Revitalizing Sales Compensation - Aon
Revitalizing Sales Compensation - Aon
Revitalizing Sales Compensation - Aon

You also want an ePaper? Increase the reach of your titles
YUMPU automatically turns print PDFs into web optimized ePapers that Google loves.
04<br />
Flexible Benefits<br />
An Effective Prescription<br />
in China<br />
09<br />
Theory of<br />
Subjectivity<br />
The Indian C-Suite<br />
Pay Packet<br />
29<br />
Rethinking the Future<br />
of Total Rewards<br />
India • Volume 2 • Issue 2<br />
<strong>Revitalizing</strong> <strong>Sales</strong><br />
<strong>Compensation</strong>
14<br />
www.aonhewitt.com/india<br />
what’s inside<br />
CoveR StoRy<br />
04 09<br />
21<br />
Flexible Benefits<br />
An Effective Prescription<br />
in China<br />
04<br />
Theory of Subjectivity<br />
The Indian C-Suite Pay Packet<br />
09<br />
02<br />
<strong>Aon</strong> Hewitt Rewards that<br />
Work – The Genpact Story<br />
21<br />
Global Mobility in the<br />
IT Sector:<br />
The Cost Factor<br />
26<br />
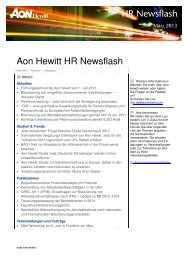
<strong>Revitalizing</strong> <strong>Sales</strong><br />
<strong>Compensation</strong><br />
There are many paths to the<br />
desired business outcomes,<br />
and the right results tend to<br />
come from a deeper, strategic,<br />
sequenced evaluation of the<br />
business model and a workforce<br />
ultimately supported – not<br />
created – by sales compensation.<br />
Rethinking the Future of<br />
Total Rewards<br />
29<br />
Survey Calendar<br />
35
Total Rewards Quarterly<br />
India • Volume 2 • Issue 2<br />
www.aonhewitt.com/india<br />
editors<br />
Shilpa Khanna<br />
shilpa.khanna@aonhewitt.com<br />
Sushil Bhasin<br />
sushil.bhasin@aonhewitt.com<br />
Tel: +91 124 4155000<br />
editorial, Reprints &<br />
Syndication office<br />
<strong>Aon</strong> Hewitt Tower, DLF Centre Court<br />
Sector-42, Gurgaon, India-122002<br />
Tel: +91 124 4155000<br />
Fax: +91 124 4052010<br />
Subscription Requests<br />
totalrewards@aonhewitt.com<br />
editorial Feedback<br />
totalrewards@aonhewitt.com<br />
Design<br />
CREATIVE InC. (www.creative-inc.in)<br />
Total Rewards Quarterly is published<br />
four times a year by <strong>Aon</strong> Hewitt<br />
Copyright © 2012 <strong>Aon</strong> Hewitt<br />
The Indian economic growth is expected to remain moderate in 2012-13<br />
unless substantive policy measures are undertaken. Advance estimates released<br />
by the Central Statistical Organization (CSO) place GDP growth for 2011-12 at<br />
6.9%, marginally higher than the 6.7% growth seen in 2008-09. India faces an<br />
awkward combination of slowing growth and still-elevated inflation.<br />
Our conventional wisdom of investing in salaries has not brought us any closer<br />
to winning the talent game. We continue to face higher attrition and low<br />
engagement among employees. We are at the point of inflection where we can<br />
either carry on the current legacy, or, try and rethink the future and how best<br />
we can influence it to create sustainable growth.<br />
Expectations from rewards are fast changing. Instead of aligning to the market,<br />
the need of the hour is to differentiate and be the early adopters and innovators.<br />
By viewing the combination of rewards elements as a portfolio, and recognizing<br />
that some elements have higher returns than others, in terms of perceived<br />
value, impact on engagement, etc., organizations are able to optimize rewards<br />
programs by aligning costs and employee preferences. I personally have been<br />
discussing the change it requires and look forward to spread the message in my<br />
interactions with you.<br />
In this issue, we have our global expert sharing his views on 'diagnosing your<br />
sales compensation issues' where he rightly emphasizes the fact that<br />
organizations need to identify the root cause across the gamut of salesforce<br />
management issues before jumping to redesign sales compensation.<br />
In addition, we share the key highlights of our annual executive compensation<br />
study. The fact, that we saw over 200% increase in participation in its second<br />
year, tells us the growing significance of this topic. The results show a strong<br />
global alignment on levels and methods of pay, but fall short on fairness and<br />
accountability. In our engagement with organizations on the ongoing Best<br />
Managed Boards Study, this has emerged as an area that needs better governance.<br />
And finally, an interesting tête-à-tête to bring you CEO’s, Investor's and HR<br />
Heads' perspectives on the future of Total Rewards.<br />
We hope you enjoy the read and look forward to receiving your comments<br />
and feedback.<br />
Sandeep Chaudhary<br />
Partner,<br />
Talent and Rewards,<br />
<strong>Aon</strong> Hewitt<br />
For more information, please write to us<br />
at totalrewards@aonhewitt.com<br />
totalRewards quarterly<br />
India • Volume 2 • Issue 2<br />
03
Flexible Benefits<br />
An Effective Prescription in China<br />
04<br />
www.aonhewitt.com/india
Since its first appearance in the 1970s, flexible benefits<br />
(flex) have become a common benefits element in the<br />
Western countries. Flex is a benefits program that provides<br />
a variety of supplemental benefits options to employees<br />
based on a predetermined budget. A typical flex program<br />
usually includes healthcare and insurance for employees<br />
and their families, pension/savings, and work-life benefits<br />
such as gym membership, travel benefits, and a flexible<br />
spending account. In China and many Asian countries,<br />
flex is a recent emergence that has quickly gained the<br />
attention and favor of many companies.<br />
Companies most attracted to flex are multinational<br />
firms in leading industries (such as pharmaceutical, auto,<br />
hi-tech, FMCG, etc.) with large workforce populations and<br />
relatively comprehensive pay and benefits systems. All are<br />
experiencing the fierce war for talent. To further enhance<br />
their employer value proposition and boost recognition<br />
of their employee benefits as a way to attract and retain<br />
talent, these organizations began to look at flex as<br />
a solution.<br />
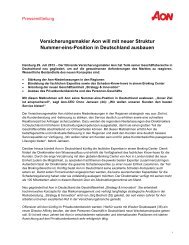
According to the chart below, about 9.4% of the<br />
multinational firms operating in China have already<br />
implemented or are currently implementing flex,<br />
17% have plans to implement flex shortly, and 63%<br />
are considering flex.<br />
Source: <strong>Aon</strong> Hewitt 2010 Benefits Hot Topic Survey China<br />
A typical flex plan includes components such as group<br />
insurance, medical benefits, pension/savings plan, and paid<br />
leave. Several companies without flex plans have begun to<br />
follow the market trend by offering some self-paid plan<br />
options for employees.<br />
Why is flex becoming increasingly popular in China?<br />
What are the keys to a successful flex project? What are<br />
some of the common challenges and solutions encountered<br />
in the implementation of flex?<br />
PERSPECTIVE<br />
Flex Advantages<br />
As the talent competition intensifies in China and salary<br />
cost continuously increases, we observe that the following<br />
issues are becoming headaches for most HR professionals<br />
in China:<br />
According to the 2011 <strong>Aon</strong> Hewitt Total<br />
<strong>Compensation</strong> Measurement (TCM) survey, for<br />
companies operating in China, the benefit cost usually<br />
reaches 20% to 40% of the total compensation cost.<br />
Along with the annual increase in salary, benefits cost<br />
is also rising year-on-year<br />
Healthcare costs in the China market have risen faster<br />
and faster and have outpaced the Consumer Price<br />
Index (CPI) since 2008. The supplemental medical<br />
premium paid by employers has gone up significantly<br />
in the recent years, and is still on the rise<br />
Inspite of companies’ considerable spending on<br />
employee benefits, there has been limited positive<br />
feedback from employees. Moreover, they have<br />
voiced a lot of complaints about how current benefits<br />
programs are not meeting their actual needs<br />
In order to compete with rivals, companies are using a<br />
variety of methods to attract and retain talent, but the<br />
effects so far have been unsatisfactory, according to many<br />
HR professionals.<br />
Flex therefore, emerged in response to these<br />
challenges. It helps companies improve employee<br />
satisfaction, enhances the organization’s competitiveness<br />
in the talent market and effectively controls<br />
long-term costs.<br />
Improve Employee Satisfaction<br />
Flex allows employees to make their own selections<br />
from a range of benefits programs – an approach that<br />
better meets the diverse needs of employees. In the<br />
implementation and continual management of flex,<br />
companies should communicate more with employees<br />
to increase their understanding of the employee benefits<br />
provisions and thus, further improve employee<br />
satisfaction levels.<br />
A common feedback <strong>Aon</strong> Hewitt has received<br />
from clients who have implemented flex is that their<br />
employees’ satisfaction with such benefits has improved<br />
significantly. The leading pharmaceutical company,<br />
AstraZeneca’s 2010 focus group study shows that after<br />
implementation of flex, the employees’ engagement<br />
levels reached 93% and the satisfaction levels 86%, a<br />
record high.<br />
totalRewards quarterly<br />
India • Volume 2 • Issue 2<br />
05
Flex, as an innovative benefits<br />
solution, can help companies<br />
maximize the value of benefits,<br />
boost employer brand<br />
and improve their overall<br />
remuneration advantage.<br />
Improve the Competitiveness of Companies in<br />
the Talent Market<br />
Talent war in the Chinese market has grown more<br />
competitive and the marginal effect of traditional benefits<br />
programs on talent retention is falling. Flex, as an<br />
innovative benefits solution, can help companies maximize<br />
the value of benefits, boost employer brand and improve<br />
their overall remuneration advantage. The implementation<br />
of flex sends out positive messages both to the external<br />
market and internally within the organization, so the<br />
effect on talent attraction and retention is measurable.<br />
Improve Control Over the Long-Term Cost<br />
of Benefits<br />
In Western countries, rising benefits cost is another major<br />
motivation for adopting flex. In the traditional benefits<br />
system, companies that have committed to an employee<br />
benefits program will have to bear the full cost, even<br />
though, it may be increasing year-on-year. Companies<br />
trying to control costs by cutting down on the benefits<br />
face a dilemma in terms of the impact on employee<br />
satisfaction levels, as well as potential legal disputes. In<br />
such circumstances, the advantages of flex are that benefits<br />
options are provided according to a predetermined budget<br />
for each employee. Therefore, in the case of increase in<br />
benefits cost, the companies can choose not to cover the<br />
increased portion or can share it with their employees.<br />
Keys to Success with Flex<br />
Tailor-Made Plan Design<br />
The flex plan design should be fully tailored to the<br />
company and employees’ profile. Besides focusing on the<br />
external market, internal human resource strategies and<br />
cost budget, it is also important to ensure that the plan<br />
complies with the demographics of the employees. In the<br />
06<br />
www.aonhewitt.com/india<br />
China market, basic insurance for employees and medical<br />
care are usually placed as the core plan, and based on<br />
this, some top up programs such as family insurance/<br />
medical care and various other options are provided.<br />
According to a recent study of 15,000+ employees in<br />
<strong>Aon</strong> Hewitt’s flex database:<br />
76.7% of employees have actively chosen their benefits<br />
plan; the rest (24.3%) used the default plan preset by<br />
the company<br />
In companies where housing assistance and/or<br />
reimbursement benefits are provided, these often<br />
become the most popular benefits for single employees<br />
aged below 30; these two items satisfy young, single<br />
employees’ short-term cash needs. Housing assistance<br />
attracts 42% of them, while reimbursement benefits<br />
attract 41.9%<br />
For young to middle-aged employees with families,<br />
the medical plan is the most popular, with an average<br />
49.9% of employees choosing to upgrade this benefit.<br />
42% of them also choose to provide protection to their<br />
children, and 34% to their spouse. Parents’ healthcare<br />
is subject to stricter underwriting conditions, as well as<br />
higher risks of claims and cost, which is why not too<br />
many companies provide it<br />
For employees above age 45, pension and medical plans<br />
are the most popular. On an average, 42.8% choose<br />
to top up their pension contribution, and 44.8% top<br />
up their medical plan. This employee group has a high<br />
demand for a tax effective benefits plan; however, this<br />
is restrained by the tax regulations in China<br />
Employees of different companies have different<br />
characteristics, which could play out in different choice<br />
inclinations. To ensure that the benefits program suits the<br />
needs of a particular organization’s employees, the flex<br />
plan should be tailored to fit their employee demographic<br />
features (including age, family status, place of work, etc.).<br />
For instance, if the employees of a company are mostly<br />
middle-aged or above, a better medical benefit and pension<br />
plan would be highly welcomed. In some companies where<br />
young employees account for the majority, downgrade<br />
options lower than the default insurance plan are provided,<br />
so employees are able to trade the insurance default plan<br />
for other benefits items deemed more attractive.<br />
Excellent Service Providers<br />
Excellent service providers are also the key to the success<br />
of flex. They can ensure smooth functioning of the flex<br />
programs and provide sufficient support to employees
in terms of the selection and ongoing management of<br />
their benefits. As a comprehensive benefits platform, flex<br />
may require many service providers to fuel its operation,<br />
such as insurance companies, medical check-up centers,<br />
pension trust companies, and flex system operators,<br />
among others.<br />
There are many such vendors in China. However,<br />
considering the fact that flex places higher requirements<br />
on service providers, companies need to be more cautious<br />
in vendor selection. Take insurance companies, for instance,<br />
what needs to be evaluated are not only their traditional<br />
services (claims settlement, insured registration and<br />
administration, etc.), but also their capacity to connect<br />
with the flex system and provide relevant support.<br />
Thorough Employee Communication<br />
The acceptance and appreciation of flex by employees is<br />
closely linked to sufficient communication in both plan<br />
implementation and ongoing management. Usually, the<br />
employee communication strategy and plan is one of the<br />
key elements in the flex design and implementation stage.<br />
Before implementation, companies should use mail<br />
notification, seminars, brochures, promotional videos and<br />
other means to mobilize employee enthusiasm and ensure<br />
their understanding and acceptance of the plan. In the<br />
process of ongoing management, smooth communication<br />
channels must be made available to collect employees’<br />
feedback and suggestions. The flex plan must also be<br />
constantly improved to better serve both the employees<br />
and the company.<br />
For any optional plans, the employee participation<br />
rate is a kind of feedback in itself. A high participation<br />
rate usually means high acceptance and understanding<br />
of the plan. Among <strong>Aon</strong> Hewitt’s flex clients, employees’<br />
active enrollment rates averaged at 76.7%, while some<br />
plans have succeeded in attracting more than 90% of<br />
employees to participate. While this seems to indicate<br />
that flex is appealing to employees, it is crucial to note<br />
that during the implementation and management<br />
process, incorporating the principles listed above<br />
ensures that the advantages of flex are fully optimized.<br />
Reduce the Risk of Anti-Selection and<br />
Maximize the Advantages of Flex<br />
If flex is a good antidote for solving various kinds of benefits<br />
problems for companies, then the rising risk of anti-selection<br />
can be considered its 'side effect'. Raised by American<br />
economist, George Arthur Akerlof, a nobel prize winner in<br />
PERSPECTIVE<br />
Economics, the theory of adverse or anti-selection refers to<br />
the survival of the weakest, instead of the survival of the<br />
fittest. In the case of an optional medical plan, this can be<br />
observed in the behavior of employees. Employees who<br />
usually go to the hospital are more inclined to top up their<br />
medical plan, while employees enjoying good health display<br />
relatively low purchase willingness.<br />
The negative impact of anti-selection is obvious. The<br />
cost of benefits bears the brunt – anti-selection leads<br />
directly to an increased claims ratio, which then puts<br />
pressure on health costs. However, in China, increased<br />
claims ratio doesn’t always mean increased insurance<br />
premium. Whether or not the premium would go up and<br />
by how much often depends on the size of the client’s<br />
workforce, its bargaining power, the insurance company’s<br />
market strategy (whether to seize market at low price or<br />
to guarantee profits), and even the personal relationship<br />
between the client and the account manager. Of course,<br />
for those clients that don’t bring profit or even cause loss<br />
for insurance companies, the pressure on health costs will<br />
certainly increase continuously.<br />
A successful flex plan can achieve a win-win result.<br />
The employees can choose better health protection for<br />
themselves and their families, companies can better<br />
attract and retain employees, and insurance companies<br />
can profit by offering more insurance products. So how<br />
can we contain the risk of anti-selection and achieve a<br />
win-win result? The following are some feasible solutions<br />
for your reference:<br />
Identify the 'Minefields' of Anti-Selection<br />
First, before plan design, full evaluation of the risk of<br />
anti-selection should be conducted based on market data<br />
and the employee demographic characteristics of age,<br />
family status, region of working and job nature of the<br />
employees concerned. Finding the high risk minefield can<br />
The acceptance of flex by<br />
employees is closely linked to<br />
sufficient communication in<br />
both plan implementation<br />
and ongoing management.<br />
It is therefore, one of the key<br />
elements in the flex design<br />
and implementation stage.<br />
totalRewards quarterly<br />
India • Volume 2 • Issue 2<br />
07
help companies and service providers take effective<br />
measures to address the risk. For instance, if a company’s<br />
employees are largely located in a region where the<br />
overall claim result is relatively poor, in addition to<br />
considering these employees’ needs, stricter claims rules<br />
should be established during the plan design phase to<br />
control anti-selection.<br />
Set Out Claims Rules in Plan Design<br />
In plan design, certain rules can be introduced to control<br />
the risk of anti-selection. The typical practices include:<br />
Grouping benefits items with a higher claims ratio<br />
(medical insurances for employees and their families)<br />
with those that have a relatively low claims ratio<br />
(life insurance, accident insurance, etc.)<br />
Setting out a two or three-year lock-in period during<br />
which the options selected cannot be altered<br />
Stipulating a rule with employees that the benefit level<br />
of the insurance/medical plan selected for their families<br />
shall not be higher than the plan for themselves, and<br />
so on<br />
Leverage Pricing Strategy<br />
The pricing strategy of the insurance company is of vital<br />
importance. An in-depth analysis of the claims data and<br />
a comprehensive grasp of employee information will be<br />
helpful in determining the insurance item with the higher<br />
risk of anti-selection, and then the price of that particular<br />
item can be altered to control the claims ratio. If the<br />
insurance pricing simply focuses on the overall claims ratio,<br />
some items with an abnormally high claims ratio would<br />
go neglected and the development of anti-selection<br />
indulged, gradually increasing the pressure on health costs.<br />
In a recent customized study of high-end medical and<br />
voluntary benefits, <strong>Aon</strong> Hewitt compared the claims ratio of<br />
three flex clients and four other clients that provided top up<br />
options in their insurance program. They discovered that<br />
the claims ratio of top up options in the simple optional<br />
insurance plans is relatively higher (most exceeded 100%)<br />
than that in the comprehensive flex programs (most below<br />
80%). The underlying reason is that compared with optional<br />
insurance plans, flex programs usually incorporate a number<br />
of effective rules to control anti-selection that were based on<br />
comprehensive analysis and evaluation during the plan<br />
design phase.<br />
08<br />
www.aonhewitt.com/india<br />
It is foreseeable that with<br />
the participation of more<br />
and more companies, the<br />
increasing maturity of<br />
the vendors and growing<br />
acceptance by employees,<br />
flex will gradually manifest<br />
its enormous potential and<br />
evolve into a prevailing mode<br />
of benefits solution in China.<br />
Conclusion<br />
In summary, so long as corresponding measures are taken,<br />
the risk of anti-selection in flex can be minimized. As an<br />
effective prescription for employers to retain talent and<br />
control benefits costs, the advantages of flex are obvious.<br />
Its successful operation in Western countries and some<br />
mature markets in Asia, like Singapore, indicate that it is a<br />
tested, effective benefits solution. It is foreseeable that with<br />
the participation of more and more companies, the<br />
increasing maturity of the vendors and growing acceptance<br />
by employees, flex will gradually manifest its enormous<br />
potential and evolve into a prevailing mode of benefits<br />
solution in China.<br />
Angela (Shanyan) Zhou<br />
Senior Consultant – Health and Benefits Practice,<br />
<strong>Aon</strong> Hewitt, China<br />
For more information, please write to us at<br />
totalrewards@aonhewitt.com
In response to our first executive compensation study, the<br />
highlights of which were presented through this journal<br />
about a year back, we got two often repeated reactions<br />
from people. The first was a perhaps pleasantly surprised,<br />
“Wow… that much” and the second was an incredulous,<br />
“but why?”. And therefore, as we went through our<br />
second edition of this study, our objective was to try<br />
and answer these two questions with greater conviction.<br />
There were only two ways to get this conviction – one<br />
was to ensure we had a much larger participant base<br />
to get a more representative sample of companies, and<br />
two, was to ensure we asked the right questions and<br />
probed for the right data. It pleases us to say that we hit<br />
the mark on both. not only did we get data from more<br />
than double the number of companies as compared<br />
to the previous year (166 compared to 65 last year),<br />
we also tested this compensation data through a wider<br />
range of analytical filters. We would like to begin this<br />
article by first thanking the compensation teams of these<br />
166 organizations who helped us with their data and<br />
practices. Without their active support, we would not<br />
PERSPECTIVE<br />
Theory of<br />
Subjectivity<br />
The Indian C-Suite<br />
Pay Packet<br />
have been able to share the perspective and trends that<br />
this data throws up.<br />
The Story the Media Loved<br />
Over the last few months, you would have noticed at least<br />
one article every month in any of the leading dailies, on<br />
how pay levels for Indian CEOs seems to be mirroring the<br />
pay for CEOs at global or American companies. That, in<br />
effect, was our story – and we found takers from across<br />
other compensation and recruitment firms and the media<br />
loved it. While it is absolutely true that Indian CEOs are<br />
paid not too far from their global peers, there is a fair bit<br />
of mathematical approximations that are involved in that<br />
premise. Let’s look at the numbers: For an organization in<br />
the US, in the range of USD 4-7 billion in revenues, the<br />
median CEO compensation ranges around USD 6-7<br />
million per annum. now if you were to multiply it with<br />
the USD/` exchange rate, the Indian equivalent<br />
compensation would be a massive ` 30-35 crores per<br />
annum. A more realistic way of looking at this would<br />
be to multiply the dollar value with a Purchasing Power<br />
totalRewards quarterly<br />
India • Volume 2 • Issue 2<br />
09
Parity (PPP) adjusted currency conversion rate. This would<br />
translate into an approximate value of ` 9-11 crores. now<br />
compare that with the median compensation of the CEO<br />
of an Indian company (in a revenue range of USD 2-4<br />
billion), and you would find the CEO pay to be in the<br />
range of ` 5-7 crores.<br />
Source: <strong>Aon</strong> Hewitt TCM Studies, OECD PPP Database 2011<br />
Note: Figures represent Total Fixed Pay<br />
There are two other interesting dimensions to this<br />
story. The first is around how the CEO compensation<br />
grows in India vis-à-vis other countries. At an average,<br />
executive pay in India has seen a Compound Annual<br />
Growth Rate (CAGR) of approximately 13-14% over the<br />
last decade. In the same period, the average growth in<br />
executive compensation across most Western economies<br />
has been in the range of 1-3%. If we assume that growth<br />
rates remain unchanged over the next five years, Indian<br />
CEOs would earn greater than their Western counterparts,<br />
albeit on a PPP basis.<br />
The second, and slightly nuanced story, is around<br />
how compensation is structured for executives in India vs<br />
the Western world. Typically, Indian CEOs have between<br />
45-50% of their compensation delivered through fixed<br />
(and non-performance linked) elements of pay, while their<br />
Western counterparts usually don’t have more than 20%<br />
of their pay as fixed. If you apply these percentages to the<br />
total compensation numbers, you will find that on a fixed<br />
pay basis, Indian CEOs already make more than their<br />
Western peers!<br />
The Story You Need to Know<br />
Let us now turn to the fundamental construct of executive<br />
pay practices that our study and the subsequent analysis<br />
threw up. Beyond this point, we will focus on the data as it<br />
is and some of the stories behind the data.<br />
10 www.aonhewitt.com/india<br />
a. Executive Pay Levels Significantly Vary<br />
by Industry<br />
This year, our survey represented a similar pattern in<br />
executive compensation differentials across industries<br />
as we had seen in the previous years. While we kept<br />
financial services out of this analysis on account of the<br />
wide differentials in pay levels between different subsectors<br />
under this industry definition, we found a variance<br />
of about 160% between the median CEO pay across<br />
the lowest and highest paying industries. Interestingly,<br />
we found a combination of new and old – ITeS and<br />
manufacturing – as the leading paymasters at the CEO<br />
level across all industry definitions. We believe much of<br />
it can be attributed to the fact that the ITeS business is<br />
dominated by organizations that have a global footprint<br />
and very often are also listed abroad. Thus, their approach<br />
towards executive compensation management is different<br />
from the way Indian Boards look at it. We noticed that the<br />
manufacturing industry definition covered some of the<br />
largest companies in the survey and therefore, it was not<br />
surprising to find that pay in these organizations should<br />
be higher than their peers. The manufacturing industry<br />
also represents a host of companies that have larger global<br />
aspirations and their executives are, very often, not just<br />
responsible for the India operations.<br />
It would be important to highlight that interestingly,<br />
the width in compensation levels for the direct reports to<br />
the CEOs across these industries was far narrower (~75%).<br />
Source: <strong>Aon</strong> Hewitt Executive <strong>Compensation</strong> Study 2011-12<br />
Note: Figures represent Total Fixed Pay (a summation of Fixed Pay,<br />
Monetized Benefits, Annual Incentives and Long-Term Incentives)<br />
b. CXO Pay Varies by Function<br />
We found interesting patterns in CXO pay levels across<br />
different functions. While it is intuitive that the Chief
While globally the variance in<br />
CEO and CXO compensation is<br />
largely on account of the much<br />
higher stock grants that the CEO<br />
gets; in India, this difference<br />
is primarily on account of the<br />
higher annual incentives that<br />
the CEO seems to be receiving.<br />
Operating Officer (COO) and the Chief Financial Officer<br />
(CFO) occupy the higher end of the spectrum on the<br />
compensation ranges, we found (to significant rejoicing<br />
around the office) that the Chief Human Resources<br />
Officer (CHRO) comes up third in the list of highest paid<br />
CXOs. What is interesting however, is the fact that, at<br />
the higher quartiles of the market range, the CFO’s total<br />
compensation seems to be higher than that of the COO.<br />
At the CXO levels, the nature of the industry significantly<br />
impacts the pay for different roles. For instance, the<br />
Head of Service is compensated significantly more in the<br />
telecom industry as opposed to most other industries.<br />
Similarly, the Head of <strong>Sales</strong> earns the maximum premium<br />
in the FMCG business.<br />
Source: <strong>Aon</strong> Hewitt Executive <strong>Compensation</strong> Study 2011-12<br />
Note: Figures represent Total Fixed Pay (a summation of Fixed Pay,<br />
Monetized Benefits, Annual Incentives and Long-Term Incentives)<br />
Organizations often focus on the metric of ratio<br />
between CEO and CXO compensation as a parameter<br />
to analyze the approach towards the management of<br />
executive compensation. Our analysis of this metric<br />
PERSPECTIVE<br />
revealed some interesting results. Firstly, the ratio in India<br />
is distinctly different from global levels. While in India the<br />
ratio of total pay for the CEO and CXO is about 2.23x,<br />
the global benchmark is at 5.8x. In India, industries<br />
such as ITeS (which largely have globally aligned pay<br />
practices) occupy the higher end of the spectrum, while<br />
most industries with a domestic focus have a much<br />
lower ratio. The second interesting aspect about this<br />
ratio is that while globally the variance in CEO and CXO<br />
compensation is largely on account of the much higher<br />
stock grants that the CEO gets; in India, this difference is<br />
primarily on account of the higher annual incentives that<br />
the CEO seems to be receiving.<br />
c. The Delivery of Pay Still Retains the Strong<br />
Alignment Towards Fixed <strong>Compensation</strong><br />
The fixed to performance pay ratio usually forms the core<br />
of the discourse on executive compensation. There is<br />
naturally no right mix between fixed pay, annual and<br />
long-term incentives and there exists a wide range of<br />
beliefs on what the mix should look like for companies<br />
across different industries and in different stages of their<br />
growth/maturity. The mix of pay is also very often<br />
dictated by the culture of the organization and the<br />
country of operation. Our survey found that the executive<br />
population in India broadly follows a 50-50 split between<br />
fixed and incentives and within incentives again, there is<br />
an equal split between annual and long-term incentives.<br />
The mix of pay varies by role and level with the CEO<br />
usually showing the maximum alignment to incentives<br />
(46 to 54), while support roles at the next level show a<br />
much stronger focus on fixed compensation. The ITeS<br />
sector seems to be the most aggressive in its pay mix with<br />
more than 67% of pay being delivered through incentives<br />
of which two-thirds are delivered through long-term<br />
incentives. The IT and Banking, Financial Service and<br />
Insurance (BFSI) industries also represent significantly<br />
aggressive pay mixes.<br />
As we highlighted above, the Indian compensation<br />
structures reflect a far greater alignment towards fixed<br />
pay as compared to north American standards, where<br />
fixed pay represents approximately 20-25% of total pay<br />
and long-term incentives constitute the bulk of the pay<br />
delivered. Indian structures are possibly more aligned to<br />
European standards where 35-40% of the pay is delivered<br />
through fixed pay and the rest through a combination of<br />
annual and long-term incentives. As a matter of fact, while<br />
responding to our questionnaires, we found many<br />
totalRewards quarterly<br />
India • Volume 2 • Issue 2<br />
11
organizations complain about their inability to position<br />
incentive pay as an equally important and relevant<br />
compensation component as fixed even to top executives.<br />
Culturally, Asian countries retain a distinct preference<br />
for fixed compensation across all levels of management<br />
and perhaps that has, in some ways, protected these<br />
economies from compensation mishaps like the rest of the<br />
world! However, as compensation levels keep growing, it<br />
needs to be seen the extent to which companies bring in<br />
performance leverage into the compensation structure and<br />
therefore, change the mix of pay.<br />
*AI – Annual Incentives, **LTI – Long-Term Incentives<br />
Source: <strong>Aon</strong> Hewitt TCM Studies<br />
d. Long-Term Incentives (LTI) Remain at the<br />
Core of Executive <strong>Compensation</strong> Practices<br />
The importance of LTI as a critical differentiator in executive<br />
compensation has only been exacerbated with a distinct<br />
reduction in the coverage of employees through LTI plans.<br />
Over the last five years, we have seen the coverage of<br />
mid-management employees go down from 50% of all<br />
companies to approximately 30%. With a decrease in<br />
the size of the employee base being covered, LTI plans<br />
have focused on delivering higher values to the executive<br />
With such a clear uniformity in<br />
the benefits structure and limited<br />
innovation in the recent times in<br />
this area, it will be interesting to see<br />
whether companies use benefits as<br />
the key differentiator in their Total<br />
Rewards package in the future.<br />
12 www.aonhewitt.com/india<br />
population and we have seen the contribution of this<br />
element of pay for CEOs go up from about 20% of total<br />
compensation to about 31% over the last four years.<br />
LTIs in India have traditionally been delivered through<br />
Employee Stock Option Plans (ESOPs). This vehicle<br />
remains dominant even today with more than 55% of all<br />
plans being structured as ESOPs. Over the last few years,<br />
with India almost coming to the brink of introducing IFRS<br />
accounting norms, a wide cross section of organizations<br />
chose to shift their programs to full value vehicles such as<br />
restricted stocks or performance shares (on account of the<br />
almost identical accounting expenses between ESOPs and<br />
these vehicles). Consequently, we found these vehicles<br />
constituting almost 35% of all the long-term incentive<br />
programs in India.<br />
Most long-term incentive plans in India are<br />
structured to vest over a 3-4 year period with the total<br />
term of the vehicle being between 7-10 years.<br />
e. Benefits Practices Present a Largely<br />
Uniform Picture<br />
Our study found organizations have a fair degree of<br />
uniformity in the approach towards benefits design.<br />
Regardless of size or nature of industry, the core benefits<br />
structure was defined around a set of anchors such as car and<br />
related benefits, housing, medical and life insurance, club<br />
memberships, etc. While there was variance in the value<br />
of the benefits being offered, almost all executives were<br />
covered under these benefits policies. Loans were the only<br />
area of benefits where there was a clear divergence based on<br />
the nature of the company and while financial institutions<br />
were most prominent in advancing loans to their executives,<br />
only 40% of all other companies provided this benefits.<br />
With such a clear uniformity in the benefits structure and<br />
limited innovation in the recent times in this area, it will be<br />
interesting to see whether companies use benefits as the key<br />
differentiator in their Total Rewards package in the future.<br />
The Story That Made Us Think<br />
We started this article by talking about the two simple<br />
questions that our study this year was focused on addressing,<br />
and we now turn to the second of the two – the “but why”<br />
of executive pay levels. We ran a few simple statistical tests<br />
on the compensation data that we had gathered – a<br />
measurement of the co-efficients of correlation and<br />
regression between compensation data and financial/<br />
operating metrics that act as proxies for business size. We<br />
took revenue, profit after tax and employee size (because
We have seen organizations<br />
broaden their questioning<br />
around executive pay and we<br />
are working with them to audit<br />
their executive compensation<br />
practices with a view to ensure<br />
that there is fairness – both for the<br />
company and for the executive.<br />
of the large constitution of unlisted companies, we could<br />
not take market capitalization). The results reveal a<br />
rather disconcerting picture – the predictive relationship<br />
(reflected through the regression co-efficient) between<br />
financial metrics and compensation came out to be very<br />
low both from a statistically 'acceptable' range as well as<br />
when compared to global standards on these parameters.<br />
The average regression co-efficient between the CEO’s<br />
pay and revenue was approximately 0.20 while between<br />
the CFO’s pay and revenue was approximately 0.30. The<br />
global comparables for this were approximately 0.70. The<br />
results were very similar across the other metrics as well.<br />
This raises a range of sticky issues. Firstly, there doesn’t<br />
seem to be a fundamental data-driven rationale for pay<br />
levels. Business size fundamentals clearly do not have<br />
any distinct bearing on the pay for executive positions.<br />
Secondly, there is a huge effort that goes in, both by<br />
organizations and pay consultants, to ensure that a correct<br />
peer group is defined for benchmarking. This peer group<br />
definition is based on ensuring that companies with<br />
similar business and financial fundamentals are used for<br />
comparing compensation levels. But inspite of that, pay is<br />
only very marginally aligned to financial and business size<br />
fundamentals, thereby, negating the logic of the peer<br />
group selection process.<br />
As a part of this study, we also asked companies on their<br />
approach towards pay determination for their executive<br />
population. The responses did not provide us with a clear<br />
canvas on the thinking behind executive pay decisions.<br />
Almost 70% companies talked about total cost to company<br />
(not including LTI) as their anchor for pay determination<br />
PERSPECTIVE<br />
and 88% companies said, they would set their pay at<br />
between the median and 75 th percentile of the market.<br />
Most organizations (76%) did not differentiate their<br />
peer group for executive compensation benchmarking<br />
from the one used for other management levels. Most<br />
organizations highlighted their inability to manage the<br />
pressures of attracting the right talent and managing the<br />
compensation costs for executives. These companies also<br />
pointed out that most compensation decisions at that<br />
level were still largely determined on the basis of<br />
incumbents as opposed to the role.<br />
In Conclusion<br />
The airwaves today are packed with bad news for the<br />
business and economy. There is a general sense of<br />
discomfort around an impending doom. We are all sure<br />
that there is no certainty of how the next few years will<br />
shape up for the world and more importantly, for India. In<br />
our niche of executive compensation, we are wondering<br />
if all of this means that we will see a gradual slowing down<br />
in the rapid advance of executive compensation levels. We<br />
are wondering if this situation will make organizations sit<br />
up to the fact that executive compensation costs in many<br />
cases have perhaps gone out of sync with the sizes of the<br />
business that these executives manage. We have seen<br />
organizations broaden their questioning around executive<br />
pay and we are working with them to audit their executive<br />
compensation practices with a view to ensure that there<br />
is fairness – both for the company and for the executive.<br />
Albert Einstein, in the mid 1940s said, “The problems<br />
we have today, cannot be solved by thinking the way we<br />
thought when we created them.” His observation applies<br />
remarkably well to all walks of economic life today. At a<br />
larger level, we need to rethink the way our polity and<br />
economy is linked and in our little space of executive pay,<br />
rethink the principles that we have used in the past<br />
to determine compensation for the individuals running<br />
our companies.<br />
Anandorup Ghose<br />
Director – Executive <strong>Compensation</strong> and Governance,<br />
<strong>Aon</strong> Hewitt, India<br />
For more information, please write to us at<br />
totalrewards@aonhewitt.com<br />
totalRewards quarterly<br />
India • Volume 2 • Issue 2<br />
13
Instead of over relying on sales<br />
compensation, companies need<br />
to develop a more sophisticated<br />
diagnostic system to identify<br />
the underlying drivers of<br />
cost and dysfunction.<br />
14 www.aonhewitt.com/india<br />
<strong>Revitalizing</strong> <strong>Sales</strong><br />
<strong>Compensation</strong>
Diagnosing Your Company’s <strong>Sales</strong><br />
<strong>Compensation</strong> Problems<br />
There is no sales compensation plan that can solve<br />
all business problems. While this may seem intuitive,<br />
a challenging economy and tremendous professional<br />
pressure are taking a toll on business leaders, and many<br />
find themselves asking for sales compensation to work<br />
miracles. Instead of over relying on sales compensation,<br />
companies need to develop a more sophisticated<br />
diagnostic system to identify the underlying drivers of<br />
cost and dysfunction such as talent gaps, coverage holes<br />
and mismatched sales channels. Successful companies<br />
start by looking for these types of root business issues<br />
before beginning any redesign of sales compensation.<br />
Often, the root business issue lies in the structural<br />
clarity and characteristics of the salesforce the company<br />
is trying to attract, motivate and retain. A detailed model<br />
to help companies apply the best techniques for workforce<br />
planning brings many of these root issues to light. Such<br />
a model helps companies construct a fully aligned and<br />
focused salesforce that creates lasting competitive<br />
advantage while also achieving immediate business<br />
goals. While this work may appear to be outside of the<br />
responsibilities of most compensation professionals, it is<br />
critical to ensure compensation is addressing appropriate<br />
goals and issues. As a cautionary example, companies<br />
sometimes try to create aggressive sales compensation<br />
programs in an effort to overcome weak sales coverage<br />
models, creating alignment, cost and equity issues.<br />
In order for companies to have the right salesforce for<br />
a specific market, they must first compare their current<br />
workforce design to their business objectives. As illustrated<br />
by the representative case study that follows, nine major<br />
steps in workforce planning for sales emerge (see Exhibit 1).<br />
Nine Steps to <strong>Sales</strong>force Planning<br />
1. Identify business goals and constraints<br />
2. Quantify opportunity in customer segments<br />
3. Develop productivity equation(s)<br />
4. Determine talent requirements<br />
5. Evaluate the current talent supply<br />
6. Quantify talent gaps<br />
7. Select talent gap closure levers<br />
8. Build the talent plan<br />
9. Execute salesforce transition<br />
Exhibit 1<br />
COVERstory<br />
A Hypothetical Business Situation<br />
A company, let’s refer to it as 'Acme Widgets,' is delivering<br />
USD 1 billion in annual revenue with 40% gross margins<br />
and 15% operating margins. The immediate problem is<br />
that two years ago, the company was delivering USD 1.2<br />
billion in revenue, 50% gross margins and 20% operating<br />
margins. The decline experienced in the previous two years<br />
has placed immense pressure on the senior management<br />
to orchestrate a turnaround in the company’s performance<br />
and to show the levels of shareholder return to which<br />
Wall Street had grown accustomed. The company has<br />
only 10% market share (ranking third to larger<br />
competitors who have 30% and 20% shares, with the<br />
remaining 40% of the market spread out across a<br />
fragmented group of smaller competitors), so both<br />
executives and investors believe there is an opportunity<br />
for expansion in a market that is growing at 5% per year.<br />
Acme Widgets employs approximately 400 salespeople<br />
and sales managers who are largely generalists. The<br />
company operates on a fairly simple sales compensation<br />
plan that pays sales representatives an average of USD<br />
150,000 per year, half in base salary and half from a 2.5%<br />
commission based on total revenue in a geographical<br />
territory. When the company was growing, these territories<br />
would grow and then divide as new sales representatives<br />
were added. Recently, the company has trimmed back<br />
the number of representatives, resulting in accounts,<br />
sales and commissions being distributed to the remaining<br />
representatives somewhat arbitrarily. <strong>Compensation</strong><br />
Cost of <strong>Sales</strong> (or CCOS – the sum of all base salaries and<br />
actual cash incentives paid as a percentage of revenue)<br />
has hovered around 6% in the recent years despite<br />
headcount reductions.<br />
The CFO has decided that Acme’s return to greatness<br />
should begin in 2011, with goals of:<br />
10% revenue growth to USD 1.1 billion<br />
48% gross margins<br />
18% operating margins<br />
The CFO and CEO believe that much of the revenue and<br />
gross margin increase can be driven by selling more<br />
solutions to their customers’ senior-most C-Suite buyers.<br />
The operating margin increase, they believe, can come<br />
from improved gross margins plus further cuts in<br />
headcount and compensation. The first premise makes<br />
sales and marketing nervous, because the company does<br />
not have a track record of successful solution sales. The<br />
second premise makes human resources uneasy, because<br />
most compensation professionals understand that the<br />
totalRewards quarterly<br />
India • Volume 2 • Issue 2<br />
15
chances of cutting everyone’s pay in one year and still<br />
fielding an engaged salesforce is slim. Talent management<br />
and change management experts would also contend<br />
that the challenge of converting an entire salesforce from<br />
volume-oriented commodity sellers to value-oriented<br />
solution sellers in a year is significant. So how should Acme<br />
HR help make such a transition and convince the senior<br />
leadership that there is a right and wrong way to attempt<br />
this feat?<br />
The Solution<br />
One of the critical success factors for this type of transition<br />
is an explicit workforce plan for sales. For companies<br />
engaging in successful salesforce planning, there are nine<br />
major steps:<br />
1. Identify Business Goals, Situations<br />
and Constraints<br />
If an organization, such as Acme, plans to sell solutions<br />
faster than the market is growing, there are different<br />
strategic, talent and motivational implications that exist<br />
for a zero growth company. Resources that manage the<br />
existing procurement relationships to sustain orders of a<br />
commodity typically possess one set of skills, while taking<br />
market share from competitors by selling new conceptual<br />
product/service bundles to senior leaders in larger<br />
accounts requires a very different set of competencies. The<br />
question that workforce planning should ask, therefore,<br />
is “How many of each type of resource do we need?”<br />
One of the basic mistakes that companies make as<br />
they attempt to become solution sellers is deciding<br />
that all of their salespeople need to possess the new<br />
competencies (whether through training or outside<br />
hiring). That is often not true for three main reasons:<br />
The supply of good solution salespeople in the market is<br />
constrained. Short of a risky acquisition, few companies<br />
can access a reliable talent pool to hire 300-400 of<br />
these resources<br />
Leading sales organizations<br />
quantify the sales potential in<br />
each account, the penetration<br />
rates, close rates, retention<br />
rates, sales resource seniority,<br />
selling time and workload<br />
for each sales process.<br />
16 www.aonhewitt.com/india<br />
Solution sellers command a higher price in the market<br />
than transactional sellers (see Exhibit 2), an economic<br />
reality that would create an unaffordable salesforce for<br />
many companies<br />
not all customers are willing to buy solutions, even<br />
under ideal circumstances<br />
2. Quantify the Opportunity in<br />
Customer Segments<br />
Any increase or change in the mix of revenue must come<br />
from a finite market. Companies can use several methods<br />
for sizing that market and its segments, from customer<br />
surveys to statistical regression. Once a company knows<br />
how much revenue and profit opportunity is in the market,<br />
how much is accessible by its salesforce, which customers<br />
are loyal, what market share is in the hands of major<br />
competitors and which prospects would be inclined<br />
to purchase if price, service level or product quality is<br />
changed, then it can determine how much of the business<br />
plan can be delivered from each segment.<br />
note that some portion of the business plan could<br />
still be delivered from customer segments that value only<br />
transactional commodities. Therefore, companies may<br />
decide to keep some transactional salespeople deployed<br />
against accounts that will most likely continue to buy<br />
in this manner. This can also create a gradual transition<br />
that takes some pressure off change management and<br />
salesforce transformation. In pure compensation terms,<br />
pay level premiums may not need to be as high to recruit<br />
150 new solution salespeople as they would be to get 300.<br />
In the case example, Acme had 50,000 total customers<br />
who, on an average, purchased USD 20,000 worth of<br />
widgets each year. Based on Acme’s customer surveys,<br />
there are 1,000 potential strategic accounts that can be<br />
targeted with solution selling and that can be expected to<br />
be successful in 2011. On the other end of the spectrum,<br />
the bottom 10% of the market is actually unprofitable.<br />
Profits and margins could go up by simply not deploying<br />
sales resources against those customers going forward,<br />
or by using very different resources or terms.<br />
The Pareto principle (also known as the 80-20 rule)<br />
applies to Acme just as it does to most other companies,<br />
meaning a significant number of accounts purchase very<br />
small amounts each year. These buyers state that they<br />
would be just as happy with a telesales representative<br />
as their touchpoint with Acme (in all honesty, there are<br />
many of these smaller customers who received no personal<br />
touch when the generalist territory sales representatives
Source: <strong>Aon</strong> Hewitt 2010 <strong>Sales</strong> <strong>Compensation</strong> Survey<br />
Exhibit 2<br />
Average Impact of Individual Attributes on Total Cash – <strong>Sales</strong> Representative<br />
were assigned more than 120 customers each). Therefore,<br />
Acme might be able to get higher productivity at lower cost<br />
with telesales resources deployed against these accounts.<br />
3. Develop a Productivity Equation<br />
Specifically define how much a single resource in a specific<br />
channel can be expected to produce. Many companies<br />
seek this information in sales compensation benchmarking<br />
surveys. note, however, that while there are a few surveys<br />
that provide reliable quota and revenue production<br />
information, surveys are probably best used as sanity checks<br />
and not the basis for a sales productivity model. Crediting<br />
rules for companies contributing to the surveys aren’t<br />
always consistent, as recurring revenue and long-term<br />
contracts often prevent an 'apple-to-apple' comparison. As<br />
a result, the numbers may have bits of apple and orange<br />
mixed up into a dangerously misleading fruit salad of data.<br />
COVERstory<br />
Leading sales organizations quantify the sales potential<br />
in each account, the penetration rates, close rates,<br />
retention rates, sales resource seniority, selling time and<br />
workload for each sales process. This creates a model that<br />
will help companies determine the sales resources needed<br />
to achieve business objectives as allocated to segments.<br />
For example, if Acme’s goal is to land a new strategic<br />
account with USD 20 million of sales potential (of which<br />
40% is secured in the first transaction), it might require<br />
a team of three people to pursue 10 prospects through a<br />
sales process that demands 50% of their time over the<br />
course of six months to yield one successful sale.<br />
4. Determine Talent Requirements<br />
What size (and shape) salesforce is needed to cover a<br />
company’s target markets and deliver against the business<br />
plan for an acceptable cost? Start understanding the sales<br />
totalRewards quarterly<br />
India • Volume 2 • Issue 2<br />
17
talent requirements by using the productivity model to<br />
determine how many accounts a sales resource can cover.<br />
In Acme’s case, if each strategic account requires 60 hours<br />
of selling time per year, and a Strategic Account Manager<br />
(SAM) has a selling capacity of 1,200 hours per year, then<br />
each SAM can cover 20 accounts, and 50 SAMs are needed<br />
to cover the targeted 1,000 accounts. If strategic accounts<br />
can deliver USD 400,000 each in revenue, and SAMs cost<br />
USD 180,000 each, there is now a cost associated with the<br />
talent required to cover this segment and deliver targeted<br />
revenue. Going segment by segment, complete this initial<br />
sizing exercise for each type of resource.<br />
By articulating talent requirements and identifying the<br />
types of resources that will be assigned to customers, it is<br />
apparent that five different types of sales resources will be<br />
deployed (see Exhibit 3):<br />
SAMs (blue in Exhibit 3) – assigned to large accounts<br />
Territory generalists (maroon in Exhibit 3) – assigned to<br />
mid-market accounts<br />
Product specialists (maroon in Exhibit 3) – overlay<br />
resources assigned to assist in the sale of new offerings<br />
Inside sales representatives (green in Exhibit 3) –<br />
assigned to small transactional accounts<br />
<strong>Sales</strong> managers (blue in Exhibit 3) – oversee front<br />
line sales resources<br />
For each resource deployed, companies should have a<br />
rough number required and a set of competencies defined.<br />
5. Evaluate the Current Talent Supply<br />
It is imperative for companies to identify a set of<br />
competencies for each sales role within the organization.<br />
Exhibit 3<br />
18 www.aonhewitt.com/india<br />
Creating a workforce plan is not just about numbers of<br />
resources required, but also the skills or competencies that<br />
must be demonstrated by each. This can make a transition<br />
like Acme’s more complex. For example, in order to sell<br />
solutions to senior buyers in larger accounts, SAMs may<br />
need competencies such as problem solving or financial<br />
acumen, where previously, sales representatives were hired<br />
based on their negotiation or communication capabilities<br />
only. Acme should perform a fresh evaluation of all sales<br />
resources based on the new competencies defined. Leading<br />
companies will embed these competencies in their<br />
interviewing tools to screen recruits, training curriculum<br />
and performance management systems.<br />
6. Quantify Talent Gaps<br />
After evaluating the qualities needed in the salesforce,<br />
organizations need to also evaluate how many individuals<br />
in the salesforce possess those skills in order to determine<br />
how much additional hiring (and/or attrition) is needed.<br />
In Acme’s case, assessors may determine that just 10% of<br />
Acme’s original 400 territory sales representatives score<br />
high enough in financial acumen, leaving a gap of at least<br />
10 SAMs to hire from outside sources. Each role may have<br />
a surplus or deficit of internal talent to be addressed over<br />
time. The higher the talent gaps, the more the company<br />
will lean on the talent gap closure levers in Step 7.<br />
7. Select Talent Gap Closure Levers<br />
There are many tools that a company can use to recruit new<br />
sales talent, improve existing sales talent or coax additional<br />
productivity from resources. These talent gap closure levers<br />
Individual <strong>Sales</strong> Contributor Planning (Managers Driven by Span of Control)
include many of the HR programs companies often address<br />
in isolation, including:<br />
Process improvements to create more selling time, loop<br />
in new resources or improve sales yield<br />
Recruiting initiatives to access new talent pools or<br />
improve offer acceptance rates<br />
Training and development to focus on new competencies<br />
Outsourcing (i.e., using channel partners or agents) to<br />
reduce dependence on internal talent<br />
Career path development to accelerate the movement<br />
of desired talent<br />
Changes to compensation or benefits to attract the<br />
specific talent demographic in the labor market<br />
Leadership initiatives to get sales managers in place<br />
who can orient resources for strategy execution<br />
These levers all have time, resource and other hard or soft<br />
financial costs associated with them. A good workforce<br />
plan can accommodate a variety of scenarios and respond<br />
to external factors (economic conditions, competitor<br />
actions, etc.) with different talent management levers.<br />
For Acme’s SAM role, sales compensation surveys<br />
confirm that these resources command approximately<br />
a 20% premium over the legacy sales representatives.<br />
This means Acme would probably need to use the<br />
Exhibit 4<br />
High Level Workforce Plan<br />
COVERstory<br />
compensation lever to pay for the added skills required<br />
to close this talent gap. This premium could make<br />
the transition more attractive for successful internal<br />
candidates, making it a part of Acme’s sales career path.<br />
Alternatively, training and development programs might<br />
make financial sense if Acme can deploy the improved<br />
skills with less pay increase. Whatever the combination<br />
of levers used, companies must have refined market and<br />
employee value propositions to avert salesforce planning<br />
pitfalls such as increased turnover, customer churn and<br />
poor strategic execution.<br />
8. Build the Talent Plan<br />
A basic workforce planning model (see Exhibit 4)<br />
can help reinforce this approach across the necessary<br />
functional resources within any company. The output<br />
of this step should be a clear, actionable roadmap<br />
that directs sales, HR, finance, IT and other functional<br />
project leads to execute on a series of activities over a<br />
defined period of time with specific outcomes. Beyond<br />
documenting all of the supporting analysis previously<br />
outlined, the plan creates recipes for organizational<br />
success that are readily supported by existing and new<br />
programs and initiatives.<br />
totalRewards quarterly<br />
India • Volume 2 • Issue 2<br />
19
Exhibit 5<br />
9. Execute the <strong>Sales</strong>force Transition<br />
Execution is where many workforce plans fail. For sales,<br />
there are additional factors to consider, including customer<br />
relationships and geographically dispersed employees.<br />
Successful execution typically requires a clear case for<br />
action, a universally understood plan, adequate resources,<br />
visionary leadership, coordinated management, effective<br />
communication and frequent progress checks. In Acme’s<br />
case, the company chose to:<br />
Designate the worldwide Vice President of <strong>Sales</strong><br />
as the central leader of the transition, supported by HR,<br />
marketing and finance and governed by a CEO mandate<br />
Create regional task forces composed of sales, HR and<br />
IT executives<br />
Develop standardized tools for everything from<br />
competency evaluation to customer communications<br />
Meet monthly to review key metrics, including salesforce<br />
turnover, revenue, customer churn and CCOS<br />
Use a combination of best internal resources and new<br />
external talent pools to fill out the new salesforce<br />
structure as quickly as possible, creating a hiring<br />
calendar that accounted for attrition and ramped up<br />
to a sustainable flow of new candidates without<br />
overloading the recruiting function<br />
The Result<br />
By following this process, Acme is able to effectively grow<br />
the business while still showing a drop in CCOS using key<br />
workforce planning levers for sales (see Exhibit 5). Acme’s<br />
reallocation of headcount, resource mix and associated<br />
pay levels reduce overall salesforce expense while<br />
improving talent quality and productivity to ensure greater<br />
20 www.aonhewitt.com/india<br />
Workforce Planning Drivers of CCOS<br />
yield. This approach brings out the best results from<br />
workforce planning and sales compensation when used<br />
together with sound market intelligence.<br />
Effective salesforce planning is a multi-year exercise<br />
for most companies. Even with a detailed plan, turning<br />
around a supertanker can take some foresight and<br />
patience. Identifying the constraining function or<br />
element in a specific workforce plan can help speed<br />
the process and exploit any bottlenecks in the system.<br />
The ultimate lesson is that there are many paths to the<br />
desired business outcomes, and the right results tend<br />
to come from a deeper, strategic, sequenced evaluation<br />
of the business model and a workforce ultimately<br />
supported – not created – by sales compensation.<br />
Contents © 2010. Reprinted with permission from WorldatWork.<br />
Content is licensed for use by purchaser only. No part of this article<br />
may be reproduced, excerpted or redistributed in any form without<br />
express written permission from WorldatWork.<br />
Scott Sands<br />
Principal and <strong>Sales</strong>force Effectiveness Practice Leader,<br />
<strong>Aon</strong> Hewitt, Atlanta<br />
Marilu Malague<br />
Senior Consultant, Talent and Rewards,<br />
Consulting Practice,<br />
<strong>Aon</strong> Hewitt, The Woodlands, Texas<br />
For more information, please write to us at totalrewards@aonhewitt.com
<strong>Aon</strong> Hewitt<br />
Rewards that Work<br />
As companies continue to wrestle with profound business<br />
challenges and the ever changing workforce needs, business<br />
and HR practitioners are eager to gain clear insights on<br />
how some organizations are continuing to use rewards<br />
as a lever to manage talent and drive business results.<br />
With that in view, we had recently launched<br />
'Rewards that Work' – a study which aims to capture<br />
and showcase leading and distinctive rewards programs<br />
and practices. 50+ organizations shared over 100+<br />
programs in the area of compensation, benefits and<br />
PERSPECTIVE<br />
wellness. The study findings along with our experience<br />
tells us that what determines the success of a rewards<br />
program is not so much the design of the program but<br />
how strongly aligned it is to the business strategy, how<br />
relevant it is to the employees and how well it has<br />
been executed.<br />
We are thankful to the winning organizations for<br />
sharing their success stories during our annual Rewards<br />
Conference and as caselets in this and subsequent issues<br />
of Total Rewards Quarterly.<br />
totalRewards quarterly<br />
India • Volume 2 • Issue 2 21
Winners**<br />
** In alphabetical order<br />
Transforming Potential Into Value<br />
Our recent Total Rewards Research across 750<br />
organizations shows that high performing organizations*<br />
do five things differently:<br />
Articulate Clearer Strategies and Goals for<br />
Total Rewards<br />
High performing companies declare Total Rewards as an<br />
area of focus and clearly articulate a Total Rewards strategy<br />
at almost twice the rate of other sampled organizations.<br />
High performing companies are purposefully differentiating<br />
in the areas that are hard to replicate: culture, leadership,<br />
learning and development, and work-life balance.<br />
Balance Multiple Inputs for Decision Making<br />
Across the board, high performers use more data inputs.<br />
They balance multiple inputs that include business<br />
alignment, competitive position, cost and compliance.<br />
Connect to the Business and Employees<br />
High performing companies connect to employee<br />
22 www.aonhewitt.com/india<br />
American Express:<br />
Straight from the Heart<br />
For their innovative Benefits Offering<br />
– Dil Se and for driving employee<br />
health and engagement through their<br />
comprehensive wellness programs<br />
Genpact:<br />
Understanding Changing<br />
Workforce Preferences<br />
For driving higher productivity and<br />
engagement through their flexible<br />
working arrangements<br />
HDFC Bank:<br />
Analytics that Work<br />
For the innovative Benchmark Salary<br />
Trending and Fitment System: BeSTFit<br />
Hindustan Unilever:<br />
Building an Owner's Mindset<br />
For distinctive design, implementation<br />
and communication of the Long-Term<br />
Incentives (LTIs) programs<br />
HSBC:<br />
Balancing Risk and Reward<br />
For effective design, governance<br />
and measurement of their sales<br />
compensation programs<br />
Tata Sons:<br />
Sharing-Learning-Leveraging<br />
For the practice of driving governance<br />
and consistency in rewards management<br />
through capability building with the<br />
initiative – the Tata Rem Club<br />
value at a higher rate than other companies – they do it<br />
through flexibility, first-mover advantage, and<br />
follow-through communication. Also, their programs<br />
and strategy are much better business-aligned than<br />
the rest.<br />
Define Effectiveness Differently<br />
Quite simply, high performers are much more likely<br />
to define and measure success through a balance of<br />
employee value and RoI – in addition to, but at a<br />
higher rate than, budget and cost management.<br />
Earn Better Outcomes<br />
High performing companies are more likely to achieve<br />
the best business and people outcomes because they<br />
have achieved significant, sustainable competitive<br />
advantage with the Total Rewards they offer.<br />
*High performing organizations are defined as those that achieve<br />
the highest levels of revenue against objectives, innovation and<br />
high employee engagement. Using this definition, 150 out of 750<br />
(approximately 20%) fall in this category.
The Story<br />
Flexi Work @ Genpact<br />
The Beginning<br />
As an organization, we associate great importance to our<br />
value ‘We grow when our people grow’ and believe in a<br />
holistic approach that meets the employee needs for a<br />
'dream career' and not just a job.<br />
It is our constant endeavor to design processes<br />
and policies to attract and retain the best talent in the<br />
industry. Like most people practices at Genpact, the<br />
flexible work practice germinated through recurring<br />
employee feedback. We captured employee feedback<br />
through multiple forums and felt the need to design<br />
these options to meet the demands of a vibrant,<br />
dynamic and younger workforce, build a diverse work<br />
environment, help employees optimize personal<br />
productivity and optimize cost.<br />
As we grew in size and multiple sites within cities<br />
emerged, one recurring and important feedback from<br />
employees was to find a way to reduce travel time so that<br />
they could spend more time with their families. Many<br />
team leaders felt it was a workable solution for employees<br />
in non-customer facing roles to work from home (WFH)<br />
on a rotation basis or take up part time work.<br />
It was a great thought but since it was implemented<br />
in pockets without any central support or guidelines,<br />
it was not a viable or long-term solution and we still<br />
CASEstudy<br />
What stands out for Genpact is not only its agility as an organization to recognize the changing workforce<br />
preferences and be bold enough to apply models that redefine the workplace, but also, the robustness with which<br />
it implemented the program to ensure success and drive higher productivity and engagement.<br />
We believe that organizations can build a competitive advantage for themselves in how they attract and manage<br />
their workforce if they embrace these practices as a deliberate strategy and not as a one-off benefit offered on a need<br />
basis. Flexible work arrangements can drive benefits ranging from significant cost saving, higher productivity, better<br />
ability to attract and retain a diverse and geographically dispersed workforce to benefits of business continuity and<br />
organization sustainability.<br />
Here, Genpact shares with us their journey. What led them to evaluate flexible work arrangements – the<br />
challenges they faced and more importantly, how they got around them.<br />
We are sure that there is tremendous learning that other organizations can leverage from this and would like to<br />
thank Genpact for providing us this opportunity.<br />
witnessed a lot of attrition due to these reasons especially<br />
among female employees. This forced us to look at<br />
the option of providing employees with an alternate<br />
mechanism to continue their work from remote areas<br />
without compromising on data security. The popularity<br />
and availability of broadband connections by 2006 gave<br />
a boost to this idea and we shared this idea with some<br />
of our key customers. While some customers bought<br />
the idea easily, others were not very keen as they were<br />
worried about safeguarding their data, connectivity with<br />
employees and utilization of work hours. Hence, to begin<br />
with, we initiated this program in small pockets with a few<br />
customers and employees. Our internal IT team ensured<br />
robust controls to safeguard critical data and we put in<br />
place a detailed policy explaining the do's and don’ts of<br />
Rewards that Work<br />
totalRewards quarterly<br />
India • Volume 2 • Issue 2<br />
23
flexi work to employees. The testimony from employees<br />
and customers and our increasing capability to attract and<br />
retain talent gave us the reinforcement to launch this<br />
program across our various businesses.<br />
Flexi Work = Smart Work: The Options<br />
Traditionally, 'flexible work' is a term used to describe all<br />
kinds of employment which differ from the traditional<br />
9:00-5:00 full time job. Our ‘part time work’ and<br />
‘tele-work’ practices go back to 2004-05. We realized that<br />
with increasing competition and the constant battle for<br />
good resources, we needed to expand our hiring pool.<br />
The part time work program gave us the flexibility to hire<br />
undergraduates, housewives and retired employees on<br />
a part time basis. These employees were trained under<br />
specialized training programs and helped us maximize<br />
our people productivity. The success of this initiative<br />
encouraged employees and managers to explore more flexi<br />
work options and through continuous employee feedback,<br />
we developed and institutionalized work from home and<br />
telecommuting practices.<br />
Some of the options that our employees across<br />
regions and levels can choose from are:<br />
Work from home: Employees work from home for most<br />
part of the week and come to office at least once or twice<br />
Tele-work: Employees work up to several days a week<br />
at sites other than their primary location<br />
Flextime: Employees vary the start and end times of<br />
their work days, whether on-site or off-site, covering<br />
core hours<br />
Remote work: Employees exclusively work from<br />
locations outside the primary work site (satellite or<br />
client office)<br />
The flexi work program has<br />
developed into a sustainable<br />
and enriching experience.<br />
To measure the overall<br />
effectiveness and success<br />
of the program, we use<br />
measures such as employee<br />
productivity, cost effectiveness,<br />
attrition rate, net promoter<br />
score and diversity at each<br />
business unit level.<br />
24 www.aonhewitt.com/india<br />
Part time work: Employees work in shifts and<br />
cover 'prime time' or high call volume hours. These<br />
employees are usually undergraduates or those<br />
pursuing higher education and work for 4-5 hours a<br />
day instead of regular shifts<br />
The Barriers and Enablers<br />
Every change comes with its challenges and our flexi work<br />
program had its share of challenges too. There were more<br />
questions than we had answers for. It required a paradigm<br />
shift in the thought processes of leaders/managers,<br />
employees and customers.<br />
While employees questioned their appraisal process,<br />
and were afraid of biases, managers were afraid to delegate<br />
critical responsibilities. We learnt that employees who<br />
work from home or work flexibly during select hours, were<br />
some times left uninformed of key developments in the<br />
organization thus, leaving them detached and disengaged.<br />
We also saw that there was limited face time between<br />
the employee and the supervisor. Customers had their<br />
own share of worries. They had questions on data security,<br />
utilization of resources and employee commitment.<br />
We realized that the success of this program was<br />
contingent on employee commitment and the manager’s<br />
and customer’s buy-in. And hence, it was important for us<br />
to address these challenges.<br />
We launched series of floor walks and communication<br />
efforts to educate employees about the benefits of this<br />
program. We ensured a non-discriminatory environment<br />
with no biases towards employees availing these options<br />
on policies that deal with employee promotion, merit<br />
increments and bonuses. All important information was<br />
shared with them through articles, blogs, write-ups and<br />
video clips through the intranet page. To ensure employees<br />
stay connected with their supervisors, we further tuned the<br />
flexi work guidelines to include at least 1-2 days of work
“I have been with Genpact for the<br />
last 13 years now. It was a tough<br />
decision once I became a mother<br />
to continue to work. Thankfully,<br />
I was offered to work from home<br />
due to which I could fulfill two big<br />
aspirational goals… build my career<br />
and look after my baby. Genpact<br />
trusted me to lead the Executive<br />
Hiring for India and that too,<br />
by working from home. I saved<br />
a lot on travel time and spent<br />
those hours productively to do<br />
my job and be with my baby!”<br />
Ritu Bhatia<br />
Assistant Vice President,<br />
Executive Hiring, Genpact<br />
from office. We groomed our managers on handling virtual<br />
teams and shared success stories and program case studies<br />
with our customers. Our strong IT setup ensured that<br />
employees availing the flexi work options were provided<br />
with special IT assets and adequate IT support to carry on<br />
day-to-day work. The team also ensured regular audits to<br />
protect critical information. Any kind of remote work was<br />
permitted only after specific approvals from business owners<br />
and at times even customers.<br />
We provide work from home employees with a<br />
company sponsored broadband connection, VPn ID, a<br />
laptop lock and a laptop with security controls to address<br />
the data security issues. We have also set up a toll-free<br />
helpdesk number for employees to get IT support at home.<br />
Additionally, a separate agreement on data confidentiality is<br />
signed with the employees availing these options to protect<br />
data and copyright materials.<br />
Measuring the Impact on Businesses<br />
and Employees<br />
We stayed extremely focused on measuring the<br />
effectiveness of flexi work programs. Employee<br />
productivity, cost effectiveness, attrition rate, net<br />
promoter score and diversity were measured at each<br />
business unit level to understand and arrive at the<br />
overall effectiveness and success of this program.<br />
The success far exceeded our expectations and we<br />
saw positive results in multiple areas. Some businesses<br />
were able to increase seat utilizations by approximately<br />
65% which contributed significantly to reducing their<br />
fixed cost. Another business showed a consistently<br />
higher eSat score for employees working from home in<br />
comparison to employees working from office. Typically,<br />
net Promoter Scores (nPS) for WFH (work from home)<br />
process was way higher than the overall Genpact net<br />
Promoter Score, a clear indicator that satisfied employees<br />
bring better results and are working well for our clients too.<br />
Employees who avail of flexi work are not shortchanged<br />
when it comes to annual appraisals and are in fact, more<br />
productive than other peers. In our analytics business, only<br />
~2% of our employees on flexi work were rated ‘below<br />
meets expectations’.<br />
These practices are now highly appreciated by the<br />
employees and their families alike. It reinforces our belief<br />
that 'We grow when our people grow'. It continues to be<br />
a very successful model and with the advances in<br />
technology over time, we will continue to ensure more<br />
robust data security systems and provide better<br />
connectivity for employees. The flexi work program has<br />
developed into a sustainable and enriching experience<br />
and has now become a business imperative and is<br />
measured at leadership levels.<br />
Contributors<br />
Co-contributors<br />
Smitha Pillai<br />
Senior Manager, C&B,<br />
Genpact, India<br />
Urvashi Singh<br />
Vice President, Genpact Executive Hiring<br />
and C&B Leader,<br />
Genpact, India<br />
Richa Sharma<br />
Assistant Vice President,<br />
Global <strong>Compensation</strong> and Benefits<br />
Genpact, India<br />
Garima Derozarieux<br />
Senior Manager, Corporate Communications,<br />
Genpact, India<br />
CASEstudy<br />
totalRewards quarterly<br />
India • Volume 2 • Issue 2<br />
25
Global Mobility in the IT<br />
Sector: The Cost Factor<br />
2011 was a year of uncertainty for the world economy.<br />
Global activity reduced in its intensity; many countries in the<br />
Euro Zone witnessed financial crises; Japan had to endure<br />
the twin strikes of the earthquake and tsunami followed by<br />
the nuclear disaster; there were many upheavals across the<br />
Middle East; and closer home, in India, there was a fall in<br />
the growth rate to near recession levels. In such a scenario,<br />
one would have expected employee mobility, a phenomenon<br />
that is inevitable for companies competing in global<br />
markets, to go down significantly.<br />
Similar to the post recession scenario, however,<br />
international mobility to and from India remained resilient.<br />
This was driven by factors such as moderate but steady<br />
economic activity in emerging markets – sustaining the<br />
need for international assignments, rapid international<br />
expansion by Indian organizations – leading to more<br />
diverse assignments and lack of locally available qualified<br />
professionals in many countries driving the need to send<br />
employees to overseas locations. A headcount analysis of<br />
26 www.aonhewitt.com/india<br />
five of the large IT players in India, for example, reflected<br />
an increase in overseas headcount in 2011 by about<br />
10% vis-à-vis 2010 levels.<br />
Having said that, a key change that has been brought<br />
about by recession and the resulting period of continued<br />
low economic growth, is the significant pressure on<br />
organizations to reduce costs of international assignments.<br />
In no other sector is the impact of expatriate movements<br />
on costs as significant as the IT sector in India, wherein<br />
thousands of employees are relocated overseas every year,<br />
typically for projects, career development, training or<br />
business development.<br />
The decision of whether an organization deploys local<br />
talent for an overseas assignment or deputes employees<br />
from the headquarter country, primarily depends on three<br />
key factors:<br />
The availability and quality of local talent<br />
Visa/work permit and legal norms governing the<br />
mobility of talent
The differentials between local salaries and<br />
international assignee salaries<br />
In this article, we have attempted to address the latter,<br />
i.e., the subject of salary differentials.<br />
We carried out a comparison of last year’s<br />
compensation data of international assignees of 14 of the<br />
large IT firms (in India) in the <strong>Aon</strong> Hewitt database, across<br />
countries, with local employee compensation data in<br />
these countries from the Radford GTS Survey conducted<br />
last year.<br />
Negative figures signify lower local salaries vis-à-vis international<br />
assignee salaries<br />
*Data not available<br />
Source: <strong>Aon</strong> Hewitt Database 2011, Radford GTS Survey 2011<br />
The data throws up some interesting insights. In case<br />
of north America and Western Europe, local salaries are<br />
consistently higher than Indian international assignee<br />
salaries across management levels with the differentials<br />
increasing with increase in the management levels.<br />
Considering that the number of employee movements<br />
from IT organizations in India is the highest to these<br />
two regions, this does reflect a significant opportunity<br />
in cost savings on account of labor arbitrage, one<br />
which these organizations have traditionally been<br />
capitalizing on.<br />
Local salaries in APAC and Eastern Europe are<br />
significantly lower than Indian assignee salaries at<br />
the junior management level. Therefore, movements<br />
to these regions, at the junior management level,<br />
are more a factor of availability and quality of talent<br />
rather than labor arbitrage, with the exception of<br />
Japan where local salaries are significantly higher than<br />
PERSPECTIVE<br />
Indian assignee salaries. However, salaries across APAC<br />
tend to significantly increase as one goes higher up the<br />
management levels. Interestingly, local employee salaries<br />
in Eastern Europe continue to remain lower than Indian<br />
international assignee salaries in these regions even at the<br />
middle management levels.<br />
Though the differentials between expatriate salaries<br />
and local salaries in the assignment country serves as an<br />
important factor in decisions around employee mobility,<br />
the differentials of expatriate salaries across regions may<br />
also drive some of these decisions.<br />
Figures reflect annual average total cost to company in USD thousand<br />
*Data not available<br />
Source: <strong>Aon</strong> Hewitt Database 2011<br />
A comparison of Indian expatriate salaries in the<br />
IT sector across regions reflects the highest salaries across<br />
all management levels in the region of north America,<br />
followed by Western Europe. This is primarily on account of<br />
higher market rates for IT professionals prevalent in these<br />
geographies, as well as, on account of higher cost of living<br />
in countries within these regions. APAC emerged as<br />
the third most expensive region in terms of labor cost of<br />
Indian IT professionals, closely followed by the Middle East.<br />
Salaries in Eastern Europe are the least, the differentials<br />
between Western Europe and Eastern Europe ranging from<br />
64-79% at junior/middle management levels. In case of<br />
specific country combinations (such as norway-Poland),<br />
these may be as high as 130-135%.<br />
As IT organizations struggle to reduce international<br />
assignment costs, they may find merit in evaluating the<br />
need to have assignees based out of high-cost/salary<br />
locations. For example, it may be possible in some cases to<br />
depute Indian assignees such as business development<br />
professionals to less expensive locations in Eastern Europe,<br />
undertaking more frequent travel to locations in Western<br />
Europe, rather than having them based out of more<br />
totalRewards quarterly<br />
India • Volume 2 • Issue 2<br />
27
APAC emerged as the third<br />
most expensive region in<br />
terms of labor cost of Indian<br />
IT professionals after North<br />
America and Western Europe.<br />
expensive locations in the latter region (assuming low<br />
availability or quality of local talent with similar skillsets in<br />
Eastern European countries). It is obvious that this model<br />
has its own advantages and disadvantages in terms of<br />
possible impact on project deliveries and client relationship<br />
management, which need to be taken into consideration<br />
while taking these decisions.<br />
It is also interesting to note that salary differentials (in<br />
percentage terms) between Indian international assignees<br />
across regions decrease as one moves higher up the<br />
management levels. This may be on account of the fact<br />
that talent at these levels may be considered as critical and<br />
sometimes even ‘global’, and therefore, many organizations<br />
while determining the salaries of senior management<br />
professionals, consider the roles of individuals to be the<br />
major deciding criteria without as much emphasis on the<br />
assignment location.<br />
So how do salaries of employees increase when<br />
expatriated overseas and what is the impact on<br />
organization costs?<br />
Figures reflect multiplier of Indian international assignee salaries over the<br />
Indian local salaries<br />
*Data not available<br />
Source: <strong>Aon</strong> Hewitt Database 2011<br />
When comparing the salaries of Indian international<br />
assignees to their peers in India, a significant differential can<br />
be observed especially in case of movements to the regions<br />
28 www.aonhewitt.com/india<br />
of north America and Western Europe – the assignee<br />
salaries at lower levels in these geographies are as high<br />
as nearly six to seven times the salaries of their peers in<br />
India. These differentials in salaries, however, reduce to a<br />
multiplier of around only two at senior management levels.<br />
Having said that, these when combined with additional<br />
costs in terms of pre-assignment, relocation and onsite<br />
administration support further increase the organization<br />
costs, thus making each expatriation expensive.<br />
It has always been a tight rope walk for most HR/<br />
mobility practitioners in IT organizations to balance<br />
the expatriate assignment costs with maintaining<br />
competitiveness of the expatriate salaries. Going by the<br />
growth forecasts for the global economy for the coming<br />
year, the rope is expected to become narrower.<br />
Regional Categorizations:<br />
North America: Canada and USA<br />
APAC: Australia, China, Hong Kong, Japan, Malaysia,<br />
new Zealand, Philippines and Singapore<br />
Western Europe: Denmark, Finland, France, Germany,<br />
the netherlands, norway, Ireland, Italy, Spain, Switzerland<br />
and the UK<br />
Eastern Europe: Poland and Romania<br />
Middle East: Qatar, Saudi Arabia and the UAE<br />
Kartik Rishi<br />
Solution Lead – Expatriate <strong>Compensation</strong> Practice,<br />
<strong>Aon</strong> Hewitt, India<br />
Udit Narula<br />
Consultant – <strong>Compensation</strong> Practice,<br />
<strong>Aon</strong> Hewitt, India<br />
For more information, please write to us at totalrewards@aonhewitt.com
Rethinking the Future<br />
of Total Rewards<br />
PERSPECTIVES<br />
Our Annual Rewards Conference, held on April 26, 2012 gave us the opportunity<br />
to meet an extremely impressive lineup of industry stalwarts. We managed to<br />
catch up with some of them for a short tête-à-tête in between their sessions, and in<br />
this feature, we bring to you a CEO’s, an Investor's and HR Heads' perspectives on<br />
the future of Total Rewards. They talked to us about the expectations from HR, the<br />
evolving governance environment for compensation and lots more.<br />
totalRewards quarterly<br />
India • Volume 2 • Issue 2<br />
29
Parag Shah<br />
Managing Partner –<br />
Mahindra Partners<br />
Q. In today’s context, what are the<br />
key expectations that you have<br />
from Hr as a business leader?<br />
A. I think the first would be for HR<br />
to be a ‘partner’ to business. To<br />
do that, they need to begin with<br />
playing an active role in the business<br />
planning meetings, in strategy and<br />
budgeting sessions, and not limit<br />
their contribution only to aspects<br />
‘traditionally‘ related to human<br />
resources. HR needs to be a key<br />
contributor in shaping and positively<br />
impacting the business over time.<br />
The second, clearly, HR needs<br />
to think out-of-the-box. For example,<br />
in our industry, we have businesses<br />
which are at different life stages –<br />
from startups to mature businesses,<br />
and many with global footprint.<br />
There is rapid technological<br />
development with social media<br />
network available at all times. Under<br />
such dynamic internal and external<br />
environment, the HR strategy must<br />
also change and that’s where I feel<br />
HR needs to step-up. They need to<br />
ensure that they bring in flexibility to<br />
deal with complexity.<br />
30 www.aonhewitt.com/india<br />
The third is about governance.<br />
The focus on governance has<br />
sharpened, and HR has a critical role<br />
to play in ensuring that not only are<br />
they able to liaison with the regulatory<br />
bodies, but also develop robust<br />
systems and practices that will help<br />
create a culture of self-governance.<br />
Q. on the point of governance, how<br />
do you see it evolve, going forward<br />
in India?<br />
A. I think there will be two types<br />
of governance mechanisms: selfgovernance<br />
and government-defined<br />
or regulatory-driven governance.<br />
I personally feel, organizations<br />
today need to focus on ensuring the<br />
former, while the latter will follow.<br />
We at Mahindra Group, have had<br />
great success in this area. In 2009,<br />
Forbes ranked Mahindra among the<br />
top 200 most reputed companies in<br />
the world and we pride ourselves for<br />
living up to our Core Values. Even our<br />
new corporate brand, Mahindra Rise,<br />
launched in 2011, is not so much a<br />
rebranding initiative as it is a culture<br />
transformation initiative. It’s about a<br />
common purpose, a common goal<br />
and has governance as an integral<br />
part of it.<br />
If we can get the self-governance<br />
aspect right, the mandatory or<br />
regulations will only be a secondary.<br />
Right balance is critical to the success<br />
of governance in any context.<br />
Q. What are your views on the<br />
disparity of pay between entry level<br />
and CEo compensation in India?<br />
A. I think there is always going to be<br />
a difference. The moot point is how<br />
much of a difference? One way to<br />
look at it is to study the GInI index<br />
as that is a fairly standard metric that<br />
will show where India stands. If I am<br />
not mistaken, we are quite low in<br />
our scorecard. However, it has a<br />
lot to do with perspectives. The<br />
top management believes in being<br />
co-owners to the success of the<br />
organization and therefore, feel that<br />
they need to be rewarded differently.<br />
Whereas those at the grassroots<br />
level believe that they are the real<br />
drivers of the business – the brick<br />
and mortar part. I definitely think<br />
there is high disparity in India, and<br />
a correction is likely, going forward.<br />
Though I do hope that it is driven<br />
by the stakeholders and not so<br />
much by the government. A healthy<br />
difference is important since it puts<br />
the accountability with the person to<br />
perform and be rewarded accordingly.
Q. As a business leader, what<br />
are the expectations you have<br />
from Hr?<br />
A. Knowledge of the business and<br />
the ability to think strategically and<br />
in step with business/line managers<br />
is really the single most important<br />
expectation from HR. We need<br />
HR professionals who understand<br />
the business so that they can create<br />
fair and transparent HR models<br />
around the business requirement<br />
and not separate from it.<br />
Also, I strongly believe that talent/<br />
HR management is as much a business<br />
manager’s responsibility, and they<br />
need to own the people strategy<br />
along with HR. Business framework<br />
and the people framework specially<br />
in a services organization need to be<br />
very closely aligned and integrated.<br />
One way to facilitate this is<br />
through job rotation and through<br />
being ‘engaged’ in the day-to-day<br />
operations of the business. In my own<br />
organization, one of our business<br />
managers has recently moved to take<br />
on the Head HR portfolio.<br />
Q. <strong>Compensation</strong> today is possibly<br />
the single largest investment that<br />
the organization makes for its<br />
people. As a business leader, what<br />
is your view on the effectiveness or<br />
on the returns from this investment<br />
and what is the best way to<br />
measure this?<br />
A. I think this is an extremely<br />
important question. An increase<br />
in salary should be commensurate<br />
with an increase in efficiency or<br />
productivity of an individual or else<br />
there is a risk of creating a ripple<br />
effect, which will take the employees<br />
to a point where they are non-hirable.<br />
We didn’t see organizations<br />
focusing on this aspect till 2007,<br />
especially in our industry, which for<br />
7-10 years saw a CAGR of 30%. Post<br />
the downturn, however, as businesses<br />
came under pressure, this issue came<br />
to the forefront. now, when we look<br />
at compensation benchmarks, we are<br />
also parallely looking at performance<br />
and productivity benchmarks. An<br />
employee who is at the 90 th percentile<br />
on compensation is being evaluated<br />
on whether the same bears out when<br />
we benchmark his/her performance<br />
or competence.<br />
Defining the right performance<br />
measures and conducting<br />
productivity/efficiency analysis is key<br />
to measuring the effectiveness<br />
or returns from your investment<br />
in compensation.<br />
Q. Innovation vs. Execution focus,<br />
what do you think is the need of<br />
the hour for rewards professionals?<br />
PERSPECTIVES<br />
Rajeev Jain<br />
Chief Executive Officer –<br />
Bajaj Finance<br />
A. This is a very interesting question.<br />
To my mind, execution holds the<br />
key. Execution is about constantly<br />
improvising, about taking you to<br />
the last mile. You can have the<br />
best-in-class program or policy but<br />
if it is not executed well, it really<br />
does not hold much meaning.<br />
Barring the 2% of the population for<br />
whom very complex compensation<br />
structuring is required, for the<br />
remaining 98%, execution has far<br />
greater importance than innovation.<br />
Having said that, I am in no way<br />
advocating that innovation is not<br />
important. We need to constantly<br />
challenge ourselves, think<br />
out-of-the-box to stay ahead of the<br />
curve. If I was to give a weightage,<br />
I would say, it is 20% innovation and<br />
80% execution.<br />
totalRewards quarterly<br />
India • Volume 2 • Issue 2<br />
31
Animesh<br />
Kumar<br />
Group Head – HR &<br />
Corporate Communications,<br />
IDFC<br />
Q. How are you seeing 'total<br />
rewards' evolve to meet the<br />
changing needs of the workforce?<br />
A. While it is important to look at<br />
segmenting rewards and making<br />
them more meaningful for their<br />
targeted groups, I believe, it is far<br />
more critical to create a sense of<br />
higher purpose within organizations.<br />
Great organizations are moving<br />
towards a 'Total Rewards approach'<br />
that looks at pay as just one, albeit<br />
important, element of the overall<br />
package. Simultaneously, employees,<br />
both current and potential, are also<br />
beginning to evaluate potential<br />
employers on a wider array of<br />
parameters such as organizational<br />
culture and purpose, employee<br />
experience, learning/growth<br />
opportunities, flexible working<br />
arrangements, commitment to a<br />
triple bottom line approach, etc. In<br />
this context, organizations must<br />
rethink the design and management<br />
of their rewards programs and<br />
32 www.aonhewitt.com/india<br />
showcase the total employment<br />
deal to be able to attract the most<br />
appropriate talent – talent that is<br />
not just functionally competent<br />
but also culturally aligned with the<br />
values and purpose of the firm.<br />
Q. What about Gen y in particular?<br />
What do we need to do differently<br />
to attract and retain them?<br />
A. The answers that have emerged<br />
for enabling organizations to meet the<br />
needs of a changing workforce would<br />
hold good for the 'Millennial' (or<br />
Gen Y's) as well. I have found that the<br />
'Millennial' talent gravitates towards<br />
firms that have a clearly defined<br />
and articulated sense of purpose.<br />
Therefore, organizations that<br />
succeed in creating a strong<br />
psychological relationship in addition<br />
to a competitive financial contract will<br />
be better able to attract and retain the<br />
'Millennial' employee.<br />
The 'Millennials' have a deep urge<br />
to explore and experience different<br />
avenues in the first decade of their<br />
careers. Firms need to be able to<br />
leverage this and create opportunities<br />
for them to experience different roles<br />
within the organization early on in<br />
their careers.<br />
Other than that, creating flexible<br />
working arrangements backed by a<br />
technology infrastructure and clearly<br />
defined productivity measures are<br />
alternatives that have been tried<br />
successfully by many companies.<br />
Q. do you think pay disparity<br />
(between entry level and top<br />
management) is an issue in India?<br />
And if yes, what are some of the<br />
strategies we should possibly adopt<br />
to correct this in the future?<br />
A. The income differential between<br />
an employee at the entry level and<br />
at the top management level in<br />
India is probably far higher than the<br />
global average. This is an important<br />
issue, as also a very complex one for<br />
which there are no easy answers.<br />
For one, the leadership talent in<br />
India is often sourced internationally<br />
and/or is globally mobile. This<br />
necessitates that pay levels are<br />
referenced to a wider geography and<br />
not constrained just by local demand<br />
and supply economics. However, this<br />
is not necessarily the case for talent<br />
across all levels within companies.<br />
This coupled with a severe shortage<br />
of leadership talent (fuelled by our<br />
economic growth since the early<br />
'90s), has increased leadership level<br />
payouts exponentially, contributing<br />
further to pay disparities.<br />
While a part of this issue will be<br />
corrected through an increased flow of<br />
Indian origin leadership talent willing<br />
to relocate to India (a clear emerging<br />
trend over the last five years), there<br />
is no option for companies but to<br />
significantly enhance the investment<br />
in developing leaders internally. Like<br />
I mentioned before, there are no<br />
easy answers.<br />
Q. do you feel that increased<br />
governance may in some ways help<br />
reduce this disparity?<br />
A. Pay levels should reflect as they<br />
always will, the play of economic<br />
value-added and demand supply<br />
dynamics. Increased governance<br />
therefore may not be the panacea<br />
or the best way to address this<br />
issue. What I expect increasingly<br />
will happen is increased shareholder<br />
activism, especially by institutional<br />
shareholders to ensure that senior<br />
employee income and payouts<br />
are sharply linked to investor<br />
wealth creation and long-term risk<br />
management in order to maintain<br />
a sense of fairness and proportion.
Q. How do you think employers<br />
should position ’total rewards’ to<br />
their employees in India?<br />
A. Well, I think, as we in India move<br />
from cash or cash plus benefits, to<br />
a more encompassing definition<br />
of Total Rewards, it is important to<br />
caution against the extreme, where<br />
every dollar spent on the employee<br />
is quantified and listed. The key<br />
principle is around the investment<br />
that the organization is making in<br />
an employee and the value that the<br />
employee sees in it. Simply put,<br />
your Total Rewards should be able<br />
to communicate the investment<br />
that an organization is making in an<br />
employee and not simply the cost.<br />
For example, if we were to include<br />
the cost of say a mobile phone<br />
provided to an employee, then<br />
there is a risk of getting viewed by<br />
employees as ‘too cheap’. The key<br />
lies in using a balanced approach.<br />
Q. What in your opinion would be<br />
the most effective measure of your<br />
rewards programs?<br />
A. Many companies struggle to<br />
define a measure to assess the<br />
effectiveness of their rewards<br />
programs. However, I believe, there<br />
are three or four simple parameters<br />
that you need to look at:<br />
First, is the program driving the<br />
right or desired behavior and are you<br />
rewarding it appropriately?<br />
Second, are the right performance<br />
metrics in place and is the rewards<br />
program closely tied to these metrics?<br />
Third, is the program helping you<br />
retain your key and critical talent?<br />
And fourth, perhaps the most<br />
important one – has the rewards<br />
program helped achieve the desired<br />
business result?<br />
There are a lot of additional<br />
metrics that one can look at – cost<br />
per revenue, etc. but my personal<br />
view is that there are so many other<br />
variables that impact these metrics<br />
and one cannot really look at them<br />
in isolation.<br />
In my mind these four parameters<br />
that I spoke about earlier are<br />
probably the best indicators for<br />
measuring the effectiveness of your<br />
rewards programs.<br />
Q. What in your opinion can the<br />
Hr function do to better support<br />
the business?<br />
A. I think, increasingly, people and<br />
organizational decisions are forming<br />
a part of the broader organizational<br />
strategy and that’s where HR needs<br />
to play a key role. HR needs to<br />
step-up and organize itself by being<br />
more proactive and adaptive to the<br />
rapidly changing requirements of the<br />
PERSPECTIVES<br />
Krish<br />
Shankar<br />
Executive Director –<br />
Human Resources, Airtel<br />
organization. It is important for them<br />
to be a part of the organizational<br />
planning process and help directly<br />
influence the future strategy and<br />
business success. They need to define<br />
and own the people and talent<br />
strategy and not have a reactive<br />
approach to managing talent.<br />
Q. do you see governance of<br />
compensation management<br />
changing in the next couple of<br />
years because of what we see in<br />
the external environment?<br />
A. Yes, definitely. There will be<br />
regulations which will see greater<br />
governance especially of top and<br />
senior management compensation.<br />
In my view, companies themselves are<br />
likely to define a strong governance<br />
structure to drive transparency and<br />
equality. Reliance on market/external<br />
benchmarks and audits is likely to<br />
increase. Also, I see the Board playing<br />
a much larger role in ensuring a<br />
balanced portfolio of what people<br />
get paid.<br />
totalRewards quarterly<br />
India • Volume 2 • Issue 2<br />
33
SURVEYCAlEndAr<br />
FMCG Manpower and<br />
Productivity Study January-May<br />
The study provides credible benchmark data on<br />
manpower productivity. It looks at the return<br />
on compensation spend, while comparing<br />
productivity trends, headcount and payroll cost<br />
allocations, etc.<br />
Best Managed Boards Survey<br />
January-June<br />
This survey in conjunction with BSE, NSE, SEBI<br />
and Mint is focused on identifying the best<br />
practices in corporate and board governance<br />
in India.<br />
Short-Term International<br />
Assignment Study February-March<br />
The study focuses on capturing policies and<br />
practices as well as daily allowances paid<br />
for short-term international assignments.<br />
Salary Increase Survey<br />
Phase I: June-September<br />
Phase 2: November-February<br />
One of the most exhaustive studies in the area<br />
of performance and rewards in India. The<br />
study measures actual and projected salary<br />
increases, variable pay and performance data<br />
across employee categories.<br />
Executive <strong>Compensation</strong> Study<br />
September-January<br />
The study provides organizations with access<br />
to rich analysis of data and practices in<br />
executive compensation.<br />
Campus <strong>Compensation</strong> Study<br />
(CCS) October-December<br />
The study provides organizations with trends<br />
in compensation for MBAs and graduates from<br />
top business schools and engineering colleges<br />
across the country.<br />
India Telecom Forum<br />
October-February<br />
One of the flagship studies in the telecom<br />
sector that captures cash and benefits<br />
information across 170 positions.<br />
India Hotel Survey<br />
May-September<br />
The study covers a comprehensive list of<br />
200+ positions across 11 groups and<br />
160+ properties. It analyzes differentials by<br />
city, locations and covers key business metrics.<br />
India FMCG Forum<br />
June-December<br />
The forum brings together all major MNCs and<br />
Indian FMCG organizations to benchmark their<br />
positions, levels and benefits across the industry.<br />
34 www.aonhewitt.com/india<br />
SIAM Automobile Forum<br />
October-January<br />
A study of all auto manufacturing organizations<br />
covering compensation data across levels and<br />
functions of management. It also serves as a<br />
platform for sharing best practices.<br />
India Pharmaceutical Forum<br />
June-September<br />
The forum brings together the key MNCs<br />
and Indian pharmaceutical organizations<br />
to benchmark their positions, levels<br />
and benefits across the industry.<br />
Medical Technology Forum<br />
July-November<br />
The study covers leading organizations in the<br />
medical devices/technology domain providing<br />
robust and comprehensive information on<br />
cash compensation and industry trends.<br />
Hi-Tech/IT Industry Study<br />
June-September<br />
The study provides robust and comprehensive<br />
information on cash compensation and<br />
industry trends across 180+ companies.<br />
ITeS Industry Study<br />
March-June and November-February<br />
A comprehensive study that covers<br />
500+ positions across 60+ job families.<br />
The study includes detailed cash compensation<br />
and industry trends across domestic and<br />
international businesses.<br />
Indian Semiconductor and EDA<br />
Forum (ISEF) July-September<br />
The forum brings together leading<br />
semiconductor and EDA companies to<br />
benchmark compensation and share salary<br />
increase trends, variable pay practices, key<br />
organizational metrices, etc.<br />
Variable Pay Practices and<br />
Benefits Study October-January<br />
A comprehensive study for the IT and ITeS<br />
industry capturing 35+ policies and details on<br />
plan eligibility, entitlement, design and other<br />
policy features for 100+ organizations.<br />
Skills Study May-August<br />
Upcoming Insights<br />
This study provides benchmark information<br />
and best practices with regards to managing<br />
compensation for niche and differentiated<br />
skills in the IT and ITeS industry.<br />
McLagan – Banking &<br />
Financial Services Insights<br />
India Banking Forum Study<br />
May-October<br />
A study for all major Indian and MNC banks<br />
to come together to share and benchmark<br />
their positions and levels across the industry.<br />
Capital Markets Forum Study<br />
April-September<br />
A benchmark study conducted for large<br />
MNCs and Indian institutional securities firms<br />
covering equity capital markets, debt capital<br />
markets and investment banking job families.<br />
Investment Management<br />
Forum Study June-October<br />
A flagship study in the asset management<br />
sector covering key job families like fund<br />
management and sales.<br />
Private Banking Forum Study<br />
June-September<br />
A study covering large Indian and MNC<br />
private wealth management organizations to<br />
benchmark key roles across functions.<br />
Life Insurance Forum Study<br />
August-January<br />
A study of the largest life insurance players in<br />
India covering positions across all channels<br />
of distribution and key corporate functions.<br />
Retail Broking Forum Study<br />
October-January<br />
A study covering Indian and MNC retail<br />
brokerage organizations to benchmark<br />
positions across sales, PMS and other functions.<br />
Private Equity Forum Study<br />
October-January<br />
A study of private equity players covering key<br />
positions across fund management roles.<br />
NBFC Forum Study<br />
November-March<br />
A study of large NBFCs covering 100+ unique<br />
roles across sales and support.<br />
For more information, please write to<br />
us at totalrewards@aonhewitt.com
'total Rewards Statements' tRS<br />
Employers have seen the potential of Total Rewards for many years. Each year, they invest vast sums on their<br />
Total Rewards programs. But, are organizations really reaping the return on their investments?<br />
<strong>Aon</strong> Hewitt can help<br />
Quantify and define the full value of your Total Rewards programs<br />
Communicate them in a clear, concise and consistent manner<br />
Innovate and differentiate your programs for a sustainable competitive edge<br />
Introducing 'total Rewards Statements' tRS<br />
An online employee portal that can consolidate in one convenient platform – the full value of Total Rewards,<br />
details of relevant policies and programs, essential employee profile and career history, calculators to model<br />
future wealth creation, make flexible benefits choices and much more.<br />
For further details and queries, please contact<br />
Madhvi Pande at madhvi.pande@aonhewitt.com<br />
totalRewards quarterly<br />
India • Volume 2 • Issue 2<br />
35
<strong>Aon</strong> Hewitt<br />
Learning Center<br />
For HR professionals to provide real functional expertise that is both strategic and leading-edge, they must hone their<br />
skills and capabilities.<br />
<strong>Aon</strong> Hewitt Learning Center (AHLC) provides targeted courses in Human Capital Management for HR and<br />
non-HR professionals.<br />
Leveraging <strong>Aon</strong> Hewitt’s extensive experience and research in various aspects of HR, the courses and curriculum are<br />
designed for a result-oriented learning experience.<br />
A set of courses would culminate in a ‘Role-Based Certification’, that will assist professionals in their current or<br />
intended roles.<br />
over 3,000+ professionals certified across Asia Pacific.<br />
Four dimensional learning<br />
Study Module<br />
e-Learning Module<br />
Virtual Classroom/Classroom<br />
Communities of Practice<br />
Activities/Cases/Additional Learning<br />
Equipping you to be a World-Class HR Professional<br />
For further details and queries, please contact nanjundi Karthick at nanjundi.karthick@aonhewitt.com<br />
www.aonhewitt.com/india<br />
Upcoming courses<br />
<strong>Compensation</strong> Analyst Level 1 & 2<br />
Short-Term Incentives and Long-Term Incentives<br />
Expatriate <strong>Compensation</strong>