Annual Report 2011
Annual Report 2011
Annual Report 2011

You also want an ePaper? Increase the reach of your titles
YUMPU automatically turns print PDFs into web optimized ePapers that Google loves.
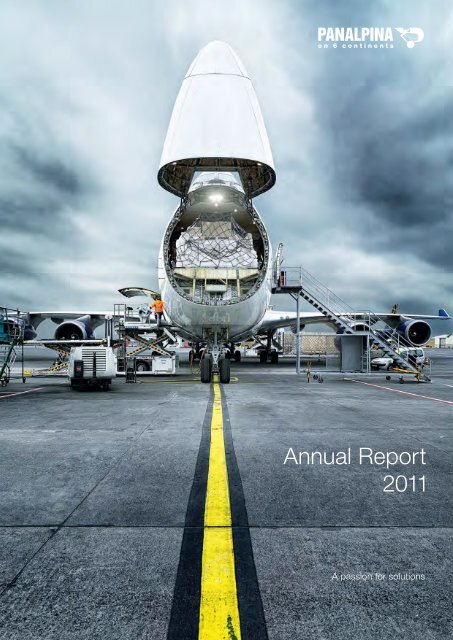
<strong>Annual</strong> <strong>Report</strong><br />
<strong>2011</strong><br />
A passion for solutions
Contents<br />
Letter to Shareholders 4<br />
<strong>Report</strong> of the Executive Board 6<br />
Group Management Structure 15<br />
<strong>Report</strong>ing Regions 16<br />
Product Divisions 18<br />
CEO Statement 30<br />
Success Factors<br />
Global Network 34<br />
Industry Verticals 36<br />
Employees 38<br />
Compliance and Corporate Culture 40<br />
Information Technology 42<br />
Procurement 43<br />
Quality, Security and HSE 44<br />
Responsibilities<br />
Social Commitment 49<br />
Corporate Governance 50<br />
Global <strong>Report</strong>ing Initiative 61<br />
Consolidated and<br />
<strong>Annual</strong> Financial Statements <strong>2011</strong><br />
Consolidated Financial Statement 64<br />
<strong>Annual</strong> Financial Statement 134<br />
Appendix<br />
Information for Investors 142<br />
Pictures 144<br />
Imprint 145
Five-year development<br />
in million CHF<br />
Net forwarding revenue<br />
10,500<br />
9,000<br />
7,500<br />
6,000<br />
4,500<br />
3,000<br />
1,500<br />
0<br />
EBIT<br />
320<br />
280<br />
240<br />
200<br />
160<br />
120<br />
80<br />
40<br />
0<br />
1,000<br />
875<br />
750<br />
625<br />
500<br />
375<br />
250<br />
125<br />
0<br />
8,641<br />
8,878<br />
2007 2008 2009 2010 <strong>2011</strong><br />
Shareholders’ equity<br />
Glossary<br />
299<br />
1,026<br />
193<br />
871<br />
Twenty-foot Equivalent Unit (TEU)<br />
Unit of measurement based on a 20-foot ISO container<br />
(6.10 meters long)<br />
Full Container Load (FCL)<br />
This refers to containers that are fully loaded by the consignor and<br />
unloaded by the recipient at the destination.<br />
Less than Container Load (LCL)<br />
This refers to part-loads or small loads that are grouped together and<br />
transported in containers throughout the transport chain.<br />
5,958<br />
30<br />
864<br />
7,164<br />
15<br />
812<br />
6,500<br />
174<br />
2007 2008 2009 2010 <strong>2011</strong><br />
915<br />
2007 2008 2009 2010 <strong>2011</strong><br />
Gross profit<br />
2,050<br />
1,900<br />
1,750<br />
1,600<br />
1,450<br />
1,300<br />
1,150<br />
1,000<br />
1,803<br />
Consolidated profit<br />
245<br />
210<br />
175<br />
140<br />
105<br />
70<br />
35<br />
0<br />
–35<br />
1,742<br />
1,377<br />
1,480<br />
1,477<br />
2007 2008 2009 2010 <strong>2011</strong><br />
211<br />
114<br />
10<br />
–26<br />
127<br />
2007 2008 2009 2010 <strong>2011</strong><br />
The containers are unloaded when they reach the various recipients<br />
at different destinations. The term LCL is used mainly for containers<br />
shipped as ocean freight.<br />
Ocean freight and air freight: a comparison of capacity<br />
The capacity of a 12,000-TEU container ship is equivalent to that of<br />
1,000 Boeing 747 cargo planes.<br />
The English version takes precedence over the German version.
Panalpina at a glance<br />
The Panalpina Group is one of the world’s leading providers<br />
of supply chain solutions, combining intercontinental air<br />
and ocean freight with comprehensive Value-Added Logistics<br />
Services and Supply Chain Services.<br />
Thanks to its in-depth industry know-how and customized<br />
IT systems, Panalpina provides globally integrated end-toend<br />
solutions tailored to its customers’ supply chain management<br />
needs. Panalpina operates a global network with<br />
some 500 branches in more than 80 countries. In a further<br />
80 countries, it cooperates closely with partner companies.<br />
Panalpina employs approximately 15,500 people worldwide.<br />
Panalpina’s business model: focussed to deliver end-to-end supply chain solutions<br />
Standard<br />
Warehousing<br />
Core Services<br />
Supply Chain Services<br />
Air and<br />
Ocean Freight<br />
Value-Added Logistics Services<br />
Vision<br />
We deliver reliable supply chain solutions that provide value<br />
to our customers – every time.<br />
Core values<br />
Performance – is our continuous commitment to long-term<br />
sustainable development and financial success: We aspire<br />
to out-play competition.<br />
Integrity – is the compass which drives our behavior and<br />
attitude towards each other and our customers: We keep<br />
our promises and comply with the rules.<br />
Professionalism – is how we create value for our customers<br />
through our solutions and by anticipating their business<br />
needs: We know our business and create value for our<br />
stakeholders.<br />
Overland
Key figures <strong>2011</strong><br />
Net forwarding revenue per product division<br />
Air Freight<br />
Ocean Freight<br />
Logistics<br />
Net forwarding revenue of CHF 6,500 million<br />
Currency adjusted gross profit increase by 12 % year-on-year, supported<br />
by organic growth across all regions and product divisions<br />
Consolidated profit of CHF 127 million<br />
Net working capital intensity at all-time low of 1.1 %<br />
Forwarding volumes: 848,000 tons in Air Freight (– 5 % year-on-year) and<br />
1,310,000 TEUs in Ocean Freight (+ 6 % year-on-year)<br />
Returns<br />
36%<br />
14%<br />
50%<br />
in % <strong>2011</strong> 2010<br />
Return on equity (ROE) 14.9 – 3.1<br />
Return on capital employed (ROCE) 43.2 – 5.4<br />
Net forwarding revenue per region<br />
Europe, Middle East, Africa and CIS<br />
North America<br />
Central and South America<br />
19%<br />
13%<br />
49%<br />
Asia Pacific 19%<br />
Share price development in comparison to SPI<br />
Swiss Performance Index (SPI)<br />
Panalpina World Transport<br />
Dec 31,<br />
2010<br />
Mar 1 May 1 Jul 1 Sep 1 Nov 1 Dec 31,<br />
<strong>2011</strong><br />
110%<br />
100%<br />
Panalpina <strong>Annual</strong> <strong>Report</strong> <strong>2011</strong><br />
90%<br />
80%<br />
70%<br />
60%
4<br />
Letter to Shareholders<br />
Sustainably profitable<br />
With a consolidated profit of CHF 127 million, Panalpina left an economically volatile<br />
year behind and entered a new year strengthened for the future. Concentration on<br />
the strategic orientation and the consistent focus on profitability are already paying off.<br />
Stakeholders can be paid a dividend.<br />
Panalpina closed the year under review with a solid business<br />
result. It recorded a gross profit of CHF 1,477 million and<br />
consolidated earnings of CHF 127 million. In comparison to<br />
2010, Panalpina’s ocean freight volumes grew by 6 % to<br />
a new record of 1,310,000 TEUs transported. Air freight<br />
forwarding volumes sank by 5 % to 848,000 million tons,<br />
but an increase in gross profit per ton of air freight compensated<br />
the decline in volumes. The Company acquired new<br />
business and expanded existing mandates in all customer<br />
segments.<br />
Clear growth strategy<br />
In its corporate strategy, Panalpina confirmed its role as<br />
one of the leading providers of global supply chain solutions<br />
and dedicated itself to sustainable, profitable growth. The<br />
focus on profitability with a product-oriented organization<br />
targeted towards strategic customer segments has already<br />
proven itself in the reporting year. The ten centers of expertise<br />
are targeted entirely toward the needs of customers,<br />
which enables to recognize and develop market niches and<br />
future markets. The asset-light business model has again<br />
proved its flexibility. It enables Panalpina to rapidly and efficiently<br />
react to uncertain market situations in order to take<br />
advantage of growth opportunities.<br />
To implement the corporate strategy with its ambitious<br />
growth objectives in the regions, Panalpina will introduce<br />
three regional CEOs in 2012. This places the decision<br />
makers closer to the customers, which enhances Panalpina’s<br />
clout in the markets. The three regional CEOs will belong<br />
to the Executive Committee, the operative management<br />
body. The regional management structure will be kept lean.<br />
Another route for generating growth is through acquisitions.<br />
Panalpina consistently reviews potential acquisitions for<br />
their value-generating and strategic potential. Panalpina<br />
found such a candidate in early <strong>2011</strong> with Grieg Logistics.<br />
Panalpina can expand its global presence with this Norwegian<br />
logistics service provider, particularly in the oil and<br />
gas industry, and integrate the know-how. Despite the<br />
Panalpina <strong>Annual</strong> <strong>Report</strong> <strong>2011</strong><br />
constant investments in organic growth, Panalpina remains<br />
practically without debt. The Company is financially solid,<br />
with adequate cash reserves and remains open to opportunities<br />
for acquisitions that make a good fit.<br />
Board of Directors and Executive Board<br />
With Lars Förberg and Knud Elmholdt Stubkjær, the <strong>Annual</strong><br />
General Meeting elected two new proven experts to the<br />
Board of Directors on May 10, <strong>2011</strong>. The Swedish citizen<br />
Lars Förberg, is Managing Partner and co-founder of<br />
Cevian Capital. The Dane Knud Elmholdt Stubkjær, looks<br />
back on a long and successful career in the shipping industry,<br />
including as CEO of the Mærsk Line, which belongs<br />
to the Danish A.P. Møller-Mærsk Group. Board member<br />
Günter Rohrmann stood down from the Board at the <strong>Annual</strong><br />
General Meeting. The composition of the Executive Board<br />
remained unchanged in <strong>2011</strong>.<br />
Dividend payout<br />
Based on the solid results of the <strong>2011</strong> business year, the<br />
Board of Directors of Panalpina World Transport (Holding)<br />
Ltd. proposes to the <strong>Annual</strong> General Meeting a dividend<br />
payout of CHF 2.00 and a nominal value payback of<br />
CHF 1.90 per share.<br />
Appreciation<br />
Panalpina thanks the high motivation and excellent commitment<br />
of its employees for the success and positive development<br />
in <strong>2011</strong>. They deserve the highest recognition from<br />
the entire Board of Directors and the Executive Board. We<br />
extend our thanks to our customers and suppliers for the<br />
partnership and the trust placed in the Company, as well as<br />
our valued shareholders for their loyalty and constant confidence.<br />
We look forward to a successful future together.<br />
Monika Ribar Rudolf W. Hug<br />
Chief Executive Officer Chairman of the Board<br />
of Directors
Letter to Shareholders<br />
Panalpina <strong>Annual</strong> <strong>Report</strong> <strong>2011</strong><br />
5
6<br />
<strong>Report</strong> of the Executive Board<br />
Focused execution leads to solid financial results<br />
The year <strong>2011</strong> was characterized by widespread uncertainty of economic prospects,<br />
resulting in nervous market behavior and high volatility. Growth slowed, particularly in<br />
the debt-burdened economies of the eurozone and the United States, where consumer<br />
confidence slid to very low levels. However, robust growth continued in many emerging<br />
markets, led in size by China, India and Brazil. Furthermore, the Company’s reporting<br />
currency, the Swiss franc, appreciated significantly against all major currencies during<br />
the reporting year and impacted the Group’s financial results materially. In this challenging<br />
environment, Panalpina achieved solid organic gross profit growth and further<br />
solidified its position within the industry. Sticking to its focused strategy of going for<br />
sustainable and profitable growth, the Group managed to increase its profitability, further<br />
expanded its profit margins and generated a substantial amount of free cash flow.<br />
Market development<br />
After a period of strong growth in 2010, world trade and<br />
global freight markets were characterized by the uncertainty<br />
of economic prospects around the world in <strong>2011</strong>.<br />
The International Monetary Fund estimates that global trade<br />
volumes rose approximately 7 % in <strong>2011</strong> – only about half<br />
of the 13 % growth rate posted the year before, which had<br />
been boosted by the restocking of inventories. In addition,<br />
and in contrast to 2010, growth in <strong>2011</strong> was relatively<br />
unevenly distributed across geographical trade lanes and<br />
transport modes. The amount of international cargo moved<br />
by air freight in <strong>2011</strong> slightly declined compared to the year<br />
before and thus once again fell short of the record volumes<br />
reached in 2007. In contrast, the global ocean freight<br />
market developed more robustly, growing by more than<br />
5 %, making <strong>2011</strong> a new record year with some 160 million<br />
TEUs transported on the ocean globally.<br />
Freight moved on two of Panalpina’s major trade lanes,<br />
the far east westbound and transpacific eastbound routes –<br />
jointly comprising around one quarter (Air) and one third<br />
(Ocean) of the Group’s volumes – developed under-proportionately<br />
in <strong>2011</strong> in comparison with cargo moved on other<br />
trade lanes due to relatively lackluster imports into Europe<br />
and North America. In Japan, the world’s fourth largest<br />
economy, the devastating earthquake and tsunami in March<br />
led to a major disruption of economic activity for several<br />
weeks, although, fortunately, with no major adverse consequences<br />
for either Panalpina employees or for the Group’s<br />
business.<br />
Panalpina <strong>Annual</strong> <strong>Report</strong> <strong>2011</strong><br />
At the same time, above-average growth was recorded for<br />
trade lanes connecting some of the largest emerging<br />
markets, such as China, India and Brazil – markets in which<br />
Panalpina continued to invest and further expanded its<br />
presence during the year under review. As such, in <strong>2011</strong>,<br />
three new offices were opened in India (Ahmedabad,<br />
Jaipur and Ludhiana). In China, Panalpina complemented<br />
its increasing footprint in the central part of the country<br />
through the opening of an office in Chongqing at the beginning<br />
of the year, adding to the two branches in Wuhan<br />
and Chengdu, bringing the total number of offices in the<br />
Greater China region to 20. In addition, Panalpina also<br />
opened a logistics center in Tianjin, which marked an important<br />
milestone in the Group’s forward strategy to extend<br />
its Value-Added Logistics Services capabilities.<br />
Strengthening of the corporate platform<br />
Throughout the year, notwithstanding an increasingly<br />
cloudy economic environment, Panalpina kept its focus on<br />
further strengthening its corporate platform and setting the<br />
ground for leveraging future growth. During the first half<br />
of the year, the Group also reviewed, clarified and refined<br />
its strategy for the years to come and, in this context, in<br />
June, the Group announced a mid-term target of raising the<br />
EBITDA-to-gross profit conversion ratio to 20 % by 2014.<br />
Panalpina’s ambition is to offer comprehensive end-to-end<br />
supply chain solutions to its customers, with the core<br />
service offering in Air and Ocean Freight complemented<br />
by Supply Chain Services and Value-Added Logistics<br />
Services.
Executive Board (clockwise): Monika Ribar (President and CEO), Marco Gadola (Chief Financial Officer),<br />
Karl Weyeneth (Chief Operating Officer), Christoph Hess (Chief Legal Officer and Corporate Secretary) and<br />
Alastair Robertson (Chief Human Resources Officer)<br />
<strong>Report</strong> of the Executive Board<br />
Panalpina <strong>Annual</strong> <strong>Report</strong> <strong>2011</strong><br />
7
8<br />
<strong>Report</strong> of the Executive Board<br />
On a product level, all three product divisions (Air Freight,<br />
Ocean Freight, Logistics) were strengthened by a number<br />
of key divisional management hires during the reporting<br />
year. Moreover, Panalpina also continued its strict focus on<br />
restoring unit profitability, particularly gross profit per ton<br />
of air freight, which rose 9 % year-on-year (+ 21 % in local<br />
currencies). As a consequence, a number of larger, yet unprofitable<br />
customer contracts were not renewed, leading<br />
to an adverse effect on the Group’s transported air freight<br />
volumes, because, in a declining market, the volumes<br />
represented by these contracts could not be immediately<br />
replaced with new business. In terms of product innovation,<br />
Panalpina signed a new ACMI (aircraft, crew, maintenance<br />
and insurance) contract for two Boeing 747-8Fs with<br />
one of its long-term business partners. The aircraft will enter<br />
service in the first half of 2012 and operate in Panalpina’s<br />
unique own-controlled air freight network, replacing two<br />
Boeing 747-400Fs. Compared to the 747-400F, the industry’s<br />
newest freighter has 16 % additional cargo volume,<br />
but is expected to have the lowest carbon dioxide emissions<br />
in its class. With the new aircraft, Panalpina is optimally set<br />
up to meet industry specific requirements and the increasing<br />
demand for large-freighter capacity, especially in the<br />
Healthcare, Hi-tech, Automotive and Oil and Gas verticals.<br />
In Ocean Freight, in line with the corporate strategy to<br />
aggressively expand its Less than Container Load (LCL)<br />
business and to focus on emerging markets, Panalpina<br />
launched more than 50 new LCL point-to-point services<br />
in <strong>2011</strong>. Most of the new regular services run out of Asia<br />
and meet increased customer demand for reliable LCL<br />
solutions on the Intra Asia and Asia-Europe trades.<br />
In the third product division, Logistics, the Group extended<br />
its product line with a range of new services which all support<br />
the strategic focus of offering value-added services to<br />
customers. In addition to launching regional centers of<br />
expertise on three continents, Panalpina also opened several<br />
new logistics centers, including a facility in Huntsville<br />
(USA). The 3,700 square-meter Huntsville Logistics Center<br />
is situated in close proximity to the Panalpina Huntsville<br />
hub and provides complete kitting and parts assembly as<br />
well as temperature-controlled storage areas.<br />
Out of its nine existing industry verticals where Panalpina<br />
has a dedicated setup in place to effectively serve its customers<br />
with industry-specific solutions, four focus industry<br />
verticals were defined, which are particularly well aligned<br />
with the product strategies: Consumer and Retail, Healthcare,<br />
Hi-tech, and Oil and Gas. In terms of gross profit<br />
growth, the largest advances during the reporting year<br />
came from Automotive, Healthcare, Hi-tech, Telecom and<br />
Panalpina <strong>Annual</strong> <strong>Report</strong> <strong>2011</strong><br />
Fashion. In Oil and Gas, the signing of a strategic services<br />
master agreement with one of the world’s largest oil and<br />
gas companies marked a major milestone in the execution<br />
of the Group’s growth strategy. The scope of the multi-year<br />
agreement comprises transportation services for air, ocean,<br />
road and rail, industrial projects, freight management and<br />
other logistics services connected with the exploration and<br />
production of oil and gas.<br />
While Panalpina aims for predominantly organic growth, it<br />
also looks selectively into acquisition opportunities to support<br />
and accelerate the execution of the corporate strategy.<br />
One company which the Group identified as an optimal<br />
strategic fit and acquired in <strong>2011</strong> is Grieg Logistics, a leading<br />
logistics provider to the Norwegian oil and gas industry<br />
with approximately 100 staff and an annual turnover of<br />
roughly NOK 400 million (CHF 67 million). Through this acquisition,<br />
Panalpina added seven new locations in Norway<br />
and thus significantly expanded its presence in the country.<br />
Through the set of initiatives embarked on during the year,<br />
complemented by a new volume record in Ocean Freight,<br />
Panalpina achieved a solid organic (ie, expressed in local<br />
currencies) gross profit growth of 12 % and thus managed<br />
to further solidify its position within the industry. Furthermore,<br />
through effective cost management, profitability was<br />
significantly increased and profit margins further expanded<br />
in <strong>2011</strong>.<br />
Outlook<br />
The economic situation in many of the developed nations –<br />
a majority of which are struggling with critical levels of debt<br />
and continuously high levels of unemployment – is set to<br />
remain challenging in the years ahead, while the stability of<br />
the financial sector yet needs to be restored. On the other<br />
hand, growth prospects for many of the emerging economies<br />
remain promising. Regardless of the short-term economic<br />
environment and in line with its sustainable, profitable<br />
growth strategy, Panalpina remains committed to further<br />
improving productivity while continuing to invest selectively<br />
and specifically in Marketing and Sales, IT and Value-Added<br />
Logistics Services competence and maintaining a strong<br />
focus on cost control – all with the aim of delivering reliable<br />
solutions to our customers and ensuring above-market<br />
growth. To facilitate implementation of the corporate strategy,<br />
to drive growth and increase profitability, the Panalpina<br />
Group will put in place (effective July 1, 2012) three regional<br />
CEOs (with respective respon sibility for Asia Pacific, Europe<br />
and Middle East, and the Americas), each supported by a<br />
small team of dedicated regional resources. With this lean<br />
regional setup, the decision-making power will shift from
Panalpina’s headquarters closer to where decisions are<br />
made by its customer base, facilitating exploitation of<br />
regional and local growth opportunities in the various markets<br />
where Panalpina operates.<br />
Overall, Group management expects world trade and<br />
global outsourcing to expand further in the years to come,<br />
albeit with a bias towards the emerging economies –<br />
particularly in Asia, Latin America and Africa, which will<br />
continue to gain in relative importance. With its global and<br />
asset-light network, coupled with the ability to react swiftly<br />
and offer its customers first-class, tailor-made, end-toend<br />
supply chain solutions, Panalpina is well prepared to<br />
take advantage of the growth opportunities ahead and<br />
to further enlarge its footprint in the global logistics market.<br />
Net forwarding revenue (NFR)<br />
With the Swiss franc as its reporting currency, Panalpina’s<br />
financial results in <strong>2011</strong> were massively distorted by the<br />
strength of the Swiss franc versus all foreign currencies<br />
relevant to the Company. On average, the euro and the<br />
US dollar lost approximately 11 % and 15 %, respectively, in<br />
value against the Swiss franc during the reporting year.<br />
Net forwarding revenue amounted to CHF 6,500 million,<br />
a reduction of 9 % compared to the CHF 7,164 million the<br />
year before, yet in local currencies, NFR advanced 2 %<br />
versus the prior year. This slight increase can be attributed<br />
to a variety of factors, including a balanced volume effect<br />
(more shipments handled in Ocean Freight and Logistics,<br />
fewer shipments handled in Air Freight) as well as factors<br />
over which Panalpina has limited influence, such as a significant<br />
increase in oil prices, resulting in higher fuel surcharges,<br />
which were counterbalanced by sharply lower average<br />
freight rates prevailing in the market caused by significant<br />
overcapacities.<br />
At regional level, net forwarding revenue declined in all<br />
four reporting regions due to a variety of factors. In Europe,<br />
Middle East, Africa and CIS (EMEA), NFR decreased 13 %<br />
to CHF 3,171 million. This region recorded a material adverse<br />
translation impact from the weak euro, and was also<br />
affected by the import weakness of many European economies<br />
and falling freight rates. EMEA remains Panalpina’s<br />
largest region in revenue terms, contributing to almost half<br />
of the Group’s turnover.<br />
In North America, NFR fell by 10 % to CHF 1,270 million, a<br />
large part of which can be attributed to the depreciating<br />
<strong>Report</strong> of the Executive Board<br />
US dollar. Moreover, persistently low consumer confidence<br />
resulted in lower import volumes.<br />
Compared to 2010, Panalpina’s NFR in <strong>2011</strong> in Central and<br />
South America declined 1 % to CHF 834 million. The Group<br />
recorded strong double-digit volume growth in this region<br />
on the import side, while the currency translation effect<br />
and falling freight rates both acted as a drag on turnover.<br />
The Asia Pacific region saw a decline in NFR of 4 % to<br />
CHF 1,225 million. Also here, the translation of locally generated<br />
turnover into Swiss francs along with severely<br />
depressed freight rates, particularly on the Asia-Europe<br />
route, overshadowed double-digit volume growth rates on<br />
lanes such as Asia to Latin America and Intra Asia.<br />
In <strong>2011</strong>, the Panalpina Group generated 49 % of its net forwarding<br />
revenue in Europe, Middle East, Africa and CIS,<br />
19 % each in North America and Asia Pacific and 13 % in<br />
Central and South America.<br />
Net forwarding revenue per region<br />
<strong>2011</strong> 2010<br />
in million CHF<br />
4,000<br />
3,000<br />
2,000<br />
1,000<br />
3,171<br />
3,640<br />
0<br />
Europe, Middle East,<br />
Africa and CIS<br />
1,270<br />
1,409<br />
North<br />
America<br />
834<br />
845<br />
Central and<br />
South America<br />
Net forwarding revenue per region (<strong>2011</strong>)<br />
Europe, Middle East, Africa and CIS<br />
North America<br />
Central and South America<br />
19%<br />
13%<br />
49%<br />
Asia Pacific 19%<br />
1,225<br />
1,270<br />
Asia Pacific<br />
On a divisional level, the oversupply of carrier capacity,<br />
which was prevalent for a large part of the year, led to<br />
a substantial drop of carrier freight rates, which – together<br />
with the strength of the Swiss franc – adversely impacted<br />
the Group’s NFR in Air Freight and Ocean Freight, due to<br />
the pass-through character of freight rates for an asset-light<br />
service provider like Panalpina. These impacts were only<br />
partially mitigated by increasing oil prices, which in <strong>2011</strong> on<br />
average rose more than 40 % above 2010 levels, resulting<br />
Panalpina <strong>Annual</strong> <strong>Report</strong> <strong>2011</strong><br />
9
10<br />
<strong>Report</strong> of the Executive Board<br />
in distinctly higher fuel and bunker surcharges (essentially<br />
also items with a pass-through character) which the Group<br />
invoiced to its customers.<br />
Influenced by these developments and coupled with lower<br />
volumes, but improved pricing discipline per file handled,<br />
as described in the preceding paragraph, the Group’s NFR<br />
generated with Air Freight decreased by 6 % to CHF 3,281<br />
million. In the Ocean Freight division, NFR saw the biggest<br />
impact from falling freight rates and decreased by 17 % to<br />
CHF 2,313 million, despite an expansion of volumes. In the<br />
third product division, Logistics, NFR saw an increase of<br />
2 % to CHF 906 million, which was driven by an expansion<br />
of business activities particularly in distribution, valueadded<br />
logistics services as well as overland.<br />
In <strong>2011</strong>, the Panalpina Group generated 50 % of its net forwarding<br />
revenue with Air Freight, 36 % with Ocean Freight<br />
and 14 % with Logistics.<br />
Net forwarding revenue per product division<br />
<strong>2011</strong> 2010<br />
in million CHF<br />
4,000<br />
3,500<br />
3,000<br />
2,500<br />
2,000<br />
1,500<br />
1,000<br />
500<br />
0<br />
Air Freight<br />
Ocean Freight<br />
Logistics<br />
3,281<br />
3,503<br />
Air Freight Ocean Freight Logistics<br />
Net forwarding revenue per product division (<strong>2011</strong>)<br />
Panalpina <strong>Annual</strong> <strong>Report</strong> <strong>2011</strong><br />
2,313<br />
2,771<br />
36%<br />
14%<br />
906<br />
50%<br />
890<br />
Gross profit (GP)<br />
Gross profit, a better measure of actual sales performance<br />
than net forwarding revenue in the forwarding industry,<br />
remained essentially flat at CHF 1,477 million in <strong>2011</strong> (2010:<br />
CHF 1,480 million). Organically (ie, in local currencies),<br />
however, GP increased by 12 %.<br />
With respect to regional performance, Europe, Middle<br />
East, Africa and CIS is also the most important region for<br />
Panalpina in terms of gross profit generation, representing<br />
approximately half of the Group’s gross profit. In <strong>2011</strong>,<br />
gross profit generated in the region increased 6 % in local<br />
currencies, supported by higher freight volumes on all<br />
major export trade lanes. Translated into Swiss francs, GP<br />
in this region decreased by 4 % to CHF 731 million.<br />
In North America, gross profit translated into Swiss francs<br />
took a major hit due to the weak US dollar, but nevertheless<br />
grew by 2 % to CHF 271 million. In local currencies, gross<br />
profit even grew by 19 %, which is a reflection of new business<br />
generated in various industry verticals, higher volumes<br />
handled on transatlantic routes and strong growth in<br />
exports to Central and South America.<br />
Asia Pacific and Central and South America recorded<br />
similarly strong increases in GP, which management attributes<br />
to the relatively better economic development of<br />
these regions in <strong>2011</strong>, which manifested itself in strong<br />
intraregional and import-related trade flows in and between<br />
these parts of the world. In Asia Pacific, gross profit rose<br />
5 % (+ 18 % in local currencies) to a record CHF 313 million,<br />
making this region the Group’s second largest in terms of<br />
GP, while gross profit in Central and South America<br />
increased 4 % (+ 19 % in local currencies) to a total of CHF<br />
162 million.<br />
In <strong>2011</strong>, the Panalpina Group generated 50 % of its gross<br />
profit in Europe, Middle East, Africa and CIS, 21 % in Asia<br />
Pacific, 18 % in North America and 11 % in Central and<br />
South America.<br />
Gross profit per region<br />
<strong>2011</strong> 2010<br />
in million CHF<br />
800<br />
600<br />
400<br />
200<br />
731<br />
760<br />
0<br />
Europe, Middle East,<br />
Africa and CIS<br />
271<br />
266<br />
North<br />
America<br />
162<br />
156<br />
Central and<br />
South America<br />
313<br />
298<br />
Asia Pacific
Gross profit per region (<strong>2011</strong>)<br />
Europe, Middle East, Africa and CIS<br />
North America<br />
Central and South America<br />
Asia Pacific<br />
18%<br />
11%<br />
50%<br />
21%<br />
In Air Freight, a number of larger, yet unprofitable, customer<br />
contracts were not renewed due to the Group’s focus on<br />
restoring unit profitability. This led to an adverse effect on<br />
the Group’s transported volumes, which declined by 5 %<br />
compared to the year before. In addition to an improved<br />
pricing discipline, the Air Freight division also benefited for<br />
the first time from a centrally managed volume tender initiative,<br />
which led to a reduction in the cost of goods sold.<br />
These efforts combined led to an increase of 9 % (+ 21 %<br />
in local currencies) in gross profit per ton of Air Freight,<br />
which more than compensated for the declining volumes.<br />
As a result, the Group’s gross profit realized through Air<br />
Freight forwarding services increased by 3 % in <strong>2011</strong><br />
(+ 15 % in local currencies), reaching CHF 688 million versus<br />
CHF 667 million the year before.<br />
In the Ocean Freight division, GP saw a slight contraction<br />
of 3 % to CHF 439 million, but posted growth of 9 % in local<br />
currencies. Panalpina’s volume growth rate amounted to<br />
6 % and grew approximately in line with the market, with<br />
market share gains in the year’s second half as the strengthening<br />
of divisional structures started to unfold. Gross profit<br />
per 20-foot equivalent unit fell 8 % (+ 3 % in local currencies)<br />
compared to the prior year, because the low level of<br />
freight rates prevailing for most of the year and the highly<br />
competitive environment made it difficult to maintain the<br />
same mark-up to customers.<br />
Gross profit generated through the Logistics division contracted<br />
by 3 % to reach a total of CHF 350 million. In local<br />
currencies, this product division recorded a growth of 9 %,<br />
which was mainly driven by an expansion in the Group’s<br />
Distribution, Value-Added Logistics Services and Overland<br />
activities.<br />
In <strong>2011</strong>, the Panalpina Group generated 46 % of its gross<br />
profit with Air Freight, 30 % with Ocean Freight and 24 %<br />
with Logistics.<br />
Gross profit per product division<br />
<strong>2011</strong> 2010<br />
in million CHF<br />
700<br />
600<br />
500<br />
400<br />
300<br />
200<br />
100<br />
0<br />
Air Freight<br />
Ocean Freight<br />
Logistics<br />
688<br />
667<br />
439<br />
453<br />
<strong>Report</strong> of the Executive Board<br />
350<br />
360<br />
Air Freight Ocean Freight Logistics<br />
Gross profit per product division (<strong>2011</strong>)<br />
30%<br />
24%<br />
46%<br />
Earnings before interest, taxes,<br />
depreciation and amortization (EBITDA)<br />
Panalpina achieved an EBITDA of CHF 212 million in the<br />
reporting year (2010: CHF 62 million*), which was negatively<br />
impacted by CHF 27 million through currency translation.<br />
The EBITDA-to-gross profit margin in <strong>2011</strong> improved<br />
to 14.4 % (2010: 4.2 %*).<br />
The two main items included in operating expenses –<br />
personnel expenses and other operating expenses –<br />
developed as follows:<br />
<br />
(+ 12 % currency adjusted) at CHF 892 million in <strong>2011</strong><br />
(2010: CHF 891 million). Panalpina increased its headcount<br />
during the reporting period by 6 % to 15,700 full-time<br />
equivalents (FTEs). This number includes approximately<br />
100 FTEs which joined Panalpina from Grieg Logistics.<br />
<br />
of the Group’s total operating expenses, amounted to<br />
CHF 372 million in <strong>2011</strong> (2010: CHF 527 million*), equivalent<br />
to a decrease of 29 % (– 20 % currency adjusted).<br />
Panalpina <strong>Annual</strong> <strong>Report</strong> <strong>2011</strong><br />
11
12<br />
<strong>Report</strong> of the Executive Board<br />
Overall development<br />
EBITDA Operating expenses<br />
in million CHF<br />
<strong>2011</strong><br />
2010*<br />
212<br />
62<br />
Panalpina <strong>Annual</strong> <strong>Report</strong> <strong>2011</strong><br />
1,265<br />
1,418<br />
* Other operating expenses in 2010 included a charge of CHF 128 million which the<br />
Company recognized to cover all costs arising from the settlement of two legal<br />
claims in the United States and associated compliance consulting costs as well as<br />
from an internal reorganization project.<br />
Regional development<br />
Panalpina assesses segmental operating performance<br />
primarily from a geographical perspective, as the Group’s<br />
operations are predominantly managed by geography.<br />
A useful measure for assessing the operating performance<br />
by region is EBITDA. The segmental EBITDA provided in<br />
the financial accounts developed as follows in the reporting<br />
period:<br />
<br />
declined from CHF 78 million in 2010 to CHF 39 million<br />
in <strong>2011</strong>. The main reasons for the decrease are the depreciation<br />
of the euro versus the Swiss franc, a reconditioned<br />
compensation scheme introduced at the beginning of<br />
the reporting year (reflecting compensation on a door-todoor<br />
shipment between the exporting and importing<br />
station), along with a general slowdown of business in<br />
Europe and Africa.<br />
<br />
US dollar, this region recorded a substantial improvement<br />
in EBITDA, from a negative result of CHF 17 million<br />
in 2010 to a gain of CHF 8 million in <strong>2011</strong>, helped by the<br />
elimination of certain unprofitable contracts as well as<br />
the acquisition of new businesses with a variety of customers<br />
across different sectors, including oil and gas.<br />
Moreover, this region was also positively impacted by the<br />
above mentioned compensation scheme.<br />
<br />
decreased from CHF 19 million in 2010 to CHF 17 million<br />
in <strong>2011</strong>. While the operating result also suffered from an<br />
adverse currency translation effect, this region made various<br />
investments in logistics facilities during the reporting<br />
period in order to appropriately position the Company to<br />
take advantage of future business opportunities.<br />
<br />
CHF 92 million in 2010 to CHF 88 million in <strong>2011</strong>, which<br />
was mainly related to an adverse currency translation<br />
effect as well as the already mentioned compensation<br />
scheme.<br />
<br />
to CHF 60 million in <strong>2011</strong>. The improvement was supported<br />
by higher royalties from Group companies and an<br />
adjusted renumeration model of centralized functions.<br />
EBITDA per region<br />
<strong>2011</strong> 2010*<br />
in million CHF<br />
100<br />
80<br />
60<br />
40<br />
20<br />
0<br />
–20<br />
39<br />
78<br />
Europe,<br />
Middle East,<br />
Africa and CIS<br />
8<br />
–17<br />
North<br />
America<br />
*Figures adjusted by non-recurring charges as already mentioned.<br />
Balance sheet<br />
Current assets<br />
17<br />
19<br />
Central<br />
and South<br />
America<br />
88<br />
92<br />
60<br />
18<br />
Asia Pacific Corporate<br />
Panalpina’s cash and cash equivalents amounted to<br />
CHF 573 million on December 31, <strong>2011</strong> and thus<br />
increased by CHF 45 million from the year before, which<br />
can be mainly attributed to the substantial amount of<br />
free cash flow generated during the reporting period.<br />
Trade receivables and unbilled forwarding services<br />
increased by CHF 29 million, from CHF 1,033 million at<br />
the end of 2010 (equivalent to 52 % of total assets) to<br />
CHF 1,062 million at the end of <strong>2011</strong> (equivalent to 50 %<br />
of total assets). The increase in trade receivables was<br />
more than compensated by an increase in trade payables.<br />
In total, the net working capital intensity (defined as net<br />
working capital as a percentage of gross forwarding revenue)<br />
at the end of <strong>2011</strong> was at a record low level of 1.1 %.
Non-current assets<br />
Panalpina’s non-current assets increased from<br />
CHF 303 million on December 31, 2010 to CHF 390 million<br />
on December 31, <strong>2011</strong>. The increase is primarily a result<br />
of an increase in intangibles due to the acquisition of<br />
Grieg Logistics, a Norway-based logistics company that<br />
Panalpina acquired effective April 1, <strong>2011</strong>, as well as<br />
various investments in money market instruments classi-<br />
fied as financial assets.<br />
Total assets<br />
Cash and cash equivalents<br />
Trade receivables and unbilled forwarding services<br />
in million CHF<br />
<strong>2011</strong><br />
2010<br />
Other current assets<br />
Non-current assets<br />
573 1,062 110 390 2,135<br />
529 1,033 124 303<br />
Trade payables and accrued cost of services<br />
1,989<br />
Panalpina’s trade payables and accrued cost of services,<br />
which jointly comprised 63 % of total liabilities on December<br />
31, <strong>2011</strong>, increased to CHF 773 million, compared to<br />
CHF 696 million on December 31, 2010. This favorable<br />
development is primarily attributable to a further improved<br />
payment discipline and renegotiation of payment terms<br />
with various vendors.<br />
Borrowings (short-/long-term)<br />
Total borrowings were further reduced from CHF 10 million<br />
at year-end 2010 to CHF 7 million at year-end <strong>2011</strong>.<br />
Other liabilities<br />
Panalpina’s other liabilities declined from CHF 471 million<br />
at year-end 2010 to CHF 440 million at year-end <strong>2011</strong>.<br />
The key reason for this decline is a decrease of provisions<br />
due to the payment of fines in connection with the settlement<br />
of the two legal claims in the United States.<br />
Total equity<br />
The increase in shareholders’ equity is almost entirely<br />
attributable to the change in reserves which – as a result<br />
of the significant improvement of the net result for the<br />
reporting year – rose from CHF 950 million on December<br />
31, 2010, to CHF 1,053 million on December 31, <strong>2011</strong>.<br />
Total equity increased by CHF 103 million during the<br />
<strong>Report</strong> of the Executive Board<br />
reporting period, from CHF 812 million on December 31,<br />
2010, to CHF 915 million on December 31, <strong>2011</strong>.<br />
Total liability and equity<br />
Trade payables and accrued cost of services<br />
Short- and long-term borrowings<br />
in million CHF<br />
<strong>2011</strong><br />
2010<br />
Cash flow<br />
7<br />
773<br />
696<br />
10<br />
440<br />
471<br />
Net cash from operating activities<br />
Other liabilities<br />
Equity<br />
915 2,135<br />
812 1,989<br />
Panalpina’s net cash from operating activities in the reporting<br />
period amounted to CHF 193 million, CHF 156 million<br />
above the prior year’s figure (2010: CHF 37 million). Major<br />
contributors to the positive development were the substantial<br />
expansion of net profit for the period and the simultaneous<br />
decrease of the net working capital. In addition, net<br />
cash from operating activities includes an outflow of<br />
approximately CHF 30 million during the reporting year due<br />
to the payment of fines to US authorities for which provisions<br />
were taken in the prior year and which the Group is<br />
paying in several installments over a period of three years<br />
(in 2010, corresponding outflows amounted to CHF 27 million).<br />
The remaining payable amount totalling CHF 33 million<br />
will be paid in two equal installments, which are due in<br />
2012 and 2013.<br />
Cash flow from investing activities<br />
Expenditures on property, plant and equipment (mainly<br />
IT equipment) increased slightly during the reporting year<br />
to CHF 31 million (2010: CHF 28 million). Net investments<br />
into acquired subsidiaries increased from CHF 2 million in<br />
2010 to CHF 60 million in <strong>2011</strong>, mainly as a result of the<br />
purchase of Grieg Logistics. Moreover, the Group invested,<br />
compared to 2010, an additional CHF 51 million of its cash<br />
holdings in money market instruments with a maturity of<br />
more than three months. Overall, the net cash outflow from<br />
investing activities rose substantially from CHF 31 million<br />
in 2010 to CHF 152 million in <strong>2011</strong>.<br />
Capital expenditures in <strong>2011</strong> amounted to 0.8 % of net forwarding<br />
revenue (2010: 0.6 %). The slight increase over<br />
the prior year was mainly related to higher investments into<br />
software.<br />
Panalpina <strong>Annual</strong> <strong>Report</strong> <strong>2011</strong><br />
13
14<br />
<strong>Report</strong> of the Executive Board<br />
Free cash flow<br />
The free cash flow, calculated as net cash from operating<br />
activities minus net cash flow from investing activities,<br />
increased from CHF 6 million in 2010, to CHF 42 million in<br />
<strong>2011</strong>. Adjusted for the above-mentioned increase of investments<br />
in acquired companies and money market instruments,<br />
free cash flow even increased to CHF 153 million in<br />
<strong>2011</strong> (2010: CHF 12 million).<br />
Cash flow development<br />
Free cash flow Net cash generated<br />
from operating activities<br />
in million CHF<br />
<strong>2011</strong><br />
6<br />
2010<br />
37<br />
42<br />
Cash flow from financing activities<br />
The net cash used in financing activities decreased by<br />
CHF 4 million in <strong>2011</strong> compared to the year before. A large<br />
portion of this improvement came from lower investments<br />
for the (Management Incentive Plan-related) purchase<br />
of treasury shares due to a lower average share price.<br />
Net cash<br />
in million CHF Dec 31<br />
<strong>2011</strong><br />
Panalpina <strong>Annual</strong> <strong>Report</strong> <strong>2011</strong><br />
Dec 31<br />
2010<br />
193<br />
%<br />
change<br />
Cash and cash equivalents 573.6 528.9 8<br />
Other current financial assets 20.0 6.1 228<br />
Short-term debt – 7.3 – 9.3 – 22<br />
Long-term debt – 0.2 – 0.4 – 50<br />
Net cash 586.1 525.3 12<br />
Net cash increased by CHF 61 million during the year<br />
under review to CHF 586 million on December 31, <strong>2011</strong>.<br />
Employees<br />
full-time equivalents (FTEs)<br />
as at December 31<br />
Region <strong>2011</strong> 2010<br />
%<br />
change<br />
Europe, Middle East, Africa<br />
and CIS 6,746 6,485 4<br />
North America 2,418 2,423 0<br />
Central and South America 2,474 2,294 8<br />
Asia Pacific 3,601 3,259 10<br />
Corporate 461 415 11<br />
Total 15,700 14,876 6<br />
In <strong>2011</strong>, Panalpina continued to selectively invest and<br />
increased the number of FTEs by 6 %, from 14,876 on<br />
December 31, 2010, to 15,700 on December 31, <strong>2011</strong>.<br />
An increase took place in various reporting regions in<br />
order to accommodate the volume growth in Ocean<br />
Freight and Logistics and to complement organizational<br />
structure.
Group Management Structure<br />
As at December 31, <strong>2011</strong><br />
Chief Operating Officer<br />
Karl Weyeneth<br />
Air Freight<br />
Ocean Freight<br />
Logistics<br />
Marketing and Sales<br />
Business Processes and Quality<br />
Corporate Audit Board of Directors<br />
Compensation and<br />
Chairman<br />
Rudolf W. Hug<br />
Nomination Committee<br />
Vice Chairman<br />
Beat Walti<br />
Audit Committee<br />
Corporate and Regional<br />
Development, Agent Relations<br />
Chief Financial Officer<br />
Marco Gadola<br />
Corporate Accounting<br />
Corporate Taxes<br />
Corporate Controlling<br />
Investor Relations<br />
Indirect Purchasing<br />
Strategic Finance and Projects<br />
Group Treasury<br />
Corporate Information Technology<br />
Lars Förberg, Chris E. Muntwyler,<br />
Roger Schmid, Hans-Peter Strodel,<br />
Knud Elmholdt Stubkjær<br />
Chief Executive Officer<br />
Monika Ribar<br />
Areas<br />
Panprojects<br />
Chief Human Resources Officer<br />
Alastair Robertson<br />
HR Processes and Projects<br />
International Compensation and<br />
Benefits<br />
HR Operations<br />
Capability Development and<br />
PanAcademy<br />
Legal and Compliance<br />
Committee<br />
Corporate Communications<br />
Corporate Compliance<br />
www.panalpina.com / organization<br />
<strong>Report</strong> of the Executive Board<br />
Chief Legal Officer /<br />
Corporate Secretary<br />
Christoph Hess<br />
Corporate Legal Services<br />
Corporate Insurance Management<br />
Panalpina <strong>Annual</strong> <strong>Report</strong> <strong>2011</strong><br />
15
16<br />
<strong>Report</strong> of the Executive Board<br />
<strong>Report</strong>ing Regions<br />
Promising achievements in each of the four regions<br />
Europe, Middle East,<br />
Africa and CIS<br />
Key data<br />
Areas: 11<br />
BeNe, Central Europe, Eastern Europe, France, Iberia,<br />
Northern Europe, Northwest Europe, Southwest Europe,<br />
Sub-Saharan, Black and Caspian Sea, Arabian Belt<br />
Net forwarding revenue: CHF 3,171 million<br />
Employees in full-time equivalents: 6,746<br />
Market conditions<br />
A clear deterioration occurred in this heterogeneous<br />
economy. A decline in cargo to move has led to a highly<br />
competitive environment. Customers tried to obtain<br />
financing from forwarders. The Arabian Spring and the<br />
high oil price hurt Middle East market conditions.<br />
Highlights<br />
Central Europe strengthened its partnerships and<br />
gained new logistics businesses of customers in the<br />
Hi-tech and Fashion verticals.<br />
Panalpina was awarded with more overland transports<br />
in Continental Europe.<br />
Norway-based Grieg Logistics was acquired and<br />
successfully integrated.<br />
In booming Turkey, two offices (Ankara/Bursa) and<br />
a new warehouse in Istanbul opened.<br />
A new standalone logistics facility was launched in<br />
Didcot, Southeast England.<br />
The first Panalpina Saudi Arabia office opened in<br />
Dammam.<br />
Dubai’s role as a distribution hub for Africa grew.<br />
An office in Murmansk was opened and a state-ofthe-art<br />
warehouse began operations in Moscow. The<br />
area became a front runner in e-customs clearance.<br />
Panalpina expanded to East Africa and pursued<br />
opportunities in the mining industry along the West<br />
African coast.<br />
Panalpina <strong>Annual</strong> <strong>Report</strong> <strong>2011</strong><br />
Asia Pacific<br />
Key data<br />
Areas: 5<br />
India, East Asia, Southeast Asia, Greater China, Oceania<br />
Net forwarding revenue: CHF 1,225 million<br />
Employees in full-time equivalents: 3,601<br />
Market conditions<br />
Asia Pacific faced stagnating EU and US demand<br />
but remains a growth market. The airline industry<br />
experienced turbulence, with soft demand and capacity<br />
oversupply. Ocean freight rates were deteriorating to<br />
unsustainable levels for the carriers. Very competitive<br />
market conditions are forcing continued cost reductions.<br />
Highlights<br />
The new Intra Asia trucking service began operations,<br />
connecting China with Vietnam, Laos, Thailand,<br />
Malaysia and Singapore.<br />
Rail-air transport from Urumqi to Europe and sea-air<br />
moves via Los Angeles to Brazil were relaunched.<br />
New business units were launched in Suzhou,<br />
Wuhan and Chongqing, China. Two regional distribution<br />
centers opened, one in Tianjin and another<br />
in Shanghai. 5,000 square meters of warehouse<br />
capacity came into service in Singapore.<br />
Three consol services from Shanghai, Ningbo and<br />
Hong Kong to the Jebel Ali hub serving the Middle<br />
East region kicked off.<br />
Expansion continued in India as three offices opened<br />
and the local sales organization was strengthened.<br />
Long-time partner Apollo was integrated in Perth,<br />
Australia.<br />
A stringent subcontractor management concept,<br />
designed to maintain overall margins in all trades and<br />
products, was implemented.
<strong>Report</strong> of the Executive Board<br />
North America Central and South America<br />
Key data<br />
Areas: 2<br />
Canada, USA<br />
Net forwarding revenue: CHF 1,270 million<br />
Employees in full-time equivalents: 2,418<br />
Market conditions<br />
The growth of US economy slowed down considerably.<br />
High unemployment and sluggish housing markets<br />
remained the principal concerns. US companies focused<br />
more and more on growth in emerging markets. Canada<br />
as an import market felt a slowdown in volumes.<br />
Highlights<br />
Both Areas began a major realignment and upgrading<br />
of their key organizational structures.<br />
The Canada division, dedicated to the needs of the<br />
helicopter industry, continued to grow.<br />
New, direct Less than Container Load (LCL) services<br />
from major ports in China to Montreal augmented the<br />
existing services to Vancouver and Toronto.<br />
Two new business units opened: Malta (New York)<br />
and Indianapolis (Indiana).<br />
The Healthcare vertical of Panalpina in the US flourished.<br />
Additional significant investments in cold-chain<br />
capabilities have been made.<br />
In the US, Panalpina was able to strengthen major<br />
accounts in all vertical markets.<br />
The Huntsville Logistics Center enlarged its offering of<br />
end-to-end solutions and value-added services along<br />
with Panalpina’s own-controlled network.<br />
Two new Panalpina-controlled flights between Hong<br />
Kong and Huntsville have been filled continuously.<br />
Key data<br />
Areas: 3<br />
Andina, Mercosur, Middle America<br />
Net forwarding revenue: CHF 834 million<br />
Employees in full-time equivalents: 2,474<br />
Market conditions<br />
Consistent economic growth has greatly enlarged a<br />
middle class hungry for durable goods and consumer<br />
products. In Brazil, future international events such as<br />
the 2016 Olympic Games and the FIFA World Cup in 2014<br />
require greater logistics capabilities and infra structure<br />
investments. In Middle America, rising insecurity due to<br />
drug-related crime affected foreign investments.<br />
Highlights<br />
All areas strengthened customer relationships and<br />
gained new businesses. For example: A Brazilian<br />
blue chip company contracted Panalpina to distribute<br />
its products throughout Latin America and France.<br />
Panalpina became Mercosur’s number one LCL<br />
provider and the leading exporter of containerized<br />
sugar.<br />
Mercosur Area was leading in telecom distribution.<br />
Warehousing activities increased as Panalpina<br />
added space in Mexico City and a newly finished<br />
20,000 square meter depot in Panama, where a<br />
12,000 square meter warehousing and distribution<br />
business in the Hi-tech vertical covering end-to-end<br />
supply chain needs was launched.<br />
New logistics operations opened in Peru and<br />
Colombia.<br />
The warehouse in Santiago, Chile, reached profitability<br />
and a new multi-customer warehouse in<br />
Cajamar, Brazil, opened.<br />
Panalpina <strong>Annual</strong> <strong>Report</strong> <strong>2011</strong><br />
17
18<br />
<strong>Report</strong> of the Executive Board<br />
Product Divisions<br />
Panalpina expands its product range in all divisions<br />
Air Freight Ocean Freight<br />
Key figures<br />
848,000 tons of freight moved<br />
Generated 50 % of Panalpina’s net forwarding revenue<br />
Market conditions<br />
<strong>2011</strong> started out fairly strongly but dropped off in the<br />
second half of the year. The air freight market stayed<br />
very soft in most major trade lanes until year-end.<br />
Highlights<br />
Panalpina has become one of the world’s biggest<br />
Qualified Envirotainer Providers for active cooling<br />
solutions. In <strong>2011</strong> the Company offered a total of<br />
43 accredited locations in 27 countries.<br />
Air Freight improved successfully its profitability<br />
per cargo unit.<br />
Panalpina launched a second twice-weekly transpacific<br />
service between Hong Kong and Huntsville and<br />
between Huntsville and São Paulo (Viracopos).<br />
Air Freight implemented a new centralized global procurement<br />
process and system.<br />
The Cargo 2000 Certification and the Global Air<br />
Sourcing Initiative were successfully introduced to<br />
Panalpina’s global carriers. These credentials ensure<br />
efficient air cargo transport.<br />
Panalpina signed contracts for the upgrade of two<br />
B747-8F aircraft, the latest environmentally friendly<br />
freighter technology from Boeing. Operated with Atlas<br />
Air, they will replace the two existing B747-400F by<br />
2012.<br />
Outlook<br />
The soft market conditions will persist into 2012, though<br />
with an expectation for growth in the second half.<br />
Panalpina’s Air Freight business will focus on growth in<br />
the five strategic trade lanes (Asia–Europe, Asia–North<br />
America, Asia–Latin America, Asia–Middle East and<br />
Intra Asia).<br />
Panalpina <strong>Annual</strong> <strong>Report</strong> <strong>2011</strong><br />
Key figures<br />
1,310,000 TEUs transported<br />
Generated 36 % of Panalpina’s net forwarding revenue<br />
Market conditions<br />
The business faced substantial overcapacity in major<br />
east-west trade lines. Ocean freight rates deteriorated<br />
to unsustainable levels, resulting in massive losses<br />
for carriers, very much like in the 2009 shipping season.<br />
Highlights<br />
Panalpina increased its worldwide footprint, recorded<br />
volume growth and therefore gained market share.<br />
In fact, <strong>2011</strong> marked the highest volumes ever in<br />
Panalpina’s Ocean Freight.<br />
Ocean Freight further focused on its profitability per<br />
cargo unit.<br />
Panalpina’s Ocean Freight business aligned its global<br />
strategies and established a strong focus on trade<br />
lane growth, niche verticals, and managed solutions.<br />
Integrated systems, processes and data quality are<br />
an essential part of the growth strategy.<br />
Panalpina adjusted its global Less than Container<br />
Load (LCL) hub setup and launched in excess of<br />
50 new LCL services. Operated by the in-house carrier<br />
Pantainer Express Line, they support customer<br />
needs for simplicity and global reach through a single<br />
integrated LCL network. The new services reduce<br />
transit times and CO2 emissions.<br />
Outlook<br />
Overcapacity on the main east-west routes is expected<br />
to decrease in 2012 while rates will increase. Panalpina<br />
Ocean Freight will concentrate on five stra tegic trade<br />
lanes (Asia–Europe, Asia–North America, Asia–Latin<br />
America, Asia–Middle East and Intra Asia).
Logistics<br />
Key figures<br />
Generated 14 % of Panalpina’s net forwarding revenue<br />
Market conditions<br />
A large number of customers continued to outsource their<br />
logistics activities; market growth trends are continuing,<br />
but the competition in contract logistics remains strong.<br />
Highlights<br />
A global Logistics strategy focusing on value-added<br />
services for customers was developed and the<br />
product line extended with inbound to manufacturing,<br />
aftermarket spare parts and service logistics, technical<br />
distribution, and postponement services.<br />
Newly developed logistics tools allow optimization of<br />
warehousing by simulation, what-if modelling, and<br />
accurate activity-based cost calculation.<br />
Regional centers of expertise opened in Asia Pacific,<br />
Europe and the Americas along with strengthened<br />
services.<br />
Panalpina provided additional logistics space in<br />
Brazil, Canada, China, Colombia, France, Germany,<br />
Japan, Korea, Luxembourg, Mexico, Panama, Peru,<br />
Russia, Singapore, Sweden, Turkey, the United<br />
Kingdom, and the USA.<br />
With its European road project, Logistics launched<br />
a new procurement process and a standardized<br />
IT platform, leading to higher utilization factors.<br />
Outlook<br />
Panalpina expects this market to grow. Logistics further<br />
emphasizes continuous improvements to existing<br />
operations while maintaining the development of strategic<br />
geographies, industry verticals, and corresponding<br />
service offerings.<br />
<strong>Report</strong> of the Executive Board<br />
Panalpina <strong>Annual</strong> <strong>Report</strong> <strong>2011</strong><br />
19
20<br />
Panalpina <strong>Annual</strong> <strong>Report</strong> <strong>2011</strong>
Tim Bauer<br />
Lane Manager for Air Freight from Europe to<br />
the Americas and for own-controlled flight<br />
operations, has the capacity overview on all<br />
lanes out of Luxembourg<br />
Panalpina <strong>Annual</strong> <strong>Report</strong> <strong>2011</strong><br />
21
Panalpina <strong>Annual</strong> <strong>Report</strong> <strong>2011</strong>
Samia Guerroumi<br />
Procurement and Capacity Management<br />
Clerk for Air Freight from Europe to Central<br />
and South America<br />
Panalpina <strong>Annual</strong> <strong>Report</strong> <strong>2011</strong>
Panalpina <strong>Annual</strong> <strong>Report</strong> <strong>2011</strong>
Jasmine Medhora<br />
of Panalpina’s Pantainer Express Line<br />
based in Hamburg checks operational<br />
queries of Ocean Freight on correct<br />
procedures and guidelines<br />
Panalpina <strong>Annual</strong> <strong>Report</strong> <strong>2011</strong>
Panalpina <strong>Annual</strong> <strong>Report</strong> <strong>2011</strong>
Marco Parnitzke<br />
Booking Agent for Less than Container Load<br />
Ocean Freight from Hamburg to South America,<br />
handled 3175 shipments in <strong>2011</strong><br />
Panalpina <strong>Annual</strong> <strong>Report</strong> <strong>2011</strong>
Panalpina <strong>Annual</strong> <strong>Report</strong> <strong>2011</strong><br />
Andrea Ribaudo<br />
Logistic Platform Manager at Milan<br />
warehouse from where approximately<br />
15 million units have been shipped in <strong>2011</strong>
Panalpina <strong>Annual</strong> <strong>Report</strong> <strong>2011</strong>
30<br />
CEO Statement<br />
Profitability built on sustainable business model<br />
Despite the economic gloom and uncertainty, the Panalpina Group emerged from <strong>2011</strong><br />
with its market position strengthened. Our strategic orientation towards profitability,<br />
underpinned by our business model, has already proved its worth. But it is nonetheless<br />
set to encounter fresh challenges in the future.<br />
All aspects of Panalpina’s operations are guided by the<br />
principle of sustainable development. To progressively<br />
strengthen the welfare of our company, the environment<br />
and the population at large, equal weight is given to social,<br />
economic and ecological criteria in the evaluation of strategies,<br />
projects and innovations. Overall, this offers the<br />
best means for Panalpina to honor its obligations towards<br />
shareholders, employees, suppliers, customers and the<br />
general public.<br />
Panalpina <strong>Annual</strong> <strong>Report</strong> <strong>2011</strong><br />
Sound business operations<br />
The foundation for accepting broader responsibility is laid by<br />
entrepreneurial success. Solid business performance and<br />
the efficient deployment of corporate resources are crucial<br />
to unlocking creative freedoms and meeting the varying<br />
demands of the Company’s different stakeholders. In today’s<br />
global logistics and forwarding markets, simply delivering<br />
the right goods to the right place at the right time no longer<br />
suffices for long-term success.
Success factors as growth drivers<br />
<strong>2011</strong> saw Panalpina put in place a carefully crafted corporate<br />
strategy – initially for the period up to 2014 – which is<br />
built on the principles of performance, integrity and professionalism.<br />
While striving to continuously provide our customers<br />
with absolutely reliable logistics services that are<br />
tailored to their needs, our strategy targets sustainable and<br />
profitable growth. Our most crucial assets in the current<br />
business environment include our in-depth know-how in key<br />
industry verticals and the associated client focus, an<br />
extensive global network, a highly qualified and committed<br />
workforce, process-optimized information technology,<br />
outstanding compliance standards, and efficient and trans-<br />
parent procurement.<br />
Value-added services<br />
CEO Statement<br />
Panalpina is far more than a freight forwarding company.<br />
Our core air and ocean freight business is backed up<br />
by supply chain services and value-added logistics. The<br />
former includes, for instance, the optimization of supply<br />
chains and management of orders. The latter generally<br />
entails the acceptance of consignments for production or<br />
as part of postponement or customer service solutions.<br />
By expertly combining these services, we can offer our<br />
customers door-to-door products closely geared to their<br />
supply chains. Thanks to our world-spanning network<br />
embracing some 500 offices on six continents, these solutions<br />
can be implemented in all corners of the globe.<br />
Delivering end-to-end supply chain solutions: Panalpina’s business model with success factors<br />
Global Network<br />
Standard<br />
Warehousing<br />
Quality and Procurement<br />
Core Services<br />
Success Factors<br />
Employees<br />
Supply Chain Services<br />
Air and<br />
Ocean Freight<br />
Value-Added Logistics Services<br />
Information Technology<br />
Industry Verticals<br />
Overland<br />
Compliance and<br />
Corporate Culture<br />
Panalpina <strong>Annual</strong> <strong>Report</strong> <strong>2011</strong><br />
31
32<br />
CEO Statement<br />
We are planning a further expansion of our own logistical<br />
capacities in the years ahead. The focus here will be<br />
on value-added services rather than mere warehousing<br />
provision.<br />
Focus on specific sectors<br />
Crucial for the provision of tailored solutions for our customers’<br />
supply chains is an intimate knowledge of the<br />
forwarding sector’s key target industries. Panalpina has<br />
pooled this expertise in nine vertical centers of expertise<br />
known as “customer groups” or “industry verticals.” These<br />
are additionally supported by the Panprojects unit, which<br />
is charged with handling large industrial projects. Being<br />
conversant with the extremely diverse needs of customers<br />
in the different industrial sectors, the centers’ employees<br />
are able to deliver the appropriate solutions. While the automotive<br />
trade, for instance, gives high priority to just-in-time<br />
delivery directly to the production line, the pharmaceutical<br />
industry requires temperature-controlled door-to-door shipments<br />
in order to safeguard the quality of active ingredients.<br />
All industries in which Panalpina operates contribute to the<br />
Group’s sustainable growth. In our bid to achieve aboveaverage<br />
growth in our air freight, ocean freight and logistics<br />
business, we will concentrate in particular on the consumer<br />
and retail, healthcare, hi-tech, and oil and gas sectors over<br />
the next few years. By 2014, we are looking to earn a place<br />
among the top five in all the industries served by our centers<br />
of expertise.<br />
Own-controlled air freight network<br />
The Panalpina’s own-controlled air freight network, widely<br />
acknowledged in the market as a powerful unique selling<br />
point, will be a major asset for future growth. It creates a<br />
wealth of options for the Group to deliver customized solutions<br />
without any reliance on airline flight schedules. Our air<br />
freight network is due for a further upgrade in 2012 through<br />
replacement of the previously deployed cargo planes by<br />
two new Boeing 747-8F freighters. The new aircraft consume<br />
less fuel, are far quieter than their predecessors, and offer<br />
greater freight capacity. They are also equipped with wideranging<br />
facilities for the transportation of temperature-sensitive<br />
cargo.<br />
Maximum flexibility thanks to asset-light business model<br />
The two new aircraft epitomize two of Panalpina’s key corporate<br />
principles: its asset-light strategy and its PanGreen<br />
initiative. Asset-light means that the Group does not own<br />
vehicles and warehousing facilities itself, but purchases<br />
Panalpina <strong>Annual</strong> <strong>Report</strong> <strong>2011</strong><br />
capacity as needed from its suppliers. Accordingly, even<br />
the new planes will remain in the ownership of our longtime<br />
partner Atlas Air, while Panalpina concentrates on marketing<br />
and flight scheduling. This policy enables us to<br />
adapt more easily to fluctuations in demand than many of<br />
our competitors with their own vehicle fleets or warehouses.<br />
It also helps to minimize debt while boosting flexibility.<br />
Moreover, the asset-light approach is sustainable in<br />
that our procurement processes are highly transparent and<br />
help to cultivate trusting relationships with our suppliers.<br />
Ecological transport logistics<br />
The PanGreen program helps to sharpen both our own<br />
environmental profile and that of our customers and suppliers.<br />
The program makes it possible to obtain detailed<br />
information on the environmental impact of customers’ consignments<br />
as well as the options available for lower-carbon<br />
ocean shipments. In addition, as of mid-2012 the new aircraft<br />
will allow us to offer air shipments with a much smaller<br />
carbon footprint. The PanGreen program also benefits<br />
from our flexibility in that customers are able at all times to<br />
switch to a more ecological transport mode.<br />
Employee development as the path to excellence<br />
Our business is a people business. In other words, our<br />
service quality reflects the skills of our workforce. Hence<br />
the high priority which – in line with our corporate values –<br />
we attach to further training, talent management, and proactive<br />
succession planning. All forms of personnel development<br />
implemented by us worldwide are closely geared<br />
to promoting the organizational skills, individual competencies<br />
and commitment of our staff.<br />
Leverage through information technology<br />
To work efficiently and raise productivity, our highly qualified<br />
staff members rely on standardized processes and<br />
modern information technology. Greater speed, quality and<br />
transparency are required in the provision of data to both<br />
Panalpina and its customers. The immense importance<br />
attached to the continuous refinement of our IT platforms<br />
is reflected by the substantial annual investment in this<br />
field. One key IT project is the worldwide introduction of<br />
the SAP Transportation Management (SAP TM) system.<br />
This platform is currently being phased in, with completion<br />
scheduled for 2015.
Highest compliance standard<br />
Our corporate values, Code of Conduct and compliance<br />
processes govern all our actions. The principles behind<br />
Panalpina’s Code of Conduct are derived from the United<br />
Nations’ Universal Declaration of Human Rights and from<br />
internationally recognized environmental standards and<br />
labor laws. Our compliance processes are implemented<br />
company-wide, undergo continuous revision, and are<br />
deemed exemplary within our industry. As customers place<br />
increasing demands on the compliance procedures of<br />
their suppliers, Panalpina’s existing standards are steadily<br />
sharpening its competitive edge.<br />
External growth drivers<br />
The key drivers in our market include continuing globalization,<br />
the trend towards services outsourcing, the rising<br />
demand for value-added logistics services, and the ever<br />
greater market penetration of freight forwarders. In both air<br />
freight and ocean freight, routes between Asia and the<br />
Western World, between Asia and other emerging markets,<br />
and especially the intra-Asian lanes, are growing rapidly.<br />
Thanks to our business model, strategy and the commitment<br />
of our workforce, we are excellently equipped to<br />
achieve sustainable development in this environment – for<br />
the good of all our stakeholders.<br />
Monika Ribar<br />
Chief Executive Officer<br />
CEO Statement<br />
Panalpina <strong>Annual</strong> <strong>Report</strong> <strong>2011</strong><br />
33
34<br />
Success Factors<br />
Global Network<br />
Worldwide presence – local knowledge<br />
Across time zones and borders, Panalpina operates a world-spanning network<br />
embracing some 500 branches. With detailed knowledge of local markets<br />
and characteristics Panalpina’s professionals deliver every time comprehensive<br />
door-to-door solutions.<br />
North America<br />
Net forwarding revenue: CHF 1,270 million<br />
Employees in full-time equivalents: 2,418<br />
Panalpina <strong>Annual</strong> <strong>Report</strong> <strong>2011</strong><br />
Central and South America<br />
Net forwarding revenue: CHF 834 million<br />
Employees in full-time equivalents: 2,474
Europe, Middle East, Africa and CIS<br />
Net forwarding revenue: CHF 3,171 million<br />
Employees in full-time equivalents: 6,746<br />
As at December 31, <strong>2011</strong><br />
Asia Pacific<br />
Net forwarding revenue: CHF 1,225 million<br />
Employees in full-time equivalents: 3,601<br />
Panalpina branches in over 80 countries<br />
Partner companies in further 80 countries<br />
www.panalpina.com / addresses<br />
Success Factors<br />
Panalpina <strong>Annual</strong> <strong>Report</strong> <strong>2011</strong><br />
35
36<br />
Success Factors<br />
Industry Verticals<br />
Sharpening the focus on customer needs<br />
Panalpina concentrated on the special division Panprojects and nine core industry<br />
verticals in which it provides industry-leading expertise and tailor-made customer-<br />
specific solutions. In <strong>2011</strong> these ten centers of expertise further strengthened their<br />
know-how and gained new businesses.<br />
Healthcare<br />
The healthcare industry saw increasing demand for<br />
end-to-end supply chain solutions. In developed countries,<br />
there was continuing pressure on costs as well<br />
as on regulatory aspects and quality control. Not only<br />
did Panalpina become one of the world’s biggest Qualified<br />
Envirotainer Providers in <strong>2011</strong>, but it is now recognized<br />
as one of the leading companies in terms of endto-end<br />
cold chain solutions.<br />
Customer needs:<br />
Temperature-controlled services<br />
Direct delivery to pharmacy, patient or hospital<br />
Warehousing, distribution and packaging services<br />
Zero defects in supply chain<br />
Telecom<br />
<strong>2011</strong> saw a significant investment in telecom infrastructure,<br />
which resulted in positive volume growth. Orders<br />
from new telecom operators in emerging markets (Latin<br />
America, Africa, Middle East) came atop higher volumes<br />
in existing accounts. The outlook for 2012 remains stable<br />
in terms of volume but price erosion is to be expected.<br />
Customer needs:<br />
Aftermarket and repair services<br />
Enhanced and innovative last mile solutions<br />
Warehousing and distribution services<br />
Order management with IT integration<br />
Panalpina <strong>Annual</strong> <strong>Report</strong> <strong>2011</strong><br />
www.panalpina.com / iv<br />
Consumer and Retail<br />
Growth was fueled by fast-moving global consumer<br />
brands and by large and medium-size retailers. Asia<br />
remained an important market not only from a sourcing<br />
point of view but also in terms of consumer demand.<br />
In addition, though, established markets such as North<br />
America or Europe will remain important, particularly<br />
with regard to purchase order management and end-toend<br />
milestone tracking.<br />
Customer needs:<br />
Purchase order management with IT integration<br />
Vendor management and integration<br />
Sophisticated buyer consolidation services<br />
End-to-end milestone tracking<br />
Panprojects<br />
The project business for the petrochemical and process<br />
sector was flat, but previously awarded contracts continued<br />
from prior years. The upturn in the global mining<br />
industry provided the bulk of the work. In a difficult<br />
market Panalpina achieved operational excellence while<br />
meeting high health, security, environmental and compliance<br />
standards. The goal is to expand investments,<br />
including into Sub-Saharan Africa.<br />
Customer needs:<br />
Worldwide coverage<br />
Integrated turn-key solutions<br />
Fast and secure shipments for bulky and oversized<br />
goods
Automotive<br />
Continued growth of volume with major automotive<br />
manufacturers and suppliers was strongly based on<br />
their need for air freight services. The latest natural<br />
disasters have triggered alternative supply chain design<br />
discussions in which just-in-time is being weighed carefully<br />
against just-in-case inventories. As a consequence,<br />
effective crisis management became an integral part of<br />
the service portfolio.<br />
Customer needs:<br />
Flexible and reliable supply chains with zero defects<br />
Purchase order management and warning systems<br />
Buyer consolidation<br />
Chemicals<br />
In the International Year of Chemistry all buyers in the<br />
value chain reduced their stock, decreasing further the<br />
volumes traded. Industry mergers and acquisitions gave<br />
Panalpina a stronger foothold within the top account<br />
landscape as cost-saving and efficiency efforts reached<br />
a new peak. New products on the market create numerous<br />
opportunities for Panalpina.<br />
Customer needs:<br />
Product know-how and technical support<br />
Key partnership programs with global coverage<br />
Supply chain excellence and visibility<br />
Compliance program and health, safety and<br />
environment (HSE) competence<br />
Oil and Gas<br />
For more than five decades, Panalpina has proven its<br />
commitment to the industry with a focus on servicing<br />
the highly demanding upstream part of the business<br />
(exploration and production). The vertical expanded its<br />
lead position with operators and oilfield service companies,<br />
demonstrating excellence in processes, compliance,<br />
HSE standards, and service innovation.<br />
Customer needs:<br />
End-to-end supply of on- and offshore locations<br />
Integrated project management for on- and offshore<br />
facilities, including rig moves<br />
Pick and pack of hazardous material, bulk and heavy<br />
shipments<br />
Fashion<br />
Manufacturing<br />
Success Factors<br />
The fashion industry performed well. This was due to<br />
customer growth in emerging markets. Panalpina’s<br />
performance was underpinned by growth in Asia and in<br />
the Americas. Fashion companies faced cost pressure<br />
but also had to address increased consumer demands.<br />
Panalpina will continue to support them in their continued<br />
trend to globalization and with its multi-channel<br />
solution offer.<br />
Customer needs:<br />
High supply chain reliability and predictability<br />
High security and cost focus<br />
Multimodal solutions<br />
Thanks to full order books at most manufacturing companies<br />
across all segments, Panalpina was able to<br />
grow in its newest industry vertical (established 2010).<br />
In addition, Panalpina developed specific industry value<br />
propositions such as non-containerized cargo or<br />
smart air freight solutions related to the aftermarket of<br />
Panalpina’s client base.<br />
Customer needs:<br />
End-to-end transport and logistics solutions<br />
Special equipment management<br />
Buyer and shipper consolidations<br />
Aftermarket logistics<br />
Packaging<br />
Hi-tech<br />
Meeting the needs of a dynamic and volatile market<br />
whose products exhibit a short lifecycle requires a highly<br />
flexible supply chain design. Panalpina leverages its<br />
global reach as more companies move their production<br />
sites to Asia and other emerging markets. This vertical<br />
already has a sophisticated mix of transport and logistics<br />
services in place to meet customer demand.<br />
Customer needs:<br />
Lead-time reductions at low cost<br />
Last-mile delivery services<br />
Postponement<br />
High security<br />
Reverse logistics with repair services<br />
Panalpina <strong>Annual</strong> <strong>Report</strong> <strong>2011</strong><br />
37
38<br />
Success Factors<br />
Employees<br />
Empowering staff for service excellence<br />
Panalpina’s future success depends on the investment it makes now in the<br />
development of its employees. Attracting, screening, and selecting the right people<br />
for the right jobs, and retaining them through value-added training and employee<br />
development are central to this investment, which will pay dividends into the future.<br />
At the end of <strong>2011</strong>, Panalpina had 15,051 employees in over<br />
80 countries. Its global human resources (HR) function is<br />
responsible for enabling organizational development so as<br />
to secure the ongoing engagement and effectiveness of<br />
Panalpina’s employees. The systems, processes and training<br />
programs that form a strong foundation for such a culture<br />
for these efforts are based on Panalpina’s core values<br />
and a pragmatic leadership competency model. These are<br />
continually evaluated and refined to ensure that Panalpina<br />
managers have a robust framework that will sustain a<br />
high-performance culture within the Company.<br />
Human Resources transformation continues<br />
In its fourth year, the HR transformation process remains<br />
focused on building on the foundation of its strategic<br />
priorities, namely, (1) identifying, attracting, managing, and<br />
deploying the talent required to perform; (2) propagating<br />
a sustainable high-performance organization and workforce;<br />
(3) developing leadership and other capability requirements;<br />
and (4) designing, implementing, and optimizing<br />
HR processes, policies and service delivery so that they<br />
efficiently meet the needs of our global business units and<br />
workforce.<br />
System support for talent management<br />
PanLink, a web-based Human Resources management<br />
system, was launched in late 2010 to support the implementation<br />
and institutionalization of the automation and<br />
global centralization of objective and performance management,<br />
talent management, succession planning, and compensation<br />
for Panalpina’s senior management. In 2012, the<br />
system will be introduced for all employees in India and<br />
at the head office in Basel. The scope of PanLink has also<br />
been expanded to include a Recruitment Module, which<br />
is expected to be a key tool for all hiring managers in the<br />
coming years.<br />
Panalpina <strong>Annual</strong> <strong>Report</strong> <strong>2011</strong><br />
Organizational commitment to employee development<br />
The global Human Resources team continually monitors<br />
various indicators of training, development and engagement<br />
in the workforce. In <strong>2011</strong>, Panalpina launched its<br />
second Employee Engagement Survey to identify areas<br />
where enhanced programming would be beneficial. In<br />
total, 84 % of employees responded, and improvement was<br />
noted in the following areas: Panalpina’s management<br />
has improved in terms of its ability to state objectives clearly,<br />
establish priorities, make decisions promptly, provide<br />
leadership, and communicate with people. Panalpina’s<br />
employees felt they are better informed about the Company’s<br />
strategy and performance, and they reported that<br />
greater efforts are being made to obtain their views. More<br />
employees noted satisfaction with the training opportunities<br />
available to them and stated that Panalpina is doing a good<br />
job in employee development and in providing deserving<br />
employees with opportunities for advancement.<br />
Nevertheless, opportunities for helping Panalpina to continue<br />
its development were identified. For example, the<br />
survey showed scope for improvement in relation to operating<br />
conditions and efficiency, to the integration of<br />
Panalpina’s core values into the corporate culture, and to<br />
performance review processes.<br />
The virtual campus: PanAcademy<br />
In response to the results of the 2009 survey, Panalpina<br />
continued to strengthen its commitment to providing<br />
learning opportunities for all its employees. PanAcademy,<br />
Panalpina’s e-learning platform, grew to include 33 learn-<br />
ing units covering the Company’s strategic environmental<br />
PanGreen initiative as well as operations, product competence,<br />
and compliance. E-learning also expanded the<br />
coordinated launch of multi-language units – highlighted<br />
by the unit covering a Panalpina “core values journey” that<br />
includes refresher courses on anti-corruption.
Discovering and developing leadership talent<br />
Panalpina’s commitment to employee development and talent<br />
management extend to all levels of the organization.<br />
In <strong>2011</strong>, the CEO personally led learning workshops focused<br />
on enhancing strategy execution. 44 senior managers<br />
spent four days in an offsite program to create a common<br />
understanding and alignment of the challenges linked to<br />
strategy execution, supply chain management from a customer’s<br />
perspective and high-performance leadership.<br />
During these four days, they participated in an intuitive tailor-made<br />
business simulation called Mexus that challenged<br />
each Panalpina manager to deliver value to customers<br />
consistently, collaborate across the organization, and drive<br />
strong financial performance.<br />
Tailor-made learning programs<br />
In <strong>2011</strong>, the Company’s global program on collaborative<br />
strategic leadership skills, Navigating our Future, enrolled<br />
an additional 35 candidates. The program is offered to<br />
high-potential employees in mid-senior positions who are<br />
willing to pursue an international career. In its third year,<br />
it is augmented by the re-launched global leadership and<br />
managerial skills program Steering Success. In 2012, this<br />
includes over 609 department heads, team leaders and<br />
supervisors who will participate in three modules offered in<br />
Mandarin, German, French, Portuguese, Spanish, Italian,<br />
and English. Panalpina continually seeks the best possible<br />
candidates, either internal or external, for management<br />
and line roles, and thus does not have a policy to preferentially<br />
hire people who are living locally.<br />
In 2012, four new training initiatives will begin to help employees<br />
deal with the challenges faced in the work environment<br />
– namely: securing success for new and first time<br />
leaders, performance management, empowerment and<br />
coaching, and effective communications.<br />
In parallel, Panalpina continued to build upon its internal<br />
assessment capabilities. Over the last two years more than<br />
150 assessments have been run internally with a strategic<br />
partner; these assessments are now well established as a<br />
source of sound information regarding an individual’s capabilities<br />
and as a means of identifying development needs.<br />
Success Factors<br />
Benchmarking for fair, transparent, and motivational<br />
compensation<br />
Global, regional and local compensation benchmarking<br />
again played an important role in ensuring best competitive<br />
practices and maintaining a competitive edge by retaining<br />
and motivating employees. In <strong>2011</strong> the practice was<br />
enhanced to include reviews of global job levels and compensation<br />
structures against industry norms.<br />
Building further on the foundations for annual global cost<br />
transparency in relation to cross-border transfers, another<br />
internally developed enhancement to a global compensation<br />
and benefit reporting process was established in<br />
2012. This introduces extra transparency into comparisons<br />
of actual costs versus budgeted costs, thus enabling<br />
Panalpina to accurately track the return on investment.<br />
The Company expects that the continued evolution of this<br />
cutting-edge tool will facilitate strategic decisions that<br />
include cost factors. It will then be better equipped to deploy<br />
these high-value, high-cost resources strategically around<br />
the globe.<br />
Employees<br />
as at December 31, <strong>2011</strong><br />
www.panalpina.com / jobs<br />
Full-time<br />
equivalents*<br />
Europe, Middle East, Africa and CIS 6,746<br />
North America 2,418<br />
Central and South America 2,474<br />
Asia Pacific 3,601<br />
Corporate 461<br />
Total 15,700<br />
* Full-time equivalents include also part-time assignments and<br />
employees provided by labor agencies.<br />
Number of employees 15,051<br />
Panalpina <strong>Annual</strong> <strong>Report</strong> <strong>2011</strong><br />
39
40<br />
Success Factors<br />
Compliance and Corporate Culture<br />
Ethics, values and compliance<br />
As a global organization with operations on six continents, Panalpina is integrated into<br />
the cultures of many different countries. This makes cross-cultural understanding<br />
crucial. Furthermore, Panalpina’s strong corporate culture is based on shared values<br />
and ethical behavior that encompass fairness, respect and responsibility.<br />
A key aspect of Panalpina’s commitment to outstanding<br />
service is its culture of ethical behavior, rigorous compliance<br />
with all applicable laws, and the global experience contributed<br />
by its employees. Panalpina realizes that its ultimate<br />
success depends on its employees’ awareness of the<br />
Company’s long term values, and an understanding of how<br />
their individual work contributes to the Company’s success.<br />
Cultivating strong values and a healthy corporate culture<br />
is a long process that calls for commitment and investment<br />
on the part of all stakeholders.<br />
Global experience supports performance<br />
With approximately 500 of its own representative offices in<br />
over 80 countries and close collaboration with partner<br />
companies in 80 more countries, Panalpina has the global<br />
footprint and experience base to help its customers succeed<br />
and prosper in the international marketplace. To support<br />
this, Panalpina offers its employees an extensive<br />
internal exchange program through which they have the<br />
opportunity to spend an average of three months abroad<br />
within the Company. This popular program remains a priority<br />
for 2012 as it provides employees with multi-cultural<br />
and international experiences that strengthen cross-border<br />
understanding and collaboration.<br />
Panalpina’s Code of Conduct<br />
The Panalpina Code of Conduct encompasses binding rules<br />
on health, safety, and environment; on employee relations<br />
(including protection from discrimination and harassment);<br />
on ethical business conduct (including fair competition and<br />
antitrust and trade regulations); on the strict prohibition on<br />
bribery and corruption (including a ban on political contributions<br />
by the Company); and on responsibility for Company<br />
assets as well as financial integrity. Derived from the United<br />
Nations’ Universal Declaration of Human Rights and from<br />
internationally recognized environmental standards and<br />
labor laws, Panalpina’s Code of Conduct continues to reflect<br />
its commitment to integrity and responsibility across all<br />
operations and divisions.<br />
Panalpina <strong>Annual</strong> <strong>Report</strong> <strong>2011</strong><br />
The Code of Conduct is available in 30 languages and is<br />
readily accessible by all employees via the intranet and on<br />
the Corporate website, see www.panalpina.com/culture.<br />
Since 2008, it is applied consistently and rigorously throughout<br />
the Company regardless of an employee’s status or<br />
tenure; all Panalpina employees are required to sign the<br />
Code of Conduct, indicating their commitment to adhere<br />
to the standards therein. Staff members are encouraged to<br />
report breaches of the Code of Conduct to their line or HR<br />
managers, or directly to the Corporate Compliance Office.<br />
However, if employees are unwilling or unable to do so,<br />
they can also contact a neutral, external hotline or file a<br />
confidential report via the internet.<br />
Resources and training for compliance<br />
Panalpina’s Corporate Compliance Officer reports directly<br />
to the CEO and to the Legal and Compliance Committee<br />
of the Board of Directors, and is assisted by a team of<br />
eight full-time Corporate Compliance Managers. In <strong>2011</strong>,<br />
Panalpina expanded its corporate compliance team by<br />
adding a position dedicated to focusing on trade compliance,<br />
which includes oversight of export regulations and<br />
issues regarding sanctioned and embargoed countries.<br />
Furthermore, in the year under review, the compliance<br />
team visited Panalpina operations in 27 countries for one<br />
to two weeks each in order to ensure that Code of Conduct<br />
and Compliance programs were implemented fully<br />
and correctly. The selection of the countries was based in<br />
part on the Corruption Perceptions Index of Transparency<br />
International, a global civil society organization focused on<br />
the fight against corruption.<br />
Training has remained a focal point in Panalpina’s overall<br />
Compliance Program. Since 2008 it has been supported<br />
by an interactive e-learning platform which enables employees<br />
to familiarize themselves with the Code of Conduct<br />
and various aspects of compliance. This program was<br />
enhanced in <strong>2011</strong> by the launch of modules that focus on<br />
the topics of anti-trust and anti-corruption. These modules
are specifically designed for employees who may confront<br />
these issues in their work.<br />
In <strong>2011</strong>, Panalpina conducted over 90 on-site compliance<br />
training sessions, with over 1000 employees participating<br />
worldwide.<br />
Sharing compliance initiatives with suppliers and<br />
customers<br />
Panalpina initiates regular face-to-face discussions, seminars<br />
and workshops on various aspects of compliance<br />
with its suppliers and customers. This is seen as a key element<br />
to building long-term, trusted collaboration among<br />
the Company’s different stakeholders. In <strong>2011</strong>, Panalpina<br />
continued to engage with key suppliers, particularly those<br />
in countries where compliance has been seen as particularly<br />
important, regarding performance, necessary<br />
improvements, and compliance certification standards.<br />
Panalpina was admitted as a signatory member to the<br />
World Economic Forum Partnering Against Corruption<br />
Initiative (PACI) in 2009, and continued its support for this<br />
important initiative in <strong>2011</strong>. The PACI requires CEO level<br />
commitment to zero tolerance for bribery as well as a commitment<br />
to implement a practical and effective anti-corruption<br />
program within the Company, benchmarked against<br />
the PACI Principles.<br />
www.panalpina.com / culture<br />
Success Factors<br />
Panalpina <strong>Annual</strong> <strong>Report</strong> <strong>2011</strong><br />
41
42<br />
Success Factors<br />
Information Technology<br />
Drivers for efficiency excellence<br />
Continuous investment in the most advanced information technology (IT) systems is<br />
an essential part of Panalpina’s mission to offer state-of-the-art solutions to customers<br />
with complex transport and logistical needs. To guide this effort, Panalpina has a<br />
focused three-year strategic plan dedicated to streamlining data management processes<br />
and improving efficiency.<br />
The global logistics industry is becoming increasingly reliant<br />
on the secure and efficient processing of information.<br />
Therefore, having a robust, effective, and scalable IT infrastructure<br />
is critically important to future growth and success.<br />
In this era of rapid technological progress, identifying<br />
the latest technologies and realizing their value requires<br />
careful analysis of company operations as well as a clear<br />
understanding of customers’ needs.<br />
Ongoing IT advancements<br />
Following the worldwide rollout of a Documentation Management<br />
System in 2010, Panalpina began the implementation<br />
of a new collaboration platform in <strong>2011</strong> to provide a<br />
highly secure portal that is accessible to customers. The<br />
objective is to improve efficiency and quality assurance<br />
within the Company while providing a more streamlined<br />
approach to communication and documentation exchange<br />
between Panalpina and its customers and partners. Committed<br />
to providing reliable information in a timely manner,<br />
the collaboration platform is part of an Integrated Standard<br />
Business Platform which will be rolled out in its entirety by<br />
the end of 2012. In addition, the Event Management System<br />
will increase the transparency, the quality of data and the<br />
supply chain visibility for customers.<br />
Also introduced in <strong>2011</strong> was the SAP Transportation Management<br />
(TM) platform, which will be rolled out globally<br />
step by step. Following the <strong>2011</strong> implementation of the sea<br />
freight SAP TM application, air freight pilot installations<br />
will be deployed toward the end of 2012. Beginning in 2013,<br />
both the air and ocean freight systems will be rolled out<br />
on a corporate-wide basis. This comprehensive project will<br />
be completed by 2015.<br />
Outlook for 2012<br />
Part of Panalpina’s three-year strategic plan is an ongoing<br />
effort to renew legacy applications. Existing systems are<br />
being adapted to improve real-time automation capabilities<br />
Panalpina <strong>Annual</strong> <strong>Report</strong> <strong>2011</strong><br />
and assure data quality. These advancements will simplify<br />
processes and positively influence internal IT organization<br />
and quality targets. Innovation is also a key aspect of the<br />
strategic plan, with an emphasis on the adoption of more<br />
sophisticated technologies that promise to enhance communication,<br />
speed, efficiency and, ultimately, productivity.<br />
Various platforms based on mobile communication and<br />
information technologies will be explored with the goal of<br />
improving communication between Panalpina and its<br />
customers and partners. Panalpina recognizes the potential<br />
value in emerging technologies such as tablets, smartphones<br />
and other mobile solutions, and is prepared to<br />
incorporate these devices when deemed valuable to customers,<br />
business partners, and employees.<br />
In addition to the three-year IT strategy, Panalpina will<br />
implement standardized procedures and templates where<br />
possible to streamline processes and meet the demands<br />
of its fast-paced market, while also ensuring efficient and<br />
reliable service. This will include directing its attention to its<br />
supply chain to meet customers’ high expectations in<br />
areas such as package tracking and other real-time data<br />
monitoring capabilities.<br />
In 2012, Panalpina will launch an information security<br />
campaign. As part of this project, Panalpina will ensure<br />
that the Corporate Information Security Policy is signed<br />
and adhered to by all employees. Security awareness will<br />
be reinforced through training and refresher sessions.<br />
Lastly, as a final step in Panalpina’s long-term effort to unify<br />
data centers, security levels and disaster recovery precautions<br />
will be strengthened by a consolidation across the IT<br />
infrastructure throughout 2012 and into 2013. This process<br />
sustains the Company’s business intelligence and mitigates<br />
the risk of business disruption in the event of unforeseeable<br />
emergencies.
Procurement<br />
Strong subcontractor relations as a key asset<br />
Success Factors<br />
One of Panalpina’s ongoing strategic goals is to build long-term partnerships with<br />
world-class vendors. In order to effectively maintain this network, Panalpina’s<br />
procurement of each product division has streamlined its purchasing processes to<br />
ensure fair, equitable, and efficient treatment of its current and potential partners.<br />
Procurement is a fundamental driver for Panalpina’s<br />
success. The Company depends on its network of subcontractors<br />
to continuously improve efficiency and uphold<br />
Panalpina’s reputation in order to maintain a competitive<br />
position in the global market. This network is one of<br />
Panalpina’s most valuable assets, and results in significant<br />
dividends that are passed along to its customers.<br />
Therefore Panalpina is thorough and diligent in selecting<br />
the best possible partners with whom to do business.<br />
Finding and keeping the best partners<br />
In order to choose the most qualified subcontractors for<br />
ocean, air and logistics operations, Panalpina implemented<br />
clear criteria for assessing potential subcontractors:<br />
compliance, credibility, pricing, quality of service,<br />
consistency and performance. In addition to excelling in<br />
terms of these criteria, candidates must be willing to<br />
engage in a cooperative partnership, adhere to the Company’s<br />
rules and policies, and remain compliant with applicable<br />
laws and regulations. Panalpina is also committed<br />
to practicing fair selection procedures, which include<br />
conducting a consistent evaluation process, allowing for<br />
negotiations, disregarding nationality as a criterion, and<br />
utilizing standard contracts. Because Panalpina is a global<br />
company that applies high standards for its vendors, it<br />
does not have a policy to preferentially hire suppliers that<br />
are local to its operations.<br />
Improvements on both sides<br />
In its fast-paced industry, Panalpina must work with its<br />
partners to strengthen relationships and recognize areas<br />
for improvement. Panalpina’s suppliers have the opportunity<br />
to leverage its considerable experience in the industry to<br />
improve their own operations. Since 2010, the PanGreen<br />
program assesses the energy and environmental impacts<br />
of subcontractors and calculates the carbon footprint of<br />
cargo shipments. Results from this program provided a data<br />
baseline for the network of subcontractors against which<br />
they can measure their own environmental performance.<br />
It is not uncommon for Panalpina’s sub contractors to also<br />
be a source of innovative ideas that improve service offerings.<br />
By monitoring each step along the supply chain, and<br />
by actively engaging with its sup pliers, Panalpina can improve<br />
overall performance and offer its customers higherquality<br />
services.<br />
Ensuring compliance<br />
Panalpina must also carefully manage its exposure to<br />
liability from the actions of its subcontractors. There are<br />
numerous national and international anti-corruption laws<br />
and regulations, environmental regulations, and other legal<br />
requirements with which the Company must comply.<br />
Therefore, as a means of averting risk, regular audits are<br />
conducted to ensure subcontractor compliance with<br />
Panalpina’s Anti-Corruption Policies and Code of Conduct,<br />
as well as all applicable laws and regulations.<br />
Continued partnership<br />
Ultimately, both Panalpina and its subcontractors have<br />
the opportunity to benefit from these relationship-building<br />
and compliance assurance procedures. In support of<br />
Panalpina’s asset-light strategy, the Company attaches<br />
great importance to its growing network of trusted and<br />
reliable partners. As this will remain a key priority in future<br />
too, Panalpina intends to continue improving and securing<br />
its position in the market by developing new partnerships<br />
that meet the Company’s business demand.<br />
Panalpina <strong>Annual</strong> <strong>Report</strong> <strong>2011</strong><br />
43
44<br />
Success Factors<br />
Quality, Security and HSE<br />
A strong commitment to sustainable values<br />
To exceed its customers’ expectations, Panalpina is focused on applying outstanding<br />
quality and strong environmental performance. Consequently, it is steadily optimizing<br />
its processes and improving its services to secure long-term success.<br />
Panalpina’s robust business and quality control processes<br />
greatly increase the value of its services and ultimately<br />
the satisfaction of its customers. The responsibilities of the<br />
Business Processes and Quality team extend throughout<br />
the organization and are central to maintaining its culture<br />
of responsibility and accountability and its close cooperation<br />
with subcontractors. Key aspects of their efforts include<br />
employee training and development programs, and facilitating<br />
and monitoring the implementation of global standards<br />
for measuring and ensuring the quality of the operational<br />
service delivered to customers.<br />
Employee training for quality improvement<br />
In the past year, Panalpina continued its focus on quality<br />
services by implementing Six Sigma methodologies<br />
around the world. This was highlighted by the successful<br />
completion of the first Lean Six Sigma Green Belt Training<br />
at the facility in Basel, Switzerland. Fourteen Panalpina<br />
employees participated in the training program, which is<br />
based upon the PanCIP framework – the continuous improvement<br />
methodology designed to actively drive process<br />
improvement for Panalpina and its customers. In 2012,<br />
the Green Belt Training participants will focus on a series<br />
of quality improvement initiatives to address key elements<br />
of Panalpina’s business processes or the specific needs of<br />
certain customers.<br />
In <strong>2011</strong>, the Panalpina Project Management program,<br />
PanPM, was expanded to include worldwide class room<br />
trainings. PanPM started in 2010 as a common, standardized<br />
project management methodology intended to streamline<br />
project management across the organization. Over<br />
the past year, almost 1000 Panalpina employees have participated<br />
in the classroom, e-learning or introductory training<br />
sessions on the PanPM methodology.<br />
Customer engagement<br />
Engaging with customers and obtaining feedback on<br />
Panalpina’s performance continued as an important<br />
goal in <strong>2011</strong>. The results from previous surveys show that<br />
Panalpina <strong>Annual</strong> <strong>Report</strong> <strong>2011</strong><br />
quality and speed of service are the two most important<br />
factors for Panalpina’s customers. Surveys such as these<br />
play a critical role in informing process improvement and<br />
customer relationship management efforts.<br />
Streamlining information flows<br />
In early <strong>2011</strong>, the GlobaI Invoicing Speed and Quality initiative<br />
began at Panalpina in selected business units<br />
and departments. The expected benefits of this effort are<br />
to eliminate defects, to issue and process invoices more<br />
quickly and thereby to improve cash flow. Ultimately the<br />
lessons learned can be passed on to customers as best<br />
practices. This initiative is also built upon the PanCIP<br />
framework and utilizes the principles of the Lean Six Sigma.<br />
Panalpina Cargo 2000 Phase 1 certified<br />
In <strong>2011</strong>, Panalpina announced that the Group is now Cargo<br />
2000 certified for Phase 1. Cargo 2000 is a three-phase,<br />
multiple stakeholder industry initiative aimed at implementing<br />
a quality management system for the worldwide air<br />
cargo industry in order to improve efficiency. Phase 1 manages<br />
airport-to-airport processes, and Phase 2 tackles<br />
door-to-door shipments. Phase 2 certification is expected<br />
to follow in 2013, in line with the roll-out of a strategic IT<br />
initiative at Panalpina.<br />
Recognition for outstanding performance<br />
In <strong>2011</strong>, a number of different units were recognized with<br />
awards. During the eyefortransport’s 9th <strong>Annual</strong> 3PL<br />
Summit held at Antwerp, Panalpina received awards in two<br />
categories: Best European 3PL for Pharmaceutical, Healthcare<br />
and Life Sciences, and Best European 3PL for Industrial<br />
Supply Chain. Panalpina Greater China was named<br />
the Molex 2010 Supplier of the Year. This is the first logistics<br />
service award from Molex Chengdu and acknowledges<br />
Panalpina’s continuous improvement in supply chain management<br />
services, quality, delivery, cost control, and information<br />
technology. In early <strong>2011</strong> Panalpina Poland received<br />
the Market Leader in Sea and Air Freight Forwarding in
Poland award in the 9 th Logistics Provider of the Year 2010<br />
competition. Panalpina’s agent in South Africa, Safcor<br />
Panalpina – in <strong>2011</strong> renamed Bidvest Panalpina Logistics –<br />
has achieved the diamond award in the latest PMR survey<br />
on freight forwarders. The Company reached the highest<br />
rating amongst 150 respondents. Panalpina Northwest<br />
Europe received the Best Logistics Partner 2010 award<br />
from Huawei and was acclaimed by Tesco for its outstanding<br />
customer service. In Switzerland, Panalpina ranked<br />
28 out of 250 of the largest Swiss companies assessed<br />
for their sustainability reporting (with special emphasis<br />
on transparency) and garnered first place in the logistics<br />
sector.<br />
Dedication to security<br />
In <strong>2011</strong>, Panalpina continued to enhance its ability to provide<br />
solid security solutions, such as secure shipment and<br />
storage of valuable goods in line with its customers’ everchanging<br />
needs and demands. Led by the addition of a new<br />
Head of Security for Corporate Key Accounts, supplementing<br />
the existing Corporate Regional Heads of Security and<br />
Area Security Managers, the Panalpina team has vast experience<br />
accrued from years of work in the applicable fields<br />
of supply chain and logistics, law enforcement, military, and<br />
government (Department of Homeland Security).<br />
The tailored supply chain security measures that Panalpina<br />
offers its customers include Authorized Economic Operators<br />
(AEO), US Customs (CBP) Trade Partnership Against<br />
Terrorism (C-TPAT), US Transportation Security Administration<br />
(TSA), and the Transported Asset Protection Association<br />
(TAPA) security guidelines and protocols. In the past<br />
year, Panalpina also continued its solid compliance with<br />
its international regulatory responsibilities, which included<br />
additional AEO certifications, re-certification and validation<br />
in the C-TPAT program, and its record of 100 % screening<br />
of cargo shipped via passenger aircraft from the<br />
US in accordance with the TSA requirements through its<br />
expanding network of ten Certified Cargo Screening<br />
Facilities (CCSF).<br />
Panalpina’s Corporate Security team provides subject<br />
matter expertise to the supply chain security field by creating,<br />
reviewing, and updating industry-accepted publications<br />
and guidelines, participating in workshops and highlevel<br />
industry and government meetings, and developing<br />
“best practices” for supply chain security. In the past year,<br />
representatives from Panalpina’s Corporate Security team<br />
have been asked to present at the United Nations in<br />
Europe and to participate in working groups with CBP’s<br />
and TSA’s Air Cargo Advanced Screening pilot program<br />
Success Factors<br />
in the US, as well as assisting with standards and programs<br />
in conjunction with the Business Alliance for Secure<br />
Commerce in South America.<br />
Moving forward, Panalpina’s Corporate Supply Chain<br />
Security team will remain flexible and adapt to the everevolving<br />
security environment: it will remain dedicated<br />
and committed to the needs of its customers. In 2012, some<br />
planned improvements include:<br />
<br />
Panalpina functions in supporting the integration of secu-<br />
rity considerations in the development of new facilities.<br />
<br />
technology solution, which will increase Panalpina’s<br />
ability to monitor and manage risk in the Company’s (and<br />
its industry partners’) supply chain network; it will also<br />
provide actual trend and statistical analysis of vulnerabilities<br />
in order to reduce future risk.<br />
<br />
to Panalpina employees through e-learning modules and<br />
updates to the Company’s intranet; this will highlight the<br />
importance of security and emphasize why all employees<br />
should make security a priority in their daily work functions.<br />
Commitment to health, safety, and the environment<br />
The health and safety of Panalpina’s employees is of paramount<br />
importance to all of Panalpina’s stakeholders. The<br />
Company’s efforts in this area include ensuring a safe and<br />
hygienic workplace, instilling a culture of responsibility and<br />
risk mitigation, and communicating with employees and<br />
contractors on issues of health risks, preventive measures,<br />
hygiene, and proper medical care. Employees at all levels<br />
of the Panalpina Group working on any client project are<br />
responsible for upholding the health, safety, and environmental<br />
policies, principles, and objectives of both the client<br />
and Panalpina.<br />
The Corporate Business Sustainability and Improvement<br />
Manager – Panalpina’s global Health, Safety and Environment<br />
(HSE) representative – ensures the implementation<br />
and maintenance of all processes needed for the HSE system<br />
globally and reports the performance of the system<br />
to the Executive Board. Panalpina Management defines the<br />
overall goals of the HSE plan, appoints responsibilities,<br />
provides the authority and necessary resources for implementation,<br />
assesses performance against the goals, and<br />
takes corrective actions as appropriate.<br />
Panalpina <strong>Annual</strong> <strong>Report</strong> <strong>2011</strong><br />
45
46<br />
Success Factors<br />
In <strong>2011</strong>, Panalpina reported zero fatal accidents and<br />
305 nonfatal accidents which included onsite subcontractors.<br />
As part of the Behavioral Safety Program, employees<br />
are also encouraged to report events with 73 “near misses”<br />
reported compared to 82 in the previous year. 35 lost work<br />
day cases resulted in 17.1 days lost per 200,000 total working<br />
hours. Globally, there are more than 40 health, safety<br />
and environment representatives in place at Panalpina, who<br />
provide guidance and assistance to the senior management<br />
on HSE issues. Internal audits are performed by more<br />
than 100 trained auditors and 645 on-site inspections<br />
were carried out in <strong>2011</strong>. All areas passed the ongoing surveillance<br />
audits completed by an external certification firm.<br />
Environmental initiatives<br />
Panalpina’s global environmental program, PanGreen, is<br />
organized into four key areas: ISO certification, internal data<br />
collection and monitoring, supplier outreach, and greenhouse<br />
gas calculations. These initiatives, which originate<br />
from the Panalpina Executive Board and include all business<br />
units and departments, form the basis for Panalpina’s<br />
ongoing commitment to reducing its environmental<br />
impacts worldwide.<br />
ISO certification<br />
Comprehensive and systematic environmental management<br />
is a key component of PanGreen. To support this,<br />
Panalpina has achieved certification for all offices worldwide<br />
according to the Environmental Management Standard<br />
ISO 14001: 2004. This required integrating the Environmental<br />
Global Standards in compliance with ISO 14001: 2004<br />
into the Panalpina Integrated Management System and<br />
subsequently applying this framework to all facilities worldwide.<br />
In addition, all countries had to identify all relevant<br />
local environmental legislation and ensure these laws were<br />
implemented and checked for compliance. On completion<br />
of the rollout and training, very rigorous internal audits<br />
were carried out, supplemented by external audits by thirdparty<br />
firms that specialize in such processes.<br />
Internal data collection<br />
Comprehensive and timely data collection from across the<br />
organization is critical in order to continually monitor and<br />
manage Panalpina’s environmental and sustainability related<br />
performance. Over the past years, a number of key performance<br />
indicators have been developed that form the core<br />
of this data collection process. By using an enterprise data<br />
collection tool to measure and monitor key environmental<br />
data, the HSE and Quality team is able to monitor a range<br />
Panalpina <strong>Annual</strong> <strong>Report</strong> <strong>2011</strong><br />
of data on an annual, quarterly and monthly basis. Such<br />
data includes:<br />
<br />
<br />
<br />
<br />
<br />
<br />
<br />
<br />
This data set is continuously being assessed and<br />
expanded upon as new data becomes available or is seen<br />
as material to Panalpina’s ongoing performance.<br />
Calculating CO2 emissions for suppliers and customers<br />
With its Eco-Consumption and Eco-Transport programs,<br />
Panalpina emphasizes its commitment to minimizing its<br />
own environmental footprint and to helping its customers<br />
find ways to reduce the impact of their shipments. In the<br />
coming years, these programs will be extended to include<br />
Panalpina’s primary subcontractors in order to understand<br />
more fully the various environmental impacts across its<br />
supply chain.<br />
By using a tool that calculates CO2 emissions from transportation<br />
via air, sea, and road, Panalpina helps its customers<br />
and suppliers understand their greenhouse gas emissions.<br />
The tool is linked to Panalpina’s operational data warehouse,<br />
where information regarding each shipment’s origin,<br />
destination, weight, and mode of transport is consolidated<br />
and centrally stored. The output is a concise report that<br />
gives Panalpina’s customers a quarterly summary of their<br />
total CO2 emissions by mode of transport, KPIs for the<br />
overall CO2 efficiency, statistics on total tonnage and transport<br />
performance, and analyses of the top ten lanes utilized.<br />
Customers may use this tool for their own carbon reporting<br />
requirements and to identify opportunities for reducing<br />
carbon emissions.<br />
Environmental performance in <strong>2011</strong><br />
In <strong>2011</strong>, Panalpina continued its efforts to collect, compile,<br />
and monitor progress against key environmental impact<br />
indicators in a harmonized manner across all countries<br />
where it operates.<br />
With this commitment came the realization that in order to<br />
establish robust and credible goals for environmental<br />
performance improvements, it is necessary to have clear<br />
baseline data from which to measure and monitor impacts.
Previous goals included 5 % reductions in electricity, vehicle<br />
fuel and water usage, and – through the roll-out of paperless<br />
processes – a 10 % reduction in paper usage by the<br />
end of <strong>2011</strong>. With the recent fluctuations in the global economy,<br />
and the continued improvement in the coverage and<br />
quality of the data collection efforts, the baseline data has<br />
continually shifted in the past several years. Therefore<br />
new goals will be established at the end of 2012 in order<br />
to accurately reflect the true scope of Panalpina’s environmental<br />
impacts.<br />
Compared to the previous year, total electricity consumption<br />
increased by 18 %, heating energy rose by 84 %<br />
and vehicle fuel consumption fell by 22 %. Similarly, direct<br />
(Scope 1) CO2 emissions increased by 15 % while indirect<br />
(Scope 2) emissions were up by 30 %. Scope 3 data relevant<br />
to business travel by air has been collected and<br />
showed a 31 % increase over 2010 figures. In <strong>2011</strong>, there<br />
were 4.5 tons of CO2 equivalent emissions per full-time<br />
equivalent. As discussed above, these changes can be primarily<br />
attributed to fluctuations in business due to the<br />
global economic situation and the improved data collection<br />
efforts. Panalpina is committed to improving even further<br />
on its environmental monitoring and will continue to improve<br />
the coverage and quality of its data collection efforts<br />
in 2012.<br />
The table on the next page gives an overview of the environmental<br />
performance figures collected in <strong>2011</strong> across<br />
Panalpina’s global internal operations.<br />
Success Factors<br />
Panalpina <strong>Annual</strong> <strong>Report</strong> <strong>2011</strong><br />
47
48<br />
Success Factors<br />
Activities 1 Performance indicator Unit <strong>2011</strong><br />
Energy and CO2<br />
Electricity Consumption Terajoule 226<br />
Heating Overall consumption Terajoule 169<br />
– District heat Terajoule 10<br />
Vehicle fuel Consumption (Panalpina-owned and lease vehicles only) Terajoule 208<br />
CO2 emissions 2 Total emissions Tons 67,779<br />
– Direct (Scope 1) Tons 27,352<br />
– Indirect (Scope 2) Tons 29,795<br />
– Indirect (Scope 3, business air travel) Tons 10,631<br />
Relative emissions per FTE 2 Materials<br />
Tons / FTE 4.5<br />
Paper Consumption Tons 1,113<br />
Water Consumption m3 /1000 257<br />
Spillages 3 Incident Number 14<br />
Notes:<br />
1 For each number, data accuracy from many contributing countries was improved compared to the previous year. There are some<br />
locations for which no data was available. For more details, see the GRI content index.<br />
2 CO2 emissions were calculated according to the guidelines of the Greenhouse Gas Protocol. Emission factors for direct emissions<br />
were taken from IPCC, 2006. Emission factors for indirect emissions were taken from the International Energy Agency (IEA) and the UK<br />
Department for Environment, Food and Rural Affairs (DEFRA). For more details please refer to the GRI content index.<br />
3 There were no cases causing significant damage.<br />
Energy balance by energy category<br />
Indirect<br />
renewable energy<br />
in Gigajoule<br />
240,000<br />
200,000<br />
160,000<br />
120,000<br />
80,000<br />
40,000<br />
0<br />
Indirect<br />
energy<br />
Electricity Heating Owned<br />
vehicles<br />
Panalpina <strong>Annual</strong> <strong>Report</strong> <strong>2011</strong><br />
Direct energy<br />
CO2 emission by scope and activity<br />
Scope 1<br />
in tons of CO2 equivalent<br />
30,000<br />
25,000<br />
20,000<br />
15,000<br />
10,000<br />
5,000<br />
0<br />
Scope 2<br />
Electricity Heating Owned<br />
vehicles<br />
www.panalpina.com / quality<br />
www.panalpina.com / security<br />
www.panalpina.com / hse
Social Commitment<br />
Responsibility to society<br />
Responsibilities<br />
The Panalpina Group honors its social responsibility at different levels. Since 2003,<br />
through its support for the Vision First program in Ghana, it has helped combat<br />
avoidable blindness. On top of this, Panalpina’s regional business units are involved<br />
in many local projects.<br />
Engagement at regional level<br />
The ways in which Panalpina and its workforce underscore<br />
their social commitment are manifold: Examples include<br />
the collection of over USD 10,000 by employees who took<br />
part in a sponsored run for the American Heart Association,<br />
free-of-charge container deliveries to Haiti, the participation<br />
of 1500 staff members in the <strong>2011</strong> Earth Hour of<br />
the Worldwide Fund for Nature (WWF), and Greater China’s<br />
own “One Shipment, One Dollar” fundraising campaign,<br />
whose proceeds were used to reconstruct a Chinese<br />
school.<br />
Vision First: the fight against avoidable blindness<br />
Apart from its regional sponsorships, Panalpina has since<br />
2003 been involved in the Vision First program in Ghana.<br />
In this program, the Swiss and local Red Cross societies<br />
work in partnership with the Ghana Ministry of Health.<br />
Through the wider provision of access to eye care treatment,<br />
these organizations are able in many cases to prevent<br />
patients from becoming blind.<br />
It is estimated that around 1 % of Ghana’s approximately<br />
24 million-strong population, or about 230,000 people, are<br />
blind. Some 80 % of blindness cases have preventable and<br />
treatable causes, such as cataract, trachoma or malnutrition.<br />
Poverty, coupled with a shortage of eye care professionals,<br />
makes it difficult for sufferers to find suitable treatment.<br />
In Africa, there is only about one ophthalmologist<br />
per million inhabitants.<br />
Local resources as key to sustainable progress<br />
The Vision First program adopts a three-pronged approach:<br />
treating eye disorders, training specialized medical personnel,<br />
and expanding the infrastructure and technology<br />
base. This is made possible by a combination of external<br />
funding and local resources. To provide eye care in remote<br />
village communities, the program maintains a network of<br />
volunteers. These carry out sight checks, assist sufferers<br />
in obtaining glasses or treatment at the nearest clinic,<br />
and offer vital information on eye care that helps many to<br />
avoid visual impairment in the first place.<br />
Transition to independent framework<br />
Panalpina’s annual contribution to the Vision First program<br />
runs to CHF 200,000, equivalent to a quarter of the project<br />
costs. Having been sponsored by the Group throughout<br />
its pilot and on-the-ground implementation phases, the<br />
project has now entered the completion stage, which will<br />
see the various institutions gain autonomy. To date, over<br />
1.3 million people have been treated at clinics and advice<br />
surgeries and more than 31,000 operations performed.<br />
<strong>2011</strong> results of Vision First program<br />
Patients treated 166,051<br />
Operations performed 2,144<br />
Patients issued vision aids 2,142<br />
Clinics/hospitals in operation 16<br />
Persons provided with health education 507,860<br />
Number of project participants<br />
Opticians and ophthalmologists 5<br />
Nurses (trained to treat minor eye disorders) 28<br />
Schoolteachers (with special training in healthcare<br />
issues)<br />
www.panalpina.com / society<br />
325<br />
Active Red Cross volunteers 1,000<br />
Panalpina <strong>Annual</strong> <strong>Report</strong> <strong>2011</strong><br />
49
50<br />
Responsibilities<br />
Corporate Governance<br />
Corporate Governance and Remuneration <strong>Report</strong>:<br />
committed to a transparent management structure<br />
Panalpina is committed to a transparent management structure that is governed<br />
by international corporate governance principles. This Corporate Governance <strong>Report</strong><br />
complies with the revised Directive of the SIX Swiss Exchange and therefore serves<br />
to provide investors with key information regarding corporate governance in an<br />
accessible format. Section 5 of this report also serves as a Compensation <strong>Report</strong> as<br />
recommended by economiesuisse in its Swiss Code of Best Practice for Corporate<br />
Governance guidelines.<br />
1 Group structure and shareholders<br />
1.1 Group structure<br />
1.1.1 Operational group structure<br />
Panalpina’s business activities are primarily regionally oriented.<br />
The operating structure is divided into the following<br />
four regional units:<br />
<br />
<br />
<br />
<br />
In 2009, Panalpina integrated the regional management<br />
layer into its Head Office structure.<br />
Secondary, the business activities are subdivided into the<br />
following business segments:<br />
<br />
<br />
<br />
Supplementary information can be taken from the<br />
segmental reporting section of the Consolidated Financial<br />
Statements (pages 84 – 86).<br />
1.1.2 Listed companies within the scope of<br />
consolidation<br />
Panalpina World Transport (Holding) Ltd. (PWT), the ultimate<br />
holding company of the Panalpina Group, is the only listed<br />
company within the scope of consolidation. PWT has its<br />
registered office in Basel, Switzerland. The PWT shares are<br />
exclusively listed on the SIX Swiss Exchange. The market<br />
capitalization on the closing date amounted to CHF 2.4 billion<br />
(25,000,000 registered shares at CHF 96.20 per share).<br />
The PWT shares are traded under Valor no. 216808,<br />
ISIN CH0002168083, symbol PWTN.<br />
Panalpina <strong>Annual</strong> <strong>Report</strong> <strong>2011</strong><br />
1.1.3 Non-listed companies within the scope of<br />
consolidation<br />
The main subsidiaries and associated companies are<br />
disclosed in the Consolidated Financial Statements<br />
(pages 122–125) itemized by registered office, nominal<br />
capital, equity interest in percent, investment and method<br />
of consolidation.<br />
1.2 Significant shareholders<br />
The Ernst Göhner Foundation, Zug, Switzerland, is the main<br />
shareholder of PWT, with an equity participation of 43.58 %.<br />
Cevian Capital II Master Fund LP held 11.37 % and Panalpina<br />
World Transport (Holding) Ltd., held a share capital of 5.47 %<br />
on closing date. The respective treasury shares were purchased<br />
as a result of PWT’s share buyback program (referenced<br />
in section 2.3) and its share and option programs<br />
(referenced in section 5). Other significant shareholders are<br />
Artisan Partners Limited Partnership (5.01 %) and Bestinver<br />
Gestión, S.G. SGIIC (5.05 %).<br />
With regard to other significant shareholders, during the<br />
reporting year disclosures were made on the SIX online<br />
publication platform. The notifications (listed by shareholder<br />
and transaction date) are summarized as follows:<br />
Bestinver Gestión, S.G. SGIIC, Spain<br />
15. 07. <strong>2011</strong> increase of share capital to 3.04 %<br />
17. 10. <strong>2011</strong> increase of share capital to 5.05 %<br />
1.3 Cross-shareholdings<br />
No cross-shareholdings exist between PWT and any other<br />
company.
2 Capital structure<br />
2.1 Capital<br />
On the closing date, the ordinary share capital of PWT<br />
amounted to CHF 50,000,000 and is divided into<br />
25,000,000 registered shares, with a nominal value of<br />
CHF 2.00 each.<br />
2.2 Authorized and conditional share capital<br />
The extraordinary Shareholders’ Meeting of PWT held on<br />
August 23, 2005 agreed with the Board of Directors’ proposal<br />
to create an authorized share capital up to a maximum<br />
aggregate amount of CHF 6,000,000 by issuing a maximum<br />
of 3,000,000 registered shares with a nominal value of<br />
CHF 2.00 each. At the Shareholders’ Meeting of May 10,<br />
<strong>2011</strong> the authorized share capital was renewed at the same<br />
value until May 2013.<br />
The Board of Directors is authorized to exclude the preemptive<br />
rights of shareholders and to convey them to third<br />
parties, provided that such new shares are to be used for<br />
the takeover of entire enterprises, divisions or assets of<br />
enterprises or participations or for the financing of such<br />
transactions. The Board of Directors has not yet made use<br />
of this authorization.<br />
No decision has been made regarding the creation of<br />
conditional capital.<br />
2.3 Change in capital over the past three years<br />
With the exception of the share split introduced at the IPO<br />
in August 2005, there has been no change in the share<br />
capital structure during the years through <strong>2011</strong>.<br />
In August 2007, the Board of Directors initiated a share<br />
buyback program. Under this program, shares amounting<br />
to 5 % of the share capital (1,250,000 shares) have been<br />
repurchased. The buyback program was concluded on<br />
September 2, 2008. The proposal of the Board of Directors<br />
to the <strong>Annual</strong> General Meeting to reduce the share capital<br />
and cancel the repurchased shares has been postponed<br />
with the explicit consent of the Swiss Takeover Board.<br />
2.4 Shares and participation certificates<br />
On the closing date, 25,000,000 fully paid-in PWT registered<br />
shares with a nominal value of CHF 2.00 each were<br />
issued. On this date, no participation certificates were<br />
issued.<br />
Responsibilities<br />
2.5 Dividend-right certificates<br />
On the closing date, no dividend-right certificates had<br />
been issued.<br />
2.6 Limitations on transferability and nominee<br />
registrations<br />
2.6.1 Limitations on transferability for each share<br />
category; indication of statutory group clauses and rules<br />
for granting exceptions<br />
Acquirers of PWT shares are entered into the share register<br />
as shareholders with voting rights upon provision of<br />
proof of the acquisition of the shares and provided that they<br />
expressly declare that they hold the shares in their own<br />
name and for their own account.<br />
The Articles of PWT specify that any shareholder may<br />
exercise voting rights to a maximum of 5 % of the total<br />
number of shares recorded in the commercial register.<br />
This limitation for registration in the share register shall also<br />
apply to persons who hold shares fully or in part through<br />
nominees within the meaning of the Articles. Furthermore,<br />
this limitation for registration in the share register also<br />
applies to registered shares that are acquired through the<br />
exercising of pre-emptive rights, warrants and conversion<br />
rights. The Board of Directors is empowered to allow<br />
exemptions from the limitation for registration in the share<br />
register in particular cases.<br />
The Articles make provision for group clauses.<br />
The limitations on transferability do not apply to the shares<br />
held by the Ernst Göhner Foundation because it held<br />
PWT shares prior to the implementation of the limitations<br />
(so-called grandfathering).<br />
2.6.2 Reasons for granting exceptions in the year<br />
under review<br />
No exceptions were granted during the reporting year.<br />
2.6.3 Admissibility of nominee registrations; indication<br />
of any percent clauses and registration conditions<br />
The Articles of PWT specify that the Board of Directors<br />
may register nominees with voting rights in the share register<br />
up to a maximum of 2 % of the share capital recorded<br />
in the commercial register. Nominees are persons who do<br />
not expressly declare in their application that they hold the<br />
shares for their own account and with whom the Company<br />
has entered into an agreement to this effect.<br />
The Board of Directors is empowered to register nominees<br />
with voting rights exceeding 2 % of the share capital recorded<br />
in the commercial register as long as the respective<br />
Panalpina <strong>Annual</strong> <strong>Report</strong> <strong>2011</strong><br />
51
52<br />
Responsibilities<br />
nominees inform PWT of the names, addresses, nationalities<br />
(registered office in the case of legal entities) and the<br />
shareholdings of those persons for whose account they<br />
hold 2 % or more of the share capital recorded in the commercial<br />
register.<br />
The Articles make provision for group clauses.<br />
2.6.4 Procedure and conditions for cancelling statutory<br />
privileges and limitations on transferability<br />
A resolution of the General Shareholders Meeting of PWT<br />
on which at least two-thirds of the voting shares represented<br />
agree is required for any abolition or change of the<br />
provisions relating to transfer limitations.<br />
2.7 Convertible bonds, warrants and options<br />
There were no convertible bonds outstanding on the<br />
closing date.<br />
The only issued options relate to the share and option<br />
participation program (Management Incentive Plan, MIP)<br />
are for currently approximately 480 senior managers<br />
of Panalpina. As of 2009, the Board of Directors and the<br />
Executive Board have been excluded from participation<br />
in this program. As of <strong>2011</strong>, the options under the MIP program<br />
have been replaced by a free share ratio scheme.<br />
For further details please refer to section 5.1.<br />
3 Board of Directors<br />
3.1 Members of the Board of Directors<br />
At the <strong>Annual</strong> General Meeting of May 10, <strong>2011</strong>, Lars<br />
Förberg and Knud Elmholdt Stubkjær were elected<br />
to the Board of Directors whereas Rudolf W. Hug, Beat<br />
Walti, Chris E. Muntwyler, Roger Schmid and Hans-Peter<br />
Strodel were re-elected to the Board of Directors for a<br />
one-year term.<br />
On the closing date, the Board was composed of<br />
seven persons.<br />
Three members of the Board of Directors (Rudolf W. Hug,<br />
Roger Schmid and Beat Walti) are also members of the<br />
Board of Trustees (Stiftungsrat) of PWT’s main shareholder,<br />
the Ernst Göhner Foundation.<br />
Lars Förberg is a member of the Board of Directors of<br />
Cevian Capital, the second largest PWT shareholder.<br />
The biographies of the members are as follows:<br />
Rudolf W. Hug, Chairman. Swiss citizen. Born in 1944.<br />
Re-elected in <strong>2011</strong> (until 2012).<br />
Panalpina <strong>Annual</strong> <strong>Report</strong> <strong>2011</strong><br />
Rudolf W. Hug holds a PhD in law from the University of<br />
Zurich and a MBA from INSEAD, Fontainebleau (France).<br />
In 1985, he participated in the Executive Program of the<br />
Graduate School of Business at Stanford University.<br />
From 1977 to 1997, he worked in several positions for<br />
Schweize rische Kreditanstalt (today Credit Suisse). During<br />
the period from 1987 to 1997, he ran the international<br />
division and served as a member of the Executive Board<br />
of Credit Suisse and Credit Suisse First Boston. Since<br />
1998, Rudolf W. Hug has been active as an independent<br />
management consultant.<br />
Rudolf W. Hug has been a member of the Board of Directors<br />
since 2005 and was appointed Chairman of the Board<br />
of Directors on May 15, 2007 following the retirement of<br />
his predecessor.<br />
Beat Walti, Vice Chairman. Swiss citizen. Born in 1968.<br />
Re-elected in <strong>2011</strong>, (until 2012).<br />
Beat Walti holds a PhD in law from the University of Zurich.<br />
In 1998, he became a consultant with McKinsey & Company<br />
in Zurich. In 2001, he was a project manager, shareholder<br />
and board member for the start-up ETOILE Medical. Since<br />
2002, Beat Walti is a lawyer with Wenger & Vieli in Zurich<br />
specializing in corporate, commercial, contract, competition<br />
and antitrust law. He became partner with Wenger & Vieli<br />
in 2007.<br />
Lars Förberg, Member of the Board of Directors. Swedish<br />
citizen. Born in 1965. Elected <strong>2011</strong> (until 2012).<br />
Lars Förberg studied economics in Stockholm and Michigan<br />
and holds a M. Sc. in Economics and Business Administration<br />
from the Stockholm School of Economics. He<br />
started his career as an investment manager and partner<br />
at the private equity company Nordic Capital in Sweden.<br />
At the end of 1997 he moved to the former AB Custos, one<br />
of Sweden’s largest public limited investment companies,<br />
where he worked until September 2001, most recently as<br />
Chief Investment Officer. Since October 2001, Lars Förberg<br />
has been managing partner in Cevian Capital, an investment<br />
company specializing in public limited companies,<br />
which he co-founded.<br />
Chris E. Muntwyler, Member of the Board of Directors.<br />
Swiss citizen. Born in 1952. Re-elected in <strong>2011</strong> (until 2012).<br />
Chris E. Muntwyler attended the School of Commerce<br />
in Zürich and completed various executive programs at<br />
Harvard University, IMD in Lausanne and at the Wharton<br />
University. From 1972 to 1999 he held several positions at<br />
Swissair, until 1981 in various leadership functions in the<br />
Marketing Division, in 1982 as General Manager Marketing
and Sales Scandinavia and from 1986 for North America.<br />
In 1990, he took over the responsibility for the global Priceand<br />
Distribution Policy and was then leading the development<br />
and introduction of the new group IT strategy. Before<br />
leaving Swissair at the beginning of 1999, he was Vice<br />
President Global Distribution. From 1999 to 2008, Chris<br />
E. Muntwyler held several executive positions at DHL<br />
Express, in 1999 as Managing Director Switzerland, in<br />
2002 as Managing Director Germany, in 2003 as Chief<br />
Executive Central Europe, and in 2005 as Chief Executive<br />
United Kingdom.<br />
Today Chris E. Muntwyler is President and CEO of the<br />
management consulting company Conlogic AG.<br />
Roger Schmid, Member of the Board of Directors.<br />
Swiss citizen. Born in 1959. Re-elected in <strong>2011</strong> (until 2012).<br />
Roger Schmid holds a university degree in law as well as<br />
a PhD in law from the University of Zurich. From 1991<br />
to 1995, he was Legal Counsel and Director at Bank Leu,<br />
a subsidiary of Credit Suisse. Roger Schmid works as<br />
an Executive Director of the Ernst Göhner Foundation.<br />
Roger Schmid has been a member of the Board of Directors<br />
since 2003.<br />
Hans-Peter Strodel, Member of the Board of Directors.<br />
Swiss citizen. Born in 1943. Re-elected in <strong>2011</strong> (until 2012).<br />
Hans-Peter Strodel holds a PhD in economics from the<br />
University of St. Gallen. From 1969 until 1974 he was an<br />
executive assistant at Maschinenfabrik Benninger und<br />
Heberlein AG. From 1975 until 1994, he held several positions<br />
at the Oerlikon-Bührle Group, in 1975 as Head of<br />
Planning and Marketing in Italy, and from 1980 as Head of<br />
Finance at Werkzeugmaschinenfabrik Oerlikon-Bührle AG<br />
and Oerlikon-Contraves. From 1995 until 2008, Hans-Peter<br />
Strodel was CFO at Schweizerische Post.<br />
Knud Elmholdt Stubkjær, Member of the Board of<br />
Directors, Danish citizen. Born in 1956. Elected in <strong>2011</strong><br />
(until 2012).<br />
Knud Elmholdt Stubkjær holds a shipping degree from the<br />
Mærsk International Shipping Academy, supplemented with<br />
various executive programmes, a.o. from IMD and INSEAD.<br />
From 1977 through 2007, he held various positions within<br />
the A.P. Møller-Mærsk Group, including a number of postings<br />
in various Asian and European countries. This included<br />
positions as Head of Mærsk Line United Kingdom, President<br />
of Mærsk K.K. Japan, CEO A.P. Møller-Mærsk Singapore<br />
and at the same time Regional Manager A.P. Møller<br />
Group Asia / Oceania / Middle East. In 1999, he became<br />
Head of Mærsk container business worldwide, based in<br />
Responsibilities<br />
Copenhagen, and the same year became partner in the<br />
A.P. Møller-Mærsk Group. In 2008, he became partner in<br />
the E.R. Capital Holding Group in Hamburg, serving as<br />
CEO of one of its subsidiaries, E.R. Schiffahrt GmbH,<br />
a leading maritime service provider within container, bulk<br />
and offshore shipping.<br />
All the members of the Board are non-executive members<br />
and do not actively perform any managerial functions at<br />
PWT or any of the Group companies. Nor have they held<br />
any executive positions within the past three years prior to<br />
this reporting year. None of the members of the Board of<br />
Directors has a substantial business relationship with PWT<br />
or any of its group companies.<br />
3.2 Other activities and vested interests<br />
Rudolf W. Hug, Member of the Board of Trustees<br />
(Stiftungsrat) of the Ernst Göhner Foundation, Zug<br />
(Switzerland), and Member of the Board of Directors of<br />
the following companies: Deutsche Bank (Schweiz) AG,<br />
Geneva (Switzerland), Allreal Holding AG, Baar (Switzerland);<br />
Ionbond AG, Olten (Switzerland).<br />
Beat Walti, Chairman of the Board of Trustees of the<br />
Ernst Göhner Foundation, Zug (Switzerland).<br />
Lars Förberg, Chairman of the Board of Directors of Cevian<br />
Capital AG, Pfäffikon (Switzerland), a member of the<br />
Board of Directors of Cevian Capital Ltd., Jersey (Channel<br />
Islands), member of the Nomination Committees of Metso,<br />
Helsinki (Finland), Tieto, Helsinki (Finland), and Volvo,<br />
Gothenburg (Sweden).<br />
Chris E. Muntwyler, Member of the Board of Directors of<br />
Austrian Post in Vienna (Austria) and of National Express<br />
Group PLC, London (England).<br />
Roger Schmid, Member of the Board of Trustees and<br />
Executive Director of the Ernst Göhner Foundation, Zug<br />
(Switzerland).<br />
Hans-Peter Strodel, Member of the Board of Directors of<br />
Skyguide, Meyrin (Switzerland).<br />
Knud Elmholdt Stubkjær, Vice Chairman of E.R. Capital<br />
Holding, Hamburg (Germany) and member of the<br />
Board of Directors of Unifeeder A/S, Aarhus (Denmark)<br />
and FR8 Holdings Pty Ltd., Singapore.<br />
Other than these, the members of the Board of Directors<br />
do not hold other material offices, nor do they carry out any<br />
other principal activities that affect the Group.<br />
Panalpina <strong>Annual</strong> <strong>Report</strong> <strong>2011</strong><br />
53
54<br />
Responsibilities<br />
3.4 Elections and terms of office<br />
3.4.1 Principles of the election procedure and limitations<br />
on the terms of office<br />
The Articles of PWT do not make provision for the general<br />
renewal of office for the Board of Directors. The members<br />
of the Board of Directors are elected at each General<br />
Meeting of Shareholders with a one-year period of office.<br />
They may be re-elected at any time. The Organizational<br />
Regulations of PWT specify an age limit of 72 years for the<br />
members of the Board of Directors.<br />
3.4.2 The first election and remaining term of office<br />
for each member of the Board of Directors<br />
The timing of the first election and the remaining term of<br />
office for each member of the Board of Directors is specified<br />
under section 3.1.<br />
3.5 Internal organizational structure<br />
The Board of Directors is responsible for the ultimate management<br />
of the Company and monitoring of the Executive<br />
Board. It represents the Company externally and is responsible<br />
for all matters which have not been transferred to<br />
another executive body of the Company by the Swiss Code<br />
of Obligations or the Articles. In line with the Articles, the<br />
Board of Directors has established Organizational Regulations<br />
that transfer certain management responsibilities to<br />
the Executive Board.<br />
3.5.1 Allocation of tasks within the Board of Directors<br />
The Board of Directors self-constitutes and appoints its<br />
Chairman and Vice Chairman. The Chairman (in his<br />
absence the Vice Chairman) directly supervises the business<br />
affairs and activities of the Executive Board and is<br />
entitled to regularly attend Executive Board meetings. The<br />
Corporate Auditor as well as the Corporate Secretary, in his<br />
capacity as secretary to the Board of Directors, are directly<br />
subordinated to the Chairman of the Board of Directors.<br />
3.5.2 Member list, tasks and areas of responsibility<br />
for each committee of the Board of Directors<br />
Three committees exist under the Board of Directors.<br />
The Audit Committee consists of the following members<br />
of the Board of Directors: Hans-Peter Strodel (Chairman),<br />
Lars Förberg (since May <strong>2011</strong>) and Roger Schmid. The<br />
Audit Committee supports the Board of Directors with the<br />
review of the Company’s financial statements, the supervision<br />
of the financial accounting standards and reporting,<br />
the review of the effectiveness of the Internal Control System<br />
and with the efficiency of external and internal audit<br />
Panalpina <strong>Annual</strong> <strong>Report</strong> <strong>2011</strong><br />
procedures, including risk management. The Audit Committee<br />
reviews the consolidated annual financial statements<br />
as well as the published interim financial statements and<br />
submits an application to the Board of Directors for approval.<br />
It regularly maintains contact with the Group Auditors and<br />
the Corporate Auditor. On this basis, it adopts the detailed<br />
reports of the Group Auditors and semi-annual reports of<br />
Corporate Audit. It is therefore in the position to audit the<br />
quality, effectiveness and interaction between the control<br />
systems, to determine the audit priorities, to introduce proposed<br />
measures and to monitor their implementation. The<br />
Audit Committee determines the organization of Corporate<br />
Audit, adopts the internal audit charter and approves the<br />
annual planning and scope of internal audit.<br />
In the field of risk management, the Audit Committee<br />
approves the detailed and weighted risk map of the Executive<br />
Board, adopts the necessary measures for risk control<br />
and risk mitigation and reports the respective outcome<br />
to the Board of Directors on a yearly basis. The risk map<br />
itself covers any strategic, financial, operational, legal and<br />
compliance risks that could significantly impact the Company’s<br />
ability to achieve its business goals and financial<br />
targets. Identified risks are weighted and prioritized by the<br />
Executive Board according to their significance and likelihood<br />
of occurrence. For each risk, specific risk mitigation<br />
measures – including their current status – are defined and<br />
responsibilities are allocated. The risk map, which is compiled<br />
by the Risk Review Committee, chaired by the Corporate<br />
Secretary, for review by the Executive Board and subsequent<br />
approval by the Audit Committee, contains risks<br />
identified and assessed by the respective corporate functions,<br />
selected country management, Corporate Audit and<br />
the Group Auditors. The group’s key risks are annually<br />
reported to the Board of Directors.<br />
During the reporting year the Audit Committee held five<br />
half day meetings. During Audit Committee meetings, direct<br />
discussions took place with representatives of the Group<br />
Auditors and Corporate Audit. Representatives from the<br />
Group Auditors were present at three of these meetings and<br />
the Corporate Auditor (being a permanent participant of<br />
the Audit Committee since August 2010) attended all of the<br />
above-mentioned meetings. At these meetings, the Executive<br />
Board was regularly represented by the CEO, the CFO<br />
and the Corporate Secretary.<br />
The Compensation and Nomination Committee consists of<br />
the following members of the Board of Directors: Rudolf<br />
W. Hug (Chairman), Chris E. Muntwyler and Knud Elmholdt<br />
Stubkjær (since May <strong>2011</strong>). It monitors the selection process<br />
for members of the Board of Directors, the Executive Board
and other selected senior management positions, determines<br />
the overall remuneration and terms of employment<br />
for members of the Board of Directors and the Executive<br />
Board as well as remuneration bands for highly compensated<br />
employees. Regarding the compensation of the<br />
members of the Executive Board (overall remuneration,<br />
including target bonus), the Committee makes a decision<br />
subject to the final approval of the Board of Directors;<br />
applications for the compensation of the Board members<br />
are decided by the Committee and shared with the Board<br />
of Directors. Each year the Committee decides on the<br />
bonus compensation for the CEO and the other members<br />
of the Executive Board for the previous year, based on<br />
recommendations of the Chairman (for the CEO) and the<br />
CEO (for other Executive Board members). Furthermore,<br />
the Committee regularly reviews the Board Stock Award<br />
Plan, the Executive Board Mid-term and Long-Term Incentive<br />
plans and the Group’s Management Incentive Plan<br />
and submits proposals for final approval to the Board of<br />
Directors. Moreover, it approves concepts and policies<br />
for the Group’s management performance assessment,<br />
succession planning and expat programs.<br />
During the reporting year, the Compensation and Nomination<br />
Committee held three meetings of approximately two<br />
hours each. The Executive Board was regularly represented<br />
at these meetings by the CEO, the Chief HR Officer and<br />
the Corporate Secretary.<br />
The Legal and Compliance Committee consists of the following<br />
members of the Board of Directors: Rudolf W. Hug<br />
(Chairman), Roger Schmid and Beat Walti. It oversees the<br />
Company’s handling of major legal matters, including the<br />
pending anti-trust investigations and related proceedings<br />
as well as the development of the Company’s compliance<br />
policies and procedures. Furthermore the Committee oversees<br />
the compliance undertakings to which the Company<br />
has agreed with the US Department of Justice under<br />
a Deferred Prosecution Agreement in November 2010.<br />
During the reporting year, the Committee has held four<br />
meetings. The Executive Board was represented at these<br />
meetings by the CEO and the Corporate Secretary.<br />
The Committees generally meet prior to Board of Directors<br />
meetings. The chairmen of the committees inform and<br />
update the Board of Directors on the topics discussed and<br />
decisions made during such meetings. They submit proposals<br />
for approval related to decisions that fall within the<br />
scope of the Board of Directors.<br />
Objectives, organization, duties and the cooperation with<br />
the Board of Directors are defined in the Terms of Refer-<br />
Responsibilities<br />
ence of the respective committees which are reviewed and<br />
adopted by the Board of Directors.<br />
The overall responsibility of the Board of Directors is not<br />
affected by these committees.<br />
3.5.3 Working methods of the Board of Directors and its<br />
committees<br />
During the reporting year, the Board of Directors held three<br />
full-day meetings, one two-day meeting and one telephone<br />
conference. The Executive Board was represented by all<br />
its members at these meetings. In urgent cases, telephone<br />
conferences or decisions by circular may be organized in<br />
order for decisions to be taken.<br />
At every meeting, the Executive Board updates the Board<br />
of Directors on business and key financial developments and<br />
main regional and segment development. On a quarterly<br />
basis, detailed consolidated financial statements on the<br />
group, regional and business segment levels are reported<br />
to the Board of Directors in accordance with International<br />
Financial <strong>Report</strong>ing Standards (IFRS). The Board of Directors<br />
is furnished in time with an agenda, detailed meeting<br />
documentation related to topics on the agenda and minutes.<br />
3.6 Definition of areas of responsibility<br />
In line with the law and the Articles, the Board of Directors<br />
has transferred the responsibility to develop and implement<br />
the group strategy, as well as the responsibility to supervise<br />
business and financial development of the Group’s<br />
subsidiaries, to the Executive Board.<br />
The Organizational Regulations adopted by the Board of<br />
Directors govern the cooperation between the Board of<br />
Directors, the Chairman and the Executive Board. It contains<br />
a detailed catalogue of duties and competencies<br />
which determine the financial thresholds within which the<br />
Board of Directors and the Executive Board can efficiently<br />
execute their daily business. The Organizational Regulations,<br />
which are accessible on Panalpina’s website, also<br />
outline the reporting duties of the Executive Board on<br />
Group and Holding level.<br />
The main responsibilities of the Board of Directors on Group<br />
level include the determination of the business strategy<br />
on the basis of the proposals of the Executive Board, the<br />
approval of major Group policies and organizational structures,<br />
including topics related to Corporate Governance<br />
and Compliance, the approval of the annual operational and<br />
investment budgets, the approval of any extraordinary<br />
additional investment applications as well as financial planning.<br />
Further responsibilities include decisions regarding<br />
Panalpina <strong>Annual</strong> <strong>Report</strong> <strong>2011</strong><br />
55
56<br />
Responsibilities<br />
mergers and acquisitions and major human resources and<br />
remuneration decisions following recommendations and<br />
preparatory work of its Compensation and Nomination<br />
Committee.<br />
3.7 Information and control instruments<br />
vis-à-vis the senior management<br />
The Executive Board informs the Board of Directors of<br />
business developments in a written format on a monthly<br />
basis and a detailed update is provided at each Board of<br />
Directors meeting. Elements of this reporting include<br />
monthly financial reports, consolidated quarterly regional<br />
and business segment results according to IFRS (with<br />
actual figures, previous years’ figures, quarter results and<br />
budget figures as well as a comparison with the financial<br />
guidance), the reporting of business development in all<br />
regions and business segments (including focus on problematic<br />
organizations), the development of shipments,<br />
volumes and tonnages, the debtors’ and creditors’ reports<br />
(including DSO and DPO) as well as the net working capital.<br />
Further information regarding personnel and organizational<br />
changes, extraordinary events and the activities of analysts,<br />
investors and competitors form part of the regular reporting.<br />
Moreover, the Board of Directors annually reviews and<br />
approves the Group’s targets for the individual regions and<br />
business segments and adopts the respective report of<br />
the Executive Board.<br />
During the reporting year, the Chairman of the Board of<br />
Directors partly attended two Executive Board meetings<br />
and regularly receives the minutes of the Executive Board<br />
meetings. The members of the Executive Board regularly<br />
join meetings of the Board of Directors. In addition, individual<br />
senior executives attend specific topic discussions pertaining<br />
to their particular field of expertise when required.<br />
Furthermore, specific meetings of the Board of Directors<br />
are dedicated to a detailed review of major markets, business<br />
segments and the Group’s strategy according to predefined<br />
schedule. For further details please refer to sections<br />
3.5.2 and 3.5.3.<br />
The Audit Committee of the Board of Directors monitors<br />
and assesses the activities of the Corporate Auditor as<br />
well as his cooperation with the Group Auditors.<br />
The Audit Committee receives the Corporate Auditor’s<br />
half-year reports and also adopts the comprehensive<br />
annual risk map of the Executive Board. The Audit Committee<br />
approves the proposed risk control and risk mitigation<br />
measures as well as the annual planning and scope<br />
of the internal audit, which is also based on the Risk Map.<br />
For further details please refer to section 3.5.2.<br />
Panalpina <strong>Annual</strong> <strong>Report</strong> <strong>2011</strong><br />
4 Executive Board<br />
4.1 Members of the Executive Board<br />
On the closing date, the Executive Board was composed<br />
of five persons.<br />
Monika Ribar, Chief Executive Officer, Swiss citizen. Born<br />
in 1959. Member of the Executive Board since 2000 and<br />
CEO since October 2006. Apart from her CEO function,<br />
Monika Ribar has special responsibilities for Corporate and<br />
Regional Development, Corporate Compliance, Corporate<br />
Communications and Panprojects.<br />
Monika Ribar joined the Group in 1991. She held several<br />
positions within the Group’s controlling, IT and global<br />
project management departments. From 2000 to 2005,<br />
she held the position of the CIO (Chief Information Officer)<br />
of the Group and was member of the Executive Board.<br />
In 2005, Monika Ribar was appointed as CFO of the Group<br />
and her appointment as CEO was announced in June<br />
2006. She officially took office as CEO in October 2006.<br />
She holds a university degree in Finance and Controlling<br />
from the University of St. Gallen. She participated in the<br />
Executive Program of the Graduate School of Business at<br />
Stanford University, Palo Alto, California in 1999.<br />
Marco Gadola, Chief Financial Officer, Swiss citizen.<br />
Born in 1963. Joined Panalpina as a member of the Executive<br />
Board in September 2008. Responsible for Corporate<br />
Finance, Controlling, Investor Relations, Strategic<br />
Finance and Projects, Indirect Purchasing and Information<br />
Technology.<br />
Marco Gadola is a finance and economics expert with<br />
many years’ experience in international companies. Before<br />
joining Panalpina he was Group CFO and Executive Vice<br />
President Operations of Straumann Holding, a world-leading<br />
Swiss-based dental and oral technology company;<br />
prior to that he was Group CFO of the Swiss-based international<br />
consumer foods company Hero. He also held<br />
leading management positions at the Hilti Group, which<br />
manufactures and sells products for the construction<br />
and building industries. Furthermore, both at Straumann<br />
and at Hero Marco Gadola oversaw production, logistics,<br />
investor relations and information technology worldwide,<br />
and played a leading part in the acquisition and integration<br />
of companies. Marco Gadola has a Masters Degree in<br />
Business Administration and Economics from the University<br />
of Basel (Switzerland). He also completed the Accelerated<br />
Management Development Program at the London School<br />
of Economics.<br />
Christoph Hess, Chief Legal Officer and Corporate Secretary,<br />
Swiss citizen. Born in 1955. Member of the Executive
Board since October 2006. Responsible for Corporate<br />
Legal Services and Insurance.<br />
Christoph Hess joined the Group’s head office in 1994 as<br />
Secretary of the Board of Directors and the Executive<br />
Board. In this capacity he also manages both the Group’s<br />
Legal and Insurance departments. He also managed<br />
Corporate Communications until August 2008. Christoph<br />
Hess holds a degree in law from the University of Basel<br />
and has been admitted to the bar in Switzerland.<br />
Alastair Robertson, Chief Human Resources Officer,<br />
British citizen. Born in 1960. Member of the Executive<br />
Board since April 2008. Responsible for Human Resources.<br />
Alastair Robertson joined the Group in 2007 as Head of<br />
Global Human Resources. Before joining Panalpina, he<br />
had been a Vice President at Tetra Pak since 1996, where<br />
he held various positions in the field of Human Resources:<br />
between 1999 and 2001 as Vice President Human<br />
Resources Americas and from 2002 to 2004 as Vice President<br />
Human Resources Europe and Africa. From 1992<br />
to 1996, he worked for W. H. Smith in the field of Personnel,<br />
Development and Training and between 1989 and<br />
1992 he was with Graham Builders Merchants as Manager<br />
Human Resources Management, Training and Development.<br />
He previously served in the military, where he attained the<br />
rank of Major and served in numerous countries. Alastair<br />
Robertson holds an MBA in Strategy and Marketing from<br />
the University of Huddersfield, Bradford (United Kingdom).<br />
He also attended the Royal School of Military Engineering<br />
and the Royal Military Academy in the United Kingdom.<br />
Karl Weyeneth, Chief Operating Officer, Swiss citizen.<br />
Born in 1964. Member of the Executive Board since April<br />
2008. Responsible for Air Freight, Ocean Freight, Logistics,<br />
Marketing and Sales and Business Processes and<br />
Quality.<br />
Karl Weyeneth joined the Group in 2007 as Regional CEO<br />
for North America, where he was responsible for the<br />
development and results of the subsidiaries in USA and<br />
Canada. He is a professional with profound leadership<br />
and management experience in logistics, including freight<br />
management, 3PL and contract logistics. Before joining<br />
Panalpina, he was President and CEO Americas of Hellmann<br />
Worldwide Logistics, Inc. (USA) and prior to this he<br />
was Executive Vice President and CFO of Danzas Management<br />
Latin America (USA), where he attained profound<br />
experience in all finance matters. He holds a Bachelor in<br />
Economics and Business Administration from the University<br />
of Berne, Switzerland.<br />
Responsibilities<br />
4.2 Other activities and vested interests<br />
Monika Ribar: Member of the Board of Directors of Logitech<br />
International SA, Romanel / Morges (Switzerland) and<br />
Sika AG, Baar (Switzerland).<br />
Marco Gadola: Member of the Board of Directors of<br />
Calida Holding AG, Sursee (Switzerland) and Luxair SA,<br />
Luxembourg.<br />
4.3 Management contracts<br />
No management contracts exist with any third party<br />
outside the Group.<br />
5 Compensation, shareholdings and loans<br />
5.1 Content and method of determining<br />
the compensation and the share-ownership<br />
programs<br />
The compensation and principles governing the Board of<br />
Directors Stock Award Plan, the Executive Board mid- and<br />
long-term incentive plans and the Management Incentive<br />
Plan for other senior management (excluding the Executive<br />
Board) are determined and approved by the Board of<br />
Directors based on the proposal of the Compensation and<br />
Nomination Committee. Further, the Committee regularly<br />
updates the Board of Directors during the Board of Directors<br />
meetings, applies for changes in the remuneration<br />
system as required and annually reports the bonus allocation<br />
of individual Executive Board members. Members of<br />
the Executive Board do not attend respective discussions<br />
regarding decisions related to their own remuneration.<br />
Remuneration of Executive Board members is benchmarked<br />
against regular market data surveys compiled<br />
through leading Executive Compensation consultants.<br />
The benchmark custom peer group is consisting of some<br />
of Panalpina's main competitors completed with some<br />
Swiss multinational companies with comparable size and<br />
geographical network reach in order to make the sample<br />
substantial enough.<br />
The members of the Board of Directors receive a fixed<br />
annual compensation. Moreover and introduced in 2009,<br />
part of each Board member’s remuneration is in free<br />
shares of the Company to the value of CHF 50,000. The<br />
corresponding number of shares is based on the share’s<br />
closing price on April 30, and has a one-year restriction<br />
period.<br />
The salary package for the members of the Executive<br />
Board consists of a fixed basic salary, lump sum vehicle<br />
Panalpina <strong>Annual</strong> <strong>Report</strong> <strong>2011</strong><br />
57
58<br />
Responsibilities<br />
and general expense allowances, additional pension contributions<br />
and a target bonus. 50 % of the target bonus<br />
depends on budgeted Group EBITDA and the achievement<br />
of the external financial guidance for the respective business<br />
year, whereas 50 % depends on the achievement of<br />
measurable individual performance targets. Individual performance<br />
targets are defined for the CEO by the Chairman<br />
and for other Executive Board members by the CEO.<br />
Each Executive Board member is subject to a formal<br />
performance appraisal process. For each reporting year,<br />
performance targets are jointly determined and a year-end<br />
performance assessment is carried out. The maximum<br />
target bonus of the CEO equals 100 % of the annual basic<br />
salary, whereas maximum target bonuses of other Executive<br />
Board members equal between 67 % and 80 % of their<br />
respective annual basic salaries depending on their function.<br />
All bonus payments are cut if the respective group or<br />
individual performance targets have not been reached.<br />
The Compensation and Nomination Committee annually<br />
reports to the Board of Directors on bonus payments to<br />
the members of the Executive Board.<br />
In 2009, the bonus scheme for Executive Board members<br />
was adjusted to focus on the Company’s sustainable midand<br />
long-term success. Only 60 % of the bonuses – which<br />
continue to be set by the achievement of annually reviewed<br />
Group KPIs and individual performance targets as outlined<br />
above – are paid out in cash, whereas the remainder<br />
is converted into PWTN shares with a one-year restriction<br />
period. The applicable share price for such deferred bonus<br />
shares is the PWTN closing price on April 30, in the first year<br />
of a three-year cycle (2009 to <strong>2011</strong>) which was CHF 62.50.<br />
The deferred bonus share price will thus be redefined on<br />
April 30, 2012. In addition, the number of such allocated<br />
deferred bonus shares is matched by the Company after<br />
twelve months (qualifying period during which the Executive<br />
Board member must remain with the Company) with a<br />
free PWTN share award which also has a one-year restriction<br />
period.<br />
Furthermore, each Executive Board member is participating<br />
in a Long-Term Incentive Plan Pool which rewards<br />
long-term value creation measured by economic profit.<br />
Under this plan, each year (as of 2009) 5 % of the year-onyear<br />
change in economic profit is added to the pool,<br />
whereas negative economic profit is deducted from the<br />
pool. At the end of a five-year plan cycle (2013) each Executive<br />
Board member is entitled to be paid out in cash an<br />
equal share of such pool. Vesting of this plan occurs after<br />
three years at 25 % (<strong>2011</strong>), after four years at 50 % and<br />
100 % after five years.<br />
Panalpina <strong>Annual</strong> <strong>Report</strong> <strong>2011</strong><br />
Due to the introduction of a new share program for the<br />
members of the Board of Directors and the Executive Board<br />
in 2009, neither the members of the Board of Directors<br />
nor the members of the Executive Board are eligible to participate<br />
in the Company’s Management Incentive Plan.<br />
Employment agreements with Executive Board members<br />
stipulate a notice period of twelve months. They do not<br />
contain “golden parachutes” in case of a change of control<br />
nor severance payments after termination of employment.<br />
Further information related to both overall and individual<br />
remuneration of the Board of Directors and Executive<br />
Board members as well as shares and options held by<br />
these persons at the closing date including a comparison<br />
with the previous year are reflected in the audited Notes<br />
to the Consolidated Financial Statements (pages 89 – 93<br />
and 115 – 118) according to article 663bbis of the Swiss<br />
Code of Obligations.<br />
Compared to the previous year, the annual compensation<br />
of the Board of Directors remained unchanged. The Board<br />
Stock Award Plan, which was introduced in 2009, has<br />
been applied for the business year <strong>2011</strong>.<br />
Overall compensation for the CEO increased in the reporting<br />
year due to a salary increase resulting in higher bonus<br />
potential and other related benefits.<br />
Compensation to other Executive Board members also<br />
increased due to salary increase for certain Executive Board<br />
functions and due to an increase of the maximum bonus<br />
payments to a new range of 67 % – 80 % depending on<br />
their function (2010: 50 % – 67 %).<br />
6 Shareholders’ participation<br />
6.1 Voting rights and representation restrictions<br />
Each share carries one vote at the General Meeting of<br />
Shareholders. The Articles state that when exercising voting<br />
rights, no shareholder may directly or indirectly represent<br />
more than 5 % of the total shares issued by the Company<br />
for own and represented shares.<br />
The Articles provide for group clauses.<br />
The voting right restrictions are not applicable to representatives<br />
of the corporate body (Organvertreter) as well as<br />
the independent proxy holder of voting rights (unabhängiger<br />
Stimmrechtsvertreter). In order to facilitate the exercise of<br />
voting rights of deposited shares, the Board of Directors is<br />
entitled to enter into agreements with banks which deviate<br />
from the voting restrictions.
The voting restrictions do not apply to the shares held by<br />
the Ernst Göhner Foundation, because it held PWT<br />
shares prior to the introduction of the voting restrictions<br />
(grandfathering).<br />
Any abolition or change of the provisions relating to the<br />
restrictions on voting rights requires a resolution of the<br />
General Meeting of Shareholders on which at least twothirds<br />
of the voting shares represented agree.<br />
A written proxy entitles a shareholder to be represented at<br />
the General Meeting of Shareholders by his or her legal<br />
representative, or by another shareholder with the right to<br />
vote, or by the representative of the corporate body<br />
(Organvertreter), or by the independent proxy holder of<br />
voting rights (unabhängiger Stimmrechtsvertreter) or by the<br />
proxy holder of deposited shares (Depotvertreter).<br />
6.2 Statutory quorums<br />
In principle, the legal rules on quorums apply. Supplementary<br />
to the quorums legally listed, a two-thirds majority<br />
of the shares represented at the General Meeting of Shareholders<br />
is required for the following resolutions:<br />
<br />
transfer restrictions;<br />
<br />
restriction of voting rights;<br />
<br />
shares;<br />
<br />
<br />
Directors;<br />
<br />
well as the repeal or relief of the stated quorum. A resolution<br />
to increase the quorum as set forth in the Articles<br />
must be based on the consent of the increased quorum.<br />
6.3 Convocation of the General Meeting<br />
of Shareholders<br />
There are no provisions deviating from the law.<br />
6.4 Agenda<br />
Shareholders who individually or together with other<br />
shareholders represent shares in the nominal value of<br />
CHF 1 million may request that an item be placed on<br />
the agenda. Such a request must be made in writing to<br />
PWT at least 60 days prior to the General Meeting of<br />
Shareholders.<br />
Responsibilities<br />
6.5 Inscriptions into the share register<br />
Registered shares can only be represented by shareholders<br />
(or nominees) who have been entered into the PWT share<br />
register. Shareholders (or registered nominees) who cannot<br />
personally attend the General Meeting of Shareholders are<br />
entitled to nominate a representative according to the provisions<br />
in the Articles, who represents them by written proxy.<br />
For the purpose of determining voting rights, the share<br />
register is closed for registration from the date upon which<br />
the General Meeting of Shareholders has been called<br />
(date of invitation) until the day after the General Meeting<br />
of Shareholders has taken place.<br />
7 Changes of control and defense measures<br />
7.1 Duty to make an offer<br />
No opting-out or opting-up provisions exist.<br />
7.2 Clauses on changes of control<br />
Neither the contracts of the members of the Board of<br />
Directors nor of the Executive Board have a change-ofcontrol<br />
clause.<br />
8 Auditors<br />
8.1 Duration of the mandate and term of office<br />
of the lead auditor<br />
The mandate to act as statutory and Group Auditors is<br />
assumed by KPMG, Zurich. The lead auditor, Regula<br />
Wallimann, took up office on May 6, 2008 for a seven-year<br />
term.<br />
8.2 Auditing fees<br />
According to financial accounting, invoices for auditing<br />
fees for the financial year amounted to CHF 2,999,000.<br />
Further KPMG invoiced CHF 49,000 for audit-related<br />
services.<br />
8.3 Additional fees<br />
The auditors KPMG were compensated an additional<br />
amount of CHF 1,204,000 for further services rendered in<br />
the financial year. KPMG was mandated in the reporting<br />
year in particular for tax consulting (CHF 1,129,000) and<br />
other non-audit related work (CHF 75,000).<br />
Panalpina <strong>Annual</strong> <strong>Report</strong> <strong>2011</strong><br />
59
60<br />
Responsibilities<br />
8.4 Informational instruments pertaining to<br />
the external audit<br />
The Group Auditors are supervised and controlled by the<br />
Audit Committee. The Group Auditors report to the Audit<br />
Committee and periodically the lead auditor participates in<br />
the meetings. During these meetings, the Group Auditors<br />
present a detailed audit plan for the current year including<br />
risk-based audit priorities, the audit scope, proposals regarding<br />
audit fees, organization and timing as well as updates<br />
and status of the results of the Internal Control System. In<br />
subsequent meetings they present interim audit findings<br />
with respective statements and recommendations later followed<br />
by a detailed audit report. Presentations also contain<br />
references to upcoming changes in legislation and IFRS.<br />
The main criteria for the selection of Group Auditors include<br />
independence, network capabilities, industry and IT experience<br />
of the audit team, a risk-based audit approach,<br />
a central process management as well as the integration<br />
of Corporate Audit and risk management functions. The<br />
Audit Committee annually assesses the performance of the<br />
Group Auditors and determines the audit fees (refer to<br />
section 3.5).<br />
9 Information policy<br />
Panalpina regularly updates its website at<br />
www.panalpina.com, informing the public of any major<br />
events, organizational changes and (quarterly) financial<br />
results. Press releases are accessible to all visitors to the<br />
website; alternatively, subscriptions can be made so that<br />
the latest press releases are automatically forwarded via<br />
e-mail. Furthermore, all publications such as the <strong>Annual</strong><br />
<strong>Report</strong> (including the Corporate Governance and Compensation<br />
<strong>Report</strong>), customer magazine and sales brochures<br />
are available online. The dates of the General Meeting of<br />
Shareholders as well as dates of publication of the quarterly<br />
financial results are printed in the <strong>Annual</strong> <strong>Report</strong> and<br />
appear in the Financial Calendar on the web site (under<br />
Investor Relations). The minutes of shareholder meetings<br />
are available online.<br />
www.panalpina.com / corpgov<br />
Panalpina <strong>Annual</strong> <strong>Report</strong> <strong>2011</strong>
Global <strong>Report</strong>ing Initiative<br />
www.panalpina.com / gri<br />
Responsibilities<br />
Panalpina <strong>Annual</strong> <strong>Report</strong> <strong>2011</strong><br />
61
62<br />
Consolidated and <strong>Annual</strong><br />
Financial Statements <strong>2011</strong><br />
Panalpina <strong>Annual</strong> <strong>Report</strong> <strong>2011</strong>
Contents<br />
Consolidated Financial Statements <strong>2011</strong><br />
Consolidated Income Statement 64<br />
Consolidated Statement of Comprehensive Income 65<br />
Consolidated Statement of Financial Position 66<br />
Consolidated Statement of Changes in Equity 67<br />
Consolidated Statement of Cash Flows 69<br />
Notes to the Consolidated Financial Statements 70<br />
Principal Group Companies and Participations 122<br />
<strong>Report</strong> of the Group Auditors 127<br />
Key Figures in CHF (five-year review) 128<br />
Consolidated Statement of Financial Position in CHF (five-year review) 130<br />
Key Figures in EUR (five-year review) 131<br />
Consolidated Statement of Financial Position in EUR 133<br />
<strong>Annual</strong> Financial Statements <strong>2011</strong> of Panalpina World Transport (Holding) Ltd.<br />
Income Statement 134<br />
Balance Sheet as of December 31 (before profit appropriation) 135<br />
Notes to the Financial Statements 136<br />
Appropriation of Available Earnings 140<br />
<strong>Report</strong> of the Statutory Auditors 141<br />
Panalpina <strong>Annual</strong> <strong>Report</strong> <strong>2011</strong><br />
63
64<br />
Consolidated Financial Statements <strong>2011</strong><br />
Consolidated Income Statement<br />
for the years ended December 31, <strong>2011</strong> and 2010<br />
in thousand CHF Notes <strong>2011</strong> 2010<br />
Forwarding services 7,925,993 8,675,826<br />
Customs, duties and taxes (1,426,345) (1,511,665)<br />
Net forwarding revenue 5 6,499,648 7,164,161<br />
Forwarding services from third parties 5 (5,022,599) (5,684,084)<br />
Gross profit 5 1,477,049 1,480,077<br />
Personnel expenses 6 (892,421) (890,937)<br />
Other operating expenses 9 (372,438) (527,051)<br />
(Losses)/gains on sales of non-current assets 10 (106) 277<br />
EBITDA 212,084 62,366<br />
Depreciation of property, plant and equipment 14 (28,484) (38,891)<br />
Amortization of intangible assets 15 (9,383) (8,113)<br />
Operating result (EBIT) 174,217 15,362<br />
Finance income 11 6,268 6,248<br />
Finance costs 11 (11,903) (15,488)<br />
Profit before income tax (EBT) 168,582 6,122<br />
Income tax expenses 12 (41,169) (32,119)<br />
Consolidated profit 127,413 (25,997)<br />
Consolidated profit attributable to:<br />
Owners of the parent 126,294 (27,350)<br />
Non-controlling interests 24 1,119 1,353<br />
Earnings per share (in CHF per share)<br />
Basic 13 5.34 (1.16)<br />
Diluted 13 5.33 (1.16)<br />
The notes on pages 70 to 125 are an integral part of these consolidated financial statements.<br />
Panalpina <strong>Annual</strong> <strong>Report</strong> <strong>2011</strong>
Consolidated Financial Statements <strong>2011</strong><br />
Consolidated Statement of Comprehensive Income<br />
for the years ended December 31, <strong>2011</strong> and 2010<br />
in thousand CHF Notes <strong>2011</strong> 2010<br />
Consolidated profit 127,413 (25,997)<br />
Other comprehensive income<br />
Available-for-sale financial assets 16 3,994 (1,828)<br />
Amounts recognized in equity for defined benefit post-employment plans<br />
– Actuarial gains (losses) 7 (23,297) (11,347)<br />
– Exchange difference 7 1,163 751<br />
Exchange difference on translations of foreign operations (11,238) (15,027)<br />
Income tax on components of other comprehensive income 12 5,296 5,289<br />
Other comprehensive income for the period, net of tax (24,082) (22,162)<br />
Total comprehensive income for the period 103,331 (48,159)<br />
Attributable to owners of the parent 102,416 (49,082)<br />
Attributable to non-controlling interests 24 915 923<br />
The notes on pages 70 to 125 are an integral part of these consolidated financial statements.<br />
Panalpina <strong>Annual</strong> <strong>Report</strong> <strong>2011</strong><br />
65
66<br />
Consolidated Financial Statements <strong>2011</strong><br />
Consolidated Statement of Financial Position<br />
as at December 31, <strong>2011</strong> and 2010<br />
Assets<br />
in thousand CHF Notes <strong>2011</strong> 2010<br />
Non-current assets<br />
Property, plant and equipment 14 113,180 113,833<br />
Intangible assets 15 141,743 78,091<br />
Investments 16 72,256 34,843<br />
Derivative financial instruments 21 459 0<br />
Post-employment benefit assets 7 0 10,312<br />
Deferred income tax assets 27 62,313 65,871<br />
Total non-current assets 389,951 302,950<br />
Current assets<br />
Other receivables and other current assets 19 84,997 97,957<br />
Unbilled forwarding services 77,346 74,742<br />
Trade receivables 20 984,404 958,114<br />
Derivative financial instruments 21 5,045 20,454<br />
Other current financial assets 22 20,000 6,089<br />
Cash and cash equivalents 22 573,579 528,936<br />
Total current assets 1,745,371 1,686,292<br />
Total assets 2,135,322 1,989,242<br />
Liabilities and equity<br />
in thousand CHF Notes <strong>2011</strong> 2010<br />
Equity<br />
Share capital 23 50,000 50,000<br />
Treasury shares 23 (197,278) (196,003)<br />
Reserves 1,053,086 950,282<br />
Total equity attributable to owners of the parent 905,808 804,279<br />
Non-controlling interests 24 9,082 7,890<br />
Total equity 914,890 812,169<br />
Non-current liabilities<br />
Borrowings 25 231 403<br />
Provisions 26 85,032 112,579<br />
Post-employment benefit liabilities 7 47,151 40,671<br />
Derivative financial instruments 21 0 539<br />
Deferred income tax liabilities 27 14,492 20,745<br />
Total non-current liabilities 146,906 174,937<br />
Current liabilities<br />
Trade payables 588,104 521,207<br />
Other payables and accruals 144,354 134,264<br />
Accrued cost of services 184,519 174,840<br />
Borrowings 25 7,296 9,335<br />
Derivative financial instruments 21 4,648 4,993<br />
Provisions and other liabilities 28 125,420 141,053<br />
Current income tax liabilities 19,185 16,444<br />
Total current liabilities 1,073,526 1,002,136<br />
Total liabilities 1,220,432 1,177,073<br />
Total equity and liabilities 2,135,322 1,989,242<br />
The notes on pages 70 to 125 are an integral part of these consolidated financial statements.<br />
Panalpina <strong>Annual</strong> <strong>Report</strong> <strong>2011</strong>
Consolidated Statement of Changes in Equity<br />
for the year ended December 31, <strong>2011</strong><br />
in thousand CHF<br />
Notes<br />
Share<br />
capital<br />
Attributable to the owners of the parent<br />
Treasury<br />
shares<br />
Other<br />
reserves<br />
Translation<br />
reserve<br />
Retained<br />
earnings<br />
Consolidated Financial Statements <strong>2011</strong><br />
Total<br />
Non-<br />
controlling<br />
interests<br />
Balance on January 1, <strong>2011</strong> 50,000 (196,003) (108,862) (151,070) 1,210,214 804,279 7,890 812,169<br />
Consolidated profit 126,294 126,294 1,119 127,413<br />
Total<br />
equity<br />
Available-for-sale financial assets<br />
Amounts recognized in equity for<br />
defined benefit post-employment plans<br />
16 3,994 3,994 3,994<br />
– Actuarial gains (losses) 7 (23,297) (23,297) (23,297)<br />
– Exchange difference<br />
Exchange difference on translations<br />
7 1,163 1,163 1,163<br />
of foreign operations<br />
Income tax on components<br />
(11,034) (11,034) (204) (11,238)<br />
of other comprehensive income<br />
Total comprehensive income<br />
12 5,296 5,296 5,296<br />
for the period 0 0 (12,844) (11,034) 126,294 102,416 915 103,331<br />
Dividends paid<br />
Share-based payments<br />
24 0 0 (46) (46)<br />
employee share plan<br />
Share-based payments<br />
8 1,255 1,255 1,255<br />
option plan 8 662 662 662<br />
Changes in treasury shares, net (1,274) (1,530) (2,804) (2,804)<br />
Acquired non-controlling interests 24 0 0 323 323<br />
Balance on December 31, <strong>2011</strong> 50,000 (197,277) (121,706) (162,104) 1,336,895 905,808 9,082 914,890<br />
The notes on pages 70 to 125 are an integral part of these consolidated financial statements.<br />
Panalpina <strong>Annual</strong> <strong>Report</strong> <strong>2011</strong><br />
67
68<br />
Consolidated Financial Statements <strong>2011</strong><br />
Consolidated Statement of Changes in Equity<br />
for the year ended December 31, 2010<br />
in thousand CHF<br />
Panalpina <strong>Annual</strong> <strong>Report</strong> <strong>2011</strong><br />
Notes<br />
Share<br />
capital<br />
Attributable to the owners of the parent<br />
Treasury<br />
shares<br />
Other<br />
reserves<br />
Translation<br />
reserve<br />
Retained<br />
earnings<br />
Total<br />
Non-<br />
controlling<br />
interests<br />
Balance on January 1, 2010 50,000 (192,567) (101,723) (136,473) 1,237,327 856,564 7,015 863,579<br />
Consolidated profit (27,350) (27,350) 1,353 (25,997)<br />
Total<br />
equity<br />
Available-for-sale financial assets<br />
Amounts recognized in equity for<br />
defined benefit post-employment plans<br />
16 (1,828) (1,828) (1,828)<br />
– Actuarial gains (losses) 7 (11,347) (11,347) (11,347)<br />
– Exchange difference<br />
Exchange difference on translations<br />
7 751 751 751<br />
of foreign operations<br />
Income tax on components<br />
(14,597) (14,597) (430) (15,027)<br />
of other comprehensive income<br />
Total comprehensive income<br />
12 5,289 5,289 5,289<br />
for the period 0 0 (7,135) (14,597) (27,350) (49,082) 923 (48,159)<br />
Dividends paid<br />
Share-based payments<br />
24 0 0 (52) (52)<br />
employee share plan<br />
Share-based payments<br />
8 676 676 676<br />
option plan 8 1,540 1,540 1,540<br />
Changes in treasury shares, net (3,436) (1,979) (5,415) (5,415)<br />
Reclassification non-controlling interests 24 (4) (4) 4 0<br />
Balance on December 31, 2010 50,000 (196,003) (108,862) (151,070) 1,210,214 804,279 7,890 812,169<br />
The notes on pages 70 to 125 are an integral part of these consolidated financial statements.
Consolidated Statement of Cash Flows<br />
for the years ended December 31, <strong>2011</strong> and 2010<br />
Consolidated Financial Statements <strong>2011</strong><br />
in thousand CHF Notes <strong>2011</strong> 2010<br />
Profit for the period 127,413 (25,997)<br />
Income tax expenses 12 41,169 32,119<br />
Depreciation of property, plant and equipment 14 28,484 38,891<br />
Amortization of intangible assets 15 9,383 8,113<br />
Finance income and dividend on available-for-sale financial assets 11 (6,268) (6,078)<br />
Interest expenses 11 5,932 5,516<br />
Exchange differences 11 2,840 609<br />
(Losses)/gains on sales of property, plant and equipment 10 106 (277)<br />
Equity-settled share-based payment transactions 8 2,936 2,281<br />
Other non-cash expenses (869) 9,791<br />
Working capital adjustments:<br />
211,126 64,968<br />
(Increase)/decrease receivables and other current assets (21,893) (208,859)<br />
Increase/(decrease) payables, accruals and deferred income 89,262 133,890<br />
(Decrease)/increase long-term provisions (15,508) 48,980<br />
(Decrease)/increase short-term provisions and other liabilities (33,915) 36,287<br />
Cash generated from operations 229,072 75,266<br />
Interest paid (2,577) (5,198)<br />
Income taxes paid (32,996) (33,031)<br />
Net cash from operating activities 193,499 37,037<br />
Interest received 4,695 5,206<br />
Dividends received 11 172 99<br />
Proceeds from sales of PPE 1,633 3,009<br />
Proceeds from investments held for trading 12 0<br />
Proceeds from sales of securities 0 150<br />
Loan and receivables repayments 1,148 7,586<br />
Repayment of other financial assets 1,927 1,345<br />
Purchase of property, plant and equipment (30,715) (28,173)<br />
Acquisition of subsidiary, net of cash acquired 30 (59,986) (2,384)<br />
Purchase of intangible assets and other assets (19,648) (13,967)<br />
Purchase of investments held for trading (13,840) 0<br />
Purchase of other financial assets (36,954) (3,663)<br />
Net cash used in investing activities (151,556) (30,792)<br />
Free cash flow 41,943 6,245<br />
Proceeds of short- and long-term borrowings 142 2,831<br />
Repayment of short- and long-term borrowings 0 (5,228)<br />
Dividends paid to non-controlling interests 24 (46) (52)<br />
Purchase of treasury shares (8,617) (10,540)<br />
Sale of treasury shares 4,685 4,865<br />
Net cash used in financing activities (3,836) (8,124)<br />
Effect of exchange rate changes on cash and cash equivalents 6,536 (988)<br />
Net increase (decrease) in cash and cash equivalents 44,643 (2,867)<br />
Cash and cash equivalents at the beginning of the year 22 528,936 531,803<br />
Cash and cash equivalents at the end of the year 22 573,579 528,936<br />
The notes on pages 70 to 125 are an integral part of these consolidated financial statements.<br />
Panalpina <strong>Annual</strong> <strong>Report</strong> <strong>2011</strong><br />
69
70<br />
1<br />
2<br />
3<br />
Consolidated Financial Statements <strong>2011</strong><br />
Notes to the Consolidated Financial Statements<br />
General information<br />
Panalpina World Transport (Holding) Ltd. (referred to hereafter as the Company) and its subsidiaries is one of the world’s leading<br />
providers of supply chain solutions, combining intercontinental Air and Ocean Freight with comprehensive Value-Added Logistic Services<br />
and Supply Chain Services. Thanks to its in-depth industry know-how and customized IT systems, Panalpina provides globally integrated<br />
end-to-end solutions tailored to its customers’ supply chain management needs.<br />
Panalpina World Transport (Holding) Ltd. is a limited company incorporated and domiciled in Basel. The registered address is Viaduktstrasse<br />
42, 4002 Basel, Switzerland. The Company shares are publicly traded and are listed on the SIX Swiss Exchange in Zurich.<br />
The consolidated financial statements for the year ending December 31, <strong>2011</strong> were authorized for issuance in accordance with a resolution<br />
by the Board of Directors on March 2, 2012.<br />
Summary of significant accounting policies<br />
Basis of preparation of the consolidated financial statements<br />
The principal accounting policies applied in the preparation of these consolidated financial statements are set out below. The consolidated<br />
financial statements of the Company as at and for the year ended December 31, <strong>2011</strong> comprise the Company and its affiliates (together<br />
referred to as the Group and individually as Group entities).<br />
Statement of compliance<br />
The consolidated financial statements are based on the accounts of the individual subsidiaries on December 31, which have been drawn<br />
up according to uniform Group accounting principles. The consolidated accounts have been prepared in accordance with the International<br />
Financial <strong>Report</strong>ing Standards (IFRS) and comply with Swiss law.<br />
Basis of measurement<br />
The consolidated financial statements have been prepared under the historical cost basis, except for available-for-sale financial assets,<br />
financial assets and financial liabilities (including derivative instruments) at fair value through profit and loss and liabilities for cash-settled<br />
share-based payment arrangements which have been measured at fair value. Defined benefit assets are recognized at the net total of the<br />
plan assets plus unrecognized past-service costs and unrecognized actuarial losses and the present value of the defined benefit<br />
obligation.<br />
The methods used to measure fair values are discussed further in note 3.<br />
Presentation currency<br />
The consolidated financial statements are presented in Swiss francs (CHF) which is the functional currency of the Company and all values<br />
are rounded to the nearest thousand except where otherwise indicated.<br />
Use of estimates and judgments<br />
The preparation of the consolidated financial statements in conformity with IFRS requires management to make judgments, estimates and<br />
assumptions that affect application of accounting policies and the reported amounts of assets, liabilities, income and expenses. It requires<br />
management to exercise its judgments and assumptions in the process of applying the Group’s accounting policies. Actual results may<br />
differ from these estimates. Estimates and underlying assumptions are reviewed on an ongoing basis. Deviations from estimates and<br />
judgments are recognized in the period in which the estimates are revised and in any future periods affected.<br />
The areas involving a higher degree of judgment or complexity, or areas in which assumptions and estimates are significant to the consolidated<br />
financial statements, are disclosed in note 4.<br />
Significant accounting policies<br />
The accounting policies set out below have been applied consistently to all periods presented in these consolidated financial statements,<br />
and have been applied consistently by Group entities, unless otherwise stated. If necessary, comparative amounts have been reclassified<br />
to conform with the current year’s presentation.<br />
Effective from January 1, <strong>2011</strong>, the Group adopted the revised standard IAS 24 “Related Party Disclosures” as well as the amendments to<br />
IAS 32 “Financial Instruments: Presentation – Classification of Rights Issues” and IFRIC 14 “The Limit on a Defined Benefit Asset, Minimum<br />
Funding Requirements and their Interaction – Prepayments of a Minimum Funding Requirement.”<br />
Panalpina <strong>Annual</strong> <strong>Report</strong> <strong>2011</strong>
Consolidated Financial Statements <strong>2011</strong><br />
IAS 24 (revised) “Related Party Disclosures”<br />
The revised standard supersedes IAS 24 “Related Party Disclosures”, issued in 2003. IAS 24 (revised) is mandatory for periods<br />
beginning on or after January 1, <strong>2011</strong>. The revised standard provides a simplified definition of related parties by clarifying its intended<br />
meaning and eliminating inconsistencies from the definition. The adoption of the revised standard did not impact on the financial<br />
statements of the Group.<br />
IAS 32 (amendment) “Financial Instruments: Presentation – Classification of Rights Issues”<br />
The amendment applies to annual periods beginning on or after February 1, 2010. The amendment addresses the accounting for rights<br />
issues that are denominated in a currency other than the functional currency of the issuer. Provided certain conditions are met, such<br />
rights issues are now classified as equity regardless of the currency in which the exercise price is denominated. Previously, these issues<br />
had to be accounted for as derivative liabilities. The amendment applies retrospectively in accordance with IAS 8 “Accounting Policies,<br />
Changes in Accounting Estimates and Errors.” As Panalpina has no rights issues, the adoption of this amendment did not have any<br />
impact on the consolidated financial statement.<br />
IFRIC 14 (amendment) “The Limit on a Defined Benefit Asset, Minimum Funding Requirements and Their Interaction – Prepayment<br />
of a Minimum Funding Requirements”<br />
The amendment corrects an unintended consequence of IFRIC 14 “IAS 19 – The Limit on a Defined Benefit Asset, Minimum Funding<br />
Requirements and Their Interaction.” Without the amendment, entities are not permitted to recognize some voluntary prepayments<br />
for minimum funding contributions as an asset. With this amendment this has been revoked and should be applied retrospectively to<br />
the earliest comparative period presented. The adoption of this amendment did not impact on the financial statements of the Group.<br />
In addition, the IASB issued amendments to its standards in May 2010, primarily with a view to remove inconsistencies and clarifying<br />
the wording. There are separate transitional provisions for each standard. The adoption of the amendments resulted in changes to the<br />
accounting policies but did not have any significant impact on the financial position or performance of the Group.<br />
The following new or revised standards, amendments to standards and interpretations that have been published are mandatory for the<br />
Group’s accounting periods beginning on or after January 1, 2012 or for later periods, but the Group has not yet adopted them:<br />
IFRS 7 (amended) “Disclosures – Transfers of Financial Assets”<br />
In October 2010 the IAS issued “Disclosures – Transfers of Financial Assets” (amendments to IFRS 7) with an effective date of July 1, <strong>2011</strong>.<br />
Panalpina is in the process of analyzing the impact of the amendments to IFRS 7.<br />
IFRS 9 “Financial instruments”<br />
Addresses the classification, measurement and recognition of financial assets and financial liabilities. IFRS 9 was issued in November<br />
2009 and October 2010. It replaces the parts of IAS 39 that relate to the classification and measurement of financial instruments. IFRS<br />
9 requires financial assets to be classified into two measurement categories: those measured as at fair value and those measured at<br />
amortized cost. The determination is made at initial recognition. The classification depends on the entity’s business model for managing<br />
its financial instruments and the contractual cash flow characteristics of the instrument. For financial liabilities, the standard retains<br />
most of the IAS 39 requirements. The main change is that, in cases where the fair value option is taken for financial liabilities, the part<br />
of a fair value change due to an entity’s own credit risk is recorded in other comprehensive income rather than the income statement,<br />
unless this creates an accounting mismatch. The Group is yet to assess IFRS 9’s full impact and intends to adopt IFRS 9 no later than<br />
the accounting period beginning on or after January 1, 2015.<br />
IFRS 10 “Consolidated Financial statements”<br />
The new standard creates a uniform definition regarding the concept of control thus setting a uniform basis for the existence of a<br />
parent-subsidiary relationship and the related definition of the scope of consolidation. The Group is yet to assess IFRS 10’s full impact<br />
and intends to adopt IFRS 10 no later than the accounting period beginning January 1, 2013.<br />
IFRS 11 “Joint Arrangements”<br />
IFRS 11 addresses joint arrangements distinguishing between arrangements where an entity exercises joint control over a joint venture<br />
or joint operation and the accounting of such. The new Standard supersedes IAS 31 “Interests in Joint Ventures” and SIC-13 “Jointly<br />
Controlled Entities – Non-Monetary Contributions by Venturers” as the henceforth relevant provisions addressing issues of accounting<br />
for jointly held entities. The Group is yet to assess IFRS 11’s full impact and intends to adopt IFRS 11 no later than the accounting<br />
period beginning January1, 2013.<br />
IFRS 12 “Disclosure of interests in other entities”<br />
Includes the disclosure requirements for all forms of interests in other entities, including joint arrangements, associates, special purpose<br />
vehicles and other off balance sheet vehicles. The Group is yet to assess IFRS 12’s full impact and intends to adopt IFRS 12 no later<br />
than the accounting period beginning on or after January 1, 2013.<br />
Panalpina <strong>Annual</strong> <strong>Report</strong> <strong>2011</strong><br />
71
72<br />
Consolidated Financial Statements <strong>2011</strong><br />
IFRS 13 “Fair value measurement”<br />
The aim of the standard is to improve consistency and to reduce complexity by providing a precise definition of fair value and a single<br />
source of fair value measurement and disclosure requirements across all IFRS standards. The requirements, which are largely aligned<br />
between IFRS and US GAAP, do not extend the use of fair value accounting but provide guidance on how it should be applied where<br />
its use is already required or permitted by other standards within IFRS or US GAAP. The Group is yet to assess IFRS 13’s full impact<br />
and to adopt IFRS 13 no later than the accounting period beginning on or after January 1, 2013.<br />
Amendments to IAS 1 “Presentation of Financial Statements”<br />
In June <strong>2011</strong> the IASB issued Presentation of items of Other Comprehensive Income (amendments to IAS 1) “Presentation of Financial<br />
Statements” with an effective date of July 1, 2012. The Group is yet to assess the amendments impact.<br />
Amendments to IAS 12 “Deferred Tax – Recovery of Underlying Assets”<br />
In December 2010 the IASB issued Deferred Tax: “Recovery of Underlying Assets” - Amendments to IAS 12. The Amendment offers<br />
a partial clarification of the treatment of timing differences arising in connection with the application of the fair-value model of IAS 40.<br />
In the case of real estate held for investment purposes, it is often difficult to assess whether existing differences will reverse through<br />
continued use or as a result of a sale. The amendment to IAS 12 provides that reversal in principle occurs as a result of a sale. As a<br />
consequence of the amendment, SIC 21 “Income Taxes – Recovery of Revalued Depreciable Assets” shall no longer be effective for<br />
real estate held for investment purposes measured at fair value. The Group anticipates no impact on its financial statements in applying<br />
this amendment, which will become effective for accounting periods on or after January 1, 2012.<br />
IAS 19 “Employee benefits”<br />
The standard was amended in June <strong>2011</strong>. As the Group already eliminated the corridor approach and recognized all actuarial gains and<br />
losses in Other Comprehensive Income (OCI) as they occurred and already recognized all past service costs the impact on Group l<br />
evel will only be the replacement of interest costs, and the expected return on plan assets with a net interest amount that is calculated<br />
by applying the discount rate to the net defined benefit liability (asset). In addition the amendments require additional disclosures.<br />
The Group is yet to assess the full impact of the amendments. The amendments are mandatory for periods beginning on or after<br />
January 1, 2012.<br />
IAS 27 “Consolidated and Separate Financial Statements”<br />
IAS 27 will be renamed from “Consolidated and Separate Financial Statements” to “Separate Financial Statements” and henceforth<br />
shall apply only to entities preparing stand-alone financial statements in accordance with IFRS. The new standard has no impact on the<br />
Group as it does not prepare stand-alone financial statements in accordance with IFRS.<br />
IAS 28 “Investments in Associates”<br />
In the amendments to IAS 28, the content of the provisions governing the accounting for shares in associates and joint ventures is<br />
expanded. The Group is yet to assess full impact of this amendment and intends to adopt the amendment no later than the accounting<br />
period beginning January 1, 2013.<br />
Amendments to IAS 32 “Financial Instruments: Presentation” and IFRS 7 “Financial Instruments: Disclosures – Offsetting of<br />
Financial Assets and Financial Liabilities”<br />
The preconditions set out in IAS 32 regarding the set-off are set out in additional application guidelines. The Amendments to IFRS 7<br />
concern new disclosure requirements in connection with certain netting agreements. The Group is yet to assess full impact of these<br />
amendments and intends to adopt the amendments no later than the accounting period beginning January 1, 2014.<br />
There are no other IFRS or IFRIC interpretations that are not yet effective and would be expected to have a material impact on the Group.<br />
Basis of consolidation<br />
Consolidation policy<br />
The subsidiaries are those companies controlled directly or indirectly, by Panalpina World Transport (Holding) Ltd., where control is defined<br />
as the power to govern the financial and operating policies of an enterprise so as to obtain benefits from its activities. This control is<br />
normally evidenced when the Group owns, either directly or indirectly, more than one half of the voting rights or currently exercisable<br />
potential voting rights of a company’s share capital. Inter-company balances, transactions and resulting unrealized income are eliminated<br />
in full. Changes in ownership interests in subsidiaries are accounted for as equity transactions if they occur after control has already been<br />
obtained and if they do not result in a loss of control.<br />
The Group uses the acquisition method of accounting to account for business combinations. The consideration transferred for the acquisition<br />
of a subsidiary is determined by the fair values of the assets transferred, the liabilities incurred to previous owners and the equity<br />
interests issued by the Group. The consideration transferred includes the fair value of any asset or liability resulting from a contingent<br />
consideration arrangement. Acquisition-related costs are expensed as incurred. Identifiable assets acquired and liabilities assumed in a<br />
business combination are measured initially at their fair value at acquisition date. On an acquisition by acquisition basis, the Group recognizes<br />
any non-controlling interest in the acquiree either at fair value or at the non-controlling interest’s proportionate share of the acquiree’s<br />
net assets. Investments are accounted for at cost less impairment. Cost is adjusted to reflect changes in consideration arising from<br />
contingent consideration amendments. Cost also includes direct attributable costs of investment.<br />
Panalpina <strong>Annual</strong> <strong>Report</strong> <strong>2011</strong>
Consolidated Financial Statements <strong>2011</strong><br />
The excess of the consideration transferred, the amount of any non-controlling interest in the acquiree and the acquisition date fair value<br />
of any previous equity interest in the acquiree over the fair value of the Group’s share of the identifiable net assets acquired are recorded<br />
as goodwill. If this is less than the fair value of the net assets of the subsidiary acquired in the case of bargain purchase, the difference is<br />
recognized directly in the statement of comprehensive income.<br />
The Group treats transactions with non-controlling interests as transactions with equity owner of the Group. For purchases from-noncontrolling<br />
interest, the difference between any consideration paid and the relevant share acquired of the carrying value of net assets of the<br />
subsidiary is recorded in equity. Gains or losses on disposals to non-controlling interests are also recorded in equity.<br />
When the Group ceases to have significant influence, any retained interest in the entity is re-measured to its fair value, with the change in<br />
carrying amount recognized in profit or loss. The fair value is the initial carrying amount for the purposes of subsequent accounting for<br />
the retained interest as an associate, joint venture or financial asset. Any amounts previously recognized in other comprehensive income in<br />
respect of that entity are accounted for as if the Group had directly disposed of the related assets or liabilities. The amounts previously<br />
recognized in other comprehensive income are reclassified to profit or loss.<br />
Associates are all entities over which the Group has significant influence, but where it does not have control, generally accompanying a<br />
shareholding of business between 20 % and 50 % of the voting rights. Investments in associates are accounted for using the equity<br />
method of accounting and are initially recognized at cost. The Group’s investment in associates includes goodwill identified on acquisition,<br />
net of any accumulated impairment losses.<br />
The Group’s share of its associates’ post-acquisition profits or losses is recognized in the income statement, and its share of post-acquisition<br />
movements is recognized in reserves. The cumulative post-acquisition movements are adjusted against the carrying amount of the<br />
investment. When the Group’s share of losses in an associate equals or exceeds its interest in the associate, including any other unsecured<br />
receivables, the Group does not recognize further losses unless it has incurred obligations or made payments on behalf of the associate.<br />
Unrealized gains on transactions between the Group and its associates are eliminated to the extent of the Group’s interest in the associates.<br />
Unrealized losses are also eliminated unless the transaction provides evidence of an impairment of the asset transferred. Dilution gains<br />
and losses arising in investments in associates are recognized in the income statement.<br />
Operating segment information<br />
The determination of the Group’s operating segments is based on the organization units for which information is reported to the Group’s<br />
management. The Group is primarily organized by regions and has four reportable segments: Europe, Middle East, Africa and CIS, North<br />
America, Central and South America and Asia Pacific. Each reportable segment offers the same products and services. The Executive<br />
Board reviews monthly the Group’s internal reporting in order to assess performance and allocate resources. Performance is measured<br />
based on gross profit and operating result (EBIT). Income tax expenses, finance income and costs as well as special items are not<br />
assessed by segment. Certain headquarter activities are reported as Corporate. These consist of corporate headquarters, including the<br />
Corporate Executive Committee, Corporate Communications, Corporate Operations, Corporate Human Resources, Corporate Finance,<br />
including Treasury, Taxes and Pension Fund Management.<br />
Transfer prices between operating segments are set out at arm’s-length basis. Operating assets and liabilities consist of property, plant<br />
and equipment, goodwill and intangible assets, trade receivables/payables, other assets and liabilities such as provisions and current<br />
income taxes, which can be reasonably attributed to the reported operating segments. Non-operating assets and liabilities mainly include<br />
deferred income tax balances, post-employment benefit assets/liabilities and financial assets/liabilities such as marketable securities<br />
and investments.<br />
Foreign currency<br />
Functional currency<br />
Most Group companies use their local currency as their functional currency. Certain Group companies use other currencies (such as US<br />
dollars or euros) as their functional currency where this is the currency of the primary economic environment in which the entity or branch<br />
operates.<br />
Transactions and balances<br />
Local transactions in other currencies are initially reported using the exchange rate at the date of the transaction or reporting date. Gains<br />
and losses from the settlement of such transactions and gains and losses on transactions of monetary assets and liabilities denominated<br />
in other currencies are included in the income statement, except when they arise on monetary items that, in substance, form part of the<br />
Group’s net investment in a foreign entity. In such cases the gains and losses are deferred into other comprehensive income.<br />
Non-monetary items that are measured in terms of historical cost in foreign currency are translated using the exchange rate as of the dates<br />
of the initial transaction. Non-monetary items measured at fair value in a foreign currency are translated using the exchange rates on the<br />
date on which the fair value is determined.<br />
Changes in fair value of securities denominated in foreign currency classified as available-for-sale are split into components resulting from<br />
changes in the amortized cost of the security and other changes in the carrying amount of the security. Foreign exchange remeasurement<br />
differences related to changes in amortized cost are recognized in profit or loss, and other changes in the carrying amount are recognized<br />
in equity.<br />
Panalpina <strong>Annual</strong> <strong>Report</strong> <strong>2011</strong><br />
73
74<br />
Consolidated Financial Statements <strong>2011</strong><br />
Presentation currency<br />
Upon consolidation, assets and liabilities of Group companies using functional currency other than Swiss francs are translated into Swiss<br />
francs using a year-end rate of exchange. Income, expenses and net income and cash flows are translated at the average rates of<br />
exchange for the year. Translation differences due to the changes in exchange rates between the beginning and the end of the year and<br />
the difference between net incomes translated at the average and year-end exchange rates are recognized as a separate component<br />
of other comprehensive income.<br />
The income and expenses of foreign operations in hyperinflationary economies are translated to Swiss francs at the exchange rate on the<br />
reporting date. Prior to translating the financial statement of foreign operations in hyperinflationary economies, their financial statements<br />
are restated to account for changes in the general purchasing power of the local currency. The restatement is based on relevant price indices<br />
on the reporting date. Foreign currency differences are recognized directly in comprehensive income in the foreign currency translation<br />
reserve.<br />
On disposal of a foreign entity, the identified cumulative currency translation differences within equity relating to that foreign entity are<br />
recognized in the income statement as part of the gain or loss on divestment.<br />
Any goodwill arising on the acquisition is treated as assets and liabilities of the foreign operation and translated at the closing rate.<br />
The most important exchange rates used in the reported financial statements are:<br />
Panalpina <strong>Annual</strong> <strong>Report</strong> <strong>2011</strong><br />
Statement of<br />
Financial<br />
Position<br />
<strong>2011</strong> 2010<br />
Income<br />
Statement<br />
Statement of<br />
Financial<br />
Position<br />
Income<br />
Statement<br />
EUR 1.21628 1.23080 EUR 1.25134 1.37870<br />
USD 0.94082 0.88478 USD 0.93670 1.04137<br />
HKD 0.12114 0.11366 HKD 0.12049 0.13403<br />
CNY 0.14950 0.13690 CNY 0.14177 0.15385<br />
CAD 0.92165 0.89488 CAD 0.93820 1.01107<br />
GBP 1.45278 1.41844 GBP 1.45170 1.60781<br />
Revenue recognition<br />
Net forwarding revenue includes amounts received, receivables and unbilled forwarding services for forwarding performed for customers<br />
after deducting trade discounts and volume rebates and excluding sales taxes and value-added taxes less charges for customs and duty.<br />
Trade discounts and volume rebates are recorded on an accrual basis consistent with recognition of the related revenue recorded as a<br />
deduction for accounts receivable or as accrued liabilities. Such estimates are based on analyses of existing contractual obligations,<br />
historical trends and the Group’s experience.<br />
Net forwarding revenue is recognized at the time the services are performed. Logistics projects with a longer period of delivery are<br />
recognized at the stage of completion of the services on the reporting date. The stage of completion is assessed in reference to completion<br />
of the specific transaction assessed on the basis of the actual service provided as a proportion of the total services to be provided.<br />
Where necessary, single transactions are split into separately identifiable components to reflect the substance of the transaction. Conversely,<br />
two or more transactions may be considered together for revenue recognition purposes, where the commercial effect cannot be understood<br />
without reference to the series of transactions as a whole.<br />
Gross profit includes net forwarding revenue from services rendered less related expenses for services provided by third parties net of<br />
customs, duty and taxes.<br />
Interest income is recognized as interest accrued using the effective interest method. Interest income is included in finance income in the<br />
income statement.<br />
Dividends are recognized when the Group’s right to receive the payment is established.<br />
Forwarding services from third parties<br />
Forwarding services from third parties includes the corresponding direct services costs and related services costs rendered by a third<br />
party. Trade discounts and volume rebates are recorded on an accrual basis consistent with the recognition of the related services.<br />
Employee benefits<br />
Wages, salaries, social security contributions, paid annual leave, sick leave and other benefits are paid or accrued undiscounted in the<br />
year in which the associated services are rendered by employees of the Group. Legal or constructive obligations such as bonus or profitsharing<br />
plans are recognized for the amount expected to be paid in the year in which the services are provided.
Consolidated Financial Statements <strong>2011</strong><br />
Termination benefits are recognized as an expense when the Group is demonstrably committed, without realistic possibility of withdrawal,<br />
to a formal detailed plan to either terminate employment before the normal retirement date, or to provide termination benefits as a result<br />
of an offer made to voluntary redundancy. Termination benefits for voluntary redundancies are recognized as expenses if the Group has<br />
made an offer of voluntary redundancy and it is probable that the offer will be accepted. If benefits are payable more than twelve months<br />
after the reporting date, then they are discounted to their present value.<br />
Pension obligation<br />
Most employees are covered by defined benefit and defined contribution post-employment plans sponsored by the Group companies.<br />
The schemes are generally funded through payments to insurance companies or trustee-administrated funds. The Group’s contributions to<br />
defined contribution plans are recognized in the income statement within the operating results when they are due. The Group has no legal<br />
or constructive obligation to pay further contributions.<br />
The asset and liability recognized in the statement of financial position in regard to defined benefit pension plans is the present value of the<br />
defined benefit obligation at the statement of financial position date less the fair value of plan assets, together with adjustments for unrecognized<br />
past-services costs. The accounting and reporting of defined benefit plans are based on recent actuarial valuations. The defined<br />
benefit obligations and service costs are calculated using the projected unit credit method. This reflects services rendered by employees<br />
to the date of valuation and incorporates actuarial assumptions primarily regarding discount rates used in determining the present value of<br />
benefits, projected rates of remuneration growth and long-term expected rates of return for plan assets using the interest rates of highquality<br />
corporate bonds that are denominated in the currency in which the benefits will be paid and which have maturity dates approximating<br />
the terms of the related pension liability. Past services costs are recognized immediately in the income statement, unless the changes<br />
to the pension plans are conditional on the employees remaining in service for a specified period of time. In this case post service costs<br />
are amortized on a straight-line basis over the vesting period.<br />
Actuarial gains and losses, which consist of differences between assumptions and actual experiences and the effects of changes in<br />
actuarial assumptions, are recorded in equity in other comprehensive income in the period in which they arise.<br />
Pension assets and liabilities in different defined benefit plans are not offset against each other unless the Group has a legally enforceable<br />
right to use the surplus in one plan to settle obligations in the other plan. The recognition of pension assets is limited to the present value<br />
of any future refunds from the plans or reductions in future contributions to the plans and any cumulative unrecognized past service costs.<br />
Adjustments arising from the limit on the recognition of assets for defined benefit plans are charged in equity in other comprehensive<br />
income.<br />
Other long-term employee benefits<br />
Net obligation in regard to long-term employee benefits other than pension plans is the amount of future benefits that employees have<br />
earned in return for their service in the current and/or prior periods. Benefits are discounted to determine their present value and the fair<br />
value of any related asset is deducted. The expected costs of these benefits are accrued over the period of employment using the same<br />
method of valuation that is used for defined benefit pension plans. Any actuarial gains or losses which consist of differences between<br />
assumptions and actual experiences and the effects of changes in actuarial assumptions are recognized in the income statement in the<br />
period in which they arise.<br />
Share-based compensation<br />
Certain employees of the Group participate in share-based compensation plans. The fair value of the employee services received in exchange<br />
for the granting of the options and the discount on the shares granted is estimated at the grant date and recorded as an expense over<br />
the vesting period. The expense is recognized as other employee benefits in the income statement within the operating result of Corporate.<br />
For equity-settled plans, an increase in equity is recorded for this expense and any subsequent cash flows from exercises of vested<br />
awards are recorded as changes in equity. For cash-settled plans, a liability is recorded, which is measured at fair value at each reporting<br />
date with any movements in fair value being recorded in the income statement. Any subsequent cash flows from exercise of vested<br />
awards are recorded as a reduction of the liability.<br />
Other operating expenses<br />
Other operating expenses primarily include administrative expenses, communication expenses, rent and utilities expenses, travel and<br />
promotion expenses, insurance expenses and claims, changes in provisions from impairments of trade receivables and collection<br />
expenses and other operating expenses necessary to render forwarding revenue to third parties. The expenses are recognized when<br />
the expenses recorded on an accrual basis have been incurred.<br />
Finance income and costs<br />
Finance income comprises interest income on funds invested, dividend income, cash discounts, gains on disposals of available-for-sale<br />
financial assets, changes in the fair value of financial assets at fair value through profit or loss, and gains on derivatives that are recognized<br />
in profit or loss. Interest income is recognized as it accrues in profit or loss, using the effective interest method.<br />
Finance costs comprise interest expense on borrowings, unwinding of the discount on provisions, cash discounts, changes in the fair<br />
value of financial assets at fair value through profit or loss, impairment losses recognized on financial assets, losses on hedging instruments<br />
that are recog nized in profit or loss, bank charges and bank guarantee fees. All borrowing costs are recognized in profit or loss using<br />
the effective interest method.<br />
Panalpina <strong>Annual</strong> <strong>Report</strong> <strong>2011</strong><br />
75
76<br />
Consolidated Financial Statements <strong>2011</strong><br />
Income tax expenses<br />
Income taxes include all taxes based on the taxable profits of the Group, including withholding taxes payable on the distribution of<br />
retained earnings within the Group. Other taxes not based on income, such as capital taxes, are included within other operating expenses.<br />
Current income tax is the expected tax payable or receivable on the taxable income or loss for the year, using tax rates enacted or substantively<br />
enacted at the reporting date, and any adjustment to tax payable in respect of previous years.<br />
Deferred income tax assets and liabilities are recognized on temporary differences between the carrying amounts and the tax bases of<br />
assets and liabilities for financial statement. Deferred income tax assets relating to the carry-forward of unused tax losses are recognized<br />
to the extent that it is probable that future taxable profit will be available against which the unused tax losses can be utilized.<br />
Deferred income tax is not recognized for the initial recognition of assets and liabilities in a transaction that is not a business combination<br />
and that affects neither accounting nor taxable profit nor loss, and differences relating to investments in subsidiaries and jointly controlled<br />
entities to the extent that it is probable that they will not reverse in the foreseeable future. In addition, deferred income tax is not recognized<br />
for taxable temporary differences arising on the initial recognition of goodwill.<br />
Deferred income tax assets and liabilities are offset when the income taxes are levied by the same taxation authority and when there is a<br />
legally enforceable right to offset them. Deferred income tax is measured based on the currently enacted tax rates applicable in each tax<br />
jurisdiction where the Group operates.<br />
Current income tax and deferred income tax are recognized in profit or loss except to the extent that they relate to a business combination,<br />
or items recognized directly in equity or in other comprehensive income.<br />
Property, plant and equipment<br />
Property, plant and equipment are measured at cost, net of accumulated depreciation and/or accumulated impairment losses, if any. Initially<br />
property, plant and equipment are recorded at cost of purchase or construction and include all cost directly attributable to bringing the<br />
asset to the location and condition necessary for it to be capable of operating in the manner intended by management. Interest and other<br />
borrowing costs for long-term construction projects are capitalized and included in the carrying value of the assets. All other repair and<br />
maintenance costs of the day-to-day servicing are recognized in the income statement as incurred. The present value of the expected cost<br />
for the decommissioning of the asset after its use is included in the cost of the respective asset if the recognition criteria for a provision<br />
are met. When components of an item of property, plant and equipment have different useful lives, they are accounted for as separate<br />
items of property, plant and equipment.<br />
Gains and losses on a disposal of an item of property, plant and equipment are determined by comparing the proceeds from disposal with<br />
the carrying amount of property, plant and equipment, and are recognized net within gains or losses on sales of non-current assets in the<br />
income statement.<br />
Land and buildings are carried at cost less depreciation and/or accumulated impairment losses.<br />
Depreciation is recognized in the income statement on a straight-line basis over the estimated useful lives of each part of an item of<br />
property, plant and equipment. Leased assets are depreciated over the shorter of the lease term and their useful lives unless it is reasonably<br />
certain that the Group will obtain ownership by the end of the lease term. Land and construction in progress are not depreciated.<br />
The estimated useful lives for the current and comparative periods are as follows:<br />
Warehouse and office buildings<br />
Years<br />
25 – 40<br />
Warehouse and transportation equipment 3 – 10<br />
Office furnishings and equipment 5 – 10<br />
EDP hardware 3<br />
Trucks, trailers and special vehicles 3 – 10<br />
Automobiles 3 – 5<br />
The assets’ residual value and estimated useful lives are regularly reviewed and adjusted. If appropriate, the future depreciation charge is<br />
accelerated.<br />
Leases<br />
Where the Group is the lessee, leases of property, plant and equipment where the Group has substantially all of the risks and rewards of<br />
ownership are classified as finance leases. Financial leases are capitalized at the start of the lease at fair value, or the present value of<br />
the minimum lease payments, if lower. Assets acquired under finance leases are depreciated in accordance with the Group’s policy on<br />
property, plant and equipment. If there is no reasonable certainty that the Group will obtain ownership by the end of the lease term, the<br />
asset is depreciated over the shorter of the lease term based on the effective interest rate method. Leases where substantially all of the<br />
risk and rewards of ownership are not transferred to the Group are classified as operating leases. Payments made under operating<br />
leases are charged against the income statement on a straight-line basis over the period of the lease.<br />
The corresponding leasing obligations, net of finance charges, are included in borrowings. The interest element of the finance cost is<br />
charged to the income statement over the lease period so as to produce a constant periodic rate of interest on the remaining balance of<br />
the liability for each period.<br />
Panalpina <strong>Annual</strong> <strong>Report</strong> <strong>2011</strong>
Intangible assets<br />
Consolidated Financial Statements <strong>2011</strong><br />
Business combination and goodwill<br />
Business combinations are accounted for using the acquisition method of accounting. The consideration transferred in a business combination<br />
is measured at fair value at the date of acquisition and includes the cash paid plus the fair value at the date of exchange of assets<br />
given, liabilities incurred or assumed and equity instruments issued by the Group. The fair value of the consideration transferred also includes<br />
contingent consideration arrangements at fair value. Directly attributable acquisition-related costs are expensed in the income statement.<br />
At the date of acquisition the Group recognizes the identifiable assets acquired and the liabilities assumed at fair value. Where the Group<br />
does not acquire 100 % ownership of the acquired business, non-controlling interests are recorded as the proportion of the fair value of<br />
the acquired net assets attributable to non-controlling interest. Goodwill is recorded as the surplus of the consideration transferred over<br />
the Group’s interest in the fair value of acquired net assets. Any goodwill and fair value adjustments are recorded as assets and liabilities<br />
of the acquired business in the functional currency of that business. When the initial accounting for a business combination is incomplete<br />
at the end of a reporting period, provisional amounts are used. During the measurement period, the provisional amounts are retrospec -<br />
tively adjusted and additional assets and liabilities may be recognized, to reflect new information obtained about the amounts recognized<br />
at that date, had they been known. Goodwill is not amortized but assessed for possible impairment at each reporting date and is additionally<br />
tested annually for impairment. For the purpose of impairment testing, goodwill acquired in a business combination is allocated to each<br />
of the Group’s cash-generating units that are expected to benefit from the synergies of the combination, irrespective of whether other<br />
assets or liabilities of the acquiree are assigned to those units. Changes in ownership interest in subsidiaries are accounted for as equity<br />
transactions if they occur after control has already been obtained and if they do not result in a loss of control.<br />
Trademarks and licenses<br />
Separately acquired trademarks and licenses are shown at historical cost. Trademarks and licenses acquired in a business combination<br />
are recognized at fair value at the acquisition date. Trademarks and licenses have a finite useful life and are carried at cost less accumulated<br />
amortization and/or accumulated impairment losses. Amortization is calculated using the straight-line method to allocate the cost of<br />
trademarks and licenses over their estimated useful lives of five to ten years.<br />
Customer relationships<br />
Customer relationships acquired in a business combination are recognized at fair value at the acquisition date. Customer relations have<br />
a finite useful life and are carried at cost less accumulated amortization and / or accumulated impairment losses. Amortization is calculated<br />
using the straight-line method over the expected life of the customer relationship of three to five years.<br />
Computer software<br />
Development costs that are directly attributable to the design and testing of identifiable and unique software products controlled by the<br />
Group are recognized as intangible assets when the following criteria are met:<br />
• it is technically feasible to complete the software product so that it will be available for use;<br />
• management intends to complete the software product and use or sell it;<br />
• there is an ability to use or sell the software product;<br />
• it can be demonstrated how the software product will generate probable future economic benefits;<br />
• adequate technical, financial and other resources to complete the development and to use or sell the software product are available;<br />
and<br />
• the expenditure attributable to the software product during its development can be reliably measured.<br />
Directly attributable costs that are capitalized as part of the software product include software development costs, employee costs and an<br />
appropriate portion of relevant overhead costs. Other development expenditures that do not meet these criteria are recognized as an<br />
expense as incurred. Development costs previously recognized as expenses are not recognized as an asset in a subsequent period. Costs<br />
associated with maintaining computer software programs are recognized as an expense as incurred. Computer software development<br />
costs recognized as assets are amortized over their estimated useful life, which does not exceed three to five years.<br />
Other intangible assets<br />
Other intangible assets that are acquired by the Group that have finite useful lives are measured at cost less accumulated amortization and<br />
accumulated impairment losses.<br />
Impairment of property, plant and equipment and intangible assets<br />
An impairment assessment is carried out when there is evidence that an asset may be impaired. In addition, intangible assets that are not<br />
yet available for use are tested for impairment annually. If any such indication exists, or when annual impairment testing for an asset is<br />
required, the Group makes an estimate of the asset’s recoverable amount. An asset’s recoverable amount is the higher of an asset’s or<br />
cash-generating unit’s fair value less costs to sell, and its value in use, and is determined for an individual asset, unless the asset does<br />
not generate cash inflows that are largely independent of those from other assets or asset groups. Where the carrying amount of an asset<br />
exceeds its recoverable amount, the asset is considered impaired and is written down to its recoverable amount. In assessing value in<br />
use, the estimated future cash flows are discounted to their present value using a pre-tax discount rate that reflects current market assess-<br />
Panalpina <strong>Annual</strong> <strong>Report</strong> <strong>2011</strong><br />
77
78<br />
Consolidated Financial Statements <strong>2011</strong><br />
ments of the time value of money and the risks specific to the asset. An appropriate valuation model is used to determine fair value less<br />
costs to sell. These calculations are corroborated by valuation multiples, quoted share prices for publicly traded subsidiaries or other available<br />
fair value indicators. Impairment losses are recognized in the income statement. When an impairment loss arises, the useful life of the<br />
asset in question is reviewed and, if necessary, the future depreciation/amortization charge is accelerated.<br />
Impairment of goodwill<br />
Goodwill is assessed for possible impairment at each reporting date and is additionally tested annually for impairment. When the recoverable<br />
amount of the cash-generating units, being the higher of its fair value less costs to sell or its value in use, is less, then the carrying<br />
value of the goodwill is reduced to its recoverable amount. The reduction is reported in the income statement as an impairment loss.<br />
The methodology used in the impairment testing is further described in note 15.<br />
Financial assets<br />
Financial assets, including cash and marketable securities, short- and long-term deposits, trade and other receivables, loans and other<br />
receivables, quoted and unquoted financial instruments and derivative financial instruments, are classified either as fair value through profit<br />
or loss, loans and receivables, available-for-sale, or in exceptional cases, as held to maturity. The classification depends on the purpose<br />
for which the financial assets were acquired. Management determines the classification of its financial assets at initial recognition. All financial<br />
assets are initially recognized at fair value plus, in the case of investments not at fair value through profit or loss, directly attributable<br />
transaction costs. All purchases and sales are recognized on the settlement date.<br />
Subsequent measurement<br />
Financial assets at fair value through profit or loss<br />
Financial assets at fair value through profit or loss include financial assets held for trading and financial assets designated upon initial<br />
recognition at fair value through profit or loss. Financial assets are classified as held for trading if they are acquired for the purpose of selling<br />
in the near term. This category includes derivative financial instruments entered into by the Group that do not meet the hedge accounting<br />
criteria. Derivatives, including separately embedded derivatives, are also classified as held for trading unless they are designated as effective<br />
hedging instruments. Financial assets at fair value through profit or loss are carried on the statement of financial position at fair value with<br />
gains or losses recognized in the income statement.<br />
Loans and receivables<br />
Loans and receivables are non-derivative financial assets with fixed or determinable payments that are not quoted in an active market.<br />
Such financial assets are normally carried at amortized cost using the effective interest rate method. Gains and losses are recognized in<br />
the income statement when the loans and receivables are derecognized or impaired, as well as through the amortization process.<br />
Trade receivables originated by the Group are financial assets that are created by providing money or services directly to the debtor. Such<br />
receivables are not quoted and are not originated with the intention to be sold immediately or in the near term. Receivables are presented in<br />
current assets for maturities up to twelve months (accounting treatment of trade receivables is outlined in more detail in the section:<br />
Trade receivables).<br />
Held-to-maturity investments<br />
Non-derivative financial assets with fixed or determinable payments and fixed maturities are classified as held to maturity when the Group<br />
has the positive intention and ability to hold them until maturity. After initial measurement, held-to-maturity investments are measured at<br />
amortized cost using the effective interest method. This method uses an effective interest rate that exactly discounts estimated future cash<br />
receipts through the expected life of the financial asset to the net carrying amount of the financial asset. Gains and losses are recognized<br />
in the income statement when the investments are derecognized or impaired, as well as through the amortization process. The Group did<br />
not have any held-to-maturity investments during the periods under review.<br />
Available-for-sale financial assets<br />
Available-for-sale financial assets are non-derivative financial assets that are designated as available-for-sale or are not classified in any of the<br />
three preceding categories. After initial measurement, available-for-sale financial assets are measured at fair value with unrealized gains<br />
or losses recognized in comprehensive income until the investment is derecognized, at which time the cumulative gain or loss recorded in<br />
comprehensive income is recognized in the income statement, or determined to be impaired, at which time the cumulative loss recorded<br />
in comprehensive income is recognized in the income statement.<br />
Fair value of financial instruments<br />
Fair value is the amount for which a financial asset, liability or instrument could be exchanged between knowledgeable and willing parties<br />
in an arm’s-length transaction. It is determined by reference to quoted market prices or by the use of established valuation techniques<br />
such as option pricing models and the discounted cash flow method if quoted prices in an active market are not available. Valuation<br />
tech niques will incorporate observable market data about market conditions and other factors that are likely to affect the fair value of<br />
a financial instrument. Valuation techniques are typically used for derivative financial instruments. The fair values of financial assets and<br />
liabilities at the reporting date are not materially different to their reported carrying value unless specifically mentioned in the notes to the<br />
consolidated financial statements. Information on fair value hierarchy is included in note 18 on risk management.<br />
Panalpina <strong>Annual</strong> <strong>Report</strong> <strong>2011</strong>
Amortized cost of financial instruments<br />
Consolidated Financial Statements <strong>2011</strong><br />
Amortized cost is computed using the effective interest method less any allowance for impairment and principal repayment or reduction.<br />
The calculation takes into account any premium or discount on acquisition and includes transaction costs that are an integral part of the<br />
effective interest rate.<br />
Impairment of financial assets<br />
Financial assets are individually assessed for possible impairment at each reporting date. An impairment charge is recorded where there is<br />
objective evidence of impairment, such as where the issuer is in bankruptcy, default or other significant financial difficulty. In addition, any<br />
available-for-sale equity securities that have a market value of more than 25 % below their original cost, net of any previous impairment, will<br />
be considered as impaired. Any available-for-sale equity securities that have a market value below their original cost, net of any previous<br />
impairment, for a sustained six-month period will also be considered as impaired. Any decreases in the market price of less than 25 % of<br />
original cost, net of any previous impairment, which are also for less than a sustained six-month period are not by themselves considered<br />
as objective evidence of impairment. Such movements in fair value are recorded in equity until there is objective evidence of impairment or<br />
until the asset is sold or otherwise disposed of. For financial assets carried at amortized cost, any impairment charge is the difference<br />
between the carrying value and the recoverable amount, calculated using estimated future cash flows discounted using the original effective<br />
interest rate. For available-for-sale financial assets the original cost, net of any previous impairment charge, is the amount currently carried<br />
in equity for the difference between the original cost, net of any previous impairment, and at fair value. An impairment loss is reversed if the<br />
reversal can be related objectively to an event occurring after the impairment loss was recognized. For debt securities measured at amortized<br />
cost that are available-for-sale, the reversal is recognized in income. For equity held available-for-sale, the reversal is recognized directly in<br />
equity.<br />
Derecognition of financial assets<br />
A financial asset is derecognized when:<br />
• the Group’s rights to receive cash flows from the asset have expired; or<br />
• the Group has transferred its rights to receive cash flows from the asset or has assumed an obligation to pay the received cash flows<br />
in full without material delay to a third party under a “pass-through” arrangement; and either (a) the Group has transferred substantially<br />
all the risks and rewards of the asset or (b) the Group has neither transferred nor retained substantially all the risks and rewards<br />
of the asset, but has transferred control of the asset.<br />
Derivatives<br />
The Group holds derivative financial instruments to hedge its foreign currency and interest rate risk exposures. Derivative financial instruments<br />
are initially recognized and subsequently carried at fair value on the date a derivative contract is entered into. Apart from those<br />
derivatives designated as qualifying cash flow hedging instruments in the “hedging” policy below, all changes in fair value are recorded as<br />
financial income in the period in which they arise. Embedded derivatives are recognized separately if not closely related to the host<br />
contract and where the host contract is carried at amortized cost. Attributable transaction costs are recognized in the income statement<br />
when incurred.<br />
Derivatives are carried as financial assets when the fair value is positive and as financial liabilities when the fair value is negative.<br />
The fair value of forward currency contracts is the difference between the forward exchange rate and the contract rate. The forward<br />
exchange rate is referenced to current forward exchange rates for contracts with similar maturity profiles. The fair value of interest swap<br />
contracts is determined by reference to market value for similar instruments.<br />
Hedge accounting<br />
For the purpose of hedge accounting, hedging relationships may be of three types. A fair value hedge is a hedge of the exposure to changes<br />
in fair value of a recognized asset or liability, or an unrecognized commitment, or an identified portion of such an asset, liability or commitment<br />
that is attributable to a particular risk and could affect profit or loss. A cash flow hedge is a hedge of the exposure to variability in<br />
cash flows that is attributable to a particular risk associated with a recognized asset or liability or a highly probable forecast transaction<br />
and could affect profit or loss. A “hedge of a net investment in a foreign operation” is a hedge of the foreign currency exposure on a net<br />
investment in a foreign operation.<br />
To qualify for hedge accounting, the hedging relationship must meet several strict conditions on documentation, probability of occurrence<br />
(for cash flow hedges), hedge effectiveness and reliability of measurement. If these conditions are not met, then the derivative instrument<br />
does not qualify for hedge accounting. In this case, the hedging instrument and the hedged item are valued independently of one another.<br />
The derivative hedging instrument is reported at fair value with the changes in fair value included in income or expenses. Where the Group<br />
will hold a derivative as an economic hedge for a period beyond twelve months after the statement of financial position date, the derivative<br />
is classified as non-current consistent with the classification of the underlying item.<br />
Panalpina <strong>Annual</strong> <strong>Report</strong> <strong>2011</strong><br />
79
80<br />
Consolidated Financial Statements <strong>2011</strong><br />
At the inception of a hedge relationship, the Group formally designates and documents the hedge relationship to which the Group wishes<br />
to apply hedge accounting and the risk management objective and strategy for undertaking the hedge. The documentation includes<br />
identification of the hedging instrument, the hedged item or transaction, the nature of the risk being hedged and how the entity will assess<br />
the hedging instrument’s effectiveness in offsetting the exposure to changes in the hedged item’s fair value or cash flow attributable to<br />
the hedged risk. Such hedges are expected to be highly effective in achieving offsetting changes in fair value or cash flows and are assessed<br />
on an ongoing basis to determine whether they actually have been highly effective throughout the financial reporting periods for which<br />
they were designated.<br />
Hedges that meet the strict criteria for hedge accounting are accounted for as follows:<br />
Fair value hedges<br />
The change in the fair value of hedging derivatives is recognized in the income statement. The change in the fair value of the hedged item<br />
attributable to the risk hedged is recorded as part of the carrying value of the hedged item and is also recognized in the income statement.<br />
For fair value hedges relating to items carried to amortized cost, the adjustment to carrying value is amortized through the income statement<br />
over the remaining term to maturity. Amortization may begin as soon as an adjustment exists and shall begin no later than when the hedge<br />
item ceases to be adjusted for changes in its fair value attributable to the risk being hedged. If the hedge item is derecognized, the unamortized<br />
fair value is recognized immediately in the income statement.<br />
When an unrecognized firm commitment is designated as a hedged item, subsequent cumulative change in the fair value of the firm commitment<br />
attributable to the hedged risk is recognized as an asset or liability with a corresponding gain or loss recognized in the income<br />
statement.<br />
Cash flow hedges<br />
The effective portion of the gain or loss on the hedging instrument is recognized directly in equity, while any ineffective portion is recognized<br />
in the income statement. Amounts taken to equity are transferred to the income statement when the hedged transaction affects profit or<br />
loss, such as when the hedged financial income or financial expense is recognized or when a forecast sale occurs. Where the hedged item<br />
is the cost of a non-financial asset or non-financial liability, the amounts taken to equity are transferred to the initial carrying amount of the<br />
non-financial asset or liability.<br />
If the forecast transaction or firm commitment is no longer expected to occur, amounts previously recognized in equity are transferred to the<br />
income statement. If the hedging instrument expires or is sold, terminated or exercised without replacement or rollover, or if its designation<br />
as a hedge is revoked amounts previously recognized in equity remain in equity until the forecast transaction or firm commitment occurs.<br />
Hedges of a net investment<br />
Hedges of a net investment in a foreign operation, including a hedge of a monetary item that is accounted for as part of the net investment,<br />
are accounted for in a manner similar to cash flow hedges. Gains or losses on the hedging instrument relating to the effective portion<br />
of the hedge are recognized directly in equity while any gains or losses relating to the ineffective portion are recognized in the income statement.<br />
Upon disposal of the foreign operation, the cumulative value of any such gains or losses recognized directly in equity is transferred<br />
to the income statement.<br />
Hedging activities and derivative financial instruments<br />
The Group uses foreign-currency-denominated borrowings and forward contracts to manage its transaction exposures. These currency<br />
forward contracts are not designated as cash flow, fair value or net investment hedges and are entered into for periods consistent with currency<br />
transaction exposure (generally one to six months). Such derivatives do not qualify for hedge accounting.<br />
At year-end, the contract value is calculated on the total volume of individual contracts using the fair value at this time. The positive<br />
replacement value represents the theoretical profit if the open currency contracts were closed out as of December 31. Correspondingly, the<br />
negative replacement value represents the theoretical loss on closing the currency transactions open as of December 31.<br />
Trade receivables<br />
Trade receivable are carried at the original invoice amount less valuation adjustments for impairment, trade discounts, volume rebates and<br />
similar allowances. Subsequently, accounts receivable are measured at amortized cost using the effective interest method. An allowance<br />
for doubtful accounts trade receivables is recorded when there is objective evidence that the Group will not be able to collect all amounts<br />
due according to the original terms of receivables. Significant financial difficulties of the debtor, probability that the debtor will enter bankruptcy<br />
or financial reorganization, and default or delinquency in payments (more than 30 days overdue) are considered indicators that the<br />
trade receivable is impaired. The amount of the provision is the difference between the asset’s carrying amount and the present value of<br />
estimated future cash flows. The carrying amount of the asset is reduced through the use of an allowance account, and the amount of the<br />
loss is recognized in the income statement within other operating expenses. When a trade receivable is uncollectible, it is written off<br />
against the allowance account for trade receivables. Subsequent recoveries of amounts previously written off or 100 % impaired are credited<br />
against operating expenses in the income statement. Trade discounts, volume rebates and similar allowances are recorded on an<br />
accrual basis consistent with the recognition of the related sales, using estimates based on existing contractual obligations, historical<br />
trends and the Group’s experience. Long-term accounts receivable are discounted to take into account the time value of money.<br />
Unbilled forwarding services<br />
Unbilled forwarding services represent the gross unbilled amount expected to be collected from customers for forwarding services in<br />
progress for which costs are incurred but not yet invoiced. For logistics projects and other services with a longer period of delivery,<br />
recognized profits are included.<br />
Panalpina <strong>Annual</strong> <strong>Report</strong> <strong>2011</strong>
Cash and cash equivalents and other current financial assets<br />
Consolidated Financial Statements <strong>2011</strong><br />
Cash and cash equivalents included in the statement of financial position and statement of cash flows represent cash on hand, bank<br />
and postal checks, bills of exchange net, current balance with banks and similar institutions less bank overdraft as well as time deposits<br />
and highly liquid money market papers with a maturity period of less than three months from the date of acquisition. Such balances are<br />
only reported as cash if they are readily convertible to known amounts of cash and are subject to insignificant risk of change in value.<br />
Other current financial assets include time deposits and highly liquid money market papers with a maturity period between three months<br />
and one year.<br />
Non-current assets held for sale<br />
Non-current assets or disposal groups are classified as assets held for sale when their carrying amount is to be recovered principally through<br />
a sales transaction and a sale is considered highly probable. Before classification as held for sale, the assets or components of a disposal<br />
group are remeasured in accordance with the Group’s accounting policies. Thereafter, generally the assets or disposal groups are<br />
measured at the lower of their carrying amount and fair value less costs. Any impairment loss on a disposal group is allocated first to<br />
goodwill, and then to remaining assets and liabilities on a pro rata basis, except that no loss is allocated to financial assets, deferred tax<br />
assets and employee benefit assets, which continue to be measured. Impairment losses on initial classification as held for sale and<br />
subsequent gains or losses on remeasurement are recognized in the income statement. Gains are not recognized in excess of any cumulative<br />
impairment loss.<br />
Share capital<br />
Ordinary shares are classified as equity. Incremental costs directly attributable to the issue of new shares or options are recognized in equity<br />
as a deduction, net of tax effects, from the proceeds.<br />
Treasury shares<br />
When share capital recognized as equity is repurchased, the amount of the consideration paid, which includes directly attributable costs,<br />
is net of any tax effects and is recognized as a deduction from equity. Repurchased shares are classified as treasury shares and are<br />
presented as a deduction from total equity. Where such shares are subsequently reissued, any consideration received, net of any directly<br />
attributable incremental transaction costs and the related income tax effects, the resulting surplus or deficit on the transaction is transferred<br />
to retained earnings.<br />
Retained earnings and other reserves<br />
Retained earnings and other reserves contain legal reserves which are not distributable to the shareholders pursuant to Swiss law, cumulative<br />
translation adjustments of all foreign currency differences arising from the translation of the financial statements of foreign operations<br />
as well as cumulative actuarial gains and losses from defined benefit post-employment plans net of taxes and accumulated difference in<br />
available-for-sales assets.<br />
Financial liabilities<br />
Financial liabilities are either classified as financial liabilities at fair value through profit or loss, financial liabilities at amortized cost or as<br />
derivatives designated as hedging instruments in an effective hedge as appropriate. The Group determines the classification of its financial<br />
liabilities at initial recognition. Financial liabilities are recognized initially at fair value and, in the case of loans and borrowings, directly<br />
attributable transaction costs. The Group’s financial liabilities include trade and other payables, loans and borrowings and derivative<br />
financial instruments.<br />
Subsequent measurement<br />
Financial liabilities at fair value through profit or loss include financial liabilities held for trading and financial liabilities designated upon initial<br />
recognition as at fair value through profit or loss. This category includes derivative financial instruments entered into by the Group that<br />
do not meet the hedge accounting criteria. Gains or losses on liabilities at fair value through profit or loss are recognized in the income statement.<br />
Loans and borrowings<br />
After initial recognition, interest-bearing loans and borrowings are subsequently measured at amortized cost. Any discount between the<br />
net proceeds received and the principal value due on redemption is amortized over the duration of the debt instruments and is recognized<br />
as part of financing costs using the effective interest rate method.<br />
Derecognition of financial liabilities<br />
Financial liabilities are derecognized when the obligation under the liability is discharged or cancelled or expired. Where a financial liability is<br />
replaced by another from the same lender on substantially different terms, or the terms of an existing liability are substantially modified,<br />
such an exchange or modification is treated as a derecognition of the original liability. The recognition of a new liability and the difference in<br />
the respective carrying amounts is recognized in the income statement.<br />
Panalpina <strong>Annual</strong> <strong>Report</strong> <strong>2011</strong><br />
81
82<br />
Consolidated Financial Statements <strong>2011</strong><br />
Provisions<br />
Provisions are recognized where a legal or constructive obligation has been incurred and if an outflow of resources that can be estimated<br />
reliably. Provisions are recorded for the estimated ultimate liability that is expected to arise, taking into account foreign currency effects<br />
arising from their translation from their functional currency into Swiss francs and the time value of money where material, determined by<br />
discounting the expected future cash flows at a pre-tax rate that reflects current market assessments of the time value of money and<br />
the risks specific to the liability. The unwinding of the discount is recognized as finance cost. Provisions are established in particular for<br />
accrued costs of services, freight forwarding claims, short-term employee benefits, termination and other long-term employee benefits,<br />
post-employment benefit liabilities and decommissioning provisions. Provisions for restructuring are recognized only when the Group has<br />
approved a detailed and formal restructuring plan, and the restructuring either has commenced or has been announced publicly. Future<br />
operating costs are not provided for.<br />
4<br />
Critical accounting estimates and judgments<br />
The preparation of the Group’s consolidated financial statements in conformity with IFRS requires management to make estimates and judgments<br />
that affect the application of policies and reported amounts of assets, liabilities, income, expenses and related disclosures. Estimates<br />
and the underlying assumptions are based on historical experience and various other factors that are believed to be reasonable under the<br />
circumstances. The results of which form the basis for making the judgments about carrying values of assets and liabilities that are not<br />
readily apparent from other sources. Actual results may differ from these estimates. The estimates and underlying assumptions are reviewed<br />
on an ongoing basis. Changes in accounting estimates may be necessary if there are changes in the circumstances on which the estimate<br />
was based, or as a result of new information or more experience. Such changes are recognized in the period in which the estimate is revised.<br />
The estimations and assumptions that have a significant risk of causing a material adjustment to the carrying amount of assets and liabilities<br />
within the next financial year are discussed below.<br />
Impairment of goodwill<br />
The Group tests periodically whether goodwill has suffered any impairment in accordance with the Group’s accounting policy and details<br />
disclosed in note 15 – Intangible assets, section: Impairment test for goodwill. The recoverable amounts of cash-generating units (CGUs)<br />
have been determined based on value-in-use calculations. The underlying calculations require the use of estimates.<br />
Fair value of financial instruments<br />
Where the fair value of financial assets and financial liabilities recorded in the statement of financial position cannot be derived from future<br />
markets, it is determined using the valuation technique including the discounted cash flow model. The inputs to these models are taken<br />
from observable markets where possible, but where this is not feasible, a degree of judgment is required to establish fair value. The judgments<br />
include considerations of inputs such as credit risk, liquidity risk and volatility. Changes in assumptions concerning these factors<br />
could affect the reported fair value of financial instruments.<br />
Pension and other post-employment benefits<br />
The cost of defined benefit pension plans and other post-employment medical benefits as well as the present value of the pension obligation<br />
are determined using actuarial valuations. The actuarial valuation involves making assumptions about discount rates, expected rates of<br />
return of assets, future salary increases, mortality rates and future pension increases. All assumptions are reviewed at each reporting<br />
date. When determining the appropriate discount rate, management considers the interest rates on high-quality corporate bonds (with an<br />
AAA or AA rating) in the respective country and appropriate duration. The mortality rate is based on publicly available mortality tables<br />
for the specific country. Future salary increases and pension increases are based on expected future inflation rates for the specific country.<br />
Such differences are recognized in full directly in equity in the period in which they occur without affecting the income statement. At<br />
December 31, <strong>2011</strong> the Group had a deficit of the fair value of plan assets below the present value of funded obligations of CHF 9.5 million<br />
(2010: surplus CHF 7.6 million) for funded plans and a negative present value of unfunded plans of CHF 37.7 million (2010: CHF 37.9<br />
million) for unfunded plans (see note 7). The actuarial assumptions used may differ materially from actual results due to changes in market<br />
and economic conditions, higher or lower withdrawal rates, longer or shorter life spans of participants and other changes in the factors<br />
assessed. These differences could impact the assets or liabilities recognized in the statement of financial position in future periods.<br />
Panalpina <strong>Annual</strong> <strong>Report</strong> <strong>2011</strong>
Consolidated Financial Statements <strong>2011</strong><br />
Provisions<br />
A number of subsidiaries are subject to litigation arising from the normal conduct of their businesses, as a result of which claims could be<br />
raised against them.<br />
The Group has established a captive reinsurance company that insures a dedicated risk portion of its errors and omissions, transporter<br />
operator and commercial general liability programs. The exposure of its captive reinsurance company is limited by a third-party insurer that<br />
covers losses exceeding an amount of CHF 1 million on a single-case basis and a total aggregate limit of CHF 9 million annually for<br />
claims exceeding CHF 50,000 per incident. In a consolidated view, the Group, through its captive reinsurance company, bears the risks<br />
insured with its captive reinsurance company up to the limit as if such risks were not insured at all. Furthermore, as third-party coverage is<br />
subject to a considerable deductible and a total aggregated limit per year, the Group, in effect, bears the risk of damages, losses and<br />
claims that are above such aggregated limits as well. The Group used for the above-mentioned provision an actuarial calculation<br />
method, which requires for the calculation of the “incurred but not reported reserves” (IBNR), among other estimations, the overall circumstances<br />
which may impact the future losses, such as the growth of business. At December 31, <strong>2011</strong> the recognized liability for claims<br />
amounts to CHF 33.0 million (2010: CHF 52.5 million). If the management decided to use the optimal actuarial calculation method, which<br />
only takes into consideration the linear loss development according to historical figures, the carrying amount of claim provisions would be<br />
approximately CHF 2.3 million lower (2010: CHF 0.8 million). Using a more conservative percentile, the carrying amount of claim provisions<br />
would be approximately CHF 1.7 million higher (2010: CHF 1.3 million).<br />
The Group is also subject to legal and regulatory proceedings and government investigations in various jurisdictions. These proceedings<br />
are related to the area of competition law. Such proceedings may result in criminal or civil sanctions, penalties or damages against the<br />
Company. Regulatory and legal proceedings, as well as government investigations, involve complex legal issues, the outcome of which is<br />
difficult to predict. Accordingly, management’s judgment is affected in determining whether it is more likely or not that such a proceeding<br />
will result in an outflow of resources and whether the amount of the obligation can be reliably estimated. These judgments are subject to<br />
change as new information becomes available. Upon resolution of any legal or regulatory proceeding or government investigation, the<br />
Group may incur a provision for such matters. It cannot be ruled out that the financial condition or results of operations of the Group will be<br />
materially affected. For additional information see note 31 – Pending legal claims. Related legal costs are recognized when incurred.<br />
Deferred income tax assets<br />
Deferred tax assets are recognized for unused tax losses to the extent that it is probable that taxable profit will be available against which<br />
the losses can be utilized. Significant management judgment is required to determine the amount of deferred tax assets that can be<br />
recognized, based on the likely timing and level of future taxable profits.<br />
The carrying value of recognized tax loss carry-forwards amounts to CHF 98.0 million (2010: CHF 96.0 million) and unrecognized tax loss<br />
carry-forwards to CHF 100.1 million (2010: CHF 80.3 million). Further details are provided in note 27.<br />
If the Group were able to recognize all unrecognized deferred tax assets, consolidated profit would increase by CHF 31.6 million<br />
(2010: CHF 25.2 million). If the Group failed to achieve the expected future taxable profits, the consolidated profit would decrease by<br />
CHF 31.9 million (2010 CHF 31.3 million) but the management believes that the full amount of the recognized deferred tax assets are<br />
recoverable in the foreseeable future.<br />
Income taxes<br />
At December 31, <strong>2011</strong>, the net liability for current income taxes amounts to CHF 19.2 million (2010: CHF 16.4 million). As the Group is<br />
subject to income taxes in numerous jurisdictions, significant judgments are required in determining worldwide provisions for income taxes.<br />
Some of these estimates are based on interpretations of existing tax laws or regulations. Management believes that the estimates are<br />
reasonable and that the recognized liabilities for income-tax-related uncertainties are adequate. Various external factors may have favorable<br />
or unfavorable effects on income taxes. These factors include, but are not limited to, changes in tax law regulations and/or rates,<br />
changing interpretation of existing tax laws or regulations and changes in management estimations. Such changes that arise could affect<br />
the assets and liabilities recognized in the statement of financial position in future periods.<br />
Panalpina <strong>Annual</strong> <strong>Report</strong> <strong>2011</strong><br />
83
84<br />
Consolidated Financial Statements <strong>2011</strong><br />
5<br />
Operating segment information<br />
Management has determined the operating segments based on the reports reviewed by the Executive Board that are used to make strategic<br />
decisions. The Executive Board considers the business from a geographic perspective, as the Group’s operations are predominantly<br />
managed by the geographical location. The Executive Board assesses performance of the operating segments based on a measure of<br />
adjusted EBIT. This measurement basis excludes the effects on non-recurring expenditure from the operating segments such as restructuring<br />
costs, legal expenses, reorganization costs as well as fines recognized and related expenses. The measurement also excludes<br />
the unrealized gains / losses on financial instruments as well as interest income and expenditure, as this type of activity is driven by the central<br />
treasury function, which manages the cash position of the Group. Income and deferred income taxes are not assessed by segment.<br />
<strong>2011</strong> (in million CHF)<br />
Panalpina <strong>Annual</strong> <strong>Report</strong> <strong>2011</strong><br />
Europe,<br />
Middle<br />
East,<br />
Africa,<br />
CIS<br />
North<br />
America<br />
Central<br />
and<br />
South<br />
America<br />
Asia<br />
Pacific<br />
Total<br />
operating<br />
segment<br />
Elimi-<br />
nations<br />
Cor-<br />
porate<br />
Total<br />
Group<br />
External forwarding services 3,171 1,270 834 1,225 6,500 0 6,500<br />
Intra-group forwarding services 1,574 469 177 1,547 3,767 (3,767) 0<br />
Net forwarding revenue 4,745 1,739 1,011 2,772 10,267 (3,767) 0 6,500<br />
Forwarding services from third parties (4,014) (1,468) (849) (2,459) (8,790) 3,767 (5,023)<br />
Gross profit 731 271 162 313 1,477 0 0 1,477<br />
Personnel expenses (445) (169) (77) (125) (816) (76) (892)<br />
Other operating expenses (247) (94) (68) (100) (509) 136 (373)<br />
Segment EBITDA 39 8 17 88 152 0 60 212<br />
Depreciation and amortization (17) (5) (4) (6) (32) (6) (38)<br />
Segment operating result (Segment EBIT) 22 3 13 82 120 0 54 174<br />
Financial result<br />
– Finance income 6<br />
– Finance costs (12)<br />
Profit before income tax (EBT) 168<br />
Income tax expenses (41)<br />
Consolidated profit 127<br />
Information about segment assets and liabilities:<br />
<strong>2011</strong> (in million CHF)<br />
Europe,<br />
Middle<br />
East,<br />
Africa,<br />
CIS<br />
North<br />
America<br />
Central<br />
and<br />
South<br />
America<br />
Asia<br />
Pacific<br />
Total<br />
operating<br />
segment<br />
Non-<br />
segment<br />
assets<br />
Non-<br />
segment<br />
liabilities<br />
Total<br />
Group<br />
Segment assets 755 247 209 372 1,583 552 2,135<br />
Segment liabilities 542 170 94 234 1,040 180 1,220<br />
Net forwarding revenue and segment assets from the country of domicile (Switzerland) and major countries within above-mentioned<br />
segments:<br />
<strong>2011</strong> (in million CHF) Switzerland<br />
Germany<br />
United<br />
States of<br />
America<br />
Brazil<br />
Republic of<br />
China<br />
Net forwarding revenue 905 1,376 1,445 412 1,182<br />
Segment assets 69 189 195 86 131<br />
The Group does not have sales in excess of 10 % of the total net forwarding revenues to any single external customer.
2010 (in million CHF)<br />
Europe,<br />
Middle<br />
East,<br />
Africa,<br />
CIS<br />
North<br />
America<br />
Central<br />
and<br />
South<br />
America<br />
Asia<br />
Pacific<br />
Total<br />
operating<br />
segment<br />
Consolidated Financial Statements <strong>2011</strong><br />
Elimi-<br />
nations<br />
Cor-<br />
porate<br />
Total<br />
Group<br />
External forwarding services 3,640 1,409 845 1,270 7,164 0 0 7,164<br />
Intra-group forwarding services 1,432 421 147 1,954 3,954 (3,954) 0 0<br />
Net forwarding revenue 5,072 1,830 992 3,224 11,118 (3,954) 0 7,164<br />
Forwarding services from third parties (4,312) (1,564) (836) (2,926) (9,638) 3,954 0 (5,684)<br />
Gross profit 760 266 156 298 1,480 0 0 1,480<br />
Personnel expenses (432) (181) (76) (121) (810) 0 (81) (891)<br />
Other operating expenses (250) (102) (61) (85) (498) 0 99 (399)<br />
Segment EBITDA 78 (17) 19 92 172 0 18 190<br />
Depreciation and amortization (25) (6) (4) (7) (42) 0 (5) (47)<br />
Segment operating result (Segment EBIT) 53 (23) 15 85 130 0 13 143<br />
Fines and related costs (112)<br />
Reorganisation costs<br />
Financial result<br />
(14) (2) (16)<br />
– Finance income 6<br />
– Finance costs (15)<br />
Profit before income tax (EBT) 6<br />
Income tax expenses (32)<br />
Consolidated profit (26)<br />
Information about segment assets and liabilities:<br />
2010 (in million CHF)<br />
Europe,<br />
Middle<br />
East,<br />
Africa,<br />
CIS<br />
North<br />
America<br />
Central<br />
and<br />
South<br />
America<br />
Asia<br />
Pacific<br />
Total<br />
operating<br />
segment<br />
Non-<br />
segment<br />
assets<br />
Non-<br />
segment<br />
liabilities<br />
Total<br />
Group<br />
Segment assets 728 219 168 311 1,426 563 1,989<br />
Segment liabilities 517 144 75 233 969 208 1,177<br />
Net forwarding revenue and segment assets from the country of domicile (Switzerland) and major countries within above-mentioned<br />
segments:<br />
<strong>2011</strong> (in million CHF) Switzerland<br />
Germany<br />
United<br />
States of<br />
America<br />
Brazil<br />
Republic of<br />
China<br />
Net forwarding revenue 931 1,425 1,495 358 1,653<br />
Segment assets 70 176 170 58 124<br />
Panalpina <strong>Annual</strong> <strong>Report</strong> <strong>2011</strong><br />
85
86<br />
6<br />
Consolidated Financial Statements <strong>2011</strong><br />
Information by business<br />
The Group’s business can be divided into three divisions: Air Freight, Ocean Freight and Logistics.<br />
<strong>2011</strong> (in million CHF)<br />
Panalpina <strong>Annual</strong> <strong>Report</strong> <strong>2011</strong><br />
Air Freight<br />
Ocean<br />
Freight<br />
Logistics<br />
Total Group<br />
Net forwarding revenue 3,281 2,313 906 6,500<br />
Forwarding services from third parties (2,593) (1,874) (556) (5,023)<br />
Gross profit 688 439 350 1,477<br />
2010 (in million CHF)<br />
Air Freight<br />
Ocean<br />
Freight<br />
Logistics<br />
Total Group<br />
Net forwarding revenue 3,503 2,771 890 7,164<br />
Forwarding services from third parties (2,836) (2,318) (530) (5,684)<br />
Gross profit 667 453 360 1,480<br />
Personnel expenses<br />
in thousand CHF <strong>2011</strong> 2010<br />
Wages and salaries 695,473 694,834<br />
Compulsory social security contributions 84,421 85,304<br />
Contributions to defined contribution plans 49,166 47,649<br />
Expenses related to defined benefit plans (note 7) 987 4,946<br />
Staff training<br />
Share-based compensation (note 8)<br />
8,823 7,561<br />
Equity-settled compensation plan 1,917 2,216<br />
Cash-settled compensation plan 1,019 65<br />
Other personnel-related expenses 50,615 48,362<br />
Total personnel expenses 892,421 890,937<br />
Number of employees 15,051 14,136<br />
thereof in Switzerland 775 749<br />
7<br />
Post-employment benefit obligations<br />
Panalpina’s objective is to provide attractive post-employment benefits to employees, while at the same time ensuring that the various plans<br />
are appropriately financed, while managing any potential impacts on the Group’s long-term financial position. The nature of such plans<br />
varies according to legal regulations and fiscal requirements in the countries in which the employees are employed. Other post-employment<br />
benefits consist mostly of post-retirement schemes. Post-employment benefit plans are classified for IFRS as “defined contribution plans”<br />
if the Group pays fixed contributions in a separate fund or to a third-party financial institution and will have no further legal or constructive<br />
obligation to pay further contributions. All other plans are classified as defined benefit plans. The Group’s major defined benefit plans are<br />
located in Switzerland, Germany, Japan, Taiwan and France. Plans are usually established as trusts independent of the Group and are<br />
funded by payments from the Group and by employees. In some cases, notably for the major defined benefit plans in Germany and Japan,<br />
the plans are unfunded and the Group pays pensions to retired employees directly from its own financial resources.<br />
Current and past services as well as expected returns on plan assets and interest costs are charged to the income statement as personnel<br />
expenses. Actuarial gains and losses are recorded directly in equity. The recognition of pension assets is limited to the total of the<br />
present value of any future refunds from the plans or reduction in future contributions to the plans and any cumulative unrecognized past<br />
service costs. Adjustments arising from the limit on the recognition of assets for defined benefit plans are recorded directly in equity.<br />
Qualified independent actuaries carry out valuations on a regular basis and for major plans annually as at the reporting date. For funded<br />
plans, which are usually trusts independent of the Group’s finances, the net asset / liability recognized on the Group’s statement of
Consolidated Financial Statements <strong>2011</strong><br />
financial position corresponds to the over-/underfunding of the plan, adjusted for unrecognized past service costs. For unfunded plans,<br />
where the Group meets the pension obligations directly from its own financial resources, a liability for the defined benefit obligation<br />
is recorded in the Group’s statement of financial position. Pension assets and liabilities in different defined benefit plans are not offset.<br />
The amounts recognized in the statement of financial position are determined as follows:<br />
in thousand CHF <strong>2011</strong> 2010<br />
Fair value of plan assets 211,525 217,656<br />
Present value of funded obligation (221,002) (210,094)<br />
Surplus (deficit) (9,477) 7,562<br />
Present value of unfunded obligations (37,674) (37,921)<br />
(Net liability) net asset recognized in statement of financial position (47,151) (30,359)<br />
thereof recognized as asset 0 10,312<br />
thereof recognized as liability (47,151) (40,671)<br />
The following amounts relating to defined benefit pension plans were recorded in the income statement:<br />
in thousand CHF <strong>2011</strong> 2010<br />
Net pension cost for year ending<br />
Current service cost (13,488) (12,259)<br />
Recognized past service cost 3,448 0<br />
Interest cost (7,232) (8,046)<br />
Expected return on plan assets 10,226 9,842<br />
Employee contribution 4,960 4,369<br />
Settlements 922 950<br />
Curtailments 177 198<br />
Expenses for defined benefit plans (987) (4,946)<br />
The movement in the defined benefit obligation over the year is as follows:<br />
in thousand CHF <strong>2011</strong> 2010<br />
Changes in defined benefit obligation (DBO)<br />
DBO at beginning of year (248,015) (232,899)<br />
Current service cost (13,488) (12,259)<br />
Recognized past service cost 3,448 0<br />
Interest cost (7,232) (8,046)<br />
Actuarial (losses) gains recognized in OCI (10,777) (12,297)<br />
Benefits paid 16,196 11,786<br />
Curtailments 177 198<br />
Liabilities extinguished on settlement 29 0<br />
Currency impact 986 5,502<br />
DBO at end of year (258,676) (248,015)<br />
The movement in the fair value of plan assets of the year is as follows:<br />
in thousand CHF <strong>2011</strong> 2010<br />
Changes in fair value of plan assets<br />
Fair value at beginning of year 217,656 208,217<br />
Employer contributions 6,167 5,060<br />
Employee contributions 4,960 4,369<br />
Expected return on plan assets 10,226 9,842<br />
Actuarial gains (losses) recognized in OCI (12,520) 950<br />
Benefits paid (14,943) (10,733)<br />
Currency impact (21) (49)<br />
Fair value at end of year of plan assets 211,525 217,656<br />
The fair value of the plan assets includes none of the Group’s shares for either <strong>2011</strong> or 2010.<br />
Panalpina <strong>Annual</strong> <strong>Report</strong> <strong>2011</strong><br />
87
88<br />
Consolidated Financial Statements <strong>2011</strong><br />
An analysis of the amounts recognized in equity is shown in the table below:<br />
in thousand CHF <strong>2011</strong> 2010<br />
Analysis of amounts recognized in other comprehensive income<br />
Recognized in other comprehensive income on January 1 104,601 94,005<br />
Actuarial (gains) losses plan assets 12,520 (950)<br />
Actuarial losses (gains) DBO 10,777 12,297<br />
Currency impact (1,163) (751)<br />
Recognized in other comprehensive income on December 31 126,735 104,601<br />
Plan assets are comprised as follows:<br />
in thousand CHF <strong>2011</strong> 2010<br />
Major categories of plan assets<br />
Panalpina <strong>Annual</strong> <strong>Report</strong> <strong>2011</strong><br />
in CHF in % in CHF in %<br />
Cash and cash equivalents 3 0.0088 % 1,016 0.47 %<br />
Equity investments 61,021 28.85 % 66,922 30.75 %<br />
Bonds 117,765 55.68 % 115,128 52.89 %<br />
Hedge funds and private equity 6,500 3.07 % 3,130 1.44 %<br />
Real estate funds 22,893 10.82 % 24,042 11.04 %<br />
Others 3,343 1.58 % 7,418 3.41 %<br />
Actuarial assumptions<br />
Actuarial assumptions are unbiased and mutually compatible estimates of variables that determine the ultimate cost of providing past<br />
employment benefits. They are set on an annual basis by local management and actuaries and are subject to approval by corporate management.<br />
Actuarial assumptions consist of demographic assumptions on matters such as mortality and employee turnover, and financial<br />
assumptions on matters such as salary and benefit level, interest rates and return on investments. The Group operates defined benefit plans<br />
in many countries and the actuarial assumptions vary based upon local economic and social conditions.<br />
Demographic assumptions<br />
The most significant demographic assumptions relate to mortality rates. The Group’s actuaries use mortality tables which take into account<br />
historic patterns and expected changes, such as further increases in longevity. The mortality tables used for the major schemes are:<br />
Switzerland: BVG 2010 and adjustment<br />
Germany: tables 2005G from Klaus Heubeck<br />
France: table INSEE TV / TD 2004 / 2006<br />
Rates of employee turnover, disability and early retirement are based on historical behavior within the Group companies.<br />
Financial assumptions<br />
These are based on market expectations for the period over which the obligations are to be settled. The assumptions used in the actuarial<br />
valuations with stable currencies and interest are shown below:<br />
<strong>2011</strong> 2010<br />
Discount rate 2.57 % 2.99 %<br />
Expected return on pension plan assets 3.99 % 4.74 %<br />
Future salary increase 1.75 % 2.97 %<br />
Future pension increase 1.25 % 1.24 %<br />
Discount rates, which are used to calculate the discounted present value of the defined benefit obligation, are determined with reference to<br />
market yields on high-quality corporate bonds.<br />
Expected returns on plan assets are based on market expectations of expected returns on the assets in funded plans over the duration of<br />
the related obligation. This takes into account the split of the plan assets between equities, bonds, properties and other investments.<br />
The calculation includes assumptions concerning expected dividend and interest income and realized and unrealized gains on plan assets.<br />
Due to the long-term nature of the obligations, the assumptions used for matters such as returns on investments may not necessarily be<br />
consistent with recent historical patterns. The expected return on plan assets included in the income statement is calculated by multiplying<br />
the expected rate of return by the fair value of plan assets. The difference between the expected return and the actual return in any<br />
twelve–month period is an actuarial gain/loss and recorded directly to equity. In <strong>2011</strong>, the actual return on plan assets was CHF – 2.3 million<br />
(2010: CHF 10.8 million).
Consolidated Financial Statements <strong>2011</strong><br />
Expected rates of salary increases, which are used to calculate the defined benefit obligation and the current service cost included in the<br />
income statement, are based on the latest expectation and historical behavior within Group entities.<br />
A five-year summary of the Group’s defined benefit plans is shown in the table below:<br />
in thousand CHF <strong>2011</strong> 2010 2009 2008 2007<br />
DBO 258,676 248,015 232,899 256,441 268,675<br />
Plan assets (211,525) (217,656) (208,217) (213,520) (255,989)<br />
Deficit (surplus)<br />
Experience adjustments arising on:<br />
47,151 30,359 24,682 42,920 12,686<br />
plan liability 8,974 (2,858) 3,149 (7,692) 9,290<br />
plan asset (12,510) 1,042 20,539 (40,859) (8,668)<br />
8<br />
Share and option ownership program<br />
The Group operates several share and option ownership programs. The members of the Board of Directors, the members of the Executive<br />
Board as well as selected preferential employees had the option of voluntarily participating in the share and option ownership program<br />
introduced in 2005 and continued in a modified program in the following years.<br />
Management Incentive Program II (MIP II)<br />
In June 2006, the Group introduced the Management Incentive Program II. Participants in this program had the right to purchase shares<br />
with a discount of 25 % based on the share price corresponding to the average closing price of one share at the SIX Swiss Exchange during<br />
the months January to May in the respective year of purchase. The difference between the discounted share price on the grant date<br />
and the share price paid by the participants is recognized as personnel expenses on the date of the issue of the shares. The shares are<br />
subject to a one-year lock-up period. For every purchased share under this plan, the Group granted one option free of charge to the participant.<br />
The options have a contractual term of six years and a vesting period of one to three years. Each option entitles the participant to<br />
obtain one share of Panalpina World Transport (Holding) Ltd. at a predetermined strike price which equals the average closing price of<br />
one share at the SIX Swiss Exchange during the months January to May in 2006. The share options cannot be settled in cash. In May 2007,<br />
the Board of Directors decided to divide the Management Incentive Program II into an “International Management Incentive Plan” and a<br />
“United States Management Incentive Plan.” Beneficiaries of the “United States Management Incentive Plan” are selected preferential employees<br />
of the subsidiary in the United States of America and members of the Board of Directors with residence in the United States of<br />
America. The conditions of this plan do not differ from those of the “International Management Incentive Plan” except for the strike price, which<br />
equals the closing price of one share at the SIX Swiss Exchange on the date of disbursement. Under this changed program, beneficiaries<br />
of the “United States Management Incentive Plan” holding options to purchase shares of the Group’s capital stock were given the opportunity<br />
to exchange their existing options for new options to purchase an equal number of shares. 3,550 options with a strike price of<br />
CHF 111.30 were tendered pursuant to the “United States Management Incentive Plan.” In May 2007, those options were accepted and<br />
cancelled by the Group. The Group undertook to grant new options on a one-for-one basis, in lieu of the tendered options, to the<br />
affected employees. The new options, which totaled 5,350, were granted with a strike price of CHF 114.00.<br />
The following table lists the parameters based on which the option valuation of both plans was performed:<br />
in CHF<br />
International<br />
Management<br />
Incentive<br />
Plan II<br />
United States<br />
Management<br />
Incentive<br />
Plan II<br />
Market price of share 114.00 114.00<br />
Exercise price of option 111.30 114.00<br />
Expected volatility (in %) 30.00 30.00<br />
Option life (in years) 5 5<br />
Dividend yield (in %) 1.78 1.78<br />
Risk-free interest rate based on Swiss government bonds (in %) 2.670 2.670<br />
Management Incentive Program III (MIP III)<br />
The third share and option program was introduced in June 2007, which conceptually completely mirrors the modified program of 2006. Participants<br />
of the “International Management Incentive Plan III” subscribed for 38,921 options with a strike price of CHF 201.10. Participants<br />
in the “United States Management Incentive Plan III” subscribed for 4,096 options with a strike price of CHF 251.00. The difference between<br />
the discounted share price on the grant date and the share price paid by the participants is recognized as personnel expenses on the date<br />
of the issue of the shares.<br />
Panalpina <strong>Annual</strong> <strong>Report</strong> <strong>2011</strong><br />
89
90<br />
Consolidated Financial Statements <strong>2011</strong><br />
The following table lists the parameters based on which the option valuation of both plans was performed:<br />
in CHF<br />
Panalpina <strong>Annual</strong> <strong>Report</strong> <strong>2011</strong><br />
International<br />
Management<br />
Incentive<br />
Plan III<br />
United States<br />
Management<br />
Incentive<br />
Plan III<br />
Market price of share 251.00 251.00<br />
Exercise price of option 201.10 251.00<br />
Expected volatility (in %) 22.74 22.74<br />
Option life (in years) 5 5<br />
Dividend yield (in %) 1.20 1.20<br />
Risk-free interest rate based on Swiss government bonds (in %) 4.250 4.250<br />
Management Incentive Program IV (MIP IV)<br />
A fourth share and option program was introduced in June 2008. The conditions of this share and option program are identical to the Management<br />
Incentive Program II of the Group except for the purchase price of the shares, which equals 75 % of the closing price of one<br />
share at the SIX Swiss Exchange on April 30, 2008. The difference between the discounted share price on the grant date and the share<br />
price paid by the participants is recognized as personnel expenses on the date of the issue of the shares. The plan is also divided into an<br />
“International Management Incentive Plan” and a “United States Management Incentive Plan.” The exercise price of options of the “International<br />
Management Incentive Plan” is equal to the closing price of one share at the SIX Swiss Exchange on April 30, 2008. The exercise<br />
price of options of the “United States Management Incentive Plan” is equal to the share price at the SIX Swiss Exchange on the grant date.<br />
Participants in the “International Management Incentive Plan IV” subscribed for 32,436 options with a strike price of CHF 132.00. Partici -<br />
pants in the “United States Management Incentive Plan IV” subscribed for 4,689 options with a strike price of CHF 122.40.<br />
The following table lists the parameters based on which the option valuation of both plans was performed:<br />
in CHF<br />
International<br />
Management<br />
Incentive<br />
Plan IV<br />
United States<br />
Management<br />
Incentive<br />
Plan IV<br />
Market price of share 122.40 122.40<br />
Exercise price of option 132.00 122.40<br />
Expected volatility (in %) 50.28 50.28<br />
Option life (in years) 5 5<br />
Dividend yield (in %) 2.39 2.39<br />
Risk-free interest rate based on Swiss government bonds (in %) 3.408 3.408<br />
Management Incentive Plan 08 / 09 (MIP 08 / 09)<br />
In 2009, the management introduced a new plan. The terms of this share and option program are identical to the Management Incentive<br />
Program IV as described above apart from the strike price of the “International Management Incentive Plan,” which equals the closing<br />
price of the share on the cut-off day at the SIX Swiss Exchange. Under this program participants of the “International Management Incentive<br />
Plan” received 65,921 options with a strike price of CHF 62.50 and participants of the “United States Management Incentive Plan”<br />
received 5,132 options with a strike price of CHF 83.05.<br />
The following table lists the parameters based on which the option valuation of both plans was performed:<br />
in CHF<br />
International<br />
Management<br />
Incentive<br />
Plan 08/09<br />
United States<br />
Management<br />
Incentive<br />
Plan 08/09<br />
Market price of share 83.05 83.05<br />
Exercise price of option 62.50 83.05<br />
Expected volatility (in %) 56.91 56.91<br />
Option life (in years) 5 5<br />
Dividend yield (in %) 2.84 2.84<br />
Risk-free interest rate based on Swiss government bonds (in %) 2.360 2.360
Management Incentive Plan 09 / 10 (MIP 09 / 10)<br />
Consolidated Financial Statements <strong>2011</strong><br />
In 2010 an additional management incentive plan was set up. Apart from the strike price of the “International Management Incentive<br />
Plan”, which equals the closing price of the share on the cut-off day at the SIX Swiss Exchange, the terms of this share and option<br />
program are identical to the Management Incentive Program 08/09. Under this program participants of the “International Management<br />
Incentive Plan” received 12,099 options with a strike price of CHF 97.60 and participants of the “United States Management<br />
Plan” received 1,354 options with a strike price of CHF 89.55.<br />
The weighted average fair value of the share options granted during the reporting period is determined using the binominal valuation<br />
model, applying the following significant inputs into the model:<br />
in CHF<br />
International<br />
Management<br />
Incentive<br />
Plan 09/10<br />
United States<br />
Management<br />
Incentive<br />
Plan 09/10<br />
Market price of share 89.55 89.55<br />
Exercise price of option 97.60 89.55<br />
Expected volatility (in %) 45.32 45.32<br />
Option life (in years) 5 5<br />
Dividend yield (in %) 1.63 1.63<br />
Risk-free interest rate based on Swiss government bonds (in %) 1.552 1.552<br />
The following table summarizes the movements in the number of share options outstanding and their related average exercise prices:<br />
Average exercise<br />
price<br />
per share<br />
(in CHF)<br />
<strong>2011</strong> 2010<br />
Options<br />
(number)<br />
Average exercise<br />
price<br />
per share<br />
(in CHF)<br />
Options<br />
(number)<br />
Options outstanding on January 1 115.72 173,692 114.79 179,369<br />
Granted 0.00 0 96.79 13,453<br />
Exercised 74.52 (16,065) 72.09 (11,196)<br />
Forfeited 71.62 (3,367) 92.70 (3,993)<br />
Expired 150.92 (5,808) 155.97 (3,941)<br />
Options outstanding on December 31 119.80 148,452 115.72 173,692<br />
Options exercisable on December 31 132.57 115,799 140.20 99,454<br />
During the reporting year the following numbers of options were exercised with the respective exercise prices:<br />
Exercise<br />
price<br />
of option<br />
(in CHF)<br />
<strong>2011</strong> 2010<br />
Number of<br />
exercised<br />
options<br />
Exercise<br />
price<br />
of option<br />
(in CHF)<br />
Number of<br />
exercised<br />
options<br />
International Management Incentive Plan II 111.30 3,435 111.30 2,152<br />
International Management Incentive Plan 08 / 09 62.50 11,781 62.50 8,930<br />
United States Management Incentive Plan 08 / 09 83.05 226 83.05 114<br />
International Management Incentive Plan 09 /10 97.60 501 0.00 0<br />
United States Management Incentive Plan 09 /10<br />
Weighted average exercise price of options exercised<br />
89.55 122 0.00 0<br />
during the year 74.52 72.09<br />
Panalpina <strong>Annual</strong> <strong>Report</strong> <strong>2011</strong><br />
91
92<br />
Consolidated Financial Statements <strong>2011</strong><br />
The average exercise prices and the expiry date of the outstanding options at period-end are as follows:<br />
Panalpina <strong>Annual</strong> <strong>Report</strong> <strong>2011</strong><br />
Average<br />
exercise price<br />
per share (in CHF)<br />
<strong>2011</strong><br />
Number of options<br />
expiring at year-end<br />
2012 111.68 29,635<br />
2013 206.45 30,061<br />
2014 130.70 32,439<br />
2015 64.55 44,095<br />
2016 96.79 12,222<br />
Total 119.80 148,452<br />
Management Incentive Plan 10 / 11 (MIP 10 / 11)<br />
In <strong>2011</strong> a new management incentive plan was set up. Participants in this program had the right to purchase shares with a discount of<br />
10 % based on the share price equal to the closing price on the SIX Swiss Stock Exchange at the cut-off day. The difference between the<br />
discounted share price on the grant date and the share price paid by the participants is recognized as personnel expenses on the date<br />
of the issue of the shares. The shares are subject to a one-year lock-up period. For every purchased share under this plan, the Group granted<br />
a number of free shares according to a “Free Share Ratio” which is annually set by the Compensation and Nomination Committee. For<br />
the current year the ratio was set to 1:4 (one free share per four shares bought). The free shares have a vesting period of one to three years.<br />
On non-vested free shares, no dividends are paid and there is no entitlement for dividends. The shares cannot be settled in cash. The<br />
fair value of the free shares corresponds to the market price of the shares at the grant date.<br />
<strong>2011</strong><br />
Management<br />
Incentive<br />
Plan 10/11<br />
Fair value of free share (in CHF) 119.30<br />
Granted free shares 7,124<br />
Vested free shares (138)<br />
Forfeited free shares (25)<br />
Free shares outstanding on December 31 6,961<br />
The Group holds its own shares in order to meet its obligations under the Management Incentive Programs. These own shares are deducted<br />
from equity (note 23).<br />
The members of the Executive Board and the Boards of Directors did not participate in the above-mentioned incentive plans.<br />
Executive Board Mid-Term Incentive Plan<br />
The Mid-Term Incentive Plan has been set up such that only 60 % of the bonuses, which continue to be set by the achievement of annually<br />
reviewed Group key performance indicators (KPIs) and individual performance targets, are paid out in cash, whereas the remainder is<br />
paid out in shares with a restriction period of one year. This number of shares will be matched by the Company after this restriction period.<br />
In addition, the members of the Executive Board will receive the corresponding number of shares, based on the share’s closing price on<br />
April 30, 2009 of CHF 62.50. These shares will thereafter be subject to a further one-year restriction period. In the reporting period under<br />
review Executive Board members received 40 % of the bonus in company shares totaling 13,528 shares (previous year: 4,155 shares) with<br />
a restriction period of one year. This number of shares will, additionally, be matched by the company after this restriction period. These<br />
additional shares are also subject to a further one-year restriction period.<br />
During the period under review the management received matched shares totaling 4,155 shares reflecting the 40 % bonus paid in the<br />
previous year.<br />
Executive Board Long-Term Incentive Plan<br />
The Long-Term Incentive Plan rewards long-term value creation measured by economic profit. Under this plan, which has a five-year<br />
cycle, the individual Executive Board member is entitled to an equal share of the respective pool after the expiry of the five-year plan<br />
period. This plan can be cash-settled. The carrying amount of the liability at December 31, <strong>2011</strong> amounts to CHF 2,527 thousand, which<br />
is also the intrinsic value.
9<br />
Board of Directors Restricted Stock Award Plan<br />
Consolidated Financial Statements <strong>2011</strong><br />
The Restricted Stock Award Plan for the Board of Directors was introduced in 2009. Part of the remuneration of each Board<br />
member is settled in free shares of the company. The corresponding number of shares per member will be based on the share’s closing<br />
price at the assignment date. The shares have a one-year restriction period. During the period under review the board of directors<br />
received 2,562 shares (2010: 0 shares)<br />
Costs of share-based compensation<br />
Recognized costs of share-based compensation were as follows:<br />
in CHF <strong>2011</strong> 2010<br />
Employee share plan 2,273,801 740,818<br />
Option plan 662,587 1,540,175<br />
Total cost of share-based payments 2,936,388 2,280,993<br />
Share-based compensation costs are not reported in operating segments. They are reported under Corporate.<br />
Other operating expenses<br />
in thousand CHF <strong>2011</strong> 2010<br />
Administrative expenses 37,905 61,786<br />
Communications expenses 64,949 65,346<br />
Rent and utilities expenses 183,294 185,815<br />
Travel and promotion expenses 42,717 38,222<br />
Insurance expenses and claims 6,352 131,632<br />
Bad debt and collection expenses 6,558 10,353<br />
Other 30,663 33,897<br />
Total other operating expenses 372,438 527,051<br />
Rent and utilities expenses include rentals amounting to CHF 103.6 million (2010: CHF 100.0 million) and lease of machinery, equipment<br />
and vehicles of CHF 20.2 million (2010: CHF 23.9 million). Bad debt and collection expenses include CHF 1.4 million (2010:<br />
CHF 2.2 million) of credit insurance premiums. In last year’s period, the Group recognized fines amounting to CHF 104.0 million as claim<br />
expenses (<strong>2011</strong>: none).<br />
10<br />
Gains and losses on sales of non-current assets<br />
in thousand CHF <strong>2011</strong> 2010<br />
Gains on sales of property, plant and equipment 618 1,103<br />
Losses on sales of property, plant and equipment (724) (826)<br />
Total net (losses)/gains on sales of non-current assets (106) 277<br />
Panalpina <strong>Annual</strong> <strong>Report</strong> <strong>2011</strong><br />
93
94<br />
11<br />
Consolidated Financial Statements <strong>2011</strong><br />
Finance income and costs<br />
in thousand CHF <strong>2011</strong> 2010<br />
Interest income<br />
Interest income on current bank accounts 3,986 3,795<br />
Interest income on financial assets at fair value through profit or loss 11 13<br />
Interest differential on forwards and swaps 1,741 1,750<br />
Interest income on loans 7 5<br />
Cash discount income 351 416<br />
Subtotal interest income 6,096 5,979<br />
Guarantee fees income 0 16<br />
Dividend on available-for-sale financial assets 172 99<br />
Fair value adjustments on financial assets 0 154<br />
Total finance income 6,268 6,248<br />
Interest expenses<br />
Interest expenses on loans (242) (642)<br />
Interest expenses on current bank accounts (760) (1,041)<br />
Interest differential on forwards and swaps (4,345) (3,493)<br />
Interest expenses on financial leasing (71) (86)<br />
Cash discount expenses (514) (254)<br />
Subtotal interest expenses (5,932) (5,516)<br />
Bank charges (2,277) (2,958)<br />
Exchange differences (2,840) (609)<br />
Guarantee fees expenses (529) (760)<br />
Other financial expenses (303) (886)<br />
Impairment on financial assets 0 (4,759)<br />
Fair value adjustments on financial assets (22) 0<br />
Total finance costs (11,903) (15,488)<br />
Net finance costs (5,635) (9,240)<br />
12<br />
Income tax expenses<br />
in thousand CHF <strong>2011</strong> 2010<br />
Current income taxes<br />
Current period 37,064 43,457<br />
Adjustments for prior periods 1,566 883<br />
Total income taxes 38,630 44,340<br />
Deferred income taxes (note 27)<br />
Origination and reversal of taxes on temporary differences and on tax loss carry forwards 1,931 (12,384)<br />
Effect of changes in the tax rate on temporary differences 980 305<br />
Utilization of non-recognized tax loss carry-forwards (372) (142)<br />
Total deferred income taxes 2,539 (12,221)<br />
Total income tax expenses 41,169 32,119<br />
Management decided to calculate the applicable standard tax rate as in the previous year based on the standard tax rate in its Basel<br />
headquarters domicile.<br />
Panalpina <strong>Annual</strong> <strong>Report</strong> <strong>2011</strong>
The Group’s effective tax rate can be reconciled to the Group’s average expected tax rate as follows:<br />
Consolidated Financial Statements <strong>2011</strong><br />
in thousand CHF <strong>2011</strong> 2010<br />
Profit before income tax 168,582 6,122<br />
Tax at the applicable tax rate of 23.37 % (2010: 23.37 %) 39,398 1,431<br />
Effect of differing national tax rates (17,375) (6,479)<br />
Utilization of not yet recognized tax loss carry-forwards (372) (142)<br />
Recognition of deferred tax assets from previous periods (2,835) (259)<br />
Not yet recognized tax loss carry-forwards 13,510 13,434<br />
Adjustment of previous year tax provision 1,566 883<br />
Effect of changes in the tax rate on temporary differences 980 305<br />
Withholding tax on dividends received 3,339 4,907<br />
Expenses not deductible for tax purposes and non-taxable income 1,840 17,298<br />
Miscellaneous 1,118 741<br />
Actual tax charge 41,169 32,119<br />
The following table shows the reconciliation for <strong>2011</strong> in percent:<br />
Tax at the applicable tax rate of 23.37 % 23.37 %<br />
Effect of differing national tax rates (10.31 %)<br />
Utilization of not yet recognized tax loss carry-forwards (0.22 %)<br />
Recognition of deferred tax assets from previous periods (1.68 %)<br />
Not yet recognized tax loss carry-forwards 8.01 %<br />
Adjustment of previous year tax provision 0.93 %<br />
Effect of changes in the tax rate on temporary differences 0.58 %<br />
Withholding tax on dividends received 1.98 %<br />
Expenses not deductible for tax purposes and non-taxable income 1.09 %<br />
Miscellaneous 0.66 %<br />
Actual tax charge 24.42 %<br />
Income tax recognized in the consolidated statement of comprehensive income:<br />
in thousand CHF<br />
Before tax<br />
<strong>2011</strong> 2010<br />
Tax benefit<br />
(expense)<br />
Net of tax<br />
Before tax<br />
Tax benefit<br />
(expense)<br />
<strong>2011</strong><br />
Net of tax<br />
Translation and exchange differences (11,238) 0 (11,238) (15,027) 0 (15,027)<br />
Available-for-sale financial assets 3,994 0 3,994 (1,828) 0 (1,828)<br />
Other taxes directly recognized in equity<br />
Actuarial gains (losses)<br />
0 (123) (123) 0 (123) (123)<br />
on defined benefit plans (22,134) 5,419 (16,715) (10,596) 5,412 (5,184)<br />
Total (29,378) 5,296 (24,082) (27,451) 5,289 (22,162)<br />
Panalpina <strong>Annual</strong> <strong>Report</strong> <strong>2011</strong><br />
95
96<br />
Consolidated Financial Statements <strong>2011</strong><br />
13<br />
Earnings per share<br />
Basic earnings per share<br />
Basic earnings per share is calculated by dividing the profit attributable to ordinary shareholders of the Company by the weighted average<br />
number of ordinary shares outstanding (total shares less treasury shares) during the period.<br />
in thousand CHF <strong>2011</strong> 2010<br />
Consolidated profit attributable to owners of the parent 126,294 (27,350)<br />
Weighted average number of ordinary shares outstanding 23,639 23,668<br />
Basic earnings per share (in CHF) 5.34 (1.16)<br />
Diluted earnings per share<br />
Diluted earnings per share is calculated by adjusting the weighted average number of ordinary shares outstanding to assume conversion<br />
of all dilutive potential ordinary shares. The Group only has share options outstanding that can be categorized as dilutive potential ordinary<br />
shares. For the share options, a calculation is made to determine the number of shares that could have been acquired at fair value based<br />
on the monetary value of the subscription rights attached to outstanding share options. The number of shares calculated as above is compared<br />
with the number of shares that would have been issued assuming the exercise of the share options.<br />
in thousand CHF <strong>2011</strong> 2010<br />
Consolidated profit attributable to owners of the parent 126,294 (27,350)<br />
Weighted average number of ordinary shares outstanding 23,639 23,668<br />
Adjustments for share options 17 7<br />
Adjustments for share ownership program 20 4<br />
Weighted average number of ordinary shares for diluted earnings per share 23,676 23,679<br />
Diluted earnings per share (in CHF) 5.33 (1.16)<br />
At December 31, <strong>2011</strong>, 103,125 options (2010: 66,946 options) were excluded from the diluted weighted average number of ordinary shares<br />
calculation as their effect would have been anti-dilutive.<br />
Panalpina <strong>Annual</strong> <strong>Report</strong> <strong>2011</strong>
14<br />
Property, plant and equipment<br />
Consolidated Financial Statements <strong>2011</strong><br />
During the period under review, the Group acquired mainly machinery and equipment. The reclassification of CHF 14.3 million in 2010<br />
from construction in progress mainly to buildings refers to the commissioning of a new warehouse in Dubai. In 2010, the net assets of two<br />
barges were revalued. As the recoverable amount of these assets did not exceed the carrying amount, an impairment of CHF 4.7 million<br />
was recognized in 2010 (<strong>2011</strong>: CHF 0.0).<br />
<strong>2011</strong> (in thousand CHF)<br />
Land and<br />
buildings<br />
Machinery<br />
and<br />
equipment<br />
Vehicles<br />
Construc-<br />
tion in<br />
progress<br />
Acquisition costs<br />
Balance on January 1 130,222 215,619 39,669 5 385,515<br />
Translation differences (1,962) (4,008) (326) 0 (6,296)<br />
Acquisition of subsidiaries, net of cash acquired 39 258 147 0 444<br />
Additions 8,874 20,902 1,512 37 31,325<br />
Disposals (2,518) (2,485) (4,693) 0 (9,696)<br />
Reclassifications 5 0 0 (5) 0<br />
Balance on December 31 134,660 230,286 36,309 37 401,292<br />
Accumulated depreciation<br />
Balance on January 1 70,694 170,418 30,570 0 271,682<br />
Translation differences (894) (2,926) (277) 0 (4,097)<br />
Additions 6,344 19,280 2,860 0 28,484<br />
Disposals (1,552) (1,805) (4,600) 0 (7,957)<br />
Balance on December 31 74,592 184,967 28,553 0 288,112<br />
Net book value on January 1 59,528 45,201 9,099 5 113,833<br />
Net book value on December 31 60,068 45,319 7,756 37 113,180<br />
Of which net book value of assets<br />
acquired under finance leases 245 51 1,138 0 1,434<br />
2010 (in thousand CHF)<br />
Land and<br />
buildings<br />
Machinery<br />
and<br />
equipment<br />
Vehicles<br />
Construc-<br />
tion in<br />
progress<br />
Acquisition costs<br />
Balance on January 1 133,833 239,225 41,401 15,749 430,208<br />
Translation differences (16,261) (20,515) (3,740) (1,418) (41,934)<br />
Acquisition of subsidiaries, net of cash acquired 1 68 65 0 134<br />
Additions 5,169 18,062 3,109 2 26,342<br />
Disposals (4,310) (23,068) (1,857) 0 (29,235)<br />
Reclassifications 11,790 1,847 691 (14,328) 0<br />
Balance on December 31 130,222 215,619 39,669 5 385,515<br />
Accumulated depreciation<br />
Balance on January 1 76,401 189,162 23,372 0 288,935<br />
Translation differences (9,248) (17,260) (3,133) 0 (29,641)<br />
Additions 6,756 20,757 11,378 0 38,891<br />
Disposals (3,215) (22,240) (1,048) 0 (26,503)<br />
Reclassifications 0 (1) 1 0 0<br />
Balance on December 31 70,694 170,418 30,570 0 271,682<br />
Net book value on January 1 57,432 50,063 18,029 15,749 141,273<br />
Net book value on December 31 59,528 45,201 9,099 5 113,833<br />
Of which net book value of assets<br />
acquired under finance leases 304 44 1,236 0 1,584<br />
Total<br />
Total<br />
Panalpina <strong>Annual</strong> <strong>Report</strong> <strong>2011</strong><br />
97
98<br />
Consolidated Financial Statements <strong>2011</strong><br />
15<br />
Intangible assets<br />
<strong>2011</strong> (in thousand CHF)<br />
Panalpina <strong>Annual</strong> <strong>Report</strong> <strong>2011</strong><br />
Goodwill<br />
Software<br />
Brands/<br />
Customer<br />
lists<br />
Other<br />
intangible<br />
assets<br />
Acquisition costs<br />
Balance on January 1 44,549 72,724 22,763 656 140,692<br />
Translation differences (2,701) (901) (1,172) (54) (4,828)<br />
Acquisition of subsidiaries, net of cash acquired 40,869 0 15,927 0 56,796<br />
Additions 0 19,731 0 106 19,837<br />
Disposals 0 (2,635) 0 0 (2,635)<br />
Balance on December 31 82,717 88,919 37,518 708 209,862<br />
Accumulated depreciation or impairment losses<br />
Balance on January 1 1,598 41,499 18,891 613 62,601<br />
Translation differences (260) (670) (250) (50) (1,230)<br />
Additions 0 6,684 2,649 50 9,383<br />
Disposals 0 (2,635) 0 0 (2,635)<br />
Balance on December 31 1,338 44,878 21,290 613 68,119<br />
Net book value on January 1 42,951 31,225 3,872 43 78,091<br />
Net book value on December 31 81,379 44,041 16,228 95 141,743<br />
2010 (in thousand CHF)<br />
Goodwill<br />
Software<br />
Brands/<br />
Customer<br />
lists<br />
Other<br />
intangible<br />
assets<br />
Acquisition costs<br />
Balance on January 1 44,315 63,879 23,651 688 132,533<br />
Translation differences (1,170) (3,831) (1,732) (44) (6,777)<br />
Acquisition of subsidiaries, net of cash acquired 1,404 2 844 0 2,250<br />
Additions 0 13,677 0 21 13,698<br />
Disposals 0 (1,003) 0 (9) (1,012)<br />
Balance on December 31 44,549 72,724 22,763 656 140,692<br />
Accumulated depreciation or impairment losses<br />
Balance on January 1 1,823 39,570 18,755 508 60,656<br />
Translation differences (225) (3,453) (1,433) (45) (5,156)<br />
Additions 0 6,385 1,569 159 8,113<br />
Disposals 0 (1,003) 0 (9) (1,012)<br />
Balance on December 31 1,598 41,499 18,891 613 62,601<br />
Net book value on January 1 42,492 24,309 4,896 180 71,877<br />
Net book value on December 31 42,951 31,225 3,872 43 78,091<br />
The net book value of software is comprised of accumulated, internally generated, capitalized software development costs of CHF 33.4 million<br />
(2010: CHF 22.6 million). All intangible assets with estimable useful lives are amortized over the period of their respective estimated<br />
useful lives to their estimated residual values, and reviewed for impairment. Neither in <strong>2011</strong> nor 2010 there were any impairment charges<br />
on these intangible assets.<br />
Impairment test for goodwill<br />
Goodwill is allocated to the Group’s cash-generating units (CGUs) identified according to the country of operation. The recoverable amount<br />
of a CGU is determined based on value-in-use calculations. These calculations use cash flow projections based on financial budgets<br />
ap proved by management covering a five-year period. Cash flows beyond the five-year period are extrapolated using the estimated growth<br />
rates stated below. The growth rate does not exceed the long-term average growth rate for the business in which the CGU operates.<br />
Total<br />
Total
A summary of the goodwill allocation per CGU is presented below:<br />
Consolidated Financial Statements <strong>2011</strong><br />
in thousand CHF <strong>2011</strong> 2010<br />
Air freight division (CGU Airfreight) 31,151 31,151<br />
Grampian International Freight Aberdeen & Beverwijk (CGU Grampian) 6,393 6,388<br />
Panalpina World Transport (Singapore) Pte. Ltd. (CGU Janco) 3,981 4,008<br />
Panalpina World Transport (Pty) Ltd. (CGU Australia) 3,606 1,404<br />
Grieg Logistics AS (CGU Norway) 36,248 0<br />
Total goodwill 81,379 42,951<br />
The following key assumptions have been used for the value-in-use calculations of each CGU:<br />
<strong>2011</strong><br />
CGU<br />
Norway<br />
CGU<br />
Australia<br />
CGU<br />
Airfreight<br />
CGU<br />
Grampian<br />
CGU<br />
Janco<br />
Growth rate1 9.25 % 6.75 % 3.50 % 7.25 % 4.50 %<br />
Operating expenses in % of forwarding revenues2 97.62 % 98.73 % 98.19 % 99.83 % 98.73 %<br />
WACC3 7.57 % 11.18 % 6.65 % 8.08 % 6.85 %<br />
2010<br />
CGU<br />
Australia<br />
CGU<br />
Airfreight<br />
CGU<br />
Grampian<br />
CGU<br />
Janco<br />
Growth rate1 4.50 % 2.25 % 4.63 % 3.13 %<br />
Operating expenses in % of forwarding revenues2 96.87 % 98.37 % 98.62 % 97.74 %<br />
WACC3 15.53 % 10.44 % 12.60 % 10.51 %<br />
1 Weighted average growth rate used to extrapolate cash flows beyond the budget period<br />
2 Budgeted operating expenses in % of forwarding revenues<br />
3 Pre-tax discount rate applied to the cash flow projections<br />
The management determined budgeted growth rates based on past performance and its expectations of market development. The operating<br />
expenses, as a percentage of forwarding revenues, are consistent with the forecasts and past experience. The weighted average<br />
cost of capital (WACC) used are pre-tax and reflect specific risks relating to the relevant CGUs. For the impairment testing procedure the<br />
planning assumptions of prior years were critically reviewed. The impairment testing procedure assumes that the CGU would achieve<br />
sales growth at market growth for the planning period. It was also assumed that the percentage of operating expenses as a percentage of<br />
forwarding revenue, will remain stable.<br />
For CGU Grampian a change in the assumptions of the growth rate of the gross profit (2.6 percentage points) or the WACC (1.8 percentage<br />
points) would cause the carrying value of goodwill to exceed the recoverable amount. The same applies for CGU Norway for which<br />
a change in the assumptions of the growth rate of the gross profit (2.9 percentage points) or the WACC (2.7 percentage points) would also<br />
cause the carrying value of goodwill to exceed the recoverable amount.<br />
For other CGUs the carrying value of goodwill would only exceed the recoverable amount if following changes in the key assumptions gross<br />
profit growth or WACC would occur:<br />
CGU Airfreight<br />
Gross profit growth rate – 54.5 percentage points<br />
WACC + 34.6 percentage points<br />
CGU Janco<br />
Gross profit growth rate – 30.3 percentage points<br />
WACC + 8.6 percentage points<br />
CGU Grampian<br />
Gross profit growth rate – 2.6 percentage points<br />
WACC + 1.8 percentage points<br />
CGU Australia<br />
Gross profit growth rate – 58.5 percentage points<br />
WACC + 34.6 percentage points<br />
CGU Norway<br />
Gross profit growth rate – 2.9 percentage points<br />
WACC + 2.7 percentage points<br />
Panalpina <strong>Annual</strong> <strong>Report</strong> <strong>2011</strong><br />
99
100<br />
16<br />
Consolidated Financial Statements <strong>2011</strong><br />
Investments<br />
in thousand CHF <strong>2011</strong> 2010<br />
Available-for-sale investments 19,670 15,625<br />
Fair value through profit or loss investments 775 816<br />
Loans receivable 311 208<br />
Long-term receivables 47,975 14,061<br />
Other 3,525 4,133<br />
Total investments 72,256 34,843<br />
Long-term receivables primarily include rental and guarantee deposits of CHF 13.7 million (2010: CHF 12.8 million) and investments in<br />
money market and time deposits with a maturity longer than 360 days of CHF 34.3 million (2010: CHF 0.0 million).<br />
Available-for-sale investments – unquoted equity shares<br />
in thousand CHF <strong>2011</strong> 2010<br />
Balance on January 1 15,625 17,794<br />
Translation differences (13) (78)<br />
Additions 69 5<br />
Disposals (5) (142)<br />
Fair value adjustments recognized in statement of comprehensive income 3,994 (1,702)<br />
Reclassifications 0 (252)<br />
Balance on December 31 19,670 15,625<br />
Less: non-current portion 19,670 15,625<br />
Current portion 0 0<br />
In <strong>2011</strong>, no shares (2010: shares of CHF 252 thousand) were transferred from available-for-sale investments to fair value through profit or<br />
loss. Fair value adjustments amounting to CHF 126 thousand previously recorded in comprehensive income are recognized in the income<br />
statement (<strong>2011</strong>: CHF 0).<br />
Fair value through profit or loss investments<br />
in thousand CHF <strong>2011</strong> 2010<br />
Balance on January 1 816 618<br />
Translation differences (12) (85)<br />
Disposals (7) (8)<br />
Fair value adjustments recognized in profit or loss (22) 39<br />
Reclassifications 0 252<br />
Balance on December 31 775 816<br />
Less: non-current portion 775 816<br />
Current portion 0 0<br />
17<br />
Group risk management<br />
In the field of risk management, the Audit Committee approves the detailed and weighted risk map of the Executive Board. It adopts the<br />
necessary measures for risk control and risk mitigation and reports the respective outcome to the Board of Directors on an annual basis.<br />
The risk map itself covers any strategic, financial, operational, legal and compliance risks that could significantly impact the Company’s<br />
ability to achieve its business goals and financial targets. Identified risks are weighted and prioritized by the Executive Board according to<br />
their significance and likelihood of occurrence. For each risk, specific risk-mitigation measures – including their current status – are defined<br />
and responsibilities are allocated. The risk map, which is compiled by the Risk Review Committee, chaired by the Corporate Secretary, for<br />
Panalpina <strong>Annual</strong> <strong>Report</strong> <strong>2011</strong>
Consolidated Financial Statements <strong>2011</strong><br />
review by the Executive Board and the Audit Committee and subsequently approved by the Audit Committee, contains risks iden tified and<br />
assessed by the respective corporate functions, selected country management, Corporate Audit and the Group auditors. The annual risk<br />
map also features risks which have increased or decreased in the course of the reporting year. Financial risk management specifically is<br />
described in further detail below.<br />
18<br />
Financial risk management<br />
The Group’s principal financial liabilities, other than derivatives, comprise loans and borrowings, trade and other payables. The main purpose<br />
of these financial liabilities is to raise funds for Group operations. The Group has trade and other receivables, loans, cash, short and<br />
long-term deposits that arise directly from its operations. The Group also holds available-for-sale investments and enters into deriva-tive<br />
transactions.<br />
The Group is exposed to market risk, credit risk and liquidity risk. The Group’s senior management oversees the management of these risks.<br />
It is supported by a financial risk committee that advises on financial risks and the appropriate financial risk governance framework for the<br />
Group. The financial risk committee provides assurance to the Group’s senior management that the Group’s financial risk-taking activities are<br />
governed by appropriate policies and procedures and that financial risks are identified, measured and managed in accor dance with<br />
Group policies and Group risk appetite. All derivative activities for risk management purposes are carried out by specialist teams that have<br />
the appropriate skills, experience and supervision. It is the Group’s policy that no trading in derivatives for speculative purposes shall<br />
be undertaken.<br />
The Board of Directors reviews and agrees on policies for managing each of these risks, which are summarized below.<br />
Financial risk factors<br />
Carrying amount and fair value of financial assets by asset classes<br />
<strong>2011</strong> (in thousand CHF)<br />
Cash<br />
Available-<br />
for-sale<br />
Fair value<br />
through<br />
profit or<br />
loss held<br />
for trading<br />
Loans and<br />
receivables<br />
Carrying<br />
amount<br />
Total<br />
(fair value)<br />
Trade receivables and other receivables 1,002,163 1,002,163 1,002,163<br />
Unbilled forwarding services 77,346 77,346 77,346<br />
Accrued interest income 757 757 757<br />
Cash and cash equivalents 1,693 571,886 573,579 573,579<br />
Other current financial assets 20,000 20,000 20,000<br />
Derivative financial instruments<br />
Investments:<br />
5,504 5,504 5,504<br />
Bonds and debentures 171 171 171<br />
Shares 19,670 379 20,049 20,049<br />
Other investments 225 225 225<br />
Third-party loans 373 373 373<br />
Rental and guarantee deposits 47,975 47,975 47,975<br />
Other 3,525 3,525 3,525<br />
Total on December 31, <strong>2011</strong> 1,693 19,670 6,279 1,724,025 1,751,667 1,751,667<br />
<strong>2011</strong> (in thousand CHF)<br />
Financial<br />
liabilities at<br />
fair value<br />
through<br />
profit or loss<br />
Financial<br />
liabilities<br />
measured<br />
at amortized<br />
cost<br />
Carrying<br />
amount<br />
Total<br />
(fair value)<br />
Payables and accruals 915,529 915,529 915,529<br />
Borrowings 6,921 6,921 6,921<br />
Finance lease liabilities 606 606 606<br />
Derivative financial instruments 4,648 4,648 4,648<br />
Provisions and other liabilities 50,852 50,852 50,852<br />
Total on December 31, <strong>2011</strong> 4,648 973,908 978,556 978,556<br />
Panalpina <strong>Annual</strong> <strong>Report</strong> <strong>2011</strong><br />
101
102<br />
Consolidated Financial Statements <strong>2011</strong><br />
2010 (in thousand CHF)<br />
Panalpina <strong>Annual</strong> <strong>Report</strong> <strong>2011</strong><br />
Cash<br />
Available-<br />
for-sale<br />
Fair value<br />
through<br />
profit or<br />
loss held<br />
for trading<br />
Loans and<br />
receivables<br />
Carrying<br />
amount<br />
Total<br />
(fair value)<br />
Trade receivables and other receivables 1,055,438 1,055,438 1,055,438<br />
Unbilled forwarding services 74,742 74,742 74,742<br />
Accrued interest income 340 340 340<br />
Cash and cash equivalents 1,423 527,513 528,936 528,936<br />
Other current financial assets 6,089 6,089 6,089<br />
Derivative financial instruments<br />
Investments:<br />
20,454 20,454 20,454<br />
Bonds and debentures 181 181 181<br />
Shares 15,625 394 16,019 16,019<br />
Other investments 241 241 241<br />
Third-party loans 354 354 354<br />
Rental and guarantee deposits 12,849 12,849 12,849<br />
Total on December 31, 2010 1,423 15,625 21,270 1,677,325 1,715,643 1,715,643<br />
2010 (in thousand CHF)<br />
Financial<br />
liabilities at<br />
fair value<br />
through<br />
profit or loss<br />
Financial<br />
liabilities<br />
measured<br />
at amortized<br />
cost<br />
Carrying<br />
amount<br />
Total<br />
(fair value)<br />
Payables and accruals 830,310 830,310 830,310<br />
Borrowings 8,858 8,858 8,858<br />
Finance lease liabilities 879 879 992<br />
Derivative financial instruments 5,532 5,532 5,532<br />
Provisions and other liabilities 120,451 120,451 120,451<br />
Total on December 31, 2010 5,532 960,498 966,030 966,143<br />
Fair value hierarchy<br />
The table below analyzes financial instruments carried at fair value, by valuation method. The different levels have been defined as follows:<br />
• Level 1: quoted prices (unadjusted) in active markets for identical assets or liabilities<br />
• Level 2: inputs other than quoted prices included within level 1 that are observable for the asset or liability, either directly<br />
(ie, as prices) or indirectly (ie, derived from prices)<br />
• Level 3: inputs for the asset or liability that are not based on observable market data (unobservable inputs).
Consolidated Financial Statements <strong>2011</strong><br />
<strong>2011</strong> (in thousand CHF) Level 1 Level 2 Level 3 Total<br />
Available-for-sale financial assets 0 1,715 17,640 19,355<br />
Financial assets at fair value through profit or loss held for trading 663 112 0 775<br />
Derivative financial assets 0 5,504 0 5,504<br />
Available-for-sale financial assets at cost 315<br />
Total 25,949<br />
Derivative financial liabilities 0 4,648 0 4,648<br />
Total 4,648<br />
2010 (in thousand CHF) Level 1 Level 2 Level 3 Total<br />
Available-for-sale financial assets 0 1,074 14,228 15,302<br />
Financial assets at fair value through profit or loss held for trading 691 125 0 816<br />
Derivative financial assets 0 20,454 0 20,454<br />
Available-for-sale financial assets at cost 323<br />
Total 36,895<br />
Derivative financial liabilities 0 5,532 0 5,532<br />
Total 5,532<br />
The fair value of financial instruments traded in active markets is based on quoted market prices at the statement of financial position<br />
date. A market is regarded as active if quoted prices are readily and regularly available from an exchange, dealer, broker, industry group,<br />
pricing service or regulatory agency, and those prices represent actual and regularly occurring market transactions on an arm’s-length<br />
basis. The quoted market price used for financial assets held by the Group is the current bid price. These instruments are included in level 1.<br />
The fair value of financial instruments that are not traded in an active market (for example, over-the-counter derivatives) is determined<br />
by using valuation techniques. These valuation techniques maximize the use of observable market data where it is available and rely, as little<br />
as possible, on entity-specific estimates. If all significant inputs required to fair-value an instrument are observable, the instrument is<br />
included in level 2.<br />
If one or more of the significant inputs is not based on observable market data, the instrument is included in level 3. Neither in 2010 nor in<br />
<strong>2011</strong> investments have been sold.<br />
The Group used the discounted cash flow method to determine the fair value of level 3 financial instruments.<br />
The following table presents the changes in level 3 instruments for the year ended December 31, <strong>2011</strong>:<br />
in thousand CHF<br />
Available-for-sale<br />
financial assets<br />
Balance on January 1 14,228 14,228<br />
Fair-value adjustments in statement of comprehensive income 3,412 3,412<br />
Balance on December 31<br />
Total gains or losses for the period included in the statement of comprehensive income for assets<br />
17,640 17,640<br />
held at the end of the reporting period 3,412 3,412<br />
Neither in <strong>2011</strong> nor in 2010 did the Group transfer financial instruments into another level.<br />
Market risk<br />
Market risk is the risk that the fair value of future cash flows of a financial instrument will fluctuate due to changes in market price. Market<br />
prices entail three types of risk: foreign currency risk, interest rate risk and other price risk such as equity risk.<br />
The Group’s activities expose it primarily to financial risk due to changes in foreign currency exchange rates.<br />
Total<br />
Panalpina <strong>Annual</strong> <strong>Report</strong> <strong>2011</strong><br />
103
104<br />
Consolidated Financial Statements <strong>2011</strong><br />
Foreign currency risk<br />
The Group operates internationally and is exposed to foreign exchange risk arising from various currency exposures, primarily in regard<br />
to the US dollar and the euro. Foreign exchange risk arises from future commercial transactions, recognized assets and liabilities as well as<br />
net investments in foreign operations.<br />
Management has set up a policy to require Group companies to manage their foreign exchange risk against their functional currency. The<br />
Group companies are required to hedge their entire foreign exchange risk exposure with the Group Treasury, if possible. To manage foreign<br />
exchange risks arising from future commercial transactions or recognized assets and liabilities, entities in the Group use forward contracts.<br />
Foreign exchange risk arises when future commercial transactions or recognized assets and liabilities are denominated in a currency that<br />
is not the Group entity’s functional currency. The Group Treasury is responsible for managing the net position using external derivative<br />
contracts. For segment reporting purposes, each subsidiary designates contracts with the Group Treasury as fair value hedges. External<br />
foreign exchange contracts are designated at the Group level as hedges of foreign exchange risk on specific assets and liabilities on a<br />
gross basis.<br />
At December 31, <strong>2011</strong>, the Group’s net foreign currency risk exposure amounted to CHF 9.4 million (2010: CHF 31.6 million). The<br />
following table demonstrates the sensitivity to a reasonable possible change of 10 % in the USD, EUR and HKD exchange rate, with all<br />
other variables held constant, of the Group’s profit before income tax (due to changes in the fair value of monetary assets and liabilities).<br />
Profit before income tax<br />
Effect in thousand CHF <strong>2011</strong> 2010<br />
Euro (1,648) 371<br />
US dollar (105) (2,286)<br />
Hong Kong dollar (947) (896)<br />
Total effect (2,700) (2,811)<br />
The movement in the pre-tax effect results from the change in the fair value of derivative financial instruments not designated in a hedging<br />
relationship and monetary assets and liabilities denominated in USD, EUR and HKD, in which the functional currency of the entity is a currency<br />
other than USD, EUR or HKD. Although the derivatives have not been designated in a hedge relationship, they act as a commercial<br />
hedge and will offset the underlying transactions should they occur. If the exchange rates of all currencies changed by 10 %, the total<br />
maximum net effect would amount to CHF 0.9 million (2010: CHF 3.2 million).<br />
Interest rate risk<br />
The Group has a clear funding policy that prohibits affiliates from borrowing in foreign currency and has a clear preference for intragroup<br />
financing. Affiliates are also required to repatriate their excess cash. Liquidity is mainly managed at the corporate level by using money market<br />
products. Derivative instruments are used to manage the duration of financial instruments in a prudent manner.<br />
As the Group generally has no significant interest-bearing liabilities, and given their short-term nature, the Group has a limited exposure to interest<br />
rate risk. Consequently the Group’s expense and operating cash flows are substantially independent of changes in market interest rates.<br />
Credit risk<br />
Credit risk is the risk that a counterparty will not meet its obligations under a financial instrument or customer contract, leading to a<br />
finan cial loss. The Group is exposed to credit risk from its operating activities (primarily for trade receivables) and from its financing activities,<br />
including deposits with banks and other financial institutions, foreign exchange transactions and other financial instruments.<br />
Credit risk related to trade receivables<br />
Customer credit is managed by each business unit and subject to the Group’s established policy, procedures and control relating to customer<br />
credit risk management. Credit limits are established for all customers based on external ratings or, if not available, according<br />
to internal rating criteria. The customer’s credit quality is assessed based on an extensive credit rating scorecard. Outstanding customer<br />
receivables are regularly monitored. The objective of the management of trade receivables is to sustain the growth and profitability of<br />
the Group by optimizing asset utilization while maintaining risks at an acceptable level. There is no significant concentration of counterparty<br />
credit risk due to the Group’s large number of customers and their wide geographical spread. Risk limits and exposures are continuously<br />
monitored by country and by the nature of counterparties. Additionally, the Group obtains credit insurance and similar enhancements when<br />
appropriate to protect the collection of trade receivables.<br />
Credit risk related to financial instruments and cash deposit<br />
Credit risk from balances with banks and financial institutions is managed by the Group Treasury in accordance with the Group’s policy.<br />
Investments of surplus funds are made only with approved counterparties and with credit limits assigned to each counterparty with a minimum<br />
rating of A. Counterparty credit limits are reviewed by senior management on a regular basis. The limits are set to minimize the<br />
concentra tion of risks and therefore mitigate financial loss through potential counterparty failure.<br />
Panalpina <strong>Annual</strong> <strong>Report</strong> <strong>2011</strong>
The table below shows the Group’s maximum exposure to credit risk:<br />
Consolidated Financial Statements <strong>2011</strong><br />
in thousand CHF <strong>2011</strong> 2010<br />
Cash and cash equivalents (without cash in hand) 571,886 527,513<br />
Derivative financial instruments 5,504 20,454<br />
Trade receivables and other receivables 1,106,317 1,057,090<br />
Loans and other financial assets 49,123 18,547<br />
Total financial assets shown in statement of financial position subject to credit risk 1,732,830 1,623,604<br />
Guarantees 242,045 134,169<br />
Total credit risk 1,974,875 1,757,773<br />
Liquidity risk<br />
Liquidity risk is the risk that the Group will not be able to meet its financial obligations as they become due. The Group’s approach to<br />
managing liquidity is to ensure, to the extent possible, that it will always have sufficient liquidity to meet its liabilities when due, under both<br />
normal and stressed conditions, without incurring unacceptable losses or risking damage to the Group’s reputation.<br />
The Group’s objective is to maintain a balance between continuity of funding and flexibility through the use of overdrafts, bank loans,<br />
de bentures, finance leases and hire purchase contracts. The Group’s liquidity is reported to the Management on a monthly basis.<br />
To secure liquidity, the Group holds a net cash position of CHF 586.1 million (2010: CHF 525.3 million) and credit lines with various finan cial<br />
institutions totaling CHF 515.9 million (2010: CHF 520.9 million). Of this total, CHF 179.8 million (2010: CHF 190.9 million) is allocated to<br />
bank guarantees and foreign exchange lines.<br />
The table below summarizes the maturity profile of the Group’s financial liabilities on December 31, <strong>2011</strong>/2010 based on contractual<br />
un discounted payments.<br />
<strong>2011</strong> (in thousand CHF)<br />
between<br />
1 and 3 months<br />
between<br />
3 months and<br />
1 year<br />
between<br />
1 and 5 years<br />
Total remaining<br />
contractual<br />
payments<br />
Borrowings (note 25) 2,838 4,457 232 7,527<br />
Trade and other payables 633,436 29,545 0 662,981<br />
Accruals 223,462 29,086 0 252,548<br />
Other liabilities<br />
Foreign exchange contracts<br />
21,193 8,051 0 29,244<br />
Cash inflow (800,997) (15,204) (6,115) (822,316)<br />
Cash outflow 765,705 15,558 5,723 786,986<br />
Total 845,637 71,493 (160) 916,970<br />
2010 (in thousand CHF)<br />
between<br />
1 and 3 months<br />
between<br />
3 months and<br />
1 year<br />
between<br />
1 and 5 years<br />
Total remaining<br />
contractual<br />
payments<br />
Borrowings (note 25) 2,884 6,451 403 9,738<br />
Trade and other payables 557,671 24,372 9,971 592,014<br />
Accruals 217,396 14,821 6,080 238,297<br />
Provisions and other liabilities<br />
Foreign exchange contracts<br />
80,311 40,142 0 120,453<br />
Cash inflow (750,894) (65,039) (7,025) (822,958)<br />
Cash outflow 737,807 63,495 7,541 808,843<br />
Total 845,175 84,242 16,970 946,387<br />
Panalpina <strong>Annual</strong> <strong>Report</strong> <strong>2011</strong><br />
105
106<br />
Consolidated Financial Statements <strong>2011</strong><br />
Capital risk management<br />
The Group’s objectives when managing capital are to safeguard its ability to continue as an ongoing concern so as to provide returns<br />
for shareholders and benefits for other stakeholders and to maintain an optimal capital structure to reduce the cost of capital.<br />
In order to maintain or adjust the capital structure, the Group may adjust the amount of dividends paid to shareholders, return capital to<br />
shareholders, issue new shares or sell assets to reduce debts.<br />
Capital is monitored on the basis of the equity ratio, which is calculated as equity (including non-controlling interests) as a percentage of total<br />
assets. This is reported to the management as part of the Group’s regular internal management reporting.<br />
The Group’s capital and equity ratio is shown in the table below:<br />
in thousand CHF <strong>2011</strong> 2010<br />
Capital and reserves attributable to Panalpina shareholders 905,808 804,279<br />
Equity attributable to non-controlling interests 9,082 7,890<br />
Total equity 914,890 812,169<br />
Total assets 2,135,322 1,989,242<br />
Equity ratio 42.8% 40.8%<br />
The Group is not subject to regulatory capital adequacy requirements.<br />
19<br />
Other receivables and other current assets<br />
in thousand CHF <strong>2011</strong> 2010<br />
Office supplies 0 1,721<br />
Taxes (VAT, withholding tax) 41,949 42,660<br />
Accrued income 6,092 1,391<br />
Accrued interest income 757 340<br />
Personnel advances 1,405 2,559<br />
Prepaid rent expenses 5,371 6,829<br />
Prepaid communication and IT expenses 3,325 3,039<br />
Supplier rebates 16,912 21,535<br />
Short-term loans 847 146<br />
Others 8,339 17,737<br />
Total other receivables and other current assets 84,997 97,957<br />
Panalpina <strong>Annual</strong> <strong>Report</strong> <strong>2011</strong>
20<br />
Trade receivables<br />
Consolidated Financial Statements <strong>2011</strong><br />
in thousand CHF <strong>2011</strong> 2010<br />
Commercial clients 990,839 962,919<br />
Agents 17,684 22,508<br />
Total trade receivables (gross values) 1,008,523 985,427<br />
Individual allowance (282) (1,864)<br />
Overall allowance (23,837) (25,449)<br />
Total trade receivables (net) 984,404 958,114<br />
Europe, Middle East , Africa, CIS 479,358 518,859<br />
thereof European Union 380,646 419,529<br />
thereof Switzerland 42,185 38,370<br />
North America 201,398 179,090<br />
Central and South America 133,770 102,248<br />
Asia Pacific 169,878 157,917<br />
Total trade receivables (net) 984,404 958,114<br />
There is no concentration of credit risk with regard to trade receivables as the Group has a large number of customers that are dispersed<br />
internationally.<br />
Provisions for impaired trade receivables are collectively assessed and represent the impairment that has been incurred but not indentified.<br />
Panalpina establishes its provisions for doubtful trade receivables based on its historical loss experiences. Significant financial difficulties of<br />
the debtor are individually impaired. The maximum exposure to credit risk on the reporting date is the carrying amount of net trade receivables<br />
mentioned above. Based on past experience, the Group does not anticipate writing off not-past-due nor unprovided trade receivables.<br />
The creation and usage of provisions for impaired trade receivables have been included in other operating expenses in the income<br />
statement.<br />
The following table summarizes the movement in the provision for impairment of trade receivables:<br />
in thousand CHF <strong>2011</strong> 2010<br />
Balance as of January 1 27,313 34,848<br />
Receivables written off during the year as uncollectible (7,470) (9,684)<br />
Changes in provision for doubtful accounts 4,276 2,149<br />
Balance as of December 31 24,119 27,313<br />
Panalpina <strong>Annual</strong> <strong>Report</strong> <strong>2011</strong><br />
107
108<br />
Consolidated Financial Statements <strong>2011</strong><br />
The following table provides details about the age of trade receivables that are not overdue as the payment terms specified in the terms and<br />
conditions established with Panalpina customers have not been exceeded, as well as an analysis of overdue amounts and related provisions<br />
for doubtful trade receivables:<br />
in thousand CHF <strong>2011</strong> 2010<br />
Commercial clients 990,839 962,919<br />
Agents 17,684 22,508<br />
Total trade receivables (gross values) 1,008,523 985,427<br />
Allowance for bad debt (24,119) (27,313)<br />
Total trade receivables (net) 984,404 958,114<br />
of which:<br />
Not overdue 734,894 708,293<br />
Past due not more than 30 days 182,956 189,671<br />
Past due more than 30 days up to 180 days 83,667 82,139<br />
Past due more than 180 days up to 360 days 12,932 8,052<br />
Past due more than 360 days 10,137 10,153<br />
Prepayment (16,063) (12,881)<br />
Total trade receivables (gross) 1,008,523 985,427<br />
Allowance for bad debt (24,119) (27,313)<br />
Total trade receivables (net) 984,404 958,114<br />
21<br />
Derivative financial instruments<br />
Panalpina <strong>Annual</strong> <strong>Report</strong> <strong>2011</strong><br />
Contract value<br />
Positive<br />
replacement value<br />
Negative<br />
replacement value<br />
in thousand CHF <strong>2011</strong> 2010 <strong>2011</strong> 2010 <strong>2011</strong> 2010<br />
Forward foreign exchange contracts 728,316 805,302 5,504 20,454 (4,648) (5,532)<br />
Forward trading hedges 728,316 805,302 5,504 20,454 (4,648) (5,532)<br />
Contract value<br />
Positive<br />
replacement value<br />
Negative<br />
replacement value<br />
in thousand CHF <strong>2011</strong> 2010 <strong>2011</strong> 2010 <strong>2011</strong> 2010<br />
Terms of the forward foreign<br />
exchange contracts 728,316 805,302 5,504 20,454 (4,648) (5,532)<br />
0 – 3 months 675,587 734,333 4,540 18,579 (3,945) (4,890)<br />
4 – 12 months 46,614 63,428 505 1,875 (703) (103)<br />
13 – 18 months 6,115 7,541 459 0 0 (539)
Derivative financial instruments are spread over the following currencies:<br />
Consolidated Financial Statements <strong>2011</strong><br />
Forward foreign<br />
exchange contracts<br />
in thousand CHF <strong>2011</strong> 2010<br />
USD 443,673 399,245<br />
EUR 214,650 278,063<br />
SGD 24,222 2,001<br />
GBP 10,618 11,178<br />
HKD 7,511 17,074<br />
CZK 6,456 998<br />
CAD 6,452 25,097<br />
NZD 4,725 1,452<br />
MXN 2,353 2,211<br />
NOK 2,342 1,361<br />
SEK 2,261 8,154<br />
CHF 520 4,100<br />
AUD 0 15,002<br />
COP 0 11,228<br />
Other 2,533 28,138<br />
Total 728,316 805,302<br />
22<br />
Cash and cash equivalents<br />
in thousand CHF <strong>2011</strong> 2010<br />
Cash on hand 1,693 1,423<br />
Cash at bank 569,983 531,658<br />
Checks and bills of exchange in transit 1,903 (4,145)<br />
Total cash and cash equivalents 573,579 528,936<br />
Net cash (debt) is comprised as follows:<br />
in thousand CHF <strong>2011</strong> 2010<br />
Cash and cash equivalents 573,579 528,936<br />
Other current financial assets 20,000 6,089<br />
Short-term borrowings (7,296) (9,335)<br />
Long-term borrowings (231) (403)<br />
Net cash (debt) 586,052 525,287<br />
Panalpina <strong>Annual</strong> <strong>Report</strong> <strong>2011</strong><br />
109
Consolidated Financial Statements <strong>2011</strong><br />
110 23 Share capital and treasury shares<br />
in thousand CHF<br />
Panalpina <strong>Annual</strong> <strong>Report</strong> <strong>2011</strong><br />
Outstanding<br />
number of shares<br />
(numbers)<br />
Ordinary<br />
shares<br />
Treasury<br />
shares<br />
Balance on January 1, <strong>2011</strong> 23,642,458 50,000 (196,003) (146,003)<br />
Treasury shares<br />
Sold 20,245 0 2,190 2,190<br />
Purchased (79,042) 0 (8,617) (8,617)<br />
Sold under employee share plan 32,182 0 3,462 3,462<br />
Sold under employee option plan 16,065 0 1,690 1,690<br />
Balance on December 31, <strong>2011</strong> 23,631,908 50,000 (197,278) (147,278)<br />
The share capital is presented by 25 million issued shares (2010: 25 million) of CHF 2.00 par value, fully paid in.<br />
On December 31, <strong>2011</strong>, the number of outstanding shares amounted to 23,631,908 shares (2010: 23,642,458) and the number of treasury<br />
shares to 1,368,092 (2010: 1,357,542). Treasury shares have been deducted from equity attributable to owners of the parent. All<br />
shares issued by the Company were fully paid in.<br />
The extraordinary Shareholders’ Meeting held on August 23, 2005, authorized the Board of Directors to create authorized capital to the<br />
maximum amount of CHF 6 million by issuing a maximum of 3,000,000 registered shares with a nominal value of CHF 2.00 each at any<br />
time until August 22, 2007. At the <strong>Annual</strong> General Meeting held on May 15, 2007, the shareholders approved the proposal of the Board of<br />
Directors to extend the authorized share capital until May 2009 with an unchanged amount. The extension of the authorized capital for<br />
another two years was approved at the <strong>Annual</strong> General Meeting held on May 5, 2009. On May 10, <strong>2011</strong>, the General Meeting extended the<br />
resolution, with unchanged conditions until May 10, 2013. The Board of Directors has not made use of this au thorization. The Company<br />
has no conditional share capital.<br />
In 2007, the Board of Directors decided to return excess capital to the shareholders by launching a share buyback program via a second<br />
trading line on the SIX Swiss Exchange. Between August 13, 2007 and September 2, 2008, the Group repurchased 1,250,000 registered<br />
shares, totaling a value of CHF 185.0 million and representing 5 % of share capital.<br />
The amount available for dividend distribution is based on the available distributable retained earnings of Panalpina World Transport<br />
(Holding) Ltd. determined in accordance with the legal provisions of the Swiss Code of Obligations. On May 10, <strong>2011</strong>, the shareholders<br />
approved that no dividends will be distributed in respect of the 2010 business year.<br />
The Board of Directors has proposed dividends for the fiscal year <strong>2011</strong> of CHF 2.00 per share. In addition to the dividend payment the<br />
Board of Directors has proposed to cancel the 1,250,000 repurchased shares. This would result in a total remaining share capital of<br />
CHF 47.5 million (23,750,000 shares). Furthermore, the Board of Directors requests a reduction of the nominal value of the remaining<br />
23,750,000 shares by CHF 1.90 per share. If the shareholders would approve the proposal of the Board of Directors to reduce the nominal<br />
value per share from currently CHF 2.00 to CHF 0.10, the share capital would further decrease by CHF 45.125 million to CHF 2.375 million.<br />
The proposal of the dividend payment, the cancelation of the repurchased shares and the reduction of share nominal value are subject to<br />
approval at the <strong>Annual</strong> Meeting of Shareholders on May 8, 2012.<br />
24<br />
Non-controlling interests<br />
in thousand CHF <strong>2011</strong> 2010<br />
Balance on January 1, (net) 7,890 7,015<br />
Reclassification of parent’s ownership interest 0 9<br />
Translation differences (204) (430)<br />
Reclassification of translation difference to parent shareholders’ equity 0 (5)<br />
Interest in profit 1,119 1,298<br />
Reclassification of interest in profit to parent shareholders’ equity 0 55<br />
Dividend paid (46) (52)<br />
Acquisition Grieg 279 0<br />
Capital increase Panalpina Vietnam 44 0<br />
Total net non-controlling interests 9,082 7,890<br />
During the year under review, non-controlling interest increased by TCHF 44 due to the capital increase of Panalpina World Transport (Vietnam)<br />
Company Ltd. In addition, the Grieg acquisition included non-controlling interests of TCHF 279 for the participation in Grieg Triangle Logistics<br />
B.V., Netherlands. In 2010, the negative non-controlling interests of Panalpina Kuwait were reclassified to parent shareholders’ equity.<br />
Total
25<br />
Borrowings<br />
Consolidated Financial Statements <strong>2011</strong><br />
This note provides information about the contractual terms of the Group’s interest-bearing loans and borrowings, which are measured at<br />
amortized cost. For more information about the Group’s exposure to foreign currency and liquidity risk, see note 18.<br />
in thousand CHF <strong>2011</strong> 2010<br />
Current liabilities<br />
Overdraft 2,681 0<br />
Current portion of secured bank loans 4,233 8,855<br />
Unsecured bank facility 4 0<br />
Current portion of finance lease liabilities 378 480<br />
Total current liabilities 7,296 9,335<br />
Non-current liabilities<br />
Non-current portion of finance lease liabilities 228 399<br />
Other loans 3 4<br />
Total non-current liabilities 231 403<br />
Terms and repayment schedule<br />
in thousand CHF<br />
Currency<br />
Nominal<br />
interest rate<br />
Year of<br />
maturity<br />
<strong>2011</strong> 2010<br />
Carrying<br />
amount Fair value<br />
Carrying<br />
amount Fair value<br />
Current liabilities<br />
Secured bank loan USD 5.85 %<br />
DTF<br />
<strong>2011</strong> 0 0 6,020 6,020<br />
Secured bank loan COP +3.00 % <strong>2011</strong> 0 0 4 4<br />
Secured bank loan COP 4.91 % <strong>2011</strong> 0 0 2,831 2,831<br />
Secured bank loan USD 2.74 % 2012 4,233 4,233<br />
Unsecured bank facility COP 8.48 % 2012 4 4<br />
Total current liabilities 4,237 4,237 8,855 8,855<br />
Non-current liabilities<br />
Other loans SGD n/a 2013 3 3 4 4<br />
Total interest-bearing liabilities 4,240 4,240 8,859 8,859<br />
Finance lease liabilities<br />
in thousand CHF<br />
Future<br />
minimum<br />
lease<br />
payments<br />
<strong>2011</strong> 2010<br />
Interest<br />
Present value<br />
of minimum<br />
lease<br />
payments<br />
Future<br />
minimum<br />
lease<br />
payments<br />
Interest<br />
Present value<br />
of minimum<br />
lease<br />
payments<br />
Less than 1 year 429 51 378 542 62 480<br />
Between 1 and 5 years 255 27 228 450 51 399<br />
Total interest-bearing liabilities 684 78 606 992 113 879<br />
The weighted average interest rate of bank borrowings and other financing liabilities is 3.90 % (2010: 5.78 %). The carrying amounts of<br />
short-term bank borrowings approximate their fair value.<br />
Panalpina <strong>Annual</strong> <strong>Report</strong> <strong>2011</strong><br />
111
112<br />
Consolidated Financial Statements <strong>2011</strong><br />
The maturity of the Group’s long-term financial debts (excluding lease liabilities) is shown in the following table:<br />
in thousand CHF<br />
Panalpina <strong>Annual</strong> <strong>Report</strong> <strong>2011</strong><br />
<strong>2011</strong> 2010<br />
<strong>2011</strong> 0 4<br />
2013 3 0<br />
Total 3 4<br />
The carrying amounts of the Group’s borrowings are denominated in the following currencies:<br />
in thousand CHF <strong>2011</strong> 2010<br />
USD 4,179 6,020<br />
EUR 2,741 18<br />
GBP 296 654<br />
PLN 250 165<br />
COP 4 2,835<br />
AUD 0 0<br />
Others 57 46<br />
Total 7,527 9,738<br />
26<br />
Long-term provisions<br />
<strong>2011</strong> (in thousand CHF)<br />
Employee<br />
benefits<br />
Claims<br />
and other<br />
provisions<br />
Total provisions<br />
Balance on January 1 34,450 78,129 112,579<br />
Translation differences (587) 14 (573)<br />
Change in scope of consolidation 267 414 681<br />
Addition 8,904 5,086 13,990<br />
Reversal of unused amount (1,948) (14,778) (16,726)<br />
Charged in income statement 6,956 (9,692) (2,736)<br />
Utilization (3,217) (5,106) (8,323)<br />
Transfers 0 (16,596) (16,596)<br />
Balance on December 31 37,869 47,163 85,032<br />
2010 (in thousand CHF)<br />
Employee<br />
benefits<br />
Claims<br />
and other<br />
provisions<br />
Total provisions<br />
Balance on January 1 28,756 37,902 66,658<br />
Translation differences (2,513) (3,725) (6,238)<br />
Addition 9,492 70,923 80,415<br />
Reversal of unused amount (2,939) (35,449) (38,388)<br />
Charged in income statement 6,553 35,474 42,027<br />
Utilization (5,092) (514) (5,606)<br />
Transfers 6,746 8,992 15,738<br />
Balance on December 31 34,450 78,129 112,579
Consolidated Financial Statements <strong>2011</strong><br />
Employee provisions mostly relate to certain employee benefit obligations, such as “anniversary” benefits, termination payments and long<br />
service benefits, mainly in Switzerland, Germany, Austria, Italy, France and the USA. The timings of these cash outflows can be reasonably<br />
estimated based on past performance. In addition, employee provisions include the liability of CHF 2,527 thousand for the cash-settled<br />
compensation plan. Significant provisions are discounted by using the corresponding discount rate applicable in the respective countries<br />
where the obligation occurs.<br />
The balance for claims represents a provision for certain claims brought forward against the Group by customers and forwarding agents.<br />
The balance as of December 31, <strong>2011</strong> is expected to be utilized within the next two to five years. Long-term claims include an additional<br />
provision for probable potential future payments in connection with transport damages. Furthermore, in 2010, a long-term provision in the<br />
amount of CHF 38.0 million was recorded to cover the fines, legal penalties and compliance consultancy fees relating to the settlement of<br />
the US Foreign Corrupt Practices Act (FCPA). In the period under review the current portion of CHF 16.6 million has been reclassified to<br />
provisions and other liabilities as it is expected to be utilized within one year. The management determined the provision based on past<br />
performance and its expectation of the funds needed for the future settlement of the claims which are not yet reported (see also note 4 Critical<br />
accounting estimates and judgments).<br />
The current portion of employee provisions and claim provisions are disclosed in note 28.<br />
27<br />
Deferred income taxes<br />
Deferred taxes are related to the following statement of financial position items:<br />
in thousand CHF<br />
Balance<br />
January 1<br />
2010<br />
Recog-<br />
nized<br />
translation<br />
differ-<br />
ences<br />
Recog-<br />
nized<br />
in income<br />
statement<br />
Recog-<br />
nized<br />
in OCI<br />
Balance<br />
Decem-<br />
ber 31<br />
2010<br />
Recog-<br />
nized<br />
translation<br />
differ-<br />
ences<br />
Recog-<br />
nized<br />
in income<br />
statement<br />
Recog-<br />
nized<br />
in OCI<br />
Balance<br />
Decem-<br />
ber 31<br />
<strong>2011</strong><br />
Deferred tax assets<br />
Receivables 2,928 (307) (1,358) 0 1,263 (4) 1,278 0 2,537<br />
Fixed assets 4,060 (425) (440) 0 3,195 (10) 180 0 3,365<br />
Provisions<br />
Other statement of financial<br />
15,710 (1,645) 6,402 (1,794) 18,673 (56) 1,195 (410) 19,402<br />
position captions<br />
Deductible loss<br />
8,763 (917) 3,610 0 11,456 (35) (6,305) 0 5,116<br />
carry-forwards 23,878 (2,500) 9,906 0 31,284 (94) 703 0 31,893<br />
Total deferred tax assets 55,339 (5,794) 18,120 (1,794) 65,871 (199) (2,949) (410) 62,313<br />
Deferred tax liabilities<br />
Receivables (640) (4) 135 0 (509) 0 104 0 (405)<br />
Fixed assets (9,171) (57) (510) 0 (9,738) 7 (2,152) 0 (11,883)<br />
Provisions<br />
Other statement of financial<br />
(8,591) (54) (668) 7,206 (2,107) 1 (5,563) 5,829 (1,840)<br />
position captions<br />
Deductible loss<br />
(4,801) (30) (3,560) 0 (8,391) 6 8,021 0 (364)<br />
carry-forwards<br />
Total deferred<br />
1,288 8 (1,296) 0 0 0 0 0 0<br />
tax liabilities (21,915) (137) (5,899) 7,206 (20,745) 14 410 5,829 (14,492)<br />
Net deferred tax assets<br />
(liabilities) 33,424 (5,931) 12,221 5,412 45,126 (185) (2,539) 5,419 47,821<br />
Panalpina <strong>Annual</strong> <strong>Report</strong> <strong>2011</strong><br />
113
114<br />
Consolidated Financial Statements <strong>2011</strong><br />
The gross movement in the deferred income tax account is as follows:<br />
in thousand CHF <strong>2011</strong> 2010<br />
Balance January 1 45,126 33,424<br />
Translation differences (185) (5,931)<br />
Income statement charge (2,539) 12,221<br />
Tax charged to equity due to IAS 19 5,419 5,412<br />
Balance December 31 47,821 45,126<br />
In <strong>2011</strong>, temporary differences in the amount of CHF 3.6 million (2010: CHF 4.9 million) were not capitalized because it was not probable<br />
that they could be offset against future profits.<br />
Year of expiry of unrecognized tax loss carry-forwards (in thousand CHF) <strong>2011</strong> 2010<br />
<strong>2011</strong> – 2,360<br />
2012 16,702 18,321<br />
2013 15,399 15,544<br />
2014 7,884 2,677<br />
2015 768 723<br />
2016 674 –<br />
Later 58,672 40,698<br />
Total unrecognized tax loss carry-forwards 100,099 80,323<br />
The total increase of CHF 19.8 million (2010: increase of CHF 25.3 million) derived mainly from unrecognized tax loss carry-forwards in<br />
Angola, Belgium, Brazil and Luxembourg. During the period under review, tax loss carry-forwards expired mainly in Finland, Denmark and<br />
Angola. Tax loss carry-forwards of CHF 13.4 million (2010: CHF 21.9 million) were utilized mainly in Switzerland, USA and Australia.<br />
28<br />
Provisions and other liabilities<br />
<strong>2011</strong> (in thousand CHF)<br />
Panalpina <strong>Annual</strong> <strong>Report</strong> <strong>2011</strong><br />
Employee<br />
benefits and<br />
others<br />
Outstanding<br />
vacation<br />
entitlement<br />
Claims<br />
Restruc-<br />
turing<br />
Balance on January 1 64,737 19,449 56,028 839 141,053<br />
Translation differences (1,001) (571) (177) (20) (1,769)<br />
Change in scope of consolidation 259 1,004 0 0 1,263<br />
Addition 66,003 6,348 11,917 0 84,268<br />
Reversal of unused amounts (15,043) (3,075) (23,399) 0 (41,517)<br />
Charged in income statement 50,960 3,273 (11,482) 0 42,751<br />
Utilization (41,848) (735) (31,721) (170) (74,474)<br />
Transfers 0 0 16,596 0 16,596<br />
Balance on December 31 73,107 22,420 29,244 649 125,420<br />
Total
2010 (in thousand CHF)<br />
Employee<br />
benefits and<br />
others<br />
Outstanding<br />
vacation<br />
entitlement<br />
Consolidated Financial Statements <strong>2011</strong><br />
Claims<br />
Restruc-<br />
turing<br />
Balance on January 1 45,285 21,077 32,983 4,026 103,371<br />
Translation differences (3,073) (2,168) (1,247) (1,144) (7,632)<br />
Addition 122,915 4,113 90,338 265 217,631<br />
Reversal of unused amounts (11,502) (1,253) (16,440) (584) (29,779)<br />
Charged in income statement 111,413 2,860 73,898 (319) 187,852<br />
Utilization (88,888) (2,320) (33,868) (1,724) (126,800)<br />
Transfers 0 0 (15,738) 0 (15,738)<br />
Balance on December 31 64,737 19,449 56,028 839 141,053<br />
Apart from outstanding vacation entitlement and the current portions of provisions as disclosed in note 26, provisions and other liabilities<br />
include personnel profit participation and related social security costs and payroll taxes as well as compliance consultancy fees. During<br />
the period under review, CHF 30.8 million of personnel profit participation (2010: CHF 30.7 million) was paid out. For the current year<br />
additional personnel profit participation of CHF 51.2 million (2010: CHF 51.2 million) including related social security costs and payroll<br />
taxes was recognized.<br />
As disclosed in notes 3 and 26, claim provisions include the current portion of certain claims brought forward against the Group by customers<br />
and forwarding agents. In addition, in 2010 short-term provision in the amount of CHF 31.0 million was recorded to cover the<br />
fines, legal penalties and compliance consultancy fees relating to the settlement of the US Foreign Corrupt Practices Act (FCPA) and the<br />
US as well as the New Zealand antitrust investigations. During the period under review the previous year recognized provision was<br />
paid out.<br />
In 2010, the management reassessed the cash outflow of claims and came to the conclusion that, based on past utilization, the duration<br />
until claims can be settled increased substantially. The reclassification to long-term claim provisions of CHF 15.7 million reflects this change.<br />
The balance as of December 31, is expected to be utilized within one year.<br />
Restructuring provisions arise from planned programs that materially change the scope of business undertaken by the Group or the manner<br />
in which business is conducted. Such provisions include only the costs necessarily entailed by the restructuring which are not associated<br />
with the recurring activities of the Group. In 2010, additionally recognized restructuring provisions related to adjustments of the previous<br />
year estimations. Neither in <strong>2011</strong> nor in 2010, an additional restructuring plan was approved. The timings of these cash outflows are<br />
expected to occur within one year.<br />
29<br />
Related parties<br />
Key management personnel compensation<br />
Key management personnel consists of the Board of Directors and the Executive Board. The members of the Board of Directors receive<br />
a fixed annual compensation and participate in certain equity compensation plans (see note 8). In <strong>2011</strong>, there were 7 (2010: 6) members<br />
of the Board of Directors.<br />
The compensation of the Executive Board consists of a fixed portion and a variable portion, which depends on the course of business<br />
and the individual manager’s performance. In addition, members of the Executive Board receive indirect benefits and are able to participate<br />
in certain equity compensation plans (see note 8). In <strong>2011</strong>, there were 5 (2010: 5) members of the Executive Board.<br />
Total<br />
Panalpina <strong>Annual</strong> <strong>Report</strong> <strong>2011</strong><br />
115
116<br />
Consolidated Financial Statements <strong>2011</strong><br />
The following table shows the compensation of key management personnel:<br />
<strong>2011</strong> (in thousand CHF)<br />
Panalpina <strong>Annual</strong> <strong>Report</strong> <strong>2011</strong><br />
<strong>Annual</strong><br />
salary 1<br />
Bonus<br />
Termi-<br />
nation<br />
benefits<br />
Other<br />
benefits 2<br />
Share-<br />
based<br />
payment 3<br />
Social<br />
security<br />
contribution<br />
Total<br />
compen-<br />
sation<br />
Option<br />
granted<br />
Board of Directors<br />
Rudolf W. Hug, Chairman 453 50 63 566<br />
Beat Walti, Vice Chairman 153 50 22 225<br />
Lars Förberg, Member 79 50 11 140<br />
Chris E. Muntwyler, Member 153 50 22 225<br />
Roger Schmid, Member* 155 50 205<br />
Hans-Peter Strodel, Member 155 50 17 222<br />
Knud Elmholdt Stubkjær, Member<br />
Board of Directors leaving<br />
77 50 12 139<br />
Günter Rohrmann 102 102<br />
Total remuneration of Board of Directors 1,327 0 0 0 350 147 1,824 0<br />
Executive Board<br />
Monika Ribar, Chief Executive Officer 913 570 125 380 145 2,133<br />
Members of the Executive Board 2,246 1,014 144 1,157 555 5,116<br />
Executive Management leaving 113 9 16 138<br />
Total remuneration of Executive Board 3,272 1,584 0 278 1,537 716 7,387 0<br />
Total remuneration of key management<br />
personnel 4,599 1,584 0 278 1,887 863 9,211 0<br />
1 Salaries incl. fixed remuneration, salary and discount on shares granted<br />
2 Other benefits incl. expense allowance and fringe benefits<br />
3 According to the Executive Board Mid-term Incentive Plan (see Note 8) the members of the Executive Board received matched shares<br />
totaling 4,155 shares reflecting the 40 % bonus paid in the previous year<br />
* Remuneration respectively shares have been transferred to Ernst Göhner Stiftung (employer of respective board member)
2010 (in thousand CHF)<br />
<strong>Annual</strong><br />
salary 1<br />
Bonus<br />
Termi-<br />
nation<br />
benefits<br />
Other<br />
benefits 2<br />
Share-<br />
based<br />
payment 3<br />
Consolidated Financial Statements <strong>2011</strong><br />
Social<br />
security<br />
contribution<br />
Total<br />
compen-<br />
sation<br />
Option<br />
granted<br />
Board of Directors<br />
Rudolf W. Hug, Chairman 454 50 46 550<br />
Günter Rohrmann, Vice Chairman 154 50 0 204<br />
Roger Schmid, Member * 155 50 0 205<br />
Chris E. Muntwyler, Member 77 50 8 135<br />
Hans-Peter Strodel, Member 77 50 7 134<br />
Beat Walti, Member<br />
Board of Directors leaving<br />
77 50 8 135<br />
Günther Casjens, Member 154 0 154<br />
Wilfried Rutz, Vice Chairman 127 12 139<br />
Yuichi Ishimaru, Member 77 7 84<br />
Glen R. Pringle, Member 51 0 51<br />
Total remuneration of Board of Directors 1,403 0 0 0 300 88 1,791 0<br />
Executive Board<br />
Monika Ribar, Chief Executive Officer 800 730 27 633 110 2,300<br />
Members of the Executive Board 2,220 1,141 149 1,017 420 4,947<br />
Executive Management leaving 850 33 73 206 134 1,296<br />
Total remuneration of Executive Board 3,870 1,871 33 249 1,856 664 8,543 0<br />
Total remuneration of key management<br />
personnel 5,273 1,871 33 249 2,156 752 10,334 0<br />
1 Salaries incl. fixed remuneration, salary and discount on shares granted<br />
2 Other benefits incl. expense allowance and fringe benefits<br />
3 According to the Executive Board Mid-term Incentive Plan (see Note 8) the members of the Executive Board received matched shares<br />
totaling 4,155 shares reflecting the 40% bonus paid in the previous year<br />
* Remuneration respectively shares have been transferred to Ernst Göhner Stiftung (employer of respective board member)<br />
There were no contributions or donations to close members of the families of the key management.<br />
Panalpina <strong>Annual</strong> <strong>Report</strong> <strong>2011</strong><br />
117
118<br />
Consolidated Financial Statements <strong>2011</strong><br />
The following table shows the equity holdings in Panalpina World Transport (Holding) Ltd. (PWT) of key management personnel and their<br />
related parties in line with article 663b bis and 663c of the Swiss Code of Obligations.<br />
Panalpina <strong>Annual</strong> <strong>Report</strong> <strong>2011</strong><br />
Number of PWT<br />
nominal shares<br />
Number of options<br />
(End of vesting period)<br />
2012 2013 2014<br />
Board of Directors<br />
Rudolf W. Hug, Chairman 8,362 1,200 1,325 2,020<br />
Beat Walti, Vice Chairman 427 0 0 0<br />
Lars Förberg, Member 0 0 0 0<br />
Chris E. Muntwyler, Member 427 0 0 0<br />
Roger Schmid, Member* 9,375 1,800 1,325 0<br />
Hans-Peter Strodel, Member 427 0 0 0<br />
Knud Elmholdt Stubkjær, Member 0 0 0 0<br />
Total on December 31, <strong>2011</strong> 19,018 3,000 2,650 2,020<br />
Executive Board<br />
Monika Ribar, Chief Executive Officer 26,183 1,800 1,325 2,020<br />
Christoph Hess, General Counsel and Corporate Secretary 4,208 600 600 1,000<br />
Karl Weyeneth, Chief Operating Officer 9,044 0 497 303<br />
Marco Gadola, Chief Financial Officer 3,858 1,800 1,325 2,020<br />
Alastair Robertson, Chief Human Resources Officer 4,050 0 0 200<br />
Total on December 31, <strong>2011</strong> 47,343 4,200 3,747 5,543<br />
Total on December 31, <strong>2011</strong> 66,361 7,200 6,397 7,563<br />
Number of PWT<br />
nominal shares<br />
Number of options<br />
(End of vesting period)<br />
2012 2013 2014<br />
Board of Directors<br />
Rudolf W. Hug, Chairman 7,935 1,200 1,325 2,020<br />
Günter Rohrmann, Vice Chairman 2,820 2,020<br />
Roger Schmid, Member 9,375 1,800 1,325<br />
Total on December 31, 2010 20,130 3,000 2,650 4,040<br />
Executive Board<br />
Monika Ribar, Chief Executive Officer 21,063 1,800 1,325 2,020<br />
Christoph Hess, General Counsel and Corporate Secretary 3,000 600 600 1,000<br />
Karl Weyeneth, Chief Operating Officer 5,315 0 497 303<br />
Marco Gadola, Chief Financial Officer 2,572 1,800 1,325 2,020<br />
Alastair Robertson, Chief Human Resources Officer 2,200 0 0 200<br />
Total on December 31, 2010 34,150 4,200 3,747 5,543<br />
Total on December 31, 2010 54,280 7,200 6,397 9,583<br />
* Remuneration respectively shares have been transferred to Ernst Göhner Stiftung (employer of respective board member)<br />
Shareholders, pension funds, associated companies and all subsidiaries are defined as parties related to the Group. Apart from the transactions<br />
with related parties mentioned above, we refer to notes 7 and 8.
30<br />
Business combinations/disinvestments<br />
Consolidated Financial Statements <strong>2011</strong><br />
On February 1, <strong>2011</strong>, Panalpina World Transport (Pty) Ltd. in Sydney announced the purchase of defined tangible and intangible assets<br />
and the business of Apollo Forwarding in Perth. Apollo and Panalpina have been close partners for more than ten years. During that<br />
time, Apollo Perth has acted as an agent of Panalpina. The purchase enables Panalpina to further enlarge the geographical office coverage<br />
in Oceania and widen the customer base. In addition to being a well-established customs broker, Apollo Perth also provides international<br />
freight forwarding services to its Australia-based customers who now gain access to Panalpina’s global network. The acquisition has<br />
been settled for a final cash consideration of CHF 2.9 million.<br />
As per April 1, <strong>2011</strong> the Group acquired 100 percent of the issued share capital of Grieg Logistics AS, a company today encompassing<br />
freight forwarding, domestic transportation, warehousing, distribution and customs clearance with operations in fourteen locations.<br />
Grieg Logistics, established in 1969, is a leading logistics provider to the Norwegian oil and gas, shipping and maritime industries. It has a<br />
broad product portfolio including logistics, freight forwarding and project development. In Norway, Grieg Logistics serves the national<br />
market with offices throughout the country. Businesses will add approximately NOK 400 million (CHF 67.0 million) to the Panalpina Group’s<br />
annual turnover. Grieg Logistics, with its strategic locations throughout Norway, has built up a strong reputation for providing customers<br />
with tailor-made services to meet their needs. The acquisition was settled for a final cash consideration of CHF 60.3 million. The acquired<br />
business contributed net forwarding revenue of CHF 49.4 million and net profit of CHF 0.2 million to the Group for the period from<br />
April 1 to December 31, <strong>2011</strong>.<br />
Tangible assets acquired in <strong>2011</strong> include mainly office equipment and vehicles. Intangible assets include customer relationships.<br />
Details of net assets acquired and goodwill are as follows:<br />
in thousand CHF <strong>2011</strong> 2010<br />
Purchase consideration<br />
– Cash paid 63,160 2,384<br />
Total purchase consideration 63,160 2,384<br />
Fair value of net assets acquired (22,570) (980)<br />
Non-controlling interest 279 0<br />
Goodwill 40,869 1,404<br />
The goodwill is attributable to market knowledge and experience of the acquired employees, the profitability of the acquired business and<br />
the synergies expected to arise after the Group’s acquisition.<br />
The assets and liabilities arising from the acquisition are the following:<br />
in thousand CHF<br />
Revaluation<br />
Acquiree’s due to purchase<br />
carrying amount accounting<br />
Fair value<br />
<strong>2011</strong><br />
Fair value<br />
2010<br />
Cash and cash equivalents 3,174 0 3,174 0<br />
Property, plant and equipment 444 0 444 134<br />
Intangible assets 0 15,927 15,927 846<br />
Other non-current assets 351 (72) 279 0<br />
Trade receivables 10,322 0 10,322 0<br />
Other current assets 357 0 357 0<br />
Total acquired assets 14,648 15,855 30,503 980<br />
Payables (2,501) 0 (2,501) 0<br />
Provisions (681) 348 (333) 0<br />
Other current liabilities (5,099) 0 (5,099) 0<br />
Total acquired liabilities (8,281) 348 (7,933) 0<br />
Net assets acquired 6,367 16,203 22,570 980<br />
Non-controlling interests (279) 0<br />
Less acquired liquidity (3,174) 0<br />
Goodwill 40,869 1,404<br />
Total cash used in acquisition of businesses 59,986 2,384<br />
Panalpina <strong>Annual</strong> <strong>Report</strong> <strong>2011</strong><br />
119
Consolidated Financial Statements <strong>2011</strong><br />
120 31<br />
Additional information<br />
Contractual commitments on non-cancellable operating lease contracts <strong>2011</strong> 2010<br />
in thousand CHF<br />
Less than one year 139,128 137,768<br />
Between one and five years 261,044 283,793<br />
More than five years 99,459 116,535<br />
Total residual commitments 499,631 538,096<br />
Included in the residual lease commitments is an operating lease contract for aircrafts of CHF 33.8 million (2010: CHF 76.8 million), leased<br />
by Panalpina Air & Ocean Ltd. The contract, with a one-year notice period, was renewed in 2010 for the first aircraft until August 31, 2012.<br />
In 2010, a second aircraft was leased with a period at least until September 30, 2012.<br />
Pledged assets<br />
As of the statement of financial position date <strong>2011</strong> and 2010, the Group does not have any pledged assets.<br />
Pending legal claims<br />
Introduction<br />
In addition to the matters discussed in note 4 – Provisions, from time to time the Group is involved in legal proceedings in the ordinary course<br />
of its business. Other than as noted below, the Group is not a party to any legal, administrative or arbitration proceedings which could<br />
significantly harm the Group’s business, financial condition and results of operations taken as a whole, and it does not know of any such<br />
proceedings which may currently be contemplated by governmental or third parties.<br />
Claim against Pantainer Ltd.<br />
In a case which originated in 2004, it is alleged that a fire occurred on a container vessel due to containers shipped under Pantainer bills<br />
of lading containing chemicals that were not declared as hazardous cargo. As a consequence the vessel has declared general average.<br />
Claimants may seek compensation of general average contributions, damage and loss of cargo and potential damages to the vessel. Formal<br />
legal proceedings were launched in Tokyo in 2005 against the shipper which, in turn, commenced third-party proceedings against<br />
Pantainer Ltd. and other companies of the Group. Neither Pantainer nor any other Panalpina Group companies are named defendants in<br />
the Tokyo litigation. In July 2010, the court dismissed all claims of the plaintiffs and plaintiffs have appealed the judgment. The value in<br />
dispute amounts to approximately CHF 25 million.<br />
Business practices investigation<br />
In November 2010, Panalpina entered into a Deferred Prosecution Agreement (DPA) with the US Department of Justice (DOJ) to resolve<br />
claims against it arising from an investigation by the DOJ and the US Securities and Exchange Commission (SEC) for violations of the<br />
US Foreign Corrupt Practices Act (FCPA). Under the DPA, the DOJ has agreed to defer any criminal prosecution for three years. Panalpina<br />
has accepted certain obligations under the DPA, such as further strengthening its compliance policies and procedures and providing<br />
regular reports to the DOJ on the company’s progress. If Panalpina satisfies its obligations under the DPA, the DOJ has agreed to release<br />
the company from criminal liability at the end of the three-year term.<br />
Freight forwarding antitrust investigation<br />
In October 2007, Panalpina’s headquarters in Switzerland and the USA were raided by the respective competition authorities. Further, a<br />
request for information was served by the New Zealand Commerce Division and a document retention notice by the Competition Bureau<br />
Canada.<br />
In April 2008, the Australian Competition and Consumer Commission served a notice on the Australian subsidiary requesting information<br />
and documents and in June 2008, Panalpina’s UK subsidiary was the recipient of a request for information issued by the European<br />
Commission requesting certain information and records relating to alleged antitrust violations in the freight forwarding industry. In August<br />
2010, Brazilian authorities announced preliminary investigations against the freight forwarding industry. In December <strong>2011</strong>, Panalpina’s<br />
local subsidiary received a letter from the Competition Commission Singapore to detail whether it has engaged in similar anti-competitive<br />
conduct.<br />
Panalpina <strong>Annual</strong> <strong>Report</strong> <strong>2011</strong>
Consolidated Financial Statements <strong>2011</strong><br />
These activities were part of an investigation of several competition authorities against various major freight forwarding companies for<br />
alleged anti-competitive behavior.<br />
Furthermore, a civil class action lawsuit was filed in the USA against Panalpina and a number of its major competitors as a direct consequence<br />
of these investigations, alleging a conspiracy in the pricing of freight forwarding services. In July 2009, plaintiffs filed an<br />
amended complaint adding additional defendants and claims. In November 2009, the Company, along with other defendants, filed motions<br />
to dismiss the amended complaint for failure to state a claim and for lack of subject matter jurisdiction. Oppositions to the motions<br />
were filed in January 2010. At this stage, Panalpina is unable to express an opinion as to the probable outcome of this litigation and thus<br />
to estimate the potential loss, if any.<br />
In 2009, the Competition Bureau Canada closed its investigation into alleged anti-competitive activity due to a lack of evidence substantiating<br />
an undue lessening of competition.<br />
In January 2010, the Australian Competition and Consumer Commission also discontinued its investigation.<br />
In February 2010, Panalpina was served with a Statement of Objections by the European Commission, alleging anti-competitive behavior<br />
in the freight forwarding industry. In an oral hearing before the Commission’s case team held in July 2010, Panalpina has presented its<br />
arguments. In January <strong>2011</strong>, Panalpina received an additional request for information issued by the European Commission. A final decision<br />
is not expected prior to early 2012.<br />
In October 2010, Panalpina announced a settlement with the DOJ over violations of the Sherman Antitrust Act related to the sale of<br />
international air freight forwarding services. Under the terms of the settlement, which has been approved by the competent court, Panalpina<br />
has agreed to pay a fine of approximately USD twelve million.<br />
In the reporting year Panalpina completed settlement negotiations with the New Zealand Commerce Commission and the agreed penalty<br />
has been approved by the competent court.<br />
It is not possible to predict the outcome of the pending anti-trust proceedings at this stage. They may, however, result in material penalties<br />
being imposed on Panalpina. As Panalpina is not yet in a position to assess its exposure and the potential financial consequences in these<br />
proceedings, no related provisions have been made as of December 31, <strong>2011</strong>.<br />
Subsequent events<br />
Since the statement of financial position date, no events have become known for which a disclosure is required.<br />
Panalpina <strong>Annual</strong> <strong>Report</strong> <strong>2011</strong><br />
121
Consolidated Financial Statements <strong>2011</strong><br />
122 32<br />
Principal Group companies and participations<br />
Company<br />
Panalpina <strong>Annual</strong> <strong>Report</strong> <strong>2011</strong><br />
Registered<br />
Currency<br />
Nominal<br />
capital<br />
in 1,000<br />
Equity<br />
interest<br />
in %<br />
Invest-<br />
ment<br />
Method<br />
of con-<br />
solidation<br />
Europe<br />
Panalpina World Transport (Holding) Ltd. Basel CHF 50,000 K<br />
Panalpina Management Ltd. Basel CHF 2,500 100 1 K<br />
Panalpina Ltd. Basel CHF 600 100 1 K<br />
Pantainer Ltd. Basel CHF 100 100 1 K<br />
Panalpina Insurance Broker Ltd. Basel CHF 100 100 1 K<br />
Panalpina International Ltd. Basel CHF 100 100 1 K<br />
Hausmann Transport Ltd. Basel CHF 100 100 1 K<br />
Panalpina Air & Ocean Ltd. Basel CHF 2,700 100 1 K<br />
Jacky Maeder international forwarding Ltd. Basel CHF 300 100 1 K<br />
Panalpina Global Employment Services Ltd. Basel CHF 100 100 1 K<br />
Panalpina Welttransport (Deutschland) GmbH Mörfelden EUR 10,226 100 1 K<br />
Panalpina Welttransport GmbH Vienna EUR 36 100 1 K<br />
Panalpina Welttransport GmbH Höchst EUR 36 100 1 K<br />
Panalpina France Transports Internationaux S.A.S. Paris-Roissy EUR 2,000 100 1 K<br />
Panalpina Trasporti Mondiali S.p.A. Milan EUR 2,000 100 1 K<br />
Panalpina Transportes Mundiales S.A. Madrid EUR 451 100 1 K<br />
Panalpina Transportes Mundiais Lda Lisbon EUR 50 100 1 K<br />
Panalpina World Transport Ltd. London GBP 12,350 100 1 K<br />
Panalpina World Transport (Ireland) Ltd. Dublin EUR 25 100 1 K<br />
Panalpina World Transport N.V. Antwerp EUR 13,050 100 1 K<br />
Panalpina Luxembourg S.A. Luxembourg EUR 31 100 1 K<br />
Panalpina World Transport B.V. Amsterdam EUR 4,091 100 1 K<br />
Grieg Triangle Logistics B.V. Spijkenisse EUR 50 51 1 K<br />
Grampian International Freight B.V. Beverwijk EUR 18 100 1 K<br />
Panalpina Czech Sro. Prague CZK 1,000 100 1 K<br />
Panalpina Croatia d.o.o. Rijeka HRK 400 100 1 K<br />
Panalpina Slovakia S.R.O. Bratislava EUR 23 100 1 K<br />
Panalpina Magyarorszag Kft. Budapest HUF 528,000 100 1 K<br />
Panalpina Romania S.R.L. Oradea RON 72 100 1 K<br />
Panalpina Polska Sp. z o.o. Wroclaw PLN 1,500 100 1 K<br />
Panalpina AB Gothenburg SEK 1,000 100 1 K<br />
Panalpina A/S Oslo NOK 75,060 100 1 K<br />
Panalpina World Transport Nakliyat Ltd. Srk. Istanbul TRY 808 100 1 K<br />
Panalpina World Transport ZAO Moscow RUB 2,100 100 1 K<br />
Panalpina CIS Helsinki OY Vantaa EUR 8 100 1 K<br />
Panalpina Logistics LLC Moscow RUB 240 100 1 K<br />
Panalpina World Transport Ltd. Kiev UAH 376 100 1 K<br />
Luxair S.A. Luxembourg EUR 13,750 12 3 N
Company<br />
Registered<br />
Currency<br />
Consolidated Financial Statements <strong>2011</strong><br />
Nominal<br />
capital<br />
in 1,000<br />
Equity<br />
interest<br />
in %<br />
Invest-<br />
ment<br />
Method<br />
of con-<br />
solidation<br />
North, Central and South America<br />
Panalpina Inc. Jersey USD 83,000 100 1 K<br />
Panalpina FMS, Inc. (Washington) Jersey City USD 1 100 1 K<br />
International Claims Handling Services Inc. Miami USD 1 100 1 K<br />
Panalpina Inc. Toronto CAD 100 100 1 K<br />
Panalpina Transportes Mundiales, S.A. de C.V. Mexico City MXN 35,834 100 1 K<br />
Panalpina S.A. Panama City USD 1,250 100 1 K<br />
Almacenadora Mercantil S.A. Panama City USD 25 100 1 K<br />
Panalpina S.A. de C.V. San Salvador SVC 100 100 1 K<br />
Panalpina Transportes Mundiales S.A. San José CRC 2,500 100 1 K<br />
Las Fronteras S.A. San José CRC 1,590 100 1 K<br />
Panalpina Uruguay Transportes Mundiales S.A. Montevideo UYU 4,093 100 1 K<br />
Panalpina S.A. Santa Fé de Bogotá COP 7,450,838 100 1 K<br />
DAPSA Depositos Aduaneros Panalpina S.A. Santa Fé de Bogotá COP 2,815,208 100 1 K<br />
Panalpina C.A. Caracas VEF 7,299,297 100 1 K<br />
Panalpina Ecuador S.A. Quito USD 1 100 1 K<br />
Panalpina Aduanas S.A. Lima PEN 732 100 1 K<br />
Panalpina Transportes Mundiales S.A. Lima PEN 4,008 100 1 K<br />
Panalpina Ltda São Paulo BRL 127,317 100 1 K<br />
Panalpina Chile Transportes Mundiales Ltd.a Santiago CLP 1,593,521 100 1 K<br />
Panalpina Transportes Mundiales S.A. Buenos Aires ARS 800 100 1 K<br />
Panalpina Logistics S.R.L. Buenos Aires ARS 12 100 1 K<br />
Panalpina Transportes Mundiales S.A. de C.V. Santo Domingo DOP 1,000 100 1 K<br />
Mondi Reinsurance Ltd. Hamilton CHF 1,000 100 1 K<br />
Panalpina <strong>Annual</strong> <strong>Report</strong> <strong>2011</strong><br />
123
124<br />
Consolidated Financial Statements <strong>2011</strong><br />
Company<br />
Panalpina <strong>Annual</strong> <strong>Report</strong> <strong>2011</strong><br />
Registered<br />
Currency<br />
Nominal<br />
capital<br />
in 1,000<br />
Equity<br />
interest<br />
in %<br />
Invest-<br />
ment<br />
Method<br />
of con-<br />
solidation<br />
Asia and Australia<br />
Panalpina World Transport (Singapore) Pte. Ltd. Singapore SGD 2,500 100 1 K<br />
PT Panalpina Nusajaya Transport Jakarta IDR 1,500,000 100 1 K<br />
Panalpina China Ltd. Hong Kong HKD 1,000 100 1 K<br />
Panalpina World Transport (PRC) Ltd. Shanghai CNY 13,500 100 1 K<br />
Panalpina Logistics (Shanghai) Ltd. Shanghai CNY 5,000 100 1 K<br />
Panalpina Logistics (Wuhan) Ltd. Wuhan CNY 10,000 100 1 K<br />
Panalpina Asia-Pacific Services Ltd. Hong Kong HKD 500 100 1 K<br />
Panalpina World Transport Ltd. Hong Kong HKD 500 100 1 K<br />
Pantainer (H. K.) Limited Hong Kong HKD 100 100 1 K<br />
International Claims Handling Services Ltd. Hong Kong HKD 10 100 1 K<br />
Panalpina Taiwan Ltd. Taipei TWD 15,500 100 1 K<br />
Panalpina IAF (Korea) Ltd. Seoul KRW 500,000 100 1 K<br />
Panalpina World Transport (Thailand) Ltd. Bangkok THB 27,000 100 1 K<br />
Panalpina Asia-Pacific Services (Thailand) Ltd. Bangkok THB 10,000 100 1 K<br />
Panalpina Macao Ltd. Macao HKD 1,000 100 1 K<br />
Panalpina World Transport (Vietnam) Company Ltd. Ho Chi Minh City VND 6,360,145 49 2 K<br />
Panalpina Transport (Malaysia) Sdn. Bhd. Kuala Lumpur MYR 4,215 100 1 K<br />
Panalpina World Transport (Japan) Ltd. Tokyo JPY 50,000 100 1 K<br />
ASB Air Japan Ltd. Tokyo JPY 10,000 100 1 K<br />
Panalpina World Transport (India) Pvt. Ltd. Delhi INR 100,050 100 1 K<br />
Panindia Cargo Private Ltd., Delhi Delhi INR 100 100 1 K<br />
Panalpina World Transport (Philippines) Inc. Manila PHP 10,000 100 1 K<br />
Panalpina World Transport (Pty) Ltd. Sydney AUD 15,000 100 1 K<br />
Panalpina World Transport LLP Almaty KZT 1,252,395 100 1 K
Company<br />
Registered<br />
Currency<br />
Consolidated Financial Statements <strong>2011</strong><br />
Nominal<br />
capital<br />
in 1,000<br />
Equity<br />
interest<br />
in %<br />
Invest-<br />
ment<br />
Method<br />
of con-<br />
solidation<br />
Middle East and Africa<br />
Panalpina Gulf LLC Dubai AED 1,000 49 2 K<br />
Panalpina Jebel Ali Ltd. Jebel Ali AED 100 100 1 K<br />
Panalpina World Transport (Dubai) DWC-LLC Dubai AED 300 100 1 K<br />
Panalpina World Transport (Kuwait) WLL Kuwait KWD 20 49 2 K<br />
Panalpina (Bahrain) WLL Manama BHD 20 100 1 K<br />
Panalpina Central Asia EC Manama USD 17,020 100 1 K<br />
Panalpina Georgia LLC Tbilisi GEL 11 100 1 K<br />
Panalpina Azerbaijan LLC Baku AZN 1 100 1 K<br />
Panalpina Turkmenistan LLC Turkmenbashi TMT 62 100 1 K<br />
Qatar Shipping Company (Panalpina Qatar) WLL Doha QAR 200 49 2 K<br />
Panalpina World Transport (Saudi Arabia) Ltd. Al Khobar SAR 500 100 1 K<br />
Panalpina Transports Mondiaux Cameroun S.A.R.L. Douala XAF 150,000 100 1 K<br />
Panalpina Transports Mondiaux Algérie EURL Hassi Messaoud DZD 128,039 100 1 K<br />
Panalpina Transports Mondiaux Congo S.A.R.L. Pointe-Noire XAF 70,000 100 1 K<br />
Panalpina Transports Mondiaux Gabon S.A. Port-Gentil XAF 50,000 90 1 K<br />
Panalpina (Ghana) Ltd.<br />
Panalpina Transportes Mundiais Navegãçao<br />
Accra GHS 10 100 1 K<br />
e Trânsitos S.A.R.L. Luanda AOA 18,000 92 1 K<br />
K = fully consolidated<br />
N = not consolidated<br />
1 = capital participation 50 – 100 %<br />
2 = controlling influence over management<br />
3 = capital participation less than 50 %<br />
Panalpina <strong>Annual</strong> <strong>Report</strong> <strong>2011</strong><br />
125
126<br />
Consolidated Financial Statements <strong>2011</strong><br />
Panalpina <strong>Annual</strong> <strong>Report</strong> <strong>2011</strong>
Panalpina World Transport (Holding) Ltd., Basel<br />
Consolidated Financial Statements <strong>2011</strong><br />
<strong>Report</strong> of the Statutory Auditor on the Consolidated<br />
Financial Statements to the General Meeting<br />
of Shareholders of<br />
As statutory auditor, we have audited the accompanying consolidated financial statements of Panalpina World Transport (Holding) Ltd.,<br />
which comprise the consolidated income statement, consolidated statement of comprehensive income, consolidated statement of financial<br />
position, consolidated statement of changes in equity, consolidated statement of cash flows and notes on pages 64 to 125 for the year<br />
ended December 31, <strong>2011</strong>.<br />
Board of Directors’ Responsibility<br />
The board of directors is responsible for the preparation and fair presentation of the consolidated financial statements in accordance with<br />
International Financial <strong>Report</strong>ing Standards (IFRS) and the requirements of Swiss law. This responsibility includes designing, implementing<br />
and maintaining an internal control system relevant to the preparation and fair presentation of consolidated financial statements that are<br />
free from material misstatement, whether due to fraud or error. The board of directors is further responsible for selecting and applying<br />
appropriate accounting policies and making accounting estimates that are reasonable in the circumstances.<br />
Auditor’s Responsibility<br />
Our responsibility is to express an opinion on these consolidated financial statements based on our audit. We conducted our audit in<br />
accordance with Swiss law and Swiss Auditing Standards as well as International Standards on Auditing. Those standards require that<br />
we plan and perform the audit to obtain reasonable assurance whether the consolidated financial statements are free from material<br />
misstatement.<br />
An audit involves performing procedures to obtain audit evidence about the amounts and disclosures in the consolidated financial statements.<br />
The procedures selected depend on the auditor’s judgment, including the assessment of the risks of material misstatement of<br />
the consolidated financial statements, whether due to fraud or error. In making those risk assessments, the auditor considers the internal<br />
control system relevant to the entity’s preparation and fair presentation of the consolidated financial statements in order to design audit<br />
procedures that are appropriate in the circumstances, but not for the purpose of expressing an opinion on the effectiveness of the entity’s<br />
internal control system. An audit also includes evaluating the appropriateness of the accounting policies used and the reasonableness<br />
of accounting estimates made, as well as evaluating the overall presentation of the consolidated financial statements. We believe that the<br />
audit evidence we have obtained is sufficient and appropriate to provide a basis for our audit opinion.<br />
Opinion<br />
In our opinion, the consolidated financial statements for the year ended December 31, <strong>2011</strong> give a true and fair view of the financial position,<br />
the results of operations and the cash flows in accordance with International Financial <strong>Report</strong>ing Standards (IFRS) and comply with<br />
Swiss law.<br />
<strong>Report</strong> on Other Legal Requirements<br />
We confirm that we meet the legal requirements on licensing according to the Auditor Oversight Act (AOA) and independence (article 728<br />
CO and article 11 AOA) and that there are no circumstances incompatible with our independence.<br />
In accordance with article 728a paragraph 1 item 3 CO and Swiss Auditing Standard 890, we confirm that an internal control system exists,<br />
which has been designed for the preparation of consolidated financial statements according to the instructions of the board of directors.<br />
We recommend that the consolidated financial statements submitted to you be approved.<br />
KPMG AG<br />
Regula Wallimann Martin Rohrbach<br />
Licensed Audit Expert Licensed Audit Expert<br />
Auditor in Charge<br />
Zurich, March 2, 2012<br />
Panalpina <strong>Annual</strong> <strong>Report</strong> <strong>2011</strong><br />
127
128<br />
Consolidated Financial Statements <strong>2011</strong><br />
Key Figures in CHF<br />
Five-year review<br />
in million CHF <strong>2011</strong> 2010 2009 2008 2007<br />
Forwarding services 7,926 8,676 7,340 10,597 10,548<br />
Change in % (8.64) 18.19 (30.73) 0.47 13.41<br />
Net forwarding revenue 6,500 7,164 5,958 8,878 8,641<br />
Change in % (9.27) 20.25 (32.89) 2.74 11.71<br />
Gross profit 1,477 1,480 1,377 1,742 1,803<br />
Change in % (0.21) 7.49 (20.94) (3.43) 13.35<br />
in % of net revenue 22.72 20.66 23.11 19.62 20.87<br />
Consolidated profit 127.4 (26.0) 10.4 113.8 210.6<br />
Change in % 590.06 (348.94) (90.82) (45.98) 14.77<br />
in % of gross profit 8.63 (1.76) 0.76 6.53 11.68<br />
EBITDA 212.1 62.4 79.7 240.7 360.8<br />
Change in % 240.09 (21.78) (66.88) (33.29) 15.39<br />
in % of gross profit 14.36 4.21 5.79 13.82 20.01<br />
EBITA 183.6 23.5 42.5 204.7 310.7<br />
Change in % 682.11 (44.77) (79.23) (34.13) 11.80<br />
in % of gross profit 12.43 1.59 3.09 11.75 17.23<br />
EBIT 174.2 15.4 29.9 193.0 299.4<br />
Change in % 1,033.97 (48.64) (84.50) (35.54) 14.70<br />
in % of gross profit 11.79 1.04 2.17 11.08 16.60<br />
Cash generated from operations 229.1 75.3 311.8 274.5 278.9<br />
Change in % 204.35 (75.86) 13.58 (1.58) (13.20)<br />
in % of gross profit 15.51 5.09 22.64 15.76 15.47<br />
Net cash from operating activities 193.5 37.0 259.8 193.2 209.5<br />
Change in % 422.45 (85.74) 34.45 (7.78) (13.03)<br />
in % of gross profit 13.10 2.50 18.87 11.09 11.62<br />
Free cash flow 41.9 6.2 225.9 170.2 138.1<br />
Change in % 570.94 (97.24) 32.73 (23.20) (25.74)<br />
in % of gross profit 2.84 0.42 16.41 9.77 7.66<br />
Net working capital 85.2 143.0 132.2 351.6 487.8<br />
Change in % (40.42) 8.20 (62.42) (27.92) 17.72<br />
Capital expenditure on fixed assets 51.2 40.0 41.8 58.4 50.8<br />
Change in % 27.87 (4.31) (28.34) 14.90 (10.84)<br />
in % of gross profit 3.47 2.71 3.04 3.35 2.82<br />
Net capital expenditure on fixed assets 108.7 28.5 29.4 25.6 45.4<br />
Change in % 281.81 (3.24) 14.81 (43.56) (15.90)<br />
in % of gross profit 7.36 1.92 2.14 1.47 2.52<br />
Panalpina <strong>Annual</strong> <strong>Report</strong> <strong>2011</strong>
Consolidated Financial Statements <strong>2011</strong><br />
in million CHF <strong>2011</strong> 2010 2009 2008 2007<br />
Depreciation and amortization 37.9 47.0 49.8 47.8 61.5<br />
Change in % (19.37) (5.65) 4.33 (22.33) 18.91<br />
in % of gross profit 2.57 3.18 3.62 2.74 3.53<br />
Personnel expenses 892.4 890.9 879.1 992.5 1,002.5<br />
Personnel<br />
Number of employees at year-end (world) 15,051 14,136 13,570 14,804 15,301<br />
Number of employees at year-end (Switzerland) 775 749 737 778 769<br />
Productivity ratios (CHF)<br />
Net sales per average employee 425,226 503,703 429,864 582,867 587,344<br />
Gross profit per average employee 96,624 104,062 99,343 114,356 122,581<br />
Personnel expenses per average employee 58,380 62,641 63,430 65,163 68,138<br />
Personnel cost in % of gross profit 60.42 60.20 63.85 56.99 55.59<br />
Leverage (liabilities/equity) 1.35 1.46 1.24 1.27 1.23<br />
Net interest-bearing liabilities (591) (546) (535) (381) (325)<br />
Gross gearing (interest-bearing liabilities/equity) 0.01 0.01 0.02 0.02 0.03<br />
Net gearing (net interest-bearing liabilities/equity) (0.65) (0.68) (0.63) (0.44) (0.32)<br />
ROCE (EBIT less tax/capital employed) in % 43.22 (5.40) 6.14 23.03 34.84<br />
Current cash debt coverage ratio<br />
(net operating cash flow/average current liability) 0.19 0.04 0.27 0.19 0.20<br />
Cash debt coverage ratio<br />
(net operating cash flow/average total liability) 0.16 0.03 0.24 0.16 0.18<br />
Return on equity in % 14.9 (3.1) 1.2 12.1 21.2<br />
Change in % (575.95) (360.88) (89.97) (42.92) 4.83<br />
Panalpina <strong>Annual</strong> <strong>Report</strong> <strong>2011</strong><br />
129
130<br />
Consolidated Financial Statements <strong>2011</strong><br />
Consolidated Statement of Financial Position in CHF<br />
Five-year review<br />
in million CHF <strong>2011</strong> 2010 2009 2008 2007<br />
ASSETS 2,135 1,989 1,925 1,971 2,278<br />
Change in % 7.34 3.36 (2.35) (13.48) 8.08<br />
Current assets 1,745 1,686 1,599 1,679 1,922<br />
Change in % 3.50 5.48 (4.78) (12.64) 8.40<br />
Liquid funds 599 555 548 401 358<br />
Change in % 7.77 1.30 36.69 12.00 (4.73)<br />
Receivables and other current assets 1,147 1,131 1,050 1,278 1,564<br />
Change in % 1.41 7.66 (17.80) (18.28) 11.94<br />
Non-current assets 390 303 326 292 356<br />
Change in % 28.72 (7.04) 11.66 (18.00) 6.06<br />
Property, plant and equipment 113 114 141 148 168<br />
Change in % (0.57) (19.42) (4.35) (11.89) 3.47<br />
Financial assets 135 111 113 70 103<br />
Change in % 21.62 (1.53) 60.07 (31.29) 42.59<br />
Intangible assets 142 78 72 74 86<br />
Change in % 81.51 8.65 (2.52) (14.06) (15.63)<br />
LIABILITIES AND EQUITY 2,135 1,989 1,925 1,971 2,278<br />
Change in % 7.34 3.36 (2.35) (13.48) 8.07<br />
Liabilities 1,220 1,177 1,061 1,100 1,252<br />
Change in % 3.68 10.93 (3.50) (12.18) 10.73<br />
Payables, accruals and deferred income 1,002 914 878 912 1,056<br />
Change in % 9.71 4.05 (3.69) (13.65) 5.33<br />
Borrowings 8 10 13 20 33<br />
Change in % (22.70) (24.43) (36.49) (39.38) 22.60<br />
Provisions 210 254 170 167 163<br />
Change in % (17.02) 49.17 1.54 2.91 61.10<br />
Non-controlling interests 9 8 7 8 7<br />
Equity 906 804 857 864 1,019<br />
Change in % 12.62 (6.10) (0.83) (15.25) 5.07<br />
Share capital 50 50 50 50 50<br />
Change in % 0.00 0.00 0.00 0.00 0.00<br />
Treasury shares (197) (196) (193) (198) (101)<br />
Change in % 0.65 1.78 (2.62) 95.03 575.98<br />
Translation reserves (162) (151) (136) (146) (74)<br />
Change in % 7.30 10.70 (6.51) 96.03 13.50<br />
Retained earnings and other reserves 1,215 1,101 1,136 1,157 1,145<br />
Change in % 10.34 (3.02) (1.89) 1.09 14.50<br />
Panalpina <strong>Annual</strong> <strong>Report</strong> <strong>2011</strong>
Key Figures in EUR<br />
Five-year review<br />
Consolidated Financial Statements <strong>2011</strong><br />
in million EUR <strong>2011</strong> 2010 2009 2008 2007<br />
Forwarding services 6,440 6,293 4,861 6,677 6,421<br />
Change in % 2.34 29.46 (27.20) 3.99 8.92<br />
Net forwarding revenue 5,281 5,196 3,945 5,594 5,260<br />
Change in % 1.64 31.71 (29.48) 6.35 7.28<br />
Gross profit 1,200 1,074 912 1,097 1,098<br />
Change in % 11.73 17.76 (16.86) (0.09) 8.91<br />
in % of net revenue 22.72 20.67 23.12 19.61 20.87<br />
Consolidated profit 103.5 (18.9) 6.9 71.7 128.2<br />
Change in % 647.62 (373.91) (90.38) (44.07) 10.23<br />
in % of gross profit 8.63 (1.76) 0.76 6.54 11.68<br />
EBITDA 172.3 45.2 52.8 151.7 219.7<br />
Change in % 281.19 (14.39) (65.19) (30.95) 10.83<br />
in % of gross profit 14.36 4.21 5.79 13.83 20.01<br />
EBITA 149.2 17.0 28.1 129.0 189.1<br />
Change in % 777.65 (39.50) (78.22) (31.78) 7.40<br />
in % of gross profit 12.43 1.58 3.08 11.76 17.23<br />
EBIT 141.5 11.1 19.8 121.6 182.2<br />
Change in % 1,174.77 (43.94) (83.72) (33.26) 10.18<br />
in % of gross profit 11.79 1.03 2.17 11.08 16.60<br />
Cash generated from operations 186.1 54.6 206.5 172.9 232.1<br />
Change in % 240.84 (73.56) 19.43 (25.51) 13.98<br />
in % of gross profit 15.51 5.08 22.64 15.76 21.14<br />
Net cash from operating activities 157.2 26.9 172.0 121.7 127.5<br />
Change in % 484.39 (84.36) 41.33 (4.55) (16.48)<br />
in % of gross profit 13.10 2.50 18.86 11.09 11.62<br />
Free cash flow 34.0 4.5 149.6 107.2 84.1<br />
Change in % 655.56 (96.99) 39.55 27.47 (28.68)<br />
in % of gross profit 2.83 0.42 16.40 9.77 7.66<br />
Net working capital 70.0 114.3 89.0 236.1 293.1<br />
Change in % (38.76) 28.43 (62.30) (19.45) 14.09<br />
Capital expenditure on fixed assets 42.1 32.0 28.2 39.2 30.5<br />
Change in % 31.56 13.48 (28.06) 28.52 (13.75)<br />
in % of gross profit 3.51 2.98 3.09 3.57 2.78<br />
Net capital expenditure on fixed assets 89.4 22.8 19.8 17.2 27.3<br />
Change in % 292.11 15.15 15.12 (37.00) (18.79)<br />
in % of gross profit 7.45 2.12 2.17 1.57 2.49<br />
Panalpina <strong>Annual</strong> <strong>Report</strong> <strong>2011</strong><br />
131
132<br />
Consolidated Financial Statements <strong>2011</strong><br />
in million EUR <strong>2011</strong> 2010 2009 2008 2007<br />
Depreciation and amortization 30.8 34.1 33.0 30.1 37.4<br />
Change in % (9.68) 3.33 9.63 (19.52) 14.44<br />
in % of gross profit 2.57 3.18 3.62 2.74 3.41<br />
Personnel expenses 725.1 646.2 582.2 625.4 610.2<br />
Personnel<br />
Number of employees at year-end (world) 15,051 14,136 13,570 14,804 15,301<br />
Number of employees at year-end (Switzerland) 775 749 737 778 769<br />
Productivity ratios (in EUR)<br />
Net sales per average employee 345,480 365,324 284,632 367,277 357,539<br />
Gross profit per average employee 78,503 75,511 65,801 72,024 74,620<br />
Personnel expenses per average employee 47,436 45,433 42,006 41,061 41,478<br />
Personnel cost in % of gross profit 60.43 60.17 63.84 57.01 55.59<br />
Leverage (liabilities/equity) 1.35 1.46 1.24 1.27 1.23<br />
Net interest-bearing liabilities (486) (436) (361) (256) (195)<br />
Gross gearing (interest-bearing liabilities/equity) 0.01 0.01 0.02 0.02 0.03<br />
Net gearing (net interest-bearing liabilities/equity) (0.65) (0.68) (0.63) (0.44) (0.32)<br />
ROCE (EBIT less tax / capital employed) in % 43.22 (5.40) 6.14 23.03 34.84<br />
Current cash debt coverage ratio<br />
(net operating cash flow/average current liability) 0.19 0.04 0.27 0.19 0.20<br />
Cash debt coverage ratio<br />
(net operating cash flow/average total liability) 0.16 0.03 0.24 0.16 0.16<br />
Return on equity in % 14.9 (3.1) 1.2 12.1 12.1<br />
Change in % (575.95) (360.88) (89.97) (42.92) (42.92)<br />
Panalpina <strong>Annual</strong> <strong>Report</strong> <strong>2011</strong>
Consolidated Financial Statements <strong>2011</strong><br />
Consolidated Statement of Financial Position in EUR<br />
Five-year review<br />
in million EUR <strong>2011</strong> 2010 2009 2008 2007<br />
ASSETS 1,756 1,590 1,297 1,323 1,369<br />
Change in % 10.44 22.59 (1.97) (3.36) 14.56<br />
Current assets 1,435 1,348 1,077 1,127 1,155<br />
Change in % 6.45 25.16 (4.44) (2.42) 15.54<br />
Liquid funds 492 444 369 269 215<br />
Change in % 10.81 20.33 37.17 25.12 (7.73)<br />
Receivables and other current assets 943 904 708 858 940<br />
Change in % 4.31 27.68 (17.48) (8.72) 8.05<br />
Non-current assets 321 242 220 196 214<br />
Change in % 32.64 10.00 12.24 (8.41) 2.33<br />
Property, plant and equipment 93 91 95 99 101<br />
Change in % 2.20 (4.21) (4.04) (1.98) 0.71<br />
Financial assets 111 89 76 47 62<br />
Change in % 24.72 17.11 61.70 (24.19) 36.89<br />
Intangible assets 117 62 48 49 52<br />
Change in % 88.71 29.17 (2.04) (5.77) (19.45)<br />
LIABILITIES AND EQUITY 1,756 1,590 1,297 1,323 1,369<br />
Change in % 10.44 22.59 (1.97) (3.36) 4.39<br />
Liabilities 1,003 941 715 738 752<br />
Change in % 6.59 31.61 (3.12) (1.86) 7.01<br />
Payables, accruals and deferred income 824 730 592 612 634<br />
Change in % 12.88 23.31 (3.27) (3.47) 1.83<br />
Borrowings 6 8 9 14 20<br />
Change in % (25.00) (11.11) (35.71) (30.00) 18.30<br />
Provisions 173 203 115 112 98<br />
Change in % (14.78) 76.52 2.68 14.29 55.18<br />
Non-controlling interests 7 6 5 5 4<br />
Equity 745 643 577 580 612<br />
Change in % 15.86 11.44 (0.52) (5.23) 1.55<br />
Share capital 41 40 34 34 30<br />
Change in % 2.50 17.65 0.00 13.33 (6.12)<br />
Treasury shares (162) (157) (130) (133) (61)<br />
Change in % 3.18 20.77 (2.26) 118.03 5,992.36<br />
Translation reserves (133) (121) (92) (98) (45)<br />
Change in % 9.92 31.52 (6.12) 117.78 9.12<br />
Retained earnings and other reserves 999 880 765 777 688<br />
Change in % 13.52 15.03 (1.54) 12.94 10.61<br />
Panalpina <strong>Annual</strong> <strong>Report</strong> <strong>2011</strong><br />
133
134<br />
<strong>Annual</strong> Financial Statements <strong>2011</strong><br />
Financial Statements <strong>2011</strong><br />
Panalpina World Transport (Holding) Ltd.<br />
Income Statement<br />
for the years ended December 31, <strong>2011</strong> and 2010<br />
in thousand CHF <strong>2011</strong> 2010<br />
Income<br />
Income from participations 87,737 142,904<br />
Financial income 41,728 55,670<br />
Royalties income 49,577 34,741<br />
Release of valuation allowance on loans to Group companies 47,268 3,520<br />
Total income 226,310 236,835<br />
Expenses<br />
Personnel expenses 13,357 11,939<br />
Other administrative expenses 12,973 35,034<br />
Financial expenses 10,357 12,820<br />
Depreciation and value adjustments 168,740 36,336<br />
Total expenses 205,427 96,129<br />
Taxes 1,817 2,159<br />
Profit for the year 19,066 138,547<br />
Panalpina <strong>Annual</strong> <strong>Report</strong> <strong>2011</strong>
Balance Sheet<br />
as of December 31 (before profit appropriation)<br />
Assets<br />
<strong>Annual</strong> Financial Statements <strong>2011</strong><br />
in thousand CHF <strong>2011</strong> 2010<br />
Current assets<br />
Cash 303,247 353,736<br />
Cash pool receivables from Group companies 101,647 82,140<br />
Receivables:<br />
– from Group companies 3,340 3,371<br />
– from third parties 242 194<br />
Financial receivables from Group companies 167,895 103,667<br />
Marketable securities 20,000 6,089<br />
Prepaid expenses and deferred charges 53,176 51,075<br />
Total current assets 649,547 600,272<br />
Long-term assets<br />
Participations 161,361 162,069<br />
Loans to Group companies 1 161,378 241,515<br />
Financial assets 34,234 0<br />
Own shares 84,128 82,853<br />
Total long-term assets 441,101 486,437<br />
Total assets 1,090,648 1,086,709<br />
1 Thereof subordinated CHF 68.0 million (2010: CHF 68.0 million)<br />
Liabilities and Equity<br />
in thousand CHF <strong>2011</strong> 2010<br />
Short-term liabilities<br />
Cash pool payables to Group companies 105,152 122,601<br />
Payables:<br />
– due to Group companies 2,528 5,945<br />
– due to third parties 1,424 1,589<br />
Financial liabilities to Group companies 79,702 74,469<br />
Accrued expenses 11,977 10,178<br />
Total short-term liabilities 200,783 214,782<br />
Long-term liabilities<br />
Provisions 4,306 5,434<br />
Total long-term liabilities 4,306 5,434<br />
Total liabilities 205,089 220,216<br />
Equity<br />
Share capital 50,000 50,000<br />
General legal reserve 10,000 10,000<br />
Reserve for own shares 197,277 196,003<br />
Special reserve 130,573 131,847<br />
Accumulated earnings:<br />
– balance brought forward from previous year 478,643 340,096<br />
– profit for the year 19,066 138,547<br />
Total equity 885,559 866,493<br />
Total liabilities and equity 1,090,648 1,086,709<br />
Panalpina <strong>Annual</strong> <strong>Report</strong> <strong>2011</strong><br />
135
136<br />
<strong>Annual</strong> Financial Statements <strong>2011</strong><br />
Notes to the Financial Statements<br />
General<br />
The Group’s consolidated financial statements must be considered for an appropriate financial and economic assessment of the Group.<br />
The presented statutory financial statements of Panalpina World Transport (Holding) Ltd. were prepared in accordance with the requirements<br />
of the Swiss Code of Obligations (SCO).<br />
Valuation methods and translation of foreign currencies<br />
Treasury shares are valued at the lower of cost and market value. All other assets, including participations, are reported at cost less<br />
appropriate write-downs. Assets and liabilities denominated in foreign currencies are translated into Swiss francs (CHF), using year-end<br />
rates<br />
of exchange, except participations which are translated at historical rates. Marketable securities are reported at market value. Transactions<br />
during the year which are denominated in foreign currencies are translated at exchange rates effective at the relevant transaction dates.<br />
Resulting exchange gains and losses are recognized in the income statement with the exception of unrealized gains which are deferred.<br />
Income from participations<br />
The decrease of CHF 55.2 million is due to the fact that Panalpina Welttransport (Holding) Ltd. received fewer dividends from subsidiaries.<br />
Financial income<br />
The drop of CHF 13.9 million compared to the prior year is predominantly attributable to lower foreign exchange gains of CHF 10.3 million<br />
and less interest income of CHF 3.4 million from subsidiaries.<br />
Royalty income<br />
In 2009, Panalpina World Transport (Holding) Ltd. received for the first time a fee from its subsidiaries for usage of the Panalpina network<br />
and trademark. This fee increased in <strong>2011</strong> by CHF 14.8 million.<br />
Release of valuation allowance on loans to Group companies<br />
As a result of Debt/Equity Swaps, the Company was able to release a valuation allowance amounting to CHF 47.3 million.<br />
Personnel expenses<br />
In accordance with the Transparency Act, the compensation of the key management personnel is disclosed in note 29 in the Group’s<br />
financial statements.<br />
Other administrative expenses<br />
The reduction of CHF 22.1 million in other administrative expenses is mostly attributable to less legal and consulting expenses in connection<br />
with the FCPA investigation (CHF 19.0 million) and a decline in claims expenses (CHF 4.9 million).<br />
Financial expenses<br />
The drop in financial expenses of CHF 2.5 million is mainly due to the fact that in <strong>2011</strong> CHF 1.0 million less losses of subsidiaries had to be<br />
covered and CHF 1.0 million less interest had to be paid.<br />
Depreciation and value adjustments<br />
In <strong>2011</strong>, value adjustments to participations amounting to CHF 168.7 million were booked to the income statement in accordance with the<br />
Company’s practice to directly write off capital contributions to cover losses or undercapitalization in subsidiaries.<br />
Cash pool receivables and payables<br />
The cash pool receivables augmented for CHF 19.5 million and the cash pool payables declined for CHF 17.4 million, thus the net receivables<br />
increased for CHF 37.0 million.<br />
Financial receivables and loans to Group companies<br />
Financial receivables and loans to Group companies increased by CHF 64.2 million compared to 2010 mainly due to swap of financing structure<br />
of subsidiaries from long-term loans to short-term loans.<br />
Marketable securities<br />
In the year under review, investments of CHF 20.0 million were made in fixed-term deposits.<br />
Panalpina <strong>Annual</strong> <strong>Report</strong> <strong>2011</strong>
Participations<br />
<strong>Annual</strong> Financial Statements <strong>2011</strong><br />
The principal direct and indirect subsidiaries of Panalpina World Transport (Holding) Ltd. are listed under the heading “Principal Group<br />
companies and participations” on pages 122 to 125.<br />
Financial assets<br />
In <strong>2011</strong>, for the first time investments into fix term deposits were done, the investments amount to CHF 34.2 million.<br />
Own shares<br />
In the year under review, treasury shares purchased totaled 79,042 shares (2010: 94,142 shares) with an average purchase price per<br />
share of CHF 109.02 (2010: CHF 111.96) and treasury share sales totaled 68,492 shares (2010: 69,123 shares) with an average sale price<br />
of CHF 68.40 (2010: CHF 74.14). Of these shares a total of 118,092 (2010: 107,542) are held for serving the employee option plan.<br />
The other 1,250,000 shares (2010: 1,250,000) are held for the share buyback program. This program was launched in 2007 by the Board<br />
of Directors to return excess capital to the shareholders. The share buyback program includes up to 5 % of the total share capital, which<br />
represents a maximum of 1,250,000 registered shares. The number of treasury shares held by Panalpina World Transport (Holding) Ltd.<br />
meets the definitions and requirements of art. 659, 659a, 663b para 10 and 671a SCO.<br />
Number of shares<br />
31.12.<strong>2011</strong><br />
Movement<br />
in year<br />
31.12.2010<br />
Movement<br />
in year<br />
31.12.2009<br />
Total Panalpina World Transport (Holding) Ltd. shares<br />
issued<br />
Total treasury shares held by Panalpina World Transport<br />
25,000,000 0 25,000,000 0 25,000,000<br />
(Holding) Ltd. 1,368,092 10,550 1,357,542 25,019 1,332,523<br />
in % 5.47 5.43 5.33<br />
Provisions<br />
An amount of CHF 1.8 million is related to the obligations Panalpina has accepted under the DPA as mentioned in note 31.<br />
Share capital<br />
As in the previous year, the fully paid-in share capital on December 31, <strong>2011</strong> amounts to CHF 50 million consisting of 25 million registered<br />
shares at a par value of CHF 2.00 each. With regard to the authorized capital increase and share buyback program we refer to note 23 in the<br />
Group’s financial statements.<br />
in % <strong>2011</strong> 2010<br />
Shareholders<br />
Ernst Göhner Stiftung, Switzerland 43.58 43.58<br />
Cevian Capital II Master Fund L.P. 11.37 10.31<br />
Bestinver Gestión, S.G. SGIIC, Spain 5.05 –<br />
Artisan Partners Limited Partnership, USA<br />
Portfolio investment (according to the share register, there are no more shareholders<br />
5.01 5.01<br />
with holdings of more than 3 % or 5 %) 29.52 35.67*<br />
Panalpina World Transport (Holding) Ltd. 5.47 5.43*<br />
Nominees<br />
Chase Nominees Ltd., UK 5.23 6.02<br />
* restated considering own shares of Panalpina<br />
Panalpina <strong>Annual</strong> <strong>Report</strong> <strong>2011</strong><br />
137
138<br />
<strong>Annual</strong> Financial Statements <strong>2011</strong><br />
General legal reserves<br />
The legal reserve must be at least 20 % of the share capital of Panalpina World Transport (Holding) Ltd. in order to comply with the SCO.<br />
Panalpina World Transport (Holding) Ltd. has met the legal requirements for legal reserves under art. 671 SCO.<br />
Guarantees<br />
in thousand CHF <strong>2011</strong> 2010<br />
Guarantees in favor of third parties<br />
Guarantees and indemnity liabilities, SCO, art. 663b para 1 198,780 199,076<br />
Additionally, Panalpina World Transport (Holding) Ltd., Basel, has issued letters of awareness in favor of various banks concerning liabilities<br />
due from subsidiaries amounting to CHF 2.7 million (previous year: CHF 0.2 million).<br />
Contingent liabilities<br />
In 2008, Panalpina World Transport (Holding) Ltd. signed a letter of indemnity as a security for the intraday cash pool overdraft limits over a<br />
maximum amount of CHF 60 million.<br />
Panalpina World Transport (Holding) Ltd. carries joint liability to the federal tax authorities for value-added tax of all Swiss subsidiaries.<br />
Pending legal claims<br />
Business practices investigation<br />
In November 2010, Panalpina entered into a Deferred Prosecution Agreement (DPA) with the US Department of Justice (DOJ) to resolve<br />
claims against it arising from an investigation by the DOJ and the US Securities and Exchange Commission (SEC) for violations of the<br />
US Foreign Corrupt Practices Act (FCPA). Under the DPA, the DOJ has agreed to defer any criminal prosecution for three years. Panalpina<br />
has accepted certain obligations under the DPA, such as further strengthening its compliance policies and procedures and providing<br />
regular reports to the DOJ on the company’s progress. If Panalpina satisfies its obligations under the DPA, the DOJ has agreed to release<br />
the company from criminal liability at the end of the three-year term.<br />
Freight forwarding antitrust investigation<br />
In October 2007, Panalpina’s headquarters in Switzerland and the USA were raided by the respective competition authorities. Further, a<br />
request for information was served by the New Zealand Commerce Division and a document retention notice by the Competition Bureau<br />
Canada.<br />
In April 2008, the Australian Competition and Consumer Commission served a notice on the Australian subsidiary requesting information<br />
and documents and in June 2008, Panalpina’s UK subsidiary was the recipient of a request for information issued by the European<br />
Commission requesting certain information and records relating to alleged antitrust violations in the freight forwarding industry. In August<br />
2010, Brazilian authorities announced preliminary investigations against the freight forwarding industry. In December <strong>2011</strong> Panalpina’s<br />
local subsidiary received a letter from the Competition Commission Singapore to detail whether it has engaged in similar anti-competitive<br />
conduct.<br />
These activities were part of an investigation of several competition authorities against various major freight forwarding companies for<br />
alleged anti-competitive behavior.<br />
Panalpina <strong>Annual</strong> <strong>Report</strong> <strong>2011</strong>
<strong>Annual</strong> Financial Statements <strong>2011</strong><br />
Furthermore, a civil class action lawsuit was filed in the USA against Panalpina and a number of its major competitors as a direct consequence<br />
of these investigations alleging a conspiracy in the pricing of freight forwarding services. In July 2009, plaintiffs filed an amended<br />
complaint adding additional defendants and claims. In November 2009, the Company, along with other defendants, filed motions to dismiss<br />
the amended complaint for failure to state a claim and for lack of subject matter jurisdiction. Oppositions to the motions were filed<br />
in January 2010. At this stage, Panalpina is unable to express an opinion as to the probable outcome of this litigation and thus to estimate<br />
the potential loss, if any.<br />
In 2009, the Competition Bureau Canada closed its investigation into alleged anti-competitive activity due to a lack of evidence substantiating<br />
an undue lessening of competition.<br />
In January 2010, the Australian Competition and Consumer Commission also discontinued its investigation.<br />
In February 2010, Panalpina was served with a Statement of Objections by the European Commission, alleging anti-competitive behavior<br />
in the freight forwarding industry. In an oral hearing before the Commission’s case team held in July 2010, Panalpina has presented its<br />
arguments. In January <strong>2011</strong>, Panalpina received an additional request for information issued by the European Commission. A final decision<br />
is not expected prior to early 2012.<br />
In October 2010, Panalpina announced a settlement with the DOJ over violations of the Sherman Antitrust Act related to the sale of international<br />
air freight forwarding services. Under the terms of the settlement, which has been approved by the competent court, Panalpina<br />
has agreed to pay a fine of approximately USD twelve million.<br />
In the reporting year Panalpina completed settlement negotiations with the New Zealand Commerce Commission and the agreed penalty<br />
has been approved by the competent court.<br />
It is not possible to predict the outcome of the pending anti-trust proceedings at this stage. They may, however, result in material penalties<br />
being imposed on Panalpina. As Panalpina is not yet in a position to assess its exposure and the potential financial consequences in these<br />
proceedings, no related provisions have been made as of December 31, <strong>2011</strong>.<br />
Risk management<br />
The detailed disclosures regarding risk management/assessment that are required by Swiss law are included in the Panalpina Group’s<br />
consolidated financial statements on pages 100 – 106.<br />
Panalpina <strong>Annual</strong> <strong>Report</strong> <strong>2011</strong><br />
139
140<br />
<strong>Annual</strong> Financial Statements <strong>2011</strong><br />
Appropriation of Available Earnings<br />
The Board of Directors proposes the following appropriation of available earnings of total CHF 497,709,723 at the <strong>Annual</strong> General Meeting:<br />
in CHF <strong>2011</strong><br />
Distribution of an ordinary dividend of CHF 2.00 gross per share* 47,263,816<br />
To be carried forward 450,445,907<br />
Total 497,709,723<br />
* It is not planned to pay dividends on own shares held by the Group.<br />
Panalpina <strong>Annual</strong> <strong>Report</strong> <strong>2011</strong>
Panalpina World Transport (Holding) Ltd., Basel<br />
<strong>Annual</strong> Financial Statements <strong>2011</strong><br />
<strong>Report</strong> of the Statutory Auditor on the Financial<br />
Statements to the General Meeting of Shareholders of<br />
As statutory auditor, we have audited the accompanying financial statements of Panalpina World Transport (Holding) Ltd., which comprise<br />
balance sheet, income statement and notes on pages 134 to 140 for the year ended December 31, <strong>2011</strong>.<br />
Board of Directors’ Responsibility<br />
The board of directors is responsible for the preparation of the financial statements in accordance with the requirements of Swiss law and<br />
the company’s articles of incorporation. This responsibility includes designing, implementing and maintaining an internal control system<br />
relevant to the preparation of financial statements that are free from material misstatement, whether due to fraud or error. The board of<br />
directors is further responsible for selecting and applying appropriate accounting policies and making accounting estimates that are<br />
reasonable in the circumstances.<br />
Auditor’s Responsibility<br />
Our responsibility is to express an opinion on these financial statements based on our audit. We conducted our audit in accordance with<br />
Swiss law and Swiss Auditing Standards. Those standards require that we plan and perform the audit to obtain reasonable assurance<br />
whether the financial statements are free from material misstatement.<br />
An audit involves performing procedures to obtain audit evidence about the amounts and disclosures in the financial statements. The procedures<br />
selected depend on the auditor’s judgment, including the assessment of the risks of material misstatement of the financial statements,<br />
whether due to fraud or error. In making those risk assessments, the auditor considers the internal control system relevant to the<br />
entity’s preparation of the financial statements in order to design audit procedures that are appropriate in the circumstances, but not for<br />
the purpose of expressing an opinion on the effectiveness of the entity’s internal control system. An audit also includes evaluating the<br />
appropriateness of the accounting policies used and the reasonableness of accounting estimates made, as well as evaluating the overall<br />
presentation of the financial statements. We believe that the audit evidence we have obtained is sufficient and appropriate to provide a basis<br />
for our audit opinion.<br />
Opinion<br />
In our opinion, the financial statements for the year ended December 31, <strong>2011</strong> comply with Swiss law and the company’s articles of<br />
incorporation.<br />
<strong>Report</strong> on Other Legal Requirements<br />
We confirm that we meet the legal requirements on licensing according to the Auditor Oversight Act (AOA) and independence (article 728 CO<br />
and article 11 AOA) and that there are no circumstances incompatible with our independence.<br />
In accordance with article 728a paragraph 1 item 3 CO and Swiss Auditing Standard 890, we confirm that an internal control system exists,<br />
which has been designed for the preparation of financial statements according to the instructions of the board of directors.<br />
We further confirm that the proposed appropriation of available earnings complies with Swiss law and the company’s articles of incorporation.<br />
We recommend that the financial statements submitted to you be approved.<br />
KPMG AG<br />
Regula Wallimann Martin Rohrbach<br />
Licensed Audit Expert Licensed Audit Expert<br />
Auditor in Charge<br />
Zurich, March 2, 2012<br />
Panalpina <strong>Annual</strong> <strong>Report</strong> <strong>2011</strong><br />
141
142<br />
Appendix<br />
Information for Investors<br />
Share information<br />
Share symbol PWTN<br />
Reuters PWTN.S<br />
Bloomberg PWTN SW<br />
Trading exchange SIX<br />
Key figures<br />
in million CHF <strong>2011</strong> 2010 * Change in %<br />
Net forwarding revenue 6,500 7,164 – 9.3<br />
Gross profit 1,477 1,480 – 0.2<br />
EBITDA 212 62 240.1<br />
EBIT 174 15 1,034.0<br />
Consolidated profit 127 – 26 590.1<br />
Cash generated from operations 229 75 204.4<br />
* Certain comparatives have been restated to conform to the current period’s presentation.<br />
Five-year development<br />
in million CHF<br />
Net forwarding revenue<br />
10,500<br />
9,000<br />
7,500<br />
6,000<br />
4,500<br />
3,000<br />
1,500<br />
0<br />
EBIT<br />
320<br />
280<br />
240<br />
200<br />
160<br />
120<br />
80<br />
40<br />
0<br />
1,000<br />
875<br />
750<br />
625<br />
500<br />
375<br />
250<br />
125<br />
0<br />
8,641<br />
8,878<br />
2007 2008 2009 2010 <strong>2011</strong><br />
299<br />
1,026<br />
193<br />
871<br />
Panalpina <strong>Annual</strong> <strong>Report</strong> <strong>2011</strong><br />
5,958<br />
30<br />
864<br />
7,164<br />
15<br />
812<br />
6,500<br />
174<br />
2007 2008 2009 2010 <strong>2011</strong><br />
Shareholders’ equity<br />
915<br />
2007 2008 2009 2010 <strong>2011</strong><br />
Fiscal year ends December 31<br />
Valoren 000216808<br />
ISIN CH0002168083<br />
Share register SIS Aktienregister AG, Olten, Switzerland<br />
Gross profit<br />
2,050<br />
1,900<br />
1,750<br />
1,600<br />
1,450<br />
1,300<br />
1,150<br />
1,000<br />
245<br />
210<br />
175<br />
140<br />
105<br />
70<br />
35<br />
0<br />
–35<br />
1,803<br />
Consolidated profit<br />
1,742<br />
1,377<br />
1,480<br />
1,477<br />
2007 2008 2009 2010 <strong>2011</strong><br />
211<br />
114<br />
10<br />
–26<br />
127<br />
2007 2008 2009 2010 <strong>2011</strong>
Ordinary gross dividend payments<br />
Financial year<br />
Swiss Performance Index (SPI)<br />
Panalpina World Transport<br />
Dec 31,<br />
2010<br />
Mar 1 May 1 Jul 1 Sep 1 Nov 1 Dec 31,<br />
<strong>2011</strong><br />
110%<br />
100%<br />
90%<br />
80%<br />
70%<br />
60%<br />
Amount<br />
(in million CHF)<br />
Per share<br />
(in CHF)<br />
<strong>2011</strong> 47 2.00 **<br />
2010 0 0.00<br />
2009 0 0.00<br />
2008 45 1.90<br />
2007 80 3.20<br />
2006 75 3.00<br />
2005<br />
* Included a special one-time jubilee dividend of CHF 20 million<br />
50 * 2.00<br />
** In addition, CHF 1.90 per share are paid to shareholders through a reduction of the nominal value per share from<br />
CHF 2.00 to CHF 0.10. Ordinary dividend and payback are subjects to vote by the <strong>Annual</strong> General Meeting of May 8, 2012.<br />
Earnings per share<br />
Weighted average of oustanding shares <strong>2011</strong> 2010<br />
Basic EPS 23,639 CHF 5.34 CHF – 1.16<br />
Diluted EPS 23,676 CHF 5.33 CHF – 1.16<br />
Share price development<br />
in CHF <strong>2011</strong> 2010<br />
Last day of trading previous year 120.50 65.80<br />
High 132.00 128.50<br />
Low 70.90 64.65<br />
Last day of trading current year 96.20 120.50<br />
Average trading volume 51,764 77,922<br />
Total shareholder return (in %) – 16.9 83.1<br />
Market capitalization as per December 31, <strong>2011</strong> (in CHF million) 2,405 3,013<br />
Share price development in comparison to SPI<br />
December 31, 2010 to December 31, <strong>2011</strong><br />
Financial calendar<br />
Appendix<br />
January 1 to December 31 Financial year<br />
May 4, 2012 First quarter results<br />
May 8, 2012 <strong>Annual</strong> General Meeting<br />
July 31, 2012 Half-year results<br />
November 2, 2012 Third quarter results<br />
March 6, 2013 2012 full-year results<br />
May 8, 2013 <strong>Annual</strong> General Meeting<br />
Panalpina <strong>Annual</strong> <strong>Report</strong> <strong>2011</strong><br />
143
144<br />
Appendix<br />
Pictures<br />
Cover A Boeing 747-400F aircraft of Panalpina’s<br />
Panalpina <strong>Annual</strong> <strong>Report</strong> <strong>2011</strong><br />
own-controlled air freight network while<br />
loaded in Luxembourg<br />
Page 5 Monika Ribar (CEO) and Rudolf W. Hug<br />
(Chairman of the Board of Directors)<br />
Page 7 Executive Board<br />
Page 20/21 Panalpina employee Tim Bauer in front of<br />
a Boeing 747-400F operated by Atlas Air<br />
and part of Panalpina’s own-controlled<br />
network in Luxembourg<br />
Page 22/23 Panalpina employee Samia Guerroumi<br />
inside a Boeing 747-400F while loaded<br />
Page 24/25 Jasmine Medhora of Panalpina’s<br />
Pantainer Express Line at the port<br />
of Hamburg<br />
Page 26/27 Marco Parnitzke of Panalpina’s Ocean<br />
Freight division at the port of Hamburg<br />
Page 28/29 Andrea Ribaudo in Panalpina’s Milan<br />
warehouse<br />
Page 30 Monika Ribar (CEO)
Imprint<br />
Panalpina World Transport<br />
(Holding) Ltd.<br />
Viaduktstrasse 42<br />
P. O. Box<br />
CH-4002 Basel<br />
Switzerland<br />
Phone +41 61 226 11 11<br />
Fax +41 61 226 11 01<br />
info@panalpina.com<br />
www.panalpina.com<br />
The Panalpina <strong>Annual</strong> <strong>Report</strong> is published in German and English.<br />
For additional copies please refer to the above addresses.<br />
An electronic version is available at: www.panalpina.com /ar<br />
Editorial body<br />
Corporate Communications, Corporate Finance and Investor Relations<br />
Project management<br />
Heidi Stöckli, Corporate Communications<br />
Concept and design<br />
Wirz Corporate AG, Zurich<br />
Photography<br />
Scanderbeg Sauer Photography, Zurich<br />
Portraits<br />
Julian Salinas, Basel<br />
Translations and editing<br />
Text Control, Zurich<br />
BMP Translations AG, Basel<br />
Word + Image, Zufikon<br />
Lithography<br />
Wirz Medienrealisation<br />
Printed by<br />
Neidhart + Schön AG, Zurich<br />
Consultant on sustainability<br />
sustainserv, Zurich and Boston<br />
Appendix<br />
Disclaimer<br />
Certain sections of this <strong>Annual</strong> <strong>Report</strong> may contain forward-looking statements that are based on management’s expectations,<br />
estimates, projections and assumptions. These statements are not guarantees of future performance and involve certain<br />
risks and uncertainties, which are difficult to predict. Therefore, future developments and trends may differ materially from what<br />
is forecast in forward-looking statements.<br />
All forward-looking statements speak only as of the date of their publication or, in the case of any document incorporated by<br />
reference, the date of that document. All subsequent written and oral forward-looking statements attributable to the Company<br />
or any person acting on the Company’s behalf are qualified by the cautionary statements. The Company does not undertake<br />
any obligation to update or publicly release any revisions to forward-looking statements to reflect events, circumstances or<br />
changes in expectations after the date of this report.<br />
Panalpina <strong>Annual</strong> <strong>Report</strong> <strong>2011</strong><br />
145
Panalpina World Transport<br />
(Holding) Ltd.<br />
Viaduktstrasse 42<br />
P. O. Box<br />
CH-4002 Basel<br />
Phone +41 61 226 11 11<br />
Fax +41 61 226 11 01<br />
info@panalpina.com<br />
www.panalpina.com
![Eigenes Luftfrachtnetzwerk [pdf | 244 KB] - Panalpina](https://img.yumpu.com/23347328/1/184x260/eigenes-luftfrachtnetzwerk-pdf-244-kb-panalpina.jpg?quality=85)
![Übersicht Panalpina [pdf | 240 KB]](https://img.yumpu.com/22547731/1/184x260/ubersicht-panalpina-pdf-240-kb.jpg?quality=85)

![Seefracht [pdf | 181 KB] - Panalpina](https://img.yumpu.com/22234724/1/184x260/seefracht-pdf-181-kb-panalpina.jpg?quality=85)


![Annual Report 2012 [pdf | 1 MB] - Panalpina](https://img.yumpu.com/15342099/1/184x260/annual-report-2012-pdf-1-mb-panalpina.jpg?quality=85)