EACC Bolivia
EACC Bolivia
EACC Bolivia

Create successful ePaper yourself
Turn your PDF publications into a flip-book with our unique Google optimized e-Paper software.
D I S C U S S I O N PA P E R N U M B E R 1 3 D E C E M B E R 2 0 1 0<br />
D E V E L O P M E N T A N D C L I M A T E C H A N G E D I S C U S S I O N P A P E R S<br />
1<br />
D E V E L O P M E N T A N D C L I M A T E C H A N G E<br />
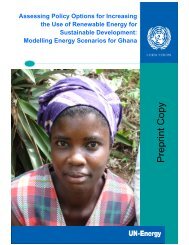
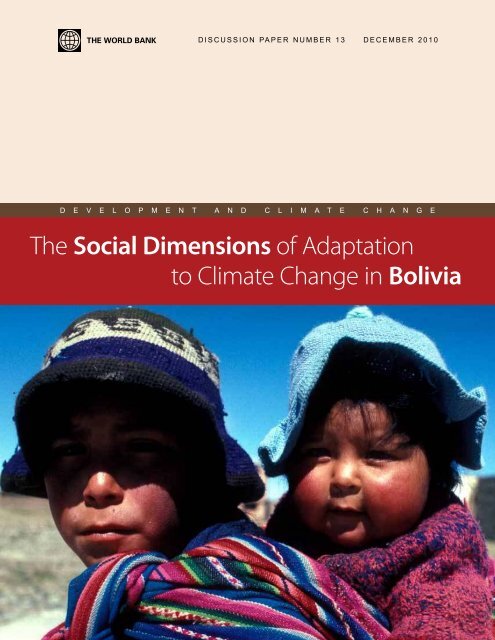
The Social Dimensions of Adaptation<br />
to Climate Change in <strong>Bolivia</strong>
d i s c U s s i o n pA p E R n U m B E R 1 3 d E c E m B E R 2 0 1 0<br />
E c o n o m i c s o f A d A p t A t i o n t o c l i m A t E c h A n g E<br />
The Social Dimensions of Adaptation<br />
to Climate Change in <strong>Bolivia</strong><br />
miguel morales<br />
Papers in this series are not formal publications of the World Bank. They are circulated to encourage thought and discussion. The use and<br />
citation of this paper should take this into account. The views expressed are those of the authors and should not be attributed to the World<br />
Bank. Copies are available from the Environment Department of the World Bank by calling 202-473-3641.
© 2010 The International Bank for Reconstruction and Development/<br />
The World Bank<br />
1818 H St., NW<br />
Washington, DC 20433 U.S.A.<br />
Telephone: 202-473-1000<br />
Internet: www.worldbank.org/climatechange<br />
E-mail: feedback@worldbank.org<br />
All rights reserved.<br />
December 2010<br />
This paper is based upon work that has been commissioned by the World Bank as part of the Economics of Adaptation to Climate Change study. The<br />
results reported in the paper are preliminary and subject to revision. The analysis, results, and views expressed in the paper are those of the authors alone<br />
and do not represent the position of the World Bank or any of its member countries.<br />
Papers in this series are not formal publications of the World Bank. They are circulated to encourage thought and discussion. Copies are available from<br />
the World Bank Environment Department by calling 202-473-3641.<br />
The World Bank does not guarantee the accuracy of the data included in this work. The boundaries, colors, denominations, and other information shown<br />
or any map in this work do not imply any judgment on the part of the World Bank concerning the legal status of any territory or the endorsement or<br />
acceptances of such boundaries.<br />
RIGHTS AND PERMISSIONS<br />
The material in this publication is copyrighted. Copying and/or transmitting portions or all of this work without permission may be a violation of applicable<br />
law. The International Bank for Reconstruction and Development/The World Bank encourages dissemination of its work and will normally grant<br />
permission to reproduce portions of the work promptly.<br />
For permission to photocopy or reprint any part of this work, please send a request with complete information to the Copyright Clearance Center Inc.,<br />
222 Rosewood Drive, Danvers, MA 01923, USA; telephone 978-750-4470; Internet: www.copyright.com<br />
Cover photo courtesy of World Bank.
iii<br />
tABlE of contEnts<br />
AcRonyms And ABBREviAtions<br />
AcKnoWlEdgmEnts<br />
ix<br />
x<br />
1. scopE And mEthodology of thE stUdy 1<br />
General Approach 1<br />
Study Phases 1<br />
Methodological Approach to the Field Work 1<br />
Instruments 3<br />
Activities Undertaken 3<br />
Participating Institutions 4<br />
Scope and Limitations of the Methodology 5<br />
2. BAcKgRoUnd on BoliviA 7<br />
The Ggeneral Context 7<br />
Location 7<br />
Demography 7<br />
Economy 7<br />
Diversity 9<br />
Climate Change 9<br />
Institutional Status 9<br />
3. thE institUtionAl fRAmEWoRK 11<br />
Structure of Government 11<br />
Powers of the Different Levels of Government 11<br />
The Central State Level 12<br />
The Departmental Level 13<br />
Municipalities 13<br />
The Indigenous Campesino Autonomies 13<br />
Regional Autonomies 13<br />
Civil Society 13
iv<br />
thE sociAl dimEnsions of AdAptAtion to climAtE chAngE in BoliviA<br />
4. thE Zoning of thE coUntRy in tERms of vUlnERABility to climAtE chAngE 15<br />
The Macro-regions 15<br />
Population by Macro-regions 15<br />
Altitude 15<br />
Rainfall 17<br />
Average Temperature 17<br />
Flood Risk 18<br />
Human Development Indicators 18<br />
Food Vulnerability 19<br />
Holdridge Life Zones 20<br />
Selection of Municipalities for the Study 21<br />
5. livElihood stRAtEgiEs in thE stUdy AREA 28<br />
Classification of Livelihood Strategies 28<br />
Strategies Based on Rainfed Agriculture 28<br />
Strategies Based on Irrigated Agriculture 28<br />
Strategies Based on Extensive Livestock 29<br />
Strategies Based on Intensive Livestock 29<br />
Forestry-based Livelihood Strategies 29<br />
Employment-based Livelihood Strategies 30<br />
Strategies Based on Trades 30<br />
Strategies Based on Services 30<br />
Socioeconomic Strata 30<br />
Livelihood Strategies by Socioeconomic Strata. 31<br />
Temporary Migration as a Livelihood Strategy 34<br />
Who are the Temporary Migrants 34<br />
Who are the Non-migrants 34<br />
6. climAtE chAngE in BoliviA 36<br />
The Specialists´ Viewpoints 36<br />
Views of the Communities 36<br />
Change Trends in Recent Years 36<br />
Increasing Temperatures 37<br />
Less Water 37<br />
Other Climate Changes 37<br />
Future Climate Scenarios 37<br />
Major Changes 37<br />
Other Climate Changes 38<br />
7. thE impActs of climAtE chAngE 39<br />
The Effects and Impacts of Drought 39<br />
Decrease or Loss of Crops 39<br />
Loss of Seeds 40<br />
Famine 40<br />
Decreased Income 41<br />
Disease 41
d E v E l o p m E n t A n d c l i m A t E c h A n g E d i s c U s s i o n pA p E R s<br />
v<br />
Sectors Worst Affected by Drought 42<br />
Effects and Impacts of Flooding 42<br />
Families Hardest Hit by Flooding 42<br />
Effects and Impacts of Warming 43<br />
Sensitivity of Livelihood Strategies to Climate Change 44<br />
8. AdAptAtion to climAtE chAngE 46<br />
Lessons from the Past 46<br />
Responses to Extreme Weather Events 46<br />
Autonomous Changes in Production Systems 47<br />
Adaptation Measures 48<br />
Classification of Adaptation Measures 48<br />
Water Management Measures 48<br />
Infrastructure Measures 50<br />
Measures to Improve Livestock 50<br />
Measures to Improve Agriculture 51<br />
Environmental Management Measures 52<br />
Training and Advisory Measures 52<br />
Credit and Financing Measures 53<br />
Measures to Improve Employment and Value-added Activities 53<br />
Frequency of Adaptation Measures 54<br />
Adaptation Strategies 56<br />
General Trends 56<br />
Adaptation Strategies for Drought 60<br />
Adaptation Strategies for Flooding 61<br />
Non-prioritized Measures 61<br />
Perception of Local Authorities about Climate Change Adaptation 62<br />
Climate Change 62<br />
Adaptation Measures Envisaged by Municipal Authorities 63<br />
Possible Municipal Interventions Related to Adaptation 63<br />
Support Needed by Local Governments 64<br />
9. sUmmARy And conclUsions 66<br />
Climate Change 66<br />
Climate Change Impacts 66<br />
Livelihood Strategies to Climate Change 67<br />
Adaptation Measures to Climate Change 67<br />
The Local Institutional Framework 68<br />
The View of Local Authorities 69<br />
10. REcommEndAtions foR dEsigning policiEs in sUppoRt of AdAptAtion 70
vi<br />
thE sociAl dimEnsions of AdAptAtion to climAtE chAngE in BoliviA<br />
Tables<br />
table 1. methodological instruments Used in the study 4<br />
table 2. participating institutions 5<br />
table 3. <strong>Bolivia</strong>: Key Economic indicators, 2007 7<br />
table 4. 1981–2000 Average yields (tons per hectare) 9<br />
table 5. <strong>Bolivia</strong> 2001: population by macro-regions 16<br />
table 6. drought risk, by municipalities and macro-region 18<br />
table 7. Risk of floods in macro-regions 18<br />
table 8. human development index 18<br />
table 9. food vulnerability, by macro-regions and municipalities 19<br />
table 10. number of municipalities studied, by macro-region 22<br />
table 11. municipalities at Risk 23<br />
table 12. vulnerability 23<br />
table 13. social indicators 26<br />
table 14. population size and density 26<br />
table 15. climate 27<br />
table 16. holdridge life Zones 27<br />
table 17. livelihood strategies 29<br />
table 18. livelihood strategies in the sample 30<br />
table 19: family Agricultural Assets by strata and macro-region 31<br />
table 20. Effects and impacts of drought 39<br />
table 21. Effects of climate change on yields (dry scenario) 40<br />
table 22. family income in normal years (pampajasi community) 40<br />
table 23. family income and drought-reduced yields of 20 percent (pampajasi community) 41<br />
table 24. sensitivity of livelihood strategies to drought 44<br />
table 25. sensitivity of livelihood strategies to flooding 45<br />
table 26. spontaneous changes in Response to climate change 49<br />
table 27. Examples of measures for Best Use of Existing Water Resources 50<br />
table 28. Examples of Rainwater harvesting 50<br />
table 29. Examples of improvement or Expansion of Existing systems 50<br />
table 30. Examples of infrastructure Upgrading Adaptation measures 51<br />
table 31. Examples of measures to improve livestock Raising systems 51<br />
table 32. Examples of pasture management measures 51<br />
table 33. Examples of changed measures for cropping systems 52<br />
table 34. Examples of Agricultural soil management measures 52
d E v E l o p m E n t A n d c l i m A t E c h A n g E d i s c U s s i o n pA p E R s<br />
vii<br />
table 35. Examples of Environmental improvement Adaptation measures 53<br />
table 36. Examples of manpower training measures 53<br />
table 37. Examples of measures for training in Alternative occupations 53<br />
table 38. Example of a credit and financing Adaptation measure 53<br />
table 39. Examples of measures to improve Employment and value-added Activities 54<br />
table 40. Average number of community Adaptation measures by macro-region 54<br />
table 41. number of prioritized measures by type and community 55<br />
table 42. valleys: prioritized Adaptation measures, by community 57<br />
table 43. plains: prioritized Adaptation measures, by community 58<br />
table 44. chaco: prioritized Adaptation measures, by community 58<br />
table 45. Altiplano: prioritized Adaptation measures, by community 59<br />
table 46. Adaptation strategy of the contorno calacoto community 60<br />
table 47. order of priority for Adaptation measures 60<br />
table 48. local Authority perceptions of the timing of climate change 62<br />
Figures<br />
figure 1. methodological Approach Used for identifying community Adaptation measures 3<br />
figure 2. <strong>Bolivia</strong>: map showing Eco-regions 8<br />
figure 3. <strong>Bolivia</strong>: structure of the state 11<br />
figure 4. structure of the national mechanism for Adaptation to climate change 12<br />
figure 5. municipalities According to macro-region 16<br />
figure 6. <strong>Bolivia</strong> 2001: population by Urban-rural macro-region 17<br />
figure 7. Regional variations in Altitude 17<br />
figure 8. Regional variations in Annual precipation 17<br />
figure 9. Regional variations in temperature 17<br />
figure 10. drought Risk 18<br />
figure 11. human development indicators 19<br />
figure 12. food vulnerability by macro-region 20<br />
figure 13. <strong>Bolivia</strong>: life Zones identified by the pncc 20<br />
figure 14. <strong>Bolivia</strong>: life Zones adjusted by pncc 21<br />
figure 15. municipalities selected by macro-region 24<br />
figure 16. municipalities selected According to Altitude 25<br />
figure 17: socioeconomic stratification in the communities 31<br />
figure 18: Rural families (Agricultural Assets) by strata and macro-region 32<br />
figure 19. climate scenarios identified by communities 38
viii<br />
thE sociAl dimEnsions of AdAptAtion to climAtE chAngE in BoliviA<br />
figure 20. Responses to climate hazards 47<br />
figure 21. possible municipal investment in Adaptation 64<br />
figure 22. comparative Analysis of Adaptation measures 64<br />
figure 23. support Required from central government 65<br />
boxes<br />
testimony of Aidée gimenez, president of the indian subcentral cercado, Beni 43<br />
Abandoning the land in the ovejería community 44
ix<br />
AcRonyms And ABBREviAtions<br />
NDP<br />
PDM<br />
PNCC<br />
POA<br />
National Development Plan<br />
Municipal Development Plan<br />
National Climate Change Program<br />
Annual Operating Plan
x<br />
AcKnoWlEdgmEnts<br />
The social component of the Economics of Adaptation<br />
to Climate Change (<strong>EACC</strong>) study (hereafter ‘study’)<br />
was developed through the joint efforts of the World<br />
Bank Social Development (SDV) and Environment<br />
Departments (ENV) and LCR, AFR, EAP, and SAR<br />
Regions of the World Bank; ESSA Technologies Ltd<br />
and the International Institute for Sustainable<br />
Development (IISD), Canada; and research institutions<br />
in <strong>Bolivia</strong>, Bangladesh, Ethiopia, Ghana, Mozambique,<br />
and Vietnam. The study was undertaken by a core team<br />
led by Robin Mearns and comprising Anne Kuriakose,<br />
Carina Bachofen, Nilufar Ahmad and Minna Kononen<br />
(all SDV). An overall synthesis report of all six country<br />
reports has been prepared and is available at<br />
www.worldbank.org/eacc. The study was designed and<br />
implemented in close collaboration with the team leader<br />
for the overall <strong>EACC</strong> study (Sergio Margulis), and Ana<br />
Bucher, Laurent Cretegny, Urvashi Narain, Kiran<br />
Pandey, Robert Schneider (all ENV) and sector<br />
consultants.<br />
The <strong>Bolivia</strong> country study for the social component was<br />
led by Carina Bachofen, under the overall guidance of<br />
Robin Mearns, in collaboration with the <strong>EACC</strong> country<br />
team leader Ana Bucher (ENV) and country office<br />
sector liaison Ruth Llanos (LCSSO). The research<br />
partner in <strong>Bolivia</strong> was Miguel Morales.<br />
We could not have completed this work without the<br />
continuous logistical support provided by Hawanty<br />
Page (ENV), Grace Aguilar (ENV), Mustafa<br />
Pajazetovic, and Carmen Martinel (both SDV). We<br />
gratefully acknowledge editorial services provided by<br />
John Felton, and production management provided by<br />
Danielle Christophe (SDV) and Robert Reinecke.<br />
The <strong>Bolivia</strong> country study benefitted greatly from peer<br />
review comments and other feedback from World Bank<br />
staff including Max Ashwill (LCSSO) and Morten<br />
Blomqvist (LCCBO), and from external peer reviewers<br />
including Richard Klein. Any remaining errors and<br />
omissions are entirely those of the country report team.
1<br />
1. scopE And<br />
mEthodology of thE<br />
stUdy<br />
gEnERAl AppRoAch<br />
The study in <strong>Bolivia</strong> was based on the concepts<br />
contained in the document Methodology for the Social<br />
Component (October 2008) prepared by the core team in<br />
Washington. This lists the social component objectives<br />
as: to develop a methodology for estimating the costs of<br />
adaptation strategies at the local level; to identify how<br />
public adaptation policies can benefit the most vulnerable<br />
members of society; to identify how factors such as<br />
socio-economic status, gender and poverty impact on<br />
vulnerability to climate change; and to ascertain local<br />
perceptions of the costs and benefits of climate change<br />
adaptation in different agro-ecological zones.<br />
In the <strong>Bolivia</strong> study the methodology focused on:<br />
• The local level, i.e., communities and<br />
municipalities;<br />
• The poorest and most vulnerable communities and<br />
social groups;<br />
• Participatory analysis, involving the most vulnerable<br />
sectors in the analysis of adaptation measures;<br />
• Existing adaptive responses, to retrieve knowledge<br />
and previous experiences;<br />
• ‘Soft’ and ‘hard’ adaptation measures;<br />
• Bottom-up approximation, prioritizing data collection<br />
in the field;<br />
• Triangulation of different sources of information.<br />
stUdy phAsEs<br />
The study was conducted in four phases:<br />
1. Preparation: The main objectives of the first phase<br />
were: (a) to collect qualitative, quantitative, and<br />
illustrative secondary data related to climate change<br />
and (b) to analyze previous studies undertaken in<br />
<strong>Bolivia</strong> on climate change adaptation.<br />
2. Sampling: The second phase, which lasted one<br />
month, primarily consisted of constructing a climate<br />
vulnerability zoning pattern of the entire country to<br />
serve as a basis for identifying and selecting areas for<br />
study. Using the reasoned sampling technique, 14<br />
municipalities were selected containing the 14 communities<br />
to be targeted by the study (the “study<br />
communities”). Chapter 4 contains a detailed explanation<br />
of the sampling procedure and the characteristics<br />
of each of the selected municipalities.<br />
3. Field work: The field work was undertaken over a<br />
period of three months, consisting of three activities:<br />
(a) designing tools for field work; (b) identification,<br />
recruitment and training of researchers; and<br />
(c) information collection in the field through interviews<br />
and workshops.<br />
4. Reports: The final phase involved processing and<br />
analyzing the information and drafting the Final<br />
Report.<br />
mEthodologicAl AppRoAch to<br />
thE fiEld WoRK<br />
While the literature provided important references, the<br />
main source of information for the study was field work.
2 thE sociAl dimEnsions of AdAptAtion to climAtE chAngE in BoliviA<br />
This involved visiting communities and homes in rural<br />
areas to organize workshops and conduct interviews<br />
locally.<br />
Our field work generated two types of information:<br />
1. Basic information: mainly descriptions of livelihood<br />
strategies, socio-economic conditions, vulnerability<br />
to climate change, etc.<br />
2. Information on adaptation measures: Identification of<br />
the views held by the campesinos and others with<br />
regard to adaptation measures, and participatory<br />
construction of scenarios and strategies to address<br />
climate change.<br />
The basic information was generated through surveys,<br />
interviews and workshops, employing the traditional<br />
PRA (Participatory Rural Appraisal) research technique.<br />
Information on adaptation measures required the development<br />
of specific tools based on Participatory Analysis<br />
methodology. This methodology, developed for work in<br />
rural communities, is deployed to help local people to<br />
produce consensual and hierarchical responses to new<br />
problems or hypothetical situations. In our specific case,<br />
the methodology was used for participatory identification<br />
of climate scenarios and to formulate adaptation<br />
strategies to cope with climate change.<br />
The methodological approach for identifying adaptation<br />
measures was as follows:<br />
1. Climate scenarios<br />
The field work commenced by constructing climate<br />
scenarios with the assistance of the population,<br />
raising questions such as: “What will climate<br />
change be in our community”<br />
Efforts were also made, for example, to get the<br />
communities to identify the climate trends<br />
observed over the last 20 to 30 years (e.g.: “How<br />
has the climate changed since our childhood”).<br />
This led to the analysis of specific indicators.<br />
The communities were informed of the results of<br />
studies and climate models for the whole country<br />
and the particular region.<br />
With this information, communities were in a<br />
better position to consider what the future climate<br />
situation might be in their areas. A number of<br />
different scenarios were analyzed and the scenario<br />
considered to be “most probable” by the community<br />
was awarded priority.<br />
2. Possible impacts<br />
Individual communities were asked to reflect on the<br />
possible impacts of their prioritized climate<br />
scenario. The different ways in which the community<br />
and households would be affected by the<br />
climate scenario were thus identified. Communities<br />
also identified the livelihoods which were likely to<br />
be most vulnerable to climate change.<br />
3. Adaptation measures<br />
In focus groups and community workshops the<br />
adaptation measures needed for addressing the<br />
prioritized scenarios were identified and<br />
analyzed. This process took the form of an initial<br />
brainstorming followed by an analysis and detailed<br />
description of each measure in order to provide a<br />
basis for subsequent cost calculations.<br />
Once the key measures had been identified the<br />
community proceeded to arrange them according to<br />
priority of implementation 1 . Communities based<br />
their list of priorities on a range of different criteria<br />
such as:<br />
• Urgency: “Does the measure need to be effected<br />
immediately”<br />
• Importance: “Will this measure resolve our most<br />
pressing problems”<br />
• Timing: “What is the right time to implement this<br />
measure What conditions need to be met prior to<br />
implementation”<br />
• Feasibility: “Can this measure be implemented in<br />
practice, given current availability (or not) of<br />
resources and technology”<br />
1 This process of prioritization of measures is common in the rural<br />
communities of <strong>Bolivia</strong>, since according to law the communities must<br />
identify and prioritize the investments of their respective municipal<br />
governments.
d E v E l o p m E n t A n d c l i m A t E c h A n g E d i s c U s s i o n pA p E R s<br />
3<br />
figURE 1. mEthodologicAl AppRoAch UsEd foR idEntifying commUnity<br />
AdAptAtion mEAsUREs<br />
Dynamics of observed changes<br />
Technical information<br />
Participatory design of<br />
climate scenarios<br />
Visualization of impacts<br />
and effects<br />
Past experiences<br />
Technical information<br />
Participatory design of<br />
adaptation measures<br />
Cost calcuation of<br />
measures<br />
• Coverage: “How many families will benefit from<br />
the measure”<br />
After the adaptation measures had been prioritized, we<br />
proceeded to quantify the cost of each of them.<br />
The above methodological approach is outlined in the<br />
following diagram:<br />
English translations: Top left: “Dynamics of observed<br />
changes; top right, “Technical information; center,<br />
“Participatory design of climate scenarios; middle row,<br />
left to right, “Past experiences,” “Visualization of<br />
impacts and effects,” and “technical information;”<br />
bottom center: “Participatory design of adaptation<br />
measures.” Bottom right: “Cost calcuation of measures.”<br />
instRUmEnts<br />
The instruments used in the course of field work<br />
consisted of workshops, key-informant interviews, and<br />
direct observation in the municipalities studied:<br />
ActivitiEs UndERtAKEn<br />
In the course of the study we undertook the following<br />
activities:<br />
• 14 workshops with municipal authorities. In each<br />
municipality we worked with the Mayor or City<br />
Council President and also interviewed senior<br />
municipal technical staff (e.g., the Chief Executive<br />
Officer).<br />
• We interviewed 42 key informants. In each municipality<br />
we interviewed three informants who were<br />
well informed about municipal and/or environmental<br />
issues. These informants, all permanent residents<br />
of the municipalities, were professionals of<br />
one kind or another (e.g., teachers and technical<br />
staff) or representatives of social organizations.<br />
• 70 families were interviewed with a view to collecting<br />
their life stories. We interviewed five families in<br />
each community. The selection of households was<br />
done randomly, the only obligatory requirement<br />
being to ensure participation in the interview by the
4 thE sociAl dimEnsions of AdAptAtion to climAtE chAngE in BoliviA<br />
tABlE 1. mEthodologicAl instRUmEnts UsEd in thE stUdy<br />
Item Instrument Aim Application<br />
00 guide introducing the study<br />
and containing information<br />
on climate change in <strong>Bolivia</strong><br />
01 inventory of institutions<br />
working in the municipality<br />
02 Quantification of municipal<br />
investments in climate<br />
change<br />
03 interviews with municipal<br />
authorities<br />
04 identification and description<br />
of communities in the<br />
municipality<br />
05 interview guide for use with<br />
key informants<br />
06 guide to community<br />
workshop on participatory<br />
construction of adaptation<br />
measures<br />
07 guide to focus group<br />
workshop on participatory<br />
construction of adaptation<br />
measures<br />
08 family interview guide for<br />
researching life stories<br />
09 form for quantifying costs of<br />
adaptation measures<br />
10 guide to drafting community<br />
report<br />
to present the EAcc study to local authorities and<br />
communities<br />
to ascertain the number and characteristics of public and<br />
private institutions working in the municipality<br />
to ascertain the amount of municipal investment over the<br />
past three years in water management or environmental<br />
schemes<br />
to gauge the perception of the local authorities with<br />
regard to climate change in the municipality and to the<br />
possible adaptation measures to be implemented<br />
to learn about the features of the communities in the<br />
municipality according to environmental, socio-economic<br />
production and productive criteria.<br />
to learn the perceptions of the best- informed members<br />
of the municipality regarding climate change, livelihood<br />
strategies, and the community’s vulnerability to climate<br />
change.<br />
to organize a community workshop to identify trends in<br />
climate change, to identify climate scenarios for the<br />
future, to analyze the possible impacts of climate change,<br />
and to identify and prioritize adaptation measures<br />
to use focus groups to identify adaptation measures<br />
based on the prioritized scenarios<br />
to obtain an accurate picture of families on the basis of<br />
socioeconomic criteria; to identify past family coping<br />
actions after climate-induced accidents; to ascertain the<br />
roles of family members; to discuss possible adaptation<br />
measures to be taken by families.<br />
to quantify the costs (in local prices) of the adaptation<br />
measures identified by the communities<br />
At the beginning of each interview<br />
one enquiry form per municipality,<br />
based on secondary information<br />
one enquiry form per municipality,<br />
based on secondary information<br />
interview with the mayor, city<br />
council president and / or senior<br />
official<br />
Applied in five representative<br />
communities of the municipality,<br />
based on secondary information<br />
and interviews<br />
three to five interviews per<br />
municipality with key informants<br />
five forms per community<br />
completed at a community<br />
workshop<br />
three focus groups per community<br />
representing the three main<br />
livelihood strategies in the<br />
community.<br />
five family interviews per<br />
community, involving visits to each<br />
household and interviews in the<br />
presence of the entire family.<br />
one record slip for each measure<br />
whole family. Each interview lasted an average of<br />
two hours.<br />
• 45 workshops were conducted with focus groups. In<br />
each community between three to four focus groups<br />
were identified and classified according to livelihood<br />
strategies. Each focus group consisted of six to<br />
eight persons. The focus group work lasted three to<br />
four hours per group.<br />
• 14 community workshops were organized, with participation<br />
by all the members (men and women) of<br />
the community. Each community workshop lasted<br />
an average of six hours. The workshops were useful<br />
for checking key information obtained from field<br />
work and for identifying and prioritizing adaptation<br />
measures.<br />
• At the conclusion of the second phase of the study<br />
we organized a “national workshop” with experts<br />
from the country’s different macro-regions. This<br />
provided an opportunity for discussing the main<br />
findings of the study and for analyzing the climate<br />
scenarios and life strategies prevailing in each<br />
macro-region.<br />
pARticipAting institUtions<br />
The collection of field information was undertaken by<br />
private development institutions selected for their<br />
known expertise in research studies, project execution,<br />
and on-the-ground knowledge of the municipalities.<br />
Each institution provided a team of four researchers
d E v E l o p m E n t A n d c l i m A t E c h A n g E d i s c U s s i o n pA p E R s<br />
5<br />
who were to be responsible for undertaking all the<br />
respective tasks. The researchers received training in La<br />
Paz on the implementation of all the tools contained in<br />
the methodology.<br />
The institutions described in Table 1 were responsible<br />
for the field work.<br />
scopE And limitAtions of<br />
thE mEthodology<br />
Given that this was a qualitative study aimed at ascertaining<br />
the perception of the population on a new topic,<br />
the methodology naturally reflected the scope and limitations<br />
germane to this type of study. The main limitations<br />
were:<br />
Available information: The adaptation measures identified<br />
were the result of the technical information available<br />
to the communities and represented their views at<br />
that particular moment in time. These views might<br />
have been erroneous or biased, but they nevertheless<br />
were accepted as forming the basis of all the decisions<br />
made by the communities.<br />
Uncertain climate data: The scenarios of the models are<br />
contradictory and vague, and no certainties exist<br />
regarding the magnitude of future climate change. Our<br />
methodology was therefore based on projections which<br />
reflected the trends in climate change as observed by the<br />
communities. This approach obviously had limitations<br />
but was deemed to be the most reliable at the time.<br />
Sample size: The most important limitation of the study<br />
was without doubt the sample size. We consider that<br />
the sample used was too small to adequately represent<br />
the situation on a broader nationwide basis. The obvious<br />
outcome is that it is not possible to undertake<br />
statistical analysis with the results of the study, and<br />
much less to project the results onto a larger<br />
canvas. The numerical data obtained from the study can<br />
only be used as reference material.<br />
Sample selection: The sample was selected by considering<br />
vulnerability to climate change criteria. For this reason<br />
we chose precisely the most vulnerable municipalities.<br />
This means that adaptation measures and associated<br />
costs do not represent the situation of the “average”<br />
municipalities. It is probable that in a municipality<br />
which is not as vulnerable as those studied the costs<br />
associated with adaptation measures could be lower.<br />
Community level: The methodology was applied at the<br />
individual community level and the measures identified<br />
tABlE 2. pARticipAting institUtions<br />
Institution Study Municipalities Macro-region<br />
tarija Aclo foundation El puente (tarija) valleys<br />
chuquisaca Aclo foundation tarvita (chuquisaca) valleys<br />
potosi Aclo foundation vitichi (potosí) valleys<br />
cordillera cipcA (centre for Research and campesino development) charagua (santa cruz) chaco<br />
villa vaca guzman (chuquisaca) chaco<br />
Beni cipcA san ignacio de moxos (Beni) plains<br />
iphAE (institute for man, Agriculture and Ecology) san pedro (pando) plains<br />
cEpAc (Rural Agricultural promotion centre) yapacani (santa cruz) plains<br />
ciAt (center for tropical Agronomy Research) saipina (santa cruz) plains<br />
isA <strong>Bolivia</strong> (<strong>Bolivia</strong> socio-Environmental institute) carangas curawara (oruro) Altiplano<br />
porco (potosí)<br />
Altiplano<br />
sicaya (cochabamba)<br />
valleys<br />
sEmtA (multiple services for Appropriate technologies) pucarani (la paz) Altiplano<br />
calacoto (la paz)<br />
Altiplano
6 thE sociAl dimEnsions of AdAptAtion to climAtE chAngE in BoliviA<br />
at this level effectively constituted that community’s<br />
adaptation measures and strategies. “Multicommunity”<br />
adaptation measures were not identified. This was, for<br />
example, the case of river or catchment basin (cuenca)<br />
management. This was analyzed in the communities as<br />
one of the few options for improving the flow recovery<br />
of catchment basins and rivers, to inhibit erosion and<br />
reduce the effects of flooding. But such measures were<br />
not prioritized because they required the agreement of<br />
all the communities occupying the respective basin. In<br />
cost terms this limitation is important because the costs<br />
involved in multicommunity adaptation measures tend<br />
to be significantly higher than for those involving only<br />
individual communities.<br />
Private level: No measures were identified for which the<br />
state should take responsibility for adaptation measures.<br />
Communities reflected on how to adapt to the measures<br />
themselves and not how the state should intervene. As a<br />
result, we were unable to identify any investments<br />
designed to improve government services, such as<br />
providing timely and adequate humanitarian assistance<br />
in the event of flooding or drought, or the provision of<br />
better health care or education. Communities also<br />
raised the need to switch their crops and livestock to<br />
varieties and breeds that would adapt better to climate<br />
change but failed to identify any measures or investments<br />
that the state should undertake to develop the<br />
required types of genetic material for the communities.<br />
Focus on adaptation: Given that the focus of the study<br />
was to identify measures that would enable families to<br />
continue living in their communities, the communities<br />
did not consider the idea of temporary or permanent<br />
migration as a viable adaptation measure. In practice it<br />
is likely that migration will continue to grow apace,<br />
and it is incumbent on the state to consider the investments<br />
needed to track and provide support to such<br />
migrants.<br />
Short-term horizon: The study initially sought to design<br />
adaptation measures for the next 50 years, but in the<br />
field tests it was found that this was a very distant horizon<br />
due to the lack of accurate climate scenarios and<br />
the substantial and numerous uncertainties impacting<br />
the life of rural communities. People living in the<br />
communities regarded a period of 10 to 15 years as<br />
“long term.” To ensure achievable and concrete measures<br />
of the right magnitude, it was therefore decided to limit<br />
the time horizon to 15 years.<br />
Rural areas: Priority was given to the study of municipalities<br />
in rural areas where the population is more<br />
vulnerable. Urban areas are also subject to climate<br />
change, but the problems involved in addressing<br />
climate adaptation in such areas are bound to be<br />
different. This is a challenge that needs to be<br />
addressed by a specific study employing a different<br />
methodology.
7<br />
2. BAcKgRoUnd on BoliviA<br />
thE gEnERAl contExt<br />
location<br />
<strong>Bolivia</strong> is a landlocked country located in the heart of<br />
South America. It borders on Brazil, Peru, Argentina,<br />
Chile, and Paraguay.s<br />
demography<br />
<strong>Bolivia</strong> currently has about 10.4 million inhabitants,<br />
with an annual growth rate of 2.7 percent. The country<br />
covers a large land area, with a population density of<br />
only 10 people per square kilometer, the lowest in the<br />
entire continent. Around 40 percent of the population<br />
lives in rural areas. The largest city is Santa Cruz, with<br />
a population of just over 1.7 million.<br />
Economy<br />
The annual per capita income (GDP per capita) is<br />
US$1,363 (2007) which makes <strong>Bolivia</strong> the poorest<br />
country in Latin America. According to the last population<br />
census (2001), some two thirds of the population<br />
live in poverty, and the remaining third in ‘extreme’<br />
poverty.<br />
tABlE 3. BoliviA: KEy Economic indicAtoRs, 2007<br />
Indicator Unit 2007<br />
gross domestic product (current prices) Us$ million 13,395<br />
growth (1) percentage 4.56<br />
Accumulated inflation percentage 11.73<br />
Exchange Rate national currency to Us$ 7.90<br />
Average Annual fluctuation in Exchange Rate percentage (4.28)<br />
Unemployment percentage 5.18<br />
current Account Balance Us$ million 1,758<br />
External debt Us$ million 2,183<br />
gross fixed capital formation Us$ million 2,162<br />
private consumption Us$ million 8,469<br />
public consumption Us$ million 1,883<br />
per capita gdp Us$ 1,363<br />
Sources: Latin American Integration Association; International Monetary Fund; National Institute of Statistics; <strong>Bolivia</strong>n Central Bank.
8 thE sociAl dimEnsions of AdAptAtion to climAtE chAngE in BoliviA<br />
figURE 2. BoliviA: mAp shoWing Eco-REgions<br />
<strong>Bolivia</strong> has a limited domestic market with low<br />
purchasing power and a small industrial sector, with<br />
domestic demand largely met by imports. The economy<br />
is based on the export of minerals and hydrocarbons,<br />
activities generating over 50 percent of national revenue<br />
but employing few people. Agricultural productivity is<br />
very low, with average yields of traditional crops 50<br />
percent lower than those in the rest of Latin America.<br />
According to National Institute of Statistics, data labor<br />
productivity in the agricultural sector is six times lower<br />
than in the rest of the country’s economy.
d E v E l o p m E n t A n d c l i m A t E c h A n g E d i s c U s s i o n pA p E R s<br />
9<br />
tABlE 4. 1981–2000 AvERAgE yiElds<br />
(tons pER hEctARE)<br />
diversity<br />
<strong>Bolivia</strong> possesses the largest “indigenous” population of<br />
all South America, consisting of 36 ethnic groups,<br />
settled mainly in rural areas. These groups reflect the<br />
country’s rich cultural diversity. 2<br />
<strong>Bolivia</strong> is also characterized by wide-ranging agroecological<br />
diversity with territory stretching from the<br />
Andes to the Amazon jungle. The country contains at<br />
least 16 major eco-regions that range in height from<br />
300 to 6500 meters above sea level and which possess a<br />
broad range of vegetation (forests, savannas, steppes,<br />
scrubland etc) and climates (varying from cold and dry<br />
to humid and warm).<br />
Since pre-colonial times each eco-region has been<br />
inhabited by indigenous peoples, mainly small farmers<br />
and livestock raisers but also hunters and fishermen, all<br />
of whom have developed a wide range of long term<br />
sustainable life strategies in harmony with their<br />
environment.<br />
Population growth and climate change in recent years<br />
have however brought into question this sustainability.<br />
New generations now find it difficult to eke out a living<br />
in their ancestral lands and are experiencing profound<br />
crises owing to the weakened capacity of the ecosystem.<br />
It is clear that important changes will need to be made to<br />
all the production systems, which obviously will involve<br />
changes in the rural population’s livelihood strategies.<br />
climate change<br />
Wheat Corn Potato Quinoa<br />
<strong>Bolivia</strong> 0.8 1.7 4.9 0.5<br />
south<br />
America<br />
1.9 2.4 2.12 0.6<br />
france 6.3 7.4 33.7 0<br />
Source: FAO 2002<br />
Climate change is already apparent throughout most of<br />
the country. According to the National Climate Change<br />
Program (PNCC), all the Andean glaciers, a source of<br />
drinking water and energy for some major cities like La<br />
Paz and El Alto (which are over 40 percent dependent<br />
on these sources), are experiencing rapid meltdown.<br />
Climate models developed for this study (water component)<br />
show that average temperatures are on the<br />
increase. The rainfall pattern has undergone changes,<br />
with the rainy season getting shorter but stormier.<br />
As a result, the Altiplano (high plateau), the inter-<br />
Andean valleys, and the Chaco, inhabited by threequarters<br />
of <strong>Bolivia</strong>’s population, are experiencing a rapid<br />
process of desertification, 3 with areas of desert becoming<br />
larger and rivers and catchment areas drying up.<br />
The country as a whole is highly susceptible to drought,<br />
since only 15 percent of all agricultural land is irrigated,<br />
with the remainder depending on rainfall—which in<br />
most parts of the country is only seasonal (four months<br />
a year).<br />
The Amazon region of <strong>Bolivia</strong> is also experiencing a<br />
higher incidence of drought as well as increased<br />
frequency and intensity of flooding during the rainy<br />
season.<br />
institutional status<br />
<strong>Bolivia</strong> has a democratic government. The current<br />
President is Evo Morales, a representative of the<br />
campesinos and ‘native’ indigenous peoples. Morales was<br />
reelected in December 2009 with a majority of 65<br />
percent, the largest in the country’s history.<br />
During his first term, President Morales oversaw the<br />
drafting and adoption of a new State Political<br />
Constitution, aimed at initiating a process of broad<br />
social and political inclusion of indigenous peoples and<br />
campesinos.<br />
2 The exact number of indigenous inhabitants in <strong>Bolivia</strong> is not known.<br />
However the 2001 Census showed that around 40 percent of the population<br />
communicate in a language other than Spanish. This has to be<br />
treated with some caution since the language spoken does not necessarily<br />
imply that the speaker belongs to a particular ethnic group, as in the<br />
case of indigenous people who live in cities and communicate with one<br />
another in Spanish.<br />
3 PNCC: Climate Change in <strong>Bolivia</strong>, page 83.
10 thE sociAl dimEnsions of AdAptAtion to climAtE chAngE in BoliviA<br />
The Morales government also significantly revamped<br />
<strong>Bolivia</strong>’s foreign policy. In the environmental area the<br />
new policy has embraced the concepts of climate debt<br />
that cast responsibility for global warming on<br />
industrialized countries. As a result, the <strong>Bolivia</strong>n<br />
government calls for more stringent action to address<br />
the causes and effects of this problem, including efforts<br />
to formulate a binding multilateral instrument.
11<br />
3. thE institUtionAl<br />
fRAmEWoRK<br />
stRUctURE of govERnmEnt<br />
With the approval of the new Constitution of the State<br />
of <strong>Bolivia</strong>, the overall structure of the state is organized<br />
as follows: central government, nine departmental<br />
governments (with the right to autonomy) and 327<br />
autonomous municipalities. The Constitution also<br />
provides for indigenous and regional autonomous areas<br />
(autonomies) within departmental boundaries. Under the<br />
constitution, each level of self-government has the same<br />
hierarchical structure and is entitled to take decisions<br />
independently of any government.<br />
A schematic representation of the new state structure<br />
can be seen in the chart below:<br />
poWERs of thE diffEREnt<br />
lEvEls of govERnmEnt<br />
The recently adopted Constitution sets out the responsibilities<br />
of the different levels of government.<br />
The Central Level possesses normative, regulatory, and<br />
executive powers to deal with biodiversity and the environment.<br />
It has the power to define overall policies and<br />
to implement programs and projects throughout the<br />
country. At the same time, the Constitution states that<br />
a number of responsibilities in these areas are to be<br />
exercised concurrently and shared with the autonomous<br />
figURE 3. BoliviA: stRUctURE of thE stAtE<br />
National government<br />
Departmental government<br />
Departmental government<br />
Departmental government<br />
Regional government<br />
Municipal government Municipal government<br />
Municipal government<br />
Municipal government Indigenous authority<br />
Indigenous authority<br />
[The lines in this graph represent connectivity not dependency].
12 thE sociAl dimEnsions of AdAptAtion to climAtE chAngE in BoliviA<br />
territorial entities, i.e., the departmental, municipal and<br />
autonomous indigenous governments.<br />
Adaptation actions with regard to climate change are<br />
defined at the central and sub-national levels within<br />
their respective jurisdictions.<br />
thE cEntRAl stAtE lEvEl<br />
According to DS No. 29894 of February 7, 2009, the<br />
current organizational structure of what is now called<br />
the “Plurinational State of <strong>Bolivia</strong>” makes the Ministry<br />
of Foreign Affairs the entity responsible, jointly with<br />
other relevant bodies, for defending and protecting the<br />
natural resources of the state, including water resources.<br />
Meanwhile, the Ministry of Development Planning is<br />
charged with formulating and presenting policies for<br />
science, technology, innovation, and the enhancement of<br />
local knowledge, in cooperation with the autonomous<br />
and decentralized territorial entities.<br />
The formulation of national climate change policy is<br />
the responsibility of the Ministry of Environment and<br />
Water Resources which, through the Vice-Ministry of<br />
the Environment, Biodiversity and Climate Change,<br />
aims to promote and implement policies, legislation,<br />
plans, programs, and projects related to climate<br />
change. Jointly with other government entities and<br />
departmental governments, the Vice-Ministry is also<br />
responsible for developing the National Climate<br />
Change Program (PNCC), tasked with formulating and<br />
implementing measures for adaptation to, and mitigation<br />
of, climate change, and for monitoring the international<br />
environmental and climate change agenda.<br />
The PNCC has formulated the National Mechanism<br />
for Adaptation to Climate Change, “which is essentially<br />
in line with the National Development Plan (NDP)<br />
and consists of a long-term strategy aimed at establishing<br />
the actions and results expected of it as a tool for<br />
formulating a structured response to global warming<br />
through adaptation.”<br />
figURE 4. stRUctURE of thE nAtionAl mEchAnism foR AdAptAtion to<br />
climAtE chAngE<br />
Sectoral programs<br />
Water resources<br />
Security and<br />
sovereignty<br />
Settlements<br />
Health<br />
Ecosystems<br />
Scientific investigation<br />
Adaptation measures<br />
Capacity-building and<br />
awareness-raising<br />
Anthropological measures and<br />
ancestral knowledge<br />
Stakeholder consultations<br />
Prefectures Municipalities NGOs Universities Producer associations<br />
Feeedback<br />
Source: PNCC, 2007
d E v E l o p m E n t A n d c l i m A t E c h A n g E d i s c U s s i o n pA p E R s<br />
13<br />
The mechanism is basically a set of adaptation<br />
programs to deal with water resources, food security and<br />
sovereignty, human settlements and irrigation management,<br />
health, ecosystems, research and training. It<br />
involves practitioners from both the public and private<br />
sectors operating within an institutional framework, as<br />
illustrated in Figure 4:<br />
thE dEpARtmEntAl lEvEl<br />
The prefectures (or departmental governments) are at<br />
present engaged in a re-structuring process in preparation<br />
for assuming the responsibilities assigned to them<br />
under the new Constitution. Within this context local<br />
prefectures are required to establish a Departmental<br />
Service or Division responsible, inter alia, for preparing<br />
and implementing departmental land use and environmental<br />
protection policies in line with national<br />
policy. This entity will probably be charged with leading<br />
on climate change policies in <strong>Bolivia</strong>´s departments.<br />
Prefectural investments are governed by the<br />
Departmental Development Plan, which is drawn up<br />
with the participation of citizens and institutions.<br />
mUnicipAlitiEs<br />
At the local level, municipal governments are responsible<br />
for preparing and implementing planning policies,<br />
environmental protection, and promotion of human<br />
development within their territorial areas. The design<br />
and implementation of policies and projects for adaptation<br />
to climate change are required to be consistent<br />
with national and departmental policies.<br />
The formulation of policies, projects, and budgets by<br />
local governments embraces the concept of “’participatory<br />
planning.” This mechanism is intended to make it<br />
possible for all citizens residing in a municipality to<br />
participate in the design of the Municipal Development<br />
Plan (PDM) and Annual Operating Plan (POA), both<br />
of which govern all investments at the municipal<br />
level. In each community the neighborhood council<br />
assembles residents once a year (in the case of the POA)<br />
and once every five years (in the case of PDM) to<br />
decide upon and prioritize the investments to be undertaken<br />
by a municipal government in its particular territory.<br />
According to law all municipal disbursements must<br />
be registered in the PDM, with the details available for<br />
public scrutiny.<br />
The communities themselves are responsible for defining<br />
the type of investments to be undertaken by the municipal<br />
government, meaning that efforts to mobilize local<br />
resources for climate adaptation will necessarily involve<br />
convincing both the mayor and the wider community of<br />
the need for the relevant initiatives to be financed.<br />
thE indigEnoUs cAmpEsino<br />
AUTONOMIES<br />
The Constitution provides that the indigenous<br />
campesino autonomous areas (autonomies) shall, within<br />
their territorial jurisdiction, possess exclusive responsibility<br />
for their own land and environmental management<br />
and promotion of agricultural development (Art.<br />
304). These autonomous areas are not in operation to<br />
date, but on December 6, 2009, a total of 11 municipalities<br />
chose to transfer their “municipal” autonomous<br />
status to that of “original indigenous” autonomies and<br />
were to (in April 2010) elect transitional authorities in<br />
advance of the approval and entry into force of the new<br />
territorial entities.<br />
REgionAl AUTONOMIES<br />
The Constitution also establishes the possibility of<br />
creating autonomous regions, to be established within<br />
departments by clustering municipal territories.<br />
Regional autonomous authorities will possess<br />
powers delegated to them by the prefectures (i.e.,<br />
further decentralizing regional government). In<br />
December 2009 the province of Gran Chaco, for example,<br />
opted for regional autonomy and discussions are<br />
underway on the modalities which will govern elections<br />
for its regional authorities.<br />
civil sociEty<br />
Keen participation by citizens in public investment<br />
decisions at all levels of government, particularly in the<br />
municipalities, is widespread. In the case of the regional<br />
and autonomous campesino indigenous areas, a good<br />
chance exists of them also opting for public participation<br />
in the planning processes along the same lines as<br />
the municipalities.
14 thE sociAl dimEnsions of AdAptAtion to climAtE chAngE in BoliviA<br />
This implies that for the state to invest in climate<br />
change adaptation measures, citizens must be in a position<br />
to prioritize both their requirements and projects.<br />
Civil society institutions (NGOs and research centers)<br />
have to date worked in isolation on climate change<br />
issues. This work has mainly been in the form of studies,<br />
knowledge of which has failed to filter down to the<br />
relevant interested individuals and institutions.<br />
Notwithstanding the above, social organizations are<br />
convinced that that they are bearers of a rich ancestral<br />
experience of adaptation to climate change and argue<br />
that this experience should be put at the service of the<br />
state and NGOs.<br />
The <strong>Bolivia</strong>n Platform for Climate Change, bringing<br />
together some fifty institutions (NGOs) and social<br />
organizations, was established in February 2009.
15<br />
4. thE Zoning of thE<br />
coUntRy in tERms of<br />
vUlnERABility to<br />
climAtE chAngE<br />
thE mAcRo-REgions<br />
In view of its socio-agrobiological characteristics <strong>Bolivia</strong><br />
can be divided into four separate macro-regions:<br />
• Highlands: At a height of over 3,500 meters above sea<br />
level, the highlands the (high plateau or “Altiplano”<br />
and the Andes mountain chain) contain municipalities<br />
such as La Paz, Oruro, Potosí, and Cochabamba.<br />
The climate is generally cold and dry. This macroregion<br />
can be further divided into two sub-regions:<br />
the northern and southern regions, with the former<br />
subject to the highest humidity.<br />
• Valleys: Located in the foothills of the eastern<br />
mountains, the height of the inter-Andean valleys<br />
ranges from 1,000 to 3,500 meters above sea level.<br />
The valleys fall within the departments of La Paz,<br />
Cochabamba, Potosí, Chuquisaca, Tarija, and Santa<br />
Cruz. The climate is temperate. Again, this area<br />
can be divided into two regions: the ‘dry’ valleys<br />
and the more humid Yungas (including the Yungas<br />
of La Paz and the Chaparé de Cochabamba).<br />
• The Chaco: Located in the south east, this area—<br />
with a hot, dry climate—is less thanr 1,000 meters<br />
above sea level and contains the departments of<br />
Tarija, Chuquisaca, and Santa Cruz.<br />
• The plains (llanos): In the northeast, lying at under<br />
1,000 meters height and with a warm, humid<br />
climate, contain the departments of Santa Cruz,<br />
Beni, Pando, and parts of La Paz and Cochabamba<br />
departments.<br />
Each municipality can be classified according to the<br />
macro-region in which it is located, as detailed in the<br />
map below.<br />
population by macro-regions<br />
According to the 2001 Population Census, the present<br />
population in the municipalities of each macro-region is<br />
as follows:<br />
The Valleys Region contains 42 percent of the total<br />
population, followed by the Plains Region with 29<br />
percent. The 2001 Census also indicates that 62 percent<br />
of <strong>Bolivia</strong>’s population is urban (living in towns of over<br />
2,000 inhabitants). The same proportion is maintained<br />
in all macro-regions, except in the Plains Region, where<br />
three quarters of the population is urban.<br />
Altitude<br />
One of the prominent features of <strong>Bolivia</strong> is the enormous<br />
variation of altitude. The following chart<br />
compares the different altitudes above sea level of the<br />
capitals of each municipality per macro-region. It is<br />
clear that <strong>Bolivia</strong>´s four regions differ in terms of<br />
average altitude. It is also worth noting that the<br />
valleys, at an average height of 2,500 meters, present<br />
significant variations in altitude in view of their<br />
special topography, whereas the Plains Region is more<br />
uniformly flat.
16 thE sociAl dimEnsions of AdAptAtion to climAtE chAngE in BoliviA<br />
figURE 5. mUnicipAlitiEs AccoRding to mAcRo-REgion<br />
Note: Chaco = dry lowland, Llanos Amazonia = Amazonia plains, Tierras altas = highlands, Valles Yungas = Yungas valleys.<br />
tABlE 5. BoliviA 2001: popUlAtion By mAcRo-REgions<br />
Urban Rural Total Percent<br />
Altiplano 1,146,046 1,004,237 2,150,283 26<br />
valleys 2,106,205 1,466,618 3,572,823 42<br />
chaco 127,121 167,259 294,380 3<br />
plains 1,806,052 596,050 2,402,102 29<br />
All regions 5,185,424 3,234,164 8,419,588 100<br />
percent 62 38 100<br />
Source: Authors
d E v E l o p m E n t A n d c l i m A t E c h A n g E d i s c U s s i o n pA p E R s<br />
17<br />
figURE 6. BoliviA 2001: popUlAtion<br />
By URBAn-RURAl mAcRo-REgion<br />
figURE 8. REgionAl vARiAtions<br />
in AnnUAl pREcipAtion<br />
1,466,618<br />
596,050<br />
4500<br />
4000<br />
3500<br />
Categ. Box & Whisker Plot:<br />
Annual precipitation (mm)<br />
1,004,237<br />
3000<br />
2,106,205<br />
1,146,046<br />
167,259<br />
127,121<br />
Highlands Valleys Dry lowland<br />
Urban<br />
Rural<br />
1,806,052<br />
Plains<br />
Precipitation<br />
2500<br />
2000<br />
1500<br />
1000<br />
500<br />
0<br />
Source: Authors<br />
–500<br />
Highlands<br />
Valleys Dry lowland<br />
Macrozones<br />
Plains<br />
Median 25%–75% Min–Max<br />
figURE 7. REgionAl vARiAtions in<br />
AltitUdE<br />
Altitude<br />
5000<br />
4500<br />
4000<br />
3500<br />
3000<br />
2500<br />
2000<br />
1500<br />
1000<br />
500<br />
0<br />
–500<br />
Highlands<br />
Categ. Box & Whisker Plot:<br />
Altitude (m.s.n.m.)<br />
Valleys Dry lowland<br />
Macrozones<br />
Plains<br />
Median 25%–75% Min–Max<br />
Average temperature<br />
The following table, derived from data observed or<br />
calculated from isothermal curves, shows the mean<br />
annual temperature in the capital of each municipality.<br />
Marked differences exist between the four<br />
figURE 9. REgionAl vARiAtions<br />
in tEmpERAtURE<br />
35<br />
30<br />
Categ. Box & Whisker Plot:<br />
Temperature annual median (ºC)<br />
25<br />
Rainfall<br />
Temperature ºC<br />
20<br />
15<br />
The following chart (by macro-region) shows the average<br />
annual rainfall recorded (or calculated from isohyets<br />
curves) in the capital of each municipality. The municipalities<br />
in the Altiplano have the lowest rainfall levels<br />
(average 450 mm), whereas in the Plains rainfall exceeds<br />
1,000 mm.<br />
10<br />
5<br />
0<br />
Highlands Valleys Dry lowland Plains<br />
Macrozones<br />
Median 25%–75% Min–Max
18 thE sociAl dimEnsions of AdAptAtion to climAtE chAngE in BoliviA<br />
figURE 10. dRoUght RisK<br />
years. The table below compares flood risks for the<br />
macro-regions.<br />
30%<br />
20%<br />
Medium<br />
to none<br />
tABlE 7. RisK of floods<br />
in mAcRo-REgions<br />
Very high<br />
10%<br />
0%<br />
Valleys Dry lowland Highlands Plains<br />
High<br />
Flood Risk<br />
Zero to<br />
Average High Very High<br />
Total<br />
Municipalities<br />
valleys 37% 1% 0% 38%<br />
chaco 5% 0% 0% 5%<br />
Altiplano 29% 4% 3% 35%<br />
plains 6% 6% 10% 21%<br />
total<br />
municipalities<br />
77% 10% 13% 100%<br />
tABlE 6. dRoUght RisK, By<br />
mUnicipAlitiEs And mAcRo-REgion<br />
macro-regions. Whereas the average annual temperature<br />
is lowest in the Altiplano and highest in the Plains,<br />
temperatures vary significantly within each<br />
macro-region.<br />
Eight percent of <strong>Bolivia</strong>´s municipalities run a “very<br />
high” risk of drought. These are all located in the<br />
Altiplano. 51 percent, mainly municipalities in the<br />
Valleys and Altiplano, are at “high risk.”. 80 percent of<br />
the Chaco municipalities are at “high risk” and those in<br />
the Plains run “low” or “zero” risk of drought.<br />
flood Risk<br />
Drought Risk<br />
Zero to<br />
average High Very high<br />
Total<br />
municipalities<br />
valleys 14% 24% 0% 38%<br />
chaco 1% 4% 0% 5%<br />
Altiplano 5% 23% 8% 35%<br />
plains 21% 0% 0% 21%<br />
total<br />
municipalities<br />
41% 51% 8% 100%<br />
Flood risk figures have been prepared by WFP, based on<br />
data obtained from the municipalities over recent<br />
The above table shows that 13 percent of the municipalities<br />
run “very high” flood risks. Most of these are found<br />
in the Plains region. No municipalities in the Chaco or<br />
the Valleys are exposed to “very high” risk of flooding.<br />
human development indicators<br />
The following tables are based on HDI data compiled<br />
for 2001 by UNDP. 25% of municipalities with the<br />
lowest HDI are in the first quartile (Table 8).<br />
Quartile 1 (with the lowest HDI) and Quartile 2<br />
municipalities are located virtually exclusively in the<br />
Valleys and Altiplano, indicating that poverty in <strong>Bolivia</strong><br />
is concentrated on these macro-regions.<br />
tABlE 8. hUmAn dEvElopmEnt<br />
indEx<br />
Quartile<br />
1<br />
Human Development Index<br />
Quartile<br />
2<br />
Quartile<br />
3<br />
Quartile<br />
4<br />
Total<br />
Municipalities<br />
valleys 15% 8% 8% 7% 38%<br />
chaco 0% 1% 1% 2% 5%<br />
Altiplano 10% 13% 9% 3% 35%<br />
plains 0% 3% 6% 13% 22%<br />
total<br />
municipalities<br />
25% 25% 25% 25% 100%
d E v E l o p m E n t A n d c l i m A t E c h A n g E d i s c U s s i o n pA p E R s<br />
19<br />
figURE 11. hUmAn dEvElopmEnt indicAtoRs<br />
0.75<br />
Categ. Box & Whisker Plot:<br />
Human development index<br />
75<br />
Categ. Box & Whisker Plot:<br />
Life expectancy<br />
0.70<br />
70<br />
HDI<br />
0.65<br />
0.60<br />
0.55<br />
0.50<br />
0.45<br />
0.40<br />
Expectancy<br />
65<br />
60<br />
55<br />
50<br />
45<br />
0.35<br />
40<br />
0.30<br />
Highlands<br />
Valleys Dry lowland<br />
Macrozones<br />
Plains<br />
35<br />
Highlands<br />
Valleys Dry lowland<br />
Macrozones<br />
Plains<br />
Median ±SD ±1.98*SD<br />
Median 25%–75% Min–Max<br />
0.9<br />
0.8<br />
0.7<br />
0.6<br />
Categ. Box & Whisker Plot:<br />
Illiteracy rate<br />
Illiteracy rate (left chart). the diagram indicates that the highest<br />
levels of illiteracy (2001 data) exist in the valleys, followed by the<br />
Altiplano and chaco.<br />
Life expectancy at birth (upper right). While this indicator reveals a<br />
more homogeneous situation throughout the country, the lowest<br />
levels of life expectancy at birth are nevertheless in the Altiplano<br />
and valleys.<br />
Illiteracy<br />
0.5<br />
0.4<br />
0.3<br />
0.2<br />
0.1<br />
0<br />
Highlands<br />
Valleys Dry lowland<br />
Macrozones<br />
Plains<br />
Median 25%–75% Min–Max<br />
food vulnerability<br />
The Food Vulnerability Map published by the WFP<br />
provided the basis for the following table (table 9).<br />
Figure 12 shows that 53 percent of <strong>Bolivia</strong>´s municipalities<br />
present a high level of food vulnerability. This is<br />
particularly the case of municipalities in the Altiplano<br />
and Valleys.<br />
tABlE 9. food vUlnERABility, By<br />
mAcRo-REgions And mUnicipAlitiEs<br />
Food Vulnerability<br />
Low Average High<br />
Total<br />
Municipalities<br />
valleys 9% 10% 19% 38%<br />
chaco 2% 3% 1% 5%<br />
Altiplano 2% 6% 27% 35%<br />
plains 10% 5% 6% 21%<br />
total<br />
municipalities<br />
23% 24% 53% 100%
20 thE sociAl dimEnsions of AdAptAtion to climAtE chAngE in BoliviA<br />
figURE 12. food vUlnERABility By<br />
mAcRo-REgion<br />
High<br />
30%<br />
25%<br />
20%<br />
15%<br />
10%<br />
5%<br />
0%<br />
Low<br />
Valleys Dry lowland Highlands Plains<br />
Medium<br />
holdRidgE lifE ZonEs<br />
The PNCC has produced a national zoning map of the<br />
territory, drawing on variables closely related to climate<br />
change and using the “Holdridge model,” the global<br />
bioclimatic scheme for the classification of land areas, to<br />
identify life zones.<br />
The PNCC used the following methodology: “[...]<br />
theoretical data for temperature and precipitation was<br />
employed for each IIASA 0.5 degree geographic grid<br />
(identical to that applied for the determination of life<br />
areas according to the parameters established by<br />
Holdridge). Values were also extrapolated for certain<br />
life areas (where there were no weather stations) from<br />
SENAMHI isotherm and isohyet maps. After<br />
figURE 13. BoliviA: lifE ZonEs idEntifiEd By thE pncc<br />
1. Wet subtropical forest<br />
2. Dry tropical forest<br />
3. Wet tropical forest<br />
4. Wet temperate forest<br />
5. Dry temperate forest<br />
6. Highly wet subtropical forest<br />
7. Subtropical rainforest<br />
8. Highly wet tropical forest<br />
9. Highly wet cold temperate forest<br />
10. Wet cold temperate forest<br />
11. Subtropical thorny scrub mountain<br />
12. Highly dry tropical forest<br />
13. Cold temperate steppe<br />
14. Cold temperate desert bush<br />
15. Cold temperate desert<br />
16. Cold temperate thorny scrub steppe
d E v E l o p m E n t A n d c l i m A t E c h A n g E d i s c U s s i o n pA p E R s<br />
21<br />
fine-tuning and updating the data, a database was<br />
constructed for inputting into the Holdridge model<br />
(1947). Given that this database included information<br />
on latitude, longitude, altitude, temperature and different<br />
climate scenarios, the model was able to classify<br />
life areas according to the various inputs. Together<br />
with the information previously described, the<br />
Holdridge model was used to determine current<br />
weather conditions in accordance with the IS92a5<br />
climate scenario proposed by the IPCC (PNCC 2007,<br />
Climate Change in <strong>Bolivia</strong>. p. 33)”. The results,<br />
published in 2001, are shown in Figure 13.<br />
As can be seen in the above map, the limits defined by<br />
the model are formed by straight lines, corresponding to<br />
0.5 degree grid squares. In 2007, the PNCC presented<br />
the map of life zones with curved boundaries,<br />
constructed by combining the Holdridge model results<br />
and the 1979 Ecological Map (See Figure 14).<br />
sElEction of mUnicipAlitiEs<br />
foR thE stUdy<br />
Urban-rural: The study team had to decide whether to<br />
concentrate efforts on rural or urban areas given that it<br />
figURE 14. BoliviA: lifE ZonEs AdjUstEd By pncc<br />
Life Zones<br />
Wet subtropical forest<br />
Dry tropical forest<br />
Wet tropical forest<br />
Wet temperate forest<br />
Dry temperate forest<br />
Highly wet subtropical forest<br />
Subtropical rainforest<br />
Highly wet tropical forest<br />
Highly wet cold temperate forest<br />
Wet cold temperate forest<br />
Subtropical thorny scrub mountain<br />
Highly dry tropical forest<br />
Cold temperate steppe<br />
Cold temperate desert bush<br />
Cold temperate desert<br />
Cold temperate thorny scrub steppe
22 thE sociAl dimEnsions of AdAptAtion to climAtE chAngE in BoliviA<br />
was not possible to cover both areas without undermining<br />
the accuracy of the results. Since we needed to give<br />
priority to the populations most vulnerable to climate<br />
change, it was decided to focus on <strong>Bolivia</strong>´s rural population,<br />
where the most vulnerable groups are the indigenous<br />
campesinos. Our decision to focus on the rural<br />
areas did not mean ruling out city-dwellers as also being<br />
vulnerable to climate change. It has been proven that<br />
some <strong>Bolivia</strong>n cities are indeed vulnerable, especially<br />
those that depend on glaciers for water supply and irrigated<br />
agriculture to supply food, as well as the urban<br />
areas located near to large rivers that overflow during<br />
the rainy season. In this respect we believe that the<br />
urban areas should be the subject of a further study.<br />
Sample size: In order to gain a minimal understanding<br />
of the reality of campesino existence against a background<br />
of substantial agro-ecological, cultural, and<br />
socio-economic diversity (and in view of the obvious<br />
limitations of this type of study), we decided that that<br />
the sample should cover 14 rural municipalities 4 , drawn<br />
from different macro-regions and taking into account<br />
existing levels of population, vulnerability and<br />
biodiversity.<br />
Additional criteria: We had to use a set of additional<br />
criteria in order to determine which municipalities<br />
should be sampled, given that the criteria based on location<br />
in a particular macro-region and vulnerability to<br />
climate change were not sufficient for our purposes.<br />
Other criteria included:<br />
• Life zones: representing the most diverse life zones;<br />
• Ethnicity: reflecting as much ethnic diversity as<br />
possible;<br />
• Population density: covering municipalities with<br />
large and small populations;<br />
• Poverty: includinge the poorest municipalities;<br />
• Drought: including municipalities with the highest<br />
risk of drought;<br />
• Flooding: including at least two municipalities at<br />
high risk from floods.<br />
The results were as follows (see Tables 11–16 and<br />
Figure 15–16):<br />
Main criterion: The main criterion for our sample selection<br />
was that of “vulnerability to climate change,” and<br />
we chose to divide municipalities into three categories<br />
of vulnerability: “high,” “medium,” and “low.” This type<br />
of indicator is complex, combining exposure criteria and<br />
vulnerability awareness to climate risks as well as the<br />
population’s response capacity, education levels, and<br />
economic situation. We decided therefore that the<br />
sample should consist only of those municipalities with<br />
“high vulnerability” to climate change.<br />
tABlE 10. nUmBER of<br />
mUnicipAlitiEs stUdiEd, By<br />
mAcRo-REgion<br />
Macro-region<br />
Number of municipalities<br />
Altiplano 4<br />
valleys 5<br />
chaco 2<br />
plains 3<br />
total 14<br />
4 The budget assigned to the social area in <strong>Bolivia</strong> was not sufficient to<br />
allow a study to be made of the 14 municipalities with the result that<br />
the study was delayed by several months until additional funds were<br />
found.
d E v E l o p m E n t A n d c l i m A t E c h A n g E d i s c U s s i o n pA p E R s<br />
23<br />
tABlE 11. mUnicipAlitiEs At RisK<br />
Municipality Province Department Language Macro-region<br />
1 tarvita (villa orias) Azurduy chuquisaca Quechua valleys<br />
2 villa vaca guzman luis calvo chuquisaca spanish chaco<br />
3 calacoto pacajes la paz Aymara Altiplano<br />
4 pucarani los Andes la paz Aymara Altiplano<br />
5 sicaya capinota cochabamba Quechua valleys<br />
6 carangas curahuara sajama oruro Aymara-spanish Altiplano<br />
7 vitichi nor chichas potosi Quechua valleys<br />
8 porco Antonio Quijarro potosi Quechua-spanish Altiplano<br />
9 El puente (tomayapo) mendez tarija spanish valleys<br />
10 yapacaní ichilo santa cruz Quechua-spanish plains<br />
11 charagua cordillera santa cruz spanish-other chaco<br />
12 saipina manuel m. gentleman santa cruz spanish valleys<br />
13 san ignacio moxos Beni spanish plains<br />
14 san pedro manuripi pando spanish plains<br />
Sample by department: Chuquisaca (2 municipalities), Santa Cruz (3 municipalities), La Paz (2 municipalities), Potosi (1 municipality), Cochabamba (1 municipality),<br />
Oruro (1 municipality), Tarija (1 municipality), Beni (1 municipality), Pando (1 municipality).<br />
tABlE 12. vUlnERABility<br />
Municipality Vulnerability to climate change Food vulnerability Risk of drought Flood risk<br />
1 tarvita (villa orias) high high high low<br />
2 villa vaca guzman high Average high low<br />
3 calacoto high Added high low<br />
4 pucarani high high high Average<br />
5 sicaya high high high low<br />
6 carangas curahuara high high high low<br />
7 vitichi high high high low<br />
8 porco high Average high low<br />
9 El puente (tomayapo) high Average high Average<br />
10 yapacaní high high medium or low high<br />
11 charagua high Average high Average<br />
12 saipina high Average high low<br />
13 san ignacio high high medium or low high<br />
14 san pedro high Average medium or low high<br />
Sample: 9 municipalities with ‘high’ food vulnerability, 11 municipalities with ‘very high’ risk of drought, 3 municipalities with ‘very high’ or ‘high’ flood risk.
24 thE sociAl dimEnsions of AdAptAtion to climAtE chAngE in BoliviA<br />
figURE 15. mUnicipAlitiEs sElEctEd By mAcRo-REgion<br />
Macroregions<br />
Highlands<br />
Valleys<br />
Plains<br />
Dry lowland<br />
Selected municipalities<br />
Sample by macro-region: Valleys (5 municipalities), Altiplano (4 municipalities), Plains (3 municipalities), Chaco (2 municipalities).
d E v E l o p m E n t A n d c l i m A t E c h A n g E d i s c U s s i o n pA p E R s<br />
25<br />
figURE 16. mUnicipAlitiEs sElEctEd AccoRding to AltitUdE<br />
Municipalities according to altitude<br />
In meters
26 thE sociAl dimEnsions of AdAptAtion to climAtE chAngE in BoliviA<br />
tABlE 13. sociAl indicAtoRs<br />
Municipality<br />
Poverty incidence<br />
Annual per capita<br />
income (US$)<br />
Life expectancy (yrs)<br />
Human Development<br />
Index<br />
1 tarvita (villa orias) 91.1% 1,129 54.9 0.41<br />
2 villa vaca guzman 55.1% 966 62.6 0.54<br />
3 calacoto 75.8% 697 58.9 0.56<br />
4 pucarani 69.6% 612 59.8 0.52<br />
5 sicaya 82.8% 1,048 58.8 0.47<br />
6 carangas<br />
curahuara<br />
69.9% 811 65.5 0.57<br />
7 vitichi 67.1% 601 59.5 0.50<br />
8 porco 24.7% 1,026 60.7 0.57<br />
9 El puente<br />
(tomayapo)<br />
61.8% 1,325 62.9 0.54<br />
10 yapacaní 39.9% 1,498 65.3 0.62<br />
11 charagua 52.0% 1,214 61.9 0.57<br />
12 saipina 35.6% 1,497 61.5 0.59<br />
13 san ignacio 66.3% 2,142 63.6 0.59<br />
14 san pedro 82.6% 1,461 54.8 0.53<br />
The sample shows 14 municipalities with an HDI below the national average (0.641).<br />
tABlE 14. popUlAtion siZE And dEnsity<br />
Municipality 2002 population Urban population Rural population Area (km 2 )<br />
1 tarvita (villa<br />
orias)<br />
2 villa vaca<br />
guzman<br />
Population density<br />
(inhabitants per<br />
km 2 )<br />
15,166 0 15,166 1,830 8.3<br />
10,748 2,327 8,421 4,024 2.7<br />
3 calacoto 8,818 0 8,818 3,700 2.4<br />
4 pucarani 26,802 0 26,802 924 29.0<br />
5 sicaya 2,235 0 2,235 256 8.7<br />
6 carangas<br />
curahuara<br />
5,278 0 5,278 2,296 2.3<br />
7 vitichi 11,298 0 11,298 1,963 5.8<br />
8 porco 5,959 0 5,959 1,023 5.8<br />
9 El puente<br />
(tomayapo)<br />
10,663 0 10,663 2,477 4.3<br />
10 yapacaní 31,538 14,589 16,949 9,218 3.4<br />
11 charagua 24,427 2,737 21,690 72,223 0.3<br />
12 saipina 5,350 2,394 2,956 406 2.13<br />
13 san ignacio 21,643 8,893 12,750 24,978 0.9<br />
14 san pedro 1,082 0 1,082 2,623 0.4<br />
Sample: 3 municipalities with large populations, 9 municipalities with exclusively rural populations, 1 large town in area terms, 4 municipalities with high or medium<br />
population.
d E v E l o p m E n t A n d c l i m A t E c h A n g E d i s c U s s i o n pA p E R s<br />
27<br />
tABlE 15. climAtE<br />
Municipality<br />
Altitude (meters)<br />
Average annual<br />
temperature<br />
Annual precipitation<br />
(mm)<br />
Climate<br />
1 tarvita (villa orias) 2,480 15 400 temperate/ subhumid<br />
2 villa vaca guzman 1,117 21 748 Warm humid<br />
3 calacoto 3,900 7 400 dry cold<br />
4 pucarani 3,846 11 550 cold<br />
5 sicaya 2,500 17 700 dry temperate<br />
6 carangas<br />
curahuara<br />
3,968 5 400 cold<br />
7 vitichi 3,020 15 394 temperate<br />
8 porco 4,050 13 400 cold<br />
9 El puente<br />
(tomayapo)<br />
2,300 17 500 temperate<br />
10 yapacaní 288 2,24 1,972 hot humid<br />
11 charagua 735 23 900 Warm dry<br />
12 saipina 1,360 8,20 600 Warm dry<br />
13 san ignacio 160 2,25 1,916 hot humid<br />
14 san pedro 267 26,0 1,920 hot humid<br />
Sample: 7 municipalities have dry climates, 4 municipalities cold climates, 4 towns in the Altiplano, 6 in low-lying areas.<br />
tABlE 16. holdRidgE lifE ZonEs<br />
Municipality Life Zone 1 Life Zone 2 Life Zone 3 LIfe Zone 4<br />
1 tarvita (villa<br />
orias)<br />
2 villa vaca<br />
guzman<br />
subtropical dry forest<br />
subtropical dry forest<br />
3 calacoto cool temperate steppe<br />
4 pucarani cool temperate rainforest temperate rain forest<br />
5 sicaya temperate dry forest<br />
6 carangas<br />
curahuara<br />
cool temperate steppe<br />
7 vitichi cool temperate steppe prickly scrub cold temperate<br />
steppe<br />
8 porco cool temperate steppe<br />
9 El puente<br />
(tomayapo)<br />
prickly scrub cold temperate<br />
steppe<br />
subtropical thorn<br />
scrub<br />
10 yapacaní subtropical rainforest Rainforest subtropical wet<br />
forest<br />
11 charagua tropical dry forest subtropical dry forest tropical dry forest<br />
12 saipina subtropical dry forest<br />
13 san ignacio subtropical rainforest Rainforest tropical dry forest subtropical<br />
rainforest<br />
14 san pedro subtropical rainforest
28<br />
5. livElihood stRAtEgiEs in<br />
thE stUdy AREA<br />
A livelihood strategy can be described as a hierarchical<br />
combination of economic activities which generate<br />
resources to provide for family subsistence.<br />
Livelihood strategies are complex because they comprise<br />
a number of different economic activities, depending on<br />
the resources and opportunities possessed by families, as<br />
well as the constraints affecting households.<br />
One of the factors in terms of constraints and opportunities<br />
is the diverse agro-ecological nature of the land,<br />
particularly regarding its soil composition and<br />
relief. This varies considerably, even over small areas,<br />
e.g., within the same community separate areas may<br />
produce vegetables, potatoes, corn, etc. As a result a<br />
wide diversity of livelihood strategies can exist in the<br />
same community.<br />
A further aspect is that livelihood strategies are<br />
complex. While one activity may predominate, others<br />
may also exist which, together with the main activity,<br />
combine to form the family´s or community´s livelihood<br />
strategy. Families engaged in livestock raising also often<br />
devote time to cropping as well as making and selling<br />
other products, although such families are generally<br />
described as “livestock raisers” in view of their core<br />
income-producing activity.<br />
Livelihood strategies are also dynamic. Families may<br />
often change or rearrange the activities that underpin<br />
their livelihoods when new opportunities or constraints<br />
appear. These are frequently the result of greater or<br />
lesser availability of resources (e.g., more capital, young<br />
adults leaving home, cattle herd reduced by death, etc.).<br />
clAssificAtion of livElihood<br />
stRAtEgiEs<br />
The classification below is based on the main economic<br />
and income-producing activity of households.<br />
strategies Based on Rainfed Agriculture<br />
The main activity is rainfed agriculture, i.e., not requiring<br />
irrigation. In the Altiplano and valleys this is generally<br />
based on a combination of agriculture and some<br />
livestock raising. Although the main income source is<br />
growing crops, livestock raising provides inputs as well<br />
as labor for the former. In the Plains and Chaco, where<br />
most farms are devoted solely to agricultural production,<br />
this dual activity is much less common. Potatoes are<br />
generally grown in the areas with good soils and high<br />
humidity, cereals in the drier areas with poorer soils, and<br />
fruit in hot and humid areas.<br />
strategies Based on irrigated Agriculture<br />
These involve growing products that can fetch a high<br />
market value and require irrigation to obtain competitive<br />
returns. Such strategies tend to be specialized and<br />
well integrated into the market. The main agricultural<br />
activities in this sector involve growing counter-season<br />
crops (potatoes, corn, onions, fruit, etc.), vegetables (in<br />
areas near cities) and fruit (in hot dry areas).
d E v E l o p m E n t A n d c l i m A t E c h A n g E d i s c U s s i o n pA p E R s<br />
29<br />
tABlE 17. livElihood stRAtEgiEs<br />
Sector Subsector Predominant economic activity<br />
Agricultural Agriculture With irrigation vegetables<br />
fruit<br />
counter-season crops<br />
others<br />
Without irrigation<br />
cereals<br />
potatoes<br />
others<br />
Animal husbandry Extensive cattle<br />
camelids<br />
others<br />
semi-stables<br />
cattle<br />
others<br />
forestry<br />
hunting<br />
fishing<br />
Extraction or harvesting<br />
Employment Employment local Agricultural day laborer<br />
casual labor, other jobs<br />
temporary migration<br />
seasonal agricultural work<br />
seasonal urban employment<br />
self-employed manual activities Bricklayer<br />
carpenter<br />
Blacksmith / mechanic<br />
craftsman<br />
services<br />
trade<br />
manufacturing<br />
sales<br />
transport<br />
strategies Based on Extensive livestock<br />
The main economic activity in this sector is free-range<br />
livestock-raising on natural pasture land. The main<br />
animals in the category are cattle (in the lowlands) and<br />
camelids (in the Altiplano), both reared for their<br />
meat. Sheep and goats are also bred in smaller numbers.<br />
Extensive livestock raising activities are often combined<br />
with small-scale subsistence agriculture.<br />
strategies Based on intensive livestock<br />
Intensive livestock (mainly cattle) raising is undertaken<br />
generally in the vicinity of large cities, mainly for milk<br />
production. The milk-producing farms generally grow<br />
irrigated crops of alfalfa to feed the semi-stabled herds<br />
(supplemented by balanced feed purchased in the<br />
towns). Beef cattle, pigs, and poultry are also raised on<br />
a smaller scale in this category.<br />
forestry-based livelihood strategies<br />
These strategies can generally be found in the Plains<br />
Region where families have access to the biodiversity of<br />
the forests and rivers, e.g., hunting, fishing, and forest<br />
resources extraction. Small plots are also often cultivated<br />
for family consumption.
30 thE sociAl dimEnsions of AdAptAtion to climAtE chAngE in BoliviA<br />
tABlE 18. livElihood stRAtEgiEs in thE sAmplE<br />
Livelihood approach<br />
Macro-region Agricultural Agricultural and other Employment Self-employed Total n<br />
Altiplano 42% 47% 0% 11% 100% 19<br />
chaco 50% 40% 10% 0% 100% 10<br />
plains 86% 14% 0% 0% 100% 14<br />
valleys 59% 37% 4% 0% 100% 27<br />
Weighted<br />
average<br />
Source: Prepared with data from family interviews; (n = 70 families)<br />
59% 36% 3% 3% 100% 70<br />
Employment-based livelihood strategies<br />
The poorest families in the communities derive the bulk<br />
of their income from selling their labor as casual farm<br />
hands (jornaleros). Such families also often cultivate<br />
small vegetable gardens and raise a few animals.<br />
Other families live from the income derived from<br />
temporary migration (family members traveling to seek<br />
work in the cities or in other farming areas). Some<br />
families live on the wages of one or more family<br />
members who work as permanent employees of the<br />
state (usually teachers) or of mining and oil companies.<br />
strategies Based on trades<br />
Other families receive the bulk of their income from a<br />
trade practiced by one or more family member. These<br />
are people who have received technical training, usually<br />
from parents, and have a small amount of capital:<br />
masons, artisans (leather or ceramic products), blacksmiths,<br />
carpenters, etc.<br />
strategies Based on services<br />
Some communities have families principally engaged as<br />
services providers—mainly truck or bus-drivers, small<br />
shopkeepers/traders, and others who make a living from<br />
renting out corn-milling equipment, etc.<br />
From the above table it can be seen that fewer than<br />
two-thirds (59 percent) of families live from agricultural<br />
activities, while the remaining third (36 percent)<br />
combine agricultural activities with paid jobs or are<br />
self-employed. Notwithstanding the small sample size,<br />
it is clear that agriculture forms the basis for the livelihoods<br />
of families living in the communities. A third of<br />
the families also supplement these activities with nonagricultural<br />
work.<br />
socioEconomic stRAtA<br />
Socioeconomic self-stratification enabled our researchers<br />
to classify households and families in the communities<br />
under three main headings or strata: “poor,”<br />
“average,” and “rich,” 5 using the indicators selected by<br />
the communities and taking account of land tenure,<br />
livestock ownership, family social position, child<br />
employment, type of housing, etc.<br />
Figure 17 shows the proportion of families in the three<br />
categories on the basis of the sample of 70 communities<br />
studied. 9.2 percent of families in the community were<br />
considered “rich,” 40.8 percent “poor,” and the remaining<br />
50 percent “average.” These figures probably fail to<br />
tell the whole story since significant variations exist<br />
from one community to another.<br />
The socioeconomic strata classification presented in this<br />
study is a relative and very approximate ranking<br />
constructed by comparing one family to another in a<br />
5 In the study area all the families are considered to be poor according to<br />
the definition of poverty by the National Statistics Institute, and the<br />
sample was selected with this in mind. As a result, the description of<br />
each stratum should be: the poorest, the intermediate poor, and the less<br />
poor. However, in order to make the document easier to read we<br />
decided to adopt the following definitions: “poor,” “average poor,” and<br />
“rich” (using inverted commas).
d E v E l o p m E n t A n d c l i m A t E c h A n g E d i s c U s s i o n pA p E R s<br />
31<br />
figURE 17: socioEconomic<br />
stRAtificAtion in thE commUnitiEs<br />
Medium<br />
50.0%<br />
Rich<br />
9.2%<br />
Source: Prepared from Enquiry Form 4.<br />
Poor<br />
40.8%<br />
given community (i.e. poor families in one community<br />
may differ significantly from poor families in another).<br />
Table 19 indicates degrees of socio-economic differentiation<br />
in the communities: the so-called “rich” own<br />
between 5–10 times more assets than “poor” families,<br />
particularly as regards ownership of animals.<br />
On the other hand, analyzing the figures by macroregion,<br />
it appears that the differences between strata are<br />
higher in the Plains.<br />
Figure 18 shows that productive assets within each stratum<br />
can vary significantly, given that in each macroregion<br />
communities possess different productive skills.<br />
Communities in the Altiplano, for example, which raise<br />
camelids tend to own many more animals than other<br />
communities engaged in agricultural pursuits.<br />
livElihood stRAtEgiEs By<br />
socioEconomic stRAtA.<br />
Livelihood strategies and socioeconomic status are<br />
closely linked. A particular livelihood strategy is<br />
governed not by what families or communities desire of<br />
their own free will but by a set of overriding factors that<br />
must be met. A dairy-based livelihood strategy calls, for<br />
example, for a substantial amount of capital for investing<br />
in livestock and infrastructure; such families need<br />
irrigated land for growing fodder and to be close to<br />
markets where they can sell their milk. The capital<br />
invested in dairy units is generally 10 to 20 times<br />
greater than that invested in rainfed agricultural units. 6<br />
This means that only the richest families in the<br />
community are dairy farmers, earning over ten times<br />
more than families living off rainfed agriculture. 7<br />
6 Wizke Emilie: Study of production systems in the Yotala Valley, page 25.<br />
7 Idem, page 33<br />
tABlE 19: fAmily AgRicUltURAl AssEts By stRAtA And mAcRo-REgion<br />
Area cultivated (Ha)<br />
Livestock ownership (AUE)<br />
Macro-region Stratum Valid N Mean Std.Dev. Mean Std.Dev.<br />
Altiplano poor 20 0.8 0.7 7.14 9.13<br />
Average 20 1.6 1.1 46.9 43.2<br />
Rich 16 2.8 2.4 94.1 83.4<br />
valleys poor 25 0.9 0.8 6.0 3.3<br />
Average 25 2.2 1.5 4.14 6.4<br />
Rich 20 4.4 3.3 37.0 7.15<br />
plains poor 15 1.5 1.1 1.3 2.3<br />
Average 15 4.4 5.6 5.3 9.9<br />
Rich 15 8.5 10.8 9.13 25.0<br />
chaco poor 10 1.2 0.8 3.1 3.4<br />
Average 10 3.0 1.7 9.0 7.6<br />
Rich 10 4.5 2.1 1.20 3.12<br />
Source: Enquiry Form 4<br />
UEB: Animal Unit Equivalent
32 thE sociAl dimEnsions of AdAptAtion to climAtE chAngE in BoliviA<br />
figURE 18: RURAl fAmiliEs (AgRicUltURAl AssEts) By stRAtA And<br />
mAcRo-REgion<br />
180<br />
Highlands: landholding<br />
8<br />
Highlands: area cultivated<br />
160<br />
7<br />
140<br />
6<br />
120<br />
5<br />
UEB<br />
100<br />
80<br />
60<br />
Hectares<br />
4<br />
3<br />
40<br />
2<br />
20<br />
1<br />
0<br />
0<br />
–20<br />
Poor<br />
Middle<br />
Rich<br />
–1<br />
Poor<br />
Middle<br />
Rich<br />
Socioeconomic strata<br />
Socioeconomic strata<br />
Median 25%–75% 25%–75%<br />
Median 25%–75% Min–Max<br />
60<br />
Valleys: landholding<br />
8<br />
Valleys: area cultivated<br />
50<br />
7<br />
6<br />
40<br />
5<br />
UEB<br />
30<br />
Hectares<br />
4<br />
3<br />
20<br />
2<br />
1<br />
10<br />
0<br />
0<br />
Poor<br />
Middle<br />
Rich<br />
–1<br />
Poor<br />
Middle<br />
Rich<br />
Socioeconomic strata<br />
Median 25%–75% 25%–75%<br />
Socioeconomic strata<br />
Median 25%–75% 25%–75%<br />
Source: Prepared from Enquiry Form 4
d E v E l o p m E n t A n d c l i m A t E c h A n g E d i s c U s s i o n pA p E R s<br />
33<br />
figURE 18: RURAl fAmiliEs (AgRicUltURAl AssEts) By stRAtA And<br />
mAcRo-REgion<br />
16<br />
Plains: landholding<br />
22<br />
Plains: area cultivated<br />
14<br />
20<br />
12<br />
18<br />
16<br />
10<br />
14<br />
UEB<br />
8<br />
6<br />
Hectares<br />
12<br />
10<br />
4<br />
2<br />
0<br />
8<br />
6<br />
4<br />
2<br />
–20<br />
Poor<br />
Middle<br />
Rich<br />
0<br />
Poor<br />
Middle<br />
Rich<br />
Socioeconomic strata<br />
Socioeconomic strata<br />
Median 25%–75% 25%–75%<br />
Median 25%–75% 25%–75%<br />
26<br />
24<br />
22<br />
Dry lowland: landholding<br />
8<br />
7<br />
Dry lowland: area cultivated<br />
20<br />
18<br />
16<br />
6<br />
5<br />
UEB<br />
14<br />
12<br />
10<br />
Hectares<br />
4<br />
3<br />
8<br />
6<br />
4<br />
2<br />
0<br />
2<br />
1<br />
0<br />
–2<br />
Poor<br />
Middle<br />
Rich<br />
–1<br />
Poor<br />
Middle<br />
Rich<br />
Socioeconomic strata<br />
Socioeconomic strata<br />
Median 25%–75% 25%–75%<br />
Median 25%–75% 25%–75%<br />
Source: Prepared from Enquiry Form 4
34 thE sociAl dimEnsions of AdAptAtion to climAtE chAngE in BoliviA<br />
Although separate communities possess a variety of<br />
livelihood strategies general trends can be identified<br />
from the analysis of the results of the family interviews 8<br />
designed to establish the relationship between socioeconomic<br />
strata and livelihood strategy.<br />
The livelihood strategy of the “poorest” families tends to<br />
be based on:<br />
• Rainfed agriculture’<br />
• Small-scale livestock farming; or<br />
• Casual agricultural employment in the community<br />
(jornaleo) and seasonal migration.<br />
The strategy of the “intermediate” families revolves<br />
around:<br />
• Rainfed and some irrigated agriculture<br />
• Extensive livestock farming; or<br />
• Casual agricultural employment and seasonal<br />
migration<br />
“Rich” families base their strategies on:<br />
• Irrigated (and some rainfed) agriculture;<br />
• Semi-stabled livestock, dairy produce, large-scale<br />
livestock rearing; or<br />
• Self-employed activities (services and trades).<br />
tEmpoRARy migRAtion As A<br />
livElihood stRAtEgy<br />
Temporary migration applies to rural family members<br />
who travel to nearby towns and cities or to mining<br />
centers or other agricultural regions to seek temporary<br />
employment.<br />
Temporary migration is now commonplace in rural<br />
communities. It meets a number of different needs, but<br />
the main one is to generate additional income for families<br />
back home. The general rule (exceptions exist) is<br />
that temporary migrants consist of men of working age<br />
leaving the communities in search of work while the<br />
rest of the family stays behind to care for the animals<br />
and crops. In the interviews conducted in this study we<br />
found that in all the 25 families where this practice was<br />
common temporary migration was restricted to the<br />
menfolk.<br />
We also discovered that migration is a practice that<br />
families prefer to avoid, given the uncertain outcomes.<br />
Migrants do not always find work and return to their<br />
communities either penniless or sick (or both). The top<br />
priorities of many families in such circumstances is to<br />
avoid migration and seek to expand the productive<br />
capacity of their farms. This point was put succinctly by<br />
a resident of Barrancas:<br />
My husband left home to find work at sugar cane<br />
harvest time in another area, but he suffered a lot.<br />
Sometimes he returned sick from mosquito bites<br />
and there were occasions when he returned with<br />
no money since the rains brought cutting to a halt.<br />
But we managed to irrigate our land and he<br />
thankfully has no longer needed to leave home for<br />
the last three years. (Interview with Maria<br />
Quispe, community of Barrancas, Valleys<br />
Region).<br />
Who Are the temporary migrants<br />
The bulk of the ‘migrant’ population consists of young<br />
men keen to end dependency on their families and earn<br />
their own money. Temporary migration for them is a<br />
kind of rite of passage into adulthood. 9 Another important<br />
group consists of smallholder (minifundista) families<br />
with little land (or with no land) who depend on<br />
rainfed farming but who are unable to grow enough to<br />
support themselves. These families organize their activities<br />
to enable one or more family members to migrate<br />
in search of work for several weeks a year.<br />
Who Are the non-migrants<br />
The interviews revealed two categories of families<br />
where migration was not an issue: families with no need<br />
to migrate and those who were unable to do so.<br />
The first category includes the less poor families in the<br />
community with sufficient irrigated land and/or are able<br />
to earn money from such activities as providing transport,<br />
milling services, etc. The second category generally<br />
consists of:<br />
8 The sample is too small to produce significant statistical data to support<br />
these trends.<br />
9 Vargas Miriam, La migración temporal en la dinámica de la unidad domestica<br />
campesina, page 150.
d E v E l o p m E n t A n d c l i m A t E c h A n g E d i s c U s s i o n pA p E R s<br />
35<br />
• Families with no adult male, as in the case of widows<br />
with young children;<br />
• The elderly, where the male is too old to seek work;<br />
• Families where the male has some disability that<br />
prevents him from working.<br />
These families (generally the poorest, landless families<br />
in the community) do not possess the wherewithal to<br />
seek work elsewhere and family members are obliged to<br />
work locally as casual laborers within the community.<br />
In summary, temporary migration is an approach taken<br />
specifically by poor families with insufficient productive<br />
resources. It is however an approach that is not open to<br />
all such families for one reason or another.<br />
Temporary migration should not be confused with the<br />
traditional campesino practice of growing crops in<br />
several (not necessarily contiguous) ecological zones,<br />
involving family members being away from home for<br />
several weeks at a time.
36<br />
6. climAtE chAngE in<br />
BoliviA<br />
This chapter examines community views on recent<br />
manifestations of climate change in their areas and the<br />
change scenarios for the coming years.<br />
thE spEciAlists´ viEWpoints<br />
Numerous efforts are currently afoot in <strong>Bolivia</strong> to<br />
develop climate scenarios from climate modeling. The<br />
scale used by these models has gradually become more<br />
precise and projections therefore more reliable.<br />
In terms of temperatures, almost all the models 10 reveal<br />
that <strong>Bolivia</strong> will be hotter in the coming years, with<br />
average temperatures rising by between 0.8 and 3.9 0 C<br />
over the next 100 years (the IS92a scenario).<br />
In terms of rainfall, however, the scenarios are highly<br />
varied and at times contradictory. Some scenarios<br />
predict an increase in rainfall while others suggest less<br />
rainfall. Nevertheless, all the scenarios appear to concur<br />
on one point: that the rainy season will be shorter and<br />
more intense.<br />
viEWs of thE commUnitiEs<br />
Heirs to a rich tradition, <strong>Bolivia</strong>’s communities handle<br />
climate indicator systems which enable them to interpret<br />
the changes in natural phenomena for identifying<br />
changing trends and predicting climate variability.<br />
Given that this traditional practice is common to all<br />
the communities surveyed, the study opened a debate<br />
with the communities to try and identify past mediumand<br />
long-term climate change trends as a basis for<br />
projecting future climate scenarios.<br />
This discussions revealed that many of the climate indicators<br />
employed by traditional communities tend to be<br />
increasingly ineffective. Many asserted that it was no<br />
longer possible to predict weather patterns as in previous<br />
generations due to the climate change process<br />
(including greater climate variability). Regardless of the<br />
new scenario the communities nevertheless continue to<br />
pay close and regular attention to the climate, observing<br />
changes and new developments. Given that their livelihoods<br />
depend on the climate, the communities were in<br />
an excellent position to provide accurate descriptions of<br />
the changes observed over many years.<br />
chAngE tREnds in REcEnt<br />
yEARs<br />
One of the main conclusions of the study is that in all<br />
the communities, regardless of the ecosystems in which<br />
they survive, it would appear that the climate is changing.<br />
Communities, accustomed to living with climate<br />
variability, are now more concerned with the change<br />
trends in the climate. The change trends were precisely<br />
identified by our interlocutors and thus it was possible,<br />
10 In this paragraph we refer to the study undertaken by the PNCC in<br />
which a comparative analysis was done of the climatic models<br />
HADCM2, HKHI, GISSEQ, MAGICC y SCENGEN, employing<br />
three CO 2 emission scenarios: IS92a, IS92e, IS92c. The results were<br />
applied in a vulnerability study of <strong>Bolivia</strong>´s main ecosystems. See<br />
PNCC, Escenarios climáticos 2007.
d E v E l o p m E n t A n d c l i m A t E c h A n g E d i s c U s s i o n pA p E R s<br />
37<br />
using the process of participatory analysis, to construct<br />
climate scenarios for each community.<br />
increasing temperatures<br />
The majority of the communities considered that over the<br />
past 20–30 years temperatures had risen. They observed<br />
that the sun burns hotter and longer, that river water is<br />
warmer, that the earth is drier, and that wild fruit ripens<br />
quicker than before. Furthermore, they reported that<br />
animals, insects, plants, and crops more typical of warmer<br />
climes had begun to appear. The communities in the<br />
valleys and plains observed that the winters were less cold.<br />
Some comments are worth recording in this respect:<br />
• Now it is very hot and the sun burns down on us, particularly<br />
in the daytime in winter and<br />
spring. (Chaquilla Community<br />
Workshop, Altiplano).<br />
• By day the burning heat causes skin cancer and headaches.<br />
(Pucarani Community Workshop, Altiplano).<br />
• The sun is stronger, the soil is drier, new plant diseases are<br />
occurring. (La Silla Community Workshop, Valleys).<br />
• The heat brings more flies and mosquitoes in January<br />
and February. (Chapicollo Community<br />
Workshop, Valleys).<br />
On the other hand, the Altiplano communities reported<br />
increased frequency and intensity of frost (attributed to<br />
drier air).<br />
less Water<br />
Twelve of the 14 municipalities reported a trend toward<br />
decreased rainfall, and in most cases a shorter rainy<br />
season, with heavier precipitation than previously.<br />
The rains which used to begin in the first half of<br />
December now come in January [...] They always<br />
used to end in the first half of April but now they<br />
end in March. (Contorno Calacoto Community<br />
Workshop, Altiplano)<br />
[The rains] used to start in September but they<br />
now start in December and end in February, not<br />
in March, as previously. (Charagua Community<br />
Workshop, Chaco)<br />
The rains always began in September or October,<br />
whereas nowadays they begin in December or<br />
sometimes January. They used to end in May but<br />
now they stop earlier, in March. (El Puente<br />
Community Workshop, Valleys)<br />
Previously the rains began earlier, in the month of<br />
October, but they now start in November. It used<br />
to rain until April but now the rains stop in mid-<br />
March. (Yapacani Community Workshop,<br />
Plains)<br />
The indicators identified by communities, in addition to<br />
a shorter and heavier rainy season, showed lower levels<br />
of water in the rivers and catchment basins. Some of<br />
these were reported to have dried up altogether. A trend<br />
had also been towards less natural vegetation, falling<br />
crop yields, and early budding of trees.<br />
Only the municipalities of the Amazon (San Ignacio<br />
and San Pedro Moxos) reported the rainy season beginning<br />
earlier and ending later, together with heavier rainfall<br />
and flooding.<br />
In all the communities there was general agreement that<br />
rains were more torrential, with more water falling over<br />
shorter periods and causing erosion and flooding.<br />
other climate changes<br />
An increase of more frequent and intensive hailstorms<br />
was often mentioned in the course of our workshops. It<br />
was also stated that winds were stronger over recent<br />
years, attributed by the communities to a rise in deforestation<br />
and regarded by many as the cause of less rainfall,<br />
in the belief that higher winds were responsible for<br />
dissipating rain-bearing clouds.<br />
fUtURE climAtE scEnARios<br />
From their observation of trends over the past 20–30<br />
years, the communities identified future climate<br />
scenarios.<br />
major changes<br />
The most-cited trend was the increased frequency of<br />
drought. Twelve out of the 14 communities studied
38 thE sociAl dimEnsions of AdAptAtion to climAtE chAngE in BoliviA<br />
referred to this. One community in the Amazon opined<br />
that the future would bring heavier rainfall, concentrated<br />
into shorter times and interspersed with periods<br />
of drought.<br />
The future climate scenarios advanced by the communities<br />
predicted that drought would be the main problem<br />
(more heat and less water). Moreover the communities<br />
were particularly concerned that the future decline of<br />
water availability would go hand in hand with poorer<br />
distribution of this resource. The “Indian Summer”’<br />
short dry spells during the rainy seasons (veranillos)<br />
were forecast to be longer and more frequent, with the<br />
rains starting later and ending earlier, with more storms<br />
and torrential downpours.<br />
This perception by community dwellers coincides with<br />
climate scenarios developed from Global Climate<br />
Models (GCMs), which predict a future with more heat<br />
and more pressure on water resources. Annual rainfall in<br />
absolute terms is unlikely to diminish but will be<br />
concentrated in shorter periods of heavy rainfall.<br />
Figure 19 shows that 100 percent of the communities of<br />
the Altiplano, Valleys and the Chaco believe there will be<br />
a shortage of rain, while in the Plains 30 percent of the<br />
communities reckoned lack of rain would be a problem.<br />
The reduced and increasingly intense rainy season is the<br />
main change identified by all the communities in<br />
<strong>Bolivia</strong>´s four macro-regions, particularly by communities<br />
located in the Plains region. Meanwhile, the<br />
communities in the Amazon part of the country predict<br />
heavier rainfall accompanied by increased flooding.<br />
figURE 19. climAtE scEnARios<br />
idEntifiEd By commUnitiEs<br />
100%<br />
90%<br />
80%<br />
70%<br />
60%<br />
50%<br />
40%<br />
30%<br />
20%<br />
10%<br />
0%<br />
other climate changes<br />
Rainfall scenarios<br />
Highlands Dry lowland Valleys Plains<br />
Changes in rainfall cycle Increased rainfall intensity Rainfall scarcity<br />
Virtually all the communities in our study considered<br />
that wind frequency, duration, and intensity would<br />
increase, causing severe damage mainly in the Chaco<br />
and Plains, especially in areas where the windy period<br />
coincides with harvest time.<br />
While the Altiplano communities believe that periods<br />
of frosty weather are likely to increase in frequency and<br />
intensity, communities in the Chaco, the Plains and the<br />
Valleys regions predict decreased frost.<br />
According to three of the four communities interviewed<br />
in the Valleys region, hailstorms are likely to be more<br />
frequent, and fears were raised about possible calamitous<br />
crop losses as a result.
39<br />
7. thE impActs of climAtE<br />
chAngE<br />
The study called for communities to reflect on the<br />
possible impacts of climate change on their livelihoods<br />
id the prioritized scenarios become reality. We regarded<br />
this as a necessary methodological requirement, involving<br />
a hypothetical and general rather than quantified<br />
approach, in order to gain an idea of how adaptation<br />
measures could be envisaged and formulated. The<br />
following sections are not therefore an examination of<br />
the impacts of climate change (which falls into a different<br />
category and which we believe would be very interesting<br />
to undertake), but rather reflect the outcomes of<br />
discussions with the campesinos about the ways they<br />
themselves saw future scenarios. Analyzing the results is<br />
an interesting exercise because it helps toward a better<br />
understanding of the adaptation measures prioritized by<br />
the campesinos.<br />
thE EffEcts And impActs of<br />
dRoUght<br />
According to the campesinos, water shortages have<br />
multiple effects on communities. The results of our<br />
discussions in the 14 communities are presented in the<br />
following table:<br />
decrease or loss of crops<br />
All the communities were aware of the immediate<br />
effects of drought: the loss or decline of crop and livestock<br />
production. Prolonged drought involves total loss<br />
tABlE 20. EffEcts And impActs of<br />
dRoUght<br />
Effect or impact<br />
Communities<br />
Effects decrease or loss of production 100%<br />
loss of genetic material 86%<br />
less food eaten 100%<br />
less water drunk 54%<br />
less hygiene 46%<br />
impacts lower incomes 100%<br />
Source: Community Workshops<br />
children’s education affected 62%<br />
more family illnesses 100%<br />
of the harvest, while “normal” periods of drought generally<br />
lead to decreased yields. Ten of the 14 communities<br />
reported experiencing severe drought over the past 30<br />
years.<br />
This can be confirmed by the Agronomy Component<br />
Study which stated that drought years (the dry scenario)<br />
would cause significant decreases in the yields of all the<br />
crops studied (see Table 21):<br />
Citing a study by the Pan American Health<br />
Organization (PAHO), the PNCC estimates that the<br />
1983 drought led to a loss in <strong>Bolivia</strong>´s productive sector<br />
of around US$1,174 million dollars, equivalent to over<br />
15 percent of total GDP and 50 percent of agricultural<br />
GDP.
40 thE sociAl dimEnsions of AdAptAtion to climAtE chAngE in BoliviA<br />
tABlE 21. EffEcts of climAtE<br />
chAngE on yiElds (dRy scEnARio)<br />
crop<br />
potatoes<br />
corn<br />
Quinoa<br />
loss of seeds<br />
decreased production<br />
decreased production<br />
decreased production<br />
Source: Agronomy Component Study<br />
According to our surveys, given the small size of the<br />
crops managed by smallholder campesinos, the losses<br />
caused by drought forced families to consume their<br />
entire harvested crop, including the portion normally<br />
reserved for seeding in the following season.<br />
In the Qhawasiri Community (Valleys), for example,<br />
the 1983 drought was so severe that virtually all the<br />
seed potatoes were lost and the menfolk were forced to<br />
seek jobs in the cities to obtain the money needed for<br />
purchasing new seeds. In the aftermath of the drought<br />
demand for seeds was such that prices increased significantly.<br />
The generalized shortage of potato seeds led to<br />
new foreign varieties being imported which caused the<br />
spread of previously unknown diseases, blight and parasites<br />
such as the white grub locally known as lagartu.<br />
Thus, one of the major consequences of drought is the<br />
loss of genetic material, with many species<br />
and varieties disappearing from vast regions of the<br />
country and in many cases in danger of extinction.<br />
famine<br />
The communities also revealed that drought had an<br />
immediate and direct effect on the amount and quality<br />
of food available for human consumption. The community<br />
workshops without exception all referred to<br />
drought as being synonymous with famine, although<br />
this did not affect everyone uniformly. However, falling<br />
harvests as the result of drought tended to affect most<br />
families, causing hunger, while a small proportion of<br />
families (the ‘less poor’), managed to escape the worst<br />
effects. Drought for the latter involved using up the<br />
money or food they had managed to put aside for this<br />
eventuality.<br />
As indicated in Tables 22 and 23 above, yield reduction<br />
affects everyone, but particularly the “poor” and “average”<br />
campesinos, whose production fails to supply them<br />
with enough to eat or store. The “average” campesino<br />
family cultivating three acres per year will see their agricultural<br />
income drop due to drought from US$4,725 to<br />
US$3,465, which is insufficient to cover their consumption<br />
expenditure of US$ 3,918 and resulting in a net<br />
loss of around US$450, meaning the family would need<br />
to supplement its income with other income-producing<br />
activities in order to maintain its<br />
tABlE 22. fAmily incomE in noRmAl yEARs (pAmpAjAsi commUnity)<br />
Units “Poor” Campesinos “Average” Campesinos “Rich” Campesinos<br />
Average yield (*) Us$/ha 1,400 2,100 2,800<br />
input unit Us$/ha 350 525 700<br />
Added value Unit Us$/ha 1,050 1,575 2,100<br />
cultivated area ha 2 3 4<br />
total value added Us$ 2,100 4,725 8,400<br />
household consumption (**) Us$ 3,134 3,918 4,701<br />
saving Us$ –1,034 807 3,699<br />
Source: Data from Enquiry Form 4.<br />
(*) Average yield of major crops (potato, barley) in normal years.<br />
(**) Extrapolated from UNDP data (2001 HDI), Pucarani Municipality.
d E v E l o p m E n t A n d c l i m A t E c h A n g E d i s c U s s i o n pA p E R s<br />
41<br />
tABlE 23. fAmily incomE And dRoUght-REdUcEd yiElds of 20 pERcEnt<br />
(pAmpAjAsi commUnity)<br />
Units “Poor” Campesinos “Average” Campesinos “Rich” Campesinos<br />
potato equivalent yield Us$/ha 1,120 1,680 2,240<br />
input unit Us$/ha 350 525 700<br />
value added Us$/ha 770 1,155 1,540<br />
cultivated area it 2 3 4<br />
total value added Us$ 1,540 3,465 6,160<br />
household consumption (**) Us$ 3,134 3,918 4,701<br />
saving Us$ –1,594 –453 1,459<br />
Source: Data from Enquiry Form 4.<br />
(*) Average yield of major crops (potato, barley) in dry year.<br />
(**) Extrapolated from UNDP data (2001 HDI), Pucarani Municipality.<br />
level of consumption. But, as explained by the families<br />
interviewed, during a drought many people migrate in<br />
search of work, and wages tend to fall in view of the<br />
competition for jobs, As a result, the migrants fail to<br />
achieve sufficient cash to offset the family´s losses. Such<br />
families have no other choice but to reduce food<br />
consumption. 11<br />
In the drought we have less food all round: fewer<br />
beans, less corn, less kumanda. We simply have to<br />
make do by drinking less milk and eating less meat<br />
(San Francisco Community Workshop, Chaco.)<br />
In times of drought production tails off and we<br />
have less to eat. We have to buy food from the city<br />
which is less nutritious. You simply eat less meat<br />
and cheese. (El Puente Community Workshop,<br />
Valleys).<br />
decreased income<br />
All of the communities indicated to our researchers that<br />
drought causes a drop in incomes owing to reduced or<br />
lost agricultural and livestock production. Some<br />
communities also reported that even handicrafts<br />
production was affected by the drought.<br />
There are no surplus agricultural products to sell.<br />
(Chapicollo Community Workshop,<br />
Vitichi, Valleys)<br />
The sale of animals such as goats and sheep falls<br />
off. (Caña Cruz Community Workshop, El<br />
Puente, Valleys)<br />
Significant decreases in homemade clothing items<br />
made from our camelid wool. ( Jila Uta Manasaya<br />
Community Workshop, Carangas Curawara,<br />
Altiplano)<br />
disease<br />
In all the communities surveyed drought was reported<br />
to be the cause of disease (mainly a variety of infections<br />
and diarrhea) resulting from undernourishment and<br />
from drinking stagnant and polluted water.<br />
Drought affects the health and welfare of all of us.<br />
People here are eating less and badly. (Chaquilla<br />
Community Workshop, Porco Municipality)<br />
62 percent reported that drought had a negative effect<br />
on children’s education for two reasons: malnourished<br />
children were unable to learn properly and children<br />
ceased going to school in order to assist their parents to<br />
deal with problems caused by drought.<br />
11 A study undertaken in the valleys during the 1998 drought reveals that<br />
it is the poorest families who are forced to reduce their levels of<br />
consumption—cutting down on the number of daily meals. Morales et<br />
al. 2001: Estrategias campesinas para enfrentar la sequia. Page 92. PIEB.
42 thE sociAl dimEnsions of AdAptAtion to climAtE chAngE in BoliviA<br />
Children cannot learn on a virtually empty stomach.<br />
(Chapicollo Community Workshop,<br />
Vitichi Municipality, Valleys).<br />
sEctoRs WoRst AffEctEd By<br />
dRoUght<br />
The families in the lowest socioeconomic strata are the most<br />
affected by drought. They are more susceptible to the effects<br />
of drought since: (i) they farm only rainfed land; (ii) their<br />
land is more drought-susceptible, being short of organic<br />
matter and with low moisture retention; and (iii) they are<br />
short of resources for coping with drought, possess only<br />
small plots for growing a limited amount of crops and have<br />
no reserves to get them through the bad years.<br />
Our interviews revealed that the worst affects of drought<br />
are suffered by families who depend on the rainfed cultivation<br />
of potatoes. The campesinos knew that the potato<br />
is a crop requiring plenty of water and that water shortages<br />
were bound to have a more negative effect on it than<br />
on other crops. The loss of a potato crop is expensive, not<br />
only because the price fetched by the sale of potatoes is<br />
normally relatively high (and the losses correspondingly<br />
greater), but also because inputs (especially seed) cost<br />
significantly more than for other crops. Families who had<br />
lost their seed potatoes during a drought reckoned that it<br />
took two to three years to recover them.<br />
My potato crop is not what it was before the drought<br />
three years ago. I still do not have enough seed potatoes<br />
to go round. But I am slowly recovering, working<br />
in partnership with others who do have seeds.<br />
( Julio Padilla, Kanalla Community, Valleys).<br />
Other livelihoods that are seriously affected by drought<br />
are those based on extensive livestock farming. Drought<br />
causes a decrease of native vegetation, particularly grassland<br />
fodder, due mainly to grass being slow to re-sprout<br />
after the winter and also to the fact that in the veranillos<br />
(dry spells during the rainy season) the grass grows<br />
much slower. It follows that animals have less grass to<br />
graze on. Drought also causes springs and river catchment<br />
areas to dry up, thereby forcing cattle to cover<br />
long distances in search of water.<br />
Severe droughts cause not only the decline of livestock<br />
productivity but also the deaths of large numbers of<br />
animals and, for the campesinos, the destruction of<br />
productive capital. After periods of drought, campesinos<br />
who had who lost their herds were generally forced to<br />
look elsewhere for work.<br />
Many people who lost their cattle had to go and<br />
live somewhere else. Some went to Chile, others<br />
went to work in the mines. It is difficult to get a<br />
herd together again. Where would we find the<br />
money (Gregorio Alvarado, Uta Manasaya Jila<br />
Community, Altiplano)<br />
EffEcts And impActs of<br />
flooding<br />
Two communities in the sample discussed the effects<br />
and impacts of floods. Both communities argued that<br />
flooding leads to:<br />
• A drop in eating and living standards due to the<br />
loss of crop and livestock production, the difficulty<br />
of obtaining forest products, and from drinking bad<br />
water.<br />
Floods strongly affect food security because of<br />
crop losses. On the other hand we are forced to<br />
drink contaminated water. (Valparaiso<br />
Community Workshop, San Pedro, Plains)<br />
• Significant flood damage to homes caused by<br />
humidity and sludge;<br />
• Absenteeism at school because children are unable<br />
to attend school at peak flood times.<br />
During the flood families temporarily move to<br />
other places. Classes are cancelled until the flood<br />
subsides, the rains end and the mud dries up<br />
(Valparaiso Community Workshop,<br />
San Pedro Municipality)<br />
• Spread of diseases such as malaria, diarrhea,<br />
malaria, fever and “evil eye” (conjunctivitis).<br />
fAmiliEs hARdEst hit By<br />
flooding<br />
In the communities studied it was reported that flooding<br />
affected everyone’s houses and plots of land. Those
d E v E l o p m E n t A n d c l i m A t E c h A n g E d i s c U s s i o n pA p E R s<br />
43<br />
tEstimony of AidéE gimEnEZ, pREsidEnt of thE indiAn sUBcEntRAl<br />
cERcAdo, BEni<br />
Climate change for us is very serious since it brings more flooding. Over the last ten years we have had three major floods which have<br />
flooded communities and places that were never flooded before. My whole community is now under water - in some places it is up to a<br />
meter deep. Previously the floods were short but after five or six days things got back to normal. But now the water is with us for four<br />
months.<br />
The water dries up after the flood leaving a layer of white clay on the ground. This prevents us from growing anything in the soil. Some say<br />
that this clay can be an advantage, but you have to know how to deal with it.<br />
Flooding seriously affects our plantation. We planted chocolate trees but after a couple of years the water came and ruined them. The<br />
trunks and roots have all been eaten by insects. The same happened with our banana plantations. It looks like the insects have nowhere to<br />
live except in the roots of our trees and plants.<br />
The bigger floods also kill off our fish. Flash floods bring everything to the ground: tree leaves and branches, and after a few days all the<br />
vegetation starts rotting and smelly water gets everywhere. I reckon that that is what kills off the fish.<br />
with motor boats coped better since they were able to<br />
transfer their families and animals to other communities<br />
or move to higher ground. Families without boats,<br />
including the poorest members of the community, had<br />
to rely on assistance from neighbors.<br />
I have a small boat and when the floods hit the<br />
community I was able move my family and pigs to<br />
Agua Dulce [a neighboring community that was<br />
not flooded], because around here there was a lot of<br />
mud and water. (Interview with the family of<br />
Vicente Moreno, Valparaiso Community,<br />
Plains Region)<br />
In the flood we had to make a high ‘chachapa’ (a<br />
high wooden pen) next to the guava tree to protect<br />
our animals [...] many of them drowned.<br />
(Interview with Sanginez Marina, Valparaíso<br />
Community, Plains Region)<br />
EffEcts And impActs of<br />
WARming<br />
Our study was also able to identify the effects in some<br />
communities of gradual climate warming. We found<br />
that warming had a number of negative effects on<br />
communities in the cold and temperate regions but was<br />
not a serious concern in the warmer areas. Of note was<br />
the fact that the gradual increase in temperatures over<br />
recent years had brought about major changes in<br />
people’s livelihood strategies, either gradually over time<br />
or more rapidly from one year to the next.<br />
One example of gradual climate warming was in the<br />
communities growing potatoes as their main source of<br />
subsistence, where climate change was gradually<br />
producing changes in the potato varieties. The traditional<br />
Andean species, usually grown in a long cycle,<br />
were being slowly replaced by Dutch potato varieties<br />
(short-growth cycle mainly for use as French<br />
fries). This change was observed in interviews with all<br />
potato growing families, both the Valleys Region and in<br />
the Altiplano. Communities reported that the acreage<br />
under Dutch varieties was increasing year by year at the<br />
expense of the local traditional potato species.<br />
A further example, reported by all the communities in<br />
the Altiplano and Valleys Regions, is that livestock<br />
systems are altering as the result of reduced pasture<br />
availability. This was reported by all the communities in<br />
the Altiplano and Valleys regions. According to the<br />
campesinos, pastures were requiring more water as the<br />
climate heated up and sprouting was delayed after the<br />
end of winter. The upshot was that animals were unable<br />
to find the same amount of grass to eat and had taken<br />
to chewing grass roots, which obviously had negative<br />
effects on pasture recovery times. Due to lack of available<br />
food, the number of animals kept per family had<br />
begun to decline, causing food shortages in families and<br />
a manure deficit for fertilizing crops.
44 thE sociAl dimEnsions of AdAptAtion to climAtE chAngE in BoliviA<br />
ABAndoning thE lAnd in thE ovEjERíA commUnity<br />
What was the effect of climate warming: The community of Ovejería (rainfed hillside grain cultivation), was practically abandoned. Almost<br />
everyone moved away, leaving only a few old people. The main reason is that over recent years wheat and barley production fell so much<br />
that families could not feed themselves properly. The climate is very dry in this community.<br />
Where were these people: Most of the younger people left for the city, while others went to work as laborers in Rio Chico where crops are<br />
grown under irrigation.<br />
how do the remaining members of the old community live: In the community of Ovejería there are only a few goats left, being looked after<br />
by elderly people. Many years ago, when there was more grass in this community we raised sheep. Around 20 years ago we began to lose<br />
the sheep and started raising goats instead.<br />
(interview with marcial vargas, agronomist)<br />
In the Valleys goats were reported to have begun to replace<br />
sheep, which require more and better quality forage.<br />
When I was young we had lots of animals at<br />
home—around 200 sheep and goats. Now have<br />
only 40. The problem is that animals have been<br />
dying from external parasites and<br />
disease. Previously we also had these problems but<br />
the animals were stronger and more resistant in<br />
those days, as well as bigger and<br />
fatter. (Leonardo Ibarra, La Sillada)<br />
An example of abrupt change due to warming concerns<br />
crops (grains) grown on the valley slopes. As the result of<br />
higher temperatures and water shortages average yields<br />
were reported to have fallen. The decline in production<br />
was so great that some families decided to give up and<br />
leave their land. In the Pueblo Abajo community (Sicaya,<br />
Valleys region), for example, three of the five families<br />
interviewed were originally from other hillside communities<br />
and had been forced to leave because the climate was<br />
so dry that they were unable to harvest enough to live on.<br />
sEnsitivity of livElihood<br />
stRAtEgiEs to climAtE chAngE<br />
The responses in our community workshops enabled us<br />
to draw up a list of livelihood strategies based on the<br />
tABlE 24. sEnsitivity of livElihood stRAtEgiEs to dRoUght<br />
Sensitivity Livelihood strategy Effect of drought<br />
high Rainfed agriculture Water stress causing yield reduction<br />
livestock farming<br />
Average Agricultural employment Reduced job opportunities<br />
irrigated agriculture<br />
intensive livestock<br />
Agriculture-related services and<br />
commerce<br />
forestry<br />
low Agricultural employment fewer jobs<br />
services and non-agricultural trade<br />
loss of vegetation, shrinking water supplies, causing food shortages, loss of<br />
productivity, death of livestock.<br />
Reduced irrigation flow, reduced yields<br />
higher cost of fodder, water shortages<br />
decrease in incomes due to reduced agricultural production<br />
Reduced density of exploitable species<br />
less activity due to reduced incomes of customers.
d E v E l o p m E n t A n d c l i m A t E c h A n g E d i s c U s s i o n pA p E R s<br />
45<br />
tABlE 25. sEnsitivity of livElihood stRAtEgiEs to flooding<br />
Sensitivity Livelihood strategy Effect of flooding<br />
high Rainfed and irrigated agriculture floods cause loss of the harvest and depending on their intensity, loss of soil<br />
cover.<br />
intensive and extensive livestock<br />
raising<br />
forestry<br />
Average services and agriculture-related trade demand reduction<br />
low Agricultural and non-farm employment fewer jobs<br />
services and non-agricultural trades<br />
loss or deterioration of infrastructure<br />
loss of livestock and decreased productivity<br />
displacement, reduced density of exploitable species.<br />
demand reduction<br />
Source: Community Workshop Enquiry Form 03.06<br />
respondents´ level of sensitivity to the twin problems of<br />
drought and flooding, which according to the communities,<br />
are the most likely manifestations of climate<br />
change in the future.<br />
In summary, in the opinion of the campesinos, all livelihoods<br />
will be affected to one degree or another by<br />
climate change—some of them less affected, some more.<br />
Livelihood strategies that are most likely to suffer are<br />
those that are directly dependent on climatic conditions<br />
such as rainfed agriculture, rainfed livestock raising, and<br />
forestry. Strategies which combine these farming<br />
activities with others such as non-agricultural jobs,<br />
trades, and service supply will probably be less affected.<br />
The strategies less vulnerable to climate change tend to<br />
be those that are not based on agriculture. For families<br />
with non-agriculture strategies (wage earners, traders, and<br />
those with jobs in the transport sector) their activities will<br />
marginally affected, but any shortfalls can probably be<br />
easily met in other ways. In the case of wage-earning<br />
employees, their salaries are unlikely to be affected, but<br />
their purchasing power could well be reduced on account<br />
of generalized price increases caused by drought.
46<br />
8. AdAptAtion to climAtE<br />
chAngE<br />
lEssons fRom thE pAst<br />
The following paragraphs are an account of the<br />
responses given in family interviews regarding climate<br />
change. These serve as a basis for formulating practical<br />
and concrete adaptation measures.<br />
Responses to extreme weather events<br />
The study focused on the responses of the 70 families<br />
interviewed to past climatic events. Families were questioned,<br />
for example, on what action they took in the<br />
event of drought, hailstorms, frost, or flooding.<br />
Fifty percent of the families surveyed claimed that in<br />
such circumstances they maintained their same life<br />
patterns but tended to cut down consumption and draw<br />
on their reserves. Among these families were (i) those<br />
not significantly affected by the climate event and<br />
(ii) those who were unable to react to the event. The<br />
former were generally the “richest” families, possessing<br />
plenty of good irrigated land and a level of agricultural<br />
production which would help them to survive. They<br />
were also invariably the families who had access, apart<br />
from farming, to other activities that were not totally<br />
dependent on climate change, such as outside jobs,<br />
trade, and processing value-added items for sale.<br />
The second category were generally the poorest in the<br />
community, comprising elderly people, single women, etc.,<br />
with scarce resources and who often were either unable to<br />
work or prevented from migrating or seeking a new<br />
economic activity. These people were apt to endure the<br />
hardship resulting from adverse weather events thanks to<br />
help received from neighbors and other family members.<br />
The following statements are examples of how extreme<br />
events affect the poorest families in the communities.<br />
The case of Juana´s family (37 years old): My main occupation<br />
is supplying milk. I have a number of cows and also<br />
go from house to house collecting milk for selling to the dairy.<br />
During the drought milk production fell by half because of<br />
the lack of forage. We had to manage on a reduced income.<br />
I have no husband, my children are too small to work and<br />
I was not in a position to leave my home. ( Juana Mamani,<br />
Jasi Pampa Community, Pucarani Municipality,<br />
Altiplano)<br />
The case of Evaristo´s family (68 years old): We live off<br />
rice, maize and cassava production (3 hectares), and the<br />
vegetables grown by my wife. We could do nothing when the<br />
drought came and simply waited for the next year in order<br />
to start again. Luckily we survived on vegetables which we<br />
were able to irrigate with the little water available to us.<br />
(Evaristo Flores, San Isidro Community, Yapacaní<br />
Municipality)<br />
The other 50 percent of respondents claimed that they<br />
took some form of action in the face of adverse climatic<br />
events. The responses were varied: Some claimed to<br />
have adopted new economic activities as part of their<br />
livelihood strategies, some decided to migrate to other<br />
areas, while others devoted themselves to improving<br />
their traditional farming methods.
d E v E l o p m E n t A n d c l i m A t E c h A n g E d i s c U s s i o n pA p E R s<br />
47<br />
figURE 20. REsponsEs to climAtE<br />
hAZARds<br />
Temporary<br />
migration<br />
36%<br />
Agricultural<br />
commercialization<br />
and employment<br />
17%<br />
Traditional management<br />
practices<br />
25%<br />
Other<br />
3%<br />
Agricultural<br />
improvements<br />
9%<br />
Water<br />
management<br />
10%<br />
Of the 36 per cent of families who resorted to temporary<br />
migration, these were generally families who in<br />
normal circumstances would not migrate but who were<br />
obliged to do so in order to offset losses 12 . In emergencies<br />
such as prolonged drought, temporary migration<br />
generally involved people heading for the cities rather<br />
than to the traditional farming areas, which were also<br />
likely to be affected by drought.<br />
Most respondents viewed migration as their preferred<br />
temporary measure for the following reasons:<br />
• fewer mouths to feed in the community;<br />
• the possibility of earning sufficient cash to cover<br />
urgent needs;<br />
• opportunities to secure enough to avoid selling animals<br />
or divesting other capital assets for the duration<br />
of the emergency.<br />
The case of the Victor´s family (35 years):<br />
We grow mainly bananas, rice, maize, and<br />
cassava. Our main problem during last year’s flood<br />
was to find a place to shelter. We had to get rid of<br />
animals and find some other way of earning a<br />
living in the neighboring city of Riberalta. My<br />
whole family went. For three or four months I<br />
worked as a building laborer. It was not like that<br />
in the old days. (Victor Yanam, Valparaiso<br />
Community, San Pedro Municipality)<br />
Regarding the approximately 17 percent of the remainder<br />
who developed new activities such as making handicrafts,<br />
getting a local paid job, setting up a small<br />
business, or who migrated temporarily, the result was<br />
that over half the community was forced to find some<br />
form of new activity in order to offset further losses<br />
caused by climate hazard.<br />
The other 50 percent of the families made an effort to<br />
incorporate improvements in their traditional occupations<br />
by installing irrigation, developing more productive<br />
farming techniques, improving infrastructure, or<br />
simply by selling their animals or using up their savings.<br />
Simon´s case (58 years): We raise llamas and<br />
sheep and also grow a few crops on our small<br />
plots. During the last drought I had to leave home<br />
in order to seek work in the mining town of Porco<br />
while I left my wife and my children to care for<br />
the animals. We also had to sell some of the<br />
animals to have enough money to buy food. Our<br />
children who live in the city also helped us out a<br />
bi, by sending money home. (Simón Choque,<br />
Chaquilla Community, Porco Municipality)<br />
Meanwhile, around 25 percent of all the families and the<br />
community resorted to traditional rituals in cases of<br />
emergency such as praying for rain, building fires against<br />
frost, sending up fireworks against hailstorms, etc.<br />
Autonomous changes in production systems<br />
The climatic changes occurring in communities—identified<br />
primarily as higher temperatures, lower rainfall<br />
and recurring floods—are not a recent phenomenon but<br />
have come about gradually over several years, accompanied<br />
by gradual and spontaneous (unplanned) adaptation<br />
to production systems. These autonomous changes<br />
were identified and analyzed in the community workshops<br />
and provided the basis for the formulation of<br />
adaptation measures. The main trends were the<br />
following:<br />
• installing irrigation<br />
• changing varieties and species of crops<br />
12 Morales et al. Estrategias campesinas para enfrentar la sequía, page 98
48 thE sociAl dimEnsions of AdAptAtion to climAtE chAngE in BoliviA<br />
• changing to different breeds of animals<br />
• changing animal husbandry systems<br />
• converting pasture into crop land<br />
• abandoning land<br />
• undertaking a variety of different economic activities<br />
(“pluriactivity”)<br />
• protecting infrastructure<br />
• relocating homes.<br />
Table 26 provides a detailed description of the main<br />
changes identified in the communities.<br />
It is worth noting that these changes occurred with no<br />
support from the state or other institutions, and came<br />
about at the initiative (and cost) of the families themselves<br />
in an empirical manner without previous planning.<br />
In common with any innovation in all rural<br />
communities, this process took place over a number of<br />
years, based on the “trial and error method,” where new<br />
ideas are incorporated and consolidated only after they<br />
have been proven to produce good results. Municipal<br />
governments and institutions, at the request of<br />
communities, have been persuaded to use some of<br />
these ideas to execute irrigation and infrastructure<br />
protection projects (implemented in five of the<br />
communities studied).<br />
At the participatory design stage of climate change<br />
adaptation measures, communities were fully aware of<br />
the above trends and initiatives but were also prepared<br />
to incorporate other measures based on information<br />
acquired as a result of the experiences of neighboring<br />
communities.<br />
AdAptAtion mEAsUREs<br />
As explained in Chapter 1 (Scope and Methodology<br />
of the study) we used Participatory Analysis for<br />
designing adaptation measures for the prioritized<br />
climate scenarios. The communities began by<br />
constructing future climate scenarios based on the<br />
analysis of change trends observed over the previous<br />
20–30 years and on projections from general circulation<br />
models. An analysis was then done of the possible<br />
effects and impacts of climate change on family livelihood<br />
systems. Using their past experience, the<br />
communities were then able to identify possible<br />
measures for adapting to different climate<br />
scenarios. Each of the measures identified was<br />
discussed in community workshops and focus groups<br />
and subsequently subjected to a prioritization process.<br />
The process of analysis and discussion in each community<br />
was undertaken with the support of technical staff<br />
trained to encourage forthright discussion without<br />
asking leading questions (i.e., inducing obvious<br />
responses from interviewees).<br />
classification of Adaptation measures<br />
A total of 134 adaptation measures was identified in the<br />
communities, with an average of nine measures per<br />
community. As will be seen below, these are highly<br />
concrete measures in line with the real situation of each<br />
community and genuinely reflect a particular community’s<br />
real needs, the number of beneficiaries, local cultural<br />
criteria, previous experiences, etc.<br />
With a view to identifying trends, these diverse and<br />
complex measures were divided into eight categories:<br />
• Water management<br />
• Infrastructure<br />
• Livestock improvement<br />
• Agriculture improvement<br />
• Environmental management<br />
• Advice and training<br />
• Credit and financing<br />
• Value added activities (processing) and employment<br />
Water management measures<br />
Water management measures basically consist of installing<br />
water storage infrastructure to facilitate water<br />
supply for human use. Three subcategories were<br />
identified:<br />
1. Use of existing water resources: Building infrastructure<br />
(dams, etc.) to harness available water sources<br />
such as rivers, water catchment areas, and underground<br />
aquifers.<br />
2. Rainwater harvesting: building infrastructure to<br />
capture and store rainwater, involving the construction<br />
of artificial reservoirs and atajados (small<br />
dams) and providing facilities for harvesting roof<br />
water.
tABlE 26. spontAnEoUs chAngEs in REsponsE to climAtE chAngE<br />
Measure Description Stratum Livelihood strategy Macroregion<br />
Installation of irrigation<br />
Changes of species and<br />
varieties of crops<br />
Changes in animal species<br />
and breeds<br />
Changes in farming systems<br />
Grazing areas are converted<br />
into cropland<br />
Land abandonment<br />
‘Pluriactivity’<br />
Infrastructure protection<br />
construction of systems to exploit available water<br />
sources. small-scale systems owing to the costs of the works<br />
involved and the limited availability of water sources.<br />
introduction of new shorter-cycle varieties and species<br />
resistant to drought, to allow later planting before the late<br />
rains and to earlier harvesting at the end of the shorter rainy<br />
season<br />
introduction of breeds and species requiring less or lower<br />
quality fodder and which are more drought tolerant, such as<br />
goats and llamas, to replace sheep and alpacas<br />
in view of the gradual deterioration of grazing pastures a<br />
trend exists towards switching from extensive livestock<br />
raising to semi-stabled systems using cultivated forage and<br />
concentrated feeds (mainly for dairy and fatstock cattle).<br />
the ‘bofedales’ (permanently damp areas with grass cover in<br />
Altiplano communities), previously exclusively used for<br />
grazing, are converted into crop land due to the lower<br />
incidence of frost, dried up water sources and grass cover<br />
degradation.<br />
Abandonment of lands prone to drought, with little organic<br />
matter or which retain limited amounts of moisture; usually<br />
located on steep slopes and hills.<br />
incorporation of new activities in campesino livelihood<br />
strategies, in addition to the main activities. these include<br />
temporary migration, trades (bricklayer, blacksmith etc), and<br />
services provision (setting up a shop, selling food etc)<br />
construction of flood control defenses against flooding and<br />
flash floods along the rivers.<br />
“Rich” campesinos with<br />
capital<br />
All strata<br />
“Average” and “poor”<br />
campesinos<br />
“Rich” campesinos with<br />
capital<br />
All strata<br />
All strata, but mainly the<br />
“poor” campesinos working<br />
land that is more<br />
vulnerable to drought<br />
“Average” and “poor”<br />
campesinos<br />
“Rich” campesinos with<br />
capital resources<br />
Housing relocation Relocating homes in places less exposed to flooding “Rich” campesinos with<br />
capital resources<br />
strategies based on<br />
rainfed agriculture<br />
strategies based on<br />
rainfed agriculture<br />
strategies based on<br />
extensive livestock<br />
raising<br />
strategies based on<br />
rainfed agriculture<br />
and extensive<br />
livestock raising<br />
strategies based on<br />
extensive livestock<br />
raising<br />
strategies based on<br />
rainfed agriculture<br />
strategies based on<br />
rainfed agriculture or<br />
livestock raising<br />
All<br />
All<br />
Altiplano, valleys, plains<br />
Altiplano, valleys<br />
valleys (goats)<br />
Altiplano (llamas)<br />
All macro-regions with<br />
communities near to cities<br />
Altiplano, in communities that<br />
have humid ‘bofedales’<br />
All macro-regions, mainly in the<br />
semi-tropical valleys<br />
All macro-regions<br />
flood-prone communities<br />
plains<br />
d E v E l o p m E n t A n d c l i m A t E c h A n g E d i s c U s s i o n pA p E R s<br />
Source: Community workshops, family interviews<br />
49
50 thE sociAl dimEnsions of AdAptAtion to climAtE chAngE in BoliviA<br />
tABlE 27. ExAmplEs of mEAsUREs foR BEst UsE of Existing WAtER<br />
REsoURcEs<br />
Macro-region Municipality Community Measure<br />
chaco charagua san francisco micro-irrigation system construction and making use of river water<br />
Altiplano carangas curahuara Uta jila manasaya drilling wells and installing hand pumps for drinking water<br />
valleys saipina oconi construction of a storage dam on the river oconi<br />
valleys vitichi chapicollo Underground storage tank 1<br />
1. This measure is in reality a very ancient traditional practice which consists of burying in the bed of the quebradas (small rivers which run only when it rains) a<br />
large tank for storing water. This resembles a swimming pool with a lid on it and is buried a few meters deep under the sand. The device has porous walls<br />
through which the water is captured and a small aperture at the top where water can be extracted with the use of buckets. The people in the communities<br />
recount that their ancestors always used this method but that the younger generation are not familiar with it.<br />
tABlE 28. ExAmplEs of RAinWAtER hARvEsting<br />
Macro-region Municipality Community Measure<br />
Altiplano carangas curahuara Uta jila manasaya construction of atajados for the irrigation of bofedales<br />
valleys tarvita la silla construction of 50 earth atajados with capacity of 4000c.m.<br />
3. Improvement and expansion of existing water systems:<br />
infrastructure and equipment to expand water capture<br />
capacity and distribution systems with a view<br />
to avoiding future shortages. Improvement initiatives<br />
include training and the provision of facilities<br />
and equipment to make more efficient use of water<br />
such as pumping systems, improved piping layouts,<br />
and other efforts to prevent irrigation water losses.<br />
infrastructure measures<br />
Infrastructure measures include building infrastructure<br />
and providing defenses to protect against erosion or<br />
flooding, and ensuring that schools and homes are built<br />
in areas free from flooding.<br />
measures to improve livestock<br />
These measures involve helping small farmers to<br />
introduce livestock that is more suitable to the impacts<br />
of climate change. Two subcategories can be<br />
identified:<br />
1. Changes to the livestock raising system: infrastructure,<br />
training and equipment; introduction of new species<br />
and breeds better adapted to drought; and<br />
tABlE 29. ExAmplEs of impRovEmEnt oR ExpAnsion of Existing<br />
systEms<br />
Macro-region Municipality Community Measure<br />
chaco charagua san francisco Upgrading and expansion of drinking water system<br />
chaco villa vaca guzman Aguayrenda Repairs to tapping point, construction of holding tank and installation<br />
of pressurized irrigation<br />
plains yapacani August 15 Emergency repairs to drinking water system and education center
d E v E l o p m E n t A n d c l i m A t E c h A n g E d i s c U s s i o n pA p E R s<br />
51<br />
tABlE 30. ExAmplEs of infRAstRUctURE UpgRAding AdAptAtion<br />
mEAsUREs<br />
Macro-region Municipality Community Prioritized action<br />
plains yapacani san isidro construction of condorito Bridge<br />
plains yapacani san isidro construction of social housing<br />
plains yapacani August 15 Reconstruction of 5 km of the 15 de Agosto community´s main road<br />
plains yapacani August 15 construction of flood defenses along the River yapacaní<br />
tABlE 31. ExAmplEs of mEAsUREs to impRovE livEstocK RAising<br />
systEms<br />
Macro-region Municipality Community Prioritized measure<br />
Altiplano pucarani pampajasi construction of dairy cattle infrastructure<br />
Altiplano pucarani pampajasi Upgrading dairy herds<br />
Altiplano porco chaquilla construction of roofed folds and other infrastructure (forage racks, troughs, etc.).<br />
Altiplano porco chaquilla comprehensive animal health program (de-worming of internal and external<br />
parasites, etc).<br />
Altiplano porco chaquilla improving reproductive and genetic management (managed cross-breeding,<br />
selection and rotation of stud animals, avoiding use of underperforming animals).<br />
chaco<br />
villa vaca<br />
guzman<br />
Aguayrenda<br />
management and recovery of native forest-deferred forage<br />
valleys El puente caña cruz improving livestock infrastructure and introduction of goats for 25 families.<br />
tABlE 32. ExAmplEs of pAstURE mAnAgEmEnt mEAsUREs<br />
Macro-region Municipality Community Prioritized measure<br />
Altiplano calacoto contorno<br />
calacoto<br />
improvement of pastures and fodder<br />
Altiplano porco chaquilla Recovery practices in degraded wetlands (fencing, fertilization, irrigation and<br />
repopulation)<br />
Altiplano<br />
chaco<br />
carangas<br />
curahuara<br />
villa vaca<br />
guzman<br />
Uta jila<br />
manasaya<br />
Aguayrenda<br />
improvement of native grasslands by constructing infiltration trenches (to aid runoff)<br />
and planting seeds of native grasses<br />
management and recovery of native forest-deferred forage<br />
construction of pens, stables and apriscos (cattle<br />
folds) as a prelude to shifting to semi-intensive<br />
farming.<br />
2. Grazing pasture management: infrastructure and<br />
training aimed at the improvement, protection and<br />
management of grazing pastures; and preventing<br />
falls in load capacity due to climate change,<br />
including the establishment of regulatory frameworks<br />
limiting access to grassland.<br />
measures to improve Agriculture<br />
Measures to adapt agriculture to climate change can be<br />
divided into two subcategories:
52 thE sociAl dimEnsions of AdAptAtion to climAtE chAngE in BoliviA<br />
tABlE 33. ExAmplEs of chAngEd mEAsUREs foR cRopping systEms<br />
Macro-region Municipality Community Prioritized measure<br />
Altiplano porco chaquilla organic farming, using selected native species and varieties tolerant to adverse<br />
weather conditions<br />
chaco charagua san<br />
francisco<br />
chaco villa vaca guzman Aguayrenda protection of rice production<br />
crops of early soft corn varieties, pearl maize, and beans in 22 chaco family<br />
farms<br />
chaco villa vaca guzman Aguayrenda improved soil cultivation, hoeing, and selecting earlier and more profitable<br />
peanut varieties<br />
plains san ignacio puerto san<br />
Borja<br />
grain storage system (construction of silos)<br />
plains san pedro valparaiso fast-growing vegetable crops introduced<br />
plains yapacani san isidro control of high weed incidence in pastures and fruit orchards<br />
plains yapacani san isidro introduction of citrus trees in conjunction with coffee plants<br />
plains yapacani Agosto 15 diversification: citrus and cocoa planted<br />
plains yapacani Agosto 15 Windbreaks installed in rice paddies<br />
valleys El puente caña cruz construction of 50 family greenhouses.<br />
valleys El puente caña cruz improved management of local varieties and introduction of new varieties of fruit<br />
trees (peaches) in 50 domestic orchards.<br />
1. Changing cropping systems: infrastructure, equipment<br />
and training for introducing new species and<br />
adapted varieties; building storage facilities to ensure<br />
conservation of crops under warmer conditions.<br />
2. Farmland management: infrastructure, equipment<br />
and training to ensure better soil management by<br />
seeking to improve water-holding capacity (in the<br />
event of drought); and installing drainage systems<br />
and controlling erosion (in the event of flooding).<br />
Environmental management measures<br />
Measures aimed at improving the management of<br />
forests and water catchment areas, together with<br />
regulation of access; and reforestation and revegetation<br />
to reduce water infiltration, erosion, flooding, and the<br />
drying up of water sources.<br />
training and Advisory measures<br />
Two subcategories of training and advisory measures<br />
exist to help people living in the communities better<br />
adapt to climate change:<br />
1. Manpower training: to boost employment opportunities<br />
in the event of temporary or permanent<br />
migration.<br />
tABlE 34. ExAmplEs of AgRicUltURAl soil mAnAgEmEnt mEAsUREs<br />
Macro-region Municipality Community Prioritized measure<br />
Altiplano porco chaquilla opening up and / or construction of drainage ditches to prevent crops being<br />
affected by permanent moisture.<br />
chaco charagua san francisco Animal traction to aid arable land soil management<br />
chaco<br />
villa vaca<br />
guzman<br />
Aguayrenda<br />
plains san ignacio puerto san<br />
Borja<br />
improved soil cultivation, hoeing and selecting earlier and more profitable peanut<br />
varieties.<br />
Agricultural terracing (lomas) to prevent flooding<br />
valleys El puente caña cruz management and recovery of soil fertility (0.5 ha / household)
d E v E l o p m E n t A n d c l i m A t E c h A n g E d i s c U s s i o n pA p E R s<br />
53<br />
tABlE 35. ExAmplEs of EnviRonmEntAl impRovEmEnt AdAptAtion<br />
mEAsUREs<br />
Macro-region Municipality Community Prioritized measure<br />
chaco charagua san francisco forest management and recovery of native species<br />
valleys El puente caña cruz Reforestation and management training in woodland areas of 0.25 ha / household<br />
valleys saipina oconi Reforestation to protect drinking water sources<br />
tABlE 36. ExAmplEs of mAnpoWER tRAining mEAsUREs<br />
Macro-region Municipality Community Prioritized measure<br />
Altiplano calacoto contorno calacoto technical training in various activities<br />
valleys tarvita la silla training for community leaders and young people<br />
valleys saipina oconi training courses for 40 families<br />
tABlE 37. ExAmplEs of mEAsUREs foR tRAining in AltERnAtivE<br />
occUpAtions<br />
Macro-region Municipality Community Prioritized measure<br />
Altiplano calacoto contorno calacoto creation of producers´ Association<br />
Altiplano porco chaquilla training and user awareness for sustainable use of resources.<br />
plains yapacani san isidro diagnostic study on the timing of flowering of local plants<br />
valleys El puente caña cruz production chain counseling program<br />
valleys saipina oconi Exchange of experiences with other communities<br />
valleys sicaya pueblo Abajo tracking and monitoring climate change in community<br />
2. Training for alternative occupations: training and<br />
advice given on seeking and undertaking new<br />
income-generating occupations in the communities,<br />
support for organizational strengthening.<br />
credit and financing measures<br />
Measures of access to credit and financing aimed at<br />
supporting family adaptation initiatives.<br />
measures to improve Employment and<br />
value-added Activities<br />
These include constructing infrastructure and introducing<br />
equipment and training with the aim of generating<br />
new sources of income to complement that earned from<br />
farming activities, together with measures to support<br />
organizational strengthening and associated marketing<br />
methods.<br />
tABlE 38. ExAmplE of A cREdit And finAncing AdAptAtion mEAsURE<br />
Macro-region Municipality Community Prioritized measure<br />
Altiplano calacoto contorno calacoto management of low-interest loan financing
54 thE sociAl dimEnsions of AdAptAtion to climAtE chAngE in BoliviA<br />
tABlE 39. ExAmplEs of mEAsUREs to impRovE EmploymEnt And<br />
vAlUE-AddEd ActivitiEs<br />
Macro-region Municipality Community Prioritized measures<br />
Altiplano calacoto contorno<br />
calacoto<br />
processing and marketing of local products<br />
Altiplano pucarani pampajasi support for the establishment of an organization to market aggregates (sand and<br />
stone)<br />
plains san pedro valparaiso community flat boat for transporting produce to market<br />
plains yapacani san isidro pilot center for improving apiculture techniques<br />
valleys El puente caña cruz joint marketing of vegetables and traditional products<br />
valleys El puente caña cruz production of lambswool fabrics by 10 families<br />
valleys vitichi chapicollo facilities installed for weaving and clothes manufacture<br />
valleys vitichi chapicollo Establishment of tannery<br />
fREQUEncy of AdAptAtion<br />
mEAsUREs<br />
Our analysis of the number of times each type of<br />
measure was included in community adaptation strategies<br />
indicates a number of interesting trends.<br />
The above table indicates that on average each community<br />
included 8.9 adaptation measures in their livelihood<br />
strategies. The community with the largest<br />
number of measures was Chapicollo (Vitichi<br />
Municipality) with 17 measures, while Jila Manasaya<br />
Uta (Curawara Carangas Municipality) suggested only<br />
5 measures (the lowest).<br />
Water management was given the highest priority in<br />
community strategies (an average of 3.1 per community)<br />
followed by measures to improve agriculture and<br />
livestock raising.<br />
Communities in the Altiplano and inter-Andean<br />
valleys (i.e., in the Andes) prioritized water management<br />
measures given that their main concern was<br />
drought. In the plains region and the Chaco, water<br />
management measures took second place to measures<br />
for improving agriculture. Livestock improvement was<br />
the main concern of the highland communities<br />
surveyed.<br />
tABlE 40. AvERAgE nUmBER of commUnity AdAptAtion mEAsUREs<br />
By mAcRo-REgion<br />
Measure Altiplano Chaco Plains Valleys Total<br />
Water management 3.0 3.0 1.8 4.2 3.1<br />
infrastructure 0.3 0.0 1.0 0.2 0.4<br />
livestock improvement 2.8 0.5 0.5 1.2 1.3<br />
Agriculture improvement 1.5 4.0 2.3 2.8 2.5<br />
Environmental management 0.0 0.5 0.0 0.4 0.2<br />
training and advice 1.3 0.0 0.3 1.0 0.7<br />
financing and credit 0.3 0.0 0.0 0.0 0.1<br />
Employment and value-added activities 0.5 0.0 0.5 1.2 0.7<br />
Total 9.5 8.0 6.3 11.0 8.9
tABlE 41. nUmBER of pRioRitiZEd mEAsUREs By typE And commUnity<br />
Macroregion<br />
Community<br />
Water<br />
management<br />
Infrastructure<br />
Livestock<br />
Improvement<br />
Improvement<br />
of agriculture<br />
Type of measure<br />
Environmental<br />
management<br />
Training and<br />
advice<br />
Financing and<br />
credit<br />
Employment<br />
and valueadded<br />
activities<br />
Altiplano chaquilla 3 4 3 3 13<br />
total<br />
Altiplano<br />
contorno<br />
calacoto<br />
Uta jila<br />
manasaya<br />
2 1 3 1 2 1 1 11<br />
4 1 5<br />
pampajasi 3 3 2 1 9<br />
12 1 11 6 5 1 2 38<br />
chaco Aguayrenda 4 1 5 10<br />
total<br />
chaco<br />
san francisco 2 3 1 6<br />
6 1 8 1 16<br />
plains Agosto 15 1 2 3 6<br />
total<br />
plains<br />
puerto san<br />
Borja<br />
2 1 3 6<br />
san isidro 1 2 1 2 1 1 8<br />
valparaiso 3 1 1 5<br />
7 4 2 9 1 2 25<br />
valleys caña cruz 1 3 6 1 1 2 14<br />
total<br />
valleys<br />
grand<br />
Total<br />
chapicollo 8 3 2 4 17<br />
la silla 5 1 1 7<br />
oconi 3 1 3 1 2 10<br />
pueblo Abajo 4 2 1 7<br />
21 1 6 14 2 5 6 55<br />
Total<br />
measures<br />
46 6 20 37 3 11 1 10 134<br />
d E v E l o p m E n t A n d c l i m A t E c h A n g E d i s c U s s i o n pA p E R s<br />
55
56 thE sociAl dimEnsions of AdAptAtion to climAtE chAngE in BoliviA<br />
AdAptAtion stRAtEgiEs<br />
Our results indicate that communities do not award<br />
priority to any single measure or to measures in isolation<br />
but combine different measures (“adaptation strategies”)<br />
in order of priority, to be implemented within a<br />
specific time limit.<br />
Strategies differ greatly. Communities located in the<br />
same macro-region with similar climate problems prioritized<br />
different strategies. For example, while all the<br />
communities in the Valleys region forecast drought as<br />
their predominant climate scenario, the measures and<br />
adaptation strategies to deal with drought vary. These<br />
differences are apparent not only in the total number of<br />
measures recorded but also with regard to the type of<br />
measures proposed and their order of priority. The<br />
following chart displays all the adaptation measures<br />
identified by the communities in the order of priority<br />
which communities assigned to them.<br />
The above tables indicate a wide variety of community<br />
livelihood strategies which can be explained as follows.<br />
Firstly, each strategy tends to reflect the specific concerns<br />
of an individual community, especially regarding the<br />
extent to which it is exposed to, and aware of, climate<br />
change and its likely effects on the life of the community.<br />
The measures that have been identified and the priorities<br />
assigned to them also mirror the kind of measures or<br />
investments that have already been made (or not) in the<br />
community in the past. In effect the strategies depend on<br />
the recent history of a particular community.<br />
Communities, for example, that have succeeded in<br />
resolving the problems of drinking water supply thanks<br />
to investments already made considered that there was<br />
no need to include this measure in their livelihood strategy<br />
unless the current system was considered inadequate.<br />
A further factor distinguishing the different adaptation<br />
strategies in the communities is the presence of institutions,<br />
or lack of them. We found during the study that<br />
the number and type of “institutional”’ interventions in a<br />
particular community impacted on the priority assigned<br />
to the measures by the communities. For example, the<br />
San Pedro Community (Plains), which hitherto had<br />
received little institutional support, awarded priority to<br />
measures which required only limited institutional help.<br />
On the other hand communities such as Saipina<br />
(Valleys), which currently benefit from significant<br />
investments made by the local authorities and private<br />
institutions, prioritized investments requiring substantial<br />
external support (see Table below).<br />
general trends<br />
Analyzing this group of multifaceted strategies it is<br />
possible to identify general trends which are common to<br />
all the strategies and which present lessons for designing<br />
policies in support of climate adaptation.<br />
A notable trend is that the prioritized measures related<br />
to a particular strategy effectively complement one<br />
another (i.e. they are not isolated, one-off, actions).<br />
Implementing a measure implies the need to undertake<br />
a series of other measures that complement and ensure<br />
that the desired end-results are achieved.<br />
The case of the Contorno Calacoto community<br />
(Altiplano)<br />
This community, located on the central <strong>Bolivia</strong>n high<br />
plateau a few hours from the capital La Paz, is characterized<br />
by its extreme poverty owing to very low agricultural<br />
production. Agricultural production has deteriorated<br />
significantly as a result of climate change, with water<br />
scarcity one of the community’s major problems.<br />
Contorno Calacoto´s first priority is to introduce<br />
measures related to water supply for human consumption<br />
and farming activities. Secondly, the community<br />
has assigned priority to improving livestock rearing<br />
through two measures: improving pasture and fodder—<br />
the main limiting factors owing to deterioration of the<br />
grasslands over the past few years.<br />
The community also hopes to develop semi-stabled<br />
livestock rearing and therefore requires stables and<br />
covered pens to be built. This implies completely transforming<br />
the livestock rearing system by switching beef<br />
production to dairy production. This will obviously<br />
imply families investing more money and time. A<br />
related but a lower priority strategy would be to seek<br />
genetic improvements for the beef herd.<br />
The community also foresees improving its farming<br />
techniques by introducing seeds which are more
d E v E l o p m E n t A n d c l i m A t E c h A n g E d i s c U s s i o n pA p E R s<br />
57<br />
tABlE 42. vAllEys: pRioRitiZEd AdAptAtion mEAsUREs, By commUnity<br />
Chapicollo (Vitichi) Caña Cruz (El Puente) Oconi (Saipina) Pueblo Abajo (Sicaya) La Silla (Tarvita)<br />
1 micro-gravity dam construction of 5<br />
atajados and 15 tanks,<br />
with appropriate piping<br />
systems<br />
2 construction of atajados<br />
(small dams) with 3000<br />
m 3 capacity<br />
3 construction of atajados<br />
with 5000 m 3 capacity<br />
4 construction of irrigation<br />
infrastructure<br />
(distribution system)<br />
5 Establishment and<br />
regeneration of native<br />
forage species.<br />
6 Reinforced concrete<br />
domestic aljibe (water<br />
tank)<br />
management and<br />
recovery of soil fertility:<br />
0.5 ha / household<br />
production chain<br />
counseling program<br />
construction of 50 family<br />
greenhouses.<br />
improvement of livestock<br />
infrastructure and<br />
introduction of goats for<br />
25 families.<br />
improved techniques and<br />
varieties of traditional<br />
crops and vegetables in<br />
50 orchards<br />
7 Well-drilling (first stage) improved management of<br />
local varieties and<br />
introduction of new<br />
varieties of fruit trees in<br />
50 orchards.<br />
8 improved livestock folds marketing vegetables and<br />
traditional products<br />
jointly.<br />
9 drilling – submersible<br />
pump (second phase)<br />
10 fenced areas for<br />
regeneration of forage<br />
species, improvement<br />
of shelters, breeds,<br />
provision of equipment<br />
11 Underground water<br />
cistern<br />
12 motorized farm<br />
equipment and tools.<br />
13 facilities for weaving<br />
and sewing<br />
small tools needed to<br />
manage agricultural land<br />
for 50 families.<br />
Animal health<br />
improvement.<br />
Reforestation and<br />
management training in<br />
woodland plots of 0.25<br />
ha / household.<br />
production of woolens by<br />
10 families.<br />
improved breeds of<br />
goats.<br />
14 dairy production centre plant health surveillance<br />
program in fruit orchards.<br />
15 Establishment of<br />
tannery<br />
16 silos, supply bases<br />
(pirhuas) and seeds<br />
17 production, planting of<br />
peaches and installation<br />
of mesh to protect from<br />
hailstorms.<br />
construction of water<br />
storage dam on the River<br />
oconi<br />
construction of 40<br />
domestic atajados<br />
Acquisition by the<br />
community of a farm<br />
tractor with attachments<br />
Reforestation and<br />
protection of drinking<br />
water sources<br />
provision of certified seed<br />
potatoes for 40 families in<br />
oconi<br />
provision of hybrid tomato<br />
seeds for 40 families in<br />
oconi<br />
project for integrated pest<br />
management of potato<br />
and tomato cultivation for<br />
40 families in oconi<br />
implementation of custard<br />
apple (chirimoya)<br />
production project using<br />
micro- irrigation<br />
training courses for 40<br />
families in oconi<br />
Exchange of experiences<br />
with other communities<br />
lining irrigation canal<br />
of the palermo i<br />
cooperative<br />
improving intercommunity<br />
irrigation<br />
channel<br />
construction of<br />
atajados and rainwater<br />
management<br />
construction of wall<br />
technical assistance<br />
for integrated crop<br />
management practices<br />
involving<br />
permanent adaptation<br />
to climate change<br />
community tracking<br />
and monitoring of<br />
climate change<br />
micro-irrigation<br />
systems in rainfed<br />
areas for families and<br />
for sharing between<br />
families<br />
construction of a<br />
100,000 c.m. dam<br />
construction of<br />
50 atajados with<br />
4000 c.m.<br />
capacity<br />
construction of 6<br />
micro-irrigation<br />
systems<br />
construction and<br />
improvement of<br />
irrigation<br />
channels<br />
silos for storage<br />
of 1000 ‘quintales’<br />
of native seed<br />
leadership<br />
training<br />
installation of<br />
sprinkler irrigation
58 thE sociAl dimEnsions of AdAptAtion to climAtE chAngE in BoliviA<br />
tABlE 43. plAins: pRioRitiZEd AdAptAtion mEAsUREs, By commUnity<br />
San Isidro (Yapacani) Puerto San Borja (San Ignacio) Agosto 15 (Yapacani) Valparaiso (San Pedro)<br />
1 Water supply system for<br />
cattle<br />
2 construction of social<br />
housing<br />
3 improved dual-purpose<br />
cattle<br />
4 construction of the<br />
condorito Bridge<br />
5 pilot centre for apiculture<br />
improvement<br />
6 controlling high incidence<br />
of weeds in pastures and<br />
orchards<br />
7 joint production of citrus<br />
and coffee<br />
8 diagnostic study on<br />
flowering times of local<br />
plants<br />
construction of water hole<br />
(aguada)<br />
family plots to be fenced off<br />
grain storage system<br />
irrigation pumps to be installed<br />
construction of artificial<br />
terracing<br />
construction of furrow terracing<br />
(camellones)<br />
Emergency water recovery and<br />
Educational center<br />
construction of defenses on<br />
the River yapacaní<br />
Repair of 5 km of main road in<br />
the Agosto 15 community<br />
installing windbreaks in rice<br />
paddies<br />
Restarting rice production in<br />
the Agosto 15 community<br />
to diversify agricultural<br />
production by planting citrus<br />
and cocoa<br />
community flat boat to<br />
transport produce to market.<br />
to plant fast-growing<br />
vegetables.<br />
domestic irrigation using<br />
waterwheels in orchards<br />
30 irrigation pumps for irrigating<br />
family orchards in the<br />
valparaiso community (with<br />
river water)<br />
10 irrigation pumps for lifting<br />
river water to irrigate family<br />
vegetable plots<br />
tABlE 44. chAco: pRioRitiZEd AdAptAtion mEAsUREs, By commUnity<br />
Aguayrenda (Villa Vaca Guzman)<br />
San Francisco (Charagua)<br />
1 Repair and expansion of community water system improvement and expansion of drinking water system<br />
2 Repair of water tapping inlet, construction of storage tank and<br />
installation of pressurized irrigation<br />
3 Better soil cultivation, hoeing, selection of early peanut varieties at<br />
better prices<br />
Early crops of soft corn, pearl maize and beans in 22<br />
family plots<br />
improvement and protection of 2 ha family plots for<br />
growing combined crops<br />
4 protection of cultivated areas construction of micro-irrigation system to make best use<br />
of river water<br />
5 construction of a reservoir and relevant infrastructure to improve<br />
irrigation<br />
Animal traction for soil management and conservation of<br />
arable land<br />
6 selection of early-yield drought resistant rice seed forest management and rehabilitation of native species<br />
7 protection of rice paddies<br />
8 management and recovery of native forest using rotation methods<br />
9 soil management of plots in protected areas<br />
10 combining fruit and vegetable cultivation<br />
resistant to drought, requesting technical support and<br />
training to help with this changeover.<br />
Finally the community awards priority to measures for<br />
strengthening its own organization and training and<br />
will need to seek financial help for underpinning valueadded<br />
economic activities to complement farming<br />
production. It can be observed from all this that the<br />
community is considering a radical transformation of its<br />
livelihood strategies as a necessary step toward adapting<br />
to climate change.<br />
A second key trend noted is that the order of implementation<br />
is vitally important. Prioritized actions cannot be
d E v E l o p m E n t A n d c l i m A t E c h A n g E d i s c U s s i o n pA p E R s<br />
59<br />
tABlE 45. AltiplAno: pRioRitiZEd AdAptAtion mEAsUREs, By commUnity<br />
Chaquilla (Porco)<br />
Contorno Calacoto<br />
(Calacoto)<br />
Pampajasi (Pucarani)<br />
Jila Manasaya Uta (Curawara<br />
Carangas)<br />
1 improved water irrigation<br />
management systems to streamline<br />
water use and reduce silting<br />
construction of wells<br />
and water catchment<br />
facilities<br />
construction of a dam<br />
construction of multifamily water<br />
system<br />
2 construction of new irrigation<br />
channels to include water tapping<br />
facilities and water flow chambers for<br />
efficient irrigation.<br />
construction of<br />
reservoirs<br />
construction of reservoirs<br />
drilling wells and installing hand<br />
pumps for drinking water<br />
3 measures to recover degraded<br />
wetlands (fencing, fertilization,<br />
irrigation and replanting)<br />
improvement of<br />
pastures and fodder<br />
Build infrastructure for<br />
dairy herd management<br />
improving family wells and<br />
installing hand pumps<br />
4 training and user awareness to<br />
enable sustainable use of available<br />
resources.<br />
livestock<br />
infrastructure<br />
management and<br />
improvement of<br />
agricultural production<br />
improvement of native grasslands<br />
with the construction of infiltration<br />
trenches and planting native grass<br />
seeds<br />
5 construction of roofed livestock<br />
shelters and other necessary<br />
infrastructure to upgrade production<br />
support for farming<br />
activities<br />
management and<br />
conservation of fodder<br />
construction of abajados for<br />
irrigating wetlands (bofedales)<br />
6 comprehensive animal health<br />
program<br />
management of lowinterest<br />
loan finance<br />
improvement of dairy<br />
herds<br />
7 to improve reproductive and genetic<br />
management.<br />
technical training in<br />
various activities<br />
to support the<br />
establishment of a body to<br />
produce and sell<br />
aggregates<br />
8 training and awareness among<br />
livestock raisers for the sustainable<br />
production and handling of animals.<br />
to organize a<br />
producers<br />
Association<br />
vegetable production in<br />
solar-heated enclosures<br />
9 construction and / or repair of<br />
defenses and retaining walls in<br />
cultivated terraced plots.<br />
improvement of<br />
productive<br />
infrastructure<br />
handling and production<br />
of potato crops<br />
10 improvement of irrigation canals and<br />
water tapping facilties for efficient<br />
use of irrigation water.<br />
management and<br />
livestock genetic<br />
improvement<br />
11 opening and / or construction of<br />
drainage ditches to prevent moisture<br />
damage to crops.<br />
processing and<br />
marketing of local<br />
products<br />
12 organic farming using selected<br />
native species and varieties tolerant<br />
to adverse weather conditions.<br />
13 training and awareness-raising of<br />
community residents to protect and<br />
preserve soils used for growing<br />
crops<br />
Source: Community Workshops<br />
undertaken haphazardly because most measures require<br />
others to be implemented first in order to generate the<br />
appropriate conditions for further action.<br />
As noted above, residents of the Contorno Calacoto<br />
community are planning key changes to their livestock<br />
rearing system by introducing semi-stabled cattle. The<br />
steps to be taken are therefore: (i) to guarantee a good<br />
supply of water; (ii) to improve grasslands and fodder;<br />
(iii) to move ahead with livestock infrastructure<br />
construction once the feeding situation is resolved;<br />
(iv) to strengthen community organization; and finally,<br />
once all the minimum technical conditions are in place,<br />
(v) to introduce genetic improvements for the livestock.<br />
It is considered that unless the measures can be undertaken<br />
in this order the adaptation exercise would fail.
60 thE sociAl dimEnsions of AdAptAtion to climAtE chAngE in BoliviA<br />
tABlE 46. AdAptAtion stRAtEgy of<br />
thE contoRno cAlAcoto<br />
commUnity<br />
Priority<br />
Measure<br />
1 construction of wells and water capture facilities<br />
2 construction of reservoirs (water capture)<br />
3 improvement of pasture and forage<br />
4 livestock infrastructure (pens, stables)<br />
5 support for agricultural activities (seeds,tA and<br />
training)<br />
6 low interest financing management<br />
7 technical training in different activities<br />
8 to organize a producers´Association<br />
9 to improve productive infrastructure (soil<br />
management)<br />
10 handling and genetic improvement for cattle<br />
11 processing and marketing of local products<br />
A third trend is that the strategies are comprehensive<br />
and not confined to investments in infrastructure. These<br />
strategies include, apart from installing the correct<br />
infrastructure (perhaps the costliest step), training, advisory<br />
and organizational support measures.<br />
Finally, a fourth trend is that water management<br />
measures generally have top priority. In 14 of the 15<br />
communities surveyed, measures to deal with water<br />
management are prioritized. On the other hand,<br />
throughout the study we were able to identify 46 water<br />
management measures, and it is noteworthy that in 38<br />
cases (83 percent) such measures were put forward as<br />
being among the top three priorities of the communities.<br />
Table 47 below confirms that water management is the<br />
foremost measure needed for adapting to climate change.<br />
Adaptation strategies for drought<br />
Adaptation to drought, especially by improving water<br />
management, involves a switch from rainfed farming to<br />
irrigated systems. This is a major change with important<br />
implications.<br />
Firstly, installing an irrigation system involves constructing<br />
an appropriate infrastructure and training users in<br />
its operation and maintenance. Communities have<br />
proposed various types of infrastructure. The most<br />
noteworthy case is probably that of Chapicollo (Vitichi<br />
Municipality, Valleys) whose adaptation strategy<br />
embraces 16 measures of which eight concern water<br />
management employing different types of infrastructure.<br />
The community proposes, for example, the<br />
construction of a dam to supply a small part of the land<br />
located in the bottom of a valley. For land on the slopes<br />
it is proposed to construct two types of atajados (large<br />
and small dams/reservoirs). Meanwhile, in order to<br />
resolve the drinking water issue various measures have<br />
been advanced to serve this dispersed community: well<br />
drilling, construction of systems for housing rainwater,<br />
building underground cisterns, etc.<br />
tABlE 47. oRdER of pRioRity foR AdAptAtion mEAsUREs<br />
Order of priority<br />
Type of measure<br />
1 2 3 4 5 6 7 8 9 10 11 12 13 14 15 16 Grand Total<br />
Water management 14 9 5 5 3 1 3 3 3 46<br />
infrastructure 2 2 1 1 6<br />
livestock improvement 4 2 5 2 2 1 1 2 1 20<br />
improvement of agriculture 4 3 5 6 6 4 4 1 1 1 1 1 37<br />
Environmental management 1 1 1 3<br />
training and advice 1 1 2 1 3 1 1 1 11<br />
financing and credit 1 1<br />
Employment and value-added activities 1 1 1 1 2 2 1 1 10<br />
grand Total 15 15 15 15 15 13 11 8 7 6 4 3 3 2 1 1 134
d E v E l o p m E n t A n d c l i m A t E c h A n g E d i s c U s s i o n pA p E R s<br />
61<br />
The community of Pueblo Abajo (Sicaya, Valleys), identifies<br />
three water management measures:<br />
• expanding the coverage and capacity of the existing<br />
water system;<br />
• building atajados for harvesting rain; and<br />
• building an irrigation system to take advantage of<br />
an existing water source.<br />
Secondly, irrigated agriculture involves changing entire<br />
farming or animal breeding systems. Introduction of<br />
irrigated agriculture involves for example:<br />
• new types of agricultural equipment and<br />
tools. Communities where irrigation is being introduced<br />
for the first time (e.g., Caña Cruz and El<br />
Puente) require assistance for purchasing tools;<br />
• growing different crops and introducing new species<br />
and varieties require technical training and a<br />
supply of genetic material (e.g., the Oconi community<br />
approach);<br />
• upgrading conservation and storage systems for the<br />
new crops. (e.g., La Sillada community).<br />
Another common response to the need for coping with<br />
drought is to change the livestock rearing system by<br />
switching from an extensive system to a controlled<br />
semi-stabled system, inevitably involving substantial<br />
disruption for families and communities.<br />
Such a response also involves upgrading the management<br />
of grassland and woodland grazing, replacing free<br />
and unrestricted access with a controlled and regulated<br />
system. Controlled grazing means that families will<br />
need to devote more time to raising their cattle. Rearing<br />
livestock will therefore need to be a more productive<br />
activity (to justify the increase in labor), which in turn<br />
involves improving animal health and reproduction,<br />
especially through the use of genetics to upgrade the<br />
stock.<br />
The proposed changes to cropping systems can be<br />
clearly observed in the livelihood strategies of Contorno<br />
Calacoto, Chaquilla, Porco, Caña Cruz, and El Puente.<br />
A further approach is to introduce improvements without<br />
the need for irrigation. This is particularly the case<br />
in communities on the plains where rainfall is high and<br />
where crops are not as prone to drought. These communities,<br />
such as San Isidro and Agosto 15, propose introducing<br />
new species and varieties which require less<br />
water and which can withstand higher temperatures.<br />
Finally, secondary (lowest priority) measures concern<br />
changing production techniques, introducing technical<br />
training and examining ways of generating supplementary<br />
income from different sources. Chapicollo, Caña<br />
Cruz, and Oconi, for example, argue that tanning,<br />
cloth-making, and dairy production fall into this category,<br />
while Contorno Calacoto and Pampajasi mention<br />
moving into the processing and marketing of<br />
aggregates.<br />
Adaptation strategies for flooding<br />
Only three communities in our sample (Agosto 15,<br />
Valparaiso, and Puerto San Borja) claimed that climate<br />
change would cause increased flooding in their areas.<br />
Key actions proposed by these communities include<br />
infrastructure works and acquiring new equipment.<br />
Puerto San Borja proposes constructing artificial<br />
terraces (camellones) and hillocks (lomas) to avoid losing<br />
crops and livestock at flood times, and fencing off agricultural<br />
plots on higher ground to prevent animals seeking<br />
refuge in them during floods.<br />
Agosto 15 proposes rebuilding the educational center in<br />
a more protected location, building a flood defense<br />
system on the banks of the river, and reconstructing a<br />
stretch of road in a place less susceptible to flooding.<br />
Valparaiso, which has received the least institutional<br />
intervention, proposes purchasing a community boat to<br />
help relocate families in the event of flooding. The<br />
community also maintains that it will introduce annual<br />
crops such as vegetables and other species that can be<br />
harvested before the beginning of the flood season.<br />
non-pRioRitiZEd mEAsUREs<br />
A number of “spontaneous” measures used in the past<br />
were not included in the adaptation strategies:<br />
1. Seasonal migration: a common practice in rural communities,<br />
even without climate change, but in
62 thE sociAl dimEnsions of AdAptAtion to climAtE chAngE in BoliviA<br />
drought or flood scenarios temporary migration has<br />
become a kind of Plan B, which comes into play<br />
when other adaptation measures fail to work (e.g.,<br />
insufficient irrigation).<br />
2. Land abandonment: also a common practice for families<br />
who cease farming land, because it has become<br />
too exposed to drought or flooding, and relocate to<br />
other areas. Entire communities have been known to<br />
move to areas further away. This practice, however,<br />
tends to be costly, involving rebuilding the social<br />
infrastructure, housing, roads, etc. In certain circumstances<br />
this will effectively be a Plan B to which<br />
people resort when other adaptation measures fail or<br />
are beyond the community’s resources.<br />
As with temporary migration, abandoning the land<br />
forms part of the stock of campesino responses to<br />
climate hazards. However, land abandonment was<br />
not prioritized in our study as an adaptation measure<br />
given that the logic applied to identifying adaptation<br />
measures was on the lines of: “What should we do<br />
to adapt and not have to abandon the community.”<br />
We do not want to move the community. This<br />
would be an easy way out for the authorities.<br />
We want to stay in our community despite<br />
flooding. It took a lot of effort to build our<br />
community here and it is now a strategic place,<br />
a port where everybody goes through. We need<br />
help to stay in our own place and not to get us to<br />
move. (Aydee Jimenez, Beni)<br />
3. Water catchment basin management: was not mentioned<br />
frequently in the course of the study. Passing<br />
reference was made to it in discussions about the<br />
management of grasslands and forests and environmental<br />
recovery. Nevertheless, when referring to the<br />
causes and effects of climate change, communities<br />
argued that excessive deforestation was the main<br />
cause of erosion and shortage of rain.<br />
Catchment area management usually involves several<br />
communities. The measure was not included in<br />
community adaptation measures because its inclusion<br />
would have required the concurrence of all the<br />
communities located within the basin concerned<br />
(the study methodology addressed individual<br />
communities rather than entire groups of communities<br />
located in river basins).<br />
Catchment basin management will undoubtedly be<br />
given priority both in the flood and drought scenarios<br />
since this adaptation measure tends to increase<br />
tree cover in the specific area of the basin, control<br />
erosion, reduce water runoff, and increase the infiltration<br />
to feed the underground streams and reduce<br />
swollen rivers during flood periods.<br />
pERcEption of locAl<br />
AUthoRitiEs ABoUt climAtE<br />
chAngE AdAptAtion<br />
climate change<br />
Our interviews revealed that all the municipal authorities<br />
had heard of climate change but not all of them had<br />
particularly accurate knowledge. They all claimed that<br />
this was a matter of concern that could have a negative<br />
effect on the development of their municipalities. Most<br />
of the local authorities believe that climate change is a<br />
“thing of the future.”<br />
In the majority of municipalities 14 (11 cases out of 14)<br />
the authorities saw climate change as a problem for the<br />
future and with little current impact. In the 11 municipalities,<br />
six were unable to identify clear changing<br />
trends in temperatures or rainfall and appeared more<br />
concerned with climate variability and “El Niño”<br />
phenomenon. Officials in the five remaining municipal<br />
authorities agreed that temperatures were higher than<br />
tABlE 48. locAl AUthoRity<br />
pERcEptions of thE timing of<br />
climAtE chAngE<br />
Municipalities<br />
climate change is something in the future 11<br />
climate change is with us now 3<br />
Source: Interview with local authorities<br />
14 No clear trend can be detected on a per macro-region level. This<br />
number (11) includes municipalities from all the macro-regions. The<br />
most evident trend is that these are the municipalities where the<br />
climatic scenarios mainly concern drought.
d E v E l o p m E n t A n d c l i m A t E c h A n g E d i s c U s s i o n pA p E R s<br />
63<br />
previously, but they made no reference to the fact that<br />
this had negative effects on agriculture or on the lives of<br />
the communities, apparently believing that the effects<br />
and impacts of climate change were something to be<br />
tackled at a future date.<br />
Local authorities in only three of the 14 municipalities<br />
in our sample agreed that climate change had already<br />
commenced, since their municipalities had been affected<br />
by heavy flooding. It was noted, however, that official<br />
views were not unanimous: two of the municipalities<br />
averred that the floods were directly caused by El Niño<br />
and that climate change had caused this phenomenon<br />
to be more frequent and intense than previously. In all<br />
three cases it was considered that climate change was<br />
already affecting <strong>Bolivia</strong>, but that these effects had only<br />
become apparent over the last 10 years.<br />
It can be argued that a difference exists between the<br />
campesino viewpoint and that of the local authorities.<br />
People in the communities were adamant that climate<br />
change had started twenty or thirty years ago and was a<br />
continuing process, affecting their lives and livelihoods,<br />
while most of the authorities reckoned that climate<br />
change was a thing of the future and would come about<br />
suddenly (with the exception of officials in municipalities<br />
that had been affected by flooding, who considered<br />
that climate change began around 10 years ago).<br />
Officials also differed from the campesinos in their attitudes<br />
towards the timing and effects of climate change,<br />
arguing that climate change would be catastrophic,<br />
would come about without warning and cause widespread<br />
tragedy. The campesinos on the other hand<br />
argued that climate change was a continuous, gradual<br />
process to which they could adapt. Explaining the official<br />
approach, Daniel Maydana, the Mayor of Curawara,<br />
told researchers:<br />
In our community it would seem that over the last<br />
10 years it has certainly got warmer and at critical<br />
times water is in short supply. But for the moment<br />
climate change is not a problem here and is not<br />
recognized as such in this municipality. It’s true<br />
that there are natural disasters but these have<br />
always been common in our area and we have an<br />
annual budget of Bs35,000 to deal with this. No<br />
doubt in future there will be more disasters.<br />
Adaptation measures Envisaged by<br />
municipal Authorities<br />
In the course of our study we were unable to identify<br />
any specific official climate change adaptation measures<br />
in any of the municipalities. No programs existed and<br />
no resources had been assigned to climate change. The<br />
municipal governments generally confined themselves<br />
to arguing that climate change was a new problem that<br />
was gradually being addressed.<br />
In a number of municipalities concrete actions had been<br />
undertaken that could be interpreted as being related to<br />
climate change, but these related mainly to emergency<br />
assistance to deal with climatic hazards such as flooding<br />
and drought. The latter was provided in the form of<br />
food aid for people affected by drought and, in the case<br />
of flood victims, food and medical/healthcare assistance<br />
had been offered.<br />
Municipal authorities have also been called upon to<br />
invest in repairing infrastructure damaged by flooding.<br />
In one of the areas studied (Yapacaní), which was<br />
particularly vulnerable to flooding, it was mentioned<br />
that a specific risk management program had been<br />
established, consisting of an early warning system and<br />
educational outreach for the population to warn of the<br />
need to take precautions in the event of severe floods.<br />
This was a pilot project being taken forward jointly<br />
with private development institutions.<br />
The bulk of municipal investments are focused on<br />
development work. This includes water management,<br />
agricultural and livestock improvement projects, etc.,<br />
not explicitly linked to climate change.<br />
possible municipal interventions Related to<br />
Adaptation<br />
When local authorities were asked how they could best<br />
support communities to adapt to climate change, the<br />
responses were given in imprecise and general terms,<br />
due no doubt to the fact that the issue is still relatively<br />
new on the local agenda. An analysis of the responses<br />
from the 14 municipalities indicates a number of interesting<br />
trends, with the authorities identifying 10 types<br />
of interventions, as displayed in the figure below.
64 thE sociAl dimEnsions of AdAptAtion to climAtE chAngE in BoliviA<br />
figURE 21. possiBlE mUnicipAl<br />
invEstmEnt in AdAptAtion<br />
Water management<br />
27%<br />
Credit and finance<br />
14%<br />
Development of policy and<br />
institutional framework<br />
5%<br />
Capacity building<br />
and training<br />
3%<br />
Infrastructure machinery<br />
and transport<br />
16%<br />
Enviromental<br />
management<br />
11%<br />
Agricultural<br />
improvements<br />
8%<br />
Livestock<br />
improvements<br />
8%<br />
Agricultural commercialization<br />
Disaster and employment<br />
response<br />
5%<br />
3%<br />
Municipal authorities awarded priority to the construction<br />
of water management infrastructure (dams, atajados,<br />
potable water systems, etc.), followed in order of<br />
importance by financing for anti-flood defenses, housing,<br />
roads and bridges, environmental management, and<br />
agricultural/livestock improvement. Three percent of<br />
projected measures would target emergency relief.<br />
Comparing the types of measures envisaged by the<br />
authorities with those prioritized by the communities it<br />
can be observed that, overall, both give priority to water,<br />
arguing that water management is the main climate adaptation<br />
measure to be taken. This is the only major point of<br />
agreement between the authorities and the communities.<br />
As can be seen in Figure 22, the communities and the<br />
authorities gave significantly different priorities to the<br />
types of projects, except for water management.<br />
Communities give greater importance to investments<br />
related to “improving agriculture,” “improving livestock<br />
rearing.” “processing and marketing,” and “advice and<br />
training.” On the other hand, the local authorities place<br />
greater importance on “infrastructure building,” regulating<br />
access to natural resources (“environmental management,”<br />
regulatory frameworks, etc.) and emergency assistance.<br />
From this it is clear that climate adaptation from the<br />
viewpoint of the municipal authorities is mainly a question<br />
of investing in infrastructure works, while for the<br />
communities adaptation to climate change is principally a<br />
process targeted at transforming livelihood systems.<br />
The communities, rather than awarding priority to oneoff<br />
projects, have worked out complex strategies<br />
combining a range of investments (including training)<br />
needed to transform production systems based upon<br />
control of water resources.<br />
Climate change is, however, a new issue for the municipal<br />
authorities and, regardless of community concerns,<br />
it is obvious that local authorities have not thought<br />
systematically and deeply about climate change—and<br />
even less about the measures needed to adapt to it.<br />
There can be no doubt that the official approach and<br />
the related investment strategies will change significantly<br />
once the authorities begin to regard climate<br />
change as a priority, and above all when they open<br />
discussions with the communities about the various<br />
adaptation measures required.<br />
support needed by local governments<br />
Local authorities were asked what support they<br />
required from the central government to deal with<br />
climate change. The main responses were as follows:<br />
figURE 22. compARAtivE AnAlysis<br />
of AdAptAtion mEAsUREs<br />
35%<br />
30%<br />
25%<br />
20%<br />
15%<br />
10%<br />
5%<br />
0%<br />
Disaster response<br />
Capacity building and training<br />
Credit and finance<br />
Development of policy and institutional framework<br />
Water management<br />
Infrastructure machinery and transport<br />
Authorities<br />
Agricultural improvements<br />
Enviromental management<br />
Communities<br />
Livestock improvements<br />
Agricultural commercialization and employment
d E v E l o p m E n t A n d c l i m A t E c h A n g E d i s c U s s i o n pA p E R s<br />
65<br />
1. Development and implementation of national standards<br />
to curb environmental degradation, particularly<br />
deforestation and grassland burning;<br />
2. Additional funding for municipal budgets, specifically<br />
for adaptation to climate change;<br />
3. National and departmental irrigation projects to be<br />
undertaken;<br />
4. Training and technical advice for municipal authorities<br />
and technical staff on climate change: causes,<br />
effects and possible impacts and the role of local<br />
government.<br />
The above figure indicates that local municipal authorities<br />
clearly hope that Central Government will help<br />
them to develop the local capacities needed to address<br />
climate change.<br />
figURE 23. sUppoRt REQUiREd<br />
fRom cEntRAl govERnmEnt<br />
Development of policy<br />
and institutional<br />
framework<br />
25%<br />
Capacity building<br />
and training<br />
13%<br />
Livestock improvements<br />
4%<br />
Enviromental<br />
management<br />
8%<br />
Credit and finance<br />
25%<br />
Infrastructure, machinery<br />
and transport<br />
4%<br />
Water management<br />
21%
66<br />
9. sUmmARy And<br />
conclUsions<br />
climAtE chAngE<br />
Observation of the climate is a permanent practice in the<br />
communities.<br />
Campesino and indigenous communities possess a long<br />
and rich tradition of systematically observing climate<br />
evolution, since their livelihoods depend upon it. The<br />
results of our study showed that communities generally<br />
have an accurate knowledge of changing climate trends<br />
over the long term.<br />
However, the community workshops revealed that there<br />
was little capacity for forecasting shorter-term climate<br />
changes. Climate change and increased climate variability<br />
means that many of the traditional climate indicators<br />
are no longer effective, which obliges the<br />
communities to construct new indicators for predicting<br />
weather over the short term.<br />
The powers of observation and interpretation of the<br />
climate possessed by people in the communities areimportant<br />
advantages which authorities should take into<br />
account when designing climate change policies.<br />
the key climate change trends identified by<br />
the communities are rising temperatures<br />
and increased water scarcity.<br />
One of the main conclusions of our study is that<br />
climate change has been observed in all communities,<br />
regardless of the particular ecosystem in which they are<br />
located. The most significant trends compared with<br />
20–30 years ago were identified as: (i) rising temperatures<br />
and increased shortage of water; and (ii) increasingly<br />
irregular rainfall with shorter and more intense<br />
rainy seasons. The campesinos in <strong>Bolivia</strong>’s Amazon<br />
region claimed that temperatures were higher, more rain<br />
fell than previously, and that floods were more frequent,<br />
more intense, and lasted longer.<br />
the communities regard drought and floods<br />
as being the main problems in the climate<br />
scenario for the future.<br />
Judging from the climate trends observed, the communities<br />
studied have come to the conclusion that the<br />
most probable future climate scenario will involve<br />
higher temperatures and water shortages affecting the<br />
country’s four micro-regions, together with higher rainfall<br />
and extensive flooding in the Amazon.<br />
climAtE chAngE impActs<br />
Climate change Will Have negative effects on communities´<br />
quality of life.<br />
All communities came to the conclusion that climate<br />
change will have an immediate and direct effect: a sharp<br />
decline in production capacity, related to a reduction of<br />
soil, grassland, and forest-based productivity due mainly<br />
to insufficient water to offset the expected higher<br />
temperatures and consequent evapotranspiration.<br />
Reduced production is likely to mean economic hardship<br />
for many families who will have fewer surplus<br />
goods to sell.
d E v E l o p m E n t A n d c l i m A t E c h A n g E d i s c U s s i o n pA p E R s<br />
67<br />
In addition to impacting negatively on farming jobs,<br />
climate change will also lead to people eating poorer<br />
quality food and less of it. All the communities participating<br />
in the study without exception considered that<br />
hunger and increased disease would become an issue.<br />
They also drew attention to the negative effects of<br />
climate change on children’s education.<br />
The communities also believe that the climate change is<br />
likely to speed deterioration of the environment, especially<br />
the wooded areas and grazing pastures. In the case of the<br />
latter, it was claimed that pastures would be unable to<br />
provide grazing for the present number of animals, and the<br />
cost of upgrading pastures would be prohibitively high.<br />
livElihood stRAtEgiEs to<br />
climAtE chAngE<br />
The livelihoods of the poorest are most vulnerable to climate<br />
change.<br />
Identifying and categorizing family livelihood strategies,<br />
our researchers detected a wide range of livelihood<br />
strategies among families in the various communities.<br />
These strategies varied, depending on the opportunities<br />
and constraints existing in the immediately surrounding<br />
environment.<br />
The study also found that there was a direct relationship<br />
between families´ livelihood strategies and their<br />
socio-economic strata, demonstrating that swapping one<br />
strategy for another depended not on freedom of choice<br />
but on the resources that families happened to possess.<br />
The communities were given the opportunity to analyze<br />
the impacts of climate change, concluding that certain<br />
livelihood strategies were more vulnerable than others.<br />
The poorest families in the communities considered<br />
themselves to be the most vulnerable given that they<br />
were more exposed to the problems of climate change<br />
and had fewer means of responding.<br />
Livelihood strategies based on rainfed agriculture and<br />
extensive livestock raising were considered to be the<br />
most vulnerable since they depended directly on the<br />
amount and timing of rainfall. The already precarious<br />
and poorly diversified nature of this kind of farming<br />
means that it is more exposed to risks.<br />
The poorest families in the flood regions were judged to<br />
be less able to protect themselves (because of poor<br />
housing, lack of boats, etc.) from generalized flooding<br />
of entire communities.<br />
It was also found that households headed by single<br />
women (with no males of working age), elderly people,<br />
or with male members unable to work, find it more<br />
difficult to cope with climatic hazards.<br />
AdAptAtion mEAsUREs to<br />
climAtE chAngE<br />
The communities formulated their adaptation measures<br />
to climate change on a participatory basis, based upon<br />
the prioritized climate scenarios. An average of nine<br />
adaptation measures was identified per community, with<br />
the following key features:<br />
strategies and Adaptation measures<br />
In their discussions on climate change the communities<br />
tended not to consider isolated measures or projects but<br />
rather to think in terms of a group of adaptation measures<br />
that could be prioritized together over time. They firmly<br />
believed that implementing adaptation “strategies” rather<br />
than “measures” should be the most important goal.<br />
These strategies vary significantly from one community to<br />
another regardless of their belonging to the same ecosystem.<br />
We noted that strategies differed not only in the type<br />
of measures included but also in their order of priority.<br />
The great variety of community adaptation strategies<br />
can be explained by the diversity of <strong>Bolivia</strong> in agroecological,<br />
cultural, social, and political<br />
terms. Community views on adaptation to climate<br />
change depend primarily on the communities´ level of<br />
exposure to climate change, the importance of the main<br />
lifestyle strategies in a particular community, available<br />
resources, and, finally, their experience with measures<br />
that have already been adopted in the past.<br />
the importance of implementing measures<br />
in sequence<br />
The communities believe that prioritized measures<br />
cannot be implemented haphazardly but must be carried
68 thE sociAl dimEnsions of AdAptAtion to climAtE chAngE in BoliviA<br />
out in strict order of precedence. This is determined by<br />
the fact that certain actions require the prior execution<br />
of measures that create the appropriate conditions for<br />
further measures to be undertaken. Changing the logical<br />
order of implementation runs the risk of not achieving<br />
the desired results. For example new breeds of animals<br />
should be introduced only after the question of how to<br />
feed the animals has been resolved, not vice versa.<br />
Adaptation is essentially a social process.<br />
Furthermore, the communities argued that identification<br />
and implementation of adaptation strategies are<br />
not individual processes relating to a single family. On<br />
the contrary, the strategies require groups and communities<br />
to participate and collaborate in this task.<br />
Effectively the strategies are regarded as “social strategies.”<br />
It follows that adaptation measures need to be<br />
analyzed, prioritized, and negotiated with the agreement<br />
of all members of the community. In the event major<br />
measures are needed (road construction, river basin<br />
management, etc.) negotiations should be undertaken<br />
jointly by various communities.<br />
Adaptation involves major changes in life systems.<br />
Communities believe that adaptation is not simply a<br />
question of investing in infrastructure but requires organizational<br />
development, training, and changes in living<br />
systems.<br />
Adaptation strategies involve changes to production<br />
systems, such as switching from rainfed to irrigated<br />
systems, switching from free grazing to controlled grazing<br />
or from extensive to intensive livestock raising.<br />
Adoption of these new production systems involves not<br />
only changes of economic logic but also technological,<br />
organizational, and financial changes. With regard to the<br />
latter, close attention has to be paid to the amount of<br />
capital available for investing in family production units.<br />
Water resource management as a basis for adaptation to<br />
climate change.<br />
Adaptation strategies include measures to manage water<br />
resources during both droughts and floods. A substantial<br />
number of proposals have been put forward for<br />
managing water, all of them targeted at ensuring water<br />
supply of the right quality and quanity and at the right<br />
time. Good water management involves constructing<br />
new capture and storage infrastructure, improving<br />
distribution systems, and optimizing water usage. This<br />
range of proposals by the communities can be summed<br />
up as follows: (i) the importance of capturing rainwater<br />
in the Altiplano and Valleys, storing it, and making best<br />
use of it at times of the year when it is scarcest; and<br />
(ii) to reduce the effect of flooding in the lowlands. All<br />
this implies shifting from rainfed to irrigated farming<br />
practices.<br />
Adaptation through grassland and forest management<br />
improvement.<br />
All the communities identified that grazing pastures<br />
were likely to deteriorate as a result of climate change<br />
and that their capacity to feed animals would diminish.<br />
In order to avoid overloading pastureland (resulting in<br />
further deterioration of grassland) the campesinos were<br />
of the opinion that major changes needed to be made<br />
to the ways in which pastures and forests were<br />
managed, i.e., to regulate access and develop methods<br />
for regenerating the vegetation cover. This change<br />
implies a major change in livestock farming methods—from<br />
free range to controlled grazing and semistabling—as<br />
well as for campesinos to spend more<br />
time on their livestock-related activities in order to<br />
produce more profitable herds. This obviously implies<br />
introducing new breeds, installing proper shelters,<br />
training, etc.<br />
Adaptation involving developing new complementary<br />
economic activities.<br />
Communities agree that farming alone will not be sufficient<br />
to tackle climate change and that it is necessary to<br />
develop other, higher value-added activities producing<br />
goods that can be sold to generate higher returns,<br />
processing farm produce, and developing mining activities<br />
and trades, etc.—all of which generally involves investing<br />
in technical training and organizational support.<br />
thE locAl institUtionAl<br />
fRAmEWoRK<br />
A favorable institutional framework for adaptation<br />
exists at local level.
d E v E l o p m E n t A n d c l i m A t E c h A n g E d i s c U s s i o n pA p E R s<br />
69<br />
The study revealed that all the municipalities private<br />
institutions (NGOs, producer associations, social organizations,<br />
and trade unions) over many years had<br />
fostered and supported development as an adjunct to<br />
the efforts of different levels of government.<br />
At least half of such private institutions had sufficient<br />
operational capacity to become useful partners in<br />
formulating public policy initiatives aimed at adaptation<br />
to climate change.<br />
thE viEW of locAl AUthoRitiEs<br />
A notable distinction exists between the views of communities<br />
and local authorities with regard to climate change.<br />
The local officials interviewed believe that climate<br />
change is something that will come about in the future<br />
and that tackling it would involve a series of adaptation<br />
measures, especially infrastructure-building.<br />
This approach differs substantially from that revealed in<br />
our interviews in the communities, where it is considered<br />
that climate change has been an accepted part of life for<br />
many years and that addressing it requires strategies to be<br />
developed—given that adaptation implies a fundamental<br />
change in livelihood strategies for communities, rather<br />
than being confined to one-off investments.<br />
Local authorities require national government support for<br />
developing their capacity to adapt to climate change.<br />
Local authority officials stressed that coordinated action<br />
between central and local governments was needed to<br />
adequately support adaptation measures. Local authorities<br />
argued that the following specific commitments<br />
from central government were required:<br />
1. Development and implementation of national standards<br />
to curb environmental degradation, particularly<br />
deforestation and grassland burning;<br />
2. Additional funding for municipal budgets targeted<br />
specifically at climate change adaptation;<br />
3. Irrigation projects to be undertaken at the national<br />
and departmental levels;<br />
4. Training and technical advice for municipal authorities<br />
and technical staff regarding the causes,<br />
effects, and possible impacts of climate change and<br />
an examination of the role of local government in<br />
addressing this problem.
70<br />
10. REcommEndAtions foR<br />
dEsigning policiEs in<br />
sUppoRt of AdAptAtion<br />
The following recommendations for formulating policies<br />
in support of adaptation to climate change are<br />
based upon the results of our study:<br />
1. We recommend that Central Government, when<br />
defining public policies for adaptation to climate<br />
change, should value the experience of the<br />
campesino and indigenous communities.<br />
Adaptation to climate change is nothing new in<br />
these communities, where people have developed<br />
appropriate livelihood systems in keeping with a<br />
dynamic and ever-changing environment. The<br />
communities possess a veritable storehouse of strategies<br />
and a wide and valuable diversity of responses<br />
to the problems. We believe, therefore, that efforts<br />
to define national climate change policies should<br />
rise above purely technical prescriptions and be<br />
enriched with the real life experiences of ordinary<br />
people living in the communities.<br />
2. Defining the adaptation measures (including the<br />
technical details) to be implemented must involve a<br />
coordinated dialogue between communities, supported<br />
by trained technical personnel and local government<br />
technical specialists.<br />
3. Public support for adaptation to climate change<br />
must be in line with the investment priorities of the<br />
communities themselves. Since the implementation<br />
of the Popular Participation Program, municipal<br />
investments have been identified and prioritized in<br />
community and municipal workshops in which civil<br />
society has had a direct role in decision-making.<br />
Prioritizing public investments in a community is a<br />
complex and sensitive process which depends largely<br />
on the information available to the campesinos and<br />
on the power relationships existing between them.<br />
In short, it is the result of a delicate negotiating<br />
process which can be destabilized by external<br />
intervention.<br />
4. We recommend that the different levels of government<br />
should create opportunities at the multi-community,<br />
regional, departmental, and national levels<br />
for deciding on the prioritization and scale of adaptation<br />
measures to be undertaken. It is clear that<br />
many adaptation-related investments extend beyond<br />
the purely local community environment.<br />
5. The state needs to take into account the fact that<br />
climate adaptation requires substantial investment<br />
in infrastructure (mainly water management) but<br />
that infrastructure investment is not by itself sufficient.<br />
Resources need to be targeted also at training,<br />
equipment, research, and organizational<br />
support. One-off, isolated investments will never<br />
succeed.<br />
6. We also recommend that within the scope of their<br />
powers and jurisdiction the different levels of government<br />
should formulate a clear and effective normative<br />
framework to support the efforts of the<br />
communities to regulate access to grassland and forests<br />
(a key element of adaptation). The study found<br />
that communities are planning to apply the rules<br />
governing communal access to natural resources in<br />
accordance with the new realities imposed by
d E v E l o p m E n t A n d c l i m A t E c h A n g E d i s c U s s i o n pA p E R s<br />
71<br />
climate change. However, given that the grasslands<br />
and forests extend beyond community lands, additional<br />
regulations will need to be formulated by the<br />
various levels of government.<br />
7. The central government should be required to provide<br />
more information and training to local authorities<br />
and specialists on climate change impacts and<br />
adaptation policies. Climate change is a new topic<br />
in <strong>Bolivia</strong>, and the sub-national levels of government<br />
do not yet have sufficient information to deal<br />
adequately with it.<br />
8. The State should be called upon to implement a<br />
comprehensive information program to raise the<br />
awareness of communities throughout the country<br />
about the causes, effects, and impacts of climate<br />
change, drawing on the results of studies and<br />
research. This information would assist communities<br />
to define as accurately as possible their own<br />
adaptation strategies.<br />
9. The State should also take into account that at local<br />
level a number of private institutions, social organizations,<br />
producer associations, etc. could be called<br />
upon to cooperate as partners with the government<br />
during the formulation of public climate adaptation<br />
policies.<br />
10. Climate change affects everyone, but some sectors<br />
are more vulnerable than others. Given that<br />
resources for proceeding with adaptation will be<br />
limited, the State must give preferential treatment<br />
to the most vulnerable sectors which, as identified<br />
in our study, are the poorest of the poor. The study<br />
succeeded in identifying communities in the central<br />
and southern Altiplano, the inter-Andean valleys,<br />
and the Chaco as well as the riverine communities<br />
in the lowlands. Other vulnerable sectors are:<br />
(i) those surviving on rainfed agriculture and extensive<br />
livestock farming; (ii) communities located on<br />
the banks of the rivers in the lowlands; (iii) households<br />
short of male workers, comprising elderly<br />
people and single women with young children, or<br />
those with male members physically unable to work;<br />
and (iv) extremely poor families who own little land<br />
or whose land is of such poor quality that production<br />
is negligible and who generally possess no savings<br />
to offset income losses and no capital to invest<br />
in adaptation.<br />
11. We recommend that for the above-mentioned most<br />
vulnerable sectors, the State should institute, in<br />
addition to its climate adaptation support programs,<br />
specific social protection programs<br />
designed to help the poorest families and communities<br />
to cope with the worst impacts of climate<br />
change. Thus, the Crop Insurance Program now<br />
underway should be designed in such a way that it<br />
is easily accessible to the people most vulnerable to<br />
climate change.
The World Bank Group<br />
1818 H Street, NW<br />
Washington, D.C. 20433 USA<br />
Tel: 202-473-1000<br />
Fax: 202-477-6391<br />
Internet: www.worldbank.org/climatechange