Values
Values
Values

Create successful ePaper yourself
Turn your PDF publications into a flip-book with our unique Google optimized e-Paper software.
82 Group Financial Statements<br />
Notes<br />
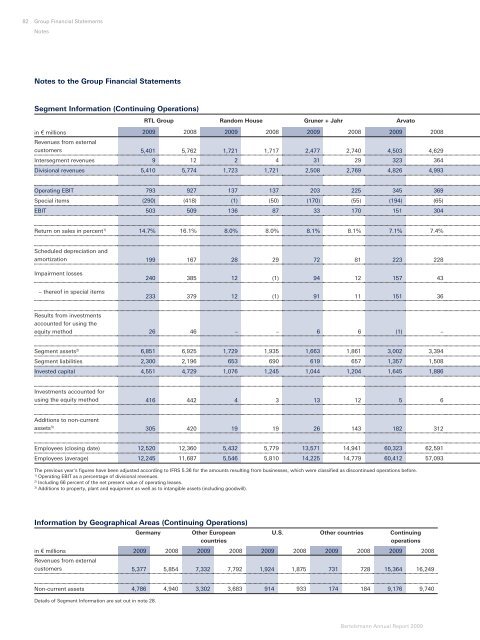
Notes to the Group Financial Statements<br />
Segment Information (Continuing Operations)<br />
in € millions<br />
RTL Group Random House Gruner + Jahr Arvato<br />
2009 2008 2009 2008 2009 2008 2009 2008<br />
Revenues from external<br />
customers 5,401 5,762 1,721 1,717 2,477 2,740 4,503 4,629<br />
Intersegment revenues 9 12 2 4 31 29 323 364<br />
Divisional revenues 5,410 5,774 1,723 1,721 2,508 2,769 4,826 4,993<br />
Operating EBIT 793 927 137 137 203 225 345 369<br />
Special items (290) (418) (1) (50) (170) (55) (194) (65)<br />
EBIT 503 509 136 87 33 170 151 304<br />
Return on sales in percent 1) 14.7% 16.1% 8.0% 8.0% 8.1% 8.1% 7.1% 7.4%<br />
Scheduled depreciation and<br />
amortization 199 167 28 29 72 81 223 228<br />
Impairment losses<br />
– thereof in special items<br />
240 385 12 (1) 94 12 157 43<br />
233 379 12 (1) 91 11 151 36<br />
Results from investments<br />
accounted for using the<br />
equity method 26 46 – – 6 6 (1) –<br />
Segment assets2) 6,851 6,925 1,729 1,935 1,663 1,861 3,002 3,394<br />
Segment liabilities 2,300 2,196 653 690 619 657 1,357 1,508<br />
Invested capital 4,551 4,729 1,076 1,245 1,044 1,204 1,645 1,886<br />
Investments accounted for<br />
using the equity method 416 442 4 3 13 12 5 6<br />
Additions to non-current<br />
assets 3)<br />
305 420 19 19 26 143 182 312<br />
Employees (closing date) 12,520 12,360 5,432 5,779 13,571 14,941 60,323 62,591<br />
Employees (average) 12,245 11,687 5,546 5,810 14,225 14,779 60,412 57,093<br />
The previous year’s figures have been adjusted according to IFRS 5.36 for the amounts resulting from businesses, which were classified as discontinued operations before.<br />
1) Operating EBIT as a percentage of divisional revenues.<br />
2) Including 66 percent of the net present value of operating leases.<br />
3) Additions to property, plant and equipment as well as to intangible assets (including goodwill).<br />
Information by Geographical Areas (Continuing Operations)<br />
Germany Other European<br />
U.S. Other countries Continuing<br />
countries<br />
operations<br />
in € millions<br />
Revenues from external<br />
2009 2008 2009 2008 2009 2008 2009 2008 2009 2008<br />
customers 5,377 5,854 7,332 7,792 1,924 1,875 731 728 15,364 16,249<br />
Non-current assets 4,786 4,940 3,302 3,683 914 933 174 184 9,176 9,740<br />
Details of Segment Information are set out in note 28.<br />
Bertelsmann Annual Report 2009