
You also want an ePaper? Increase the reach of your titles
YUMPU automatically turns print PDFs into web optimized ePapers that Google loves.
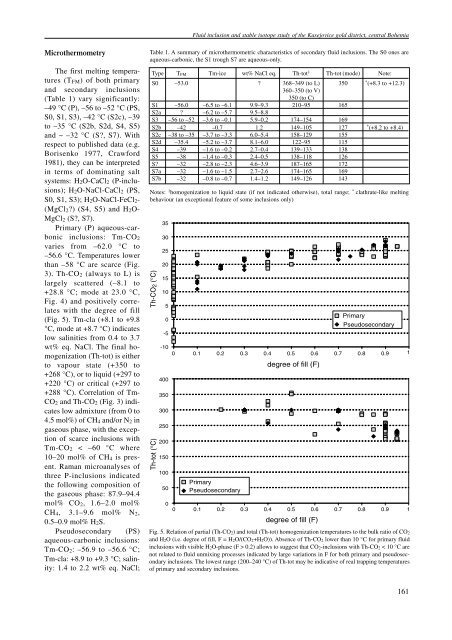
Fluid inclusion and stable isotope study of the Kasejovice gold district, central BohemiaMicrothermometryThe first melting temperatures(T FM ) of both primaryand secondary inclusions(Table 1) vary significantly:–49 °C (P), –56 to –52 °C (PS,S0, S1, S3), –42 °C (S2c), –39to –35 °C (S2b, S2d, S4, S5)and ~ –32 °C (S?, S7). Withrespect to published data (e.g.Borisenko 1977, Crawford1981), they can be interpretedin terms of dominating saltsystems: H 2 O-CaCl 2 (P-inclusions);H 2 O-NaCl-CaCl 2 (PS,S0, S1, S3); H 2 O-NaCl-FeCl 2 -(MgCl 2 ?) (S4, S5) and H 2 O-MgCl 2 (S?, S7).Primary (P) aqueous-carbonicinclusions: Tm-CO 2varies from –62.0 °C to–56.6 °C. Temperatures lowerthan –58 °C are scarce (Fig.3). Th-CO 2 (always to L) islargely scattered (–8.1 to+28.8 °C; mode at 23.0 °C,Fig. 4) and positively correlateswith the degree of fill(Fig. 5). Tm-cla (+8.1 to +9.8°C, mode at +8.7 °C) indicateslow salinities from 0.4 to 3.7wt% eq. NaCl. The final homogenization(Th-tot) is eitherto vapour state (+350 to+268 °C), or to liquid (+297 to+220 °C) or critical (+297 to+288 °C). Correlation of Tm-CO 2 and Th-CO 2 (Fig. 3) indicateslow admixture (from 0 to4.5 mol%) of CH 4 and/or N 2 ingaseous phase, with the exceptionof scarce inclusions withTm-CO 2 < –60 °C where10–20 mol% of CH 4 is present.Raman microanalyses ofthree P-inclusions indicatedthe following composition ofthe gaseous phase: 87.9–94.4mol% CO 2 , 1.6–2.0 mol%CH 4 , 3.1–9.6 mol% N 2 ,0.5–0.9 mol% H 2 S.Pseudosecondary (PS)aqueous-carbonic inclusions:Tm-CO 2 : –56.9 to –56.6 °C;Tm-cla: +8.9 to +9.3 °C; salinity:1.4 to 2.2 wt% eq. NaCl;Table 1. A summary of microthermometric characteristics of secondary fluid inclusions. The S0 ones areaqueous-carbonic, the S1 trough S7 are aqueous-only.Type T FM Tm-ice wt% NaCl eq. Th-tot 1 Th-tot (mode) Note:S0 –53.0 ? 368–349 (to L) 350 * (+8.3 to +12.3)360–350 (to V)350 (to C)S1 –56.0 –6.5 to –6.1 9.9–9.3 210–95 165S2a ? –6.2 to –5.7 9.5–8.8S3 –56 to –52 –3.6 to –0.1 5.9–0.2 174–154 169S2b –42 –0.7 1.2 149–105 127 * (+8.2 to +8.4)S2c –38 to –35 –3.7 to –3.3 6.0–5.4 158–129 155S2d –35.4 –5.2 to –3.7 8.1–6.0 122–95 115S4 –39 –1.6 to –0.2 2.7–0.4 139–133 138S5 –38 –1.4 to –0.3 2.4–0.5 138–118 126S? –32 –2.8 to –2.3 4.6–3.9 187–165 172S7a –32 –1.6 to –1.5 2.7–2.6 174–165 169S7b –32 –0.8 to –0.7 1.4–1.2 149–126 143Notes: 1 homogenization to liquid state (if not indicated otherwise), total range; * clathrate-like meltingbehaviour (an exceptional feature of some inclusions only)Th-CO2 (°C)Th-tot (°C)35302520151050-5-1004003503002502001501005000PrimaryPseudosecondaryPrimaryPseudosecondary0.1 0.2 0.3 0.4 0.5 0.6 0.7 0.8 0.9 1degree of fill (F)0.1 0.2 0.3 0.4 0.5 0.6 0.7 0.8 0.9 1degree of fill (F)Fig. 5. Relation of partial (Th-CO 2) and total (Th-tot) homogenization temperatures to the bulk ratio of CO 2and H 2O (i.e. degree of fill, F = H 2O/(CO 2+H 2O)). Absence of Th-CO 2 lower than 10 °C for primary fluidinclusions with visible H 2O-phase (F > 0.2) allows to suggest that CO 2-inclusions with Th-CO 2 < 10 °C arenot related to fluid unmixing processes indicated by large variations in F for both primary and pseudosecondaryinclusions. The lowest range (200–240 °C) of Th-tot may be indicative of real trapping temperaturesof primary and secondary inclusions.161