Automatic generation of elevation data over Danish landscape
Automatic generation of elevation data over Danish landscape
Automatic generation of elevation data over Danish landscape

You also want an ePaper? Increase the reach of your titles
YUMPU automatically turns print PDFs into web optimized ePapers that Google loves.
<strong>Automatic</strong> <strong>generation</strong><br />
<strong>of</strong> <strong>elevation</strong> <strong>data</strong><br />
<strong>over</strong> <strong>Danish</strong> <strong>landscape</strong><br />
Ph D-Thesis<br />
Marianne Wind<br />
Aalborg University<br />
2008
<strong>Automatic</strong> <strong>generation</strong><br />
<strong>of</strong> <strong>elevation</strong> <strong>data</strong><br />
<strong>over</strong> <strong>Danish</strong> <strong>landscape</strong><br />
Main part<br />
Ph D-Thesis<br />
version 1.1<br />
Marianne Wind<br />
Aalborg University<br />
2008
Abstract<br />
This thesis consists <strong>of</strong> two parts; a main part and an appendix. To get the full benefit and understanding<br />
<strong>of</strong> the thesis both parts should be read.<br />
This thesis is a review and analysis <strong>of</strong> an investigation into the automatic collection <strong>of</strong> <strong>elevation</strong> <strong>data</strong>. Elevation<br />
<strong>data</strong> can be collected “automatically” with IFSAR (InterFerometric Synthetic Aperture Radar), LI-<br />
DAR (Light Detection And Ranging, or “laser scanning”) or by automatic correlation <strong>of</strong> digital images. The<br />
focus <strong>of</strong> this thesis is on the automatic <strong>generation</strong> <strong>of</strong> <strong>elevation</strong> <strong>data</strong> from digital images based on automatic<br />
correlation. The programme Match-T is the basis for this investigation. A method for the proposal <strong>of</strong><br />
combining/integrating new z-measurements will also be mentioned. This method is to handle historic,<br />
present and future <strong>elevation</strong> <strong>data</strong> obtained from different sources.<br />
The thesis uses as its foundation previous investigations into automatic <strong>generation</strong> <strong>of</strong> <strong>elevation</strong> <strong>data</strong> by<br />
image correlation. These prior studies, however, have indicated that there is an influence between the<br />
image scale, image resolution, mesh size and <strong>landscape</strong> type on the accuracy <strong>of</strong> the generated <strong>elevation</strong><br />
<strong>data</strong>. This thesis will attempt to fill in the gaps in current academic understanding <strong>of</strong> the applicability <strong>of</strong><br />
automatic techniques for <strong>elevation</strong> <strong>data</strong> development and to see how this method interacts with <strong>Danish</strong><br />
<strong>landscape</strong> types.<br />
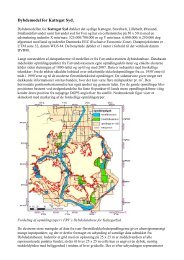
An area <strong>of</strong> typical <strong>Danish</strong> <strong>landscape</strong> has been chosen as a test case for this study. The <strong>landscape</strong> contains<br />
five different <strong>landscape</strong> types, such as open farm fields, forest, villages etc. Aerial images <strong>of</strong> this test<br />
area were taken in 3 different scales. At the start <strong>of</strong> this study, images had to be scanned in order to digitise<br />
them, they were therefore scanned in 3 different resolutions and more than 10,000 reference points<br />
were measured. A code was established to differentiate between each <strong>landscape</strong> type.<br />
To analyse each <strong>of</strong> the parameters- image scale, image resolution and mesh size- one <strong>of</strong> the parameters<br />
has to be kept constant, while the other two are changing. There have therefore been 3 3 (27) calculations<br />
carried out.<br />
The calculation flow for automatically generated <strong>elevation</strong> <strong>data</strong> is described. There is also an investigation<br />
into the results achieved, how gross errors are detected and eliminated by an iteration method and what<br />
accuracy can be obtained after elimination <strong>of</strong> the gross errors. First the influence <strong>of</strong> the three different parameters<br />
is described, then the influences <strong>of</strong> the five different <strong>landscape</strong> types are described.<br />
Finally, the thesis is concluded with a brief description <strong>of</strong> the calculation experience with the automatic<br />
<strong>generation</strong> method, and what influence <strong>of</strong> image scale, image resolution, grid size and <strong>landscape</strong> type<br />
has on the accuracy and a few suggestions for future investigations.<br />
At the end <strong>of</strong> the thesis, a new method to improve the accuracy <strong>of</strong> the <strong>elevation</strong>s, achieved by automatically<br />
<strong>generation</strong>, is introduced.
<strong>Automatic</strong> <strong>generation</strong> <strong>of</strong> <strong>elevation</strong> <strong>data</strong><br />
6
Table <strong>of</strong> contents:<br />
Table <strong>of</strong> contents:<br />
1 Introduction.............................................................................................................................. 11<br />
1.2 The motivation for the project ............................................................................................................11<br />
1.3 Digital Elevation Models ....................................................................................................................11<br />
1.3.1 Terrain model or surface model ..................................................................................................11<br />
1.4 Standards for Elevation models.........................................................................................................12<br />
1.4.1 Accuracy .....................................................................................................................................12<br />
1.4.2 Density ........................................................................................................................................12<br />
1.4.3 Currentness.................................................................................................................................12<br />
1.5 <strong>Danish</strong> digital <strong>elevation</strong> models .........................................................................................................12<br />
1.5.1 KMS DTM....................................................................................................................................12<br />
1.5.2 DDH – <strong>Danish</strong> Digital Height model............................................................................................13<br />
1.5.3 Near Future .................................................................................................................................13<br />
1.6 How to capture terrain <strong>data</strong> ...............................................................................................................13<br />
1.6.1 IFSAR - InterFerometric Synthetic Aperture Radar ....................................................................13<br />
1.6.2 LIDAR – LIght Detection And Ranging .......................................................................................14<br />
1.6.3 <strong>Automatic</strong> correlation within digital photogrammetry ..................................................................14<br />
1.7 Focus <strong>of</strong> the thesis.............................................................................................................................14<br />
1.8 Project delimitation ............................................................................................................................15<br />
1.9 Choice <strong>of</strong> method...............................................................................................................................15<br />
1.10 The structure <strong>of</strong> the project..............................................................................................................15<br />
2 Methods <strong>of</strong> determining <strong>elevation</strong> <strong>data</strong>....................................................................................19<br />
2.1 SAR....................................................................................................................................................19<br />
2.1.1 Interferometric SAR - IFSAR.......................................................................................................20<br />
2.1.2 The accuracy <strong>of</strong> the IFSAR method............................................................................................21<br />
2.1.3 The scope <strong>of</strong> the SAR method....................................................................................................22<br />
2.2 LIDAR ................................................................................................................................................22<br />
2.2.1 The principles <strong>of</strong> LIDAR ..............................................................................................................22<br />
2.2.2 The accuracy <strong>of</strong> LIDAR...............................................................................................................24<br />
2.2.3 Pros and cons <strong>of</strong> LIDAR..............................................................................................................24<br />
2.2.4 The scope <strong>of</strong> the LIDAR method.................................................................................................24<br />
2.3 Photogrammetric determination ........................................................................................................25<br />
2.3.1 Socet Set.....................................................................................................................................25<br />
2.3.1.1 Image pyramid......................................................................................................................25<br />
2.3.1.2 Orientation ............................................................................................................................26<br />
2.3.2 Normalisation ..............................................................................................................................26<br />
2.3.3 Correlation and the DTM <strong>generation</strong>...........................................................................................26<br />
2.3.4 ABM used in Socet Set ...............................................................................................................27<br />
2.3.5 The edge based method .............................................................................................................27<br />
2.3.6 Combination <strong>of</strong> the methods .......................................................................................................27<br />
2.3.7 Correlation and DEM <strong>generation</strong> ................................................................................................27<br />
2.3.7.1 Accuracy...............................................................................................................................28<br />
2.3.7.2 Pros and cons in the use <strong>of</strong> Socet Set .................................................................................28<br />
2.3.7.3 The scope <strong>of</strong> Socet Set ........................................................................................................28<br />
2.4 Match-T..............................................................................................................................................28<br />
2.4.1 Orientation <strong>of</strong> Match-T ................................................................................................................28<br />
2.4.1.1 Inner orientation....................................................................................................................28<br />
2.4.1.2 Absolute orientation..............................................................................................................29<br />
2.4.2 The pre-processing <strong>of</strong> primary <strong>data</strong> ............................................................................................29<br />
2.4.2.1 Normalisation........................................................................................................................29<br />
2.4.2.2 Image pyramid......................................................................................................................29<br />
2.4.2.3 Object pyramid .....................................................................................................................29<br />
2.4.3 Parameters for DEM <strong>generation</strong> .................................................................................................30<br />
7
<strong>Automatic</strong> <strong>generation</strong> <strong>of</strong> <strong>elevation</strong> <strong>data</strong><br />
2.4.3.1 Correlation ........................................................................................................................... 30<br />
2.4.3.2 The DEM <strong>generation</strong>............................................................................................................ 30<br />
2.4.4 Conversion <strong>of</strong> the grid points...................................................................................................... 34<br />
2.4.4.1 Accuracy .............................................................................................................................. 34<br />
2.4.4.2 Pros and cons <strong>of</strong> the photogrammetric method................................................................... 35<br />
2.4.4.3 The scope <strong>of</strong> the photogrammetric method......................................................................... 35<br />
2.5 Comparison <strong>of</strong> the three methods..................................................................................................... 35<br />
2.5.1 Choice <strong>of</strong> method ....................................................................................................................... 36<br />
2.6 Proposal for combining/integrating new z-measurements................................................................ 36<br />
3 Experience and investigation strategy..................................................................................... 41<br />
3.1 Background ....................................................................................................................................... 41<br />
3.2 A source study <strong>of</strong> experiences with Match-T .................................................................................... 41<br />
3.2.1 Results from the OEEPE-workshop ...........................................................................................43<br />
3.2.1.1 The result from Inpho GmbH ............................................................................................... 44<br />
3.2.1.2 Institut Cartogràfic de Catalunya ......................................................................................... 44<br />
3.2.1.3 Institut für Photogrammetrie, Stuttgart.................................................................................44<br />
3.2.1.4 National Geographical Institute, Brussels............................................................................ 44<br />
3.2.1.5 Investigation, Aalborg University ......................................................................................... 45<br />
3.2.2 Summation <strong>of</strong> the investigations from the OEEPE workshop .................................................... 45<br />
3.2.3 Summation <strong>of</strong> sources and OEEPE workshop........................................................................... 45<br />
3.3 The investigation strategy <strong>of</strong> this project........................................................................................... 47<br />
3.3.1 Accuracy in relation to flight altitude........................................................................................... 48<br />
3.3.2 Accuracy in relation to images resolution................................................................................... 48<br />
3.3.3 Accuracy in relation to mesh size............................................................................................... 48<br />
3.3.4 <strong>Danish</strong> <strong>landscape</strong> types ............................................................................................................. 48<br />
3.4 Selected investigations ..................................................................................................................... 48<br />
3.4.1 The influence <strong>of</strong> the scale .......................................................................................................... 48<br />
3.4.2 The influence <strong>of</strong> the pixel size .................................................................................................... 49<br />
3.4.3 The influence <strong>of</strong> the mesh size................................................................................................... 49<br />
3.4.4 The influence <strong>of</strong> the <strong>landscape</strong> type........................................................................................... 49<br />
3.5 Summation ........................................................................................................................................ 49<br />
4 The <strong>data</strong> material..................................................................................................................... 51<br />
4.1 The test area ..................................................................................................................................... 51<br />
4.2 Aerial photos ..................................................................................................................................... 52<br />
4.3 Control points .................................................................................................................................... 53<br />
4.4 Selection <strong>of</strong> models........................................................................................................................... 53<br />
4.5 The frame <strong>of</strong> reference...................................................................................................................... 53<br />
5 Preparation for the grid <strong>generation</strong>.......................................................................................... 57<br />
5.2 The set-up <strong>of</strong> Match-T....................................................................................................................... 57<br />
5.2.1 Image material............................................................................................................................ 58<br />
5.2.2 Geometric <strong>data</strong> ........................................................................................................................... 58<br />
5.2.3 External <strong>data</strong> .............................................................................................................................. 58<br />
5.2.4 Orientation <strong>of</strong> the model ............................................................................................................. 58<br />
5.2.4.1 Inner orientation................................................................................................................... 58<br />
5.2.4.2 Absolute orientation ............................................................................................................. 58<br />
5.2.5 Pre-processing <strong>of</strong> primary <strong>data</strong> .................................................................................................. 60<br />
5.2.5.1 Normalisation ....................................................................................................................... 60<br />
5.2.5.2 Image pyramid ..................................................................................................................... 60<br />
5.2.5.3 Object pyramid..................................................................................................................... 60<br />
5.2.6 The DEM <strong>generation</strong> .................................................................................................................. 60<br />
5.2.6.1 Correlation ........................................................................................................................... 61<br />
5.2.6.2 The finite-element reconstruction ........................................................................................ 61<br />
5.3 Grid calculation ................................................................................................................................. 61<br />
5.3.1.1 Monitor for individual programme steps............................................................................... 61<br />
5.3.1.2 Graphic online/<strong>of</strong>fline ........................................................................................................... 61<br />
5.3.1.3 Online statistics.................................................................................................................... 62<br />
8
Table <strong>of</strong> contents:<br />
5.3.2 The post-processing....................................................................................................................62<br />
5.3.2.1 DEM editing ..........................................................................................................................62<br />
5.3.2.2 DEM analysis........................................................................................................................62<br />
5.3.2.3 DEM output...........................................................................................................................63<br />
5.3.3 Choice <strong>of</strong> methods for a pre-analysis <strong>of</strong> <strong>data</strong> .............................................................................63<br />
6 Pre-analysis <strong>of</strong> the generated <strong>data</strong>..........................................................................................65<br />
6.2 The uniformity <strong>of</strong> the generated grids................................................................................................65<br />
6.2.1 The visualisation tool ”graphic online/<strong>of</strong>fline”..............................................................................65<br />
6.2.2 Control <strong>of</strong> the file sizes................................................................................................................68<br />
6.3 Analysis <strong>of</strong> the coding <strong>of</strong> the grid points............................................................................................68<br />
6.3.1 Summation ..................................................................................................................................70<br />
6.4 Elimination <strong>of</strong> gross correlation errors ...............................................................................................71<br />
6.4.1 The iteration process...................................................................................................................72<br />
6.5 Use <strong>of</strong> codes for identification <strong>of</strong> gross errors ...................................................................................73<br />
6.6 Partial conclusion...............................................................................................................................75<br />
7 The investigation...................................................................................................................... 77<br />
7.2 Accuracy before and after elimination <strong>of</strong> gross errors.......................................................................78<br />
7.2.1 Accuracy before elimination <strong>of</strong> gross errors................................................................................78<br />
7.2.2 Accuracy after elimination <strong>of</strong> gross errors...................................................................................79<br />
7.2.3 Summation ..................................................................................................................................80<br />
7.3 The influence <strong>of</strong> scale........................................................................................................................80<br />
7.3.1 Summation <strong>of</strong> scale.....................................................................................................................81<br />
7.4 The influence <strong>of</strong> pixel size .................................................................................................................81<br />
7.4.1 Summation <strong>of</strong> pixel size ..............................................................................................................82<br />
7.5 The influence <strong>of</strong> mesh size................................................................................................................82<br />
7.5.1 Summation <strong>of</strong> mesh size.............................................................................................................83<br />
7.5.2 Common conclusion....................................................................................................................83<br />
7.5.3 The pixel size on the ground.......................................................................................................83<br />
7.5.4 The number <strong>of</strong> pixels per mesh size ...........................................................................................84<br />
7.6 The influence <strong>of</strong> the <strong>landscape</strong> type..................................................................................................86<br />
7.6.1 The accuracy for different <strong>landscape</strong> types including gross errors ............................................86<br />
7.6.2 The accuracy for different <strong>landscape</strong> types excluding gross errors ...........................................88<br />
7.6.3 Gross errors and the <strong>landscape</strong> type..........................................................................................89<br />
7.6.4 Summation for the <strong>landscape</strong> types............................................................................................90<br />
7.6.5 Correlation errors or objects in the terrain? ................................................................................90<br />
7.6.6 Summation ..................................................................................................................................94<br />
7.7 Partial conclusion...............................................................................................................................94<br />
7.7.1 Experiences in table form............................................................................................................95<br />
8 Results on the basis <strong>of</strong> Chapter 7............................................................................................97<br />
8.2 Exclusion <strong>of</strong> the <strong>landscape</strong> types ......................................................................................................97<br />
8.2.1 Results without gross errors .......................................................................................................98<br />
8.2.2 Percentage <strong>of</strong> eliminated points..................................................................................................98<br />
8.2.3 Summation ................................................................................................................................100<br />
8.3 Method for locating gross errors......................................................................................................100<br />
8.3.1 Object or correlation error .........................................................................................................104<br />
8.4 Partial conclusion.............................................................................................................................105<br />
9 Theory and practice............................................................................................................... 107<br />
9.2 The scale .........................................................................................................................................107<br />
9.3 The pixel size...................................................................................................................................108<br />
9.4 The mesh size .................................................................................................................................108<br />
9.5 The <strong>landscape</strong> type .........................................................................................................................109<br />
9.6 Summation.......................................................................................................................................109<br />
9.7 Experiences and currentness ..........................................................................................................110<br />
10 Conclusion and perspectives...............................................................................................113<br />
10.2 Background....................................................................................................................................113<br />
10.3 The results achieved......................................................................................................................113<br />
9
<strong>Automatic</strong> <strong>generation</strong> <strong>of</strong> <strong>elevation</strong> <strong>data</strong><br />
10.3.1 The scale and resolution <strong>of</strong> the images.................................................................................. 114<br />
10.3.2 The mesh size ........................................................................................................................ 114<br />
10.3.3 The <strong>landscape</strong> type ................................................................................................................ 114<br />
10.3.4 Accuracy................................................................................................................................. 114<br />
10.3.5 Eliminated points .................................................................................................................... 114<br />
10.4 Recommendation .......................................................................................................................... 114<br />
10.5 Data fusion .................................................................................................................................... 115<br />
10.6 Perspectives.................................................................................................................................. 115<br />
10.6.1 <strong>Automatic</strong> elimination <strong>of</strong> problematic areas............................................................................ 115<br />
10.6.2 <strong>Automatic</strong> localisation and elimination <strong>of</strong> gross errors ........................................................... 116<br />
10.7 Outlook for future work in this field................................................................................................ 116<br />
References ............................................................................................................................... 119<br />
Acknowledgement .................................................................................................................... 125<br />
10
1 Introduction<br />
1 Introduction<br />
The subject <strong>of</strong> this project is the <strong>generation</strong> <strong>of</strong> digital <strong>elevation</strong> <strong>data</strong> for the use in map production, among<br />
other things. The project originated at Aalborg University, and continued in co-operation with the <strong>Danish</strong><br />
National Survey and Cadastre. The basis <strong>of</strong> the project is the automatic correlation models used in the<br />
programme package Match-T, as this was accessible at Aalborg University. Furthermore, other quite general<br />
methods and problems <strong>of</strong> generating <strong>elevation</strong> <strong>data</strong> are discussed. As the project was done in cooperation<br />
with the National Survey and Cadastre, <strong>Danish</strong> traditions for surveying and mapping are inherent<br />
in this investigation.<br />
1.2 The motivation for the project<br />
The use <strong>of</strong> geo-spatial <strong>data</strong> has increased dramatically during the last <strong>generation</strong>. In almost all areas <strong>of</strong><br />
our society today, geo-spatial <strong>data</strong> plays a major role. This is valid on a global as well as on a local level.<br />
Monitoring pollution and changes <strong>of</strong> climate are examples <strong>of</strong> applications where worldwide geo-spatial<br />
<strong>data</strong> is required. At the local level, there is an increased demand for accurate and up-to-date information.<br />
Geo-spatial <strong>data</strong> used in a Geographic Information Systems (GIS) allows for greater possibilities in analysing,<br />
planning and decision making.<br />
The technological development <strong>of</strong> computers with increased computing capacity and speed, in addition to<br />
a series <strong>of</strong> new computer applications, has made it easier to handle and process large amounts <strong>of</strong> geospatial<br />
<strong>data</strong> quicker. This has made geo-spatial analysis more accessible for a broader audience. The increased<br />
use is primarily driven by the accelerated development within the digital and technological world,<br />
<strong>of</strong>fering new possibilities as regards the use <strong>of</strong> geo-spatial <strong>data</strong> on the web, wap, in car navigation systems,<br />
cell phones, digital mini calendars etc.<br />
The increased use <strong>of</strong> geo-spatial <strong>data</strong> sets new standards for its use, as the end users expect better<br />
(more accurate, denser etc.) and more reliable (up to date) <strong>data</strong>. Geo-spatial <strong>data</strong> is 3D <strong>data</strong>. In this project,<br />
the emphasis is only on the z-value or, in other words, <strong>elevation</strong> <strong>data</strong>.<br />
1.3 Digital Elevation Models<br />
In today’s Denmark, digital <strong>elevation</strong> models play an important role in research, in public administration as<br />
well as in private business for a variety <strong>of</strong> purposes. These include traditional map production (as contour<br />
lines), rectification <strong>of</strong> aerial and satellite photos (true orthophotos), flood analysis, flow simulations, construction<br />
planning (new roads, buildings), volume estimates <strong>of</strong> soil, trace optimisation, 3D animation, 3D<br />
graphics, prognosis estimates, accuracy demands, updating demands, <strong>data</strong> quantity etc. etc. [Larsen,<br />
1996; KMS, 2005].<br />
1.3.1 Terrain model or surface model<br />
When dealing with <strong>elevation</strong> models, there is a distinction between two types <strong>of</strong> models: terrain models<br />
and surface models.<br />
Figure 1.1: The principles <strong>of</strong> a terrain model (green line) and surface model (red line).<br />
11
<strong>Automatic</strong> <strong>generation</strong> <strong>of</strong> <strong>elevation</strong> <strong>data</strong><br />
A terrain model reproduces the ground surface without objects such as houses and trees, as illustrated in<br />
figure 1.1 with the green line. Terrain models are, among other things, used as grid models for orthophoto<br />
rectification, flood analysis, and volume estimation <strong>of</strong> soil.<br />
A surface model, on the other hand, also describes the <strong>elevation</strong> <strong>of</strong> objects, such as houses, trees etc.<br />
That is to say, a surface model includes terrain as well as objects. In figure 1.1., the surface model is indicated<br />
with the red line. Surface models are used for 3D animation, trace optimisation and true orthophoto<br />
rectification, among other applications.<br />
1.4 Standards for Elevation models<br />
Users have required new standards for <strong>elevation</strong> <strong>data</strong> based on their uses and applications. These new<br />
demands fall into the following three categories:<br />
12<br />
� Accuracy<br />
� Density<br />
� Currentness<br />
1.4.1 Accuracy<br />
Different users <strong>of</strong> <strong>elevation</strong> models have different demands for how accurate the <strong>elevation</strong> model has to<br />
be. Users in the building construction industry and environmental authorities demand an accuracy on the<br />
centimetre level.<br />
Users such as 3D animators or 3D graphicers do not require an accuracy on the centimetre level, but can<br />
still use an <strong>elevation</strong> model with a high accuracy.<br />
1.4.2 Density<br />
Accuracy on its own is actually not good enough if the mesh size is too large. What good will it be if, at<br />
one point on the mesh, the accuracy is within 10 centimetres and the next point, which is maybe 50 metres<br />
away, also has an accuracy within 10 centimetres, but there is no description <strong>of</strong> the terrain between<br />
the mesh points. A grid with a small mesh size represents the terrain better than a grid with a large mesh<br />
size. An <strong>elevation</strong> model described with high accuracy also needs to contain a small mesh size.<br />
1.4.3 Currentness<br />
Elevation models and geo-spatial <strong>data</strong> in general are only snapshots or a status <strong>of</strong> the <strong>landscape</strong> or area<br />
they represent. As the <strong>landscape</strong> changes <strong>over</strong> time, the <strong>elevation</strong> model describing the area becomes<br />
outdated, corresponding to the degree <strong>of</strong> change. This yields unreliable <strong>data</strong> in the <strong>elevation</strong> model.<br />
As times goes by, the <strong>elevation</strong> model slowly degenerates and becomes more and more unreliable, and<br />
in analyses where time is a crucial parameter, outdated information will have an effect on the accuracy<br />
and reliability <strong>of</strong> the results obtained from the analysis.<br />
1.5 <strong>Danish</strong> digital <strong>elevation</strong> models<br />
In Denmark there are two national digital <strong>elevation</strong> models in existence; an old one within the framework<br />
<strong>of</strong> the National Survey and Cadastre (25 x 25 m) (KMS DTM), and one within the framework <strong>of</strong> the firm<br />
COWI A/S (2 x 2 m) <strong>Danish</strong> Digital Height model (DDH). A new, national <strong>elevation</strong> model within the<br />
framework <strong>of</strong> the National Survey and Cadastre is in production and will be available in the very near future.<br />
1.5.1 KMS DTM<br />
In connection with the production <strong>of</strong> the national vector atlas TOP10DK in the beginning <strong>of</strong> the 1990s, the<br />
National Survey and Cadastre wanted to add an <strong>elevation</strong> model. It was decided to produce a new digital<br />
<strong>elevation</strong> model on the basis <strong>of</strong> the 2.5m contours from the topographic maps in scale 1:25,000 which<br />
were scanned and vectored. To achieve an even greater accuracy, the 2.5m contours have been combined<br />
with <strong>elevation</strong> <strong>data</strong> from different themes from TOP10DK. Examination <strong>of</strong> the 2.5m contours shows<br />
that the accuracy lies in the interval from 1m to 1.5m with a few gross errors up to 2.3 m, in spite <strong>of</strong> the
1 Introduction<br />
expectation that the inclusion <strong>of</strong> the TOP10DK themes would eliminate gross errors with unknown location<br />
[Larsen, 1998].<br />
1.5.2 DDH – <strong>Danish</strong> Digital Height model<br />
Another national <strong>elevation</strong> model is established by the firm COWI A/S (www.cowi.dk) by LIght Detection<br />
And Ranging (LIDAR), and forms part <strong>of</strong> the so-called DDH, or Denmark’s Digital Height model. The <strong>elevation</strong><br />
model has mesh points <strong>of</strong> 2 x 2m. This model has not been accessible for this project, and is therefore<br />
not dealt with any further.<br />
1.5.3 Near Future<br />
A third national <strong>elevation</strong> model will come into existence in the very near future. The National Survey and<br />
Cadastre has formed a public consortium with the purpose <strong>of</strong> establishing a national laser scanned <strong>elevation</strong><br />
model by the beginning <strong>of</strong> 2009.<br />
The primary characteristics <strong>of</strong> the future model are, a mesh size <strong>of</strong> 1.6 x 1.6m and a spatial accuracy on a<br />
average <strong>of</strong> 20cm, but for well defined objects better than 15cm, in all three dimensions.<br />
The establishment <strong>of</strong> this new <strong>elevation</strong> model cannot be expected to be retaken within, at least, 20-30<br />
years after being launched. However, there is no doubt that it will degenerate. The question is, how it can<br />
be kept updated by using low cost methods?<br />
1.6 How to capture terrain <strong>data</strong><br />
The search is for a method to capture terrain <strong>data</strong> for updating purposes, based on automatic techniques<br />
that keep manual work to a minimum. Today, three methods are mainly used for (automatic) capture <strong>of</strong><br />
large amount <strong>of</strong> <strong>elevation</strong> <strong>data</strong>:<br />
� IFSAR (InterFerometric Synthetic Aperture Radar also called interferomtric SAR)<br />
� LIDAR (Light Detection And Ranging also called laser scanning)<br />
� <strong>Automatic</strong> correlation within digital photogrammetry<br />
SAR<br />
Figure1.3: Area c<strong>over</strong>ed by the three methods <strong>of</strong> surveying.<br />
Digital photogrammetry<br />
Scale 1:25.000<br />
Laser Scanning<br />
As all three methods will be dealt with in detail in chapter 2, they are, therefore, only briefly presented<br />
here.<br />
1.6.1 IFSAR - InterFerometric Synthetic Aperture Radar<br />
New SAR methods from <strong>over</strong>flights, IFSAR - InterFerometric Synthetic Aperture Radar, arrived on the<br />
market ten years ago.<br />
13
<strong>Automatic</strong> <strong>generation</strong> <strong>of</strong> <strong>elevation</strong> <strong>data</strong><br />
In Denmark, this method is still on a trial basis, but it has been used in other countries for <strong>elevation</strong> <strong>data</strong><br />
capture. The firm INTERMAP in Canada, for example, has collected <strong>elevation</strong> <strong>data</strong> <strong>over</strong> large parts <strong>of</strong><br />
North and Central America and some areas in Europe and Asia. Further information can be found at<br />
www.intermaptechnologies.com. At www.GLOBALterrain.com an <strong>over</strong>view <strong>of</strong> areas c<strong>over</strong>ed by INTER-<br />
MAP <strong>elevation</strong> <strong>data</strong> may be found.<br />
A few characteristics <strong>of</strong> IFSAR should be mentioned here.<br />
Pros:<br />
Cons:<br />
14<br />
� IFSAR is an active system and can therefore be used 24 hours per day<br />
� IFSAR c<strong>over</strong>s large areas, compared to other automatic methods for collecting <strong>elevation</strong> <strong>data</strong>.<br />
� IFSAR suffers from, the so called, shadow effect problems<br />
� IFSAR has a low accuracy compared to other methods<br />
1.6.2 LIDAR – LIght Detection And Ranging<br />
Since the beginning <strong>of</strong> the 1990s, it has also been possible to determine <strong>elevation</strong>s by means <strong>of</strong> laser<br />
scanning, today called LIDAR (Light Detection and Ranging).<br />
A few characteristics <strong>of</strong> LIDAR should also be mentioned here.<br />
Pros:<br />
Cons:<br />
� LIDAR is also an active system, like IFSAR, and can, in principal, be used 24 hours per day<br />
� LIDAR has a high accuracy compared to other methods<br />
� LIDAR c<strong>over</strong>s a small area and is therefore quite an expensive method if large areas need to be<br />
measured.<br />
� LIDAR suffers from the shadow effect, but not to such a degree as does IFSAR.<br />
1.6.3 <strong>Automatic</strong> correlation within digital photogrammetry<br />
Since the end <strong>of</strong> the 1980s, possibilities for automatic determination <strong>of</strong> <strong>elevation</strong> <strong>data</strong>, from digital images<br />
with digital photogrammetry, have appeared. The method is based on cross correlation in <strong>over</strong>lapping images,<br />
and the method is used today to a greater extent by photogrammetric firms. Various correlation<br />
methods are dealt with in Appendix A.<br />
Characteristics <strong>of</strong> automatic correlation-<br />
Pros:<br />
Cons:<br />
� There is no extra expense because the digital images used for updating the geographical <strong>data</strong><br />
can also be used for automatic <strong>generation</strong> <strong>of</strong> <strong>elevation</strong>s.<br />
� The desired accuracy can only be achieved by using high scale images.<br />
1.7 Focus <strong>of</strong> the thesis<br />
As this search for a method for collecting <strong>elevation</strong> <strong>data</strong> where the use <strong>of</strong> manual work is kept to a minimum,<br />
only IFSAR, LIDAR and digital photogrammetry will be dealt with. The manual methods are, therefore,<br />
not included in this project. IFSAR and LIDAR will only be briefly described, as they are automatic<br />
but demand a flight <strong>of</strong> their own and are, therefore, expensive.
1 Introduction<br />
Today, the <strong>Danish</strong> national geo-spatial <strong>data</strong>bases have an update cycle <strong>of</strong> 5 to 10 years. In the future, the<br />
update cycle will be 3 to 5 years. The updating process for geographical <strong>data</strong> will be done using digital<br />
images. Aerial images will, therefore, be taken <strong>over</strong> the whole <strong>of</strong> Denmark within a cycle <strong>of</strong> 3 to 5 years.<br />
Because the images already exist, it is natural that the next step is to focus on the evaluation <strong>of</strong> <strong>elevation</strong><br />
models generated by automatic correlation.<br />
When the method <strong>of</strong> automatic <strong>generation</strong> <strong>of</strong> <strong>elevation</strong> is chosen, questions <strong>of</strong> which image scale, image<br />
resolution and mesh size would be most beneficial must be asked. Their parameters have to be valued,<br />
together with the <strong>landscape</strong> type which the images c<strong>over</strong>.<br />
The goal <strong>of</strong> this thesis is to analyse and value the accuracy that can be achieved by<br />
automatic <strong>generation</strong> in consideration <strong>of</strong> scale and/or resolution <strong>of</strong> the digital images,<br />
the mesh size in which the grid is determined and to analyse the influence <strong>of</strong> the<br />
<strong>landscape</strong> types which the images c<strong>over</strong>.<br />
1.8 Project delimitation<br />
This project will only deal with <strong>elevation</strong> <strong>data</strong> for a terrain model. The aim is to find a suitable method for<br />
capturing <strong>elevation</strong> <strong>data</strong> that satisfies the needs <strong>of</strong> its users, and to examine the problems and accuracies<br />
in different types <strong>of</strong> <strong>landscape</strong>. This method must be automatic, require a minimum <strong>of</strong> manual editing and<br />
provide a level <strong>of</strong> accuracy that meets or nearly meets the precedents set by LIDAR techniques. The<br />
<strong>landscape</strong> type town will not form part <strong>of</strong> the project, as <strong>elevation</strong> <strong>data</strong> <strong>of</strong> the major part <strong>of</strong> the town areas<br />
are already in existence.<br />
None <strong>of</strong> the existing <strong>Danish</strong> terrain models will be used directly in the project. The <strong>data</strong> analysis uses<br />
original <strong>data</strong> that carries neither preconceived qualifications <strong>of</strong> its accuracy nor adjustments or improvements.<br />
1.9 Choice <strong>of</strong> method<br />
The existing methods for automatic determination <strong>of</strong> <strong>elevation</strong> <strong>data</strong> are IFSAR, LIDAR from flights and<br />
automatic correlation in digital photogrammetry, where <strong>elevation</strong> <strong>data</strong> is generated from digital images.<br />
The principles <strong>of</strong> IFSAR and LIDAR will only be described briefly in the project. The main focus is laid on<br />
the methods used in digital photogrammetry for automatic <strong>generation</strong> <strong>of</strong> <strong>elevation</strong>s from digital images.<br />
Two applications in particular are used in Denmark: Socet Set (Leica/Helava) and Match-T (Inpho GmbH,<br />
Stuttgart). Match-T is sold as an independent application or as a module in the Intergraph package, and<br />
as a module in the Zeiss Phodis package. These two programme packages, Socet Set and Match-T, will<br />
be described, and the main emphasis will be on Match-T. This choice is due to the fact that Match-T, as a<br />
stand alone programme, was available at Aalborg University when the project started. All later studies<br />
and analyses in this project are done on the basis <strong>of</strong> the Match-T programme. IFSAR and the LIDAR are<br />
included in the project as possible supplementary methods.<br />
1.10 The structure <strong>of</strong> the project<br />
Chapter 1: Introduction<br />
The motivation and delimitation <strong>of</strong> the project is described.<br />
Chapter 2: Methods <strong>of</strong> determining <strong>elevation</strong> <strong>data</strong><br />
The theory behind different automatic methods for collection <strong>of</strong> <strong>elevation</strong> <strong>data</strong>, including IFSAR, LIDAR<br />
and automatic <strong>generation</strong> <strong>of</strong> <strong>elevation</strong> from digital aerial photos, is discussed. As regards the first two<br />
methods, only the principles, pros and cons and accuracy are discussed, while the main emphasis is laid<br />
on digital photogrammetry. In this section, Socet Set and Match-T are described, Match-T in detail.<br />
The problem <strong>of</strong> updating <strong>data</strong> which deals with merging historic, present and future <strong>data</strong>, as a method for<br />
the proposal <strong>of</strong> combining/integrating new z-measurements, will also be briefly described here.<br />
15
<strong>Automatic</strong> <strong>generation</strong> <strong>of</strong> <strong>elevation</strong> <strong>data</strong><br />
Chapter 3: Experiences with Match-T and the investigation strategy<br />
A source study <strong>of</strong> other people’s investigations and experiences with Match-T is described. Investigations<br />
with Match-T have shown that different parameters can influence the result <strong>of</strong> automatic <strong>generation</strong> <strong>of</strong><br />
<strong>elevation</strong>s from digital images, for instance, the scale <strong>of</strong> the images, their resolution, the mesh size and<br />
the <strong>landscape</strong> type. On the background <strong>of</strong> this source study, the investigation strategy <strong>of</strong> the project is established.<br />
Chapter 4: The <strong>data</strong> material<br />
A test area is chosen south <strong>of</strong> Aalborg University. The area is chosen because <strong>of</strong> its varied terrain and its<br />
location close to the university. The area includes open, flat and hilly fields, woods, a residential<br />
neighbourhood (suburb), and gravel pits with steep slopes. This small test area represents a broad segment<br />
<strong>of</strong> the kind <strong>of</strong> <strong>landscape</strong> types found in Denmark. At the start <strong>of</strong> this thesis digital cameras did not<br />
exist, therefore the area was photographed in three scales, and the images have been scanned in three<br />
different resolutions. Further, a description is given <strong>of</strong> the establishment <strong>of</strong> the frame <strong>of</strong> reference for the<br />
quality control <strong>of</strong> the individual tests. The frame <strong>of</strong> reference consists <strong>of</strong> <strong>elevation</strong>s that are measured with<br />
superior accuracy. Appendix B includes a detailed description <strong>of</strong> the establishment <strong>of</strong> the frame <strong>of</strong> reference,<br />
Chapter 4 is a brief summary <strong>of</strong> this.<br />
Chapter 5: Preparation for grid <strong>generation</strong><br />
As preparation for the <strong>elevation</strong> determination, Match-T is configured. The parameters used are discussed.<br />
Chapter 6: Pre-analysis <strong>of</strong> the generated grids<br />
Match-T’s own modules for the indication <strong>of</strong> problems with the individual grid points in the automatically<br />
generated grids are investigated. Also, a superior evaluation <strong>of</strong> the completeness <strong>of</strong> the automatically<br />
generated grids is carried out.<br />
Chapter 7: The investigation<br />
The evaluation and analysis <strong>of</strong> the results from the individual calculations have been done step by step.<br />
The first step is a simple determination <strong>of</strong> the <strong>elevation</strong> difference between the calculated results and the<br />
frame <strong>of</strong> reference. Another comparison is done after elimination <strong>of</strong> gross errors. It has been investigated<br />
whether the scale, resolution, mesh size and <strong>landscape</strong> type <strong>of</strong> the images have had any influence. Possible<br />
gross errors have been localised and analysed.<br />
Chapter 8: Results on the basis <strong>of</strong> Chapter 7<br />
The experiences gained in Chapter 7 are summarised and finalised. Then an <strong>elevation</strong> model <strong>of</strong> the test<br />
area is generated, where the experiences with the method and the influence <strong>of</strong> the <strong>Danish</strong> <strong>landscape</strong> on<br />
the results are discussed, and the accuracy is evaluated. The possibility <strong>of</strong> eliminating possible gross errors<br />
by combining <strong>data</strong> obtained by the different resolutions has been attempted.<br />
Chapter 9: Theory and practice<br />
After the analysis <strong>of</strong> the results, these have been held up to the theory and experience <strong>of</strong> others. How do<br />
theory and practice compare? Where and why are results obtained that do not correspond to the theory?<br />
On the basis <strong>of</strong> the investigations carried out, possible improvements are discussed, and a method for<br />
automatic <strong>data</strong> collection in Denmark is recommended.<br />
Chapter 10: Conclusion and perspectives<br />
The suitability <strong>of</strong> the automatic correlation method is evaluated in relation to the determination <strong>of</strong> a nationwide<br />
terrain model <strong>of</strong> Denmark. Furthermore, potential future studies based on the project are discussed.<br />
This thesis also includes an appendix in four parts, A, B, C and D:<br />
� A Correlation techniques<br />
� B The <strong>data</strong> material<br />
16
� C Description <strong>of</strong> the PIL programme<br />
� D Description <strong>of</strong> the Klip programme<br />
1 Introduction<br />
Appendix A: Correlation techniques<br />
In this appendix, the most frequently used correlation techniques in digital photogrammetry are described,<br />
both techniques which are directly relevant for understanding the theory used in the project (Match-T),<br />
and techniques which are included to give a better background knowledge and understanding <strong>of</strong> correlation<br />
techniques in general.<br />
Appendix B: The <strong>data</strong> material<br />
This appendix includes a description <strong>of</strong> the material used in the project, that is, the test area with typically<br />
<strong>Danish</strong> <strong>landscape</strong> types, aerial photos from three different altitudes, scanned in three resolutions, control<br />
points and the basis for comparison. The appendix is divided into two parts, the first consisting <strong>of</strong> the description<br />
<strong>of</strong> the material, the second <strong>of</strong> the description <strong>of</strong> the process <strong>of</strong> capturing control points and the<br />
basis <strong>of</strong> comparison, consisting <strong>of</strong> analytically measured points in a 25 x 25m grid (the frame <strong>of</strong> reference).<br />
Appendix C: Description <strong>of</strong> the PIL programme<br />
With a view to the examination and evaluation <strong>of</strong> automatically generated <strong>elevation</strong>s in relation to a frame<br />
<strong>of</strong> reference, an analytical tool is needed. It has been estimated that there is no commercial programme<br />
which fulfils the demands for an analytical tool. Therefore, a programme has been developed specifically<br />
for this purpose, called the PIL programme (PIL translated from <strong>Danish</strong> is “arrow” in English). This programme<br />
is described in Appendix C.<br />
Appendix D: The Klip programme<br />
A description <strong>of</strong> a small programme, called ”Klip”, used for the cut-out <strong>of</strong> unwanted rows and columns in<br />
the automatically generated grids (Klip translated from <strong>Danish</strong> is “clip” in English).<br />
17
2 Methods <strong>of</strong> determining <strong>elevation</strong> <strong>data</strong><br />
2 Methods <strong>of</strong> determining <strong>elevation</strong> <strong>data</strong><br />
As mentioned earlier, several different methods are used today for the automatic determination <strong>of</strong> <strong>elevation</strong><br />
<strong>data</strong>, among others, IFSAR, laser scanning and digital photogrammetry. In this chapter, the methods<br />
are described with the main stress on digital photogrammetry, and Match-T in particular. Each description<br />
includes the principles, accuracy, pros and cons, and scope <strong>of</strong> the individual methods.<br />
Figure 2.1: The SAR principle shown from a satellite<br />
(drawn by B.P. Olsen).<br />
2.1 SAR<br />
In practice, the concept <strong>of</strong> SAR images is used as a collective concept without distinguishing specifically<br />
between the different radar techniques. Radar technology is an active system with an antenna which<br />
sends as well as receives an electromagnetic impulse from a high altitude, originally from a satellite, but<br />
today also from an aeroplane. Originally, radar technology was called RAR (Real Aperture Radar) and is<br />
defined as:<br />
�<br />
L � �<br />
D<br />
where: L = The band width<br />
R<br />
Figure 2.2: Aeroplane with SAR-antenna.<br />
For the RAR method’s c<strong>over</strong>age, the length <strong>of</strong> the antenna is important, the distance between antenna<br />
and band width (determined by flying altitude and the angle <strong>of</strong> the Impulse) and the frequency <strong>of</strong> the impulse.<br />
The band width is synonymous with the resolution <strong>of</strong> the radar images (pixel size) which should be as<br />
small as possible. This means that the relationship between wavelength � and the length <strong>of</strong> the antenna<br />
D (�/D) should be as small as possible, that is, either the wavelength � is decreased, or the antenna<br />
length D is increased, see formula 2.1. A much used wavelength area is the C band which has a wavelength<br />
<strong>of</strong> approx. 5.7cm . Often a pixel size <strong>of</strong> maximum 2m is wanted, i.e., that a typical antenna <strong>of</strong> 10m<br />
entails a surveying distance R (the flying altitude) <strong>of</strong> only ~ 350m. Vice versa, the surveying from a satellite<br />
at 800 km altitude will entail a pixel size <strong>of</strong> ~ 4.5 km!<br />
(2.1)<br />
� = The wavelength<br />
D = The length <strong>of</strong> the antenna<br />
R = The distance between the band width and the antenna, here the flight altitude<br />
19
<strong>Automatic</strong> <strong>generation</strong> <strong>of</strong> <strong>elevation</strong> <strong>data</strong><br />
The example mentioned shows the drawback <strong>of</strong> RAR. This drawback has formed the basis for the development<br />
<strong>of</strong> SAR. SAR stands for Synthetic Aperture Radar, i.e., that by means <strong>of</strong> mathematical algorithms<br />
an artificially (synthetic) long antenna is created. By adhering to the flying altitude, for instance <strong>of</strong> a satellite,<br />
the pixel size is determined by the �/D term alone, which has led to the development <strong>of</strong> mathematical<br />
algorithms to decrease this term. The algorithms are based on the Doppler effect, whereby an artificially<br />
long antenna L can be calculated.<br />
The background is that every object is included in more than one <strong>of</strong> the radar measurements and,<br />
thereby, registered several times from different positions on the flight path. With the signal which is returned<br />
the first time to the radar, an object in the range <strong>of</strong> vision <strong>of</strong> the radar beams will have a positive<br />
Doppler change which will gradually be decreased to zero, when the plane is at right angles to the object<br />
(P). Subsequently, the Doppler change will gradually become more and more negative, see figure 2.3.<br />
Figure 2.3: Doppler sequence for <strong>over</strong> flying a point<br />
and the impact <strong>of</strong> the effect on the frequency in different<br />
positions [Elachi, 1987].<br />
If an antenna is mounted on a plane, it will generally be on the side <strong>of</strong> the plane, and therefore the radar<br />
impulse is sent from the side. This increases the area <strong>of</strong> c<strong>over</strong>age. This method is the one used most <strong>of</strong>ten<br />
in practice., it is called SLAR (Side Looking Aperture Radar), and by far the major part <strong>of</strong> so-called<br />
SAR images are in reality SLAR images and will throughout the project be referred to as SAR, see figure<br />
2.4.<br />
Several factors have an impact on the reflected signal, both in relation to the radar system, and to influences<br />
from the surface and the surroundings. In the radar system, the factors are the wavelength used,<br />
the angle from which the signal is sent and the polarisation. A surface will reflect the radar signal differently,<br />
depending on the structure <strong>of</strong> the ground surface. The sensitivity <strong>of</strong> the radar to these influences<br />
depends, among other things, on the wavelength and the polarisation. The last circumstance is used in<br />
polarimetric SAR which is used for area analysis, among other things, but not for <strong>elevation</strong> determination,<br />
which is why it is not described any further in this project.<br />
2.1.1 Interferometric SAR - IFSAR<br />
The technique <strong>of</strong> IFSAR consists <strong>of</strong> registering two <strong>data</strong> sets <strong>over</strong> the same area. This can be done by<br />
having two antennas mounted on the plane and staggered in relation to each other, so that the distance<br />
from the antennas to the object are a little different, see figure 2.4.<br />
The result <strong>of</strong> IFSAR is an image, called an interferomegram. The pixel values in an interferomegram are<br />
indicated as a fraction <strong>of</strong> the wavelength, by which the return signal has been staggered. When the position<br />
<strong>of</strong> the satellite/plane, the distance between the antennas, the angle <strong>of</strong> emission from the two antennas,<br />
and the fraction <strong>of</strong> the wavelength are known, it is possible to determine the <strong>elevation</strong> <strong>of</strong> the object<br />
on the ground. This form <strong>of</strong> interferometry is called XTI, ”Across-Track Interferometry”, see figure 2.4. Alternatively,<br />
the two photos can be taken with the same antenna if the plane or the satellite pass the same<br />
area twice on staggered flight paths. This form is called RTI ”Repeat-Track Interferometry”.<br />
20<br />
Aeroplane<br />
Flying altitude<br />
R2<br />
Radar antenna<br />
R1<br />
Object height<br />
Figure 2.4: The SLAR principle shown from an aeroplane.
2 Methods <strong>of</strong> determining <strong>elevation</strong> <strong>data</strong><br />
The IFSAR system can also be space-borne. An example <strong>of</strong> that is the IFSAR system onboard the Shuttle<br />
Radar Topography Mission flown in Feb. 2000. IFSAR system can also be airborne.<br />
2.1.2 The accuracy <strong>of</strong> the IFSAR method<br />
Normally, a better <strong>elevation</strong> determination is obtained by the RTI method than by the XTI method but, on<br />
the other hand, the <strong>data</strong> processing and calibration <strong>of</strong> the RTI method is more difficult and it demands<br />
more manual treatment.<br />
The IFSAR system onboard the Shuttle Radar Topography Mission has been flown in Feb. 2000. From<br />
the collected interferometric radar <strong>data</strong>, a near global digital <strong>elevation</strong> model c<strong>over</strong>ing the Earth’s surface<br />
in between -56 0 and +60 0 , (which c<strong>over</strong>s 80% <strong>of</strong> the Earth’s landmass) has been made [Kobrick, 2006]<br />
According to [Werner, 2001] the global digital <strong>elevation</strong> model has an absolute <strong>elevation</strong> accuracy <strong>of</strong> �<br />
16m. A c<strong>over</strong>, with a range between -56 0 and +60 0 means that there will be interferometric radar <strong>data</strong><br />
<strong>over</strong> Denmark. It is not known to the author, whether there has been any investigation <strong>of</strong> the <strong>data</strong> from<br />
the Shuttle Radar Topography Mission <strong>over</strong> Denmark. The goal for the Shuttle Radar Topography Mission<br />
was to process a near as possible global digital <strong>elevation</strong> model <strong>of</strong> the planet earth. With this in mind<br />
an accuracy <strong>of</strong> �16m is good but, from a <strong>Danish</strong> point <strong>of</strong> view, we are looking for a method, which gives a<br />
better accuracy. In this thesis, the focus will therefore be on air-borne rather than space-borne IFSAR images.<br />
With the RTI method from an aeroplane, an accuracy <strong>of</strong> 0.2m – 0.3m horizontally can be obtained, while<br />
with the XTI method from an aeroplane,, an accuracy <strong>of</strong> only 5m – 10m horizontally can be reached. It<br />
has been indicated that the vertical accuracy <strong>of</strong> the XTI method is better than 1m [Skriver et al., 1999]. An<br />
investigation from Baden Württemberg shows the <strong>elevation</strong> differences range between – 3.3m and 1.5m<br />
and with a standard deviation <strong>of</strong> �1m - �1.3m. [Kleusberg et la., 1999]. Clearly, these examples show,<br />
that both the RTI and XTI methods are not accurate enough.<br />
Pros and cons <strong>of</strong> IFSAR:<br />
Among the pros are:<br />
� IFSAR is independent <strong>of</strong> sunlight, and can therefore also be used during the hours <strong>of</strong> darkness.<br />
� IFSAR is independent <strong>of</strong> weather conditions in the atmosphere and on the ground. However,<br />
this is not the case if the SAR images are taken after the RTI principle, as the images from one<br />
day will not be comparable to the images taken 24 hours later if, for instance, it has been raining.<br />
� Radar wavelengths are longer than visible and infrared light, and if the structure <strong>of</strong> the ground<br />
surface is larger than the wavelength (i.e. approx. 10cm ), structure can also be measured.<br />
� Data is born digital, that is, digital mapping can be done on primary <strong>data</strong>.<br />
� C<strong>over</strong>s a large area quickly and cheaply.<br />
Among the cons are:<br />
� Poor resolution compared to other methods <strong>of</strong> <strong>elevation</strong> determination<br />
� Small scale<br />
� Image disturbances<br />
21
<strong>Automatic</strong> <strong>generation</strong> <strong>of</strong> <strong>elevation</strong> <strong>data</strong><br />
22<br />
� Shadow effects in areas with significant variations, see figure 2.5<br />
SAR<br />
Figure 2.5: Example <strong>of</strong> the shadow problem.<br />
2.1.3 The scope <strong>of</strong> the SAR method<br />
The primary strength <strong>of</strong> the SAR method is that it c<strong>over</strong>s large areas <strong>of</strong> land quickly. In Denmark, IFSAR<br />
from an aeroplane, is still on a trial basis, but it has been used in other countries for <strong>elevation</strong> <strong>data</strong> collection,<br />
the firm INTERMAP, for example, has collected <strong>elevation</strong> <strong>data</strong> <strong>over</strong> large parts <strong>of</strong> North and Central<br />
America, also some places in Europe and Asia. As mentioned earlier, further information can be found on<br />
the internet address www.intermaptechnologies.com. On the internet address www.GLOBALterrain.com,<br />
an <strong>over</strong>view <strong>of</strong> areas c<strong>over</strong>ed by INTERMAP <strong>elevation</strong> <strong>data</strong> may be found.<br />
2.2 LIDAR<br />
LIDAR is done from planes at an altitude <strong>of</strong> approx. 1 km, in special cases, though, from a helicopter at,<br />
for instance, an altitude <strong>of</strong> 350m. The laser system is, like radar, an active system which emits an electromagnetic<br />
signal which is reflected from the ground surface. See figure 2.6.<br />
2.2.1 The principles <strong>of</strong> LIDAR<br />
With LIDAR, the distance is determined on the basis <strong>of</strong> the time difference between the emission <strong>of</strong> the<br />
signal and its reception:<br />
R � ½ � c � t<br />
(2.2)<br />
where: R = the difference between plane and ground surface<br />
Shadow area<br />
Figure 2.6: An example <strong>of</strong> laser scanning [Wehr et al., 1999].
c = the speed <strong>of</strong> light<br />
2 Methods <strong>of</strong> determining <strong>elevation</strong> <strong>data</strong><br />
t = the time difference between the emission <strong>of</strong> the signal and its reception<br />
1<br />
/2 = as the time is determined twice <strong>over</strong>, when the signal moves down and up again<br />
In order to convert this distance to a level, the position and orientation <strong>of</strong> the plane must be determined at<br />
the same time. This is done by means <strong>of</strong> GPS (Global Positioning System) and INS (Inertial Navigation<br />
System). Thus, there are three systems which must be co-ordinated to determine <strong>elevation</strong> <strong>data</strong>.<br />
The laser signal can be emitted in different ”figures” according to the type <strong>of</strong> scanner. The most important<br />
are oscillating mirror, Palmer scan, rotating mirror and fibre scanner, see figure 2.7.<br />
Figure 2.7: Examples <strong>of</strong> different surveying methods for laser scanning [Rasmussen et al., 2000].<br />
1) With the oscillating mirror, a mirror tilts from side to side, thereby creating a zigzag formed grid,<br />
created by the plane’s forward motion.<br />
2) With Palmer scan, a mirror is fastened to an axis with a slight inclination compared to normal.<br />
When the axis is rotated, the laser will create an elliptical display, but with the propulsion <strong>of</strong> the<br />
plane, the grid will be displayed as a spiral.<br />
3) With a rotating mirror, a mirror polygon rotates, whereby a regular grid is obtained. This method<br />
is also called rotating polygon.<br />
4) The fibre scanner is built to a slightly different concept than the aforementioned systems. While<br />
systems 1 - 3 send the laser beam in a specific direction by means <strong>of</strong> a mirror, in this case an<br />
established optical fibre bundle is used which creates a fan <strong>over</strong> the <strong>landscape</strong>. By means <strong>of</strong> a<br />
”Fibre switch” the laser light is sent by turns to the different optical fibres. As the case in point is<br />
a static optical fibre bundle, the grid on the ground will be regular. [Rasmussen et al., 2000 and<br />
Wehr et al., 1999 b].<br />
The size <strong>of</strong> the area (the breadth <strong>of</strong> the strip) which is c<strong>over</strong>ed by LIDAR depends on the angle <strong>of</strong> the laser<br />
beam and the flight altitude. To scan broadly is a great advantage as regards the economy <strong>of</strong> the survey.<br />
However, it is not an immediate advantage as, by increased scanning angle, problems <strong>of</strong> accuracy<br />
will occur. By increasing the scanning angle, the angle <strong>of</strong> impact on the points to be measured will be<br />
lower, the longer from the centre line the measuring is done, so, the accuracy <strong>of</strong> the horizontal determination<br />
will be somewhat poorer as regards the outermost measured points. The choice <strong>of</strong> scanning angle is,<br />
therefore, a balance between price and precision. In general, the systems can scan up to a breadth <strong>of</strong><br />
1.12 times the flight altitude [Rasmussen et al., 2000].<br />
The strength <strong>of</strong> the reflected signal depends on the strength <strong>of</strong> the emitted signal, but also on the type <strong>of</strong><br />
surface the signal reaches, as a light surface will reflect more than a dark one. Tests have shown that naked<br />
earth/sand reflects 10% - 20 %, vegetation 30% - 50% and snow and ice 80% [Wever, 1999, Wever<br />
et la., 1999].<br />
23
<strong>Automatic</strong> <strong>generation</strong> <strong>of</strong> <strong>elevation</strong> <strong>data</strong><br />
2.2.2 The accuracy <strong>of</strong> LIDAR<br />
The greatest contribution to errors in connection with LIDAR stems from the determination <strong>of</strong> the plane’s<br />
position at the time <strong>of</strong> shooting. Particularly <strong>over</strong> broken terrain, this may result in gross errors, where a<br />
staggering <strong>of</strong> the x, y-position may result in gross <strong>elevation</strong> errors. The accuracy <strong>of</strong> levels determined by<br />
means <strong>of</strong> LIDAR lies between 0.1m and 0.6m with typical values <strong>of</strong> 0.15m – 0.20m. The deviations on the<br />
planimetric co-ordinates is given as lying in the interval between 0.5m and 2m [Rasmussen et al., 2000].<br />
The survey done in Denmark <strong>over</strong> 73 urban areas have 1m grids with a level accuracy <strong>of</strong> 0.15m [telephone<br />
conversation with P. Nørgaard, COWI A/S, 2004].<br />
2.2.3 Pros and cons <strong>of</strong> LIDAR<br />
Among the pros are:<br />
24<br />
� LIDAR is an active system which can be used without regard to sun and light conditions. LIDAR<br />
can be performed in all seasons and at any time during day or night [Wever et la., 1999].<br />
� LIDAR is not dependent on the texture <strong>of</strong> the ground surface, which makes the method suitable<br />
for use in wet areas, <strong>over</strong> ice and snow, along tracks etc. [Wever, 1999].<br />
� LIDAR produces points with a high degree <strong>of</strong> density.<br />
� A very good degree <strong>of</strong> level accuracy can be obtained with LIDAR.<br />
Among the cons are:<br />
� Weather conditions in the form <strong>of</strong> rain, low clouds, fog or ground mist, do not allow the use <strong>of</strong><br />
LIDAR [Wever et la., 1999]. This is due to the fact that the laser wave cannot be reflected by<br />
water, where the signal will be ”eaten” [telephone conversation with P. Nørgaard, COWI A/S,<br />
2002].<br />
� LIDAR demands moderate wind conditions, that is, under 10 m/s [telephone conversation with<br />
P. Nørgaard, COWI A/S 2002]. The wind conditions have no influence on the LIDAR itself, but<br />
on flight navigation, and thereby on the final accuracy <strong>of</strong> the level determination.<br />
� LIDAR has a shadow problem behind tall objects, but the problem is not very big, as the scanning<br />
angle does not deviate much from the vertical axis <strong>of</strong> the plane.<br />
2.2.4 The scope <strong>of</strong> the LIDAR method<br />
LIDAR is recognised as an accurate and efficient <strong>data</strong> source for digital surface model <strong>generation</strong> in urban<br />
areas including buildings. Highly accurate models <strong>of</strong> the surface <strong>of</strong> urban areas are becoming widely<br />
used in applications such as digital orthophoto production, three-dimensional city modelling, and threedimensional<br />
building reconstruction [Stoker et la. 2006].<br />
The LIDAR method has already been used in several countries to create/update a digital terrain model<br />
and in special areas where other methods for <strong>elevation</strong> extractions are not sufficient [Wever et la., 1999].<br />
In the Netherlands, for instance, a nationwide national DTM has been created by means <strong>of</strong> LIDAR<br />
[Vosselman, 2000]. In Denmark a new national <strong>elevation</strong> model based on the LIDAR method will be completed<br />
in the beginning <strong>of</strong> 2009.<br />
Helicopters are used for low flights and special tasks such as, for instance, determining the <strong>elevation</strong> <strong>of</strong><br />
pylons [Lohr et al., 1999].<br />
Other examples for the use <strong>of</strong> LIDAR are monitoring <strong>of</strong> coastal erosion, simulation <strong>of</strong> different areas in<br />
order to determine engineering works and simulation <strong>of</strong> antenna sites or line-<strong>of</strong>-sight calculations for mobile<br />
communication networks [Lohr, 1999].<br />
The signal sent from a laser scanner is reflected by buildings, trees, cars, electric wires and many other<br />
objects from either the top, the middle or the bottom [Vosselman, 2000]. When LIDAR is used <strong>over</strong><br />
woods, it will <strong>of</strong>ten result in double reflection, or several reflections from treetops, bushes in the undergrowth<br />
and the ground surface respectively [Petzold et al., 2000]. As regards scanning <strong>of</strong> areas with deciduous<br />
trees, there are great differences between summer and winter. The reflection from the forest floor
2 Methods <strong>of</strong> determining <strong>elevation</strong> <strong>data</strong><br />
in summer constitutes 25% - 40% <strong>of</strong> the total reflection, while the figure in winter is 70% [Ackermann,<br />
1999].<br />
In several tests, LIDAR has been used <strong>over</strong> built-up areas. As regards establishing a 3D town model, a<br />
surface model is needed including, among other things, trees and houses with a point density <strong>of</strong> approx.<br />
one point per 1 m 2 [Brenner et al., 1999]. According to [MacIntosh et al., 2000] LIDAR is used more and<br />
more for determination <strong>of</strong> a 3D town model.<br />
[Hyyppä et al., 2000] describe how the LIDAR method <strong>of</strong>fers good opportunities for estimating tree <strong>elevation</strong>s<br />
quickly, and thereby determining tree volume and the biomass <strong>of</strong> the wood <strong>over</strong> extensive forest areas.<br />
In Finland, an investigation has shown that around 30% <strong>of</strong> the first signal is reflected directly from<br />
the ground surface. By increasing the number <strong>of</strong> impulses, it is possible to determine every individual<br />
tree, and, furthermore, the gap between the trees.<br />
In Denmark, including Greenland, it is interesting to note what accuracy the LIDAR method can <strong>of</strong>fer by<br />
determination <strong>of</strong> <strong>elevation</strong>s <strong>over</strong> glaciers/ice/snow. Different investigations have shown that it is possible<br />
to obtain an <strong>elevation</strong> accuracy <strong>of</strong> 0.1m – 0.2m <strong>over</strong> the Greenland ice cap. The same investigation<br />
shows a similar accuracy <strong>of</strong> 0.1m – 0.2m <strong>over</strong> a Norwegian glacier [Favey et al., 2000].<br />
2.3 Photogrammetric determination<br />
During the past 10 - 15 years, digital photogrammetry has gained ground in Denmark, and today forms an<br />
integral part <strong>of</strong> the work routines <strong>of</strong> the photogrammetric firms. Within digital photogrammetry there are<br />
several commercial programme packages on <strong>of</strong>fer. In Denmark, the most widespread programmes for<br />
automatic <strong>generation</strong> <strong>of</strong> <strong>elevation</strong>s are Socet Set and Match-T. Socet Set is a part <strong>of</strong> the Helava/Leica<br />
package. Match-T is an independent programme package which is also sold as a programme module in<br />
the Intergraph package and the Zeiss Phodis package respectively under the names TopoSURF or<br />
Phodis TS. These two programmes have been chosen for a closer description. Match-T has, furthermore,<br />
been chosen to be part <strong>of</strong> the investigation proper in this project. Match-T is therefore described in detail,<br />
while Socet Set is described on a more superficial level.<br />
Common to all the photogrammetric methods are the digital images. These may come from different<br />
sources, such as radar images, aerial photos, terrestrial images etc. Some are born digital, whilst others<br />
must undergo scanning, before they can be used.<br />
The following specific sections about Socet Set and Match-T respectively are set out to present the methods<br />
and principles <strong>of</strong> the two programme packages, and their anticipated accuracy, pros and cons etc.<br />
These descriptions are taken from literature/studies at the beginning <strong>of</strong> this millennium.<br />
2.3.1 Socet Set<br />
Socet Set has been developed and marketed by Helava/Leica and has found its uses all <strong>over</strong> the world.<br />
At the time <strong>of</strong> writing, it has not been possible to get details about the correlation principles in use in Socet<br />
Set. Contact has been made with the firms and institutions which use Socet Set here in Denmark to<br />
obtain information, but they have not been able to furnish sufficient information for a full understanding <strong>of</strong><br />
the programme. A literary study has also been undertaken to find the mathematics behind the programme,<br />
but without success. Helava/Leica Systems have been contacted to get information about specific<br />
correlation methods and DTM <strong>generation</strong> used in Socet Set, again without success. Therefore, it is<br />
not possible to present or discuss details concerning the correlation methods and mathematical algorithms<br />
used in Socet Set.<br />
In the following, the module for orientation <strong>of</strong> the images and the module for automatic <strong>generation</strong> <strong>of</strong> <strong>elevation</strong>s<br />
is described, together with the different calculation possibilities included in the module.<br />
The first step in the Socet Set programme is the build-up <strong>of</strong> an image pyramid, then the images are orientated,<br />
normalised and correlated, the <strong>elevation</strong> <strong>data</strong> is determined, and a DTM is generated.<br />
2.3.1.1 Image pyramid<br />
As mentioned previously the first step is the build-up <strong>of</strong> an image pyramid. The image pyramid can be<br />
built according to the principles described in Appendix 1, section A.1.5. The image pyramid is used,<br />
25
<strong>Automatic</strong> <strong>generation</strong> <strong>of</strong> <strong>elevation</strong> <strong>data</strong><br />
among other things, at the showing <strong>of</strong> the images in different resolutions by, for instance, the inner orientation.<br />
2.3.1.2 Orientation<br />
Inner orientation<br />
The determination <strong>of</strong> the inner orientation <strong>of</strong> the images may be done analogously or fully automatically.<br />
By means <strong>of</strong> the keyed-in camera information and the location <strong>of</strong> the fiducial marks, Socet Set can determine<br />
the inner orientation automatically. The first fiducial mark must be indicated, but it does not have<br />
to be very accurate. The correlation for the inner orientation is done by an ordinary area based matching<br />
(ABM), where the programme has a fiducial mark library, where the most frequently used fiducial marks<br />
are located as a target (see a closer description <strong>of</strong> ABM in Appendix A, section A.1.2). In general, an<br />
analogous description will not give a better determination than the automatic one.<br />
Relative orientation<br />
To determine the relative orientation, Socet Set needs information about <strong>over</strong>lap and terrain <strong>elevation</strong>.<br />
This information is given by indicating the centre <strong>of</strong> the images, the flight altitude and a rough indication <strong>of</strong><br />
the terrain <strong>elevation</strong>. By means <strong>of</strong> this information, the programme calculates how big the <strong>over</strong>lap with the<br />
surrounding images is. With the knowledge <strong>of</strong> the images’ inner orientation, their centre and the flight altitude,<br />
Socet Set is well informed about the location <strong>of</strong> the images in relation to each other. Thereby, Socet<br />
Set can determine automatically the connecting points by taking a window segment in one image and correlating<br />
this with the other image or images, and thus create the relative orientation [Bacher, 1998].<br />
Absolute orientation<br />
The possibilities <strong>of</strong> automating the absolute orientation is less than for the inner and relative orientation.<br />
This is due to the fact that the control points can vary in form and grey level values. With the absolute orientation<br />
it is, therefore, necessary to point out the control points manually in the first image and they are<br />
then determined automatically in the remaining images, where the control point may be found [Bacher,<br />
1998].<br />
When the orientation <strong>of</strong> the images is done, they can be normalised, then the correlation and the DTM<br />
<strong>generation</strong> can go forward.<br />
2.3.2 Normalisation<br />
To limit the following correlation from a two-dimensional problem to a one-dimensional one, the images<br />
are normalised, that is, the epipolar lines are determined, cf. Appendix A, section A.1.4. Normalisation <strong>of</strong><br />
the images is done in Socet Set ”on the fly” [Zhang et al., 1997]. The dynamic Y parallax sampling algorithm<br />
works after the following principles:<br />
26<br />
1) Division <strong>of</strong> the image into small blocks<br />
2) For each block, a number <strong>of</strong> reliable residuals are determined, Y parallaxes, by searching in two<br />
dimensions.<br />
3) Use <strong>of</strong> the residuals from the 2nd principle to compensate the correlation <strong>of</strong> all images within<br />
each block.<br />
For each area in the image, where a correlation is wanted, the images are normalised, and the correlation<br />
is calculated. The result <strong>of</strong> the normalisation is not kept on the hard disk, but the calculation is done again<br />
and again which saves storage capacity.<br />
2.3.3 Correlation and the DTM <strong>generation</strong><br />
This part is described superficially, as it has not been possible to obtain information about the mathematical<br />
background behind the correlation and the subsequent DTM <strong>generation</strong>.<br />
In Socet Set the correlation is done according to three different methods:<br />
� The area based matching (ABM)<br />
� Edges used in feature based matching (FBM)
� A combination <strong>of</strong> the above (the hybrid method)<br />
2 Methods <strong>of</strong> determining <strong>elevation</strong> <strong>data</strong><br />
2.3.4 ABM used in Socet Set<br />
On the basis <strong>of</strong> the grey level strength <strong>of</strong> the image, it is possible to correlate conjugating points along<br />
conjugating epipolar lines. Such a strategy demands that the points in evidence have the same intensity<br />
in each <strong>of</strong> the images, and that there is a significant intensity variation in both images.<br />
Furthermore, a signal correlation algorithm is used which can choose an approximated window size, dependent<br />
on the images’ strength <strong>of</strong> intensity (grey level strength), to reach a precise as well as a stable<br />
estimate <strong>of</strong> a correlation. This method is used to find the correct window size for the correlation [Zhang et<br />
al, 1997].<br />
As a method for the ABM the least square matching (LSM) is mentioned [Zhang et al., 1997]. For a more<br />
detailed description, see also Appendix A, section A.1.2.3.2.<br />
2.3.5 The edge based method<br />
The edges used in FBM are used to establish correlation between image points by correlating the images’<br />
grey level pattern along conjugating epipolar lines. Edges are detected, and the best correlation between<br />
these edges intersection with conjugating epipolar lines is sought. Of course, this method will not function<br />
well if the image areas have no edges or, if it is difficult to detect the edges precisely, see also Appendix<br />
A, section A.1.3.2.<br />
The edges used in FBM have the advantage <strong>over</strong> the ABM in that it is less influenced by noise in the images.<br />
2.3.6 Combination <strong>of</strong> the methods<br />
In Socet Set, the two methods are used in combination, so that critical image points are correlated in relation<br />
to the representation <strong>of</strong> the terrain and the frequency <strong>of</strong> errors is reduced. The combination method<br />
uses the intensity value, intensity edges, varying values, varying edges and first and second derived values<br />
<strong>of</strong> the images to find the correct correlation [Zhang et al., 1997].<br />
If a correlation algorithm functions with a high degree <strong>of</strong> success, it can automatically generate a sufficiently<br />
close DEM with very little or no manual editing.<br />
2.3.7 Correlation and DEM <strong>generation</strong><br />
The correlation and the DEM <strong>generation</strong> is done by the so-called Adaptive <strong>Automatic</strong> Terrain Extradition<br />
(AATE). AATE works on the basis <strong>of</strong> a ”set <strong>of</strong> rules” consisting <strong>of</strong> some previously known information.<br />
This set <strong>of</strong> rules is based on three components [Zhang et al., 1997]:<br />
� Rules <strong>of</strong> thumb and knowledge <strong>of</strong> the system<br />
� A set <strong>of</strong> reasonable/logical conclusions<br />
� Applications for interfaces<br />
This information lies in an ASCII-file. The information can be divided into two types:<br />
� Fact rules to define fact values<br />
� Input rules to gather fact values from the user<br />
In AATE, a set <strong>of</strong> correlation parameters is generated which is a function <strong>of</strong> terrain types, signal strength,<br />
flight altitude and X,Y-parallax.<br />
The concept is based on a set <strong>of</strong> rules created on the basis <strong>of</strong> knowledge <strong>of</strong> how to generate a set <strong>of</strong> correlation<br />
parameters through an intensive theoretical analysis and practical experiments.<br />
27
<strong>Automatic</strong> <strong>generation</strong> <strong>of</strong> <strong>elevation</strong> <strong>data</strong><br />
2.3.7.1 Accuracy<br />
Tests made <strong>over</strong> an area in Southern Germany near Stuttgart gave an accuracy <strong>of</strong> 0.5‰ - 1.2‰ <strong>of</strong> the<br />
flight altitude. A closer investigation <strong>of</strong> the contribution <strong>of</strong> the <strong>landscape</strong> types to errors showed that an<br />
accuracy <strong>of</strong> 0.4‰ – 1.1‰ <strong>of</strong> the flight altitude could be obtained <strong>over</strong> all types <strong>of</strong> <strong>landscape</strong>, except from<br />
the edge <strong>of</strong> woods, where the accuracy was 1.8‰ <strong>of</strong> the flight altitude [Bacher, 1998].<br />
Another test done in Norway shows that with the use <strong>of</strong> the standard setting, an accuracy <strong>of</strong> 0.6‰ – 1.3‰<br />
<strong>of</strong> the flight altitude can be obtained without editing [Nilsen, 1998].<br />
2.3.7.2 Pros and cons in the use <strong>of</strong> Socet Set<br />
As both Socet Set and Match-T are based on photogrammetry, the pros and cons will be the same for the<br />
two programmes, and will therefore be described jointly in section 2.4.3.5.<br />
2.3.7.3 The scope <strong>of</strong> Socet Set<br />
As the scope <strong>of</strong> the photogrammetric method, and thus for Socet Set is the same as for Match-T, these<br />
will be described jointly in section 2.4.3.6.<br />
2.4 Match-T<br />
Like Socet Set, Match-T is a programme package for automatic <strong>generation</strong> <strong>of</strong> heights from digital images.<br />
When this project was started the digital images could only be obtained by scanning images. Today images<br />
from digital cameras are accessible. DTM <strong>generation</strong> with digital frame sensors differs little from the<br />
use <strong>of</strong> scanned aerial photographs. The matching strategy has been changed in Match-T 4.0 from a<br />
model by model, to a block oriented process [Heuchel, 2005]. Which has had no influence on the results<br />
in this project.<br />
The Match-T package is used directly in this investigation and is, therefore, described with a greater degree<br />
<strong>of</strong> detail than the preceding methods.<br />
The process in Match-T can be divided into three parts. First, the images are orientated and various parameters<br />
are stated. Then comes the calculation part, which can be divided into calculation <strong>of</strong> basic facts<br />
(pre-processing), the correlation itself, and the DEM <strong>generation</strong>.<br />
2.4.1 Orientation <strong>of</strong> Match-T<br />
2.4.1.1 Inner orientation<br />
Today, the inner orientation can be done automatically. The programme must have a target window which<br />
can be used for the search. In Match-T, there is a library <strong>of</strong> target windows for fiducial marks from the<br />
most used camera types. If you have used a special camera, where a target window for the used fiducial<br />
marks is not yet in existence, it can be supplemented by determining a fiducial mark manually. This fiducial<br />
mark will subsequently be used as a target. When using Match-T, two fiducial marks are determined<br />
manually, the rest <strong>of</strong> the fiducial marks are then determined automatically by fitting the target and the<br />
search area, in the camera file, on the basis <strong>of</strong> the given camera <strong>data</strong>. The orientation is done by fitting in<br />
28<br />
Orientation <strong>of</strong> the images<br />
Inner orientation<br />
Absolute orientation<br />
Pre-processing <strong>of</strong> primary<br />
Normalisation<br />
Image pyramid<br />
Object pyramid<br />
Figure 2.8: The three process parts in a Match-T calculation.<br />
Parameters for the DEM<br />
<strong>generation</strong><br />
Correlation<br />
DEM-<strong>generation</strong>
2 Methods <strong>of</strong> determining <strong>elevation</strong> <strong>data</strong><br />
with the correlation coefficient, see appendix A, section A.1.2.2.1, and then by the principle <strong>of</strong> least<br />
squares, see appendix A, section A.1.2.3.2.<br />
2.4.1.2 Absolute orientation<br />
In the Match-T (version 2.2.0) employed, the relative orientation is not determined, the absolute orientation<br />
is started straight away. The possibilities for automating the absolute orientation are much less than<br />
for the inner and the relative orientation. This is due to the fact that the location <strong>of</strong> control points in the image<br />
is not necessarily fixed. Furthermore, two types <strong>of</strong> control points are in use, signalled control points<br />
and natural control points. If signalled control points are used, the possibility <strong>of</strong> doing an absolute orientation<br />
is greater. This is because the recognition <strong>of</strong> the control points is greater, as these are <strong>of</strong> a fixed size<br />
and form. If, on the other hand, natural control points are used, these may vary considerably in form and<br />
grey level value. The absolute orientation is, therefore, generally done manually.<br />
When the orientation is determined, the images are ready for the second part <strong>of</strong> the process, where the<br />
pre-processing <strong>of</strong> primary <strong>data</strong> will be determined.<br />
2.4.2 The pre-processing <strong>of</strong> primary <strong>data</strong><br />
2.4.2.1 Normalisation<br />
We start out with a quote: The epipolar line constraint is the strongest constraint in correlation and should<br />
be used as soon as available [Förstner, 1993]. Therefore, the first step in the pre-processing <strong>of</strong> primary<br />
<strong>data</strong> is the normalisation <strong>of</strong> the images. This is done to achieve the advantages <strong>of</strong> the principles <strong>of</strong> epipolar<br />
geometry. The normalisation is done according to the principles described in appendix A, section<br />
A.1.4.<br />
2.4.2.2 Image pyramid<br />
The second step is the <strong>generation</strong> <strong>of</strong> an image pyramid <strong>over</strong> the normalised images. The principle <strong>of</strong> an<br />
image pyramid is that temporary values <strong>of</strong> the terrain heights can be obtained by a process course from<br />
coarse to fine resolution/pixel size. In Match-T, the image pyramid is created by use <strong>of</strong> a binomial filter<br />
(the Gaussian function) <strong>over</strong>, for instance, 5 x 5 pixels (standard Match-T setting). This is called the<br />
Gaussian pyramid, see further (Appendix A, section A.2). Between pyramid levels, there is a gap <strong>of</strong> a factor<br />
4 which for images with a resolution <strong>of</strong> 15 μm gives an image pyramid <strong>of</strong> 8 – 9 levels, and for 30 μm<br />
images, 7 – 8 levels, ending with an image <strong>of</strong> minimum 30 x 30 pixels Inpho a), 1995].<br />
2.4.2.3 Object pyramid<br />
The third step is the build-up <strong>of</strong> an object pyramid by drawing out objects from each image level in the<br />
image pyramid. As the image pyramid is created <strong>over</strong> normalised images, the withdrawal <strong>of</strong> objects is<br />
done in one dimension, that is, calculation <strong>of</strong> gradients in the x-direction, see Appendix A, section A.5.<br />
The build-up <strong>of</strong> the object pyramid is done independently for the left and right image, beginning with the<br />
topmost level <strong>of</strong> the image pyramid.<br />
Calculation <strong>of</strong> gradients is done in the following way [Inpho a), 1995]: The interest point is calculated from<br />
the size <strong>of</strong> a weighted sum <strong>of</strong> squares on the gradients in the horizontal direction <strong>of</strong> the chosen window<br />
size. The size <strong>of</strong> the window in which the withdrawal is going on has an impact on the gradients. The bigger<br />
the window, the greater the significance <strong>of</strong> the withdrawn gradients and vice versa.<br />
With a ”non maxima suppression”, only the most significant objects in the window are included.<br />
� So-called ”line spacing” reduces the number <strong>of</strong> epipolar lines, and subsequently the number <strong>of</strong><br />
interest points.<br />
� Determination <strong>of</strong> the direction <strong>of</strong> the gradient for the centre element in a chosen window determines<br />
the sign <strong>of</strong> the interest point.<br />
An object pyramid is a symbolic description <strong>of</strong> the image pyramid. The size <strong>of</strong> an object pyramid corresponds<br />
to approx. 80% <strong>of</strong> the image pyramid. It takes about 20% <strong>of</strong> the total calculation time to create an<br />
object pyramid [Inpho a), 1995].<br />
29
<strong>Automatic</strong> <strong>generation</strong> <strong>of</strong> <strong>elevation</strong> <strong>data</strong><br />
2.4.3 Parameters for DEM <strong>generation</strong><br />
2.4.3.1 Correlation<br />
The starting point <strong>of</strong> a correlation done in Match-T is a FBM and, as in Socet Set, a combination <strong>of</strong> ABM<br />
and FBM is also used here. Although the algorithms used in Match-T have been in use for more 15 years,<br />
there are no alternatives in order to derive DTM’s efficiently for large areas [Heuchel, 2005].<br />
The correlation and the DEM <strong>generation</strong> is done stepwise down through the levels <strong>of</strong> the pyramid [Inpho<br />
a), 1995].<br />
The correlation <strong>of</strong> the interest points presupposes that the following information is given:<br />
30<br />
� A temporary indication <strong>of</strong> the terrain <strong>elevation</strong> as starting value<br />
� The epipolar geometry<br />
� Delimitation in the row-direction by parallax bound<br />
and the correlation is done on the basis <strong>of</strong> the following values:<br />
� The existence <strong>of</strong> a gradient<br />
� The size <strong>of</strong> the gradient<br />
� The correlation coefficient<br />
The correlation is only done in the x-direction, as the images are normalised. The movement in the xdirection<br />
is delimited by the size <strong>of</strong> the parallax bound. In Match-T, the parallax bound is changed by<br />
choice <strong>of</strong> the <strong>landscape</strong> type: flat = 3 pixels, hilly = 8 pixels and mountainous = 15 pixels. By choice <strong>of</strong>, for<br />
instance, a mountainous terrain, the fitting in <strong>of</strong> the correlation can therefore be moved 15 pixels in the xdirection.<br />
When the best fit for the correlation is found, taking into consideration the existence <strong>of</strong> gradients,<br />
and the size <strong>of</strong> these in the two images, a correlation coefficient is calculated, see appendix A, section<br />
A.1.2.2.1. The position <strong>of</strong> the correlation is where the greatest correlation coefficient can be obtained.<br />
By means <strong>of</strong> the pyramid levels and an approximated starting value for the terrain <strong>elevation</strong>, a quick and,<br />
in principle, independent pre-knowledge <strong>of</strong> the terrain can be deduced from the preceding pyramid level.<br />
2.4.3.2 The DEM <strong>generation</strong><br />
The result <strong>of</strong> the introductory correlation is a cloud <strong>of</strong> points on each pyramid level. These clouds <strong>of</strong><br />
points include gross errors, such as correlation errors, or <strong>elevation</strong> errors, created by houses, trees, etc.<br />
The DEM <strong>generation</strong> is done stepwise down through the pyramid levels, and the terrain surface is reconstructed<br />
by means <strong>of</strong> the finite element principle. The results for each pyramid level are used as temporary<br />
values for the calculation <strong>of</strong> the next pyramid level, see figure 2.9. The result <strong>of</strong> a correlation and<br />
DEM <strong>generation</strong> can be seen in figure 2.10.
2 Methods <strong>of</strong> determining <strong>elevation</strong> <strong>data</strong><br />
Figure 2.9: The principle <strong>of</strong> the DEM <strong>generation</strong> process. Figure 2.10: A cloud <strong>of</strong> interest points indicated by<br />
green dots, and generated grid points by red dots.<br />
Robust bilinear finite element method<br />
In order to create a regular grid from irregular points and to eliminate gross height errors, like correlation<br />
errors, houses, trees, etc., the calculation must be done stepwise. During the process, the prerequisite is<br />
that the following conditions are met:<br />
� Grid with a fixed mesh size<br />
� Use <strong>of</strong> a robust procedure for the elimination <strong>of</strong> gross errors<br />
� Filtration <strong>of</strong> DEM<br />
� Smoothing <strong>of</strong> DEM<br />
� Constrains maximum curvature in the perpendicular direction to regulate the DEM surface<br />
� Constrains maximum torsion to regulate the DEM surface<br />
The mathematical model for the creation <strong>of</strong> a DEM withm = n xm grid points is an adjustment called the<br />
robust bilinear finite element method and it was presented by [Ebner and Reiss, 1978].<br />
The elements in the model are defined for the height per element <strong>of</strong> the four neighbouring points, see figure<br />
2.11.<br />
31
<strong>Automatic</strong> <strong>generation</strong> <strong>of</strong> <strong>elevation</strong> <strong>data</strong><br />
Where ka, kb, kc and kd are used as weights functions.<br />
32<br />
With the following descriptions:<br />
� ka :=(1-dx)(1-dy)/d 2<br />
� kb :=dx(1-dy)/d 2<br />
� kc :=(1-dx)dy/d 2<br />
� kd :=(dx dy)/d 2<br />
where:<br />
� dx=x(zs)-x(z(i,j))<br />
� dy=y(zs)-y(z(i,j))<br />
and<br />
� d = mesh size<br />
The following description is a combination from [Inpho Match-T, <strong>Automatic</strong> DEM–Generation, Tutorial]<br />
and [Intergraph, ImageStation Match-T (ISMT) User’s Guide].<br />
Each terrain point is described by:<br />
where:<br />
Z = vector<br />
Zi = terrain heights where i runs from 1 to k<br />
k = number <strong>of</strong> terrain heights<br />
The grid point Z �<br />
�<br />
Z<br />
�<br />
�<br />
�<br />
�Z: i 1, k�<br />
Z � i �<br />
can be described as:<br />
Z (x, y) � a 0 � a 1x<br />
� a 2y<br />
The grid also has a curvature and a torsion which is described as follows:<br />
�<br />
Z xx � �Zxx � m<br />
The curvature in the x-direction<br />
�<br />
Y<br />
The curvature and the torsion apply tom = n xm grid points for the DEM. For the measured terrain points,<br />
curvature and torsion, the following is presumed true:<br />
�<br />
d<br />
Figure 2.11: Determination <strong>of</strong> the grid points, [Inpho 1995]<br />
E( Z xy) �<br />
�i, j�:<br />
i � 1, n, j 1, �<br />
Z xy � �Zxy The torsion<br />
� m<br />
�i, j�:<br />
i � 1, n, j 1, �<br />
0 ,<br />
d<br />
Z(i-d, j+d) Z(i, j+d) Z(i+d, j+d)<br />
kb ka<br />
dx<br />
kd<br />
P<br />
kc<br />
Z(i-d, j) Z(i, j) Z(i+d, j)<br />
Z(i-d, j-d)<br />
�<br />
dy<br />
E( Z xx) � 0<br />
Z(i, j-d)<br />
and<br />
�<br />
X<br />
E( Z yy) � 0<br />
Z yy � �Zyy � m<br />
The curvature in the y-direction<br />
�i, j�:<br />
i � 1, n, j 1, �<br />
The following equations refer to the definition <strong>of</strong> DEM heights for four grid points and a temporary terrain<br />
height zs.<br />
�
2 Methods <strong>of</strong> determining <strong>elevation</strong> <strong>data</strong><br />
These equations describe a vector for the unknown heights <strong>of</strong> the grid points.<br />
u T �<br />
part<br />
�z(i<br />
�1,<br />
j �1),<br />
z(i, j �1),<br />
z(i �1,<br />
j �1)<br />
�<br />
�<br />
�<br />
�<br />
�<br />
, z(i �1,<br />
j), z(i, j), z(i �1,<br />
j)<br />
�<br />
��<br />
, z(i �1,<br />
j �1),<br />
z(i, j �1),<br />
z(i �1,<br />
j �1)<br />
��<br />
The residuals vxx(i,j), vxy(i,j) and vs for observations are presumed normally distributed.<br />
The vectors ai for (i=2,3,4), which correspond to the nine terrain heights <strong>of</strong> the four grid meshes in figure<br />
2.11, are multiplied by the coefficient matrices defined as:<br />
�1<br />
� 2<br />
�T<br />
1<br />
a2<br />
: � vector(<br />
�<br />
2 4<br />
4 �<br />
�<br />
��<br />
1 � 2<br />
�<br />
a<br />
T<br />
4<br />
The final mathematical model is finished by setting up the stochastic model:<br />
1 2<br />
P( z<br />
�<br />
�<br />
xx ) � Diag(<br />
D ( � xx ))<br />
1 2<br />
P( z<br />
�<br />
�<br />
yy ) � Diag(<br />
D ( � yy ))<br />
�<br />
�1<br />
2<br />
P( z xy ) � Diag(<br />
D ( � yx ))<br />
�<br />
�1<br />
2<br />
P( z)<br />
� Diag(<br />
D ( � ))<br />
This stochastic model represents the weight matrix for the temporary observations and their<br />
a priori standard deviations. Instead <strong>of</strong> eliminating the vector for the u unknown DEM heights by a linear<br />
Gauss-Mark<strong>of</strong>f process by maximising the function:<br />
�<br />
�<br />
�<br />
f ( u,<br />
� , � , � ) � v<br />
xx yy xy<br />
z<br />
z<br />
the mathematical model is determined by introducing a weight function with approximated a priori weights<br />
for the observations in the stochastic model with a value for their normalised residuals t. As suggested by<br />
[Förstner 1989] and [Krarup et al. 1980], the weight functions are:<br />
w<br />
� 1<br />
1<br />
: � vector(<br />
�<br />
0<br />
4 �<br />
��<br />
�1<br />
2 ( t)<br />
� e<br />
These weight functions are used as the modification for the observation weight in a two-part iterative<br />
Gauss-Mark<strong>of</strong>f process by use <strong>of</strong> the relation:<br />
P � P<br />
wj(<br />
t<br />
( v�1)<br />
( 0)<br />
( v)<br />
z<br />
z z<br />
P � P<br />
2<br />
�(<br />
t)<br />
wj(<br />
t<br />
( v�1)<br />
( 0)<br />
( v)<br />
zxx zxx<br />
zxx<br />
Where: v = the iteration step.<br />
z<br />
z<br />
0<br />
0<br />
0<br />
)<br />
)<br />
T<br />
and<br />
1�<br />
2<br />
�<br />
�<br />
1��<br />
P<br />
T<br />
�1�<br />
0<br />
�<br />
�<br />
1 ��<br />
( v)<br />
T<br />
)<br />
)<br />
� � �<br />
( z)<br />
v � v<br />
�<br />
a<br />
T<br />
xx<br />
T<br />
3<br />
P<br />
P � P<br />
wj(<br />
t<br />
( v�1)<br />
( 0)<br />
( v)<br />
zyy zyy<br />
zyy<br />
P � P<br />
( v)<br />
w ( t)<br />
�<br />
1<br />
�<br />
( z<br />
xx<br />
wj(<br />
t<br />
�<br />
) v<br />
( v�1)<br />
( 0)<br />
( v)<br />
zxy zxy<br />
zxy<br />
� 1<br />
1<br />
: � vector(<br />
�<br />
2<br />
4 �<br />
�<br />
��<br />
1<br />
1<br />
1�<br />
( t)<br />
xx<br />
)<br />
2<br />
)<br />
�<br />
� v<br />
T<br />
yy<br />
P<br />
� 2<br />
� 4<br />
� 2<br />
( v)<br />
�<br />
( z<br />
yy<br />
1 �<br />
� 2<br />
�<br />
�<br />
1 ��<br />
�<br />
) v<br />
yy<br />
T<br />
)<br />
�<br />
� v<br />
T<br />
xy<br />
P<br />
( v)<br />
�<br />
( z<br />
xy<br />
�<br />
) v<br />
xy<br />
33
<strong>Automatic</strong> <strong>generation</strong> <strong>of</strong> <strong>elevation</strong> <strong>data</strong><br />
Observations with great deviations are weighted low and eliminated, if a given limit for the observation<br />
weight is <strong>over</strong>stepped during the iteration. The minimisation <strong>of</strong> the following function for each iteration<br />
step � gives a solution for the vector u � for all unknown DTM heights:<br />
�<br />
� T � � � T � � � T � � � T � �<br />
( u,<br />
�<br />
, � , � , � ) � v P(<br />
z ) v � v P(<br />
z ) v � v P(<br />
z ) v � v P(<br />
z ) v<br />
The function is minimised, until the estimated values for �z (u � , �z, �Zxx �Zyy, �Zxy) become constant or<br />
reach a given limit. The combination <strong>of</strong> both iteration phases guarantees a ”global” convergence, and detection<br />
and elimination <strong>of</strong> height errors.<br />
This mathematical model for the DTM <strong>generation</strong> is also a ”robust filter” process which can deal with areas<br />
with insufficient information about the terrain surface (lack <strong>of</strong> interest points). Because the programme<br />
can generate a very large number <strong>of</strong> measured terrain points, the process is strongly <strong>over</strong> determined,<br />
even if a small mesh size is chosen.<br />
2.4.4 Conversion <strong>of</strong> the grid points<br />
Further calculation can only be managed in ascii-format. Match-T <strong>of</strong>fers three possibilities when converting<br />
the grid file to ascii-format:<br />
34<br />
f xx yy xy<br />
z<br />
� Coded with [X, Y, Z + 8 codes]<br />
� Coded as a mass point [X, Y, Z, 30000000]<br />
� Without codes [X, Y, Z]<br />
Furthermore, it is possible to opt out <strong>of</strong> points which Match-T considers as being:<br />
� In a bad area<br />
� Interpolated<br />
z<br />
� Without the stereo-area<br />
� Situated in an excluded area<br />
� Situated without the delimited area<br />
If the grid files are converted with codes, each grid point is furnished with 8 codes:<br />
� Code 1 = the point is OK<br />
z<br />
� Code 2 = the point is situated without the stereo-area<br />
� Code 3 = the point is situated without the area<br />
� Code 4 = the point is situated within an excluded area<br />
� Code 5 = the point is situated in an area <strong>of</strong> low accuracy<br />
� Code 6 = the point is situated in an area with a low texture<br />
� Code 7 = the point is situated close to a break line<br />
� Code 8 = the point is not interpolated<br />
z<br />
xx<br />
These code descriptions are found as headings in the ascii-file, when the conversion is done with code.<br />
2.4.4.1 Accuracy<br />
In the world <strong>of</strong> photogrammetry, the rule <strong>of</strong> thumb is that the demand for accuracy in a DTM should be<br />
between 0.1‰ and 0.2‰ <strong>of</strong> the flight altitude. This demand forms the basis <strong>of</strong> the level <strong>of</strong> accuracy in<br />
Match-T. Here, the demand for accuracy is less than 0.1‰ [Krzystek et al., 1992]. Investigations <strong>of</strong><br />
Match-T done by Inpho, show that in flat or hilly areas, not only can this demand be met, but <strong>elevation</strong><br />
<strong>data</strong> considerably better than 0.1‰ <strong>of</strong> the flight altitude can be obtained. It should be noted, however, that<br />
xx<br />
xx<br />
yy<br />
yy<br />
yy<br />
xy<br />
xy<br />
xy
2 Methods <strong>of</strong> determining <strong>elevation</strong> <strong>data</strong><br />
the accuracy in mountainous terrain lies between 0.2‰ and 0.35‰ <strong>of</strong> the flight altitude [Krzystek et al.,<br />
1995].<br />
There are other investigations which show that the accuracy is not so good as described previously [Seyfert,<br />
1995], [Thorpe et al., 1996], where accuracies lie between 0.7‰ up to 3‰ <strong>of</strong> the flight altitude.<br />
An investigation done with images from digital frame cameras shows some very good results with a RMS<br />
accuracy in z <strong>of</strong> 7.2cm, which <strong>of</strong> the flight altitude is 0.05‰. [Heuchel, 2005].<br />
2.4.4.2 Pros and cons <strong>of</strong> the photogrammetric method<br />
The greatest advantage <strong>of</strong> the photogrammetric method, (Socet Set or Match-T), is that the images <strong>of</strong>fer<br />
a visual basis for a possible later location <strong>of</strong> gross errors and thus, an easier editing <strong>of</strong> the <strong>elevation</strong> <strong>data</strong>.<br />
Furthermore, the images are already in existence for a possible later mapping or orthophoto production,<br />
necessitating only one flight. The photogrammetric method thus <strong>of</strong>fers <strong>data</strong> in three dimensions which<br />
can be used for production <strong>of</strong> <strong>elevation</strong> models as well as maps.<br />
The disadvantage is that this method creates very large <strong>data</strong> collections, which have to be structured and<br />
handled and the <strong>data</strong> collections take up a lot <strong>of</strong> storage capacity. However, this is <strong>of</strong>fset by the fact that<br />
the images may be used for mapping.<br />
2.4.4.3 The scope <strong>of</strong> the photogrammetric method<br />
The photogrammetric method including Socet Set and Match-T can be used with advantage in areas,<br />
where the demand is for <strong>elevation</strong> <strong>data</strong> as well as for mapping or orthophotos.<br />
2.5 Comparison <strong>of</strong> the three methods<br />
IFSAR as well as LIDAR are active systems which emit and receive signals themselves, in contrast to the<br />
photogrammetric method which uses a passive collection system. The active systems may be used without<br />
regard to sun or light conditions, and independent <strong>of</strong> the texture <strong>of</strong> the ground surface. This means<br />
that the methods may be used all around the clock and throughout the six months <strong>of</strong> winter during the leaf<br />
free period which gives a much larger degree <strong>of</strong> usage <strong>of</strong> the systems.<br />
Studies <strong>of</strong> comparisons between <strong>elevation</strong>s generated by LIDAR and automatically generated <strong>elevation</strong>s<br />
from digital photogrammetry have shown that, as regards images with a low texture and contrast, the<br />
photogrammetric method does not <strong>of</strong>fer good results, whereas the LIDAR method is not influenced by<br />
such considerations.<br />
IFSAR and LIDAR <strong>of</strong>fer <strong>elevation</strong> <strong>data</strong>, but no geographical <strong>data</strong>. In a possible gross error search, it is<br />
therefore necessary to include other <strong>data</strong>, for instance existing maps. In the photogrammetric method,<br />
such information is included as a ‘by-product’, due to the fact that the <strong>elevation</strong>s are generated from aerial<br />
photos. That is, the photogrammetric method <strong>of</strong>fers full information about <strong>elevation</strong>s and geographical<br />
material, all at the same time.<br />
If the accuracies <strong>of</strong> the three methods are compared, the best accuracy is obtained by using LIDAR. The<br />
next best accuracy is obtained by the photogrammetric method, while the IFSAR method is the most inaccurate.<br />
The opposite is true for the area <strong>of</strong> c<strong>over</strong>age, where IFSAR c<strong>over</strong>s the largest area, the next<br />
largest area is c<strong>over</strong>ed by the photogrammetric method and the smallest area is c<strong>over</strong>ed by LIDAR which<br />
entails a longer total flight time and, thus, an increase in costs. A more detailed comparison between the<br />
photogrammetric method and LIDAR can be found in [Rasmussen et al., 2000].<br />
Also in [Marcer, 2001] the price factor for obtaining <strong>elevation</strong> <strong>data</strong> is discussed, see figure 2.11. The <strong>elevation</strong><br />
accuracy and point density are two <strong>of</strong> the components driving the cost and applicability <strong>of</strong> DEM<br />
products. In figure 2.11 the unit price (US$/km 2 ) <strong>of</strong> DEM products are shown as a function <strong>of</strong> vertical accuracy.<br />
For relative comparison, the relationship between satellite-based DEM products, IFSAR (Radar),<br />
LIDAR and aerial photography is shown. Because costs and specifications are <strong>of</strong>ten project-specific,<br />
there is a broad range for any <strong>data</strong> type, but the trend is clear.<br />
35
<strong>Automatic</strong> <strong>generation</strong> <strong>of</strong> <strong>elevation</strong> <strong>data</strong><br />
Figure 2.12: The figure illustrates the price factor for obtaining <strong>elevation</strong> <strong>data</strong> by different method [Marcer, 2001].<br />
In figure 2.12 it can be seen that the aerial photogrammetry and LIDAR methods, cost and accuracy,<br />
works out approximately the same. But because the updating <strong>of</strong> the geographic <strong>data</strong> will be performed<br />
every 3 to 5 years, the aerial images will therefore already be available for the automatic <strong>generation</strong> process.<br />
This means that there are no expenses for purchasing digital images, only the costs <strong>of</strong> the calculation<br />
process have to be taken into account.<br />
2.5.1 Choice <strong>of</strong> method<br />
As may be inferred from the aforementioned, all three methods have their pros and cons, but taken the<br />
above mentioned considerations it was chosen from the very start to have a closer look at the automatic<br />
correlation method, specifically the programme package Match-T. This choice was made as the programme<br />
was available at Aalborg University, where the project originated.<br />
2.6 Proposal for combining/integrating new z-measurements<br />
In Denmark, there are already various <strong>elevation</strong> models. In the very near future a new nationwide <strong>elevation</strong><br />
model will be created by the LIDAR method. Only in the first years after the establishment <strong>of</strong> the new<br />
<strong>elevation</strong> model, can the DEM be considered as updated, because all geo-spatial <strong>data</strong> degenerates <strong>over</strong><br />
time and becomes unreliable. It has therefore to be taken into account that the DEM in the future has to<br />
be improved with new <strong>elevation</strong> <strong>data</strong>.<br />
It must therefore be noted that historical, present and future <strong>elevation</strong> <strong>data</strong> must not come from the same<br />
sources and/or producers. In this case the updating <strong>of</strong> the geo-spatial <strong>data</strong> can, in the future, be done<br />
from digital images. It will therefore be straight forward to update the <strong>elevation</strong> <strong>data</strong> by using the automatic<br />
<strong>generation</strong> method. This means that the future <strong>elevation</strong> model will be put together with <strong>data</strong> from<br />
different sources with different accuracies. Furthermore, it can not be expected that the point placement is<br />
dispersed equally <strong>over</strong> the whole area. The points can be randomly spread out and in clusters, here,<br />
there and everywhere.<br />
This gives us several situations for combining/integrating new z-measurements:<br />
36<br />
� unstructured raw <strong>elevation</strong> <strong>data</strong> from two or more different sources/producers<br />
� structured <strong>elevation</strong> <strong>data</strong> in the grid with the same mesh size or different mesh sizes from different<br />
sources and different origo.
2 Methods <strong>of</strong> determining <strong>elevation</strong> <strong>data</strong><br />
� grid and unstructured raw <strong>elevation</strong> <strong>data</strong> from different sources/producers<br />
A mathematical model must therefore be established which can handle the problem <strong>of</strong> historical, present<br />
and future <strong>elevation</strong> <strong>data</strong>, captured from different sources/producers, with different accuracies and structures<br />
(grid or raw <strong>elevation</strong> <strong>data</strong>). A solution to this problem, could be the ‘multi grid method’. The ‘multi<br />
grid method’ is a highly effective iterative solution strategy which can solve large areas with thinly determined<br />
points with the help <strong>of</strong> an adjustment system. The great advantage with the ‘multi grid method’ is<br />
that the adjustment system is independent <strong>of</strong> the numbers <strong>of</strong> unknowns.<br />
The starting point could be: two clouds <strong>of</strong> structured or unstructured points, where the <strong>elevation</strong> <strong>data</strong> is<br />
independent and has different accuracies. Should one <strong>of</strong> the clouds <strong>of</strong> points consist <strong>of</strong> grid points, this<br />
grid will be looked at, as a non-structural cloud <strong>of</strong> points.<br />
This is a classic adjustment problem, the solution being, an adjustment is done by means <strong>of</strong> the least<br />
squares measurement principle. (For the readers, who are familiar with least squares measurements,<br />
skip the next 1½ pages). The principle <strong>of</strong> least squares measurement is, that the random values (residuals)<br />
(vi) have to be minimum, which means:<br />
v<br />
m<br />
2 2 2<br />
2<br />
2<br />
� 1 v � 2 v � � � � �<br />
3 v � m �v i<br />
i�1<br />
� min<br />
When the observations are independent and have different weights the principle <strong>of</strong> least squares measurement<br />
demands that the weight function minimises like:<br />
� �<br />
m<br />
c � c v<br />
2<br />
� c v<br />
2<br />
� ��<br />
��<br />
��<br />
� � c<br />
2<br />
� c v<br />
2<br />
� � min<br />
2 2 2 3 3 m i i<br />
i � 1<br />
This function can be noted as matrix form:<br />
�<br />
�<br />
�vvv���v� 1 2 3 m<br />
�<br />
�<br />
�<br />
� �<br />
�<br />
�<br />
�<br />
�<br />
c1<br />
c<br />
2<br />
c<br />
3<br />
�<br />
c<br />
� �<br />
� �<br />
� �<br />
� � �<br />
� �<br />
� �<br />
� �<br />
� �<br />
m<br />
� 1<br />
�<br />
2�<br />
�<br />
3<br />
�<br />
� �<br />
�<br />
m�<br />
v<br />
v<br />
v<br />
This matrix form can be written more simply as:<br />
T<br />
� � v �C�<br />
v<br />
The equations for the observations can be written in matrix format as:<br />
l � A � x<br />
- v<br />
The above equation can be rewritten as:<br />
v � A � x<br />
- l<br />
T<br />
and together with equations � � v �C�<br />
v the equation will be:<br />
� = (A�x - l) T �C � (A�x - l)<br />
= (x T �A T �C - l T �C) � (A�x - l)<br />
= (x T �A T - l T )�C�(A�x-l)<br />
= x T �A T �C�A�x - l T �C�A�x - x T �A T �C�l + b T �C�l<br />
v<br />
37
<strong>Automatic</strong> <strong>generation</strong> <strong>of</strong> <strong>elevation</strong> <strong>data</strong><br />
Because � is a scalar, every part <strong>of</strong> the equation is a scalar and because scalars can be transposed <strong>over</strong><br />
in it self the second and the third part <strong>of</strong> the equation is the same. This gives:<br />
b C l<br />
T<br />
l C A x )<br />
T<br />
(A C A ) x 2 (<br />
T<br />
� � x<br />
T � � � � � � � � � � �<br />
This is the weight matrix, which has to be minimised according to the principle <strong>of</strong> least squares measurement.<br />
In the equation, all matrices and vectors are constants, except x, which has to be differential and put to<br />
zero. To be able to minimise �, the partial derivatives factor has to be set to zero.<br />
��<br />
� 2<br />
�x<br />
38<br />
A C<br />
T<br />
x ( T<br />
A ) � 2<br />
l C<br />
T<br />
A<br />
� 0<br />
By dividing with a factor <strong>of</strong> 2 and transposing the formula:<br />
A C l<br />
T<br />
A C A ) x<br />
T ( � �<br />
�<br />
x<br />
A C l<br />
T )<br />
1<br />
A C A<br />
T � (<br />
�<br />
� �<br />
where: A = the design matrix<br />
C = weight matrix<br />
l = the observations<br />
x = unknown quantities<br />
x is now able to be determined.<br />
As the starting point, an <strong>elevation</strong> model exists with points described as:<br />
�xi, yi,<br />
i�<br />
P i z for � i = 0, 1, 2, 3, 4………<br />
Where the <strong>elevation</strong> for zi (i = 1 �h) is known and with an accuracy <strong>of</strong> �zi (i = 1 � h)<br />
The new <strong>elevation</strong> model is described as:<br />
~<br />
P<br />
�~ xi,<br />
~<br />
yi,<br />
~<br />
i�<br />
i z<br />
Where the <strong>elevation</strong> for<br />
for � i = 0, 1, 2, 3, 4………<br />
~<br />
z i (i = 1 �h) is known and with an accuracy <strong>of</strong> �Z i<br />
~<br />
(i = 1 � h)<br />
For the new <strong>elevation</strong> <strong>data</strong> a new equation can be put up as:<br />
�z i v �� �~ z � v ~ �<br />
� � minimum<br />
zi<br />
i<br />
zi<br />
Equation A C l ) T<br />
A C A ) x<br />
T ( � � is changed to:<br />
(A<br />
T<br />
where:<br />
z �<br />
(A<br />
� C � A) � z � A<br />
T<br />
�C<br />
� A)<br />
-1<br />
� A<br />
T<br />
T<br />
� C �l<br />
�C<br />
�l
Y<br />
2 Methods <strong>of</strong> determining <strong>elevation</strong> <strong>data</strong><br />
The adjustment system is now set up, the observation equations have to be defined. For all points placed<br />
in the first mesh (1):<br />
vp1 = ka�zi-d,j-d + kb�zi,j-d + kc�zi-d,j + kd�zi,j – zp1<br />
For points placed in the second mesh (2):<br />
Vp2 = ka�zi,j-d + kb�zi+d,j-d + kc�zi,j + kd�zi+d,j – zp2<br />
For points placed in the third mesh (3):<br />
Vp3 = ka�zi-d,j + kb�zi,j + kc�zi-d,j+d + kd�zi,j+d – zp3<br />
For points placed in the fourth mesh (4):<br />
Vp4 = ka�zi,j + kb�zi+d,j + kc�zi,j+d + kd�zi+d,j+d – zp4<br />
As can be seen from figure 2.13 The weights functions according to the Match-T method:<br />
� ka=(1-dx)(1-dy)/d 2<br />
� kb=dx(1-dy)/d 2<br />
� kc=(1-dx)dy/d 2<br />
� kd=(dx dy)/d 2<br />
where:<br />
d<br />
d<br />
� dx=x(zs)-x(z(i,j))<br />
� dy=y(zs)-y(z(i,j))<br />
Z(i-d, j+d) Z(i, j+d) Z(i+d, j+d)<br />
Z(i-d, j)<br />
3 4<br />
1<br />
Z(i-d, j-d)<br />
Z(i, j)<br />
2<br />
Z(i, j-d)<br />
Z(i+d, j)<br />
Z(i+d, j-d)<br />
Figure 2.13: Determination <strong>of</strong> grid points for every mesh.<br />
X<br />
39
<strong>Automatic</strong> <strong>generation</strong> <strong>of</strong> <strong>elevation</strong> <strong>data</strong><br />
To be able to determine a 3 x 3 grid we need a minimum <strong>of</strong> 9 observations to have redundant observations.<br />
If there are not enough points to determine a 3 x 3 grid, 6 fictional observations equations can be<br />
put up, 3 for the horizontal lines and 3 for the vertical lines:<br />
The horizontal lines are defined by:<br />
vh1 = zi,j -2 zi+1,j + zi+2,j<br />
vh2 = zi,j+1 -2 zi+1,j+1 + zi+2,j+1<br />
vh3 = zi,j+2 -2 zi+1,j+2 + zi+2,j+2<br />
The vertical lines are defined by:<br />
vv1 = zi,j -2 zi,j+1 + zi,j+2<br />
vv2 = zi+1,j -2 zi+1,j+1 + zi+1,j+2<br />
vv3 = zi+2,j -2 zi+2,j+1 + zi+2,j+2<br />
An adjustment can now be done and the 9 grid points determined.<br />
This adjustment system can handle any type <strong>of</strong> point placement and unstructured point clouds, as well as<br />
structured grid points.<br />
Points can be determined from different sources and/or producers and can therefore have different accuracies<br />
(� 2 ). When looking at the updating purposes <strong>of</strong> the future LIDAR national DEM there are several<br />
opportunities: automatically generated <strong>elevation</strong>s from digital images, <strong>elevation</strong>s from the existing 25m x<br />
25m DEM and unknown <strong>elevation</strong>s.<br />
For every observation equation an accuracy <strong>of</strong> 1/� 2 has to be put up for the weight matrix. As an example<br />
for the different accuracies for possible <strong>elevation</strong> <strong>data</strong> including the a adjustment could be:<br />
40<br />
� LIDAR: 0,15 m<br />
� <strong>Automatic</strong> generated points: the experience from this thesis<br />
� Old <strong>elevation</strong>s: 1,3 m<br />
� Fictional points: 3 m<br />
All the information is now available in order to solve the problem:<br />
x<br />
�<br />
A C<br />
T (<br />
A C<br />
T )<br />
�1<br />
A �<br />
l<br />
After determining, the accuracy <strong>of</strong> the new grid can now be determined:<br />
r � A � x<br />
- l<br />
The only part missing is to take a closer look at what accuracy can be achieved by using the method <strong>of</strong><br />
automatic <strong>generation</strong>!<br />
It should be noted that the aforementioned method is only described theoretically and, has not been used<br />
in practice. The reason for this is, that there is no LIDAR <strong>data</strong> available at the moment.
3 Experience and investigation strategy<br />
3 Experience and investigation strategy<br />
The purpose <strong>of</strong> this chapter is to establish a strategy for the investigation <strong>of</strong> Match-T under <strong>Danish</strong> conditions.<br />
In order to pr<strong>of</strong>it from the experience gained from other investigations <strong>of</strong> Match-T, such investigations<br />
and their results are presented. On the basis <strong>of</strong> this source study, problems and divergent results/statements<br />
will be discussed, the problems stressed and listed as ”keywords”.<br />
In the source study, the terminology <strong>of</strong> the source has been used, DEM for Digital Elevation Model and<br />
DTM for Digital Terrain Model.<br />
3.1 Background<br />
<strong>Automatic</strong> <strong>generation</strong> <strong>of</strong> <strong>elevation</strong>s from digital images has for several years been included as a fixed<br />
work routine at the photogrammetric firms in Denmark. In this project, a further investigation <strong>of</strong> the possibilities<br />
and limitations <strong>of</strong> this method is undertaken, taking the programme package Match-T as point <strong>of</strong><br />
departure.<br />
For more than 15 years, a series <strong>of</strong> investigations has been made into the accuracy, completeness and<br />
<strong>landscape</strong> types for automatically generated <strong>elevation</strong>s from digital images. More<strong>over</strong>, OEEPE has conducted<br />
a workshop, where the results <strong>of</strong> automatically generated <strong>elevation</strong>s were presented. On the<br />
background <strong>of</strong> the lessons learned here, areas relevant to a <strong>Danish</strong> use <strong>of</strong> Match-T, as regards problems,<br />
accuracy versus scale, pixel size, sources <strong>of</strong> error etc., are estimated. For each source, some central<br />
themes will be noted as keywords. The sources are discussed chronologically.<br />
3.2 A source study <strong>of</strong> experiences with Match-T<br />
In an article about Match-T from 1991 [Krzystek, 1991], 5 tests are presented. These show that with<br />
15 μm images, an accuracy <strong>of</strong> at least 0.08‰ <strong>of</strong> the flight altitude can be achieved. Using images with a<br />
resolution <strong>of</strong> 30 μm, an accuracy <strong>of</strong> 0.1‰ can be achieved. A single one <strong>of</strong> the five tests gives a poorer<br />
result. This is due to the images’ content <strong>of</strong> areas with poor texture. This problem is <strong>of</strong> immediate importance,<br />
both for the automatic and the manual determination <strong>of</strong> <strong>elevation</strong>s.<br />
Keywords: accuracy, resolution, texture.<br />
In another article [Krzystek et al., 1992], the accuracies <strong>of</strong> Match-T and control points measured with<br />
analogous photogrammetry respectively are compared. This investigation takes as its point <strong>of</strong> departure<br />
the fact that an automatically generated <strong>elevation</strong> model should have an accuracy <strong>of</strong> 0.1‰ <strong>of</strong> the flight<br />
altitude. This requires Match-T to automatically find and destroy gross errors which are caused by correlation<br />
errors. More<strong>over</strong>, Match-T is expected to eliminate single objects such as trees and houses, and<br />
handle areas with a low or insufficient degree <strong>of</strong> information (none or few interest points). These three<br />
problems are handled by Match-T with the same mathematical method, see also Chapter 2, section<br />
2.4.3.2. The investigation also discusses what influence the distance between grid points, that is, the<br />
mesh size, has on the result. The smaller the mesh size, the fewer interest points for determination <strong>of</strong> the<br />
grid point. Equally, a large mesh size means a greater number <strong>of</strong> interest points to determine a grid point.<br />
The investigation uses 15 μm and 30 μm images in three different scales (1:7,000 – 1:14,000). The conclusion<br />
is obvious: large mesh size, and subsequently, more interest points, give a better result in flat areas.<br />
In the case <strong>of</strong> a steeper terrain, a grid with a large mesh size will reproduce the terrain in considerably<br />
less detail, and imply a reduction in accuracy. The accuracy with mesh sizes <strong>of</strong> <strong>over</strong> approx. 5m is<br />
under 0.1‰ <strong>of</strong> the flight altitude, regardless <strong>of</strong> scale or resolution, while the accuracy for 15 μm images is<br />
considerably better. The investigation shows that as a whole, Match-T can produce a DTM <strong>of</strong> high accuracy,<br />
and subsequently, handle areas with a low degree <strong>of</strong> information.<br />
Keywords: accuracy, scale, resolution, mesh size, terrain type.<br />
41
<strong>Automatic</strong> <strong>generation</strong> <strong>of</strong> <strong>elevation</strong> <strong>data</strong><br />
In another article from 1992 [Ackermann et al., 1992], four different investigations <strong>of</strong> images in resolutions<br />
15 μm and 30 μm are described. Small built-up areas and wooded areas are excluded In the images, but<br />
otherwise the areas are judged suitable for automatic DEM <strong>generation</strong>, as the remaining areas mostly<br />
consist <strong>of</strong> open country. The areas include sparse vegetation and a few houses which the system should<br />
be able to eliminate automatically. Three <strong>of</strong> the areas are designated as ”s<strong>of</strong>t” terrain with images in scale<br />
from 1:7,000 to 1:22,600. One <strong>of</strong> the three test areas is a more ”hard” and mountainous terrain in scale<br />
1:22,600. As regards the areas with ”s<strong>of</strong>t” terrain, the accuracy was better than 0.1‰ <strong>of</strong> the flight altitude,<br />
regardless <strong>of</strong> scale. The accuracy <strong>of</strong> the 15 μm images was 0.04‰ – 0.07‰ <strong>of</strong> the flight altitude, while<br />
the accuracy <strong>of</strong> the 30 μm images was a little poorer, 0.05‰ – 0.1‰ <strong>of</strong> the flight altitude. The last investigation<br />
was <strong>over</strong> mountainous terrain in scale <strong>of</strong> 1:22,600. Here, the accuracy was 0.11‰ – 0.13‰ <strong>of</strong> the<br />
flight altitude for 15 μm images, while for 30 μm images it was 0.14‰ – 0.16‰ <strong>of</strong> the flight altitude. Conclusion:<br />
In ”s<strong>of</strong>t” terrain, the accuracy in an automatically generated DEM is extremely good, far better<br />
than 0.1‰ <strong>of</strong> the flight altitude, and the difference between 15 μm and 30 μm images is not all that great.<br />
Keywords: Accuracy, scale, resolution, terrain type.<br />
In a third article [Ackermann, 1992], 15 μm and 30 μm images in scale 1:12,000 are used. A grid with 5m<br />
and 10m mesh sizes has been determined. The terrain may be designated as moderately hilly with a<br />
small housing estate. The result was an accuracy <strong>of</strong> 0.06‰ <strong>of</strong> the flight altitude for 15 μm images, and<br />
0.09‰ <strong>of</strong> the flight altitude for 30 μm images. The conclusion is that an accuracy <strong>of</strong> 0.1‰ <strong>of</strong> the flight altitude<br />
or better is possible for non-mountainous terrain. Some <strong>of</strong> the measured points were located on<br />
houses, trees and bushes, and Match-T was able to eliminate these ”error <strong>elevation</strong>s” automatically.<br />
Keywords: accuracy, resolution, terrain type, <strong>landscape</strong> type.<br />
A Norwegian investigation [Eide et al., 1993] is based on images in scale 1:5,000 with three different<br />
resolutions, 15 μm, 30 μm and 60 μm. This investigation shows that the best result is achieved with the<br />
resolution 15 μm, while the result for the 30 μm images is a little poorer and the result for the 60 μm images<br />
is distinctly poorer. Furthermore, the investigation shows that the accuracy is 0.1‰ <strong>of</strong> the flight altitude<br />
in flat and simple terrain, 0.25‰ <strong>of</strong> the flight altitude in flat and moderately hilly terrain, and all <strong>of</strong><br />
0.55‰ <strong>of</strong> the flight altitude in mountainous (steep) terrain.<br />
Keywords: accuracy, resolution, terrain type.<br />
In a later investigation [a) Krzystek et al., 1995] which is also based on images in different scales, various<br />
terrain types have been looked at: flat, hilly and mountainous. The investigation is made on the basis <strong>of</strong><br />
images in resolutions 15 μm and 30 μm. It shows that for images with resolution 15 μm, an accuracy <strong>of</strong><br />
0.1‰ <strong>of</strong> the flight altitude can be achieved for flat as well as hilly terrain types, while there is a small reduction<br />
<strong>of</strong> the accuracy for images with resolution 30 μm. As regards mountainous terrain, the accuracy is<br />
0.2‰ – 0.35‰ <strong>of</strong> the flight altitude. It has also been tested how well Match-T is able to find and eliminate<br />
solitary objects, such as houses and trees, and the ”<strong>elevation</strong> errors” developed in housing estates. The<br />
result for housing estates turned out to be promising. However, it must be noted that this conclusion is<br />
only valid for images in medium and small scales.<br />
Keywords: accuracy, scale, resolution, terrain type, <strong>landscape</strong> type.<br />
In the article [b) Krzystek et al., 1995], the problem <strong>of</strong> areas with a lack <strong>of</strong> texture or areas with buildings/vegetation<br />
in combination with images in large scale is investigated. As mentioned earlier, Match-T<br />
must be able to handle areas where there is not a sufficient degree <strong>of</strong> terrain information. Furthermore,<br />
Match-T, using the same mathematical model, must be able to edit away correlation errors and solitary<br />
objects such as trees and houses automatically. The article describes 10 tests with models in different<br />
scales and with different terrain types. Conclusion: In flat and slightly hilly terrain, an accuracy <strong>of</strong> 0.1‰ <strong>of</strong><br />
the flight altitude can be achieved. Some <strong>of</strong> the tests, however, show better results. In mountainous terrain,<br />
an accuracy <strong>of</strong> 0.2‰ to 0.35‰ can be achieved. More<strong>over</strong>, it was confirmed that Match-T is able to<br />
edit away solitary objects. The tests show that the said accuracy can be achieved regardless <strong>of</strong> scale and<br />
image resolution.<br />
Keywords: accuracy, scale, resolution, terrain type, <strong>landscape</strong> type, texture.<br />
[Seyfert, 1995] reports an investigation made <strong>over</strong> densely built-up areas, open country and wooded areas.<br />
The accuracy study shows that the type <strong>of</strong> <strong>landscape</strong> is crucial. Densely built-up areas give three<br />
42
3 Experience and investigation strategy<br />
times as poor accuracy as open fields. Furthermore, this investigation shows that the same good results<br />
as in other investigations have not been achieved here. In this investigation, the accuracy is 0.7‰ <strong>of</strong> the<br />
flight altitude <strong>over</strong> open land and 2.2‰ <strong>of</strong> the flight altitude <strong>over</strong> densely built-up areas. This investigation<br />
also shows that it did not matter whether the images were scanned in 15 μm or 30 μm.<br />
Keyword: accuracy, resolution, type <strong>of</strong> <strong>landscape</strong>.<br />
In the article [Schenk, 1996] it is mentioned briefly that there are problems with large scales and built-up<br />
areas.<br />
Keywords: scale, <strong>landscape</strong> type.<br />
In the article [Ackermann, 1996] it is mentioned that the photogrammetric DEM <strong>generation</strong> in open country<br />
will not run into serious problems. However, the automatic method has a few problems in areas with<br />
break lines or in areas with low texture. More<strong>over</strong>, areas with vegetation or buildings are a fundamental<br />
problem.<br />
Keywords: texture, terrain type, <strong>landscape</strong> type.<br />
The investigation [Thorpe et al., 1996] looks at images with a resolution <strong>of</strong> 60 μm and scale 1:10,000. The<br />
investigation includes built-up areas, where problems are known to arise. In this article, an accuracy <strong>of</strong><br />
3.26m is achieved which corresponds to 2.17‰ <strong>of</strong> the flight altitude without filtration. After filtration, the<br />
accuracy was increased to 1.04m which corresponds to 0.69‰ <strong>of</strong> the flight altitude.<br />
Keywords: accuracy, <strong>landscape</strong> type.<br />
In the article [Heuchel, 2005] the investigation is done by using images taken by digital frame sensors.<br />
According to Heuchel, the DEM <strong>generation</strong> with digital frame sensors differs little from the use <strong>of</strong> scanned<br />
images. The algorithms used in Match-T are still the same now as they were 15 years ago. Two resolutions<br />
are investigated 8 and 12 bit <strong>data</strong>. The images are taken <strong>over</strong> an open coal mining area. The accuracy<br />
is very much the same, 0.05‰ <strong>of</strong> the flight altitude.<br />
Keywords: accuracy, scale, resolution, terrain type.<br />
3.2.1 Results from the OEEPE-workshop<br />
On the basis <strong>of</strong> several investigations <strong>of</strong> different programme packages for automatic <strong>generation</strong> <strong>of</strong> <strong>elevation</strong>s,<br />
a workshop was arranged in 1998 by the University <strong>of</strong> Stuttgart under the auspices <strong>of</strong> OEEPE:<br />
”OEEPE Experimental Investigations into the <strong>Automatic</strong> DTM Generation”. The purpose was to take a<br />
closer look at accuracy, quality and production improvements. The purpose was also to analyse the<br />
weaknesses <strong>of</strong> the DTM <strong>generation</strong> with regard to pixel size, point density, mesh size and terrain type,<br />
taking into consideration c<strong>over</strong>ed areas, built-up areas and flat/hilly terrain. The material for this investigation<br />
was put at the disposal <strong>of</strong> Stuttgart University and consisted <strong>of</strong> two sets <strong>of</strong> images, <strong>over</strong> the same<br />
area, in scale 1:13,000, scanned in four different resolutions, 7.5 μm, 15 μm, 30 μm and 60 μm. The<br />
<strong>data</strong>set, from July 1995, concerns an area fully c<strong>over</strong>ed by vegetation, while the other set, from October<br />
1996 concerns an area with considerably less vegetation. The reference material consisted <strong>of</strong> points<br />
measured by analytical photogrammetry in a grid with a mesh size <strong>of</strong> 25 x 25m. The reference material<br />
was coded for the different types <strong>of</strong> growth, so that there was a possibility <strong>of</strong> later analysing any problems.<br />
The most extreme types <strong>of</strong> <strong>landscape</strong>, such as woods, gravel pits and waters, were excluded from<br />
the material.<br />
Several different institutions and firms took part in the workshop with different programme packages for<br />
automatic <strong>generation</strong> <strong>of</strong> <strong>elevation</strong>s. The results were presented on 25 – 26 July 1998 and can be found<br />
on the web site <strong>of</strong> "Institut für Photogrammetrie" (http://www.ifp.uni-stuttgart.de/oeepe/index.htm).<br />
In this project, only the results achieved with Match-T are summarised. The investigations with Match-T<br />
were done by five different institutions:<br />
1. Inpho GmbH, Stuttgart<br />
2. Institut Cartogràfic de Catalunya<br />
3. Institut für Photogrammetrie (ifp), Stuttgart<br />
4. National Geographical Institute, Brussels, presented by ifp<br />
43
<strong>Automatic</strong> <strong>generation</strong> <strong>of</strong> <strong>elevation</strong> <strong>data</strong><br />
44<br />
5. The undersigned, Geolab, Aalborg University<br />
Before the results are presented, it should be mentioned briefly that the different investigations have not<br />
been done with the same parameter set-ups. An important difference is the choice <strong>of</strong> terrain type. The terrain<br />
type must be chosen before the <strong>generation</strong> can be done. The choice is between the terrain types:<br />
flat, hilly and mountainous. The choice indicates <strong>over</strong> how many pixels the correlation may be done. If a<br />
flat terrain is chosen, the correlation can be done <strong>over</strong> 3 pixels, if hilly, 8 pixels and in mountainous terrain,<br />
15 pixels. The number <strong>of</strong> pixels <strong>over</strong> which the correlation may be done is called parallax bound.<br />
Parallax bound may thus be 3, 8 or 15 pixels.<br />
3.2.1.1 The result from Inpho GmbH<br />
Inpho’s investigation includes only images with a resolution <strong>of</strong> 15 μm and 30 μm and a mesh size <strong>of</strong> 6m.<br />
Inpho estimated that the terrain type was ”mountainous”, and the correlation was then done <strong>over</strong> 15 pixels.<br />
The result for the July images was ~ 0.25m – 0.5m which corresponds to 0.13‰ – 0.26‰ <strong>of</strong> the flight<br />
altitude, regardless <strong>of</strong> the resolution <strong>of</strong> the images. A closer look showed, however, that there are problems<br />
with different <strong>landscape</strong> types. Inpho’s result shows clearly that areas with hilly terrain, or with only a<br />
little texture gave the greatest problems, while open country and fields gave the best accuracy. It is obvious<br />
that images from October with less leaf c<strong>over</strong> give significantly better results. Here, the improvement<br />
is 35% <strong>over</strong> the July images. It should be noted that the results from Inpho are divided by �2, as Inpho<br />
assumes that the reference points and the generated <strong>elevation</strong>s have the same accuracy. The conclusion<br />
from Inpho is then: the resolution <strong>of</strong> the images is not very influential. Hilly areas with low texture give<br />
problems, whereas open areas give the best result. The result is also better when using images with less<br />
leaf c<strong>over</strong>, that is, October images are better than July images.<br />
Keywords: accuracy, resolution, terrain type, season.<br />
3.2.1.2 Institut Cartogràfic de Catalunya<br />
The investigation done by Institut Cartogràfic de Catalunya also uses images with a resolution <strong>of</strong> 15 μm<br />
and 30 μm respectively. In addition, 2.5 x 2.5 m, 5 x 5m and 25 x 25m grids have been used, and the terrain<br />
is assumed to be ”mountainous”. The result for the July images gave a total accuracy <strong>of</strong> 1.7m which<br />
corresponds to 0.9‰ <strong>of</strong> the flight altitude. Again, the result shows that the resolution <strong>of</strong> the images does<br />
not influence the accuracy much. More<strong>over</strong>, the mesh size has no influence. A closer analysis <strong>of</strong> the individual<br />
<strong>landscape</strong> types shows that there were problems in built-up or <strong>over</strong>grown areas, while open country<br />
and fields gave the best result. As regards the images from October, the accuracy was significantly<br />
improved by approx. 1.1m <strong>over</strong> the July result. This is due in particular to an improvement in the <strong>landscape</strong><br />
type vegetation, from 5.2m to 0.7m. But it is also characteristic <strong>of</strong> the other <strong>landscape</strong> types that<br />
there is an improvement from the July images to the October images. Conclusion: the resolution <strong>of</strong> the<br />
images and the mesh size have no influence. The problem areas are the <strong>landscape</strong> types built-up and<br />
<strong>over</strong>grown. The best result is achieved <strong>over</strong> open fields. Again, a better result is achieved by using images<br />
with less leaf c<strong>over</strong>, that is, October images rather than July images.<br />
Keywords: accuracy, resolution, mesh size, <strong>landscape</strong> type, season.<br />
3.2.1.3 Institut für Photogrammetrie, Stuttgart<br />
The investigation done by Institut für Photogrammetrie (ifp), Stuttgart uses July images with a resolution<br />
<strong>of</strong> 15 μm, 30 μm and 60 μm and October images with a resolution <strong>of</strong> 7.5 μm and 15 μm. In addition, ifp<br />
has used positives as well as negatives <strong>of</strong> the aerial photos. The results from ifp are not presented in table/diagram<br />
form and are therefore not directly comparable to the other four results. However, it can be<br />
seen that there is no difference between using positive and negative images.<br />
Keywords: resolution, positive/negative.<br />
3.2.1.4 National Geographical Institute, Brussels<br />
This investigation has used 15 μm, 30 μm and 60 μm images and 5 x 5 m, 10 x 10 m, 11 x 11m and 23 x<br />
23m grids. Again, the test area has been assumed ”mountainous”. The accuracy achieved varies between<br />
approx. 0.7m and 1.4m (0.3‰ – 0.7‰ <strong>of</strong> the flight altitude), and the result shows that there is not a<br />
great difference between using 15 μm and 30 μm images, or different mesh sizes, while there is a small<br />
reduction <strong>of</strong> the result using 60 μm images. The conclusion is: the accuracy in open country is 0.12‰ <strong>of</strong>
3 Experience and investigation strategy<br />
the flight altitude with a small improvement using 15 μm images. The problem areas are forest edges,<br />
built-up areas and areas with dense vegetation <strong>of</strong> bushes and trees, while the open country needs very<br />
little editing. Resolution and mesh size have little or no influence on the accuracy.<br />
Keywords: accuracy, resolution, mesh size, <strong>landscape</strong> type.<br />
3.2.1.5 Investigation, Aalborg University<br />
In the investigation done at Aalborg University, images with the resolution 15 μm, 30 μm and 60 μm, and<br />
mesh sizes <strong>of</strong> 5 x 5 m, 12.5 x 12.5m and 25 x 25m were used. The terrain type was estimated from the<br />
<strong>elevation</strong> difference between the control points which was ~ 250m. This <strong>elevation</strong> difference was estimated<br />
to be neither flat nor mountainous, so the terrain type ”hilly” was chosen, which meant that the shift<br />
by the correlation could only take place <strong>over</strong> 8 pixels. The result for the July images was an accuracy <strong>of</strong><br />
1m - 2m. In addition, the result showed that neither the resolution <strong>of</strong> the images nor the mesh size had<br />
any great influence on the accuracy. A closer analysis <strong>of</strong> the individual <strong>landscape</strong> types showed that<br />
problems arose in built-up or <strong>over</strong>grown (forest edges) areas, while the open country and fields had an<br />
accuracy < 1m (< 0.5‰ <strong>of</strong> the flight altitude). In the October images, the accuracy was significantly improved<br />
by ~ 0.5m <strong>over</strong> the July images. Specifically, the result was better in the <strong>over</strong>grown areas, as the<br />
automatic <strong>generation</strong> here comes closer to the terrain because <strong>of</strong> the sparse vegetation in the autumn.<br />
Conclusion: Neither the resolution <strong>of</strong> the images nor the mesh size have any great influence on the accuracy.<br />
A better result is achieved by using images with less leaf c<strong>over</strong>, that is, October images rather than<br />
July images.<br />
Keywords: accuracy, resolution, mesh size, <strong>landscape</strong> type, season.<br />
3.2.2 Summation <strong>of</strong> the investigations from the OEEPE workshop<br />
A common result <strong>of</strong> the investigations is that image resolution has little influence on accuracy. There are<br />
problems in areas with vegetation and buildings, while open fields give the best results. A significantly<br />
better result is achieved by using October images rather than July images, as the leaf c<strong>over</strong> is less in October.<br />
If the results <strong>of</strong> the five investigations are compared, it should be noted that Inpho’s investigation is<br />
divided by �2. Even if Inpho’s results are multiplied by �2, they are still the best at ~ 0.35m – 0.7 m,<br />
whereas the remaining participants get results <strong>of</strong> between 0.7m and 2m which corresponds to 0.36‰ –<br />
1.02‰ <strong>of</strong> the flight altitude.<br />
3.2.3 Summation <strong>of</strong> sources and OEEPE workshop<br />
A comparison <strong>of</strong> the results, from the article sources and the results from the OEEPE investigations leads<br />
to the conclusion that there is some divergence. In no way are the same good results achieved in the<br />
source material as in the OEEPE investigations. For instance, the accuracy <strong>over</strong> open, flat terrain varies<br />
from 0.04‰ – 0.07‰ <strong>of</strong> the flight altitude in [Ackermann et al., 1992], to 0.7‰ <strong>of</strong> the flight altitude in [Seyfert,<br />
1995]. However, several sources show that an accuracy around 0.1‰ <strong>of</strong> the flight altitude is realistic<br />
[Eide et al., 1993; Brussels, OEEPE, 1998].<br />
Common to several <strong>of</strong> the articles and the OEEPE results is that the pixel size is estimated to have little<br />
or no influence on the accuracy <strong>of</strong> images in resolution 15 μm and 30 μm, while 60 μm images according<br />
to [Eide et al., 1993] and Brussels give a poorer result. However, the OEEPE investigation from Aalborg<br />
university shows that even 60 μm images give the same result as images in resolution 15 μm and 30 μm.<br />
The results <strong>of</strong> all the sources discussed are collated in the following table. For each keyword an indication<br />
is made, whether it has an influence (+) or not ( / ). In cases where the conclusion is ambiguous, this is<br />
marked (?).<br />
45
<strong>Automatic</strong> <strong>generation</strong> <strong>of</strong> <strong>elevation</strong> <strong>data</strong><br />
Articles Accuracy Resolution Scale Landscape Terrain Mesh Texture Season Pos./neg.<br />
type type size<br />
pictures<br />
Krzystek<br />
(1991)<br />
X X ( / ) X (+)<br />
Krzystek,<br />
Wild (1992)<br />
X X ( / ) X ( / ) X (+) X (+)<br />
Ackermann,<br />
Schneider,<br />
(1992)<br />
X X (+) X ( / ) X (+)<br />
Ackermann<br />
(1992)<br />
X X ( / ) X ( / ) X (+)<br />
Eide, Mardal<br />
(1993)<br />
X X (+) X (+)<br />
Krzystek,<br />
Ackermann<br />
(1995)<br />
X X ( / ) X (+) X (+) X (+)<br />
Krzystek,<br />
Wild, (1995)<br />
X X ( / ) X (+) X (+) X (+) X (+)<br />
Seyfert<br />
(1995)<br />
X X ( / ) X (+) X (+)<br />
Schenk<br />
(1996)<br />
X (+) X (+)<br />
Ackermann<br />
(1996)<br />
X (+) X( ? ) X (+)<br />
Thorpe,<br />
Schickler,<br />
(1996)<br />
X X (+)<br />
Heuchel<br />
(2005)<br />
X X(/) X<br />
Inpho<br />
(1998)<br />
X X ( / ) X (+) X (+) X (+) X (+)<br />
Catalunya<br />
(1998)<br />
X X ( / ) X (+) X ( / ) X (+)<br />
Ifp Stuttgart<br />
(1998)<br />
X ( / )<br />
Brussels<br />
(1998)<br />
X X ( / ) X (+) X ( / ) X (+)<br />
Denmark<br />
(1998)<br />
X X ( / ) X (+) X ( / ) X (+)<br />
Table 3.1: The influence <strong>of</strong> different topics by an automatic <strong>generation</strong> <strong>of</strong> <strong>elevation</strong> <strong>data</strong> using match-T. X = the<br />
topic in question, + = the topic has an influence, / = the topic has no influence and ? = ambiguous conclusion.<br />
On the basis <strong>of</strong> experiences and results as plotted in table 3.1, the following can be concluded:<br />
Pixel size<br />
The sources disagree about the influence <strong>of</strong> pixel size on accuracy. Some examples are quoted here; according<br />
to [Krzystek et al., 1992], considerably better results are achieved by using 15 μm rather than 30<br />
μm images. On the other hand, a more moderate stand is taken by [Ackermann et al., 1992; Eide et al.,<br />
1993; Inpho and Brussels OEEPE, 1998], stating that a little better result is achieved by using 15 μm<br />
rather than 30 μm images. [Seyfert, 1995; Catatunya and myself OEEPE, 1998] find that there is no difference.<br />
However, the difference is pronounced when 60 μm images are used. Here, the accuracy is<br />
somewhat reduced. [Eide et al., 1993; Brussels OEPEE, 1998].<br />
46
3 Experience and investigation strategy<br />
Scale<br />
Opinions also differ about the influence <strong>of</strong> scale. [Krzystek et al., 1992] shows that the same accuracy<br />
can be achieved by different scales, regardless <strong>of</strong> which scale is in question. However, this is only valid<br />
for images in medium or small scale. As regards large scale, it is stated that the <strong>landscape</strong> type gives<br />
problems. [Schenk, 1996]. It can also be seen from the OEEPE presentations that an accuracy <strong>of</strong> 0.1‰ <strong>of</strong><br />
the flight altitude cannot always be counted on.<br />
Mesh size<br />
The sources disagree on the influence <strong>of</strong> mesh size on the accuracy. [Krzystek et al., 1992] mentions that<br />
the mesh size has an influence; the greater the mesh size, the better the result, whereas [Catalunya,<br />
Brussels and the undersigned OEEPE, 1998] found no such influence.<br />
Landscape type<br />
The sources agree that <strong>landscape</strong> types pose a fundamental problem. A <strong>generation</strong> only succeeds in<br />
open areas with solitary objects which Match-T can eliminate on its own [Ackermann et al., 1992; a)<br />
Krzystek et al., 1995]. In addition, the investigations show [Ackermann, 1992; a) Krzystek et al. 1995] that<br />
housing estates appear promising. The investigation [Seyfert, 1995] shows clearly that the <strong>landscape</strong><br />
type has an influence. Here, it is shown that built-up areas give three times as poor results as open fields.<br />
Likewise, [Thorpe et al., 1996] have shown that <strong>generation</strong> <strong>over</strong> built-up areas gives a poor result. In addition,<br />
the presentations from OEEPE show that there are problems with vegetation and buildings.<br />
Terrain type<br />
The sources agree that the terrain type has an influence. According to [Ackermann et al., 1992; Ackermann<br />
1992; Eide et al., 1993; a) Krzystek et al., 1995], an accuracy <strong>of</strong> better than 0.1‰ <strong>of</strong> the flight altitude<br />
can be achieved <strong>over</strong> a flat to slightly hilly <strong>landscape</strong> with solitary objects, as Match-T according to<br />
[Krzystek, 1991; Ackermann 1992; a) Krzystek et al., 1995; b) Krzystek et al., 1995] can handle these objects.<br />
[Ackermann,1996] mentions that photogrammetric DEM <strong>generation</strong> <strong>over</strong> open terrain will run into<br />
problems. Opinions differ about what accuracy can be achieved <strong>over</strong>, for instance, mountainous terrain.<br />
In the investigation by [Eide et al., 1993], it is shown that in mountainous terrain, an accuracy <strong>of</strong> 0.55‰ <strong>of</strong><br />
the flight altitude can be achieved, while, for instance [a) Krzystek et al., 1995], show that an accuracy <strong>of</strong><br />
between 0.2‰ and 0.35‰ can be achieved.<br />
Texture<br />
The sources agree that poor texture has a negative influence on the accuracy. Several sources [Krzystek<br />
1991; b) Krzystek et al., 1995; Inpho (OEEPE), 1998] mention that there are problems with areas with<br />
poor texture, and thus lack <strong>of</strong> interest points for <strong>generation</strong> <strong>of</strong> grid points.<br />
Summation<br />
As seen from the above, there is divergent information about, for instance, the influence <strong>of</strong> pixel size,<br />
scale and mesh size, or the impact <strong>of</strong> <strong>landscape</strong> type and texture. This divergent information forms the<br />
basis for the choice <strong>of</strong> topic for the investigation with Match-T under <strong>Danish</strong> conditions with regard to a<br />
nationwide <strong>elevation</strong> model.<br />
3.3 The investigation strategy <strong>of</strong> this project<br />
On the basis <strong>of</strong> finding out how good a result can be achieved by using Match-T, the lessons learned<br />
from various investigations and the workshop in Stuttgart, a series <strong>of</strong> investigations have been set up with<br />
relevance to a <strong>Danish</strong> terrain. The investigations are chosen with regard to optimising the accuracy, and<br />
at the same time minimising the <strong>data</strong> quantity and editing work. The <strong>data</strong> quantity is evaluated in relation<br />
to the scale and resolution (pixel size) <strong>of</strong> the aerial photos. The editing is evaluated, among other things,<br />
on the basis <strong>of</strong> the influence <strong>of</strong> <strong>landscape</strong> type on the accuracy. Furthermore, a closer analysis <strong>of</strong> the impact<br />
<strong>of</strong> the mesh size has been included.<br />
47
<strong>Automatic</strong> <strong>generation</strong> <strong>of</strong> <strong>elevation</strong> <strong>data</strong><br />
3.3.1 Accuracy in relation to flight altitude<br />
It appears from the source study that there is a great difference in accuracy in relation to flight altitude.<br />
One investigation [Heuchel, 2005] shows that a very good accuracy 0.05‰ <strong>of</strong> the flight altitude can be<br />
achieved. Several other investigations have shown that an accuracy <strong>of</strong> 0.1‰ <strong>of</strong> the flight altitude can be<br />
achieved, while in a few others, an accuracy <strong>of</strong> 0.5‰ - 1.0‰ <strong>of</strong> the flight altitude is achieved, which<br />
means that the difference in results may be <strong>of</strong> the order <strong>of</strong> a factor 10. This may be due to the fact that in<br />
the ”good” investigations [Krzystek, 1991; Krzystek et al., 1992; Ackermann et al., 1992; Ackermann<br />
1992; Eide et al., 1993; a) Krzystek et al., 1995; b) Krzystek et al., 1995], possible gross errors and a<br />
possible <strong>of</strong>fset have been known and taken into consideration. In the results from OEEPE, on the other<br />
hand, it is the ”raw” <strong>data</strong> from which the accuracy is calculated, as no form <strong>of</strong> editing has been done.<br />
3.3.2 Accuracy in relation to images resolution<br />
The source study and the OEEPE investigation show that opinions differ about the influence <strong>of</strong> resolution<br />
on the result, but several sources [Krzystek, 1991; Krzystek et al., 1992; Ackermann et al., 1992; Ackermann,<br />
1992; Eide et al., 1993] mention that 15 μm images give the best result. At the same time, it is<br />
mentioned by [Seyfert, 1995] that no better accuracy is achieved by using 15 μm rather than 30 μm images.<br />
It appears from the Norwegian investigation that there is no great difference in accuracy until a<br />
resolution <strong>of</strong> 60 μm, when a relatively poorer result is achieved [Eide et al., 1993].<br />
3.3.3 Accuracy in relation to mesh size<br />
As a factor in the reduction <strong>of</strong> the <strong>data</strong> quantity, the mesh size should also be discussed. Small mesh<br />
sizes will render the <strong>landscape</strong> in greater detail, but there will be fewer interest points for the determination<br />
<strong>of</strong> the grid points. On the other hand, using greater mesh sizes means there will be many interest<br />
points, facilitating the determination <strong>of</strong> the grid points. The source [Krzystek et al., 1992] mentions that the<br />
mesh size has an influence, while, for instance, the investigation from Aalborg University with the OEEPE<br />
material shows that the mesh size has no influence.<br />
3.3.4 <strong>Danish</strong> <strong>landscape</strong> types<br />
Taking as point <strong>of</strong> departure the opinion <strong>of</strong> [Ackermann et al., 1992; Eide et al., 1993; b) Krzystek et al.;<br />
Ackermann, 1996] that the best accuracy is achieved <strong>over</strong> open flat and slightly hilly terrain, the <strong>Danish</strong><br />
terrain must be characterised as perfect for the use <strong>of</strong> Match-T. 70% <strong>of</strong> the <strong>Danish</strong> <strong>landscape</strong> can be described<br />
as open, flat, slightly hilly farming land with isolated trees (hedges) and houses (farms). The remaining<br />
30% <strong>of</strong> the <strong>landscape</strong> consists <strong>of</strong> urban and wooded areas and waters. It must therefore be assumed<br />
that 70% <strong>of</strong> the <strong>Danish</strong> <strong>landscape</strong> is ideal for automatic <strong>generation</strong> with Match-T.<br />
It must be taken into consideration, however, that there are large agricultural areas in Denmark which will<br />
appear on aerial photos as large uniform planes which, according to [Krzystek, 1991], may pose problems<br />
in large-scale images because <strong>of</strong> a lack <strong>of</strong> texture.<br />
3.4 Selected investigations<br />
The source study has shown that different parameters have an impact on the result <strong>of</strong> an automatic <strong>generation</strong>,<br />
therefore, the following parameters have been selected for a closer look:<br />
48<br />
� Scale<br />
� Pixel size<br />
� Mesh size<br />
� Landscape type, including terrain type<br />
3.4.1 The influence <strong>of</strong> the scale<br />
In this investigation, the influence <strong>of</strong> the image scale on the accuracy is estimated. Supposedly/empirically<br />
seen, the influence <strong>of</strong> the scale should be linear, but different investigations show that the scale has<br />
no influence, except in housing estates, where it has turned out to be problematic to use images in large
3 Experience and investigation strategy<br />
scale [Schenk, 1996], while images in medium or small scale give a promising result [b) Krzystek et al.,<br />
1992]. In addition, it is investigated whether the optimum scale depends on the chosen <strong>landscape</strong> type.<br />
3.4.2 The influence <strong>of</strong> the pixel size<br />
It is investigated, whether it is possible to get a significantly better accuracy in a <strong>Danish</strong> <strong>landscape</strong> by using<br />
images with a higher resolution. Some investigations [Ackermann et al., 1992; Eide et al., 1993] point<br />
to the supposition that the pixel size has an influence on the accuracy, while several others, for instance,<br />
[a) & b) Krzystek et al.; all the investigations from OEEPE, 1998] show that pixel size does not have any<br />
great influence. The optimum is to operate with as low a resolution as possible with regard to the <strong>data</strong><br />
quantity.<br />
3.4.3 The influence <strong>of</strong> the mesh size<br />
On the basis <strong>of</strong> the difference <strong>of</strong> opinion <strong>of</strong> the sources as regards the size <strong>of</strong> the mesh, an investigation<br />
is wanted into the influence <strong>of</strong> the mesh size in the <strong>Danish</strong> terrain. Where the mesh size has no influence,<br />
the optimum is as large a mesh size as possible, as the calculation time is then shortened, and the grid<br />
file is minimised.<br />
3.4.4 The influence <strong>of</strong> the <strong>landscape</strong> type<br />
Investigations by, for instance, [a) Krzystek et al., 1995; Seyfert, 1995; Schenk, 1996] show that built-up<br />
and <strong>over</strong>grown areas pose problems. Furthermore, areas with little or no texture may also give rise to<br />
problems by the correlation [Krzystek, 1991]. As Denmark consists <strong>of</strong> large areas (fields) with low texture,<br />
this problem is extremely relevant in large parts <strong>of</strong> Denmark. An investigation into the usability <strong>of</strong> the<br />
method in the <strong>Danish</strong> <strong>landscape</strong> is one <strong>of</strong> the purposes <strong>of</strong> this project.<br />
3.5 Summation<br />
These are the investigations which are interesting, and have therefore been selected for inclusion in this<br />
project with regard to generating <strong>elevation</strong> <strong>data</strong> for a new model or for updating purposes.<br />
In the investigation, the aim is to put up a list in which the necessary scale, resolution and mesh size appear<br />
with due consideration <strong>of</strong> the <strong>landscape</strong> type and the desired accuracy.<br />
A test area is chosen for use in the investigation, and a frame <strong>of</strong> reference with superior accuracy is established.<br />
Aerial photos are taken <strong>over</strong> the test area in different scales, and these images are scanned in<br />
different resolutions. In addition, grids with different mesh sizes are generated, where the planimetric coordinates<br />
<strong>of</strong> the grid points will merge with the planimetric co-ordinates <strong>of</strong> the frame <strong>of</strong> reference.<br />
All grids are compared with the frame <strong>of</strong> reference to examine the accuracy and possible gross errors.<br />
Subsequently, an analysis is done <strong>of</strong> how such gross errors have arisen and why. Is it due to a correlation<br />
error, or to objects such as trees and houses? The analysis is done by visualisation <strong>of</strong> the location <strong>of</strong> the<br />
gross errors on an orthophoto <strong>of</strong> the test area. Here, it is possible to see whether the error is due to objects<br />
or to a correlation error <strong>over</strong>, for instance, an area with poor texture.<br />
49
<strong>Automatic</strong> <strong>generation</strong> <strong>of</strong> <strong>elevation</strong> <strong>data</strong><br />
50
4 The <strong>data</strong> material<br />
4 The <strong>data</strong> material<br />
In this chapter the <strong>data</strong> material <strong>of</strong> the investigations, in the project, is described, though only briefly. A<br />
more detailed description <strong>of</strong> the <strong>data</strong> capture, image resolution, accuracy etc. can be found in Appendix<br />
B.<br />
All investigations presume that the chosen test area is characteristic <strong>of</strong> the <strong>Danish</strong> <strong>landscape</strong>. In addition,<br />
a frame <strong>of</strong> reference <strong>of</strong> the test area must be established, and aerial photos in different scales must be<br />
taken <strong>over</strong> the test area. The images will subsequently be scanned in different resolutions.<br />
4.1 The test area<br />
Several areas in Northern Jutland were evaluated, both areas close to Aalborg University and further<br />
away. The choice fell on an area <strong>of</strong> 3.5 km x 4.0 km south <strong>of</strong> Aalborg University. The area includes a typical<br />
<strong>Danish</strong> <strong>landscape</strong> with open, flat areas, hilly areas, <strong>over</strong>grown areas, built-up areas etc. The choice <strong>of</strong><br />
area is made on the basis <strong>of</strong> the literary study’s identification <strong>of</strong> particularly interesting (problematic) <strong>landscape</strong><br />
and terrain types, that is, areas with vegetation, built-up areas and open areas with low texture.<br />
More<strong>over</strong>, in this test area it is possible to take a closer look at other <strong>landscape</strong> types which are typically<br />
<strong>Danish</strong> and which, according to the literary study, should be ideal <strong>landscape</strong> types for automatic <strong>generation</strong><br />
<strong>of</strong> <strong>elevation</strong> <strong>data</strong>.<br />
Five characteristic <strong>landscape</strong> types are chosen for this investigation:<br />
� Open, flat terrain (fields)<br />
� Gravel pits<br />
� Housing estates (villages)<br />
� Open, hilly terrain (fields)<br />
� Overgrown terrain (woods)<br />
The open, flat terrain is a river valley, where there are no trees, buildings etc. Two gravel pits are included,<br />
as these are very hilly and thus, represent steep slopes. The housing estate is an area with one-<br />
or one-and-a-half-storey houses surrounded by gardens. In the open, hilly terrain there are a few farms<br />
with several buildings and trees around. In addition, there are hedges and such surrounding the fields.<br />
This means that the area is not a 100% open area. The last terrain is a wood with both dense and open<br />
areas, tall and low vegetation, made up <strong>of</strong> different species <strong>of</strong> trees.<br />
The selected areas for the different <strong>landscape</strong> types are marked on figure 4.1 with colours, so that green<br />
shows a typical flat <strong>landscape</strong>, orange shows the location <strong>of</strong> the two gravel pits, red marks the village areas,<br />
violet the areas with hilly <strong>landscape</strong>, and blue areas with woods. In addition, the location <strong>of</strong> the test<br />
area is seen in relation to Aalborg University.<br />
51
<strong>Automatic</strong> <strong>generation</strong> <strong>of</strong> <strong>elevation</strong> <strong>data</strong><br />
Figure 4.1: The 3.5 km x 4.0 km test area with an indication <strong>of</strong> the location <strong>of</strong> the different <strong>landscape</strong> types.<br />
4.2 Aerial photos<br />
Aerial photos have been taken <strong>over</strong> the test area in three different flight altitudes producing test material<br />
in scales 1:5,000, 1:15,000 and 1:25,000. The point <strong>of</strong> departure for the choice <strong>of</strong> these scales is the<br />
<strong>Danish</strong> tradition for shots in scale 1:25,000 for nationwide mapping, and 1:5,000 for detailed projecting. In<br />
addition, 1:15,000 has been included in order to decide, whether there is a linear connection between<br />
scale and accuracy. The aerial photos <strong>of</strong> the test area in scales 1:5,000, 1:15,000 and 1:25,000 form 36,<br />
7 and 2 models respectively.<br />
The images were scanned in a PS1 PhotoScan, where the possible resolutions are 7.5 μm, 15 μm, 30<br />
μm, 60 μm and 120 μm. To avoid too many analysis possibilities but, at the same time, keeping the possibility<br />
<strong>of</strong> determining whether the resolution <strong>of</strong> the images may have a linear influence, it has been decided<br />
to look at only three different resolutions. To avoid too great a <strong>data</strong> quantity, the pixel size 7.5 μm<br />
has been excluded. To examine images with a resolution around the traditional 25 μm, the choice has<br />
been to scan in 15 μm, 30 μm and 60 μm, excluding the resolution 120 μm.<br />
The shots were to be taken before leafing foliation, but the year 1996, when the images were taken, was<br />
a problematic year with late snow and early foliation. As a result, there are some leaves on the trees.<br />
52<br />
Aalborg<br />
University<br />
Gravel pit<br />
Flat<br />
terrain<br />
Test area<br />
Village<br />
Woods<br />
Hilly<br />
terrain
4 The <strong>data</strong> material<br />
4.3 Control points<br />
This investigation was started back in the mid 90’s and at that time the determination <strong>of</strong> the airplanes position<br />
by GPS/INS was not good enough. The orientation <strong>of</strong> the images is, therefore, done on behalf <strong>of</strong><br />
ground control points. The selection <strong>of</strong> control points for the orientation <strong>of</strong> the images builds on the <strong>Danish</strong><br />
tradition, where well-defined terrain objects with a good contrast are used. In this project, the selection<br />
has therefore included wells, gratings, road markings etc. For the models in 1:25,000 and 1:15,000, a<br />
smaller number <strong>of</strong> control points are in question, while for the 36 models in 1:5,000, a greater number are<br />
in question. The measuring has been done with GPS. As the measuring for the 1:5,000 images is very<br />
time-consuming, it is supplemented by a bundle adjustment. The location <strong>of</strong> the control points in the<br />
models can be viewed in Appendix B, section B.1.3. Altogether, 77 control points and check points were<br />
measured. The result <strong>of</strong> the GPS calculation and the bundle adjustment can be found in Appendix E. The<br />
accuracy <strong>of</strong> the GPS points is:<br />
X = 0.011 m<br />
Y = 0.014 m<br />
Z = 0.015 m<br />
The 77 control points and check points form part <strong>of</strong> the bundle adjustments <strong>of</strong> all the images in the three<br />
scales. A discussion <strong>of</strong> the bundle adjustment can be found in Appendix B, section B.2.2.2.<br />
4.4 Selection <strong>of</strong> models<br />
All the models in 1:25,000 and 1:15,000 are included, while the number <strong>of</strong> models in 1:5,000 is reduced<br />
to 14 out <strong>of</strong> the 36 models. The models are selected according to those <strong>landscape</strong> types which are interesting<br />
for this project. The chosen models’ approximate location in the test area is shown in figure 4.1.<br />
4.5 The frame <strong>of</strong> reference<br />
In order to make an analysis, there must be a standard <strong>of</strong> comparison, a frame <strong>of</strong> reference. The frame <strong>of</strong><br />
reference is determined photogrammetrically in an analytical instrument, Planicomp. As the reference<br />
points must be compared with automatically generated points, and these are generated in a fixed grid, the<br />
reference points should also be determined in the same fixed grid. The reference points are determined<br />
with a fixed mesh size <strong>of</strong> 25 x 25m. For the <strong>landscape</strong> type gravel pit, however, the mesh size was reduced<br />
to 5 x 5m. The planimetric co-ordinates for the reference points are chosen, so that the X- and Yco-ordinates<br />
end on ***00.00, ***25.00, ***50.00 and ***75.00. For the mesh size 5 x 5 m, the planimetric<br />
co-ordinates end on ****5.00 or ****0.00. The mesh size was automatically fixed by the PlaniComp. When<br />
it was not possible to determine the <strong>elevation</strong> in the fixed grid, because <strong>of</strong> trees or houses, the point was<br />
moved out, where it was possible to see the terrain. Subsequently, it was moved back to the original grid,<br />
where measurements continued.<br />
The measured reference points have been assigned an object code which refer to the different <strong>landscape</strong><br />
types. The following number <strong>of</strong> points have been measured within each <strong>landscape</strong> type:<br />
� Open, flat terrain = 2092 points<br />
� Open, hilly terrain = 2814 points<br />
� Wooded/<strong>over</strong>grown terrain = 1223 points<br />
� Village = 1629 points<br />
� Gravel pit = 2429 points<br />
To ensure that the reference points can be used as a basis for the analysis, they must have a superior<br />
accuracy. As mentioned earlier, [Krzystek et al., 1992] describe that it is possible to determine <strong>elevation</strong>s<br />
automatically with an accuracy <strong>of</strong> 0.1‰ <strong>of</strong> the flight altitude. For images in scale 1:5,000, this means that<br />
53
<strong>Automatic</strong> <strong>generation</strong> <strong>of</strong> <strong>elevation</strong> <strong>data</strong><br />
an accuracy for the generated <strong>elevation</strong>s <strong>of</strong> approx. 0.075m can be achieved. For images in 1:15,000 and<br />
1:25,000, it should be possible to achieve an accuracy <strong>of</strong> approx. 0.225m and approx. 0.375m respectively.<br />
The reference points should therefore be determined with an accuracy better than 0.075m.<br />
The accuracy <strong>of</strong> the frame <strong>of</strong> reference is a combination <strong>of</strong> the accuracies <strong>of</strong> the control points, including<br />
their measuring and their definition, and the accuracy with which an experienced stereo-operator can<br />
measure <strong>elevation</strong>s. The last-mentioned is indicated as 0.06‰ <strong>of</strong> the flight altitude.<br />
The accuracy <strong>of</strong> the photogrammetrically measured <strong>elevation</strong>s (the frame <strong>of</strong> reference) therefore consists<br />
<strong>of</strong> the following three contributions:<br />
�<br />
Where:<br />
54<br />
2<br />
Z<br />
�z = the accuracy <strong>of</strong> the photogrammetrically measured <strong>elevation</strong>s<br />
0.06‰ <strong>of</strong> H = the empirical experience <strong>of</strong> how well a pr<strong>of</strong>essional operator can measure <strong>elevation</strong> <strong>data</strong><br />
H = the flight altitude<br />
�ctrl.pt. = the accuracy <strong>of</strong> the control point determination by GPS<br />
�def = the accuracy <strong>of</strong> the definition <strong>of</strong> the control points<br />
In this project, a bundle adjustment has been done. The accuracy <strong>of</strong> the bundle adjustment includes the<br />
accuracy <strong>of</strong> the control point measurements and the accuracy <strong>of</strong> their definition. As can be seen from Appendix<br />
A, section A.5, the accuracy <strong>of</strong> the control points in the 1:5,000 images after the bundle adjustment<br />
is:<br />
x = 0.031 m<br />
y = 0.034 m<br />
z = 0.045 m<br />
and the accuracy <strong>of</strong> the tie points after the bundle adjustment is:<br />
x = 0.034 m<br />
y = 0.040 m<br />
z = 0.060 m<br />
If Bingo/Match-T is used on images in scale 1:5,000, the output will include the control point accuracy as<br />
well as the accuracy achieved by the bundle adjustment.<br />
This means that the accuracy can be determined as:<br />
�<br />
2<br />
Z<br />
Where:<br />
2 2<br />
� ((0.06 0<br />
00 af H) � � � ctrl.pt. �<br />
�<br />
2<br />
� (0,06 0<br />
00 ) �<br />
�<br />
�<br />
2<br />
z aero<br />
ctrl.pt.<br />
orient<br />
2<br />
def<br />
)<br />
� 0,045<br />
� 0,06<br />
� 0,075<br />
�z = the accuracy <strong>of</strong> the photogrammetrically measured <strong>elevation</strong>s<br />
�z aero + ctrl.pt. + orient = the accuracy achieved by the bundle adjustment which is 0.06 m<br />
�measurement = the accuracy <strong>of</strong> the measurements <strong>of</strong> the frame <strong>of</strong> reference, estimated at 0.045m by<br />
error-free control points<br />
As will be seen from the above, the accuracy in the Z-direction is approx. 0.075m.<br />
m<br />
2<br />
Very few control points have an accuracy poorer than 0.1m after the bundle adjustment. If this accuracy is<br />
used as the basis <strong>of</strong> estimation for the frame <strong>of</strong> reference, we have:<br />
m<br />
2<br />
m
�<br />
2<br />
Z<br />
�<br />
2<br />
� (0,06 0<br />
00 ) � z aero �<br />
ctrl.pt. �<br />
2<br />
orient<br />
�<br />
0,045<br />
m<br />
� 0,1<br />
4 The <strong>data</strong> material<br />
As there are very few control points which are determined with an accuracy poorer than 0.1 m, the accuracy<br />
<strong>of</strong> the whole frame <strong>of</strong> reference is, therefore, set at 0.1m. For images in 1:15,000 and 1:25,000, the<br />
frame <strong>of</strong> reference has a superior accuracy. An accuracy <strong>of</strong> 0.1m is not superior compared to the accuracy<br />
which can be achieved by using images in 1:5,000. However, work goes on with this frame <strong>of</strong> reference<br />
and also for images in 1:5,000, as that is the best possible reference that the project can produce.<br />
According to Chapter 1, the goal <strong>of</strong> the project is to analyse and value the accuracy that can be achieved<br />
by automatic <strong>generation</strong> in consideration <strong>of</strong>, for instance, scale. Images in 1:5,000 will therefore be valued,<br />
even though the reference is not superior.<br />
The points <strong>of</strong> reference were not determined for the whole test area, but only for the models/areas with<br />
<strong>landscape</strong> types which are interesting for the investigations. In order to reduce the error contribution, the<br />
frame <strong>of</strong> reference was determined by an experienced operator. A closer description <strong>of</strong> the determination<br />
<strong>of</strong> the frame <strong>of</strong> reference can be found in Appendix B, section B.1.8.3.<br />
2<br />
m<br />
2<br />
�<br />
0,11<br />
m<br />
55
5 Preparation for the grid <strong>generation</strong><br />
5 Preparation for the grid <strong>generation</strong><br />
This chapter describes the Match-T set-up which is the basis for all the automatically generated grid calculations<br />
which are included in the investigations. The Match-T version employed is version 2.2.0.<br />
5.1 The set-up <strong>of</strong> Match-T<br />
The use <strong>of</strong> Match-T demands a series <strong>of</strong> input <strong>data</strong> and a choice <strong>of</strong> parameters. A superior programme<br />
menu, “Project Manager” is available to handle the information. A project is defined and organised under<br />
“Project Manager” which handles all project-related <strong>data</strong>, such as image material, geometric <strong>data</strong> and<br />
possible external measurements/<strong>data</strong>, see figure 5.1.<br />
Geometric <strong>data</strong><br />
Orientation <strong>data</strong><br />
Camera information<br />
Earth curvature<br />
Refraction<br />
Figure 5.1: The process course in Match-T.<br />
Image material<br />
Digital images<br />
(*.tif, *.itex, *.bt<br />
or *.raw format)<br />
Project definition<br />
Determination<br />
<strong>of</strong> project<br />
parameters<br />
Orientation <strong>of</strong> model<br />
Inner orientation<br />
Absolute orientation<br />
Pre-processing<br />
Normalisation<br />
Image pyramid<br />
Object pyramid<br />
DEM <strong>generation</strong><br />
Preliminary image matching<br />
3D intersection<br />
Finite Element Interpolation<br />
Post-processing<br />
DEM – analysis<br />
DEM – editing<br />
DEM – output<br />
External measurements/<strong>data</strong><br />
Break lines<br />
Excluded areas<br />
External points<br />
Boundary lines<br />
57
<strong>Automatic</strong> <strong>generation</strong> <strong>of</strong> <strong>elevation</strong> <strong>data</strong><br />
5.1.1 Image material<br />
The location <strong>of</strong> the digital image material must be indicated with the full path connection. In the Match-T<br />
version 2.2.0, the image material must be stored in *.itex, *.tif or *.bt format. For each model, the pair <strong>of</strong><br />
images must be indicated, and the location <strong>of</strong> the models in the block must be given.<br />
In this project, the images have the format *.bt or *.itex, and it is noted that aerial photos have been used.<br />
Each pair <strong>of</strong> images and their location paths are given.<br />
5.1.2 Geometric <strong>data</strong><br />
Under the heading <strong>of</strong> geometric <strong>data</strong>, the terrain type and the mean <strong>elevation</strong> <strong>over</strong> the terrain, the calibration<br />
report <strong>of</strong> the camera, control points, earth curvature and refraction are indicated. The information<br />
from the calibration report <strong>of</strong> the camera can be keyed in or transferred per file, if the information lies in<br />
Match-T camera format. The co-ordinates <strong>of</strong> the control points can be keyed in with an indication <strong>of</strong><br />
whether it is a planimetric control point, a height control point or a fully measured control point, its accuracy,<br />
etc. The control point co-ordinates can also lie in a separate control point file to which a reference is<br />
given with full path connection. Finally, it must be indicated whether the earth curvature and the refraction<br />
must be taken into consideration.<br />
In this project the terrain type is given as flat, the mean <strong>elevation</strong> as 75 m, the information from the calibration<br />
report <strong>of</strong> the camera is keyed in manually, the control points are keyed in manually and the earth<br />
curvature, refraction and lens distortion have been considered.<br />
5.1.3 External <strong>data</strong><br />
A <strong>generation</strong> <strong>of</strong> <strong>elevation</strong>s can be supported by external <strong>data</strong>. This is done by including external <strong>elevation</strong><br />
<strong>data</strong> as a part <strong>of</strong> the calculation itself, for instance a grid or as break lines.<br />
However, this possibility has not been used in this project, even though an actual <strong>elevation</strong> model exists.<br />
That is because the purpose is to find out how well Match-T is able to determine <strong>elevation</strong>s without the<br />
influence <strong>of</strong> other <strong>data</strong>. The existing <strong>elevation</strong> <strong>data</strong> will only be included as a standard <strong>of</strong> comparison.<br />
After the initial set up, the project was chosen. The further calculation process is divided into four steps:<br />
orientation <strong>of</strong> the images, determination <strong>of</strong> primary <strong>data</strong>, the DEM <strong>generation</strong> and, finally, the postprocessing.<br />
5.1.4 Orientation <strong>of</strong> the model<br />
In Match-T, first the inner, then the absolute orientation are determined. The relative orientation is not determined,<br />
cf. Chapter 2 part 2.4.1.<br />
5.1.4.1 Inner orientation<br />
In Match-T, the inner orientation can be determined manually or automatically.<br />
The automatic measuring <strong>of</strong> the inner orientation was not stable at the start <strong>of</strong> the project, giving a poorer<br />
result than if the orientation had been done manually, therefore, the inner orientation has been done<br />
manually.<br />
5.1.4.2 Absolute orientation<br />
Parameters which might have an influence on the absolute orientation are the possibilities <strong>of</strong> stereo vision<br />
and the definition <strong>of</strong> the control points. The definition <strong>of</strong> the control points is dependent on among other<br />
things, the resolution <strong>of</strong> the images.<br />
Stereo vision.<br />
The control points in the images are chosen according to those criteria which are used in a stereo system.<br />
In the Match-T version 2.2.0, orientation <strong>of</strong> the images is done, however, in a mono-system, there is<br />
no possibility <strong>of</strong> orientating the images in stereo. The control points in a mono-system must be physical<br />
objects which can be recognised in the images. Not all the chosen control points live up to this demand.<br />
For example, the height control points are chosen on flat areas, for instance in a field or in the middle <strong>of</strong> a<br />
58
5 Preparation for the grid <strong>generation</strong><br />
courtyard, where it was possible to see in stereo and thus determine the <strong>elevation</strong>. The determination <strong>of</strong><br />
the height control points is, therefore, not possible because <strong>of</strong> the lack <strong>of</strong> stereo vision in Match-T.<br />
The influence <strong>of</strong> resolution on the control points.<br />
The control points are chosen in the analogous images. The experience gained in this project shows that<br />
control points chosen in analogous images cannot be transferred directly to digital images. The analogous<br />
aerial images lose some <strong>of</strong> their clarity by later scanning which is particularly important to the definition<br />
and contrast <strong>of</strong> the points. The contrast between control points and their surroundings must therefore<br />
be greater by digital photogrammetry than by analytical photogrammetry. Their definition in 15 μm images<br />
is a little blurred, and even more so in the 30 μm images. As for the 60 μm images, the control points are<br />
so blurred that they can only be recognised/localised by an operator who ”knows” where the control<br />
points are, and therefore can recognise their location in the images.<br />
To avoid that the standard <strong>of</strong> comparison, <strong>of</strong> the different image resolutions, vary because <strong>of</strong> different orientations,<br />
it has been decided to ”re-use” the same orientation for each image, regardless <strong>of</strong> resolution.<br />
The orientation <strong>of</strong> the individual images can be achieved by use <strong>of</strong> different methods. For example, the<br />
orientation <strong>of</strong> 15 μm images can be transferred to the 30 μm and 60 μm images, as the definition <strong>of</strong> the<br />
control points is best in the 15 μm images. However, incomplete <strong>elevation</strong> orientation caused by lack <strong>of</strong><br />
stereo vision will still be a problem.<br />
As it has not always been possible to select physical objects as height control points, and to avoid different<br />
orientations, it has been decided in this project to orientate all images in a Planicomp, and do a subsequent<br />
bundle adjustment in the programme package Bingo. As regards the images in scale 1:5,000,<br />
the orientation exists as a consequence <strong>of</strong> the creation <strong>of</strong> the frame <strong>of</strong> reference. As regards images in<br />
scale 1:15,000 and 1:25,000, this extra process is done to achieve a uniform orientation <strong>of</strong> the images.<br />
The orientations achieved are then transferred to the respective images, regardless <strong>of</strong> their resolution. As<br />
a result, the orientation <strong>of</strong> the individual images will be the same, and the orientation will, therefore, not be<br />
included as a source <strong>of</strong> error in the comparison <strong>of</strong> the individual analyses, or by the evaluation <strong>of</strong> the<br />
method used for automatic <strong>generation</strong> <strong>of</strong> <strong>elevation</strong>s in general.<br />
The orientation <strong>of</strong> the images.<br />
The table below shows the maximum deviation from the absolute orientation in x, y, z, �, � and � for images<br />
in the different scales achieved in Bingo. The results can be seen in Appendix A, section A.3.<br />
Scale Accuracy in<br />
x (m)<br />
Accuracy in<br />
y (m)<br />
Accuracy in<br />
z (m)<br />
Max. deviation in<br />
� (mgon)<br />
Max. deviation in<br />
� (mgon)<br />
Max. deviation in<br />
� (mgon)<br />
1 : 5,000 0.103 0.108 0.064 7.9 6.7 3.6<br />
1 : 15,000 0.218 0.226 0.152 5.9 5.3 2.6<br />
1 : 25,000 0.277 0.241 0.197 4.6 3.3 1.7<br />
Table 5.1: The accuracy <strong>of</strong> the absolute orientation in x, y, z, �, � and �<br />
Table 5.1 shows that the poorest accuracy is the planimetric, whereas the <strong>elevation</strong> is somewhat better<br />
determined which is important for this project, as it is the <strong>elevation</strong>s which are <strong>of</strong> interest. If the deviation<br />
is expressed in ‰ <strong>of</strong> the flight altitude, the result is 0.09‰ <strong>of</strong> the flight altitude for images in scale 1:5,000,<br />
0.07‰ for scale 1:15,000 and 0.05‰ for scale 1:25,000.<br />
The results <strong>of</strong> the bundle adjustments <strong>of</strong> the images in 1:5,000, 1:15,000 and 1:25,000 can be found in<br />
Appendix A, section A.3 and A.5.<br />
Transfer <strong>of</strong> the orientation to Match-T<br />
In Match-T, it is possible to transfer the orientation parameters from Bingo automatically. The transfer<br />
presupposes, however, that the orientation and scanning <strong>of</strong> the images are done in the same direction<br />
which is not the case in this project. In Planicomp, all the images have been orientated towards south. As<br />
regards the scanned images, the greater part is scanned with north upwards. Still, images which were<br />
part <strong>of</strong> a block with several strips were scanned with both north and south upwards. For images in scale<br />
1:15,000, the first strip was scanned with north upwards and the second strip with south upwards. For im-<br />
59
<strong>Automatic</strong> <strong>generation</strong> <strong>of</strong> <strong>elevation</strong> <strong>data</strong><br />
ages in 1:5,000, the first strip was scanned with north upwards, the second strip with south upwards, the<br />
third strip again with north upwards and the last strip with south upwards.<br />
In this project, the orientation parameters are therefore keyed in manually.<br />
5.1.5 Pre-processing <strong>of</strong> primary <strong>data</strong><br />
After the orientation <strong>of</strong> the images, the pre-processing is carried out. First the images are normalised,<br />
then an image pyramid and an object pyramid respectively are created.<br />
5.1.5.1 Normalisation<br />
Each image was normalised, that is, an epipolar geometry was built up according to the principles described<br />
in Appendix 1, section A.1.4. These normalised images were then stored on the hard disk.<br />
5.1.5.2 Image pyramid<br />
For each <strong>of</strong> the normalised images, an image pyramid was built. As standard, the image pyramid was<br />
built by the Gaussian function <strong>over</strong> 5 x 5 pixels. For images with a resolution <strong>of</strong> 15 μm, 9 levels more than<br />
the original image were built. For images with resolution 30 μm, the image pyramid was built with 8 levels,<br />
and for the 60 μm images with 7 levels more than the original image. (Cf. Appendix A, section A.1.7).<br />
The standard set-up for Match-T has been chosen for this project.<br />
5.1.5.3 Object pyramid<br />
The object pyramid with interest points is built from the image pyramid. This is done according to the principles<br />
described in Appendix A, section A.1.8.<br />
Primary <strong>data</strong>, that is, the normalised images and the image and object pyramids are not changed by the<br />
later correlation or DEM <strong>generation</strong>. This process is therefore not influenced by changes such as, for instance,<br />
a different set up <strong>of</strong> parameters for the DEM <strong>generation</strong>. Therefore, primary <strong>data</strong> is re-used in the<br />
subsequent calculations with different mesh sizes. This is done to save calculation time.<br />
5.1.6 The DEM <strong>generation</strong><br />
Input arguments for the grid <strong>generation</strong> include indication <strong>of</strong> the calculation area defined by the lower left<br />
co-ordinate (lower left, II) and the upper right co-ordinate (upper right, ur). In addition, a starting point is<br />
indicated. This starting point must be located within the model.<br />
In this project, the co-ordinates for (II) and (ur) are chosen, so that the calculation areas are indicated by<br />
means <strong>of</strong> the corner points in such a way that neighbouring areas adjoin without <strong>over</strong>lap. This is done to<br />
avoid <strong>elevation</strong>s being generated <strong>over</strong> the same area twice. This is valid for neighbouring models as well<br />
as between strips. By avoiding <strong>over</strong>lapping areas, possible problems arising from such double <strong>elevation</strong>s<br />
will not have to be taken into consideration later in the project.<br />
The mesh size is chosen under the parameters for DEM <strong>generation</strong>. For this project, <strong>elevation</strong>s are generated<br />
in a grid with a mesh size <strong>of</strong> 5 x 5 m, 12.5 x 12.5m and 25 x 25m respectively. As mentioned earlier,<br />
the primary <strong>data</strong> is not re-calculated, it is only the DEM <strong>generation</strong> itself which is determined for each<br />
mesh size.<br />
To achieve the optimum standard <strong>of</strong> comparison, the automatically generated grids must be coincident<br />
with the frame <strong>of</strong> reference which has a mesh size <strong>of</strong> 25 x 25m and 5 x 5m respectively. Therefore, the<br />
automatic <strong>elevation</strong>s are generated in the same grid as the frame <strong>of</strong> reference. This means that for the<br />
automatically generated grids with the mesh size 25 x 25 m, the same co-ordinate endings are fixed as<br />
for the frame <strong>of</strong> reference, which means that the planimetric co-ordinates X an Y end on ***00.00,<br />
***25.00, ***50.00 and ***75.00. For grids with a mesh size <strong>of</strong> 12.5 x 12.5 m, the co-ordinate endings are<br />
***00.00, ***12.50,***25.00, ***37.50, ***50.00 etc. For this mesh size every other grid point will be coincident<br />
with a reference point. For automatically generated grids with a mesh size <strong>of</strong> 5 x 5 m, the planimetric<br />
co-ordinates end in ****5.00 or ****0.00. Here each point will be coincident with a reference point in the<br />
reference grid <strong>of</strong> 5 x 5 m, while there will be coincidence in every 5th reference point in the 25 x 25m grid.<br />
60
5 Preparation for the grid <strong>generation</strong><br />
5.1.6.1 Correlation<br />
The standard value for the correlation window is 5 x 3 pixels. The threshold value <strong>of</strong> the correlation coefficient<br />
is as a standard value 0.75. The correlation coefficient is described in Appendix A, section A.1.1.1.1.<br />
In this project the <strong>landscape</strong> is considered as flat.<br />
The standard value for the correlation window and the correlation coefficient is selected and fixed. The<br />
choice <strong>of</strong> a flat terrain entails a parallax bound in the x-direction (because <strong>of</strong> the normalised images) <strong>of</strong> 3<br />
pixels, see Chapter 2, section 2.4.3.1.<br />
5.1.6.2 The finite-element reconstruction<br />
In the finite-element reconstruction, the values for the curvature, the torsion, the standard deviation etc.<br />
are fixed. The standard value <strong>of</strong> the curvature and torsion is 3, see the description <strong>of</strong> curvature and torsion<br />
in Chapter 2, section 2.4.3.2. The standard value for the standard deviation <strong>of</strong> the determined terrain<br />
points is 0.20m. The iteration process goes through 2 separate phases. The standard value <strong>of</strong> the first<br />
phase is 6 and for the last phase is 4. The last parameter used in the set up in this project is the threshold<br />
for the bias, the standard value is 35 %.<br />
All these standard values are fixed. The chosen values are presented in table 5.2:<br />
Function Parameter Value Comments<br />
The image and object pyramid Gaussian function <strong>over</strong> 5 x 5 pixels 9 levels Standard for 15 μm images<br />
The image and object pyramid Gaussian function <strong>over</strong> 5 x 5 pixels 8 levels Standard for 30 μm images<br />
The image and object pyramid Gaussian function <strong>over</strong> 5 x 5 pixels 7 levels Standard for 60 μm images<br />
DEM <strong>generation</strong> Window size for convolution 5 x 3 pixels Standard window size<br />
DEM <strong>generation</strong> Parallax bound in row direction 3 pixels Standard value for flat terrain<br />
DEM <strong>generation</strong> Threshold for correlation coefficient 0.75 Standard value<br />
Finite-element Curvature and torsion 3 Standard value<br />
Finite-element Standard deviation for grid points 0.20 m Standard value<br />
Finite-element First iteration process 6 Standard value<br />
Finite-element Second iteration process 4 Standard value<br />
Finite-element Threshold value for bias 35 % Standard value<br />
Table 5.2: The standard set-up for Match-T for all calculations.<br />
The above parameters are fixed in all automatically generated grid calculations. As described in Chapter<br />
4, there are digital images in three different scales and three different resolutions. In addition, calculations<br />
are planned with three different mesh sizes, that is, 27 calculations in all.<br />
5.2 Grid calculation<br />
After setting up Match-T, the calculations are done. In Match-T there are three modules where the grid<br />
calculation can be followed online. These modules are called:<br />
� Monitor for individual programme steps<br />
� Graphic online/<strong>of</strong>fline<br />
� Online statistics<br />
5.2.1.1 Monitor for individual programme steps<br />
While the calculation itself is running, the process can be followed in the window, ”Monitor for individual<br />
programme steps”. Here the individual steps for normalisation, pyramid build-up and DEM <strong>generation</strong> can<br />
be followed numerically and in bar form. In this window, the currently used time and the estimated use <strong>of</strong><br />
time are indicated for each process. Likewise, there is a possibility <strong>of</strong> interrupting the calculation. In this<br />
project the module is only used to follow the calculation and will not be mentioned further.<br />
5.2.1.2 Graphic online/<strong>of</strong>fline<br />
Graphic online/<strong>of</strong>fline is a visualisation function which <strong>of</strong>fers the opportunity to follow the correlation and<br />
grid <strong>generation</strong> process online, where the correlated points and grid points are shown. This function must<br />
61
<strong>Automatic</strong> <strong>generation</strong> <strong>of</strong> <strong>elevation</strong> <strong>data</strong><br />
be chosen before the calculation is started. The function <strong>of</strong>fers the possibility <strong>of</strong> doing an a priori evaluation<br />
<strong>of</strong> the generated grid. It shows only a single model calculation at a time, so if the calculation consists<br />
<strong>of</strong> several consecutive models, the visualisation tool must be opened manually when the next model calculation<br />
starts. If a graphic result for each model is wanted, the calculations must be followed closely.<br />
This has not been done for all calculations in this project because some <strong>of</strong> the time consuming calculations<br />
have been done during the night.<br />
The result <strong>of</strong> this visualisation is not stored automatically on the hard disk. If the image is to be kept, it<br />
must be done by screen dump in a self-elected file. A closer look at some <strong>of</strong> the results <strong>of</strong> the graphic<br />
online/<strong>of</strong>fline function have been included in the project.<br />
5.2.1.3 Online statistics<br />
In the window ”online statistics”, the calculation process can also be followed numerically. For instance,<br />
the estimated and actually used time, the pyramid level at which the calculation is going on, various information<br />
about the calculated grid point and the internal accuracy <strong>of</strong> the point are shown. In addition, the<br />
numerical information is stored in the file ’match_t.log’. This file is changed after each calculation, It is<br />
possible that a closer analysis <strong>of</strong> the information in the match_log file may lead to a greater insight into<br />
the quality <strong>of</strong> the calculations, and thus to the exclusion <strong>of</strong> doubtful calculations. Such an analysis, however,<br />
has not been done in this project.<br />
5.2.2 The post-processing<br />
In [Inpho GmbH,1994] it is stated that it is necessary to do a post-processing in problematic areas like<br />
woods, densely built-up areas, in areas where low texture is found in the digital images and in areas in<br />
the images with shadows from clouds.<br />
The post-processing can be divided into:<br />
62<br />
� DEM editing<br />
� DEM analysis<br />
� DEM output<br />
5.2.2.1 DEM editing<br />
The DEM editing can be done in three ways, and as a combination <strong>of</strong> these:<br />
1) Inclusion <strong>of</strong> external measuring to support the editing<br />
2) Editing <strong>of</strong> problematic areas<br />
3) Manipulation <strong>of</strong> the automatically generated <strong>elevation</strong> <strong>data</strong> without inclusion <strong>of</strong> external <strong>data</strong><br />
In this project, problematic areas will not be edited out. In this project, an examination will be carried out<br />
into how a post-processing can be done with the highest degree <strong>of</strong> accuracy and with a minimum <strong>of</strong> editing.<br />
If the automatic <strong>generation</strong> is done <strong>over</strong> a few models, a subsequent editing will be within clear<br />
bounds, but when the automatic <strong>generation</strong> is done <strong>over</strong> a large block <strong>of</strong> many km 2 , where several thousand<br />
models are included, the post-processing MUST be minimised. External <strong>data</strong> will not be included.<br />
This is due to the fact that users have found errors in the model and to avoid the phenomenon <strong>of</strong> ”garbage<br />
in, garbage out”, the existing <strong>elevation</strong> <strong>data</strong> is excluded. An editing <strong>of</strong> problematic areas will not be<br />
done, the results are viewed for whole models.<br />
5.2.2.2 DEM analysis<br />
Match-T will do an internal quality check <strong>of</strong> the automatically generated grids. This is done by choosing a<br />
threshold value for the whole DEM, and relate this value to the corresponding statistical values from the<br />
DEM calculation. This internal quality check can be done for seven different criteria individually or in random<br />
combination.
5 Preparation for the grid <strong>generation</strong><br />
The result <strong>of</strong> a DEM analysis can be ”superimposed” on a digital image. If more differentiated ”view” is<br />
wanted, the limit <strong>of</strong> the classification factor can be subdivided into four classes which can be defined as<br />
wanted and then shown in different colours.<br />
A test <strong>of</strong> this analysis option is desired to see whether it can be used quickly and without too much expenditure<br />
<strong>of</strong> time to point out problematic areas.<br />
5.2.2.3 DEM output<br />
The DEM output files exist as binary files. There are three possibilities for converting the grid file to ascii<br />
form: with codes, without codes and coded as mass points.<br />
Furthermore, it is possible to exclude points which Match-T estimates as being interpolated without the<br />
stereo area etc. In this project all the generated points will be looked at and, therefore, no points have<br />
been excluded beforehand. Also, a grid point coded as a mass point has no interest in this project. The<br />
generated files will therefore only be converted with or without codes. These codes make it possible to<br />
see which grid points Match-T considers to be influenced by error.<br />
5.2.3 Choice <strong>of</strong> methods for a pre-analysis <strong>of</strong> <strong>data</strong><br />
Options<br />
In this project the visualisation tool and graphic online/<strong>of</strong>fline will be looked at during the calculation itself.<br />
This is done to examine whether this method may give a superior first hand impression <strong>of</strong> problems with<br />
the calculation and the subsequent accuracy <strong>of</strong> the grid.<br />
Also, the ascii file will be examined closer to see whether the codes can be used for a pre-analysis <strong>of</strong> the<br />
individual automatically generated grids. It will be investigated where Match-T finds errors, as opposed to<br />
where errors are actually found, when the automatically generated grids are related to the frame <strong>of</strong> reference.<br />
Non-options<br />
Even if many relevant external <strong>elevation</strong> <strong>data</strong> exist in Denmark, it has been decided not to include these<br />
in the project. In the same way, a closer investigation <strong>of</strong> the analysis functions might possibly lead to a<br />
location <strong>of</strong> problematic areas but, to delimit the scope <strong>of</strong> the project, a closer discussion and possible improvement<br />
or optimisation <strong>of</strong> the post-processing has been set apart for a possible subsequent project.<br />
As a post-processing method, Match-T’s graphic DEM analysis after calculation has been excluded for<br />
several reasons. This analysis was tested to see whether it could be used quickly and without too much<br />
expenditure <strong>of</strong> time to point to problematic areas. It turned out quickly, though, that this analysis function<br />
could not be used without a closer and more detailed insight into the programme module which is not immediately<br />
accessible. Furthermore, an evaluation <strong>of</strong> the automatically generated grids down to individual<br />
grid points was required, which is not immediately possible as the result is shown graphically. Therefore,<br />
this method has been excluded.<br />
The DEM output given in codes will be looked at more closely, as this method renders it possible to<br />
evaluate the individual grid points.<br />
Also, the choice has been to maintain focus on the influence <strong>of</strong> the final result on the parameters chosen<br />
in Chapter 3 (scale, resolution, mesh size and <strong>landscape</strong> type). The influence <strong>of</strong> the parameters is investigated<br />
down to the individual grid point.<br />
63
6 Pre-analysis <strong>of</strong> the generated <strong>data</strong><br />
6 Pre-analysis <strong>of</strong> the generated <strong>data</strong><br />
In preparation for a thorough analysis <strong>of</strong> the automatically generated grids, the condition <strong>of</strong> the grids are<br />
examined. First a description <strong>of</strong> which calculations have been possible to carry out, then a description <strong>of</strong><br />
one <strong>of</strong> Match-T’s dynamic online visualisation functions, and finally, an evaluation <strong>of</strong> the ability <strong>of</strong> Match-<br />
T’s post-processing application to localise gross errors.<br />
To begin with, the course <strong>of</strong> the calculations is briefly described. After the <strong>generation</strong> is finished, a quantity<br />
<strong>of</strong> <strong>elevation</strong> <strong>data</strong> is available. This <strong>data</strong> quantity is expected to include gross errors. These gross errors<br />
must be eliminated, before the analysis <strong>of</strong> the chosen parameters (scale, resolution, mesh size and<br />
<strong>landscape</strong> type) can be done. In Match-T, there are various visualisation tools and post-processing tools.<br />
In this chapter, only the visualisation tool ”Graphic online/<strong>of</strong>fline” and DEM output with codes will be examined.<br />
Can this tool and the output with codes be used to indicate problems with individual grid points?<br />
The optimal would be that Match-T was able to point out possible errors on its own. Finally, the iteration<br />
process concerning the elimination <strong>of</strong> gross errors will be discussed.<br />
6.1 The uniformity <strong>of</strong> the generated grids<br />
The first to be noted is that it has not been possible to generate all the required grids in Match-T. Table<br />
6.1 shows an <strong>over</strong>view <strong>of</strong> the calculations.<br />
Resolu-<br />
1 : 5,000 1 : 15,000 1 : 25,000<br />
tion 5 x 5 m 12.5 x 25 x 25 m 5 x 5 m 12.5 x 25 x 25 m 5 x 5 m 12.5 x 25 x 25 m<br />
12.5 m<br />
12.5 m<br />
12.5 m<br />
15 μm X X X X X X X X X<br />
30 μm X X X X X X / X X<br />
60 μm X X X / X X / X X<br />
Table 6.1: Accomplished calculations shown in green (X) and yellow (X), not accomplished calculations in red ( / ).<br />
In table 6.1 the accomplished calculations are shown in green (X), calculations which are accomplished,<br />
but where the calculation proceeded very slowly is shown in yellow (x), while red ( / ) indicates that this<br />
calculation cannot be carried out. The explanation why some <strong>of</strong> the calculations cannot be done or have<br />
proceeded very slowly is given in Chapter 7.4.<br />
6.1.1 The visualisation tool ”graphic online/<strong>of</strong>fline”<br />
By means <strong>of</strong> Match-T’s online visualisation option, the calculation can be followed. The visualisation and<br />
possible storing <strong>of</strong> the result must be done for each individual model. As many <strong>of</strong> the calculations, especially<br />
the time-consuming ones, are done at night, not all the examples from this online visualisation function<br />
have been stored. Two examples, figure 6.1 and figure 6.2 are included in this chapter, 11 others are<br />
found in Appendix F.<br />
Figure 6.1 (reproduction <strong>of</strong> figure 2.10) is an image <strong>of</strong> the dynamic online visualisation function which can<br />
be chosen for each calculation. The green dots reproduce correlated interest points, the red dots show<br />
the grid points.<br />
A look at figure 6.1 sharpens the attention. Can Match-T deliver a uniform grid? For example, the result<br />
shown in figure 6.1 indicates that the grid does not have a uniform mesh size, but is a grid with holes.<br />
This phenomenon is not singular. In Appendix G it can be seen that there are many peculiarities which<br />
may lead to worries about the ability <strong>of</strong> Match-T to deliver a uniform grid.<br />
65
<strong>Automatic</strong> <strong>generation</strong> <strong>of</strong> <strong>elevation</strong> <strong>data</strong><br />
Figure 6.1: The point cloud indicated with green dots is interest points, the red points are the generated grid<br />
points. Six interesting areas (a-f) have been extracted for a closer analysis.<br />
In figure 6.1 six interesting areas (a-f) are extracted. These areas will be discussed with a view to a closer<br />
investigation <strong>of</strong> the number <strong>of</strong> interest points versus generated grid points.<br />
The (a) area: This area shows that Match-T is able to generate grid points, even if the number <strong>of</strong> interest<br />
points is low.<br />
The (b) area: This area shows that within a small area, can be found, both the required number <strong>of</strong> grid<br />
points, and half the number required, and only every fourth grid point.<br />
The (c) and (d) areas: These areas show that the gap between areas with the required number <strong>of</strong> grid<br />
points and areas with few grid points appear in straight lines, both vertically and horizontally. In case the<br />
lack <strong>of</strong> points is due to a random error, it is not very probable that they would appear in such regular patterns.<br />
Again, it is seen that the lack <strong>of</strong> grid points does not necessarily have any connection with the lack<br />
<strong>of</strong> interest points.<br />
The (e) area: This area is an example <strong>of</strong> an area where there are many interest points, but where only<br />
half the number <strong>of</strong> grid points are being generated. This contradicts the claim that the lack <strong>of</strong> grid points is<br />
due to the lack <strong>of</strong> points o interest.<br />
The (f) area: In this area one might be tempted to draw the conclusion that Match-T is unable to generate<br />
grid points in areas where there are few interest points. Purely intuitively, one would also expect that<br />
there would be a lack <strong>of</strong> grid points in areas where the number <strong>of</strong> interest points are low.<br />
These six examples show that there is not a systematic connection between the number <strong>of</strong> grid points<br />
and the number <strong>of</strong> interest points. It can be seen that there are both areas where the <strong>generation</strong> is done,<br />
66<br />
(a)<br />
(e)<br />
(b)<br />
(d)<br />
(f)<br />
(c)
6 Pre-analysis <strong>of</strong> the generated <strong>data</strong><br />
even with a small number <strong>of</strong> interest points (a), and areas where the <strong>generation</strong> is not done, in spite <strong>of</strong><br />
the existence <strong>of</strong> a sufficient number <strong>of</strong> interest points, for instance area (d), and in particular area (e).<br />
Other results from graphic online functions indicate that some <strong>of</strong> the calculations are perhaps not finished,<br />
but have stopped midway, cf. figure 6.2. It must be emphasised here that figure 6.2 is not a screen dump<br />
in the middle <strong>of</strong> the calculation, but the last image!<br />
Figure 6.2: The result <strong>of</strong> the online function for the model 161162 with the resolution 30 μm<br />
and mesh size 12.5 x 12.5 m.<br />
These examples create the suspicion that the generated grids are not always uniform, or that the calculation<br />
has stopped in mid-course. If the examples shown are representative <strong>of</strong> the quality and uniformity <strong>of</strong><br />
the grids generated automatically by Match-T, there is cause for deep concern.<br />
This leads to an investigation into the uniformity and completeness <strong>of</strong> the grid files. The files must have<br />
the same size, when the same scale and mesh size are used. For example, the files with scale 1:25,000,<br />
resolution 15 μm and mesh size 25 x 25m must have the same size as the files with scale 1:25,000, resolution<br />
30 μm and 60 μm and mesh size 25 x 25 m, as they include the same number <strong>of</strong> grid points. By<br />
comparing the size <strong>of</strong> the files, it is disc<strong>over</strong>ed that those files which were expected to be <strong>of</strong> equal size,<br />
are not necessarily so. Table 6.2 shows the file sizes for scale 1:25,000.<br />
67
<strong>Automatic</strong> <strong>generation</strong> <strong>of</strong> <strong>elevation</strong> <strong>data</strong><br />
68<br />
Model and resolution<br />
5 x 5 m<br />
File size by mesh size<br />
12.5 x 12.5 m 25 x 25 m<br />
160161_15 μm 2302 Kb 582 Kb<br />
160161_30 μm 2984 Kb 686 Kb<br />
160161_60 μm Cannot be calculated<br />
2983 Kb 686 Kb<br />
161162_15 μm 3257 Kb 821 Kb<br />
161162_30 μm 3929 Kb 848 Kb<br />
161162_60 μm<br />
3929 Kb 848 Kb<br />
Table 6.2: File sizes for models in scale 1:25,000.<br />
It will be seen, from table 6.2, that the files which are expected to have the same size do not. For model<br />
160161, the file sizes with equal mesh size should be the same, regardless <strong>of</strong> the resolution, and it appears<br />
from the table that this is not the case. Likewise, it will be seen that the file sizes for model 161162<br />
are not the same, regardless <strong>of</strong> the resolution.<br />
Appendix G includes a table where all the file sizes are indicated, and it is seen here that files expected to<br />
have the same size, regardless <strong>of</strong> scale and resolution, do not fulfil expectations. The different file sizes<br />
may have several causes, for instance that the calculation has stopped before it is finished, unequal<br />
mesh sizes, or that the <strong>generation</strong> is done <strong>over</strong> unequal area sizes.<br />
6.1.2 Control <strong>of</strong> the file sizes<br />
GeoCAD has been chosen as the visualisation tool for the investigation <strong>of</strong> whether the individual files are<br />
fully calculated and have acquired the wished-for mesh size. (GeoCAD is a <strong>Danish</strong> developed CAD programme<br />
for geometric <strong>data</strong>). This has entailed that not all results can be shown, as GeoCAD cannot handle<br />
very large <strong>data</strong> quantities. Therefore, there are only 16 plots in Appendix H, as three calculations<br />
could not be done, and eight could not be visualised.<br />
It will be seen from the file plots that all calculations are finished, and that the grids have the required<br />
mesh sizes, just as they are, apparently, calculated <strong>over</strong> the required area. As it can thus be demonstrated<br />
that the calculations have the expected quality, the conclusion must be that Match-T’s visualisation<br />
tool is not a reliable representation <strong>of</strong> the grid calculation, and that it cannot be used other than as a<br />
consultative visual indication <strong>of</strong> how far the calculation has run. This function will therefore not be discussed<br />
further in the project.<br />
6.2 Analysis <strong>of</strong> the coding <strong>of</strong> the grid points<br />
Can the codes indicate defective grid points?<br />
A grid point is assigned a binary code with up to 8 different combination possibilities, for instance, a point<br />
may well be assigned the code 1 (the point is OK), and at the same time the code 6 (the point is located<br />
in an area which is supposed by Match-T to have a low texture). A closer description <strong>of</strong> what the individual<br />
codes indicate is found in Chapter 2, section 2.4.4. In the investigation <strong>of</strong> the usability <strong>of</strong> the codes to<br />
point out gross errors, it was chosen to divide the grid points into three groups:<br />
� Grid points with only code 1 = OK<br />
� Grid points with code 1 and an arbitrarily chosen other code = double code<br />
� Grid points without a code = defective<br />
The result <strong>of</strong> this analysis is found in Appendix H.<br />
In figure 6.3 the result <strong>of</strong> the calculation for scale 1:25,000, resolution 15 μm and mesh size 12.5 x 12.5m<br />
with codes is shown. The generated grid points with code 1 = OK have been assigned a light grey colour,<br />
grid points with double code are shown in medium grey. The grid points which are estimated as defective,<br />
and therefore have no code, have been assigned the colour dark grey.
Model 161162<br />
6 Pre-analysis <strong>of</strong> the generated <strong>data</strong><br />
Model 160161<br />
Figure 6.3 shows that there are different forms <strong>of</strong> coding. If figure 6.3 is subjected to a visual <strong>over</strong>view,<br />
four characteristics are demonstrated:<br />
1) Boundaries are found along the model limits and along the northern edge.<br />
2) The boundaries between points which are estimated as being defective (dark grey) appear in<br />
squares with varying interval points, and the boundaries are linear.<br />
3) Grid points with a double code (medium grey) appear in a random pattern.<br />
4) Areas with grid points estimated as OK are uniformly light grey.<br />
Boundaries<br />
Figure 6.3: The result for 1:25,000, 15 μm and 12.5 x 12.5 m. Grid points are indicated by codes, light grey = the grid<br />
point is OK, medium grey = grid point with double code, dark grey = the grid point is estimated as defective. Six types<br />
are emphasised, boundaries and the areas (a) – (e).<br />
Re 1):<br />
On the background <strong>of</strong> a visual description, marked elements appear in the form <strong>of</strong> borders. A closer investigation<br />
<strong>of</strong> the borders between the models and along the northern edge has shown that <strong>elevation</strong><br />
<strong>data</strong> in these borders has been assigned the code 3 (outside the area). A further examination showed<br />
that the keyed-in LL and UR delimitations have not been observed. This means that the assigned code is<br />
correct! But why Match-T has included the points, when these lie outside the limits <strong>of</strong> the desired area<br />
remains uncertain. This phenomenon is not a singular case, but is valid for all the 144 generated files,<br />
which are included in this project!<br />
These extra points have also led to an <strong>over</strong>lap between the models which was not wanted. Therefore, it<br />
has been necessary to develop a small programme which cuts out this extra <strong>elevation</strong> <strong>data</strong> from the areas<br />
again, see Appendix D. After the cut-out <strong>of</strong> extra points, the file sizes were reduced and rendered uniform.<br />
(a)<br />
(b)<br />
(c)<br />
(d)<br />
(e)<br />
69
<strong>Automatic</strong> <strong>generation</strong> <strong>of</strong> <strong>elevation</strong> <strong>data</strong><br />
Re 2):<br />
Grid points which are estimated as being defective (dark grey) appear in squares with varying intervals.<br />
Examples <strong>of</strong> this are shown for the areas (b) and (c). As regards area (b), every second point is estimated<br />
as being OK, for area (c), every fourth point is estimated as being OK. The possibility that errors in the<br />
<strong>data</strong>, caused by, for instance, a correlation error due to objects in the terrain, should appear in fixed<br />
squares is estimated as improbable. Objects in Denmark do not appear in fixed squares. Furthermore,<br />
there are grid points between the points which are defective, likewise in a fixed pattern which does not<br />
appear probable either.<br />
In addition, there are areas where every other or every fourth point in a dark area has been assigned a<br />
double code. An example <strong>of</strong> this is seen in (a). Here, it is the code for the boundaries which ”shines”<br />
through.<br />
Re 3):<br />
Grid points which have been assigned a double code (medium grey) appear in a random pattern. An example<br />
<strong>of</strong> this phenomenon is shown in (d). That grid points with a double code should appear in a random<br />
pattern seems probable, as this could, for instance, be a reproduction <strong>of</strong> objects in the terrain such as<br />
hedges, ditches etc.<br />
Re 4):<br />
In area (e), all the points have been estimated as being OK. These areas are as required.<br />
The five different areas (a)-(e) are summed up in table 6.3.<br />
Area Description Comments<br />
(a) Area where both every second and every fourth point have<br />
either the code = OK or a double code.<br />
Improbable<br />
(b) Square where every second grid point has the code = defective<br />
and every second point the code = OK.<br />
Improbable<br />
(c) Square where every fourth grid point has the code = OK,<br />
the rest the code = defective.<br />
Improbable<br />
(d) Area where grid points with a double code appears in a<br />
random pattern.<br />
Probable<br />
(e) Areas where all the points have the code = OK. Probable<br />
70<br />
Table 6.3: Comments on the chosen areas.<br />
6.2.1 Summation<br />
In the chosen grid in scale 1:25,000, resolution 15 μm and mesh size 12.5, there are many and large areas<br />
where the coding is improbable (a) – (c). If these codes indicate that there are errors in the grid<br />
points, it is grounds for great concern as regards the use <strong>of</strong> automatic <strong>generation</strong> <strong>of</strong> <strong>elevation</strong> <strong>data</strong>. Only<br />
the areas (d) and (e) show results which are probable, and are wanted by the user.<br />
A look at all the results from Appendix H shows that the number <strong>of</strong> dark grey squares is diminished, when<br />
the mesh size is increased. As regards a few results with mesh size 25 x 25 m, there are no dark grey<br />
squares, while with mesh size 12.5 x 12.5 m, there are large areas with dark grey. This indicates that the<br />
determination <strong>of</strong> a grid point is best when a large mesh size is chosen, as there are several interest points<br />
to determine the individual grid point, which corresponds with the theory, cf. Chapter 2, section 2.4.3.2.<br />
The next step in the preliminary investigation is to find out whether the assigned codes are actually able<br />
to indicate gross errors in the <strong>data</strong> material. Before this can be done, possible gross errors must be identified<br />
and located. For this investigation, the frame <strong>of</strong> reference and the PIL programme are used. The PIL<br />
programme is self-developed specifically for this purpose, a detailed description <strong>of</strong> the PIL programme is<br />
found in Appendix C. By means <strong>of</strong> the frame <strong>of</strong> reference, possible gross errors can be identified and located,<br />
and thereby isolated.
6 Pre-analysis <strong>of</strong> the generated <strong>data</strong><br />
6.3 Elimination <strong>of</strong> gross correlation errors<br />
Gross errors in a generated grid can arise for two reasons, because <strong>of</strong> correlation errors or caused by objects<br />
on the ground. In this investigation, there will be no differentiation between the two types <strong>of</strong> error.<br />
The focus in the project is on creating a terrain model, which means that it is regarded as irrelevant<br />
whether the question is about a correlation error or a correct correlation which falls, for instance, on a<br />
ro<strong>of</strong>. Both situations will be regarded as gross errors in this project.<br />
Apart from the case that the grids may include gross errors, there will probably also be an <strong>of</strong>fset, as the<br />
<strong>elevation</strong>s are generated <strong>over</strong> the terrain. As an example, diagram 6.1. shows the distribution <strong>of</strong> the deviations<br />
between the grid and the frame <strong>of</strong> reference, calculated on the basis <strong>of</strong> the images in scale<br />
1:25,000 with resolution 15 μm and mesh size 25 x 25m.<br />
700<br />
600<br />
500<br />
400<br />
300<br />
200<br />
100<br />
0<br />
The distribution <strong>of</strong> deviations for 1:25.000, 15 μm, 25 m<br />
Deviations Normal distribution<br />
-7.2 -5.4 -3.6 -1.8 0 1.8 3.6 5.4 7.2 9 10.8 12.6 14.4 16.2 18<br />
Diagram 6.1: The distribution <strong>of</strong> the deviations between the frame <strong>of</strong> reference and the generated grid for images<br />
in scale 1:25,000, resolution 15 μm and mesh size 25m with an approximated normal distribution.<br />
As seen from diagram 6.1, the distribution <strong>of</strong> the deviations has an <strong>of</strong>fset, as the distribution is not placed<br />
around zero. It can also be seen that the distribution has ”long tails” which means that there are gross errors.<br />
The deviations are distributed between – 7.2m and 17.8m.<br />
The localisation <strong>of</strong> gross errors is based on the statistic assumption about normal distribution. If the observations<br />
are normally distributed, the following is valid: 68.3% <strong>of</strong> the points will be located within the 1 x<br />
accuracy (1 x Root Mean Square Error or RMSE), 95.4% <strong>of</strong> the points will be located within the 2 x<br />
RMSE, and 99.7% <strong>of</strong> the points will be located within the 3 x RMSE. If a calculation is normally distributed,<br />
a maximum <strong>of</strong> 0.3% <strong>of</strong> the good results will be located outside the 3 x RMSE.<br />
The elimination <strong>of</strong> gross errors is done on the assumption that, if a result is normally distributed, all acceptable<br />
results will be located within the 3 x accuracy, and only 0.3% <strong>of</strong> the good results will be without<br />
this limit. This knowledge is used as an argument for the elimination <strong>of</strong> all deviations which are located<br />
outwith the 3 x RMSE. This is done by determining a threshold value, and then eliminating all deviations<br />
<strong>over</strong> the threshold value (numerically).<br />
The elimination runs as an iterative process. At the first calculation, an accuracy is determined <strong>over</strong> all the<br />
deviations, called RMSE(1). At the second run, the threshold value is set at 3 x RMSE(1). At first all the<br />
deviations are moved, so that the error distribution is placed around 0. All deviations larger than 3 x<br />
RMSE(1) numerically are eliminated. A new accuracy, RMSE(2) is calculated on the basis <strong>of</strong> the remaining<br />
deviations. By the third calculation, the movement is repeated for a possible <strong>of</strong>fset, 3 x RMSE(2) is<br />
used as threshold value, and a new accuracy is determined, RMSE(3). This RMSE(3) is used as thresh-<br />
71
<strong>Automatic</strong> <strong>generation</strong> <strong>of</strong> <strong>elevation</strong> <strong>data</strong><br />
old value at the fourth calculation etc. until the whole process is stabilised, and no better accuracy can be<br />
achieved.<br />
The idea was to use the PIL programme to investigate whether the result is normally distributed, and<br />
whether there are gross errors. The PIL programme is constructed so that reference points with a greater<br />
deviation than 3 x RMSE (level 3) are eliminated (see Appendix C). The chosen threshold value is therefore<br />
put in as level 3. By the first calculation in the iterative process, level 3 is chosen so high that all reference<br />
points will be included in the calculation. This is done by setting the threshold value (level 3) at<br />
600m. The accuracy achieved from the first calculation is then used in the next calculation etc. etc.<br />
It turned out to be very time-consuming to use the PIL programme for each individual intermediate calculation,<br />
so a macro was made in Excel, where the iteration process was run through, until the process was<br />
stabilised. The finally achieved 3 x RMSE has then been used as a threshold value in the PIL programme,<br />
whereby all the necessary output files are generated for a later analysis.<br />
This process is run through for all the desired combinations as regards scale, resolution and mesh size.<br />
As an example <strong>of</strong> the course <strong>of</strong> the process, the calculation <strong>of</strong> images in scale 1:25,000 with the resolution<br />
15 μm and the mesh size 25 x 25m will be gone through in this chapter.<br />
The remainder <strong>of</strong> the results are found in Appendix I.<br />
6.3.1 The iteration process<br />
It can be seen from diagram 6.1 that the distribution <strong>of</strong> the deviations is not normal. There is an <strong>of</strong>fset,<br />
and the distribution has ”long tails”. It appears from a cut from the analysis file, generated by the PIL programme<br />
(see table 6.4) that the <strong>of</strong>fset is 1.78m (mean), and the accuracy (RMSE) <strong>over</strong> all points is<br />
2.68m. This accuracy includes gross errors. It appears from table 6.4 that 8956 points are included in the<br />
analysis. The remaining information is found in Appendix I.<br />
72<br />
1:25,000_15μm_25 m Result from the first iteration done with all points<br />
Mean (m) 1.78 m<br />
RMSE (m) 2.68 m<br />
Number <strong>of</strong> reference points 8956<br />
Table 6.4: Values from the analysis file for deviations between the frame <strong>of</strong> reference and the generated grid for<br />
images in scale 1:25,000, resolution 15 μm and mesh size 25 x 25m.<br />
For each calculation in the iterative process (except the first), the values are shifted so that the error distribution<br />
is placed around 0.<br />
The values used as threshold value for gross errors are found by taking the numerical value <strong>of</strong> the accuracy<br />
from the previous calculation and multiplying this value by 3 etc., etc. In diagram 6.2, the iteration<br />
process is presented graphically.<br />
RMSE (m)<br />
2.5<br />
2.0<br />
1.5<br />
1.0<br />
0.5<br />
0.0<br />
3 * RMSE (m)<br />
Threshold value (m)<br />
Iteration process for 1:25.000, 15 μm, 25 m<br />
6.012<br />
600 3.443<br />
6.012 2.484<br />
3.443 2.115<br />
2.484 1.954<br />
2.115<br />
1.859<br />
1.954<br />
1.818<br />
1.859<br />
1.794<br />
1.818<br />
1.778<br />
1.794<br />
1.768<br />
1.778<br />
1.763<br />
1.768<br />
1.759<br />
1.763 1.756<br />
1.759 1.756<br />
1.756<br />
Diagram 6.2: Accuracy and threshold value for the calculations in the iteration process for images in scale 1:25,000,<br />
resolution 15 μm and mesh size 25 x 25 m.<br />
As can be seen from diagram 6.2, the accuracy has not changed between the two last calculations, the<br />
iteration has thus stabilised itself, and no more calculations are done. This means that the grid generated<br />
on the basis <strong>of</strong> images in scale 1:25,000, resolution 15 μm and mesh size 25 x 25m has shifted 1.50m<br />
and has an accuracy <strong>of</strong> 0.585m (1,756m:3), when gross errors are edited out.
6 Pre-analysis <strong>of</strong> the generated <strong>data</strong><br />
Diagram 6.3 shows the deviations without gross errors between the reference points and the grid with a<br />
normal distribution graph determined from the accuracy and the mean value.<br />
Distribution <strong>of</strong> deviations after elimination <strong>of</strong> gross errors for image 1:25,000, 15 �m, 25 x 25 m<br />
700<br />
600<br />
500<br />
400<br />
300<br />
200<br />
100<br />
0<br />
Deviation Normal distribution<br />
-1.8 -1.6 -1.4 -1.2 -1 -0.8 -0.6 -0.4 -0.2 0 0.2 0.4 0.6 0.8 1 1.2 1.4 1.6<br />
Diagram 6.3: The normal distribution graph for the deviations for images 1:25,000, resolution 15 μm and mesh size<br />
25 x 25m after elimination <strong>of</strong> gross errors.<br />
As will be seen from diagram 6.3, the result after the iteration process is, approximately, a normal distribution.<br />
In this section only one example <strong>of</strong> the iterative process has been shown. This process is repeated for all<br />
the results from the images in the three different scales, resolutions, and mesh sizes. All in all, 24 processes<br />
have been run through, as three calculations could not be accomplished.<br />
This iteration process has shown that there are gross errors. These have been identified and located<br />
through the iteration process. Subsequently, it has been investigated whether there is a connection between<br />
Match-T’s code indication and the location <strong>of</strong> the gross errors.<br />
6.4 Use <strong>of</strong> codes for identification <strong>of</strong> gross errors<br />
As described in Appendix C, the PIL programme generates different output files. Two <strong>of</strong> these output files<br />
can be compared with Match-T’s code designations for each grid point. One <strong>of</strong> these output files includes<br />
deviations between the frame <strong>of</strong> reference and the points from the generated grid which lie within the 3 x<br />
RMSE. These deviations are indicated as error arrows, where the location and size <strong>of</strong> the error arrow indicate<br />
the size and location <strong>of</strong> the deviation. In addition, an output file is generated which includes the<br />
eliminated grid points with deviations greater than the 3 x RMSE. These eliminated points are indicated<br />
as green crosses. These two files will be used in the investigation <strong>of</strong> whether the assigned codes indicate<br />
problematic grid points (gross errors).<br />
In order to investigate whether there is a connection between the assigned codes and the deviations between<br />
the frame <strong>of</strong> reference and the generated grids, the deviations are visualised <strong>over</strong> a background<br />
with code indications. The deviations within the 3 x RMSE are shown as red arrows, and the eliminated<br />
grid points with deviations greater than 3 x RMSE are shown as green crosses. In the example, the background<br />
is a reproduction <strong>of</strong> figure 6.3, the result for scale 1:25,000, resolution 15 μm and mesh size 12.5<br />
x 12.5m where the boundaries are erased.<br />
73
<strong>Automatic</strong> <strong>generation</strong> <strong>of</strong> <strong>elevation</strong> <strong>data</strong><br />
Figure 6.4: The result <strong>of</strong> the code indication for images in scale 1:25,000, resolution 15 μm and mesh size 12.5 x 12.5<br />
m, where the error arrows (red) and the eliminated points (green) have been superimposed.<br />
It is quite clear from figure 6.4 that the areas which have been indicated by Match-T as problematic (dark<br />
grey), are in fact not so. In these areas, the red error arrows, indicating the deviation, are small, and no<br />
grid points are eliminated (green crosses). On the other hand, there are large error arrows and eliminated<br />
points (crosses), particularly in three areas which Match-T indicates as being OK (light grey) or OK with<br />
code (medium grey).<br />
This investigation has not taken a closer look at the individual codes included in the medium grey colour,<br />
but determined that the point has been accepted. These grid points will therefore be treated equally with<br />
grid points with the code OK. This choice has been made to limit the investigation and thus make it more<br />
easy to assess.<br />
This investigation is done for all the automatic generated grids. The remaining results can be found in<br />
Appendix J. It is seen from figure 6.4 and the results in Appendix J that the code indications in their present<br />
form are not adequate as editing tools. A closer investigation <strong>of</strong> how these post-processing tools can<br />
be improved is estimated to be a project on its own, as the point <strong>of</strong> departure for this project is to take a<br />
closer look at the accuracy which can be achieved with Match-T.<br />
74
6 Pre-analysis <strong>of</strong> the generated <strong>data</strong><br />
6.5 Partial conclusion<br />
In this chapter a pre-analysis/control <strong>of</strong> the automatically generated <strong>elevation</strong> <strong>data</strong> has been done. The<br />
result shows that the chosen tools cannot be used as evaluation tools for the quality/accuracy <strong>of</strong> the generated<br />
grids. The visual tool ”graphic online” is not reliable, and can, therefore, only be used as a comfortable<br />
indication <strong>of</strong> how far the calculation has come. But even this must be taken with reservations, as<br />
the visual result may well show that the calculation has stopped in mid-process, which later turned out not<br />
to be the case, as all calculations, which it has been possible to carry through, have in fact, been carried<br />
all the way through. The visual tool can only be used to have ”something nice” on the screen, while the<br />
calculation runs.<br />
Investigation <strong>of</strong> the grids showed that the files are complete and have the required mesh size. An examination<br />
<strong>of</strong> the binary codes showed the codes to the grid co-ordinates to be partly useful, as these indicated<br />
that unwanted boundaries had been included around each model and these could be located and<br />
eliminated. However, the code indication showed that grid points with the code defective appear in fixed<br />
squares. This is estimated improbable.<br />
The investigation where the reference grid was included showed that there are gross errors in the generated<br />
grids. Unfortunately, the crosses showed that the gross errors are not located where Match-T has<br />
given grid points with the code defective. It must be concluded that the coding <strong>of</strong> the grid points is useful<br />
for locating boundaries but not for locating gross errors, thus improving the quality <strong>of</strong> the generated grids.<br />
In Denmark, a new digital LIDAR <strong>elevation</strong> model is in the process <strong>of</strong> being produced but, the problem<br />
with the updating <strong>of</strong> the <strong>elevation</strong>s by the method <strong>of</strong> automatic <strong>generation</strong> is still valid. The gross errors<br />
are the all-important problem. If the method <strong>of</strong> generating <strong>elevation</strong> <strong>data</strong> automatically from digital images<br />
is to be used to create <strong>elevation</strong> <strong>data</strong> for updating purposes as good, or nearly as good, as the LIDAR<br />
method, the gross errors must be located and eliminated, preferably automatically. The tools which have<br />
been examined cannot be used for this, which leaves the investigation in a type <strong>of</strong> vacuum. Consequently,<br />
the original ideas about parameters which might have an influence on the quality and accuracy<br />
will be referred to. A closer look will be done into what the influence <strong>of</strong> scale, pixel size, mesh size and<br />
<strong>landscape</strong> type might have, in order to see whether it is possible to improve the quality and the accuracy<br />
by means <strong>of</strong> these parameters.<br />
75
<strong>Automatic</strong> <strong>generation</strong> <strong>of</strong> <strong>elevation</strong> <strong>data</strong><br />
76
7 The investigation<br />
7 The investigation<br />
The purpose <strong>of</strong> this chapter is to examine whether scale, pixel and mesh size and different <strong>landscape</strong><br />
types have an influence on the accuracy <strong>of</strong> automatically generated grids.<br />
This whole investigation is concerned with the accuracy <strong>of</strong> the grid points. These grid points are determined<br />
from the interest points, cf. Chapter 2, section 2.4.3.2. The optimal would be to look directly at the<br />
<strong>elevation</strong>s <strong>of</strong> the interest points to estimate whether possible errors are due to a correlation error or an<br />
object in the terrain. However, as the interest points are not accessible, it is only the accuracy <strong>of</strong> the grid<br />
points which can be estimated.<br />
In Chapter 6 it turned out that there are gross errors in all the generated grids. Therefore, the results<br />
achieved are presented with gross errors, and then after elimination <strong>of</strong> the gross errors. Furthermore, it is<br />
briefly noted, how great a percentage <strong>of</strong> the grid points it is necessary to eliminate, before the iteration<br />
process has stabilised itself.<br />
The investigations proposed in Chapter 3 will be referred to again, to ascertain what influence, the scale,<br />
pixel and mesh size have on the final result. As all reference points are coded (cf. Appendix B, section<br />
B.1.4), it is also possible to determine which <strong>landscape</strong> types contribute the most to the gross errors, and<br />
the location <strong>of</strong> such <strong>landscape</strong> types.<br />
This will occasion altogether four investigations:<br />
� The influence <strong>of</strong> scale<br />
� The influence <strong>of</strong> pixel size<br />
� The influence <strong>of</strong> mesh size<br />
� The influence <strong>of</strong> <strong>landscape</strong> type<br />
See also figure 7.1.<br />
Accuracy before and after elimination<br />
<strong>of</strong> gross errors (7.1)<br />
Figure 7.1: Planned investigations.<br />
The influence <strong>of</strong> image<br />
scale (7.2)<br />
The influence <strong>of</strong> pixel size<br />
(7.3)<br />
The influence <strong>of</strong> the mesh<br />
size (7.4)<br />
The influence <strong>of</strong> the <strong>landscape</strong><br />
type (7.5)<br />
77
<strong>Automatic</strong> <strong>generation</strong> <strong>of</strong> <strong>elevation</strong> <strong>data</strong><br />
7.1 Accuracy before and after elimination <strong>of</strong> gross errors<br />
When the different mesh sizes for the individual calculations were chosen, it was not noted that in Match-<br />
T there is a minimum mesh size in relation to scale and resolution. Even if a desired mesh size is keyed<br />
in, this size will not be used if it is below the minimum size, and one’s attention is not drawn to this fact.<br />
Three <strong>of</strong> the desired grids are therefore not calculated.<br />
These are:<br />
78<br />
� Scale 1:15,000, resolution 60 μm, mesh size 5 x 5 m<br />
� Scale 1:25,000, resolution 30μm, mesh size 5 x 5 m<br />
� Scale 1:25,000, resolution 60μm, mesh size 5 x 5 m<br />
In addition, out <strong>of</strong> the remaining 24 calculations, 2 were unusually slow, these are:<br />
� Scale 1:15,000, resolution 30μm, mesh size 5 x 5 m<br />
� Scale 1:25,000, resolution 60μm, mesh size 12.5 x 12.5 m<br />
As several different parameters are included in this investigation, one must take note that only results with<br />
the same parameter set-up can be compared. If, for instance, conclusions are to be drawn on the basis <strong>of</strong><br />
the scale alone, only those images which have the same resolution and mesh size can be compared.<br />
Likewise, if conclusions are to be drawn on the basis <strong>of</strong> the resolution, only those images which have the<br />
same scale and mesh size can be compared.<br />
7.1.1 Accuracy before elimination <strong>of</strong> gross errors<br />
In the tables 7.1 – 7.3 the accuracy and percentage <strong>of</strong> the flight altitude for the ”raw” calculations <strong>of</strong> the<br />
24 grids are shown. In the ”raw” calculation the <strong>generation</strong> is done <strong>over</strong> all the image without regard to<br />
<strong>landscape</strong> type or possible lack <strong>of</strong> texture in the images.<br />
Images scale 1:5,000<br />
Resolution (μm) Mesh size (m) Accuracy (m) ‰ <strong>of</strong> flight altitude<br />
5 x 5 m 2.90 m 3.87‰<br />
15μm<br />
12.5 x 12.5 m 3.23 m 4.30‰<br />
25 x 25 m 3.29 m 4.39‰<br />
5 x 5 m 2.19 m 2.92‰<br />
30μm<br />
12.5 x 12.5 m 2.43 m 3.24‰<br />
25 x 25 m 2.87 m 3.83‰<br />
5 x 5 m 1.65 m 2.20‰<br />
60μm<br />
12.5 x 12.5 m 1.95 m 2.60‰<br />
25 x 25 m 2.55 m 3.40‰<br />
Table 7.1: The results, included gross errors for images in scale 1:5,000 at the three resolutions and mesh sizes.<br />
Images scale 1:15,000<br />
Resolution (μm) Mesh size (m) Accuracy (m) ‰ <strong>of</strong> flight altitude<br />
5 x 5 m 1.93 m 0.86‰<br />
15μm<br />
12.5 x 12.5 m 1.93 m 0.86‰<br />
25 x 25 m 2.07 m 0.92‰<br />
5 x 5 m 2.17 m 0.97‰<br />
30μm<br />
12.5 x 12.5 m 1.90 m 0.84‰<br />
25 x 25 m 2.15 m 0.96‰<br />
5 x 5 m Cannot be calculated!<br />
60μm<br />
12.5 x 12.5 m 1.93 m 0.87‰<br />
25 x 25 m 1.96 m 0.87‰<br />
Table 7.2: The results, included gross errors for images in scale 1:15,000 at the three resolutions and mesh sizes.
7 The investigation<br />
Images scale 1:25,000<br />
Resolution (μm) Mesh size (m) Accuracy (m) ‰ <strong>of</strong> flight altitude<br />
5 x 5 m 1.27 m 0.34‰<br />
15μm<br />
12.5 x 12.5 m 1.86 m 0.50‰<br />
25 x 25 m 2.00 m 0.53‰<br />
5 x 5 m Cannot be calculated!<br />
30μm<br />
12.5 x 12.5 m 1.46 m 0.39‰<br />
25 x 25 m 2.37 m 0.63‰<br />
5 x 5 m Cannot be calculated!<br />
60μm<br />
12.5 x 12.5 m 1.56 m 0.42‰<br />
25 x 25 m 1.98 m 0.53‰<br />
Table 7.3: The results, included gross errors for images in scale 1:25,000 at the three resolutions and mesh sizes.<br />
As seen from tables 7.1 – 7.3, the results are not very good, when a ”raw” <strong>generation</strong> <strong>of</strong> the <strong>elevation</strong><br />
<strong>data</strong> from digital images is done. Regardless <strong>of</strong> scale, pixel size or mesh size, the accuracy lies between<br />
approx. 1.3m to approx. 3.5m.<br />
7.1.2 Accuracy after elimination <strong>of</strong> gross errors<br />
For each calculation in the iterative process, more and more points are eliminated. It is therefore, interesting<br />
to see how many points it has been necessary to eliminate, before the iteration has stabilised itself.<br />
The gross errors are eliminated according to the principles described in Chapter 6, section 3. In the tables<br />
7.4 – 7.6, the accuracy and the percentage <strong>of</strong> the flight altitude after elimination is shown, and the numbers<br />
<strong>of</strong> eliminated points are given as percentages.<br />
Images scale 1 : 5,000<br />
Resolution (μm) Mesh size (m) Accuracy (m) ‰ <strong>of</strong> flight altitude Eliminated points (%)<br />
5 x 5 m 0.11 m 0.14‰ 18.7 %<br />
15μm 12.5 x 12.5 m 0.12 m 0.17‰ 21.0 %<br />
25 x 25 m 0.18 m 0.25‰ 24.3 %<br />
5 x 5 m 0.13 m 0.18‰ 18.7 %<br />
30μm 12.5 x 12.5m 0.17 m 0.22‰ 21.8 %<br />
25 x 25 m 0.22 m 0.30‰ 22.9 %<br />
5 x 5 m 0.24 m 0.32‰ 14.3 %<br />
60μm 12.5 x 12.5 m 0.24 m 0.33‰ 16.3 %<br />
25 x 25m 0.31 m 0.41‰ 19.8 %<br />
Table 7.4: The results without gross errors for scale 1:5,000 at the three resolutions and mesh sizes. The number <strong>of</strong><br />
eliminated points is given as a percentage.<br />
Images scale 1 : 15,000<br />
Resolution (μm) Mesh size (m) Accuracy ‰ <strong>of</strong> flight altitude Eliminated points (%)<br />
5 x 5 m 0.32 m 0.14‰ 17.6 %<br />
15μm 12.5 x 12.5 m 0.33 m 0.15‰ 18.7 %<br />
25 x 25 m 0.36 m 0.16‰ 19.7 %<br />
5 x 5 m 0.53 m 0.24‰ 14.0 %<br />
30μm 12.5 x 12.5 m 0.51 m 0.23‰ 12.3 %<br />
25 x 25 m 0.57 m 0.25‰ 25.3 %<br />
60μm<br />
5 x 5 m Cannot be calculated!<br />
12.5 x 12.5 m 0.71 m 0.31‰ 10.8 %<br />
25 x 25 m 0.80 m 0.35‰ 10.7 %<br />
Table 7.5: The results without gross errors for scale 1:15,000 at the three resolutions and mesh sizes. The number<br />
<strong>of</strong> eliminated points is given as a percentage.<br />
79
<strong>Automatic</strong> <strong>generation</strong> <strong>of</strong> <strong>elevation</strong> <strong>data</strong><br />
80<br />
Images scale 1 : 25,000<br />
Resolution (μm) Mesh size (m) Accuracy (m) ‰ <strong>of</strong> flight altitude Eliminated points (%)<br />
5 x 5 m 0.53 m 0.14‰ 44.1 %<br />
15μm 12.5 x 12.5 m 0.55 m 0.15‰ 44.4 %<br />
25 x 25 m 0.59 m 0.16‰ 36.1 %<br />
5 x 5 m Cannot be calculated!<br />
30μm 12.5 x 12.5 m 0.72 m 0.19‰ 21.7 %<br />
25 x 25 m 0.78 m 0.21‰ 20.6 %<br />
5 x 5 m Cannot be calculated!<br />
60μm 12.5 x 12.5 m 1.06 m 0.28‰ 11.7 %<br />
25 x 25 m 0.93 m 0.25‰ 17.9 %<br />
Table 7.6: The results without gross errors for scale 1:25,000 at the three resolutions and mesh sizes. The number<br />
<strong>of</strong> eliminated points is given as a percentage.<br />
7.1.3 Summation<br />
At the ”raw” calculation <strong>over</strong> the whole image, an accuracy is achieved from approx. 1.3m to more than 3<br />
m, regardless <strong>of</strong> scale and resolution. It must therefore be concluded that there are elements in the <strong>data</strong><br />
material which are not changed by the use <strong>of</strong> different scales or pixel sizes. These might, for instance, be<br />
objects on the terrain surface such as houses, trees etc. These objects should have been eliminated<br />
automatically by means <strong>of</strong> the principles described in Chapter 2, section 2.4.3.2. As mentioned before,<br />
this project will not differentiate between decided correlation errors or a correct correlation <strong>over</strong> an object<br />
in the terrain, such as houses, trees etc. Both kinds are regarded as gross errors. In a later investigation<br />
into <strong>landscape</strong> types, a closer discussion <strong>of</strong> the cause <strong>of</strong> the gross errors will be undertaken.<br />
If a ”raw” calculation is done without any kind <strong>of</strong> evaluation or editing in the images, the conclusion is that<br />
the flight altitude should be as high as possible, as this gives the best result.<br />
If gross errors are eliminated, it will be seen from the results in tables 7.4 – 7.6 that for images with resolution<br />
15μm, an accuracy <strong>of</strong> between 0.14‰ and 0.17‰ <strong>of</strong> the flight altitude can be achieved regardless<br />
<strong>of</strong> scale, except for one result which is up to 0.25‰ <strong>of</strong> the flight altitude. For images with resolution 30μm,<br />
the accuracy lies between 0.18‰ and 0.25‰ <strong>of</strong> the flight altitude regardless <strong>of</strong> scale. For images with<br />
resolution 60μm, the accuracy lies between 0.25‰ and 0.41‰ <strong>of</strong> the flight altitude regardless <strong>of</strong> scale.<br />
It will be seen that there is a large difference in how great a percentage it has been necessary to eliminate.<br />
For images with resolution 15μm, it has been necessary to eliminate between approx. 14% and<br />
approx. 44 %, for 30μm images approx. 20% are eliminated, whereas for images with resolution 60μm, it<br />
has only been necessary to eliminate between approx. 11% and approx. 18% <strong>of</strong> the points.<br />
The results in tables 7.4 – 7.6 are presented without any form <strong>of</strong> analysis <strong>of</strong> why the results are, as they<br />
are. It can, however, be briefly stated that the results have been considerably improved by the iterative<br />
process, and that there are quite a few gross errors in the <strong>data</strong> material. In the source material, included<br />
in the literary study <strong>of</strong> the project, there has been no indications or analyses <strong>of</strong> how many points must be<br />
regarded as gross errors, and consequently cannot be included in an analysis. How many points are in<br />
reality eliminated to achieve an accuracy <strong>of</strong> 0.1‰ <strong>of</strong> the flight altitude, as described in different sources, is<br />
therefore not known.<br />
In the following sections, the results will be discussed more closely with regard to the scale and resolution<br />
<strong>of</strong> the images. In the three calculations which could not be carried out, the chosen mesh size was 5 x 5m.<br />
A closer look at the influence <strong>of</strong> the mesh size will therefore also be undertaken. When it has been investigated<br />
which influence the primary parameters (scale, resolution and mesh size) have, a closer look is<br />
taken at the cause <strong>of</strong> the gross errors, and where they are located in relation to the <strong>landscape</strong> type.<br />
7.2 The influence <strong>of</strong> scale<br />
One <strong>of</strong> the primary parameters in the method for automatic <strong>generation</strong> <strong>of</strong> <strong>elevation</strong>s is, as mentioned before,<br />
the scale <strong>of</strong> the images. The optimal would be if the accuracy is approximately linear in relation to
7 The investigation<br />
the scale. That is, that the accuracy is improved, if images in large scale are used, and, vice versa, that<br />
the accuracy is reduced, if an image in a lesser scale is used. The result for images in scale 1:15,000<br />
should theoretically be 3 times poorer than the result for images in scale 1:5,000. The result for images in<br />
scale 1:25,000 should be reduced by a factor 5 in relation to the results in scale 1:5,000.<br />
Tables 7.4 – 7.6 show that the accuracy <strong>of</strong> images in scale 1:5,000 is improved by a factor approx. 2-3 in<br />
relation to the scale 1:15,000, whereas the accuracy for images in scale 1:5,000 is improved by a factor<br />
approx. 3-5 in relation to the result for images in scale 1:25,000.<br />
The results from tables 7.4 – 7.6 are shown in diagram form in diagram 7.1. As a standard <strong>of</strong> comparison,<br />
the expected accuracy is 0.1‰ <strong>of</strong> the flight altitude [Krzystek et al., 1992].<br />
Accuracy (m)<br />
1.2<br />
1<br />
0.8<br />
0.6<br />
0.4<br />
0.2<br />
0<br />
The influence <strong>of</strong> scale<br />
1:5,000 1:15,000<br />
Scale<br />
1:25,000<br />
Theoretical<br />
15 μm_5 m<br />
15 μm_12.5 m<br />
15 μm_25 m<br />
30 μm_5 m<br />
30 μm_12.5 m<br />
30 μm_25 m<br />
60 μm_5 m<br />
60 μm_12.5 m<br />
60 μm_25 m<br />
Diagram 7.1: The influence <strong>of</strong> scale on all calculations and the theoretically promised accuracy.<br />
None <strong>of</strong> the results come close to the expected accuracy <strong>of</strong> 0.1‰ <strong>of</strong> the flight altitude. The results group<br />
themselves according to resolution, so that the results with resolutions 15μm, 30μm and 60μm respectively<br />
are grouped together.<br />
The results from the use <strong>of</strong> the 15μm images are linear, and the result is, as expected, approx. 3 times<br />
better than the results for the images in scale 1:15,000, and 5 times better than the results from the images<br />
in scale 1:25,000. The same tendency can be recognised for images with the resolution 30μm and<br />
60μm, the results are approximately linear, though with a small deflection at scale 1:15,000.<br />
From a superior point <strong>of</strong> view, the best results are achieved by using a large scale. Likewise. it can be<br />
seen that the best results are achieved by using a small resolution, in this case 15μm, then 30μm and<br />
poorest by using 60μm, which is not surprising.<br />
7.2.1 Summation <strong>of</strong> scale<br />
This investigation shows that the scale has the expected influence. The best results are achieved by using<br />
images in a large scale, and the accuracy is linearly decreasing with a diminishing scale.<br />
7.3 The influence <strong>of</strong> pixel size<br />
In digital photogrammetry, aerial photos are scanned in different resolutions. Experience shows that the<br />
smaller the pixel size, the greater the accuracy which can be achieved. This is due, <strong>of</strong> course, to the fact<br />
that by using smaller pixel sizes, more details are included, and consequently, the accuracy <strong>of</strong> the automatically<br />
generated <strong>elevation</strong> model is better. It will be discussed here whether a better accuracy can be<br />
achieved by using a higher resolution and whether the improvement is linear.<br />
81
<strong>Automatic</strong> <strong>generation</strong> <strong>of</strong> <strong>elevation</strong> <strong>data</strong><br />
In diagram 7.2 the result can be seen for the three scales 1:5,000, 1:15,000 and 1:25,000 with the image<br />
resolutions 15μm, 30μm and 60μm, and the three mesh sizes 5 x 5 m, 12.5 x 12.5 m and 25 x 25m. The<br />
results come from tables 7.4 – 7.6.<br />
It will be seen that the results using images in scale 1:5,000 are linear. For scales 1:15,000 and 1:25,000,<br />
the same tendencies are found, where the results are approximately linear. In addition, it can be seen that<br />
the results again fall into groups <strong>of</strong> 1:5,000, 1:15,000 and 1:25,000 respectively.<br />
7.3.1 Summation <strong>of</strong> pixel size<br />
After elimination <strong>of</strong> gross errors, a twice as good accuracy is achieved by 15μm images compared to<br />
60μm images. To achieve this accuracy, however, it has been necessary to eliminate several more points<br />
in resolution 15μm than in resolution 60μm . It holds good for all three scales that significantly more points<br />
are eliminated by resolution 15μm than by resolution 60μm . This investigation must conclude that the<br />
greater the resolution and the fewer the number <strong>of</strong> points eliminated, the poorer the accuracy.<br />
7.4 The influence <strong>of</strong> mesh size<br />
The last <strong>of</strong> the primary parameters is the mesh size. The <strong>elevation</strong>s <strong>of</strong> the interest points are determined<br />
by the correlation process. From the <strong>elevation</strong>s <strong>of</strong> the interest points, the <strong>elevation</strong>s <strong>of</strong> the grid points are<br />
interpolated. The determination <strong>of</strong> the grid points is, therefore, a purely mathematical process which is<br />
done on the basis <strong>of</strong> the <strong>elevation</strong>s <strong>of</strong> the interest points and has nothing to do with the correlation process<br />
itself. The basis (the <strong>elevation</strong>s <strong>of</strong> the interest points) for the determination <strong>of</strong> the <strong>elevation</strong>s <strong>of</strong> the<br />
grid points remains unchanged for all mesh sizes.<br />
This means that there should not be any appreciable difference in accuracy, regardless <strong>of</strong> which mesh<br />
size is chosen, taking into consideration the scale and resolution <strong>of</strong> the images. A grid with mesh size 5 x<br />
5m will reproduce the terrain with more information, while a grid with mesh size 25 x 25m reproduces the<br />
terrain more s<strong>of</strong>tly. On the other hand, the individual grid points in the 25 x 25m grid are determined with<br />
a greater degree <strong>of</strong> accuracy, as more interest points will be included in the determination <strong>of</strong> these grid<br />
points than by mesh size 5 x 5m.<br />
82<br />
Accuracy (m)<br />
1.2<br />
1<br />
0.8<br />
0.6<br />
0.4<br />
0.2<br />
0<br />
The influece <strong>of</strong> resolution<br />
15 μm 30 μm<br />
Resolution<br />
60 μm<br />
Diagram 7.2: The accuracy with regard to image resolution.<br />
1:5,000_5 m<br />
1:5,000_12.5 m<br />
1:5,000_25 m<br />
1:15,000_5 m<br />
1:15,000_12.5 m<br />
1:15,000_25 m<br />
1:25,000_5 m<br />
1:25,000_12.5 m<br />
1:25,000_25 m
Accuracy (m)<br />
1.2<br />
1<br />
0.8<br />
0.6<br />
0.4<br />
0.2<br />
0<br />
Resolution<br />
Scale<br />
15 μm<br />
1:5000<br />
30 μm<br />
1:5000<br />
The influence <strong>of</strong> mesh size<br />
60 μm<br />
1:5000<br />
15 μm<br />
1:15.000<br />
30 μm<br />
1:15.000<br />
Diagram 7.3: Accuracy with regard to resolution and scale.<br />
60 μm<br />
1:15.000<br />
7 The investigation<br />
15 μm<br />
1:25.000<br />
30 μm<br />
1:25.000<br />
60 μm<br />
1:25.000<br />
5 m<br />
12.5 m<br />
25 m<br />
In diagram 7.3 the accuracy for the individual mesh sizes is shown. The missing columns in the diagram<br />
represent the three grids which could not be calculated. It can be seen that the mesh size has only a<br />
small influence, there is only a faint rise when the larger mesh size is chosen. Only two results deviate<br />
from this tendency. It is those for 1:15,000, 30μm and 5 x 5 m, and 1:25,000, 60μm and 12.5 x 12.5 m,<br />
where the results are poorer than the tendency.<br />
7.4.1 Summation <strong>of</strong> mesh size<br />
The mesh size does not have a significant influence. However, there is a small reduction in accuracy using<br />
a large mesh size. This conforms with expectations. A small mesh size reproduces the terrain with a<br />
greater degree <strong>of</strong> detail than a large mesh size. A grid with large mesh size reproduces the terrain more<br />
s<strong>of</strong>tly, while the accuracy must be expected to be a little poorer than when using a small mesh size.<br />
7.4.2 Common conclusion<br />
Looking at the results shown in diagram 7.1 and 7.2 where images with different scales and resolution are<br />
shown, it can be concluded that the best results are achieved by using a large scale and a small resolution.<br />
The results are linear as expected, and they group themselves according to resolution, see diagram<br />
7.1 or according to scale, see diagram 7.2.<br />
The calculations for 1:15,000, 30μm and 5 x 5m and those for 1:25,000, 60μm and 12.5 x 12.5m deviate<br />
from the tendency. These two results correspond to these two calculations which ran slower compared to<br />
the remaining calculations. This leads to an investigation into whether there is a limit to how few pixels on<br />
the ground may by found per mesh size for a calculation to run without hitch.<br />
It is seen again that the scale has an influence, as a better accuracy is achieved by using a small scale<br />
and a low resolution than a large scale and a low resolution.<br />
7.4.3 The pixel size on the ground<br />
Approximately the same accuracy is achieved by using a large scale and a low resolution as by using a<br />
smaller scale and a higher resolution, for example 1:15,000 and 30μm, and 1:25,000 and 15μm . This<br />
suggests that the scale <strong>of</strong> the images and their resolution should be regarded each on its own, but that<br />
the parameters are influenced by each other. This means that it is not the specific scale and resolution <strong>of</strong><br />
the individual images which are important, but how great an area the individual pixel c<strong>over</strong>s on the<br />
ground. This size, henceforth called ”pixel size on the ground” is dependent on the scale <strong>of</strong> the images<br />
combined with their resolution.<br />
83
<strong>Automatic</strong> <strong>generation</strong> <strong>of</strong> <strong>elevation</strong> <strong>data</strong><br />
In table 7.7 the results achieved in relation to the pixel size on the ground are shown.<br />
84<br />
Scale<br />
1:5,000<br />
1:15,000<br />
1:25,000<br />
Resolution<br />
Pixel size on the<br />
ground (m<br />
Accuracy by mesh size<br />
2 ) 5 x 5 m 12.5 x 12.5 m 25 x 25 m<br />
15μm 0.075 0.11 m 0.12 m 0.18 m<br />
30μm 0.15 0.13 m 0.17 m 0.22 m<br />
60μm 0.30 0.24 m 0.22 m 0.31 m<br />
15μm 0.225 0.32 m 0.33 m 0.36 m<br />
30μm 0.45 0.53 m 0.51 m 0.57 m<br />
60μm 0.90 / 0.71 m 0.80 m<br />
15μm 0.375 0.53 m 0.55 m 0.59 m<br />
30μm 0.75 / 0.72 m 0.78 m<br />
60μm 1.50 / 1.06 m 0.93 m<br />
Table 7.7: The results as a function <strong>of</strong> the pixel size on the ground and the mesh size.<br />
7.4.4 The number <strong>of</strong> pixels per mesh size<br />
When the investigations are evaluated as to scale, resolution and mesh size, it turns out that there is a<br />
connection between the three primary parameters. For instance, it makes no sense to determine an <strong>elevation</strong><br />
model with the mesh size 5 x 5 m, if a pixel size on the ground c<strong>over</strong>s, for example, 3 x 3m.<br />
The number <strong>of</strong> pixel sizes on the ground per mesh size is determined thus:<br />
g<br />
number <strong>of</strong> pixels<br />
μ * M<br />
�� � �<br />
�<br />
��<br />
� �<br />
where: number_pixels =the number <strong>of</strong> pixels on the ground per mesh<br />
g = the mesh size (grid)<br />
μ = the resolution <strong>of</strong> the images<br />
m = the scale <strong>of</strong> the images<br />
2<br />
In tables 7.8 – 7.10, the number <strong>of</strong> pixels on the ground per mesh is shown. The number is calculated for<br />
each scale. The relation is indicated with the colours green, yellow and red. In tables 7.8 – 7.10, the calculations<br />
which have gone well are marked with green. The calculations marked with yellow have been<br />
done without warning from Match-T that the results deviate from the tendency. It was marked, however,<br />
that the calculation, itself, ran slower than expected. Calculations which could not be done are marked<br />
with red.<br />
Resolution 5 x 5 m<br />
Image scale 1:5,000<br />
12.5 x 12.5 m 25 x 25 m<br />
15μm ~ 67 x 67 ~ 167 x 167 ~ 333 x 333<br />
30μm ~ 33 x 33 ~ 83 x 83 ~ 167 x 167<br />
60μm ~ 17 x 17 ~ 42 x 42 ~ 83 x 83<br />
(7.1)<br />
Table 7.8: Number <strong>of</strong> pixels per mesh by different resolutions and mesh sizes in scale 1:5,000.
7 The investigation<br />
Image scale 1:15,000<br />
Resolution 5 x 5 m 12.5 x 12.5 m 25 x 25 m<br />
15μm ~ 22 x 22 ~ 56 x 56 ~ 111 x 111<br />
30μm ~ 11 x 11 ~ 28 x 28 ~ 56 x 56<br />
60μm ~ 6 x 6 ~ 14 x 14 ~ 28 x 28<br />
Table 7.9: Number <strong>of</strong> pixels per mesh by different resolutions and mesh sizes in scale 1:15,000.<br />
Image scale 1:25,000<br />
Resolution 5 x 5 m 12.5 x 12.5 m 25 x 25 m<br />
15μm ~ 13 x 13 ~ 33 x 33 ~ 67 x 67<br />
30μm ~ 7 x 7 ~ 17 x 17 ~ 33 x 33<br />
60μm ~ 3 x 3 ~ 8 x 8 ~ 17 x 17<br />
Table 7.10: Number <strong>of</strong> pixels per mesh by different resolutions and mesh sizes in scale 1:25,000.<br />
It will be seen from tables 7.8 – 7.10 that if the number <strong>of</strong> pixels per mesh size is greater than approx. 13<br />
x 13 pixels, the calculation runs without problems. If the number <strong>of</strong> pixels per mesh size lies between<br />
approx. 8 x 8 pixels, and approx. 11 x 11 pixels, a calculation can be done, but the result deviates from<br />
the tendency. If the number <strong>of</strong> pixels is lower than approx. 8 x 8 pixels per mesh size, a calculation cannot<br />
be done. This phenomenon is also confirmed in the sources, where it is mentioned [Inpho, 1994] that<br />
a calculation can be expected to run slower if there are less than 30 x 30 pixels per mesh. It is also mentioned<br />
by [Baltsavias, 1999] that it is recommended that there are 10 x 10 to 15 x 15 pixels per mesh.<br />
This investigation shows that there should be at least 13 x 13 pixels per mesh size for a calculation to run<br />
smoothly, which falls within the recommendation from [Baltsavias, 1999] <strong>of</strong> 10 2 – 15 2 pixels. If the minimum<br />
<strong>of</strong> approx. 13 x 13 pixels per mesh size is used, a calculation will run smoothly. However, it is recommend<br />
here that 15 x 15 pixels per mesh size is chosen, so that it is certain that a calculation can be<br />
done, see table 7.11.<br />
Scale Pixel size (μm) Minimum mesh size (m)<br />
1:5,000 15 x 15μm 1.125 x 1.125<br />
1:5,000 30 x 30μm 2.25 x 2.25<br />
1:5,000 60 x 60μm 4.5 x 4.5<br />
1:15,000 15 x 15μm 3.375 x 3.375<br />
1:15,000 30 x 30μm 6.75 x 6.75<br />
1:15,000 60 x 60μm 13.5 x 13.5<br />
1:25,000 15 x 15μm 6.625 x 6.625<br />
1:25,000 30 x 30μm 11.25 x 11.25<br />
1:25,000 60 x 60μm 22.5 x 22.5<br />
Table 7.11: Minimum mesh size considering scale resolution.<br />
The presumption is that with 15 x 15 pixels, Match-T can determine enough interest points to determine<br />
the grid points. A closer investigation <strong>of</strong> this is not possible, as the information concerning the accurate<br />
location and <strong>elevation</strong> <strong>of</strong> the interest points appear as a binary file. This file has not been accessible in<br />
this project. Therefore, it has not been possible to make a closer analysis <strong>of</strong>, for instance, the lack <strong>of</strong> interest<br />
points for the determination <strong>of</strong> a small mesh size as opposed to the resolution. The investigation<br />
done in this project has shown a tendency as regards which minimum mesh size can be expected to be<br />
serviceable with a certain scale and resolution.<br />
If this knowledge is used on any given combination <strong>of</strong> scale, resolution and mesh size, it can be checked<br />
whether the calculation will run correctly, using formula 7.1. It must be noted, however, that even if the<br />
number <strong>of</strong> pixels per mesh size is <strong>over</strong> 15 x 15, this is no guarantee <strong>of</strong> a good result, but only <strong>of</strong> a smooth<br />
run <strong>of</strong> the calculation itself.<br />
In order to come closer to the problem <strong>of</strong> gross errors, the <strong>landscape</strong> type will be investigated.<br />
85
<strong>Automatic</strong> <strong>generation</strong> <strong>of</strong> <strong>elevation</strong> <strong>data</strong><br />
7.5 The influence <strong>of</strong> the <strong>landscape</strong> type<br />
In this section the cause <strong>of</strong> the gross errors will be examined. The test area has been divided into five<br />
<strong>landscape</strong> types. This <strong>of</strong>fers the possibility <strong>of</strong> investigating whether the gross errors are due to the individual<br />
<strong>landscape</strong> type <strong>over</strong> which the point is generated, or if the gross error is due to a correlation error.<br />
The number <strong>of</strong> reference points in the five <strong>landscape</strong> types are indicated here:<br />
86<br />
� Flat terrain = 2093 points<br />
� Gravel pit = 2429 points<br />
� Village = 1629 points<br />
� Hilly terrain = 2814 points<br />
� Woods = 1223 points<br />
For a further description <strong>of</strong> the <strong>data</strong> material, see Chapter 4 and Appendix B.<br />
In [Seyfert, 1995; Ackermann, 1996] it is stated that built-up and <strong>over</strong>grown areas give rise to problems.<br />
To investigate this claim, a village and a wooded area have been included. In addition, areas with low or<br />
no texture may give problems by the correlation [Krzystek, 1991]. Denmark includes large areas <strong>of</strong> fields<br />
with low texture, wherefore this problem may well arise in large parts <strong>of</strong> the country. The problem will be<br />
examined in flat and hilly terrain, as the fields will typically be found here.<br />
To begin with, it is investigated what accuracy can be achieved without any form <strong>of</strong> editing <strong>of</strong> the different<br />
<strong>landscape</strong> types. This makes it possible to see which <strong>landscape</strong> types contribute the largest number <strong>of</strong><br />
gross errors, and hence which <strong>landscape</strong> types <strong>of</strong>fer the best and poorest accuracy. Then the iteration<br />
process is done for each <strong>landscape</strong> type, and the accuracy is viewed after elimination <strong>of</strong> the gross errors.<br />
Again, it is investigated which <strong>landscape</strong> type contributes the best and poorest accuracy respectively. Finally,<br />
a closer look is taken at how great a percentage <strong>of</strong> points it has been necessary to eliminate from<br />
the individual <strong>landscape</strong> types, before the iteration process has stabilised itself.<br />
7.5.1 The accuracy for different <strong>landscape</strong> types including gross errors<br />
Tables 7.12 – 7.14 show the accuracy including gross errors for the individual <strong>landscape</strong> types using the<br />
three scales, resolutions and mesh sizes.<br />
Resolution<br />
15μm<br />
30μm<br />
60μm<br />
Mesh size<br />
Image scale 1:5,000<br />
The accuracy for <strong>landscape</strong> types before elimination <strong>of</strong> gross errors<br />
Flat terrain Gravel pit Village Hilly terrain Woods<br />
5 x 5 m 0.11 m 4.58 m 2.34 m 1.27 m 7.58 m<br />
12.5 x 12.5 m 0.12 m 5.33 m 2.85 m 1.84 m 9.03 m<br />
25 x 25 m 0.14 m 6.72 m 1.80 m 1.54 m 7.70 m<br />
5 x 5 m 0.13 m 3.50 m 1.44 m 0.80 m 5.96 m<br />
12.5 x 12.5 m 0.12 m 4.86 m 1.69 m 1.25 m 4.47 m<br />
25 x 25 m 0.14 m 5.37 m 2.03 m 1.68 m 6.82 m<br />
5 x 5 m 0.20 m 0.80 m 1.53 m 0.96 m 6.14 m<br />
12.5 x 12.5 m 0.19 m 4.46 m 0.72 m 0.61 m 4.37 m<br />
25 x 25 m 0.19 m 5.03 m 2.01 m 1.47 m 5.16 m<br />
Table 7.12: The accuracy, including gross errors, for the individual <strong>landscape</strong> types for 1:5,000.
Resolution<br />
15μm<br />
30μm<br />
60μm<br />
7 The investigation<br />
Mesh size<br />
Image scale 1:15,000<br />
The accuracy for <strong>landscape</strong> types before elimination <strong>of</strong> gross errors<br />
Flat terrain Gravel pit Village Hilly terrain Woods<br />
5 x 5 m 0.61 m 1.83 m 0.79 m 2.34 m 3.92 m<br />
12.5 x 12.5 m 0.59 m 3.05 m 0.68 m 1.02 m 4.02 m<br />
25 x 25 m 0.61 m 3.86 m 0.69 m 1.27 m 3.12 m<br />
5 x 5 m 0.60 m 3.14 m 1.08 m 1.77 m 4.48 m<br />
12.5 x 12.5m 0.56 m 2.09 m 0.90 m 1.60 m 4.29 m<br />
25 x 25 m 0.57 m 3.65 m 0.89 m 1.32 m 3.98 m<br />
5 x 5 m Cannot be calculated!<br />
12.5 x 12.5 m 0.71 m 1.71 m 1.31 m 1.97 m 4.17 m<br />
25 x 25 m 0.70 m 2.43 m 1.30 m 1.70 m 3.99 m<br />
Table 7.13: Accuracy, including gross errors, for the individual <strong>landscape</strong> types for scale 1:15,000.<br />
Resolution<br />
15μm<br />
30μm<br />
60μm<br />
Mesh size<br />
Image scale 1:25,000<br />
The accuracy for <strong>landscape</strong> types before elimination <strong>of</strong> gross errors<br />
Flat terrain Gravel pit Village Hilly terrain Woods<br />
5 x 5 m 1.61 m 1.18 m 1.79 m 1.92 m 4.02 m<br />
12.5 x 12.5 m 1.53 m 3.85 m 1.59 m 1.78 m 4.39 m<br />
25 x 25 m 1.53 m 4.21 m 1.56 m 2.01 m 3.87 m<br />
5 x 5 m Cannot be calculated!<br />
12.5 x 12.5 m 1.50 m 2.49 m 1.90 m 2.00 m 3.93 m<br />
25 x 25m 1.49 m 5.26 m 1.81 m 1.93 m 4.29 m<br />
5 x 5 m Cannot be calculated!<br />
12.5 x 12.5 m 1.79 m 2.74 m 2.20 m 2.01 m 3.95 m<br />
25 x 25 m 1.76 m 4.38 m 2.14 m 1.96 m 3.76 m<br />
Table 7.14: Accuracy, including gross errors, for the individual <strong>landscape</strong> types for scale 1:25,000.<br />
In scale 1:5,000, it is obvious that the best results are achieved <strong>over</strong> open, flat terrain. The <strong>landscape</strong><br />
types village and hilly terrain give relatively good results, while the <strong>landscape</strong> type gravel pit and woods<br />
give the poorest results.<br />
Again in scale 1:15,000, the best results are achieved for the <strong>landscape</strong> type open, flat terrain, however,<br />
almost as good results are achieved for villages and hilly terrain. Again, it is in the <strong>landscape</strong> types woods<br />
and gravel pit, that the poorest results are achieved.<br />
In scale 1:25,000, the difference in accuracy for the individual <strong>landscape</strong> types is not so marked as by<br />
scales 1:5,000 and 1:15,000. Here, the results are almost equally good <strong>over</strong> open, flat terrain and villages,<br />
closely followed by hilly terrain. Again, it is the <strong>landscape</strong> types woods and gravel pit, which are<br />
problematic.<br />
A comparison <strong>of</strong> the three scales shows that in scale 1:5,000, either very good or very poor results are<br />
achieved. The results for open, flat terrain are very good compared with the results for images in scale<br />
1:15,000 and 1:25,000. Likewise, the results for woods are much poorer in scale 1:5,000 than in 1:15,000<br />
and 1:25,000. For images in scale 1:15,000, differences between the <strong>landscape</strong> types are evened out a<br />
little, and that also applies for the images in scale 1:25,000.<br />
87
<strong>Automatic</strong> <strong>generation</strong> <strong>of</strong> <strong>elevation</strong> <strong>data</strong><br />
7.5.2 The accuracy for different <strong>landscape</strong> types excluding gross errors<br />
Tables 7.15 – 7.17 show the accuracy achieved for the individual <strong>landscape</strong> types after the elimination <strong>of</strong><br />
all gross errors.<br />
Resolution<br />
88<br />
15μm<br />
30μm<br />
60μm<br />
Mesh size<br />
Image scale 1:5,000<br />
The accuracy for <strong>landscape</strong> types after elimination <strong>of</strong> gross errors<br />
Flat terrain Gravel pit Village Hilly terrain Woods<br />
5 x 5 m 0.09 m 0.19 m 0.21 m 0.09 m 0.18 m<br />
12.5 x 12.5 m 0.10 m 0.24 m 0.20 m 0.11 m 0.18 m<br />
25 x 25 m 0.12 m 0.27 m 0.24 m 0.19 m 0.30 m<br />
5 x 5 m 0.11 m 0.25 m 0.14 m 0.11 m 0.24 m<br />
12.5 x 12.5 m 0.11 m 0.30 m 0.19 m 0.16 m 0.28 m<br />
25 x 25 m 0.14 m 0.34 m 0.24 m 0.24 m 0.36 m<br />
5 x 5 m 0.17 m 0.28 m 0.35 m 0.22 m 0.40 m<br />
12.5 x 12.5 m 0.16 m 0.39 m 0.29 m 0.22 m 0.44 m<br />
25 x 25 m 0.18 m 0.57 m 0.34 m 0.32 m 0.49 m<br />
Table 7.15: Accuracy for the five <strong>landscape</strong> types in scale 1:5,000 after elimination <strong>of</strong> gross errors.<br />
Resolution<br />
15μm<br />
30μm<br />
60μm<br />
Mesh size<br />
Image scale 1:15,000<br />
The accuracy for <strong>landscape</strong> types after elimination <strong>of</strong> gross errors<br />
Flat terrain Gravel pit Village Hilly terrain Woods<br />
5 x 5 m 0.28 m 0.36 m 0.31 m 0.29 m 0.53 m<br />
12.5 x 12.5 m 0.25 m 0.42 m 0.28 m 0.30 m 0.48 m<br />
25 x 25 m 0.27 m 0.51 m 0.31 m 0.35 m 0.44 m<br />
5 x 5 m 0.36 m 0.64 m 0.55 m 0.46 m 0.82 m<br />
12.5 x 12.5 m 0.34 m 0.66 m 0.48 m 0.46 m 0.78 m<br />
25 x 25 m 0.36 m 0.74 m 0.51 m 0.55 m 0.76 m<br />
5 x 5 m Cannot be calculated!<br />
12.5 x 12.5 m 0.39 m 0.92 m 0.65 m 0.65 m 1.02 m<br />
25 x 25 m 0.45 m 1.10 m 0.68 m 0.71 m 1.03 m<br />
Table 7.16: Accuracy for the five <strong>landscape</strong> types in scale 1:15,000 after elimination <strong>of</strong> gross errors.<br />
Resolution<br />
15μm<br />
30μm<br />
60μm<br />
Mesh size<br />
Image size 1:25,000<br />
The accuracy for <strong>landscape</strong> types after elimination <strong>of</strong> gross errors<br />
Flat terrain Gravel pit Village Hilly terrain Woods<br />
5 x 5 m 0.42 m 0.51 m 0.51 m 0.53 m 0.69 m<br />
12.5 x 12.5 m 0.41 m 0.73 m 0.47 m 0.48 m 0.76 m<br />
25 x 25 m 0.41 m 0.80 m 0.48 m 0.57 m 0.75 m<br />
5 x 5 m Cannot be calculated!<br />
12.5 x 12.5 m 0.49 m 1.01 m 0.67 m 0.66 m 0.96 m<br />
25 x 25 m 0.47 m 1.10 m 0.67 m 0.71 m 0.93 m<br />
5 x 5 m Cannot be calculated!<br />
12.5 x 12.5 m 0.63 m 1.62 m 0.87 m 0.97 m 1.45 m<br />
25 x 25 m 0.54 m 1.31 m 0.85 m 0.91 m 1.24 m<br />
Table 7.17: Accuracy for the five <strong>landscape</strong> types in scale 1:25,000 after elimination <strong>of</strong> gross errors.<br />
Table 7.15 shows that in scale 1:5,000, the condition for achieving nearly the same accuracy, regardless<br />
<strong>of</strong> <strong>landscape</strong> type, is that gross errors are eliminated. However, the <strong>landscape</strong> types gravel pit and woods<br />
still achieve a slightly poorer result.
7 The investigation<br />
Table 7.16 shows that in scale 1:15,000, after the elimination <strong>of</strong> gross errors and with resolution 15μm,<br />
almost the same accuracy can be achieved for the <strong>landscape</strong> types flat and hilly terrain and village.<br />
Woods and gravel pit still achieve a slightly poorer result. For the resolutions 30μm and 60μm, the results<br />
for gravel pit and woods are considerably poorer compared to the three other <strong>landscape</strong> types.<br />
Table 7.17 shows that with images in scale 1:25,000 and resolution 15μm, almost the same accuracy is<br />
achieved for four <strong>of</strong> the five <strong>landscape</strong> types after elimination <strong>of</strong> gross errors. Woods, however, still give<br />
rise to problems. For resolutions 30μm and 60μm, the best results are achieved in flat terrain. The accuracy<br />
is reduced for gravel pit and woods.<br />
It can thus be concluded that the accuracy achieved is independent <strong>of</strong> the individual <strong>landscape</strong> types with<br />
resolution 15μm after elimination <strong>of</strong> gross errors. With resolutions 30μm and 60μm, the results for the<br />
<strong>landscape</strong> types woods and gravel pit are not so good when compared to open, flat terrain.<br />
This means that there are many gross errors for the <strong>landscape</strong> types gravel pit and woods. It might therefore<br />
be interesting to see how great a percentage <strong>of</strong> the points it has been necessary to eliminate in the<br />
individual <strong>landscape</strong> types, before the iteration process stabilised itself.<br />
7.5.3 Gross errors and the <strong>landscape</strong> type<br />
Tables 7.18 – 7.20 show the number <strong>of</strong> points, indicated as a percentage within each <strong>landscape</strong> type, it<br />
has been necessary to eliminate, before the iteration process has stabilised itself.<br />
Resolution<br />
15μm<br />
30μm<br />
60μm<br />
Image scale 1:5,000<br />
Mesh size<br />
Flat terrain<br />
Percentage <strong>of</strong> eliminated points<br />
Gravel pit Village Hilly terrain Woods<br />
5 x 5 m 1.1 % 41.2 % 23.1 % 4.6 % 85.5 %<br />
12.5 x 12.5 m 1.0 % 59.3 % 24.3 % 8.7 % 87.8 %<br />
25 x 25 m 0.6 % 65.2 % 27.5 % 12.8 % 87.8 %<br />
5 x 5 m 1.01 % 36.1 % 27.5 % 4.8 % 86.5 %<br />
12.5 x 12.5 m 0.2 % 53.3 % 22.7 % 8.8 % 82.4 %<br />
25 x 25 m 0.1 % 57.6 % 21.6 % 16.0 % 81.8 %<br />
5 x 5 m 0.8 % 14.3 % 29.3 % 6.0 % 74.6 %<br />
12.5 x 12.5 m 0.5 % 44.9 % 16.4 % 5.3 % 85.0 %<br />
25 x 25 m 0.1 % 51.1 % 20.9 % 11.1 % 77.2 %<br />
Table 7.18: Percentage <strong>of</strong> points eliminated by the iteration process for scale 1:5,000 and the <strong>landscape</strong> types.<br />
Table 7.18 shows clearly that in open, flat and hilly terrain, it has not been necessary to eliminate very<br />
many points. For the <strong>landscape</strong> type village, between 25% and 30% <strong>of</strong> the points have been eliminated,<br />
whereas by far the greatest amount <strong>of</strong> points for the <strong>landscape</strong> types gravel pit and woods have had to be<br />
eliminated.<br />
Resolution<br />
15μm<br />
30μm<br />
60μm<br />
Image scale 1:15,000<br />
Mesh size<br />
Flat terrain<br />
Percentage <strong>of</strong> eliminated points<br />
Gravel pit Village Hilly terrain Woods<br />
5 x 5 m 7.5 % 19.6 % 15.4 % 14.7 % 42.7 %<br />
12.5 x 12.5 m 3.6 % 47.3 % 8.0 % 10.0 % 36.7 %<br />
25 x 25 m 2.9 % 52.3 % 6.0 % 11.7 % 36.0 %<br />
5 x 5 m 1.3 % 21.3 % 11.2 % 6.6 % 50.0 %<br />
12.5 x 12.5 m 0.7 % 23.6 % 6.3 % 6.8 % 36.0 %<br />
25 x 25 m 0.7 % 34.1 % 3.4 % 8.4 % 33.9 %<br />
5 x 5 m Cannot be calculated!<br />
12.5 x 12.5 m 0.9 % 14.4 % 6.6 % 6.0 % 40.1 %<br />
25 x 25 m 0.5 % 24.1 % 2.4 % 5.8 % 31.5 %<br />
Table 7.19: Percentage <strong>of</strong> points eliminated by the iteration process for scale 1:15,000 and the <strong>landscape</strong> types.<br />
89
<strong>Automatic</strong> <strong>generation</strong> <strong>of</strong> <strong>elevation</strong> <strong>data</strong><br />
Table 7.19 shows that it has not been necessary to eliminate very many points in flat terrain. For the<br />
<strong>landscape</strong> types village and hilly terrain, between approx. 1% and approx. 15% have been eliminated.<br />
Again, it has been necessary to eliminate large amounts <strong>of</strong> points for the <strong>landscape</strong> types gravel pit and<br />
woods, where the percentage lies from approx. 25% to approx. 50 %.<br />
Resolution<br />
90<br />
15μm<br />
30μm<br />
60μm<br />
Mesh size<br />
Image scale 1:25,000<br />
Percentage <strong>of</strong> eliminated points<br />
Flat terrain Gravel pit Village Hilly terrain Woods<br />
5 x 5 m 42.2 % 14.8 % 48.0 % 54.7 % 47.2 %<br />
12.5 x 12.5 m 33.7 % 56.5 % 35.2 % 50.0 % 39.4 %<br />
25 x 25 m 21.4 % 54.5 % 24.0 % 39.8 % 39.3 %<br />
5 x 5 m Cannot be calculated!<br />
12.5 x 12.5 m 6.8 % 30.6 % 25.9 % 20.4 % 38.0 %<br />
25 x 25 m 2.8 % 46.5 % 14.7 % 17.2 % 32.3 %<br />
5 x 5 m Cannot be calculated!<br />
12.5 x 12.5 m 2.0 % 21.3 % 8.1 % 7.2 % 36.8 %<br />
25 x 25 m 3.4 % 37.7 % 14.6 % 12.0 % 37.1 %<br />
Table 7.20: Percentage <strong>of</strong> points eliminated by the iteration process for scale 1:25,000 and the <strong>landscape</strong> types.<br />
Table 7.20 shows that for images in scale 1:25,000 and resolution 15μm, it has been necessary to eliminate<br />
markedly more points for all <strong>landscape</strong> types compared to the two other resolutions. Furthermore,<br />
the degree <strong>of</strong> elimination is the same for all <strong>landscape</strong> types which is not the case for the other scales<br />
and resolution.<br />
7.5.4 Summation for the <strong>landscape</strong> types<br />
Tables 7.18 – 7.20 show that gross errors mainly occur in those areas where they are expected. In scales<br />
1:5,000 and 1:15,000, the fewest gross errors are found in the <strong>landscape</strong> type open, flat terrain which is<br />
to be expected, as this area is flat without trees or buildings. In scale 1:25,000 and resolution 15μm, it has<br />
been necessary to eliminate markedly more points for all <strong>landscape</strong> types compared to the two other<br />
resolutions. It has not been possible to find an explanation for this phenomenon.<br />
In the <strong>landscape</strong> type open, hilly terrain, quite a few unexpected gross errors occur. The area includes<br />
fields, a few hedges, smaller <strong>over</strong>grown areas and a couple <strong>of</strong> farms with vegetation around them. The<br />
expectation was that these objects would be eliminated by Match-T.<br />
In the <strong>landscape</strong> types gravel pit and woods, the largest amount <strong>of</strong> gross errors are eliminated which was<br />
to be expected. In the next section a closer look is taken at the causes <strong>of</strong> gross errors.<br />
7.5.5 Correlation errors or objects in the terrain?<br />
The PIL programme gives the option <strong>of</strong> visualising the deviations between the frame <strong>of</strong> reference and the<br />
generated grid as error arrows. Each <strong>landscape</strong> type has been assigned a colour. These are:<br />
� Flat terrain = green<br />
� Gravel pit = yellow/orange<br />
� Village = red<br />
� Hilly terrain = violet<br />
� Woods = blue<br />
The error arrows are designed so that negative deviations give a dark downwards pointing arrow, and<br />
positive deviations give a light upwards pointing arrow, an example is shown in figure 7.2.
Gravel pit<br />
Village<br />
Flat terrain<br />
Hilly terrain<br />
7 The investigation<br />
Village<br />
Woods<br />
Figure 7.2: The error arrows show the deviation between the frame <strong>of</strong> reference and the generated grid.<br />
Pale colours indicate a positive error, dark colours a negative error. The error arrows are shifted, so that<br />
the starting and finishing point for the individual arrows do not adjoin.<br />
Figure 7.2 shows that there are few gross errors in the <strong>landscape</strong> type open, flat terrain and village,<br />
whereas there are relatively many unforeseeable gross errors in the <strong>landscape</strong> type hilly terrain. There<br />
are many positive gross errors in the <strong>landscape</strong> type woods and a few negative ones.<br />
By means <strong>of</strong> the error arrows generated by the analysis programme and an orthophoto, it is possible to<br />
make a closer analysis <strong>of</strong> where the errors are located, and whether it is a question <strong>of</strong> a correlation error<br />
or <strong>of</strong> objects in the terrain. This visualisation does not shift the error arrows, as their location after the shift<br />
will not fit in with the orthophotos.<br />
The choice has been to take a closer look at two resolutions <strong>of</strong> images in scale 1.25,000, namely the results<br />
for the resolutions 15μm and 60μm . The choice is based on the fact that large gaps have appeared<br />
within each resolution in the number <strong>of</strong> points eliminated, and furthermore, that these two results differ<br />
from the tendency in the other images.<br />
Tables 7.18 - 7.20 show that there are many gross errors in the <strong>landscape</strong> types woods, gravel pit and<br />
hilly terrain. The gross errors are symbolised by arrows. The arrows are here scaled up by a factor 20, so<br />
that they are easier to find. The result for scale 1:25,000, resolution 15μm and mesh size 25 x 25m is<br />
shown in figure 7.3.<br />
91
<strong>Automatic</strong> <strong>generation</strong> <strong>of</strong> <strong>elevation</strong> <strong>data</strong><br />
Figure 7.3: The differences between the generated grid in scale 1:25,000, resolution 15 μm and mesh size 25 x<br />
25m and the frame <strong>of</strong> reference are shown as arrows. Interesting areas have been extracted.<br />
In figure 7.3 three areas have been extracted, a gravel pit (yellow), a part <strong>of</strong> the hilly terrain (violet) and a<br />
part <strong>of</strong> the woods (blue). In the chosen gravel pit there are very large error arrows. By far the most <strong>of</strong> the<br />
error arrows are positive, and only a few are negative. Here Match-T has not been able to extend the<br />
<strong>generation</strong> to the bottom <strong>of</strong> the gravel pit, but has finished by passing it <strong>over</strong>. In the <strong>landscape</strong> type hilly<br />
terrain there are also many gross errors. After a closer analysis <strong>of</strong> the error arrows <strong>over</strong> the orthophoto, it<br />
can be seen that a part <strong>of</strong> the gross errors are due to the farms with outbuildings and vegetation around.<br />
Here the automatic <strong>generation</strong> has not been able to eliminate these objects so that the grid returned to<br />
the terrain. Likewise, a field is seen which, due to the soil conditions, has assumed a funny pattern.<br />
Match-T regards this pattern as shifts in the terrain, but in reality, it is a gently sloping field without any<br />
kind <strong>of</strong> shifts.<br />
The result <strong>of</strong> the automatic <strong>generation</strong> is as expected as regards the <strong>landscape</strong> type woods. It can be<br />
seen from the figure that there are many positive errors (large blue arrows), as the <strong>generation</strong> must have<br />
passed <strong>over</strong> the treetops.<br />
The same areas as in figure 7.3 have been chosen in figure 7.4.<br />
92
7 The investigation<br />
Figure 7.4: The differences between the generated grid in scale 1:25,000, resolution 60 μm and mesh<br />
size 25 x 25m and the frame <strong>of</strong> reference are shown as arrows. Interesting areas have been extracted.<br />
Figure 7.4 shows that the error arrows generally are much smaller for the whole area.<br />
In the <strong>landscape</strong> types flat terrain (green), village (red) and hilly terrain (violet), the number <strong>of</strong> gross errors<br />
have fallen compared to the result for images with resolution 15μm in figure 7.3. This can be seen from<br />
the small size <strong>of</strong> the arrows and from the fact that, in some places, there are holes within the <strong>landscape</strong><br />
type, where the error arrows are too small to appear.<br />
Generally seen, the error arrows for gravel pits and wooded areas are markedly smaller by resolution<br />
60μm.<br />
In the chosen areas, it will be seen that the error arrows are considerably smaller with a resolution <strong>of</strong><br />
60μm that with 15μm. As regards the gravel pit, there are markedly fewer <strong>of</strong> the very large error arrows.<br />
Furthermore, there are both positive and negative error arrows which indicates that the generated grid in<br />
the resolution 60μm has passed <strong>over</strong> as well as under the real terrain. In the <strong>landscape</strong> type woods, there<br />
are many positive errors (big blue arrows), as the grid has passed <strong>over</strong> the treetops as expected.<br />
93
<strong>Automatic</strong> <strong>generation</strong> <strong>of</strong> <strong>elevation</strong> <strong>data</strong><br />
In general, it can be seen from the figures in Appendix K that the error arrows are large when using a high<br />
resolution. These error arrows are reduced by using a lower resolution. For images in scale 1:5,000, it is<br />
seen that the same area consisting <strong>of</strong> village and woods include very large error arrows for all the results,<br />
regardless <strong>of</strong> the image resolution or mesh size. A closer analysis shows that the area is c<strong>over</strong>ed by a<br />
model. Even if the results from this model are poor, they still show that the deviations are reduced by using<br />
a lower resolution.<br />
7.5.6 Summation<br />
A difference between the results for the 15μm and the 60μm images is seen within the flat area. For the<br />
15μm images, all the error arrows are pale green which indicates that the <strong>generation</strong> passes <strong>over</strong> the terrain.<br />
For the images with resolution 60μm, the error arrows are both positive (pale green) and negative<br />
(dark green).<br />
Gross errors within the <strong>landscape</strong> type open, flat terrain must be due to correlation errors, as there are no<br />
objects <strong>of</strong> any kind on the terrain. For images in scale 1:25,000 with resolution 15μm, the result is quite<br />
wrong. Why the correlation, in these images in particular, has gone wrong is not known.<br />
That gravel pits should give problems is logical, as in this investigation the terrain type flat has been chosen<br />
for the whole image, and thereby a parallax bound <strong>of</strong> 3 pixels is used at the correlation. The gravel<br />
pits are very hilly with many steep slopes. If the <strong>generation</strong> in a gravel pit should have gone well, the terrain<br />
type for the <strong>generation</strong> should have been chosen as mountainous, whereby a parallax bound <strong>of</strong> 15<br />
pixels would have been used for the correlation.<br />
As regards the <strong>landscape</strong> type hilly terrain, there are also many gross errors. After a closer analysis <strong>of</strong> the<br />
error arrows <strong>over</strong> the orthophoto it is seen that there are several farms with outbuildings and vegetation<br />
around in the area. Here the automatic <strong>generation</strong> has not been able to eliminate these objects so that<br />
the grid returned to the terrain. This shows that Match-T is not able to eliminate objects if these form a<br />
small group, for instance, a farm with outbuildings and trees in a group. Likewise, a field is seen which,<br />
due to the soil conditions, appears in a funny pattern. These peculiarities are not foreseeable, and cannot<br />
therefore be considered beforehand. They must be characterised as freaks <strong>of</strong> nature! Match-T regards<br />
this pattern as terrain shifts, but in reality, as mentioned earlier, it represents a gently sloping field without<br />
any kind <strong>of</strong> shifts.<br />
In woods there are many positive errors which is natural as the generated grid will pass <strong>over</strong> the treetops.<br />
The holes in, for instance, the <strong>landscape</strong> type woods are due to the fact that it has not been possible to<br />
see the terrain and thus, measure a reference point in a fixed grid, see Appendix B or Chapter 4. The images<br />
should have been taken before leafing foliation, but this was not done because <strong>of</strong> a difficult spring<br />
season. The grid therefore passes <strong>over</strong> not only coniferous but also deciduous trees.<br />
In scales 1:5,000 and 1:15,000, only a few percent <strong>of</strong> the grid points in the <strong>landscape</strong> type open, flat terrain<br />
are eliminated. This small percentage may be due to correlation errors, as there are no hedges or<br />
farms in this area. In scale 1:25,000 and resolution 15μm, it has proved necessary to eliminate markedly<br />
more points in all <strong>landscape</strong> types compared to the two other resolutions. It has not been possible to disc<strong>over</strong><br />
the cause <strong>of</strong> this phenomenon.<br />
7.6 Partial conclusion<br />
This investigation has shown that the Match-T method is not capable <strong>of</strong> eliminating all objects (trees or<br />
buildings) in the terrain. If it is not otherwise possible to eliminate any vegetation or buildings, an accuracy<br />
<strong>of</strong> between approx. 1.5m and 3.5m can be achieved, dependent on the flight altitude and the resolution <strong>of</strong><br />
the images. If gross errors are not eliminated, there is a tendency that the accuracy improves the higher<br />
the altitude. If vegetation and buildings are removed, at best, an accuracy <strong>of</strong> 0.14‰ <strong>of</strong> the flight altitude<br />
can be achieved with images with resolution 15μm and mesh size 5 x 5m.<br />
As a mean, 20% <strong>of</strong> the grid points must be eliminated to achieve these accuracies, though for images in<br />
scale 1:25,000 and resolution 15μm, the percentage is 40.<br />
The investigation <strong>of</strong> the primary parameters have shown that the best results are achieved by using a<br />
large scale, and that the result is reduced linearly by using images in smaller scales, when the pixel size<br />
is maintained.<br />
94
7 The investigation<br />
The investigation <strong>of</strong> the resolution shows that the best results are achieved by using a small pixel size. In<br />
a high resolution, for instance 15μm, a higher degree <strong>of</strong> detailed information in the images is achieved.<br />
This entails a better accuracy, but also more gross errors by the automatic <strong>generation</strong> <strong>of</strong> <strong>elevation</strong> <strong>data</strong>. A<br />
low resolution blurs the images and thus incurs a reduced information basis. This means that the <strong>elevation</strong><br />
model is more ”s<strong>of</strong>t” without so many gross errors as with the 15μm images. The accuracy is linearly<br />
decreasing with the use <strong>of</strong> a lower resolution.<br />
The mesh size does not have any significant influence. This concurs with the theory, as the determination<br />
<strong>of</strong> the grid points is a purely mathematical process which is done on the basis <strong>of</strong> the <strong>elevation</strong>s <strong>of</strong> the interest<br />
points, and has nothing to do with the correlation process itself. The basis (the <strong>elevation</strong>s <strong>of</strong> the interest<br />
points) <strong>of</strong> the determination <strong>of</strong> the <strong>elevation</strong>s <strong>of</strong> the grid points in the <strong>elevation</strong> model will not be<br />
changed by the determination <strong>of</strong> any mesh size. However, a small mesh size will be determined on the<br />
basis <strong>of</strong> a smaller number <strong>of</strong> interest points. A grid with a small mesh size will reproduce the terrain with<br />
more information, while a grid with a large mesh size will reproduce the terrain more s<strong>of</strong>tly. On the other<br />
hand, the individual grid points in a large grid will be determined with greater accuracy, as more interest<br />
points will be included in the determination <strong>of</strong> these grid points than by a small mesh size. The essential<br />
aspect is the number <strong>of</strong> pixels on the ground, compared to the desired mesh size. This investigation<br />
shows that no less than 15 x 15 pixels per mesh should be used.<br />
The investigation <strong>of</strong> the <strong>landscape</strong> types has shown that gross errors arise in the <strong>landscape</strong> types woods<br />
and gravel pit, regardless <strong>of</strong> the scale or resolution <strong>of</strong> the images. However, fewer gross errors are generated,<br />
when images with resolution 60μm rather than with resolution 15μm are used. As regards the<br />
<strong>landscape</strong> type gravel pit, there are fewer gross errors with resolution 60μm, and they are not so big. This<br />
phenomenon is also valid for the <strong>landscape</strong> type woods, where there are also fewer errors and the error<br />
arrows are not so large as by 15μm images. For areas within the hilly terrain, there are also ”bare” spots,<br />
where the error arrows are small. The areas with many gross errors at the <strong>generation</strong> <strong>over</strong> the 15μm images<br />
have become considerably smaller, both in extent and size <strong>of</strong> the error arrows.<br />
The investigation <strong>of</strong> the <strong>landscape</strong> types also shows that <strong>elevation</strong>s automatically generated <strong>over</strong> gravel<br />
pits (steep slopes) or woods cannot be used. These areas should be edited before an automatic <strong>generation</strong><br />
is done, regardless <strong>of</strong> scale and resolution. Generations <strong>over</strong> the <strong>landscape</strong> type village should not<br />
be done in large scales, for instance 1:5,000. In medium and small scales, good results are achieved for<br />
the <strong>landscape</strong> type village.<br />
7.6.1 Experiences in table form<br />
The essential aspect <strong>of</strong> the <strong>landscape</strong> type gravel pit is that it consists <strong>of</strong> steep slopes. To generalise the<br />
<strong>landscape</strong> types used in this project, the type gravel pit is therefore changed to the more generalised designation,<br />
steep slopes.<br />
In Denmark, the scale 1:5,000 is traditionally used for technical mapping, and the scale 1:25,000 for nationwide<br />
mapping. Furthermore, the scale 1:15,000 has been included in this investigation.<br />
If the experience gained in this project is set on table form in these three scales, the result shows as follows:<br />
95
<strong>Automatic</strong> <strong>generation</strong> <strong>of</strong> <strong>elevation</strong> <strong>data</strong><br />
96<br />
Image<br />
scale<br />
Resolution<br />
Minimum mesh<br />
size (m)<br />
Flat<br />
Terrain<br />
Steep<br />
slope<br />
Landscape types<br />
Village<br />
Hilly<br />
terrain<br />
Woods<br />
15μm 1.125 x 1.125 X / / X /<br />
1:5,000 30μm 2.25 x 2.25 X / / X /<br />
60μm 4.5 x 4.5 X / / X /<br />
15μm 3.375 x 3.375 X / X X /<br />
1:15,000 30μm 6.75 x 6.75 X / X X /<br />
60μm 13.5 x 13.5 X / X X /<br />
15μm 6.625 x 6.625 X / X X /<br />
1:25,000 30μm 11.25 x 11.25 X / X X /<br />
60μm 22.5 x 22.5 X / X X /<br />
Table 7.21: Recommended minimum mesh size for a given scale and resolution, and which <strong>landscape</strong> types can be<br />
recommended (x) or not recommended ( / ) for an automatic <strong>generation</strong>.
8 Results on the basis <strong>of</strong> Chapter 7<br />
8 Results on the basis <strong>of</strong> Chapter 7<br />
In this chapter, a closer look will be taken at the accuracy which can be achieved in the calculations,<br />
when taking into consideration the lessons learned in Chapter 7.<br />
Even if quite a few gross errors are found in an automatic <strong>generation</strong>, for instance 30 %, it still means that<br />
70% <strong>of</strong> the measuring has gone well. This implies that the method <strong>of</strong> automatic <strong>generation</strong> <strong>of</strong> <strong>elevation</strong>s<br />
from digital images is still a relevant method for use in the <strong>Danish</strong> <strong>landscape</strong>. The question is, how the<br />
gross errors can be located. The experience learned from Chapter 7 shows that a part <strong>of</strong> the gross errors<br />
is due to the <strong>landscape</strong> type <strong>over</strong> which the automatic <strong>generation</strong> is done and that, in some <strong>of</strong> the calculations,<br />
there were not enough pixels per mesh. In this chapter, these experiences will be taken into consideration.<br />
The first investigation is into which accuracy can be achieved by using the minimum mesh size, and excluding<br />
those <strong>landscape</strong> types which contribute to the greatest number <strong>of</strong> gross errors. Then it is investigated<br />
whether there are still gross errors in the remaining <strong>landscape</strong> types.<br />
8.1 Exclusion <strong>of</strong> the <strong>landscape</strong> types<br />
It can be concluded from section 7.6 that the <strong>landscape</strong> types can be divided into three groups. The <strong>landscape</strong><br />
type open, flat terrain gives the best results, the intermediate group is the <strong>landscape</strong> types village<br />
and open, hilly terrain. The <strong>landscape</strong> types gravel pit and woods give the poorest results.<br />
In this investigation, a closer look will be taken at which accuracy can be achieved by excluding the <strong>landscape</strong><br />
types which contribute to the largest errors.<br />
If the desire was only to look at those <strong>landscape</strong> types where the best results can be achieved, the <strong>generation</strong><br />
should only be done <strong>over</strong> the open, flat terrain. Such a narrow choice <strong>of</strong> <strong>landscape</strong> types and<br />
thus, such a large exclusion <strong>of</strong> other <strong>landscape</strong> types, would reduce the area <strong>over</strong> which an automatic<br />
<strong>generation</strong> can be done. This implies that a great deal <strong>of</strong> manual editing work must be done in the images<br />
before a calculation can be done. Should such a thorough editing <strong>of</strong> the images be necessary before the<br />
automatic <strong>generation</strong> can be carried out, the method <strong>of</strong> automatic <strong>generation</strong> <strong>of</strong> <strong>elevation</strong>s from digital<br />
images can no longer be assessed as a cheap and quick method with a minimum <strong>of</strong> manual work. If a<br />
large part <strong>of</strong> the image is excluded from the automatic <strong>generation</strong>, other methods for <strong>elevation</strong> determination<br />
must be included. This complicates and raises the price <strong>of</strong> the process <strong>of</strong> determining <strong>elevation</strong> <strong>data</strong>.<br />
Gravel pits contribute with very large errors, but as gravel pits c<strong>over</strong> an insignificant part, and an exclusion<br />
<strong>of</strong> this <strong>landscape</strong> type is unimportant. If woods are excluded, the area will be reduced by approx.<br />
20% <strong>of</strong> the total area <strong>of</strong> Denmark. From the beginning <strong>of</strong> the project, densely built-up areas and waters<br />
have been excluded, which corresponds to approx. 20% <strong>of</strong> the area <strong>of</strong> Denmark. This means that the<br />
area <strong>over</strong> which an automatic <strong>generation</strong> can be done is approx. 60% <strong>of</strong> the total <strong>Danish</strong> area.<br />
As mentioned before, the choice has been to take a closer look at which accuracy can be achieved when<br />
taking into consideration the experience gained in Chapter 7. The criteria for the subsequent investigations<br />
are:<br />
� Only those grids will be included which meet the requirement <strong>of</strong> a minimum <strong>of</strong> pixels per mesh<br />
size <strong>of</strong> approx. 15 x 15.<br />
� The <strong>landscape</strong> types woods and gravel pit are excluded in all three scales. In scale 1:5,000, the<br />
<strong>landscape</strong> type village is also excluded.<br />
The results are presented without gross errors.<br />
97
<strong>Automatic</strong> <strong>generation</strong> <strong>of</strong> <strong>elevation</strong> <strong>data</strong><br />
8.1.1 Results without gross errors<br />
The <strong>data</strong> material consists <strong>of</strong> the <strong>landscape</strong> types flat and hilly terrain for the images in scale 1:5,000. For<br />
the images in scale 1:15,000 and 1:25,000, the <strong>data</strong> material consists <strong>of</strong> the <strong>landscape</strong> types flat and hilly<br />
terrain and village. As the same <strong>landscape</strong> types are not included in all three scales, the results are presented<br />
in two tables. The iterative process described in section 6.3 is done to isolate the remaining gross<br />
errors. The results are shown in table 8.1 for scale 1:5,000, and in table 8.2 for scales 1.15,000 and<br />
1:25,000 in metres and ‰ <strong>of</strong> the flight altitude.<br />
98<br />
Resolutionμm Mesh size Accuracy ‰ <strong>of</strong> H for 1:5,000<br />
5 x 5 m 0.08 m 0.11<br />
15μm<br />
12.5 x 12.5 m 0.10 m 0.13<br />
25 x 25 m 0.16 m 0.21<br />
5 x 5 m 0.10 m 0.13<br />
30μm<br />
12.5 x 12.5 m 0.13 m 0.17<br />
25 x 25 m 0.18 m 0.24<br />
5 x 5 m 0.17 m 0.23<br />
60μm<br />
12.5 x 12.5m 0.17 m 0.23<br />
25 x 25 m 0.24 m 0.32<br />
Table 8.1: The accuracy without gross errors for scale 1:5,000, the three resolutions and mesh sizes. The <strong>landscape</strong><br />
types included are flat and hilly terrain.<br />
Resolution<br />
15μm<br />
30μm<br />
60μm<br />
Mesh size<br />
Accuracy for<br />
1:15,0000<br />
‰ <strong>of</strong> H for<br />
1:15,000<br />
Accuracy for<br />
1:25,000<br />
‰ <strong>of</strong> H for<br />
1:25,000<br />
5 x 5 m 0.29 m 0.13 m Should not be calculated!<br />
12.5 x 12.5 m 0.27 m 0.12 m 0.42 m 0.11 m<br />
25 x 25 m 0.30 m 0.13 m 0.47 m 0.12 m<br />
5 x 5 m Should not be calculated! Cannot be calculated!<br />
12.5 x 12.5 m 0.41 m 0.18 m 0.59 m 0.16 m<br />
25 x 25 m 0.46 m 0.21 m 0.60 m 0.16 m<br />
5 x 5 m Cannot be calculated! Cannot be calculated!<br />
12.5 x 12.5 m Should not be calculated! Should not be calculated!<br />
25 x 25 m 0.62 m 0.27 m 0.75 m 0.20 m<br />
Table 8.2: The accuracy without gross errors for scale 1:15,000 and 1:25,000, the three resolutions and mesh sizes. The<br />
<strong>landscape</strong> types included are flat terrain, hilly terrain and village.<br />
Table 8.1 and 8.2 show that the best results are achieved by using 15μm images in all three scales. Here<br />
the accuracy for the <strong>landscape</strong> type open, flat terrain is close to 0.1‰ <strong>of</strong> the flight altitude, if a small mesh<br />
size is used. For images with resolution 30μm, the accuracy is reduced by a small amount and lies between<br />
approx. 0.13‰ and approx. 0.25‰ <strong>of</strong> the flight altitude. For images with resolution 60μm, the accuracy<br />
is again a little reduced and lies between 0.2‰ and approx. 0.3‰ <strong>of</strong> the flight altitude.<br />
8.1.2 Percentage <strong>of</strong> eliminated points<br />
After the <strong>landscape</strong> types gravel pit and woods are no longer part <strong>of</strong> the <strong>data</strong> material, and the type village<br />
has been excluded in scale 1:5,000, it is now investigated how many points still have to be eliminated<br />
during the iteration process. The number <strong>of</strong> eliminated points is given as a percentage.
8 Results on the basis <strong>of</strong> Chapter 7<br />
Image scale 1 : 5,000<br />
Resolution Mesh sizes Flat terrain Hilly terrain Total<br />
5 x 5 m 3.25 % 7.69 % 5.95 %<br />
15μm 12.5 x 12.5 m 2.53 % 11.44 % 7.99 %<br />
25 x 25 m 0.45 % 11.61 % 7.22 %<br />
5 x 5 m 3.11 % 7.61 % 5.81 %<br />
30μm 12.5 x 12.5 m 0.83 % 11.95 % 7.59 %<br />
25 x 25 m 0.23 % 19.60 % 11.98 %<br />
5 x 5 m 2.34 % 10.68 % 7.40 %<br />
60μm 12.5 x 12.5 m 1.67 % 9.65 % 6.52 %<br />
25 x 25 m 0.45 % 14.16 % 8.77 %<br />
Table 8.3: Number <strong>of</strong> eliminated points given as a percentage for each <strong>landscape</strong> type, and for the total number <strong>of</strong><br />
points in scale 1:5,000.<br />
It will be seen from table 8.3 that very few points have to be eliminated in flat terrain (approx. 0.25% -<br />
3.25 %). In hilly terrain, between approx. 8% and approx. 20% <strong>of</strong> points have to be eliminated. Of the total<br />
number <strong>of</strong> points, between approx. 6% and approx. 12% are eliminated.<br />
In scale 1:15,000, the <strong>landscape</strong> types flat and hilly terrain and village are included. The number <strong>of</strong> eliminated<br />
points given as a percentage is shown in table 8.4.<br />
Image scale 1 : 15,000<br />
Resolution Mesh sizes Flat terrain Village Hilly terrain Total<br />
5 x 5 m 11.97 % 19.69 % 18.16 % 16.62 %<br />
15μm 12.5 x 12.5 m 12.69 % 16.65 % 16.25 % 15.24 %<br />
25 x 25 m 8.44 % 11.92 % 17.97 % 13.47 %<br />
5 x 5 m Should not be calculated!<br />
30μm 12.5 x 12.5 m 2.04 % 14.01 % 10.91 % 8.90 %<br />
25 x 25 m 1.49 % 8.81 % 11.56 % 7.72 %<br />
5 x 5 m Cannot be calculated!<br />
60μm 12.5 x 12.5 m Should not be calculated!<br />
25 x 25 m 1.24 % 12.79 % 9.50 % 7.74 %<br />
Table 8.4: Number <strong>of</strong> eliminated points given as a percentage for each <strong>landscape</strong> type, and for the total number <strong>of</strong><br />
points in scale 1:15,000.<br />
Table 8.4 shows that the number <strong>of</strong> eliminated points in flat terrain is strongly reduced by using a lower<br />
resolution from approx. 13% to approx. 1 %. In the <strong>landscape</strong> types village and hilly terrain, between<br />
approx. 10% and 20% <strong>of</strong> the points are eliminated.<br />
The number <strong>of</strong> eliminated points given as a percentage in scale 1:25,000.<br />
Image scale 1 : 25,000<br />
Resolution Mesh sizes Flat terrain Village Hilly terrain Total<br />
5 x 5 m Should not be calculated!<br />
15μm 12.5 x 12.5 m 64.40 % 71.44 % 82.25 % 73.91 %<br />
25 x 25 m 50.62 % 59.09 % 67.81 % 60.16 %<br />
5 x 5 m Cannot be calculated!<br />
30μm 12.5 x 12.5 m 18.3 % 47.3 % 40.6 % 34.7 %<br />
25 x 25 m 17.02 % 45.64 % 43.29 % 35.15 %<br />
5 x 5 m Cannot be calculated!<br />
60μm 12.5 x 12.5 m Should not be calculated!<br />
25 x 25 m 11.0 % 34.6 % 26.9 % 23.4 %<br />
Table 8.5: Number <strong>of</strong> eliminated points given as a percentage for each <strong>landscape</strong> type, and for the total number <strong>of</strong><br />
points in scale 1:25,000.<br />
99
<strong>Automatic</strong> <strong>generation</strong> <strong>of</strong> <strong>elevation</strong> <strong>data</strong><br />
Table 8.5 shows that in scale 1:25,000, very many points are still eliminated in the chosen <strong>landscape</strong><br />
types. With resolution 15μm, from 50% to more than 80% are eliminated. With resolution 30μm, from<br />
approx. 20% to approx. 50% are eliminated. With resolution 60μm, from approx. 10% to approx. 35% are<br />
eliminated.<br />
8.1.3 Summation<br />
After leaving out the problematic areas and elimination <strong>of</strong> gross errors, it can be seen from tables 8.1 and<br />
8.2 when compared with the results in Chapter 7, tables 7.4 – 7.6, it can be seen that by excluding the<br />
problematic <strong>landscape</strong> types, an improvement in accuracy <strong>of</strong> approx. 0.10m to 0.20m can be achieved.<br />
It has turned out in this investigation that there is a very great difference in the number <strong>of</strong> points it has<br />
been necessary to eliminate. Tables 8.3 and 8.4 show that there are still up to 20% gross errors, even if<br />
the <strong>landscape</strong> types which contribute the largest number <strong>of</strong> gross errors are not included in the investigation.<br />
Furthermore, it will be seen that the number <strong>of</strong> eliminated points vary with the resolution and the<br />
mesh size.<br />
Table 8.5 shows that there are still very many gross errors in scale 1.25,000. It should therefore be investigated<br />
more closely, why the <strong>elevation</strong> determination in this scale is so markedly poorer than in the two<br />
other scales. Unfortunately this has not been possible as the Match-T programme is no longer available.<br />
The results from scale 1:25,000 will still be included in this project, though with an eye on the circumstance<br />
that the elimination <strong>of</strong> gross errors has been very extensive, and therefore deviates from the general<br />
tendency.<br />
In scale 1:5,000 in flat terrain, the accuracy without gross errors lies between approx. 0.08 m and 0.24 m,<br />
cf. table 8.1. By the elimination process, a maximum <strong>of</strong> 12% <strong>of</strong> the points are excluded, cf. table 8.3. This<br />
shows that there are few gross errors in this <strong>landscape</strong> type. This is also valid for the two other scales,<br />
though not to such an unambiguous degree. However, it is seen clearly from the tables 8.3 – 8.5 that<br />
there are still some gross errors, even if the most problematic <strong>landscape</strong> types are no longer included in<br />
the test material.<br />
Therefore, a method should be found which can locate these gross errors from the existing <strong>data</strong> material<br />
without involving the frame <strong>of</strong> reference.<br />
8.2 Method for locating gross errors<br />
This project has defined a frame <strong>of</strong> reference against which all the calculated grids have been held,<br />
whereby the gross errors have been located. A frame <strong>of</strong> reference would not exist, if the survey was done<br />
<strong>over</strong> ”virgin” ground. If a frame <strong>of</strong> reference existed, it would not be necessary to do a new survey, as the<br />
<strong>elevation</strong> <strong>data</strong> would already be in existence!<br />
It will therefore be investigated whether it is possible, by means <strong>of</strong> the existing <strong>data</strong> material, to locate<br />
gross errors. The theory and the experience gained in Chapter 7 show that a DEM determined <strong>over</strong> images<br />
with a low resolution, for instance 60μm, gives a poorer accuracy, and the grid represents the terrain<br />
in s<strong>of</strong>t lines. In resolution 30μm, the terrain is represented a little better with a little better accuracy, and<br />
again, the images in resolution 15μm will represent the terrain even better, and here the best accuracy is<br />
achieved. This means that the accuracy is improved by using a higher resolution, and at the same time it<br />
turned out that the number and size <strong>of</strong> the gross errors were likewise increased by using a higher resolution.<br />
In a case where a correlation error caused by, for instance the soil condition generates a hilltop, this error<br />
may be found as a small hill in the 60μm images, in the 30μm images, the hill will have become a little<br />
higher, while in the 15μm images, it will be shown as a hilltop. Another example could be that Match-T, in<br />
a smaller group <strong>of</strong> objects, generated a medium solution with resolution 60μm, a slightly better one with<br />
resolution 30μm, and a full representation with resolution 15μm, see figure 8.1.<br />
100
8 Results on the basis <strong>of</strong> Chapter 7<br />
This is the background to the idea <strong>of</strong> using all three resolutions, 60μm, 30μm and 15μm in combination to<br />
locate gross errors in the 15μm images. The frame <strong>of</strong> reference will only be used for an evaluation <strong>of</strong> the<br />
method.<br />
In the investigation, those results are used which fulfil the demand for the minimum <strong>of</strong> 15 x 15 pixels per<br />
mesh size. For each calculation, the scale and the mesh size are maintained. This reduces the investigation<br />
to include only six grids. At first, the minimum and maximum deviation, as well as the mean (mean)<br />
and accuracy (RMSE) between the frame <strong>of</strong> reference and the raw <strong>data</strong> material for the 15μm images are<br />
regarded. This information stems from the analysis file for the individual calculation, see Appendix L.<br />
Again, the results are shown in two tables, as the same <strong>landscape</strong> types do not appear in scale 1:5,000<br />
as in scales 1:15,000 and 1:25,000.<br />
Table 8.6 shows the results in scale 1:5,000.<br />
15 μm<br />
30 μm<br />
60 μm<br />
Figure 8.1: Sketch <strong>of</strong> the results for an object group by different resolutions.<br />
Grid Min. deviation Max. deviation Mean RMSE (m)<br />
1:5,000_15μm _5 m -16.46 m 7.13 m -0.01 m 0.97 m<br />
1:5,000_15μm _12.5 m -23.28 m 13.04 m -0.02 m 1.45 m<br />
1:5,000_15μm _25 m -15.87 m 11.76 m -0.01 m 1.16 m<br />
Table 8.6: Minimum (Min) and maximum (Max) deviation, the mean and Root Mean Squared Error (RMSE) for<br />
1:5,000, 15μm and the three mesh sizes.<br />
Table 8.6 shows that there are quite large deviations, with the minimum deviations between approx. –<br />
15m down to –23 m, and the maximum deviations between approx. 7m and 13m. In scale 1:5,000, there<br />
is almost no <strong>of</strong>fset (mean).<br />
Table 8.7 shows the results for scales 1:15,000 and 1:25,000.<br />
Terrain<br />
Grid Min. Deviation Max. Deviation Mean RMSE (m)<br />
1:15,000_15μm _12.5 m -7.43 m 12.68 m 0.54 m 0.83 m<br />
1:15,000_15μm _25 m -4.98 m 11.95 m 0.77 m 1.63 m<br />
1:25,000_15μm _25 m -7.17 m 11.73 m 1.53 m 1.76 m<br />
Table 8.7: Minimum (Min) and maximum (Max) deviation, the mean and RMSE for 1:15,000 and 1:25,000, 15μm<br />
and the three mesh sizes.<br />
In scales 1:15,000 and 1:25,000, see table 8.7, there is a minimum deviation <strong>of</strong> approx. –7.5m and a<br />
maximum deviation <strong>of</strong> approx. 13 m, an <strong>of</strong>fset <strong>of</strong> approx. 0.5m and 0.8m for images in scale 1:15,000. In<br />
scale 1:25,000, there is an <strong>of</strong>fset <strong>of</strong> approx. 1.5m. Regardless <strong>of</strong> scale, the accuracy lies between approx.<br />
0.8m and approx. 1.75m.<br />
It is to be hoped that the method can locate those grid points where the greatest deviation between the<br />
<strong>elevation</strong> values <strong>of</strong> the three resolutions is to be found, and that these are also the grid points which contribute<br />
with a gross error.<br />
101
<strong>Automatic</strong> <strong>generation</strong> <strong>of</strong> <strong>elevation</strong> <strong>data</strong><br />
The problematic grid points are determined by means <strong>of</strong> the standard deviation from the results for the<br />
three resolutions, which means that the standard deviation is only determined <strong>over</strong> three values. This is<br />
not optimal, but as no more material exists, use must be made <strong>of</strong> what does exist.<br />
The analysis <strong>of</strong> the <strong>elevation</strong>s in the three resolutions and the frame <strong>of</strong> reference is done in Excel, and<br />
therefore appears in one dimension. First, the standard deviation between the individual grid points in the<br />
three resolutions is calculated. Then the <strong>data</strong> material is sorted after the standard deviation to find those<br />
grid points, where the standard deviation is largest. This is done to find those grid points, where there is a<br />
great difference between the <strong>elevation</strong>s in the different resolutions.<br />
An example <strong>of</strong> grid points with large standard deviation is the result for scale 1:25,000 and mesh size 25<br />
x 25m. In order to retain an <strong>over</strong>view, it was chosen to show only the first 100 grid points with the biggest<br />
standard deviation. For the sake <strong>of</strong> readability, the Y-axis has been shifted, so that only the interesting<br />
interval is shown.<br />
Diagram 8.1 shows that some points follow the results for resolution 30μm and 60μm in the frame <strong>of</strong> reference<br />
nicely, while the results for resolution 15μm deviates appreciably, see points 1-22. By and large,<br />
there is a large deviation between 15μm and the frame <strong>of</strong> reference for the peaks in the diagram. For<br />
other grid points, the results for 15μm and the frame <strong>of</strong> reference follow each other, see the valleys. It is<br />
therefore quite clear that if grid points are eliminated by a given standard deviation, correctly as well as<br />
wrongly determined grid points will be eliminated.<br />
As the method is investigated for use in the elimination <strong>of</strong> gross errors in resolution 15μm, the accuracy<br />
achieved in Chapter 7 for 15μm images is taken as point <strong>of</strong> departure for the fixing <strong>of</strong> a gross error limit<br />
for the standard deviation. The gross error limit is determined as the mean per thousand <strong>of</strong> the flight altitude<br />
<strong>of</strong> all the results for 15μm images achieved in Chapter 7. This value is multiplied by 3 and used as<br />
gross error limit for the standard deviation. The result is 0.4‰ <strong>of</strong> the flight altitude which gives:<br />
102<br />
Height (m)<br />
100<br />
90<br />
80<br />
70<br />
60<br />
50<br />
40<br />
� 1:5,000 = 0.3 m<br />
� 1:15,000 = 0.9 m<br />
� 1:25,000 = 1.5 m<br />
Heights from frame <strong>of</strong> references, 1:25.000; 15 μm, 30 μm og 60 μm<br />
1<br />
4<br />
7<br />
10<br />
13<br />
16<br />
19<br />
22<br />
25<br />
28<br />
31<br />
34<br />
37<br />
40<br />
43<br />
46<br />
49<br />
52<br />
55<br />
58<br />
61<br />
64<br />
67<br />
70<br />
73<br />
76<br />
79<br />
82<br />
85<br />
88<br />
91<br />
94<br />
97<br />
100<br />
Number <strong>of</strong> points<br />
Diagram 8.1: Elevation <strong>data</strong> in resolution 15 μm, 30 μm and 60 μm in scale 1:25,000 and mesh size 25 x 25 m.<br />
The elimination <strong>of</strong> good grid points is accepted, if the method still finds those grid points which contribute<br />
to the really gross errors. It is therefore interesting to see how many grid points are eliminated, how many<br />
z<br />
60 μm<br />
30 μm<br />
15 μm
8 Results on the basis <strong>of</strong> Chapter 7<br />
<strong>of</strong> them are correctly determined, and how many are wrongly determined. To get an idea <strong>of</strong> how much is<br />
lost by the elimination <strong>of</strong> correctly determined grid points, and how much is won by the elimination <strong>of</strong><br />
wrongly determined points, all deviations are summed up from correctly determined grid points and<br />
wrongly determined grid points respectively. All this information is shown for each grid which is included<br />
in the investigation, see table 8.8.<br />
Grid<br />
Number <strong>of</strong><br />
eliminated<br />
points<br />
Number<br />
<strong>of</strong> correct<br />
points<br />
Number<br />
<strong>of</strong> wrong<br />
points<br />
Good<br />
metres<br />
Bad<br />
metres<br />
Max. Good<br />
metres<br />
Max. Bad<br />
metres<br />
1:5,000_15μm _5 m 158 95 63 10 m 342 m 0.27 m 16.46 m<br />
1:5,000_15μm _12.5 m 170 54 116 7 m 632 m 0.29 m 23.28 m<br />
1:5,000_15μm _25 m 340 140 200 20 m 597 m 0.30 m 15.87 m<br />
Table:8.8: The number <strong>of</strong> eliminated points, incl. the number <strong>of</strong> correct and wrong grid points respectively, the sum <strong>of</strong><br />
the deviations for the correct points (good m) and for the wrong points (bad m), and the maximum deviation for<br />
wrongly and correctly determined grid point in scale 1:5,000.<br />
Grid<br />
Number <strong>of</strong><br />
eliminated<br />
points<br />
Number<br />
<strong>of</strong> correct<br />
points<br />
Number<br />
<strong>of</strong> wrong<br />
points<br />
Good<br />
metres<br />
Bad<br />
metres<br />
Max. good<br />
metres<br />
Max. Bad<br />
metres<br />
1:15,000_15μm _12.5 m 199 81 118 38 m 472 m 0.89 m 14.08 m<br />
1:15,000_15μm _25 m 177 93 94 39 m 327 m 0.85 m 12.68 m<br />
1:25,000_15μm _25 m 70 14 56 11 m 286 m 1.50 m 11.73 m<br />
Table:8.9: The number <strong>of</strong> eliminated points, incl. the number <strong>of</strong> correct and wrong grid points respectively, the sum <strong>of</strong><br />
the deviations for the correct points (good m) and for the wrong points (bad m), and the maximum deviation for<br />
wrongly and correctly determined grid point in scale 1:15,000 and 1:25,000.<br />
Table 8.9 shows that in scale 1:5,000 and resolution 15μm and mesh size 5 x 5 m, 158 points are eliminated,<br />
<strong>of</strong> which 95 are correctly determined points, and 63 are wrongly determined points. This is the only<br />
case where more good than bad points are eliminated. Even in this case, the sum <strong>of</strong> the deviations for the<br />
95 correctly determined points is only 10 m, whereas the sum <strong>of</strong> the deviations for the 63 wrongly determined<br />
grid points is all <strong>of</strong> 342 m, <strong>of</strong> which the largest deviation is 16.5m.<br />
In the remaining grids, more wrongly determined grid points are eliminated than correctly determined<br />
ones. Furthermore, it is seen that the sum <strong>of</strong> the eliminated correctly determined points lies from approx.<br />
7m to approx. 40 m, while the sum <strong>of</strong> the eliminated wrongly determined grid points lies from approx.<br />
290m to approx. 630m. This shows that even if the method eliminates good grid points, it is clearly an asset<br />
in eliminating very gross errors.<br />
Table 8.10 shows how great the minimum and maximum deviations are after the elimination, as well the<br />
mean and the accuracy (RMSE). These resolutions are taken from Appendix L.<br />
Grid Min. Max. Mean RMSE Stnd<br />
1:5,000_15μm _5 m -0.92 m 0.82 m 0.07 m 0.12 m 0.10 m<br />
1:5,000_15μm _12.5 m -2.45 m 2.41 m 0.06 m 0.17 m 0.15 m<br />
1:5,000_15μm _25 m -6.03 m 8.52 m 0.04 m 0.47 m 0.46 m<br />
Table 8.10: Min. and max. deviations, mean, RMSE and standard deviation (Stnd) after the elimination in scale<br />
1:5,000.<br />
Grid Min. Max. Mean RMSE Stnd<br />
1:15,000_15μm _12.5 m -2.93 m 4.11 m 0.53 m 0.64 m 0.36 m<br />
1:15,000_15μm _25 m -3.84 m 4.75 m 0.53 m 0.71 m 0.47 m<br />
1:25,000_15μm _25 m -6.51 m 7.42 m 1.53 m 1.68 m 0.69 m<br />
Table 8.11: Min. and max. deviations, mean, RMSE and Stnd after the elimination in scale 1:15,000 and 1:25,000.<br />
Table 8.10 shows that in scale 1:5,000 and mesh size 5 x 5 m, the result is quite good with a minimum<br />
and maximum <strong>of</strong> under one metre and a RMSE <strong>of</strong> 0.12m. In scale 1:5,000 and mesh size 12.5 x 12.5 m,<br />
103
<strong>Automatic</strong> <strong>generation</strong> <strong>of</strong> <strong>elevation</strong> <strong>data</strong><br />
the result is still good with a minimum <strong>of</strong> –2.5 m and a maximum <strong>of</strong> 2.5 m, and a RMSE <strong>of</strong> 0.17m. The result<br />
for mesh size 25 x 25 m is a minimum <strong>of</strong> –6.03 m and a maximum <strong>of</strong> 8.52 m and the RMSE <strong>of</strong> 0.47m.<br />
For the remaining grids, see table 8.11, the result still shows large minimum and maximum deviations, but<br />
these are not so large as before the elimination, where the deviations were <strong>over</strong> 10m. Furthermore, there<br />
is still an <strong>of</strong>fset in the images in scales 1:15,000 and 1:25,000. The results are quite good, corresponding<br />
to 0.16‰ – 0.2‰ <strong>of</strong> the flight altitude, if this <strong>of</strong>fset is eliminated. And, bearing in mind, in a completely<br />
automatic <strong>generation</strong> process.<br />
8.2.1 Object or correlation error<br />
A drawback to this method is that it is not able to catch gross errors <strong>of</strong> the same size in all three resolutions.<br />
If the gross error is caused by, for instance, an object group, where the correlation is correct, but<br />
falls on top <strong>of</strong> trees or houses, which has happened in all three resolutions, the deviation will not be recognised<br />
by this method. It will therefore be investigated whether the remaining gross errors are caused by<br />
objects in the terrain. If this is the case, these objects can be located by means <strong>of</strong> information from map<br />
<strong>data</strong>, in this case by means <strong>of</strong> TOP10DK <strong>data</strong>.<br />
To find out whether the remaining gross errors are due to correlation errors or to objects in the terrain, the<br />
grid points with the errors are visualised in an orthophoto <strong>over</strong> the test area, see figure 8.2.<br />
Figure 8.2: The remaining gross errors after the error elimination using the standard deviation as threshold limit. The<br />
gross errors are shown as green crosses.<br />
Figure 8.2 shows that the remaining gross errors are caused not only by objects, but also by correlation<br />
errors which are due to soil conditions. These soil conditions are found in all three resolutions. In other<br />
cases, the gross error is caused by an object.<br />
The results for the remaining grids are found in Appendix L.<br />
104
8 Results on the basis <strong>of</strong> Chapter 7<br />
8.3 Partial conclusion<br />
By choosing the minimum mesh size, it is ensured that the calculation will run without problems, and the<br />
result will lie within the tendency. By excluding those <strong>landscape</strong> types which contribute the largest number<br />
<strong>of</strong> errors, the accuracy is considerably improved, but there are still quite a few gross errors in the remaining<br />
<strong>landscape</strong> types. In scales 1:5,000 and 1:15,000, the number <strong>of</strong> gross errors is 0.20 %, while in<br />
scale 1:25,000, very many gross errors are still eliminated.<br />
By using the results from the three resolutions, the largest gross errors are located, and the result improved<br />
considerably. However, there is still an <strong>of</strong>fset in the scales 1:15,000 and 1:25,000. If this <strong>of</strong>fset<br />
can be removed, the result is quite good.<br />
105
9 Theory and practice<br />
9 Theory and practice<br />
The purpose <strong>of</strong> this chapter is to compare the results from Chapter 7 and 8 with the theory from Chapter<br />
2 and with the experience <strong>of</strong> others, as appears in the source study in Chapter 3. It will be discussed<br />
here, whether there are discrepancies between the results achieved, the theory and the experience <strong>of</strong><br />
others.<br />
The individual parameters which are included in this project will be treated individually. First, the scale is<br />
described, then the pixel size, the mesh size, and finally the <strong>landscape</strong> type. For each subject, the theory<br />
is described first, then the source study, and finally the results. To round <strong>of</strong>f, possible accordance’s are<br />
discussed.<br />
In this project, the results appear on several levels, results for all <strong>landscape</strong> types with and without gross<br />
errors (Chapter 7), results for selected <strong>landscape</strong> types with and without gross errors, and results<br />
achieved by use <strong>of</strong> the standard deviation between the resolutions 15μm, 30μm and 60μm as gross error<br />
limit. (Chapter 8).<br />
9.1 The scale<br />
Theory: The accuracy <strong>of</strong> the <strong>elevation</strong>s is presented as ‰ <strong>of</strong> the flight altitude which shows that the flight<br />
altitude and thus the scale have a linear influence on the accuracy. Therefore, one should be able to<br />
achieve a better accuracy with images in a large scale, where there are far more details than in images in<br />
a small scale.<br />
Source: Several articles discuss what accuracy can be achieved with Match-T as function <strong>of</strong> the flight altitude.<br />
One investigation shows that an accuracy better than 0.1‰ <strong>of</strong> the flight altitude, down to 0.08‰ <strong>of</strong><br />
the flight altitude is possible [Krzystek, 1991]. Another article shows that an even better accuracy can be<br />
achieved, down to between 0.04‰ and 0.1‰ <strong>of</strong> the flight altitude dependent on the resolution <strong>of</strong> the images<br />
and the <strong>landscape</strong> type [Ackermann et al., 1992]. A Norwegian investigation [Eide, et al., 1993] also<br />
shows that an accuracy <strong>of</strong> 0.1‰ <strong>of</strong> the flight altitude in flat and simple terrain, 0.25‰ in flat and moderately<br />
hilly terrain and 0.55‰ <strong>of</strong> the flight altitude in mountainous (steep) terrain can be achieved.<br />
In none <strong>of</strong> the described articles has it been discussed whether there is linearity between the different<br />
flight altitudes, or how many points have possibly been eliminated to achieve these results.<br />
Practice: The investigations undertaken in this project show that not very good results are achieved<br />
when a ”raw” <strong>generation</strong> is done <strong>over</strong> all <strong>landscape</strong> types. The results lie between 1.5m and 3.5m regardless<br />
<strong>of</strong> scale. After the elimination <strong>of</strong> gross errors, investigations show that if accuracy is regarded from a<br />
centimetre point <strong>of</strong> view, the best results are achieved by using images in large scale and the poorest by<br />
using images in small scale. This result is as expected.<br />
If the results achieved are transformed into ‰ <strong>of</strong> the flight altitude, the best results are achieved by using<br />
images with resolution 15μm . Here, the accuracy is approx. 0.15‰ <strong>of</strong> the flight altitude, for the 30μm images,<br />
the accuracy lies between approx. 0.2‰ and 0.3‰ <strong>of</strong> the flight altitude, and between 0.3‰ and<br />
0.4‰ <strong>of</strong> the flight altitude for the 60μm images.<br />
Furthermore, the investigation shows that with resolution 15μm, the accuracy is by and large linearly dependent<br />
<strong>of</strong> the scale, whereas there is a small deflection in scale 1:15,000 with the resolutions 30μm and<br />
60μm.<br />
It has also turned out that it has not been possible to achieve the accuracy <strong>of</strong> 0.1‰ <strong>of</strong> the flight altitude,<br />
regardless <strong>of</strong> the scale or resolution <strong>of</strong> the images, if the <strong>elevation</strong> <strong>data</strong> is generated <strong>over</strong> all <strong>landscape</strong><br />
types. If problematic <strong>landscape</strong> types are excluded, the results are considerably improved. The accuracy<br />
then lies between 0.5m and 1.5m.<br />
107
<strong>Automatic</strong> <strong>generation</strong> <strong>of</strong> <strong>elevation</strong> <strong>data</strong><br />
An accuracy <strong>of</strong> 0.1‰ <strong>of</strong> the flight altitude can only be achieved for images with resolution 15μm and without<br />
problematic <strong>landscape</strong> types and gross errors in the remaining <strong>landscape</strong> types. In this investigation,<br />
the accuracy lies between 0.1‰ and 0.2‰ <strong>of</strong> the flight altitude for the 15μm images, between 0.15‰ and<br />
0.25‰ <strong>of</strong> the flight altitude for the 30μm images and around 0.2‰ to 0.25‰ <strong>of</strong> the flight altitude for the<br />
60μm images.<br />
9.2 The pixel size<br />
Theory: Theoretically seen, the best results should be achieved by using images with a high resolution,<br />
as a small pixel size means that far more information is included in the images, than when they are<br />
scanned with a low resolution, where the images become more blurred.<br />
Source: In an article by [Krzystek, et al., 1992] images with resolutions 15μm and 30μm have been used.<br />
This investigation shows that the accuracy for the 15μm images is considerably better than for the 30μm<br />
images. In another article [Ackermann, 1992], 15μm and 30μm images have also been used. The result<br />
was 0.06‰ <strong>of</strong> the flight altitude for the 15μm images and 0.09‰ <strong>of</strong> the flight altitude for the 30μm images.<br />
A Norwegian investigation [Eide, et al., 1993] is based on images with 3 different resolutions, 15μm,<br />
30μm and 60μm . This investigation shows that the best result was achieved with the resolution 15μm,<br />
while the result for the 30μm images was a little poorer, and the result for the 60μm images was clearly<br />
poorer. The articles mentioned show that the image resolution has an influence, on the other hand, the<br />
results from the OEEPE workshop where for instance, the results from Inpho GmbH, Institut Cartogràfic<br />
de Catalunya or the Aalborg University OEEPE investigation show that resolution has no influence.<br />
Practice: The results from the ”raw” <strong>generation</strong> show that the resolution has no influence. After the elimination<br />
<strong>of</strong> gross errors, the best results are achieved by using a high resolution, and the results are approximately<br />
linear.<br />
The results achieved in this project show that the best accuracy is achieved by using the 15μm images.<br />
At the same time, a high resolution entails many gross errors. The images with resolution 60μm gives a<br />
poorer accuracy, but at the same time contains fewer gross errors.<br />
9.3 The mesh size<br />
Theory: The grid heights are determined mathematically from the <strong>elevation</strong>s <strong>of</strong> the interest points. The<br />
<strong>elevation</strong>s <strong>of</strong> the interest points are determined by the correlation process itself. After having determined<br />
the <strong>elevation</strong>s <strong>of</strong> a group <strong>of</strong> interest points, the grid heights are determined from the <strong>elevation</strong>s <strong>of</strong> the interest<br />
points. The determination <strong>of</strong> the different mesh sizes is, therefore, done on the same basis, from<br />
the <strong>elevation</strong>s <strong>of</strong> the same interest points. Theoretically, the mesh size should, therefore, not have any<br />
appreciable influence on the result. However, with a large mesh size there will be more interest points<br />
<strong>elevation</strong>s as a basis for the determination <strong>of</strong> the grid point than with a small mesh size. Furthermore, a<br />
grid with a small mesh size will reproduce the terrain with a greater degree <strong>of</strong> detail, while a grid with a<br />
large mesh size will reproduce the terrain more s<strong>of</strong>tly. This should form part <strong>of</strong> the reflections when a<br />
large and small mesh size <strong>over</strong> the same area is compared. A 100% similar result cannot be expected<br />
with different mesh sizes, even if the basis is the same.<br />
In each calculation, Match-T itself suggests a mesh size. Under which conditions this mesh size is determined,<br />
is not known in this project.<br />
Source: In the article [Krzystek, et al., 1992] the conclusion is clear: large mesh size, and thus more interest<br />
points, gives a better result in flat areas. In the case <strong>of</strong> steeper terrain, a grid with a large mesh size<br />
will entail a reduction in the accuracy. The accuracy for mesh sizes <strong>over</strong> approx. 5m is better than 0.1‰<br />
<strong>of</strong> the flight altitude, regardless <strong>of</strong> scale or resolution. Other investigations from OEEPE workshop [Institut<br />
Cartogràfic de Catalunya; National Geographical Institute, Bruxelles; the Aalborg University investigation]<br />
show that the mesh size has no influence.<br />
[Inpho, 1995] points to the rule <strong>of</strong> thumb that the mesh size should be c<strong>over</strong>ed by approx. 30 x 30 pixels<br />
in the digital image. If the mesh size is reduced drastically and it relates to this rule <strong>of</strong> thumb, the calculation<br />
time will increase considerably. The mesh size can be calculated by means <strong>of</strong> the following formula:<br />
The mesh size = 30 x pixels x the scale.<br />
108
9 Theory and practice<br />
However, this is only a rough recommendation and may be ignored [Inpho, 1995].<br />
It is also stated by [Baltsavias, 1999] that there should be a minimum <strong>of</strong> 10 2 – 15 2 pixels per mesh.<br />
Practice: This project has shown that the mesh size has an influence. It has turned out that there is a<br />
lower limit to how small a mesh size the programme can handle in relation to the scale and resolution <strong>of</strong><br />
the images. The influence is probably due to a lack <strong>of</strong> interest points. The experience gained in this project<br />
says that if one wishes to use a mesh size which is smaller than 15 x 15 pixels per mesh, calculation<br />
problems may arise, and it may even be impossible to calculate a grid. This corresponds well with the<br />
sizes suggested by [Baltsavias, 1999].<br />
If this minimum demand for the number <strong>of</strong> pixels per mesh is observed, the mesh size does not have any<br />
great influence, the accuracy is reduced very little by using a large mesh size.<br />
9.4 The <strong>landscape</strong> type<br />
Theory: If the problems surrounding <strong>landscape</strong> types are regarded theoretically, they must be divided<br />
into two superior areas, open country and areas with objects (houses, trees etc.). Theoretically seen,<br />
100% <strong>of</strong> the open country without any form <strong>of</strong> objects should not give rise to problems. Areas with objects<br />
can be subdivided into areas with solitary objects, sparsely built-up areas (housing estates, woods with<br />
clearings etc.) and densely built-up areas or closely wooded areas. Match-T should be able to eliminate<br />
solitary objects by use <strong>of</strong> the mathematics for smoothing the grid. This method will not be very successful<br />
in densely built-up or closely wooded areas. Here, the grid will pass <strong>over</strong> the objects.<br />
Source: The sources agree that <strong>landscape</strong> types pose a fundamental problem. Only in open areas with<br />
solitary objects, which Match-T can eliminate itself, does the <strong>generation</strong> go immediately well [Ackermann<br />
et al., 1992; a) Krzystek et la., 1995]. The article [b) Krzystek et al., 1995] shows that Match-T is also able<br />
to handle areas with a lack <strong>of</strong> texture, and therefore not sufficient terrain information. The investigation by<br />
[Seyfert, 1995] shows that densely built-up areas yield three times as poor a result as fields. Likewise,<br />
[Thorpe, 1996] has shown that <strong>generation</strong> <strong>over</strong> built-up areas gives poor results. Furthermore, the presentations<br />
from the OEEPE workshop show that there are problems with vegetation and buildings.<br />
Practice: In this project five <strong>landscape</strong> types have been included. The type flat, open terrain is without<br />
objects, while open, hilly terrain was not quite without objects. In this area there are hedges, solitary trees<br />
and a few farms/houses. These objects were estimated to be without problems. The problem areas are<br />
gravel pits, the housing estate and the woods.<br />
The investigation showed that the same results are achieved regardless <strong>of</strong> <strong>landscape</strong> type after elimination<br />
<strong>of</strong> gross errors. Regardless <strong>of</strong> scale, resolution and mesh size, only a few gross errors are found in<br />
flat terrain. In hilly terrain and village in scale 1:15,000, there are between 2% and 15% gross errors and<br />
between 7% and approx. 25% for images in scale 1:25,000. It must be noted, however, that images with<br />
resolution 15μm have been excluded, as these involve an unusual amount <strong>of</strong> errors.<br />
Most deviations are found in the <strong>landscape</strong> types gravel pit and woods which was to be expected. In the<br />
housing estate area, it was surprising to see how well Match-T was able to handle this area, particularly in<br />
scales 1:15,000 and 1.25,000, a conclusion which was also reached in [Krzystek et al., 1995]. It was to be<br />
expected that this area would give large deviations. If the influence <strong>of</strong> this result is regarded by the creation<br />
<strong>of</strong> <strong>elevation</strong> models for updating purposes, the result is even more gratifying, as changes in the <strong>Danish</strong><br />
terrain is usually caused by the building <strong>of</strong> new housing estates. On the other hand, it has been a surprise<br />
to find so many gross errors in the hilly terrain.<br />
The conclusion is that the <strong>landscape</strong> type has a great influence on the result, and that gravel pits and<br />
woods should not be included, regardless <strong>of</strong> the scale <strong>of</strong> the images. Furthermore, villages should not be<br />
included for images in a large scale. If a higher accuracy is required, problematic areas can be edited<br />
away before the <strong>generation</strong>. Even if this is done, one must still calculate with a deal <strong>of</strong> editing work after<br />
the <strong>generation</strong>.<br />
9.5 Summation<br />
If the experience gained in this project is summed up, it has turned out that the accuracy, by and large, is<br />
linear with the scale or the pixel size. It has not been possible to achieve an accuracy <strong>of</strong> 0.1‰ <strong>of</strong> the flight<br />
109
<strong>Automatic</strong> <strong>generation</strong> <strong>of</strong> <strong>elevation</strong> <strong>data</strong><br />
altitude, regardless <strong>of</strong> the scale or resolution <strong>of</strong> the images, if the <strong>elevation</strong> <strong>data</strong> is generated <strong>over</strong> all<br />
<strong>landscape</strong> types. The mesh size has an influence, as it has been found that there are lower limits to how<br />
small a mesh size the programme can handle in relation to the scale and resolution <strong>of</strong> the images. An experience<br />
gained in this project is that, if one wishes to use a mesh size smaller than 15 x 15 pixels per<br />
mesh size, calculation problems may arise or, it may even be impossible to calculate a grid. This corresponds<br />
to the sizes suggested by [Baltsavias, 1999]. If this minimum demand for number <strong>of</strong> pixels per<br />
mesh size is observed, the mesh size does not have any great influence, the accuracy is only reduced<br />
very little by the use <strong>of</strong> a large mesh size.<br />
A summation <strong>of</strong> the results for the <strong>landscape</strong> types showed that open, flat and hilly terrain can be included<br />
regardless <strong>of</strong> scale and resolution. The greatest deviations are found in the <strong>landscape</strong> types<br />
gravel pit and woods which is as expected. In general, the <strong>landscape</strong> types gravel pit and woods should<br />
be eliminated. As regards the housing estate area, it is surprising to see how well Match-T could handle<br />
this area, in particular for images in scale 1:15,000 and 1:25,000, as it was to be expected that this <strong>landscape</strong><br />
type would <strong>of</strong>fer larger deviations.<br />
These experiences are summed up, and the recommendation concerning minimum mesh size is indicated<br />
in table 9.2.<br />
Landscape type Image scale 1:5,000 Image scale 1:15,000 Image scale 1:25,000<br />
15μm 30μm 60μm 15μm 30μm 60μm 15μm 30μm 60μm<br />
Flat terrain + + + + + + + + +<br />
Gravel pit / / / / / / / / /<br />
Village / / / + + + + + +<br />
Hilly terrain + + + + + + + + +<br />
Woods / / / / / / / / /<br />
Mesh sizes (m 2 ) > 1.125 > 2.25 > 4.5 > 3.375 > 6.75 > 13.5 > 6.625 > 11.25 > 22,5<br />
Table 9.2: Recommendation <strong>of</strong> the <strong>landscape</strong> types <strong>over</strong> which <strong>generation</strong> can be done in different scales and resolutions,<br />
and the minimum mesh size. (+)=recommendation, (/)=no recommendation.<br />
9.6 Experiences and currentness<br />
If the experience gained is used in the preparation for a method <strong>of</strong> an updating routine <strong>of</strong> <strong>elevation</strong> <strong>data</strong>,<br />
so that the nationwide <strong>elevation</strong> model will keep its currentness, the following factors must be taken into<br />
consideration:<br />
110<br />
1. New <strong>elevation</strong> <strong>data</strong> for updating purposes, the accuracy must be nearly as good as the upcoming<br />
LIDAR model<br />
2. The burden <strong>of</strong> work must be minimised<br />
Re 1: If new <strong>elevation</strong> <strong>data</strong> is generated for updating purposes with an accuracy nearly as good as the<br />
LIDAR model, the accuracy must be better than 0.5m. In order to achieve this, problematic areas will<br />
have to be excluded, and gross errors in the remaining <strong>landscape</strong> types must be eliminated.<br />
Re. 2: The burden <strong>of</strong> work must be minimised which means that the localisation and elimination <strong>of</strong> problematic<br />
areas and elimination <strong>of</strong> gross errors in the <strong>landscape</strong> types included must be done automatically.<br />
Gravel pits and larger wooded areas can be found by means <strong>of</strong> map <strong>data</strong> (TOP10DK). The largest gross<br />
errors in the chosen <strong>landscape</strong> types may, for instance, be eliminated by use <strong>of</strong> the standard deviation<br />
determined between images in different resolutions <strong>over</strong> the same area as the gross error limit, as done<br />
in Chapter 8.<br />
The results achieved in this project, where a minimum <strong>of</strong> 15 x 15 pixels per mesh size is found in the calculation,<br />
where scales 1:15,000 or 1:25,000 are used, where gravel pit and woods are not included, and<br />
where the standard deviation as the gross error limit is used for elimination <strong>of</strong> the remaining gross errors,<br />
are shown in table 9.3.
9 Theory and practice<br />
Scale Resolution_Mesh size Mean RMSE (m) Stnd (m)<br />
15μm _5 m 0.07 m 0.12 m 0.10 m<br />
1:5,000 15μm _12.5 m 0.06 m 0.17 m 0.15 m<br />
15μm _25 m 0.04 m 0.47 m 0.46 m<br />
1:15,000<br />
15μm _12.5 m<br />
15μm _25 m<br />
0.53 m<br />
0.53 m<br />
0.64 m<br />
0.71 m<br />
0.36 m<br />
0.47 m<br />
Table 9.3: Accuracy for images in scales 1:5,000 and 1:15,000 without problematic <strong>landscape</strong> types, and with the<br />
largest gross errors eliminated.<br />
Table 9.3 shows that <strong>elevation</strong> <strong>data</strong> can be created by using images in scale 1:5,000 and 1:15.000 in<br />
which the accuracy (standard deviation, stnd) is better than 0.5 metre, even if there is an <strong>of</strong>fset <strong>of</strong> approx.<br />
0.5m. If the <strong>of</strong>fset is eliminated, really good results can be achieved.<br />
111
<strong>Automatic</strong> <strong>generation</strong> <strong>of</strong> <strong>elevation</strong> <strong>data</strong><br />
112
Conclusion and perspectives<br />
10 Conclusion and perspectives<br />
In this chapter, the project as a whole is summed up and a conclusion is reached on the basis <strong>of</strong> the results<br />
achieved. On the basis <strong>of</strong> these results, a recommendation is <strong>of</strong>fered as to how <strong>elevation</strong> <strong>data</strong> may<br />
be generated by automatic <strong>generation</strong>. There will be a brief formulation <strong>of</strong> the perspectives inherent in the<br />
ideas to improve accuracy, although these have not been tested in this project. There will also be a consideration<br />
<strong>of</strong> how the <strong>data</strong> fusion problem between old and new <strong>data</strong> can be solved. The chapter concludes<br />
with some perspectives and hopes for the future.<br />
10.1 Background<br />
The background/motivation for this project has been that the use <strong>of</strong> geo-spatial <strong>data</strong> has increased dramatically<br />
during the last <strong>generation</strong>. In this thesis, the focus has been on <strong>elevation</strong> <strong>data</strong>. In addition, the<br />
technological options will <strong>of</strong>fer existing and future users unimaginable possibilities for the use <strong>of</strong> <strong>elevation</strong><br />
<strong>data</strong>. Today, <strong>elevation</strong> <strong>data</strong> is increasingly used for a range <strong>of</strong> evaluation and analysis purposes. With this<br />
increase, end users have set new standards for the quality <strong>of</strong> <strong>data</strong> they are willing to accept, in relation to,<br />
the accuracy, density and viability <strong>of</strong> <strong>data</strong>, regarding how up to date it is.<br />
The goal was to analyse and value the accuracy which can be achieved by automatic <strong>generation</strong>, in consideration<br />
<strong>of</strong> scale and/or resolution <strong>of</strong> the digital images, the mesh size in which the grid is determined<br />
and to analyse the influence <strong>of</strong> the <strong>landscape</strong> types which the images c<strong>over</strong>s.<br />
For the acquisition and capture <strong>of</strong> <strong>elevation</strong> <strong>data</strong>, three methods have been discussed in the project: IF-<br />
SAR, LIDAR and automatic correlation <strong>of</strong> digital images. The choice was to carry out a detailed investigation<br />
on the basis <strong>of</strong> automatic correlation <strong>of</strong> digital images with the programme package Match-T.<br />
The specific purpose <strong>of</strong> this project has thus been to investigate, with what accuracy it is possible to capture<br />
<strong>elevation</strong> <strong>data</strong> with Match-T with a minimum <strong>of</strong> manual editing work. Several different investigations<br />
were carried out to determine the influence <strong>of</strong> the scale and resolution <strong>of</strong> the images on the accuracy, the<br />
influence <strong>of</strong> the mesh size from the automatically generated grid and the influence <strong>of</strong> the <strong>landscape</strong> type.<br />
These themes have been treated by others through time, but the reported results have been divergent.<br />
These divergences have formed the basis <strong>of</strong> the investigations in this project.<br />
A test area was chosen for use in the investigations. This test area included ordinary <strong>landscape</strong> types<br />
found in Denmark. A frame <strong>of</strong> reference was established with <strong>over</strong> 10,000 points. All results achieved in<br />
this project have been compared with this frame <strong>of</strong> reference.<br />
The automatically generated grids have all been generated with the standard set-up for Match-T. Before<br />
the detailed analysis was done, a pre-analysis <strong>of</strong> the generated grids was done, to see whether they included<br />
the required mesh size and were generated <strong>over</strong> the required area. The grids included the required<br />
mesh size, but none <strong>of</strong> the grids were generated <strong>over</strong> the required area, wherefore all the grids<br />
had to be trimmed before the detailed analysis could be done.<br />
10.2 The results achieved<br />
The investigations in this project have shown that it is possible to determine terrain <strong>data</strong> with an accuracy<br />
close to 10 cm by using automatic correlation by means <strong>of</strong> the Match-T programme.<br />
The investigations have also shown that a great deal <strong>of</strong> gross errors arise by the automatic <strong>generation</strong> <strong>of</strong><br />
<strong>elevation</strong>s. It is therefore necessary to identify and eliminate gross errors wholly or partly. Two types <strong>of</strong><br />
gross errors arise, the one created by problematic <strong>landscape</strong> types such as woods or areas with steep<br />
slopes, for instance, a gravel pit. The other type <strong>of</strong> gross error is correlation errors that arise for more diffuse<br />
reasons, such as lack <strong>of</strong> texture or the programme misunderstands information in the images etc.<br />
These errors are found in the <strong>landscape</strong> types flat and hilly and at the same time, they are difficult to anticipate<br />
and therefore to handle, as they cannot immediately be located.<br />
113
<strong>Automatic</strong> <strong>generation</strong> <strong>of</strong> <strong>elevation</strong> <strong>data</strong><br />
10.2.1 The scale and resolution <strong>of</strong> the images<br />
The results in this project show that scale and resolution have a linear influence on the accuracy, which<br />
means that a large scale and a high resolution give the best results. However, this is only valid if the<br />
gross errors are eliminated. Even after the gross errors were eliminated, it has not been possible to<br />
achieve the expected accuracy <strong>of</strong> 0.1‰ <strong>of</strong> the flight altitude, regardless <strong>of</strong> the scale or resolution <strong>of</strong> the<br />
images, when the <strong>elevation</strong> <strong>data</strong> is generated <strong>over</strong> all <strong>landscape</strong> types.<br />
10.2.2 The mesh size<br />
It has turned out in this project that there is a minimum limit to how small a mesh size the programme can<br />
handle in relation to the scale and resolution <strong>of</strong> the images. The lesson learned here is that if the requirement<br />
is to use a mesh size which is c<strong>over</strong>ed by less than 15 x 15 pixels per mesh, calculation problems<br />
may arise, or it may even be impossible to calculate a grid. If this minimum requirement for the<br />
number <strong>of</strong> pixels per mesh is observed, the mesh size does not have any great influence. The accuracy is<br />
only reduced by a fraction when using a large mesh size.<br />
10.2.3 The <strong>landscape</strong> type<br />
This project has shown that <strong>landscape</strong> type has a very large influence on accuracy. The <strong>landscape</strong> types<br />
that represent the greatest part <strong>of</strong> the <strong>Danish</strong> <strong>landscape</strong> are open fields which are either flat or hilly. The<br />
best results are achieved by <strong>generation</strong> <strong>over</strong> a flat terrain. The second best results are achieved in hilly<br />
terrain and villages, but only for images in medium or small scales. The investigations showed that woods<br />
and gravel pit <strong>landscape</strong>s give great problems, regardless <strong>of</strong> the scale or resolution <strong>of</strong> the images. This<br />
was expected. Likewise, the <strong>landscape</strong> type village gives problems for images in a large scale, such as<br />
1:5,000.<br />
10.2.4 Accuracy<br />
It has been mentioned in several sources that an accuracy <strong>of</strong> 0.1‰ <strong>of</strong> flight altitude or better can be<br />
achieved by automatic <strong>generation</strong> <strong>of</strong> <strong>elevation</strong> <strong>data</strong>. Investigations in this project show that when problem<br />
areas are excluded, and the gross errors in the remaining <strong>landscape</strong> types are eliminated, accuracies<br />
close to 0.1‰ <strong>of</strong> the flight altitude can be achieved.<br />
The best results are achieved by using images with a resolution <strong>of</strong> 15μm and <strong>over</strong> the <strong>landscape</strong> type<br />
open, flat terrain.<br />
10.2.5 Eliminated points<br />
If <strong>elevation</strong>s are generated <strong>over</strong> an area without regard to <strong>landscape</strong> type, it must calculated that approximately<br />
25% <strong>of</strong> the generated points must be eliminated due to their poor quality, and in individual<br />
cases, up to 45% <strong>of</strong> these points. If the <strong>generation</strong> is only done <strong>over</strong> open, flat or hilly terrain, up to 15%<br />
<strong>of</strong> the points must be eliminated.<br />
10.3 Recommendation<br />
In this project, three methods for automatic determination <strong>of</strong> <strong>elevation</strong> <strong>data</strong> have been discussed. The<br />
method IFSAR cannot be recommended for the determination <strong>of</strong> <strong>elevation</strong> <strong>data</strong> <strong>over</strong> Denmark. The accuracy<br />
achieved using this method will not contribute to a new and better <strong>elevation</strong> model than the existing<br />
one. The method LIDAR gives a much higher accuracy, but is expensive, and cannot therefore be immediately<br />
recommended either. <strong>Automatic</strong> <strong>generation</strong> <strong>of</strong> <strong>elevation</strong> <strong>data</strong> by use <strong>of</strong> Match-T can be recommended<br />
for the creation <strong>of</strong> <strong>elevation</strong> <strong>data</strong> for updating the laser scanned nationwide <strong>elevation</strong> model. This<br />
is based on the fact that the greater part <strong>of</strong> Denmark consists <strong>of</strong> flat or hilly terrain, where the method for<br />
automatic <strong>generation</strong> <strong>of</strong> <strong>elevation</strong>s functions well. If the gross error elimination method which is described<br />
in Chapter 8 is included, this accuracy may even be achieved with an acceptable manual editing effort.<br />
The process <strong>of</strong> <strong>elevation</strong> <strong>data</strong> capture could, for example, run parallel with the updating <strong>of</strong> other existing<br />
map material, for instance, the nationwide map TOP10DK. TOP10DK is updated today every 5 years, in<br />
the future every 3 years, from images at the scale <strong>of</strong> 1:25,000 which means that image material is already<br />
in existence and can be used for the <strong>generation</strong> <strong>of</strong> <strong>elevation</strong> <strong>data</strong>. For example, an operator could digitise<br />
maps in the daytime, and the computer could generate <strong>elevation</strong> <strong>data</strong> <strong>over</strong> the same images at night. The<br />
114
Conclusion and perspectives<br />
problematic areas must be eliminated before the <strong>generation</strong>, and to optimise the process, the elimination<br />
should be carried out automatically, for instance from TOP10DK <strong>data</strong>. The <strong>elevation</strong> determination <strong>of</strong><br />
these areas must then be carried out in other ways. This can be done by different means:<br />
� Manually, on an analytical instrument by an operator in the already orientated images<br />
� Supplemented by LIDAR <strong>data</strong> for these specific areas which means, however, that an extra<br />
flight must be done<br />
� Inclusion <strong>of</strong> existing <strong>elevation</strong> <strong>data</strong><br />
Not all <strong>landscape</strong> types have been represented in the test area. For example, a dense midtown area has<br />
not been included in this investigation. At this point in time a new national LIDAR <strong>elevation</strong> model will<br />
c<strong>over</strong> this area. With updating purposes in mind, the changes will be more pronounced in the outlying areas<br />
<strong>of</strong> towns and cities, where it is usual for industrial sites and housing estates to be developed.<br />
Should other problematic areas in open country, such as areas with woods and steep slopes be c<strong>over</strong>ed<br />
by means <strong>of</strong> an automatic survey, LIDAR would be the best alternative.<br />
10.4 Data fusion<br />
Only <strong>over</strong> “virgin land”, where no geo-spatial <strong>data</strong> already exists, does the combining <strong>of</strong> old <strong>data</strong> with new<br />
<strong>data</strong> not come into question. Over an old country like Denmark, ‘tons’ <strong>of</strong> geo-spatial <strong>data</strong>, including <strong>elevation</strong><br />
models, exist at different qualities. In this thesis, the method “<strong>data</strong> fusion” is chosen as the answer to<br />
how to mix existing <strong>elevation</strong> <strong>data</strong> with new measured <strong>elevation</strong> <strong>data</strong>.<br />
10.5 Perspectives<br />
During the work on this project, new ideas/perspectives have turned up which might be interesting to explore.<br />
On account <strong>of</strong> the scope <strong>of</strong> the project, these ideas have not been further investigated. Two ideas<br />
are mentioned here:<br />
� <strong>Automatic</strong> elimination <strong>of</strong> problematic areas<br />
� <strong>Automatic</strong> localisation and elimination <strong>of</strong> gross errors<br />
10.5.1 <strong>Automatic</strong> elimination <strong>of</strong> problematic areas<br />
The experience <strong>of</strong> this project has been that an automatic <strong>generation</strong> does not run well <strong>over</strong> <strong>over</strong>grown<br />
areas (woods), and areas with slopes (gravel pit). It has also turned out that the <strong>generation</strong> does not run<br />
well, if, for example, a farm reaches a certain size and is surrounded by trees. According to theory,<br />
Match-T should be able to eliminate solitary objects. The first step in this investigation would, therefore,<br />
be to confirm how well Match-T is able to eliminate solitary objects, and at what size <strong>of</strong> area, Match-T is<br />
no longer able to cope on its own.<br />
The obvious solution would be to investigate whether it is possible to automatically eliminate areas such<br />
as woods, gravel pits or other areas with slopes, dense urban areas etc. Likewise to investigate the possibility<br />
<strong>of</strong> eliminating smaller mixed areas, such as farms surrounded by a group <strong>of</strong> trees, on the basis <strong>of</strong><br />
the existing map material, before an automatic <strong>generation</strong> is done. Denmark is c<strong>over</strong>ed by nationwide<br />
maps built up geologically, and wooded areas <strong>of</strong> a certain size are registered as coherent objects. The<br />
same goes for urban mid-town areas. Furthermore, all buildings <strong>over</strong> a certain size are registered. It<br />
would, therefore, be interesting to investigate whether it is possible to eliminate problem areas automatically<br />
in the images, before an automatic <strong>generation</strong> <strong>of</strong> <strong>elevation</strong> <strong>data</strong> is done.<br />
This is obviously a good idea, as this <strong>data</strong> already exists, but the necessarily limited scope <strong>of</strong> this project<br />
has made it impossible to include this theme in the investigations.<br />
115
<strong>Automatic</strong> <strong>generation</strong> <strong>of</strong> <strong>elevation</strong> <strong>data</strong><br />
10.5.2 <strong>Automatic</strong> localisation and elimination <strong>of</strong> gross errors<br />
Another idea for further investigation is how gross errors can be eliminated individually by use <strong>of</strong> the existing<br />
image material. If there is not, as in the case <strong>of</strong> this project, an existing <strong>elevation</strong> model or other<br />
<strong>data</strong> material, it is necessary to localise and eliminate the gross errors in other ways.<br />
It has been found in this project that the smallest number <strong>of</strong> points is eliminated by the use <strong>of</strong> a low resolution,<br />
and at the same time the accuracy is the poorest. This gave the idea <strong>of</strong> determining the standard<br />
deviation between the three image resolutions which existed in this project. However, this is a difficult and<br />
lengthy process. The optimal solution would be if this process could be done as an internal process in<br />
Match-T. The process is carried out by means <strong>of</strong> the three last levels in the pyramid.<br />
A poorer accuracy is achieved by using images in resolution 60μm, but the investigations show clearly<br />
that there are also far fewer gross errors in this resolution. A higher resolution gives a greater degree <strong>of</strong><br />
detail in the images, and thus a better accuracy, but also far more gross errors.<br />
Instead <strong>of</strong> repeating the process in the project, where a standard deviation is calculated between the results<br />
from the 15μm, 30μm and 60μm images, this is done <strong>over</strong> the results from the three last levels in the<br />
pyramid process. A standard deviation for the Z-co-ordinates is determined between the grid points with<br />
the same planimetric co-ordinates in the last level. If this standard deviation is larger than 0.4‰ <strong>of</strong> the<br />
flight altitude, this point is cut out. The result is a grid with holes. There are two possibilities <strong>of</strong> filling out<br />
these holes:<br />
116<br />
1. The missing grid points are interpolated from the surrounding grid points<br />
2. The missing grid points are determined manually<br />
See figure 10.1<br />
DEM-pyramid<br />
The standard<br />
deviation (stnd)<br />
is calculated<br />
Stnd > 0.4‰ <strong>of</strong><br />
the flight altitude<br />
cut out<br />
pyramid level 0<br />
Manual<br />
measurement <br />
Interpolation<br />
Figure 10.1: The course <strong>of</strong> process in an investigation where generated <strong>elevation</strong> <strong>data</strong> from three levels in the pyramid<br />
are used.<br />
10.6 Outlook for future work in this field<br />
This project has given the author a deep insight into the methods for automatic determination <strong>of</strong> <strong>elevation</strong><br />
<strong>data</strong> and, in particular, into the methods for automatic correlation.<br />
Firstly, the author has had to accept that the pr<strong>over</strong>b In theory, theory and practice are the same; in practice,<br />
they never are! is true.<br />
The author would also like to include some words from Anton Schenk [Schenk, 1996] Even though the<br />
words are <strong>over</strong> 10 years old, the author still believes that they are valid, even today. ”Ever since computers<br />
became available, researchers have tried to generate DEMs automatically. Despite considerable<br />
progress, the problem is still not entirely solved. Consider a large-scale, urban area, for example. No sys-
Conclusion and perspectives<br />
tem exists today which would generate a DEM automatically. The problem has been underestimated, like<br />
so many other attempts, which try to mimic the mental faculty <strong>of</strong> seeing. What a human operator solves<br />
without conscious effort does not mean the task is easy.<br />
With automatic <strong>generation</strong> <strong>of</strong> DEMs, one would expect that the computer performs the same task that is<br />
usually assigned to an operator. Today’s systems are not autonomous and will not be in the foreseeable<br />
future.<br />
A computer can calculate, estimate and classify in accordance with the algorithms and calculation methods<br />
it is predisposed to. These types <strong>of</strong> operations it carries out precisely and tirelessly, but it cannot interpret<br />
image <strong>data</strong>, and can only recognise patterns in images to the extent that it has been programmed<br />
for. On the contrary, the human eye and sight can spot and recognise large and complex patterns which<br />
are created by physical structures, <strong>landscape</strong>s or urban areas, <strong>of</strong> which we have concrete or general experience<br />
in the physical world. A human being can, without problems, recognise an urban area, a golf<br />
course or a wood in a photo. A computer will only perceive the difference between the wood and the surrounding<br />
open country as a grey level difference which it has been trained to perceive as a shift in the terrain.<br />
Therefore, the “automatic” in “automatic <strong>generation</strong>”, should be taken with a grain <strong>of</strong> salt, and it should not<br />
be expected that automatic procedures can run without problems. For the most part, there will be several<br />
gross errors, and the final <strong>elevation</strong>s can only be determined after subsequent editing work.<br />
There is hardly any doubt that the work towards a more automated <strong>generation</strong> <strong>of</strong> <strong>elevation</strong>s has to continue.<br />
Among other things, through a refining <strong>of</strong> the mathematical descriptions which make the computer<br />
calculations possible. It is hoped that this project has contributed to the general understanding <strong>of</strong> the<br />
complexity that characterises work with automatic <strong>generation</strong>. And perhaps in that way opened up new<br />
vistas for future work within this field. It is the understanding <strong>of</strong> the author that the investigation and results<br />
have contributed to confirm and solve some <strong>of</strong> the existing problems, and that the project has thus<br />
brought us a step higher up on the ladder towards automatic <strong>generation</strong> with less subsequent editing.<br />
Furthermore, it is hoped that interest in further investigation has been aroused, in one or both <strong>of</strong> the ideas<br />
put forward in the section on perspectives, or a combination <strong>of</strong> both as inspiration for the future.<br />
117
References<br />
References<br />
Ackermann, F., (1984): Digital image correlation: Performance and potential application in photogrammetry,<br />
Photogrammetric Record, vol. 11(64), Octorber, pp. 429 – 439.<br />
Ackermann, F., (1992): <strong>Automatic</strong> <strong>generation</strong> <strong>of</strong> digital <strong>elevation</strong> models.<br />
Ackermann, F. and Schneider, W., (1992): Experience with Automated DEM Generation. Int. Archives <strong>of</strong><br />
Photogrammetry and Remote Sensing, ISPRS Congress 1992, Washington, Vol. XXIX, part B4, pp. 986 -<br />
989.<br />
Ackermann, F., (1996): Techniques and strategies for DEM <strong>generation</strong>. Digital Photogrammetry, An Addendum<br />
to the Manual <strong>of</strong> Photogrammetry. Published by American Society for Photogrammetry and Remote<br />
Sensing. Cliff Greve (ed.) pp. 135 – 141.<br />
Ackermann, F., (1999): Airborne laser scanning – present status and future expectations, ISPRS Journal<br />
<strong>of</strong> Photogrammetry & Remote Sensing 54 (1999) pp. 64 - 67.<br />
ASHTECH, (1992): ASHTECH FILLNET User’s manual, Ashtech TM Document number 600089, Ashtech,<br />
Inc. 1170 Kifer Road, Sunnyvale, CA 94086, USA.<br />
Bacher, U., (1998): Experimental studies into automated DTM <strong>generation</strong> on the DPW770, Universität der<br />
Bundeswehr Muenchen. GIS-Between Visions and Application, ISPRS Commission Symposium, volume<br />
32 Part 4, sep. 7 – 10, pp. 35 - 41.<br />
Baltsavias, E. P., (1991): Multiphoto Geometrically Constrained matching, Institut für Geodäsie und Photogrammetrie<br />
and der Eidg. Technischen Hochschule Zürich, ETH Hönggerberg, Zürich.<br />
Baltsavias, E. P., (1999): A comparison between photogrammetry and laser scanning, Institute <strong>of</strong> Geodesy<br />
and Photogrammetry, Swiss Federal Institute <strong>of</strong> Technology, ETH-Hoenggerberg, CH-8093 Zurich,<br />
Switzerland, ISPRS Journal <strong>of</strong> Photogrammetry & Remote Sensing 54 (1999) pp. 83 - 94.<br />
Binzer, J. og Tscherning, C. C., Geodætisk Institut, Frederiksen, L. og Krüger, J. C., Matrikeldirektoratet,<br />
(1982): Etablering af en digital højde<strong>data</strong>base for Danmark, Landinspektøren, 5. hæfte, 1982, udgivet af<br />
Den danske Landinspektørforening. (<strong>Danish</strong> Journal for Mapping and Land-use), pp. 289 - 297.<br />
Brande-Lavridsen, O., (1987): Theory/Practice about a <strong>Danish</strong> DEM. ISPRS, proceedings <strong>of</strong> the international<br />
colloquium PROGRESS IN TERRAIN MODELLING, Technical University <strong>of</strong> Denmark, 1987, pp. 49<br />
- 54.<br />
Brande-Lavridsen, O., (1993): Fotogrammetri, 9. udgave, Laboratoriet for Fotogrammetri og Landmåling,<br />
Aalborg Universitetscenter, Danmark.<br />
Brenner, C. and Haala, N., (1999): Rapid production <strong>of</strong> virtual reality city models, GIS, Geo-<br />
Informationssysteme, Zeitschrift für raumbezogene Informationen und Entscheidungen, volume 12, 2/99,<br />
Wichmann, pp. 22 - 28.<br />
Cederholm, P., (1995): Øvelse i detailmåling med GPS/PNAV, Institut for Samfundsudvikling og Planlægning,<br />
Laboratoriet for Fotogrammetri og Landmåling, Aalborg Universitet, Danmark.<br />
Dahl, P. H. S., Lassen, A. G. og Christensen, K. R., (1995): Ajourføring af tekniske kort med monoplotning,<br />
9. Sem., GeoInformatik, Aalborg Universitetscenter, Danmark.<br />
119
<strong>Automatic</strong> <strong>generation</strong> <strong>of</strong> <strong>elevation</strong> <strong>data</strong><br />
Ebner, H. and Reiss P., (1978): Height interpolation by the Method <strong>of</strong> Finite Elements. Proc. DTM Symp.<br />
St. Louis, pp. 241-254<br />
Eggers, O., Ellegaard, S., Hølledig, L. og Norvin, P., (1989): Fra kurveplaner til digital højdemodel, Afgangsprojekt<br />
på landinspektørstudiet, Aalborg Universitet, Aalborg Universitetsbibliotek.<br />
Eide, O. R. og Mardal L., (1993): Digital Fotogrammetri, Test av Intergraph’s Image Station, Diploma<br />
Thesis, Ås, Norway. Unpublished.<br />
Elachi, C., (1987): Introduction to the physics and techniques <strong>of</strong> remote sensing, California Institute <strong>of</strong><br />
Technology, Earth and Space Sciences Divisions, Jet Propulsion Laboratory, Pasadena, California, editor<br />
Jin Au Kong, A Wiley-Interscience Publication John Wikey & Sons.<br />
Favey, E., Pateraki, M., Baltsavias, E., Bauder, A. and Bösch, H., (2000): Surface modelling for alpine<br />
glacier monitoring by airborne laser scanning and digital photogrammetry, International Archives <strong>of</strong> Photogrammetry<br />
and Remote Sensing. Vol. XXXIII, Part B4, Amsterdam 2000, pp. 269 - 277.<br />
Frederiksen P., (1987): A digital <strong>elevation</strong> model for Radio Communication. ISPRS, proceedings <strong>of</strong> the<br />
international colloquium PROGRESS IN TERRAIN MODELLING, Technical University <strong>of</strong> Denmark, 1987,<br />
pp. 127-133.<br />
Frederiksen, P., (1993): Instituttet for Landmåling og Fotogrammetri, DTH: Digitale højde<strong>data</strong>baser i<br />
Danmark, Landinspektøren, nr. 2-93, 36. Bind, 102 årgang, 1993. Udgivet af Den danske Landinspektørforening<br />
(<strong>Danish</strong> Journal for mapping and land-use).<br />
Förstner, W., (1986): A feature based correspondence algorithm for image matching, International Archives<br />
<strong>of</strong> Photogrammetry and Remote Sensing, vol. 26, part 3 Rovaniemi, 1986.<br />
Förstner, W., and Gülch, E., (1987): A fast operator for detection and precise location <strong>of</strong> distinct points,<br />
corners and centres <strong>of</strong> circular features, University Stuttgart, Institute <strong>of</strong> Photogrammetry, Proceedings<br />
ISPRS Intercommission Conference on Fast Processing <strong>of</strong> Photogrammetric Data, Interlaken, Switzerland,<br />
1987, pp. 281 - 305.<br />
Förstner W. (1989): A Feature Based Correspondence Algorithm for Image Matching and Least Squares<br />
Matching. International Archives <strong>of</strong> Photogrammetry and Remote Sensing, Vol. 26, Part 3, Rovanieme,<br />
1989.<br />
Förstner, W., (1991): Statistische verfahren für die automatische Bildanalyse und ihre Bewertung bei der<br />
Objekterkennung und –vermessung, Deutsche Geodätische Kommission bie der Bayerischen Akademie<br />
der Wissenschaften, Dissertationen, Heft nr. 370, München 1991, verlag der Bayerishen Akademie der<br />
Wissenschaften en Kommission bei der C. H. Beck’schen Verlagsbuchhandlung München.<br />
Förstner, W., (1993): Image Matching, chapter 16 in Computer and Robot Vision, volume II, edited by R.<br />
Haralick and L. Shapiro, University <strong>of</strong> Washington, printed by Addison-Wesley publishing company.<br />
Geodætisk Institut (1978): Geodætisk Institut 1928-1978, København, red. Sørensen, E., Arentzen, E. S.,<br />
trykt ved Geodætisk Institut 1978.<br />
Geodæsidivisionen, (1992): Signalerings-vejledning, Kort- og Matrikelstyrelsen, Rentemestervej 8, (DK)<br />
2400 København NV.<br />
Hahn, M., (1989): <strong>Automatic</strong> measurement <strong>of</strong> digital Terrain Models by means <strong>of</strong> Image Matching Techniques.<br />
Proceedings <strong>of</strong> 42 nd Photogrammetric Week, Stuttgart, pp. 141 - 151.<br />
120
References<br />
Hansen, M., Mølgaard, M. S. og Overby, S., Weje, P. N., (1995): Stråleudjævningsprogrammet BINGO –<br />
anvendt på statue. Aalborg Universitet, Landinspektøruddannelsen, 8. semester, Teknisk måling, Gruppe<br />
TM2 – Juni 1995.<br />
Haralick, R. M. and Shapiro, L. G. (1992): Computer and Robot Vision, volume 1, University <strong>of</strong> Washington,<br />
printed by Addison-Wesley Publishing Company.<br />
Heipke, C., (1996): Overview <strong>of</strong> image matching techniques, European Organization for experimental<br />
Photogrammetric Research, proceedings <strong>of</strong> the OEEPE- WORKSHOP on application <strong>of</strong> digital photogrammetric<br />
workstations, <strong>of</strong>ficial publication No 33, Lausanne, 1996, editor O. Kölbl, pp. 173 – 189.<br />
Heuchel, T. (2005): Experience in Applying Matching Techniques Using Images from Digital Cameras.<br />
Proceedings <strong>of</strong> the 50th Photogrammetric Week, Stuttgart. Dieter Fritsch (eds.). Wichman Verlag Heidelberg,<br />
pp. 181-188.<br />
Holm, M., Permes, E., Andersson, K., and Vuorela, A., (1995): A nation wide automatic satellite image<br />
registration system, SPIE Aerosense ´95, Conference on integrating Photogrammetric Techniques with<br />
scene analysis and machine vision II, Orlando, Florida, USA, 17 – 21 April 1995, SPIE vol. 2486 – 18, pp.<br />
156 – 167.<br />
Hyyppä, J., Hyyppä, H. and Ruppert, G., (2000): <strong>Automatic</strong> derivation <strong>of</strong> features related to forest stand<br />
attributes using laser scanner, International Archives <strong>of</strong> Photogrammetry and Remote Sensing. Vol.<br />
XXXIII, Part B3, Amsterdam 2000, pp. 421 - 428.<br />
Intergraph (1994): ImageStation Match-T (ISMT) User’s guide, appendix B: Mathematical Model for DTM<br />
Generation.<br />
Inpho GmbH, Stuttgart, (1994): Match-T, <strong>Automatic</strong> DEM Generation, User Manual, Version 1.3.1.<br />
Inpho Stuttgart, (1995): Match-T, <strong>Automatic</strong> DEM – Generation, Tutorial, Inpho Stuttgart, Photogrammetric<br />
Information Processing, Smaragdweg 1, D-70174 Stuttgart, Germany.<br />
Johansen, N. P., (1927): Danmarks Topografiska Kartläggning, Foredrag holdt i “Kartografiska Sällskapet”<br />
i Stockholm 7. marts 1927, Stockholm 1927, A. Börtzells Tryckeri A-B.<br />
Kleusberg, A. and Klaedtke, H-G., (1999): Accuracy assessment <strong>of</strong> a digital height model derived form<br />
airborne synthetic aperture radar measurements. Proceedings <strong>of</strong> the 47th Photogrammetric Week, Stuttgart.<br />
Fritsch/Spiller (eds.). Wichman Verlag Heidelberg, pp. 139-143.<br />
Kobrick, M., (2006): On the Toes <strong>of</strong> Giants – How SRTM was Born. Photogrammetric Engineering and<br />
Remote Sensing, March 2006, Volume 72, Number 3, pp 207-210.<br />
Kort- og Matrikelstyrelsen, (1989): Danmarks Geografiske Referencenet, Brugervejledning, Matrikelstyrelsen,<br />
Rentemestervej 8, (DK) 2400 København NV.<br />
Kort- og Matrikelstyrelsen, Geodæsidivisionen, (1992): Signalerings-Vejledning, Kort- og Matrikelstyrelsen,<br />
Rentemestervej 8, (DK) 2400 København NV.<br />
KMS, (2005): Forslag om etablering af en nøjagtig højdemodel <strong>over</strong> Danmark, note.<br />
Krarup, T., Kubik, K. and Juhl, J., (1980): Goetterdaemmerung <strong>over</strong> least squares adjustment. Int Arch<br />
Photogram XXIII, Part B3, Commission III, Proc. 14 th Congress <strong>of</strong> ISP, Hamburg, 1980, pp. 369-378.<br />
Kraus, K., (1990): Fernerkundung, Band 2, Auswertung photographischer und digitaler bilder, Institut für<br />
photogrammetrie und fernerkundung der Technischen Universität Wien, Ferd. Dümmlers verlag, Bonn.<br />
121
<strong>Automatic</strong> <strong>generation</strong> <strong>of</strong> <strong>elevation</strong> <strong>data</strong><br />
Kraus, K., (1993): Photogrammetry, Volume 1, Fundamentals and Standard Processes, Institute for Photogrammetry,<br />
Vienna University <strong>of</strong> Technology, contributions by P. Waldhäusl, translated by P. Stewardson,<br />
Ferd. Dümmlers verlag, Bonn.<br />
Kraus, K., (1997): Photogrammetry, Volume 2, Advanced Methods and Applications, Institute for Photogrammetry<br />
and Remote Sensing, Vienna University <strong>of</strong> Technology, contributions by J. Jansa and H.<br />
Kager, translated by P. Stewardson, Ferd. Dümmlers verlag, Bonn.<br />
Kruck, E., (1995): BINGO – User’s Manual, Hann<strong>over</strong> 1995.<br />
Krzystek, P., (1991): Fully automatic measurement <strong>of</strong> digital <strong>elevation</strong> models. Proceedings <strong>of</strong> the 43rd<br />
Photogrammetric Week, Stuttgart. Ackermann/Plietker (ed.). pp. 203 – 214.<br />
Krzystek, P. and Wild, D., (1992) (a): Experimental accuracy analysis <strong>of</strong> automatically measured digital<br />
terrain models. Robust Computer Vision. Quality <strong>of</strong> Vision Algorithms. Förstner/Ruwiedel (ed), Wichmann<br />
Verlag, Karlsruhe, pp. 372 - 390.<br />
Krzystek, P. and Ackermann, F., (1995): New investigations into the practical performance <strong>of</strong> automatic<br />
DEM <strong>generation</strong>, Technical Papers ACSM/ASPRA Annual Convention and Exposition, Charlotte, Feb.<br />
27 th - March 2 nd , 1995, vol. 2 pp. 488 - 499.<br />
Krzystek, P. and Wild, D., (1995): <strong>Automatic</strong> Generation <strong>of</strong> Elevation Models. Second Course on Digital<br />
Photogrammetry, University Bonn, Institute for Photogrammetry and Remote Sensing and LVA NRW<br />
Krzystek, P., (1995): <strong>Automatic</strong> Generation <strong>of</strong> Elevation Models. Third Course in Digital Photogrammetry,<br />
University Bonn, Institute for Photogrammetry and Remote Sensing and LVA NRW<br />
Larsen, J. N., (1996): Fra højdemodel mod terrænmodel, Forbedring af Digitale Højdemodeller ved tilføjelse<br />
af ekstra <strong>data</strong>, Afgangsprojekt, Institut for Planlægning, Danmarks Tekniske Universitet, Faggruppe<br />
Landmåling.<br />
Larsen, J. N., (1998): Improving a DEM by integrating <strong>data</strong>, ISPRS volume XXXII, part 2, Commission II,<br />
proceedings <strong>of</strong> the commission II symposium, Data integration: Systems and techniques, Cambridge, UK,<br />
pp. 177 - 183.<br />
Lemmens, M. J. P. M., (1988): A Survey on stereo Matching Techniques, Proceedings <strong>of</strong> 16 th ISPRSC. In<br />
IAPRS, vol. 27 / B8, pp. 11 – 23.<br />
Lohr, U., (1999): High Resolution Laserscanning, not only for 3D-City Models. Proceedings <strong>of</strong> the 47th<br />
Photogrammetric Week, Stuttgart, Fritsch/Spiller (eds.). Wichman Verlag Heidelberg, pp. 133-138.<br />
Lohr, U. und Schaller, J., (1999): Trassenbefliegungen mit dem TopoSys Laserscanner, GIS, Geo-<br />
Informationssysteme, Zeitschrift für raumbezogene Informationen und Entscheidungen, volume 12, 2/99,<br />
Wichmann, pp. 3 - 5.<br />
McIntosh, K., Krupnik, A. and Schenk, T., (2000): Improvement <strong>of</strong> automatic DSM <strong>generation</strong> <strong>over</strong> urban<br />
areas using airborne laser scanner <strong>data</strong>, International Archives <strong>of</strong> Photogrammetry and Remote Sensing.<br />
Vol. XXXIII, Part B3, Amsterdam 2000, pp. 563 - 570.<br />
Mercer, B., (2001): Comtining LIDAR and IfSAR: What can you expect? Proceedings <strong>of</strong> the 48th Photogrammetric<br />
Week 01’, Stuttgart, Fritsch/Spiller (eds.). Wichman Verlag Heidelberg, pp. 227-237.<br />
Nilsen, B., (1998): Nøyaktighet av automatisk genererte digitale terrengmodeller, Kart og Plan 1-98, pp.<br />
35 – 44.<br />
122
References<br />
Nørgård, P., (2001): Præcisionshøjdemodeller – med luftbåren laserskanner, Geologisk Nyt 3/01, pp. 26 -<br />
27.<br />
Petzold, B. and Axelsson, P., (2000): Results <strong>of</strong> the OEEPE WG on laser <strong>data</strong> acquisition, International<br />
Archives <strong>of</strong> Photogrammetry and Remote Sensing. Vol. XXXIII, Part B3, Amsterdam 2000, pp. 718 - 723.<br />
Rasmussen, J. K. og Flatman, A. C., (2000): Laserskanning - En kvalitetsvurdering, afgangsprojekt fra<br />
Aalborg Universitet, Landinspektøruddannelse, Fibigerstræde 11, Aalborg, Danmark.<br />
Seyfert, E., (1995): Erste Erfahrungen bei der automatischen Generierung von digitalen Höhenmodellen<br />
in Siedlungsgebieten. Proceedings <strong>of</strong> the 45th Photogrammetric Week, Stuttgart. Fritsch/Hobbie (ed.).<br />
Wichman Verlag. pp. 269 – 276.<br />
Schenk, A. F., (1996): <strong>Automatic</strong> Generation <strong>of</strong> DEM’s, Digital Photogrammetry, An addendum to the<br />
Manual <strong>of</strong> Photogrammetry, Published by American Society for Photogrammetry and Remote Sensing,<br />
edited by Cliff Greve, pp. 145 – 150.<br />
Schenk, T., Li, J.-C., and Toth, C., (1991): Towards an Autonomous System for Orienteering Digital<br />
Stereopairs, Department <strong>of</strong> Geodetic Science and Surveying, The Ohio State University, Columbus, Photogrammetric<br />
Engineering and Remote Sensing, vol. 57, no. 8, August 1991, pp. 1057 – 1064.<br />
Skriver, H., Dall, J. og Madsen, S, N., (1999): Kortlægning med billeddannende radar, Institut for Elektromagnetiske<br />
Systemer, Danmarks Tekniske Universitet, Landinspektøren Tidsskrift for kortlægning og<br />
areal forvaltning, No. 2-99, pp. 336 - 341.<br />
Stoker, J. M., Greenlee, S. K., Gesch, D. B. and Menig, J. C. (2006): Click: The new USGS Center for Lidar<br />
Information Coordination and Knowledge. Photogrammetric Engineering and Remote Sensing, June<br />
2006, Volume 72, Number 6, pp 613-616.<br />
Thorpe, J. A. and Schickler, W., (1996): New automated procedures for creating large scale digital ortohophotography<br />
in urban areas, ISPRS Congress 1996, Vienna, International Archives <strong>of</strong> Photogrammetry<br />
and Remote Sensing, Vol. XXXI, part B4, pp. 868 – 873.<br />
Vosselman, G., (2000): Slope based filtering <strong>of</strong> laser altimetry <strong>data</strong>, Working Group III/2, International Archives<br />
<strong>of</strong> Photogrammetry and Remote Sensing. Vol. XXXIII, Part B3, Amsterdam 2000, pp. 935 - 942.<br />
Wehr, A. und Hug, C., (1999): Topographische Geländeaufnahme mit ScaLARS, GIS, Geo-<br />
Informationssysteme, Zeitschrift für raumbezogene Informationen und Entscheidungen, volume 12, 2/99,<br />
Wichmann, pp. 6 - 11.<br />
Wehr, A. and Lohr, U., (1999): Airborne laser scanning – an introduction and <strong>over</strong>view, ISPRS Journal <strong>of</strong><br />
Photogrammetry & Remote Sensing 54 (1999) pp. 68 - 82.<br />
Werner, M. (2001): Status <strong>of</strong> the SRTM <strong>data</strong> processing: when will the world-wide 30m DTM <strong>data</strong> be<br />
available? Proceedings <strong>of</strong> the 48th Photogrammetric Week 01’, Stuttgart, Fritsch/Spiller (eds.). Wichman<br />
Verlag Heidelberg, pp. 159-165.<br />
Wever, C., (1999): Laserscannermessungen – ein Verfahren setzt sich durch, GIS, Geo-<br />
Informationssysteme, Zeitschrift für raumbezogene Informationen und Entscheidungen, volume 12, 2/99,<br />
Wichmann, pp. 12 - 17.<br />
Wever, C. and Lindenberger, J., (1999): Experiences <strong>of</strong> 10 years laser scanning. Proceedings <strong>of</strong> the 47th<br />
Photogrammetric Week, Stuttgart, Fritsch/Spiller (eds.). Wichman Verlag Heidelberg, pp. 125-132.<br />
123
<strong>Automatic</strong> <strong>generation</strong> <strong>of</strong> <strong>elevation</strong> <strong>data</strong><br />
Zhang, B. and Miller, S., (1997): Adaptive automatic terrain extraction, Proceedings <strong>of</strong> SPIE – The International<br />
society for Optical Engineering, Integrating Photogrammetric Techniques with Scene analysis<br />
and Machine Vision III, volume 3072, Orlando, Florida, pp. 27 – 36.<br />
Aarestrup, M. og Villadsen S. S. (1994): Koordinatsystemer i Danmark, GIS i Danmark, red. ved Balstrøm,<br />
T. et al., 1. udgave, 1. oplag, Teknisk Forlag A/S,1994, pp 31-43.<br />
124
Acknowledgement<br />
Acknowledgement<br />
This project original started at Aalborg University under the supervision <strong>of</strong> Pr<strong>of</strong>. J. Höhle. The project continued<br />
in my spare time and in co-operation with the National Survey and Cadastre in Copenhagen and<br />
Institut für Photogrammetrie (ifp) at Stuttgart University. Special thanks go to Pr<strong>of</strong>. J. Höhle for originating<br />
the idea and helping with starting the project, also thanks to the National Survey and Cadastre for the<br />
time I have been given to work on the project, and to Pr<strong>of</strong>. D. Fritsch for his interest and support during<br />
the course <strong>of</strong> my time at ifp and later comments and discussions.<br />
Special thanks go to Associate Pr<strong>of</strong>essors Jens Juhl and Poul Frederiksen for their interest, and the<br />
countless discussions which have spread much light at difficult times. Also thanks for the loan <strong>of</strong> the<br />
GeoCAD programme.<br />
Thanks to all ifp colleagues in Stuttgart for the time I spent with you. You made my stay in Stuttgart interesting<br />
both on and <strong>of</strong>f campus. Also thanks to Inpho colleagues Frank Petran and Dietmar Wild for our<br />
good discussions about pr<strong>of</strong>essional as well as cultural life.<br />
During the long course <strong>of</strong> this project, I have had much support and felt a large degree <strong>of</strong> commitment<br />
from my family, the close as well as the larger one, and from friends and acquaintances. Special thanks<br />
go to my husband Ian and my brother Kaj for their unstinting support during the years, humanly as well as<br />
pr<strong>of</strong>essionally. Also special thanks to my parents for their hospitality that made it possible to work at their<br />
home, while the two <strong>of</strong> you and my brother Ole looked after the girls.<br />
Also thanks to Ina, Mette, Marie, Bjarke, Stefan and Keld.<br />
Thanks to all <strong>of</strong> you who have not been mentioned in this acknowledgement, but who have, during the<br />
years, helped or shown pr<strong>of</strong>essional interest. I remember your help and interest in the project and I am<br />
deeply grateful.<br />
Ishøj June 2008<br />
Marianne Wind<br />
125
<strong>Automatic</strong> <strong>generation</strong> <strong>of</strong> <strong>elevation</strong> <strong>data</strong><br />
126
Appendices<br />
Ph D-Thesis<br />
Marianne Wind<br />
Aalborg University<br />
2008
Appendices<br />
Version 1.1<br />
Appendix A: Correlation techniques<br />
Appendix B: The <strong>data</strong> material<br />
Appendix C: Analysis programme<br />
Appendix D: Editing programme<br />
Appendix E: Bundle adjustment<br />
Appendix F: Graphic online/<strong>of</strong>fline<br />
Appendix G: Sizes <strong>of</strong> grid files<br />
Appendix H: Code specification<br />
Appendix I: Analysis calculations<br />
Appendices<br />
Appendix J: Code specification and error arrows<br />
Appendix K: Orthophoto and error arrows<br />
Appendix L: STND used as threshold<br />
129
Table <strong>of</strong> contents<br />
Table <strong>of</strong> contents<br />
Appendix A: Image matching techniques<br />
130<br />
A.1 ABM and FBM ................................................................................................................................ 135<br />
A.1.1 Area based matching ............................................................................................................... 136<br />
A.1.1.1 Correlation at pixel level .................................................................................................... 136<br />
A.1.1.1.1 Correlation coefficient ................................................................................................. 136<br />
A.1.1.1.2 Mean square............................................................................................................... 137<br />
A.1.1.2 Correlation at sub pixel level ............................................................................................. 137<br />
A.1.1.2.1 Fitting in <strong>of</strong> a polynomial ............................................................................................. 137<br />
A.1.1.2.2 Least squares matching.............................................................................................. 138<br />
A.1.2 Feature based matching .......................................................................................................... 140<br />
A.1.2.1 Area ................................................................................................................................... 140<br />
A.1.2.2 Line.................................................................................................................................... 140<br />
A.1.2.3 Points................................................................................................................................. 141<br />
A.1.2.3.1 The Moravec operator ................................................................................................ 141<br />
A.1.2.3.2 The Förstner operator................................................................................................. 143<br />
A.1.2.3.3 Determination <strong>of</strong> intersections, corner and end points ............................................... 143<br />
A.1.2.3.4 Determination <strong>of</strong> circle points ..................................................................................... 146<br />
A.1.2.3.5 Quality evaluation <strong>of</strong> the characteristic points ............................................................ 147<br />
A.1.2.4 The principles <strong>of</strong> FBM ....................................................................................................... 147<br />
A.1.3 Epipolar geometry .................................................................................................................... 148<br />
A.1.3.1 Resampling........................................................................................................................ 149<br />
A.1.3.2 Normalisation and resampling........................................................................................... 150<br />
A.1.3.3 Correlation in one dimension............................................................................................. 150<br />
A.1.3.4 ABM in one dimension ...................................................................................................... 150<br />
A.1.4 FBM in one dimension ............................................................................................................. 151<br />
A.1.5 Correlation in one dimension ‘on the fly’ .................................................................................. 151<br />
A.1.6 Image pyramid ......................................................................................................................... 151<br />
A.1.7 Object pyramid ......................................................................................................................... 152<br />
A.1.8 Pros and cons .......................................................................................................................... 153<br />
Appendix B: The <strong>data</strong> material<br />
B.1 Description <strong>of</strong> the <strong>data</strong> material...................................................................................................... 157<br />
B.1.1 Test area .................................................................................................................................. 157<br />
B.1.2 Aerial photos ............................................................................................................................ 158<br />
B.1.3 Control points ........................................................................................................................... 159<br />
B.1.4 Selection <strong>of</strong> models and area types......................................................................................... 162<br />
B.1.5 Analytically measured points <strong>of</strong> reference ............................................................................... 164<br />
B.2 Data capture ................................................................................................................................... 165<br />
B.2.1 Capture <strong>of</strong> control points.......................................................................................................... 165<br />
B.2.1.1 Planning............................................................................................................................. 165<br />
B.2.1.1.1 Geodetic reference ..................................................................................................... 165<br />
B.2.1.1.2 Equipment................................................................................................................... 166<br />
B.2.1.2 Grid structure..................................................................................................................... 166<br />
B.2.1.2.1 Measuring method ...................................................................................................... 166<br />
B.2.1.3 Changes during the field survey........................................................................................ 167<br />
B.2.1.4 Calculation......................................................................................................................... 167
Table <strong>of</strong> contents<br />
B.2.1.5 Evaluation ..........................................................................................................................168<br />
B.2.1.5.1 The free adjustment ....................................................................................................168<br />
B.2.1.5.2 The retained adjustment..............................................................................................170<br />
B.2.2 Capture <strong>of</strong> analytically measured <strong>elevation</strong> <strong>data</strong>......................................................................170<br />
B.2.2.1 Relative orientation ............................................................................................................170<br />
B.2.2.2 Bundle adjustment .............................................................................................................171<br />
B.2.2.3 The frame <strong>of</strong> reference ......................................................................................................172<br />
B.2.2.4 The control point list...........................................................................................................174<br />
Appendix C: Analysis programme PIL<br />
C.1 Description <strong>of</strong> the analysis programme PIL.................................................................................................177<br />
C.1.1 Demands on the analysis programme PIL ...............................................................................177<br />
C.1.2 Input files ..................................................................................................................................178<br />
C.1.2.1 File format ..........................................................................................................................178<br />
C.1.3 Programme description ............................................................................................................180<br />
C.1.3.1 The user interface..............................................................................................................180<br />
C.1.3.2 Choice <strong>of</strong> files ....................................................................................................................180<br />
C.1.3.3 Calculation options.............................................................................................................181<br />
C.1.4 Functionality .............................................................................................................................183<br />
C.1.4.1 Filing <strong>of</strong> <strong>data</strong> ......................................................................................................................183<br />
C.1.4.2 Data processing.................................................................................................................183<br />
C.1.5 Statistics ...................................................................................................................................184<br />
C.1.6 The output files .........................................................................................................................185<br />
Appendix D: Editing programme<br />
D.1 The editing programme ”Klip” .........................................................................................................191<br />
Appendix E: Bundle adjustment<br />
E.1 Free bundle adjustment <strong>of</strong> the GPS points .....................................................................................195<br />
E.2 Fixed bundle adjustment <strong>of</strong> the GPS points....................................................................................198<br />
E.3 The co-ordinate list for the ground control points............................................................................201<br />
E.4 Aerotriangulation for images in scale 1:25,000...............................................................................203<br />
E.4.1 The ’Itera.dat’ file from the aerotriangulation for images in 1:25,000 .......................................205<br />
E.5 Aerotriangulation for images in scale 1:15,000...............................................................................206<br />
E.5.1 The ’Itera.dat’ file from the aerotriangulation for the images in scale 1:15,000........................209<br />
E.6 Aerotriangulation for images in scale 1:5,000.................................................................................211<br />
E.6.1 The ’Itera.dat’ file from the aerotriangulation for the images in scale 1:5,000..........................219<br />
Appendix F: Graphic online/<strong>of</strong>fline<br />
131
Table <strong>of</strong> contents<br />
132<br />
F.1 Graphic online/<strong>of</strong>fline ...................................................................................................................... 229<br />
Appendix G: Sizes <strong>of</strong> grid files<br />
G.1 Sizes <strong>of</strong> grid files ............................................................................................................................ 235<br />
Appendix H: Code specification<br />
H.1 Code specification .......................................................................................................................... 239<br />
Appendix I: Analysis calculations<br />
I.1 Analysis calculations ........................................................................................................................ 249<br />
Appendix J: Code specification and error arrows<br />
J.1 Code specification and error arrows ............................................................................................... 301<br />
Appendix K: Orthophoto and error arrows<br />
K.1 Orthophoto and error arrows .......................................................................................................... 313<br />
Appendix L: STND used as threshold<br />
L.1 STND used as threshold................................................................................................................. 329
Appendix A
Correlation techniques<br />
134
A.1 ABM and FBM<br />
Appendix A: Correlation techniques<br />
In this appendix, the most frequently used correlation techniques in digital photogrammetry are described,<br />
both techniques which are directly relevant for the understanding <strong>of</strong> the theory used in the project (Match-<br />
T), and other techniques which are included here to give a better background knowledge and understanding<br />
<strong>of</strong> correlation techniques in general.<br />
A.1 ABM and FBM<br />
Photogrammetric correlation may be defined as the establishment <strong>of</strong> coherence between two images<br />
[Heipke, 1996]. The aim <strong>of</strong> correlation is to determine the position where the concordance between the<br />
two images is at its best. That corresponds to making an orientation <strong>of</strong> the images in analogous photogrammetry.<br />
The method for digital photogrammetry is based, however, on image processing theory rather<br />
than optical/mechanical theory. In the following, the most frequently used correlation techniques used in<br />
digital photogrammetry are described in connection with, among other things, orientation, aerotriangulation<br />
and determination <strong>of</strong> an <strong>elevation</strong> model.<br />
In general, the purpose <strong>of</strong> the correlation technique is to make two digital images, or rather image<br />
patches correlate, that is, find corresponding points by means <strong>of</strong> the grey level values <strong>of</strong> the images’ pixels<br />
or image features. A correlation which is done <strong>over</strong> the whole image at once will be practically impossible<br />
in terms <strong>of</strong> the large quantity <strong>of</strong> <strong>data</strong>, therefore, an image segment <strong>of</strong>, for instance, 7 x 7 pixels is selected<br />
to work in. In one image, a segment is selected which is used as the target in the search for the<br />
best correlation. In the other image, an image segment, the search area, is selected, where the search<br />
itself is done. The search area is moved consecutively, so that the whole search image is c<strong>over</strong>ed. The<br />
purpose <strong>of</strong> the use <strong>of</strong> selected segments is minimisation <strong>of</strong> error possibilities, search time and the demand<br />
for calculation capacity.<br />
In general terms, there are two correlation methods in digital photogrammetry. One is known as Area<br />
Based Matching (ABM), where the grey level values in the digital image are the basis <strong>of</strong> the correlation.<br />
The ABM method is described in Appendix A.1.1. The present description includes two types <strong>of</strong> ABM:<br />
correlation coefficient and least squares matching. The other method is known as Feature Based Matching<br />
(FBM). With this method, the image features, such as lines, points and areas, are extracted from the<br />
images, and the correlation is done by means <strong>of</strong> the image features. The FBM method is described in<br />
Appendix A.1.2.<br />
In a correlation, the fitting in must be done in the row as well as the column direction <strong>of</strong> the pixels, that is,<br />
in two dimensions. By use <strong>of</strong> the normalisation method, epipolar geometry may be achieved, and the correlation<br />
problem reduced to a one-dimensional problem. This method is described in Appendix A.1.3.<br />
According to each correlation principle, the correlation may be done at pixel level or sub pixel level, that<br />
is, the co-ordinates <strong>of</strong> the corresponding point are indicated as whole pixels or fractions <strong>of</strong> pixels, and<br />
thus, the accuracy can be determined on two levels: whole pixel level and sub pixel level or pixel fraction,<br />
level. The last mentioned is the most accurate <strong>of</strong> the two indications. By transformation/adaptation, image<br />
1 (the target area) is moved a whole number <strong>of</strong> pixels, or a whole and a fraction number <strong>of</strong> pixels <strong>over</strong><br />
image 2 (the search area). If the movement is only wanted after a whole number <strong>of</strong> pixels, correlation calculations<br />
will suffice. If the adaptation is to be better than at whole pixel level, the correlation calculation<br />
must be followed by, for instance, an adjustment.<br />
In order to achieve good results by a correlation, temporary co-ordinates must be available. These can be<br />
found by means <strong>of</strong> the pyramid technique described in Appendix A.1.6 and A.1.7.<br />
Appendix A concludes with a discussion <strong>of</strong> the pros and cons <strong>of</strong> the use <strong>of</strong> ABM and FBM respectively<br />
(A.1.8).<br />
135
Correlation techniques<br />
A.1.1 Area based matching<br />
Area based matching (ABM) is the most straightforward type <strong>of</strong> correlation, as the images are used without<br />
previous processing and interpretation. This correlation method has a high degree <strong>of</strong> accuracy in areas<br />
with a good structure [Ackermann, 1984], where there are grey level gaps, for instance, boundaries in<br />
the images. Areas with poor structure and subsequent poor contrast present a higher risk <strong>of</strong> errors, and<br />
subsequent poorer accuracy. Boundaries may, for instance, be differences between road and ditch, cultivation<br />
boundaries, or rooves and surroundings etc. On the other hand, the method is sensitive to changes<br />
in the grey level value between the images.<br />
The accuracy <strong>of</strong> ABM can be divided into an accuracy at pixel level and one at sub pixel level. The firstmentioned<br />
will find the best whole pixel position for a correlation.<br />
A.1.1.1 Correlation at pixel level<br />
Correlation at pixel level is done by means <strong>of</strong> correlation calculations, and in the following, different algorithms<br />
will be discussed. The difference between these algorithms lies mainly in the reliability <strong>of</strong> the correlation<br />
value and the speed. Speed is <strong>of</strong>ten an important factor in the choice <strong>of</strong> which correlation function<br />
should be used [Kraus, 1990].<br />
Here, two will be mentioned: correlation coefficient and mean square <strong>of</strong> the grey level differences, as it is<br />
these which have acquired the greatest importance.<br />
A.1.1.1.1 Correlation coefficient<br />
The correlation coefficient is an expression <strong>of</strong> the quality <strong>of</strong> the concordance between two images or image<br />
segments. The correlation coefficient (c) is determined on the basis <strong>of</strong> the standard deviation for the<br />
grey level values in the two images, or image segments, and the mutual co-variance matrix.<br />
where:<br />
136<br />
T<br />
� � 2<br />
g �<br />
� � � �<br />
A(1.1)<br />
S<br />
T<br />
T<br />
� �2 g �<br />
� � � �<br />
A(1.2)<br />
S<br />
� TS � T T S S<br />
S<br />
� (g - � )(g - � )<br />
A(1.3)<br />
�T = the standard deviation in the target area<br />
�S = the standard deviation in the search area<br />
gT = the individual grey level values in the target area<br />
gS = the individual grey level values in the search area<br />
�T = the mean <strong>of</strong> the grey level values in the target area<br />
�S = the mean <strong>of</strong> the grey level values in the search area<br />
calculated for the same position as the target segment.
The correlation coefficient may then be described as [Kraus, 1993]:<br />
�<br />
�<br />
A.1 ABM and FBM<br />
� TS �(g T - � T )(gS<br />
- � S )<br />
c � �<br />
A(1.4)<br />
� �<br />
2<br />
2<br />
T �S<br />
(g � � ) � (g � � )<br />
T<br />
T<br />
The correlation coefficient is <strong>of</strong>ten used as a criterion for confirmation <strong>of</strong> a correlation. The correlation coefficient<br />
can vary between –1 and 1. The correlation is best when the coefficient is 1. For example, the<br />
programme package Match-T uses a minimum value for the coefficient, which as point <strong>of</strong> departure is<br />
0.85 [Inpho GmbH, 1994]. The correlation coefficient is a measure <strong>of</strong> the quality <strong>of</strong> the correlation at pixel<br />
level. Calculation <strong>of</strong> the correlation coefficient for a series <strong>of</strong> search areas may form the basis <strong>of</strong> the selection<br />
<strong>of</strong> the best correlation at pixel level.<br />
A.1.1.1.2 Mean square<br />
Another measure <strong>of</strong> the quality <strong>of</strong> the correlation is the mean square which is calculated in the following<br />
way:<br />
�gg� � T �<br />
n<br />
S<br />
where: gT = the grey level value in the target area<br />
2<br />
gS = the grey level value in the search area<br />
n = the number <strong>of</strong> pixels used<br />
By an optimal correlation, the mean square is 0.<br />
S<br />
S<br />
A(1.5)<br />
The correlation coefficient has, as its most important advantage, its reliability, but it still results in a longer<br />
calculation time. On the other hand, the mean square <strong>of</strong> the grey level differences is easy to calculate and<br />
implement, but cannot handle differences in image scale.<br />
Correlation with a greater accuracy than at pixel level can be achieved by means <strong>of</strong> other methods which<br />
indicate positions at sub pixel level.<br />
Often a better determination <strong>of</strong> the position than at whole pixel level is desirable. Therefore, sub pixel<br />
level is used as well, and here two <strong>of</strong> the most important types <strong>of</strong> ABM at sub pixel level, polynomial correlation<br />
[Schenk et al., 1991; Kraus, 1997] and least squares matching [Ackermann, 1984] are treated.<br />
A.1.1.2 Correlation at sub pixel level<br />
Correlation at sub pixel level can be done by means <strong>of</strong> 1) fitting in a polynomial, or 2) least squares<br />
matching. Both methods presuppose temporary co-ordinates at pixel level which can be produced by iterative<br />
use <strong>of</strong> correlation calculations, as, for instance, a calculation <strong>of</strong> the correlation coefficient or the<br />
mean square which is repeated for each pixel in a given area.<br />
A.1.1.2.1 Fitting in <strong>of</strong> a polynomial<br />
As it is wished to find the best fitting in at sub pixel level, the surrounding pixel co-ordinates are also regarded,<br />
for instance, in a segment <strong>of</strong> 3 x 3 pixels. The segment is placed so that the pixel position with<br />
the optimal correlation value is in the centre <strong>of</strong> the segment. The nine correlation values are used as observations<br />
for a better determination <strong>of</strong> a polynomial. A second degree polynomial is suitable for this purpose<br />
[Schenk et al., 1991; Kraus, 1997].<br />
a 0 1 2 3 4 5<br />
2 2<br />
� ra � sa � rsa � r a � s a � �(r, s) � v<br />
A(1.6)<br />
137
Correlation techniques<br />
where: r and s are the integer pixel co-ordinates<br />
138<br />
a0........a5 are the parameters which are determined by the adjustment<br />
pi(r,s) = the individual correlation coefficients within the window<br />
v = the residuals<br />
If this equation is used as an observation equation, the coefficients ai for the polynomial can be found by<br />
an adjustment. The following equation system is set up:<br />
which means:<br />
l + v = A · x A(1.7)<br />
v = A · x - l<br />
where: l = the observations<br />
v = random values (the residuals)<br />
A = the design matrix<br />
x = unknown quantities<br />
If l = gT(x,y), x = r0 it follows that:<br />
� �a1x<br />
� a 2y�<br />
�a<br />
3 ��<br />
v( x, y) � gS<br />
� r0<br />
� �<br />
�<br />
� �<br />
� r1<br />
� g M (x, y)<br />
a 4x<br />
a 5y<br />
� � �<br />
a<br />
�<br />
A(1.8)<br />
�<br />
� � � � � 6 ��<br />
where: a1, a2, a3, a4, a5, a6, r0 og r1 = temporary values<br />
v(x,y) = the residuals<br />
The turning point <strong>of</strong> the polynomial (the sub pixel position) can then be found by differentiating. A sub<br />
pixel position can then be achieved by:<br />
r<br />
a<br />
a<br />
� 2a a<br />
2 3 1 5<br />
sub � A(1.9)<br />
2<br />
4a 4a<br />
5 � a 3<br />
s<br />
� 2a<br />
a<br />
� a a<br />
2 4 1 3<br />
sub � A(1.10)<br />
2<br />
4a 4a<br />
5 � a 3<br />
[Schenk et al., 1991]. This method <strong>of</strong>fers a sub pixel accuracy <strong>of</strong> 1 /4 pixel [Kraus, 1997].<br />
A.1.1.2.2 Least squares matching<br />
To find the best correlation at sub pixel level, the least squares matching, which consists <strong>of</strong> two transformations,<br />
is <strong>of</strong>ten used. The best correlation between two images can be regarded as an affine transformation<br />
between the images. By affine transformation, we have 6 geometric unknown quantities: 2 moves,<br />
2 twists and 2 scalings. Furthermore, we have 2 unknown corrections for the contrast in grey level<br />
strength. Altogether, 8 unknown quantities.<br />
Therefore, the transformation parameters are calculated during the process, but it is only the co-ordinates<br />
<strong>of</strong> the corresponding point in the search image which are <strong>of</strong> interest.
A.1 ABM and FBM<br />
If the correlation is done by means <strong>of</strong> least squares matching, there is, as mentioned, 8 unknown quantities,<br />
6 corrections for the approximated value <strong>of</strong> the move, and 2 corrections for the contrast in grey level<br />
strength:<br />
- The move in grey level values<br />
- The change in scale<br />
- The x-co-ordinate for the target area (gT)<br />
- The y-co-ordinate for the target area (gT)<br />
- The x-co-ordinate for the search area (gS)<br />
- The y-co-ordinate for the search area (gS)<br />
- The grey level values in the target area (gT)<br />
- The grey level values in the search area (gS)<br />
Least squares matching in two dimensions consists <strong>of</strong>:<br />
1) The radiometric transformation:<br />
gT(x,y) = r0 · gS(u,v) + r1 A(1.11)<br />
� �<br />
Target area Search area<br />
where: gT = the grey level values for the target area<br />
x = x-position for the target area<br />
y = y-position for the target area<br />
r0 = estimated correction for the scaling factor in the grey levels<br />
gS = the grey level values for the search area<br />
u = the x-position in the search area<br />
v = the y-position in the search area<br />
r1 = estimated correction for the shift <strong>of</strong> the grey level values<br />
2) The geometric transformation:<br />
�<br />
��<br />
�<br />
u<br />
v<br />
�<br />
��<br />
�<br />
�<br />
� a<br />
�<br />
�<br />
� a<br />
1<br />
4<br />
a<br />
a<br />
2<br />
5<br />
� � x<br />
�<br />
�<br />
��<br />
� � y<br />
�<br />
��<br />
�<br />
� a<br />
� �<br />
�<br />
� a<br />
where: a1, a2, a4, a5 = the affinity divided into 2 scalings and 2 twists<br />
a3, a6 = the shift in the x- and y-direction<br />
If the radiometric and the geometric transformation are put together, the following applies:<br />
1x 2y 3<br />
g T (x, y) r0<br />
� g S<br />
�<br />
� � �<br />
a 4x<br />
� a<br />
� �<br />
5y a<br />
��<br />
6<br />
3<br />
6<br />
�<br />
�<br />
�<br />
�<br />
A(1.12)<br />
� �a<br />
x � a � a �<br />
�<br />
� �<br />
� � r1<br />
A(1.13)<br />
� � � � ��<br />
139
Correlation techniques<br />
By assigning the target random errors (v), there will be:<br />
140<br />
� �a<br />
x � a y�<br />
�a<br />
��<br />
� � � �<br />
� r1<br />
A(1.14)<br />
� � � � ��<br />
1 2<br />
3<br />
g T (x, y) v r0<br />
g S�<br />
� � �<br />
a 4x<br />
� a 5y<br />
� �<br />
a<br />
��<br />
6<br />
To solve this problem, an adjustment is used again by means <strong>of</strong> the least squares principle. The equation<br />
system seen in A(1.7) and A(1.8) is set up, and repeated here for clarity:<br />
which means:<br />
l + v = A · x<br />
v = A · x - l<br />
where: l = the observations<br />
v = random values (the residuals)<br />
A = the design matrix<br />
x = unknown quantities<br />
If l = gT(x,y), x = r0 it follows that:<br />
� �a<br />
1x<br />
� a 2y<br />
� �a<br />
3 ��<br />
y) � g �<br />
�<br />
S�<br />
�<br />
� r0<br />
� r1<br />
� g (x, y)<br />
a 4x<br />
a 5y<br />
� � �<br />
a<br />
�<br />
A(1.15)<br />
�<br />
� � � � � 6 ��<br />
v(x, T<br />
where: a1, a2, a3, a4, a5, a6, r0 og r1 = estimated values<br />
v(x,y) = the residuals<br />
A.1.2 Feature based matching<br />
The feature based matching (FBM), in contrast to ABM, uses image features as background for the correlation.<br />
The first step is to extract image features, which is done by means <strong>of</strong> a so-called operator. Dependent<br />
on the operator, the image features may be areas, lines or points. These image features’ position<br />
and attributes are stored in a list. This extract is done for both images in an image pair. The second step<br />
is the correlation itself, where the features on the two lists are investigated with regard to coincidence.<br />
A.1.2.1 Area<br />
An example <strong>of</strong> the use <strong>of</strong> areas as features in a FBM is done on the background <strong>of</strong> satellite images.<br />
Lakes and islands were chosen as features. This is due to the fact that these are easy to extract automatically<br />
by setting up a limit in the histogram for the near-infrared channel. The correlation can, for instance,<br />
be done between an orientated satellite image, and a non-orientated satellite image. The features<br />
are extracted from each satellite image. The method can also be used between a digital topographical<br />
map in raster form and a satellite image, where the same features are extracted, here lakes and islands.<br />
As attributes for the area features, the size <strong>of</strong> the area is registered, both as area (km 2 ), by the length and<br />
shoreline, and as to type, including whether it is land (island) or water (lake). For the determination <strong>of</strong> the<br />
sub pixel position <strong>of</strong> the area, its centre <strong>of</strong> gravity is used. These attributes were considered in the correlation.<br />
The accuracy <strong>of</strong> this method has turned out to be at least as good as a traditional measuring <strong>of</strong> control<br />
points [Holm et al., 1995].<br />
A.1.2.2 Line<br />
Human vision is, to a large degree, based on the correlation between distinct, well-defined lines rather<br />
than on the grey level values themselves. Such distinct lines and edges can be derived from the grey
A.1 ABM and FBM<br />
level values (edge detection) by calculating the differences from the neighbouring grey level values. The<br />
grey level variations are further emphasised in the image by taking the second-derived differences. This<br />
process is also called the Laplace operator.<br />
It has turned out that there is an advantage to filtering the image for noise (random errors) before edges<br />
can be detected. A known operator which both filters and emphasises edges is the LoG operator (Laplacian<br />
<strong>of</strong> Gaussian zero-crossing edge detector) [Haralick et al., 1992]. As the name LoG operator indicates,<br />
it is the Laplace operator combined with a 3D Gaussian distribution.<br />
The LoG operator is found by double differentiation <strong>of</strong> the Gaussian bell function. The derivation itself appears<br />
from [Kraus, 1992].<br />
where: r = rows<br />
� 2 2<br />
2 2 2<br />
�<br />
�<br />
r �c<br />
r � c � 2�<br />
�<br />
�<br />
� 2 �<br />
LoG(r, c) �<br />
e � 2�<br />
�<br />
A(1.16)<br />
6<br />
2��<br />
c = columns<br />
The value � is the only eligible parameter. A small � gives a transformed image with many zero points. If<br />
you want to choose points for an orientation, it is reasonable to use a large value for �.<br />
This operator is used with a view to extraction <strong>of</strong> lines for, for instance, a relative orientation [Schenk et<br />
al., 1991].<br />
The edges are found in locations where LoG(r,c) = 0. For the linking together <strong>of</strong> the edges found, the<br />
chain code principle is used. Of course, edges will be found in one image, which are either not found in<br />
the other image, or which deviate as regards form or linking together. Therefore, the problem <strong>of</strong> finding<br />
corresponding edges must be formulated very generally. Reasonable correlation criteria are that the lines<br />
have a certain concordance as regards length, form, derived gradients and location in both images.<br />
These attributes are independent <strong>of</strong> rotation or scale difference between the images.<br />
This investigation indicates that the method (the use <strong>of</strong> edges) may be quite serviceable for the solution<br />
<strong>of</strong> correlation problems in connection with, for instance, correlation between two images, or between images<br />
and maps.<br />
A.1.2.3 Points<br />
It has turned out that if the correlation <strong>of</strong> the images is to be used later for measuring, and not only for<br />
analysis purposes, points are the best image features [Baltsavias, 1991].<br />
Other criteria, such as robustness, point density, the demand for a temporary value, and in some cases<br />
also, the question <strong>of</strong> the calculation speed, can play a part in the evaluation <strong>of</strong> whether an operator is the<br />
optimal one. The most precise operators use points as image features, and thus <strong>of</strong>fer a closer result<br />
while, at the same time, the calculation runs quicker. The operator is, however, sensitive to noise in the<br />
images which adds to the risk <strong>of</strong> faulty correlation because <strong>of</strong> ambiguity. The point operators need better<br />
temporary co-ordinates than operators which use lines and areas.<br />
Over time, different operators have been developed. One <strong>of</strong> the oldest and most used operators is the<br />
Moravec operator (1980). Another much used operator is the Förstner operator (1987), both will be discussed<br />
in the following two paragraphs. A long series <strong>of</strong> operators are compared by [Baltsavias, 1991].<br />
A.1.2.3.1 The Moravec operator<br />
The Moravec operator determines the change in grey level value in the four directions, row, column and<br />
the two diagonals. The change in the grey level value is determined as the sum <strong>of</strong> the grey level differences<br />
between neighbouring pixels squared. The original Moravec operator is defined as a 5 x 5 window:<br />
1 2 1<br />
2<br />
M 1(r,<br />
c) � � � �[g(r � k, c � l) � g(r � k, c � l �1)]<br />
A(1.17)<br />
20 k��21��2<br />
141
Correlation techniques<br />
where: r = rows<br />
142<br />
2<br />
1 1 2<br />
2<br />
(r, c) � � � �[g(r � k, c � l) � g(c � k �1,<br />
c � l)]<br />
20 k��21��2<br />
M A(1.18)<br />
3<br />
1 1 1<br />
2<br />
(r, c) � � � �[g(r � k, c � l) � g(r � k �1,<br />
c � l �1)]<br />
16 k��2l��2<br />
M A(1.19)<br />
4<br />
1 1 1<br />
2<br />
(r, c) � � � �[g(r � k, c � l �1)<br />
� g(r � k �1,<br />
c � l)]<br />
16 k��2l��2<br />
M A(1.20)<br />
c = columns<br />
The definition <strong>of</strong> the Moravec operator (M) is: M = min (Mi) for i = 1, 2, 3, 4<br />
If M reaches a certain limit, the point will be included as a characteristic point. In order to choose only the<br />
clearly separate points, the thinning out is then done. The advantage <strong>of</strong> this method is that it is easy to<br />
implement, but there are also the following drawbacks [Lemmens, 1988]:<br />
- Points are determined which do not relate to real points, but only to grey level differences<br />
- The operator is sensitive to features with a poor resolution, for instance, small points will give a<br />
larger operator signal<br />
- The operator is not rotation-independent<br />
It has turned out that the Moravec operator has certain weaknesses as regards precise determinations <strong>of</strong><br />
corners [Förstner, 1993].<br />
As regards achieving the greatest number <strong>of</strong> extracted points, the Förstner operator is preferable, as it is<br />
able not only to extract corners, but also the centre <strong>of</strong> circles, intersections, points where the structure is<br />
marked in relation to the surroundings, end points <strong>of</strong> lines etc. [Förstner, 1991; Förstner, 1993]. The operator<br />
is good at using an image with little variation in the grey level values, which results in a general<br />
high degree <strong>of</strong> point density.<br />
Other operators can only extract some <strong>of</strong> the mentioned image features, and the density <strong>of</strong> the extracted<br />
features is therefore lower. Furthermore, investigations have shown that for images with noise, the<br />
Förstner operator is also the best in every sense [Baltsavias, 1991].<br />
Förstner has stated a series <strong>of</strong> demands for the extraction <strong>of</strong> image features [Förstner, 1986]. Characteristic<br />
image features are corners, intersections, points with a high contour gradient, and end points for<br />
lines, and centres <strong>of</strong> circles. Common to all these features are that they fulfil the following demands:<br />
Clear separation: The points must be clearly separated from the immediately neighbouring points. This<br />
demand is valid locally, that is, in the immediate surroundings <strong>of</strong> the interest points. This demand excludes<br />
points on the same line. Clearly separated points may be corners, round features etc.<br />
Rare/unique: The points must be rare or unique within the image, so that recognition <strong>of</strong> a point by comparison<br />
<strong>of</strong> the two images’ lists becomes quicker. That way, the speed <strong>of</strong> the correlation is increased,<br />
which also ensures a better result.<br />
Stable/unchangeable: The image features must be recognisable in the other image. The features must<br />
be stable at the selection, grey level wise as well as geometrically. The stability has a direct influence on<br />
the accuracy <strong>of</strong> the correlation, and thus on the reliability <strong>of</strong> the later processes.<br />
According to [Förstner, 1991 and 1993], it is only the Förstner operator which in practice can deliver the<br />
points which live up to the aforementioned demands.
A.1.2.3.2 The Förstner operator<br />
A.1 ABM and FBM<br />
In 1986, another FBM algorithm was presented by W. Förstner. This is the algorithm which later became<br />
known as the Förstner operator. The algorithm is presented as being an operator which extracts points<br />
with greater accuracy, and thus with a total better accuracy. This operator has later been described in detail<br />
in [Förstner et al., 1987 & 1993], which also forms the basis <strong>of</strong> the description in the following.<br />
The Förstner operator really consists <strong>of</strong> several part processes: determination <strong>of</strong> gradients, determination<br />
<strong>of</strong> corner and end points, intersections, points with a high contour gradient, circle points, quality calculation<br />
and build-up <strong>of</strong> a point list.<br />
The gradient image<br />
A gradient image consists <strong>of</strong> derived grey level values, which are calculated separately in the pixels’ row<br />
and column direction. The gradients are determined by means <strong>of</strong>, for instance, a Roberts operator or a<br />
Sobel operator. If the Roberts operator is used, the image must first be smoothed by means <strong>of</strong> a ”lowpass”<br />
filter [Förstner, 1986]. Therefore, the Sobel operator is used more <strong>of</strong>ten, as the smoothing is done<br />
there during the calculation <strong>of</strong> the gradients. A Sobel operator is described thus:<br />
For the pixel rows For the pixel columns<br />
��1<br />
0 1�<br />
�<br />
�<br />
�2<br />
0 2<br />
�<br />
�<br />
��<br />
�1<br />
0 1��<br />
��1<br />
�2 �1�<br />
� �<br />
�<br />
0 0 0<br />
�<br />
��<br />
1 2 1��<br />
The calculation <strong>of</strong> the gradients may, for instance, begin in the upper left corner <strong>of</strong> the image. The operator<br />
moves from pixel to pixel and line to line (row) until gradients are calculated <strong>over</strong> the whole image.<br />
This is done for the row operator as well for the column operator. Of course, there will be problems along<br />
the edge <strong>of</strong> the image, as the operator will not be able to find pixel points for the whole size <strong>of</strong> the operator<br />
here. This edge problem may be solved in different ways.<br />
1) The choice is to go on working with only a reduced gradient image, where the incorrect gradients<br />
are not included<br />
2) For an operator <strong>of</strong> 3 x 3 pixels, 2 extra columns and 2 extra rows are added along the edge with<br />
the grey level value 0<br />
3) The outermost rows and columns outside the image have to be copied<br />
First when the Sobel operator is in the position second row and second column, will there be pixel values<br />
for a correct gradient determination. The result <strong>of</strong> this will be 2 gradient images, one including the gradients<br />
in the x-direction, and the other the gradients in the y-direction.<br />
The gradients are used in the later processes where the search is for intersections, corner, end and circle<br />
points. These points may be designated as characteristic points in the digital image.<br />
A.1.2.3.3 Determination <strong>of</strong> intersections, corner and end points<br />
As the determination <strong>of</strong> intersections, corner and end points is done in the same way, these are treated<br />
as one.<br />
Let it be presumed that in a fixed window, for example <strong>of</strong> 7 x 7 pixels, there will be an intersection, corner,<br />
or end point. Before this point can be determined, line segments must first be determined. These are determined<br />
by means <strong>of</strong> gradient lines. The line segments are defined as the line which passes through the<br />
middle <strong>of</strong> the pixel, and runs perpendicular to the gradient. [Förstner, 1991]. For each pixel, a gradient<br />
line is determined, and for each gradient line, a line segment is determined.<br />
A line segment in pixel position (r, c) is defined as:<br />
G: l(r,c) = r · cos � + c · sin � A(1.21)<br />
143
Correlation techniques<br />
Where: l = the distance to origin for the (r,c) position<br />
see figure A.1.1.<br />
144<br />
� = the direction found by means <strong>of</strong> the gradient (cos � = gr/��g�)<br />
where: gr = the grey level value for the row<br />
��g� = the length <strong>of</strong> the gradient<br />
When the line segment is given, the distance (v) to an intersection, corner or end point P(ro, co) is given<br />
by:<br />
v = r · cos � + c · sin � - l A(1.22)<br />
A so-called characteristic point is the position from which the distance to all the line segments is the<br />
shortest. Generally, the work is done within a smaller window <strong>of</strong>, for instance, 7 x 7 pixels. For each window,<br />
the position is determined, from which the distance to all lines in this window is the shortest. For the<br />
solution <strong>of</strong> this problem, an adjustment is used. An intersection, corner or end point can therefore be determined<br />
from the following equation for each <strong>of</strong> the surrounding gradient lines:<br />
l (r,c) = r0 · cos � (r,c) + c0 · sin � (r,c) + v (r,c) A(1.23)<br />
where v(r,c) is the distance to be minimised.<br />
In figures A.1.2 and A.1.3 examples are shown <strong>of</strong> a corner situation, for instance, a house corner, and an<br />
end situation, for instance, the end <strong>of</strong> a road or a hedge.<br />
The equation A(1.23) is used as an observation equation at an adjustment by the least squares method.<br />
In an n x n window (for example 5 x 5 or 7 x 7), there are n 2 edge elements, and thus n 2 observation<br />
equations <strong>of</strong> the type:<br />
Thereby this is the case:<br />
r<br />
�<br />
l<br />
v<br />
P(ro, co)<br />
vi = r0 · cos �i + c0 · sin �i - li A(1.24)<br />
1. The equation for all line segments within a window, set up as in equation A(1.23)<br />
�g<br />
2. The determination <strong>of</strong> the point P which is in the position, where the distance to all lines is the<br />
shortest<br />
gc<br />
gr<br />
G<br />
c<br />
Figure A.1.1: Designation <strong>of</strong> the line segment with gradient.
This is done by an adjustment by the least squares method.<br />
On the background <strong>of</strong> the equation A(1.24), n 2 normal equations are set up:<br />
vi = r0 · cos �i + c0 · sin �i - li<br />
A.1 ABM and FBM<br />
where the position <strong>of</strong> the characteristic point is (r0, c0) and r0 and c0 are the unknown quantities.<br />
The normal equation system:<br />
A T P A x = A T P b A(1.25)<br />
Translates to:<br />
�cos�<br />
A �<br />
�<br />
�<br />
�<br />
��<br />
cos�<br />
1<br />
n<br />
�<br />
�<br />
�<br />
sin�<br />
�<br />
sin�<br />
1<br />
n<br />
�<br />
�<br />
�<br />
��<br />
� �g<br />
�<br />
P � � �<br />
� 0<br />
�<br />
2<br />
1<br />
By using the normal equation system, this is the formula:<br />
�<br />
�<br />
�<br />
0<br />
�<br />
�g<br />
2<br />
n<br />
�<br />
�<br />
�<br />
�<br />
�<br />
A(1.26)<br />
�<br />
2<br />
2<br />
2 �<br />
T � cos � �i<br />
�gi<br />
� cos� i � sin� i � �gi<br />
N � A PA � �<br />
2<br />
2 �<br />
A(1.27)<br />
2<br />
��<br />
� cos� i � sin� i � �gi<br />
� sin � i � �gi<br />
��<br />
g r<br />
gc<br />
If cos� � and sin� � is set<br />
�g<br />
�g<br />
this is obtained:<br />
End point<br />
Figure A.1.2: Determination <strong>of</strong> an end point<br />
Figure A.1.3: Determination <strong>of</strong> a corner point<br />
Corner point<br />
2 � � g<br />
�<br />
r � g r � g<br />
i<br />
i ci<br />
N � �<br />
2 �<br />
A(1.28)<br />
��<br />
� g r � gc<br />
� g<br />
i i<br />
ci<br />
��<br />
145
Correlation techniques<br />
2<br />
�<br />
T � cos� i � gi<br />
� li<br />
A Pl � �<br />
2<br />
��<br />
� sin� i � gi<br />
� li<br />
A.1.2.3.4 Determination <strong>of</strong> circle points<br />
146<br />
2<br />
� ��<br />
cos� i � gi<br />
�<br />
�<br />
� � �<br />
2<br />
��<br />
��<br />
� sin� i � gi<br />
� i<br />
i �<br />
� �<br />
� � � �<br />
2<br />
r<br />
� ��<br />
� � � � �<br />
i � cos� � ci<br />
sin� g r ri<br />
g r gc<br />
c<br />
i<br />
i<br />
i i i<br />
� � �<br />
2<br />
r � cos� � c sin� � g g � r � � g � c<br />
i<br />
��<br />
��<br />
ri<br />
ci<br />
i<br />
A(1.29)<br />
Circle points are defined as the centre <strong>of</strong> circular features, that is, rings and round surfaces. The point <strong>of</strong><br />
departure is gradients, determined as described in section 1.2.3.2. The gradient lines have the same direction<br />
as the gradients. As the gradient lines by circular features are turned 90 o , a line designation is indicated<br />
as:<br />
l (r,c) = -sin � (r,c) +cos � (r,c) + v(r,c) A(1.30)<br />
�<br />
r · (-sin �(r,c)) + c · cos �i (r,c)- l (r,c) = 0<br />
The circle point is determined as the position from which the distance to all the gradient lines in the window<br />
is the shortest possible. See figure A.1.4.<br />
As for intersections, corner and end points, the adjustment is done by the least squares method.<br />
This gives:<br />
where:<br />
� � r � ( �sin�<br />
) � c � cos� � l<br />
A(1.31)<br />
i<br />
0<br />
li i<br />
i i<br />
and thus the normal equations:<br />
A T P A x = A T P b<br />
�<br />
� r � ( �sin�<br />
) � c � cos�<br />
i<br />
0<br />
i<br />
i<br />
2<br />
2<br />
� � g<br />
� �<br />
�<br />
c � � g r gc<br />
�r0<br />
� �gc�ri��gr�gc�c i i i<br />
i<br />
i i i<br />
�<br />
2 � � � � � �<br />
2 �<br />
A(1.32)<br />
��<br />
� � g r gc<br />
� gc<br />
��<br />
�c0<br />
� ��<br />
� �gr�gc�r�i�gr�c i i<br />
i<br />
i i<br />
i i ��<br />
i<br />
Circle point<br />
Figure A.1.4: Determination <strong>of</strong> a circle point from a circle element<br />
By iterative use <strong>of</strong> the equations for corner and circle points respectively, the points are identified which<br />
will then be registered with co-ordinates at sub pixel level in a list.<br />
ri<br />
i<br />
�
A.1.2.3.5 Quality evaluation <strong>of</strong> the characteristic points<br />
A.1 ABM and FBM<br />
The first time around, the Förstner operator has identified a long series <strong>of</strong> points, but the quality may be<br />
very varied, therefore a closer evaluation can exclude the points with the poorest determination. For each<br />
point, an error ellipsis and its size (w) and roundness (q) is determined, which is used as a measure <strong>of</strong><br />
the quality <strong>of</strong> the determination <strong>of</strong> the point. The size and roundness <strong>of</strong> the error ellipsis can be expressed<br />
as:<br />
det N<br />
w � A(1.33)<br />
½tr N<br />
4detN<br />
� A(1.34)<br />
tr N<br />
q 2<br />
where: det N = the determinant for the normal equation matrix<br />
tr N = the trace for the normal equation matrix<br />
By means <strong>of</strong> w and q, the best determined points are chosen, which are also the most suitable as temporary<br />
co-ordinates. The size <strong>of</strong> the error ellipsis should not exceed a certain value. A maximum value for w<br />
may be found in the following way: The mean <strong>of</strong> the w values is calculated for a segment <strong>of</strong> the image.<br />
Tests have shown that 2/3 times the mean is a suitable minimum limit [Kraus, 1997]. These points are the<br />
so-called interest points which are stored in a list.<br />
At the same time, the error ellipsis should be approximately round, that is, q close to 1. Practical experience<br />
has shown that a minimum limit <strong>of</strong> 0.75 is suitable for q [Kraus, 1997].<br />
A selection criterion for a point could be that the w value as well as the q value <strong>of</strong> the point should keep<br />
within the limit. But if a common limit for w and q is set for the whole image, it may result in the inclusion<br />
only <strong>of</strong> points which are determined in areas with a good structure and which, therefore, achieve a good<br />
determination. By the later correlation, it is therefore only possible to correlate <strong>over</strong> these areas.<br />
To avoid this problem, the non-maximum principle (the thinning out principle) is <strong>of</strong>ten used. Within a window<br />
<strong>of</strong>, for instance, 7 x 7 pixels, only the point with the best determination is chosen. The w value and q<br />
value <strong>of</strong> the remaining points are set at zero [Förstner, 1993].<br />
Because <strong>of</strong> the ability <strong>of</strong> the Förstner operator to eliminate points in areas with low contrast, the chosen<br />
points will be well defined, and thus form the basis <strong>of</strong> a final correlation with a high accuracy. The drawback,<br />
however, is that in areas with low texture, no points will be chosen.<br />
A.1.2.4 The principles <strong>of</strong> FBM<br />
The correlation is started with the selection <strong>of</strong> point pairs in lists <strong>of</strong> the extracted points from the two images.<br />
For each point in one list, the most suitable candidate from the other list is nominated. Together,<br />
the two points constitute a point pair.<br />
The selection <strong>of</strong> points for a point pair may be done in different ways [Förstner, 1993]:<br />
1) The point pair must meet a demand for a certain homogeneity as regards the attributes w and q.<br />
2) For an image pair, a parallax can be interpolated. Between chosen points, a uniform ”parallax<br />
field” must be filled. An expected parallax can be used to exclude improbable point pairs. This<br />
expected parallax may be the result <strong>of</strong> using the image pyramid principle (section A.1.6), where<br />
the results from the one level is used as the temporary values for the next pyramid level.<br />
3) A third criterion might be that the points must be unique, that is, that uniform points must not lie<br />
close to each other. This is done separately for both images by eliminating uniform points within<br />
a window.<br />
147
Correlation techniques<br />
148<br />
4) Finally, the nomination <strong>of</strong> the candidate point may be done by combining with a criterion about<br />
concordance between the immediate surroundings <strong>of</strong> the points. For this comparison, an ABM<br />
can be used, for instance, correlation coefficient or least squares matching [Kraus, 1997].<br />
The result <strong>of</strong> a selection is a list with {(r1,c1),(r2,c2),w} <strong>of</strong> a candidate pair with their co-ordinates for left<br />
and right image, and their size as attributes.<br />
The position <strong>of</strong> the selected points is indicated at sub pixel level. In case the accuracy on the background<br />
<strong>of</strong> the above Förstner operator is not sufficient, it can be supplemented by an ABM, for instance, least<br />
squares matching [Kraus, 1997].<br />
A.1.3 Epipolar geometry<br />
A quotation by Förstner is a good starting point: The epipolar line constraint is the strongest constraint in<br />
image matching and should be used as soon as available [Förstner, 1993].<br />
The correlation problem between images can be markedly simplified if the relative orientation is known.<br />
The two-dimensional search area can thereby be reduced to a one-dimensional problem by means <strong>of</strong> the<br />
so-called epipolar geometry [Förstner 1993]. To achieve epipolar geometry, a mathematical process, also<br />
called normalisation <strong>of</strong> the images, is done.<br />
The reduction from two to one dimension is done by elimination <strong>of</strong> the vertical parallaxes (the yparallaxes).<br />
The two normalised images deviate geometrically only along the horizontal parallaxes (the xparallaxes).<br />
To determine the epipolar geometry, it requires the relative orientation or the whole outer orientation to be<br />
known. x1, y1 and x2, y2 are the image co-ordinates in the two original images, and x1’, y1’ and x2’, y2’ are<br />
the image co-ordinates in the corresponding normalised images. Furthermore, it is determined that origin<br />
for the local co-ordinate system is placed in the projection centre <strong>of</strong> image (O1), and that the x-axis<br />
passes through the projection centre <strong>of</strong> image (O2). The z-direction is in concordance with the shooting<br />
direction <strong>of</strong> the first normally shot image, that is, �1 = �1 = �1 = 0. The y-axis is perpendicular to the xzplane,<br />
see figure A.1.5.<br />
The original image co-ordinates may be expressed as:<br />
r11x � � r12y � - r31c� x � - c<br />
r x � � r y � - r c�<br />
13 23<br />
33<br />
r12x � � r22y � - r32c� y � -c<br />
r x � � r y � - r c�<br />
13 23 33<br />
The normalised image co-ordinates may be expressed as:<br />
x � � - c �<br />
y � � - c �<br />
r11x � r12y - r13c r x � r y - r c<br />
31 32 33<br />
r21x � r22y - r23c r x � r y - r c<br />
31 32 33<br />
where: c = the camera constant<br />
c’ =the camera constant for the normalised images<br />
x’ = the x-co-ordinate in the normalised image<br />
y’ = the y-co-ordinate in the normalised image<br />
rii = the elements in rotation matrix R<br />
A(1.35)<br />
A(1.36)<br />
A(1.37)<br />
A(1.38)
K 1<br />
A.1 ABM and FBM<br />
By means <strong>of</strong> the formulas A(1.37) and A(1.38) it is now possible to make a conversion <strong>of</strong> the original digital<br />
images into normalised images. For the normalisation process, a value for the camera constant c is<br />
chosen. This must be somewhat larger than the original camera constant to ensure that all the image features<br />
from the original image are included. The pixel size is the same as in the original image. A pixel position<br />
in the normalised image does not normally correspond directly to a pixel position in the original image,<br />
but <strong>of</strong>ten falls on a sub pixel position.<br />
The grey level value <strong>of</strong> each pixel in the normalised image may be transferred directly from the original<br />
image.<br />
A.1.3.1 Resampling<br />
y<br />
x 1<br />
y’ 2<br />
Figure A.1.5: Epipolar geometry<br />
c<br />
z<br />
O1<br />
C’<br />
If the grey level value is transferred directly, the result will rarely be a harmonious image. To minimise this<br />
problem, resampling can used. By means <strong>of</strong> the equations A(1.37) and A(1.38), a pixel position in the<br />
normalised image is transferred to a position in the original image, see figure A.1.6. An adapted grey level<br />
value is interpolated from the grey levels in an area in the original image by using, for instance, a bi-linear<br />
interpolation [Kraus, 1993], or a bi-cubic interpolation [Krzystek, 1995].<br />
x 1 c y 1<br />
y<br />
y’<br />
y1<br />
z<br />
x’ 2<br />
P’<br />
O<br />
c’<br />
x2<br />
y’2<br />
P<br />
Figure A.1.6: The resampling principle<br />
P<br />
O2<br />
C’<br />
x<br />
x’<br />
y2<br />
x<br />
x’ 2<br />
K 2<br />
149
Correlation techniques<br />
A.1.3.2 Normalisation and resampling<br />
If epipolar geometry and resampling are combined, it can be done as an independent process, where the<br />
whole normalised image is stored on the hard disk, or the process can run concurrently during the correlation<br />
process. The process <strong>of</strong> normalisation and resampling <strong>of</strong> a whole image is quite time- consuming.<br />
Time may therefore be saved by only normalising and resampling those pixels which are necessary for<br />
the correlation. The last-mentioned can be regarded as a one-dimensional correlation in the original images.<br />
A.1.3.3 Correlation in one dimension<br />
As described, the correlation problem is reduced from a two-dimensional problem to a one-dimensional<br />
one by using the normalisation principle. In the following, the correlation principles for ABM and FBM are<br />
described in one dimension.<br />
A.1.3.4 ABM in one dimension<br />
The methods described for the determination <strong>of</strong> a position at pixel level (see section A.1.1.1) may be<br />
used directly in one dimension. As an example, the least squares matching is described here to find the<br />
best correlation at sub pixel level. If the pixel position on an integer is designated (�) and the small shift<br />
(�), the fitting in between the position for the two normalised images I1 and I2 can be expressed in the following<br />
way:<br />
150<br />
��� g ����� g T S<br />
� A(1.39)<br />
where gT = the grey level values for the target area<br />
gS = the grey level values for the search area<br />
As described in section A.1.1.2.2, the target area and the search area do not only diverge from each<br />
other in position, but also in grey level values. Therefore, the grey level values for the target, gT, are assigned<br />
random values v. gS is supplied with systematic correlations, such as a scale factor r0 and a shift r1<br />
for the grey level values:<br />
gT(�) + v = r0 gS(� + �) + r1 A(1.40)<br />
By using the least squares method for the adjustment, the square sum <strong>of</strong> the random values v is minimised,<br />
and the elements �, r0 and r1 are determined. For this purpose, the equations must first be linearised.<br />
As � is a small element, the equation can be expressed thus:<br />
gT(�) + v = r0 (gS(�) + gT´(�) �) + r1 A(1.41)<br />
After a change <strong>of</strong> the terms, finally the searched-for error equation for an element adjustment with the unknown<br />
quantities (r0� �), r0 and r1 is obtained:<br />
v = [r0 (gS (�) + gT´(�) �) + r1] – gT (�) A(1.42)<br />
where: gT(�) and gS(�) are corresponding grey levels in the two images. The number <strong>of</strong> grey level<br />
pairs is usually given by the size <strong>of</strong> the target area.<br />
and where: gT´(�) is the inclination <strong>of</strong> the grey level pr<strong>of</strong>ile for the first image for a given pixel position,<br />
that is, g´(�) = �g/��. For the first pixel, we put �g = gS – gT, for the last, the n th , �g = gn -<br />
gn-1; for pixels between 1
A.1.4 FBM in one dimension<br />
A.1 ABM and FBM<br />
An example <strong>of</strong> the use <strong>of</strong> FBM in one dimension is in the programme package Match-T. The Förstner operator<br />
is, as mentioned before, originally an operator, where corners and circular features are extracted,<br />
and their ”sub pixel position” is determined (see section 1.3.3.2). This is done in two dimensions. Match-T<br />
first converts images into normalised images. In these normalised images, the Förstner operator is specified,<br />
so that only squared gradients in the row direction are summed up within a window size, determined<br />
beforehand. The assumption <strong>of</strong> the location <strong>of</strong> a point within the window is fundamentally a Gauss-<br />
Mark<strong>of</strong>f process [Krzystek 1995]:<br />
2<br />
2<br />
� g �x � � g r �<br />
� r r<br />
A(1.43)<br />
with: gr = the gradient in the row direction in the window<br />
r = the number <strong>of</strong> column co-ordinates in the window<br />
x = the location <strong>of</strong> the point in the window<br />
In specific cases <strong>of</strong> epipolar geometry, the operator is a pure edge operator which is very sensitive to vertical<br />
edges [Krzystek 1995]. By means <strong>of</strong> the principle <strong>of</strong> non-maxima suppression, the list <strong>of</strong> feature<br />
points (gradients) is thinned out. Then, only the most significant points remain. The final correlation <strong>of</strong> corresponding<br />
points is geometrically delimited by the epipolar lines (the image rows), and by a parallax<br />
bound between the correlation candidates. In addition, a symbol and the size <strong>of</strong> the ”interest” value as<br />
well as the correlation coefficient in a defined window are used as frame <strong>of</strong> comparison for the correlation.<br />
A list <strong>of</strong> ”interest” candidates (gradients), which are not unique after an introductory correlation, is cleared<br />
<strong>of</strong> discrepancies by a robust affine transformation.<br />
A.1.5 Correlation in one dimension ‘on the fly’<br />
The procedure for finding corresponding points by means <strong>of</strong> kernel rays in the two original images is as<br />
follows: an arbitrary point P1(x1, y1) in the original image is chosen. This point P1 and the kernel point K1<br />
define a kernel ray in the first image. P1(x1, y1) is transformed in the corresponding, normalised image by<br />
the equations A(1.37), A(1.38) into P1’(x1’, y1’). This point may then be used to define the point P2’ in the<br />
other normalised image. Finally, this P2’(x2’, y2’, c’) is transformed into the other original image by the<br />
equations A(1.35) and A(1.36). P2’ and K2 determine the kernel beam in image 2 which corresponds with<br />
the kernel beam in the first original image, determined by the points P1 and K1.<br />
A.1.6 Image pyramid<br />
ABM may be supplemented by the build-up <strong>of</strong> a so-called image pyramid. An image pyramid consists <strong>of</strong><br />
different resolutions <strong>of</strong> the same image, where the top level has the lowest resolution, and thus the smallest<br />
number <strong>of</strong> pixels. The method is also known as the multi-resolution or coarse to fine resolution, as the<br />
pyramid is used beginning at the upper, coarse level. The image pyramid can be regarded as image information<br />
presented in a series, where the resolution increases, when moving downwards in the pyramid.<br />
There are different methods <strong>of</strong> building up an image pyramid. Typically however, the number <strong>of</strong> pixels is<br />
changed by a factor 4 between two neighbouring levels in the pyramid. Here, some <strong>of</strong> the methods employed<br />
most <strong>of</strong>ten are indicated:<br />
� For a group <strong>of</strong> four pixels, the grey level value for the lower left pixel is transferred. The remaining<br />
three pixels are not transferred.<br />
� Every second row and column are eliminated.<br />
� The mean grey level value for 2 x 2 pixels is calculated and transferred to the next level.<br />
� Binomial filter (for instance the Gaussian function) in a window <strong>of</strong>, for instance, 5 x 5 pixels.<br />
151
Correlation techniques<br />
152<br />
� Interpolation, for instance bi-linear, <strong>over</strong> four neighbouring pixels.<br />
The levels <strong>over</strong> the original image will altogether fill 33 % <strong>of</strong> the original image. An example <strong>of</strong> an image<br />
pyramid is seen in figure A.1.7. The individual pyramid levels are determined by calculating the mean<br />
grey level value for 2 x 2 pixels, and transferring it to the next pyramid level.<br />
Figure A.1.7: Image pyramid<br />
The purpose <strong>of</strong> an image pyramid is to achieve temporary values for correlation. The first correlation is<br />
done with <strong>data</strong> from the upper level <strong>of</strong> the pyramid, and the result is then used as temporary values on<br />
the next (finer) pyramid level. The use <strong>of</strong> the image pyramid is very effective in the search for temporary<br />
values, and at the same time quick and certain. There are three valuable qualities in the use <strong>of</strong> the image<br />
pyramid [Ackermann & Hahn, 1991]:<br />
� The area <strong>over</strong> which the correlation is done may be broadened, as there is only need for a<br />
coarse, temporary value at the upper pyramid level.<br />
� The total expense <strong>of</strong> time for the correlation is minimised.<br />
� Greater certainty <strong>of</strong> achieving a correct correlation.<br />
Back in the beginning <strong>of</strong> the 1990s, many, if not all correlation algorithms were based on the image pyramid<br />
principle [Ackermann & Hahn, 1991].<br />
A.1.7 Object pyramid<br />
Level 4<br />
Level 3<br />
Level 2<br />
Level 1<br />
Level 0<br />
If the requirement is to transfer the pyramid principle to FBM, an object pyramid must be built up. The<br />
point <strong>of</strong> departure is an image pyramid, where for each level features are extracted by means <strong>of</strong> an operator<br />
which is described in section 1.2. In contrast to the image pyramid, the object pyramid is built from<br />
the top, and independent <strong>of</strong> the previous levels, see figure A.1.8.
A.1 ABM and FBM<br />
Image pyramid Object pyramid<br />
Figure A.1.8: Creation <strong>of</strong> the object pyramid from the image pyramid<br />
An FBM can then proceed down through the object pyramid by means <strong>of</strong> the results from the previous<br />
pyramid level as temporary values.<br />
A.1.8 Pros and cons<br />
FBM is <strong>of</strong>ten discussed as an alternative to ABM. In reality, both methods have their advantages and<br />
drawbacks [Baltsavias, 1991]. FBM is superior for correlation as regards speed and possibilities [Förstner<br />
1986], and does not require such good temporary values as ABM [Krzystek, 1995; Baltsavias, 1991].<br />
FBM is generally less sensitive to geometric and radiometric deformations [Baltsavias, 1991], but, on the<br />
other hand, it gives a poorer accuracy (1.5 pixels) and more scattered results.<br />
ABM poses problems when the images have been shot from very different positions, when they have a<br />
low signal structure, or are very different and incoherent [Baltsavias, 1991].<br />
The end result for the final correlation with FBM, however, is not as good as with an ABM, where an accuracy<br />
<strong>of</strong> 0.1 pixel can be achieved [Kraus, 1997]. One <strong>of</strong> the drawbacks <strong>of</strong> an ABM, for instance the least<br />
squares matching, is that it requires good temporary values to achieve a good result. Furthermore, the<br />
calculation process <strong>of</strong> least squares matching is demanding, both as regards the calculation time and the<br />
calculation capacity.<br />
FBM is, in general, a superior correlation method as regards speed and versatility. Likewise, when comparing<br />
least squares matching, FBM is better as regards convergence, speed and versatility.<br />
The optimal would therefore be to combine the two methods. FBM is used to achieve good temporary<br />
values, and the least squares matching in ABM is used to find sub pixel level with an accuracy <strong>of</strong> 1/10 <strong>of</strong><br />
a pixel [Kraus, 1997].<br />
153
Correlation techniques<br />
154
Appendix B
The <strong>data</strong> material<br />
156
B.1 Description <strong>of</strong> the <strong>data</strong> material<br />
Appendix B: The <strong>data</strong> material<br />
This appendix includes a description <strong>of</strong> the <strong>data</strong> material which is used in the project, that is, test area,<br />
aerial photos, control points and frame <strong>of</strong> comparison. The appendix is divided into two parts, in the first<br />
part the <strong>data</strong> material itself is described. The second part includes a description <strong>of</strong> the process <strong>of</strong> acquiring<br />
control points, and the frame <strong>of</strong> comparison, consisting <strong>of</strong> analytically measured points in a 25 x 25 m<br />
grid (the frame <strong>of</strong> reference). The second part is concluded with the final control point list.<br />
B.1 Description <strong>of</strong> the <strong>data</strong> material<br />
The structure <strong>of</strong> this part <strong>of</strong> appendix B, is as follows: The chosen test area with typically <strong>Danish</strong> <strong>landscape</strong><br />
types is described in section B.1.1. The shooting and scanning <strong>of</strong> aerial photos, shot at three different<br />
flight altitudes are discussed in section B.1.2. Section B.1.3 includes a presentation <strong>of</strong> control<br />
points, chosen for use at the orientation <strong>of</strong> the aerial photos. In section B.1.4, a description is given <strong>of</strong> the<br />
models chosen as background for the frame <strong>of</strong> reference. Section B.1.5 describes the frame <strong>of</strong> reference,<br />
and the existing <strong>elevation</strong> models are described in section B.1.6.<br />
B.1.1 Test area<br />
With a view to the purpose <strong>of</strong> the project, a test area is required which is representative <strong>of</strong> <strong>Danish</strong> conditions,<br />
that is, including open, flat areas, hilly areas, <strong>over</strong>grown areas, built-up areas etc. Of particular interest<br />
are area types such as woods and buildings, as earlier investigations [Hahn, 1989; Ackermann et<br />
al., 1992; Krzystek et al., 1992] have proved problems with automatic <strong>generation</strong> <strong>of</strong> <strong>elevation</strong> <strong>data</strong> <strong>over</strong><br />
these areas in particular. For practical reasons, proximity to Aalborg University (AAU) has also been<br />
stressed.<br />
The result <strong>of</strong> the search was an area <strong>of</strong> 3.5 x 4 km situated immediately south <strong>of</strong> the university. The area<br />
includes two villages, flat and hilly fields, gravel pits and part <strong>of</strong> a wood. With the chosen test area, more<br />
than 70 % <strong>of</strong> the area types in Denmark are represented. Only densely built-up areas and waters are not<br />
represented. Urban areas are a <strong>landscape</strong> type which [Seyfert, 1995; Thorpe et al., 1996] have taken a<br />
closer look at. Their investigation shows that this kind <strong>of</strong> <strong>landscape</strong> type poses problems. For natural reasons,<br />
no correlation is possible <strong>over</strong> sea or lakes, and these are therefore not interesting for this investigation.<br />
The location <strong>of</strong> the test area is shown in figure B.1.1.<br />
157
The <strong>data</strong> material<br />
Figure B.1.1: The location <strong>of</strong> the test area in relation to Aalborg/Northern Jutland.<br />
B.1.2 Aerial photos<br />
For use in the analysis, digital aerial photos are necessary. When this investigation was started, digital<br />
cameras did not exist. This investigation is therefore done on scanned aerial photos. As the photogrammetric<br />
system Match-T cannot handle colour photos, the aerial photos were shot in black/white.<br />
Earlier investigations, for instance [Ackermann et al., 1992; Eide et al., 1993; Krzystek et al., 1995], show<br />
that the scale and resolution <strong>of</strong> the images have an influence on the accuracy by automatic <strong>generation</strong>.<br />
The aerial photos are therefore shot at 3 different flight altitudes, and so test material in scales 1:5,000,<br />
1:15,000 and 1:25,000 is available. The point <strong>of</strong> departure for these scales is that shots in scale 1:25,000<br />
are the basis <strong>of</strong> the nationwide atlas TOP10DK, and scale 1:5,000 is used for detailed projecting.<br />
1:15,000 has been included in order to determine, whether there is a linear connection between scale and<br />
accuracy. The aerial photos <strong>of</strong> the test area in scales 1:5,000, 1:15,000 and 1:25,000 are c<strong>over</strong>ed by 36,<br />
7 and 2 models respectively.<br />
The images were scanned in a PS1 PhotoScan, where the possible resolutions are 7.5 μm, 15 μm, 30<br />
μm, 60 μm and 120 μm. Traditionally, images have been scanned for many years in the pixel size 21 μm.<br />
To avoid too many analysis options, and to investigate whether the resolution <strong>of</strong> the images by any<br />
chance, has a linear influence, the choice has been to look at only three different resolutions. To avoid<br />
too large <strong>data</strong> quantities, the pixel size 7.5 μm has been excluded. In order to investigate images with a<br />
resolution around the traditional 21 μm, the choice has been to scan in 15 μm, 30 μm and 60 μm, thus<br />
excluding the resolution 120 μm.<br />
Figure B.1.2 shows the flight paths for the photo shot <strong>of</strong> the images in scale 1:5,000.<br />
The requirements for the shooting <strong>of</strong> the images were that these should live up to the general demands<br />
for images for photogrammetric mapping. The images in scales 1.5,000 and 1:15,000 meet the demands,<br />
while the images in scale 1.25,000 are hazy. The point <strong>of</strong> departure for the images was that they would<br />
be shot before leafing foliation. The year 1996, however, was a problematic year, where the snow disappeared<br />
late, and the trees were out early. Therefore, it may be expected that the trees are in leaf.<br />
158<br />
The test area
Figure B.1.2: The flight paths for the shooting <strong>of</strong> images in 1:5,000.<br />
B.1.3 Control points<br />
B.1 Description <strong>of</strong> the <strong>data</strong> material<br />
When this investigation was started the position <strong>of</strong> the airplane determined by GPS/INS was not as trustworthy<br />
as it is today. The images have therefore been orientated by the old traditional way <strong>of</strong> using control<br />
points.<br />
The number <strong>of</strong> control points for the models in scales 1:25,000 and 1:15,000 is small, while for the 36<br />
models in scale 1:5,000, a larger number <strong>of</strong> points is in question. The number <strong>of</strong> control points takes as<br />
point <strong>of</strong> departure the recommendation <strong>of</strong> 4 PP and 6HP per model [Brande-Lavridsen, 1993]. Measuring<br />
by means <strong>of</strong> GPS was time-consuming in the middle <strong>of</strong> the 1990s, and might therefore, with advantage,<br />
be supplemented with a bundle adjustment. Determination <strong>of</strong> control points by photogrammetric methods,<br />
furthermore ensures good coherence and uniform accuracy. For this purpose, the distance between the<br />
<strong>elevation</strong> control points should be 2 times the basis <strong>over</strong> the whole block, while as regards the planimetric<br />
control points, the distance between them should be 4 times the basis along the edge <strong>of</strong> the block<br />
[Brande-Lavridsen, 1993]. For practical reasons, the control points from the models in 1.25,000 are as far<br />
as possible reused for the models in 1:15,000, cf. for example point 500 or 506, see figure B.1.4 and<br />
B.1.5. Where the models c<strong>over</strong> more than the test area, the control points are chosen, so that they primarily<br />
surround the test area, but not necessarily most <strong>of</strong> the model, see figure B.1.4.<br />
The selection <strong>of</strong> control points builds on the <strong>Danish</strong> tradition <strong>of</strong> using terrain objects as control points.<br />
Truly well-defined terrain objects are wells, gratings and road markings, wherefore such points are used<br />
in this project. The use <strong>of</strong> natural control points requires a good contrast between the point and the surroundings.<br />
As regards the size <strong>of</strong> the control points, the National Survey and Cadastre has laid down signalling<br />
guidelines for the size <strong>of</strong> signal plates for use in traditional analogue photogrammetry for models in<br />
scale 1.5,000 at between 25-30 cm x 25-30 cm [The Geodesy division, 1992]. This size <strong>of</strong> signal plane<br />
corresponds to 50 μm - 60 μm in the image. The guidelines are valid for scales down to 1:12,000, but if<br />
the size 60 μm is transferred to the models in scale 1:15,000 and 1:25,000, it corresponds to point sizes<br />
159
The <strong>data</strong> material<br />
<strong>of</strong> 75 –90 x 90 cm and 125-150 x 150 cm respectively. In the middle <strong>of</strong> the 1990s, there existed no specific<br />
guidelines for digital photogrammetry in Denmark, or for that matter, guidelines for the size <strong>of</strong> natural<br />
control points, therefore the aforementioned guidelines were adhered to.<br />
With a view to a later comparison with other <strong>data</strong>, the control points were linked to the GI grid, and the coordinates<br />
were given in System34 Jutland/DNN.<br />
As the control points are used for the <strong>generation</strong> <strong>of</strong> <strong>elevation</strong> <strong>data</strong> as well as for the production <strong>of</strong> the analytically<br />
measured <strong>elevation</strong> <strong>data</strong>, the strictest demand for accuracy by the automatic <strong>generation</strong> <strong>of</strong> <strong>elevation</strong><br />
<strong>data</strong> has been taken as point <strong>of</strong> departure. That is, better than 0.1 ‰ <strong>of</strong> the flight altitude for images<br />
in scale 1:5,000, which means a final accuracy requirement for the frame <strong>of</strong> reference better than 0.075<br />
m. This entails a demand on the GPS measurement <strong>of</strong> 0.015 m in all three directions (see the later section<br />
B.1.5).<br />
As mentioned before, control points <strong>of</strong> the types gratings, wells and road markings have primarily been<br />
used in this project. For the models in scales 1:15,000 and 1:25,000, however, objects such as sand<br />
boxes and flower beds have also been used. More supplementary planimetric control points have been<br />
measured than prescribed, to improve the accuracy <strong>of</strong> the whole model. The total number <strong>of</strong> points (geodetic<br />
reference points and control points) is 119, and the maximum co-ordinate deviation is:<br />
160<br />
x = 0.011 m<br />
y = 0.014 m<br />
z = 0.015 m<br />
See also section B.2.8.4.2 and Appendix E.2 and E.3.<br />
An example <strong>of</strong> a terrain object used as control point is shown in figure B.1.3.<br />
Figure B.1.3: Grating used as control point.<br />
The chosen control points and the location <strong>of</strong> the test area for the models in scale 1:25,000 are shown in<br />
the following figure B.1.4.
581<br />
981<br />
580<br />
583<br />
583<br />
952<br />
506<br />
963<br />
563<br />
Figure B.1.4: Tracing for 1:25,000.<br />
B.1 Description <strong>of</strong> the <strong>data</strong> material<br />
The control points and the location <strong>of</strong> the test area for images in scale 1:15,000 are shown in figure B.1.5.<br />
515<br />
582<br />
583<br />
512<br />
580<br />
983<br />
554<br />
506<br />
520<br />
909<br />
903<br />
953<br />
553<br />
963<br />
952<br />
As mentioned earlier, as regards the images in scale 1:5,000, only the number <strong>of</strong> control points necessary<br />
to do a bundle adjustment has been chosen. The location <strong>of</strong> these control points is shown in figure<br />
B.1.6. As the models in scale 1:5,000 are all situated within the test area, this has not been delineated in<br />
figure B.1.6.<br />
As may be seen from the tracing, plane control points for 4 times the basis in the middle <strong>of</strong> the model<br />
have also been chosen, even if this is not strictly necessary.<br />
503<br />
565<br />
962<br />
562<br />
552<br />
Figure B.1.5: Tracing for scale 1:15,000.<br />
500<br />
972<br />
574<br />
551<br />
954 957<br />
590<br />
963<br />
990<br />
526<br />
551<br />
571<br />
971<br />
574<br />
500<br />
972<br />
550<br />
524<br />
161
The <strong>data</strong> material<br />
The control determination has been described in more detail in another part <strong>of</strong> Appendix B.<br />
B.1.4 Selection <strong>of</strong> models and area types<br />
Not all models in scale 1.5,000 are included in the investigation. The selection <strong>of</strong> models is done on the<br />
following basis: the quality <strong>of</strong> the control points and the <strong>landscape</strong> types represented in the model. Interesting<br />
area types are flat and hilly areas, wooded/<strong>over</strong>grown areas, built-up areas and gravel pits.<br />
As it will appear from figure B.2.7 (see section B.2.2.1), the control points in the corners <strong>of</strong> the test area<br />
are not so well determined as in the rest <strong>of</strong> the block. It has therefore been the aim to select models<br />
which were not corner models. The 14 models were chosen to represent the test basis in scale 1:5,000,<br />
and it is also those models which are the basis <strong>of</strong> the frame <strong>of</strong> reference. The selected models, and thus<br />
the location <strong>of</strong> the frame <strong>of</strong> reference in the test area are shown in figure B.1.7. The individual <strong>landscape</strong><br />
types are represented by colours, where red is village, blue is woods, green is flat fields, violet is hilly<br />
fields, and orange is gravel pits.<br />
162<br />
582<br />
584<br />
984<br />
511<br />
518 906<br />
516 907<br />
517<br />
982<br />
585<br />
985<br />
510<br />
513<br />
520<br />
521<br />
954<br />
909<br />
555<br />
Figure B.1.6: Tracing for scale 1:5,000<br />
505<br />
903<br />
564<br />
519<br />
908<br />
963<br />
962<br />
556<br />
964<br />
503<br />
961<br />
561<br />
565<br />
501<br />
528<br />
575<br />
973<br />
912<br />
576<br />
573<br />
911<br />
560<br />
960<br />
971<br />
572<br />
574 972<br />
577<br />
527<br />
522<br />
570<br />
571<br />
523<br />
910
B.1 Description <strong>of</strong> the <strong>data</strong> material<br />
Figure B.1.7: The location <strong>of</strong> the <strong>landscape</strong> types in the 3.5 x 4.0 km large test area.<br />
The measured points <strong>of</strong> reference have been assigned an object code which refers to the different <strong>landscape</strong><br />
types. The number <strong>of</strong> points <strong>of</strong> reference for the different <strong>landscape</strong> types are distributed as follows:<br />
Code 12 = Flat terrain: 2092 points<br />
Code 34 = Gravel pits: 2429 points<br />
Code 56 = Village: 1629 points<br />
Code 78 = Hilly terrain: 2814 points<br />
Code 90 = Woods/vegetation: 1223 points<br />
Total: 10.188 points<br />
Aalborg<br />
University<br />
Gravel pit<br />
Flat<br />
terrain<br />
Test area<br />
Village<br />
Woods<br />
Hilly<br />
terrain<br />
The points <strong>of</strong> reference are measured in a grid with a fixed mesh size <strong>of</strong> 25 x 25 m. However, in the <strong>landscape</strong><br />
type gravel pit, the measured grid has a mesh size <strong>of</strong> 5 x 5 m. This is due to the fact that this <strong>landscape</strong><br />
type is steeper than the others. Furthermore, this <strong>landscape</strong> type c<strong>over</strong>s a somewhat smaller area<br />
than the others, and to get a sufficient number <strong>of</strong> points for the statistical material, the mesh size must be<br />
smaller. It is seen that there is a sufficient number <strong>of</strong> points for a statistically representative frame <strong>of</strong> reference.<br />
163
The <strong>data</strong> material<br />
B.1.5 Analytically measured points <strong>of</strong> reference<br />
In order to make an analysis <strong>of</strong> <strong>elevation</strong> <strong>data</strong> determined in different ways <strong>over</strong> an area, a frame <strong>of</strong> reference<br />
<strong>over</strong> this area must be available. This frame <strong>of</strong> reference may be established in different ways.<br />
The <strong>elevation</strong>s may be determined by levelling, or, for instance, by use <strong>of</strong> GPS or by photogrammetry etc.<br />
In this project, the choice has been to determine the frame <strong>of</strong> reference photogrammetrically in an analytical<br />
instrument, on the basis <strong>of</strong> the same aerial photos and control points which are used for the automatic<br />
<strong>generation</strong> <strong>of</strong> <strong>elevation</strong> <strong>data</strong>. The point set is thus independent <strong>of</strong> the method for automatic <strong>generation</strong><br />
<strong>of</strong> <strong>elevation</strong> <strong>data</strong> itself, but takes the same <strong>data</strong> as point <strong>of</strong> departure. As the automatic <strong>generation</strong> is<br />
done in a fixed grid without break lines (cf. Chapter 2, section 2.4.3.2), the best basis <strong>of</strong> comparison is a<br />
grid, that is, with identical plane co-ordinates. The chosen mesh size in Match-T is 25 x 25 m, 12.5 x 12.5<br />
m and 5 x 5 m respectively.<br />
The original idea was that the analytically measured <strong>elevation</strong> <strong>data</strong> should be compared with the automatically<br />
generated <strong>elevation</strong> <strong>data</strong> as well as with existing <strong>elevation</strong> models. Therefore, the points were<br />
co-ordinated in System34 Jutland/DNN. If the existing <strong>elevation</strong> model was not to be included directly, but<br />
only used as frame <strong>of</strong> comparison for the accuracy demands <strong>of</strong> the method, the analytical determination<br />
<strong>of</strong> the points could be done in a local system, and thus be quite uninfluenced by existing grid tensions.<br />
In order to be able to use the analytically measured <strong>elevation</strong> <strong>data</strong> as frame <strong>of</strong> reference, these points<br />
must have a superior accuracy. It is stated in the literature that it is possible to determine <strong>elevation</strong> <strong>data</strong><br />
automatically with an accuracy <strong>of</strong> 0.1 ‰ <strong>of</strong> the flight altitude [Krzystek et al., 1992]. Images in scale<br />
1:5,000 are shot at a flight altitude <strong>of</strong> 750 m, which means that by automatic <strong>generation</strong> <strong>of</strong> <strong>elevation</strong> <strong>data</strong>,<br />
an accuracy <strong>of</strong> approx. 0.075 m should be possible to achieve. For images in scale 1:15,000, an accuracy<br />
<strong>of</strong> approx. 0.225 m should thus be possible, while for images in scale 1:25,000, the accuracy might be<br />
approx. 0.375 m.<br />
If the analytically measured <strong>elevation</strong> <strong>data</strong> is to have a superior accuracy in relation to the automatically<br />
generated <strong>elevation</strong> <strong>data</strong>, the point deviation must not exceed 0.03 m – 0.04 m, because <strong>of</strong> the high degree<br />
<strong>of</strong> accuracy, which may be expected in scale 1:5,000. However, this cannot be achieved, as the expected<br />
accuracy <strong>of</strong> the result <strong>of</strong> an aerotriangulation with use <strong>of</strong> images in scale 1:5,000 is better than<br />
0.05 m in the planimetric, and 0.05 m – 0.10 m in <strong>elevation</strong>. As the largest error contribution traditionally<br />
arises from the photogrammetric part, the accuracy demand for the GPS measurement <strong>of</strong> the control<br />
points is less than 0.015 m in all three dimensions.<br />
For the production <strong>of</strong> the frame <strong>of</strong> reference, an analytical instrument <strong>of</strong> the type Planicomp was available<br />
for the project. To minimise the error contribution from the manual measuring <strong>of</strong> the analytically measured<br />
<strong>elevation</strong> <strong>data</strong>, an experienced stereo operator did the work.<br />
The provision <strong>of</strong> the analytically measured <strong>elevation</strong> points is described in more detail in section B.2.2.<br />
As it will appear later from section B.2.2.2, the accuracy <strong>of</strong> the aerotriangulation has not turned out so<br />
well as expected. To this must be added the error contribution from the analytical measuring, after which<br />
the total accuracy <strong>of</strong> the analytically measured points is estimated to be 0.10 m (see the later section<br />
B.2.2.3). This accuracy is not superior for models in 1:5,000, as the literature [Krzystek et al., 1992;<br />
Krzystek et al., 1995] prescribes that an accuracy <strong>of</strong> 0.075 m can be achieved here. This means that the<br />
frame <strong>of</strong> reference must be used with caution for the evaluation <strong>of</strong> the result <strong>of</strong> automatically generated<br />
<strong>elevation</strong> <strong>data</strong> in scale 1.5,000. For images in scale 1:15,000 or 1:25,000, the accuracy achieved will still<br />
be superior in relation to 0.225 m and 0.375 m respectively, which may be achieved by automatic <strong>generation</strong><br />
<strong>of</strong> <strong>elevation</strong> <strong>data</strong>.<br />
164
B.2 Data capture<br />
B.2 Data capture<br />
The second part includes section B.2.1 about control point capture, and section B.2.2 about capture <strong>of</strong><br />
the analytically measured <strong>elevation</strong> <strong>data</strong> which are used as frame <strong>of</strong> comparison, called the frame <strong>of</strong> reference.<br />
B.2.1 Capture <strong>of</strong> control points<br />
With point <strong>of</strong> departure in the requirements <strong>of</strong> the control points mentioned in section B.1.3, the process<br />
<strong>of</strong> capturing the control point co-ordinates will be described here.<br />
B.2.1.1 Planning<br />
B.2.1.1.1 Geodetic reference<br />
The control points must be measured in relation to the nationwide, superior net, the Geodetic reference<br />
net, as a later comparison with other <strong>elevation</strong> <strong>data</strong> may then be possible. The connection to the Geodetic<br />
reference net has, furthermore, the advantage that it is possible to control the measurement, as both<br />
<strong>elevation</strong> and planimetric reference points are included. Thus, gross errors can be detected, and a possible<br />
repeat measurement can be planned optimally. Reference points are selected, so that they are<br />
Figure B.2.1: The location <strong>of</strong> the geodetic reference points in relation to the test area.<br />
165
The <strong>data</strong> material<br />
dispersed evenly and c<strong>over</strong> the whole area, see figure B.2.1.<br />
To satisfy the demand for accuracy in the control points, these are measured with GPS. As the <strong>elevation</strong><br />
reference points are <strong>of</strong>ten placed on, for instance, house walls, a moving-out/establishment <strong>of</strong> the <strong>of</strong>fset<br />
point is necessary, which is then determined by means <strong>of</strong> levelling. These <strong>of</strong>fset points are then measured<br />
with GPS. Where possible, these <strong>of</strong>fset points are included as <strong>elevation</strong> control points as well.<br />
B.2.1.1.2 Equipment<br />
At the disposal <strong>of</strong> the measurement were two-frequency Ashtech Z12 receivers with the matching programme<br />
package called PRISM. The calculation <strong>of</strong> the vectors was done with PNAV, a calculation module<br />
in the Ashtech programme package, and the subsequent adjustment was done with the module Fillnet.<br />
B.2.1.2 Grid structure<br />
The optimal location <strong>of</strong> the master station is in a point with free horizon. The reach <strong>of</strong> the measuring<br />
method in the mid 1990s was a maximum <strong>of</strong> 10 km, therefore, the master station should be located within<br />
a radius <strong>of</strong> 10 km. Furthermore, it was required that the point where the master station was placed, was a<br />
point where all three co-ordinates were known.<br />
Two points were chosen for the master set-ups. One was a point located on the wall <strong>of</strong> a building at Aalborg<br />
University called 0011. This point was chosen, as there is a free horizon, and it is situated in such a<br />
way that the point could be under surveillance, while the field measurements were done. In addition, the<br />
geodetic reference point 62-09-007 on Storhøj was chosen. Storhøj is a tumulus with free horizon in the<br />
middle <strong>of</strong> the test area. While the point at Aalborg University was known with co-ordinates in all three<br />
planes, the 62-09-007 point was only known in the x, y plane, but as the point was situated in the middle<br />
<strong>of</strong> the test area, and therefore was <strong>of</strong> optimum use, its <strong>elevation</strong> was determined for the occasion.<br />
Figure B.2.2: The masterstation on the wall <strong>of</strong> Fibigerstræde 11, Aalborg University and on Storhøj, geodetic reference<br />
point GI 62-09-007.<br />
Planimetric control points and fully measured points are assigned numbers from 500-599. The <strong>elevation</strong><br />
control points are assigned numbers from 600 and up.<br />
B.2.1.2.1 Measuring method<br />
The GPS measurement was done as a cinematic measurement called ”stop and go”. The chosen surveying<br />
method can be used for both real-time positioning and for post-processing. The last mentioned is chosen<br />
for this measuring task because <strong>of</strong> the greater accuracy which is expected at cm level [Cederholm,<br />
1995].<br />
At the ”stop and go” survey, <strong>data</strong> is captured continuously in both r<strong>over</strong> and master. When the r<strong>over</strong> is<br />
moved between the points, the contact to the satellites must be preserved. In that way, the measuring<br />
166
Figure B.2.3: Example <strong>of</strong> the r<strong>over</strong> on the move<br />
B.2 Data capture<br />
time is reduced, as it is not required to initialise ( make contact with the satellites) for each new point. Initialising<br />
is only done in the first point, and if the contact is lost in the course <strong>of</strong> the process. A first time initialisation<br />
takes approx. 10 minutes, while an initialisation on the way is a little shorter. To achieve good<br />
results, contact to a minimum <strong>of</strong> 5 satellites is required, and also that PDOP is less than 4 [Cederholm,<br />
1995].<br />
The R<strong>over</strong> antenna is mounted on a Kern telescope tripod which can be moved fairly easily while, at the<br />
same time, the contact to the satellite is maintained. Likewise, a stable set-up is secured, where the centering<br />
is maintained during the whole <strong>of</strong> the survey. The antenna <strong>elevation</strong> is not meant to be fixed during<br />
the whole process, but changed so that there is always the best possible contact with the satellites. This<br />
means that the antenna <strong>elevation</strong> must be registered for each set-up.<br />
Over-determination is achieved by measurement <strong>of</strong> two vectors for each point. This can be done, either<br />
by simultaneous measuring to two master stations, or by two separate measurements, each with one<br />
master. By using two master stations at the same time, a wrongly indicated antenna <strong>elevation</strong> will not be<br />
disc<strong>over</strong>ed, wherefore the choice has been to use two separate measurements.<br />
B.2.1.3 Changes during the field survey<br />
During the course <strong>of</strong> the process, it turned out to be necessary to extend the numbering system. Extra or<br />
re-measured points were assigned four-digit numbers by adding 6, 7, 8 or 9 respectively in front <strong>of</strong> the<br />
original number. As the <strong>elevation</strong> control points are not well-defined horizontally, and therefore cannot be<br />
re-measured in precisely the same place, they received a 9xx number at the first measurement, and at<br />
the second measurement one <strong>of</strong> the above-mentioned four-digit numbers. At the assignment <strong>of</strong> four-digit<br />
numbers, no difference was made between a required measurement and a re-measurement.<br />
B.2.1.4 Calculation<br />
Figure B.2.4: An example <strong>of</strong> a r<strong>over</strong> position<br />
With the co-ordinate calculation by the PNAV module, there are two methods to choose between. Data<br />
can be calculated from the beginning in the order in which they have been measured, or a double calculation<br />
can be done beginning from the end and then from the beginning. The last-mentioned method closes<br />
a part <strong>of</strong> the cycle slips which may have arisen during the measurements, and it is therefore chosen for<br />
this project.<br />
According to how good a solution the programme achieves, the solution for the vector <strong>of</strong> the point is assigned<br />
the designation ”fixed” or ”floating”. By a ”fixed” solution, the determination <strong>of</strong> the whole number <strong>of</strong><br />
167
The <strong>data</strong> material<br />
wavelengths is an integer. With a ”floating” solution, the determination <strong>of</strong> the whole number <strong>of</strong> wavelengths<br />
is approximately solved. Only points with the designation ”fixed” were used in the further process,<br />
whereas the points with the designation ”floating” were measured again.<br />
The subsequent adjustment in the module Fillnet was done both freely and quickly.<br />
The grid sketch in figure B.2.5 shows that the grid is harmonious, and that there are two vectors to almost<br />
all points. For a single point, two vectors from 0011 have been measured instead <strong>of</strong> one from 0011 and<br />
one from GI 62-09-007. Other points originally had one vector from 0011 and one vector from 007 was<br />
measured, but the vector from 0011 was poor because <strong>of</strong> a bad connection to the satellites. This vector<br />
has therefore been taken out <strong>of</strong> the calculation, and the vector has not been re-measured, as the point is<br />
an <strong>elevation</strong> reference point, and not a control point.<br />
B.2.1.5 Evaluation<br />
119 points were measured, and the result <strong>of</strong> the free adjustment is shown in Appendix E.1. The fixed adjustment<br />
is shown in Appendix E.2.<br />
B.2.1.5.1 The free adjustment<br />
The calculation programme PNAV requires that a minimum <strong>of</strong> one point is fixed. A free adjustment <strong>over</strong><br />
all the points can therefore not be done. The closest you can come to a free adjustment is by fixing only<br />
one point. With a free adjustment the aim is that the standard deviation <strong>of</strong> the weight unity is around 1. By<br />
using Fillnet’s standard a priori values, the standard deviation on the weight unit was approx. 1.8<br />
[Ashtech, 2002]. Fillnet’s standard a priori values for latitude, longitude and <strong>elevation</strong> <strong>of</strong> 0.003, 0.005 and<br />
0.005 respectively were estimated as too narrow by the measuring <strong>of</strong> natural control points, where the<br />
point definition cannot assert that accuracy. These a priori values were therefore increased to the double<br />
size <strong>of</strong> 0.006, 0.010 and 0.010. After this, the standard deviation on the weight unit fell to 1.015. The<br />
greatest deviations are seen for points determined by a single vector, that is, the <strong>elevation</strong> control points.<br />
For the remaining points, the deviation is less than one centimetre in all three directions.<br />
It may be seen from Appendix E.1 that the maximum co-ordinate deviation <strong>of</strong> the points by the free adjustment<br />
is:<br />
168<br />
Figure B.2.5: The grid sketch<br />
x = 0.011 m<br />
Aalborg University<br />
0011<br />
GI 62-09-007
y = 0.011 m<br />
z = 0.011 m<br />
B.2 Data capture<br />
For the evaluation <strong>of</strong> the measurement, the co-ordinates to the reference points from the free adjustment<br />
can be compared with the co-ordinates from the National Survey and Cadastre.<br />
The point fixed in the adjustment is point GI 62-07-007. Table B.1 shows the given and the calculated coordinate<br />
for the plane reference points plus the deviation.<br />
Point num- Given co-ordinates Measured co-ordinates Deviations<br />
ber X (m) Y (m) X (m) Y (m) � X (m) � Y (m)<br />
62-04-001 -233063.37 283824.09 -233063.375 283824.088 0.005 0.002<br />
62-09-003 -236757.47 282257.20 -236757.439 282257.179 -0.031 0.021<br />
62-09-007 -235111.88 284064.85 -235111.880 284064.850 0.000 0.000<br />
62-09-008 -237630.91 285102.78 -237630.916 285102.741 -0.006 0.039<br />
62-13-006 -236203.02 286570.39 -236203.059 286570.339 -0.057 0.051<br />
62-13-007 -232601.67 287097.65 -232601.632 287097.668 0.038 -0.018<br />
Table B.1: Given and calculated X, Y-co-ordinates and the deviation between these by fixing point GI 62-13-007.<br />
Table B.1 shows that the deviations for point 62-13-006 is somewhat larger than for the other points. It is<br />
assumed that the measurement is normally distributed, and that there may appear points with a deviation<br />
<strong>of</strong> 3 times the standard deviation. If the accuracy <strong>of</strong> the planimetric geodetic reference point is set at<br />
0.015 m, a deviation <strong>of</strong> up to 0.045 m is acceptable. The deviation for point 62-13-006 therefore exceeds<br />
3 times the standard deviation. The deviation may be due to damage to the point, which is not the case,<br />
however. As point 62-09-007 is fixed, the deviation might also be due to damage to point 62-09-007,<br />
which is not the case either. What really causes the deviation is uncertain, as both points are situated optimally<br />
on an open Viking burial mound, and thus <strong>of</strong>fer the very best conditions for receiving. Point 62-13-<br />
006 has not been included in the final calculation.<br />
The same comparison is done for the geodetic reference <strong>elevation</strong> points. Here, it is the <strong>elevation</strong> from<br />
the <strong>of</strong>fset points and a single fully measured reference point which are compared with the measured <strong>elevation</strong>s.<br />
Point No. Given <strong>elevation</strong>s (m) Measured <strong>elevation</strong>s (m) Deviations (m)<br />
62-13-007 45.749 45.755 -0.006<br />
501 48.117 48.107 0.010<br />
570 46.285 46.301 -0.016<br />
901 48.786 48.788 -0.002<br />
902 47.777 47.735 0.042<br />
905 47.337 47.335 0.002<br />
906 48.014 48.010 0.004<br />
909 48.844 48.833 0.011<br />
950 69.037 69.038 -0.001<br />
951 61.753 61.737 0.016<br />
953 85.843 85.835 0.008<br />
954 61.146 61.144 0.002<br />
955 80.140 80.143 -0.003<br />
970 50.175 50.180 -0.005<br />
990 70.531 70.522 0.009<br />
Table B.2: Given and measured z-co-ordinates and the deviation between them.<br />
169
The <strong>data</strong> material<br />
It can be seen in table B.2 that the greatest deviation between a given <strong>elevation</strong> and the measured <strong>elevation</strong><br />
is in point 902, where the deviation is 0.042 m. The <strong>of</strong>fset point 902 was not optimally placed for<br />
measuring with GPS, as there were many trees, which caused many cycle slips. These may have caused<br />
the point to have been poorly determined. As regards the remaining points, the deviation is less than<br />
0.016 m. Point 902 is, likewise, not included in the final calculation.<br />
It may be seen from both table B.1 and B.2 that the results <strong>of</strong> the measurements are satisfactory.<br />
B.2.1.5.2 The retained adjustment<br />
[NS&C, 1989] has stated that the neighbouring accuracy <strong>of</strong> the planimetric geodetic reference points is<br />
better than 2 cm per km. As shown in table 1, there are great tensions at reference point 62-13-006. This<br />
point has, therefore, not been included in the final adjustment. As for the remaining reference points,<br />
there have not been greater deviations than the stated standard deviation from the National Survey and<br />
Cadastre times 3, these are therefore retained, which means that 5 planimetric and 14 <strong>elevation</strong> reference<br />
points have been retained.<br />
As seen in Appendix E.2, the maximum co-ordinate deviation is:<br />
170<br />
x = 0.011 m<br />
y = 0.014 m<br />
z = 0.015 m<br />
The measurement thus meets the accuracy requirement <strong>of</strong> 0.015 m determined in section B.1.3.<br />
The points were transformed from WGS 84 to System34 Jutland. Furthermore, the y- and x-columns were<br />
exchanged, and the x-co-ordinates multiplied by –1. This was done so that the co-ordinates might be included<br />
in a bundle adjustment in the programme packages Bingo and Match-T.<br />
B.2.2 Capture <strong>of</strong> analytically measured <strong>elevation</strong> <strong>data</strong><br />
A superior accuracy <strong>of</strong> 0.03 m – 0.04 m as discussed in section B.1.5 can only be achieved by GPS<br />
measurement or by levelling. These measuring methods, on the other hand, are time-consuming, and it is<br />
difficult to determine the <strong>elevation</strong> <strong>data</strong> in a uniform square grid. Photogrammetric determination in images<br />
in scale 1:5,000, in comparison, cannot quite meet the accuracy requirements, but is far quicker and<br />
easier for this task. Seen in the time frame <strong>of</strong> this project, the choice therefore fell on photogrammetric<br />
determination.<br />
The photogrammetric process <strong>of</strong> determining <strong>elevation</strong> <strong>data</strong> in a square grid consists <strong>of</strong> several parts, <strong>of</strong><br />
which the first is the relative orientation (section B.2.2.1). In the orientated images, the image coordinates<br />
are measured, and then a bundle adjustment is done (section B.2.2.2), and finally, the reference<br />
points are measured in an analytical instrument (section B.2.2.3). To achieve the best total accuracy,<br />
the aim is for each <strong>of</strong> these parts to result in as small a standard deviation as possible.<br />
B.2.2.1 Relative orientation<br />
The relative orientation is done in an analytical instrument, Planicomp. In connection with the relative orientation,<br />
a fixed numbering system was chosen, so that all point numbers are four-digit numbers. The first<br />
number refers to the flight path, while the next numbers refer to the model number. A minimum <strong>of</strong> 5 points<br />
must be determined in order to solve the relative orientation [Brande-Lavridsen, 1993]. In practice, more<br />
points are always measured to achieve <strong>over</strong>-determination, so that adjustments may be done, and poorly<br />
determined points may be excluded. For each model, 12 tie points were measured together with the control<br />
points which might be in the model. As regards the tie points between the flight paths, sketches were<br />
drawn, so that it was possible to rec<strong>over</strong> these in the neighbouring flight path.
B.2 Data capture<br />
The accuracy requirement for the individual orientation <strong>over</strong> 12 tie points for each model is set at max. 5<br />
μm. Only a few models do not meet this demand fully, in spite <strong>of</strong> re-measurements. These models are included<br />
anyway.<br />
Figure B.2.6: Model <strong>over</strong>view <strong>of</strong> the relative orientation with ties between the flight lines.<br />
The image co-ordinates from the relative orientation are now ready for use in a bundle adjustment.<br />
B.2.2.2 Bundle adjustment<br />
The bundle adjustment was done with the programme Bingo developed by Hann<strong>over</strong> University. The image<br />
co-ordinates to the tie and control points from the relative orientation were transferred from the analytical<br />
instrument Planicomp to Bingo.<br />
As part <strong>of</strong> the programme, Bingo helps the user, on the way, as regards detecting gross errors. As 12 tie<br />
points were measured with the points determined in pairs, points with large residuals could be eliminated,<br />
but only one point per pair. Bingo eliminates automatically the points with the poorest determination. Furthermore,<br />
the less good points are indicated with an asterisk system, where the poorest points are indicated<br />
with 4 asterisks, less poor points with 3 asterisks etc. The good points have no asterisk.<br />
In Bingo, the control points must be indicated with a point deviation. Experiences from [Hansen et al.,<br />
1995] show that an a priori value for the point deviation <strong>of</strong> 0.04 m is suitable in order for an adjustment<br />
iteration to start. As a priori value for the image co-ordinates from the relative orientation, Bingo’s standard<br />
value <strong>of</strong> 4 μm is used [Kruck, 1995].<br />
Figure B.2.7 shows the result <strong>of</strong> the bundle adjustment.<br />
Line 1<br />
2000 numbers<br />
Line 2<br />
3000 numbers<br />
Line 3<br />
4000 numbers<br />
Line 4<br />
5000 and 6000<br />
numbers<br />
171
The <strong>data</strong> material<br />
Figure B.2.7: The error ellipses from Bingo for the images in scale i 1:5,000.<br />
As will be seen from figure B.2.7, some <strong>of</strong> the points are less well determined, in particular, the points in<br />
the corners.<br />
The use <strong>of</strong> Bingo’s standard value for an a priori value <strong>of</strong> 4 μm must be reckoned too narrow, as the demand<br />
for accuracy <strong>of</strong> the model measurement at the relative orientation was set at 5 μm. This may also<br />
be concluded from the fact that the accuracy <strong>of</strong> the adjustment <strong>of</strong> all the models was 5.64 μm.<br />
It is also seen that the relation between a posteriori and a priori values is 1.41, while the value aimed for<br />
was 1.<br />
The result <strong>of</strong> the bundle adjustment was an accuracy <strong>of</strong> 0.06 m, see Appendix E.6.<br />
B.2.2.3 The frame <strong>of</strong> reference<br />
Before the reference points can be determined, the images must be orientated absolutely. This was done<br />
in the analytical instrument, Planicomp. The co-ordinates <strong>of</strong> control points and tie points were transferred<br />
to the Planicomp, and subsequently a transformation was done in the analytical instrument. Thereby, the<br />
images are orientated absolutely, and the reference points can then be determined.<br />
The reference points were not determined for the whole test area, but only for models/areas with <strong>landscape</strong><br />
types which were interesting for the investigation. At the selection <strong>of</strong> the models, the accuracy <strong>of</strong><br />
the control points was also considered. 14 models were selected. The frame <strong>of</strong> reference was determined<br />
by an experienced operator to lessen the error contribution.<br />
The accuracy <strong>of</strong> the frame <strong>of</strong> reference is a combination <strong>of</strong> the standard deviations <strong>of</strong> the control points,<br />
including their measuring and definition, and an experience contribution <strong>of</strong> 0.06 ‰ <strong>of</strong> the flight altitude<br />
which indicates how well an experienced operator can measure <strong>elevation</strong> <strong>data</strong>.<br />
172
B.2 Data capture<br />
The standard deviation <strong>of</strong> the photogrammetrically measured <strong>elevation</strong> <strong>data</strong> (the frame <strong>of</strong> reference)<br />
therefore consists <strong>of</strong> these three contributions:<br />
where:<br />
2<br />
�z = ((0.06 ‰ ) 2 + �ctrp + �def<br />
�z = The standard deviation <strong>of</strong> the photogrammetrically measured <strong>elevation</strong> <strong>data</strong><br />
0.06 ‰ = The empirical experience <strong>of</strong> how well a pr<strong>of</strong>essional operator can measure <strong>elevation</strong> <strong>data</strong><br />
�ctrp = The standard deviation <strong>of</strong> the control point determination by GPS<br />
�def = The standard deviation <strong>of</strong> the control point definition<br />
A bundle adjustment has been done in this project. In the standard deviation <strong>of</strong> this bundle adjustment,<br />
the standard deviation <strong>of</strong> the measurement and definition <strong>of</strong> the control points are included. As may be<br />
seen from Appendix E.6, the standard deviation for the control points after the aerotriangulation is:<br />
x = 0.031 m<br />
y = 0.034 m<br />
z = 0.045 m<br />
and the standard deviation for the tie points after the aerotriangulation is:<br />
x = 0.034 m<br />
y = 0.040 m<br />
z = 0.060 m<br />
For Bingo/Match-T used on images in scale 1:5,000, it applies that the output includes the control point<br />
deviation as well as the aerotriangulation deviation. Furthermore, the estimated accuracy <strong>of</strong> the measurement<br />
<strong>of</strong> <strong>elevation</strong> <strong>data</strong> also includes the deviation <strong>of</strong> the orientation <strong>of</strong> the images. To lessen the error<br />
contribution from the measurement <strong>of</strong> the reference points, this part has been done by an experienced<br />
operator.<br />
This means that the accuracy can be determined as:<br />
where:<br />
2<br />
�z = ((0.06 ‰ ) 2 + �aero + ctrp + orient 2 = 0.045 2 + 0.06 2 = 0.075 m<br />
�z = the standard deviation <strong>of</strong> the photogrammetrically measured <strong>elevation</strong> <strong>data</strong><br />
�aero + ctrp + orient = the standard deviation <strong>of</strong> the aerotriangulation which is 0.06 m<br />
0.06 ‰ = the empirical experience <strong>of</strong> how well a pr<strong>of</strong>essional operator can measure<br />
<strong>elevation</strong> <strong>data</strong><br />
As will be seen from the above, the accuracy in the z-direction is around 0.075 m.<br />
Very few control points have a standard deviation after the bundle adjustment larger than 0.1 m. If this<br />
deviation is used as evaluation basis for the frame <strong>of</strong> reference, we have:<br />
2<br />
�z = ((0.06 ‰ ) 2 + �aero + ctrp + orient 2 = 0.045 2 + 0.1 2 = 0.11 m<br />
The accuracy <strong>of</strong> the whole frame <strong>of</strong> reference is therefore set at 0.1 m. An accuracy <strong>of</strong> 0.1 m is not superior<br />
compared to the accuracy which may be achieved by use <strong>of</strong> images in scale 1:5,000. For images in<br />
scales 1:15,000 and 1:25,000, the frame <strong>of</strong> reference has a superior accuracy.<br />
173
The <strong>data</strong> material<br />
The points <strong>of</strong> reference are determined with a fixed mesh size <strong>of</strong> 25 x 25 m. For the <strong>landscape</strong> type<br />
gravel pit, the mesh size was reduced to 5 x 5 m. The mesh size was fixed automatically by the Planicomp.<br />
When it proved impossible to determine <strong>elevation</strong> <strong>data</strong> in the fixed mesh grid, for instance because<br />
<strong>of</strong> trees or houses, the point was moved out to an area, where it was possible to see the ground, and<br />
here the <strong>elevation</strong> and the corresponding x- and y-co-ordinates were registered. Then it was moved back<br />
to the original grid, where the measurement continued. The planimetric co-ordinates to the reference<br />
points with the mesh size 25 x 25 m were chosen so that the x- and y-co-ordinates ended in ***00.00,<br />
***25.00, ***50.00 and ***75.00. For the mesh size 5 x 5 m, the plane co-ordinates fell on ****5.00 or<br />
****0.00.<br />
All in all, 10188 points were registered, distributed with 2092 points in open, flat fields, 2814 points in hilly<br />
fields, 12123 points in woods, 1629 points in village and 2429 points in the gravel pit.<br />
B.2.2.4 The control point list<br />
The control point list consists <strong>of</strong> the 119 control points determined by GPS, see Appendix E.3. These<br />
points are included in the bundle adjustments, see Appendix E.<br />
As mentioned earlier, the <strong>elevation</strong> control points have been determined by means <strong>of</strong> a minimum <strong>of</strong> two<br />
independent vectors. The first was assigned a point number 9***, the next the numbers 9***, 8*** or 7***<br />
in the number series. An <strong>elevation</strong> mean <strong>over</strong> these points was determined after the bundle adjustment,<br />
and used in the final co-ordinate list.<br />
Those reference points and <strong>of</strong>fset points which are not suitable as <strong>elevation</strong> control points have been<br />
taken out <strong>of</strong> the control point list, as they are no longer to be used.<br />
174
Appendix C
Analysis programme PIL<br />
176
C.1 Description <strong>of</strong> the analysis programme PIL<br />
Appendix C: Analysis programme PIL<br />
With regard to investigation and evaluation <strong>of</strong> automatically generated <strong>elevation</strong> <strong>data</strong> in relation to a<br />
frame <strong>of</strong> reference, an analytical tool is required. The actual investigation evaluates <strong>elevation</strong> <strong>data</strong> generated<br />
by the programme package Match-T, used in a selected test area (cf. Chapter 4 and Appendix B).<br />
C.1 Description <strong>of</strong> the analysis programme PIL<br />
C.1.1 Demands on the analysis programme PIL<br />
One <strong>of</strong> the basic demands on an analysis tool is complete insight into method and <strong>data</strong>. The analysis tool<br />
must be able to present various statistical <strong>data</strong> calculated on the basis <strong>of</strong> the differences between reference<br />
<strong>data</strong> and generated <strong>elevation</strong> <strong>data</strong>, such as the maximum (max) and minimum (min) deviation,<br />
mean (mean), the standard deviation (Stnd), the Root Mean Square Error (RMSE) etc. It must be possible<br />
to do these calculations separately according to <strong>landscape</strong> type. It must also be possible to cut out<br />
points, where the difference exceeds a chosen limit. Furthermore, the programme must be able to take a<br />
possible <strong>of</strong>fset into consideration, here calculated as the mean (mean).<br />
The input format must be able to handle Match-T files. The output files from the programme must be<br />
flexible as regards the presentation <strong>of</strong> result file and method. One demand to the output files is that they<br />
must be in GeoCAD format, so that it is possible to use GeoCAD for visualisation <strong>of</strong> the results. GeoCAD<br />
is a CAD programme developed in Denmark.<br />
The point <strong>of</strong> departure is that there are two <strong>elevation</strong> models in existence <strong>over</strong> an area, for example, a<br />
new <strong>elevation</strong> model and a frame <strong>of</strong> reference. The programme is built up so that the one <strong>elevation</strong> model<br />
is regarded as frame <strong>of</strong> reference, and the other is the model under investigation, for instance by Match-<br />
T. There are thus one set <strong>of</strong> reference <strong>data</strong> and one set <strong>of</strong> test <strong>data</strong> in operation.<br />
In this project, the <strong>elevation</strong> model, which is automatically generated in Match-T, is regarded as test <strong>data</strong>,<br />
and it is compared to the frame <strong>of</strong> reference determined in the Planicomp.<br />
It was estimated that there was not a commercial programme on the market, which could fulfil the wishes<br />
<strong>of</strong> an analysis tool. Therefore, a programme was developed specifically for this purpose. A programme<br />
developed by the author also has the advantage that it can be changed or the analysis possibilities can<br />
be broadened. The analysis programme has been named PIL, as the deviations between the reference<br />
<strong>data</strong> and the generated <strong>elevation</strong> <strong>data</strong> is shown as ”pile” (arrows).<br />
The demands on the user interface in the PIL programme are that it must be intuitively built up, and easily<br />
accessible. Furthermore, it must be clear and have a short path <strong>of</strong> access to all functions. There must be<br />
the possibility <strong>of</strong> correcting the keyed-in information, and the option <strong>of</strong> breaking <strong>of</strong>f the programme, both<br />
during the set-up, during the calculation itself, and after the calculation.<br />
177
Analysis programme PIL<br />
To optimise the analysis process, the programme must be able to optimise the search, so that the calculation<br />
time is minimised, as the <strong>data</strong> quantities included in the process are very large.<br />
The development <strong>of</strong> the PIL programme has been a long process, where new options have been included<br />
during the whole course <strong>of</strong> the project.<br />
Figure C.1.1 shows a <strong>data</strong>flow diagram for the programme modules.<br />
C.1.2 Input files<br />
Input files consist <strong>of</strong> a reference file and a test file respectively. The reference file includes analytically determined<br />
<strong>elevation</strong> <strong>data</strong>. The test file is automatically generated <strong>elevation</strong> <strong>data</strong> from Match-T.<br />
C.1.2.1 File format<br />
Reference file(s)<br />
The reference file must be in ascii and column format. The first column includes a possible code for the<br />
<strong>landscape</strong> type, the second column is the x-co-ordinate, the third column is the y-co-ordinate, and the<br />
fourth column is the z-co-ordinate. As the <strong>landscape</strong> type is identified from the code, each point must<br />
have a code. The codes for the <strong>landscape</strong> type are described in Appendix B, section 1.4. The PIL programme<br />
can handle a file format for the reference file, which consists only <strong>of</strong> three columns (x, y and z),<br />
which is to say that there is no code for the points. If the points do not have a code from the start, they are<br />
automatically assigned the code 00 for unknown <strong>landscape</strong> type. If decimals are included, the decimal<br />
separation must be made with a full stop.<br />
178<br />
Input file<br />
Input<br />
values<br />
Data flow diagram for the programmes modules<br />
Conversion Filing<br />
Data processing:-<br />
Analysis<br />
& cut-out<br />
Analysis &<br />
Cut-out after<br />
local <strong>of</strong>fset<br />
Output<br />
Figure C.1.1: Data flow diagram for the analysis program PIL<br />
Analysis &<br />
Input reference<br />
file >3
C.1 Description <strong>of</strong> the analysis programme PIL<br />
An example <strong>of</strong> the format <strong>of</strong> the reference file, code, x-co-ordinate, y-co-ordinate and z-co-ordinate:<br />
Test file(s)<br />
12 -235800 286025 49.808<br />
12 -235800 286050 52.891<br />
34 -235834 286125 63.017<br />
34 -235834 286130 64.777<br />
56 -233552.419 284697.242 65.093<br />
56 -233551.245 284675.049 65.205<br />
78 -234475 284700 80.079<br />
78 -234475 284725 78.676<br />
90 -233925 284025 77.845<br />
90 -233924.783 284006.829 77.579<br />
The format <strong>of</strong> the test file must also be in ascii and column format. The PIL programme can handle test<br />
files both with and without codes. The individual codes are described in Chapter 5, section 5.9.3 and Appendix<br />
B, section 1.4.<br />
The PIL programme examines how many columns the test file contains. If the test file contains the x-coordinate<br />
as the first column, then a column with the y-co-ordinate, and finally a column with the z-coordinate,<br />
it means that the test files do not include codes, and all grid points are therefore assigned the<br />
code 00.<br />
If there are more than 3 columns, the test file includes codes, and the individual codes are identified.<br />
Again, if decimals are included, the decimal separation must be done with a full stop.<br />
An example <strong>of</strong> the format <strong>of</strong> a test file without codes, x-co-ordinate, y-co-ordinate, z-co-ordinate:<br />
-237725.0000 282775.0000 75.8301<br />
-237700.0000 282775.0000 75.6937<br />
-237675.0000 282775.0000 75.3046<br />
-237650.0000 282775.0000 75.3496<br />
-237625.0000 282775.0000 75.3223<br />
-237600.0000 282775.0000 74.3945<br />
-237575.0000 282775.0000 74.6186<br />
-237550.0000 282775.0000 75.6875<br />
-237525.0000 282775.0000 75.7793<br />
If co-ordinates given in SYSTEM34 are used, these must be fitted in by exchanging the x- and y- coordinate,<br />
and multiplying the x-co-ordinate by –1 before they are used in the PIL programme. For both the<br />
reference file and the test file, the division <strong>of</strong> columns must be done with space (ASCII 32), tab (ASCII 9)<br />
or comma (ASCII 44).<br />
Both the reference files and the test files are examined by the PIL programme to see whether they contain<br />
the prescribed formats. If the files have the wrong format, the PIL programme draws attention to this,<br />
and the programme stops without updating.<br />
179
Analysis programme PIL<br />
C.1.3 Programme description<br />
C.1.3.1 The user interface<br />
The PIL programme is run in a Windows format, and is therefore built up as a typical user interface for the<br />
Windows standard, see figure C.1.2<br />
Figure C.1.2: The programme window for the analysis programme PIL.<br />
C.1.3.2 Choice <strong>of</strong> files<br />
Reference file(s)<br />
The reference file is indicated by clicking on Reference file(s), see figure C.1.2. The file is found by clicking<br />
in the normal way in a Windows format. After acceptance <strong>of</strong> the file, it is shown in the window with the<br />
whole <strong>of</strong> its path indication. There is a choice between several files. These are listed under each other.<br />
The file list can be edited by means <strong>of</strong> the ”delete” button.<br />
Test file(s)<br />
The test file or files is chosen by clicking on Test file(s). The files are found by clicking in the Windows<br />
format. After the choice <strong>of</strong> file, this is shown with the path indication. Several files may by chosen at a<br />
time. These are listed under each other, see figure C.1.2. The file list may be edited by means <strong>of</strong> the ”delete”<br />
button.<br />
180
C.1.3.3 Calculation options<br />
C.1 Description <strong>of</strong> the analysis programme PIL<br />
To make the programme run, a work directory c:/work, and a result directory c:/res must be established.<br />
There are three different calculation options in the programme. The wanted calculation is chosen by the<br />
user by marking:<br />
1) Analysis and cut-out<br />
2) Analysis and cut-out after local <strong>of</strong>fset<br />
3) Analysis and input reference file > level 3<br />
1) Analysis and cut-out<br />
With the calculation option ”Analysis and cut-out”, a differential calculation is done, and the statistical <strong>data</strong><br />
is calculated. All differences, which numerically exceed the gross error limit determined in level 3, are cut<br />
out. If this calculation method is chosen, the cut-outs are done numerically without regard to a possible<br />
<strong>of</strong>fset.<br />
If all points are to be included, the gross error limit in level 3 is set so high that there will be no differences<br />
larger than this value.<br />
2) Analysis and cut-out after local <strong>of</strong>fset<br />
If the choice is to do the calculation with the option ”Analysis and cut-out after local <strong>of</strong>fset”, a possible <strong>of</strong>fset<br />
is determined first, and the cut-out is then done numerically from this <strong>of</strong>fset.<br />
If all points are to be included, level 3 is set higher than the greatest difference.<br />
3) Analysis and input reference file > level 3<br />
If this calculation option is chosen, the <strong>elevation</strong> differences are determined. Points, where the <strong>elevation</strong><br />
differences are numerically larger than the gross error limit indicated in level 3 after shift <strong>of</strong> <strong>of</strong>fset, are<br />
taken out, and <strong>elevation</strong> <strong>data</strong> from the reference file is put in instead <strong>of</strong> the grid point from the test file. For<br />
example, a new, generated <strong>elevation</strong> model (test file) may be compared to an existing model (reference<br />
file), and in case there is a difference in <strong>elevation</strong>s greater than the value in level 3, <strong>elevation</strong> <strong>data</strong> from<br />
the existing <strong>elevation</strong> model are put in. As reference file, the existing <strong>elevation</strong> model from the National<br />
Survey and Cadastre might be used.<br />
In case the two grids are not coincident, a bi-linear interpolation is done to move the grid points from the<br />
reference file to the grid position for the test file.<br />
A new grid file is generated which includes the automatically generated points plus put-in points. The new<br />
grid file is placed in c:/work. It is then possible to compare this new grid file with the analytically determined<br />
reference file. This <strong>of</strong>fers an opportunity <strong>of</strong> analysing how good an accuracy can be achieved, if<br />
grid points from an existing <strong>elevation</strong> model are included.<br />
If, for example, a poor accuracy is achieved by the inclusion <strong>of</strong> the NS&C <strong>elevation</strong>s, it is still possible to<br />
avoid putting in the NS&S <strong>elevation</strong> <strong>data</strong> by using calculation option 2). This results in a grid full <strong>of</strong> holes,<br />
where the cut-out points lie in the file ”Udklip.txt” or by self-chosen indication with the ending ”*ukl.txt.”. In<br />
the files ”Udklip.txt” or ”*ukl.txt”, the cut-out points are found in list format. In the file ”Dummy.asc”, the<br />
points in GeoCAD format are found. The external points will be assigned the <strong>landscape</strong> code 00 in here.<br />
It is then possible to re-measure these points.<br />
Use marked<br />
For all three calculations options, it is possible to add ”use marked”. If an interpolation is included, the grid<br />
point out <strong>of</strong> the four, which has an <strong>elevation</strong> difference larger than the one chosen in level 3, is cut out<br />
(marked by the computer). This point will not be included in the interpolation <strong>of</strong> the neighbouring point. If<br />
181
Analysis programme PIL<br />
”use marked” is chosen, the marked (cut-out ) grid points will be used anyway by the interpolation <strong>of</strong> a<br />
neighbouring point.<br />
Save_name<br />
As point <strong>of</strong> departure, the output files will be stored in c:/res. Under ”save_name”, the path indication <strong>of</strong><br />
the output files may be indicated plus another first name on the files. The output files will then be stored<br />
here with the chosen names, while the output files with the standard names will still be placed in c:/res as<br />
safety copy. The standard names are described in section C.1.7.<br />
Grid distance<br />
The mesh size used in the test file is indicated as grid distance. This value limits the search radius according<br />
to the surrounding grid points, unless there is a direct merging <strong>of</strong> points, an interpolation is then<br />
necessary. Only grid points which lie within the mesh size plus one meter are included in a possible calculation.<br />
Level 1, 2, 3<br />
The <strong>elevation</strong> differences are sorted according to size into four levels, divided by three level limits which<br />
may be indicated by the user:<br />
Level 1: the difference smaller than the 1 st level limit<br />
Level 2: the difference between the 1 st and 2 nd level limit<br />
Level 3: the difference between the 2 nd and 3 rd level limit<br />
Cut-out: differences exceeding the 3 rd level limit<br />
The standard values for the level limits are 2 m, 4 m and 6 m. If these values are used, it means that:<br />
Level 1: the difference < 2 m<br />
Level 2: 2 m � the difference < 4 m<br />
Level 3: 4 � the difference < 6 m<br />
Cut-out: 6 m � the difference<br />
The level limits keyed-in by users may be arbitrary figures. If decimals are used, they must be divided by<br />
a full stop. Furthermore, the following must be observed: Level limit 1 should always be smaller than level<br />
limit 2, which again must be smaller than level limit 3. If the individual level classifications are not observed,<br />
the PIL programme will stop without updating. Differences exceeding, for instance 6 m, are cut<br />
out and transferred to the ”cut-out file”.<br />
Cut x -, cut x cut y – and cut y +<br />
This function gives the option <strong>of</strong> excluding an integer number <strong>of</strong> rows or columns, which is not required to<br />
be included in the analysis calculation <strong>of</strong> the test grid. This function is developed in order to handle unwanted<br />
columns or rows in the automatically generated grids.<br />
The keyed-in figure must be an integer. This figure indicates how many rows or columns are to be ignored.<br />
For example, the keyed-in number <strong>of</strong> columns from the east is ignored by using klip x+, and from<br />
the west by using klip x-. By using klip y- and klip y+, the keyed-in number <strong>of</strong> rows from the south and the<br />
north respectively are ignored.<br />
Scale factor<br />
By means <strong>of</strong> the scale factor, the user may indicate a factor for the size <strong>of</strong> the error arrows. To make possible<br />
a clearer view <strong>of</strong> the <strong>elevation</strong> differences, all <strong>elevation</strong> differences may be multiplied with this self-<br />
182
C.1 Description <strong>of</strong> the analysis programme PIL<br />
chosen factor. This facilitates the analysis <strong>of</strong> where the large errors have arisen. The standard value is 5,<br />
see figure C.1.2.<br />
Print-out shift in the x-direction<br />
Some <strong>of</strong> the <strong>elevation</strong> differences are so great that the individual arrows <strong>over</strong>lap. That means that it is<br />
impossible to see, how large the individual arrows are, as these start and end on top <strong>of</strong> other error arrows.<br />
By ”Print-out shift in the x-direction” it is possible to shift the arrows in relation to each other, so that<br />
the arrow in the row underneath does not <strong>over</strong>lap the starting point <strong>of</strong> the arrow in the row above.<br />
Run<br />
The choice <strong>of</strong> ”run” starts the calculation process.<br />
Stop<br />
The choice <strong>of</strong> ”stop” breaks the programme without dialogue box for the user, and without saving <strong>data</strong>.<br />
C.1.4 Functionality<br />
C.1.4.1 Filing <strong>of</strong> <strong>data</strong><br />
As large <strong>data</strong> quantities are <strong>of</strong>ten in question, the calculations take a long time. To optimise the calculation<br />
time, it is <strong>of</strong> great importance to optimise the search routine. In order for the search to run more easily,<br />
<strong>data</strong> is filed in both files. This is done by first filing <strong>data</strong> according to the y-co-ordinate, then according<br />
to the x-co-ordinate. This filing makes the programme able to handle ”chaos” files, for instance, unstructured<br />
files, or files where there is an <strong>over</strong>lap between files as well as files which are not in grid format etc.<br />
If there is an <strong>over</strong>lap between the <strong>elevation</strong> <strong>data</strong>, and these are coincident, these <strong>data</strong> are put next to<br />
each other in the filing.<br />
The <strong>elevation</strong> models do not need to have coincident grid positions, that is, the same plane co-ordinates.<br />
This is handled by the interpolation. Both, different mesh sizes and a possible twist between the <strong>elevation</strong><br />
models can be handled by the programme. This is due to the filing, which ensures that the <strong>elevation</strong> <strong>data</strong><br />
is structured after the filing process. After the filing, the <strong>data</strong> is put in storage.<br />
When the files are filed, the search is further refined by means <strong>of</strong> a pointer.<br />
C.1.4.2 Data processing<br />
The automatically generated <strong>elevation</strong> <strong>data</strong> is placed in a grid with a fixed mesh size. However, it has not<br />
been possible to place all the reference points in a corresponding grid, but they have been determined as<br />
close to the mesh position as possible. (cf. Appendix B, section B.2.9.3). An interpolation would give an<br />
error contribution, wherefore the points, as far as possible, should coincide, that is, have the same plane<br />
co-ordinates in the two files. Thus, a direct comparison point to point may be done, without an error contribution<br />
from the interpolation.<br />
In case the planimetric co-ordinates to the points in the two files do not coincide, and the deviation is<br />
greater than 0.01 m, a new <strong>elevation</strong> for the reference point’s x- and y-position will be interpolated by<br />
means <strong>of</strong> the bi-linear interpolation calculation between four neighbouring points:<br />
h(x, y) � ax � by � cxy � d<br />
C(1.1)<br />
where h = the interpolated <strong>elevation</strong>.<br />
See figure C.1.3.<br />
183
Analysis programme PIL<br />
When the points are located precisely in the fixed grid, that is, the points in the test file(s) and the frame <strong>of</strong><br />
reference file(s) have the same x- and y- co-ordinates, a simple difference calculation is done with the<br />
formula:<br />
184<br />
Interpolated height<br />
diff � 'z'test�'<br />
z'ref<br />
C(1.2)<br />
where: diff = the <strong>elevation</strong> difference<br />
‘z’test = the <strong>elevation</strong> from the test file<br />
‘z’ref = the <strong>elevation</strong> from the reference file<br />
Only one interpolated <strong>elevation</strong> is determined if there are four surrounding grid points. The search for the<br />
grid points is limited by the value, which is indicated in the mesh distance in the main menu <strong>of</strong> the PIL<br />
programme.<br />
C.1.5 Statistics<br />
Various statistical calculations are done on the located differences. These calculations are done, both on<br />
all the differences as a whole, and for each <strong>landscape</strong> type. The <strong>data</strong> determined is the minimum difference<br />
(min.), the maximum difference (max.), the mean (mean), the standard deviation (stnd) and the Root<br />
Mean Square Error (RMSE).<br />
The RMSE is determined according to the formula:<br />
RMSE �<br />
2<br />
� x i<br />
i�1�<br />
n<br />
where: RMSE = the Root Mean Square Error<br />
n<br />
xi = the deviation between frame <strong>of</strong> reference and the generated grid<br />
n = the number <strong>of</strong> points<br />
Reference point<br />
Figure C.1.3: The principle <strong>of</strong> the bi-linear interpolation.<br />
The standard deviation is determined according to the formula:<br />
C(1.3)
� �<br />
C.1 Description <strong>of</strong> the analysis programme PIL<br />
(x i<br />
2<br />
� x)<br />
stnd �<br />
i�1<br />
n<br />
n<br />
C(1.4)<br />
where: stnd = the standard deviation<br />
xi = the <strong>elevation</strong> deviation between frame <strong>of</strong> reference and the generated grid<br />
x = the mean <strong>of</strong> all deviations<br />
n = the number <strong>of</strong> points<br />
The total number <strong>of</strong> points included in the analysis is indicated, as well as the number <strong>of</strong> points for the individual<br />
<strong>landscape</strong> types. The number <strong>of</strong> differences falling within the four different level classifications<br />
(level ’1’, level ’2’, level ’3’, udklip.pkt) are indicated. The total area, and the area <strong>of</strong> each <strong>landscape</strong> type<br />
for each <strong>of</strong> the four levels (level ’1’, level ’2’, level ’3’, udkl.areas) are calculated, see figure C.1.6.<br />
Offset<br />
In the <strong>of</strong>fset calculation, a possible <strong>of</strong>fset is determined for <strong>elevation</strong> differences and the individual <strong>landscape</strong><br />
types. All the <strong>elevation</strong> differences are deducted from the total <strong>of</strong>fset, and the <strong>of</strong>fset from the individual<br />
<strong>landscape</strong> types is deducted from the individual <strong>landscape</strong> types, and new min., max, mean, Stnd<br />
and RMSE are calculated for all the points in one, and for the individual <strong>landscape</strong> types each on its own.<br />
The cut-out<br />
In the first editions <strong>of</strong> the programme, the reference point was cut out, if there was a difference larger than<br />
level 3. Later, this was changed, so that the cut-out was done in the test file. This change was caused by<br />
the fact that, basically seen, it is not the reference point which contributes to the error, but on the contrary,<br />
the grid point in the test file. If the problem is regarded from the point <strong>of</strong> view <strong>of</strong> a production course, it<br />
would be the grid point which should be registered for a possible re-measurement, not the reference<br />
point! If an interpolation is included, the grid point out <strong>of</strong> the four, which has an <strong>elevation</strong> difference larger<br />
than the one chosen in level 3, is cut out. This point will only be included in the interpolation <strong>of</strong> the<br />
neighbouring point.<br />
After the cut-out, new values are calculated for min., max., mean, Stnd and RMSE for all points, and for<br />
the individual <strong>landscape</strong> types.<br />
The cut-out + <strong>of</strong>fset<br />
In this category, cut-outs are done under consideration <strong>of</strong> possible <strong>of</strong>fsets, and new min., max., mean,<br />
Stnd and RMSE are calculated for all points, and for the individual <strong>landscape</strong> types.<br />
C.1.6 The output files<br />
The PIL programme is meant to be an intermediate link between the calculated <strong>elevation</strong> differences and<br />
the visualisation by means <strong>of</strong> the graphic programme GeoCAD. The PIL programme does not only calculate<br />
<strong>elevation</strong> differences, but also converts <strong>data</strong>, so that they appear in the GeoCAD format.<br />
The following files are generated as a result <strong>of</strong> a calculation. The standard file names are:<br />
- Differens.txt<br />
- Differens_max.txt<br />
- Analyse.txt<br />
- Udklip.txt<br />
- Resultat.asc<br />
185
Analysis programme PIL<br />
- Resultat_max.asc<br />
- Dummy.asc<br />
- Remu.acs<br />
The first four files are for analysis purposes and, therefore, are in ordinary list format, the last are in Geo-<br />
CAD format, and are used for visualisation. The difference file includes four columns consisting <strong>of</strong> the x-,<br />
y- and z-co-ordinates <strong>of</strong> the frame <strong>of</strong> reference file, plus a difference column with sign. This file includes<br />
all the differences. The Differens_max file includes four columns consisting <strong>of</strong> the x-, y- and z-coordinates<br />
<strong>of</strong> the frame <strong>of</strong> reference file, plus a difference column with sign. This file includes only the differences<br />
which remain after the cut-out <strong>of</strong> points with a difference exceeding the threshold value chosen<br />
in level 3. The analysis file includes the result <strong>of</strong> the statistical analysis, such as the maximum and minimum<br />
<strong>elevation</strong> difference, the mean, the standard deviation, the deviation, the number <strong>of</strong> points per <strong>landscape</strong><br />
type and the area calculation. The analysis file consists <strong>of</strong> a table as shown in figure C.1.6.<br />
| Total | Fladt A 12 | Grusgrav 34 | Landsby 56 | Bakket A 78 | Skov 90 | Ukendt 00 |<br />
Min | -8.42 | -1.07 | -6.94 | -1.12 | -8.42 | -7.55 | 0.00 |<br />
Max | 17.52 | 6.17 | 15.66 | 3.96 | 11.18 | 17.52 | 0.00 |<br />
Gns | 1.64 | 1.33 | 2.20 | 1.29 | 1.60 | 1.78 | 0.00 |<br />
Stnd | 2.12 | 0.48 | 3.60 | 0.52 | 1.33 | 3.02 | 0.00 |<br />
RMSE | 2.68 | 1.41 | 4.22 | 1.39 | 2.08 | 3.50 | 0.00 |<br />
Antal | 9187 | 2093 | 1805 | 1287 | 2785 | 1217 | 0 |<br />
Niv'2.0' | 7311 | 1977 | 1065 | 1203 | 2133 | 933 | 0 |<br />
Niv'4.0' | 1276 | 110 | 405 | 84 | 540 | 137 | 0 |<br />
Niv'500’ | 600 | 6 | 335 | 0 | 112 | 147 | 0 |<br />
Udklip.pkt | 0 | 0 | 0 | 0 | 0 | 0 | 0 |<br />
Areal | 708431.4 | 72232.5 | 47688.3 | 262563.3 | 95402.3 | 230544.9 | 0.00 |<br />
Niv'2.0' | 570979.2 | 66003.3 | 28698.6 | 242590.7 | 72517.2 | 161169.4 | 0.00 |<br />
Niv'4.0' | 88703.3 | 6229.2 | 10572.8 | 19972.6 | 18412.4 | 33516.3 | 0.00 |<br />
Niv'500' | 48748.99 | 0.0 | 8416.9 | 0.0 | 4472.7 | 35859.3 | 0.00 |<br />
Udklip.pkt | 0 | 0 | 0 | 0 | 121705.6 | 101715.0 | 0.0 |<br />
Udkl. i % | 6.40 | 0.62 | 9.35 | 0.00 | 6.99 | 16.01 | 0 |<br />
186<br />
Offset Gns 1.64 | 1.33 | 2.20 | 1.29 | 1.60 | 1.78 | 0.00 |<br />
Min | -10.02 | -2.40 | -9.13 | -2.41 | -10.02 | -9.33 | 0.00 |<br />
Max | 15.74 | 4.84 | 13.46 | 2.67 | 9.58 | 15.74 | 0.00 |<br />
Gns | 0.00 | 0.00 | 0.00 | 0.00 | 0.00 | 0.00 | 0.00 |<br />
Stnd | 2.09 | 0.48 | 3.60 | 0.52 | 1.33 | 3.02 | 0.00 |<br />
RMSE | 2.09 | 0.48 | 3.60 | 0.52 | 1.33 | 3.02 | 0.00 |<br />
Udklippet<br />
Min | -8.42 | -1.07 | -6.94 | -1.12 | -8.42 | -7.55 | 0.00 |<br />
Max | 17.52 | 6.17 | 15.66 | 3.96 | 11.18 | 17.52 | 0.00 |<br />
Gns | 1.64 | 1.33 | 2.20 | 1.29 | 1.60 | 1.78 | 0.00 |<br />
Stnd | 2.12 | 0.48 | 3.60 | 0.52 | 1.33 | 3.02 | 0.00 |<br />
RMSE | 2.68 | 1.41 | 4.22 | 1.39 | 2.08 | 3.50 | 0.00 |<br />
Udklippet + Offset<br />
Min | -10.02 | -2.40 | -9.13 | -2.41 | -10.02 | -9.33 | 0.00 |<br />
Max | 15.74 | 4.84 | 13.46 | 2.67 | 9.58 | 15.74 | 0.00 |<br />
Gns | 0.00 | 0.00 | 0.00 | 0.00 | 0.00 | 0.00 | 0.00 |<br />
Stnd | 2.09 | 0.48 | 3.60 | 0.52 | 1.33 | 3.02 | 0.00 |<br />
RMSE | 2.09 | 0.48 | 3.60 | 0.52 | 1.33 | 3.02 | 0.00 |<br />
Figure C.1.6: Analysis file generated by the programme PIL. A translated format can be found in Appendix L on page<br />
331.
C.1 Description <strong>of</strong> the analysis programme PIL<br />
The cut-out file includes the x- and y-co-ordinates <strong>of</strong> the cut-out grid points from the test file(s). This file<br />
may be used as a guide to a possible re-measurement.<br />
The last four files (*.asc) are in GeoCAD format. The result file includes the <strong>elevation</strong> differences which<br />
are shown as arrows by means <strong>of</strong> GeoCAD. If the <strong>elevation</strong> difference is positive, the arrow points upwards,<br />
while it points downwards if the difference is negative. The length <strong>of</strong> the arrow (plus possibly the<br />
scale used) indicates the size <strong>of</strong> the <strong>elevation</strong> difference. Furthermore, each arrow has a colour, which<br />
indicates the <strong>landscape</strong> type. If the <strong>elevation</strong> difference is positive, the colour is light, if the difference is<br />
negative, the colour is dark. For instance, the arrows which represent the <strong>landscape</strong> type woods have<br />
been assigned the colour blue, light blue arrows for positive <strong>elevation</strong> differences, and dark blue arrows<br />
for negative <strong>elevation</strong> differences. The result file can be drawn into GeoCAD for visualisation, see figure<br />
C.1.7.<br />
Figure C.1.7: The result in GeoCAD format with the <strong>elevation</strong> difference indicated as arrows.<br />
The Resultat_max file includes those <strong>elevation</strong> differences which remain after cutting out those <strong>elevation</strong><br />
differences which are larger than the threshold value in level 3. Here, the differences are also shown by<br />
means <strong>of</strong> GeoCAD as arrows, as described above. The Dummy file includes the same points as the file<br />
Cut-out, but in GeoCAD format, so that they can be drawn directly into GeoCAD with a view to visualisation.<br />
Remu.asc is an abbreviation <strong>of</strong> Result minus cut-out. This file, however, like the Resultat.asc’ file, is<br />
without those arrows, which fall above level 3, and are thus cut out.<br />
No matter which calculation is chosen, all eight files are generated. The standard files are put in c:/res as<br />
copy. These files are copied at each calculation.<br />
187
Appendix D
Editing programme
D.1 The editing programme ”Klip”<br />
Appendix D: Editing programme<br />
This appendix includes a brief description <strong>of</strong> a small programme for cutting out unwanted <strong>data</strong>.<br />
D.1 The editing programme ”Klip”<br />
With different investigations <strong>of</strong> the automatically generated grids, it turned out that in none <strong>of</strong> the grids<br />
were the keyed-in corner indications, “lower left, LL” and “upper right, UR” observed. It has therefore been<br />
necessary to develop a small programme called “Klip” for cutting out the unwanted columns or rows. The<br />
Klip programme is also run in a Windows format, and is therefore built up with user interface in Windows<br />
standard, see figure D.1.<br />
Figure D.1: Programme window for the ’klip’ programme.<br />
191
Editing programme<br />
Input file<br />
The input file is one <strong>of</strong> the generated files from Match-T. The input file is indicated by clicking on ”Fil til<br />
klipning” and then continue as in a normal Windows format.<br />
During the input <strong>of</strong> the input file, max. and min. for the x- and y-co-ordinates are found, and these are indicated<br />
by the programme in the grey areas for Minimum x, Minimum y, Maximum x and Maximum y.<br />
The wanted corner co-ordinates are keyed-in in the white areas. Co-ordinates must be indicated in all the<br />
white areas. Should a corner co-ordinate shown in the grey area turn out to be correct, this co-ordinate is<br />
keyed-in again in the white area below, see figure D.1 ”New minimum x” and ”New minimum y”.<br />
Output file<br />
The name <strong>of</strong> the output file is indicated by clicking on ”save_name”. Here a new name for the output file is<br />
chosen with the whole path indication.<br />
Run<br />
By ’run’, the Klip programme cuts out the surplus columns or rows according to the co-ordinates indicated<br />
in the white areas.<br />
Stop<br />
By ’stop’, the programme is broken <strong>of</strong>f without dialogue box for the user, and without saving <strong>data</strong>.
Appendix E
Editing programme
E.1 Free bundle adjustment <strong>of</strong> the GPS points<br />
Appendix E: Bundle adjustment<br />
E.1 Free bundle adjustment <strong>of</strong> the GPS<br />
points<br />
This Appendix contains a cut out <strong>of</strong> the results from the free bundle adjustment <strong>of</strong> the GPS measured<br />
points calculated by Fillnet. The programme Fillnet demands that one point is fixed. In this case number<br />
007 is fixed.<br />
S.E. OF UNIT WEIGHT = 1.082<br />
NUMBER OF -<br />
OBS. EQUATIONS 565<br />
UNKNOWNS 358<br />
DEGREES OF FREEDOM 207<br />
ITERATIONS 1<br />
ADJUSTED POSITIONS:<br />
LAT. LON. ELEV. STD. ERRORS (m)<br />
1 0007 56 59 3.44834 - 9 57 44.07348 103.306 0.000 0.000 0.000<br />
2 0001 56 58 56.04333 - 9 59 45.45155 122.449 0.007 0.007 0.007<br />
3 0522 56 58 25.26783 - 9 59 27.10754 81.467 0.007 0.007 0.007<br />
4 0910 56 59 6.51531 - 9 59 42.96724 82.283 0.009 0.009 0.009<br />
5 0523 56 59 6.69497 - 9 59 43.02594 83.349 0.007 0.007 0.007<br />
6 0526 56 59 15.74958 - 9 59 4.01221 72.036 0.006 0.006 0.006<br />
7 0527 56 58 54.25855 - 9 59 23.60839 95.449 0.007 0.007 0.007<br />
8 0580 57 0 33.98310 - 9 55 13.44922 46.663 0.007 0.007 0.007<br />
9 0590 56 58 35.11809 - 10 0 15.79015 71.525 0.007 0.007 0.007<br />
10 0911 56 58 53.67167 - 9 58 45.66613 91.007 0.009 0.009 0.009<br />
11 0990 56 58 35.11899 - 10 0 15.84213 70.531 0.009 0.009 0.009<br />
12 0954 56 58 38.16479 - 9 56 30.05689 61.144 0.007 0.007 0.007<br />
13 0555 56 58 27.54789 - 9 56 39.85560 52.569 0.007 0.007 0.007<br />
14 0955 56 58 22.08493 - 9 57 23.61907 80.144 0.007 0.007 0.007<br />
15 0556 56 58 26.07140 - 9 57 29.93424 80.770 0.007 0.007 0.007<br />
16 0557 56 58 37.68781 - 9 57 46.51392 89.002 0.007 0.007 0.007<br />
17 0550 56 58 9.76669 - 9 59 50.90095 70.203 0.007 0.007 0.007<br />
18 0951 56 57 54.07683 - 9 56 54.47313 61.737 0.007 0.007 0.007<br />
19 0553 56 58 5.59602 - 9 56 51.95006 53.858 0.007 0.007 0.007<br />
20 8952 56 58 5.68627 - 9 56 51.79459 53.410 0.011 0.011 0.011<br />
21 0003 56 58 4.68166 - 9 56 7.31426 97.627 0.007 0.007 0.007<br />
22 0953 56 58 6.71316 - 9 56 19.92651 85.836 0.007 0.007 0.007<br />
23 0011 57 1 5.02833 - 9 58 38.70234 52.851 0.002 0.002 0.002<br />
24 0515 56 59 24.87107 - 9 54 55.36688 65.768 0.007 0.007 0.007<br />
25 0518 56 59 46.90183 - 9 55 30.22926 68.213 0.007 0.007 0.007<br />
26 0552 56 58 2.28243 - 9 57 35.94176 64.658 0.011 0.011 0.011<br />
27 0577 56 59 26.40894 - 9 59 31.66847 67.413 0.006 0.006 0.006<br />
28 7960 56 58 33.46197 - 9 58 48.25761 98.324 0.010 0.010 0.010<br />
29 7985 56 58 25.65730 - 9 55 51.22989 68.133 0.011 0.011 0.011<br />
30 7973 56 59 16.71027 - 9 58 29.50883 78.356 0.010 0.010 0.010<br />
31 0560 56 58 33.50432 - 9 58 48.38307 99.536 0.007 0.007 0.007<br />
32 8960 56 58 33.46642 - 9 58 48.28979 98.278 0.010 0.010 0.010<br />
33 0528 56 58 24.89181 - 9 58 24.36103 84.476 0.006 0.006 0.006<br />
34 8912 56 58 24.96555 - 9 58 24.35376 83.952 0.010 0.010 0.010<br />
35 0561 56 58 53.05819 - 9 57 52.61057 98.071 0.007 0.007 0.007<br />
195
Bundle adjustment<br />
36 8961 56 58 53.27097 - 9 57 52.49404 98.019 0.010 0.010 0.010<br />
37 0562 56 59 12.68138 - 9 57 54.79421 83.371 0.006 0.006 0.006<br />
38 8962 56 59 17.79172 - 9 57 35.44830 86.645 0.010 0.010 0.010<br />
39 8963 56 59 9.83119 - 9 57 4.68741 72.020 0.010 0.010 0.010<br />
40 0519 56 59 25.16743 - 9 56 52.40897 54.126 0.006 0.006 0.006<br />
41 8908 56 59 25.17191 - 9 56 52.35891 52.872 0.010 0.010 0.010<br />
42 0564 56 59 48.84901 - 9 56 50.00526 44.554 0.006 0.006 0.006<br />
43 0565 56 59 52.05976 - 9 58 0.86240 46.804 0.006 0.006 0.006<br />
44 8964 56 59 43.93181 - 9 57 43.79598 57.377 0.009 0.009 0.009<br />
45 7504 57 0 15.88004 - 9 57 54.71038 46.007 0.009 0.009 0.009<br />
46 0554 56 58 6.52883 - 9 56 18.54113 88.129 0.006 0.006 0.006<br />
47 0576 57 0 20.02245 - 9 58 48.74222 45.473 0.005 0.005 0.005<br />
48 6902 57 0 35.18329 - 9 58 46.16635 47.684 0.009 0.009 0.009<br />
49 0505 57 0 14.10700 - 9 56 54.11391 65.293 0.006 0.006 0.006<br />
50 0903 57 0 6.13631 - 9 56 50.91242 55.223 0.006 0.006 0.006<br />
51 0500 57 0 44.76893 - 9 59 16.16652 57.978 0.006 0.006 0.006<br />
52 0570 57 0 17.71620 - 9 59 38.96836 46.301 0.006 0.006 0.006<br />
53 0571 57 0 1.04166 - 9 59 29.03586 44.750 0.006 0.006 0.006<br />
54 8971 57 0 1.15316 - 9 59 28.83524 44.535 0.009 0.009 0.009<br />
55 0573 56 59 46.55132 - 9 58 49.46301 47.445 0.006 0.006 0.006<br />
56 0575 56 59 16.63363 - 9 58 29.81030 79.293 0.006 0.006 0.006<br />
57 0107 57 0 41.95236 - 10 0 11.75041 45.755 0.007 0.007 0.007<br />
58 0970 56 59 40.48010 - 9 59 49.46954 50.180 0.006 0.006 0.006<br />
59 0572 56 59 42.26675 - 9 59 31.70807 47.932 0.006 0.006 0.006<br />
60 0574 56 59 34.03980 - 9 59 20.17309 57.010 0.006 0.006 0.006<br />
61 8972 56 59 34.00350 - 9 59 20.35496 56.868 0.009 0.009 0.009<br />
62 0901 57 1 4.84263 - 9 59 8.84128 48.788 0.006 0.006 0.006<br />
63 0581 56 59 15.03204 - 9 53 58.56395 49.065 0.007 0.007 0.007<br />
64 8981 56 59 15.00601 - 9 53 58.74243 48.251 0.011 0.011 0.011<br />
65 0582 56 58 53.01182 - 9 55 19.55301 56.167 0.007 0.007 0.007<br />
66 8982 56 59 0.76025 - 9 55 52.93278 82.327 0.010 0.010 0.010<br />
67 0583 56 58 21.66405 - 9 55 9.46612 75.529 0.007 0.007 0.007<br />
68 8983 56 58 21.46327 - 9 55 9.49124 75.183 0.011 0.011 0.011<br />
69 0584 56 58 28.77778 - 9 55 20.26470 70.295 0.007 0.007 0.007<br />
70 8984 56 58 28.41458 - 9 55 21.04573 71.074 0.011 0.011 0.011<br />
71 0585 56 58 25.70175 - 9 55 51.45826 68.808 0.007 0.007 0.007<br />
72 8985 56 58 25.63672 - 9 55 51.17518 68.191 0.011 0.011 0.011<br />
73 8990 56 58 35.11860 - 10 0 15.83156 70.512 0.010 0.010 0.010<br />
74 0981 56 59 15.00581 - 9 53 58.73292 48.275 0.010 0.010 0.010<br />
75 0982 56 59 0.76074 - 9 55 52.93294 82.268 0.009 0.009 0.009<br />
76 0985 56 58 25.66081 - 9 55 51.17433 68.179 0.009 0.009 0.009<br />
77 0984 56 58 28.42713 - 9 55 21.06665 71.083 0.009 0.009 0.009<br />
78 0983 56 58 21.45583 - 9 55 9.52484 75.177 0.009 0.009 0.009<br />
79 0912 56 58 24.96456 - 9 58 24.35440 83.961 0.009 0.009 0.009<br />
80 0961 56 58 53.27122 - 9 57 52.49300 98.023 0.009 0.009 0.009<br />
81 0962 56 59 17.75529 - 9 57 35.51212 86.697 0.009 0.009 0.009<br />
82 0963 56 59 9.84135 - 9 57 4.64887 72.004 0.009 0.009 0.009<br />
83 0908 56 59 25.17125 - 9 56 52.35552 52.877 0.009 0.009 0.009<br />
84 0964 56 59 43.93539 - 9 57 43.83105 57.428 0.009 0.009 0.009<br />
85 0008 56 59 36.49145 - 9 55 14.50841 87.309 0.007 0.007 0.007<br />
86 0512 56 59 54.47244 - 9 55 3.65495 81.585 0.007 0.007 0.007<br />
87 0516 56 59 17.58075 - 9 55 31.98712 83.793 0.007 0.007 0.007<br />
88 0907 56 59 17.55986 - 9 55 32.02004 83.534 0.009 0.009 0.009<br />
89 0517 56 59 19.43405 - 9 55 49.61569 83.741 0.007 0.007 0.007<br />
90 0501 57 0 17.81273 - 9 57 59.54135 48.107 0.005 0.005 0.005<br />
91 6502 57 0 15.95924 - 9 57 54.58831 46.082 0.006 0.006 0.006<br />
92 6503 57 0 15.92834 - 9 57 54.77953 46.011 0.006 0.006 0.006<br />
93 0551 56 58 8.01914 - 9 59 3.00450 69.896 0.005 0.005 0.005<br />
94 0950 56 58 5.16469 - 9 59 37.89795 69.038 0.009 0.009 0.009<br />
95 0952 56 58 5.68908 - 9 56 51.78993 53.421 0.009 0.009 0.009<br />
96 0521 56 58 53.49245 - 9 56 33.75730 46.618 0.007 0.007 0.007<br />
97 0906 56 59 46.14614 - 9 55 48.97606 48.010 0.007 0.007 0.007<br />
98 0511 57 0 17.06665 - 9 55 30.44647 44.868 0.007 0.007 0.007<br />
99 0520 56 59 20.23476 - 9 56 32.78459 47.624 0.007 0.007 0.007<br />
100 0513 56 59 52.57720 - 9 55 59.00737 44.532 0.007 0.007 0.007<br />
101 0905 57 0 11.94038 - 9 55 15.54437 47.335 0.007 0.007 0.007<br />
102 0510 57 0 20.63732 - 9 56 3.14322 56.885 0.007 0.007 0.007<br />
103 0006 57 0 24.23163 - 9 56 38.53673 105.948 0.006 0.006 0.006<br />
104 0506 57 0 29.28496 - 9 56 40.19745 101.481 0.006 0.006 0.006
E.1 Free bundle adjustment <strong>of</strong> the GPS points<br />
105 0971 57 0 1.15962 - 9 59 28.92980 44.588 0.009 0.009 0.009<br />
106 0973 56 59 16.63304 - 9 58 29.63436 78.188 0.009 0.009 0.009<br />
107 0972 56 59 33.98641 - 9 59 20.34750 56.900 0.009 0.009 0.009<br />
108 0524 56 59 29.19443 - 10 0 11.96634 53.496 0.007 0.007 0.007<br />
109 9902 57 0 35.18306 - 9 58 46.16601 47.787 0.009 0.009 0.009<br />
110 0502 57 0 15.88264 - 9 57 54.72306 46.007 0.009 0.009 0.009<br />
111 0503 57 0 15.98193 - 9 57 54.73038 46.125 0.009 0.009 0.009<br />
112 9502 57 0 15.88309 - 9 57 54.72129 45.991 0.009 0.009 0.009<br />
113 0504 57 0 15.95727 - 9 57 54.58648 46.089 0.009 0.009 0.009<br />
114 8907 56 59 17.56018 - 9 55 32.02028 83.518 0.010 0.010 0.010<br />
115 9908 56 59 25.17363 - 9 56 52.35534 52.874 0.010 0.010 0.010<br />
116 8909 56 59 17.72413 - 9 56 32.30671 48.833 0.010 0.010 0.010<br />
117 8910 56 59 6.51028 - 9 59 42.96292 82.276 0.010 0.010 0.010<br />
118 8911 56 58 53.67216 - 9 58 45.66500 90.997 0.010 0.010 0.010<br />
119 9912 56 58 24.96534 - 9 58 24.35214 83.963 0.010 0.010 0.010<br />
197
Bundle adjustment<br />
E.2 Fixed bundle adjustment <strong>of</strong> the GPS<br />
points<br />
This Appendix contains a cut out <strong>of</strong> the results from the fixed bundle adjustment <strong>of</strong> the GPS measured<br />
points calculated by Fillnet. The adjustment is done on behalf <strong>of</strong> 2 full control points, 3 planimetric control<br />
points and 14 height control points.<br />
S.E. OF UNIT WEIGHT = 1.166<br />
NUMBER OF -<br />
OBS. EQUATIONS 561<br />
UNKNOWNS 337<br />
DEGREES OF FREEDOM 224<br />
ITERATIONS 1<br />
ADJUSTED POSITIONS:<br />
LAT. LON. ELEV. STD. ERRORS (m)<br />
1 0007 56 59 3.44834 - 9 57 44.07348 103.306 0.000 0.000 0.000<br />
2 0001 56 58 56.04341 - 9 59 45.45179 122.446 0.000 0.000 0.008<br />
3 0522 56 58 25.26736 - 9 59 27.10756 81.464 0.006 0.008 0.008<br />
4 0910 56 59 6.51494 - 9 59 42.96779 82.280 0.007 0.010 0.009<br />
5 0523 56 59 6.69453 - 9 59 43.02732 83.353 0.007 0.010 0.009<br />
6 0526 56 59 15.74936 - 9 59 4.01276 72.034 0.005 0.007 0.007<br />
7 0527 56 58 54.25822 - 9 59 23.60871 95.446 0.005 0.007 0.007<br />
8 0580 57 0 33.98410 - 9 55 13.44930 46.671 0.010 0.012 0.012<br />
9 0590 56 58 35.11743 - 10 0 15.79037 71.527 0.008 0.010 0.010<br />
10 0911 56 58 53.67143 - 9 58 45.66629 91.005 0.006 0.009 0.009<br />
11 0990 56 58 35.11839 - 10 0 15.84249 70.531 0.008 0.010 0.000<br />
12 0954 56 58 38.16494 - 9 56 30.05625 61.146 0.005 0.007 0.000<br />
13 0555 56 58 27.54791 - 9 56 39.85490 52.566 0.005 0.008 0.007<br />
14 0955 56 58 22.08483 - 9 57 23.61852 80.140 0.005 0.007 0.000<br />
15 0556 56 58 26.07150 - 9 57 29.93373 80.773 0.005 0.007 0.007<br />
16 0557 56 58 37.68779 - 9 57 46.51371 89.003 0.006 0.009 0.009<br />
17 0550 56 58 9.76605 - 9 59 50.90096 70.198 0.007 0.009 0.008<br />
18 0951 56 57 54.07676 - 9 56 54.47214 61.737 0.007 0.008 0.008<br />
19 0553 56 58 5.59598 - 9 56 51.94921 53.859 0.006 0.008 0.008<br />
20 8952 56 58 5.68622 - 9 56 51.79373 53.410 0.012 0.013 0.013<br />
21 0003 56 58 4.68169 - 9 56 7.31319 97.626 0.007 0.008 0.008<br />
22 0953 56 58 6.71324 - 9 56 19.92553 85.843 0.006 0.008 0.000<br />
23 0011 57 1 5.02873 - 9 58 38.70387 52.852 0.006 0.005 0.004<br />
24 0515 56 59 24.87184 - 9 54 55.36635 65.772 0.007 0.009 0.008<br />
25 0518 56 59 46.90248 - 9 55 30.22915 68.217 0.006 0.008 0.008<br />
26 0552 56 58 2.28223 - 9 57 35.94106 64.657 0.012 0.013 0.013<br />
27 0577 56 59 26.40874 - 9 59 31.66922 67.412 0.005 0.007 0.007<br />
28 7960 56 58 33.46167 - 9 58 48.25755 98.322 0.010 0.012 0.012<br />
29 7985 56 58 25.65754 - 9 55 51.22898 68.135 0.011 0.013 0.013<br />
30 7973 56 59 16.71023 - 9 58 29.50915 78.355 0.008 0.011 0.010<br />
31 0560 56 58 33.50397 - 9 58 48.38302 99.534 0.005 0.007 0.007<br />
32 8960 56 58 33.46612 - 9 58 48.28974 98.275 0.010 0.012 0.012<br />
33 0528 56 58 24.89146 - 9 58 24.36078 84.472 0.005 0.006 0.006<br />
34 8912 56 58 24.96529 - 9 58 24.35351 83.950 0.010 0.012 0.012<br />
35 0561 56 58 53.05817 - 9 57 52.61048 98.072 0.004 0.007 0.007<br />
36 8961 56 58 53.27094 - 9 57 52.49395 98.019 0.009 0.011 0.011<br />
37 0562 56 59 12.68132 - 9 57 54.79445 83.371 0.004 0.007 0.007<br />
38 8962 56 59 17.79185 - 9 57 35.44840 86.645 0.008 0.011 0.011<br />
39 8963 56 59 9.83138 - 9 57 4.68730 72.021 0.009 0.011 0.011<br />
40 0519 56 59 25.16772 - 9 56 52.40898 54.128 0.005 0.007 0.007
E.2 Fixed bundle adjustment <strong>of</strong> the GPS points<br />
41 8908 56 59 25.17221 - 9 56 52.35890 52.874 0.008 0.011 0.011<br />
42 0564 56 59 48.84941 - 9 56 50.00548 44.555 0.005 0.007 0.007<br />
43 0565 56 59 52.05994 - 9 58 0.86298 46.804 0.005 0.007 0.007<br />
44 8964 56 59 43.93202 - 9 57 43.79640 57.377 0.007 0.010 0.010<br />
45 7504 57 0 15.88032 - 9 57 54.71120 46.008 0.007 0.010 0.010<br />
46 0554 56 58 6.52886 - 9 56 18.54015 88.130 0.006 0.007 0.007<br />
47 0576 57 0 20.02263 - 9 58 48.74332 45.473 0.005 0.006 0.006<br />
48 6902 57 0 35.18349 - 9 58 46.16760 47.685 0.008 0.011 0.010<br />
49 0505 57 0 14.10746 - 9 56 54.11447 65.296 0.005 0.006 0.006<br />
50 0903 57 0 6.13686 - 9 56 50.91274 55.228 0.005 0.006 0.006<br />
51 0500 57 0 44.76913 - 9 59 16.16805 57.979 0.009 0.011 0.011<br />
52 0570 57 0 17.71611 - 9 59 38.96976 46.285 0.008 0.011 0.000<br />
53 0571 57 0 1.04171 - 9 59 29.03716 44.752 0.008 0.010 0.010<br />
54 8971 57 0 1.15309 - 9 59 28.83584 44.533 0.008 0.012 0.012<br />
55 0573 56 59 46.55106 - 9 58 49.46365 47.443 0.006 0.009 0.009<br />
56 0575 56 59 16.63339 - 9 58 29.81072 79.305 0.005 0.009 0.009<br />
57 0107 57 0 41.95293 - 10 0 11.75027 45.749 0.000 0.000 0.000<br />
58 0970 56 59 40.47959 - 9 59 49.47029 50.175 0.007 0.010 0.000<br />
59 0572 56 59 42.26630 - 9 59 31.70910 47.930 0.007 0.010 0.010<br />
60 0574 56 59 34.03967 - 9 59 20.17358 57.013 0.007 0.009 0.009<br />
61 8972 56 59 34.00341 - 9 59 20.35532 56.866 0.008 0.012 0.012<br />
62 0901 57 1 4.84288 - 9 59 8.84305 48.786 0.008 0.010 0.000<br />
63 0581 56 59 15.03283 - 9 53 58.56296 49.061 0.010 0.012 0.012<br />
64 8981 56 59 15.00661 - 9 53 58.74200 48.258 0.011 0.014 0.015<br />
65 0582 56 58 53.01238 - 9 55 19.55215 56.168 0.007 0.010 0.010<br />
66 8982 56 59 0.76055 - 9 55 52.93248 82.331 0.009 0.013 0.013<br />
67 0583 56 58 21.66442 - 9 55 9.46490 75.524 0.008 0.011 0.010<br />
68 8983 56 58 21.46359 - 9 55 9.49055 75.188 0.011 0.014 0.014<br />
69 0584 56 58 28.77800 - 9 55 20.26393 70.291 0.008 0.010 0.010<br />
70 8984 56 58 28.41490 - 9 55 21.04511 71.079 0.010 0.014 0.014<br />
71 0585 56 58 25.70204 - 9 55 51.45726 68.814 0.007 0.010 0.010<br />
72 8985 56 58 25.63696 - 9 55 51.17460 68.195 0.010 0.014 0.014<br />
73 8990 56 58 35.11825 - 10 0 15.83159 70.531 0.010 0.013 0.000<br />
74 0981 56 59 15.00658 - 9 53 58.73206 48.280 0.010 0.012 0.012<br />
75 0982 56 59 0.76108 - 9 55 52.93243 82.271 0.006 0.010 0.009<br />
76 0985 56 58 25.66101 - 9 55 51.17343 68.180 0.007 0.010 0.010<br />
77 0984 56 58 28.42743 - 9 55 21.06565 71.085 0.008 0.010 0.010<br />
78 0983 56 58 21.45614 - 9 55 9.52371 75.180 0.008 0.011 0.010<br />
79 0912 56 58 24.96426 - 9 58 24.35416 83.959 0.006 0.009 0.009<br />
80 0961 56 58 53.27115 - 9 57 52.49293 98.022 0.005 0.009 0.009<br />
81 0962 56 59 17.75538 - 9 57 35.51224 86.698 0.005 0.009 0.009<br />
82 0963 56 59 9.84151 - 9 57 4.64877 72.005 0.005 0.009 0.009<br />
83 0908 56 59 25.17151 - 9 56 52.35552 52.879 0.006 0.009 0.009<br />
84 0964 56 59 43.93557 - 9 57 43.83148 57.429 0.006 0.009 0.009<br />
85 0008 56 59 36.49272 - 9 55 14.50871 87.305 0.000 0.000 0.000<br />
86 0512 56 59 54.47319 - 9 55 3.65478 81.591 0.006 0.008 0.007<br />
87 0516 56 59 17.58125 - 9 55 31.98678 83.797 0.005 0.007 0.007<br />
88 0907 56 59 17.56034 - 9 55 32.01961 83.538 0.007 0.010 0.010<br />
89 0517 56 59 19.43449 - 9 55 49.61537 83.744 0.005 0.007 0.006<br />
90 0501 57 0 17.81316 - 9 57 59.54220 48.117 0.004 0.005 0.000<br />
91 6502 57 0 15.95956 - 9 57 54.58913 46.083 0.005 0.007 0.007<br />
92 6503 57 0 15.92863 - 9 57 54.78034 46.012 0.005 0.007 0.007<br />
93 0551 56 58 8.01867 - 9 59 3.00420 69.891 0.005 0.006 0.006<br />
94 0950 56 58 5.16408 - 9 59 37.89782 69.037 0.008 0.010 0.000<br />
95 0952 56 58 5.68899 - 9 56 51.78908 53.421 0.007 0.010 0.009<br />
96 0521 56 58 53.49265 - 9 56 33.75685 46.619 0.005 0.006 0.006<br />
97 0906 56 59 46.14672 - 9 55 48.97599 48.014 0.005 0.007 0.000<br />
98 0511 57 0 17.06747 - 9 55 30.44664 44.869 0.006 0.007 0.007<br />
99 0520 56 59 20.23508 - 9 56 32.78476 47.623 0.004 0.006 0.006<br />
100 0513 56 59 52.57786 - 9 55 59.00745 44.534 0.005 0.007 0.006<br />
101 0905 57 0 11.94115 - 9 55 15.54451 47.337 0.006 0.008 0.000<br />
102 0510 57 0 20.63801 - 9 56 3.14363 56.887 0.006 0.007 0.006<br />
103 0006 57 0 24.23220 - 9 56 38.53736 105.951 0.005 0.007 0.006<br />
104 0506 57 0 29.28554 - 9 56 40.19808 101.483 0.006 0.007 0.006<br />
105 0971 57 0 1.15953 - 9 59 28.93087 44.586 0.008 0.010 0.010<br />
106 0973 56 59 16.63296 - 9 58 29.63470 78.187 0.005 0.009 0.009<br />
107 0972 56 59 33.98623 - 9 59 20.34824 56.898 0.007 0.009 0.009<br />
108 0524 56 59 29.19393 - 10 0 11.96723 53.488 0.005 0.007 0.006<br />
109 9902 57 0 35.18330 - 9 58 46.16725 47.786 0.006 0.007 0.007<br />
199
Bundle adjustment<br />
110 0502 57 0 15.88296 - 9 57 54.72387 46.008 0.005 0.007 0.007<br />
111 0503 57 0 15.98225 - 9 57 54.73119 46.126 0.005 0.007 0.007<br />
112 9502 57 0 15.88341 - 9 57 54.72210 45.991 0.005 0.007 0.007<br />
113 0504 57 0 15.95759 - 9 57 54.58728 46.090 0.005 0.007 0.007<br />
114 8907 56 59 17.56070 - 9 55 32.01984 83.521 0.007 0.009 0.009<br />
115 9908 56 59 25.17393 - 9 56 52.35533 52.875 0.006 0.008 0.008<br />
116 8909 56 59 17.72446 - 9 56 32.30654 48.834 0.006 0.008 0.008<br />
117 8910 56 59 6.50996 - 9 59 42.96346 82.273 0.009 0.011 0.011<br />
118 8911 56 58 53.67196 - 9 58 45.66515 90.995 0.009 0.011 0.011<br />
119 9912 56 58 24.96509 - 9 58 24.35189 83.961 0.010 0.012 0.012<br />
120 0957 56 58 37.68778 - 9 57 46.51364 89.001 0.005 0.007 0.007<br />
121 0960 56 58 33.52460 - 9 58 48.13771 97.051 0.006 0.009 0.009<br />
123 6551 56 58 8.01899 - 9 59 3.00407 71.786 0.011 0.013 0.013<br />
124 7503 57 0 15.96169 - 9 57 54.72101 44.005 0.007 0.010 0.010<br />
125 8523 56 59 6.69473 - 9 59 43.02551 83.604 0.009 0.011 0.011
E.3 The co-ordinate list for the ground control points<br />
E.3 The co-ordinate list for the ground<br />
control points<br />
This Appendix contains the co-ordinate list for the ground control points which are used in the following<br />
aerotriangulations.<br />
In total 119 vectors are measured. In this list, geometric reference points are deleted. The height control<br />
points are determined by two individual vectors. The average <strong>of</strong> the Z-co-ordinates is determined and one<br />
<strong>of</strong> the vectors is deleted. The list now only contains relevant ground control points, in total 77 points with<br />
accuracies.<br />
X- and Y-co-ordinates are original WGS’84 co-ordinates. These are transferred <strong>over</strong> to System34 Jutland/DNN<br />
(System34 is the <strong>of</strong>ficial <strong>Danish</strong> Datum). The accuracy for X, Y, Z in metres is placed in the last<br />
three columns. The accuracy has to be taken with reservation because there have to be minor corrections<br />
due to the transference. The accuracy <strong>of</strong> the Z-co-ordinates is correct.<br />
All accuracies <strong>over</strong> 0.01 m are highlighted.<br />
500 -233539.136 287189.892 57.979 0.006 0.009 0.009<br />
501 -234837.086 286363.522 48.117 0.005 0.007 0.000<br />
503 -234919.569 286305.927 46.879 0.008 0.012 0.012<br />
505 -235942.096 286255.562 65.309 0.006 0.009 0.009<br />
506 -236174.048 286726.49 101.483 0.006 0.009 0.009<br />
510 -236801.153 286462.969 56.877 0.006 0.009 0.010<br />
511 -237353.676 286355.987 44.815 0.007 0.009 0.010<br />
512 -237810.480 285660.147 81.591 0.007 0.009 0.010<br />
513 -236876.458 285595.415 44.577 0.006 0.009 0.009<br />
515 -237956.482 284745.466 65.772 0.007 0.009 0.010<br />
516 -237339.559 284515.894 83.534 0.006 0.009 0.009<br />
517 -237041.524 284571.290 83.720 0.006 0.009 0.009<br />
518 -237363.396 285423.054 68.141 0.006 0.009 0.010<br />
519 -235980.163 284741.915 54.107 0.006 0.009 0.009<br />
520 -236312.473 284591.484 48.182 0.006 0.009 0.009<br />
521 -236301.284 283764.202 46.654 0.006 0.009 0.009<br />
522 -233378.467 282873.829 81.333 0.006 0.009 0.009<br />
523 -233102.511 284153.771 83.216 0.006 0.009 0.009<br />
524 -232610.071 284847.067 53.488 0.006 0.009 0.009<br />
526 -233759.808 284437.601 72.046 0.006 0.009 0.009<br />
527 -233432.576 283770.938 95.378 0.006 0.009 0.009<br />
528 -234438.501 282868.186 84.240 0.005 0.008 0.008<br />
550 -232979.141 282392.155 70.198 0.007 0.009 0.010<br />
551 -233788.621 282342.592 69.891 0.005 0.007 0.008<br />
552 -235260.560 282173.715 64.657 0.010 0.014 0.014<br />
553 -236003.170 282280.737 53.859 0.006 0.009 0.009<br />
554 -236567.420 282313.115 88.130 0.006 0.009 0.009<br />
555 -236203.228 282961.065 53.121 0.006 0.009 0.009<br />
556 -235357.638 282910.106 80.788 0.006 0.009 0.009<br />
557 -235075.449 283267.723 89.012 0.006 0.009 0.009<br />
560 -234030.714 283131.978 98.544 0.006 0.009 0.009<br />
561 -234969.605 283742.595 97.901 0.005 0.009 0.009<br />
562 -234929.141 284349.365 83.371 0.005 0.009 0.009<br />
564 -236016.279 285474.800 44.591 0.006 0.009 0.009<br />
565 -234819.461 285566.792 46.788 0.005 0.009 0.009<br />
570 -233159.003 286350.914 46.021 0.006 0.009 0.000<br />
571 -233329.343 285836.161 44.708 0.006 0.009 0.009<br />
572 -233287.552 285255.139 47.621 0.006 0.009 0.009<br />
573 -234000.004 285391.701 47.427 0.005 0.009 0.009<br />
574 -233483.647 285001.785 56.888 0.006 0.009 0.009<br />
201
Bundle adjustment<br />
575 -234337.117 284468.167 78.919 0.005 0.009 0.009<br />
576 -234006.225 286427.026 45.494 0.005 0.008 0.007<br />
577 -233290.934 284764.615 67.004 0.006 0.009 0.009<br />
580 -237637.107 286881.183 46.671 0.007 0.010 0.010<br />
581 -238917.674 284447.618 49.061 0.008 0.010 0.011<br />
582 -237554.347 283757.393 56.158 0.007 0.010 0.010<br />
583 -237731.321 282788.805 75.524 0.007 0.010 0.010<br />
584 -237547.518 283007.617 70.654 0.007 0.009 0.010<br />
585 -237021.134 282909.262 68.805 0.007 0.009 0.010<br />
590 -232554.462 283174.045 71.527 0.007 0.009 0.010<br />
903 -235997.773 286009.151 55.278 0.007 0.009 0.000<br />
905 -237606.224 286199.132 47.337 0.007 0.009 0.000<br />
906 -237046.166 285396.913 48.032 0.006 0.009 0.000<br />
907 -237338.731 284514.254 83.463 0.008 0.012 0.012<br />
908 -235981.383 284741.966 52.951 0.007 0.012 0.012<br />
909 -236320.798 284513.924 48.853 0.009 0.013 0.013<br />
910 -233102.948 284149.274 82.209 0.008 0.012 0.012<br />
911 -234073.623 283756.103 91.001 0.007 0.012 0.012<br />
912 -234438.496 282869.983 84.017 0.007 0.012 0.012<br />
950 -233199.601 282251.011 69.037 0.006 0.009 0.010<br />
952 -236005.858 282283.630 53.421 0.008 0.012 0.012<br />
953 -236543.979 282318.671 85.843 0.006 0.009 0.000<br />
954 -236366.495 283292.343 61.084 0.006 0.009 0.000<br />
957 -235075.449 283267.723 89.012 0.005 0.007 0.007<br />
960 -234033.786 283131.455 98.275 0.006 0.009 0.000<br />
961 -234971.648 283748.946 98.080 0.007 0.012 0.012<br />
962 -235254.598 284509.749 86.660 0.007 0.012 0.012<br />
963 -235775.678 284266.188 72.075 0.007 0.012 0.012<br />
964 -235110.072 285316.600 57.468 0.007 0.012 0.012<br />
970 -232988.010 285198.205 50.175 0.006 0.009 0.000<br />
971 -233332.349 285838.927 44.555 0.008 0.012 0.012<br />
972 -233481.254 285000.952 56.838 0.008 0.012 0.012<br />
973 -234342.630 284470.555 78.289 0.009 0.013 0.014<br />
981 -238914.824 284446.786 48.280 0.009 0.013 0.014<br />
982 -236986.745 283991.389 82.298 0.008 0.012 0.012<br />
983 -237730.370 282782.356 75.180 0.008 0.012 0.013<br />
984 -237534.169 282997.628 71.038 0.008 0.012 0.013<br />
985 -237024.678 282907.587 68.189 0.008 0.012 0.000<br />
990 -232553.581 283174.079 70.531 0.008 0.012 0.000
E.4 Aerotriangulation for images in scale 1:25,000<br />
E.4 Aerotriangulation for images in scale<br />
1:25,000<br />
This Appendix contains a cut out <strong>of</strong> the results from the aerotriangulation for the images in the scale<br />
1:25,000 calculated by Bingo.<br />
The co-ordinate list ’Itera.dat’ file from the aerotriangulation can be found in section 4.1.<br />
BINGO-F - VERS. 3.3 / 12.96 10:27:32 Monday, 07 February 2000<br />
===============================================================================<br />
RESULTS OF ADJUSTMENT SIGMA 0 = 4.24 (1/1000)<br />
===============================================================================<br />
EXTERIOR ORIENTATION DATA<br />
TYPE PHOTO X Y Z PHI OMEGA KAPPA<br />
+- S (1/1000)<br />
-------------------------------------------------------------------------------<br />
A 60 -238430.755 284695.965 3809.087 0.1108 1.0431 197.3096<br />
+- 277. 241. 197. 4.6 3.3 1.7<br />
A 62 -233826.896 284522.027 3796.847 -0.9418 0.1314 198.4115<br />
+- 260. 231. 140. 4.1 3.3 1.4<br />
A 61 -236129.459 284617.439 3805.005 0.2995 1.2819 198.2017<br />
+- 212. 201. 102. 3.2 3.0 1.1<br />
CAMERA DATA<br />
-------------------------------------------------------------------------------<br />
CAMERA NO. 1<br />
NO UNKNOWN PARAMETERS<br />
COORDINATES OF OBJECT POINTS<br />
POINT NO. X Y Z +- S X S Y S Z<br />
( 1 / 1 0 0 0 )<br />
-------------------------------------------------------------------------------<br />
580 -237637.036 286881.216 46.703 78. 87. 135.<br />
981 -238915.398 284447.722 48.191 134. 107. 143.<br />
581 -238917.635 284447.615 47.796 89. 80. 262.<br />
506 -236174.183 286726.584 101.651 68. 76. 120.<br />
520 -236312.494 284591.399 49.258 63. 63. 150.<br />
963 -235775.530 284266.746 72.122 105. 90. 137.<br />
952 -236006.679 282282.887 53.479 87. 116. 128.<br />
583 -237731.410 282788.866 75.032 78. 89. 234.<br />
1194 -235887.516 282242.084 59.917 88. 127. 178.<br />
983 -237725.151 282787.200 75.062 104. 135. 140.<br />
1111 -236108.543 284380.039 53.837 75. 77. 149.<br />
1100 -236500.127 284781.888 55.894 77. 77. 152.<br />
203
Bundle adjustment<br />
1106 -236131.840 287181.344 93.056 87. 131. 184.<br />
1105 -236256.222 287004.740 102.184 86. 124. 180.<br />
1124 -238546.221 282220.624 93.288 147. 205. 304.<br />
1123 -238590.831 282177.872 93.335 150. 209. 306.<br />
1121 -238908.525 284897.477 52.421 152. 108. 295.<br />
1120 -238856.131 284504.035 49.851 149. 106. 293.<br />
1126 -238660.464 287183.299 48.902 155. 215. 320.<br />
1125 -238528.880 287293.175 47.826 149. 222. 319.<br />
551 -233788.733 282342.616 69.765 81. 87. 137.<br />
526 -233759.568 284437.529 72.269 75. 72. 133.<br />
574 -233483.637 285001.741 57.227 85. 74. 230.<br />
500 -233539.299 287189.782 57.706 82. 90. 140.<br />
9963 -235775.917 284267.075 75.440 101. 89. 256.<br />
553 -236003.093 282280.655 53.983 77. 91. 206.<br />
1113 -235727.089 282127.007 56.271 108. 195. 283.<br />
1096 -233339.146 287202.214 57.966 160. 217. 310.<br />
1095 -233478.460 287229.890 55.438 152. 218. 307.<br />
1094 -233765.007 282354.567 76.256 134. 183. 290.<br />
1093 -233831.065 282287.281 69.863 132. 187. 291.<br />
1091 -233550.847 284934.634 59.931 134. 98. 275.<br />
1090 -233655.927 284747.147 64.215 128. 95. 272.<br />
Mean squared precision <strong>of</strong> object points: 113. 136. 231.<br />
Mean squared precision <strong>of</strong> control points: 78. 82. 135.
E.4 Aerotriangulation for images in scale 1:25,000<br />
E.4.1 The ’Itera.dat’ file from the aerotriangulation for<br />
images in 1:25,000<br />
ORIA 160 -238430.755 284695.965 3809.087 0.1108 1.0431 197.3096 1<br />
ORIA 161 -236129.459 284617.439 3805.005 0.2995 1.2819 198.2017 1<br />
ORIA 162 -233826.896 284522.027 3796.847 -0.9418 0.1314 198.4115 1<br />
CORD 500 -233539.299 287189.782 57.706 0.082 0.090 0.140<br />
CORD 506 -236174.183 286726.584 101.651 0.068 0.076 0.120<br />
CORD 520 -236312.494 284591.399 49.258 0.063 0.063 0.150<br />
CORD 526 -233759.568 284437.529 72.269 0.075 0.072 0.133<br />
CORD 551 -233788.733 282342.616 69.765 0.081 0.087 0.137<br />
CORD 553 -236003.093 282280.655 53.983 0.077 0.091 0.206<br />
CORD 574 -233483.637 285001.741 57.227 0.085 0.074 0.230<br />
CORD 580 -237637.036 286881.216 46.703 0.078 0.087 0.135<br />
CORD 581 -238917.635 284447.615 47.796 0.089 0.080 0.262<br />
CORD 583 -237731.410 282788.866 75.032 0.078 0.089 0.234<br />
CORD 952 -236006.679 282282.887 53.479 0.087 0.116 0.128<br />
CORD 963 -235775.530 284266.746 72.122 0.105 0.090 0.137<br />
CORD 981 -238915.398 284447.722 48.191 0.134 0.107 0.143<br />
CORD 983 -237725.151 282787.200 75.062 0.104 0.135 0.140<br />
CORD 1090 -233655.927 284747.147 64.215 0.128 0.095 0.272<br />
CORD 1091 -233550.847 284934.634 59.931 0.134 0.098 0.275<br />
CORD 1093 -233831.065 282287.281 69.863 0.132 0.187 0.291<br />
CORD 1094 -233765.007 282354.567 76.256 0.134 0.183 0.290<br />
CORD 1095 -233478.460 287229.890 55.438 0.152 0.218 0.307<br />
CORD 1096 -233339.146 287202.214 57.966 0.160 0.217 0.310<br />
CORD 1100 -236500.127 284781.888 55.894 0.077 0.077 0.152<br />
CORD 1105 -236256.222 287004.740 102.184 0.086 0.124 0.180<br />
CORD 1106 -236131.840 287181.344 93.056 0.087 0.131 0.184<br />
CORD 1111 -236108.543 284380.039 53.837 0.075 0.077 0.149<br />
CORD 1113 -235727.089 282127.007 56.271 0.108 0.195 0.283<br />
CORD 1120 -238856.131 284504.035 49.851 0.149 0.106 0.293<br />
CORD 1121 -238908.525 284897.477 52.421 0.152 0.108 0.295<br />
CORD 1123 -238590.831 282177.872 93.335 0.150 0.209 0.306<br />
CORD 1124 -238546.221 282220.624 93.288 0.147 0.205 0.304<br />
CORD 1125 -238528.880 287293.175 47.826 0.149 0.222 0.319<br />
CORD 1126 -238660.464 287183.299 48.902 0.155 0.215 0.320<br />
CORD 1194 -235887.516 282242.084 59.917 0.088 0.127 0.178<br />
CORD 9963 -235775.917 284267.075 75.440 0.101 0.089 0.256<br />
END<br />
205
Bundle adjustment<br />
E.5 Aerotriangulation for images in scale<br />
1:15,000<br />
This Appendix contains a cut out <strong>of</strong> the results from the aerotriangulation for the images in scale 1:15,000<br />
calculated by Bingo.<br />
The co-ordinate list ’Itera.dat’-file from the aerotriangulation can be found in section A.5.1.<br />
BINGO-F - VERS. 3.3 / 12.96 10:26:45 Monday, 07 February 2000<br />
===============================================================================<br />
RESULTS OF ADJUSTMENT SIGMA 0 = 4.90 (1/1000)<br />
===============================================================================<br />
EXTERIOR ORIENTATION DATA<br />
TYPE PHOTO X Y Z PHI OMEGA KAPPA<br />
+- S (1/1000)<br />
-------------------------------------------------------------------------------<br />
A 50 -237724.848 285806.445 2330.373 -1.4139 -0.6494 198.5242<br />
+- 205. 226. 140. 5.2 5.1 2.6<br />
A 59 -237939.897 283472.478 2327.585 0.3645 -0.7929 197.2592<br />
+- 196. 205. 135. 5.1 4.7 2.3<br />
A 58 -236557.157 283416.057 2327.377 0.4164 -1.4382 196.7872<br />
+- 131. 166. 71. 3.3 4.2 1.5<br />
A 51 -236343.692 285770.199 2331.093 -0.2055 2.8972 199.1731<br />
+- 144. 191. 81. 3.4 4.9 1.8<br />
A 55 -232419.404 283242.176 2337.560 0.1449 -0.5721 195.2690<br />
+- 218. 206. 152. 5.9 4.7 2.4<br />
A 57 -235177.282 283354.397 2333.829 0.2893 -1.1086 196.5917<br />
+- 116. 151. 54. 2.8 4.0 1.2<br />
A 56 -233797.720 283315.066 2334.663 0.5206 -0.3600 195.7568<br />
+- 147. 165. 77. 3.7 4.2 1.5<br />
A 53 -233582.516 285648.282 2336.727 -0.2777 2.8198 199.7259<br />
+- 214. 214. 126. 5.6 5.3 2.2<br />
A 52 -234964.014 285682.564 2330.803 -0.6651 1.9315 199.1407<br />
+- 147. 175. 71. 3.4 4.6 1.5<br />
CAMERA DATA<br />
-------------------------------------------------------------------------------<br />
CAMERA NO. 1<br />
NO UNKNOWN PARAMETERS
COORDINATES OF OBJECT POINTS<br />
E.5 Aerotriangulation for images in scale 1:15,000<br />
POINT NO. X Y Z +- S X S Y S Z<br />
( 1 / 1 0 0 0 )<br />
-------------------------------------------------------------------------------<br />
580 -237636.945 286881.304 46.043 111. 125. 189.<br />
903 -235997.359 286008.974 55.277 87. 65. 127.<br />
512 -237810.138 285660.737 81.322 90. 89. 127.<br />
515 -237956.507 284745.480 65.167 68. 63. 125.<br />
1034 -237853.987 284295.895 53.334 108. 147. 223.<br />
1032 -237745.793 284534.407 65.752 97. 128. 210.<br />
1033 -237635.627 284451.113 82.657 91. 131. 208.<br />
1031 -237969.724 285655.504 79.736 110. 94. 198.<br />
1036 -237939.667 286995.714 41.316 135. 147. 235.<br />
1035 -237860.817 287129.996 41.541 134. 156. 239.<br />
1126 -236480.364 287107.404 101.314 99. 143. 216.<br />
506 -236174.067 286726.504 101.438 65. 68. 108.<br />
520 -236312.537 284591.399 48.419 38. 37. 84.<br />
1023 -236259.218 284417.870 44.924 39. 38. 85.<br />
909 -236322.553 284496.517 48.998 43. 41. 82.<br />
1024 -236312.856 284491.159 46.918 40. 38. 84.<br />
1025 -236451.671 287412.363 97.020 89. 120. 165.<br />
1020 -236508.666 285869.832 48.200 58. 57. 107.<br />
582 -237554.522 283757.394 55.987 60. 65. 123.<br />
983 -237728.781 282782.309 75.093 81. 86. 129.<br />
583 -237731.449 282788.782 74.561 72. 75. 188.<br />
1086 -237720.110 284787.355 83.352 81. 127. 203.<br />
1085 -238060.766 284640.805 48.519 100. 124. 212.<br />
1084 -237853.088 281770.423 76.234 112. 168. 235.<br />
1083 -238004.465 282139.546 92.020 113. 137. 224.<br />
1081 -238025.103 283314.029 68.198 96. 82. 200.<br />
1080 -238087.010 283407.552 72.296 99. 82. 200.<br />
1071 -236429.968 283408.897 56.873 50. 50. 102.<br />
554 -236567.429 282313.131 87.663 55. 67. 124.<br />
1070 -236554.020 283433.781 61.064 50. 51. 102.<br />
954 -236366.481 283292.382 61.247 50. 50. 88.<br />
1076 -236550.799 284892.647 47.072 55. 79. 128.<br />
1075 -236631.650 285015.363 45.886 57. 84. 133.<br />
1074 -236951.777 281955.028 87.914 72. 96. 145.<br />
1073 -236817.835 281945.441 88.054 69. 96. 144.<br />
952 -236006.005 282283.492 53.431 66. 90. 125.<br />
1061 -235498.720 283136.675 84.979 64. 59. 174.<br />
553 -236003.062 282280.747 53.536 59. 81. 168.<br />
953 -236543.645 282315.811 85.998 77. 90. 126.<br />
1060 -235164.424 283618.446 88.484 47. 47. 102.<br />
1063 -235024.851 282075.554 62.134 60. 81. 132.<br />
1064 -235397.310 282157.306 65.669 60. 78. 130.<br />
1066 -234976.536 284745.566 69.336 52. 76. 128.<br />
1065 -235279.228 284620.937 83.105 50. 70. 122.<br />
552 -235260.507 282173.982 64.915 54. 64. 105.<br />
561 -234969.559 283742.575 98.025 45. 45. 102.<br />
962 -235254.393 284502.971 86.861 49. 62. 100.<br />
562 -234929.064 284349.408 83.205 46. 55. 112.<br />
963 -235775.945 284265.741 72.068 57. 100. 123.<br />
9501 -234841.575 286362.191 48.278 85. 75. 129.<br />
503 -234919.573 286305.946 46.856 58. 57. 124.<br />
565 -234819.414 285566.756 47.033 49. 47. 90.<br />
9962 -235252.808 284506.074 86.883 60. 87. 122.<br />
1026 -236494.372 287031.781 103.355 110. 136. 218.<br />
1016 -235030.468 286505.559 62.079 66. 70. 133.<br />
1015 -234772.551 287100.882 65.330 79. 102. 162.<br />
1013 -234859.336 284303.474 77.580 39. 39. 85.<br />
1021 -236552.956 285900.917 41.191 97. 66. 191.<br />
9960 -234029.661 283133.045 98.195 78. 60. 123.<br />
560 -234031.046 283132.072 99.519 74. 55. 165.<br />
551 -233788.727 282342.569 69.689 56. 63. 101.<br />
550 -232979.126 282392.157 69.885 68. 75. 125.<br />
207
Bundle adjustment<br />
990 -232553.563 283174.327 70.456 81. 78. 128.<br />
590 -232554.500 283174.039 70.361 72. 69. 192.<br />
524 -232610.069 284846.958 52.791 73. 92. 168.<br />
1054 -233662.026 281947.678 63.725 68. 92. 137.<br />
1053 -233688.937 281809.200 63.765 70. 99. 143.<br />
1051 -233844.034 283698.732 86.298 51. 53. 103.<br />
1050 -234056.540 283250.121 93.589 52. 50. 103.<br />
1056 -233786.171 284735.575 62.096 57. 81. 130.<br />
1055 -233914.621 284901.448 60.103 89. 150. 214.<br />
1046 -232049.045 284369.939 46.916 123. 125. 228.<br />
1045 -232062.869 284326.151 48.082 121. 122. 226.<br />
1043 -232635.363 281892.199 85.343 101. 142. 221.<br />
1044 -232610.433 281736.181 89.563 106. 156. 227.<br />
1040 -232250.242 283257.493 69.320 103. 84. 206.<br />
526 -233759.670 284437.502 71.985 43. 45. 83.<br />
1004 -233428.478 284443.588 89.806 53. 56. 99.<br />
1003 -233417.951 284270.398 100.549 53. 56. 100.<br />
960 -234029.597 283133.019 98.508 64. 60. 120.<br />
1155 -233693.960 284814.069 61.031 88. 134. 207.<br />
1014 -234745.498 284273.670 76.900 43. 42. 91.<br />
972 -233480.722 285000.859 56.886 78. 78. 123.<br />
574 -233483.648 285001.768 56.957 66. 66. 118.<br />
971 -233331.959 285838.318 44.629 93. 77. 128.<br />
571 -233329.487 285836.159 44.210 81. 68. 183.<br />
500 -233539.069 287190.133 56.457 116. 157. 237.<br />
501 -234841.655 286362.198 48.207 78. 77. 129.<br />
9562 -234928.901 284349.078 83.014 74. 119. 195.<br />
1006 -233478.242 287230.326 54.093 123. 167. 250.<br />
1005 -233339.227 287202.267 57.091 132. 166. 252.<br />
1001 -233364.589 285718.132 45.455 101. 75. 196.<br />
1000 -233378.997 285600.573 48.776 99. 74. 193.<br />
Mean squared precision <strong>of</strong> object points: 80. 93. 160.<br />
Mean squared precision <strong>of</strong> control points: 69. 75. 128.
E.5 Aerotriangulation for images in scale 1:15,000<br />
E.5.1 The ’Itera.dat’ file from the aerotriangulation for<br />
the images in scale 1:15,000<br />
ORIA 150 -237724.848 285806.445 2330.373 -1.4139 -0.6494 198.5242 1<br />
ORIA 151 -236343.692 285770.199 2331.093 -0.2055 2.8972 199.1731 1<br />
ORIA 152 -234964.014 285682.564 2330.803 -0.6651 1.9315 199.1407 1<br />
ORIA 153 -233582.516 285648.282 2336.727 -0.2777 2.8198 199.7259 1<br />
ORIA 155 -232419.404 283242.176 2337.560 0.1449 -0.5721 195.2690 1<br />
ORIA 156 -233797.720 283315.066 2334.663 0.5206 -0.3600 195.7568 1<br />
ORIA 157 -235177.282 283354.397 2333.829 0.2893 -1.1086 196.5917 1<br />
ORIA 158 -236557.157 283416.057 2327.377 0.4164 -1.4382 196.7872 1<br />
ORIA 159 -237939.897 283472.478 2327.585 0.3645 -0.7929 197.2592 1<br />
CORD 500 -233539.069 287190.133 56.457 0.116 0.157 0.237<br />
CORD 501 -234841.655 286362.198 48.207 0.078 0.077 0.129<br />
CORD 503 -234919.573 286305.946 46.856 0.058 0.057 0.124<br />
CORD 506 -236174.067 286726.504 101.438 0.065 0.068 0.108<br />
CORD 512 -237810.138 285660.737 81.322 0.090 0.089 0.127<br />
CORD 515 -237956.507 284745.480 65.167 0.068 0.063 0.125<br />
CORD 520 -236312.537 284591.399 48.419 0.038 0.037 0.084<br />
CORD 524 -232610.069 284846.958 52.791 0.073 0.092 0.168<br />
CORD 526 -233759.670 284437.502 71.985 0.043 0.045 0.083<br />
CORD 550 -232979.126 282392.157 69.885 0.068 0.075 0.125<br />
CORD 551 -233788.727 282342.569 69.689 0.056 0.063 0.101<br />
CORD 552 -235260.507 282173.982 64.915 0.054 0.064 0.105<br />
CORD 553 -236003.062 282280.747 53.536 0.059 0.081 0.168<br />
CORD 554 -236567.429 282313.131 87.663 0.055 0.067 0.124<br />
CORD 560 -234031.046 283132.072 99.519 0.074 0.055 0.165<br />
CORD 561 -234969.559 283742.575 98.025 0.045 0.045 0.102<br />
CORD 562 -234929.064 284349.408 83.205 0.046 0.055 0.112<br />
CORD 565 -234819.414 285566.756 47.033 0.049 0.047 0.090<br />
CORD 571 -233329.487 285836.159 44.210 0.081 0.068 0.183<br />
CORD 574 -233483.648 285001.768 56.957 0.066 0.066 0.118<br />
CORD 580 -237636.945 286881.304 46.043 0.111 0.125 0.189<br />
CORD 582 -237554.522 283757.394 55.987 0.060 0.065 0.123<br />
CORD 583 -237731.449 282788.782 74.561 0.072 0.075 0.188<br />
CORD 590 -232554.500 283174.039 70.361 0.072 0.069 0.192<br />
CORD 903 -235997.359 286008.974 55.277 0.087 0.065 0.127<br />
CORD 909 -236322.553 284496.517 48.998 0.043 0.041 0.082<br />
CORD 952 -236006.005 282283.492 53.431 0.066 0.090 0.125<br />
CORD 953 -236543.645 282315.811 85.998 0.077 0.090 0.126<br />
CORD 954 -236366.481 283292.382 61.247 0.050 0.050 0.088<br />
CORD 960 -234029.597 283133.019 98.508 0.064 0.060 0.120<br />
CORD 962 -235254.393 284502.971 86.861 0.049 0.062 0.100<br />
CORD 963 -235775.945 284265.741 72.068 0.057 0.100 0.123<br />
CORD 971 -233331.959 285838.318 44.629 0.093 0.077 0.128<br />
CORD 972 -233480.722 285000.859 56.886 0.078 0.078 0.123<br />
CORD 983 -237728.781 282782.309 75.093 0.081 0.086 0.129<br />
CORD 990 -232553.563 283174.327 70.456 0.081 0.078 0.128<br />
CORD 1000 -233378.997 285600.573 48.776 0.099 0.074 0.193<br />
CORD 1001 -233364.589 285718.132 45.455 0.101 0.075 0.196<br />
CORD 1003 -233417.951 284270.398 100.549 0.053 0.056 0.100<br />
CORD 1004 -233428.478 284443.588 89.806 0.053 0.056 0.099<br />
CORD 1005 -233339.227 287202.267 57.091 0.132 0.166 0.252<br />
CORD 1006 -233478.242 287230.326 54.093 0.123 0.167 0.250<br />
209
Bundle adjustment<br />
CORD 1013 -234859.336 284303.474 77.580 0.039 0.039 0.085<br />
CORD 1014 -234745.498 284273.670 76.900 0.043 0.042 0.091<br />
CORD 1015 -234772.551 287100.882 65.330 0.079 0.102 0.162<br />
CORD 1016 -235030.468 286505.559 62.079 0.066 0.070 0.133<br />
CORD 1020 -236508.666 285869.832 48.200 0.058 0.057 0.107<br />
CORD 1021 -236552.956 285900.917 41.191 0.097 0.066 0.191<br />
CORD 1023 -236259.218 284417.870 44.924 0.039 0.038 0.085<br />
CORD 1024 -236312.856 284491.159 46.918 0.040 0.038 0.084<br />
CORD 1025 -236451.671 287412.363 97.020 0.089 0.120 0.165<br />
CORD 1026 -236494.372 287031.781 103.355 0.110 0.136 0.218<br />
CORD 1031 -237969.724 285655.504 79.736 0.110 0.094 0.198<br />
CORD 1032 -237745.793 284534.407 65.752 0.097 0.128 0.210<br />
CORD 1033 -237635.627 284451.113 82.657 0.091 0.131 0.208<br />
CORD 1034 -237853.987 284295.895 53.334 0.108 0.147 0.223<br />
CORD 1035 -237860.817 287129.996 41.541 0.134 0.156 0.239<br />
CORD 1036 -237939.667 286995.714 41.316 0.135 0.147 0.235<br />
CORD 1040 -232250.242 283257.493 69.320 0.103 0.084 0.206<br />
CORD 1043 -232635.363 281892.199 85.343 0.101 0.142 0.221<br />
CORD 1044 -232610.433 281736.181 89.563 0.106 0.156 0.227<br />
CORD 1045 -232062.869 284326.151 48.082 0.121 0.122 0.226<br />
CORD 1046 -232049.045 284369.939 46.916 0.123 0.125 0.228<br />
CORD 1050 -234056.540 283250.121 93.589 0.052 0.050 0.103<br />
CORD 1051 -233844.034 283698.732 86.298 0.051 0.053 0.103<br />
CORD 1053 -233688.937 281809.200 63.765 0.070 0.099 0.143<br />
CORD 1054 -233662.026 281947.678 63.725 0.068 0.092 0.137<br />
CORD 1055 -233914.621 284901.448 60.103 0.089 0.150 0.214<br />
CORD 1056 -233786.171 284735.575 62.096 0.057 0.081 0.130<br />
CORD 1060 -235164.424 283618.446 88.484 0.047 0.047 0.102<br />
CORD 1061 -235498.720 283136.675 84.979 0.064 0.059 0.174<br />
CORD 1063 -235024.851 282075.554 62.134 0.060 0.081 0.132<br />
CORD 1064 -235397.310 282157.306 65.669 0.060 0.078 0.130<br />
CORD 1065 -235279.228 284620.937 83.105 0.050 0.070 0.122<br />
CORD 1066 -234976.536 284745.566 69.336 0.052 0.076 0.128<br />
CORD 1070 -236554.020 283433.781 61.064 0.050 0.051 0.102<br />
CORD 1071 -236429.968 283408.897 56.873 0.050 0.050 0.102<br />
CORD 1073 -236817.835 281945.441 88.054 0.069 0.096 0.144<br />
CORD 1074 -236951.777 281955.028 87.914 0.072 0.096 0.145<br />
CORD 1075 -236631.650 285015.363 45.886 0.057 0.084 0.133<br />
CORD 1076 -236550.799 284892.647 47.072 0.055 0.079 0.128<br />
CORD 1080 -238087.010 283407.552 72.296 0.099 0.082 0.200<br />
CORD 1081 -238025.103 283314.029 68.198 0.096 0.082 0.200<br />
CORD 1083 -238004.465 282139.546 92.020 0.113 0.137 0.224<br />
CORD 1084 -237853.088 281770.423 76.234 0.112 0.168 0.235<br />
CORD 1085 -238060.766 284640.805 48.519 0.100 0.124 0.212<br />
CORD 1086 -237720.110 284787.355 83.352 0.081 0.127 0.203<br />
CORD 1126 -236480.364 287107.404 101.314 0.099 0.143 0.216<br />
CORD 1155 -233693.960 284814.069 61.031 0.088 0.134 0.207<br />
CORD 9501 -234841.575 286362.191 48.278 0.085 0.075 0.129<br />
CORD 9562 -234928.901 284349.078 83.014 0.074 0.119 0.195<br />
CORD 9960 -234029.661 283133.045 98.195 0.078 0.060 0.123<br />
CORD 9962 -235252.808 284506.074 86.883 0.060 0.087 0.122<br />
END
E.6 Aerotriangulation for images in scale 1:5,000<br />
E.6 Aerotriangulation for images in scale<br />
1:5,000<br />
This Appendix contains a cut out <strong>of</strong> the results from the aerotriangulation for the images in scale 1:5,000<br />
calculated by Bingo.<br />
The co-ordinate list ’Itera-dat’ file from the aerotriangulation can be found in section A.6.1.<br />
BINGO-F - VERS. 3.3 / 12.96 17:37:23 Friday, 13 June 1997<br />
===============================================================================<br />
RESULTS OF ADJUSTMENT SIGMA 0 = 5.64 (1/1000)<br />
===============================================================================<br />
EXTERIOR ORIENTATION DATA<br />
TYPE PHOTO X Y Z PHI OMEGA KAPPA<br />
+- S (1/1000)<br />
-------------------------------------------------------------------------------<br />
A 25 -233179.216 285745.958 852.126 -0.5397 2.9245 0.4688<br />
+- 103. 94. 64. 7.9 5.4 3.2<br />
A 24 -233637.218 285778.321 846.394 -0.9264 3.3689 0.3643<br />
+- 74. 64. 38. 5.0 4.0 2.0<br />
A 23 -234096.980 285811.615 842.376 -0.7450 3.1955 0.9883<br />
+- 55. 62. 32. 3.6 4.0 1.6<br />
A 22 -234557.542 285826.807 840.822 -0.6096 1.5624 1.5186<br />
+- 53. 54. 34. 3.4 3.6 1.5<br />
A 28 -233346.155 284966.369 846.695 0.4905 -0.8700 -2.8712<br />
+- 96. 77. 58. 7.5 5.0 2.7<br />
A 29 -233807.007 284978.145 846.696 0.1334 -0.6853 -2.6454<br />
+- 56. 62. 34. 3.9 4.2 1.5<br />
A 47 -233215.748 284179.148 848.918 -0.6165 1.7285 -0.7529<br />
+- 88. 80. 58. 6.6 5.0 3.0<br />
A 50 -233375.137 283383.390 835.308 0.4113 -0.3104 -2.1485<br />
+- 95. 101. 58. 7.7 6.4 3.1<br />
A 46 -233674.833 284192.486 848.576 -0.1593 1.4757 -0.7465<br />
+- 57. 66. 34. 4.0 4.4 1.9<br />
A 51 -233835.694 283387.231 831.605 0.2399 -0.8748 -1.8160<br />
+- 63. 67. 35. 4.4 4.7 2.1<br />
A 30 -234267.289 284987.450 848.212 0.6982 -1.2703 -1.8252<br />
+- 48. 56. 32. 3.3 3.9 1.2<br />
A 45 -234137.416 284200.401 849.873 -0.6427 0.9059 -0.9229<br />
+- 49. 59. 30. 3.3 4.3 1.4<br />
A 52 -234296.811 283392.882 831.894 0.4037 -1.6701 -1.5609<br />
+- 56. 67. 34. 4.0 4.8 1.8<br />
211
Bundle adjustment<br />
A 44 -234597.462 284214.869 847.518 -0.7318 1.1641 -0.8227<br />
+- 45. 55. 29. 3.0 4.0 1.3<br />
A 31 -234726.972 285005.292 847.792 1.0107 -2.1772 -1.8911<br />
+- 46. 53. 31. 2.9 3.7 1.2<br />
A 53 -234756.815 283407.806 830.036 0.9576 -2.2953 -1.5895<br />
+- 61. 66. 37. 4.5 4.9 1.6<br />
A 43 -235055.798 284234.716 850.143 -0.4898 1.6250 -0.7681<br />
+- 47. 55. 30. 3.2 4.0 1.2<br />
A 54 -235215.156 283423.867 830.885 1.0449 -1.9683 -1.4650<br />
+- 57. 62. 35. 4.0 4.6 1.7<br />
A 21 -235016.779 285832.133 844.607 -0.3232 1.5418 1.3886<br />
+- 55. 60. 34. 3.5 3.9 1.4<br />
A 32 -235185.959 285024.143 846.497 0.7617 -1.9123 -1.8986<br />
+- 52. 55. 32. 3.5 3.8 1.3<br />
A 42 -235515.687 284251.581 850.102 -0.2895 0.8219 -0.5635<br />
+- 46. 52. 28. 3.0 3.8 1.1<br />
A 55 -235675.349 283433.840 834.141 1.3325 -1.6600 -1.4489<br />
+- 61. 65. 39. 4.4 4.7 1.6<br />
A 20 -235478.377 285846.227 844.075 -0.7417 1.9825 1.1766<br />
+- 53. 56. 30. 3.1 3.7 1.5<br />
A 33 -235646.174 285033.569 844.193 0.4681 -1.6560 -1.6280<br />
+- 50. 53. 29. 3.3 3.6 1.2<br />
A 19 -235938.893 285864.748 843.860 -1.0137 1.5901 1.3236<br />
+- 54. 62. 32. 3.6 4.0 1.6<br />
A 56 -236135.452 283448.501 834.874 1.1969 -2.4428 -1.7624<br />
+- 65. 69. 43. 4.7 4.9 1.8<br />
A 34 -236106.032 285039.190 842.027 0.5885 -2.0339 -1.5793<br />
+- 48. 51. 28. 3.2 3.5 1.2<br />
A 41 -235975.280 284263.367 852.039 -0.2524 1.1511 -0.6252<br />
+- 48. 55. 28. 3.2 4.0 1.2<br />
A 40 -236433.678 284278.458 855.376 -0.5436 1.6036 -0.5884<br />
+- 49. 58. 29. 3.2 4.1 1.3<br />
A 57 -236596.001 283468.255 835.142 0.7732 -2.3852 -1.8457<br />
+- 66. 69. 40. 4.5 5.0 2.1<br />
A 58 -237054.566 283479.872 839.904 1.1973 -1.9727 -1.6910<br />
+- 71. 77. 43. 4.9 5.4 2.3<br />
A 59 -237516.804 283487.318 841.266 0.8795 -1.6951 -1.2705<br />
+- 90. 108. 63. 6.7 6.7 3.6<br />
A 39 -236892.603 284296.914 855.320 -0.2433 1.2525 -0.4415<br />
+- 52. 62. 33. 3.4 4.2 1.6<br />
A 38 -237353.784 284305.809 857.948 -0.0370 -0.1739 -0.2144<br />
+- 75. 78. 55. 5.7 4.9 2.7<br />
A 37 -237482.584 285093.060 841.018 0.9637 -2.4814 -2.0346<br />
+- 82. 83. 53. 6.4 4.7 2.9<br />
A 35 -236563.528 285055.529 840.315 0.8977 -3.0431 -1.9596<br />
+- 48. 53. 27. 3.2 3.5 1.3
E.6 Aerotriangulation for images in scale 1:5,000<br />
A 16 -237319.673 285893.592 849.076 -0.8618 0.1705 2.4667<br />
+- 72. 79. 43. 5.1 4.5 2.5<br />
A 17 -236859.041 285881.673 849.567 -0.8425 0.9451 1.1708<br />
+- 55. 62. 29. 3.5 3.8 1.7<br />
A 36 -237023.137 285076.503 840.804 0.8952 -2.7507 -2.0233<br />
+- 57. 59. 28. 4.1 3.6 1.7<br />
A 18 -236398.040 285873.118 846.771 -0.5826 0.5119 1.2708<br />
+- 52. 54. 28. 3.1 3.6 1.4<br />
CAMERA DATA<br />
-------------------------------------------------------------------------------<br />
CAMERA NO. 1<br />
NO UNKNOWN PARAMETERS<br />
COORDINATES OF OBJECT POINTS<br />
POINT NO. X Y Z +- S X S Y S Z<br />
( 1 / 1 0 0 0 )<br />
-------------------------------------------------------------------------------<br />
611 -233148.535 286345.001 46.165 52. 68. 49.<br />
610 -233159.069 286346.880 46.200 52. 68. 49.<br />
2087 -233509.667 285338.157 49.670 36. 53. 91.<br />
971 -233332.349 285838.927 44.555 36. 41. 47.<br />
571 -233329.343 285836.161 44.708 36. 41. 84.<br />
570 -233159.003 286350.914 46.021 43. 48. 79.<br />
2096 -233081.082 285397.772 46.391 56. 56. 100.<br />
2095 -233105.727 285306.524 47.910 56. 62. 102.<br />
2094 -233010.817 286344.573 47.119 69. 82. 97.<br />
2083 -233653.908 286209.900 41.710 44. 64. 100.<br />
2093 -233036.334 286187.146 44.317 62. 66. 93.<br />
2092 -233171.473 286361.887 46.084 54. 81. 92.<br />
2091 -233029.318 285877.418 42.978 57. 50. 92.<br />
2090 -233083.874 285831.732 43.236 52. 47. 91.<br />
2089 -233550.034 286249.782 42.599 37. 47. 58.<br />
2080 -233536.712 285866.289 45.405 31. 34. 53.<br />
2088 -233641.126 286136.469 41.483 33. 41. 57.<br />
2081 -233516.570 285925.938 44.960 32. 35. 53.<br />
572 -233287.552 285255.139 47.621 35. 30. 62.<br />
2085 -233513.990 285375.146 48.400 30. 27. 51.<br />
2086 -233531.890 285334.487 49.454 30. 27. 51.<br />
600 -233992.593 286435.707 44.997 38. 58. 48.<br />
601 -233989.049 286406.416 44.694 37. 56. 48.<br />
576 -234006.225 286427.026 45.494 31. 39. 50.<br />
2073 -233972.020 286429.833 44.576 35. 50. 53.<br />
2071 -234143.695 285786.276 44.125 26. 27. 49.<br />
2070 -234074.782 285809.838 43.528 26. 27. 48.<br />
2076 -233984.964 285375.775 48.420 24. 23. 44.<br />
2075 -234027.544 285304.822 47.198 24. 23. 44.<br />
573 -234000.004 285391.701 47.427 23. 22. 39.<br />
8601 -233989.027 286406.721 44.671 42. 53. 48.<br />
8600 -233992.533 286435.816 44.999 42. 55. 48.<br />
2077 -234000.836 285363.146 47.845 42. 52. 86.<br />
2074 -234179.488 286431.534 43.563 39. 71. 86.<br />
2072 -234202.295 286453.191 44.598 38. 74. 87.<br />
2062 -234579.660 286379.703 45.636 31. 45. 62.<br />
2063 -234639.036 286442.242 47.538 32. 50. 64.<br />
2066 -234463.392 285298.833 63.996 26. 37. 56.<br />
2065 -234554.492 285354.966 57.699 23. 23. 43.<br />
2061 -234561.842 285897.992 43.221 26. 27. 52.<br />
2064 -234615.271 286262.234 45.968 30. 39. 59.<br />
2060 -234489.539 285960.091 43.408 27. 28. 53.<br />
2068 -234538.868 285312.117 61.795 24. 24. 44.<br />
213
Bundle adjustment<br />
2067 -234543.779 285311.591 61.973 24. 24. 44.<br />
501 -234837.120 286363.528 48.120 30. 38. 46.<br />
565 -234819.461 285566.792 46.788 26. 29. 46.<br />
2053 -234869.683 286358.185 48.124 31. 45. 64.<br />
2052 -234879.111 286387.856 48.905 31. 47. 64.<br />
2051 -234891.580 285926.590 43.146 27. 27. 55.<br />
503 -234919.569 286305.927 46.879 28. 35. 59.<br />
2055 -234930.562 285407.204 48.293 26. 36. 57.<br />
2054 -234890.815 285394.385 51.998 26. 36. 57.<br />
972 -233481.254 285000.952 56.838 32. 33. 47.<br />
574 -233483.647 285001.785 56.888 33. 33. 82.<br />
3081 -233254.466 284923.584 59.626 46. 37. 86.<br />
3082 -233233.207 285526.877 47.314 57. 69. 100.<br />
3080 -233312.642 284993.871 56.159 42. 36. 85.<br />
3086 -233469.470 284557.690 77.091 30. 30. 49.<br />
3085 -233371.524 284555.871 80.947 32. 32. 52.<br />
577 -233290.934 284764.615 67.004 33. 31. 58.<br />
3074 -233715.293 285517.308 46.788 33. 42. 67.<br />
3073 -233748.182 285478.710 47.310 32. 39. 66.<br />
3072 -233715.257 285036.496 57.657 27. 27. 51.<br />
3075 -233766.681 284475.596 70.582 25. 24. 38.<br />
526 -233759.808 284437.601 72.046 25. 24. 35.<br />
3076 -233830.308 284469.000 69.532 25. 25. 39.<br />
8973 -234342.154 284470.864 78.345 33. 42. 47.<br />
575 -234337.117 284468.167 78.919 22. 23. 38.<br />
3066 -234215.201 284399.100 69.065 23. 23. 38.<br />
3065 -234252.296 284410.364 69.820 22. 22. 36.<br />
3063 -234310.211 285450.398 47.556 27. 36. 62.<br />
3064 -234220.527 285475.939 43.016 28. 37. 63.<br />
3062 -234249.627 285053.336 60.297 24. 25. 49.<br />
3061 -234272.826 284758.111 71.251 24. 26. 45.<br />
4097 -233425.015 283778.995 100.445 39. 52. 80.<br />
8523 -233102.461 284153.754 83.079 51. 44. 84.<br />
910 -233102.948 284149.274 82.209 46. 44. 48.<br />
4096 -233274.351 284025.828 102.329 41. 42. 78.<br />
4095 -233439.305 283776.735 93.978 38. 53. 81.<br />
4094 -233192.391 284743.310 63.818 49. 67. 94.<br />
4093 -233107.713 284756.561 61.930 56. 71. 97.<br />
4092 -233136.944 284313.405 96.856 47. 44. 81.<br />
4091 -233126.539 284120.250 84.203 49. 44. 83.<br />
4090 -233105.215 284124.870 81.327 51. 44. 84.<br />
527 -233432.576 283770.938 95.378 33. 32. 41.<br />
4083 -233578.605 284782.427 63.033 34. 42. 63.<br />
4082 -233694.969 284158.889 81.294 28. 29. 45.<br />
4086 -233688.651 283833.289 88.322 29. 28. 39.<br />
4085 -233636.732 283753.396 85.862 33. 38. 53.<br />
4081 -233613.523 284274.189 84.347 29. 30. 47.<br />
4084 -233617.417 284724.459 64.158 32. 40. 60.<br />
4080 -233664.343 284252.825 79.977 28. 29. 46.<br />
620 -233340.719 282939.845 75.721 51. 59. 48.<br />
621 -233385.805 282955.554 75.384 48. 57. 48.<br />
622 -233468.889 282986.782 78.317 45. 58. 80.<br />
522 -233378.467 282873.829 81.333 43. 46. 76.<br />
6097 -233452.627 282995.787 77.588 45. 57. 80.<br />
6096 -233290.856 282921.004 73.450 59. 67. 86.<br />
6095 -233318.814 283017.947 80.256 53. 58. 82.<br />
6093 -233420.858 283812.956 94.726 43. 54. 81.<br />
6091 -233410.776 283325.867 82.118 42. 43. 75.<br />
6090 -233307.630 283276.992 88.120 49. 46. 77.<br />
6087 -233777.158 283007.299 87.659 37. 44. 60.<br />
6085 -233861.687 283065.907 83.381 35. 41. 60.<br />
6083 -233793.794 283863.146 81.151 31. 39. 56.<br />
6082 -233869.470 283367.810 97.386 30. 32. 49.<br />
6081 -233763.278 283413.998 88.980 31. 33. 48.<br />
6084 -233837.359 283893.633 80.934 31. 40. 57.<br />
6080 -233828.214 283309.083 90.606 31. 33. 50.<br />
911 -234073.623 283756.103 91.001 31. 41. 46.<br />
4077 -234129.049 283772.664 94.162 27. 34. 48.<br />
4076 -234121.379 283683.524 87.250 25. 26. 40.
E.6 Aerotriangulation for images in scale 1:5,000<br />
4075 -234049.027 283870.585 87.145 24. 25. 38.<br />
4074 -233993.752 284653.035 62.881 28. 35. 56.<br />
4073 -234022.130 284798.518 63.248 29. 42. 61.<br />
4072 -234105.001 284182.420 73.421 25. 25. 45.<br />
4071 -234012.683 284147.764 73.700 26. 26. 45.<br />
4070 -234076.862 284269.229 68.328 25. 26. 46.<br />
960 -234033.786 283131.455 98.275 34. 38. 45.<br />
560 -234030.714 283131.978 98.544 34. 42. 73.<br />
8911 -234073.484 283756.013 91.032 29. 38. 45.<br />
6086 -233832.182 282827.482 84.194 46. 72. 91.<br />
6077 -234333.755 282931.182 88.808 32. 43. 59.<br />
6076 -234352.849 282884.688 87.491 33. 46. 61.<br />
6075 -234267.942 282940.984 92.990 33. 43. 58.<br />
6072 -234309.555 283644.375 102.779 26. 29. 50.<br />
6074 -234337.164 283683.121 103.551 26. 30. 51.<br />
6073 -234313.874 283734.209 103.000 27. 31. 53.<br />
6070 -234307.990 283388.509 96.726 27. 29. 49.<br />
973 -234342.630 284470.555 78.289 29. 43. 46.<br />
3056 -234778.631 284498.385 86.870 24. 36. 50.<br />
3055 -234685.251 284416.106 87.120 21. 21. 36.<br />
3054 -234683.067 285379.543 57.667 27. 33. 60.<br />
3052 -234639.367 285011.644 78.667 25. 24. 50.<br />
3051 -234650.367 285005.857 77.294 25. 24. 50.<br />
3050 -234665.605 284942.704 76.387 24. 24. 49.<br />
7911 -234073.651 283756.167 91.014 40. 51. 79.<br />
7973 -234342.330 284470.384 78.283 28. 32. 46.<br />
4066 -234503.087 283791.482 91.692 23. 24. 40.<br />
4065 -234549.433 283754.792 91.662 23. 24. 40.<br />
4064 -234532.480 284759.244 81.746 27. 39. 58.<br />
4063 -234476.318 284789.939 76.735 28. 41. 60.<br />
4062 -234472.076 284380.280 72.486 25. 26. 49.<br />
4061 -234484.454 284217.159 77.012 25. 24. 47.<br />
4060 -234550.854 284250.780 76.972 24. 24. 46.<br />
912 -234438.496 282869.983 84.017 36. 52. 48.<br />
528 -234438.501 282868.186 84.240 32. 43. 71.<br />
6067 -234762.381 282927.093 87.971 30. 46. 61.<br />
6066 -234701.009 282921.748 86.223 31. 46. 61.<br />
6065 -234743.770 282866.974 83.506 31. 50. 64.<br />
6062 -234693.435 283649.505 104.252 26. 29. 52.<br />
6060 -234682.797 283350.225 86.536 26. 28. 51.<br />
961 -234971.648 283748.946 98.080 28. 41. 46.<br />
561 -234969.605 283742.595 97.901 21. 22. 39.<br />
4056 -235023.494 283701.107 94.413 22. 23. 40.<br />
4055 -234985.444 283748.332 96.538 21. 23. 39.<br />
4054 -234996.648 284743.061 68.954 26. 38. 59.<br />
4053 -234925.965 284799.412 71.116 28. 41. 61.<br />
4052 -235070.589 284335.680 80.740 24. 24. 47.<br />
4050 -234956.966 284363.274 79.182 24. 25. 48.<br />
4051 -234978.093 284330.287 78.612 24. 24. 47.<br />
8962 -235254.609 284509.551 86.631 33. 43. 47.<br />
7964 -235108.434 285317.508 57.550 32. 42. 86.<br />
3046 -235300.483 284492.711 81.698 23. 23. 38.<br />
3045 -235254.349 284502.744 86.892 21. 22. 35.<br />
3044 -235236.745 285302.409 52.684 26. 31. 55.<br />
3043 -235152.489 285480.178 48.676 27. 39. 61.<br />
3042 -235126.624 285550.632 46.397 28. 43. 63.<br />
3041 -235102.196 284895.010 72.675 24. 25. 47.<br />
3040 -235150.987 284993.936 64.818 24. 24. 48.<br />
7961 -234971.030 283749.814 98.283 27. 41. 73.<br />
557 -235075.449 283267.723 89.012 28. 28. 45.<br />
5054 -235145.046 283657.587 88.181 31. 35. 76.<br />
6063 -234840.701 283709.278 98.863 30. 38. 74.<br />
6064 -234852.122 283901.309 90.756 30. 53. 80.<br />
5056 -235221.454 283078.824 85.528 30. 35. 58.<br />
5051 -235197.131 283547.130 95.231 26. 27. 53.<br />
5050 -235261.534 283417.466 91.161 26. 26. 53.<br />
3053 -235595.390 284541.686 72.086 39. 40. 86.<br />
8961 -234971.647 283748.790 97.977 33. 42. 46.<br />
7962 -235253.287 284507.975 86.671 27. 31. 45.<br />
215
Bundle adjustment<br />
4045 -235522.737 283826.836 97.323 22. 23. 41.<br />
4042 -235452.219 284220.527 83.882 24. 24. 47.<br />
4044 -235403.326 284720.026 73.285 26. 36. 55.<br />
4043 -235460.155 284764.605 70.461 26. 38. 56.<br />
4041 -235441.877 284269.948 90.581 24. 24. 46.<br />
4040 -235430.076 284245.297 88.000 24. 24. 47.<br />
4046 -235552.275 283900.335 93.229 29. 53. 81.<br />
5055 -235349.472 282935.084 80.747 35. 60. 86.<br />
556 -235357.638 282910.106 80.788 31. 39. 47.<br />
5053 -235297.236 283852.356 96.074 30. 49. 82.<br />
5046 -235773.738 282895.939 78.297 33. 48. 73.<br />
5045 -235665.741 282880.927 82.650 32. 48. 72.<br />
5044 -235741.584 283913.846 93.259 26. 37. 61.<br />
5043 -235662.255 283843.284 96.286 25. 34. 59.<br />
5042 -235670.852 283293.861 77.370 27. 29. 58.<br />
5041 -235751.785 283485.499 80.694 26. 27. 56.<br />
5040 -235644.385 283370.521 82.523 26. 28. 56.<br />
964 -235110.072 285316.600 57.468 30. 45. 48.<br />
2056 -234979.930 285300.536 55.485 37. 63. 88.<br />
2045 -235408.701 285353.408 48.547 26. 37. 55.<br />
2043 -235398.393 286363.041 71.212 32. 45. 63.<br />
2041 -235365.578 285790.090 42.846 27. 26. 53.<br />
2040 -235356.231 285939.708 44.317 28. 27. 55.<br />
2046 -235529.509 285352.109 47.112 22. 22. 38.<br />
8964 -235108.294 285317.414 57.453 35. 34. 47.<br />
962 -235254.598 284509.749 86.660 29. 44. 46.<br />
3036 -235700.099 284477.741 76.897 25. 39. 52.<br />
3034 -235565.236 285521.387 44.228 27. 37. 56.<br />
3033 -235654.683 285534.571 43.776 27. 38. 57.<br />
3032 -235621.782 285059.111 58.187 24. 24. 47.<br />
3031 -235615.084 285057.039 57.688 24. 24. 47.<br />
3030 -235599.840 284918.757 64.654 24. 24. 46.<br />
3035 -235595.473 284541.719 71.954 21. 22. 36.<br />
963 -235775.678 284266.188 72.075 26. 27. 45.<br />
7908 -235981.352 284741.983 52.847 32. 42. 47.<br />
519 -235980.163 284741.915 54.107 21. 23. 40.<br />
4036 -235887.238 283775.554 82.136 26. 36. 56.<br />
4035 -236006.258 283926.624 68.174 22. 23. 43.<br />
4037 -235942.955 283951.720 77.058 22. 23. 42.<br />
4034 -235831.912 284833.759 63.778 26. 40. 54.<br />
4031 -235883.669 284310.741 68.265 24. 24. 46.<br />
4033 -235873.172 284737.925 63.560 25. 35. 51.<br />
4032 -235873.247 284282.756 67.308 24. 24. 46.<br />
4030 -235927.472 284329.735 65.005 24. 24. 46.<br />
555 -236203.228 282961.065 53.121 31. 38. 75.<br />
5036 -236043.164 282955.135 67.865 33. 46. 78.<br />
5035 -236125.730 282933.174 55.913 33. 47. 79.<br />
5033 -236092.877 283946.676 60.899 27. 37. 63.<br />
5031 -236067.761 283349.768 65.078 28. 29. 61.<br />
5030 -236078.472 283422.526 57.725 27. 28. 60.<br />
8903 -235997.764 286008.978 55.216 35. 32. 46.<br />
2044 -235426.619 286367.785 71.245 45. 64. 91.<br />
505 -235942.096 286255.562 65.309 28. 31. 39.<br />
2039 -235852.280 285435.350 43.848 23. 22. 37.<br />
2038 -235830.905 285393.948 43.682 23. 22. 38.<br />
2037 -235977.195 286433.826 89.909 32. 47. 54.<br />
2036 -235834.700 286423.069 82.396 33. 47. 55.<br />
564 -236016.279 285474.800 44.591 22. 22. 33.<br />
2034 -235930.074 285845.075 47.279 26. 26. 47.<br />
2033 -235797.045 285942.468 44.591 28. 27. 48.<br />
908 -235981.383 284741.966 52.951 28. 33. 46.<br />
3025 -236107.173 284533.597 58.861 21. 22. 37.<br />
3026 -236142.566 284575.023 47.140 21. 22. 37.<br />
3024 -235988.852 285432.833 43.948 26. 33. 57.<br />
3023 -236058.266 285447.788 43.877 26. 34. 56.<br />
3022 -236028.423 285097.610 44.266 24. 24. 50.<br />
3021 -236131.132 285009.283 43.714 24. 24. 49.<br />
3020 -236110.590 284881.961 44.153 24. 25. 48.<br />
903 -235997.773 286009.151 55.278 32. 31. 46.
E.6 Aerotriangulation for images in scale 1:5,000<br />
2031 -236360.262 285386.437 44.170 26. 40. 59.<br />
2025 -236279.590 285343.615 44.061 27. 42. 61.<br />
2030 -236320.466 286368.840 80.701 32. 45. 59.<br />
2024 -236342.183 286386.796 82.016 32. 46. 59.<br />
2028 -236275.052 285935.736 50.875 28. 28. 53.<br />
2022 -236332.834 285935.828 50.401 27. 28. 52.<br />
5034 -236268.284 283988.613 47.090 31. 60. 92.<br />
954 -236366.495 283292.343 61.084 32. 36. 83.<br />
5032 -236243.173 283892.802 50.016 31. 52. 88.<br />
5026 -236521.411 283130.113 67.604 34. 39. 66.<br />
5025 -236565.144 283097.488 69.763 34. 41. 66.<br />
5022 -236643.820 283351.571 71.763 31. 33. 60.<br />
5021 -236665.698 283466.543 71.973 30. 31. 59.<br />
5020 -236526.393 283462.116 61.387 30. 30. 59.<br />
4025 -236341.525 283719.441 51.259 24. 25. 45.<br />
521 -236301.284 283764.202 46.654 23. 24. 40.<br />
909 -236320.798 284513.924 48.853 28. 44. 47.<br />
520 -236312.473 284591.484 48.182 25. 38. 68.<br />
3016 -236582.876 284624.469 70.494 22. 23. 36.<br />
3015 -236523.930 284488.517 69.337 22. 22. 35.<br />
3014 -236593.372 285553.828 44.318 27. 39. 59.<br />
3013 -236515.476 285557.035 44.140 27. 39. 60.<br />
3012 -236502.351 284986.513 45.799 24. 25. 49.<br />
3011 -236542.681 285030.346 45.017 24. 25. 49.<br />
3010 -236567.665 285010.562 44.287 24. 25. 49.<br />
7909 -236320.979 284513.824 48.910 29. 31. 46.<br />
8908 -235981.253 284742.154 52.831 31. 41. 47.<br />
4026 -236512.324 283768.234 68.809 25. 26. 45.<br />
4024 -236378.177 284851.855 49.008 27. 40. 58.<br />
4023 -236288.155 284817.639 44.039 27. 39. 57.<br />
4022 -236324.359 284192.729 50.436 25. 25. 47.<br />
4021 -236343.025 284388.453 48.332 25. 25. 47.<br />
4020 -236347.324 284304.687 47.938 25. 25. 46.<br />
8982 -236987.046 283991.963 82.303 43. 42. 83.<br />
8909 -236320.837 284513.753 48.821 35. 31. 47.<br />
4016 -236782.220 283792.989 80.491 29. 39. 57.<br />
4015 -236937.588 283759.791 78.978 29. 29. 46.<br />
4011 -236918.305 284127.431 84.557 27. 29. 48.<br />
4014 -236784.222 284737.342 62.637 29. 36. 57.<br />
4012 -236775.812 284416.678 82.643 26. 27. 47.<br />
4013 -236759.060 284832.629 56.117 30. 41. 62.<br />
5016 -237087.012 282999.161 61.091 39. 54. 59.<br />
5015 -237125.676 282988.274 60.259 40. 56. 60.<br />
5012 -236987.307 283322.685 84.192 33. 38. 51.<br />
5011 -236981.154 283529.039 80.378 32. 34. 53.<br />
985 -237024.678 282907.587 68.142 40. 58. 48.<br />
585 -237021.134 282909.262 68.805 40. 60. 61.<br />
5010 -236986.564 283311.356 84.081 33. 38. 51.<br />
582 -237554.347 283757.393 56.158 48. 52. 49.<br />
984 -237534.169 282997.628 71.038 54. 66. 50.<br />
584 -237547.518 283007.617 70.654 45. 48. 84.<br />
5002 -237612.423 283849.168 64.530 60. 60. 94.<br />
5004 -237628.237 283757.756 55.783 59. 56. 93.<br />
5001 -237529.038 283603.554 62.899 49. 49. 85.<br />
5006 -237519.390 282971.541 72.458 55. 73. 90.<br />
5005 -237613.867 282896.359 75.074 65. 82. 97.<br />
5003 -237527.026 283967.521 64.230 55. 67. 95.<br />
5000 -237568.469 283353.984 61.070 52. 53. 86.<br />
4006 -237304.426 283882.138 73.927 36. 35. 56.<br />
4005 -237464.049 283966.963 68.466 44. 39. 63.<br />
982 -236986.745 283991.389 82.298 33. 38. 46.<br />
8907 -237338.862 284514.415 83.524 37. 39. 47.<br />
4004 -237282.199 284841.943 75.152 41. 63. 87.<br />
4003 -237374.464 284813.250 81.141 47. 62. 87.<br />
4001 -237429.879 284126.548 75.859 47. 43. 84.<br />
4000 -237403.702 284472.467 87.542 44. 41. 80.<br />
3006 -237036.699 284529.596 84.928 26. 26. 37.<br />
517 -237041.524 284571.290 83.720 25. 25. 33.<br />
516 -237339.559 284515.894 83.534 31. 30. 47.<br />
217
Bundle adjustment<br />
3007 -237016.604 284635.557 74.741 25. 25. 36.<br />
3005 -237380.495 284563.967 88.774 34. 36. 54.<br />
632 -237358.996 285540.407 64.087 33. 32. 32.<br />
631 -237349.471 285366.589 67.869 32. 31. 31.<br />
8630 -237350.419 285365.281 67.875 35. 38. 45.<br />
3009 -236958.300 285572.048 44.093 41. 58. 86.<br />
3004 -237522.931 285505.019 84.251 48. 55. 78.<br />
907 -237338.731 284514.254 83.463 36. 52. 47.<br />
8906 -237046.158 285396.886 48.065 28. 30. 36.<br />
518 -237363.396 285423.054 68.141 31. 30. 31.<br />
2010 -237322.836 285381.904 68.691 34. 43. 74.<br />
3003 -236930.384 285017.786 54.404 26. 26. 44.<br />
3001 -237495.644 285042.254 82.485 40. 40. 75.<br />
3008 -237348.126 284529.707 82.712 37. 63. 81.<br />
2004 -237347.170 285370.582 67.754 34. 32. 38.<br />
3002 -237014.405 285047.277 56.464 26. 27. 43.<br />
3000 -237524.125 285069.908 85.471 42. 40. 75.<br />
2011 -236936.669 285341.916 46.627 24. 24. 32.<br />
2005 -236782.938 285501.515 44.251 24. 24. 34.<br />
513 -236876.458 285595.415 44.577 24. 24. 30.<br />
630 -237350.457 285365.379 67.930 39. 48. 46.<br />
906 -237046.166 285396.913 48.032 31. 43. 46.<br />
2003 -236801.100 286463.105 56.698 47. 72. 92.<br />
2008 -237399.757 286404.094 44.546 54. 68. 94.<br />
2002 -237394.584 286475.477 45.235 56. 75. 97.<br />
2006 -237336.096 285923.015 47.638 42. 38. 80.<br />
511 -237353.676 286355.987 44.815 38. 41. 47.<br />
2000 -237310.868 285905.567 47.875 40. 37. 80.<br />
510 -236801.153 286462.969 56.877 32. 37. 43.<br />
2007 -236893.754 285940.661 45.875 28. 29. 47.<br />
2001 -236850.632 285904.200 45.191 28. 28. 46.<br />
2009 -236786.499 286450.696 57.168 34. 48. 58.<br />
Mean squared precision <strong>of</strong> object points: 34. 40. 60.<br />
Mean squared precision <strong>of</strong> control points: 31. 34. 45.
E.6 Aerotriangulation for images in scale 1:5,000<br />
E.6.1 The ’Itera.dat’ file from the aerotriangulation for<br />
the images in scale 1:5,000<br />
ORIA 116 -237319.673 285893.592 849.076 -0.8618 0.1705 2.4667 1<br />
ORIA 117 -236859.041 285881.673 849.567 -0.8425 0.9451 1.1708 1<br />
ORIA 118 -236398.040 285873.118 846.771 -0.5826 0.5119 1.2708 1<br />
ORIA 119 -235938.893 285864.748 843.860 -1.0137 1.5901 1.3236 1<br />
ORIA 120 -235478.377 285846.227 844.075 -0.7417 1.9825 1.1766 1<br />
ORIA 121 -235016.779 285832.133 844.607 -0.3232 1.5418 1.3886 1<br />
ORIA 122 -234557.542 285826.807 840.822 -0.6096 1.5624 1.5186 1<br />
ORIA 123 -234096.980 285811.615 842.376 -0.7450 3.1955 0.9883 1<br />
ORIA 124 -233637.218 285778.321 846.394 -0.9264 3.3689 0.3643 1<br />
ORIA 125 -233179.216 285745.958 852.126 -0.5397 2.9245 0.4688 1<br />
ORIA 128 -233346.155 284966.369 846.695 0.4905 -0.8700 -2.8712 1<br />
ORIA 129 -233807.007 284978.145 846.696 0.1334 -0.6853 -2.6454 1<br />
ORIA 130 -234267.289 284987.450 848.212 0.6982 -1.2703 -1.8252 1<br />
ORIA 131 -234726.972 285005.292 847.792 1.0107 -2.1772 -1.8911 1<br />
ORIA 132 -235185.959 285024.143 846.497 0.7617 -1.9123 -1.8986 1<br />
ORIA 133 -235646.174 285033.569 844.193 0.4681 -1.6560 -1.6280 1<br />
ORIA 134 -236106.032 285039.190 842.027 0.5885 -2.0339 -1.5793 1<br />
ORIA 135 -236563.528 285055.529 840.315 0.8977 -3.0431 -1.9596 1<br />
ORIA 136 -237023.137 285076.503 840.804 0.8952 -2.7507 -2.0233 1<br />
ORIA 137 -237482.584 285093.060 841.018 0.9637 -2.4814 -2.0346 1<br />
ORIA 138 -237353.784 284305.809 857.948 -0.0370 -0.1739 -0.2144 1<br />
ORIA 139 -236892.603 284296.914 855.320 -0.2433 1.2525 -0.4415 1<br />
ORIA 140 -236433.678 284278.458 855.376 -0.5436 1.6036 -0.5884 1<br />
ORIA 141 -235975.280 284263.367 852.039 -0.2524 1.1511 -0.6252 1<br />
ORIA 142 -235515.687 284251.581 850.102 -0.2895 0.8219 -0.5635 1<br />
ORIA 143 -235055.798 284234.716 850.143 -0.4898 1.6250 -0.7681 1<br />
ORIA 144 -234597.462 284214.869 847.518 -0.7318 1.1641 -0.8227 1<br />
ORIA 145 -234137.416 284200.401 849.873 -0.6427 0.9059 -0.9229 1<br />
ORIA 146 -233674.833 284192.486 848.576 -0.1593 1.4757 -0.7465 1<br />
ORIA 147 -233215.748 284179.148 848.918 -0.6165 1.7285 -0.7529 1<br />
ORIA 150 -233375.137 283383.390 835.308 0.4113 -0.3104 -2.1485 1<br />
ORIA 151 -233835.694 283387.231 831.605 0.2399 -0.8748 -1.8160 1<br />
ORIA 152 -234296.811 283392.882 831.894 0.4037 -1.6701 -1.5609 1<br />
ORIA 153 -234756.815 283407.806 830.036 0.9576 -2.2953 -1.5895 1<br />
ORIA 154 -235215.156 283423.867 830.885 1.0449 -1.9683 -1.4650 1<br />
ORIA 155 -235675.349 283433.840 834.141 1.3325 -1.6600 -1.4489 1<br />
ORIA 156 -236135.452 283448.501 834.874 1.1969 -2.4428 -1.7624 1<br />
ORIA 157 -236596.001 283468.255 835.142 0.7732 -2.3852 -1.8457 1<br />
ORIA 158 -237054.566 283479.872 839.904 1.1973 -1.9727 -1.6910 1<br />
ORIA 159 -237516.804 283487.318 841.266 0.8795 -1.6951 -1.2705 1<br />
CORD 501 -234837.120 286363.528 48.120 0.030 0.038 0.046<br />
CORD 503 -234919.569 286305.927 46.879 0.028 0.035 0.059<br />
CORD 505 -235942.096 286255.562 65.309 0.028 0.031 0.039<br />
CORD 510 -236801.153 286462.969 56.877 0.032 0.037 0.043<br />
CORD 511 -237353.676 286355.987 44.815 0.038 0.041 0.047<br />
CORD 513 -236876.458 285595.415 44.577 0.024 0.024 0.030<br />
CORD 516 -237339.559 284515.894 83.534 0.031 0.030 0.047<br />
CORD 517 -237041.524 284571.290 83.720 0.025 0.025 0.033<br />
CORD 518 -237363.396 285423.054 68.141 0.031 0.030 0.031<br />
CORD 519 -235980.163 284741.915 54.107 0.021 0.023 0.040<br />
CORD 520 -236312.473 284591.484 48.182 0.025 0.038 0.068<br />
219
Bundle adjustment<br />
CORD 521 -236301.284 283764.202 46.654 0.023 0.024 0.040<br />
CORD 522 -233378.467 282873.829 81.333 0.043 0.046 0.076<br />
CORD 526 -233759.808 284437.601 72.046 0.025 0.024 0.035<br />
CORD 527 -233432.576 283770.938 95.378 0.033 0.032 0.041<br />
CORD 528 -234438.501 282868.186 84.240 0.032 0.043 0.071<br />
CORD 555 -236203.228 282961.065 53.121 0.031 0.038 0.075<br />
CORD 556 -235357.638 282910.106 80.788 0.031 0.039 0.047<br />
CORD 557 -235075.449 283267.723 89.012 0.028 0.028 0.045<br />
CORD 560 -234030.714 283131.978 98.544 0.034 0.042 0.073<br />
CORD 561 -234969.605 283742.595 97.901 0.021 0.022 0.039<br />
CORD 564 -236016.279 285474.800 44.591 0.022 0.022 0.033<br />
CORD 565 -234819.461 285566.792 46.788 0.026 0.029 0.046<br />
CORD 570 -233159.003 286350.914 46.021 0.043 0.048 0.079<br />
CORD 571 -233329.343 285836.161 44.708 0.036 0.041 0.084<br />
CORD 572 -233287.552 285255.139 47.621 0.035 0.030 0.062<br />
CORD 573 -234000.004 285391.701 47.427 0.023 0.022 0.039<br />
CORD 574 -233483.647 285001.785 56.888 0.033 0.033 0.082<br />
CORD 575 -234337.117 284468.167 78.919 0.022 0.023 0.038<br />
CORD 576 -234006.225 286427.026 45.494 0.031 0.039 0.050<br />
CORD 577 -233290.934 284764.615 67.004 0.033 0.031 0.058<br />
CORD 582 -237554.347 283757.393 56.158 0.048 0.052 0.049<br />
CORD 584 -237547.518 283007.617 70.654 0.045 0.048 0.084<br />
CORD 585 -237021.134 282909.262 68.805 0.040 0.060 0.061<br />
CORD 600 -233992.593 286435.707 44.997 0.038 0.058 0.048<br />
CORD 601 -233989.049 286406.416 44.694 0.037 0.056 0.048<br />
CORD 610 -233159.069 286346.880 46.200 0.052 0.068 0.049<br />
CORD 611 -233148.535 286345.001 46.165 0.052 0.068 0.049<br />
CORD 620 -233340.719 282939.845 75.721 0.051 0.059 0.048<br />
CORD 621 -233385.805 282955.554 75.384 0.048 0.057 0.048<br />
CORD 622 -233468.889 282986.782 78.317 0.045 0.058 0.080<br />
CORD 630 -237350.457 285365.379 67.930 0.039 0.048 0.046<br />
CORD 631 -237349.471 285366.589 67.869 0.032 0.031 0.031<br />
CORD 632 -237358.996 285540.407 64.087 0.033 0.032 0.032<br />
CORD 903 -235997.773 286009.151 55.278 0.032 0.031 0.046<br />
CORD 906 -237046.166 285396.913 48.032 0.031 0.043 0.046<br />
CORD 907 -237338.731 284514.254 83.463 0.036 0.052 0.047<br />
CORD 908 -235981.383 284741.966 52.951 0.028 0.033 0.046<br />
CORD 909 -236320.798 284513.924 48.853 0.028 0.044 0.047<br />
CORD 910 -233102.948 284149.274 82.209 0.046 0.044 0.048<br />
CORD 911 -234073.623 283756.103 91.001 0.031 0.041 0.046<br />
CORD 912 -234438.496 282869.983 84.017 0.036 0.052 0.048<br />
CORD 954 -236366.495 283292.343 61.084 0.032 0.036 0.083<br />
CORD 960 -234033.786 283131.455 98.275 0.034 0.038 0.045<br />
CORD 961 -234971.648 283748.946 98.080 0.028 0.041 0.046<br />
CORD 962 -235254.598 284509.749 86.660 0.029 0.044 0.046<br />
CORD 963 -235775.678 284266.188 72.075 0.026 0.027 0.045<br />
CORD 964 -235110.072 285316.600 57.468 0.030 0.045 0.048<br />
CORD 971 -233332.349 285838.927 44.555 0.036 0.041 0.047<br />
CORD 972 -233481.254 285000.952 56.838 0.032 0.033 0.047<br />
CORD 973 -234342.630 284470.555 78.289 0.029 0.043 0.046<br />
CORD 982 -236986.745 283991.389 82.298 0.033 0.038 0.046<br />
CORD 984 -237534.169 282997.628 71.038 0.054 0.066 0.050<br />
CORD 985 -237024.678 282907.587 68.142 0.040 0.058 0.048<br />
CORD 2000 -237310.868 285905.567 47.875 0.040 0.037 0.080<br />
CORD 2001 -236850.632 285904.200 45.191 0.028 0.028 0.046<br />
CORD 2002 -237394.584 286475.477 45.235 0.056 0.075 0.097<br />
CORD 2003 -236801.100 286463.105 56.698 0.047 0.072 0.092
E.6 Aerotriangulation for images in scale 1:5,000<br />
CORD 2004 -237347.170 285370.582 67.754 0.034 0.032 0.038<br />
CORD 2005 -236782.938 285501.515 44.251 0.024 0.024 0.034<br />
CORD 2006 -237336.096 285923.015 47.638 0.042 0.038 0.080<br />
CORD 2007 -236893.754 285940.661 45.875 0.028 0.029 0.047<br />
CORD 2008 -237399.757 286404.094 44.546 0.054 0.068 0.094<br />
CORD 2009 -236786.499 286450.696 57.168 0.034 0.048 0.058<br />
CORD 2010 -237322.836 285381.904 68.691 0.034 0.043 0.074<br />
CORD 2011 -236936.669 285341.916 46.627 0.024 0.024 0.032<br />
CORD 2022 -236332.834 285935.828 50.401 0.027 0.028 0.052<br />
CORD 2024 -236342.183 286386.796 82.016 0.032 0.046 0.059<br />
CORD 2025 -236279.590 285343.615 44.061 0.027 0.042 0.061<br />
CORD 2028 -236275.052 285935.736 50.875 0.028 0.028 0.053<br />
CORD 2030 -236320.466 286368.840 80.701 0.032 0.045 0.059<br />
CORD 2031 -236360.262 285386.437 44.170 0.026 0.040 0.059<br />
CORD 2033 -235797.045 285942.468 44.591 0.028 0.027 0.048<br />
CORD 2034 -235930.074 285845.075 47.279 0.026 0.026 0.047<br />
CORD 2036 -235834.700 286423.069 82.396 0.033 0.047 0.055<br />
CORD 2037 -235977.195 286433.826 89.909 0.032 0.047 0.054<br />
CORD 2038 -235830.905 285393.948 43.682 0.023 0.022 0.038<br />
CORD 2039 -235852.280 285435.350 43.848 0.023 0.022 0.037<br />
CORD 2040 -235356.231 285939.708 44.317 0.028 0.027 0.055<br />
CORD 2041 -235365.578 285790.090 42.846 0.027 0.026 0.053<br />
CORD 2043 -235398.393 286363.041 71.212 0.032 0.045 0.063<br />
CORD 2044 -235426.619 286367.785 71.245 0.045 0.064 0.091<br />
CORD 2045 -235408.701 285353.408 48.547 0.026 0.037 0.055<br />
CORD 2046 -235529.509 285352.109 47.112 0.022 0.022 0.038<br />
CORD 2051 -234891.580 285926.590 43.146 0.027 0.027 0.055<br />
CORD 2052 -234879.111 286387.856 48.905 0.031 0.047 0.064<br />
CORD 2053 -234869.683 286358.185 48.124 0.031 0.045 0.064<br />
CORD 2054 -234890.815 285394.385 51.998 0.026 0.036 0.057<br />
CORD 2055 -234930.562 285407.204 48.293 0.026 0.036 0.057<br />
CORD 2056 -234979.930 285300.536 55.485 0.037 0.063 0.088<br />
CORD 2060 -234489.539 285960.091 43.408 0.027 0.028 0.053<br />
CORD 2061 -234561.842 285897.992 43.221 0.026 0.027 0.052<br />
CORD 2062 -234579.660 286379.703 45.636 0.031 0.045 0.062<br />
CORD 2063 -234639.036 286442.242 47.538 0.032 0.050 0.064<br />
CORD 2064 -234615.271 286262.234 45.968 0.030 0.039 0.059<br />
CORD 2065 -234554.492 285354.966 57.699 0.023 0.023 0.043<br />
CORD 2066 -234463.392 285298.833 63.996 0.026 0.037 0.056<br />
CORD 2067 -234543.779 285311.591 61.973 0.024 0.024 0.044<br />
CORD 2068 -234538.868 285312.117 61.795 0.024 0.024 0.044<br />
CORD 2070 -234074.782 285809.838 43.528 0.026 0.027 0.048<br />
CORD 2071 -234143.695 285786.276 44.125 0.026 0.027 0.049<br />
CORD 2072 -234202.295 286453.191 44.598 0.038 0.074 0.087<br />
CORD 2073 -233972.020 286429.833 44.576 0.035 0.050 0.053<br />
CORD 2074 -234179.488 286431.534 43.563 0.039 0.071 0.086<br />
CORD 2075 -234027.544 285304.822 47.198 0.024 0.023 0.044<br />
CORD 2076 -233984.964 285375.775 48.420 0.024 0.023 0.044<br />
CORD 2077 -234000.836 285363.146 47.845 0.042 0.052 0.086<br />
CORD 2080 -233536.712 285866.289 45.405 0.031 0.034 0.053<br />
CORD 2081 -233516.570 285925.938 44.960 0.032 0.035 0.053<br />
CORD 2083 -233653.908 286209.900 41.710 0.044 0.064 0.100<br />
CORD 2085 -233513.990 285375.146 48.400 0.030 0.027 0.051<br />
CORD 2086 -233531.890 285334.487 49.454 0.030 0.027 0.051<br />
CORD 2087 -233509.667 285338.157 49.670 0.036 0.053 0.091<br />
CORD 2088 -233641.126 286136.469 41.483 0.033 0.041 0.057<br />
CORD 2089 -233550.034 286249.782 42.599 0.037 0.047 0.058<br />
221
Bundle adjustment<br />
CORD 2090 -233083.874 285831.732 43.236 0.052 0.047 0.091<br />
CORD 2091 -233029.318 285877.418 42.978 0.057 0.050 0.092<br />
CORD 2092 -233171.473 286361.887 46.084 0.054 0.081 0.092<br />
CORD 2093 -233036.334 286187.146 44.317 0.062 0.066 0.093<br />
CORD 2094 -233010.817 286344.573 47.119 0.069 0.082 0.097<br />
CORD 2095 -233105.727 285306.524 47.910 0.056 0.062 0.102<br />
CORD 2096 -233081.082 285397.772 46.391 0.056 0.056 0.100<br />
CORD 3000 -237524.125 285069.908 85.471 0.042 0.040 0.075<br />
CORD 3001 -237495.644 285042.254 82.485 0.040 0.040 0.075<br />
CORD 3002 -237014.405 285047.277 56.464 0.026 0.027 0.043<br />
CORD 3003 -236930.384 285017.786 54.404 0.026 0.026 0.044<br />
CORD 3004 -237522.931 285505.019 84.251 0.048 0.055 0.078<br />
CORD 3005 -237380.495 284563.967 88.774 0.034 0.036 0.054<br />
CORD 3006 -237036.699 284529.596 84.928 0.026 0.026 0.037<br />
CORD 3007 -237016.604 284635.557 74.741 0.025 0.025 0.036<br />
CORD 3008 -237348.126 284529.707 82.712 0.037 0.063 0.081<br />
CORD 3009 -236958.300 285572.048 44.093 0.041 0.058 0.086<br />
CORD 3010 -236567.665 285010.562 44.287 0.024 0.025 0.049<br />
CORD 3011 -236542.681 285030.346 45.017 0.024 0.025 0.049<br />
CORD 3012 -236502.351 284986.513 45.799 0.024 0.025 0.049<br />
CORD 3013 -236515.476 285557.035 44.140 0.027 0.039 0.060<br />
CORD 3014 -236593.372 285553.828 44.318 0.027 0.039 0.059<br />
CORD 3015 -236523.930 284488.517 69.337 0.022 0.022 0.035<br />
CORD 3016 -236582.876 284624.469 70.494 0.022 0.023 0.036<br />
CORD 3020 -236110.590 284881.961 44.153 0.024 0.025 0.048<br />
CORD 3021 -236131.132 285009.283 43.714 0.024 0.024 0.049<br />
CORD 3022 -236028.423 285097.610 44.266 0.024 0.024 0.050<br />
CORD 3023 -236058.266 285447.788 43.877 0.026 0.034 0.056<br />
CORD 3024 -235988.852 285432.833 43.948 0.026 0.033 0.057<br />
CORD 3025 -236107.173 284533.597 58.861 0.021 0.022 0.037<br />
CORD 3026 -236142.566 284575.023 47.140 0.021 0.022 0.037<br />
CORD 3030 -235599.840 284918.757 64.654 0.024 0.024 0.046<br />
CORD 3031 -235615.084 285057.039 57.688 0.024 0.024 0.047<br />
CORD 3032 -235621.782 285059.111 58.187 0.024 0.024 0.047<br />
CORD 3033 -235654.683 285534.571 43.776 0.027 0.038 0.057<br />
CORD 3034 -235565.236 285521.387 44.228 0.027 0.037 0.056<br />
CORD 3035 -235595.473 284541.719 71.954 0.021 0.022 0.036<br />
CORD 3036 -235700.099 284477.741 76.897 0.025 0.039 0.052<br />
CORD 3040 -235150.987 284993.936 64.818 0.024 0.024 0.048<br />
CORD 3041 -235102.196 284895.010 72.675 0.024 0.025 0.047<br />
CORD 3042 -235126.624 285550.632 46.397 0.028 0.043 0.063<br />
CORD 3043 -235152.489 285480.178 48.676 0.027 0.039 0.061<br />
CORD 3044 -235236.745 285302.409 52.684 0.026 0.031 0.055<br />
CORD 3045 -235254.349 284502.744 86.892 0.021 0.022 0.035<br />
CORD 3046 -235300.483 284492.711 81.698 0.023 0.023 0.038<br />
CORD 3050 -234665.605 284942.704 76.387 0.024 0.024 0.049<br />
CORD 3051 -234650.367 285005.857 77.294 0.025 0.024 0.050<br />
CORD 3052 -234639.367 285011.644 78.667 0.025 0.024 0.050<br />
CORD 3053 -235595.390 284541.686 72.086 0.039 0.040 0.086<br />
CORD 3054 -234683.067 285379.543 57.667 0.027 0.033 0.060<br />
CORD 3055 -234685.251 284416.106 87.120 0.021 0.021 0.036<br />
CORD 3056 -234778.631 284498.385 86.870 0.024 0.036 0.050<br />
CORD 3061 -234272.826 284758.111 71.251 0.024 0.026 0.045<br />
CORD 3062 -234249.627 285053.336 60.297 0.024 0.025 0.049<br />
CORD 3063 -234310.211 285450.398 47.556 0.027 0.036 0.062<br />
CORD 3064 -234220.527 285475.939 43.016 0.028 0.037 0.063<br />
CORD 3065 -234252.296 284410.364 69.820 0.022 0.022 0.036
E.6 Aerotriangulation for images in scale 1:5,000<br />
CORD 3066 -234215.201 284399.100 69.065 0.023 0.023 0.038<br />
CORD 3072 -233715.257 285036.496 57.657 0.027 0.027 0.051<br />
CORD 3073 -233748.182 285478.710 47.310 0.032 0.039 0.066<br />
CORD 3074 -233715.293 285517.308 46.788 0.033 0.042 0.067<br />
CORD 3075 -233766.681 284475.596 70.582 0.025 0.024 0.038<br />
CORD 3076 -233830.308 284469.000 69.532 0.025 0.025 0.039<br />
CORD 3080 -233312.642 284993.871 56.159 0.042 0.036 0.085<br />
CORD 3081 -233254.466 284923.584 59.626 0.046 0.037 0.086<br />
CORD 3082 -233233.207 285526.877 47.314 0.057 0.069 0.100<br />
CORD 3085 -233371.524 284555.871 80.947 0.032 0.032 0.052<br />
CORD 3086 -233469.470 284557.690 77.091 0.030 0.030 0.049<br />
CORD 4000 -237403.702 284472.467 87.542 0.044 0.041 0.080<br />
CORD 4001 -237429.879 284126.548 75.859 0.047 0.043 0.084<br />
CORD 4003 -237374.464 284813.250 81.141 0.047 0.062 0.087<br />
CORD 4004 -237282.199 284841.943 75.152 0.041 0.063 0.087<br />
CORD 4005 -237464.049 283966.963 68.466 0.044 0.039 0.063<br />
CORD 4006 -237304.426 283882.138 73.927 0.036 0.035 0.056<br />
CORD 4011 -236918.305 284127.431 84.557 0.027 0.029 0.048<br />
CORD 4012 -236775.812 284416.678 82.643 0.026 0.027 0.047<br />
CORD 4013 -236759.060 284832.629 56.117 0.030 0.041 0.062<br />
CORD 4014 -236784.222 284737.342 62.637 0.029 0.036 0.057<br />
CORD 4015 -236937.588 283759.791 78.978 0.029 0.029 0.046<br />
CORD 4016 -236782.220 283792.989 80.491 0.029 0.039 0.057<br />
CORD 4020 -236347.324 284304.687 47.938 0.025 0.025 0.046<br />
CORD 4021 -236343.025 284388.453 48.332 0.025 0.025 0.047<br />
CORD 4022 -236324.359 284192.729 50.436 0.025 0.025 0.047<br />
CORD 4023 -236288.155 284817.639 44.039 0.027 0.039 0.057<br />
CORD 4024 -236378.177 284851.855 49.008 0.027 0.040 0.058<br />
CORD 4025 -236341.525 283719.441 51.259 0.024 0.025 0.045<br />
CORD 4026 -236512.324 283768.234 68.809 0.025 0.026 0.045<br />
CORD 4030 -235927.472 284329.735 65.005 0.024 0.024 0.046<br />
CORD 4031 -235883.669 284310.741 68.265 0.024 0.024 0.046<br />
CORD 4032 -235873.247 284282.756 67.308 0.024 0.024 0.046<br />
CORD 4033 -235873.172 284737.925 63.560 0.025 0.035 0.051<br />
CORD 4034 -235831.912 284833.759 63.778 0.026 0.040 0.054<br />
CORD 4035 -236006.258 283926.624 68.174 0.022 0.023 0.043<br />
CORD 4036 -235887.238 283775.554 82.136 0.026 0.036 0.056<br />
CORD 4037 -235942.955 283951.720 77.058 0.022 0.023 0.042<br />
CORD 4040 -235430.076 284245.297 88.000 0.024 0.024 0.047<br />
CORD 4041 -235441.877 284269.948 90.581 0.024 0.024 0.046<br />
CORD 4042 -235452.219 284220.527 83.882 0.024 0.024 0.047<br />
CORD 4043 -235460.155 284764.605 70.461 0.026 0.038 0.056<br />
CORD 4044 -235403.326 284720.026 73.285 0.026 0.036 0.055<br />
CORD 4045 -235522.737 283826.836 97.323 0.022 0.023 0.041<br />
CORD 4046 -235552.275 283900.335 93.229 0.029 0.053 0.081<br />
CORD 4050 -234956.966 284363.274 79.182 0.024 0.025 0.048<br />
CORD 4051 -234978.093 284330.287 78.612 0.024 0.024 0.047<br />
CORD 4052 -235070.589 284335.680 80.740 0.024 0.024 0.047<br />
CORD 4053 -234925.965 284799.412 71.116 0.028 0.041 0.061<br />
CORD 4054 -234996.648 284743.061 68.954 0.026 0.038 0.059<br />
CORD 4055 -234985.444 283748.332 96.538 0.021 0.023 0.039<br />
CORD 4056 -235023.494 283701.107 94.413 0.022 0.023 0.040<br />
CORD 4060 -234550.854 284250.780 76.972 0.024 0.024 0.046<br />
CORD 4061 -234484.454 284217.159 77.012 0.025 0.024 0.047<br />
CORD 4062 -234472.076 284380.280 72.486 0.025 0.026 0.049<br />
CORD 4063 -234476.318 284789.939 76.735 0.028 0.041 0.060<br />
CORD 4064 -234532.480 284759.244 81.746 0.027 0.039 0.058<br />
223
Bundle adjustment<br />
CORD 4065 -234549.433 283754.792 91.662 0.023 0.024 0.040<br />
CORD 4066 -234503.087 283791.482 91.692 0.023 0.024 0.040<br />
CORD 4070 -234076.862 284269.229 68.328 0.025 0.026 0.046<br />
CORD 4071 -234012.683 284147.764 73.700 0.026 0.026 0.045<br />
CORD 4072 -234105.001 284182.420 73.421 0.025 0.025 0.045<br />
CORD 4073 -234022.130 284798.518 63.248 0.029 0.042 0.061<br />
CORD 4074 -233993.752 284653.035 62.881 0.028 0.035 0.056<br />
CORD 4075 -234049.027 283870.585 87.145 0.024 0.025 0.038<br />
CORD 4076 -234121.379 283683.524 87.250 0.025 0.026 0.040<br />
CORD 4077 -234129.049 283772.664 94.162 0.027 0.034 0.048<br />
CORD 4080 -233664.343 284252.825 79.977 0.028 0.029 0.046<br />
CORD 4081 -233613.523 284274.189 84.347 0.029 0.030 0.047<br />
CORD 4082 -233694.969 284158.889 81.294 0.028 0.029 0.045<br />
CORD 4083 -233578.605 284782.427 63.033 0.034 0.042 0.063<br />
CORD 4084 -233617.417 284724.459 64.158 0.032 0.040 0.060<br />
CORD 4085 -233636.732 283753.396 85.862 0.033 0.038 0.053<br />
CORD 4086 -233688.651 283833.289 88.322 0.029 0.028 0.039<br />
CORD 4090 -233105.215 284124.870 81.327 0.051 0.044 0.084<br />
CORD 4091 -233126.539 284120.250 84.203 0.049 0.044 0.083<br />
CORD 4092 -233136.944 284313.405 96.856 0.047 0.044 0.081<br />
CORD 4093 -233107.713 284756.561 61.930 0.056 0.071 0.097<br />
CORD 4094 -233192.391 284743.310 63.818 0.049 0.067 0.094<br />
CORD 4095 -233439.305 283776.735 93.978 0.038 0.053 0.081<br />
CORD 4096 -233274.351 284025.828 102.329 0.041 0.042 0.078<br />
CORD 4097 -233425.015 283778.995 100.445 0.039 0.052 0.080<br />
CORD 5000 -237568.469 283353.984 61.070 0.052 0.053 0.086<br />
CORD 5001 -237529.038 283603.554 62.899 0.049 0.049 0.085<br />
CORD 5002 -237612.423 283849.168 64.530 0.060 0.060 0.094<br />
CORD 5003 -237527.026 283967.521 64.230 0.055 0.067 0.095<br />
CORD 5004 -237628.237 283757.756 55.783 0.059 0.056 0.093<br />
CORD 5005 -237613.867 282896.359 75.074 0.065 0.082 0.097<br />
CORD 5006 -237519.390 282971.541 72.458 0.055 0.073 0.090<br />
CORD 5010 -236986.564 283311.356 84.081 0.033 0.038 0.051<br />
CORD 5011 -236981.154 283529.039 80.378 0.032 0.034 0.053<br />
CORD 5012 -236987.307 283322.685 84.192 0.033 0.038 0.051<br />
CORD 5015 -237125.676 282988.274 60.259 0.040 0.056 0.060<br />
CORD 5016 -237087.012 282999.161 61.091 0.039 0.054 0.059<br />
CORD 5020 -236526.393 283462.116 61.387 0.030 0.030 0.059<br />
CORD 5021 -236665.698 283466.543 71.973 0.030 0.031 0.059<br />
CORD 5022 -236643.820 283351.571 71.763 0.031 0.033 0.060<br />
CORD 5025 -236565.144 283097.488 69.763 0.034 0.041 0.066<br />
CORD 5026 -236521.411 283130.113 67.604 0.034 0.039 0.066<br />
CORD 5030 -236078.472 283422.526 57.725 0.027 0.028 0.060<br />
CORD 5031 -236067.761 283349.768 65.078 0.028 0.029 0.061<br />
CORD 5032 -236243.173 283892.802 50.016 0.031 0.052 0.088<br />
CORD 5033 -236092.877 283946.676 60.899 0.027 0.037 0.063<br />
CORD 5034 -236268.284 283988.613 47.090 0.031 0.060 0.092<br />
CORD 5035 -236125.730 282933.174 55.913 0.033 0.047 0.079<br />
CORD 5036 -236043.164 282955.135 67.865 0.033 0.046 0.078<br />
CORD 5040 -235644.385 283370.521 82.523 0.026 0.028 0.056<br />
CORD 5041 -235751.785 283485.499 80.694 0.026 0.027 0.056<br />
CORD 5042 -235670.852 283293.861 77.370 0.027 0.029 0.058<br />
CORD 5043 -235662.255 283843.284 96.286 0.025 0.034 0.059<br />
CORD 5044 -235741.584 283913.846 93.259 0.026 0.037 0.061<br />
CORD 5045 -235665.741 282880.927 82.650 0.032 0.048 0.072<br />
CORD 5046 -235773.738 282895.939 78.297 0.033 0.048 0.073<br />
CORD 5050 -235261.534 283417.466 91.161 0.026 0.026 0.053
E.6 Aerotriangulation for images in scale 1:5,000<br />
CORD 5051 -235197.131 283547.130 95.231 0.026 0.027 0.053<br />
CORD 5053 -235297.236 283852.356 96.074 0.030 0.049 0.082<br />
CORD 5054 -235145.046 283657.587 88.181 0.031 0.035 0.076<br />
CORD 5055 -235349.472 282935.084 80.747 0.035 0.060 0.086<br />
CORD 5056 -235221.454 283078.824 85.528 0.030 0.035 0.058<br />
CORD 6060 -234682.797 283350.225 86.536 0.026 0.028 0.051<br />
CORD 6062 -234693.435 283649.505 104.252 0.026 0.029 0.052<br />
CORD 6063 -234840.701 283709.278 98.863 0.030 0.038 0.074<br />
CORD 6064 -234852.122 283901.309 90.756 0.030 0.053 0.080<br />
CORD 6065 -234743.770 282866.974 83.506 0.031 0.050 0.064<br />
CORD 6066 -234701.009 282921.748 86.223 0.031 0.046 0.061<br />
CORD 6067 -234762.381 282927.093 87.971 0.030 0.046 0.061<br />
CORD 6070 -234307.990 283388.509 96.726 0.027 0.029 0.049<br />
CORD 6072 -234309.555 283644.375 102.779 0.026 0.029 0.050<br />
CORD 6073 -234313.874 283734.209 103.000 0.027 0.031 0.053<br />
CORD 6074 -234337.164 283683.121 103.551 0.026 0.030 0.051<br />
CORD 6075 -234267.942 282940.984 92.990 0.033 0.043 0.058<br />
CORD 6076 -234352.849 282884.688 87.491 0.033 0.046 0.061<br />
CORD 6077 -234333.755 282931.182 88.808 0.032 0.043 0.059<br />
CORD 6080 -233828.214 283309.083 90.606 0.031 0.033 0.050<br />
CORD 6081 -233763.278 283413.998 88.980 0.031 0.033 0.048<br />
CORD 6082 -233869.470 283367.810 97.386 0.030 0.032 0.049<br />
CORD 6083 -233793.794 283863.146 81.151 0.031 0.039 0.056<br />
CORD 6084 -233837.359 283893.633 80.934 0.031 0.040 0.057<br />
CORD 6085 -233861.687 283065.907 83.381 0.035 0.041 0.060<br />
CORD 6086 -233832.182 282827.482 84.194 0.046 0.072 0.091<br />
CORD 6087 -233777.158 283007.299 87.659 0.037 0.044 0.060<br />
CORD 6090 -233307.630 283276.992 88.120 0.049 0.046 0.077<br />
CORD 6091 -233410.776 283325.867 82.118 0.042 0.043 0.075<br />
CORD 6093 -233420.858 283812.956 94.726 0.043 0.054 0.081<br />
CORD 6095 -233318.814 283017.947 80.256 0.053 0.058 0.082<br />
CORD 6096 -233290.856 282921.004 73.450 0.059 0.067 0.086<br />
CORD 6097 -233452.627 282995.787 77.588 0.045 0.057 0.080<br />
CORD 7908 -235981.352 284741.983 52.847 0.032 0.042 0.047<br />
CORD 7909 -236320.979 284513.824 48.910 0.029 0.031 0.046<br />
CORD 7911 -234073.651 283756.167 91.014 0.040 0.051 0.079<br />
CORD 7961 -234971.030 283749.814 98.283 0.027 0.041 0.073<br />
CORD 7962 -235253.287 284507.975 86.671 0.027 0.031 0.045<br />
CORD 7964 -235108.434 285317.508 57.550 0.032 0.042 0.086<br />
CORD 7973 -234342.330 284470.384 78.283 0.028 0.032 0.046<br />
CORD 8523 -233102.461 284153.754 83.079 0.051 0.044 0.084<br />
CORD 8600 -233992.533 286435.816 44.999 0.042 0.055 0.048<br />
CORD 8601 -233989.027 286406.721 44.671 0.042 0.053 0.048<br />
CORD 8630 -237350.419 285365.281 67.875 0.035 0.038 0.045<br />
CORD 8903 -235997.764 286008.978 55.216 0.035 0.032 0.046<br />
CORD 8906 -237046.158 285396.886 48.065 0.028 0.030 0.036<br />
CORD 8907 -237338.862 284514.415 83.524 0.037 0.039 0.047<br />
CORD 8908 -235981.253 284742.154 52.831 0.031 0.041 0.047<br />
CORD 8909 -236320.837 284513.753 48.821 0.035 0.031 0.047<br />
CORD 8911 -234073.484 283756.013 91.032 0.029 0.038 0.045<br />
CORD 8961 -234971.647 283748.790 97.977 0.033 0.042 0.046<br />
CORD 8962 -235254.609 284509.551 86.631 0.033 0.043 0.047<br />
CORD 8964 -235108.294 285317.414 57.453 0.035 0.034 0.047<br />
CORD 8973 -234342.154 284470.864 78.345 0.033 0.042 0.047<br />
CORD 8982 -236987.046 283991.963 82.303 0.043 0.042 0.083<br />
END<br />
225
E.6 Aerotriangulation for images in scale 1:5,000<br />
Appendix F<br />
227
F.1 Graphic online/<strong>of</strong>fline<br />
Appendix F: Graphic online/<strong>of</strong>fline<br />
F.1 Graphic online/<strong>of</strong>fline<br />
Appendix F contains 11 examples <strong>of</strong> the visualisation tool graphic online/<strong>of</strong>fline. All these examples are in<br />
scale 1:25,000. The reason for this, is that the window for the graphic online/<strong>of</strong>fline has to be open for<br />
each model calculation. The block <strong>of</strong> images in scale 1:25,000 consists <strong>of</strong> 2 models, while the block for<br />
images in 1:15,000 and 1:5,000 consists <strong>of</strong> several models. It has therefore been easier to follow the calculations<br />
for the images in 1:25,000 than the images in 1:15,000 and 1:5,000.<br />
Graphic online/<strong>of</strong>fline for scale 1:25,000, resolution 15 μm and mesh size 5 x 5 m. Green dots symbolises<br />
interest points, red dots symbolises grid points.<br />
229
Graphic online/<strong>of</strong>fline<br />
Graphic online/<strong>of</strong>fline for scale 1:25,000, resolution 15 μm and mesh size 12.5 x 12.5 m.<br />
Green dots symbolises interest points, red dots symbolises grid points.<br />
Graphic online/<strong>of</strong>fline for scale 1:25,000, resolution 15 μm and mesh size 25 x 25<br />
m. Green dots symbolises interest points, red dots symbolises grid points.
F.1 Graphic online/<strong>of</strong>fline<br />
Graphic online/<strong>of</strong>fline for scale 1:25,000, resolution 60 μm and mesh size 25 x 25 m. Green<br />
dots symbolises interest points, red dots symbolises grid points.<br />
Graphic online/<strong>of</strong>fline for scale 1:25,000, resolution 30 μm and mesh size 25 x 25 m. Green<br />
dots symbolises interest points, red dots symbolises grid points.<br />
231
Graphic online/<strong>of</strong>fline
F.1 Graphic online/<strong>of</strong>fline<br />
Appendix G<br />
233
Appendix G: Sizes <strong>of</strong> grid files<br />
G.1 Sizes <strong>of</strong> grid files<br />
G.1 Sizes <strong>of</strong> grid files<br />
This Appendix contains a table with the file sizes <strong>of</strong> all models in the project. The file sizes <strong>of</strong> the models<br />
in scale 1:5,000 are on this page and the file sizes <strong>of</strong> the models in the scales 1:15,000 and 1:25,000 are<br />
shown on the following page.<br />
Scale<br />
1:5,000<br />
Model and resolution<br />
Sizes <strong>of</strong> grid files after <strong>generation</strong> for each mesh size<br />
5 x 5 m (kB) 12.5 x 12.5 m (kB) 25 x 25 m (kB)<br />
121122_15μm 570 115 37<br />
121122_30μm 570 103 37<br />
121122_60μm 570 60 37<br />
122123_15μm 813 153 43<br />
122123_30μm 746 124 46<br />
122123_60μm 813 59 46<br />
128129_15μm 691 95 137<br />
128129_30μm 558 98 29<br />
128129_60μm 558 76 29<br />
136137_15μm 845 169 53<br />
136137_30μm 845 179 53<br />
136137_60μm 845 179 53<br />
140141_15μm 813 153 46<br />
140141_30μm 813 153 46<br />
140141_60μm 813 153 46<br />
141142_15μm 525 153 46<br />
141142_30μm 525 153 46<br />
141142_60μm 525 153 46<br />
142143_15μm 813 144 53<br />
142143_30μm 813 176 43<br />
142143_60μm 813 153 43<br />
146147_15μm 597 126 46<br />
146147_30μm 597 107 46<br />
146147_60μm 597 66 50<br />
235
Sizes <strong>of</strong> grid files<br />
Scale Model and resolution<br />
Sizes <strong>of</strong> grid files after <strong>generation</strong> for each mesh size<br />
5 x 5 m (kB) 12.5 x 12.5 m (kB) 25 x 25 m (kB)<br />
150151_15μm 3535 623 172<br />
150151_30μm 1831 462 172<br />
150151_60μm --- 204 172<br />
151152_15μm 2618 465 125<br />
151152_30μm 2031 360 125<br />
151152_60μm --- 238 125<br />
152153_15μm 3159 608 172<br />
152153_30μm 2167 423 172<br />
152153_60μm --- 245 172<br />
1:15,000<br />
155156_15μm<br />
155156_30μm<br />
2118<br />
2043<br />
337<br />
305<br />
89<br />
89<br />
155156_60μm --- 278 89<br />
156157_15μm 4235 756 196<br />
156157_30μm 3848 767 197<br />
156157_60μm --- 669 197<br />
157158_15μm 3848 559 142<br />
157158_30μm 3496 538 142<br />
157158_60μm --- 33 142<br />
158159_15μm 4115 747 196<br />
158159_30μm 3375 696 196<br />
158159_60μm --- 545 196<br />
160161_15μm 2302 582<br />
160161_30μm ---<br />
2984 686<br />
1:25,000 160161_60μm<br />
2983 686<br />
161162_15μm 3257 821<br />
161162_30μm ---<br />
3929 848<br />
161162_60μm<br />
3929 848<br />
Appendix H: Sizes <strong>of</strong> grid files for each <strong>of</strong> the models.
G.1 Sizes <strong>of</strong> grid files<br />
Appendix H<br />
237
H.1 Code specification<br />
Appendix H: Code specification<br />
H.1 Code specification<br />
This Appendix contains 16 examples <strong>of</strong> the grid points placement and their code specification.<br />
Code specification for image in scale 1:25,000, resolution 15μm and mesh size 25 x 25 m. Light grey = grid point is<br />
OK, medium grey = grid point with double code, dark grey = grid point is defective.<br />
239
Code specification<br />
Code specification for image in scale 1:25,000, resolution 30 μm and mesh size 12.5 x 12.5 m. Light grey = grid point<br />
is OK, medium grey = grid point with double code, dark grey = grid point is defective.<br />
Code specification for image in scale 1:25,000, resolution 30 μm and mesh size 25 x 25 m. Light grey = grid point is<br />
OK, medium grey = grid point with double code, dark grey = grid point is defective.
H.1 Code specification<br />
Code specification for image in scale 1:25,000, resolution 15 μm and mesh size 12.5 x 12.5 m. Light grey = grid point<br />
is OK, medium grey = grid point with double code, dark grey = grid point is defective.<br />
Code specification for image in scale 1:25,000, resolution 60 μm and mesh size 25 x 25 m. Light grey = grid point is<br />
OK, medium grey = grid point with double code, dark grey = grid point is defective.<br />
241
Code specification<br />
Code specification for image in scale 1:15,000, resolution 15 μm and mesh size 12.5 x 12.5 m. Light grey = grid point<br />
is OK, medium grey = grid point with double code, dark grey = grid point is defective.<br />
Code specification for image in scale 1:15,000, resolution 15 μm and mesh size 25 x 25 m. Light grey = grid point is<br />
OK, medium grey = grid point with double code, dark grey = grid point is defective.
H.1 Code specification<br />
Code specification for image in scale 1:15,000, resolution 30 μm and mesh size 12.5 x 12.5 m. Light grey = grid point<br />
is OK, medium grey = grid point with double code, dark grey = grid point is defective.<br />
Code specification for image in scale 1:15,000, resolution 30 μm and mesh size 25 x 25 m. Light grey = grid point is<br />
OK, medium grey = grid point with double code, dark grey = grid point is defective.<br />
243
Code specification<br />
Code specification for image in scale 1:15,000, resolution 60 μm and mesh size 12.5 x 12.5 m. Light grey = grid point<br />
is OK, medium grey = grid point with double code, dark grey = grid point is defective.<br />
Code specification for image in scale 1:15,000, resolution 60 μm and mesh size 25 x 25 m. Light grey = grid point is<br />
OK, medium grey = grid point with double code, dark grey = grid point is defective.
H.1 Code specification<br />
Code specification for image in scale 1:5,000, resolution 30μm and mesh size 12.5 x 12.5 m. Light grey = grid point is<br />
OK, medium grey = grid point with double code, dark grey = grid point is defective.<br />
Code specification for image in scale 1:5,000, resolution 30 μm and mesh size 25 x 25 m. Light grey = grid point is<br />
OK, medium grey = grid point with double code, dark grey = grid point is defective.<br />
245
Code specification<br />
Code specification for image in scale 1:5,000, resolution 60 μm and mesh size 12.5 x 12.5 m. Light grey = grid point<br />
is OK, medium grey = grid point with double code, dark grey = grid point is defective.<br />
Code specification for image in scale 1:5,000, resolution 60 μm and mesh size 25 x 25 m. Light grey = grid point is<br />
OK, medium grey = grid point with double code, dark grey = grid point is defective.
H.1 Code specification<br />
Appendix I<br />
247
I.1 Analysis calculations<br />
Appendix I: Analysis calculations<br />
I.1 Analysis calculations<br />
This Appendix contains the deviation between the frame <strong>of</strong> reference and the automatically generated<br />
grid in diagram format for each <strong>of</strong> the 24 calculations. Following, is a print out <strong>of</strong> the analysis file generated<br />
by the PIL program belonging to each diagram.<br />
In order to be able to compare the results <strong>of</strong> the before and after iteration, the results are placed with the<br />
before results on the left hand page and the after results on the right hand page for the same image<br />
scale, resolution and mesh size.<br />
The language in this Appendix is <strong>Danish</strong> with a translation into English on an A3 page, which can be<br />
found after Appendix L (page 331). This can be folded out.<br />
249
Analysis calculations<br />
700<br />
600<br />
500<br />
400<br />
300<br />
200<br />
100<br />
Fordelingen af afvigelser for 1:25.000, 15μm, 5 m.<br />
Afvigelser Normalfordeling<br />
0<br />
-9.6 -8.7 -7.8 -6.9 -6 -5.1 -4.2 -3.3 -2.4 -1.5 -0.6 0.3 1.2 2.1 3 3.9 4.8 5.7 6.6 7.5 8.4 9.3 10.2 11.1 12 12.9 13.8 14.7 15.6 16.5<br />
| Total |Fladt A 12|Grusgrav 34|Landsby 56|Bakket A 78|Skov 90|Ukendt 00|<br />
Min | -9.51 | -0.07 | -0.98 | 0.06 | -2.73 | -9.51 | 0 |<br />
Max | 17.13 | 4.65 | 2.89 | 6.98 | 8.40 | 17.13 | 0 |<br />
Gns | 1.64 | 1.55 | 1.05 | 1.65 | 1.70 | 2.39 | 0 |<br />
Stnd | 1.27 | 0.45 | 0.54 | 0.68 | 0.89 | 3.22 | 0 |<br />
Sprd | 2.07 | 1.61 | 1.18 | 1.79 | 1.92 | 4.02 | 0 |<br />
Antal | 8342 | 2092 | 1168 | 1410 | 2811 | 861 | 0 |<br />
Niv'200.0'| 8342 | 2092 | 1168 | 1410 | 2811 | 861 | 0 |<br />
Niv'400.0'| 0 | 0 | 0 | 0 | 0 | 0 | 0 |<br />
Niv'600.0'| 0 | 0 | 0 | 0 | 0 | 0 | 0 |<br />
Udklip.pkt| 0 | 0 | 0 | 0 | 0 | 0 | 0 |<br />
Areal | 202.0 | 0.0 | 107.3 | 0.0 | 0.0 | 94.6 | 0.0 |<br />
Niv'200.0'| 202.0 | 0.0 | 107.3 | 0.0 | 0.0 | 94.6 | 0.0 |<br />
Niv'400.0'| 0.0 | 0.0 | 0.0 | 0.0 | 0.0 | 0.0 | 0.0 |<br />
Niv'600.0'| 0.0 | 0.0 | 0.0 | 0.0 | 0.0 | 0.0 | 0.0 |<br />
Udklip.pkt| 0.0 | 0.0 | 0.0 | 0.0 | 0.0 | 0.0 | 0.0 |<br />
Udkl. i % | 0.00 | 0.00 | 0.00 | 0.00 | 0.00 | 0.00 | -0- |<br />
Offset gns. 1.64 1.55 1.05 1.65 1.70 2.39 -0-<br />
Min | -11.90 | -1.62 | -2.03 | -1.59 | -4.43 | -11.90 | 0 |<br />
Max | 14.73 | 3.10 | 1.83 | 5.33 | 6.70 | 14.73 | 0 |<br />
Gns | -0.00 | 0.00 | 0.00 | 0.00 | -0.00 | 0.00 | 0 |<br />
Stnd | 1.23 | 0.45 | 0.54 | 0.68 | 0.89 | 3.22 | 0 |<br />
Sprd | 1.23 | 0.45 | 0.54 | 0.68 | 0.89 | 3.22 | 0 |<br />
Udklippet<br />
Min | -9.51 | -0.07 | -0.98 | 0.06 | -2.73 | -9.51 | 0 |<br />
Max | 17.13 | 4.65 | 2.89 | 6.98 | 8.40 | 17.13 | 0 |<br />
Gns | 1.64 | 1.55 | 1.05 | 1.65 | 1.70 | 2.39 | 0 |<br />
Stnd | 1.27 | 0.45 | 0.54 | 0.68 | 0.89 | 3.22 | 0 |<br />
Sprd | 2.07 | 1.61 | 1.18 | 1.79 | 1.92 | 4.02 | 0 |<br />
Udklippet + Offset<br />
Min | - | -1.62 | -2.03 | -1.59 | -4.43 | -11.90 | 0 |<br />
Max | - | 3.10 | 1.83 | 5.33 | 6.70 | 14.73 | 0 |<br />
Gns | - | 0.00 | 0.00 | 0.00 | -0.00 | 0.00 | 0 |<br />
Stnd | - | 0.45 | 0.54 | 0.68 | 0.89 | 3.22 | 0 |<br />
Sprd | - | 0.45 | 0.54 | 0.68 | 0.89 | 3.22 | 0 |<br />
Analysefilen for 1:25,000, opløsningen 15 μm og maskestørrelsen 5 m. før iterationsprocessen.
700<br />
600<br />
500<br />
400<br />
300<br />
200<br />
100<br />
0<br />
Fordelingen af afvigelser efter eliminering af grove fejl 1:25.000, 15 μm, 5 m.<br />
Afvigelser Normalfordeling<br />
I.1 Analysis calculations<br />
-1.6 -1.5 -1.4 -1.3 -1.2 -1.1 -1 -0.9 -0.8 -0.7 -0.6 -0.5 -0.4 -0.3 -0.2 -0.1 0 0.1 0.2 0.3 0.4 0.5 0.6 0.7 0.8 0.9 1 1.1 1.2 1.3 1.4 1.5<br />
| Total |Fladt A 12|Grusgrav 34|Landsby 56|Bakket A 78|Skov 90|Ukendt 00|<br />
Min | -9.51 | -0.07 | -0.98 | 0.06 | -2.73 | -9.51 | 0 |<br />
Max | 17.13 | 4.65 | 2.89 | 6.98 | 8.40 | 17.13 | 0 |<br />
Gns | 1.64 | 1.55 | 1.05 | 1.65 | 1.70 | 2.39 | 0 |<br />
Stnd | 1.27 | 0.45 | 0.54 | 0.68 | 0.89 | 3.22 | 0 |<br />
Sprd | 2.07 | 1.61 | 1.18 | 1.79 | 1.92 | 4.02 | 0 |<br />
Antal | 8342 | 2092 | 1168 | 1410 | 2811 | 861 | 0 |<br />
Niv'0.5' | 324 | 11 | 172 | 11 | 91 | 39 | 0 |<br />
Niv'1.1' | 1308 | 206 | 431 | 181 | 312 | 178 | 0 |<br />
Niv'1.6' | 3033 | 987 | 392 | 552 | 857 | 245 | 0 |<br />
Udklip.pkt| 3677 | 888 | 173 | 666 | 1551 | 399 | 0 |<br />
Areal | 202.0 | 0.0 | 107.3 | 0.0 | 0.0 | 94.6 | 0.0 |<br />
Niv'0.5' | 0.0 | 0.0 | 0.0 | 0.0 | 0.0 | 0.0 | 0.0 |<br />
Niv'1.1' | 34.2 | 0.0 | 34.2 | 0.0 | 0.0 | 0.0 | 0.0 |<br />
Niv'1.6' | 20.2 | 0.0 | 20.2 | 0.0 | 0.0 | 0.0 | 0.0 |<br />
Udklip.pkt| 147.5 | 0.0 | 52.9 | 0.0 | 0.0 | 94.6 | 0.0 |<br />
Udkl. i % | 44.08 | 42.45 | 14.81 | 47.23 | 55.18 | 46.34 | -0- |<br />
Offset gns. 1.64 1.55 1.05 1.65 1.70 2.39 -0-<br />
Min | -11.90 | -1.62 | -2.03 | -1.59 | -4.43 | -11.90 | 0 |<br />
Max | 14.73 | 3.10 | 1.83 | 5.33 | 6.70 | 14.73 | 0 |<br />
Gns | -0.00 | 0.00 | 0.00 | 0.00 | -0.00 | 0.00 | 0 |<br />
Stnd | 1.23 | 0.45 | 0.54 | 0.68 | 0.89 | 3.22 | 0 |<br />
Sprd | 1.23 | 0.45 | 0.54 | 0.68 | 0.89 | 3.22 | 0 |<br />
Udklippet<br />
Min | -0.42 | 0.10 | -0.42 | 0.13 | 0.12 | 0.82 | 0 |<br />
Max | 3.96 | 3.13 | 2.60 | 3.22 | 3.28 | 3.96 | 0 |<br />
Gns | 1.51 | 1.54 | 1.05 | 1.58 | 1.62 | 1.66 | 0 |<br />
Stnd | 0.55 | 0.42 | 0.51 | 0.51 | 0.53 | 0.70 | 0 |<br />
Sprd | 1.61 | 1.59 | 1.17 | 1.66 | 1.71 | 1.80 | 0 |<br />
Udklippet + Offset<br />
Min | - | -1.43 | -1.46 | -1.45 | -1.50 | -0.84 | 0 |<br />
Max | - | 1.59 | 1.55 | 1.64 | 1.66 | 2.31 | 0 |<br />
Gns | - | 0.00 | 0.00 | 0.00 | -0.00 | -0.00 | 0 |<br />
Stnd | - | 0.42 | 0.51 | 0.51 | 0.53 | 0.70 | 0 |<br />
Sprd | - | 0.42 | 0.51 | 0.51 | 0.53 | 0.70 | 0 |<br />
Analysefilen for 1:25,000, opløsningen 15 μm og maskestørrelsen 5 m. efter iterationsprocessen.<br />
251
Analysis calculations<br />
700<br />
600<br />
500<br />
400<br />
300<br />
200<br />
100<br />
0<br />
Fordelingen af afvigelser for 1:25.000, 15 μm, 12,5 m.<br />
Afvigelser Normalfordeling<br />
-6.3 -5.4 -4.5 -3.6 -2.7 -1.8 -0.9 0 0.9 1.8 2.7 3.6 4.5 5.4 6.3 7.2 8.1 9 9.9 10.8 11.7 12.6 13.5 14.4 15.3 16.2 17.1 18<br />
| Total |Fladt A 12|Grusgrav 34|Landsby 56|Bakket A 78|Skov 90|Ukendt 00|<br />
Min | -6.20 | 0.13 | -6.20 | -0.32 | -3.42 | -2.76 | 0 |<br />
Max | 18.07 | 3.93 | 15.41 | 4.43 | 6.19 | 18.07 | 0 |<br />
Gns | 1.82 | 1.47 | 2.28 | 1.51 | 1.67 | 2.69 | 0 |<br />
Stnd | 1.86 | 0.42 | 3.10 | 0.49 | 0.63 | 3.47 | 0 |<br />
Sprd | 2.60 | 1.53 | 3.85 | 1.59 | 1.78 | 4.39 | 0 |<br />
Antal | 8929 | 2087 | 1802 | 1392 | 2805 | 843 | 0 |<br />
Niv'200.0'| 8929 | 2087 | 1802 | 1392 | 2805 | 843 | 0 |<br />
Niv'400.0'| 0 | 0 | 0 | 0 | 0 | 0 | 0 |<br />
Niv'600.0'| 0 | 0 | 0 | 0 | 0 | 0 | 0 |<br />
Udklip.pkt| 0 | 0 | 0 | 0 | 0 | 0 | 0 |<br />
Areal | 52611.6 | 721.7 | 45759.7 | 1261.2 | 0.0 | 4868.9 | 0.0 |<br />
Niv'200.0'| 52611.6 | 721.7 | 45759.7 | 1261.2 | 0.0 | 4868.9 | 0.0 |<br />
Niv'400.0'| 0.0 | 0.0 | 0.0 | 0.0 | 0.0 | 0.0 | 0.0 |<br />
Niv'600.0'| 0.0 | 0.0 | 0.0 | 0.0 | 0.0 | 0.0 | 0.0 |<br />
Udklip.pkt| 0.0 | 0.0 | 0.0 | 0.0 | 0.0 | 0.0 | 0.0 |<br />
Udkl. i % | 0.00 | 0.00 | 0.00 | 0.00 | 0.00 | 0.00 | -0- |<br />
Offset gns. 1.82 1.47 2.28 1.51 1.67 2.69 -0-<br />
Min | -8.48 | -1.34 | -8.48 | -1.83 | -5.09 | -5.45 | 0 |<br />
Max | 15.38 | 2.47 | 13.14 | 2.92 | 4.52 | 15.38 | 0 |<br />
Gns | -0.00 | 0.00 | -0.00 | -0.00 | 0.00 | -0.00 | 0 |<br />
Stnd | 1.81 | 0.42 | 3.10 | 0.49 | 0.63 | 3.47 | 0 |<br />
Sprd | 1.81 | 0.42 | 3.10 | 0.49 | 0.63 | 3.47 | 0 |<br />
Udklippet<br />
Min | -6.20 | 0.13 | -6.20 | -0.32 | -3.42 | -2.76 | 0 |<br />
Max | 18.07 | 3.93 | 15.41 | 4.43 | 6.19 | 18.07 | 0 |<br />
Gns | 1.82 | 1.47 | 2.28 | 1.51 | 1.67 | 2.69 | 0 |<br />
Stnd | 1.87 | 0.42 | 3.10 | 0.49 | 0.63 | 3.47 | 0 |<br />
Sprd | 2.60 | 1.53 | 3.85 | 1.59 | 1.78 | 4.39 | 0 |<br />
Udklippet + Offset<br />
Min | - | -1.34 | -8.48 | -1.83 | -5.09 | -5.45 | 0 |<br />
Max | - | 2.47 | 13.14 | 2.92 | 4.52 | 15.38 | 0 |<br />
Gns | - | 0.00 | -0.00 | -0.00 | 0.00 | -0.00 | 0 |<br />
Stnd | - | 0.42 | 3.10 | 0.49 | 0.63 | 3.47 | 0 |<br />
Sprd | - | 0.42 | 3.10 | 0.49 | 0.63 | 3.47 | 0 |<br />
Analysefilen for 1:25,000, opløsningen 15 μm og maskestørrelsen 12.5 m. før iterationsprocessen.
700<br />
600<br />
500<br />
400<br />
300<br />
200<br />
100<br />
0<br />
I.1 Analysis calculations<br />
Fordelingen af afvigelser efter eliminering af grove fejl 1:25.000, 15 μm, 12,5 m.<br />
Afvigelser Normalfordeling<br />
-1.7 -1.5 -1.3 -1.1 -0.9 -0.7 -0.5 -0.3 -0.1 0.1 0.3 0.5 0.7 0.9 1.1 1.3 1.5<br />
| Total |Fladt A 12|Grusgrav 34|Landsby 56|Bakket A 78|Skov 90|Ukendt 00|<br />
Min | -6.20 | 0.13 | -6.20 | -0.32 | -3.42 | -2.76 | 0 |<br />
Max | 18.07 | 3.93 | 15.41 | 4.43 | 6.19 | 18.07 | 0 |<br />
Gns | 1.82 | 1.47 | 2.28 | 1.51 | 1.67 | 2.69 | 0 |<br />
Stnd | 1.86 | 0.42 | 3.10 | 0.49 | 0.63 | 3.47 | 0 |<br />
Sprd | 2.60 | 1.53 | 3.85 | 1.59 | 1.78 | 4.39 | 0 |<br />
Antal | 8929 | 2087 | 1802 | 1392 | 2805 | 843 | 0 |<br />
Niv'0.6' | 382 | 10 | 232 | 30 | 46 | 64 | 0 |<br />
Niv'1.1' | 1347 | 370 | 274 | 221 | 248 | 234 | 0 |<br />
Niv'1.6' | 3237 | 982 | 278 | 664 | 1096 | 217 | 0 |<br />
Udklip.pkt| 3963 | 725 | 1018 | 477 | 1415 | 328 | 0 |<br />
Areal | 52611.6 | 721.7 | 45759.7 | 1261.2 | 0.0 | 4868.9 | 0.0 |<br />
Niv'0.6' | 6446.9 | 0.0 | 5927.2 | 372.4 | 0.0 | 147.3 | 0.0 |<br />
Niv'1.1' | 8100.5 | 0.0 | 6914.1 | 343.2 | 0.0 | 843.2 | 0.0 |<br />
Niv'1.6' | 7660.0 | 0.0 | 6940.1 | 197.1 | 0.0 | 522.8 | 0.0 |<br />
Udklip.pkt| 30404.1 | 721.7 | 25978.3 | 348.5 | 0.0 | 3355.6 | 0.0 |<br />
Udkl. i % | 44.38 | 34.74 | 56.49 | 34.27 | 50.45 | 38.91 | -0- |<br />
Offset gns. 1.82 1.47 2.28 1.51 1.67 2.69 -0-<br />
Min | -8.48 | -1.34 | -8.48 | -1.83 | -5.09 | -5.45 | 0 |<br />
Max | 15.38 | 2.47 | 13.14 | 2.92 | 4.52 | 15.38 | 0 |<br />
Gns | -0.00 | 0.00 | -0.00 | -0.00 | 0.00 | -0.00 | 0 |<br />
Stnd | 1.81 | 0.42 | 3.10 | 0.49 | 0.63 | 3.47 | 0 |<br />
Sprd | 1.81 | 0.42 | 3.10 | 0.49 | 0.63 | 3.47 | 0 |<br />
Udklippet<br />
Min | -0.03 | 0.13 | 0.65 | -0.03 | 0.06 | 1.05 | 0 |<br />
Max | 4.24 | 3.06 | 3.92 | 3.11 | 3.31 | 4.24 | 0 |<br />
Gns | 1.59 | 1.47 | 2.08 | 1.49 | 1.65 | 1.78 | 0 |<br />
Stnd | 0.50 | 0.41 | 0.47 | 0.45 | 0.48 | 0.73 | 0 |<br />
Sprd | 1.66 | 1.52 | 2.13 | 1.56 | 1.72 | 1.93 | 0 |<br />
Udklippet + Offset<br />
Min | - | -1.34 | -1.42 | -1.53 | -1.59 | -0.73 | 0 |<br />
Max | - | 1.59 | 1.84 | 1.61 | 1.66 | 2.46 | 0 |<br />
Gns | - | 0.00 | 0.00 | 0.00 | 0.00 | 0.00 | 0 |<br />
Stnd | - | 0.41 | 0.47 | 0.45 | 0.48 | 0.73 | 0 |<br />
Sprd | - | 0.41 | 0.47 | 0.45 | 0.48 | 0.73 | 0 |<br />
Analysefilen for 1:25,000, opløsningen 15 μm og maskestørrelsen 12.5 m. efter iterationsprocessen.<br />
253
Analysis calculations<br />
700<br />
600<br />
500<br />
400<br />
300<br />
200<br />
100<br />
Fordelingen af afvigelser for 1:25.000_ 15 μm_25 m<br />
Afvigelser Normalfordeling<br />
0<br />
-7.2 -6.3 -5.4 -4.5 -3.6 -2.7 -1.8 -0.9 0 0.9 1.8 2.7 3.6 4.5 5.4 6.3 7.2 8.1 9 9.9 10.8 11.7 12.6 13.5 14.4 15.3 16.2 17.1 18<br />
| Total |Fladt A 12|Grusgrav 34|Landsby 56|Bakket A 78|Skov 90|Ukendt 00|<br />
Min | -7.17 | -1.29 | -6.73 | -1.04 | -7.17 | -6.36 | 0 |<br />
Max | 18.48 | 4.78 | 15.39 | 4.32 | 11.73 | 18.48 | 0 |<br />
Gns | 1.78 | 1.45 | 2.34 | 1.46 | 1.64 | 2.35 | 0 |<br />
Stnd | 2.00 | 0.47 | 3.50 | 0.53 | 1.16 | 3.07 | 0 |<br />
Sprd | 2.68 | 1.53 | 4.21 | 1.56 | 2.01 | 3.87 | 0 |<br />
Antal | 8956 | 2092 | 1805 | 1401 | 2811 | 847 | 0 |<br />
Niv'200.0'| 8956 | 2092 | 1805 | 1401 | 2811 | 847 | 0 |<br />
Niv'400.0'| 0 | 0 | 0 | 0 | 0 | 0 | 0 |<br />
Niv'600.0'| 0 | 0 | 0 | 0 | 0 | 0 | 0 |<br />
Udklip.pkt| 0 | 0 | 0 | 0 | 0 | 0 | 0 |<br />
Areal | 645893.3 | 72222.3 | 47670.5 | 262049.5 | 95868.7 | 168082.3 | 0.0 |<br />
Niv'200.0'| 645893.3 | 72222.3 | 47670.5 | 262049.5 | 95868.7 | 168082.3 | 0.0 |<br />
Niv'400.0'| 0.0 | 0.0 | 0.0 | 0.0 | 0.0 | 0.0 | 0.0 |<br />
Niv'600.0'| 0.0 | 0.0 | 0.0 | 0.0 | 0.0 | 0.0 | 0.0 |<br />
Udklip.pkt| 0.0 | 0.0 | 0.0 | 0.0 | 0.0 | 0.0 | 0.0 |<br />
Udkl. i % | 0.00 | 0.00 | 0.00 | 0.00 | 0.00 | 0.00 | -0- |<br />
Offset gns. 1.78 1.45 2.34 1.46 1.64 2.35 -0-<br />
Min | -9.07 | -2.74 | -9.07 | -2.50 | -8.80 | -8.70 | 0 |<br />
Max | 16.13 | 3.33 | 13.05 | 2.86 | 10.09 | 16.13 | 0 |<br />
Gns | -0.00 | -0.00 | -0.00 | 0.00 | -0.00 | -0.00 | 0 |<br />
Stnd | 1.97 | 0.47 | 3.50 | 0.53 | 1.16 | 3.07 | 0 |<br />
Sprd | 1.97 | 0.47 | 3.50 | 0.53 | 1.16 | 3.07 | 0 |<br />
Udklippet<br />
Min | -7.17 | -1.29 | -6.73 | -1.04 | -7.17 | -6.36 | 0 |<br />
Max | 18.48 | 4.78 | 15.39 | 4.32 | 11.73 | 18.48 | 0 |<br />
Gns | 1.78 | 1.45 | 2.34 | 1.46 | 1.64 | 2.35 | 0 |<br />
Stnd | 2.02 | 0.47 | 3.50 | 0.53 | 1.16 | 3.07 | 0 |<br />
Sprd | 2.68 | 1.53 | 4.21 | 1.56 | 2.01 | 3.87 | 0 |<br />
Udklippet + Offset<br />
Min | - | -2.74 | -9.07 | -2.50 | -8.80 | -8.70 | 0 |<br />
Max | - | 3.33 | 13.05 | 2.86 | 10.09 | 16.13 | 0 |<br />
Gns | - | -0.00 | -0.00 | 0.00 | -0.00 | -0.00 | 0 |<br />
Stnd | - | 0.47 | 3.50 | 0.53 | 1.16 | 3.07 | 0 |<br />
Sprd | - | 0.47 | 3.50 | 0.53 | 1.16 | 3.07 | 0 |<br />
Analysefilen for 1:25,000, opløsningen 15 μm og maskestørrelsen 25 m. før iterationsprocessen.
700<br />
600<br />
500<br />
400<br />
300<br />
200<br />
100<br />
0<br />
Fordelingen af afvigelser for 1:25.000_15 μm_25 m<br />
Afvigelser Normalfordeling<br />
I.1 Analysis calculations<br />
-1.8 -1.7 -1.6 -1.5 -1.4 -1.3 -1.2 -1.1 -1 -0.9 -0.8 -0.7 -0.6 -0.5 -0.4 -0.3 -0.2 -0.1 0 0.1 0.2 0.3 0.4 0.5 0.6 0.7 0.8 0.9 1 1.1 1.2 1.3 1.4 1.5 1.6 1.7<br />
| Total |Fladt A 12|Grusgrav 34|Landsby 56|Bakket A 78|Skov 90|Ukendt 00|<br />
Min | -7.17 | -1.29 | -6.73 | -1.04 | -7.17 | -6.36 | 0 |<br />
Max | 18.48 | 4.78 | 15.39 | 4.32 | 11.73 | 18.48 | 0 |<br />
Gns | 1.78 | 1.45 | 2.34 | 1.46 | 1.64 | 2.35 | 0 |<br />
Stnd | 2.00 | 0.47 | 3.50 | 0.53 | 1.16 | 3.07 | 0 |<br />
Sprd | 2.68 | 1.53 | 4.21 | 1.56 | 2.01 | 3.87 | 0 |<br />
Antal | 8956 | 2092 | 1805 | 1401 | 2811 | 847 | 0 |<br />
Niv'0.6' | 587 | 30 | 269 | 64 | 126 | 98 | 0 |<br />
Niv'1.2' | 1782 | 559 | 273 | 312 | 430 | 208 | 0 |<br />
Niv'1.8' | 3358 | 1037 | 280 | 697 | 1128 | 216 | 0 |<br />
Udklip.pkt| 3229 | 466 | 983 | 328 | 1127 | 325 | 0 |<br />
Areal | 645893.3 | 72222.3 | 47670.5 | 262049.5 | 95868.7 | 168082.3 | 0.0 |<br />
Niv'0.6' | 38660.5 | 1640.1 | 7292.8 | 12604.1 | 4576.8 | 12546.8 | 0.0 |<br />
Niv'1.2' | 111099.5 | 13775.0 | 7570.8 | 47735.8 | 13722.0 | 28296.0 | 0.0 |<br />
Niv'1.8' | 257798.6 | 36900.8 | 7445.0 | 127785.3 | 36825.2 | 48842.3 | 0.0 |<br />
Udklip.pkt| 238334.6 | 19906.3 | 25361.9 | 73924.3 | 40744.7 | 78397.3 | 0.0 |<br />
Udkl. i % | 36.05 | 22.28 | 54.46 | 23.41 | 40.09 | 38.37 | -0- |<br />
Offset gns. 1.78 1.45 2.34 1.46 1.64 2.35 -0-<br />
Min | -9.07 | -2.74 | -9.07 | -2.50 | -8.80 | -8.70 | 0 |<br />
Max | 16.13 | 3.33 | 13.05 | 2.86 | 10.09 | 16.13 | 0 |<br />
Gns | -0.00 | -0.00 | -0.00 | 0.00 | -0.00 | -0.00 | 0 |<br />
Stnd | 1.97 | 0.47 | 3.50 | 0.53 | 1.16 | 3.07 | 0 |<br />
Sprd | 1.97 | 0.47 | 3.50 | 0.53 | 1.16 | 3.07 | 0 |<br />
Udklippet<br />
Min | -0.27 | -0.18 | 1.70 | -0.27 | -0.12 | 0.59 | 0 |<br />
Max | 4.07 | 3.16 | 2.83 | 3.13 | 3.38 | 4.07 | 0 |<br />
Gns | 1.52 | 1.44 | 2.23 | 1.45 | 1.62 | 1.51 | 0 |<br />
Stnd | 0.52 | 0.42 | 0.24 | 0.47 | 0.56 | 0.68 | 0 |<br />
Sprd | 1.61 | 1.50 | 2.25 | 1.53 | 1.71 | 1.66 | 0 |<br />
Udklippet + Offset<br />
Min | - | -1.63 | -0.53 | -1.72 | -1.73 | -0.92 | 0 |<br />
Max | - | 1.72 | 0.60 | 1.68 | 1.77 | 2.56 | 0 |<br />
Gns | - | -0.00 | 0.00 | 0.00 | -0.00 | 0.00 | 0 |<br />
Stnd | - | 0.42 | 0.24 | 0.47 | 0.56 | 0.68 | 0 |<br />
Sprd | - | 0.42 | 0.24 | 0.47 | 0.56 | 0.68 | 0 |<br />
Analysefilen for 1:25,000, opløsningen 15 μm og maskestørrelsen 25 m. efter iterationsprocessen.<br />
255
Analysis calculations<br />
700<br />
600<br />
500<br />
400<br />
300<br />
200<br />
100<br />
Fordelingen af afvigelser for 1:25.000, 30 μm, 12,5 m.<br />
Afvigelser Normalfordeling<br />
0<br />
-13 -12 -11 -9.8 -8.8 -7.8 -6.8 -5.8 -4.8 -3.8 -2.8 -1.8 -0.8 0.2 1.2 2.2 3.2 4.2 5.2 6.2 7.2 8.2 9.2 10.2 11.2 12.2 13.2 14.2 15.2<br />
| Total |Fladt A 12|Grusgrav 34|Landsby 56|Bakket A 78|Skov 90|Ukendt 00|<br />
Min | -12.77 | -0.65 | -4.61 | -0.69 | -12.77 | -1.03 | 0 |<br />
Max | 16.12 | 4.43 | 12.98 | 5.10 | 7.95 | 16.12 | 0 |<br />
Gns | 1.70 | 1.40 | 1.59 | 1.76 | 1.65 | 2.79 | 0 |<br />
Stnd | 1.46 | 0.52 | 1.92 | 0.71 | 1.12 | 2.77 | 0 |<br />
Sprd | 2.25 | 1.50 | 2.49 | 1.90 | 2.00 | 3.93 | 0 |<br />
Antal | 8929 | 2087 | 1802 | 1392 | 2805 | 843 | 0 |<br />
Niv'200.0'| 8929 | 2087 | 1802 | 1392 | 2805 | 843 | 0 |<br />
Niv'400.0'| 0 | 0 | 0 | 0 | 0 | 0 | 0 |<br />
Niv'600.0'| 0 | 0 | 0 | 0 | 0 | 0 | 0 |<br />
Udklip.pkt| 0 | 0 | 0 | 0 | 0 | 0 | 0 |<br />
Areal | 52611.6 | 721.7 | 45759.7 | 1261.2 | 0.0 | 4868.9 | 0.0 |<br />
Niv'200.0'| 52611.6 | 721.7 | 45759.7 | 1261.2 | 0.0 | 4868.9 | 0.0 |<br />
Niv'400.0'| 0.0 | 0.0 | 0.0 | 0.0 | 0.0 | 0.0 | 0.0 |<br />
Niv'600.0'| 0.0 | 0.0 | 0.0 | 0.0 | 0.0 | 0.0 | 0.0 |<br />
Udklip.pkt| 0.0 | 0.0 | 0.0 | 0.0 | 0.0 | 0.0 | 0.0 |<br />
Udkl. i % | 0.00 | 0.00 | 0.00 | 0.00 | 0.00 | 0.00 | -0- |<br />
Offset gns. 1.70 1.40 1.59 1.76 1.65 2.79 -0-<br />
Min | -14.42 | -2.05 | -6.19 | -2.45 | -14.42 | -3.83 | 0 |<br />
Max | 13.32 | 3.02 | 11.39 | 3.34 | 6.30 | 13.32 | 0 |<br />
Gns | -0.00 | -0.00 | 0.00 | 0.00 | -0.00 | -0.00 | 0 |<br />
Stnd | 1.42 | 0.52 | 1.92 | 0.71 | 1.12 | 2.77 | 0 |<br />
Sprd | 1.42 | 0.52 | 1.92 | 0.71 | 1.12 | 2.77 | 0 |<br />
Udklippet<br />
Min | -12.77 | -0.65 | -4.61 | -0.69 | -12.77 | -1.03 | 0 |<br />
Max | 16.12 | 4.43 | 12.98 | 5.10 | 7.95 | 16.12 | 0 |<br />
Gns | 1.70 | 1.40 | 1.59 | 1.76 | 1.65 | 2.79 | 0 |<br />
Stnd | 1.46 | 0.52 | 1.92 | 0.71 | 1.12 | 2.77 | 0 |<br />
Sprd | 2.25 | 1.50 | 2.49 | 1.90 | 2.00 | 3.93 | 0 |<br />
Udklippet + Offset<br />
Min | - | -2.05 | -6.19 | -2.45 | -14.42 | -3.83 | 0 |<br />
Max | - | 3.02 | 11.39 | 3.34 | 6.30 | 13.32 | 0 |<br />
Gns | - | -0.00 | 0.00 | 0.00 | -0.00 | -0.00 | 0 |<br />
Stnd | - | 0.52 | 1.92 | 0.71 | 1.12 | 2.77 | 0 |<br />
Sprd | - | 0.52 | 1.92 | 0.71 | 1.12 | 2.77 | 0 |<br />
Analysefilen for 1:25,000, opløsningen 30 μm og maskestørrelsen 12.5 m. før iterationsprocessen.
700<br />
600<br />
500<br />
400<br />
300<br />
200<br />
100<br />
I.1 Analysis calculations<br />
Fordelingen af afvigelser efter eliminering af grove fejl 1:25.000, 30 μm, 12,5 m.<br />
Afvigelser Normalfordeling<br />
0<br />
-2.2 -2 -1.8 -1.6 -1.4 -1.2 -1 -0.8 -0.6 -0.4 -0.2 0 0.2 0.4 0.6 0.8 1 1.2 1.4 1.6 1.8 2<br />
| Total |Fladt A 12|Grusgrav 34|Landsby 56|Bakket A 78|Skov 90|Ukendt 00|<br />
Min | -12.77 | -0.65 | -4.61 | -0.69 | -12.77 | -1.03 | 0 |<br />
Max | 16.12 | 4.43 | 12.98 | 5.10 | 7.95 | 16.12 | 0 |<br />
Gns | 1.70 | 1.40 | 1.59 | 1.76 | 1.65 | 2.79 | 0 |<br />
Stnd | 1.46 | 0.52 | 1.92 | 0.71 | 1.12 | 2.77 | 0 |<br />
Sprd | 2.25 | 1.50 | 2.49 | 1.90 | 2.00 | 3.93 | 0 |<br />
Antal | 8929 | 2087 | 1802 | 1392 | 2805 | 843 | 0 |<br />
Niv'0.7' | 919 | 173 | 403 | 68 | 199 | 76 | 0 |<br />
Niv'1.4' | 2766 | 992 | 393 | 408 | 741 | 232 | 0 |<br />
Niv'2.2' | 3309 | 772 | 454 | 571 | 1293 | 219 | 0 |<br />
Udklip.pkt| 1935 | 150 | 552 | 345 | 572 | 316 | 0 |<br />
Areal | 52611.6 | 721.7 | 45759.7 | 1261.2 | 0.0 | 4868.9 | 0.0 |<br />
Niv'0.7' | 11225.6 | 0.0 | 10161.0 | 544.9 | 0.0 | 519.8 | 0.0 |<br />
Niv'1.4' | 11205.0 | 200.8 | 9955.2 | 342.9 | 0.0 | 706.1 | 0.0 |<br />
Niv'2.2' | 12469.8 | 90.8 | 11409.3 | 138.2 | 0.0 | 831.5 | 0.0 |<br />
Udklip.pkt| 17711.1 | 430.0 | 14234.2 | 235.3 | 0.0 | 2811.6 | 0.0 |<br />
Udkl. i % | 21.67 | 7.19 | 30.63 | 24.78 | 20.39 | 37.49 | -0- |<br />
Offset gns. 1.70 1.40 1.59 1.76 1.65 2.79 -0-<br />
Min | -14.42 | -2.05 | -6.19 | -2.45 | -14.42 | -3.83 | 0 |<br />
Max | 13.32 | 3.02 | 11.39 | 3.34 | 6.30 | 13.32 | 0 |<br />
Gns | -0.00 | -0.00 | 0.00 | 0.00 | -0.00 | -0.00 | 0 |<br />
Stnd | 1.42 | 0.52 | 1.92 | 0.71 | 1.12 | 2.77 | 0 |<br />
Sprd | 1.42 | 0.52 | 1.92 | 0.71 | 1.12 | 2.77 | 0 |<br />
Udklippet<br />
Min | -0.65 | -0.65 | -0.58 | -0.36 | -0.52 | 0.63 | 0 |<br />
Max | 4.95 | 3.54 | 3.74 | 3.88 | 3.80 | 4.95 | 0 |<br />
Gns | 1.61 | 1.39 | 1.57 | 1.73 | 1.66 | 1.89 | 0 |<br />
Stnd | 0.70 | 0.50 | 0.90 | 0.65 | 0.66 | 0.94 | 0 |<br />
Sprd | 1.75 | 1.48 | 1.81 | 1.85 | 1.78 | 2.12 | 0 |<br />
Udklippet + Offset<br />
Min | - | -2.04 | -2.14 | -2.10 | -2.18 | -1.27 | 0 |<br />
Max | - | 2.15 | 2.17 | 2.14 | 2.14 | 3.06 | 0 |<br />
Gns | - | 0.00 | -0.00 | 0.00 | -0.00 | 0.00 | 0 |<br />
Stnd | - | 0.50 | 0.90 | 0.65 | 0.66 | 0.94 | 0 |<br />
Sprd | - | 0.50 | 0.90 | 0.65 | 0.66 | 0.94 | 0 |<br />
Analysefilen for 1:25,000, opløsningen 30 μm og maskestørrelsen 12.5 m. efter iterationsprocessen.<br />
257
Analysis calculations<br />
700<br />
600<br />
500<br />
400<br />
300<br />
200<br />
100<br />
Fordelingen af afvigelser for 1:25.000, 30 μm, 25 m.<br />
Afvigelser Normalfordeling<br />
0<br />
-6.2 -5.3 -4.4 -3.5 -2.6 -1.7 -0.8 0.1 1 1.9 2.8 3.7 4.6 5.5 6.4 7.3 8.2 9.1 10 10.9 11.8 12.7 13.6 14.5 15.4 16.3 17.2 18.1 19<br />
| Total |Fladt A 12|Grusgrav 34|Landsby 56|Bakket A 78|Skov 90|Ukendt 00|<br />
Min | -6.13 | -0.14 | -6.13 | -2.30 | -5.52 | -4.33 | 0 |<br />
Max | 19.42 | 4.11 | 19.42 | 4.56 | 6.50 | 17.51 | 0 |<br />
Gns | 1.97 | 1.41 | 2.89 | 1.66 | 1.70 | 2.81 | 0 |<br />
Stnd | 2.37 | 0.49 | 4.39 | 0.72 | 0.91 | 3.24 | 0 |<br />
Sprd | 3.08 | 1.49 | 5.26 | 1.81 | 1.93 | 4.29 | 0 |<br />
Antal | 8956 | 2092 | 1805 | 1401 | 2811 | 847 | 0 |<br />
Niv'0.8' | 983 | 177 | 332 | 116 | 232 | 126 | 0 |<br />
Niv'1.6' | 3118 | 1168 | 301 | 466 | 931 | 252 | 0 |<br />
Niv'2.3' | 3007 | 682 | 332 | 624 | 1166 | 203 | 0 |<br />
Udklip.pkt| 1848 | 65 | 840 | 195 | 482 | 266 | 0 |<br />
Areal | 645893.3 | 72222.3 | 47670.5 | 262049.5 | 95868.7 | 168082.3 | 0.0 |<br />
Niv'0.8' | 52064.4 | 2797.9 | 9775.5 | 16109.8 | 6610.4 | 16770.8 | 0.0 |<br />
Niv'1.6' | 187048.7 | 36341.5 | 7733.0 | 67952.2 | 35422.0 | 39600.1 | 0.0 |<br />
Niv'2.3' | 254480.3 | 28912.1 | 8614.2 | 132124.7 | 39997.8 | 44831.5 | 0.0 |<br />
Udklip.pkt| 152300.0 | 4170.9 | 21547.8 | 45862.9 | 13838.5 | 66879.9 | 0.0 |<br />
Udkl. i % | 20.63 | 3.11 | 46.54 | 13.92 | 17.15 | 31.40 | -0- |<br />
Offset gns. 1.97 1.41 2.89 1.66 1.70 2.81 -0-<br />
Min | -9.02 | -1.55 | -9.02 | -3.97 | -7.22 | -7.14 | 0 |<br />
Max | 16.53 | 2.70 | 16.53 | 2.90 | 4.80 | 14.70 | 0 |<br />
Gns | -0.00 | -0.00 | -0.00 | 0.00 | 0.00 | 0.00 | 0 |<br />
Stnd | 2.30 | 0.49 | 4.39 | 0.72 | 0.91 | 3.24 | 0 |<br />
Sprd | 2.30 | 0.49 | 4.39 | 0.72 | 0.91 | 3.24 | 0 |<br />
Udklippet<br />
Min | -0.63 | -0.14 | 0.70 | -0.49 | -0.63 | 0.47 | 0 |<br />
Max | 4.87 | 3.59 | 3.69 | 3.93 | 3.96 | 4.87 | 0 |<br />
Gns | 1.62 | 1.41 | 2.63 | 1.69 | 1.71 | 1.72 | 0 |<br />
Stnd | 0.67 | 0.48 | 0.53 | 0.65 | 0.70 | 0.87 | 0 |<br />
Sprd | 1.75 | 1.49 | 2.68 | 1.82 | 1.85 | 1.93 | 0 |<br />
Udklippet + Offset<br />
Min | - | -1.54 | -1.93 | -2.18 | -2.33 | -1.25 | 0 |<br />
Max | - | 2.18 | 1.06 | 2.24 | 2.25 | 3.15 | 0 |<br />
Gns | - | -0.00 | -0.00 | 0.00 | 0.00 | 0.00 | 0 |<br />
Stnd | - | 0.48 | 0.53 | 0.65 | 0.70 | 0.87 | 0 |<br />
Sprd | - | 0.48 | 0.53 | 0.65 | 0.70 | 0.87 | 0 |<br />
Analysefilen for 1:25,000, opløsningen 30 μm og maskestørrelsen 25 m. før iterationsprocessen.
700<br />
600<br />
500<br />
400<br />
300<br />
200<br />
100<br />
I.1 Analysis calculations<br />
Fordelingen af afvigelser efter eliminering af grove fejl 1:25.000, 30 μm, 25 m.<br />
Afvigelser Normalfordeling<br />
0<br />
-2.4 -2.2 -2 -1.8 -1.6 -1.4 -1.2 -1 -0.8 -0.6 -0.4 -0.2 0 0.2 0.4 0.6 0.8 1 1.2 1.4 1.6 1.8 2 2.2<br />
| Total |Fladt A 12|Grusgrav 34|Landsby 56|Bakket A 78|Skov 90|Ukendt 00|<br />
Min | -6.13 | -0.14 | -6.13 | -2.30 | -5.52 | -4.33 | 0 |<br />
Max | 19.42 | 4.11 | 19.42 | 4.56 | 6.50 | 17.51 | 0 |<br />
Gns | 1.97 | 1.41 | 2.89 | 1.66 | 1.70 | 2.81 | 0 |<br />
Stnd | 2.37 | 0.49 | 4.39 | 0.72 | 0.91 | 3.24 | 0 |<br />
Sprd | 3.08 | 1.49 | 5.26 | 1.81 | 1.93 | 4.29 | 0 |<br />
Antal | 8956 | 2092 | 1805 | 1401 | 2811 | 847 | 0 |<br />
Niv'0.8' | 983 | 177 | 332 | 116 | 232 | 126 | 0 |<br />
Niv'1.6' | 3118 | 1168 | 301 | 466 | 931 | 252 | 0 |<br />
Niv'2.3' | 3007 | 682 | 332 | 624 | 1166 | 203 | 0 |<br />
Udklip.pkt| 1848 | 65 | 840 | 195 | 482 | 266 | 0 |<br />
Areal | 645893.3 | 72222.3 | 47670.5 | 262049.5 | 95868.7 | 168082.3 | 0.0 |<br />
Niv'0.8' | 52064.4 | 2797.9 | 9775.5 | 16109.8 | 6610.4 | 16770.8 | 0.0 |<br />
Niv'1.6' | 187048.7 | 36341.5 | 7733.0 | 67952.2 | 35422.0 | 39600.1 | 0.0 |<br />
Niv'2.3' | 254480.3 | 28912.1 | 8614.2 | 132124.7 | 39997.8 | 44831.5 | 0.0 |<br />
Udklip.pkt| 152300.0 | 4170.9 | 21547.8 | 45862.9 | 13838.5 | 66879.9 | 0.0 |<br />
Udkl. i % | 20.63 | 3.11 | 46.54 | 13.92 | 17.15 | 31.40 | -0- |<br />
Offset gns. 1.97 1.41 2.89 1.66 1.70 2.81 -0-<br />
Min | -9.02 | -1.55 | -9.02 | -3.97 | -7.22 | -7.14 | 0 |<br />
Max | 16.53 | 2.70 | 16.53 | 2.90 | 4.80 | 14.70 | 0 |<br />
Gns | -0.00 | -0.00 | -0.00 | 0.00 | 0.00 | 0.00 | 0 |<br />
Stnd | 2.30 | 0.49 | 4.39 | 0.72 | 0.91 | 3.24 | 0 |<br />
Sprd | 2.30 | 0.49 | 4.39 | 0.72 | 0.91 | 3.24 | 0 |<br />
Udklippet<br />
Min | -0.63 | -0.14 | 0.70 | -0.49 | -0.63 | 0.47 | 0 |<br />
Max | 4.87 | 3.59 | 3.69 | 3.93 | 3.96 | 4.87 | 0 |<br />
Gns | 1.62 | 1.41 | 2.63 | 1.69 | 1.71 | 1.72 | 0 |<br />
Stnd | 0.67 | 0.48 | 0.53 | 0.65 | 0.70 | 0.87 | 0 |<br />
Sprd | 1.75 | 1.49 | 2.68 | 1.82 | 1.85 | 1.93 | 0 |<br />
Udklippet + Offset<br />
Min | - | -1.54 | -1.93 | -2.18 | -2.33 | -1.25 | 0 |<br />
Max | - | 2.18 | 1.06 | 2.24 | 2.25 | 3.15 | 0 |<br />
Gns | - | -0.00 | -0.00 | 0.00 | 0.00 | 0.00 | 0 |<br />
Stnd | - | 0.48 | 0.53 | 0.65 | 0.70 | 0.87 | 0 |<br />
Sprd | - | 0.48 | 0.53 | 0.65 | 0.70 | 0.87 | 0 |<br />
Analysefilen for 1:25,000, opløsningen 30 μm og maskestørrelsen 25 m. efter iterationsprocessen.<br />
259
Analysis calculations<br />
450<br />
400<br />
350<br />
300<br />
250<br />
200<br />
150<br />
100<br />
50<br />
Fordelingen af afvigelser for 1:25.000, 60 μm, 12,5 m.<br />
Afvigelser Normalfordeling<br />
0<br />
-5.3 -4.6 -3.9 -3.2 -2.5 -1.8 -1.1 -0.4 0.3 1 1.7 2.4 3.1 3.8 4.5 5.2 5.9 6.6 7.3 8 8.7 9.4 10.1 10.8 11.5 12.2 12.9 13.6 14.3<br />
| Total |Fladt A 12|Grusgrav 34|Landsby 56|Bakket A 78|Skov 90|Ukendt 00|<br />
Min | -5.22 | -1.57 | -5.22 | -2.49 | -3.65 | -3.16 | 0 |<br />
Max | 14.55 | 4.03 | 11.30 | 5.32 | 5.63 | 14.55 | 0 |<br />
Gns | 1.83 | 1.67 | 1.41 | 1.99 | 1.72 | 3.17 | 0 |<br />
Stnd | 1.56 | 0.64 | 2.34 | 0.94 | 1.03 | 2.36 | 0 |<br />
Sprd | 2.40 | 1.79 | 2.74 | 2.20 | 2.01 | 3.95 | 0 |<br />
Antal | 8929 | 2087 | 1802 | 1392 | 2805 | 843 | 0 |<br />
Niv'200.0'| 8929 | 2087 | 1802 | 1392 | 2805 | 843 | 0 |<br />
Niv'400.0'| 0 | 0 | 0 | 0 | 0 | 0 | 0 |<br />
Niv'600.0'| 0 | 0 | 0 | 0 | 0 | 0 | 0 |<br />
Udklip.pkt| 0 | 0 | 0 | 0 | 0 | 0 | 0 |<br />
Areal | 52611.6 | 721.7 | 45759.7 | 1261.2 | 0.0 | 4868.9 | 0.0 |<br />
Niv'200.0'| 52611.6 | 721.7 | 45759.7 | 1261.2 | 0.0 | 4868.9 | 0.0 |<br />
Niv'400.0'| 0.0 | 0.0 | 0.0 | 0.0 | 0.0 | 0.0 | 0.0 |<br />
Niv'600.0'| 0.0 | 0.0 | 0.0 | 0.0 | 0.0 | 0.0 | 0.0 |<br />
Udklip.pkt| 0.0 | 0.0 | 0.0 | 0.0 | 0.0 | 0.0 | 0.0 |<br />
Udkl. i % | 0.00 | 0.00 | 0.00 | 0.00 | 0.00 | 0.00 | -0- |<br />
Offset gns. 1.83 1.67 1.41 1.99 1.72 3.17 -0-<br />
Min | -6.63 | -3.24 | -6.63 | -4.48 | -5.37 | -6.34 | 0 |<br />
Max | 11.38 | 2.36 | 9.88 | 3.33 | 3.91 | 11.38 | 0 |<br />
Gns | 0.00 | 0.00 | 0.00 | -0.00 | -0.00 | 0.00 | 0 |<br />
Stnd | 1.48 | 0.64 | 2.34 | 0.94 | 1.03 | 2.36 | 0 |<br />
Sprd | 1.48 | 0.64 | 2.34 | 0.94 | 1.03 | 2.36 | 0 |<br />
Udklippet<br />
Min | -5.22 | -1.57 | -5.22 | -2.49 | -3.65 | -3.16 | 0 |<br />
Max | 14.55 | 4.03 | 11.30 | 5.32 | 5.63 | 14.55 | 0 |<br />
Gns | 1.83 | 1.67 | 1.41 | 1.99 | 1.72 | 3.17 | 0 |<br />
Stnd | 1.56 | 0.64 | 2.34 | 0.94 | 1.03 | 2.36 | 0 |<br />
Sprd | 2.40 | 1.79 | 2.74 | 2.20 | 2.01 | 3.95 | 0 |<br />
Udklippet + Offset<br />
Min | - | -3.24 | -6.63 | -4.48 | -5.37 | -6.34 | 0 |<br />
Max | - | 2.36 | 9.88 | 3.33 | 3.91 | 11.38 | 0 |<br />
Gns | - | 0.00 | 0.00 | -0.00 | -0.00 | 0.00 | 0 |<br />
Stnd | - | 0.64 | 2.34 | 0.94 | 1.03 | 2.36 | 0 |<br />
Sprd | - | 0.64 | 2.34 | 0.94 | 1.03 | 2.36 | 0 |<br />
Analysefilen for 1:25,000, opløsningen 60 μm og maskestørrelsen 12.5 m. før iterationsprocessen.
450<br />
400<br />
350<br />
300<br />
250<br />
200<br />
150<br />
100<br />
50<br />
I.1 Analysis calculations<br />
Fordelingen af afvigelser efter eliminering af grove fejl 1:25.000, 60 μm, 12,5 m.<br />
Afvigelser Normalfordeling<br />
0<br />
-3.2 -3 -2.8 -2.6 -2.4 -2.2 -2 -1.8 -1.6 -1.4 -1.2 -1 -0.8 -0.6 -0.4 -0.2 0 0.2 0.4 0.6 0.8 1 1.2 1.4 1.6 1.8 2 2.2 2.4 2.6 2.8 3<br />
| Total |Fladt A 12|Grusgrav 34|Landsby 56|Bakket A 78|Skov 90|Ukendt 00|<br />
Min | -5.22 | -1.57 | -5.22 | -2.49 | -3.65 | -3.16 | 0 |<br />
Max | 14.55 | 4.03 | 11.30 | 5.32 | 5.63 | 14.55 | 0 |<br />
Gns | 1.83 | 1.67 | 1.41 | 1.99 | 1.72 | 3.17 | 0 |<br />
Stnd | 1.56 | 0.64 | 2.34 | 0.94 | 1.03 | 2.36 | 0 |<br />
Sprd | 2.40 | 1.79 | 2.74 | 2.20 | 2.01 | 3.95 | 0 |<br />
Antal | 8929 | 2087 | 1802 | 1392 | 2805 | 843 | 0 |<br />
Niv'1.1' | 1698 | 304 | 543 | 163 | 591 | 97 | 0 |<br />
Niv'2.1' | 3913 | 1351 | 470 | 597 | 1265 | 230 | 0 |<br />
Niv'3.2' | 2275 | 389 | 405 | 525 | 749 | 207 | 0 |<br />
Udklip.pkt| 1043 | 43 | 384 | 107 | 200 | 309 | 0 |<br />
Areal | 52611.6 | 721.7 | 45759.7 | 1261.2 | 0.0 | 4868.9 | 0.0 |<br />
Niv'1.1' | 14702.7 | 0.0 | 13713.8 | 490.6 | 0.0 | 498.2 | 0.0 |<br />
Niv'2.1' | 12969.0 | 401.7 | 11833.6 | 325.0 | 0.0 | 408.7 | 0.0 |<br />
Niv'3.2' | 11401.8 | 100.0 | 10497.9 | 348.5 | 0.0 | 455.4 | 0.0 |<br />
Udklip.pkt| 13538.2 | 220.0 | 9714.4 | 97.1 | 0.0 | 3506.6 | 0.0 |<br />
Udkl. i % | 11.68 | 2.06 | 21.31 | 7.69 | 7.13 | 36.65 | -0- |<br />
Offset gns. 1.83 1.67 1.41 1.99 1.72 3.17 -0-<br />
Min | -6.63 | -3.24 | -6.63 | -4.48 | -5.37 | -6.34 | 0 |<br />
Max | 11.38 | 2.36 | 9.88 | 3.33 | 3.91 | 11.38 | 0 |<br />
Gns | 0.00 | 0.00 | 0.00 | -0.00 | -0.00 | 0.00 | 0 |<br />
Stnd | 1.48 | 0.64 | 2.34 | 0.94 | 1.03 | 2.36 | 0 |<br />
Sprd | 1.48 | 0.64 | 2.34 | 0.94 | 1.03 | 2.36 | 0 |<br />
Udklippet<br />
Min | -1.73 | -1.41 | -1.73 | -1.18 | -1.40 | -0.01 | 0 |<br />
Max | 6.28 | 4.03 | 4.49 | 5.15 | 4.84 | 6.28 | 0 |<br />
Gns | 1.83 | 1.67 | 1.50 | 2.02 | 1.74 | 2.61 | 0 |<br />
Stnd | 1.04 | 0.63 | 1.45 | 0.86 | 0.97 | 1.41 | 0 |<br />
Sprd | 2.10 | 1.79 | 2.08 | 2.20 | 1.99 | 2.96 | 0 |<br />
Udklippet + Offset<br />
Min | - | -3.08 | -3.22 | -3.20 | -3.14 | -2.62 | 0 |<br />
Max | - | 2.36 | 3.00 | 3.13 | 3.10 | 3.68 | 0 |<br />
Gns | - | 0.00 | 0.00 | 0.00 | -0.00 | -0.00 | 0 |<br />
Stnd | - | 0.63 | 1.45 | 0.86 | 0.97 | 1.41 | 0 |<br />
Sprd | - | 0.63 | 1.45 | 0.86 | 0.97 | 1.41 | 0 |<br />
Analysefilen for 1:25,000, opløsningen 60 μm og maskestørrelsen 12.5 m. efter iterationsprocessen.<br />
261
Analysis calculations<br />
500<br />
450<br />
400<br />
350<br />
300<br />
250<br />
200<br />
150<br />
100<br />
50<br />
Fordelingen af afvigelser for 1:25.000, 60μm, 25 m.<br />
Afvigelser Normalfordeling<br />
0<br />
-7.2 -6.4 -5.6 -4.8 -4 -3.2 -2.4 -1.6 -0.8 0 0.8 1.6 2.4 3.2 4 4.8 5.6 6.4 7.2 8 8.8 9.6 10.4 11.2 12 12.8 13.6 14.4 15.2<br />
| Total |Fladt A 12|Grusgrav 34|Landsby 56|Bakket A 78|Skov 90|Ukendt 00|<br />
Min | -7.13 | -1.29 | -5.28 | -1.47 | -7.13 | -3.05 | 0 |<br />
Max | 15.64 | 4.34 | 15.64 | 4.81 | 5.60 | 14.63 | 0 |<br />
Gns | 1.98 | 1.66 | 2.42 | 1.97 | 1.64 | 2.93 | 0 |<br />
Stnd | 2.00 | 0.55 | 3.65 | 0.90 | 1.07 | 2.48 | 0 |<br />
Sprd | 2.82 | 1.75 | 4.38 | 2.16 | 1.96 | 3.84 | 0 |<br />
Antal | 9041 | 2092 | 1805 | 1435 | 2811 | 898 | 0 |<br />
Niv'200.0'| 9041 | 2092 | 1805 | 1435 | 2811 | 898 | 0 |<br />
Niv'400.0'| 0 | 0 | 0 | 0 | 0 | 0 | 0 |<br />
Niv'600.0'| 0 | 0 | 0 | 0 | 0 | 0 | 0 |<br />
Udklip.pkt| 0 | 0 | 0 | 0 | 0 | 0 | 0 |<br />
Areal | 667180.5 | 72222.3 | 47670.5 | 272829.8 | 95868.7 | 178589.3 | 0.0 |<br />
Niv'200.0'| 667180.5 | 72222.3 | 47670.5 | 272829.8 | 95868.7 | 178589.3 | 0.0 |<br />
Niv'400.0'| 0.0 | 0.0 | 0.0 | 0.0 | 0.0 | 0.0 | 0.0 |<br />
Niv'600.0'| 0.0 | 0.0 | 0.0 | 0.0 | 0.0 | 0.0 | 0.0 |<br />
Udklip.pkt| 0.0 | 0.0 | 0.0 | 0.0 | 0.0 | 0.0 | 0.0 |<br />
Udkl. i % | 0.00 | 0.00 | 0.00 | 0.00 | 0.00 | 0.00 | -0- |<br />
Offset gns. 1.98 1.66 2.42 1.97 1.64 2.93 -0-<br />
Min | -8.77 | -2.95 | -7.69 | -3.44 | -8.77 | -5.98 | 0 |<br />
Max | 13.22 | 2.68 | 13.22 | 2.85 | 3.95 | 11.70 | 0 |<br />
Gns | 0.00 | 0.00 | -0.00 | 0.00 | 0.00 | 0.00 | 0 |<br />
Stnd | 1.95 | 0.55 | 3.65 | 0.90 | 1.07 | 2.48 | 0 |<br />
Sprd | 1.95 | 0.55 | 3.65 | 0.90 | 1.07 | 2.48 | 0 |<br />
Udklippet<br />
Min | -7.13 | -1.29 | -5.28 | -1.47 | -7.13 | -3.05 | 0 |<br />
Max | 15.64 | 4.34 | 15.64 | 4.81 | 5.60 | 14.63 | 0 |<br />
Gns | 1.98 | 1.66 | 2.42 | 1.97 | 1.64 | 2.93 | 0 |<br />
Stnd | 2.00 | 0.55 | 3.65 | 0.90 | 1.07 | 2.48 | 0 |<br />
Sprd | 2.82 | 1.75 | 4.38 | 2.16 | 1.96 | 3.84 | 0 |<br />
Udklippet + Offset<br />
Min | - | -2.95 | -7.69 | -3.44 | -8.77 | -5.98 | 0 |<br />
Max | - | 2.68 | 13.22 | 2.85 | 3.95 | 11.70 | 0 |<br />
Gns | - | 0.00 | -0.00 | 0.00 | 0.00 | 0.00 | 0 |<br />
Stnd | - | 0.55 | 3.65 | 0.90 | 1.07 | 2.48 | 0 |<br />
Sprd | - | 0.55 | 3.65 | 0.90 | 1.07 | 2.48 | 0 |<br />
Analysefilen for 1:25,000, opløsningen 60 μm og maskestørrelsen 25 m. før iterationsprocessen.
500<br />
450<br />
400<br />
350<br />
300<br />
250<br />
200<br />
150<br />
100<br />
50<br />
I.1 Analysis calculations<br />
Fordelingen af afvigelser efter eliminering af grove fejl 1:25.000, 60 μm, 25 m.<br />
Afvigelser Normalfordeling<br />
0<br />
-2.8 -2.6 -2.4 -2.2 -2 -1.8 -1.6 -1.4 -1.2 -1 -0.8 -0.6 -0.4 -0.2 0 0.2 0.4 0.6 0.8 1 1.2 1.4 1.6 1.8 2 2.2 2.4 2.6<br />
| Total |Fladt A 12|Grusgrav 34|Landsby 56|Bakket A 78|Skov 90|Ukendt 00|<br />
Min | -7.13 | -1.29 | -5.28 | -1.47 | -7.13 | -3.05 | 0 |<br />
Max | 15.64 | 4.34 | 15.64 | 4.81 | 5.60 | 14.63 | 0 |<br />
Gns | 1.98 | 1.68 | 2.42 | 1.95 | 1.67 | 2.89 | 0 |<br />
Stnd | 1.98 | 0.55 | 3.65 | 0.89 | 1.03 | 2.40 | 0 |<br />
Sprd | 2.80 | 1.76 | 4.38 | 2.14 | 1.96 | 3.76 | 0 |<br />
Antal | 8956 | 2092 | 1805 | 1401 | 2811 | 847 | 0 |<br />
Niv'0.9' | 1276 | 151 | 373 | 144 | 503 | 105 | 0 |<br />
Niv'1.9' | 3411 | 1274 | 406 | 425 | 1092 | 214 | 0 |<br />
Niv'2.8' | 2670 | 591 | 345 | 637 | 877 | 220 | 0 |<br />
Udklip.pkt| 1599 | 76 | 681 | 195 | 339 | 308 | 0 |<br />
Areal | 645893.3 | 72222.3 | 47670.5 | 262049.5 | 95868.7 | 168082.3 | 0.0 |<br />
Niv'0.9' | 73731.0 | 4320.7 | 10505.7 | 31187.2 | 16075.7 | 11641.6 | 0.0 |<br />
Niv'1.9' | 195446.0 | 41326.9 | 10661.9 | 73885.3 | 33358.0 | 36214.0 | 0.0 |<br />
Niv'2.8' | 228815.9 | 19630.4 | 8876.0 | 124250.7 | 31329.0 | 44729.8 | 0.0 |<br />
Udklip.pkt| 147900.4 | 6944.3 | 17626.9 | 32726.4 | 15105.9 | 75496.9 | 0.0 |<br />
Udkl. i % | 17.85 | 3.63 | 37.73 | 13.92 | 12.06 | 36.36 | -0- |<br />
Offset gns. 1.98 1.68 2.42 1.95 1.67 2.89 -0-<br />
Min | -8.80 | -2.96 | -7.69 | -3.42 | -8.80 | -5.95 | 0 |<br />
Max | 13.22 | 2.66 | 13.22 | 2.87 | 3.93 | 11.74 | 0 |<br />
Gns | -0.00 | -0.00 | -0.00 | 0.00 | -0.00 | 0.00 | 0 |<br />
Stnd | 1.94 | 0.55 | 3.65 | 0.89 | 1.03 | 2.40 | 0 |<br />
Sprd | 1.94 | 0.55 | 3.65 | 0.89 | 1.03 | 2.40 | 0 |<br />
Udklippet<br />
Min | -1.10 | -0.91 | 0.56 | -0.79 | -1.10 | 0.13 | 0 |<br />
Max | 5.64 | 4.34 | 4.44 | 4.70 | 4.44 | 5.64 | 0 |<br />
Gns | 1.81 | 1.68 | 2.60 | 1.98 | 1.71 | 2.18 | 0 |<br />
Stnd | 0.85 | 0.54 | 0.62 | 0.83 | 0.90 | 1.14 | 0 |<br />
Sprd | 1.99 | 1.76 | 2.67 | 2.14 | 1.93 | 2.46 | 0 |<br />
Udklippet + Offset<br />
Min | - | -2.59 | -2.04 | -2.76 | -2.81 | -2.05 | 0 |<br />
Max | - | 2.66 | 1.85 | 2.73 | 2.73 | 3.46 | 0 |<br />
Gns | - | -0.00 | -0.00 | 0.00 | -0.00 | -0.00 | 0 |<br />
Stnd | - | 0.54 | 0.62 | 0.83 | 0.90 | 1.14 | 0 |<br />
Sprd | - | 0.54 | 0.62 | 0.83 | 0.90 | 1.14 | 0 |<br />
Analysefilen for 1:25,000, opløsningen 60 μm og maskestørrelsen 25 m. efter iterationsprocessen.<br />
263
Analysis calculations<br />
1200<br />
1000<br />
800<br />
600<br />
400<br />
200<br />
0<br />
Fordelingen af afvigelser for 1:15.000,15 μm, 5 m.<br />
Afvigelser Normalfordeling<br />
-12 -11 -10 -8.9 -7.8 -6.7 -5.6 -4.5 -3.4 -2.3 -1.2 -0.1 1 2.1 3.2 4.3 5.4 6.5 7.6 8.7 9.8 10.9 12 13.1 14.2 15.3 16.4 17.5<br />
| Total |Fladt A 12|Grusgrav 34|Landsby 56|Bakket A 78|Skov 90|Ukendt 00|<br />
Min | -12.12 | -1.07 | -3.89 | -0.75 | -4.98 | -12.12 | 0 |<br />
Max | 18.34 | 1.53 | 9.25 | 2.98 | 11.95 | 18.34 | 0 |<br />
Gns | 0.89 | 0.54 | 0.79 | 0.65 | 1.00 | 1.60 | 0 |<br />
Stnd | 1.93 | 0.29 | 1.65 | 0.45 | 2.11 | 3.58 | 0 |<br />
Sprd | 2.12 | 0.61 | 1.83 | 0.79 | 2.34 | 3.92 | 0 |<br />
Antal | 8766 | 1980 | 1168 | 1611 | 2811 | 1196 | 0 |<br />
Niv'200.0'| 8766 | 1980 | 1168 | 1611 | 2811 | 1196 | 0 |<br />
Niv'400.0'| 0 | 0 | 0 | 0 | 0 | 0 | 0 |<br />
Niv'600.0'| 0 | 0 | 0 | 0 | 0 | 0 | 0 |<br />
Udklip.pkt| 0 | 0 | 0 | 0 | 0 | 0 | 0 |<br />
Areal | 202.0 | 0.0 | 107.3 | 0.0 | 0.0 | 94.6 | 0.0 |<br />
Niv'200.0'| 202.0 | 0.0 | 107.3 | 0.0 | 0.0 | 94.6 | 0.0 |<br />
Niv'400.0'| 0.0 | 0.0 | 0.0 | 0.0 | 0.0 | 0.0 | 0.0 |<br />
Niv'600.0'| 0.0 | 0.0 | 0.0 | 0.0 | 0.0 | 0.0 | 0.0 |<br />
Udklip.pkt| 0.0 | 0.0 | 0.0 | 0.0 | 0.0 | 0.0 | 0.0 |<br />
Udkl. i % | 0.00 | 0.00 | 0.00 | 0.00 | 0.00 | 0.00 | -0- |<br />
Offset gns. 0.89 0.54 0.79 0.65 1.00 1.60 -0-<br />
Min | -13.72 | -1.61 | -4.68 | -1.40 | -5.99 | -13.72 | 0 |<br />
Max | 16.74 | 0.99 | 8.47 | 2.33 | 10.94 | 16.74 | 0 |<br />
Gns | -0.00 | 0.00 | 0.00 | 0.00 | -0.00 | 0.00 | 0 |<br />
Stnd | 1.90 | 0.29 | 1.65 | 0.45 | 2.11 | 3.58 | 0 |<br />
Sprd | 1.90 | 0.29 | 1.65 | 0.45 | 2.11 | 3.58 | 0 |<br />
Udklippet<br />
Min | -12.12 | -1.07 | -3.89 | -0.75 | -4.98 | -12.12 | 0 |<br />
Max | 18.34 | 1.53 | 9.25 | 2.98 | 11.95 | 18.34 | 0 |<br />
Gns | 0.89 | 0.54 | 0.79 | 0.65 | 1.00 | 1.60 | 0 |<br />
Stnd | 1.93 | 0.29 | 1.65 | 0.45 | 2.11 | 3.58 | 0 |<br />
Sprd | 2.12 | 0.61 | 1.83 | 0.79 | 2.34 | 3.92 | 0 |<br />
Udklippet + Offset<br />
Min | - | -1.61 | -4.68 | -1.40 | -5.99 | -13.72 | 0 |<br />
Max | - | 0.99 | 8.47 | 2.33 | 10.94 | 16.74 | 0 |<br />
Gns | - | 0.00 | 0.00 | 0.00 | -0.00 | 0.00 | 0 |<br />
Stnd | - | 0.29 | 1.65 | 0.45 | 2.11 | 3.58 | 0 |<br />
Sprd | - | 0.29 | 1.65 | 0.45 | 2.11 | 3.58 | 0 |<br />
Analysefilen for 1:15,000, opløsningen 15 μm og maskestørrelsen 5 m. før iterationsprocessen.
1200<br />
1000<br />
800<br />
600<br />
400<br />
200<br />
0<br />
I.1 Analysis calculations<br />
Fordelingen af afvigelser efter eliminering af grove fejl 1:15.000, 15 μm, 5 m.<br />
Afvigelser Normalfordeling<br />
-1 -0.9 -0.8 -0.7 -0.6 -0.5 -0.4 -0.3 -0.2 -0.1 0 0.1 0.2 0.3 0.4 0.5 0.6 0.7 0.8 0.9<br />
| Total |Fladt A 12|Grusgrav 34|Landsby 56|Bakket A 78|Skov 90|Ukendt 00|<br />
Min | -12.12 | -1.07 | -3.89 | -0.75 | -4.98 | -12.12 | 0 |<br />
Max | 18.34 | 1.53 | 9.25 | 2.98 | 11.95 | 18.34 | 0 |<br />
Gns | 0.89 | 0.54 | 0.79 | 0.65 | 1.00 | 1.60 | 0 |<br />
Stnd | 1.93 | 0.29 | 1.65 | 0.45 | 2.11 | 3.58 | 0 |<br />
Sprd | 2.12 | 0.61 | 1.83 | 0.79 | 2.34 | 3.92 | 0 |<br />
Antal | 8766 | 1980 | 1168 | 1611 | 2811 | 1196 | 0 |<br />
Niv'0.3' | 2298 | 394 | 484 | 287 | 766 | 367 | 0 |<br />
Niv'0.6' | 3172 | 870 | 333 | 655 | 1090 | 224 | 0 |<br />
Niv'0.9' | 1758 | 579 | 122 | 421 | 544 | 92 | 0 |<br />
Udklip.pkt| 1538 | 137 | 229 | 248 | 411 | 513 | 0 |<br />
Areal | 202.0 | 0.0 | 107.3 | 0.0 | 0.0 | 94.6 | 0.0 |<br />
Niv'0.3' | 54.4 | 0.0 | 54.4 | 0.0 | 0.0 | 0.0 | 0.0 |<br />
Niv'0.6' | 33.5 | 0.0 | 14.8 | 0.0 | 0.0 | 18.7 | 0.0 |<br />
Niv'0.9' | 38.1 | 0.0 | 38.1 | 0.0 | 0.0 | 0.0 | 0.0 |<br />
Udklip.pkt| 75.9 | 0.0 | 0.0 | 0.0 | 0.0 | 75.9 | 0.0 |<br />
Udkl. i % | 17.55 | 6.92 | 19.61 | 15.39 | 14.62 | 42.89 | -0- |<br />
Offset gns. 0.89 0.54 0.79 0.65 1.00 1.60 -0-<br />
Min | -13.72 | -1.61 | -4.68 | -1.40 | -5.99 | -13.72 | 0 |<br />
Max | 16.74 | 0.99 | 8.47 | 2.33 | 10.94 | 16.74 | 0 |<br />
Gns | -0.00 | 0.00 | 0.00 | 0.00 | -0.00 | 0.00 | 0 |<br />
Stnd | 1.90 | 0.29 | 1.65 | 0.45 | 2.11 | 3.58 | 0 |<br />
Sprd | 1.90 | 0.29 | 1.65 | 0.45 | 2.11 | 3.58 | 0 |<br />
Udklippet<br />
Min | -0.39 | -0.39 | -0.16 | -0.25 | 0.06 | 0.65 | 0 |<br />
Max | 2.53 | 1.48 | 1.73 | 1.58 | 1.84 | 2.53 | 0 |<br />
Gns | 0.55 | 0.54 | 0.40 | 0.58 | 0.52 | 1.34 | 0 |<br />
Stnd | 0.35 | 0.28 | 0.36 | 0.31 | 0.28 | 0.53 | 0 |<br />
Sprd | 0.65 | 0.61 | 0.54 | 0.65 | 0.59 | 1.44 | 0 |<br />
Udklippet + Offset<br />
Min | - | -0.93 | -0.57 | -0.83 | -0.47 | -0.69 | 0 |<br />
Max | - | 0.94 | 1.33 | 1.00 | 1.32 | 1.19 | 0 |<br />
Gns | - | -0.00 | -0.00 | 0.00 | -0.00 | -0.00 | 0 |<br />
Stnd | - | 0.28 | 0.36 | 0.31 | 0.28 | 0.53 | 0 |<br />
Sprd | - | 0.28 | 0.36 | 0.31 | 0.28 | 0.53 | 0 |<br />
Analysefilen for 1:15,000, opløsningen 15 μm og maskestørrelsen 5 m. efter iterationsprocessen.<br />
265
Analysis calculations<br />
1100<br />
1000<br />
900<br />
800<br />
700<br />
600<br />
500<br />
400<br />
300<br />
200<br />
100<br />
Fordelingen af afvigelser for 1:15.000, 15 μm, 12,5 m.<br />
Afvigelser Normalfordeling<br />
0<br />
-11 -9.4 -8.2 -7 -5.8 -4.6 -3.4 -2.2 -1 0.2 1.4 2.6 3.8 5 6.2 7.4 8.6 9.8 11 12.2 13.4 14.6 15.8<br />
| Total |Fladt A 12|Grusgrav 34|Landsby 56|Bakket A 78|Skov 90|Ukendt 00|<br />
Min | -10.56 | -0.85 | -7.72 | -1.69 | -7.43 | -10.56 | 0 |<br />
Max | 16.69 | 1.85 | 13.31 | 3.36 | 12.68 | 16.69 | 0 |<br />
Gns | 0.75 | 0.54 | 1.12 | 0.56 | 0.52 | 1.38 | 0 |<br />
Stnd | 1.93 | 0.25 | 2.84 | 0.38 | 0.88 | 3.77 | 0 |<br />
Sprd | 2.07 | 0.59 | 3.05 | 0.68 | 1.02 | 4.02 | 0 |<br />
Antal | 9355 | 1975 | 1802 | 1592 | 2805 | 1181 | 0 |<br />
Niv'200.0'| 9355 | 1975 | 1802 | 1592 | 2805 | 1181 | 0 |<br />
Niv'400.0'| 0 | 0 | 0 | 0 | 0 | 0 | 0 |<br />
Niv'600.0'| 0 | 0 | 0 | 0 | 0 | 0 | 0 |<br />
Udklip.pkt| 0 | 0 | 0 | 0 | 0 | 0 | 0 |<br />
Areal | 57434.9 | 721.7 | 45759.7 | 1800.3 | 0.0 | 9153.1 | 0.0 |<br />
Niv'200.0'| 57434.9 | 721.7 | 45759.7 | 1800.3 | 0.0 | 9153.1 | 0.0 |<br />
Niv'400.0'| 0.0 | 0.0 | 0.0 | 0.0 | 0.0 | 0.0 | 0.0 |<br />
Niv'600.0'| 0.0 | 0.0 | 0.0 | 0.0 | 0.0 | 0.0 | 0.0 |<br />
Udklip.pkt| 0.0 | 0.0 | 0.0 | 0.0 | 0.0 | 0.0 | 0.0 |<br />
Udkl. i % | 0.00 | 0.00 | 0.00 | 0.00 | 0.00 | 0.00 | -0- |<br />
Offset gns. 0.75 0.54 1.12 0.56 0.52 1.38 -0-<br />
Min | -11.94 | -1.39 | -8.84 | -2.25 | -7.95 | -11.94 | 0 |<br />
Max | 15.31 | 1.32 | 12.20 | 2.80 | 12.16 | 15.31 | 0 |<br />
Gns | -0.00 | 0.00 | 0.00 | -0.00 | -0.00 | 0.00 | 0 |<br />
Stnd | 1.90 | 0.25 | 2.84 | 0.38 | 0.88 | 3.77 | 0 |<br />
Sprd | 1.90 | 0.25 | 2.84 | 0.38 | 0.88 | 3.77 | 0 |<br />
Udklippet<br />
Min | -10.56 | -0.85 | -7.72 | -1.69 | -7.43 | -10.56 | 0 |<br />
Max | 16.69 | 1.85 | 13.31 | 3.36 | 12.68 | 16.69 | 0 |<br />
Gns | 0.75 | 0.54 | 1.12 | 0.56 | 0.52 | 1.38 | 0 |<br />
Stnd | 1.94 | 0.25 | 2.84 | 0.38 | 0.88 | 3.77 | 0 |<br />
Sprd | 2.07 | 0.59 | 3.05 | 0.68 | 1.02 | 4.02 | 0 |<br />
Udklippet + Offset<br />
Min | - | -1.39 | -8.84 | -2.25 | -7.95 | -11.94 | 0 |<br />
Max | - | 1.32 | 12.20 | 2.80 | 12.16 | 15.31 | 0 |<br />
Gns | - | 0.00 | 0.00 | -0.00 | -0.00 | 0.00 | 0 |<br />
Stnd | - | 0.25 | 2.84 | 0.38 | 0.88 | 3.77 | 0 |<br />
Sprd | - | 0.25 | 2.84 | 0.38 | 0.88 | 3.77 | 0 |<br />
Analysefilen for 1:15,000, opløsningen 15 μm og maskestørrelsen 12.5 m. før iterationsprocessen.
1200<br />
1000<br />
800<br />
600<br />
400<br />
200<br />
0<br />
I.1 Analysis calculations<br />
Fordelingen af afvigelser efter eliminering af grove fejl1:15.000, 15μm, 12,5 m.<br />
Afvigelser Normalfordeling<br />
-1 -0.9 -0.8 -0.7 -0.6 -0.5 -0.4 -0.3 -0.2 -0.1 0 0.1 0.2 0.3 0.4 0.5 0.6 0.7 0.8 0.9<br />
| Total |Fladt A 12|Grusgrav 34|Landsby 56|Bakket A 78|Skov 90|Ukendt 00|<br />
Min | -10.56 | -0.85 | -7.72 | -1.69 | -7.43 | -10.56 | 0 |<br />
Max | 16.69 | 1.85 | 13.31 | 3.36 | 12.68 | 16.69 | 0 |<br />
Gns | 0.75 | 0.54 | 1.12 | 0.56 | 0.52 | 1.38 | 0 |<br />
Stnd | 1.93 | 0.25 | 2.84 | 0.38 | 0.88 | 3.77 | 0 |<br />
Sprd | 2.07 | 0.59 | 3.05 | 0.68 | 1.02 | 4.02 | 0 |<br />
Antal | 9355 | 1975 | 1802 | 1592 | 2805 | 1181 | 0 |<br />
Niv'0.3' | 2300 | 397 | 311 | 333 | 872 | 387 | 0 |<br />
Niv'0.6' | 2274 | 619 | 194 | 489 | 799 | 173 | 0 |<br />
Niv'1.0' | 3028 | 897 | 445 | 642 | 858 | 186 | 0 |<br />
Udklip.pkt| 1753 | 62 | 852 | 128 | 276 | 435 | 0 |<br />
Areal | 57434.9 | 721.7 | 45759.7 | 1800.3 | 0.0 | 9153.1 | 0.0 |<br />
Niv'0.3' | 9487.3 | 0.0 | 7918.7 | 544.9 | 0.0 | 1023.7 | 0.0 |<br />
Niv'0.6' | 6177.2 | 0.0 | 4898.2 | 487.7 | 0.0 | 791.3 | 0.0 |<br />
Niv'1.0' | 13825.3 | 520.8 | 11468.5 | 625.0 | 0.0 | 1211.0 | 0.0 |<br />
Udklip.pkt| 27945.1 | 200.8 | 21474.3 | 142.9 | 0.0 | 6127.1 | 0.0 |<br />
Udkl. i % | 18.74 | 3.14 | 47.28 | 8.04 | 9.84 | 36.83 | -0- |<br />
Offset gns. 0.75 0.54 1.12 0.56 0.52 1.38 -0-<br />
Min | -11.94 | -1.39 | -8.84 | -2.25 | -7.95 | -11.94 | 0 |<br />
Max | 15.31 | 1.32 | 12.20 | 2.80 | 12.16 | 15.31 | 0 |<br />
Gns | -0.00 | 0.00 | 0.00 | -0.00 | -0.00 | 0.00 | 0 |<br />
Stnd | 1.90 | 0.25 | 2.84 | 0.38 | 0.88 | 3.77 | 0 |<br />
Sprd | 1.90 | 0.25 | 2.84 | 0.38 | 0.88 | 3.77 | 0 |<br />
Udklippet<br />
Min | -0.45 | -0.40 | 0.20 | -0.39 | -0.45 | 0.40 | 0 |<br />
Max | 2.35 | 1.45 | 1.66 | 1.54 | 1.50 | 2.35 | 0 |<br />
Gns | 0.54 | 0.53 | 0.82 | 0.54 | 0.48 | 0.87 | 0 |<br />
Stnd | 0.31 | 0.24 | 0.28 | 0.28 | 0.30 | 0.48 | 0 |<br />
Sprd | 0.62 | 0.59 | 0.87 | 0.61 | 0.56 | 0.99 | 0 |<br />
Udklippet + Offset<br />
Min | - | -0.93 | -0.63 | -0.93 | -0.92 | -0.46 | 0 |<br />
Max | - | 0.91 | 0.83 | 1.00 | 1.02 | 1.49 | 0 |<br />
Gns | - | -0.00 | -0.00 | -0.00 | -0.00 | 0.00 | 0 |<br />
Stnd | - | 0.24 | 0.28 | 0.28 | 0.30 | 0.48 | 0 |<br />
Sprd | - | 0.24 | 0.28 | 0.28 | 0.30 | 0.48 | 0 |<br />
Analysefilen for 1:15,000, opløsningen 15 μm og maskestørrelsen 12.5 m. efter iterationsprocessen.<br />
267
Analysis calculations<br />
1000<br />
900<br />
800<br />
700<br />
600<br />
500<br />
400<br />
300<br />
200<br />
100<br />
Fordelingen af afvigelser for 1:15.000, 15μm, 25 m.<br />
Afvigelser Normalfordeling<br />
0<br />
-15 -13 -12 -10 -8.8 -7.3 -5.8 -4.3 -2.8 -1.3 0.2 1.7 3.2 4.7 6.2 7.7 9.2 10.7 12.2 13.7 15.2<br />
| Total |Fladt A 12|Grusgrav 34|Landsby 56|Bakket A 78|Skov 90|Ukendt 00|<br />
Min | -14.71 | -0.60 | -7.22 | -1.79 | -9.50 | -14.71 | 0 |<br />
Max | 15.46 | 4.54 | 15.46 | 3.65 | 14.08 | 12.09 | 0 |<br />
Gns | 0.64 | 0.53 | 1.48 | 0.54 | 0.50 | 0.05 | 0 |<br />
Stnd | 2.07 | 0.29 | 3.57 | 0.43 | 1.17 | 3.12 | 0 |<br />
Sprd | 2.17 | 0.61 | 3.86 | 0.69 | 1.27 | 3.12 | 0 |<br />
Antal | 9370 | 1980 | 1775 | 1611 | 2811 | 1193 | 0 |<br />
Niv'200.0'| 9370 | 1980 | 1775 | 1611 | 2811 | 1193 | 0 |<br />
Niv'400.0'| 0 | 0 | 0 | 0 | 0 | 0 | 0 |<br />
Niv'600.0'| 0 | 0 | 0 | 0 | 0 | 0 | 0 |<br />
Udklip.pkt| 0 | 0 | 0 | 0 | 0 | 0 | 0 |<br />
Areal | 803020.7 | 70567.2 | 46920.5 | 331645.2 | 95868.7 | 258019.2 | 0.0 |<br />
Niv'200.0'| 803020.7 | 70567.2 | 46920.5 | 331645.2 | 95868.7 | 258019.2 | 0.0 |<br />
Niv'400.0'| 0.0 | 0.0 | 0.0 | 0.0 | 0.0 | 0.0 | 0.0 |<br />
Niv'600.0'| 0.0 | 0.0 | 0.0 | 0.0 | 0.0 | 0.0 | 0.0 |<br />
Udklip.pkt| 0.0 | 0.0 | 0.0 | 0.0 | 0.0 | 0.0 | 0.0 |<br />
Udkl. i % | 0.00 | 0.00 | 0.00 | 0.00 | 0.00 | 0.00 | -0- |<br />
Offset gns. 0.64 0.53 1.48 0.54 0.50 0.05 -0-<br />
Min | -14.75 | -1.13 | -8.70 | -2.33 | -10.00 | -14.75 | 0 |<br />
Max | 13.98 | 4.00 | 13.98 | 3.11 | 13.59 | 12.05 | 0 |<br />
Gns | -0.00 | 0.00 | -0.00 | 0.00 | 0.00 | -0.00 | 0 |<br />
Stnd | 2.03 | 0.29 | 3.57 | 0.43 | 1.17 | 3.12 | 0 |<br />
Sprd | 2.03 | 0.29 | 3.57 | 0.43 | 1.17 | 3.12 | 0 |<br />
Udklippet<br />
Min | -14.71 | -0.60 | -7.22 | -1.79 | -9.50 | -14.71 | 0 |<br />
Max | 15.46 | 4.54 | 15.46 | 3.65 | 14.08 | 12.09 | 0 |<br />
Gns | 0.64 | 0.53 | 1.48 | 0.54 | 0.50 | 0.05 | 0 |<br />
Stnd | 2.07 | 0.29 | 3.57 | 0.43 | 1.17 | 3.12 | 0 |<br />
Sprd | 2.17 | 0.61 | 3.86 | 0.69 | 1.27 | 3.12 | 0 |<br />
Udklippet + Offset<br />
Min | - | -1.13 | -8.70 | -2.33 | -10.00 | -14.75 | 0 |<br />
Max | - | 4.00 | 13.98 | 3.11 | 13.59 | 12.05 | 0 |<br />
Gns | - | 0.00 | -0.00 | 0.00 | 0.00 | -0.00 | 0 |<br />
Stnd | - | 0.29 | 3.57 | 0.43 | 1.17 | 3.12 | 0 |<br />
Sprd | - | 0.29 | 3.57 | 0.43 | 1.17 | 3.12 | 0 |<br />
Analysefilen for 1:15,000, opløsningen 15 μm og maskestørrelsen 25 m. før iterationsprocessen.
1000<br />
900<br />
800<br />
700<br />
600<br />
500<br />
400<br />
300<br />
200<br />
100<br />
0<br />
I.1 Analysis calculations<br />
Fordelingen af afvigelser efter eliminering af grove fejl 1:15.000, 15 μm, 25 m.<br />
Afvigelser Normalfordeling<br />
-1.1 -1 -0.9 -0.8 -0.7 -0.6 -0.5 -0.4 -0.3 -0.2 -0.1 0 0.1 0.2 0.3 0.4 0.5 0.6 0.7 0.8 0.9 1<br />
| Total |Fladt A 12|Grusgrav 34|Landsby 56|Bakket A 78|Skov 90|Ukendt 00|<br />
Min | -14.71 | -0.60 | -7.22 | -1.79 | -9.50 | -14.71 | 0 |<br />
Max | 15.46 | 4.54 | 15.46 | 3.65 | 14.08 | 12.09 | 0 |<br />
Gns | 0.64 | 0.53 | 1.48 | 0.54 | 0.50 | 0.05 | 0 |<br />
Stnd | 2.07 | 0.29 | 3.57 | 0.43 | 1.17 | 3.12 | 0 |<br />
Sprd | 2.17 | 0.61 | 3.86 | 0.69 | 1.27 | 3.12 | 0 |<br />
Antal | 9370 | 1980 | 1775 | 1611 | 2811 | 1193 | 0 |<br />
Niv'0.4' | 2519 | 504 | 251 | 434 | 963 | 367 | 0 |<br />
Niv'0.7' | 3408 | 1038 | 310 | 760 | 1034 | 266 | 0 |<br />
Niv'1.1' | 1614 | 388 | 289 | 321 | 486 | 130 | 0 |<br />
Udklip.pkt| 1829 | 50 | 925 | 96 | 328 | 430 | 0 |<br />
Areal | 803020.7 | 70567.2 | 46920.5 | 331645.2 | 95868.7 | 258019.2 | 0.0 |<br />
Niv'0.4' | 174978.0 | 14495.4 | 7462.4 | 79145.5 | 21113.6 | 52761.1 | 0.0 |<br />
Niv'0.7' | 300108.7 | 37244.3 | 8161.4 | 151541.7 | 39500.7 | 63660.6 | 0.0 |<br />
Niv'1.1' | 145980.1 | 15048.9 | 7593.0 | 74137.6 | 20266.2 | 28934.5 | 0.0 |<br />
Udklip.pkt| 181953.9 | 3778.7 | 23703.7 | 26820.4 | 14988.1 | 112662.9 | 0.0 |<br />
Udkl. i % | 19.52 | 2.53 | 52.11 | 5.96 | 11.67 | 36.04 | -0- |<br />
Offset gns. 0.64 0.53 1.48 0.54 0.50 0.05 -0-<br />
Min | -14.75 | -1.13 | -8.70 | -2.33 | -10.00 | -14.75 | 0 |<br />
Max | 13.98 | 4.00 | 13.98 | 3.11 | 13.59 | 12.05 | 0 |<br />
Gns | -0.00 | 0.00 | -0.00 | 0.00 | 0.00 | -0.00 | 0 |<br />
Stnd | 2.03 | 0.29 | 3.57 | 0.43 | 1.17 | 3.12 | 0 |<br />
Sprd | 2.03 | 0.29 | 3.57 | 0.43 | 1.17 | 3.12 | 0 |<br />
Udklippet<br />
Min | -0.98 | -0.49 | 0 | -0.51 | -0.59 | -0.98 | 0 |<br />
Max | 1.58 | 1.57 | 0 | 1.58 | 1.58 | 1.13 | 0 |<br />
Gns | 0.48 | 0.53 | 0 | 0.52 | 0.47 | 0.25 | 0 |<br />
Stnd | 0.34 | 0.27 | 0 | 0.31 | 0.35 | 0.41 | 0 |<br />
Sprd | 0.58 | 0.59 | 0 | 0.61 | 0.59 | 0.48 | 0 |<br />
Udklippet + Offset<br />
Min | - | -1.01 | 0 | -1.03 | -1.06 | -1.23 | 0 |<br />
Max | - | 1.04 | 0 | 1.06 | 1.11 | 0.88 | 0 |<br />
Gns | - | -0.00 | 0 | 0.00 | -0.00 | -0.00 | 0 |<br />
Stnd | - | 0.27 | 0 | 0.31 | 0.35 | 0.41 | 0 |<br />
Sprd | - | 0.27 | 0 | 0.31 | 0.35 | 0.41 | 0 |<br />
Analysefilen for 1:15,000, opløsningen 15 μm og maskestørrelsen 25 m. efter iterationsprocessen.<br />
269
Analysis calculations<br />
700<br />
600<br />
500<br />
400<br />
300<br />
200<br />
100<br />
Fordelingen af afvigelser for 1:15.000, 30 μm, 5 m<br />
Afvigelser Normalfordeling<br />
0<br />
-19 -17 -16 -15 -14 -12 -11 -9.6 -8.3 -7 -5.7 -4.4 -3.1 -1.8 -0.5 0.8 2.1 3.4 4.7 6 7.3 8.6 9.9 11.2 12.5 13.8 15.1 16.4 17.7<br />
| Total |Fladt A 12|Grusgrav 34|Landsby 56|Bakket A 78|Skov 90|Ukendt 00|<br />
Min | -18.62 | -0.51 | -1.95 | -2.70 | -18.62 | -14.83 | 0 |<br />
Max | 18.09 | 3.50 | 13.90 | 4.45 | 6.14 | 18.09 | 0 |<br />
Gns | 0.80 | 0.47 | 1.30 | 0.84 | 0.30 | 1.96 | 0 |<br />
Stnd | 2.17 | 0.37 | 2.86 | 0.67 | 1.75 | 4.03 | 0 |<br />
Sprd | 2.31 | 0.60 | 3.14 | 1.08 | 1.77 | 4.48 | 0 |<br />
Antal | 8766 | 1980 | 1168 | 1611 | 2811 | 1196 | 0 |<br />
Niv'200.0'| 8766 | 1980 | 1168 | 1611 | 2811 | 1196 | 0 |<br />
Niv'400.0'| 0 | 0 | 0 | 0 | 0 | 0 | 0 |<br />
Niv'600.0'| 0 | 0 | 0 | 0 | 0 | 0 | 0 |<br />
Udklip.pkt| 0 | 0 | 0 | 0 | 0 | 0 | 0 |<br />
Areal | 202.0 | 0.0 | 107.3 | 0.0 | 0.0 | 94.6 | 0.0 |<br />
Niv'200.0'| 202.0 | 0.0 | 107.3 | 0.0 | 0.0 | 94.6 | 0.0 |<br />
Niv'400.0'| 0.0 | 0.0 | 0.0 | 0.0 | 0.0 | 0.0 | 0.0 |<br />
Niv'600.0'| 0.0 | 0.0 | 0.0 | 0.0 | 0.0 | 0.0 | 0.0 |<br />
Udklip.pkt| 0.0 | 0.0 | 0.0 | 0.0 | 0.0 | 0.0 | 0.0 |<br />
Udkl. i % | 0.00 | 0.00 | 0.00 | 0.00 | 0.00 | 0.00 | -0- |<br />
Offset gns. 0.80 0.47 1.30 0.84 0.30 1.96 -0-<br />
Min | -18.92 | -0.98 | -3.25 | -3.53 | -18.92 | -16.79 | 0 |<br />
Max | 16.13 | 3.03 | 12.60 | 3.62 | 5.84 | 16.13 | 0 |<br />
Gns | 0.00 | 0.00 | -0.00 | -0.00 | -0.00 | 0.00 | 0 |<br />
Stnd | 2.10 | 0.37 | 2.86 | 0.67 | 1.75 | 4.03 | 0 |<br />
Sprd | 2.10 | 0.37 | 2.86 | 0.67 | 1.75 | 4.03 | 0 |<br />
Udklippet<br />
Min | -18.62 | -0.51 | -1.95 | -2.70 | -18.62 | -14.83 | 0 |<br />
Max | 18.09 | 3.50 | 13.90 | 4.45 | 6.14 | 18.09 | 0 |<br />
Gns | 0.80 | 0.47 | 1.30 | 0.84 | 0.30 | 1.96 | 0 |<br />
Stnd | 2.17 | 0.37 | 2.86 | 0.67 | 1.75 | 4.03 | 0 |<br />
Sprd | 2.31 | 0.60 | 3.14 | 1.08 | 1.77 | 4.48 | 0 |<br />
Udklippet + Offset<br />
Min | - | -0.98 | -3.25 | -3.53 | -18.92 | -16.79 | 0 |<br />
Max | - | 3.03 | 12.60 | 3.62 | 5.84 | 16.13 | 0 |<br />
Gns | - | 0.00 | -0.00 | -0.00 | -0.00 | 0.00 | 0 |<br />
Stnd | - | 0.37 | 2.86 | 0.67 | 1.75 | 4.03 | 0 |<br />
Sprd | - | 0.37 | 2.86 | 0.67 | 1.75 | 4.03 | 0 |<br />
Analysefilen for 1:15,000, opløsningen 30 μm og maskestørrelsen 5 m. før iterationsprocessen.
700<br />
600<br />
500<br />
400<br />
300<br />
200<br />
100<br />
0<br />
I.1 Analysis calculations<br />
Fordelingen af afvigelser efter eliminering af grove fejl 1:15.000, 30 μm, 5 m.<br />
Afvigelser Normalfordeling<br />
-1.6 -1.5 -1.4 -1.3 -1.2 -1.1 -1 -0.9 -0.8 -0.7 -0.6 -0.5 -0.4 -0.3 -0.2 -0.1 0 0.1 0.2 0.3 0.4 0.5 0.6 0.7 0.8 0.9 1 1.1 1.2 1.3 1.4 1.5<br />
| Total |Fladt A 12|Grusgrav 34|Landsby 56|Bakket A 78|Skov 90|Ukendt 00|<br />
Min | -18.62 | -0.51 | -1.95 | -2.70 | -18.62 | -14.83 | 0 |<br />
Max | 18.09 | 3.50 | 13.90 | 4.45 | 6.14 | 18.09 | 0 |<br />
Gns | 0.80 | 0.47 | 1.30 | 0.84 | 0.30 | 1.96 | 0 |<br />
Stnd | 2.17 | 0.37 | 2.86 | 0.67 | 1.75 | 4.03 | 0 |<br />
Sprd | 2.31 | 0.60 | 3.14 | 1.08 | 1.77 | 4.48 | 0 |<br />
Antal | 8766 | 1980 | 1168 | 1611 | 2811 | 1196 | 0 |<br />
Niv'0.5' | 3783 | 1158 | 528 | 465 | 1433 | 199 | 0 |<br />
Niv'1.1' | 2864 | 721 | 261 | 656 | 953 | 273 | 0 |<br />
Niv'1.6' | 890 | 82 | 130 | 310 | 242 | 126 | 0 |<br />
Udklip.pkt| 1229 | 19 | 249 | 180 | 183 | 598 | 0 |<br />
Areal | 202.0 | 0.0 | 107.3 | 0.0 | 0.0 | 94.6 | 0.0 |<br />
Niv'0.5' | 54.4 | 0.0 | 54.4 | 0.0 | 0.0 | 0.0 | 0.0 |<br />
Niv'1.1' | 52.9 | 0.0 | 52.9 | 0.0 | 0.0 | 0.0 | 0.0 |<br />
Niv'1.6' | 3.3 | 0.0 | 0.0 | 0.0 | 0.0 | 3.3 | 0.0 |<br />
Udklip.pkt| 91.3 | 0.0 | 0.0 | 0.0 | 0.0 | 91.3 | 0.0 |<br />
Udkl. i % | 14.02 | 0.96 | 21.32 | 11.17 | 6.51 | 50.00 | -0- |<br />
Offset gns. 0.80 0.47 1.30 0.84 0.30 1.96 -0-<br />
Min | -18.92 | -0.98 | -3.25 | -3.53 | -18.92 | -16.79 | 0 |<br />
Max | 16.13 | 3.03 | 12.60 | 3.62 | 5.84 | 16.13 | 0 |<br />
Gns | 0.00 | 0.00 | -0.00 | -0.00 | -0.00 | 0.00 | 0 |<br />
Stnd | 2.10 | 0.37 | 2.86 | 0.67 | 1.75 | 4.03 | 0 |<br />
Sprd | 2.10 | 0.37 | 2.86 | 0.67 | 1.75 | 4.03 | 0 |<br />
Udklippet<br />
Min | -1.30 | -0.51 | -0.30 | -0.73 | -1.30 | 0.38 | 0 |<br />
Max | 3.55 | 1.99 | 2.88 | 2.43 | 1.89 | 3.55 | 0 |<br />
Gns | 0.63 | 0.47 | 0.54 | 0.82 | 0.49 | 1.37 | 0 |<br />
Stnd | 0.60 | 0.35 | 0.64 | 0.55 | 0.46 | 0.82 | 0 |<br />
Sprd | 0.86 | 0.59 | 0.84 | 0.99 | 0.68 | 1.60 | 0 |<br />
Udklippet + Offset<br />
Min | - | -0.98 | -0.83 | -1.56 | -1.79 | -1.00 | 0 |<br />
Max | - | 1.52 | 2.35 | 1.60 | 1.40 | 2.18 | 0 |<br />
Gns | - | -0.00 | 0.00 | -0.00 | -0.00 | 0.00 | 0 |<br />
Stnd | - | 0.35 | 0.64 | 0.55 | 0.46 | 0.82 | 0 |<br />
Sprd | - | 0.35 | 0.64 | 0.55 | 0.46 | 0.82 | 0 |<br />
Analysefilen for 1:15,000, opløsningen 30 μm og maskestørrelsen 5 m. efter iterationsprocessen.<br />
271
Analysis calculations<br />
800<br />
700<br />
600<br />
500<br />
400<br />
300<br />
200<br />
100<br />
0<br />
Fordelingen af afvigelser for 1:15.000, 30 μm, 12,5 m.<br />
Afvigelser Normalfordeling<br />
-18 -17 -15 -14 -13 -12 -11 -9.3 -8.1 -6.9 -5.7 -4.5 -3.3 -2.1 -0.9 0.3 1.5 2.7 3.9 5.1 6.3 7.5 8.7 9.9 11.1 12.3 13.5 14.7 15.9 17.1<br />
| Total |Fladt A 12|Grusgrav 34|Landsby 56|Bakket A 78|Skov 90|Ukendt 00|<br />
Min | -17.68 | -0.56 | -6.57 | -1.80 | -17.68 | -12.26 | 0 |<br />
Max | 17.42 | 2.16 | 12.00 | 4.36 | 5.25 | 17.42 | 0 |<br />
Gns | 0.73 | 0.44 | 0.81 | 0.71 | 0.35 | 2.01 | 0 |<br />
Stnd | 1.90 | 0.34 | 1.92 | 0.55 | 1.56 | 3.79 | 0 |<br />
Sprd | 2.03 | 0.56 | 2.09 | 0.90 | 1.60 | 4.29 | 0 |<br />
Antal | 9355 | 1975 | 1802 | 1592 | 2805 | 1181 | 0 |<br />
Niv'200.0'| 9355 | 1975 | 1802 | 1592 | 2805 | 1181 | 0 |<br />
Niv'400.0'| 0 | 0 | 0 | 0 | 0 | 0 | 0 |<br />
Niv'600.0'| 0 | 0 | 0 | 0 | 0 | 0 | 0 |<br />
Udklip.pkt| 0 | 0 | 0 | 0 | 0 | 0 | 0 |<br />
Areal | 57434.9 | 721.7 | 45759.7 | 1800.3 | 0.0 | 9153.1 | 0.0 |<br />
Niv'200.0'| 57434.9 | 721.7 | 45759.7 | 1800.3 | 0.0 | 9153.1 | 0.0 |<br />
Niv'400.0'| 0.0 | 0.0 | 0.0 | 0.0 | 0.0 | 0.0 | 0.0 |<br />
Niv'600.0'| 0.0 | 0.0 | 0.0 | 0.0 | 0.0 | 0.0 | 0.0 |<br />
Udklip.pkt| 0.0 | 0.0 | 0.0 | 0.0 | 0.0 | 0.0 | 0.0 |<br />
Udkl. i % | 0.00 | 0.00 | 0.00 | 0.00 | 0.00 | 0.00 | -0- |<br />
Offset gns. 0.73 0.44 0.81 0.71 0.35 2.01 -0-<br />
Min | -18.03 | -1.00 | -7.37 | -2.51 | -18.03 | -14.27 | 0 |<br />
Max | 15.41 | 1.72 | 11.19 | 3.65 | 4.90 | 15.41 | 0 |<br />
Gns | 0.00 | 0.00 | -0.00 | -0.00 | 0.00 | -0.00 | 0 |<br />
Stnd | 1.82 | 0.34 | 1.92 | 0.55 | 1.56 | 3.79 | 0 |<br />
Sprd | 1.82 | 0.34 | 1.92 | 0.55 | 1.56 | 3.79 | 0 |<br />
Udklippet<br />
Min | -17.68 | -0.56 | -6.57 | -1.80 | -17.68 | -12.26 | 0 |<br />
Max | 17.42 | 2.16 | 12.00 | 4.36 | 5.25 | 17.42 | 0 |<br />
Gns | 0.73 | 0.44 | 0.81 | 0.71 | 0.35 | 2.01 | 0 |<br />
Stnd | 1.90 | 0.34 | 1.92 | 0.55 | 1.56 | 3.79 | 0 |<br />
Sprd | 2.03 | 0.56 | 2.09 | 0.90 | 1.60 | 4.29 | 0 |<br />
Udklippet + Offset<br />
Min | - | -1.00 | -7.37 | -2.51 | -18.03 | -14.27 | 0 |<br />
Max | - | 1.72 | 11.19 | 3.65 | 4.90 | 15.41 | 0 |<br />
Gns | - | 0.00 | -0.00 | -0.00 | 0.00 | -0.00 | 0 |<br />
Stnd | - | 0.34 | 1.92 | 0.55 | 1.56 | 3.79 | 0 |<br />
Sprd | - | 0.34 | 1.92 | 0.55 | 1.56 | 3.79 | 0 |<br />
Analysefilen for 1:15,000, opløsningen 30 μm og maskestørrelsen 12.5 m. før iterationsprocessen.
700<br />
600<br />
500<br />
400<br />
300<br />
200<br />
100<br />
0<br />
I.1 Analysis calculations<br />
Fordelingen af afvigelser efter eliminering af grove fejl1:15.000, 30 μm, 12,5 m.<br />
Afvigelser Normalfordeling<br />
-1.6 -1.5 -1.4 -1.3 -1.2 -1.1 -1 -0.9 -0.8 -0.7 -0.6 -0.5 -0.4 -0.3 -0.2 -0.1 0 0.1 0.2 0.3 0.4 0.5 0.6 0.7 0.8 0.9 1 1.1 1.2 1.3 1.4 1.5<br />
| Total |Fladt A 12|Grusgrav 34|Landsby 56|Bakket A 78|Skov 90|Ukendt 00|<br />
Min | -17.68 | -0.56 | -6.57 | -1.80 | -17.68 | -12.26 | 0 |<br />
Max | 17.42 | 2.16 | 12.00 | 4.36 | 5.25 | 17.42 | 0 |<br />
Gns | 0.73 | 0.44 | 0.81 | 0.71 | 0.35 | 2.01 | 0 |<br />
Stnd | 1.90 | 0.34 | 1.92 | 0.55 | 1.56 | 3.79 | 0 |<br />
Sprd | 2.03 | 0.56 | 2.09 | 0.90 | 1.60 | 4.29 | 0 |<br />
Antal | 9355 | 1975 | 1802 | 1592 | 2805 | 1181 | 0 |<br />
Niv'0.5' | 3947 | 1165 | 513 | 529 | 1393 | 347 | 0 |<br />
Niv'1.0' | 3192 | 721 | 567 | 677 | 955 | 272 | 0 |<br />
Niv'1.5' | 1066 | 80 | 297 | 285 | 266 | 138 | 0 |<br />
Udklip.pkt| 1150 | 9 | 425 | 101 | 191 | 424 | 0 |<br />
Areal | 57434.9 | 721.7 | 45759.7 | 1800.3 | 0.0 | 9153.1 | 0.0 |<br />
Niv'0.5' | 15066.0 | 0.0 | 12926.9 | 692.0 | 0.0 | 1447.0 | 0.0 |<br />
Niv'1.0' | 17006.2 | 501.7 | 14585.8 | 515.3 | 0.0 | 1403.4 | 0.0 |<br />
Niv'1.5' | 9036.7 | 220.0 | 7526.9 | 593.1 | 0.0 | 696.8 | 0.0 |<br />
Udklip.pkt| 16326.0 | 0.0 | 10720.1 | 0.0 | 0.0 | 5605.9 | 0.0 |<br />
Udkl. i % | 12.29 | 0.46 | 23.58 | 6.34 | 6.81 | 35.90 | -0- |<br />
Offset gns. 0.73 0.44 0.81 0.71 0.35 2.01 -0-<br />
Min | -18.03 | -1.00 | -7.37 | -2.51 | -18.03 | -14.27 | 0 |<br />
Max | 15.41 | 1.72 | 11.19 | 3.65 | 4.90 | 15.41 | 0 |<br />
Gns | 0.00 | 0.00 | -0.00 | -0.00 | 0.00 | -0.00 | 0 |<br />
Stnd | 1.82 | 0.34 | 1.92 | 0.55 | 1.56 | 3.79 | 0 |<br />
Sprd | 1.82 | 0.34 | 1.92 | 0.55 | 1.56 | 3.79 | 0 |<br />
Udklippet<br />
Min | -1.16 | -0.56 | -0.71 | -0.75 | -1.16 | 0.50 | 0 |<br />
Max | 3.53 | 1.90 | 1.91 | 2.21 | 1.86 | 3.53 | 0 |<br />
Gns | 0.59 | 0.44 | 0.64 | 0.70 | 0.50 | 1.28 | 0 |<br />
Stnd | 0.52 | 0.33 | 0.47 | 0.48 | 0.46 | 0.76 | 0 |<br />
Sprd | 0.78 | 0.55 | 0.79 | 0.85 | 0.68 | 1.49 | 0 |<br />
Udklippet + Offset<br />
Min | - | -1.00 | -1.35 | -1.45 | -1.66 | -0.78 | 0 |<br />
Max | - | 1.46 | 1.27 | 1.51 | 1.37 | 2.25 | 0 |<br />
Gns | - | -0.00 | -0.00 | -0.00 | -0.00 | 0.00 | 0 |<br />
Stnd | - | 0.33 | 0.47 | 0.48 | 0.46 | 0.76 | 0 |<br />
Sprd | - | 0.33 | 0.47 | 0.48 | 0.46 | 0.76 | 0 |<br />
Analysefilen for 1:15,000, opløsningen 30 μm og maskestørrelsen 12.5 m. efter iterationsprocessen.v<br />
273
Analysis calculations<br />
700<br />
600<br />
500<br />
400<br />
300<br />
200<br />
100<br />
0<br />
Fordelingen af afvigelser for 1:15.000, 30 μm, 25 m.<br />
Afvigelser Normalfordeling<br />
-12 -11 -9.5 -8.5 -7.5 -6.5 -5.5 -4.5 -3.5 -2.5 -1.5 -0.5 0.5 1.5 2.5 3.5 4.5 5.5 6.5 7.5 8.5 9.5 10.5 11.5 12.5 13.5 14.5 15.5 16.5<br />
| Total |Fladt A 12|Grusgrav 34|Landsby 56|Bakket A 78|Skov 90|Ukendt 00|<br />
Min | -11.49 | -1.00 | -7.09 | -2.17 | -8.99 | -11.49 | 0 |<br />
Max | 16.55 | 2.40 | 15.13 | 3.50 | 13.98 | 16.55 | 0 |<br />
Gns | 0.79 | 0.44 | 1.24 | 0.69 | 0.49 | 1.53 | 0 |<br />
Stnd | 2.15 | 0.36 | 3.43 | 0.56 | 1.23 | 3.67 | 0 |<br />
Sprd | 2.29 | 0.57 | 3.65 | 0.89 | 1.32 | 3.98 | 0 |<br />
Antal | 9370 | 1980 | 1775 | 1611 | 2811 | 1193 | 0 |<br />
Niv'200.0'| 9370 | 1980 | 1775 | 1611 | 2811 | 1193 | 0 |<br />
Niv'400.0'| 0 | 0 | 0 | 0 | 0 | 0 | 0 |<br />
Niv'600.0'| 0 | 0 | 0 | 0 | 0 | 0 | 0 |<br />
Udklip.pkt| 0 | 0 | 0 | 0 | 0 | 0 | 0 |<br />
Areal | 803020.7 | 70567.2 | 46920.5 | 331645.2 | 95868.7 | 258019.2 | 0.0 |<br />
Niv'200.0'| 803020.7 | 70567.2 | 46920.5 | 331645.2 | 95868.7 | 258019.2 | 0.0 |<br />
Niv'400.0'| 0.0 | 0.0 | 0.0 | 0.0 | 0.0 | 0.0 | 0.0 |<br />
Niv'600.0'| 0.0 | 0.0 | 0.0 | 0.0 | 0.0 | 0.0 | 0.0 |<br />
Udklip.pkt| 0.0 | 0.0 | 0.0 | 0.0 | 0.0 | 0.0 | 0.0 |<br />
Udkl. i % | 0.00 | 0.00 | 0.00 | 0.00 | 0.00 | 0.00 | -0- |<br />
Offset gns. 0.79 0.44 1.24 0.69 0.49 1.53 -0-<br />
Min | -13.02 | -1.44 | -8.33 | -2.85 | -9.48 | -13.02 | 0 |<br />
Max | 15.02 | 1.96 | 13.90 | 2.81 | 13.49 | 15.02 | 0 |<br />
Gns | -0.00 | -0.00 | -0.00 | -0.00 | 0.00 | 0.00 | 0 |<br />
Stnd | 2.12 | 0.36 | 3.43 | 0.56 | 1.23 | 3.67 | 0 |<br />
Sprd | 2.12 | 0.36 | 3.43 | 0.56 | 1.23 | 3.67 | 0 |<br />
Udklippet<br />
Min | -11.49 | -1.00 | -7.09 | -2.17 | -8.99 | -11.49 | 0 |<br />
Max | 16.55 | 2.40 | 15.13 | 3.50 | 13.98 | 16.55 | 0 |<br />
Gns | 0.79 | 0.44 | 1.24 | 0.69 | 0.49 | 1.53 | 0 |<br />
Stnd | 2.16 | 0.36 | 3.43 | 0.56 | 1.23 | 3.67 | 0 |<br />
Sprd | 2.29 | 0.57 | 3.65 | 0.89 | 1.32 | 3.98 | 0 |<br />
Udklippet + Offset<br />
Min | - | -1.44 | -8.33 | -2.85 | -9.48 | -13.02 | 0 |<br />
Max | - | 1.96 | 13.90 | 2.81 | 13.49 | 15.02 | 0 |<br />
Gns | - | -0.00 | -0.00 | -0.00 | 0.00 | 0.00 | 0 |<br />
Stnd | - | 0.36 | 3.43 | 0.56 | 1.23 | 3.67 | 0 |<br />
Sprd | - | 0.36 | 3.43 | 0.56 | 1.23 | 3.67 | 0 |<br />
Analysefilen for 1:15,000, opløsningen 30 μm og maskestørrelsen 25 m. før iterationsprocessen.
800<br />
700<br />
600<br />
500<br />
400<br />
300<br />
200<br />
100<br />
0<br />
I.1 Analysis calculations<br />
Fordelingen af afvigelser efter eliminering af grove fejl 1:15.000, 30 μm, 25 m.<br />
Afvigelser Normalfordeling<br />
-2.9 -2.7 -2.5 -2.3 -2.1 -1.9 -1.7 -1.5 -1.3 -1.1 -0.9 -0.7 -0.5 -0.3 -0.1 0.1 0.3 0.5 0.7 0.9 1.1 1.3 1.5 1.7 1.9 2.1 2.3 2.5 2.7<br />
| Total |Fladt A 12|Grusgrav 34|Landsby 56|Bakket A 78|Skov 90|Ukendt 00|<br />
Min | -11.49 | -1.00 | -7.09 | -2.17 | -8.99 | -11.49 | 0 |<br />
Max | 16.55 | 2.40 | 15.13 | 3.50 | 13.98 | 16.55 | 0 |<br />
Gns | 0.79 | 0.44 | 1.24 | 0.69 | 0.49 | 1.53 | 0 |<br />
Stnd | 2.15 | 0.36 | 3.43 | 0.56 | 1.23 | 3.67 | 0 |<br />
Sprd | 2.29 | 0.57 | 3.65 | 0.89 | 1.32 | 3.98 | 0 |<br />
Antal | 9370 | 1980 | 1775 | 1611 | 2811 | 1193 | 0 |<br />
Niv'0.4' | 2657 | 845 | 271 | 326 | 961 | 254 | 0 |<br />
Niv'0.7' | 2624 | 729 | 320 | 514 | 846 | 215 | 0 |<br />
Niv'1.1' | 1715 | 334 | 299 | 425 | 481 | 176 | 0 |<br />
Udklip.pkt| 2374 | 72 | 885 | 346 | 523 | 548 | 0 |<br />
Areal | 803020.7 | 70567.2 | 46920.5 | 331645.2 | 95868.7 | 258019.2 | 0.0 |<br />
Niv'0.4' | 140158.5 | 23863.0 | 7599.9 | 43783.6 | 25842.5 | 39069.6 | 0.0 |<br />
Niv'0.7' | 207176.4 | 29466.9 | 8480.0 | 94440.3 | 34425.7 | 40363.5 | 0.0 |<br />
Niv'1.1' | 177752.6 | 11990.1 | 7897.2 | 100526.0 | 18715.3 | 38624.1 | 0.0 |<br />
Udklip.pkt| 277933.2 | 5247.3 | 22943.4 | 92895.3 | 16885.2 | 139962.0 | 0.0 |<br />
Udkl. i % | 25.34 | 3.64 | 49.86 | 21.48 | 18.61 | 45.93 | -0- |<br />
Offset gns. 0.79 0.44 1.24 0.69 0.49 1.53 -0-<br />
Min | -13.02 | -1.44 | -8.33 | -2.85 | -9.48 | -13.02 | 0 |<br />
Max | 15.02 | 1.96 | 13.90 | 2.81 | 13.49 | 15.02 | 0 |<br />
Gns | -0.00 | -0.00 | -0.00 | -0.00 | 0.00 | 0.00 | 0 |<br />
Stnd | 2.12 | 0.36 | 3.43 | 0.56 | 1.23 | 3.67 | 0 |<br />
Sprd | 2.12 | 0.36 | 3.43 | 0.56 | 1.23 | 3.67 | 0 |<br />
Udklippet<br />
Min | -0.61 | -0.61 | 0.38 | -0.40 | -0.60 | 0.44 | 0 |<br />
Max | 2.60 | 1.53 | 1.43 | 1.77 | 1.57 | 2.60 | 0 |<br />
Gns | 0.53 | 0.43 | 0.96 | 0.68 | 0.46 | 1.05 | 0 |<br />
Stnd | 0.46 | 0.33 | 0.26 | 0.42 | 0.45 | 0.53 | 0 |<br />
Sprd | 0.69 | 0.54 | 0.99 | 0.80 | 0.64 | 1.17 | 0 |<br />
Udklippet + Offset<br />
Min | - | -1.04 | -0.58 | -1.08 | -1.06 | -0.60 | 0 |<br />
Max | - | 1.10 | 0.47 | 1.09 | 1.10 | 1.55 | 0 |<br />
Gns | - | 0.00 | -0.00 | -0.00 | -0.00 | 0.00 | 0 |<br />
Stnd | - | 0.33 | 0.26 | 0.42 | 0.45 | 0.53 | 0 |<br />
Sprd | - | 0.33 | 0.26 | 0.42 | 0.45 | 0.53 | 0 |<br />
Analysefilen for 1:15,000, opløsningen 30 μm og maskestørrelsen 25 m. efter iterationsprocessen.<br />
275
Analysis calculations<br />
600<br />
500<br />
400<br />
300<br />
200<br />
100<br />
Fordelingen af afvigelser for 1:15.000, 60μm, 12,5 m.<br />
Afvigelser Normalfordeling<br />
0<br />
-21 -19 -17 -16 -14 -12 -9.8 -7.9 -6 -4.1 -2.2 -0.3 1.6 3.5 5.4 7.3 9.2 11.1 13 14.9 16.8<br />
| Total |Fladt A 12|Grusgrav 34|Landsby 56|Bakket A 78|Skov 90|Ukendt 00|<br />
Min | -21.11 | -1.03 | -5.86 | -2.52 | -21.11 | -14.77 | 0 |<br />
Max | 18.53 | 2.98 | 11.43 | 3.62 | 4.84 | 18.53 | 0 |<br />
Gns | 0.79 | 0.59 | 0.48 | 1.10 | 0.45 | 1.97 | 0 |<br />
Stnd | 1.93 | 0.39 | 1.64 | 0.71 | 1.92 | 3.67 | 0 |<br />
Sprd | 2.08 | 0.71 | 1.71 | 1.31 | 1.97 | 4.17 | 0 |<br />
Antal | 9355 | 1975 | 1802 | 1592 | 2805 | 1181 | 0 |<br />
Niv'200.0'| 9355 | 1975 | 1802 | 1592 | 2805 | 1181 | 0 |<br />
Niv'400.0'| 0 | 0 | 0 | 0 | 0 | 0 | 0 |<br />
Niv'600.0'| 0 | 0 | 0 | 0 | 0 | 0 | 0 |<br />
Udklip.pkt| 0 | 0 | 0 | 0 | 0 | 0 | 0 |<br />
Areal | 57434.9 | 721.7 | 45759.7 | 1800.3 | 0.0 | 9153.1 | 0.0 |<br />
Niv'200.0'| 57434.9 | 721.7 | 45759.7 | 1800.3 | 0.0 | 9153.1 | 0.0 |<br />
Niv'400.0'| 0.0 | 0.0 | 0.0 | 0.0 | 0.0 | 0.0 | 0.0 |<br />
Niv'600.0'| 0.0 | 0.0 | 0.0 | 0.0 | 0.0 | 0.0 | 0.0 |<br />
Udklip.pkt| 0.0 | 0.0 | 0.0 | 0.0 | 0.0 | 0.0 | 0.0 |<br />
Udkl. i % | 0.00 | 0.00 | 0.00 | 0.00 | 0.00 | 0.00 | -0- |<br />
Offset gns. 0.79 0.59 0.48 1.10 0.45 1.97 -0-<br />
Min | -21.56 | -1.63 | -6.34 | -3.62 | -21.56 | -16.75 | 0 |<br />
Max | 16.56 | 2.39 | 10.95 | 2.52 | 4.40 | 16.56 | 0 |<br />
Gns | -0.00 | 0.00 | 0.00 | 0.00 | -0.00 | -0.00 | 0 |<br />
Stnd | 1.86 | 0.39 | 1.64 | 0.71 | 1.92 | 3.67 | 0 |<br />
Sprd | 1.86 | 0.39 | 1.64 | 0.71 | 1.92 | 3.67 | 0 |<br />
Udklippet<br />
Min | -21.11 | -1.03 | -5.86 | -2.52 | -21.11 | -14.77 | 0 |<br />
Max | 18.53 | 2.98 | 11.43 | 3.62 | 4.84 | 18.53 | 0 |<br />
Gns | 0.79 | 0.59 | 0.48 | 1.10 | 0.45 | 1.97 | 0 |<br />
Stnd | 1.94 | 0.39 | 1.64 | 0.71 | 1.92 | 3.67 | 0 |<br />
Sprd | 2.08 | 0.71 | 1.71 | 1.31 | 1.97 | 4.17 | 0 |<br />
Udklippet + Offset<br />
Min | - | -1.63 | -6.34 | -3.62 | -21.56 | -16.75 | 0 |<br />
Max | - | 2.39 | 10.95 | 2.52 | 4.40 | 16.56 | 0 |<br />
Gns | - | 0.00 | 0.00 | 0.00 | -0.00 | -0.00 | 0 |<br />
Stnd | - | 0.39 | 1.64 | 0.71 | 1.92 | 3.67 | 0 |<br />
Sprd | - | 0.39 | 1.64 | 0.71 | 1.92 | 3.67 | 0 |<br />
Analysefilen for 1:15,000, opløsningen 60 μm og maskestørrelsen 12.5 m. før iterationsprocessen.
600<br />
500<br />
400<br />
300<br />
200<br />
100<br />
0<br />
I.1 Analysis calculations<br />
Fordelingen af afvigelser efter eliminering af grove fejl1:15.000, 60μm, 12,5 m.<br />
Afvigelser Normalfordeling<br />
-2.2 -2 -1.8 -1.6 -1.4 -1.2 -1 -0.8 -0.6 -0.4 -0.2 0 0.2 0.4 0.6 0.8 1 1.2 1.4 1.6 1.8 2<br />
| Total |Fladt A 12|Grusgrav 34|Landsby 56|Bakket A 78|Skov 90|Ukendt 00|<br />
Min | -21.11 | -1.03 | -5.86 | -2.52 | -21.11 | -14.77 | 0 |<br />
Max | 18.53 | 2.98 | 11.43 | 3.62 | 4.84 | 18.53 | 0 |<br />
Gns | 0.79 | 0.59 | 0.48 | 1.10 | 0.45 | 1.97 | 0 |<br />
Stnd | 1.93 | 0.39 | 1.64 | 0.71 | 1.92 | 3.67 | 0 |<br />
Sprd | 2.08 | 0.71 | 1.71 | 1.31 | 1.97 | 4.17 | 0 |<br />
Antal | 9355 | 1975 | 1802 | 1592 | 2805 | 1181 | 0 |<br />
Niv'0.7' | 4105 | 1339 | 676 | 404 | 1392 | 294 | 0 |<br />
Niv'1.4' | 3047 | 574 | 605 | 669 | 943 | 256 | 0 |<br />
Niv'2.1' | 1190 | 54 | 262 | 414 | 302 | 158 | 0 |<br />
Udklip.pkt| 1013 | 8 | 259 | 105 | 168 | 473 | 0 |<br />
Areal | 57434.9 | 721.7 | 45759.7 | 1800.3 | 0.0 | 9153.1 | 0.0 |<br />
Niv'0.7' | 18436.8 | 291.7 | 17045.7 | 565.6 | 0.0 | 533.8 | 0.0 |<br />
Niv'1.4' | 17746.9 | 210.0 | 15558.6 | 466.6 | 0.0 | 1511.7 | 0.0 |<br />
Niv'2.1' | 7952.2 | 220.0 | 6623.4 | 407.7 | 0.0 | 701.0 | 0.0 |<br />
Udklip.pkt| 13299.0 | 0.0 | 6532.0 | 360.3 | 0.0 | 6406.6 | 0.0 |<br />
Udkl. i % | 10.83 | 0.41 | 14.37 | 6.60 | 5.99 | 40.05 | -0- |<br />
Offset gns. 0.79 0.59 0.48 1.10 0.45 1.97 -0-<br />
Min | -21.56 | -1.63 | -6.34 | -3.62 | -21.56 | -16.75 | 0 |<br />
Max | 16.56 | 2.39 | 10.95 | 2.52 | 4.40 | 16.56 | 0 |<br />
Gns | -0.00 | 0.00 | 0.00 | 0.00 | -0.00 | -0.00 | 0 |<br />
Stnd | 1.86 | 0.39 | 1.64 | 0.71 | 1.92 | 3.67 | 0 |<br />
Sprd | 1.86 | 0.39 | 1.64 | 0.71 | 1.92 | 3.67 | 0 |<br />
Udklippet<br />
Min | -1.65 | -1.03 | -1.60 | -0.98 | -1.65 | -0.12 | 0 |<br />
Max | 4.08 | 2.57 | 2.52 | 3.13 | 2.54 | 4.08 | 0 |<br />
Gns | 0.80 | 0.59 | 0.59 | 1.12 | 0.67 | 1.35 | 0 |<br />
Stnd | 0.74 | 0.38 | 0.72 | 0.65 | 0.64 | 1.00 | 0 |<br />
Sprd | 1.07 | 0.71 | 0.93 | 1.29 | 0.93 | 1.69 | 0 |<br />
Udklippet + Offset<br />
Min | - | -1.62 | -2.19 | -2.10 | -2.32 | -1.47 | 0 |<br />
Max | - | 1.98 | 1.93 | 2.01 | 1.87 | 2.73 | 0 |<br />
Gns | - | 0.00 | -0.00 | -0.00 | 0.00 | 0.00 | 0 |<br />
Stnd | - | 0.38 | 0.72 | 0.65 | 0.64 | 1.00 | 0 |<br />
Sprd | - | 0.38 | 0.72 | 0.65 | 0.64 | 1.00 | 0 |<br />
Analysefilen for 1:15,000, opløsningen 60 μm og maskestørrelsen 12.5 m. efter iterationsprocessen.<br />
277
Analysis calculations<br />
600<br />
500<br />
400<br />
300<br />
200<br />
100<br />
0<br />
Fordelingen af afvigelser for 1:15.000, 60 μm, 25 m.<br />
Afvigelser Normalfordeling<br />
-16 -15 -14 -12 -11 -9.9 -8.7 -7.5 -6.3 -5.1 -3.9 -2.7 -1.5 -0.3 0.9 2.1 3.3 4.5 5.7 6.9 8.1 9.3 10.5 11.7 12.9 14.1 15.3 16.5 17.7 18.9<br />
| Total |Fladt A 12|Grusgrav 34|Landsby 56|Bakket A 78|Skov 90|Ukendt 00|<br />
Min | -15.89 | -1.73 | -12.71 | -1.98 | -15.89 | -13.86 | 0 |<br />
Max | 19.16 | 2.69 | 9.82 | 3.14 | 5.50 | 19.16 | 0 |<br />
Gns | 0.76 | 0.54 | 0.43 | 1.09 | 0.53 | 1.72 | 0 |<br />
Stnd | 1.96 | 0.45 | 2.39 | 0.70 | 1.61 | 3.60 | 0 |<br />
Sprd | 2.10 | 0.70 | 2.43 | 1.30 | 1.70 | 3.99 | 0 |<br />
Antal | 9370 | 1980 | 1775 | 1611 | 2811 | 1193 | 0 |<br />
Niv'200.0'| 9370 | 1980 | 1775 | 1611 | 2811 | 1193 | 0 |<br />
Niv'400.0'| 0 | 0 | 0 | 0 | 0 | 0 | 0 |<br />
Niv'600.0'| 0 | 0 | 0 | 0 | 0 | 0 | 0 |<br />
Udklip.pkt| 0 | 0 | 0 | 0 | 0 | 0 | 0 |<br />
Areal | 803020.7 | 70567.2 | 46920.5 | 331645.2 | 95868.7 | 258019.2 | 0.0 |<br />
Niv'200.0'| 803020.7 | 70567.2 | 46920.5 | 331645.2 | 95868.7 | 258019.2 | 0.0 |<br />
Niv'400.0'| 0.0 | 0.0 | 0.0 | 0.0 | 0.0 | 0.0 | 0.0 |<br />
Niv'600.0'| 0.0 | 0.0 | 0.0 | 0.0 | 0.0 | 0.0 | 0.0 |<br />
Udklip.pkt| 0.0 | 0.0 | 0.0 | 0.0 | 0.0 | 0.0 | 0.0 |<br />
Udkl. i % | 0.00 | 0.00 | 0.00 | 0.00 | 0.00 | 0.00 | -0- |<br />
Offset gns. 0.76 0.54 0.43 1.09 0.53 1.72 -0-<br />
Min | -16.42 | -2.27 | -13.14 | -3.07 | -16.42 | -15.58 | 0 |<br />
Max | 17.44 | 2.15 | 9.39 | 2.04 | 4.97 | 17.44 | 0 |<br />
Gns | -0.00 | 0.00 | -0.00 | -0.00 | -0.00 | -0.00 | 0 |<br />
Stnd | 1.91 | 0.45 | 2.39 | 0.70 | 1.61 | 3.60 | 0 |<br />
Sprd | 1.91 | 0.45 | 2.39 | 0.70 | 1.61 | 3.60 | 0 |<br />
Udklippet<br />
Min | -15.89 | -1.73 | -12.71 | -1.98 | -15.89 | -13.86 | 0 |<br />
Max | 19.16 | 2.69 | 9.82 | 3.14 | 5.50 | 19.16 | 0 |<br />
Gns | 0.76 | 0.54 | 0.43 | 1.09 | 0.53 | 1.72 | 0 |<br />
Stnd | 1.97 | 0.45 | 2.39 | 0.70 | 1.61 | 3.60 | 0 |<br />
Sprd | 2.10 | 0.70 | 2.43 | 1.30 | 1.70 | 3.99 | 0 |<br />
Udklippet + Offset<br />
Min | - | -2.27 | -13.14 | -3.07 | -16.42 | -15.58 | 0 |<br />
Max | - | 2.15 | 9.39 | 2.04 | 4.97 | 17.44 | 0 |<br />
Gns | - | 0.00 | -0.00 | -0.00 | -0.00 | -0.00 | 0 |<br />
Stnd | - | 0.45 | 2.39 | 0.70 | 1.61 | 3.60 | 0 |<br />
Sprd | - | 0.45 | 2.39 | 0.70 | 1.61 | 3.60 | 0 |<br />
Analysefilen for 1:15,000, opløsningen 60 μm og maskestørrelsen 25 m. før iterationsprocessen.
600<br />
500<br />
400<br />
300<br />
200<br />
100<br />
I.1 Analysis calculations<br />
Fordelingen af afvigelser efter eliminering af grove fejl 1:15.000, 60 μm, 25 m.<br />
Afvigelser Normalfordeling<br />
0<br />
-2.4 -2.2 -2 -1.8 -1.6 -1.4 -1.2 -1 -0.8 -0.6 -0.4 -0.2 0 0.2 0.4 0.6 0.8 1 1.2 1.4 1.6 1.8 2 2.2<br />
| Total |Fladt A 12|Grusgrav 34|Landsby 56|Bakket A 78|Skov 90|Ukendt 00|<br />
Min | -15.89 | -1.73 | -12.71 | -1.98 | -15.89 | -13.86 | 0 |<br />
Max | 19.16 | 2.69 | 9.82 | 3.14 | 5.50 | 19.16 | 0 |<br />
Gns | 0.76 | 0.54 | 0.43 | 1.09 | 0.53 | 1.72 | 0 |<br />
Stnd | 1.96 | 0.45 | 2.39 | 0.70 | 1.61 | 3.60 | 0 |<br />
Sprd | 2.10 | 0.70 | 2.43 | 1.30 | 1.70 | 3.99 | 0 |<br />
Antal | 9370 | 1980 | 1775 | 1611 | 2811 | 1193 | 0 |<br />
Niv'0.8' | 4454 | 1536 | 577 | 488 | 1496 | 357 | 0 |<br />
Niv'1.6' | 2943 | 393 | 563 | 746 | 933 | 308 | 0 |<br />
Niv'2.4' | 973 | 48 | 210 | 339 | 220 | 156 | 0 |<br />
Udklip.pkt| 1000 | 3 | 425 | 38 | 162 | 372 | 0 |<br />
Areal | 803020.7 | 70567.2 | 46920.5 | 331645.2 | 95868.7 | 258019.2 | 0.0 |<br />
Niv'0.8' | 238385.9 | 50969.9 | 15765.6 | 61667.4 | 52000.6 | 57982.4 | 0.0 |<br />
Niv'1.6' | 292787.3 | 16714.5 | 15028.0 | 164750.5 | 33718.5 | 62575.8 | 0.0 |<br />
Niv'2.4' | 151125.9 | 2882.8 | 5454.4 | 93137.4 | 8614.2 | 41037.2 | 0.0 |<br />
Udklip.pkt| 120721.6 | 0.0 | 10672.5 | 12089.9 | 1535.3 | 96423.8 | 0.0 |<br />
Udkl. i % | 10.67 | 0.15 | 23.94 | 2.36 | 5.76 | 31.18 | -0- |<br />
Offset gns. 0.76 0.54 0.43 1.09 0.53 1.72 -0-<br />
Min | -16.42 | -2.27 | -13.14 | -3.07 | -16.42 | -15.58 | 0 |<br />
Max | 17.44 | 2.15 | 9.39 | 2.04 | 4.97 | 17.44 | 0 |<br />
Gns | -0.00 | 0.00 | -0.00 | -0.00 | -0.00 | -0.00 | 0 |<br />
Stnd | 1.91 | 0.45 | 2.39 | 0.70 | 1.61 | 3.60 | 0 |<br />
Sprd | 1.91 | 0.45 | 2.39 | 0.70 | 1.61 | 3.60 | 0 |<br />
Udklippet<br />
Min | -1.87 | -1.73 | -1.54 | -1.27 | -1.87 | -0.66 | 0 |<br />
Max | 4.08 | 2.69 | 1.72 | 3.14 | 2.92 | 4.08 | 0 |<br />
Gns | 0.78 | 0.54 | 0.79 | 1.11 | 0.67 | 1.10 | 0 |<br />
Stnd | 0.76 | 0.45 | 0.57 | 0.67 | 0.71 | 0.97 | 0 |<br />
Sprd | 1.06 | 0.70 | 0.97 | 1.30 | 0.98 | 1.47 | 0 |<br />
Udklippet + Offset<br />
Min | - | -2.27 | -2.33 | -2.38 | -2.54 | -1.76 | 0 |<br />
Max | - | 2.15 | 0.93 | 2.03 | 2.25 | 2.98 | 0 |<br />
Gns | - | 0.00 | -0.00 | -0.00 | -0.00 | -0.00 | 0 |<br />
Stnd | - | 0.45 | 0.57 | 0.67 | 0.71 | 0.97 | 0 |<br />
Sprd | - | 0.45 | 0.57 | 0.67 | 0.71 | 0.97 | 0 |<br />
Analysefilen for 1:15,000, opløsningen 60 μm og maskestørrelsen 25 m. efter iterationsprocessen.<br />
279
Analysis calculations<br />
2000<br />
1800<br />
1600<br />
1400<br />
1200<br />
1000<br />
800<br />
600<br />
400<br />
200<br />
0<br />
Fordelingen af afvigelser for 1:5.000, 15 μm, 5 m.<br />
Afvigelser Normalfordeling<br />
-19 -18 -17 -15 -14 -13 -12 -11 -9.4 -8.2 -7 -5.8 -4.6 -3.4 -2.2 -1 0.2 1.4 2.6 3.8 5 6.2 7.4 8.6 9.8 11 12.2 13.4 14.6 15.8<br />
| Total |Fladt A 12|Grusgrav 34|Landsby 56|Bakket A 78|Skov 90|Ukendt 00|<br />
Min | -18.97 | -0.43 | -2.34 | -13.56 | -16.46 | -18.97 | 0 |<br />
Max | 15.87 | 0.66 | 15.87 | 2.55 | 7.39 | 1.89 | 0 |<br />
Gns | 0.01 | 0.05 | 2.16 | -0.70 | -0.04 | -5.62 | 0 |<br />
Stnd | 2.90 | 0.10 | 4.03 | 2.23 | 1.27 | 5.08 | 0 |<br />
Sprd | 2.90 | 0.11 | 4.58 | 2.34 | 1.27 | 7.58 | 0 |<br />
Antal | 5914 | 1323 | 1143 | 1121 | 2041 | 286 | 0 |<br />
Niv'200.0'| 5914 | 1323 | 1143 | 1121 | 2041 | 286 | 0 |<br />
Niv'400.0'| 0 | 0 | 0 | 0 | 0 | 0 | 0 |<br />
Niv'600.0'| 0 | 0 | 0 | 0 | 0 | 0 | 0 |<br />
Udklip.pkt| 0 | 0 | 0 | 0 | 0 | 0 | 0 |<br />
Areal | 37.4 | 0.0 | 0.0 | 0.0 | 0.0 | 37.4 | 0.0 |<br />
Niv'200.0'| 37.4 | 0.0 | 0.0 | 0.0 | 0.0 | 37.4 | 0.0 |<br />
Niv'400.0'| 0.0 | 0.0 | 0.0 | 0.0 | 0.0 | 0.0 | 0.0 |<br />
Niv'600.0'| 0.0 | 0.0 | 0.0 | 0.0 | 0.0 | 0.0 | 0.0 |<br />
Udklip.pkt| 0.0 | 0.0 | 0.0 | 0.0 | 0.0 | 0.0 | 0.0 |<br />
Udkl. i % | 0.00 | 0.00 | 0.00 | 0.00 | 0.00 | 0.00 | -0- |<br />
Offset gns. 0.01 0.05 2.16 -0.70 -0.04 -5.62 -0-<br />
Min | -16.41 | -0.48 | -4.50 | -12.86 | -16.41 | -13.35 | 0 |<br />
Max | 13.71 | 0.61 | 13.71 | 3.25 | 7.43 | 7.51 | 0 |<br />
Gns | 0.00 | -0.00 | 0.00 | -0.00 | 0.00 | 0.00 | 0 |<br />
Stnd | 2.43 | 0.10 | 4.03 | 2.23 | 1.27 | 5.08 | 0 |<br />
Sprd | 2.43 | 0.10 | 4.03 | 2.23 | 1.27 | 5.08 | 0 |<br />
Udklippet<br />
Min | -18.97 | -0.43 | -2.34 | -13.56 | -16.46 | -18.97 | 0 |<br />
Max | 15.87 | 0.66 | 15.87 | 2.55 | 7.39 | 1.89 | 0 |<br />
Gns | 0.01 | 0.05 | 2.16 | -0.70 | -0.04 | -5.62 | 0 |<br />
Stnd | 2.95 | 0.10 | 4.03 | 2.23 | 1.27 | 5.08 | 0 |<br />
Sprd | 2.90 | 0.11 | 4.58 | 2.34 | 1.27 | 7.58 | 0 |<br />
Udklippet + Offset<br />
Min | - | -0.48 | -4.50 | -12.86 | -16.41 | -13.35 | 0 |<br />
Max | - | 0.61 | 13.71 | 3.25 | 7.43 | 7.51 | 0 |<br />
Gns | - | -0.00 | 0.00 | -0.00 | 0.00 | 0.00 | 0 |<br />
Stnd | - | 0.10 | 4.03 | 2.23 | 1.27 | 5.08 | 0 |<br />
Sprd | - | 0.10 | 4.03 | 2.23 | 1.27 | 5.08 | 0 |<br />
Analysefilen for 1:5,000, opløsningen 15 μm og maskestørrelsen 5 m. før iterationsprocessen.
1800<br />
1600<br />
1400<br />
1200<br />
1000<br />
800<br />
600<br />
400<br />
200<br />
0<br />
I.1 Analysis calculations<br />
Fordelingen af afvigelser efter eliminering af grove fejl 1:5.000, 15 μm, 5 m.<br />
Afvigelser Normalfordeling<br />
-0.4 -0.3 -0.2 -0.1 0 0.1 0.2 0.3<br />
| Total |Fladt A 12|Grusgrav 34|Landsby 56|Bakket A 78|Skov 90|Ukendt 00|<br />
Min | -18.97 | -0.43 | -2.34 | -13.56 | -16.46 | -18.97 | 0 |<br />
Max | 15.87 | 0.66 | 15.87 | 2.55 | 7.39 | 1.89 | 0 |<br />
Gns | 0.01 | 0.05 | 2.16 | -0.70 | -0.04 | -5.62 | 0 |<br />
Stnd | 2.90 | 0.10 | 4.03 | 2.23 | 1.27 | 5.08 | 0 |<br />
Sprd | 2.90 | 0.11 | 4.58 | 2.34 | 1.27 | 7.58 | 0 |<br />
Antal | 5914 | 1323 | 1143 | 1121 | 2041 | 286 | 0 |<br />
Niv'0.1' | 2952 | 992 | 431 | 354 | 1166 | 9 | 0 |<br />
Niv'0.2' | 1467 | 273 | 159 | 356 | 667 | 12 | 0 |<br />
Niv'0.3' | 390 | 44 | 82 | 148 | 108 | 8 | 0 |<br />
Udklip.pkt| 1105 | 14 | 471 | 263 | 100 | 257 | 0 |<br />
Areal | 37.4 | 0.0 | 0.0 | 0.0 | 0.0 | 37.4 | 0.0 |<br />
Niv'0.1' | 0.0 | 0.0 | 0.0 | 0.0 | 0.0 | 0.0 | 0.0 |<br />
Niv'0.2' | 0.0 | 0.0 | 0.0 | 0.0 | 0.0 | 0.0 | 0.0 |<br />
Niv'0.3' | 0.0 | 0.0 | 0.0 | 0.0 | 0.0 | 0.0 | 0.0 |<br />
Udklip.pkt| 37.4 | 0.0 | 0.0 | 0.0 | 0.0 | 37.4 | 0.0 |<br />
Udkl. i % | 18.68 | 1.06 | 41.21 | 23.46 | 4.90 | 89.86 | -0- |<br />
Offset gns. 0.01 0.05 2.16 -0.70 -0.04 -5.62 -0-<br />
Min | -16.41 | -0.48 | -4.50 | -12.86 | -16.41 | -13.35 | 0 |<br />
Max | 13.71 | 0.61 | 13.71 | 3.25 | 7.43 | 7.51 | 0 |<br />
Gns | 0.00 | -0.00 | 0.00 | -0.00 | 0.00 | 0.00 | 0 |<br />
Stnd | 2.43 | 0.10 | 4.03 | 2.23 | 1.27 | 5.08 | 0 |<br />
Sprd | 2.43 | 0.10 | 4.03 | 2.23 | 1.27 | 5.08 | 0 |<br />
Udklippet<br />
Min | -5.94 | -0.28 | 1.92 | -1.00 | -0.35 | -5.94 | 0 |<br />
Max | 2.47 | 0.36 | 2.47 | -0.41 | 0.29 | -5.33 | 0 |<br />
Gns | 0.05 | 0.05 | 2.15 | -0.70 | 0.07 | -5.66 | 0 |<br />
Stnd | 0.42 | 0.09 | 0.19 | 0.21 | 0.09 | 0.21 | 0 |<br />
Sprd | 0.41 | 0.10 | 2.15 | 0.73 | 0.12 | 5.66 | 0 |<br />
Udklippet + Offset<br />
Min | - | -0.32 | -0.22 | -0.30 | -0.43 | -0.28 | 0 |<br />
Max | - | 0.32 | 0.32 | 0.29 | 0.21 | 0.33 | 0 |<br />
Gns | - | -0.00 | -0.00 | -0.00 | -0.00 | 0.00 | 0 |<br />
Stnd | - | 0.09 | 0.19 | 0.21 | 0.09 | 0.21 | 0 |<br />
Sprd | - | 0.09 | 0.19 | 0.21 | 0.09 | 0.21 | 0 |<br />
| Total |Fladt A 12|Grusgrav 34|Landsby 56|Bakket A 78|Skov 90|Ukendt 00|<br />
Analysefilen for 1:5,000, opløsningen 15 μm og maskestørrelsen 5 m. efter iterationsprocessen.<br />
281
Analysis calculations<br />
1600<br />
1400<br />
1200<br />
1000<br />
800<br />
600<br />
400<br />
200<br />
Fordelingen af afvigelser for 1:5.000, 15 μm, 12,5 m.<br />
Afvigelser Normalfordeling<br />
0<br />
-26 -24 -23 -21 -20 -19 -17 -16 -14 -13 -12 -10 -8.8 -7.4 -6 -4.6 -3.2 -1.8 -0.4 1 2.4 3.8 5.2 6.6 8 9.4 10.812.2 13.6 15<br />
Min | -25.60 | -0.49 | -2.87 | -20.25 | -23.28 | -25.60 | 0 |<br />
Max | 16.23 | 0.88 | 16.23 | 3.45 | 11.68 | 1.88 | 0 |<br />
Gns | -0.05 | 0.05 | 2.67 | -0.75 | -0.07 | -6.64 | 0 |<br />
Stnd | 3.23 | 0.11 | 4.61 | 2.75 | 1.84 | 6.12 | 0 |<br />
Sprd | 3.23 | 0.12 | 5.33 | 2.85 | 1.84 | 9.03 | 0 |<br />
Antal | 5265 | 1265 | 764 | 1059 | 1957 | 220 | 0 |<br />
Niv'200.0'| 5265 | 1265 | 764 | 1059 | 1957 | 220 | 0 |<br />
Niv'400.0'| 0 | 0 | 0 | 0 | 0 | 0 | 0 |<br />
Niv'600.0'| 0 | 0 | 0 | 0 | 0 | 0 | 0 |<br />
Udklip.pkt| 0 | 0 | 0 | 0 | 0 | 0 | 0 |<br />
Areal | 22293.4 | 0.0 | 19316.5 | 1800.3 | 0.0 | 1176.5 | 0.0 |<br />
Niv'200.0'| 22293.4 | 0.0 | 19316.5 | 1800.3 | 0.0 | 1176.5 | 0.0 |<br />
Niv'400.0'| 0.0 | 0.0 | 0.0 | 0.0 | 0.0 | 0.0 | 0.0 |<br />
Niv'600.0'| 0.0 | 0.0 | 0.0 | 0.0 | 0.0 | 0.0 | 0.0 |<br />
Udklip.pkt| 0.0 | 0.0 | 0.0 | 0.0 | 0.0 | 0.0 | 0.0 |<br />
Udkl. i % | 0.00 | 0.00 | 0.00 | 0.00 | 0.00 | 0.00 | -0- |<br />
Offset gns. -0.05 0.05 2.67 -0.75 -0.07 -6.64 -0-<br />
Min | -23.21 | -0.54 | -5.54 | -19.50 | -23.21 | -18.96 | 0 |<br />
Max | 13.56 | 0.83 | 13.56 | 4.20 | 11.75 | 8.51 | 0 |<br />
Gns | -0.00 | -0.00 | -0.00 | -0.00 | 0.00 | 0.00 | 0 |<br />
Stnd | 2.72 | 0.11 | 4.61 | 2.75 | 1.84 | 6.12 | 0 |<br />
Sprd | 2.72 | 0.11 | 4.61 | 2.75 | 1.84 | 6.12 | 0 |<br />
Udklippet<br />
Min | -25.60 | -0.49 | -2.87 | -20.25 | -23.28 | -25.60 | 0 |<br />
Max | 16.23 | 0.88 | 16.23 | 3.45 | 11.68 | 1.88 | 0 |<br />
Gns | -0.05 | 0.05 | 2.67 | -0.75 | -0.07 | -6.64 | 0 |<br />
Stnd | 3.27 | 0.11 | 4.61 | 2.75 | 1.84 | 6.12 | 0 |<br />
Sprd | 3.23 | 0.12 | 5.33 | 2.85 | 1.84 | 9.03 | 0 |<br />
Udklippet + Offset<br />
Min | - | -0.54 | -5.54 | -19.50 | -23.21 | -18.96 | 0 |<br />
Max | - | 0.83 | 13.56 | 4.20 | 11.75 | 8.51 | 0 |<br />
Gns | - | -0.00 | -0.00 | -0.00 | 0.00 | 0.00 | 0 |<br />
Stnd | - | 0.11 | 4.61 | 2.75 | 1.84 | 6.12 | 0 |<br />
Sprd | - | 0.11 | 4.61 | 2.75 | 1.84 | 6.12 | 0 |<br />
Analysefilen for 1:5,000, opløsningen 15 μm og maskestørrelsen 12.5 m. før iterationsprocessen.
1400<br />
1200<br />
1000<br />
800<br />
600<br />
400<br />
200<br />
0<br />
I.1 Analysis calculations<br />
Fordelingen af afvigelser efter eliminering af grove fejl 1:5.000, 15 μm, 12,5 m.<br />
Afvigelser Normalfordeling<br />
-0.4 -0.3 -0.2 -0.1 0 0.1 0.2 0.3<br />
| Total |Fladt A 12|Grusgrav 34|Landsby 56|Bakket A 78|Skov 90|Ukendt 00|<br />
Min | -25.60 | -0.49 | -2.87 | -20.25 | -23.28 | -25.60 | 0 |<br />
Max | 16.23 | 0.88 | 16.23 | 3.45 | 11.68 | 1.88 | 0 |<br />
Gns | -0.05 | 0.05 | 2.67 | -0.75 | -0.07 | -6.64 | 0 |<br />
Stnd | 3.23 | 0.11 | 4.61 | 2.75 | 1.84 | 6.12 | 0 |<br />
Sprd | 3.23 | 0.12 | 5.33 | 2.85 | 1.84 | 9.03 | 0 |<br />
Antal | 5265 | 1265 | 764 | 1059 | 1957 | 220 | 0 |<br />
Niv'0.1' | 2592 | 965 | 171 | 327 | 1119 | 10 | 0 |<br />
Niv'0.2' | 1180 | 228 | 95 | 339 | 517 | 1 | 0 |<br />
Niv'0.4' | 387 | 59 | 45 | 131 | 149 | 3 | 0 |<br />
Udklip.pkt| 1106 | 13 | 453 | 262 | 172 | 206 | 0 |<br />
Areal | 22293.4 | 0.0 | 19316.5 | 1800.3 | 0.0 | 1176.5 | 0.0 |<br />
Niv'0.1' | 5137.8 | 0.0 | 4331.3 | 691.7 | 0.0 | 114.9 | 0.0 |<br />
Niv'0.2' | 2719.6 | 0.0 | 2425.0 | 294.6 | 0.0 | 0.0 | 0.0 |<br />
Niv'0.4' | 1187.5 | 0.0 | 1162.5 | 25.0 | 0.0 | 0.0 | 0.0 |<br />
Udklip.pkt| 13248.6 | 0.0 | 11397.8 | 789.1 | 0.0 | 1061.7 | 0.0 |<br />
Udkl. i % | 21.01 | 1.03 | 59.29 | 24.74 | 8.79 | 93.64 | -0- |<br />
Offset gns. -0.05 0.05 2.67 -0.75 -0.07 -6.64 -0-<br />
Min | -23.21 | -0.54 | -5.54 | -19.50 | -23.21 | -18.96 | 0 |<br />
Max | 13.56 | 0.83 | 13.56 | 4.20 | 11.75 | 8.51 | 0 |<br />
Gns | -0.00 | -0.00 | -0.00 | -0.00 | 0.00 | 0.00 | 0 |<br />
Stnd | 2.72 | 0.11 | 4.61 | 2.75 | 1.84 | 6.12 | 0 |<br />
Sprd | 2.72 | 0.11 | 4.61 | 2.75 | 1.84 | 6.12 | 0 |<br />
Udklippet<br />
Min | -6.98 | -0.32 | 0 | -1.06 | -0.39 | -6.98 | 0 |<br />
Max | 0.41 | 0.41 | 0 | -0.38 | 0.30 | -6.35 | 0 |<br />
Gns | 0.04 | 0.05 | 0 | -0.66 | 0.06 | -6.72 | 0 |<br />
Stnd | 0.33 | 0.10 | 0 | 0.19 | 0.11 | 0.23 | 0 |<br />
Sprd | 0.31 | 0.11 | 0 | 0.68 | 0.13 | 6.72 | 0 |<br />
Udklippet + Offset<br />
Min | - | -0.37 | 0 | -0.40 | -0.46 | -0.26 | 0 |<br />
Max | - | 0.36 | 0 | 0.28 | 0.24 | 0.37 | 0 |<br />
Gns | - | 0.00 | 0 | -0.00 | -0.00 | 0.00 | 0 |<br />
Stnd | - | 0.10 | 0 | 0.19 | 0.11 | 0.23 | 0 |<br />
Sprd | - | 0.10 | 0 | 0.19 | 0.11 | 0.23 | 0 |<br />
Analysefilen for 1:5,000, opløsningen 15 μm og maskestørrelsen 12.5 m. efter iterationsprocessen.<br />
283
Analysis calculations<br />
1200<br />
1000<br />
800<br />
600<br />
400<br />
200<br />
Fordelingen af afvigelser for 1:5000_15μm_25m.<br />
Afvigelser Normalfordeling<br />
0<br />
-18 -17 -16 -15 -13 -12 -11 -9.3 -8 -6.7 -5.4 -4.1 -2.8 -1.5 -0.2 1.1 2.4 3.7 5 6.3 7.6 8.9 10.2 11.5 12.8 14.1 15.4 16.7 18<br />
| Total |Fladt A 12|Grusgrav 34|Landsby 56|Bakket A 78|Skov 90|Ukendt 00|<br />
Min | -18.31 | -0.85 | -3.58 | -13.08 | -15.87 | -18.31 | 0 |<br />
Max | 19.11 | 0.92 | 19.11 | 3.81 | 11.76 | 2.51 | 0 |<br />
Gns | 0.10 | 0.04 | 3.58 | -0.43 | -0.06 | -5.93 | 0 |<br />
Stnd | 3.29 | 0.13 | 5.69 | 1.74 | 1.54 | 4.92 | 0 |<br />
Sprd | 3.29 | 0.14 | 6.72 | 1.80 | 1.54 | 7.70 | 0 |<br />
Antal | 5489 | 1323 | 764 | 1120 | 2001 | 281 | 0 |<br />
Niv'200.0'| 5489 | 1323 | 764 | 1120 | 2001 | 281 | 0 |<br />
Niv'400.0'| 0 | 0 | 0 | 0 | 0 | 0 | 0 |<br />
Niv'600.0'| 0 | 0 | 0 | 0 | 0 | 0 | 0 |<br />
Udklip.pkt| 0 | 0 | 0 | 0 | 0 | 0 | 0 |<br />
Areal | 413999.0 | 37649.1 | 20785.3 | 264814.4 | 21339.2 | 69411.0 | 0.0 |<br />
Niv'200.0'| 413999.0 | 37649.1 | 20785.3 | 264814.4 | 21339.2 | 69411.0 | 0.0 |<br />
Niv'400.0'| 0.0 | 0.0 | 0.0 | 0.0 | 0.0 | 0.0 | 0.0 |<br />
Niv'600.0'| 0.0 | 0.0 | 0.0 | 0.0 | 0.0 | 0.0 | 0.0 |<br />
Udklip.pkt| 0.0 | 0.0 | 0.0 | 0.0 | 0.0 | 0.0 | 0.0 |<br />
Udkl. i % | 0.00 | 0.00 | 0.00 | 0.00 | 0.00 | 0.00 | -0- |<br />
Offset gns. 0.10 0.04 3.58 -0.43 -0.06 -5.93 -0-<br />
Min | -15.81 | -0.89 | -7.16 | -12.65 | -15.81 | -12.38 | 0 |<br />
Max | 15.53 | 0.88 | 15.53 | 4.24 | 11.82 | 8.43 | 0 |<br />
Gns | -0.00 | 0.00 | 0.00 | -0.00 | 0.00 | -0.00 | 0 |<br />
Stnd | 2.69 | 0.13 | 5.69 | 1.74 | 1.54 | 4.92 | 0 |<br />
Sprd | 2.69 | 0.13 | 5.69 | 1.74 | 1.54 | 4.92 | 0 |<br />
Udklippet<br />
Min | -18.31 | -0.85 | -3.58 | -13.08 | -15.87 | -18.31 | 0 |<br />
Max | 19.11 | 0.92 | 19.11 | 3.81 | 11.76 | 2.51 | 0 |<br />
Gns | 0.10 | 0.04 | 3.58 | -0.43 | -0.06 | -5.93 | 0 |<br />
Stnd | 3.32 | 0.13 | 5.69 | 1.74 | 1.54 | 4.92 | 0 |<br />
Sprd | 3.29 | 0.14 | 6.72 | 1.80 | 1.54 | 7.70 | 0 |<br />
Udklippet + Offset<br />
Min | - | -0.89 | -7.16 | -12.65 | -15.81 | -12.38 | 0 |<br />
Max | - | 0.88 | 15.53 | 4.24 | 11.82 | 8.43 | 0 |<br />
Gns | - | 0.00 | 0.00 | -0.00 | 0.00 | -0.00 | 0 |<br />
Stnd | - | 0.13 | 5.69 | 1.74 | 1.54 | 4.92 | 0 |<br />
Sprd | - | 0.13 | 5.69 | 1.74 | 1.54 | 4.92 | 0 |<br />
Analysefilen for 1:5,000, opløsningen 15 μm og maskestørrelsen 25 m. før iterationsprocessen.
1200<br />
1000<br />
800<br />
600<br />
400<br />
200<br />
0<br />
I.1 Analysis calculations<br />
Fordelingen af afvigelser efter eliminering af grove fejl 1:5.000, 15 μm, 25 m.<br />
Afvigelser Normalfordeling<br />
-0.6 -0.5 -0.4 -0.3 -0.2 -0.1 0 0.1 0.2 0.3 0.4 0.5<br />
| Total |Fladt A 12|Grusgrav 34|Landsby 56|Bakket A 78|Skov 90|Ukendt 00|<br />
Min | -18.31 | -0.85 | -3.58 | -13.08 | -15.87 | -18.31 | 0 |<br />
Max | 19.11 | 0.92 | 19.11 | 3.81 | 11.76 | 2.51 | 0 |<br />
Gns | 0.10 | 0.04 | 3.58 | -0.43 | -0.06 | -5.93 | 0 |<br />
Stnd | 3.29 | 0.13 | 5.69 | 1.74 | 1.54 | 4.92 | 0 |<br />
Sprd | 3.29 | 0.14 | 6.72 | 1.80 | 1.54 | 7.70 | 0 |<br />
Antal | 5489 | 1323 | 764 | 1120 | 2001 | 281 | 0 |<br />
Niv'0.2' | 2851 | 1126 | 138 | 460 | 1118 | 9 | 0 |<br />
Niv'0.4' | 988 | 163 | 80 | 279 | 459 | 7 | 0 |<br />
Niv'0.6' | 314 | 26 | 48 | 74 | 162 | 4 | 0 |<br />
Udklip.pkt| 1336 | 8 | 498 | 307 | 262 | 261 | 0 |<br />
Areal | 413999.0 | 37649.1 | 20785.3 | 264814.4 | 21339.2 | 69411.0 | 0.0 |<br />
Niv'0.2' | 157766.4 | 25833.2 | 4237.5 | 114187.0 | 13072.0 | 436.6 | 0.0 |<br />
Niv'0.4' | 93051.9 | 9843.5 | 2212.5 | 74056.9 | 4635.7 | 2303.2 | 0.0 |<br />
Niv'0.6' | 18710.6 | 1172.3 | 1362.5 | 14041.8 | 1882.9 | 251.1 | 0.0 |<br />
Udklip.pkt| 144470.2 | 800.1 | 12972.8 | 62528.6 | 1748.6 | 66420.1 | 0.0 |<br />
Udkl. i % | 24.34 | 0.60 | 65.18 | 27.41 | 13.09 | 92.88 | -0- |<br />
Offset gns. 0.10 0.04 3.58 -0.43 -0.06 -5.93 -0-<br />
Min | -15.81 | -0.89 | -7.16 | -12.65 | -15.81 | -12.38 | 0 |<br />
Max | 15.53 | 0.88 | 15.53 | 4.24 | 11.82 | 8.43 | 0 |<br />
Gns | -0.00 | 0.00 | 0.00 | -0.00 | 0.00 | -0.00 | 0 |<br />
Stnd | 2.69 | 0.13 | 5.69 | 1.74 | 1.54 | 4.92 | 0 |<br />
Sprd | 2.69 | 0.13 | 5.69 | 1.74 | 1.54 | 4.92 | 0 |<br />
Udklippet<br />
Min | -6.40 | -0.47 | 0 | -0.98 | -0.60 | -6.40 | 0 |<br />
Max | 0.58 | 0.58 | 0 | 0.12 | 0.49 | -5.56 | 0 |<br />
Gns | 0.03 | 0.04 | 0 | -0.11 | 0.06 | -6.01 | 0 |<br />
Stnd | 0.35 | 0.12 | 0 | 0.26 | 0.19 | 0.28 | 0 |<br />
Sprd | 0.35 | 0.13 | 0 | 0.28 | 0.20 | 6.02 | 0 |<br />
Udklippet + Offset<br />
Min | - | -0.52 | 0 | -0.87 | -0.66 | -0.38 | 0 |<br />
Max | - | 0.53 | 0 | 0.23 | 0.44 | 0.45 | 0 |<br />
Gns | - | 0.00 | 0 | -0.00 | 0.00 | 0.00 | 0 |<br />
Stnd | - | 0.12 | 0 | 0.26 | 0.19 | 0.28 | 0 |<br />
Sprd | - | 0.12 | 0 | 0.26 | 0.19 | 0.28 | 0 |<br />
Analysefilen for 1:5,000, opløsningen 15 μm og maskestørrelsen 25 m. efter iterationsprocessen.<br />
285
Analysis calculations<br />
1800<br />
1600<br />
1400<br />
1200<br />
1000<br />
800<br />
600<br />
400<br />
200<br />
0<br />
Fordelingen af afvigelser for 1:5.000, 30 μm, 5 m.<br />
Afvigelser Normalfordeling<br />
-16 -15 -14 -13 -12 -11 -9.9 -8.9 -7.9 -6.9 -5.9 -4.9 -3.9 -2.9 -1.9 -0.9 0.1 1.1 2.1 3.1 4.1 5.1 6.1 7.1 8.1 9.1 10.1 11.1 12.1 13.1<br />
| Total |Fladt A 12|Grusgrav 34|Landsby 56|Bakket A 78|Skov 90|Ukendt 00|<br />
Min | -15.81 | -0.52 | -2.49 | -9.34 | -11.81 | -15.81 | 0 |<br />
Max | 13.29 | 1.03 | 13.29 | 3.43 | 3.52 | 4.01 | 0 |<br />
Gns | 0.07 | 0.04 | 1.54 | -0.31 | -0.02 | -3.59 | 0 |<br />
Stnd | 2.19 | 0.12 | 3.15 | 1.41 | 0.80 | 4.76 | 0 |<br />
Sprd | 2.19 | 0.13 | 3.50 | 1.44 | 0.80 | 5.96 | 0 |<br />
Antal | 5795 | 1319 | 1143 | 1105 | 1942 | 286 | 0 |<br />
Niv'200.0'| 5795 | 1319 | 1143 | 1105 | 1942 | 286 | 0 |<br />
Niv'400.0'| 0 | 0 | 0 | 0 | 0 | 0 | 0 |<br />
Niv'600.0'| 0 | 0 | 0 | 0 | 0 | 0 | 0 |<br />
Udklip.pkt| 0 | 0 | 0 | 0 | 0 | 0 | 0 |<br />
Areal | 37.4 | 0.0 | 0.0 | 0.0 | 0.0 | 37.4 | 0.0 |<br />
Niv'200.0'| 37.4 | 0.0 | 0.0 | 0.0 | 0.0 | 37.4 | 0.0 |<br />
Niv'400.0'| 0.0 | 0.0 | 0.0 | 0.0 | 0.0 | 0.0 | 0.0 |<br />
Niv'600.0'| 0.0 | 0.0 | 0.0 | 0.0 | 0.0 | 0.0 | 0.0 |<br />
Udklip.pkt| 0.0 | 0.0 | 0.0 | 0.0 | 0.0 | 0.0 | 0.0 |<br />
Udkl. i % | 0.00 | 0.00 | 0.00 | 0.00 | 0.00 | 0.00 | -0- |<br />
Offset gns. 0.07 0.04 1.54 -0.31 -0.02 -3.59 -0-<br />
Min | -12.21 | -0.56 | -4.04 | -9.03 | -11.79 | -12.21 | 0 |<br />
Max | 11.74 | 0.99 | 11.74 | 3.74 | 3.54 | 7.60 | 0 |<br />
Gns | 0.00 | 0.00 | 0.00 | 0.00 | -0.00 | -0.00 | 0 |<br />
Stnd | 1.91 | 0.12 | 3.15 | 1.41 | 0.80 | 4.76 | 0 |<br />
Sprd | 1.91 | 0.12 | 3.15 | 1.41 | 0.80 | 4.76 | 0 |<br />
Udklippet<br />
Min | -15.81 | -0.52 | -2.49 | -9.34 | -11.81 | -15.81 | 0 |<br />
Max | 13.29 | 1.03 | 13.29 | 3.43 | 3.52 | 4.01 | 0 |<br />
Gns | 0.07 | 0.04 | 1.54 | -0.31 | -0.02 | -3.59 | 0 |<br />
Stnd | 2.21 | 0.12 | 3.15 | 1.41 | 0.80 | 4.76 | 0 |<br />
Sprd | 2.19 | 0.13 | 3.50 | 1.44 | 0.80 | 5.96 | 0 |<br />
Udklippet + Offset<br />
Min | - | -0.56 | -4.04 | -9.03 | -11.79 | -12.21 | 0 |<br />
Max | - | 0.99 | 11.74 | 3.74 | 3.54 | 7.60 | 0 |<br />
Gns | - | 0.00 | 0.00 | 0.00 | -0.00 | -0.00 | 0 |<br />
Stnd | - | 0.12 | 3.15 | 1.41 | 0.80 | 4.76 | 0 |<br />
Sprd | - | 0.12 | 3.15 | 1.41 | 0.80 | 4.76 | 0 |<br />
Analysefilen for 1:5,000, opløsningen 30 μm og maskestørrelsen 5 m. før iterationsprocessen.
1600<br />
1400<br />
1200<br />
1000<br />
800<br />
600<br />
400<br />
200<br />
0<br />
I.1 Analysis calculations<br />
Fordelingen af afvigelser efter eliminering af grove fejl 1:5.000, 30 μm, 5 m.<br />
Afvigelser Normalfordeling<br />
-0.4 -0.3 -0.2 -0.1 0 0.1 0.2 0.3<br />
| Total |Fladt A 12|Grusgrav 34|Landsby 56|Bakket A 78|Skov 90|Ukendt 00|<br />
Min | -15.81 | -0.52 | -2.49 | -9.34 | -11.81 | -15.81 | 0 |<br />
Max | 13.29 | 1.03 | 13.29 | 3.43 | 3.52 | 4.01 | 0 |<br />
Gns | 0.07 | 0.04 | 1.54 | -0.31 | -0.02 | -3.59 | 0 |<br />
Stnd | 2.19 | 0.12 | 3.15 | 1.41 | 0.80 | 4.76 | 0 |<br />
Sprd | 2.19 | 0.13 | 3.50 | 1.44 | 0.80 | 5.96 | 0 |<br />
Antal | 5795 | 1319 | 1143 | 1105 | 1942 | 286 | 0 |<br />
Niv'0.1' | 3146 | 1019 | 452 | 370 | 1289 | 16 | 0 |<br />
Niv'0.3' | 1200 | 245 | 190 | 299 | 457 | 9 | 0 |<br />
Niv'0.4' | 368 | 41 | 88 | 134 | 102 | 3 | 0 |<br />
Udklip.pkt| 1081 | 14 | 413 | 302 | 94 | 258 | 0 |<br />
Areal | 37.4 | 0.0 | 0.0 | 0.0 | 0.0 | 37.4 | 0.0 |<br />
Niv'0.1' | 0.0 | 0.0 | 0.0 | 0.0 | 0.0 | 0.0 | 0.0 |<br />
Niv'0.3' | 0.0 | 0.0 | 0.0 | 0.0 | 0.0 | 0.0 | 0.0 |<br />
Niv'0.4' | 18.7 | 0.0 | 0.0 | 0.0 | 0.0 | 18.7 | 0.0 |<br />
Udklip.pkt| 18.7 | 0.0 | 0.0 | 0.0 | 0.0 | 18.7 | 0.0 |<br />
Udkl. i % | 18.65 | 1.06 | 36.13 | 27.33 | 4.84 | 90.21 | -0- |<br />
Offset gns. 0.07 0.04 1.54 -0.31 -0.02 -3.59 -0-<br />
Min | -12.21 | -0.56 | -4.04 | -9.03 | -11.79 | -12.21 | 0 |<br />
Max | 11.74 | 0.99 | 11.74 | 3.74 | 3.54 | 7.60 | 0 |<br />
Gns | 0.00 | 0.00 | 0.00 | 0.00 | -0.00 | -0.00 | 0 |<br />
Stnd | 1.91 | 0.12 | 3.15 | 1.41 | 0.80 | 4.76 | 0 |<br />
Sprd | 1.91 | 0.12 | 3.15 | 1.41 | 0.80 | 4.76 | 0 |<br />
Udklippet<br />
Min | -3.95 | -0.34 | 1.15 | -0.65 | -0.40 | -3.95 | 0 |<br />
Max | 1.89 | 0.42 | 1.89 | 0.08 | 0.37 | -3.34 | 0 |<br />
Gns | 0.04 | 0.04 | 1.47 | -0.05 | 0.06 | -3.64 | 0 |<br />
Stnd | 0.30 | 0.11 | 0.25 | 0.13 | 0.11 | 0.19 | 0 |<br />
Sprd | 0.30 | 0.11 | 1.49 | 0.14 | 0.13 | 3.64 | 0 |<br />
Udklippet + Offset<br />
Min | - | -0.38 | -0.31 | -0.60 | -0.46 | -0.31 | 0 |<br />
Max | - | 0.38 | 0.42 | 0.13 | 0.31 | 0.29 | 0 |<br />
Gns | - | 0.00 | 0.00 | 0.00 | -0.00 | 0.00 | 0 |<br />
Stnd | - | 0.11 | 0.25 | 0.13 | 0.11 | 0.19 | 0 |<br />
Sprd | - | 0.11 | 0.25 | 0.13 | 0.11 | 0.19 | 0 |<br />
Analysefilen for 1:5,000, opløsningen 30 μm og maskestørrelsen 5 m. efter iterationsprocessen.<br />
287
Analysis calculations<br />
1400<br />
1200<br />
1000<br />
800<br />
600<br />
400<br />
200<br />
Fordelingen af afvigelser for 1:5.000, 30 μm, 12,5 m.<br />
Afvigelser Normalfordeling<br />
0<br />
-16 -15 -14 -13 -12 -11 -9.4 -8.3 -7.2 -6.1 -5 -3.9 -2.8 -1.7 -0.6 0.5 1.6 2.7 3.8 4.9 6 7.1 8.2 9.3 10.4 11.5 12.6 13.7 14.8<br />
| Total |Fladt A 12|Grusgrav 34|Landsby 56|Bakket A 78|Skov 90|Ukendt 00|<br />
Min | -15.91 | -0.45 | -2.85 | -13.13 | -15.91 | -15.44 | 0 |<br />
Max | 15.04 | 0.59 | 15.04 | 2.84 | 8.59 | 10.00 | 0 |<br />
Gns | 0.15 | 0.04 | 2.38 | -0.40 | 0.00 | -1.14 | 0 |<br />
Stnd | 2.43 | 0.11 | 4.24 | 1.64 | 1.25 | 4.32 | 0 |<br />
Sprd | 2.44 | 0.12 | 4.86 | 1.69 | 1.25 | 4.47 | 0 |<br />
Antal | 5741 | 1320 | 764 | 1180 | 2001 | 476 | 0 |<br />
Niv'200.0'| 5741 | 1320 | 764 | 1180 | 2001 | 476 | 0 |<br />
Niv'400.0'| 0 | 0 | 0 | 0 | 0 | 0 | 0 |<br />
Niv'600.0'| 0 | 0 | 0 | 0 | 0 | 0 | 0 |<br />
Udklip.pkt| 0 | 0 | 0 | 0 | 0 | 0 | 0 |<br />
Areal | 23792.7 | 0.0 | 19316.5 | 1800.3 | 0.0 | 2675.8 | 0.0 |<br />
Niv'200.0'| 23792.7 | 0.0 | 19316.5 | 1800.3 | 0.0 | 2675.8 | 0.0 |<br />
Niv'400.0'| 0.0 | 0.0 | 0.0 | 0.0 | 0.0 | 0.0 | 0.0 |<br />
Niv'600.0'| 0.0 | 0.0 | 0.0 | 0.0 | 0.0 | 0.0 | 0.0 |<br />
Udklip.pkt| 0.0 | 0.0 | 0.0 | 0.0 | 0.0 | 0.0 | 0.0 |<br />
Udkl. i % | 0.00 | 0.00 | 0.00 | 0.00 | 0.00 | 0.00 | -0- |<br />
Offset gns. 0.15 0.04 2.38 -0.40 0.00 -1.14 -0-<br />
Min | -15.91 | -0.50 | -5.23 | -12.73 | -15.91 | -14.30 | 0 |<br />
Max | 12.66 | 0.55 | 12.66 | 3.24 | 8.59 | 11.14 | 0 |<br />
Gns | 0.00 | -0.00 | 0.00 | -0.00 | -0.00 | -0.00 | 0 |<br />
Stnd | 2.25 | 0.11 | 4.24 | 1.64 | 1.25 | 4.32 | 0 |<br />
Sprd | 2.25 | 0.11 | 4.24 | 1.64 | 1.25 | 4.32 | 0 |<br />
Udklippet<br />
Min | -15.91 | -0.45 | -2.85 | -13.13 | -15.91 | -15.44 | 0 |<br />
Max | 15.04 | 0.59 | 15.04 | 2.84 | 8.59 | 10.00 | 0 |<br />
Gns | 0.15 | 0.04 | 2.38 | -0.40 | 0.00 | -1.14 | 0 |<br />
Stnd | 2.47 | 0.11 | 4.24 | 1.64 | 1.25 | 4.32 | 0 |<br />
Sprd | 2.44 | 0.12 | 4.86 | 1.69 | 1.25 | 4.47 | 0 |<br />
Udklippet + Offset<br />
Min | - | -0.50 | -5.23 | -12.73 | -15.91 | -14.30 | 0 |<br />
Max | - | 0.55 | 12.66 | 3.24 | 8.59 | 11.14 | 0 |<br />
Gns | - | -0.00 | 0.00 | -0.00 | -0.00 | -0.00 | 0 |<br />
Stnd | - | 0.11 | 4.24 | 1.64 | 1.25 | 4.32 | 0 |<br />
Sprd | - | 0.11 | 4.24 | 1.64 | 1.25 | 4.32 | 0 |<br />
Analysefilen for 1:5,000, opløsningen 30 μm og maskestørrelsen 12.5 m. før iterationsprocessen.
1400<br />
1200<br />
1000<br />
800<br />
600<br />
400<br />
200<br />
0<br />
I.1 Analysis calculations<br />
Fordelingen af afvigelser efter eliminering af grove fejl 1:5.000, 30 μm, 12,5 m.<br />
Afvigelser Normalfordeling<br />
-0.5 -0.4 -0.3 -0.2 -0.1 0 0.1 0.2 0.3 0.4<br />
| Total |Fladt A 12|Grusgrav 34|Landsby 56|Bakket A 78|Skov 90|Ukendt 00|<br />
Min | -15.91 | -0.45 | -2.85 | -13.13 | -15.91 | -15.44 | 0 |<br />
Max | 15.04 | 0.59 | 15.04 | 2.84 | 11.46 | 10.00 | 0 |<br />
Gns | 0.14 | 0.04 | 2.38 | -0.39 | 0.01 | -1.18 | 0 |<br />
Stnd | 2.44 | 0.11 | 4.24 | 1.64 | 1.26 | 4.32 | 0 |<br />
Sprd | 2.45 | 0.12 | 4.86 | 1.69 | 1.26 | 4.48 | 0 |<br />
Antal | 5816 | 1320 | 764 | 1190 | 2041 | 501 | 0 |<br />
Niv'0.2' | 3139 | 1132 | 195 | 480 | 1301 | 31 | 0 |<br />
Niv'0.3' | 1069 | 166 | 115 | 330 | 433 | 25 | 0 |<br />
Niv'0.5' | 335 | 19 | 47 | 110 | 127 | 32 | 0 |<br />
Udklip.pkt| 1273 | 3 | 407 | 270 | 180 | 413 | 0 |<br />
Areal | 23880.6 | 0.0 | 19316.5 | 1800.3 | 0.0 | 2763.7 | 0.0 |<br />
Niv'0.2' | 6223.5 | 0.0 | 4968.8 | 1133.7 | 0.0 | 121.1 | 0.0 |<br />
Niv'0.3' | 3109.9 | 0.0 | 2937.5 | 172.4 | 0.0 | 0.0 | 0.0 |<br />
Niv'0.5' | 1187.5 | 0.0 | 1187.5 | 0.0 | 0.0 | 0.0 | 0.0 |<br />
Udklip.pkt| 13359.6 | 0.0 | 10222.8 | 494.3 | 0.0 | 2642.6 | 0.0 |<br />
Udkl. i % | 21.89 | 0.23 | 53.27 | 22.69 | 8.82 | 82.44 | -0- |<br />
Offset gns. 0.14 0.04 2.38 -0.39 0.01 -1.18 -0-<br />
Min | -15.92 | -0.50 | -5.23 | -12.74 | -15.92 | -14.26 | 0 |<br />
Max | 12.66 | 0.55 | 12.66 | 3.23 | 11.45 | 11.18 | 0 |<br />
Gns | 0.00 | 0.00 | 0.00 | -0.00 | 0.00 | 0.00 | 0 |<br />
Stnd | 2.25 | 0.11 | 4.24 | 1.64 | 1.26 | 4.32 | 0 |<br />
Sprd | 2.25 | 0.11 | 4.24 | 1.64 | 1.26 | 4.32 | 0 |<br />
Udklippet<br />
Min | -1.60 | -0.45 | 1.92 | -0.89 | -0.47 | -1.60 | 0 |<br />
Max | 2.85 | 0.54 | 2.85 | 0.11 | 0.51 | -0.72 | 0 |<br />
Gns | 0.04 | 0.04 | 2.38 | -0.07 | 0.06 | -1.17 | 0 |<br />
Stnd | 0.31 | 0.11 | 0.30 | 0.19 | 0.16 | 0.28 | 0 |<br />
Sprd | 0.30 | 0.12 | 2.39 | 0.21 | 0.17 | 1.20 | 0 |<br />
Udklippet + Offset<br />
Min | - | -0.50 | -0.45 | -0.82 | -0.53 | -0.43 | 0 |<br />
Max | - | 0.50 | 0.47 | 0.18 | 0.45 | 0.45 | 0 |<br />
Gns | - | 0.00 | 0.00 | 0.00 | 0.00 | -0.00 | 0 |<br />
Stnd | - | 0.11 | 0.30 | 0.19 | 0.16 | 0.28 | 0 |<br />
Sprd | - | 0.11 | 0.30 | 0.19 | 0.16 | 0.28 | 0 |<br />
Analysefilen for 1:5,000, opløsningen 30 μm og maskestørrelsen 12.5 m. efter iterationsprocessen.<br />
289
Analysis calculations<br />
1000<br />
900<br />
800<br />
700<br />
600<br />
500<br />
400<br />
300<br />
200<br />
100<br />
Fordelingen af afvigelser for 1:5.000, 30 μm, 25 m.<br />
Afvigelser Normalfordeling<br />
0<br />
-18 -17 -16 -14 -13 -12 -11 -9.6 -8.4 -7.2 -6 -4.8 -3.6 -2.4 -1.2 0 1.2 2.4 3.6 4.8 6 7.2 8.4 9.6 10.8 12 13.2 14.4<br />
| Total |Fladt A 12|Grusgrav 34|Landsby 56|Bakket A 78|Skov 90|Ukendt 00|<br />
Min | -17.93 | -0.62 | -3.44 | -15.08 | -17.93 | -17.61 | 0 |<br />
Max | 15.55 | 0.70 | 15.55 | 3.28 | 11.73 | 3.44 | 0 |<br />
Gns | 0.01 | 0.04 | 2.70 | -0.51 | -0.09 | -4.63 | 0 |<br />
Stnd | 2.87 | 0.14 | 4.63 | 1.96 | 1.67 | 5.01 | 0 |<br />
Sprd | 2.87 | 0.14 | 5.37 | 2.03 | 1.68 | 6.82 | 0 |<br />
Antal | 5489 | 1323 | 764 | 1120 | 2001 | 281 | 0 |<br />
Niv'200.0'| 5489 | 1323 | 764 | 1120 | 2001 | 281 | 0 |<br />
Niv'400.0'| 0 | 0 | 0 | 0 | 0 | 0 | 0 |<br />
Niv'600.0'| 0 | 0 | 0 | 0 | 0 | 0 | 0 |<br />
Udklip.pkt| 0 | 0 | 0 | 0 | 0 | 0 | 0 |<br />
Areal | 413999.0 | 37649.1 | 20785.3 | 264814.4 | 21339.2 | 69411.0 | 0.0 |<br />
Niv'200.0'| 413999.0 | 37649.1 | 20785.3 | 264814.4 | 21339.2 | 69411.0 | 0.0 |<br />
Niv'400.0'| 0.0 | 0.0 | 0.0 | 0.0 | 0.0 | 0.0 | 0.0 |<br />
Niv'600.0'| 0.0 | 0.0 | 0.0 | 0.0 | 0.0 | 0.0 | 0.0 |<br />
Udklip.pkt| 0.0 | 0.0 | 0.0 | 0.0 | 0.0 | 0.0 | 0.0 |<br />
Udkl. i % | 0.00 | 0.00 | 0.00 | 0.00 | 0.00 | 0.00 | -0- |<br />
Offset gns. 0.01 0.04 2.70 -0.51 -0.09 -4.63 -0-<br />
Min | -17.85 | -0.66 | -6.14 | -14.58 | -17.85 | -12.98 | 0 |<br />
Max | 12.84 | 0.66 | 12.84 | 3.78 | 11.82 | 8.08 | 0 |<br />
Gns | 0.00 | 0.00 | -0.00 | 0.00 | 0.00 | 0.00 | 0 |<br />
Stnd | 2.47 | 0.14 | 4.63 | 1.96 | 1.67 | 5.01 | 0 |<br />
Sprd | 2.47 | 0.14 | 4.63 | 1.96 | 1.67 | 5.01 | 0 |<br />
Udklippet<br />
Min | -17.93 | -0.62 | -3.44 | -15.08 | -17.93 | -17.61 | 0 |<br />
Max | 15.55 | 0.70 | 15.55 | 3.28 | 11.73 | 3.44 | 0 |<br />
Gns | 0.01 | 0.04 | 2.70 | -0.51 | -0.09 | -4.63 | 0 |<br />
Stnd | 2.90 | 0.14 | 4.63 | 1.96 | 1.67 | 5.01 | 0 |<br />
Sprd | 2.87 | 0.14 | 5.37 | 2.03 | 1.68 | 6.82 | 0 |<br />
Udklippet + Offset<br />
Min | - | -0.66 | -6.14 | -14.58 | -17.85 | -12.98 | 0 |<br />
Max | - | 0.66 | 12.84 | 3.78 | 11.82 | 8.08 | 0 |<br />
Gns | - | 0.00 | -0.00 | 0.00 | 0.00 | 0.00 | 0 |<br />
Stnd | - | 0.14 | 4.63 | 1.96 | 1.67 | 5.01 | 0 |<br />
Sprd | - | 0.14 | 4.63 | 1.96 | 1.67 | 5.01 | 0 |<br />
Analysefilen for 1:5,000, opløsningen 30 μm og maskestørrelsen 25 m. før iterationsprocessen.
1000<br />
900<br />
800<br />
700<br />
600<br />
500<br />
400<br />
300<br />
200<br />
100<br />
0<br />
I.1 Analysis calculations<br />
Fordelingen af afvigelser efter eliminering af grove fejl 1:5.000, 30 μm, 25 m.<br />
Afvigelser Normalfordeling<br />
-0.7 -0.6 -0.5 -0.4 -0.3 -0.2 -0.1 0 0.1 0.2 0.3 0.4 0.5 0.6<br />
| Total |Fladt A 12|Grusgrav 34|Landsby 56|Bakket A 78|Skov 90|Ukendt 00|<br />
Min | -17.93 | -0.62 | -3.44 | -15.08 | -17.93 | -17.61 | 0 |<br />
Max | 15.55 | 0.70 | 15.55 | 3.28 | 11.73 | 3.44 | 0 |<br />
Gns | 0.01 | 0.04 | 2.70 | -0.51 | -0.09 | -4.63 | 0 |<br />
Stnd | 2.87 | 0.14 | 4.63 | 1.96 | 1.67 | 5.01 | 0 |<br />
Sprd | 2.87 | 0.14 | 5.37 | 2.03 | 1.68 | 6.82 | 0 |<br />
Antal | 5489 | 1323 | 764 | 1120 | 2001 | 281 | 0 |<br />
Niv'0.2' | 2965 | 1172 | 155 | 509 | 1111 | 18 | 0 |<br />
Niv'0.4' | 968 | 134 | 104 | 297 | 418 | 15 | 0 |<br />
Niv'0.7' | 297 | 16 | 58 | 76 | 139 | 8 | 0 |<br />
Udklip.pkt| 1259 | 1 | 447 | 238 | 333 | 240 | 0 |<br />
Areal | 413999.0 | 37649.1 | 20785.3 | 264814.4 | 21339.2 | 69411.0 | 0.0 |<br />
Niv'0.2' | 173501.5 | 27824.9 | 4562.5 | 123359.7 | 14693.6 | 3060.8 | 0.0 |<br />
Niv'0.4' | 93479.1 | 8240.4 | 3025.0 | 75680.6 | 3563.1 | 2970.0 | 0.0 |<br />
Niv'0.7' | 23950.1 | 1583.8 | 1675.0 | 18245.2 | 1340.9 | 1105.2 | 0.0 |<br />
Udklip.pkt| 123068.3 | 0.0 | 11522.8 | 47528.9 | 1741.6 | 62275.0 | 0.0 |<br />
Udkl. i % | 22.94 | 0.08 | 58.51 | 21.25 | 16.64 | 85.41 | -0- |<br />
Offset gns. 0.01 0.04 2.70 -0.51 -0.09 -4.63 -0-<br />
Min | -17.85 | -0.66 | -6.14 | -14.58 | -17.85 | -12.98 | 0 |<br />
Max | 12.84 | 0.66 | 12.84 | 3.78 | 11.82 | 8.08 | 0 |<br />
Gns | 0.00 | 0.00 | -0.00 | 0.00 | 0.00 | 0.00 | 0 |<br />
Stnd | 2.47 | 0.14 | 4.63 | 1.96 | 1.67 | 5.01 | 0 |<br />
Sprd | 2.47 | 0.14 | 4.63 | 1.96 | 1.67 | 5.01 | 0 |<br />
Udklippet<br />
Min | -5.09 | -0.49 | 0 | -1.09 | -0.73 | -5.09 | 0 |<br />
Max | 0.58 | 0.58 | 0 | 0.14 | 0.56 | -4.04 | 0 |<br />
Gns | 0.02 | 0.04 | 0 | -0.12 | 0.03 | -4.64 | 0 |<br />
Stnd | 0.31 | 0.13 | 0 | 0.26 | 0.24 | 0.35 | 0 |<br />
Sprd | 0.30 | 0.14 | 0 | 0.29 | 0.24 | 4.66 | 0 |<br />
Udklippet + Offset<br />
Min | - | -0.53 | 0 | -0.97 | -0.77 | -0.45 | 0 |<br />
Max | - | 0.54 | 0 | 0.26 | 0.53 | 0.60 | 0 |<br />
Gns | - | 0.00 | 0 | -0.00 | -0.00 | 0.00 | 0 |<br />
Stnd | - | 0.13 | 0 | 0.26 | 0.24 | 0.35 | 0 |<br />
Sprd | - | 0.13 | 0 | 0.26 | 0.24 | 0.35 | 0 |<br />
Analysefilen for 1:5,000, opløsningen 30 μm og maskestørrelsen 25 m. efter iterationsprocessen.<br />
291
Analysis calculations<br />
1200<br />
1000<br />
800<br />
600<br />
400<br />
200<br />
Fordelingen af afvigelser for 1:5.000, 60 μm, 5 m.<br />
Afvigelser Normalfordeling<br />
0<br />
-18 -17 -16 -15 -14 -13 -12 -11 -10 -9.4 -8.5 -7.6 -6.7 -5.8 -4.9 -4 -3.1 -2.2 -1.3 -0.4 0.5 1.4 2.3 3.2 4.1 5 5.9 6.8 7.7 8.6 9.5<br />
| Total |Fladt A 12|Grusgrav 34|Landsby 56|Bakket A 78|Skov 90|Ukendt 00|<br />
Min | -17.42 | -0.63 | -3.54 | -2.06 | -3.38 | -17.42 | 0 |<br />
Max | 9.75 | 1.61 | 5.15 | 6.56 | 9.75 | 5.36 | 0 |<br />
Gns | 0.10 | 0.08 | 0.08 | 0.80 | 0.20 | -3.14 | 0 |<br />
Stnd | 1.65 | 0.18 | 0.79 | 1.31 | 0.93 | 5.27 | 0 |<br />
Sprd | 1.65 | 0.20 | 0.80 | 1.53 | 0.96 | 6.14 | 0 |<br />
Antal | 5874 | 1323 | 1143 | 1121 | 2001 | 286 | 0 |<br />
Niv'200.0'| 5874 | 1323 | 1143 | 1121 | 2001 | 286 | 0 |<br />
Niv'400.0'| 0 | 0 | 0 | 0 | 0 | 0 | 0 |<br />
Niv'600.0'| 0 | 0 | 0 | 0 | 0 | 0 | 0 |<br />
Udklip.pkt| 0 | 0 | 0 | 0 | 0 | 0 | 0 |<br />
Areal | 37.4 | 0.0 | 0.0 | 0.0 | 0.0 | 37.4 | 0.0 |<br />
Niv'200.0'| 37.4 | 0.0 | 0.0 | 0.0 | 0.0 | 37.4 | 0.0 |<br />
Niv'400.0'| 0.0 | 0.0 | 0.0 | 0.0 | 0.0 | 0.0 | 0.0 |<br />
Niv'600.0'| 0.0 | 0.0 | 0.0 | 0.0 | 0.0 | 0.0 | 0.0 |<br />
Udklip.pkt| 0.0 | 0.0 | 0.0 | 0.0 | 0.0 | 0.0 | 0.0 |<br />
Udkl. i % | 0.00 | 0.00 | 0.00 | 0.00 | 0.00 | 0.00 | -0- |<br />
Offset gns. 0.10 0.08 0.08 0.80 0.20 -3.14 -0-<br />
Min | -14.28 | -0.71 | -3.61 | -2.86 | -3.58 | -14.28 | 0 |<br />
Max | 9.56 | 1.53 | 5.07 | 5.76 | 9.56 | 8.50 | 0 |<br />
Gns | -0.00 | 0.00 | 0.00 | -0.00 | 0.00 | -0.00 | 0 |<br />
Stnd | 1.45 | 0.18 | 0.79 | 1.31 | 0.93 | 5.27 | 0 |<br />
Sprd | 1.45 | 0.18 | 0.79 | 1.31 | 0.93 | 5.27 | 0 |<br />
Udklippet<br />
Min | -17.42 | -0.63 | -3.54 | -2.06 | -3.38 | -17.42 | 0 |<br />
Max | 9.75 | 1.61 | 5.15 | 6.56 | 9.75 | 5.36 | 0 |<br />
Gns | 0.10 | 0.08 | 0.08 | 0.80 | 0.20 | -3.14 | 0 |<br />
Stnd | 1.73 | 0.18 | 0.79 | 1.31 | 0.93 | 5.27 | 0 |<br />
Sprd | 1.65 | 0.20 | 0.80 | 1.53 | 0.96 | 6.14 | 0 |<br />
Udklippet + Offset<br />
Min | - | -0.71 | -3.61 | -2.86 | -3.58 | -14.28 | 0 |<br />
Max | - | 1.53 | 5.07 | 5.76 | 9.56 | 8.50 | 0 |<br />
Gns | - | 0.00 | 0.00 | -0.00 | 0.00 | -0.00 | 0 |<br />
Stnd | - | 0.18 | 0.79 | 1.31 | 0.93 | 5.27 | 0 |<br />
Sprd | - | 0.18 | 0.79 | 1.31 | 0.93 | 5.27 | 0 |<br />
Analysefilen for 1:5,000, opløsningen 60 μm og maskestørrelsen 5 m. før iterationsprocessen.
1200<br />
1000<br />
800<br />
600<br />
400<br />
200<br />
0<br />
I.1 Analysis calculations<br />
Fordelingen af afvigelser efter eliminering af grove fejl 1:5.000, 60 μm, 5 m.<br />
Afvigelser Normalfordeling<br />
-0.8 -0.7 -0.6 -0.5 -0.4 -0.3 -0.2 -0.1 0 0.1 0.2 0.3 0.4 0.5 0.6 0.7<br />
| Total |Fladt A 12|Grusgrav 34|Landsby 56|Bakket A 78|Skov 90|Ukendt 00|<br />
Min | -17.42 | -0.63 | -3.54 | -2.06 | -3.38 | -17.42 | 0 |<br />
Max | 9.75 | 1.61 | 5.15 | 6.56 | 9.75 | 5.36 | 0 |<br />
Gns | 0.10 | 0.08 | 0.08 | 0.80 | 0.20 | -3.14 | 0 |<br />
Stnd | 1.65 | 0.18 | 0.79 | 1.31 | 0.93 | 5.27 | 0 |<br />
Sprd | 1.65 | 0.20 | 0.80 | 1.53 | 0.96 | 6.14 | 0 |<br />
Antal | 5874 | 1323 | 1143 | 1121 | 2001 | 286 | 0 |<br />
Niv'0.2' | 3598 | 1104 | 601 | 415 | 1454 | 24 | 0 |<br />
Niv'0.5' | 1052 | 187 | 276 | 247 | 322 | 20 | 0 |<br />
Niv'0.7' | 382 | 22 | 103 | 129 | 108 | 20 | 0 |<br />
Udklip.pkt| 842 | 10 | 163 | 330 | 117 | 222 | 0 |<br />
Areal | 37.4 | 0.0 | 0.0 | 0.0 | 0.0 | 37.4 | 0.0 |<br />
Niv'0.2' | 0.0 | 0.0 | 0.0 | 0.0 | 0.0 | 0.0 | 0.0 |<br />
Niv'0.5' | 0.0 | 0.0 | 0.0 | 0.0 | 0.0 | 0.0 | 0.0 |<br />
Niv'0.7' | 0.0 | 0.0 | 0.0 | 0.0 | 0.0 | 0.0 | 0.0 |<br />
Udklip.pkt| 37.4 | 0.0 | 0.0 | 0.0 | 0.0 | 37.4 | 0.0 |<br />
Udkl. i % | 14.33 | 0.76 | 14.26 | 29.44 | 5.85 | 77.62 | -0- |<br />
Offset gns. 0.10 0.08 0.08 0.80 0.20 -3.14 -0-<br />
Min | -14.28 | -0.71 | -3.61 | -2.86 | -3.58 | -14.28 | 0 |<br />
Max | 9.56 | 1.53 | 5.07 | 5.76 | 9.56 | 8.50 | 0 |<br />
Gns | -0.00 | 0.00 | 0.00 | -0.00 | 0.00 | -0.00 | 0 |<br />
Stnd | 1.45 | 0.18 | 0.79 | 1.31 | 0.93 | 5.27 | 0 |<br />
Sprd | 1.45 | 0.18 | 0.79 | 1.31 | 0.93 | 5.27 | 0 |<br />
Udklippet<br />
Min | -3.81 | -0.63 | -0.64 | 0.08 | -0.52 | -3.81 | 0 |<br />
Max | 1.52 | 0.76 | 0.78 | 1.52 | 0.90 | -2.49 | 0 |<br />
Gns | 0.11 | 0.08 | -0.00 | 0.49 | 0.08 | -3.11 | 0 |<br />
Stnd | 0.44 | 0.17 | 0.28 | 0.35 | 0.22 | 0.40 | 0 |<br />
Sprd | 0.38 | 0.18 | 0.28 | 0.60 | 0.23 | 3.14 | 0 |<br />
Udklippet + Offset<br />
Min | - | -0.70 | -0.64 | -0.41 | -0.60 | -0.70 | 0 |<br />
Max | - | 0.68 | 0.78 | 1.03 | 0.82 | 0.62 | 0 |<br />
Gns | - | 0.00 | 0.00 | -0.00 | 0.00 | -0.00 | 0 |<br />
Stnd | - | 0.17 | 0.28 | 0.35 | 0.22 | 0.40 | 0 |<br />
Sprd | - | 0.17 | 0.28 | 0.35 | 0.22 | 0.40 | 0 |<br />
Analysefilen for 1:5,000, opløsningen 60 μm og maskestørrelsen 5 m. efter iterationsprocessen.<br />
293
Analysis calculations<br />
1000<br />
900<br />
800<br />
700<br />
600<br />
500<br />
400<br />
300<br />
200<br />
100<br />
0<br />
Fordelingen af afvigelser for 1:5.000, 60 μm, 12,5 m.<br />
Afvigelser Normalfordeling<br />
-11 -9.6 -8.7 -7.8 -6.9 -6 -5.1 -4.2 -3.3 -2.4 -1.5 -0.6 0.3 1.2 2.1 3 3.9 4.8 5.7 6.6 7.5 8.4 9.3 10.2 11.1 12 12.9 13.8 14.7<br />
| Total |Fladt A 12|Grusgrav 34|Landsby 56|Bakket A 78|Skov 90|Ukendt 00|<br />
Min | -10.46 | -0.77 | -2.10 | -5.51 | -7.67 | -10.46 | 0 |<br />
Max | 14.84 | 1.11 | 14.84 | 3.78 | 8.83 | 9.01 | 0 |<br />
Gns | 0.46 | 0.08 | 2.13 | 0.22 | 0.06 | 1.45 | 0 |<br />
Stnd | 1.95 | 0.17 | 3.91 | 0.69 | 0.61 | 4.12 | 0 |<br />
Sprd | 2.00 | 0.19 | 4.46 | 0.72 | 0.61 | 4.37 | 0 |<br />
Antal | 5466 | 1320 | 764 | 1104 | 2001 | 277 | 0 |<br />
Niv'200.0'| 5466 | 1320 | 764 | 1104 | 2001 | 277 | 0 |<br />
Niv'400.0'| 0 | 0 | 0 | 0 | 0 | 0 | 0 |<br />
Niv'600.0'| 0 | 0 | 0 | 0 | 0 | 0 | 0 |<br />
Udklip.pkt| 0 | 0 | 0 | 0 | 0 | 0 | 0 |<br />
Areal | 22563.3 | 0.0 | 19316.5 | 1800.3 | 0.0 | 1446.4 | 0.0 |<br />
Niv'200.0'| 22563.3 | 0.0 | 19316.5 | 1800.3 | 0.0 | 1446.4 | 0.0 |<br />
Niv'400.0'| 0.0 | 0.0 | 0.0 | 0.0 | 0.0 | 0.0 | 0.0 |<br />
Niv'600.0'| 0.0 | 0.0 | 0.0 | 0.0 | 0.0 | 0.0 | 0.0 |<br />
Udklip.pkt| 0.0 | 0.0 | 0.0 | 0.0 | 0.0 | 0.0 | 0.0 |<br />
Udkl. i % | 0.00 | 0.00 | 0.00 | 0.00 | 0.00 | 0.00 | -0- |<br />
Offset gns. 0.46 0.08 2.13 0.22 0.06 1.45 -0-<br />
Min | -11.90 | -0.85 | -4.23 | -5.73 | -7.73 | -11.90 | 0 |<br />
Max | 12.70 | 1.02 | 12.70 | 3.56 | 8.77 | 7.57 | 0 |<br />
Gns | -0.00 | 0.00 | -0.00 | 0.00 | 0.00 | -0.00 | 0 |<br />
Stnd | 1.80 | 0.17 | 3.91 | 0.69 | 0.61 | 4.12 | 0 |<br />
Sprd | 1.80 | 0.17 | 3.91 | 0.69 | 0.61 | 4.12 | 0 |<br />
Udklippet<br />
Min | -10.46 | -0.77 | -2.10 | -5.51 | -7.67 | -10.46 | 0 |<br />
Max | 14.84 | 1.11 | 14.84 | 3.78 | 8.83 | 9.01 | 0 |<br />
Gns | 0.46 | 0.08 | 2.13 | 0.22 | 0.06 | 1.45 | 0 |<br />
Stnd | 1.95 | 0.17 | 3.91 | 0.69 | 0.61 | 4.12 | 0 |<br />
Sprd | 2.00 | 0.19 | 4.46 | 0.72 | 0.61 | 4.37 | 0 |<br />
Udklippet + Offset<br />
Min | - | -0.85 | -4.23 | -5.73 | -7.73 | -11.90 | 0 |<br />
Max | - | 1.02 | 12.70 | 3.56 | 8.77 | 7.57 | 0 |<br />
Gns | - | 0.00 | -0.00 | 0.00 | 0.00 | -0.00 | 0 |<br />
Stnd | - | 0.17 | 3.91 | 0.69 | 0.61 | 4.12 | 0 |<br />
Sprd | - | 0.17 | 3.91 | 0.69 | 0.61 | 4.12 | 0 |<br />
Analysefilen for 1:5,000, opløsningen 60 μm og maskestørrelsen 12.5 m. før iterationsprocessen.
1000<br />
900<br />
800<br />
700<br />
600<br />
500<br />
400<br />
300<br />
200<br />
100<br />
0<br />
I.1 Analysis calculations<br />
Fordelingen af afvigelser efter eliminering af grove fejl 1:5.000, 60 μm, 12,5 m.<br />
Afvigelser Normalfordeling<br />
-0.8 -0.7 -0.6 -0.5 -0.4 -0.3 -0.2 -0.1 0 0.1 0.2 0.3 0.4 0.5 0.6 0.7<br />
| Total |Fladt A 12|Grusgrav 34|Landsby 56|Bakket A 78|Skov 90|Ukendt 00|<br />
Min | -10.46 | -0.77 | -2.10 | -5.51 | -7.67 | -10.46 | 0 |<br />
Max | 14.84 | 1.11 | 14.84 | 3.78 | 8.83 | 9.01 | 0 |<br />
Gns | 0.46 | 0.08 | 2.13 | 0.22 | 0.06 | 1.45 | 0 |<br />
Stnd | 1.95 | 0.17 | 3.91 | 0.69 | 0.61 | 4.12 | 0 |<br />
Sprd | 2.00 | 0.19 | 4.46 | 0.72 | 0.61 | 4.37 | 0 |<br />
Antal | 5466 | 1320 | 764 | 1104 | 2001 | 277 | 0 |<br />
Niv'0.2' | 3186 | 1108 | 206 | 452 | 1409 | 11 | 0 |<br />
Niv'0.5' | 1050 | 185 | 155 | 320 | 381 | 9 | 0 |<br />
Niv'0.7' | 338 | 20 | 60 | 149 | 100 | 9 | 0 |<br />
Udklip.pkt| 892 | 7 | 343 | 183 | 111 | 248 | 0 |<br />
Areal | 22563.3 | 0.0 | 19316.5 | 1800.3 | 0.0 | 1446.4 | 0.0 |<br />
Niv'0.2' | 6162.7 | 0.0 | 5268.8 | 764.1 | 0.0 | 129.8 | 0.0 |<br />
Niv'0.5' | 4194.6 | 0.0 | 3925.0 | 269.6 | 0.0 | 0.0 | 0.0 |<br />
Niv'0.7' | 2141.1 | 0.0 | 1512.5 | 498.8 | 0.0 | 129.8 | 0.0 |<br />
Udklip.pkt| 10065.0 | 0.0 | 8610.3 | 267.9 | 0.0 | 1186.8 | 0.0 |<br />
Udkl. i % | 16.32 | 0.53 | 44.90 | 16.58 | 5.55 | 89.53 | -0- |<br />
Offset gns. 0.46 0.08 2.13 0.22 0.06 1.45 -0-<br />
Min | -11.90 | -0.85 | -4.23 | -5.73 | -7.73 | -11.90 | 0 |<br />
Max | 12.70 | 1.02 | 12.70 | 3.56 | 8.77 | 7.57 | 0 |<br />
Gns | -0.00 | 0.00 | -0.00 | 0.00 | 0.00 | -0.00 | 0 |<br />
Stnd | 1.80 | 0.17 | 3.91 | 0.69 | 0.61 | 4.12 | 0 |<br />
Sprd | 1.80 | 0.17 | 3.91 | 0.69 | 0.61 | 4.12 | 0 |<br />
Udklippet<br />
Min | -0.66 | -0.51 | 0 | -0.50 | -0.66 | 0.91 | 0 |<br />
Max | 2.16 | 0.81 | 0 | 0.95 | 0.78 | 2.16 | 0 |<br />
Gns | 0.12 | 0.08 | 0 | 0.23 | 0.06 | 1.57 | 0 |<br />
Stnd | 0.28 | 0.16 | 0 | 0.29 | 0.22 | 0.38 | 0 |<br />
Sprd | 0.29 | 0.18 | 0 | 0.36 | 0.23 | 1.61 | 0 |<br />
Udklippet + Offset<br />
Min | - | -0.59 | 0 | -0.73 | -0.72 | -0.66 | 0 |<br />
Max | - | 0.72 | 0 | 0.73 | 0.72 | 0.60 | 0 |<br />
Gns | - | 0.00 | 0 | -0.00 | -0.00 | 0.00 | 0 |<br />
Stnd | - | 0.16 | 0 | 0.29 | 0.22 | 0.38 | 0 |<br />
Sprd | - | 0.16 | 0 | 0.29 | 0.22 | 0.38 | 0 |<br />
Analysefilen for 1:5,000, opløsningen 60 μm og maskestørrelsen 12.5 m. efter iterationsprocessen.<br />
295
Analysis calculations<br />
900<br />
800<br />
700<br />
600<br />
500<br />
400<br />
300<br />
200<br />
100<br />
0<br />
Fordelingen af afvigelser for 1:5.000, 60 μm, 25 m<br />
Afvigelser Normalfordeling<br />
-18 -16 -15 -14 -13 -12 -11 -9.8 -8.7 -7.6 -6.5 -5.4 -4.3 -3.2 -2.1 -1 0.1 1.2 2.3 3.4 4.5 5.6 6.7 7.8 8.9 10 11.1 12.2 13.3 14.4<br />
| Total |Fladt A 12|Grusgrav 34|Landsby 56|Bakket A 78|Skov 90|Ukendt 00|<br />
Min | -17.47 | -0.64 | -3.35 | -14.63 | -17.47 | -15.74 | 0 |<br />
Max | 15.35 | 0.95 | 15.35 | 3.24 | 9.59 | 7.26 | 0 |<br />
Gns | 0.13 | 0.09 | 2.40 | -0.47 | -0.05 | -2.17 | 0 |<br />
Stnd | 2.55 | 0.17 | 4.43 | 1.95 | 1.47 | 4.68 | 0 |<br />
Sprd | 2.55 | 0.19 | 5.03 | 2.01 | 1.47 | 5.16 | 0 |<br />
Antal | 5489 | 1323 | 764 | 1120 | 2001 | 281 | 0 |<br />
Niv'200.0'| 5489 | 1323 | 764 | 1120 | 2001 | 281 | 0 |<br />
Niv'400.0'| 0 | 0 | 0 | 0 | 0 | 0 | 0 |<br />
Niv'600.0'| 0 | 0 | 0 | 0 | 0 | 0 | 0 |<br />
Udklip.pkt| 0 | 0 | 0 | 0 | 0 | 0 | 0 |<br />
Areal | 413999.0 | 37649.1 | 20785.3 | 264814.4 | 21339.2 | 69411.0 | 0.0 |<br />
Niv'200.0'| 413999.0 | 37649.1 | 20785.3 | 264814.4 | 21339.2 | 69411.0 | 0.0 |<br />
Niv'400.0'| 0.0 | 0.0 | 0.0 | 0.0 | 0.0 | 0.0 | 0.0 |<br />
Niv'600.0'| 0.0 | 0.0 | 0.0 | 0.0 | 0.0 | 0.0 | 0.0 |<br />
Udklip.pkt| 0.0 | 0.0 | 0.0 | 0.0 | 0.0 | 0.0 | 0.0 |<br />
Udkl. i % | 0.00 | 0.00 | 0.00 | 0.00 | 0.00 | 0.00 | -0- |<br />
Offset gns. 0.13 0.09 2.40 -0.47 -0.05 -2.17 -0-<br />
Min | -17.42 | -0.73 | -5.75 | -14.16 | -17.42 | -13.57 | 0 |<br />
Max | 12.95 | 0.87 | 12.95 | 3.71 | 9.64 | 9.43 | 0 |<br />
Gns | -0.00 | -0.00 | 0.00 | -0.00 | -0.00 | 0.00 | 0 |<br />
Stnd | 2.33 | 0.17 | 4.43 | 1.95 | 1.47 | 4.68 | 0 |<br />
Sprd | 2.33 | 0.17 | 4.43 | 1.95 | 1.47 | 4.68 | 0 |<br />
Udklippet<br />
Min | -17.47 | -0.64 | -3.35 | -14.63 | -17.47 | -15.74 | 0 |<br />
Max | 15.35 | 0.95 | 15.35 | 3.24 | 9.59 | 7.26 | 0 |<br />
Gns | 0.13 | 0.09 | 2.40 | -0.47 | -0.05 | -2.17 | 0 |<br />
Stnd | 2.59 | 0.17 | 4.43 | 1.95 | 1.47 | 4.68 | 0 |<br />
Sprd | 2.55 | 0.19 | 5.03 | 2.01 | 1.47 | 5.16 | 0 |<br />
Udklippet + Offset<br />
Min | - | -0.73 | -5.75 | -14.16 | -17.42 | -13.57 | 0 |<br />
Max | - | 0.87 | 12.95 | 3.71 | 9.64 | 9.43 | 0 |<br />
Gns | - | -0.00 | 0.00 | -0.00 | -0.00 | 0.00 | 0 |<br />
Stnd | - | 0.17 | 4.43 | 1.95 | 1.47 | 4.68 | 0 |<br />
Sprd | - | 0.17 | 4.43 | 1.95 | 1.47 | 4.68 | 0 |<br />
Analysefilen for 1:5,000, opløsningen 60 μm og maskestørrelsen 25 m. før iterationsprocessen.
900<br />
800<br />
700<br />
600<br />
500<br />
400<br />
300<br />
200<br />
100<br />
0<br />
I.1 Analysis calculations<br />
Fordelingen af afvigelser efter eliminering af grove fejl 1:5.000, 60 μm, 25 m.<br />
Afvigelser Normalfordeling<br />
-1 -0.9 -0.8 -0.7 -0.6 -0.5 -0.4 -0.3 -0.2 -0.1 0 0.1 0.2 0.3 0.4 0.5 0.6 0.7 0.8 0.9<br />
| Total |Fladt A 12|Grusgrav 34|Landsby 56|Bakket A 78|Skov 90|Ukendt 00|<br />
Min | -17.47 | -0.64 | -3.35 | -14.63 | -17.47 | -15.74 | 0 |<br />
Max | 15.35 | 0.95 | 15.35 | 3.24 | 9.59 | 7.26 | 0 |<br />
Gns | 0.13 | 0.09 | 2.40 | -0.47 | -0.05 | -2.17 | 0 |<br />
Stnd | 2.55 | 0.17 | 4.43 | 1.95 | 1.47 | 4.68 | 0 |<br />
Sprd | 2.55 | 0.19 | 5.03 | 2.01 | 1.47 | 5.16 | 0 |<br />
Antal | 5489 | 1323 | 764 | 1120 | 2001 | 281 | 0 |<br />
Niv'0.3' | 3105 | 1186 | 159 | 490 | 1243 | 27 | 0 |<br />
Niv'0.6' | 965 | 126 | 134 | 292 | 401 | 12 | 0 |<br />
Niv'0.9' | 330 | 10 | 81 | 100 | 128 | 11 | 0 |<br />
Udklip.pkt| 1089 | 1 | 390 | 238 | 229 | 231 | 0 |<br />
Areal | 413999.0 | 37649.1 | 20785.3 | 264814.4 | 21339.2 | 69411.0 | 0.0 |<br />
Niv'0.3' | 169599.6 | 32020.1 | 4687.5 | 114951.2 | 14508.7 | 3432.2 | 0.0 |<br />
Niv'0.6' | 89891.8 | 5264.0 | 3850.0 | 75064.1 | 4623.2 | 1090.6 | 0.0 |<br />
Niv'0.9' | 33516.9 | 365.0 | 2162.5 | 27908.6 | 799.2 | 2281.5 | 0.0 |<br />
Udklip.pkt| 120990.8 | 0.0 | 10085.3 | 46890.6 | 1408.1 | 62606.7 | 0.0 |<br />
Udkl. i % | 19.84 | 0.08 | 51.05 | 21.25 | 11.44 | 82.21 | -0- |<br />
Offset gns. 0.13 0.09 2.40 -0.47 -0.05 -2.17 -0-<br />
Min | -17.42 | -0.73 | -5.75 | -14.16 | -17.42 | -13.57 | 0 |<br />
Max | 12.95 | 0.87 | 12.95 | 3.71 | 9.64 | 9.43 | 0 |<br />
Gns | -0.00 | -0.00 | 0.00 | -0.00 | -0.00 | 0.00 | 0 |<br />
Stnd | 2.33 | 0.17 | 4.43 | 1.95 | 1.47 | 4.68 | 0 |<br />
Sprd | 2.33 | 0.17 | 4.43 | 1.95 | 1.47 | 4.68 | 0 |<br />
Udklippet<br />
Min | -2.90 | -0.64 | 0 | -1.18 | -0.97 | -2.90 | 0 |<br />
Max | 0.95 | 0.95 | 0 | 0.46 | 0.88 | -1.41 | 0 |<br />
Gns | 0.06 | 0.09 | 0 | 0.06 | 0.05 | -2.08 | 0 |<br />
Stnd | 0.31 | 0.17 | 0 | 0.31 | 0.32 | 0.44 | 0 |<br />
Sprd | 0.31 | 0.19 | 0 | 0.32 | 0.32 | 2.12 | 0 |<br />
Udklippet + Offset<br />
Min | - | -0.73 | 0 | -1.25 | -1.02 | -0.83 | 0 |<br />
Max | - | 0.87 | 0 | 0.40 | 0.83 | 0.67 | 0 |<br />
Gns | - | -0.00 | 0 | 0.00 | 0.00 | 0.00 | 0 |<br />
Stnd | - | 0.17 | 0 | 0.31 | 0.32 | 0.44 | 0 |<br />
Sprd | - | 0.17 | 0 | 0.31 | 0.32 | 0.44 | 0 |<br />
Analysefilen for 1:5,000, opløsningen 60 μm og maskestørrelsen 25 m. efter iterationsprocessen.<br />
297
I.1 Analysis calculations<br />
Appendix J<br />
299
J.1 Code specification and error arrows<br />
Appendix J: Code specification and error<br />
arrows<br />
J.1 Code specification and error arrows<br />
Appendix J contains the automatically generated grids shown with their code specifications without<br />
boundaries. The code specifications are defined as:- light grey = grid points OK, medium grey = grid<br />
points with double code and dark grey = grid points defective. The (red) error arrows are superimposed<br />
on the grid. The length <strong>of</strong> the arrow is related to the deviation between the frame <strong>of</strong> reference and the<br />
automatically generated grids. Arrows which should have been deleted are marked with a green cross.<br />
Positive deviations are depicted as upward facing arrows, and negative deviations as downward facing<br />
arrows. The size <strong>of</strong> the deviation is multiplied with a scale 20.<br />
301
Code specification and error arrows<br />
Code specification and errors arrows (red) for images in scale 1:25.000, resolution 15 �m and mesh size<br />
12.5 x 12.5 m. Points which should have been deleted are shown as green crosses.<br />
Code specification and errors arrows (red) for images in scale 1:25.000, resolution 15 �m and mesh size<br />
25 x 25 m. Points which should have been deleted are shown as green crosses.
J.1 Code specification and error arrows<br />
Code specification and errors arrows (red) for images in scale 1:25.000, resolution 30 �m and mesh size<br />
12.5 x 12.5 m. Points which should have been deleted are shown as green crosses.<br />
Code specification and errors arrows (red) for images in scale 1:25.000, resolution 15 �m and mesh size<br />
12.5 x 12.5 m. Points which should have been deleted are shown as green crosses.<br />
303
Code specification and error arrows<br />
Code specification and errors arrows (red) for images in scale 1:25.000, resolution 60 �m and mesh size<br />
12.5 x 12.5 m. Points which should have been deleted are shown as green crosses.<br />
Code specification and errors arrows (red) for images in scale 1:25.000, resolution 60 �m and mesh size<br />
25 x 25 m. Points which should have been deleted are shown as green crosses.
J.1 Code specification and error arrows<br />
Code specification and errors arrows (red) for images in scale 1:15.000, resolution 15 �m and mesh size 12.5<br />
x 12.5 m. Points which should have been deleted are shown as green crosses.<br />
Code specification and errors arrows (red) for images in scale 1:15.000, resolution 15 �m and mesh size 25<br />
x 25 m. Points which should have been deleted are shown as green crosses.<br />
305
Code specification and error arrows<br />
Code specification and errors arrows (red) for images in scale 1:15,000, resolution 30 �m and mesh size 12.5 x<br />
12.5 m. Points which should have been deleted are shown as green crosses.<br />
Code specification and errors arrows (red) for images in scale 1:25.000, resolution 30 �m and mesh size 25 x 25 m.<br />
Points which should have been deleted are shown as green crosses.
J.1 Code specification and error arrows<br />
Code specification and errors arrows (red) for images in scale 1:15,000, resolution 60 �m and mesh size 12.5<br />
x 12.5 m. Points which should have been deleted are shown as green crosses.<br />
Code specification and errors arrows (red) for images in scale 1:15,000, resolution 60 �m and mesh size 25 x<br />
25 m. Points which should have been deleted are shown as green crosses.<br />
307
Code specification and error arrows<br />
Code specification and errors arrows (red) for images in scale 1:5,000, resolution 30 �m and mesh size 12.5 x 12.5<br />
m. Points which should have been deleted are shown as green crosses.<br />
Code specification and errors arrows (red) for images in scale 1:5,000, resolution 30 �m and mesh size 25 x 25 m.<br />
Points which should have been deleted are shown as green crosses.
J.1 Code specification and error arrows<br />
Code specification and errors arrows (red) for images in scale 1:5,000, resolution 60 �m and mesh size 12.5 x 12.5<br />
m. Points which should have been deleted are shown as green crosses.<br />
Code specification and errors arrows (red) for images in scale 1:5,000, resolution 60 �m and mesh size 25 x 25<br />
m. Points which should have been deleted are shown as green crosses.<br />
309
Code specification and error arrows
J.1 Code specification and error arrows<br />
Appendix K<br />
311
K.1 Orthophoto and error arrows<br />
Appendix K: Orthophoto and error arrows<br />
K.1 Orthophoto and error arrows<br />
In this Appendix, the deviations (scale 20) are superimposed on an orthophoto <strong>of</strong> the test area. The Appendix<br />
contains all 24 calculations.<br />
Error arrows are shown with different colours. The colour indicates the <strong>landscape</strong> type:-<br />
� Green = flat terrain<br />
� Yellow/orange = gravel pit<br />
� Red = village<br />
� Violet = hilly terrain<br />
� Blue = woods<br />
Positive deviations are depicted with upward facing light coloured error arrows and negative deviations<br />
with downward facing dark coloured error arrows.<br />
Error arrows coloured as the <strong>landscape</strong> type superimposed on an orthophoto for<br />
images in scale 1:25,000, resolution 15 �m and mesh size 5 x 5 m.<br />
313
Orthophoto and error arrows<br />
Error arrows coloured as the <strong>landscape</strong> type superimposed on an orthophoto for<br />
images in scale 1:25,000, resolution 15 �m and mesh size 12.5 x 12.5 m.<br />
Error arrows coloured as the <strong>landscape</strong> type superimposed on an orthophoto for<br />
images in scale 1:25,000, resolution 15 �m and mesh size 25 x 25 m.
K.1 Orthophoto and error arrows<br />
Error arrows coloured as the <strong>landscape</strong> type superimposed on an orthophoto for<br />
images in scale 1:25,000, resolution 30 �m and mesh size 12.5 x 12.5 m.<br />
Error arrows coloured as the <strong>landscape</strong> type superimposed on an orthophoto for<br />
images in scale 1:25,000, resolution 30 �m and mesh size 25 x 25 m.<br />
315
Orthophoto and error arrows<br />
Error arrows coloured as the <strong>landscape</strong> type superimposed on an orthophoto for<br />
images in scale 1:25,000, resolution 60 �m and mesh size 12.5 x 12.5 m.<br />
Error arrows coloured as the <strong>landscape</strong> type superimposed on an orthophoto for<br />
images in scale 1:25,000, resolution 60 �m and mesh size 25 x 25 m.
K.1 Orthophoto and error arrows<br />
Error arrows coloured as the <strong>landscape</strong> type superimposed on an orthophoto for<br />
images in scale 1:15,000, resolution 15 �m and mesh size 5 x 5 m.<br />
Error arrows coloured as the <strong>landscape</strong> type superimposed on an orthophoto for<br />
images in scale 1:15,000, resolution 15 �m and mesh size 12.5 x 12.5 m.<br />
317
Orthophoto and error arrows<br />
Error arrows coloured as the <strong>landscape</strong> type superimposed on an orthophoto for<br />
images in scale 1:15.000, resolution 15 �m and mesh size 25 x 25 m.<br />
Error arrows coloured as the <strong>landscape</strong> type superimposed on an orthophoto for<br />
images in scale 1:15,000, resolution 30 �m and mesh size 5 x 5 m.
K.1 Orthophoto and error arrows<br />
Error arrows coloured as the <strong>landscape</strong> type superimposed on an orthophoto for<br />
images in scale 1:15,000, resolution 30 �m and mesh size 12.5 x 12.5 m.<br />
Error arrows coloured as the <strong>landscape</strong> type superimposed on an orthophoto for<br />
images in scale 1:15,000, resolution 30 �m and mesh size 25 x 25 m.<br />
319
Orthophoto and error arrows<br />
Error arrows coloured as the <strong>landscape</strong> type superimposed on an orthophoto for<br />
images in scale 1:15,000, resolution 60 �m and mesh size 12.5 x 12.5 m.<br />
Error arrows coloured as the <strong>landscape</strong> type superimposed on an orthophoto for<br />
images in scale 1:15.000, resolution 60 �m and mesh size 25 x 25 m.
K.1 Orthophoto and error arrows<br />
Error arrows coloured as the <strong>landscape</strong> type superimposed on an orthophoto for<br />
images in scale 1:5,000, resolution 15 �m and mesh size 5 x 5 m.<br />
Error arrows coloured as the <strong>landscape</strong> type superimposed on an orthophoto for<br />
images in scale 1:5,000, resolution 15 �m and mesh size 12.5 x 12.5 m.<br />
321
Orthophoto and error arrows<br />
Error arrows coloured as the <strong>landscape</strong> type superimposed on an orthophoto for<br />
images in scale 1:5,000, resolution 15 �m and mesh size 25 x 25 m.<br />
Error arrows coloured as the <strong>landscape</strong> type superimposed on an orthophoto for<br />
images in scale 1:5l,000, resolution 30 �m and mesh size 5 x 5 m.
K.1 Orthophoto and error arrows<br />
Error arrows coloured as the <strong>landscape</strong> type superimposed on an orthophoto for<br />
images in scale 1:5,000, resolution 30 �m and mesh size 12.5 x 12.5 m.<br />
Error arrows coloured as the <strong>landscape</strong> type superimposed on an orthophoto for<br />
images in scale 1:5,000, resolution 30 �m and mesh size 25 x 25 m.<br />
323
Orthophoto and error arrows<br />
Error arrows coloured as the <strong>landscape</strong> type superimposed on an orthophoto for<br />
images in scale 1:5,000, resolution 60 �m and mesh size 5 x 5 m.<br />
Error arrows coloured as the <strong>landscape</strong> type superimposed on an orthophoto for<br />
images in scale 1:5,000, resolution 60 �m and mesh size 12.5 x 12.5 m.
K.1 Orthophoto and error arrows<br />
Error arrows coloured as the <strong>landscape</strong> type superimposed on an orthophoto for<br />
images in scale 1:5,000, resolution 60 �m and mesh size 25 x 25 m.<br />
325
Orthophoto and error arrows
K.1 Orthophoto and error arrows<br />
Appendix L<br />
327
L.1 STND used as threshold<br />
Appendix L: STND used as threshold<br />
L.1 STND used as threshold<br />
This Appendix contains a cut out <strong>of</strong> the results from the excel sheet with the calculations in which the<br />
standard deviation has been used as the cut out threshold between the results from images in 15 �m, 30<br />
�m and 60 �m for a given scale and mesh size.<br />
Image scale 1:25,000 and mesh size 25 x 25 m.<br />
Nos.<strong>of</strong> points Nos. <strong>of</strong> points Good (nos.) Bad (nos.) Good (m) Bad (m)<br />
70 3263 14 56 11,4643 285,899<br />
1,10 % 51,48 % 0,22 % 0,88 %<br />
Klip after<br />
STND<br />
Klip after<br />
z<br />
Difference<br />
Image scale 1:15,000 and mesh size 25 x 25 m.<br />
Nos. <strong>of</strong> points Nos. <strong>of</strong> points Good (nos.) Bad (nos.) Good (m) Bad (m)<br />
199 850 81 118 37,6113 471,798<br />
3,09 % 13,21 % 1,26 % 1,83 %<br />
Cut after<br />
STND<br />
Cut after<br />
z<br />
Difference<br />
Image scale 1:15,000 and mesh size 12.5 x 12.5 m.<br />
Nos. <strong>of</strong> points Nos. <strong>of</strong> points Good (nos.) Bad (nos.) Good (m) Bad (m)<br />
177 676 83 94 38,7559 327,257<br />
2,76 % 10,55 % 1,30 % 1,47 %<br />
Cut after<br />
STDAFV<br />
Cut after<br />
Z (ref.)<br />
Difference<br />
Image scale 1:5,000 and mesh size 5 x 5 m.<br />
Nos. <strong>of</strong> points Nos. <strong>of</strong> points Good (nos.) Bad (nos.) Good (m) Bad (m)<br />
158 125 95 63 9,9755 341,525<br />
4,78 % 3,79 % 2,88 % 1,91 %<br />
Cut after<br />
STDAFV<br />
Cut after<br />
z<br />
Difference<br />
Image scale 1:5,000 and mesh size 12.5 x 12.5 m.<br />
Nos. <strong>of</strong> points Nos. <strong>of</strong> points Good (nos.) Bad (nos.) Good (m) Bad (m)<br />
170 261 54 116 7,3931 632,185<br />
5,21 % 7,99 % 1,65 % 3,55 %<br />
Cut after<br />
STDAFV<br />
Cut after<br />
z<br />
Difference<br />
Image scale 1:5,000 and mesh size 25 x 25 m.<br />
Nos. <strong>of</strong> points Nos. <strong>of</strong> points Good (nos.) Bad (nos.) Good (m) Bad (m)<br />
340 583 140 200 19,5477 597,353<br />
10,11 % 17,33 % 4,16 % 5,95 %<br />
329
STND used as threshold<br />
Cut after<br />
STDAFV<br />
Cut after<br />
z<br />
Difference
L.1 STND used as threshold<br />
Distribution <strong>of</strong> the deviations for images in scale 1:xx,000, resolution xx �m and mesh size xx m<br />
700<br />
600<br />
500<br />
400<br />
300<br />
200<br />
100<br />
Deviations<br />
Normal distribution<br />
0<br />
-9.6 -8.7 -7.8 -6.9 -6 -5.1 -4.2 -3.3 -2.4 -1.5 -0.6 0.3 1.2 2.1 3 3.9 4.8 5.7 6.6 7.5 8.4 9.3 10.2 11.1 12 12.9 13.8 14.7 15.6 16.5<br />
| Total |Flat A 12|Gravel pit 34|Village 56|Hilly A 78|Woods 90|Unknown 00|<br />
Min | -9.51 | -0.07 | -0.98 | 0.06 | -2.73 | -9.51 | 0 |<br />
Max | 17.13 | 4.65 | 2.89 | 6.98 | 8.40 | 17.13 | 0 |<br />
Mean | 1.64 | 1.55 | 1.05 | 1.65 | 1.70 | 2.39 | 0 |<br />
Stnd | 1.27 | 0.45 | 0.54 | 0.68 | 0.89 | 3.22 | 0 |<br />
RMSE | 2.07 | 1.61 | 1.18 | 1.79 | 1.92 | 4.02 | 0 |<br />
Nos. <strong>of</strong> pts| 8342 | 2092 | 1168 | 1410 | 2811 | 861 | 0 |<br />
Level'200'| 8342 | 2092 | 1168 | 1410 | 2811 | 861 | 0 |<br />
Level'400'| 0 | 0 | 0 | 0 | 0 | 0 | 0 |<br />
Level'600'| 0 | 0 | 0 | 0 | 0 | 0 | 0 |<br />
Nos. <strong>of</strong> cut out pts 0 | 0 | 0 | 0 | 0 | 0 | 0 |<br />
Area | 202.0 | 0.0 | 107.3 | 0.0 | 0.0 | 94.6 | 0.0 |<br />
Level'200'| 202.0 | 0.0 | 107.3 | 0.0 | 0.0 | 94.6 | 0.0 |<br />
Level'400'| 0.0 | 0.0 | 0.0 | 0.0 | 0.0 | 0.0 | 0.0 |<br />
Level'600'| 0.0 | 0.0 | 0.0 | 0.0 | 0.0 | 0.0 | 0.0 |<br />
Area cut out| 0.0 | 0.0 | 0.0 | 0.0 | 0.0 | 0.0 | 0.0 |<br />
Area cut out in % 0.0 | 0.00 | 0.00 | 0.00 | 0.00 | 0.00 | -0- |<br />
Offset (mean) 1.64 1.55 1.05 1.65 1.70 2.39 -0-<br />
Min | -11.90 | -1.62 | -2.03 | -1.59 | -4.43 | -11.90 | 0 |<br />
Max | 14.73 | 3.10 | 1.83 | 5.33 | 6.70 | 14.73 | 0 |<br />
Mean | -0.00 | 0.00 | 0.00 | 0.00 | -0.00 | 0.00 | 0 |<br />
Stnd | 1.23 | 0.45 | 0.54 | 0.68 | 0.89 | 3.22 | 0 |<br />
RMSE | 1.23 | 0.45 | 0.54 | 0.68 | 0.89 | 3.22 | 0 |<br />
Cut out<br />
Min | -9.51 | -0.07 | -0.98 | 0.06 | -2.73 | -9.51 | 0 |<br />
Max | 17.13 | 4.65 | 2.89 | 6.98 | 8.40 | 17.13 | 0 |<br />
Mean | 1.64 | 1.55 | 1.05 | 1.65 | 1.70 | 2.39 | 0 |<br />
Stnd | 1.27 | 0.45 | 0.54 | 0.68 | 0.89 | 3.22 | 0 |<br />
RMSE | 2.07 | 1.61 | 1.18 | 1.79 | 1.92 | 4.02 | 0 |<br />
Cut out + Offset<br />
Min | - | -1.62 | -2.03 | -1.59 | -4.43 | -11.90 | 0 |<br />
Max | - | 3.10 | 1.83 | 5.33 | 6.70 | 14.73 | 0 |<br />
Mean | - | 0.00 | 0.00 | 0.00 | -0.00 | 0.00 | 0 |<br />
Stnd | - | 0.45 | 0.54 | 0.68 | 0.89 | 3.22 | 0 |<br />
RMSE | - | 0.45 | 0.54 | 0.68 | 0.89 | 3.22 | 0 |<br />
The analysing file for 1:xx,000, resolution xx µm and mesh size xx m.<br />
before/after the iteration process<br />
331