1995: GCMC Simulation of N2 Adsorption Isotherm of Microporous ...
1995: GCMC Simulation of N2 Adsorption Isotherm of Microporous ...
1995: GCMC Simulation of N2 Adsorption Isotherm of Microporous ...

Create successful ePaper yourself
Turn your PDF publications into a flip-book with our unique Google optimized e-Paper software.
1. Introduction<br />
G CMC <strong>Simulation</strong> <strong>of</strong> <strong>N2</strong> <strong>Adsorption</strong> <strong>Isotherm</strong> <strong>of</strong><br />
<strong>Microporous</strong> Carbon" Effect <strong>of</strong> the Interlayer Spacing<br />
Takaomi Suzuki*, Katsumi Kaneko*, Mike Maddox** and Keith<br />
Gubbins**.<br />
* Department <strong>of</strong> Chemistry, Faculty <strong>of</strong> Science, Chiba University<br />
1-33 Yayoi, Inage, Chiba 263 Japan.<br />
** School <strong>of</strong> Chemical Engineering, Cornell University Ithaca, NY 14853<br />
USA.<br />
The measurement <strong>of</strong> the <strong>N2</strong> adsorption<br />
isotherm has been widely used to characterize<br />
activated carbon. X-ray diffraction (XRD) is not so<br />
effective for determination <strong>of</strong> the activated carbon<br />
structure compared with well-crystalline<br />
microporous solids such as zeolite. Therefore, the<br />
<strong>N2</strong> adsorption analysis is indispensable to<br />
understand the pore structure <strong>of</strong> activated carbon.<br />
However, analysis <strong>of</strong> the <strong>N2</strong> adsorption isotherm<br />
<strong>of</strong> activated carbon is not fully established yet,<br />
because adsorption by micropores <strong>of</strong> activated<br />
carbon, which is called micropore filling, is different<br />
from both multi-layer adsorption and capillary<br />
condensation. In the past several years computer<br />
simulation using statistical mechanics has been<br />
applied to elucidate the adsorption mechanism <strong>of</strong><br />
<strong>N2</strong> by graphitic micropores. Those simulation<br />
researches have contributed to understand<br />
adsorption <strong>of</strong> <strong>N2</strong> by activated carbon. The model<br />
<strong>of</strong> a slit-pore between perfect crystalline graphite<br />
slabs is used in ordinary simulations[I-4].<br />
However, real activated carbon is composed <strong>of</strong><br />
micrographites <strong>of</strong> which structure ~s more<br />
disordered. For example, the stacking height <strong>of</strong><br />
real micrographites is several nm at best and the<br />
interlayer spacing is greater than 0.335nm. We<br />
must take into account these factors in simulation.<br />
Also information on the more real micropore-space<br />
<strong>of</strong> activated carbon should be used in molecular<br />
simulation for comparison with the experimental<br />
isotherm, even if the micropore structure <strong>of</strong><br />
activated carbon has some distribution. In this<br />
work, we simulated the <strong>N2</strong> adsorption isotherm <strong>of</strong><br />
activated carbon using the observed interlayer<br />
spacing.<br />
2. Characterization <strong>of</strong> ACF<br />
We used pitch-based activated carbon fiber<br />
(ACF). The adsorption isotherm <strong>of</strong> <strong>N2</strong> was<br />
obtained gravimetrically at 77 K and it was<br />
analyzed by Sing's as-plot using the SPE<br />
376<br />
method [5]. The average pore width <strong>of</strong> the<br />
sample was 1.02 nm.<br />
XRD <strong>of</strong> ACF was measured (Cu Ka, 35kV,<br />
10mA) in atmosphere. It has a very broad (002)<br />
peak with a small angle scattering background<br />
because ACF has micrographitic structures <strong>of</strong><br />
very small crystallite size. We determined an<br />
accurate peak position <strong>of</strong> the (002) peak using the<br />
background correction [6]. The interlayer sapcing,<br />
d002 was 0.36_+0.01 nm.<br />
3. <strong>Simulation</strong> Model<br />
For the adsorbate-adsorbate interaction<br />
potential, we used the Lennard-Jones 12-6 pair<br />
potential. The solid-fluid interaction potential<br />
~f(z) for nitrogen interacting with a single graphite<br />
slab is described by the Steele's 10-4-3 potential<br />
[4].<br />
[2/<br />
,,,fl 1°<br />
-, z, -<br />
(O's t~)4 ]<br />
3A(0.61A+z)3 '<br />
where A is 27r~t~sfpA, z is a vertical distance<br />
from the graphite surface, p is the solid number<br />
density, Esf and osf are fitted parameters for the<br />
nitrogen-carbon potential well depth and an<br />
effective diameter. & in this equation corresponds<br />
to d002. Parameters except & and p used here<br />
were taken from Steele's work [7] (nitrogen:<br />
~ff/k=95.2K, <strong>of</strong>f=0.375nm, graphite: ~ss/k=28.3K,<br />
oss=0.340nm).<br />
4. Calculation<br />
G CMC simulation was performed for the<br />
experimental pore width; 1.0nm. The size <strong>of</strong> unit<br />
cell was 6nm x 6nm. We calculated <strong>N2</strong> adsorption<br />
for six different A value; 0.335, 0.36, 0.40, 0.50,<br />
0.60 and 0.70 nm. The p value corresponding to<br />
each d002 was calculated. <strong>GCMC</strong> simulation was
v<br />
ca<br />
,=~<br />
_A ~t3 -400<br />
N -600<br />
G<br />
-800<br />
- 1000<br />
- 1200<br />
-0.5<br />
. . . . . . . . . . I<br />
: ,~ ; , ~ ,, : :<br />
. . . . . . . . . . . . . . . . i<br />
0 0.5<br />
..<br />
0.8<br />
c-<br />
°~<br />
~0.6<br />
t-<br />
.o_<br />
~0.4<br />
0.2<br />
_ ! i i I~/ ::<br />
/.7<br />
..................... : .................... ............................ ~, ....... / . . . . . . . . . .<br />
~/.,'1--- -0.335 II '<br />
: i i • t<br />
........................................... ~ ~ 1 .... 0.36 I_-<br />
i l,','lr [ ..... 0.40 I<br />
//, .,, I ..... 0.50 l J<br />
l, ,/; I ..... 0.60 I1<br />
. . . . // .'/.' I ..... 0.~0 I!<br />
2./' 'i ']<br />
10-6 105 104 103 10 -2 101 10 o<br />
z/nm P/Po<br />
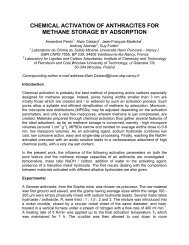
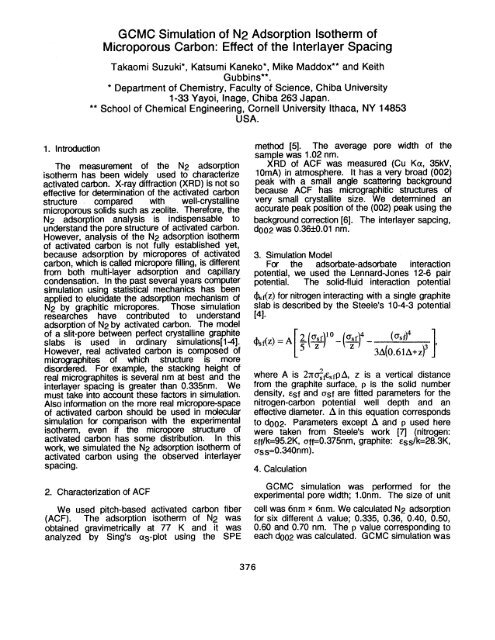
Figure 1; The interaction potential pr<strong>of</strong>iles <strong>of</strong> a Figure 2; Comparison <strong>of</strong> simulated nitrogen<br />
nitrogen molecule with graphite-slit pore <strong>of</strong> the adsorption isotherms with an observed isotherm<br />
pore width <strong>of</strong> lnm. <strong>of</strong> ACF.<br />
basically run for 2 x 10⁶ configurations to get simulated isotherm using A=0.36-0.40 is close to<br />
the observed one. In future, we must take into<br />
equilibrium (3 x 10⁶ configurations around the account the pore size distribution for the<br />
critical points on adsorption isotherms), using a simulation.<br />
Hewlett Packard 735 work station.<br />
Acknowledgment. We thank Dr. R. F. Cracknell<br />
and Dr. D. Nichoison for giving important<br />
5. Results and Discussion suggestions on writing the program.<br />
Potential curves calculated using the different<br />
A values are shown in Fig. 1. Origin <strong>of</strong> z is<br />
shifted to the ceter <strong>of</strong> the micropore in Fig. 1.<br />
There are two minima in each potential curve at<br />
0.32 nm from the center <strong>of</strong> micropore and the depth<br />
<strong>of</strong> the minima decreases with increase <strong>of</strong> A. The<br />
position <strong>of</strong> the potential minima for A=0.70 is<br />
higher than that for A=0.335 by 150K. Thus, the<br />
effect <strong>of</strong> A is quite important for simulation.<br />
Reference<br />
[1] Seaton, N.A.; Walton, J.P.R.B.; Quirke, N.,<br />
Carbon, 1989, 27, 853.<br />
[2] Matrange, K.R.; Myers, A.L.; Glandt, E.D.,<br />
Chem. Eng. Sci., 1992, 47, 1569.<br />
[3] Lastoskie, C.; Gubbins, K.E.; Quirke, N., J.<br />
Phys. Chem., 1993, 97, 4785.<br />
The simulated and experimental adsorption<br />
isotherms for ACF are shown in Fig. 2. Each<br />
simulated isotherm has a steep jump and a<br />
gradual uptake in the PIP0 regions <strong>of</strong> 104-10 -3<br />
[4] Kanko, K.; Cracknell, R. F.; Nicholson. D.,<br />
Langmuir, 1994, 10, 4606.<br />
[5] Kaneko, K.; Ishii, C., J. Colloid Interface Sci.,<br />
1992, 67, 203.<br />
[6] Suzuki, T; Kaneko, K., Carbon, 1993, 31,<br />
and 4x10⁻³-2x10 -2, respectively. The greater A 1359.<br />
value shifts the adsorption isotherm to the higher<br />
PIP0 side.<br />
The simulation explicitly showed that the steep<br />
jump come from adsorption on each microporesurface<br />
and the gradual uptake is caused b y<br />
adsorption in the residual space between preadsorbed<br />
nitrogen layers on both micropore<br />
surfaces. So far ACF has a slight pore size<br />
distribution and thereby a strict comparison <strong>of</strong> the<br />
simulated isotherm with the observed isotherm <strong>of</strong><br />
ACF is not conclusive. We believe that the<br />
[7] Steele, W.A., Surf. Sci., 1973, 36, 317.<br />
377