Laboratory evaluation of aging for asphalt-aggregate mixtures
Laboratory evaluation of aging for asphalt-aggregate mixtures
Laboratory evaluation of aging for asphalt-aggregate mixtures

Create successful ePaper yourself
Turn your PDF publications into a flip-book with our unique Google optimized e-Paper software.
An Abstract <strong>of</strong> the Thesis <strong>of</strong><br />
Daniel A. Sosnovske <strong>for</strong> the degree <strong>of</strong> Master <strong>of</strong> Science in Civil Engineering presented<br />
on December 20, 1994. Title: <strong>Laboratory</strong> Evaluation <strong>of</strong> Aging <strong>for</strong> Asphalt-Aggregate<br />
Mixtures.<br />
Abstract Approved:<br />
Chris A. Bell<br />
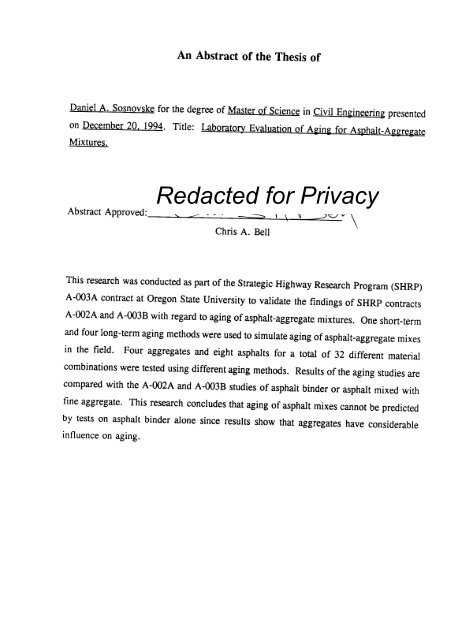
This research was conducted as part <strong>of</strong> the Strategic Highway Research Program (SHRP)<br />
A-003A contract at Oregon State University to validate the findings <strong>of</strong> SHRP contracts<br />
A-002A and A-003B with regard to <strong>aging</strong> <strong>of</strong> <strong>asphalt</strong>-<strong>aggregate</strong> <strong>mixtures</strong>. One short-term<br />
and four long-term <strong>aging</strong> methods were used to simulate <strong>aging</strong> <strong>of</strong> <strong>asphalt</strong>-<strong>aggregate</strong> mixes<br />
in the field. Four <strong>aggregate</strong>s and eight <strong>asphalt</strong>s <strong>for</strong> a total <strong>of</strong> 32 different material<br />
combinations were tested using different <strong>aging</strong> methods. Results <strong>of</strong> the <strong>aging</strong> studies are<br />
compared with the A-002A and A-003B studies <strong>of</strong> <strong>asphalt</strong> binder or <strong>asphalt</strong> mixed with<br />
fine <strong>aggregate</strong>. This research concludes that <strong>aging</strong> <strong>of</strong> <strong>asphalt</strong> mixes cannot be predicted<br />
by tests on <strong>asphalt</strong> binder alone since results show that <strong>aggregate</strong>s have considerable<br />
influence on <strong>aging</strong>.<br />
Redacted <strong>for</strong> Privacy
<strong>Laboratory</strong> Evaluation <strong>of</strong> Aging <strong>for</strong> Asphalt-Aggregate Mixtures<br />
by<br />
Daniel A. Sosnovske<br />
A THESIS<br />
submitted to<br />
Oregon State University<br />
in partial fulfillment <strong>of</strong><br />
the requirements <strong>for</strong> the<br />
degree <strong>of</strong><br />
Master <strong>of</strong> Science<br />
Completed December 20, 1994<br />
Commencement June 1995
Master <strong>of</strong> Science thesis <strong>of</strong> Daniel A. Sosnovske presented on December 20. 1994<br />
APPROVED:<br />
Redacted <strong>for</strong> Privacy<br />
Major Pr<strong>of</strong>essor, representing Civil Engineering<br />
Redacted <strong>for</strong> Privacy<br />
Head <strong>of</strong> D partment <strong>of</strong> Civil Engineering<br />
Redacted <strong>for</strong> Privacy<br />
Dean <strong>of</strong> Graduate<br />
I understand that my thesis will become part <strong>of</strong> the permanent collection <strong>of</strong> Oregon<br />
State University libraries. My signature below authorizes release <strong>of</strong> my thesis to any<br />
reader upon request.<br />
Redacted <strong>for</strong> Privacy<br />
iel A. Sosnovske, Author
Acknowledgements<br />
The research described herein was supported by the Strategic Highway Research Program<br />
(SHRP). SHRP is a unit <strong>of</strong> the National Research Council that was authorized by<br />
Section 128 <strong>of</strong> the Surface Transportation and Uni<strong>for</strong>m Relocation Assistance Act <strong>of</strong><br />
1987.<br />
I would like to express my appreciation to Dr. Chris Bell and Dr. Gary Hicks. Without<br />
their guidance and support this report would not have been completed. And also, to the<br />
other members <strong>of</strong> the OSU SHRP Research Team, whose support and encouragement<br />
made this project possible.
Table <strong>of</strong> Contents<br />
1.0 Introduction 1<br />
1.1 Background 1<br />
1.2 Purpose 2<br />
1.3 Scope 2<br />
2.0 Hypothesis <strong>for</strong> Aging <strong>of</strong> Asphalt 3<br />
2.1 Chemical Properties Western Research Institute 3<br />
2.1.1 Permanent De<strong>for</strong>mation 4<br />
2.1.2 Low Temperature Cracking 4<br />
2.1.3 Fatigue Cracking 9<br />
2.1.4 Aging 10<br />
2.1.5 Moisture Damage (Loss <strong>of</strong> Adhesion) 13<br />
2.2 Physical Properties Pennsylvania State University (PSU) 13<br />
2.2.1 Load Associated Fatigue Cracking 15<br />
2.2.2 Rutting in Upper Layers <strong>of</strong> Hot-Mix Asphalt 18<br />
2.2.3 Low-Temperature Thermal Shrinkage Cracking 20<br />
2.2.4 Moisture Damage 21<br />
2.2.5 Aging 21<br />
2.3 Auburn University A003B 22<br />
2.3.1 Adhesion 22<br />
2.3.2 Products From the A-003B Research 25<br />
3.0 Experiment Design 29<br />
3.1 Variables 29<br />
3.2 Materials 29<br />
3.3 Aging Methods 30<br />
3.3.1 No Aging 30<br />
3.3.2 Short-Term Aging 31<br />
3.3.3 Low Pressure Oxidation 32<br />
3.3.4 Long-Term Oven Aging 33
Table <strong>of</strong> Contents (Continued)<br />
3.4 Evaluation Methods 33<br />
3.4.1 Resilient Modulus 33<br />
3.4.2 Dynamic Modulus 33<br />
3.4.3 Tensile Strength Test 34<br />
4.0 Results 35<br />
4.1 Resilient Modulus Data 35<br />
4.1.1 Short-Term Aging Results 35<br />
4.1.2 Long-Term Aging Results 35<br />
4.1.3 Adjustment <strong>of</strong> Modulus Data 36<br />
5.0 Analysis <strong>of</strong> Results 50<br />
5.1 Statistical Analysis 50<br />
5.1.1 Data Description 50<br />
5.1.2 Waller Groupings 50<br />
5.2 Short-Term Aging <strong>of</strong> Asphalt-Aggregate Mixes 51<br />
5.2.1 Comparison <strong>of</strong> Mix Aging by Short-Term and<br />
Long-Term Aging Methods 52<br />
5.3 Long-Term Aging <strong>of</strong> Asphalt-Aggregate Mixes 52<br />
5.4 Comparison <strong>of</strong> Mix Aging by Short-Term and Long-Term<br />
Aging Methods 53<br />
5.5 Comparison <strong>of</strong> Mix Aging With Asphalt Aging 53<br />
5.5.1 Short-Term Aging 60<br />
5.5.2 Long-Term Aging 60<br />
5.6 General Discussion 64<br />
6.0 Conclusions and Recommendations 66<br />
6.1 Conclusions 66
Table <strong>of</strong> Contents (Continued)<br />
6.2 Recommendations 67<br />
References 68<br />
Appendices 71<br />
Appendix A Short-Term Aging <strong>of</strong> Asphalt Concrete 72<br />
Appendix B Long-Term Aging <strong>of</strong> Asphalt Concrete Mixes by Low<br />
Pressure Oxidation 77<br />
Appendix C Long-Term Aging <strong>of</strong> Asphalt Concrete Mixes by<br />
Long-Term Oven Aging 85<br />
Appendix D Detailed Resilient Modulus Results 91<br />
Appendix E Tensile Strength Test Results 100<br />
Appendix F Dynamic Mechanical Analysis 103
List <strong>of</strong> Figures<br />
Figure 2.1. Chemistry - physical property per<strong>for</strong>mance relationships 5<br />
Figure 2.2. Relationship between weight percent sec fraction II and trans<br />
delta <strong>of</strong> SHRP <strong>asphalt</strong>s 7<br />
Figure 2.3. Aging incidces at three temperatures <strong>of</strong> SHRP core <strong>asphalt</strong>s 12<br />
Figure 2.4. Net adsorption <strong>of</strong> <strong>asphalt</strong>s on various limestones 28<br />
Figure 4.1. Short-term <strong>aging</strong>: rankings based on diametral modulus 45<br />
Figure 4.2. Long-term <strong>aging</strong> by low pressure oxidation at 60°C: rankings<br />
based on diametral modulus<br />
Figure 4.3. Long-term <strong>aging</strong> by low pressure oxidation at 85°C: rankings<br />
based on diametral modulus 47<br />
Figure 4.4. Long-term <strong>aging</strong> by long-term oven <strong>aging</strong> at 85°C: based on<br />
diametral modulus 48<br />
Figure 4.5. Long-term <strong>aging</strong> by long-term oven <strong>aging</strong> at 100°C: based<br />
on diametral modulus 49<br />
46
List <strong>of</strong> Tables<br />
Table 2.1. Ranking <strong>of</strong> high temperature permanent de<strong>for</strong>mation and<br />
rutting by SEC-tan delta 6<br />
Table 2.2. Ranking <strong>of</strong> SHRP <strong>asphalt</strong>s in terms <strong>of</strong> their resistance to low<br />
temperature cracking 9<br />
Table 2.3. Resistance <strong>of</strong> aged <strong>asphalt</strong> to fatigue cracking 11<br />
Table 2.4. Ranks <strong>of</strong> moisture damage resistance by IR <strong>of</strong> functional<br />
group analysis (limited to <strong>asphalt</strong>; <strong>aggregate</strong> not considered) . 14<br />
Table 2.5. Ranking <strong>of</strong> <strong>asphalt</strong>s in load associated fatigue bending beam<br />
at 20°C (68°F) 17<br />
Table 2.6 Ranking <strong>of</strong> <strong>asphalt</strong>s in load associated fatigue bending beam<br />
at 0°C (32°F) 17<br />
Table 2.7. Ranking <strong>of</strong> <strong>asphalt</strong>s in load associated fatigue wheel tracking<br />
test at 20°C (68°F) 18<br />
Table 2.8. Ranking <strong>of</strong> <strong>asphalt</strong>s in load associated fatigue field 18<br />
Table 2.9. Ranking <strong>of</strong> <strong>asphalt</strong>s in rutting in hot-mix <strong>asphalt</strong> wheel<br />
tracking test at 5°C (41°F) 19<br />
Table 2.10. Ranking <strong>of</strong> SHRP tank <strong>asphalt</strong>s <strong>for</strong> resistance to low 20<br />
Table 3.1. Low pressure <strong>aging</strong> experiment design 30<br />
Table 3.2. Long-term oven <strong>aging</strong> experiment design 31<br />
Table 3.3. Materials used 32<br />
Table 4.1. Modulus data <strong>for</strong> <strong>aggregate</strong> RC 37<br />
Table 4.2. Modulus data <strong>for</strong> <strong>aggregate</strong> RD 39<br />
Table 4.3. Modulus data <strong>for</strong> <strong>aggregate</strong> RH 41<br />
Table 4.4. Modulus data <strong>for</strong> <strong>aggregate</strong> RJ 43<br />
Table 5.1. Short-term rankings by <strong>aggregate</strong> 54
List <strong>of</strong> Tables (Continued)<br />
Table 5.2. Long-term <strong>aging</strong> by low pressure oxidation at 60°C: rankings by<br />
<strong>aggregate</strong> 55<br />
Table 5.3. Long-term <strong>aging</strong> by low pressure oxidation at 85°C: rankings by<br />
<strong>aggregate</strong> 56<br />
Table 5.4. Long-term oven <strong>aging</strong> at 85°C: rankings by <strong>aggregate</strong> 57<br />
Table 5.5. Long-term oven <strong>aging</strong> at 100°C: rankings by <strong>aggregate</strong> 58<br />
Table 5.6 Ranking <strong>of</strong> Asphalt <strong>for</strong> Each Aggregate Based on Diametral<br />
Modulus Ratios and Aging Method 59<br />
Table 5.7. Summary <strong>of</strong> routine test data <strong>for</strong> <strong>asphalt</strong> alone 61<br />
Table 5.8. Comparison <strong>of</strong> rankings <strong>for</strong> short-term <strong>aging</strong> <strong>mixtures</strong> and <strong>asphalt</strong><br />
alone 62<br />
Table 5.9. Comparison <strong>of</strong> rankings <strong>for</strong> long-term <strong>aging</strong> <strong>of</strong> <strong>mixtures</strong> and<br />
<strong>asphalt</strong>s 63
Appendix D<br />
Appendix F<br />
Figure D.1.<br />
Figure D.2.<br />
Figure D.3.<br />
Figure D.4.<br />
Figure D.S.<br />
Figure D.6.<br />
Figure D.7.<br />
Figure D.B.<br />
Figure F.1.<br />
Figure F.2.<br />
Figure F.3.<br />
Appendix List <strong>of</strong> Figures<br />
Diametral Modulus: Long-Term Oven and Low-Pressure<br />
Oxidation Aging with Short-Term Oven Aging Asphalt<br />
AAA-1 92<br />
Diametral Modulus: Long-Term Oven and Low-Pressure<br />
Oxidation Aging with Short-Term Oven Aging--Asphalt<br />
AAB-1 93<br />
Diametral Modulus: Long-Term Oven and Low-Pressure<br />
Oxidation Aging with Short-Term Oven Aging--Asphalt<br />
AAC-1 94<br />
Diametral Modulus: Long-Term Oven and Low-Pressure<br />
Oxidation Aging with Short-Term Oven Aging Asphalt<br />
AAD-1 95<br />
Diametral Modulus: Long-Term Oven and Low-Pressure<br />
Oxidation Aging with Short-Term Oven Aging Asphalt<br />
AAF-1 96<br />
Diametral Modulus: Long-Term Oven and Low-Pressure<br />
Oxidation Aging with Short-Term Oven Aging--Asphalt<br />
AAG-1 97<br />
Diametral Modulus: Long-Term Oven and Low-Pressure<br />
Oxidation Aging with Short-Term Oven Aging--Asphalt<br />
AAK-1 98<br />
Diametral Modulus: Long-Term Oven and Low-Pressure<br />
Oxidation Aging with Short-Term Oven Aging-- Asphalt<br />
AAM-1 99<br />
Dynamic mechanical analysis (Goodrich 1991) 104<br />
Unconfined triaxial modulus test 106<br />
Procedure <strong>for</strong> trans<strong>for</strong>ming modulus data to the master<br />
stiffness curve (Stephanos 1990) 107
Appendix List <strong>of</strong> Figures (Continued)<br />
Figure F.4. Master curve <strong>for</strong> short-term oven aged specimen 109<br />
Figure F.5. Phase shift curve <strong>for</strong> short-term aged specimen 110<br />
Figure F.6. Experimental data and regression data <strong>for</strong> master curve and<br />
phase angle curve 116<br />
Figure F.7. Master curve and phase angle curve <strong>for</strong> <strong>asphalt</strong> AAD-1 and<br />
<strong>aggregate</strong> RC 117<br />
Figure F.8. Master curve and phase angle curve <strong>for</strong> <strong>asphalt</strong> AAD-1 and<br />
<strong>aggregate</strong> RH 118<br />
Figure F.9. Master curve and phase angle curve <strong>for</strong> <strong>asphalt</strong> AAF-1 and<br />
<strong>aggregate</strong> RC 119<br />
Figure F.10. Master curve and phase angle curve <strong>for</strong> <strong>asphalt</strong> AAF-1 and<br />
<strong>aggregate</strong> RH 120<br />
Figure F.11. Master curve and phase angle curve <strong>for</strong> <strong>asphalt</strong> AAM-1 and<br />
<strong>aggregate</strong> RC , 121<br />
Figure F.12. Master curve <strong>for</strong> <strong>asphalt</strong> AAB-1 (after Christensen et al.<br />
1992) 122
Appendix A<br />
Appendix B<br />
Appendix C<br />
Appendix E<br />
Appendix F<br />
Table A.1.<br />
Table B.1.<br />
Table C.1.<br />
Table E.1.<br />
Table F.1.<br />
Table F.2.<br />
Table F.3.<br />
Table F.4.<br />
Appendix List <strong>of</strong> Tables<br />
Minimum <strong>aging</strong> test system requirements 74<br />
Minimum <strong>aging</strong> test system requirements 79<br />
Minimum <strong>aging</strong> test system requirements 87<br />
Tensile strength test results 102<br />
Percent air voids <strong>for</strong> each <strong>asphalt</strong>-<strong>aggregate</strong><br />
combination 112<br />
Resilient modulus ratio <strong>for</strong> short-term and long-term<br />
<strong>aging</strong> 113<br />
Complex modulus (ksi) data selected at frequencies,<br />
0.001, 1, 1000 Hz 114<br />
Complex modulus ratio selected at frequencies, 0.001,<br />
1, 1000 Hz 115
LABORATORY EVALUATION OF AGING FOR ASPHALT-<br />
1.1 Background<br />
AGGREGRATE MIXTURES<br />
1.0 Introduction<br />
The development <strong>of</strong> laboratory <strong>aging</strong> procedures <strong>for</strong> <strong>asphalt</strong>-<strong>aggregate</strong><br />
mixes as a part <strong>of</strong> project A-003A <strong>of</strong> the Strategic Highway Research Program<br />
(SHRP) has been described previously by Bell et al. (1992a). The validation <strong>of</strong><br />
these procedures is described in another report by Bell et al. (1992b).<br />
The procedure developed <strong>for</strong> short-term <strong>aging</strong> involves heating the loose<br />
mix <strong>for</strong> 4 h at 135°C (275°F) in a <strong>for</strong>ced draft oven, prior to compaction <strong>of</strong><br />
laboratory specimens. This simulates the <strong>aging</strong> <strong>of</strong> the mix in the field during the<br />
construction process while it is in an uncompacted condition.<br />
Alternate procedures have been developed <strong>for</strong> long-term <strong>aging</strong> <strong>of</strong> mixes.<br />
These simulate the <strong>aging</strong> <strong>of</strong> compacted mix <strong>for</strong> service periods <strong>of</strong> several years.<br />
The following approaches have been found to be appropriate:<br />
a) Long-term oven <strong>aging</strong> (LTOA) <strong>of</strong> compacted specimens in a <strong>for</strong>ced<br />
draft oven.<br />
b) Low pressure oxidation (LPO) <strong>of</strong> compacted specimens in a triaxial<br />
cell by passing oxygen through the specimens.<br />
Various combinations <strong>of</strong> temperature and time have been evaluated (Bell et al.<br />
1992a).<br />
The effects <strong>of</strong> <strong>aging</strong> were evaluated by resilient modulus at 25°C (77°F)<br />
using diametral (indirect tension) and triaxial compression modes <strong>of</strong> testing.<br />
Tensile strength tests were per<strong>for</strong>med on specimens once all other data have been<br />
collected. A selection <strong>of</strong> specimens were subjected to a Dynamic Mechanical<br />
Analysis (DMA) testing program at different temperatures and loading frequencies.
1.2 Purpose<br />
The purpose <strong>of</strong> this report is to describe a laboratory study designed to<br />
compare the results <strong>of</strong> <strong>aging</strong> <strong>of</strong> <strong>asphalt</strong> (done by the SHRP A-002A contractor)<br />
with the results <strong>of</strong> <strong>aging</strong> <strong>of</strong> <strong>asphalt</strong>-<strong>aggregate</strong> mixes (done by the A-003A<br />
contractor).<br />
1.3 Scope<br />
Following a description <strong>of</strong> the hypothesis <strong>for</strong> <strong>aging</strong> <strong>of</strong> <strong>asphalt</strong>s (developed<br />
by the A-002A contractor), the experiment design <strong>for</strong> the laboratory test program<br />
is presented. The results <strong>of</strong> the test program and their analysis, including<br />
comparison with the A-002A results, are presented prior to the conclusions arising<br />
from the study. A series <strong>of</strong> appendices are included describing the <strong>aging</strong><br />
procedures and the test methods used to evaluate <strong>aging</strong>.<br />
2
2.0 Hypothesis <strong>for</strong> Aging <strong>of</strong> Asphalt<br />
The in<strong>for</strong>mation presented in this chapter is included to satisfy a<br />
requirement <strong>of</strong> the research contract. All <strong>of</strong> the in<strong>for</strong>mation presented in this<br />
chapter was developed by researchers at institutions other that OSU. The rankings<br />
presented in this chapter are hypothetical rankings based on chemical composition<br />
tests <strong>of</strong> the <strong>asphalt</strong> cements. The results in Chapter 5 are compared to basic<br />
<strong>asphalt</strong> viscosity data rather than the rankings presented in this chapter. The<br />
viscosity tests more closely resemble the physical testing mode used in this<br />
research program.<br />
The <strong>asphalt</strong> contractors A-002A and A-003B were asked to rank the SHRP<br />
<strong>asphalt</strong>s in terms <strong>of</strong> expected per<strong>for</strong>mance based on chemical and/or physical<br />
properties <strong>of</strong> the <strong>asphalt</strong> cements. Both Western Research Institute (WRI) and<br />
Pennsylvania State University (PSU) provided this in<strong>for</strong>mation <strong>for</strong> 16 <strong>of</strong> the SHRP<br />
<strong>asphalt</strong>s. These rankings, together with similar ones provided by contractor<br />
A-003B <strong>for</strong> water sensitivity, were to be validated by A-003A using simulative<br />
tests. This chapter summarizes the rankings put <strong>for</strong>th by the A-002A and A-003B<br />
contractors.<br />
Since <strong>aging</strong> plays a role in the permanent de<strong>for</strong>mation, fatigue, and thermal<br />
cracking <strong>of</strong> mixes, a summary <strong>of</strong> the hypothesis <strong>for</strong> each <strong>of</strong> these per<strong>for</strong>mance<br />
characteristics is presented below, as well as <strong>for</strong> <strong>aging</strong> and water sensitivity.<br />
2.1 Chemical Properties - Western Research Institute<br />
The following is the ranking <strong>of</strong> expected per<strong>for</strong>mance <strong>of</strong> SHRP <strong>asphalt</strong>s in<br />
terms <strong>of</strong> their chemical properties (Peterson et al. 1994). (Similar in<strong>for</strong>mation is<br />
provided in Robertson, 1994). WRI has emphasized that the structural<br />
characteristics are primarily related to the physical (viscoelastic) properties and that<br />
3
any given set <strong>of</strong> physical properties may be achieved by substantially different<br />
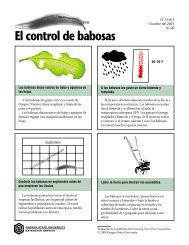
chemical compositions. Rankings by distress type are discussed, and a schematic<br />
illustrating the relationship among chemical and physical properties and pavement<br />
per<strong>for</strong>mance is shown in Figure 2.1.<br />
2.1.1 Permanent De<strong>for</strong>mation<br />
Permanent de<strong>for</strong>mation <strong>of</strong> <strong>asphalt</strong>-<strong>aggregate</strong> mixes can be affected by<br />
<strong>asphalt</strong> type or by <strong>aggregate</strong> type and mix characteristics. It generally occurs at<br />
high temperatures because <strong>of</strong> shear stresses in the upper part <strong>of</strong> the pavement<br />
surface.<br />
Size exclusion chromatography (SEC) fraction I/fraction II ratios have been<br />
found to be strongly related to permanent de<strong>for</strong>mation. These ratios are evaluated<br />
on <strong>asphalt</strong>s that have not experienced any long-term <strong>aging</strong>. The SEC ratio is the<br />
ratio <strong>of</strong> the weight <strong>of</strong> the non-fluorescent components (I) which appear to assemble<br />
into an elastic matrix to the weight <strong>of</strong> the fluorescent materials (II) which <strong>for</strong>m the<br />
dispersing phase.<br />
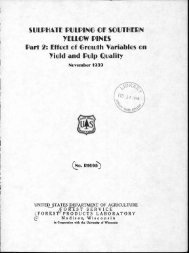
Figure 2.2 shows a plot <strong>of</strong> the SEC II fraction versus tan delta at 25°C<br />
(77°F). Table 2.1 is a ranking <strong>of</strong> the SHRP <strong>asphalt</strong>s in terms <strong>of</strong> their resistance to<br />
permanent de<strong>for</strong>mation.<br />
2.1.2 Low Temperature Cracking<br />
Thermal cracking in <strong>asphalt</strong> concrete requires two obvious situations 1)<br />
contraction (shrinkage) <strong>of</strong> some or all components <strong>of</strong> the concrete and 2) stiffening<br />
<strong>of</strong> the mix to a level that viscous flow to relieve strain caused by contraction<br />
cannot occur at a rate high enough to relieve the strain. Since the <strong>aggregate</strong> has<br />
effectively no viscous flow (at any service temperature), the ability to flow and<br />
4
Chemical<br />
Composition<br />
Associated<br />
Phas<br />
Solvent<br />
Phase<br />
Molecular<br />
Associations<br />
Figure 2.1. Chemistry physical property per<strong>for</strong>mance relationships<br />
1<br />
Physical<br />
Properties<br />
Pavement<br />
Per<strong>for</strong>mance
hence avoid cracking must be totally within the viscoelastic binder. However,<br />
<strong>aggregate</strong>s may have various coefficients <strong>of</strong> thermal expansion, and hence<br />
contribute differentially to the overall contraction <strong>of</strong> pavement. So variation in<br />
<strong>aggregate</strong> may have an effect on the overall problem <strong>of</strong> thermal cracking.<br />
Presuming that the binder is totally responsible <strong>for</strong> the creep properties, some<br />
chemical property or set <strong>of</strong> properties <strong>of</strong> the binder is (are) responsible <strong>for</strong> the<br />
variation in flow properties among different <strong>asphalt</strong>s.<br />
Table 2.1. Ranking <strong>of</strong> high temperature permanent de<strong>for</strong>mation and rutting<br />
by SEC-tan delta<br />
Asphalt Type Expected Per<strong>for</strong>mance<br />
AAM-1 Excellent Resistance<br />
AAK -1<br />
.<br />
AAE<br />
.<br />
AAS-1 Very Good Resistance<br />
.<br />
AAH<br />
AAD-1<br />
AAB-1<br />
AAW<br />
AAJ<br />
AAA-1 Good Resistance<br />
AAN<br />
.<br />
AAX<br />
AAF-1 Fair Resistance<br />
AAC-1<br />
.<br />
.<br />
AAZ<br />
AAV Poor Resistance<br />
.<br />
AAG-1<br />
ABD Little or No Resistance<br />
6
0<br />
Lr)<br />
N<br />
8<br />
5 AAV<br />
AAG-1<br />
a AAZ AAC-1<br />
4-<br />
0<br />
AAX<br />
a AAS-1<br />
3 AAK-1<br />
AAM-1<br />
/ 2 AAJ<br />
AAE AAD-1<br />
AAB-1<br />
AAH<br />
1 i I<br />
65 70<br />
AAA-1 AAF-1<br />
AAN<br />
I i<br />
75 80 85<br />
Weight Percent SEC Fraction H<br />
ABD<br />
Figure 2.2. Relationship between weight percent sec fraction II and trans delta <strong>of</strong> SHRP <strong>asphalt</strong>s<br />
I<br />
90<br />
--1
Viscous flow implies that the elastic matrix is not involved, especially<br />
considering the small amount <strong>of</strong> change involved. For example, a 1 in. (2.54 cm)<br />
crack every 50 feet (15.25 m) amounts to a 0.17 percent contraction. Elasticity<br />
should accommodate this amount <strong>of</strong> volume change. Further, thermodynamic data<br />
suggest that most organization <strong>of</strong> the polar matrix has been achieved at moderate<br />
and higher temperatures. A transition <strong>of</strong> the neutral materials to a glass with an<br />
accompanying contraction, similar to crystallization <strong>of</strong> non-polar materials, is a<br />
more likely cause. The stiffness, or rigidity, <strong>of</strong> homologous pseudocrystalline<br />
materials generally increases with molecular weight. The relative amounts may<br />
also have an effect, but ion exchange chromatography (IEC) experiments <strong>for</strong> the<br />
core <strong>asphalt</strong>s show <strong>for</strong> the neutral range from 51 to 60 percent, relatively similar<br />
amounts. The supercritical fluid chromatography (SFC) pr<strong>of</strong>iles <strong>for</strong> the IEC<br />
neutrals <strong>of</strong> core <strong>asphalt</strong>s are significantly different and show that the molecular<br />
weight pr<strong>of</strong>iles <strong>of</strong> the neutral components differ substantially. Chemical structural<br />
variations among neutrals may affect rigidity <strong>of</strong> a pseudocrystalline phase also, but<br />
no such detailed in<strong>for</strong>mation on neutral components has been acquired<br />
systematically. An indication <strong>of</strong> structural effects is being sought at present using<br />
Fourier trans<strong>for</strong>mation infrared (FUR) radiation.<br />
The ranking <strong>of</strong> six <strong>of</strong> the eight core <strong>asphalt</strong>s in table 2.2 is based on the<br />
molecular weight average by SEC. Although not shown in table 2.2, <strong>asphalt</strong><br />
AAM-1 has a maximum at 68 carbons, but is an odd case with a very uni<strong>for</strong>m and<br />
broad molecular weight range. Typically, such broad molecular weight mixes do<br />
not tend to (<strong>for</strong> a pseudocrystalline phases) and would not be expected to harden<br />
disproportionately as its carbon number might indicate. The presumption, based<br />
on the unique pr<strong>of</strong>ile <strong>of</strong> AAM-1 neutral, is that it would show intermediate low<br />
temperature cracking properties because <strong>of</strong> the broad pr<strong>of</strong>ile.<br />
8
Table 2.2. Ranking <strong>of</strong> SHRP <strong>asphalt</strong>s in terms <strong>of</strong> their resistance to low<br />
temperature cracking<br />
Carbon Number at<br />
Asphalt the Max <strong>of</strong> SFC Peak Ranking<br />
AAA-1 32 Least likely to low temp. crack<br />
AAD-1 32 "<br />
AAK-1 32<br />
AAG 42 Moderate probability to low temp.<br />
crack<br />
AAB 43 "<br />
AAF 48 Most likely to low temp. crack<br />
2.1.3 Fatigue Cracking<br />
Fatigue cracking is typically associated with aged pavement, although it can<br />
occur in relatively new pavements. In relatively new pavement fatigue cracking, to<br />
any extent that it occurs, should be somewhat the opposite <strong>of</strong> rutting. That is,<br />
<strong>asphalt</strong>s that have the smallest amounts <strong>of</strong> SEC II should have the greatest<br />
propensity to crack under stress <strong>of</strong> traffic. The matrix developed by a large SEC I<br />
would be expected to be too rigid. This is highly speculative and the best ranking<br />
available is the reverse order <strong>of</strong> the early rutting list. (Table 2.3)<br />
Problems <strong>of</strong> fatigue cracking in aged <strong>asphalt</strong>s are more likely than fatigue<br />
cracking in unaged binders. Based on Figure 2.2 the rankings were developed <strong>for</strong><br />
3 temperature regimes <strong>for</strong> the 8 core <strong>asphalt</strong>s that are shown in Table 2.3. Each<br />
ranking also has a qualitative descriptor.<br />
9
2.1.4 Aging<br />
Aging <strong>of</strong> <strong>asphalt</strong> is a complicated set <strong>of</strong> events involving oxidation at the<br />
molecular level and the additional chemical feature <strong>of</strong> structuring at the<br />
intermolecular level. The primary chemical species <strong>for</strong>med are ketones and<br />
sulfoxides. More severe oxidation produces carboxylic anhydrides and small<br />
amounts <strong>of</strong> other highly oxidized species. Structuring appears to quench further<br />
oxidative <strong>aging</strong>. The rate <strong>of</strong> <strong>aging</strong> decreases with time at any given temperature.<br />
As temperature is increased, the amount <strong>of</strong> structuring decreases, and reactivity<br />
increases. The resulting oxidation rate increases and the level <strong>of</strong> quenching<br />
decreases. At very extended times (severe oxidation <strong>aging</strong>), at least one <strong>of</strong> the<br />
core <strong>asphalt</strong>s (AAK-1) shows extreme hardening, but it is not yet clear that this is<br />
still within normal road service conditions. It is speculated that the unique<br />
behavior <strong>of</strong> AAK-1 results from its extraordinary vanadium content. This suggests<br />
that vanadium may be a viable catalyst to oxidize <strong>asphalt</strong>s rapidly, and hence<br />
provide a usable test method that is much faster than thin film oven/pressure <strong>aging</strong><br />
vessel (TFO-PAV) <strong>for</strong> <strong>evaluation</strong> <strong>of</strong> oxidative <strong>aging</strong>.<br />
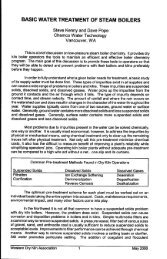
In Figure 2.3, the <strong>aging</strong> index (AI) pr<strong>of</strong>iles <strong>for</strong> the 8 core <strong>asphalt</strong>s are<br />
shown as a function <strong>of</strong> temperature between 60°C and 80°C (140° and 176°F).<br />
Note that the oxidative age hardening spreads dramatically over this 20°C (36°F)<br />
range. Note, too, that 176°F (80°C) was chosen as an upper limit. [Perhaps this<br />
should be 185°F (85°C).] At 140°F (60°C) the <strong>aging</strong> rates <strong>for</strong> all <strong>asphalt</strong>s have<br />
diminished very significantly suggesting that below 55-60°C (131°-140°F)<br />
oxidative <strong>aging</strong> may be relatively insignificant.<br />
Thus far, TFO-PAV is the chosen method to develop into a specification<br />
method <strong>for</strong> oxidative <strong>aging</strong>.<br />
10
Table 2.3. Resistance <strong>of</strong> aged <strong>asphalt</strong> to fatigue cracking<br />
Moderate and Cool Climate 140°F and<br />
below surface temperatures<br />
Intermediate Climate<br />
155-165°F surface temperatures<br />
Hot Climate 175°F higher surface<br />
temperatures<br />
AAA-1 Very resistant to fatigue cracking<br />
AAB-1<br />
AAG-1 Very resistant AAG-1 Resistant to fatigue cracking<br />
AAC-1<br />
AAG-1 AAC-1 Resistant<br />
AAB-1<br />
AAA-1<br />
AAB-1<br />
AAA-1<br />
AAK-1 Resistant to fatigue cracking<br />
AAF-1 " AAK-1<br />
"<br />
"<br />
"<br />
"<br />
AAC-1<br />
AAM-1<br />
"<br />
"<br />
AAF-1 " AAF-1<br />
AAK-1<br />
"<br />
AAD-1 Fair resistance to fatigue cracking<br />
AAM<br />
AAD<br />
Moderate susceptibility fatigue cracking<br />
"<br />
AAM-1 "<br />
Moderate susceptibility<br />
Significant susceptibility<br />
AAD-1 Very susceptible to<br />
fatigue cracking
x<br />
a)<br />
-0<br />
c<br />
.....<br />
0)<br />
c<br />
.ii)<br />
.ct<br />
70-<br />
60-<br />
50-<br />
40-<br />
30<br />
TFO-PAV 144 Hr.<br />
/ ////2( AAD-1<br />
AAK-1<br />
AAF-1<br />
AAA-1<br />
AAB-1<br />
20- AAC-1<br />
10-<br />
0 55 60 65 70 75<br />
Aging Temperature, °C<br />
Figure 2.3. Aging indices at three temperatures <strong>of</strong> SHRP core <strong>asphalt</strong>s<br />
AAG-1<br />
810 8 5<br />
i:)
2.1.5 Moisture Damage (Loss <strong>of</strong> Adhesion)<br />
Numerous studies and A-003B in particular have demonstrated that moisture<br />
damage causing loss <strong>of</strong> adhesion is primarily associated with <strong>aggregate</strong>.<br />
Classification <strong>of</strong> moisture damage susceptibility from the chemistry <strong>of</strong> only the<br />
binder is probably a minor effect at best. None the less, a highly speculative<br />
classification is shown in Table 2.4 based on the carbonyl content, with emphasis<br />
on the free acid content, as determined by FTIR. Note that <strong>aging</strong> affects the 8<br />
core <strong>asphalt</strong>s differently.<br />
2.2 Physical Properties Pennsylvania State University (PSU)<br />
The Penn State rankings (see Robertson, 1994) consider three distress<br />
modes: low-temperature thermal shrinkage cracking, load associated fatigue, and<br />
rutting caused by plastic de<strong>for</strong>mation in the upper layers <strong>of</strong> the hot-mix <strong>asphalt</strong><br />
concrete. The actual rankings are presented in the attached set <strong>of</strong> tables. In some<br />
instances, where multiple parameters were selected <strong>for</strong> the ranking, the better<br />
understanding <strong>of</strong> the failure mechanisms and better models were developed by the<br />
other SHRP research programs.<br />
13
Table 2.4. Ranks <strong>of</strong> moisture damage resistance by IR <strong>of</strong> functional group<br />
analysis (limited to <strong>asphalt</strong>; <strong>aggregate</strong> not considered)<br />
New Material Aged Material<br />
AAF-1 Good (no order established) AAB-1 Good (in order as shown)<br />
AAB-1 " AAM-1 "<br />
AAM-1 " AAC-1 "<br />
AAA-1 " AAF-1 "<br />
AAD-1 Intermediate - Good AAD-1 Intermediate - Good<br />
AAK-1<br />
AAA-1 Intermediate<br />
AAG-1 Fair - Poor AAG-1 Poor<br />
ABD Poor ABD Poor<br />
For the per<strong>for</strong>mance parameters given in tables 2.5-2.10, a score has been<br />
assigned to each <strong>asphalt</strong>. This score is a value from 1 to 8, and is based on the<br />
parameter value <strong>for</strong> the selected <strong>asphalt</strong> and the observed range <strong>for</strong> that parameter.<br />
When more than one parameter has been given, an average score has been<br />
calculated <strong>for</strong> that test or failure mode. The total score given in the attached tables<br />
is based on this average, and has also been calculated on a scale <strong>of</strong> from 1 to 8.<br />
In all cases, a lower score is associated with better per<strong>for</strong>mance in the test or<br />
failure mode under consideration. Also provided in the attached tables is a rating,<br />
G (good), M (moderate), or P (poor). These ratings were assigned based on the<br />
total score; <strong>for</strong> total scores below 2.5, a "G" rating has been assigned, <strong>for</strong> total<br />
scores above 6.5, a "P" rating has been given. All intermediate scores have been<br />
given an "M" rating. These letter ratings are meant to assist in identifying <strong>asphalt</strong>s<br />
showing extreme behavior in the various tests and failure modes.<br />
14
2.2.1 Load Associated Fatigue Cracking<br />
The mechanism that is responsible <strong>for</strong> fatigue cracking is not clear. At<br />
temperatures somewhat above 0°C (32°F), the <strong>asphalt</strong> cement behaves in a ductile<br />
manner and cracks do not propagate in a brittle manner. At lower temperatures<br />
the <strong>asphalt</strong> behaves in a brittle manner. Thus, the mechanism must be different in<br />
the region <strong>of</strong> ductile and brittle failure. Consequently, the binder properties that<br />
correlate with field behavior are probably different in the different flow regimes.<br />
It is not clear at which temperature fatigue occurs in the field. If<br />
cumulative damage, in terms <strong>of</strong> a reduced modulus, etc., is the criterion, then a<br />
more inclusive failure than pure fatigue is implied. Thus, per<strong>for</strong>mance may be a<br />
function <strong>of</strong> multiple mechanisms and the ranking may not depend on a single<br />
parameter. To further complicate the matter, the ranking criterion, in the brittle or<br />
viscoelastic response region, must be different <strong>for</strong> controlled stress and controlled<br />
strain. Both modes <strong>of</strong> testing are included in the validation program:<br />
1) <strong>Laboratory</strong> Flexural Beam Fatigue. 20°C (68°F). At this<br />
temperature it was assumed that viscous de<strong>for</strong>mation in the <strong>asphalt</strong> is<br />
the mechanism that is responsible <strong>for</strong> crack <strong>for</strong>mation and<br />
propagation. If this is the case, the viscous component <strong>of</strong> the<br />
modulus (GO at 20°C (68°F) should correlate with the laboratory<br />
fatigue test; fatigue per<strong>for</strong>mance should in this case improve with<br />
increasing values <strong>of</strong> the viscous modulus. The ranking is given in<br />
Table 2.5.<br />
A further definition <strong>of</strong> the fatigue test should probably be included in<br />
the ranking: controlled stress, controlled strain, or controlled<br />
energy. These distinctions were not made in the rankings.<br />
15
2) <strong>Laboratory</strong> Flexural Beam Fatigue. 0°C (32°F). At this<br />
temperature, the <strong>asphalt</strong> can crack in a brittle manner with a brittle<br />
or viscoelastic response. There<strong>for</strong>e, classic fatigue parameters <strong>for</strong><br />
the <strong>asphalt</strong> cements should be related to the bending beam fatigue<br />
tests conducted on the mixes. There<strong>for</strong>e, <strong>asphalt</strong> cement fatigue<br />
parameters (Nf) and a measure <strong>of</strong> the stiffness at 0°C (32°F) are<br />
included in the ranking:<br />
a. Nf, Number <strong>of</strong> Cycles to Failure in Bending Beam<br />
Test<br />
b. Cs, Complex Modulus (g? 0°C (32°F)<br />
The ranking is given in Table 2.6.<br />
3) <strong>Laboratory</strong> Slab on Elastic Foundation, 20°C (68°F). In this test<br />
the passing wheel probably creates shear stresses in the slab that are<br />
the primary cause <strong>of</strong> rutting and crack <strong>for</strong>mation. At this<br />
temperature, plastic de<strong>for</strong>mation in the mix is the primary cause <strong>of</strong><br />
both the cracks and the ruts. There<strong>for</strong>e, the viscous modulus (Gv,<br />
Viscous Modulus @ 20°C (68°F) has been used in the ranking, a<br />
ranking <strong>of</strong> the <strong>asphalt</strong>s is given in Table 2.7.<br />
4) Field Classic fatigue failure. As discussed above, this will only<br />
occur when the <strong>asphalt</strong> cement within a paving mix behaves in a<br />
brittle or highly viscoelastic manner. The gel point temperature, at<br />
a frequency <strong>of</strong> 10 rad/s, has been chosen as an estimate <strong>of</strong> the<br />
brittle-ductile transition temperature under traffic loading conditions.<br />
The higher this temperature, the greater should be the potential <strong>for</strong><br />
fatigue in the field. The width (standard deviation) <strong>of</strong> the relaxation<br />
spectrum is related to the fracture toughness <strong>of</strong> the <strong>asphalt</strong>;<br />
16
toughness, and fatigue per<strong>for</strong>mance, should generally increase with<br />
increasing spectrum width.<br />
a. Tgp, Temperature @ Gel Point<br />
b. S(tau), Width <strong>of</strong> Relaxation Spectrum<br />
A ranking <strong>of</strong> the <strong>asphalt</strong>s is given in Table 2.8.<br />
Table 2.5. Ranking <strong>of</strong> <strong>asphalt</strong>s in load associated fatigue bending beam at<br />
20°C (68°F)<br />
Log<br />
Asphalt G, at 20°C (68°F) Score Rating<br />
Pa<br />
AAA-1 6.37 8.0 P<br />
AAB-1 6.99 4.5 M<br />
AAC-1 6.99 4.5 M<br />
AAD-1 6.66 6.4 M<br />
AAF-1 7.44 2.1 G<br />
AAG-1 6.98 4.6 M<br />
AAK-1 7.26 3.1 M<br />
AAM-1 7.63 1.0 G<br />
Table 2.6 Ranking <strong>of</strong> <strong>asphalt</strong>s in load associated fatigue bending beam at 0°C<br />
(32°F)<br />
Nf @ 0°C Log<br />
(32°F) G* @ 0°C Average Total<br />
Asphalt Cycles Score (32°F) Pa Score Score Score Rating<br />
AAA-1 15064 8.0 7.403 1.0 4.5 4.0 M<br />
AAB-1 22879 4.4 7.640 2.8 3.6 2.4 G<br />
AAC-1 20147 5.6 7.934 5.1 5.4 5.5 M<br />
AAD-1 23630 4.0 7.474 1.6 2.8 1.0 G<br />
AAF-1 30115 1.0 8.047 6.0 3.5 2.2 G<br />
AAG-1 20088 5.7 8.304 8.0 6.8 8.0 P<br />
AAK-1 18537 6.4 7.749 3.7 5.0 4.9 M<br />
AAM-1 26358 2.7 7.910 4.9 3.8 2.8 M<br />
17
Table 2.7. Ranking <strong>of</strong> <strong>asphalt</strong>s in load associated fatigue wheel tracking test<br />
at 20°C (68°F)<br />
G, @ 20°(68°F)<br />
Asphalt Pa Score Rating<br />
AAA-1 6.37 8.0 P<br />
AAB-1 6.99 4.5 M<br />
AAC-1 6.99 4.5 M<br />
AAD-1 6.66 6.4 M<br />
AAF-1 7.44 2.1 G<br />
AAG-1 6.98 4.6 M<br />
AAK-1 7.26 3.1 M<br />
AAM-1 7.63 1.0 G<br />
Table 2.8. Ranking <strong>of</strong> <strong>asphalt</strong>s in load associated fatigue field<br />
Nt 0°C Average Total<br />
Asphalt Tip C Score Cydes Score Score Score Rating<br />
AAA-1 1 1.0 15064 8.0 4.5 5.2 M<br />
AAB-1 7 4.5 22879 4.4 4.4 5.0 M<br />
AAC-1 8 5.1 20147 5.6 5.4 7.3 P<br />
AAD-1 2 1.6 23630 4.0 2.8 1.0 G<br />
AAF-1 11 6.8 30115 1.0 3.9 3.7 K<br />
AAG-1 9 5.7 20088 5.7 5.7 8.0 P<br />
AAK-1 5 3.3 18537 6.4 4.9 6.0 M<br />
AAM -1 13 8.0 26350 2.7 5.4 7.3 P<br />
2.2.2 Rutting in Upper Layers <strong>of</strong> Hot-Mix Asphalt<br />
Rutting is the result <strong>of</strong> accumulated permanent de<strong>for</strong>mation in the mix; this<br />
should be related to the viscous de<strong>for</strong>mation within the binder. There<strong>for</strong>e, the<br />
viscous modulus has been used to rank the <strong>asphalt</strong>s according to resistance to<br />
18
utting, both <strong>for</strong> the wheel tracking test and <strong>for</strong> the field. Rutting will, <strong>of</strong> course,<br />
also depend on the temperatures to which the paving mix is subjected; 45°C<br />
(113 °F) was tentatively selected as a representative critical temperature <strong>for</strong><br />
permanent de<strong>for</strong>mation in the field. The viscous modulus (G) at the test<br />
temperature is used <strong>for</strong> ranking the <strong>asphalt</strong>s <strong>for</strong> per<strong>for</strong>mance in both the wheel<br />
tracking test and the field (Table 2.9).<br />
Table 2.9. Ranking <strong>of</strong> <strong>asphalt</strong>s in rutting in hot-mix <strong>asphalt</strong> wheel tracking<br />
test at 5°C (41°F)<br />
Log<br />
Asphalt G, 20°C (68°F) Pa Score Rating<br />
AAA-1 6.37 8.0 P<br />
AAB-1 6.99 4.5 M<br />
AAC-1 6.99 4.5 M<br />
AAD-1 6.66 6.4 M<br />
AAG-1 7.44 2.1 G<br />
AAG-1 6.98 4.6 M<br />
AAK-1 7.26 3.1 M<br />
AAM-1 7.63 1.0 G<br />
19
Table 2.10. Ranking <strong>of</strong> SHRP tank <strong>asphalt</strong>s <strong>for</strong> resistance to low temperature<br />
cracking as indicated by A-002A (Robertson et al. 1994)<br />
Temperature Ultimate<br />
S(t) = 200 MPa Strain @ -26 °C, Overall Rank<br />
Asphalt Type @ 2 h, °C 2 h, % 1 = Best<br />
AAA-1 -31 3.1 1<br />
AAB-1 -28 1.7 12<br />
AAC-1 -25 1.5 15<br />
AAE-1 -29 2.1 8<br />
AAF-1 -21 1.2 20<br />
AAG-1 -18 0.8 25<br />
AAH-1 -32 2.1 6<br />
AAJ-1 -25 1.5 15<br />
AAK-1 -27 1.7 12<br />
AAL-1 -30 2.8 3<br />
AAM-1 -24 1.5 16<br />
AAN-1 -24 1.5 15<br />
AAO-1 -28 2.1 9<br />
AAP-1 -27 2.2 9<br />
AAQ-1 -24 1.1 18<br />
AAR-1 -26 1.7 13<br />
AAS-1 -27 2.0 11<br />
AAT-1 -23 1.6 16<br />
AAU-1 -23 1.7 16<br />
AAV-1 -25 1.2 17<br />
AAW-1 -22 1.6 17<br />
AAX-1 -20 1.1 21<br />
AAY-1 -28 1.8 11<br />
AAZ-1 -20 1.2 21<br />
ABA-1 -29 2.4 7<br />
ABC-1 -30 2.2 8<br />
ABD-1 -15 0.5 28<br />
2.2.3 Low-Temperature Thermal Shrinkage Cracking<br />
The selected parameters <strong>for</strong> predicting thermal shrinkage cracking are the<br />
same <strong>for</strong> the restrained tensile strength test and <strong>for</strong> field conditions. The glass<br />
transition temperature has been selected as an indicator <strong>of</strong> the temperature at which<br />
stresses within the <strong>asphalt</strong> will begin to accumulate and the strain capacity will<br />
20
decrease during cooling. The energy to failure at one percent strain has been<br />
included in these rankings as an indicator <strong>of</strong> the fracture toughness <strong>of</strong> the <strong>asphalt</strong><br />
cement. The third parameter used in the rankings is the ratio <strong>of</strong> flexural stiffness<br />
at -15°C (5°F) and 2 min after 96 h conditioning at the test temperature, to the<br />
value found after only 2 h conditioning. This has been chosen as an indicator <strong>of</strong><br />
the potential <strong>for</strong> physical hardening. The ranking <strong>of</strong> the <strong>asphalt</strong>s (Table 2.10) is<br />
based on the following properties:<br />
1. Tg, Glass Transition Temperature<br />
2. Energy to Failure at One Percent Strain<br />
3. Physical Hardening at -15°C (5°F)<br />
2.2.4 Moisture Damage<br />
Physical property tests are not available <strong>for</strong> ranking the moisture sensitivity<br />
<strong>of</strong> the <strong>asphalt</strong>s.<br />
2.2.5 Aging<br />
The Penn State researchers recommend that ranking the per<strong>for</strong>mance after<br />
<strong>aging</strong> is best measured by testing the <strong>asphalt</strong> cement and mixes <strong>for</strong> the specific<br />
per<strong>for</strong>mance-related parameters. Thus, it is recommend that fatigue, etc., tests be<br />
conducted on aged mixes. Correlations with a single point measurement <strong>of</strong><br />
stiffness are not expected.<br />
21
2.3 Auburn University A003B<br />
The following paragraphs are extracted from the A-003B executive<br />
summary to the project's final report (Curtis, Ens ley, and Epps, 1993).<br />
An important element <strong>of</strong> the SHRP A-003B research was to<br />
investigate the chemical and physical processes that govern adhesion<br />
and absorption. Many different investigations were undertaken to<br />
achieve that goal. Some <strong>of</strong> them were exploratory in nature while<br />
others were much more extensive. These studies laid the<br />
groundwork <strong>for</strong> the two major products from this contract: the<br />
adhesion and stripping models and the net adsorption test.<br />
The initial <strong>asphalt</strong>-<strong>aggregate</strong> model that was proposed, postulated the<br />
adherence <strong>of</strong> <strong>asphalt</strong> at the <strong>asphalt</strong>-<strong>aggregate</strong> interface, followed by<br />
the development <strong>of</strong> a structured interphase region. Beyond the<br />
interphase was the bulk <strong>asphalt</strong>. A new understanding <strong>of</strong><br />
<strong>asphalt</strong>-<strong>aggregate</strong> interactions has emerged from the work <strong>of</strong> SHRP<br />
A-003B in conjunction with research results from other SHRP<br />
contractors. During hot mix processing, <strong>asphalt</strong> components contact<br />
and adhere to the interfacial surface <strong>of</strong> the <strong>aggregate</strong> with the more<br />
polar constituents, those compounds containing heteroatoms <strong>of</strong><br />
sulfur, nitrogen or oxygen, being most competitive <strong>for</strong> the active<br />
sites on the surface. Several different methods <strong>of</strong> measuring the<br />
energy <strong>of</strong> adsorption indicate that physisorption rather than<br />
chemisorption is occurring. This interaction can result from<br />
electrostatic, dipole-dipole, or Van der Waals interactions. Asphalt<br />
once contacted to the <strong>aggregate</strong> remains stationary; no net migration<br />
<strong>of</strong> polar constituents to the surface from the bulk <strong>asphalt</strong> is apparent.<br />
Some surface diffusion may occur, though, as the mix s<strong>of</strong>tens on a<br />
hot summer day.<br />
2.3.1 Adhesion<br />
Effect <strong>of</strong> Chemistry. Aggregate chemistry plays a key role in<br />
adhesion. Each <strong>aggregate</strong> <strong>of</strong> a given mineralogical type with a<br />
specific history has a unique surface chemistry. The electrokinetic<br />
22
properties as well as the electron donating and accepting abilities <strong>of</strong><br />
the <strong>aggregate</strong> vary according to the active metal species on the<br />
<strong>aggregate</strong> surface. The active sites on the <strong>aggregate</strong> surface that<br />
have been postulated from observed behavior have been confirmed<br />
by autoradiography. These active sites promote adsorption <strong>of</strong><br />
<strong>asphalt</strong>ic components. The covering <strong>of</strong> those active sites by<br />
nonpolar hydrocarbons completely masks their activity. Dust<br />
coatings naturally occurring on <strong>aggregate</strong> surfaces can change the<br />
chemistry <strong>of</strong> adhesion and result in weak bonding between the dust<br />
and <strong>aggregate</strong> surface, leading to attrition <strong>of</strong> the bonding <strong>for</strong>ces that<br />
help maintain the pavement.<br />
Evaluation <strong>of</strong> <strong>asphalt</strong>-<strong>aggregate</strong> interactions shows that the <strong>aggregate</strong><br />
chemistry is much more influential than the <strong>asphalt</strong> composition <strong>for</strong><br />
both adhesion and sensitivity to water. Large differences were<br />
observed in the amount <strong>of</strong> <strong>asphalt</strong> adsorbed and the amount <strong>of</strong><br />
<strong>asphalt</strong> retained after exposure to water with both siliceous and<br />
calcareous <strong>aggregate</strong>s. Although the <strong>asphalt</strong> compositional factors<br />
have a smaller effect, some differences in the amounts adsorbed and<br />
retained on a specific <strong>aggregate</strong> were observed.<br />
No chemical or thermodynamic evidence has been found in this<br />
study <strong>for</strong> the development <strong>of</strong> a structured interphasal region. Aging<br />
experiments that determined the oxidatively aged products in <strong>asphalt</strong><br />
at the interface and in the 125Am region beyond the interface<br />
showed no differentiation in type or concentration <strong>of</strong> <strong>asphalt</strong><br />
oxidative products. Heats <strong>of</strong> interaction only showed an initial<br />
release <strong>of</strong> energy corresponding to the heat released upon initial<br />
contact between <strong>asphalt</strong> and <strong>aggregate</strong>. No long term energy release<br />
was observed, indicating the lack <strong>of</strong> structuring. Autoradiography<br />
also showed no evidence <strong>of</strong> structuring.<br />
Hence, the <strong>asphalt</strong>-<strong>aggregate</strong> mix can be visualized as a system in<br />
which large, small and fine <strong>aggregate</strong> particles are coated with<br />
<strong>asphalt</strong>. The active sites on the particle attract the most polar and<br />
bondable <strong>asphalt</strong>ic species upon initial contact with little or no<br />
diffusion <strong>of</strong> <strong>asphalt</strong>ic species after the mix is cooled. Each <strong>asphalt</strong><br />
molecule is contacted with an <strong>aggregate</strong> or an <strong>asphalt</strong> molecule in<br />
contact with or close to an <strong>aggregate</strong> surface. The fines that<br />
compose 5 to 8 percent <strong>of</strong> the <strong>aggregate</strong> are interspersed with the<br />
<strong>asphalt</strong> <strong>for</strong>ming a mastic, a medium in which it is difficult to<br />
distinguish between <strong>asphalt</strong> and <strong>aggregate</strong>.<br />
23
Aagi . The <strong>aging</strong> <strong>of</strong> <strong>asphalt</strong> in a road pavement occurs in the<br />
presence <strong>of</strong> <strong>aggregate</strong> so that is natural to evaluate the <strong>asphalt</strong> <strong>aging</strong><br />
process with <strong>aggregate</strong> present. The research in SHRP A-003B<br />
evaluated the chemistry <strong>of</strong> the <strong>aging</strong> process in terms <strong>of</strong> the<br />
production <strong>of</strong> carbonyls, including both ketones and carboxylic<br />
acids, and sulfoxides. Sulfoxide production is largely dependent<br />
upon the amount <strong>of</strong> sulfur present in the <strong>asphalt</strong>. The <strong>aggregate</strong><br />
chemistry <strong>of</strong> a granite and a limestone had no effect on the<br />
production <strong>of</strong> these particular functional groups. However, other<br />
changes that may have occurred in the <strong>asphalt</strong> were not measured.<br />
In road pavements the ostensible measure <strong>of</strong> <strong>aging</strong> is viscosity.<br />
Recent research in SHRP contracts A-002A and A-003A suggests<br />
that the presence <strong>of</strong> <strong>aggregate</strong> decreases the viscosity <strong>of</strong> <strong>asphalt</strong><br />
compared to bulk <strong>asphalt</strong> <strong>for</strong> equivalent <strong>aging</strong> times. This difference<br />
in viscosity may be caused by the <strong>aggregate</strong> particles binding some<br />
<strong>of</strong> the oxidative functional groups <strong>for</strong>med and, thereby, prevents the<br />
<strong>for</strong>mation <strong>of</strong> viscosity building species.<br />
Water Sensitivity. Stripping <strong>of</strong> <strong>asphalt</strong> from <strong>aggregate</strong> stems from<br />
the intrusion <strong>of</strong> water into the <strong>asphalt</strong>-<strong>aggregate</strong> system. The modes<br />
<strong>of</strong> failure are many and dependent upon the character <strong>of</strong> the system.<br />
The most important modes <strong>of</strong> failure are:<br />
diffusion <strong>of</strong> water through the <strong>asphalt</strong> film;<br />
entry <strong>of</strong> water through cracks in the <strong>asphalt</strong> film;<br />
separation <strong>of</strong> the bond at the interface;<br />
failure within the <strong>asphalt</strong> where soluble components are<br />
removed; and<br />
cohesive failure within the <strong>aggregate</strong>.<br />
If the water-pro<strong>of</strong>ing layer <strong>of</strong> <strong>asphalt</strong> surrounding an <strong>aggregate</strong><br />
particle is continuous, then water can penetrate the system by<br />
diffusing through the <strong>asphalt</strong> film removing along the way those<br />
<strong>asphalt</strong>ic components that are solubilized. If cracks occur in the<br />
film, then water can intrude to the <strong>asphalt</strong>-<strong>aggregate</strong> interface,<br />
causing failure at or near the interface. The failure can be<br />
interfacial or cohesive either in the <strong>asphalt</strong> or in the <strong>aggregate</strong>.<br />
Reduction in water damage can be attained through modifying the<br />
<strong>aggregate</strong> surface through silylation or the addition <strong>of</strong> antistripping<br />
agents. However, complete covering <strong>of</strong> the particle by an <strong>asphalt</strong><br />
24
film should decrease the quantity <strong>of</strong> water reaching the <strong>aggregate</strong><br />
and reduce the deleterious effect <strong>of</strong> water on the <strong>aggregate</strong>.<br />
Building <strong>of</strong> roads with low air voids or good drainage may be most<br />
influential in reducing water damage, by limiting the exposure <strong>of</strong> the<br />
<strong>asphalt</strong>-<strong>aggregate</strong> bond to water.<br />
Resilience <strong>of</strong> Asphalt-<strong>aggregate</strong> Bonds. Adhesion between an<br />
<strong>asphalt</strong>-<strong>aggregate</strong> pair can be promoted or inhibited by processing<br />
and environmental factors. Researchers in SHRP A-003B evaluated<br />
the effect <strong>of</strong> pH on the <strong>asphalt</strong>-<strong>aggregate</strong> bond. High pH which<br />
resulted in a very basic medium was detrimental to most <strong>asphalt</strong><strong>aggregate</strong><br />
bonds; however, treatment at somewhat lower but still<br />
basic pH did not affect the bond substantially. Curing at elevated<br />
temperatures after mixing promoted adhesion in some<br />
<strong>asphalt</strong>-<strong>aggregate</strong> pairs. A test involving the factors <strong>of</strong> increased pH<br />
and curing, incorporated into the modified Lottman (AASHTO-283)<br />
test, has been suggested as a means <strong>of</strong> differentiating among<br />
<strong>asphalt</strong>-<strong>aggregate</strong> combinations. Those particular <strong>asphalt</strong>-<strong>aggregate</strong><br />
combinations that do not per<strong>for</strong>m well under chemical<br />
preconditioning (high pH) or curing can be treated with additives,<br />
either liquid antistripping agents or lime, to improve their<br />
per<strong>for</strong>mance. Retesting the treated mix under the stringent pH<br />
conditions <strong>of</strong>fers a means <strong>of</strong> determining the effectiveness <strong>of</strong> the<br />
treatment.<br />
2.3.2 Products From the A-003B Research<br />
Two major products were produced from SHRP A-003B. The<br />
adhesion and stripping models and the net adsorption test.<br />
The net adsorption test provides a method <strong>for</strong> determining the<br />
affinity <strong>of</strong> an <strong>asphalt</strong>-<strong>aggregate</strong> pair and its sensitivity to water.<br />
This test provides a method <strong>for</strong> selecting <strong>asphalt</strong>-<strong>aggregate</strong> pairs and<br />
determining their compatibility. The test is composed <strong>of</strong> two steps.<br />
First, <strong>asphalt</strong> is adsorbed onto <strong>aggregate</strong> from toluene solution, the<br />
amount <strong>of</strong> <strong>asphalt</strong> remaining in solution is measured, and the amount<br />
<strong>of</strong> <strong>asphalt</strong> adsorbed to the <strong>aggregate</strong> is determined. Second, water is<br />
introduced into the system, <strong>asphalt</strong> is desorbed from the <strong>aggregate</strong><br />
surface, the <strong>asphalt</strong> present in the solution is measured, and the<br />
amount remaining on the <strong>aggregate</strong> surface is calculated. The<br />
amount <strong>of</strong> <strong>asphalt</strong> remaining on the surface after the desorption step<br />
25
is termed net adsorption. The net adsorption <strong>of</strong>fers a direct means<br />
<strong>of</strong> comparing the affinity <strong>of</strong> different <strong>asphalt</strong>-<strong>aggregate</strong> pairs. The<br />
test is relatively fast, reliable and readily per<strong>for</strong>med. The net<br />
adsorption test predicts the behavior <strong>of</strong> the SHRP <strong>aggregate</strong>s quite<br />
well when using the known field per<strong>for</strong>mance <strong>of</strong> the <strong>aggregate</strong><br />
within its state as the criterion.<br />
For this study, the eleven material reference library (MRL)<br />
<strong>aggregate</strong>s were tested with three different aged <strong>asphalt</strong>s: AAD -1,<br />
AAK-1, and AAM-1. Although the <strong>asphalt</strong>s differed quite<br />
substantially in their chemical composition and characteristics, <strong>for</strong> a<br />
given <strong>aggregate</strong> the differences in the <strong>asphalt</strong> initial adsorption<br />
behavior were quite small. Based on the amount adsorbed, the<br />
<strong>asphalt</strong>s ranked best to worst by net adsorption; AAD-1 AAK-1<br />
> AAM-1 <strong>for</strong> most <strong>aggregate</strong>s, with AAD-1 and AAK-1<br />
occasionally changing positions.<br />
The adsorption behavior <strong>of</strong> the siliceous <strong>aggregate</strong>s be<strong>for</strong>e and after<br />
water desorption varied considerably. Two <strong>aggregate</strong>s, RA-granite<br />
and RJ-gravel, showed consistently low adsorption and were quite<br />
sensitive to water regardless <strong>of</strong> the <strong>asphalt</strong> used. Aggregates,<br />
RB-granite, RE-gravel, and RG-sandstone, showed similar behavior<br />
in their initial <strong>asphalt</strong> adsorption <strong>for</strong> the three <strong>asphalt</strong>s; however,<br />
RE-gravel tended to show a higher sensitivity to water and an<br />
increased amount <strong>of</strong> <strong>asphalt</strong> desorbed compared to the other<br />
<strong>aggregate</strong>s. The two siliceous <strong>aggregate</strong>s that gave the largest<br />
amounts <strong>of</strong> <strong>asphalt</strong> adsorption, regardless <strong>of</strong> <strong>asphalt</strong>, were<br />
RH-greywacke and RK-basalt. Both <strong>of</strong> these <strong>aggregate</strong>s also had<br />
low sensitivity to water.<br />
The MRL limestones used in this study included RC, a highly<br />
absorptive limestone, RD, a nonabsorptive limestone, and RF, a<br />
calcareous sandstone, a limestone with other types <strong>of</strong> minerals<br />
present. The initial adsorption behavior <strong>of</strong> the three <strong>asphalt</strong>s was<br />
similar on the three limestones and ranked the <strong>aggregate</strong>s RC > RF<br />
> RD. However, the moisture sensitivities <strong>of</strong> these limestones<br />
seemed somewhat <strong>asphalt</strong> dependent, with AAM-1 showing more<br />
sensitivity to water than either AAD-1 or AAK-1. RF-limestone<br />
yielded a considerably higher amount <strong>of</strong> desorbed <strong>asphalt</strong> than did<br />
either RC or RD-limestones. Even though the amount <strong>of</strong> adsorption<br />
and desorption that occurred varied somewhat from <strong>asphalt</strong> to<br />
<strong>asphalt</strong> <strong>for</strong> a given <strong>aggregate</strong> the net adsorption, defined as the<br />
amount <strong>of</strong> <strong>asphalt</strong> remaining on the <strong>aggregate</strong>, was similar as shown<br />
26
in Figure 2.4. The net adsorption ranking <strong>of</strong> the siliceous<br />
<strong>aggregate</strong>s <strong>for</strong> all three <strong>asphalt</strong>s was RK-basalt > RH-greywacke .--<br />
RL-gravel > RB-granite > RE-gravel > RG-sandstone ><br />
RJ-gravel > RA-granite. The net adsorption <strong>of</strong> the limestone<br />
<strong>aggregate</strong>s ranked as RC > RD .0 RF.<br />
Additional limestone samples were obtained by SHRP and used in<br />
the net adsorption test. The net adsorption <strong>for</strong> the limestones is<br />
given in Figure 2.4. The net adsorption ranking <strong>of</strong> the limestones<br />
<strong>for</strong> all three <strong>asphalt</strong>s was R7 > R3 __ R8 > R6 > R1 > R5 ><br />
R2. The average net adsorption ranged from a high <strong>of</strong> 1.27 mg/g<br />
on R7 to a low <strong>of</strong> 0.34 mg/g on R2.<br />
State highway <strong>of</strong>ficials from the respective states from which the<br />
limestones were obtained provided a classification <strong>of</strong> the limestones<br />
as stripping or nonstripping according to their observed behavior.<br />
The behavior <strong>of</strong> R1, R2 and R7 limestones in the net adsorption test<br />
did not agree with that indicated by the state highway <strong>of</strong>ficials. The<br />
reasons <strong>for</strong> these discrepancies are not known at this time; however,<br />
some obvious possibilities include the fact that only a very narrow<br />
size fraction <strong>of</strong> the <strong>aggregate</strong> was used and because the <strong>aggregate</strong><br />
was prewashed.<br />
The <strong>aggregate</strong> properties predominated in the net adsorption test,<br />
showing a stronger influence than the <strong>asphalt</strong> on the initial amount<br />
<strong>of</strong> <strong>asphalt</strong> adsorbed, the amount <strong>of</strong> <strong>asphalt</strong> desorbed by water, and<br />
the amount <strong>of</strong> <strong>asphalt</strong> remaining, the net adsorption.<br />
The net adsorption test <strong>of</strong>fers an effective means <strong>of</strong> evaluating the<br />
affinity and water sensitivity <strong>of</strong> an <strong>asphalt</strong>-<strong>aggregate</strong> pair. The test<br />
enables prediction <strong>of</strong> those <strong>aggregate</strong> materials which will achieve a<br />
substantial <strong>asphalt</strong> coating and maintain that coating in the presence<br />
<strong>of</strong> water. The test also provides a means <strong>of</strong> predicting which<br />
<strong>asphalt</strong>s would be susceptible to water. For the net adsorption test<br />
to represent most accurately the <strong>aggregate</strong>s used in road paving, the<br />
recommended sample is a minus No. 4 fraction <strong>of</strong> unwashed<br />
<strong>aggregate</strong>.<br />
27
1.8<br />
(mg/g)<br />
1.6 AAD-1 AAK-1 I AAM-1<br />
1.6<br />
1.4<br />
1.2<br />
1<br />
0.8<br />
0.6<br />
0.4<br />
0.2<br />
0<br />
RC RD RF R1 R2 R3 R5 R6 R7 R8<br />
Figure 2.4. Net adsorption <strong>of</strong> <strong>asphalt</strong>s on various limestones<br />
1.0<br />
1.4
3.1 Variables<br />
3.0 Experiment Design<br />
As mentioned earlier, the experiment design included eight different <strong>asphalt</strong><br />
types and four different <strong>aggregate</strong>s. All specimens to be long-term aged were first<br />
short-term aged at 135°C (275°F) <strong>for</strong> four hours be<strong>for</strong>e compaction. Four<br />
different long-term <strong>aging</strong> processes were examined: low pressure oxidation (LPO)<br />
at 60° and 85°C (140° and 185°F), long-term oven <strong>aging</strong> (LTOA) at 85°C<br />
(185°F), <strong>for</strong> 5 days, and LTOA at 100°C (212°F) <strong>for</strong> 2 days. See table 3.1 <strong>for</strong><br />
the LPO variables and table 3.2 <strong>for</strong> the LTOA variables.<br />
3.2 Materials<br />
The materials used <strong>for</strong> this testing program were selected from the materials<br />
stored at the Materials Reference Library (MRL).<br />
The <strong>aggregate</strong>s used represent a broad range <strong>of</strong> <strong>aggregate</strong> characteristics<br />
from a high-absorption crushed limestone to a river run gravel. Similarly, the<br />
<strong>asphalt</strong>s used spanned a broad range <strong>of</strong> <strong>asphalt</strong> grades. Table 3.3 briefly describes<br />
the materials used.<br />
29
3.3 Aging Methods<br />
3.3.1 No Aging<br />
Three specimens were prepared at the time <strong>of</strong> mixing to represent an<br />
"unaged" condition. Their preparation was the same as <strong>for</strong> other specimens except<br />
that they were not cured <strong>for</strong> four hours at 135°C (275°F). As soon as mixing was<br />
complete the specimens were placed in an oven and brought to the proper<br />
equiviscous temperature (665 ± 80 centi-Stokes). The specimens were then<br />
compacted using a Cali<strong>for</strong>nia Kneading Compactor.<br />
Table 3.1. Low pressure <strong>aging</strong> experiment design<br />
No. <strong>of</strong> Asphalts 8<br />
No. <strong>of</strong> Aggregates 4<br />
No. <strong>of</strong> Asphalt Contents 1<br />
No. <strong>of</strong> Air Voids 1<br />
Temperature: Short-Term<br />
Long-Term<br />
Test Conditions<br />
Aging Periods<br />
None (datum)<br />
Short-Term and Long-Term<br />
Total Tests<br />
1, 275°F (135°C)<br />
2, 140-185°F (60 and 85°C)<br />
No Aging (unaged) 32<br />
Short-Term and Long-Term 64<br />
Replication <strong>of</strong> Unaged 32<br />
Replication <strong>of</strong> Short-Term and Long-Term 64<br />
TOTAL 192<br />
1<br />
1<br />
30
Table 3.2. Long-term oven <strong>aging</strong> experiment design<br />
No. <strong>of</strong> Asphalts 8<br />
No. <strong>of</strong> Aggregates 4<br />
No. <strong>of</strong> Asphalt Contents 1<br />
No. <strong>of</strong> Void Contents 1<br />
Test Conditions<br />
Temperature: Short-Term 1, 275°F (135°C)<br />
Long-Term 2, 185-212°F (85°C and 100°C)<br />
Aging Periods<br />
None (datum) 1<br />
Short-Term and Long-Term I<br />
Total Tests<br />
No <strong>aging</strong> 32<br />
Short-Term and Long-Term 64<br />
Replication <strong>of</strong> short-term and long-term 64<br />
TOTAL 160<br />
3.3.2 Short-Term Aging<br />
The short-term <strong>aging</strong> method used in this test program was developed at<br />
Oregon State University under the SHRP A-003A test development program. The<br />
procedure is described in detail in Appendix A. The method employed consists <strong>of</strong><br />
curing mix samples in a <strong>for</strong>ced draft oven at 135°C (275°F) <strong>for</strong> a period <strong>of</strong> 4 h<br />
prior to compaction. After the curing period, the samples are brought to an<br />
equiviscous temperature and compacted using a Cali<strong>for</strong>nia Kneading Compactor.<br />
31
Table 3.3. Materials used<br />
Aggregate Asphalt<br />
Code Description Code Grade<br />
RC Limestone (high absorption) AAA-1 150/200<br />
RD Limestone (low absorption) AAB-1 AC-10<br />
RH Greywacke AAC-1 AC-8<br />
RJ Conglomerate AAD-1 AR-4000<br />
AAF-1 AC-20<br />
AAG-1 AR-4000<br />
AAK-1 AC-30<br />
AAM-1 AC-20<br />
3.3.3 Low Pressure Oxidation<br />
Low pressure oxidation is an <strong>aging</strong> procedure to simulate long-term <strong>aging</strong>.<br />
The procedure is carried out on compacted specimens after they have been<br />
short-term aged. After the specimen is loaded into the cell a confining pressure is<br />
applied to keep the membrane tight to the specimen. Once the confining pressure<br />
is achieved, oxygen flow is started through the specimen at a rate <strong>of</strong> 4 standard<br />
cubic feet per hour (SCFH) [0.113 cubic meter/h (m3/h)]. When the oxygen rate<br />
has been adjusted, the cell is placed in a water bath that has been preheated to the<br />
conditioning temperature, 60° or 85°C (140 or 185°F). The cell is left in the<br />
conditioning bath <strong>for</strong> a period <strong>of</strong> 5 days, at which time it is extracted from the bath<br />
and left to cool to room temperature. The specimens are then removed from the<br />
cell and allowed to stand <strong>for</strong> at least 24 h be<strong>for</strong>e testing.<br />
32
L .4 Long -Term Oven Aging<br />
Long-term oven <strong>aging</strong> is also a procedure to simulate long-term <strong>aging</strong>. The<br />
procedure is carried out on compacted specimens after they have been short-term<br />
aged. The procedure is described in detail in Appendix C. The specimens are<br />
placed in a <strong>for</strong>ced draft oven, pre-heated to 85°C (185°F), and left <strong>for</strong> a period <strong>of</strong><br />
5 days. Alternately, a temperature <strong>of</strong> 100°C (212°F) and a period <strong>of</strong> 2 days is<br />
used. After the <strong>aging</strong> period, the oven is turned <strong>of</strong>f and left to cool to room<br />
temperature. The specimens are removed from the oven when this temperature is<br />
achieved and prepared to be tested at least 24 h after removal from the oven.<br />
3.4 Evaluation Methods<br />
3.4.1 Resilient Modulus<br />
The resilient modulus is determined at 25°C (77°F) using diametral<br />
(indirect tension) (ASTM D4123) and triaxial compression modes <strong>of</strong> testing with a<br />
0.1-second loading time at a frequency <strong>of</strong> 1.0 Hz. A constant strain level <strong>of</strong><br />
100 microstrain is maintained throughout the test.<br />
3.4.2 Dynamic Modulus<br />
Several specimens were subjected to a thorough dynamic modulus<br />
<strong>evaluation</strong> at temperatures <strong>of</strong> 0°C (32°F), 25°C (77°F), and 40°C (140°F).<br />
Eleven loading frequencies ranging from 15 to 0.01 Hz were used. This testing,<br />
called dynamic mechanical analysis (DMA), takes approximately eight hours per<br />
specimen; there<strong>for</strong>e, it was not possible to test all specimens with this<br />
33
procedure. A thorough explanation <strong>of</strong> the DMA procedure and typical results are<br />
presented in Appendix F.<br />
From the limited <strong>evaluation</strong> per<strong>for</strong>med on the materials <strong>for</strong> this project, it<br />
was apparent that DMA is a valid procedure <strong>for</strong> characterizing the <strong>aging</strong> potential<br />
<strong>of</strong> <strong>asphalt</strong>-<strong>aggregate</strong> <strong>mixtures</strong>. However, due to the time required to per<strong>for</strong>m the<br />
test and reduce the data, a more through <strong>evaluation</strong> <strong>of</strong> the materials available was<br />
not pursued.<br />
3.4.3 Tensile Strength Test<br />
The tensile strength test is per<strong>for</strong>med after all modulus testing has been<br />
completed. A de<strong>for</strong>mation rate <strong>of</strong> 50 mm (2 in.) per minute is used, with the load<br />
and de<strong>for</strong>mation <strong>of</strong> the specimen monitored continuously until failure occurs. The<br />
strains at yield and failure are considered significant, as well as the strength. The<br />
broken portions <strong>of</strong> the specimens may be used to obtain recovered <strong>asphalt</strong>.<br />
Appendix D describes the tensile test and presents data from a small sample <strong>of</strong><br />
specimens.<br />
34
4.1 Resilient Modulus Data<br />
4.0 Results<br />
The results <strong>of</strong> the resilient modulus test <strong>for</strong> both diametral and triaxial<br />
modes <strong>of</strong> testing are summarized in Tables 4.1 through 4.4 <strong>for</strong> each <strong>aggregate</strong><br />
type. These data are shown graphically in Appendix D, where aged and unaged<br />
modulus values are presented.<br />
4.1.1 Short-Term Aging Results<br />
The modulus ratios from diametral testing are shown in Figure 4.1 <strong>for</strong> each<br />
<strong>of</strong> the four <strong>aggregate</strong>s, with the <strong>asphalt</strong>s shown in ranking order in each case. The<br />
data used to generate these figures are presented in Tables 4.1 through 4.4. The<br />
<strong>asphalt</strong> showing the greatest <strong>aging</strong> (in terms <strong>of</strong> modulus change) has the highest<br />
ratio in each case. The ratios have been developed using a procedure to adjust the<br />
modulus values to correspond to the same air void content. This procedure is<br />
described in Section 4.1.3.<br />
4,1,2 Long-Term Aging Results<br />
The modulus ratios from diametral testing <strong>of</strong> the long-term aged specimens<br />
are shown in Figure 4.2 through 4.5. These are shown in a <strong>for</strong>mat similar to<br />
Figure 4.1, with rankings based on the ratio <strong>of</strong> long-term aged modulus to unaged<br />
modulus. As with the short-term <strong>aging</strong> results, the modulus values were adjusted<br />
as described below. The data used to generate these tables are also presented in<br />
Tables 4.1 through 4.4.<br />
35
4.1.3 Adjustment <strong>of</strong> Modulus Data<br />
To analyze the effects <strong>of</strong> short-term and long-term <strong>aging</strong> on<br />
<strong>asphalt</strong>-<strong>aggregate</strong> mixes a method <strong>of</strong> creating an <strong>aging</strong> ratio was needed. To create<br />
this ratio a measure <strong>of</strong> the unaged modulus was needed to compare with the aged<br />
specimens. At the time <strong>of</strong> mixing in the laboratory, 3 specimens, in addition to<br />
those needed <strong>for</strong> long term <strong>aging</strong>, were prepared and compacted as soon as they<br />
could be brought to the proper compaction temperature. These specimens were<br />
said to be in an "unaged" condition and were tested <strong>for</strong> resilient modulus. In all<br />
but a few cases, the unaged specimens were found to have a different air void level<br />
than the short-term aged specimens. This prompted a need to adjust the modulus<br />
values <strong>of</strong> the short-term aged specimens to correspond to the same air void level as<br />
the unaged specimens.<br />
To achieve this adjustment, an average slope was determined from the<br />
modulus versus air voids <strong>for</strong> the unaged specimens over the data set, <strong>for</strong> diametral<br />
modulus only. With this slope and with values <strong>for</strong> the average modulus and air<br />
void level <strong>for</strong> each combination <strong>of</strong> materials, an equation <strong>for</strong> the unaged modulus<br />
at any void level could be determined. From this equation, an adjusted unaged<br />
modulus could be calculated <strong>for</strong> each short-term aged specimen, which was then<br />
used in calculating the short-term and long-term <strong>aging</strong> ratios.<br />
36
Table 4.1. Modulus data <strong>for</strong> <strong>aggregate</strong> RC<br />
Modulus Values<br />
Aging % Air Diametral Triaxial<br />
Asphalt Method Voids Be<strong>for</strong>e After Be<strong>for</strong>e After<br />
AAA LPO 85 8.2 211 572 295 805<br />
AAA LPO 85 8.4 193 504 350 802<br />
AAA LPO 60 8.0 233 367 434 600<br />
AAA LPO 60 8.1 270 414 373 442<br />
MA LTOA 85 9.5 225 405 357 780<br />
AM LTOA 85 8.7 221 412 295 583<br />
AAA LTOA 100 9.0 219 475 270 570<br />
AAA LTOA 100 8.6 216 499 295 455<br />
AAA NONE 8.0 152 230 --<br />
AAA NONE 8.8 153 225<br />
AAA NONE 7.9 164 236 --<br />
AAB LPO 85 8.4 299 638 517 1041<br />
MB LPO 85 9.2 317 438 419 635<br />
MB LPO 60 8.3 364 525 420 621<br />
MB LPO 60 8.3 300 644 379 1041<br />
MB LTOA 85 8.9 305 606 395 875<br />
AAB LTOA 85 9.3 339 614 500 956<br />
MB LTOA 100 8.3 378 694 426 698<br />
MB LTOA 100 9.7 286 618 533 958<br />
AAB NONE 8.8 216 385 --<br />
AAB NONE 7.8 207 - 421<br />
MB NONE 8.2 249 -- 467 --<br />
MAC LPO 85 8.4 329 TIT 574 1052<br />
MC LPO 85 9.4 398 750 440 844<br />
MC LPO 60 9.3 348 520 579 879<br />
MC LPO 60 10.2 339 460 384 667<br />
MC LTOA 85 9.1 345 561 690 8e9<br />
MC LTOA 85 9.3 377 600 407 787<br />
MC LTOA 100 9.4 335 557 409 697<br />
MC LTOA 100 8.9 343 623 435 643<br />
MC NONE 9.1 236 325<br />
MC NONE 9.3 235 277<br />
MC NONE 8.2 249 -- 315<br />
MD LPO 85 9.3 286 645 274 970<br />
MD LPO 85 8.8 293 694 380 950<br />
MD LPO 60 9.6 321 450 399 850<br />
MD LPO 60 9.0 257 394 432 711<br />
MD LTOA 85 8.9 324 615 391 1101<br />
MD LTOA 85 9.4 309 616 491 882<br />
MD LTOA 100 9.3 225 611 379 775<br />
MD LTOA 100 9.0 269 695 344 539<br />
MD NONE 8.2 202 -- 279 --<br />
MD NONE 8.1 208 277<br />
MD NONE 8.5 182 275<br />
°F = I.8(°C) + 32<br />
Note: All modulus data are reported in ksi. KEY:<br />
NONE = No <strong>aging</strong>.<br />
LPO 60 = Low-Pressure Oxidation, 60°05 days.<br />
LPO 85 = Low-Pressure Oxidation, 85°C/5 days.<br />
LTOA 85 = Long-Term Oven Aging, 85°05 days.<br />
LTOA 100 = Long-Term Oven Aging, 100°C./2 days.<br />
37
Table 4.1 (continued). Modulus data <strong>for</strong> <strong>aggregate</strong> RC<br />
Modulus Values<br />
Aging % Air Diametral Triaxial<br />
Asphalt Method Voids Be<strong>for</strong>e After Be<strong>for</strong>e After<br />
ME LPO 85 9.3 650 891 861 1384<br />
AAF LPO 85 8.8 687 996 864 1275<br />
AAF LPO 60 7.8 636 898 1113 1345<br />
AAF LPO 60 9.4 621 896 1323 1305<br />
AAF LTOA 85 9.0 612 943 980 1205<br />
AAF LTOA 85 9.0 701 842 1103 1573<br />
AAF LTOA 100 9.1 558 1004 823 1124<br />
AAF LTOA 100 9.7 590 1016 999 1357<br />
AAF NONE 9.0 507 -- 779 --<br />
AAF NONE 9.9 428 - 550<br />
AAF NONE 9.1 458 -- 851<br />
MG LPO 85 10.9 652 983 853 1262<br />
MG LPO 85 10.6 606 1038 684 1141<br />
MG LPO 60 10.2 682 840 701 1000<br />
MG LPO 60 10.7 744 881 851 1134<br />
MG LTOA 85 10.9 714 1004 928 1191<br />
MG LTOA 85 11.2 656 819 1024 1520<br />
MG LTOA 100 10.2 614 1030 918 1245<br />
MG LTOA 100 10.9 587 939 921 1113<br />
MG NONE 11.0 450 - 658 --<br />
MG NONE 9.9 523 734<br />
MG NONE 9.6 476 804<br />
MK LPO 85 7.9 555 974 671 1430<br />
AAK LPO 85 8.5 572 1000 655 1740<br />
MK LPO 60 9.2 497 644 644 992<br />
AAK LPO 60 9.3 427 577 574 866<br />
AAK LTOA 85 7.9 563 827 834 1367<br />
AAK LTOA 85 9.2 451 713 614 993<br />
AAK LTOA 100 9.6 544 1019 607 1068<br />
AAK LTOA 100 8.6 502 1049 662 1260<br />
AAK NONE 9.2 345 -- 413<br />
AAK NONE 8.0 450 579<br />
MK NONE 8.1 429 -- 578<br />
MM LPO 85 8.9 470 763 436 1006<br />
MM LPO 85 8.1 445 840 641 1110<br />
MM LPO 60 8.0 421 580 577 796<br />
MM LPO 60 8.6 405 602 558 850<br />
MM LTOA 85 8.5 446 796 510 897<br />
MM LTOA 85 9.0 456 747 488 910<br />
MM LTOA 100 9.2 404 750 552 816<br />
MM LTOA 100 8.5 450 787 537 818<br />
AAM NONE 8.3 332 -- 453<br />
AAM NONE 9.0 303 358<br />
MM NONE 7.9 346 442<br />
°F = 1.8(°C) + 32<br />
Note: All modulus data are reported in ksi.<br />
KEY:<br />
NONE = No <strong>aging</strong>.<br />
LPO 60 = Low-Pressure Oxidation, 60°C/5 days.<br />
LPO 85 = Low-Pressure Oxidation, 85°C/5 days.<br />
LTOA 85 = Long-Term Oven Aging, 85°C/5 days.<br />
LTOA 100 = Long-Term Oven Aging, 100C.J2 days.<br />
38
Table 4.2. Modulus data <strong>for</strong> <strong>aggregate</strong> RD<br />
Aging % Air<br />
Modulus Values<br />
Diametral Triaxial<br />
Asphalt Method Voids Be<strong>for</strong>e After Be<strong>for</strong>e After<br />
AAA<br />
MA<br />
MA<br />
LPO 85<br />
LPO 85<br />
LPO 60<br />
8.2<br />
8.4<br />
8<br />
211<br />
193<br />
233<br />
572<br />
504<br />
367<br />
295<br />
350<br />
434<br />
805<br />
802<br />
600<br />
AAA LPO 60 8.1 270 414 373 442<br />
AAA<br />
AM<br />
LTOA 85 9.5<br />
LTOA 85 8.7<br />
225<br />
221<br />
405<br />
412<br />
357<br />
295<br />
780<br />
583<br />
AAA LTOA 100 9 219 475 270 570<br />
AAA LTOA 100 8.6 216 499 295 455<br />
AAA NONE 8 152 230 --<br />
AAA NONE 8.8 153 225<br />
AAA<br />
MB<br />
MB<br />
MB<br />
MB<br />
MB<br />
MB<br />
MB<br />
MB<br />
MB<br />
MB<br />
MB<br />
NONE 7.9<br />
LPO 85 8.6<br />
LPO 85 7.2<br />
LPO 60 8.9<br />
LPO 60 8.4<br />
LTOA 85 8.7<br />
LTOA 85 8.5<br />
LTOA 100 7.4<br />
LTOA 100 7.5<br />
NONE 8.4<br />
NONE 7.6<br />
NONE 7.6<br />
164<br />
356<br />
400<br />
414<br />
380<br />
390<br />
528<br />
509<br />
444<br />
233<br />
306<br />
302<br />
--<br />
627<br />
632<br />
456<br />
506<br />
502<br />
582<br />
603<br />
642<br />
-<br />
236<br />
320<br />
475<br />
450<br />
4.89<br />
465<br />
578<br />
589<br />
411<br />
353<br />
399<br />
314<br />
--<br />
541<br />
539<br />
535<br />
696<br />
755<br />
780<br />
631<br />
588<br />
-<br />
MG LPO 85 8.3 419 657 614<br />
MC LPO 85 82 467 671 498 884<br />
MC LPO 60 6.9 486 630 762 886<br />
MC LPO 60 8.1 526 628 761 741<br />
MC LTOA 85 7.1 435 532 519 726<br />
MC LTOA 85 7.4 456 600 644 782<br />
MC LTOA 100 7.8 451 522 403 679<br />
MC LTOA 100 7.3 496 658 647 732<br />
MC NONE 7.9 304 - 506 -<br />
MC NONE 7.1 291 - 464<br />
MC NONE 7.5 319 - 505 --<br />
MD LPO 85 8.6 321 584 383 :T! i<br />
MD LPO 85 8.2 334 633 432 966<br />
MD LPO 60 8.5 325 463 425 845<br />
MD LPO 60 8.2 362 450 352 698<br />
MD LTOA 85 7.8 356 578 472 689<br />
MD LTOA 85 8.4 393 611 410 679<br />
MD LTOA 100 9.3 341 515 398 670<br />
MD LTOA 100 9 395 544 438 441<br />
MD NONE 8.1 250 - 227 --<br />
MD NONE 6.9 253 298<br />
MD NONE 7 262 286<br />
°F = I 8(°C) + 32<br />
Note: All modulus data arc reported in ksi. KEY:<br />
NONE = No <strong>aging</strong>.<br />
LPO 60 = Low-Pressure Oxidation, 60°C/5 days.<br />
LPO 85 = Low-Pressure Oxidation, 85°C/5 days.<br />
LTOA 85 - Long-Term Oven Aging, 85°C/5 days.<br />
LTOA 100 = Long-Term Oven Aging, 100°C2 days.<br />
4.,<br />
39
Table 4.2 (continued). Modulus data <strong>for</strong> <strong>aggregate</strong> RD<br />
Modulus Values<br />
Aging % Air Diametral Triaxial<br />
Asphalt Method Voids Be<strong>for</strong>e After Be<strong>for</strong>e After<br />
AAF LPO 85 8.9 795 1193 763 1393<br />
AAF LPO 85 8.9 857 1244 1009 1818<br />
AAF LPO 60 9 703 1034 998 1588<br />
AAF LPO 60 8.6 704 862 806 1359<br />
AAF LTOA 85 9.2 807 1072 1066 1342<br />
AAF LTOA 85 8.3 786 1068 1036 1538<br />
AAF LTOA 100 8.9 754 1100 871 919<br />
AAF LTOA 100 8.9 706 1119 1127 1796<br />
AAF NONE 9.6 493 - 609<br />
AAF NONE 8.9 526 700<br />
AAF NONE 8.8 564 850 -<br />
AAG LPO 85 8.6 991 1147 1194 1588<br />
AAG LPO 85 8.8 1101 1162 1380 2298<br />
AAG LPO 60 7.7 1002 1312 1178 1570<br />
AAG LPO 60 8.7 854 1201 1162 1598<br />
AAG LTOA 85 8.5 917 1108 1264 1617<br />
AAG LTOA 85 8.4 893 1161 1186 1277<br />
AAG LTOA 100 8.4 791 1015 1116 1266<br />
AAG LTOA 100 8.5 745 1105 1215 1272<br />
AAG NONE 8 608 1040 --<br />
AAG NONE 8.4 551 733<br />
AAG NONE 8 552 - 975 -<br />
AAK LPO 85 7.8 544 977 507 1039<br />
AAK LPO 85 8.2 545 782 672 1065<br />
AAK LPO 60 8 538 721 556 745<br />
AAK LPO 60 8 567 804 638 1104<br />
MK LTOA 85 7.6 527 761 690 1062<br />
AAK LTOA 85 8.8 336 650 302 1120<br />
MK LTOA 100 7.7 507 900 646 842<br />
AAK LTOA 100 7.2 516 890 723 1066<br />
AAK NONE 9.3 343 - 391 -<br />
AAK NONE 8.3 482 - 436<br />
AAK NONE 7.7 493 536<br />
AAM LPO 85 8.8 437 629 536 793<br />
MM LPO 85 8.2 509 703 556 668<br />
AAM LPO 60 8.3 406 571 605 882<br />
AAM LPO 60 8.3 446 616 476 807<br />
MM LTOA 85 7.3 458 638 510 807<br />
MM LTOA 85 8 459 710 593 809<br />
MM LTOA 100 8.2 410 648 546 696<br />
MM LTOA 100 8.6 458 639 518 840<br />
MM NONE 5.5 438 485 --<br />
AAM NONE 8.6 407 391 -<br />
MM NONE 7.9 518 469<br />
°F = 1.8(°C) + 32<br />
Note: All modulus data are reported in ksi.<br />
KEY:<br />
NONE = No <strong>aging</strong>.<br />
LPO 60 = Low-Pressure Oxidation, 60°C/5 days.<br />
LPO 85 = Low-Pressure Oxidation, 85°C/5 days.<br />
LTOA 85 = Long-Term Oven Aging, 115°C./5 days.<br />
LTOA 100 = Long-Term Oven Aging, 100°02 days.<br />
40
Table 4.3. Modulus data <strong>for</strong> <strong>aggregate</strong> RH<br />
Modulus Values<br />
Aging % Air Diametral Triaxial<br />
Asphalt Method Voids Be<strong>for</strong>e After Be<strong>for</strong>e After<br />
AAA LPO 85 8.2 211 572 295 805<br />
AAA LPO 85 8.4 193 504 350 802<br />
MA LPO 60 8 233 367 434 600<br />
AAA LPO 60 8.1 270 414 373 442<br />
AAA LTOA 85 9.5 225 405 357 780<br />
AAA LTOA 85 8.7 221 412 295 583<br />
AAA LTOA 100 9 219 475 270 570<br />
AAA LTOA 100 8.6 216 499 295 455<br />
MA NONE 8 152 - 230<br />
AAA NONE 8.8 153 225<br />
AAA NONE 7.9 164 - 236<br />
MB LPO 85 8.8 311 479 281 541<br />
MB LPO 85 10.6 244 385 275 539<br />
MB LPO 60 8.5 276 490 306 605<br />
MB LPO 60 8.9 256 330 356 539<br />
MB LTOA 85 8.8 313 419 351 567<br />
MB LTOA 85 8.4 289 445 363 655<br />
MB LTOA 100 7.6 360 454 564 562<br />
MB LTOA 100 8 348 451 425 434<br />
MB NONE 8.8 160 165 --<br />
MB NONE 7.8 191 260<br />
MB NONE 7.5 216 305 -<br />
MC LPO 85 8.3 290 505 271 589<br />
MC LPO 85 8.5 313 487 288 520<br />
MC LPO 60 8.4 264 374 242 373<br />
MC LPO 60 7.8 307 375 310 449<br />
MC LTOA 85 8.8 286 403 319 507<br />
MC LTOA 85 8.4 272 387 364 439<br />
MC LTOA 100 6.8 419 453 493 521<br />
MC LTOA 100 6.8 413 455 618 548<br />
MC NONE 7.5 176 - 200<br />
MC NONE 7.7 163 - 220<br />
MC NONE 8 161 - 210<br />
MD LPO 85 6.3 252 553 272 573<br />
AAD LPO 85 8.4 317 616 401 826<br />
MD LPO 60 8.9 229 316 295 522<br />
MD LPO 60 7.3 261 309 237 408<br />
MD LTOA 85 8 227 385 317 613<br />
MD LTOA 85 7.8 278 435 184 283<br />
MD LTOA 100 6.6 256 348 307 513<br />
MD LTOA 100 6.9 240 390 261 567<br />
MD NONE 6.2 197 -- 167 --<br />
AAD NONE 6.9 162 240<br />
MD NONE 5.6 174 255<br />
°F = I 8(°C) + 32<br />
Note: MI modulus data are reported in ksi. KEY:<br />
NONE = No <strong>aging</strong>.<br />
LPO 60 = Low-Pressure Oxidation, 60°C/5 days.<br />
LPO 85 = Low-Pressure Oxidation, 85°C/5 days.<br />
LTOA 85 Long-Term Oven Aging, 85°C/5 days.<br />
LTOA 100 . Long-Tenn Oven Aging, 100°C/2 days.<br />
41
Table 4.3 (continued). Modulus data <strong>for</strong> <strong>aggregate</strong> RH<br />
Modulus Values<br />
Aging % Air Diametral Triaxial<br />
Asphalt Method Voids Be<strong>for</strong>e After Be<strong>for</strong>e After<br />
AAF LPO 85 6.9 677 982 656 1206<br />
AAF LPO 85 8 864 1089 1158 1705<br />
AAF LPO 60 7.4 889 1041 874 896<br />
AAF LPO 60 8 816 903 790 986<br />
AAF LTOA 85 6.6 776 918 720 1128<br />
AAF LTOA 85 7.2 762 862 742 1260<br />
AAF LTOA 100 7.5 775 855 787 1004<br />
AAF LTOA 100 7.5 700 935 689 932<br />
AAF NONE 7.2 617 -- 855 --<br />
AAF NONE 7.2 603 665<br />
AAF NONE 6.5 673 -- 864 --<br />
AAG LPO 85 9.4 643 912 615 1133<br />
AAG LPO 85 10.3 610 886 627 1020<br />
AAG LPO 60 10.2 624 964 925 1102<br />
MG LPO 60 10.1 617 837 967 1034<br />
AAG LTOA 85 8.9 858 1260 982 1303<br />
AAG LTOA 85 8.4 727 1001 1012 1246<br />
AAG LTOA 100 --<br />
-- --<br />
AAG LTOA 100 -- -<br />
AAG NONE 8.9 483 641<br />
AAG NONE 8.5 511 709<br />
AAG NONE 8.6 602 -- 663 --<br />
MK LPO 85 8.5 506 735 593 904<br />
MK LPO 85 8.2 430 700 594 904<br />
AAK LPO 60 8.8 453 592 607 845<br />
MK LPO 60 8.1 400 543 453 710<br />
AAK LTOA 85 7.6 502 571 517 847<br />
AAK LTOA 85 8.3 421 453 453 764<br />
AAK LTOA 100 8 371 646 753 1018<br />
MK LTOA 100 7.1 443 626 531 667<br />
AAK NONE 7.5 250 - 353 --<br />
AAK NONE 6.9 274 - 303<br />
AAK NONE 6.8 277 - 377 -<br />
AAht LPO 85 6.8 432 alt 430 747<br />
AAM LPO 85 7.4 382 606 583 818<br />
AAM LPO 60 7.1 408 521 537 721<br />
AAM LPO 60 7.2 365 467 530 620<br />
MM LTOA 85 6.6 411 479 500 705<br />
MM LTOA 85 6.5 411 545 485 779<br />
AAM LTOA 100 7.1 416 560 467 541<br />
AAM LTOA 100 7 429 576 517 546<br />
MM NONE 5.8 319 -- 478<br />
AAM NONE 5.1 349 624<br />
MM NONE 4.6 338 666<br />
°F = 1.8(°C) + 32<br />
Note: All modulus data are reported in ksi. KEY:<br />
NONE = No <strong>aging</strong>.<br />
LPO 60 = Low-Pressure Oxidation, 60°C/5 days.<br />
LPO 85 = Low-Pressure Oxidation, 85°C/5 days.<br />
LTOA 85 Long-Term Oven Aging, 85°C/5 days.<br />
LTOA 100 = Long-Term Oven Aging, 100°C/2 days.<br />
42
Table 4.4. Modulus data <strong>for</strong> <strong>aggregate</strong> RJ<br />
Modulus Values<br />
Aging % Air Diametral Triaxial<br />
Asphalt Method Voids Be<strong>for</strong>e After Be<strong>for</strong>e After<br />
AAA LPO 85 82 211 572 295 805<br />
MA LPO 85 8.4 193 504 350 802<br />
AAA LPO 60 8 233 367 434 600<br />
AAA LPO 60 8.1 270 414 373 442<br />
AAA LTOA 85 9.5 225 405 357 780<br />
AAA LTOA 85 8.7 221 412 295 583<br />
AAA LTOA 100 9 219 475 270 570<br />
AAA LTOA 100 8.6 216 499 295 455<br />
AAA NONE 8 152 230<br />
AAA NONE 8.8 153 225<br />
AAA NONE 7.9 164 -- 236 -<br />
MB LPO 85 8.7 277 398 357 556<br />
MB LPO 85 9 318 521 357 578<br />
MB LPO 60 8.8 325 426 284 480<br />
MB LPO 60 9.4 292 376 286 588<br />
MB LTOA 85 8.6 293 431 344 536<br />
MB LTOA 85 9.1 292 455 494 521<br />
MB LTOA 100 8.2 335 451 324 536<br />
MB LTOA 100 8.2 328 460 373 650<br />
MB NONE 7.9 196 - 247<br />
MB NONE 8.2 209 253 -<br />
MB NONE 7.5 231 -- 235 -<br />
MC LPO 85 8.6 267 490 341 843<br />
MC LPO 85 7.6 405 594 464 604<br />
AAC LPO 60 7.8 392 493 478 534<br />
MC LPO 60 6.7 440 558 582 651<br />
MC LTOA 85 7.2 405 480 439 595<br />
MC LTOA 85 8 326 457 589 689<br />
MC LTOA 100 8.2 350 431 379 585<br />
MC LTOA 100 8.4 345 453 500 636<br />
MC NONE 6.4 326 376 -<br />
MC NONE 6.8 238 355<br />
MC NONE 7 245 - 365 -<br />
MD LPO 85 7.7 259 502 445 795<br />
MD LPO 85 7.9 265 507 343 780<br />
MD LPO 60 7.6 262 375 434 581<br />
MD LPO 60 8 299 452 296 548<br />
MD LTOA 85 8.4 271 491 420 708<br />
MD LTOA 85 7.5 285 476 283 439<br />
MD LTOA 100 8.6 317 496 308 651<br />
MD LTOA 100 9.2 326 571 481 790<br />
AAD NONE 7.1 149 -- 205<br />
MD NONE 7.6 136 192<br />
MD NONE 7.6 154 214<br />
°F = 1.8(°C) + 32<br />
Note: All modulus data are reported in ksi. KEY:<br />
NONE = No <strong>aging</strong>.<br />
LPO 60 = Low-Pressure Oxidation, 60°C/5 days.<br />
LPO 85 = Low-Pressure Oxidation, 85°C/5 days.<br />
LTOA 85 = Long-Term Oven Aging, 85°C/5 days.<br />
LTOA 100 = Long-Term Oven Aging, 100°C/2 days.<br />
43
Table 4.4 (continued). Modulus data <strong>for</strong> <strong>aggregate</strong> RJ<br />
Modulus Values<br />
Aging % Air Diametral Triaxial<br />
Asphalt Method Voids Be<strong>for</strong>e After Be<strong>for</strong>e After<br />
AAF LPO 85 8.7 635 1001 802 1186<br />
AAF LPO 85 8.7 752 1062 798 1025<br />
AAF LPO 60 7.6 673 849 756 951<br />
AAF LPO 60 8.9 706 871 926 1117<br />
ME LTOA 85 8.3 677 884 988 1123<br />
AAF LTOA 85 8.4 779 1006 809 988<br />
AAF LTOA 100 8.4 681 961 711 1251<br />
AAF LTOA 100 9 712 1061 736 937<br />
AAF NONE 9 558 -- 668 --<br />
AAF NONE 8.4 575 723<br />
AAF NONE 7.8 567 802<br />
MG LPO 85 7.9 620 895 745 1465<br />
MG LPO 85 8.1 735 1006 771 1341<br />
MG LPO 60 8.1 812 914 853 1268<br />
MG LPO 60 8.2 675 810 760 1030<br />
MG LTOA 85 7.9 673 785 822 1324<br />
MG LTOA 85 7.4 722 857 885 1349<br />
MG LTOA 100 8.9 598 821 717 1010<br />
MG LTOA 100 7.9 698 939 986 1116<br />
MG NONE 7.5 527 -- 657 --<br />
MG NONE 7.1 535 563<br />
MG NONE 7.2 581 640<br />
AM LPO 85 9.1 403 660 674 1057<br />
AM LPO 85 8.4 419 712 512 1066<br />
MK LPO 60 9.2 408 574 499 824<br />
MK LPO 60 8.5 463 665 460 656<br />
MK LTOA 85 8.3 533 862 551 808<br />
AAK LTOA 85 9.3 562 928 771 1022<br />
MK LTOA 100 9.7 354 586 520 808<br />
AAK LTOA 100 9 450 737 692 972<br />
MK NONE 7.9 309 473 --<br />
AAK NONE 7.8 340 421<br />
MK NONE 7.7 347 460<br />
MM LPO 85 7.2 370 548 347 652<br />
MM LPO 85 8.2 344 492 602 792<br />
MM LPO 60 7.9 367 504 598 734<br />
MM LPO 60 7.3 394 529 452 621<br />
MM LTOA 85 8.1 437 558 604 813<br />
MM LTOA 85 8.3 385 479 480 717<br />
MM LTOA 100 7.6 410 442 510 492<br />
MM LTOA 100 7.5 356 491 436 519<br />
MM NONE 7.3 312 -- 422 --<br />
MM NONE 6.8 323 393<br />
MM NONE 6.6 343 355<br />
°F = I.8(°C) + 32<br />
Note: All modulus data are reported in ksi. KEY:<br />
NONE = No <strong>aging</strong>.<br />
LPO 60 = Low-Pressure Oxidation, 60°C/5 days.<br />
LPO 85 = Low-Pressure Oxidation, 85°C/5 days.<br />
LTOA 85 = Long-Term Oven Aging, 85°C/5 days.<br />
LTOA 100 = Long-Term Oven Aging, 100°C/2 days.<br />
44
SHORT-TERM AGING RANKINGS<br />
AGGREGATE -RC<br />
MODULUS RATIO<br />
25<br />
ST0A<br />
2<br />
1.5<br />
45<br />
0<br />
D B C A 0 M F K<br />
ASPHALT<br />
SHORT-TERM AGING RANKINGS<br />
AGGREGATE-RD<br />
MODULUS RATIO<br />
25<br />
2<br />
1.5<br />
as<br />
O A BCD ASPHALT<br />
F K<br />
Figure 4.1. Short-term <strong>aging</strong>: rankings based on diametral modulus<br />
STOA<br />
SHORT-TERM AGING RANKINGS<br />
AGGREGATE-RH<br />
MODULUS RA11O<br />
25<br />
2<br />
1.5<br />
as<br />
0<br />
A G F<br />
ASPHALT<br />
SHORT-TERM AGING RANKINGS<br />
AGGREGATE - RJ<br />
MODULUS RA11O<br />
25<br />
2<br />
1.5<br />
as<br />
0<br />
D A B C K F<br />
ASPHALT<br />
STOA
AGGREGATE - RC AGGREGATE - RH<br />
LOW PRESSURE OXIDATION - 60'C LOW PRESSURE OXIDATION - 60'C<br />
MODULUS RATIO MODULUS RATIO<br />
5 5<br />
4 4<br />
a 3<br />
2 2<br />
0 0<br />
Ci M 13 B A<br />
ASPHAL ASPHALT<br />
AGGREGATE - RD AGGREGATE - RJ<br />
LOW PRESSURE OXIDATION - 60'C LOW PRESSURE OXIDATION - 60'C<br />
MODULUS RATIO MODULUS RATIO<br />
5 5<br />
STOA<br />
LPO 60<br />
4 4<br />
3 3<br />
2 2<br />
0 0<br />
A IC 13 A O F<br />
ASPHALT ASPHAL<br />
Figure 4.2. Long-term <strong>aging</strong> by low pressure oxidation at 60°C: rankings based on diametral modulus<br />
1
AGGREGATE - RC<br />
LOW PRESSURE OXIDATION - 85'C<br />
MODULUS RATIO<br />
5<br />
4<br />
3<br />
2<br />
0<br />
A K<br />
ASPHALT<br />
AGGREGATE - RD<br />
LOW PRESSURE OXIDATION - 85°C<br />
MODULUS RATIO<br />
5<br />
I<br />
3<br />
2<br />
0<br />
A D CF<br />
ASPHALT<br />
0 K A<br />
AGGREGATE - RH<br />
LOW PRESSURE OXIDATION - 89'C<br />
MODULUS RATIO<br />
5<br />
4<br />
3<br />
2<br />
0<br />
D A M G<br />
ASPHALT<br />
AGGREGATE - RJ<br />
LOW PRESSURE OXIDATION - 85°C<br />
MODULUS RATIO<br />
4<br />
3<br />
2<br />
0<br />
1i iii<br />
A<br />
ASPHALT<br />
Figure 4.3. Long-term <strong>aging</strong> by low pressure oxidation at 85°C: rankings based on diametral modulus<br />
STOA<br />
TPO 95
MODULUS RATIO<br />
5<br />
4<br />
3<br />
2<br />
1<br />
AGGREGATE - RC<br />
LONG-TERM OVEN AGING - 85°C<br />
0 GB A CM<br />
ASPHALT<br />
G K<br />
MODULUS RAT10<br />
5<br />
4<br />
3<br />
2<br />
1<br />
0<br />
AGGREGATE - RD<br />
LONG-TERM OVEN AGING - 85°C<br />
A D B O F C K M<br />
ASPHALT<br />
AGGREGATE - RH<br />
LONG-TERM OVEN AGING - 85°C<br />
MODULUS RATIO<br />
5<br />
4<br />
3<br />
2<br />
1<br />
0<br />
A D C B 0 K M<br />
ASPHALT<br />
MODULUS RA11O<br />
5<br />
1<br />
3<br />
2<br />
1<br />
0<br />
AGGREGATE - RJ<br />
LONG-TERM OVEN AGING - 85°C<br />
D K A B C M F 0<br />
ASPHALT<br />
Figure 4.4. Long-term <strong>aging</strong> by long-term oven <strong>aging</strong> at 85°C: based on diametral modulus
AGGREGATE - RC<br />
LONG-TERM OVEN AGING -100°C<br />
D A B K C<br />
ASPHALT<br />
AGGREGATE - RD<br />
LONG-TERM OVEN AGING - 100°C<br />
MODULUS RATIO<br />
5<br />
1<br />
3<br />
2<br />
1<br />
0<br />
A D B F K<br />
ASPHALT<br />
IA F GI<br />
C G 'A<br />
AGGREGATE - RH<br />
LONG-TERM OVEN AGING - 100°C<br />
MODULUS RATIO<br />
5<br />
1<br />
3<br />
2<br />
1<br />
0<br />
A K C B D M F G<br />
ASPHALT<br />
AGGREGATE - RJ<br />
LONG-TERM OVEN AGING - 100°C<br />
MODULUS RATIO<br />
5<br />
1<br />
3<br />
2<br />
1<br />
0<br />
D A B K C F 0 N4<br />
ASPHALT<br />
Figure 4.5. Long-term <strong>aging</strong> by long -term oven <strong>aging</strong> at 100°C: based on diametral modulus
5.1 Statistical Analysis<br />
5.0 Analysis <strong>of</strong> Results<br />
Statistical analysis <strong>of</strong> the short-term and long-term <strong>aging</strong> data was<br />
completed using the General Linear Model (GLM) procedure in the SAS/STAT<br />
s<strong>of</strong>tware package produced by the SAS Institute, Inc. Specifically, the GLM<br />
procedure was used to run analysis <strong>of</strong> variance (ANOVA) and to rank the <strong>asphalt</strong>s<br />
in terms <strong>of</strong> their <strong>aging</strong> susceptibility using the Waller-Duncan ranking method.<br />
5.1.1 Data Description<br />
The data were analyzed by <strong>aggregate</strong> group. The only source variable used<br />
was the <strong>asphalt</strong> group. Prior to statistical analysis, all <strong>of</strong> the data had been<br />
normalized to the same air void content to eliminate that influence on the data.<br />
The dependent variable considered was either the short-term or long-term<br />
<strong>aging</strong> ratio. The short-term ratio is defined as the resilient modulus determined<br />
after the short-term <strong>aging</strong> process divided by the adjusted baseline modulus <strong>for</strong> that<br />
particular specimen. The long-term ratio is the resilient modulus value taken after<br />
a particular long-term <strong>aging</strong> procedure divided by the adjusted baseline modulus<br />
<strong>for</strong> that specimen.<br />
5.1.2 Waller Groupings<br />
The ANOVA F statistic tells us that there are statistically significant<br />
differences in the means, although it does not identify which ones are different.<br />
The Waller method is a way <strong>of</strong> determining which means in a group are<br />
50
statistically different than the others. The Waller-Duncan method was first<br />
proposed by Waller and Duncan (1969) and makes use <strong>of</strong> a different set <strong>of</strong><br />
assumptions than most <strong>of</strong> the other methods <strong>of</strong> ranking groups by multiple<br />
comparison. The Waller-Duncan method minimizes the Bayes risk under additive<br />
loss rather than control the type I error rates as do most <strong>of</strong> the other methods. The<br />
Waller-Duncan method is less conservative in grouping means together than most<br />
<strong>of</strong> the other methods, allowing more distinct groups to be <strong>for</strong>med within the<br />
analysis.<br />
5.2 Short-Term Aging <strong>of</strong> Asphalt-Aggregate Mixes<br />
The data presented in Figure 4.1 suggest that mix <strong>aging</strong> susceptibility is<br />
<strong>aggregate</strong> dependent. However, the effect <strong>of</strong> the <strong>asphalt</strong> is more significant. The<br />
rankings <strong>of</strong> the eight <strong>asphalt</strong>s based on short term <strong>aging</strong> (Figure 4.1) vary with<br />
<strong>aggregate</strong> type. In particular, <strong>asphalt</strong> AAK-1 moves around in the rankings,<br />
showing relatively little <strong>aging</strong> with basic <strong>aggregate</strong>s (RC and RD) and relatively<br />
high <strong>aging</strong> with acidic <strong>aggregate</strong>s (RH and RJ).<br />
The observed <strong>aging</strong> phenomena appears to be related to the adhesion <strong>of</strong> the<br />
<strong>asphalt</strong> and <strong>aggregate</strong>. A hypothesis is that the greater the adhesion, the greater<br />
the mitigation <strong>of</strong> <strong>aging</strong>. It should be noted that there is not a statistically<br />
significant difference between all <strong>asphalt</strong>s, rather, <strong>for</strong> a particular <strong>aggregate</strong>, two<br />
or more <strong>asphalt</strong>s show a similar degree <strong>of</strong> <strong>aging</strong>. This is illustrated in Table 5.1,<br />
which shows numerical rankings corresponding to the short-term <strong>aging</strong> rankings<br />
shown in Figure 4.1. The <strong>asphalt</strong>s within the bracketed areas are groups <strong>of</strong><br />
statistically similar <strong>aging</strong> ratios as determined by Waller groupings. When<br />
groupings are examined, it can be seen that only <strong>asphalt</strong> AAM-1 is consistently in<br />
the lowest group, and that only <strong>asphalt</strong> AAD-1 is consistently in the upper group.<br />
51
5.2.1 Comparison <strong>of</strong> Mix Aging by Short-Term and Long-Term<br />
Aging Methods<br />
The numerical rankings <strong>of</strong> <strong>aging</strong> presented in Tables 5.1 through 5.5 are<br />
summarized in Table 5.6. Comparison <strong>of</strong> the short-term <strong>aging</strong> rankings with the<br />
long-term <strong>aging</strong> rankings shows that small movements in the rankings are common.<br />
However, using the short-term rankings as a datum, only a few <strong>asphalt</strong>s move<br />
more than two places in the rankings, as Table 5.6 shows. These comparisons<br />
imply that the low pressure oxidation <strong>aging</strong> procedure relates more closely to the<br />
short-term <strong>aging</strong> rankings than does the long-term oven <strong>aging</strong> procedure. This<br />
may be because <strong>of</strong> the greater potential <strong>for</strong> a specimen to be damaged in the<br />
long-term oven <strong>aging</strong> procedure. This could be the cause <strong>of</strong> the greater variability<br />
in the long-term oven <strong>aging</strong> specimens, particularly <strong>for</strong> the 100°C (212°F)<br />
procedure. It should be noted that the short-term <strong>aging</strong> rankings are based on data<br />
from eight specimens, while those <strong>for</strong> each set <strong>of</strong> long-term aged specimens are<br />
based on data from only two specimens. Hence, more variability in the data is<br />
expected <strong>for</strong> long-term <strong>aging</strong>.<br />
5.3 Long-Term Aging <strong>of</strong> Asphalt-Aggregate Mixes<br />
The data <strong>for</strong> long-term <strong>aging</strong> (Figure 4.2 through 4.5) support those <strong>for</strong><br />
short-term <strong>aging</strong>, i.e., they also suggest that <strong>aging</strong> is <strong>aggregate</strong>-dependent as well<br />
as <strong>asphalt</strong>-dependent. Tables 5.2 through 5.5 present the rankings numerically and<br />
show which groups <strong>of</strong> <strong>asphalt</strong> are statistically similar, again using Waller<br />
groupings. Note that there appears to be greater differentiation among <strong>asphalt</strong>s<br />
following long-term <strong>aging</strong> than after short-term <strong>aging</strong>, and that this differentiation<br />
becomes more pronounced with the severity <strong>of</strong> the <strong>aging</strong> procedure.<br />
52
5.4 Comparison <strong>of</strong> Mix Aging by Short-Term and Long-Term Aging<br />
Methods<br />
The numerical rankings <strong>of</strong> <strong>aging</strong> presented in Tables 5.1 through 5.5 are<br />
summarized in Table 5.6. Comparison <strong>of</strong> the short-term <strong>aging</strong> rankings to the<br />
long-term <strong>aging</strong> rankings shows that small movements in the rankings are common.<br />
However, using the short-term rankings as a datum, only a few <strong>asphalt</strong>s move<br />
more than two places in the rankings, as Table 5.6 shows. These comparisons<br />
imply that the low pressure oxidation technique relates more closely to the<br />
short-term oven <strong>aging</strong> ranking than does the long-term oven <strong>aging</strong> procedure. This<br />
may be because <strong>of</strong> the higher potential <strong>for</strong> a specimen to be damaged in the<br />
long-term oven <strong>aging</strong> procedure. This causes more variability in the long-term<br />
oven aged specimens. It should also be noted that the short-term <strong>aging</strong> rankings<br />
are based on data from eight specimens, those <strong>for</strong> each set <strong>of</strong> long-term aged<br />
specimens are based on data from two specimens. Hence, more variability in the<br />
data is expected <strong>for</strong> long-term <strong>aging</strong>.<br />
5.5 Comparison <strong>of</strong> Mix Aging With Asphalt Aging<br />
Aging <strong>of</strong> <strong>asphalt</strong> cement has been carried out by the SHRP A-002A<br />
contractor. Data <strong>for</strong> original (tank), thin film oven (TFO) aged, and pressure<br />
<strong>aging</strong> vessel (PAV) aged <strong>asphalt</strong> have been presented in several A-002A reports.<br />
These routine data have been summarized by Christensen and Anderson (1992).<br />
As with the mix <strong>aging</strong> data, the <strong>asphalt</strong> <strong>aging</strong> data can be used to calculate an<br />
<strong>aging</strong> ratio based on the aged viscosity at 60°C (140°F) compared to the original<br />
viscosity at 60°C (140°F). The <strong>asphalt</strong>s can then be ranked in order <strong>of</strong> <strong>aging</strong><br />
susceptibility. Table 5.7 shows the routine <strong>asphalt</strong> data and the calculated viscosity<br />
ratios.<br />
53
Table 5.1. Short-term rankings by <strong>aggregate</strong><br />
Aggregate<br />
RC D<br />
1.59<br />
RD G<br />
1.62<br />
RH C<br />
1.97<br />
RJ D<br />
2.18<br />
i<br />
><br />
1<br />
B<br />
1.53<br />
> A<br />
1.61<br />
> K<br />
1.78<br />
> A<br />
1.93<br />
> C<br />
><br />
I<br />
1.52<br />
B<br />
1.56<br />
> D<br />
><br />
1<br />
1.72<br />
B<br />
1.58<br />
> A<br />
1.58<br />
> C<br />
1.55<br />
> B<br />
1.70<br />
> C<br />
Ranking<br />
Note: Waller groupings <strong>of</strong> statistically similar behavior are identified with brackets.<br />
1.47<br />
> G<br />
1.39<br />
> D<br />
1.53<br />
> A<br />
1.70<br />
> K<br />
1.45<br />
i<br />
1<br />
> M<br />
1.35<br />
> F<br />
1.44<br />
> M<br />
><br />
1<br />
1.36<br />
G<br />
1.30<br />
1 I<br />
I<br />
> F<br />
1.34<br />
> K<br />
1.14<br />
> G<br />
1.32<br />
> F<br />
1.24<br />
> K<br />
1.28<br />
> M<br />
1.03<br />
> F<br />
1.26<br />
> M<br />
1.24<br />
1<br />
I<br />
1<br />
i
Table 5.2. Long-term <strong>aging</strong> by low pressure oxidation at 60°C: rankings by <strong>aggregate</strong><br />
Aggregate<br />
RC A<br />
2.44<br />
RD G<br />
2.21<br />
RH K<br />
2.38<br />
RJ D<br />
2.99 I<br />
> D<br />
2.40<br />
> C<br />
I<br />
2.07<br />
> C<br />
2.36<br />
> A<br />
2.40<br />
><br />
1<br />
B<br />
2.31<br />
> A<br />
I<br />
1.95<br />
> D<br />
2.26<br />
><br />
i<br />
C<br />
2.21<br />
> D<br />
1.95<br />
> B<br />
2.17<br />
i<br />
i<br />
Ranking<br />
> F<br />
1.88<br />
> B<br />
1.82<br />
> A<br />
2.17<br />
> G<br />
1.80<br />
> F<br />
1.78<br />
> G<br />
1.79<br />
I<br />
> M<br />
1.80<br />
> K<br />
1.70<br />
> M<br />
1'67<br />
I<br />
I<br />
> K<br />
1.56<br />
> M<br />
1.37<br />
> F<br />
I 1<br />
> B<br />
2.14<br />
><br />
;<br />
C<br />
2.03<br />
Note: Waller groupings <strong>of</strong> statistically similar behavior are identified with brackets.<br />
> K<br />
1.99<br />
I<br />
><br />
I<br />
M<br />
1.66<br />
> G<br />
1.63<br />
i<br />
1.58<br />
> F<br />
1.51<br />
a
Table 5.3. Long-term <strong>aging</strong> by low pressure oxidation at 85°C: rankings by <strong>aggregate</strong><br />
Aggregate<br />
RC D<br />
3.69<br />
RD A<br />
2.76<br />
RH D<br />
4.03<br />
RJ D<br />
3.63<br />
> A<br />
3.47<br />
> D<br />
2.61<br />
> A<br />
3.49<br />
> A<br />
3.32<br />
1<br />
1<br />
1<br />
> C<br />
><br />
I<br />
3.07<br />
C<br />
2.30<br />
> C<br />
><br />
1<br />
3.24<br />
B<br />
2.40<br />
> B<br />
2.88<br />
> F<br />
2.29<br />
> K<br />
><br />
2.97<br />
i<br />
1<br />
Ranking<br />
><br />
i<br />
M<br />
2.47<br />
> B<br />
2.26<br />
> B<br />
2.75<br />
> K<br />
><br />
I<br />
2.36<br />
G<br />
2.07<br />
> M<br />
1.97<br />
I I<br />
I<br />
C<br />
2.23<br />
Note: Waller groupings <strong>of</strong> statistically similar behavior are identified with brackets.<br />
> K<br />
2.20<br />
> F<br />
1.84<br />
1<br />
> G<br />
2.15<br />
> K<br />
> F<br />
2.01<br />
1 1<br />
1.96<br />
> G<br />
1.77<br />
> G<br />
1.78<br />
I<br />
i<br />
> M<br />
1.55<br />
> F<br />
1.67<br />
> M<br />
1.68<br />
1
Table 5.4. Long-term oven <strong>aging</strong> at 85°C: rankings by <strong>aggregate</strong><br />
Aggregate<br />
RC D<br />
3.43<br />
RD A<br />
2.78<br />
RH A<br />
3.26<br />
RJ D<br />
3.58<br />
I<br />
I<br />
><br />
i<br />
B<br />
2.95<br />
> D<br />
><br />
><br />
I<br />
t<br />
2.48<br />
D<br />
2.84<br />
K<br />
2.88<br />
I<br />
> A<br />
><br />
><br />
1<br />
I<br />
2.95<br />
B<br />
2.04<br />
C<br />
2.65<br />
> A<br />
2.80<br />
1<br />
><br />
1<br />
C<br />
2.49<br />
> G<br />
2.01<br />
> B<br />
Ranking<br />
Note: Waller groupings <strong>of</strong> statistically similar behavior are identified with brackets.<br />
1<br />
><br />
i<br />
2.63<br />
B<br />
2.31<br />
1<br />
> M<br />
2.41<br />
> F<br />
><br />
><br />
i<br />
i<br />
2.00<br />
G<br />
2.13<br />
C<br />
1.86<br />
1<br />
I<br />
I<br />
> G<br />
><br />
I<br />
1.96<br />
C<br />
1.83<br />
> K<br />
2.05<br />
> M<br />
1.73<br />
I<br />
p<br />
> K<br />
><br />
I<br />
1.90<br />
K<br />
1.56<br />
> M<br />
1.67<br />
> F<br />
1.67<br />
I<br />
> F<br />
1.89<br />
> M<br />
1.51<br />
> F<br />
1.41<br />
> G<br />
1.52<br />
i<br />
I<br />
I
Table 5.5. Long-term oven <strong>aging</strong> at 100°C: rankings by <strong>aggregate</strong><br />
Aggregate<br />
RC D<br />
3.63<br />
2.46<br />
RH A<br />
2.51<br />
RJ D<br />
4.59<br />
1<br />
;<br />
1<br />
> A<br />
3.36<br />
> D<br />
2.42<br />
> K<br />
><br />
1<br />
2.48<br />
A<br />
2.97<br />
> B<br />
><br />
i<br />
3.14<br />
B<br />
2.16<br />
> C<br />
2.45<br />
> B<br />
2.22<br />
1<br />
1<br />
><br />
1<br />
K<br />
2.62<br />
> F<br />
2.09<br />
> B<br />
2.34<br />
> K<br />
2.19<br />
Ranking<br />
Note: Waller groupings <strong>of</strong> statistically similar behavior are identified with brackets.<br />
1<br />
1<br />
> C<br />
2.52<br />
> K<br />
><br />
1<br />
1.95<br />
D<br />
2.21<br />
> C<br />
1.86<br />
1<br />
> M<br />
2.42<br />
> C<br />
1.95<br />
> M<br />
1.91<br />
> F<br />
1.81<br />
1<br />
><br />
i<br />
F<br />
2.18<br />
> G<br />
1.88<br />
> F<br />
1.45<br />
> G<br />
1.68<br />
1<br />
> G<br />
2.07<br />
> M<br />
1.49<br />
G<br />
> M<br />
1.49<br />
I
Table 5.6 Ranking <strong>of</strong> Asphalt <strong>for</strong> Each Aggregate Based on Diametral Modulus Ratios and Aging Method<br />
Short-Term Oven Low Pressure Oxidation Low Pressure Long-Term Oven Long-Term Oven<br />
Aging Aggregate at 60°C Oxidation at 85°C Aging at 85°C Aging at 100°C<br />
RC RD RH RJ RC RD RH RJ RC RD RH RJ RC RD RH RJ RC RD RH RJ<br />
Worst D G C D A G K D D A D D DAA/D D A Al D<br />
B AKA D CC A ADi<br />
A B D3 DOA D K A<br />
C B D B B A D B C C C B ABC A B B C B<br />
A C B C C D B C B F K CC BB Kgg F B K<br />
G D AK F B AK M B B K M F GC C K DC<br />
M F M G G F G M K MFGC Kg MMCMF<br />
F K G F MK M G G K GGKKMF F F G<br />
Best K M F M K M F F F M F M F M F Gu -.4<br />
M M<br />
Key: A shaded block indicates an <strong>asphalt</strong> that changes more than two rankings relative to the short-term <strong>aging</strong> rankings.<br />
The arrow and adjacent number indicate the number <strong>of</strong> places moved and the direction.
5.5.1 Short-Term Aging<br />
Table 5.8 shows rankings <strong>for</strong> mixes based on short-term <strong>aging</strong> and <strong>for</strong><br />
<strong>asphalt</strong>s based on TFO <strong>aging</strong>. It should be noted that TFO <strong>aging</strong> is analogous to<br />
short-term mix <strong>aging</strong>, and that (as with the mix rankings) the differences between<br />
some <strong>asphalt</strong>s are not statistically significant. Nevertheless, it is clear that there is<br />
little relationship between the mix rankings and the <strong>asphalt</strong> rankings. The major<br />
similarity is that <strong>asphalt</strong> AAM-1 is one <strong>of</strong> the two "best" <strong>asphalt</strong>s in both mix and<br />
<strong>asphalt</strong> short-term <strong>aging</strong>. A major difference is that <strong>asphalt</strong> AAK-1 is ranked one<br />
<strong>of</strong> the two "worst" from <strong>asphalt</strong> TFO <strong>aging</strong> and among the two "best" if STOA<br />
<strong>aging</strong> with <strong>aggregate</strong>s RC and RD is considered.<br />
5.5.2 Long-Term Aging<br />
Table 5.9 shows the rankings <strong>for</strong> mixes based on long-term <strong>aging</strong> by low<br />
pressure oxidation at 85°C (185°F), and rankings <strong>for</strong> <strong>asphalt</strong> developed from the<br />
data reported by Christensen and Anderson (1992). Also summarized are<br />
rankings developed from data reported by Robertson et al. (1991b) <strong>for</strong> <strong>asphalt</strong><br />
recovered from "mixes" <strong>of</strong> single size fine <strong>aggregate</strong> and from <strong>asphalt</strong> subjected to<br />
pressure <strong>aging</strong>.<br />
As with the short-term <strong>aging</strong> comparisons, there is little similarity between<br />
the rankings <strong>for</strong> long-term <strong>aging</strong> <strong>of</strong> mixes and those <strong>for</strong> <strong>asphalt</strong> alone. In fact,<br />
there is even less similarity, since <strong>asphalt</strong> AAM-1 appears to have more<br />
susceptibility to long-term <strong>aging</strong> in the PAV than it does in the TFO (relative to<br />
the other <strong>asphalt</strong>s), as shown by its movement in the rankings.<br />
There is more similarity between the rankings based on mix <strong>aging</strong> and those<br />
based on the data <strong>for</strong> fine <strong>aggregate</strong> mixes developed by the A-003A contractor.<br />
However, the rankings are different as indicated in Table 5.8.<br />
60
Table 5.7. Summary <strong>of</strong> routine test data <strong>for</strong> <strong>asphalt</strong> alone<br />
ORIGINAL ASPHALT<br />
Viscosity (60°C) (Poises)<br />
AGED ASPHALT (THIN FILM OVEN TEST)<br />
Viscosity (60°C) (Poises)<br />
Viscosity Ratio (60°C TFO Aged/Original)<br />
LONG-TERM AGED (PAV)<br />
Viscosity (60°C) (Poises)<br />
Viscosity Ratio (60°C, PAV Aged/Original)<br />
Asphalt<br />
AAA-1 AAB-1 AAC-1 AAD-1 AAF-1 AAG-1 AAK-1 AAM-1<br />
(150/200) (AC-10) (AC-8) (AR-4000) (AC-20) (AR-4000) (AC-30) (AC-20)<br />
900 I 1120 1 710 1140 I 1750 I 1950 I 3320 I 2040<br />
2080<br />
2.31<br />
5380<br />
5.98<br />
2620<br />
2.34<br />
7110<br />
6.35<br />
1780<br />
2.51<br />
5170<br />
7.28<br />
3690<br />
3.24<br />
12000<br />
10.53<br />
4560<br />
2.61<br />
16250<br />
9.29<br />
3490<br />
1.79<br />
8140<br />
4.17<br />
10240<br />
3.08<br />
27300<br />
8.22<br />
4490<br />
2.20<br />
17150<br />
8.41
Table 5.8. Comparison <strong>of</strong> rankings <strong>for</strong> short-term <strong>aging</strong> <strong>mixtures</strong> and <strong>asphalt</strong> alone<br />
Aggregate<br />
RC<br />
Aggregate<br />
RD<br />
Ranking <strong>of</strong> Asphalt<br />
A-003A' A -002A2<br />
Aggregate<br />
RH<br />
Aggregate<br />
RJ<br />
Average <strong>of</strong><br />
A-003A Rankings<br />
Worst D G C D D D<br />
No<br />
Aggregate<br />
B A K A A K<br />
C B D B C F<br />
A C B C B C<br />
G D A K K B<br />
M F M G G A<br />
F K G F F M<br />
Best K M F M M G<br />
Based on short-term <strong>aging</strong> ratios from diametral modulus.' Based on data reported by Christensen and Anderson (1992).
Table 5.9. Comparison <strong>of</strong> rankings <strong>for</strong> long-term <strong>aging</strong> <strong>of</strong> <strong>mixtures</strong> and <strong>asphalt</strong>s<br />
Ranking <strong>of</strong> Asphalts<br />
A-003A1 A-002A2 A -002A3 A-002A4<br />
Average<br />
Aggregate Aggregate Aggregate Aggregate No Aggregate Aggregate Aggregated <strong>of</strong> A-003A<br />
RC RD RH RJ Aggregate RD RJ RD Rankings<br />
Worst D A D D D F D F D<br />
A D C A F MI B M A<br />
C C A B M D F C<br />
B F C C K C C D B<br />
M B K K C At M; G K<br />
K G M F B K Al A; F<br />
G K G G A G K Bt G<br />
Best F M F M G B; G K M<br />
' Based on long-term <strong>aging</strong> ratios from diametral modulus <strong>for</strong> low pressure oxidation <strong>aging</strong>.<br />
2 Based on data reported by Christensen and Anderson (1992) <strong>for</strong> TFO-PAV <strong>aging</strong>.<br />
3 Reported in 4th Quarterly Report, 1991, based on PAV <strong>aging</strong> at 60°C <strong>for</strong> 144 hours. Prior short-term <strong>aging</strong>.<br />
° Reported in 4th Quarterly Report, 1991. Asphalt alone was subjected to TFO <strong>aging</strong> prior to mixing and PAV <strong>aging</strong>.<br />
C
5.6 General Discussion<br />
The differences in rankings between mixes and <strong>asphalt</strong>, based on either<br />
short-term or long-term <strong>aging</strong> data indicate the need <strong>for</strong> mix testing to evaluate the<br />
<strong>aging</strong> susceptibility <strong>of</strong> a mix. Clearly, the <strong>aging</strong> <strong>of</strong> the <strong>asphalt</strong> alone, or in a fine<br />
<strong>aggregate</strong> mix, is not an indicator <strong>of</strong> how a mix will age. This need is caused by<br />
the influence <strong>of</strong> the <strong>aggregate</strong> on mix <strong>aging</strong>, which appears to be related to the<br />
chemical interaction <strong>of</strong> the <strong>aggregate</strong> and the <strong>asphalt</strong>. This interaction may be<br />
related to adhesion; the greater the adhesion, the greater the mitigation <strong>of</strong> <strong>aging</strong>.<br />
The mix <strong>aging</strong> rankings given in Tables 5.7 and 5.8 confirm this hypothesis, since<br />
the rankings are similar <strong>for</strong> two "basic" <strong>aggregate</strong>s (RC and RD) and <strong>for</strong> the two<br />
"acidic" <strong>aggregate</strong>s (RH and RJ). Some <strong>of</strong> the <strong>asphalt</strong>s rank similarly regardless<br />
<strong>of</strong> the <strong>aggregate</strong> types, while others (such as AAG-1 and AAK-1) behave very<br />
differently depending on the <strong>aggregate</strong> types. It is known that <strong>asphalt</strong> AAG-1 was<br />
lime treated in the refining process and it is there<strong>for</strong>e rational that it would exhibit<br />
good adhesion and reduce <strong>aging</strong> tendency with the acidic <strong>aggregate</strong>s (RH and RJ),<br />
as the short-term <strong>aging</strong> data indicate (Table 5.7). However, the rankings <strong>of</strong><br />
<strong>asphalt</strong> AAG-1 <strong>for</strong> long-term <strong>aging</strong> do not appear to be influenced by <strong>aggregate</strong><br />
type! Asphalt AAK-1 is known to be unusually chemically active. For instance,<br />
its high <strong>aging</strong> tendency when subjected to TFO <strong>aging</strong> is attributable to its<br />
reactivity. This reactivity appears to mitigate its tendency to age when in a mix,<br />
particularly with basic <strong>aggregate</strong>s.<br />
Tensile test data and dynamic modulus data using frequency sweep testing<br />
(dynamic mechanical analysis, DMA) <strong>for</strong> a subset <strong>of</strong> the 32 mixes used are<br />
presented in Appendices E and F, respectively. As mentioned in the appendices,<br />
both the tensile strength test and the DMA procedure are able to differentiate<br />
between the <strong>aging</strong> methods and different mixes. The tensile strength test is not as<br />
sensitive to <strong>aging</strong> changes as the resilient modulus test. The data obtained from<br />
DMA testing are much more difficult to interpret than the resilient modulus data.<br />
64
For these reasons, resilient modulus was the measurement tool used most<br />
extensively in this analysis.<br />
A major drawback <strong>of</strong> the comparison included here is the use <strong>of</strong> resilient<br />
modulus values determined at one loading time and at one temperature to generate<br />
rankings <strong>of</strong> <strong>aging</strong> susceptibility. The use <strong>of</strong> DMA parameters which describe<br />
behavior over a wide range <strong>of</strong> conditions is much more desirable. Similarly, the<br />
use <strong>of</strong> viscosity at 60°C (140°F) to generate rankings <strong>of</strong> <strong>asphalt</strong> <strong>aging</strong><br />
susceptibility is much less desirable than considering <strong>asphalt</strong> DMA parameters,<br />
such as those developed by the A-002A contractor. Time constraints have not<br />
permitted comparisons <strong>of</strong> mixes and <strong>asphalt</strong> DMA parameters.<br />
Another problem with the comparisons made herein is the difference in the<br />
definition <strong>of</strong> an "unaged" condition <strong>for</strong> mixes and <strong>asphalt</strong>. For mixes, the<br />
"unaged" condition can only be defined by tests on laboratory specimens that are<br />
compacted immediately after mixing. Inevitably, the mixing process "ages" the<br />
<strong>asphalt</strong>, perhaps by a substantial amount. This is in contrast to the "unaged"<br />
condition <strong>for</strong> the <strong>asphalt</strong> which is defined by tests on the original <strong>asphalt</strong>s and<br />
which represents a true unaged condition.<br />
65
6.1 Conclusions<br />
6.0 Conclusions and Recommendations<br />
The following conclusions may be drawn from the results <strong>of</strong> this study:<br />
1) The <strong>aging</strong> <strong>of</strong> <strong>asphalt</strong>-<strong>aggregate</strong> mixes is influenced by both the<br />
<strong>asphalt</strong> and the <strong>aggregate</strong>.<br />
2) Aging <strong>of</strong> the <strong>asphalt</strong> alone and subsequent testing does not appear to<br />
be an adequate means <strong>of</strong> predicting mix per<strong>for</strong>mance because <strong>of</strong> the<br />
apparent mitigating effect <strong>aggregate</strong> has on <strong>aging</strong>.<br />
3) The <strong>aging</strong> <strong>of</strong> certain <strong>asphalt</strong>s is strongly mitigated by some<br />
<strong>aggregate</strong>s but not by others. This appears to be related to the<br />
strength <strong>of</strong> the chemical bonding (adhesion) between the <strong>asphalt</strong> and<br />
<strong>aggregate</strong>.<br />
4) The short-term <strong>aging</strong> procedure produces a change in resilient<br />
modulus <strong>of</strong> up to a factor <strong>of</strong> two. For a particular <strong>aggregate</strong>, there<br />
is not a statistically significant difference in the <strong>aging</strong> <strong>of</strong> certain<br />
<strong>asphalt</strong>s. The eight <strong>asphalt</strong>s investigated typically fell into three<br />
groups, i.e., those with high, medium, and low <strong>aging</strong> susceptibility.<br />
5) The three long-term <strong>aging</strong> methods produced somewhat different<br />
rankings <strong>of</strong> <strong>aging</strong> susceptibility compared to the short-term <strong>aging</strong><br />
procedure and to each other. This is partially attributable to<br />
variability in the materials, <strong>aging</strong> processes, and testing. However,<br />
it appears that the short-term <strong>aging</strong> procedure does not enable<br />
prediction <strong>of</strong> long-term <strong>aging</strong>.<br />
6) The low pressure oxidation long-term <strong>aging</strong> procedure causes the<br />
most <strong>aging</strong> and less variability in the <strong>aging</strong> susceptibility rankings<br />
relative to the short-term <strong>aging</strong> rankings.<br />
66
6.2 Recommendations<br />
Based on the results <strong>of</strong> this study and the companion test selection and field<br />
validation test program, the following recommendation are made:<br />
1) Oven <strong>aging</strong> <strong>of</strong> loose mix at 135°C (275°F) is recommended <strong>for</strong><br />
short-term <strong>aging</strong>. An <strong>aging</strong> period <strong>of</strong> 4 h appears to be appropriate.<br />
2) Oven <strong>aging</strong> <strong>of</strong> compacted mixes should be adopted <strong>for</strong> long-term<br />
<strong>aging</strong> <strong>of</strong> dense mixes. A temperature <strong>of</strong> 85°C (185°F) is most<br />
appropriate <strong>for</strong> period <strong>of</strong> 5 days. It may be possible to use a<br />
temperature <strong>of</strong> 100°C (212°F) <strong>for</strong> 2 days. However, use <strong>of</strong> such a<br />
high temperature may cause damage to specimens.<br />
3) A low pressure oxidation (triaxial cell) technique is recommended<br />
<strong>for</strong> long-terms <strong>of</strong> open graded mixes or dense graded mixes using<br />
s<strong>of</strong>t grades <strong>of</strong> <strong>asphalt</strong>. A temperature <strong>of</strong> 85°C (185°F) is most<br />
appropriate <strong>for</strong> a period <strong>of</strong> 5 days. It may be possible to use a<br />
temperature <strong>of</strong> 100°C (212°F) <strong>for</strong> 2 days. However, use <strong>of</strong> such a<br />
high temperature may cause damage to specimens.<br />
67
References<br />
ASTM (1987). Standard Test Method <strong>for</strong> Indirect Tension Test <strong>for</strong> Resilient<br />
Modulus <strong>of</strong> Bituminous Mixtures. ASTM D4123-82.<br />
ASTM (1985). Standard Test Method <strong>for</strong> Dynamic Modulus <strong>of</strong> Asphalt<br />
Mixtures. ASTM D3497-79.<br />
Bell, C. A., Y. AbWahab, M. E. Cristi, and D. Sosnovske (1994). Selection <strong>of</strong><br />
<strong>Laboratory</strong> Aging Procedures <strong>for</strong> Asphalt-Aggregate Mixtures.<br />
TM-OSU-A003A-92922, final subtask report to the Strategic Highway<br />
Research Program, Washington, DC.<br />
Bell, C. A., A. Wieder, and M. J. Fe llin (1994). Field Validation <strong>of</strong> <strong>Laboratory</strong><br />
Aging Procedures. TM-OSU-A-003A-92-93, final report to the Strategic<br />
Highway Research Program, Washington, DC.<br />
Christensen, D., and D. Anderson (1992). Interpretation <strong>of</strong> Dynamic Mechanical<br />
Analysis Test Data <strong>for</strong> Paving Grade Asphalt Cements. Journal <strong>of</strong> the<br />
Association <strong>of</strong> Asphalt Paving Technologists 61: 67-116, Charleston, SC.<br />
C<strong>of</strong>fman, B. S., D. C. Craft, and J. Tamayo (1964). Comparison <strong>of</strong> Calculated<br />
and Measured Deflections <strong>for</strong> the AASHTO Road Test. Proceedings <strong>of</strong><br />
Association <strong>of</strong> Asphalt Paving Technologists (AAPT), Vol 57, 116-175.<br />
Curtis, C. W., K. Ens ley and J. Epps (1993). Fundamental Properties <strong>of</strong><br />
Asphalt Aggregate Interactors Including Adhesion and Absorption.<br />
Final A-003B Report to the Strategic Highway Research Program,<br />
Washington DC.<br />
Goodrich, H. (1991). Asphaltic Binder Rheology, Asphalt Concrete Rheology and<br />
Asphalt Concrete Mix Properties. Proceedings <strong>of</strong> Association <strong>of</strong> Asphalt<br />
Paving Technologists (AAPT), Vol. 60., Seattle, WA.<br />
Goodrich, J. (1988). Asphalt and Polymer Modified Asphalt Concrete Mixtures.<br />
Proceedings <strong>of</strong> Association <strong>of</strong> Asphalt Paving Technologists (AAPT),<br />
Vol. 57, 116-175.<br />
68
Papazina, H. S. (1962). The Response <strong>of</strong> Linear Viscoelastic Materials in the<br />
Frequency Domain with Emphasis on Asphaltic Concrete on Structural<br />
Design <strong>of</strong> Asphalt Pavements. Ph.D. Disertation, University <strong>of</strong> Michigan,<br />
Ann Arbor.<br />
Peterson, J.C., R.E. Robertson, J.F. Branthaver, and D.A. Anderson, (1994).<br />
Binder Characterization and Evaluation, Volume 4, Test Methods.<br />
Strategic Highway Research Program Report no. SHRP-A-370, National<br />
Research Council, Washington DC.<br />
Robertson, R., (1994). Binder Characerization and Evaluation: Volume 2,<br />
Chemistry. Strategic Highway Research Program, Report no. SHRP-A-<br />
368, National Research Council, Washington D.C.<br />
SAS Institute Inc. (1988). SAS/STAT Users Guide, release 6.03 ed. Cary N.<br />
C., USA.<br />
Sisko, A. W. and L. C. Brunstrum (1968). The Rheological Properties <strong>of</strong><br />
Asphalts in Relation to Durability and Pavement Per<strong>for</strong>mance. Proceedings<br />
<strong>of</strong> Association <strong>of</strong> Asphalt Paving Technologists, Vol. 37, 448-475.<br />
Sosnovske, D., Y. AbWahab, C. A. Bell (1992). The Role <strong>of</strong> Ashpalt and<br />
Aggregate in the Aging <strong>of</strong> Bituminous Mixtures. Prepared <strong>for</strong><br />
Transportation Research Board 72th Annual Meetings.<br />
Stephanos, P. J. (1990). A Computer Program <strong>for</strong> Determining Master<br />
Compliance Curves <strong>of</strong> Dynamic and Creep Moduli <strong>of</strong> Asphalt Concrete.<br />
Master's Project <strong>for</strong> the Graduate school <strong>of</strong> the University <strong>of</strong> Maryland.<br />
Tayebali, A. (1990). Influence <strong>of</strong> Rheological Properties <strong>of</strong> Modified Ashpalt<br />
Binders on the Load-De<strong>for</strong>mation Characteristics <strong>of</strong> the<br />
Binder-Aggregate Mixtures. Ph.D. dissertation, University <strong>of</strong> Cali<strong>for</strong>nia,<br />
Berkeley.<br />
Tayebali, A., J. Goodrich, J. Sousa, and C. Monismith (1991). Relationships<br />
Between Modified Asphalt Binders Rheology and Binder-Aggregate<br />
Mixtures Permanent De<strong>for</strong>mation Response. Proceedings <strong>of</strong> Association <strong>of</strong><br />
Asphalt Paving Technologists (AAPT), Vol. 60: 121-159, Seattle. WA.<br />
69
Waller, R. A., and D. B. Duncan (1969). A Bayes Rule <strong>for</strong> the Symmetric<br />
Multiple Comparison Problem. Journal <strong>of</strong> the American Statistical<br />
Association, 64, 1484-1499.<br />
Waller, R. A., and K. E. Kemp (1976). Computations <strong>of</strong> Bayesian t-values <strong>for</strong><br />
Multiple Comparisons. Journal <strong>of</strong> Statistical Computation and<br />
Simulation, 75, 169-172.<br />
70
Appendices<br />
71
A.1 Scope<br />
Appendix A<br />
Short-Term Aging <strong>of</strong> Asphalt Concrete<br />
Standard Practice <strong>for</strong><br />
Short-Term Aging <strong>of</strong> Asphalt Concrete Mixes<br />
AASHTO DESIGNATION: T ###-YY<br />
(ASTM DESIGNATION: D ####-YY)<br />
72<br />
SHRP #1025<br />
1.1 This standard is used to simulate the short-term <strong>aging</strong> <strong>of</strong> <strong>asphalt</strong><br />
concrete mixes. Short-term <strong>aging</strong> considers the <strong>aging</strong> undergone by <strong>asphalt</strong><br />
concrete mixes during field plant mixing operations.<br />
1.2 This standard may involve hazardous materials, operations and<br />
equipment. This standard does not purport to address all <strong>of</strong> the safety<br />
problems associated with its use. It is the responsibility <strong>of</strong> the user <strong>of</strong> this<br />
standard to establish appropriate safety and health practices and determine the<br />
applicability <strong>of</strong> regulatory limitations prior to use.<br />
1.3 The values stated in SI units are to be regarded as the standard. The<br />
values in parentheses are <strong>for</strong> in<strong>for</strong>mation only.<br />
A.2 Referenced documents<br />
2.1 AASHTO Documents:<br />
M ### Per<strong>for</strong>mance Graded Asphalt Binders<br />
R11 Practice <strong>for</strong> Indicating Which Places <strong>of</strong> Figures are to<br />
be Considered Significant in Specifying Limiting<br />
Values<br />
T2 Method <strong>of</strong> Sampling Aggregates<br />
T 27 Method <strong>for</strong> Sieve Analysis <strong>of</strong> Fine and Coarse<br />
Aggregates<br />
T 40 Method <strong>of</strong> Sampling Bituminous Materials<br />
T 201 Method <strong>for</strong> Kinematic Viscosity <strong>of</strong> Asphalts
2.2 ASTM Documents:<br />
A.3 Terminology<br />
D 8 Standard Definitions <strong>of</strong> Terms Relating to Materials <strong>for</strong><br />
Roads and Pavements<br />
E 1 Specification <strong>for</strong> Thermometers<br />
3.1 Desired Mixing Temperature the target temperature <strong>for</strong> mixing<br />
<strong>asphalt</strong> binder and <strong>aggregate</strong> in the laboratory. The desired mixing temperature<br />
selected should be equivalent to the anticipated field plant mixing temperature. If<br />
field mixing temperatures are unknown, select a temperature which corresponds to<br />
a kinematic viscosity <strong>of</strong> 170 ± 20 cS <strong>for</strong> the <strong>asphalt</strong> binder which is used.<br />
3.2 Definitions <strong>for</strong> many terms common to <strong>asphalt</strong> are found in the<br />
following documents:<br />
3.2.1 Standard Definitions D 8<br />
3.2.2 Per<strong>for</strong>mance Graded Asphalt Binder M ###<br />
3.2.3 Kinematic Viscosity <strong>of</strong> Asphalts T 201<br />
A.4 Summary <strong>of</strong> practice<br />
4.1 A mix <strong>of</strong> <strong>aggregate</strong> and <strong>asphalt</strong> binder is aged in a <strong>for</strong>ced draft oven<br />
<strong>for</strong> 4 h at 135°C (275°F). The oven <strong>aging</strong> is designed to simulate the <strong>aging</strong> the<br />
mix will undergo during field plant mixing operations.<br />
A.5 Significance and use<br />
5.1 The short-term <strong>aging</strong> practice simulates the <strong>aging</strong> <strong>asphalt</strong> concrete<br />
mixes undergo during field plant mixing operations.<br />
5.2 The properties and per<strong>for</strong>mance <strong>of</strong> <strong>asphalt</strong> concrete mixes may be<br />
more accurately predicted by using aged test samples.<br />
73
A.6 Apparatus<br />
6.1 Aging Test System A system which consists <strong>of</strong> a <strong>for</strong>ced draft oven<br />
which possesses the requirements specified in Table A.1.<br />
Table A.1. Minimum <strong>aging</strong> test system requirements<br />
Range, °C Resolution, °C Accuracy, °C<br />
Temperature Measurement 10 - 260
A.8 Sampling<br />
8.1 The <strong>asphalt</strong> binder shall be sampled in accordance with T 40.<br />
8.2 The <strong>aggregate</strong> shall be sampled and tested in accordance with T 2<br />
and T 27, respectively.<br />
A.9 Specimen preparation<br />
9.1 Preheat the <strong>aggregate</strong> <strong>for</strong> a minimum <strong>of</strong> 2 h at the desired mixing<br />
temperature. The amount <strong>of</strong> <strong>aggregate</strong> preheated should be sufficient to give a mix<br />
specimen <strong>of</strong> the desired size.<br />
9.2 Preheat the <strong>asphalt</strong> binder <strong>for</strong> 1 to 2 h at the desired mixing<br />
temperature. The amount <strong>of</strong> <strong>asphalt</strong> binder preheated shall be <strong>of</strong> sufficient quantity<br />
to obtain the desired <strong>asphalt</strong> binder content to be tested. Asphalt binders heated<br />
<strong>for</strong> more than 2 h should be discarded.<br />
9.3 Mix the heated <strong>aggregate</strong> and <strong>asphalt</strong> binder at the desired <strong>asphalt</strong><br />
content.<br />
A.10 Procedure<br />
10.1 Place the mix on the baking pan and place the mix and pan in the<br />
<strong>for</strong>ced draft oven <strong>for</strong> 4 h ± 5 min at a temperature <strong>of</strong> 135° ± 1°C (275° ±<br />
1.8°F). The mix should be spread to an even thickness over an appropriate area<br />
such that the rate <strong>of</strong> spread should is 21-22 kg /m2 (2.2 g /cm2).<br />
10.2 Stir the mix every hour to maintain uni<strong>for</strong>m <strong>aging</strong>.<br />
10.3 After 4 h, remove the mix from the <strong>for</strong>ced draft oven. The aged<br />
mix is now ready <strong>for</strong> further conditioning or testing as required.<br />
A.11 Report<br />
11.1 Report the following in<strong>for</strong>mation:<br />
11.1.1 Asphalt Binder Grade<br />
11.1.2 Asphalt Binder Content - in percent to the nearest 0.1<br />
percent<br />
75
11.1.3 Aggregate Type and Gradation<br />
11.1.4 Mixing Temperature in °C to the nearest 1°C<br />
11.1.5 Aging Temperature in °C to the nearest 1°C<br />
11.1.6 Aging Duration in min to the nearest 1 min<br />
A.12. Keywords<br />
12.1 Asphalt concrete, bituminous mixes, bituminous paving mixes, <strong>aging</strong>,<br />
<strong>asphalt</strong> concrete <strong>aging</strong>, short-term <strong>aging</strong>.<br />
76
B.1 Scope<br />
Appendix B<br />
Long-Term Aging <strong>of</strong> Asphalt Concrete Mixes<br />
by Low Pressure Oxidation<br />
Standard Practice <strong>for</strong><br />
Long-Term Aging <strong>of</strong> Asphalt Concrete Mixes<br />
by Low Pressure Oxidation<br />
AASHTO DESIGNATION: T ###-YY<br />
(ASTM DESIGNATION: D ####-YY)<br />
77<br />
SHRP #1030<br />
1.1 This standard is used to simulate the long-term <strong>aging</strong> <strong>of</strong> <strong>asphalt</strong><br />
concrete mixes. Long-term <strong>aging</strong> considers the total <strong>aging</strong> undergone by<br />
compacted <strong>asphalt</strong> concrete mixes during a service life <strong>of</strong> 5 to 10 years.<br />
1.2 This standard may involve hazardous materials, operations and<br />
equipment. This standard does not purport to address all <strong>of</strong> the safety<br />
problems associated with its use. It is the responsibility <strong>of</strong> the user <strong>of</strong> this<br />
standard to establish appropriate safety and health practices and determine the<br />
applicability <strong>of</strong> regulatory limitations prior to use.<br />
1.3 The values stated in SI units are to be regarded as the standard. The<br />
values in parentheses are <strong>for</strong> in<strong>for</strong>mation only.<br />
B.2 Referenced documents<br />
2.1 AASHTO Documents:<br />
M ### Specification <strong>for</strong> Per<strong>for</strong>mance Graded Asphalt Binders<br />
R 11 Practice <strong>for</strong> Indicating Which Places <strong>of</strong> Figures are to<br />
be Considered Significant in Specifying Limiting<br />
Values<br />
T 27 Method <strong>for</strong> Sieve Analysis <strong>of</strong> Fine and Coarse<br />
Aggregates
T 164 Method <strong>for</strong> Quantitative Extraction <strong>of</strong> Bitumen from<br />
Paving Mixes<br />
T 168 Method <strong>of</strong> Sampling Bituminous Paving Mixes<br />
T 201 Method <strong>for</strong> Kinematic Viscosity <strong>of</strong> Asphalts<br />
T 269 Method <strong>for</strong> Percent Air Voids in Compacted Dense<br />
and Open Bituminous Paving Mixes SW: See previous<br />
note.<br />
T ### Practice <strong>for</strong> Short Term Aging <strong>of</strong> Asphalt Concrete<br />
Mixes<br />
T ### Method <strong>for</strong> Preparation <strong>of</strong> Asphalt Concrete<br />
Specimens by Means <strong>of</strong> the SHRP Gyratory<br />
Compactor<br />
T ### Method <strong>for</strong> Preparation <strong>of</strong> Asphalt Concrete<br />
Specimens by Means <strong>of</strong> the Rolling Wheel Compactor<br />
2.2 ASTM Documents:<br />
B.3 Terminology<br />
D 8 Standard Definitions <strong>of</strong> Terms Relating to Materials<br />
<strong>for</strong> Roads and Pavements<br />
D 3549 Method <strong>for</strong> Thickness or Height <strong>of</strong> Compacted<br />
Bituminous Paving Mix Specimens<br />
E 1 Specification <strong>for</strong> Thermometers<br />
3.1 Desired Compaction Temperature The target temperature <strong>for</strong><br />
compacting <strong>asphalt</strong> concrete mixes in the laboratory. The desired compaction<br />
temperature selected should be equivalent to the anticipated field compaction<br />
temperature. If field compaction temperatures are unknown, select a compaction<br />
temperature which corresponds to a kinematic viscosity <strong>of</strong> 665 ± 80 cS <strong>for</strong> the<br />
<strong>asphalt</strong> binder which is used.<br />
3.2 Definitions <strong>for</strong> many terms common to <strong>asphalt</strong> are found in the<br />
following documents:<br />
3.2.1 Standard Definitions D 8<br />
3.2.2 Per<strong>for</strong>mance Graded Asphalt Binder M ###<br />
3.2.3 Short Term Aging <strong>of</strong> Asphalt Concrete Mixes T ###<br />
3.2.4 Kinematic Viscosity <strong>of</strong> Asphalts T 201<br />
78
B.4 Summary <strong>of</strong> practice<br />
4.1 A compacted mix <strong>of</strong> <strong>aggregate</strong> and <strong>asphalt</strong> binder is aged in a low<br />
pressure oxidation cell <strong>for</strong> 5 days at 85°C (185°F). The oven <strong>aging</strong> is designed to<br />
simulate the total <strong>aging</strong> the compacted mixure will undergo during a 5 to 10 year<br />
service life after field placement and compaction.<br />
B.5 Significance and use<br />
5.1 The long-term <strong>aging</strong> practice simulates the in-service <strong>aging</strong> <strong>of</strong><br />
<strong>asphalt</strong> concrete mixes after field placement and compaction.<br />
5.2 The properties and per<strong>for</strong>mance <strong>of</strong> <strong>asphalt</strong> concrete mixes and<br />
pavements may be more accurately predicted by using aged test samples.<br />
B.6 Apparatus<br />
6.1 Aging Test System - A low pressure oxidation cell and oxygen<br />
supply system which are capable <strong>of</strong> passing oxygen at a constant flow rate through<br />
a compacted <strong>asphalt</strong> concrete specimen and meet the requirements specified in<br />
Table B.1. The oxygen supply system (0 to 690 kPa (0 to 100 psi)) shall be<br />
equipped with a suitable pressure regulator and gage. The low pressure oxidation<br />
cell shall be equipped with the following:<br />
Table B.1. Minimum <strong>aging</strong> test system requirements<br />
Range Resolution Accuracy<br />
Oxygen Flow Control 1-10 scfh
6.1.2 Specimen End Platens as shown in Figure B.2. The top specimen<br />
end platen shall be equipped will connections to provide <strong>for</strong> the flow<br />
<strong>of</strong> oxygen through the test specimen.<br />
6.1.3 Per<strong>for</strong>ated Teflon Disks as shown in Figure B.3.<br />
6.2 Oven - Any oven which is thermostatically controlled and capable <strong>of</strong><br />
being set to maintain any desired temperature from room temperature to 260°C<br />
(500°F). The oven is used <strong>for</strong> heating <strong>aggregate</strong>s, <strong>asphalt</strong> binder, <strong>asphalt</strong> concrete<br />
mixes or laboratory equipment.<br />
6.3 Water Bath - A water bath which is at least 457 mm (18 in.) deep<br />
and is thermostatically controlled so as to maintain the bath at 85 ± 1°C (185° ±<br />
1.8°F). The tank requires a per<strong>for</strong>ated false bottom or to be equipped with a shelf<br />
<strong>for</strong> supporting specimens 51 mm (2 in.) above the bottom <strong>of</strong> the bath. The water<br />
bath should also be equipped such that a constant flow <strong>of</strong> water is available to<br />
replenish any water loss from evaporation. This will maintain a constant water<br />
level.<br />
6.4 Miscellaneous Apparatus :<br />
6.4.1 One shallow metal oven pan/sheet about 305 by 457 mm (12<br />
by 18 in.) <strong>for</strong> heating uncompacted <strong>asphalt</strong> concrete mixes<br />
6.4.2 Thermometers having a range from 50° to 260°C (122° to<br />
500°F) and con<strong>for</strong>ming to the requirements <strong>for</strong> ASTM<br />
Thermometer --: as prescribed in E 1<br />
.<br />
6.4.3 Waterpro<strong>of</strong> marking sticks <strong>for</strong> identifying specimens<br />
6.4.4 Paper labeling tags<br />
6.4.5 Metal spatula or spoon<br />
6.4.6 Oven gloves<br />
6.4.7 36 cm (14 in) long by 38 mm wide strip <strong>of</strong> butcher paper<br />
6.4.8 38 mm (1.5 in) <strong>of</strong> 102 mm (4 in) diameter rubber membrane<br />
6.4.9 152 mm (6 in) <strong>of</strong> 102 mm (4 in) diameter rubber membrane<br />
6.4.10 One specimen holder similar to that shown in Figure BA<br />
6.4.11 Two 102 mm (4 in) by 1/8 in thick 0-Rings<br />
B.7 Materials<br />
7.1 The following materials are required:<br />
7.1.1 Oxygen <strong>for</strong> Aging Test System<br />
7.1.2 Clear rubber silicone<br />
80
B.8 Hazards<br />
8.1 Warning This test method involves the handling <strong>of</strong> hot <strong>asphalt</strong><br />
binder, <strong>aggregate</strong> and <strong>asphalt</strong> concrete mixes which can cause severe burns if<br />
allowed to contact skin. Proper precautions must be taken to avoid burns.<br />
B.9 Sampling<br />
9.1 The <strong>asphalt</strong> concrete mixes shall be sampled in accordance with T<br />
168, or shall consist <strong>of</strong> specimens which have sampled and short-term aged in<br />
accordance with T ###<br />
9.2 Compacted roadway samples shall have a cut specimen size which is<br />
102 ± 6 mm (4 ± 0.25 in.) in diameter by 152 ± 6 mm (6 ± 0.25 in.) in height.<br />
B.10 Specimen preparation<br />
10.1 Compacting <strong>Laboratory</strong> Mix Samples<br />
10.1.1 Heat the <strong>asphalt</strong> concrete to the desired compaction<br />
temperature.<br />
10.1.2 Compact an amount <strong>of</strong> <strong>asphalt</strong> concrete mix sufficient to give<br />
the desired specimen size in accordance with T ###.<br />
NOTE 1 - Compact a sufficient amount <strong>of</strong> material to ensure that the final specimen size<br />
after 9.1.4 is 102 ± 6 mm in diameter by 152 ± 6 mm in height.<br />
10.1.3 Cool the compacted specimen to 60° ± 1°C (140° ±<br />
1.8°F).<br />
10.1.4 After cooling the specimen, apply a static load at a rate <strong>of</strong><br />
16,000 lb/min to a maximum <strong>of</strong> 5715 kg (12,6001b), then<br />
release the load at the same rate. This procedure is to level<br />
the ends <strong>of</strong> the specimen.<br />
10.1.5 After cooling the specimen to room temperature overnight,<br />
extrude the specimen from the compaction mold.<br />
10.2 Sealing Compacted <strong>Laboratory</strong> and Roadway Specimens<br />
10.2.1 Place the specimens in a specimen holder and apply a<br />
81
sufficient bead <strong>of</strong> silicone around the circumference <strong>of</strong> the<br />
specimen at mid height. Apply a large enough bead to<br />
uni<strong>for</strong>mly cover a 38 mm (1.5 in.) strip <strong>of</strong> the specimen at<br />
mid height. Cover the bead with the 38-mm length <strong>of</strong><br />
cylindrical rubber membrane and mold the encapsulated<br />
silicone to a uni<strong>for</strong>m thickness with your fingers. Allow the<br />
specimen to stand at room temperature, overnight or longer,<br />
until the silicone is dry.<br />
10.3.1 After the silicone has dried, cover the exposed portions (i.e.<br />
portions not covered with the rubber membrane) <strong>of</strong> the<br />
specimen with 2 strips <strong>of</strong> butcher paper.<br />
NOTE 2 - Covering the exposed portions <strong>of</strong> the specimen is extremely important as large<br />
air voids or sharp edges may cause the rubber membrane to rupture under confining pressures at<br />
high temperatures. If the rubber membrane ruptures during testing, the specimen should be<br />
discarded.<br />
B.11 Procedure<br />
11.1 Place the 152-mm length <strong>of</strong> cylindrical rubber membrane around the<br />
specimen. Place one 0-ring around each end <strong>of</strong> the membrane to hold it in place<br />
over the specimen.<br />
11.2 Place a per<strong>for</strong>ated teflon disk on top <strong>of</strong> the grooved surface <strong>of</strong> the<br />
bottom end platen.<br />
11.3 Place the specimen vertically on top <strong>of</strong> the teflon disk and bottom<br />
end platen.<br />
11.4 Place a per<strong>for</strong>ated teflon disk on top <strong>of</strong> the specimen and place the<br />
top end platen on top <strong>of</strong> the disk.<br />
11.5 Place the specimen and platen assembly within the load frame and<br />
place the walls <strong>of</strong> the pressure vessel over the specimen.<br />
11.6 Connect the oxygen tubes between the top end platen and the top<br />
plate <strong>of</strong> the load frame. With the top plate <strong>of</strong> the load frame in place tighten the<br />
screws until the cell is sealed.<br />
11.7 Turn on the confining pressure within the cell and then turn on the<br />
oxygen flow. Stabilize the oxygen flow at 32 ± cm3/s (4 ± 0.5 Oh) and<br />
monitor the corresponding pressure. Monitor and adjust the confining pressure<br />
until it is 34 to 69 kPa (5 to 10 psi) greater than the oxygen pressure.<br />
82
11.8 Place the entire cell in a 85 ± 1°C (185° ± 1.8°F) bath <strong>for</strong> 5 days<br />
± 0.5 h. Periodically monitor the oxygen flow to ensure that there is a continuous<br />
supply.<br />
11.9 After 5 days, turn <strong>of</strong>f the oxygen flow and release the confining<br />
pressure. Remove the cell from the water bath and allow the entire assembly to<br />
cool to 25°C (77°F).<br />
11.10 Remove the specimen from the cell. Remove the rubber membranes<br />
and silicone from the specimen. The aged specimen is now ready <strong>for</strong> further<br />
testing as required.<br />
B.12 Report<br />
12.1 Report the following in<strong>for</strong>mation:<br />
12.1.1 Asphalt Binder Grade<br />
12.1.2 Asphalt Binder Content in percent to the nearest 0.1 percent<br />
12.1.3 Aggregate Type and Gradation<br />
12.1.4 Short-Term Aging Conditions the following in<strong>for</strong>mation as<br />
applicable:<br />
12.1.4.1 Plant Mixing Temperature in °C to the nearest<br />
1°C<br />
12.1.4.2 <strong>Laboratory</strong> Mixing Temperature - in °C to the<br />
nearest 1°C<br />
12.1.4.3 Short-Term Aging Temperature in <strong>Laboratory</strong> in<br />
°C to the nearest 1°C<br />
12.1.4.4 Short-Term Aging Duration in <strong>Laboratory</strong> in min<br />
to the nearest 1 min<br />
12.1.5 Compaction Temperature in °C to the nearest 1°C<br />
12.1.6 Compacted Specimen Height - in mm to the nearest 1 mm<br />
12.1.7 Compacted Specimen Diameter - in mm to the nearest 1 mm<br />
83
12.1.8 Compacted Specimen Density - in kg/m2 to the nearest 1 kg/m2<br />
12.1.9 Compacted Specimen Air Voids in percent to the nearest 0.1<br />
percent<br />
cm3/s<br />
12.1.10 Long-Term Aging Oxygen Flow in cm3/s to the nearest 236<br />
12.1.11 Long-Term Aging Oxygen Pressure in kPa to the nearest 69<br />
kPa (10 psi)<br />
12.1.12 Long-Term Aging Confining Pressure in Kpa to the nearest 6.9<br />
kPa (1 psi)<br />
12.1.13 Long-Term Aging Duration in min to the nearest 1 min<br />
12.1.14 Long-Term Aging Bath Temperature in °C to the nearest 1°C<br />
B.13 Keywords<br />
13.1 Asphalt concrete, bituminous mixes, bituminous paving mixes, <strong>aging</strong>,<br />
long-term <strong>aging</strong>, <strong>asphalt</strong> concrete <strong>aging</strong>, low pressure oxidation cell.<br />
84
Appendix C<br />
Long-Term Aging <strong>of</strong> Asphalt Concrete Mixes<br />
by Long-Term Oven Aging<br />
Standard Practice <strong>for</strong><br />
85<br />
SHRP #1031<br />
Long-Term Aging <strong>of</strong> Asphalt Concrete Mixes by Long-Term<br />
Oven Aging<br />
C.1 Scope<br />
AASHTO DESIGNATION: T ###-YY<br />
(ASTM DESIGNATION: D ####-YY)<br />
1.1 This standard is used to simulate the long-term <strong>aging</strong> <strong>of</strong> <strong>asphalt</strong><br />
concrete mixes. Long-term <strong>aging</strong> considers the total <strong>aging</strong> undergone by<br />
compacted <strong>asphalt</strong> concrete mixes during a service life <strong>of</strong> 5 to 10 years.<br />
1.2 This standard may involve hazardous materials, operations and<br />
equipment. This standard does not purport to address all <strong>of</strong> the safety<br />
problems associated with its use. It is the responsibility <strong>of</strong> the user <strong>of</strong> this<br />
standard to establish appropriate safety and health practices and determine the<br />
applicability <strong>of</strong> regulatory limitations prior to use.<br />
1.3 The values stated in SI units are to be regarded as the standard. The<br />
values in parentheses are <strong>for</strong> in<strong>for</strong>mation only.<br />
C.2 Referenced documents<br />
2.1 AASHTO Documents:<br />
M ### Specification <strong>for</strong> Per<strong>for</strong>mance Graded Asphalt Binders<br />
R 11 Practice <strong>for</strong> Indicating Which Places <strong>of</strong> Figures are to<br />
be Considered Significant in Specifying Limiting<br />
Values<br />
T 27 Method <strong>for</strong> Sieve Analysis <strong>of</strong> Fine and Coarse<br />
Aggregates<br />
T 164 Method <strong>for</strong> Quantitative Extraction <strong>of</strong> Bitumen from<br />
Paving Mixes<br />
T 168 Method <strong>of</strong> Sampling Bituminous Paving Mixes
T 201 Method <strong>for</strong> Kinematic Viscosity <strong>of</strong> Asphalts<br />
T 269 Method <strong>for</strong> Percent Air Voids in Compacted Dense<br />
and Open Bituminous Paving Mixes<br />
T ### Practice <strong>for</strong> Short-Term Aging <strong>of</strong> Asphalt Concrete<br />
Mixes<br />
T ### Method <strong>for</strong> Preparation <strong>of</strong> Asphalt Concrete<br />
Specimens by Means <strong>of</strong> the SHRP Gyratory<br />
Compactor<br />
T ### Method <strong>for</strong> Preparation <strong>of</strong> Asphalt Concrete<br />
Specimens by Means <strong>of</strong> the Rolling Wheel Compactor<br />
2.2 ASTM Documents:<br />
C.3 Terminology<br />
D 8 Standard Definitions <strong>of</strong> Terms Relating to Materials<br />
<strong>for</strong> Roads and Pavements<br />
D 3549 Method <strong>for</strong> Thickness or Height <strong>of</strong> Compacted<br />
Bituminous Paving Mix Specimens<br />
E 1 Specification <strong>for</strong> Thermometers<br />
3.1 Desired Compaction Temperature The target temperature <strong>for</strong><br />
compacting <strong>asphalt</strong> concrete mixes in the laboratory. The desired compaction<br />
temperature selected should be equivalent to the anticipated field compaction<br />
temperature. If field compaction temperatures are unknown, select a compaction<br />
temperature which corresponds to a kinematic viscosity <strong>of</strong> 665 ± 80 cS <strong>for</strong> the<br />
<strong>asphalt</strong> binder which is used.<br />
3.2 Definitions <strong>for</strong> many terms common to <strong>asphalt</strong> are found in the<br />
following documents:<br />
3.2.1 Standard Definitions D 8<br />
3.2.2 Per<strong>for</strong>mance Graded Asphalt Binder M ###<br />
3.2.3 Short-Term Aging <strong>of</strong> Asphalt Concrete Mixes T ###<br />
3.2.4 Kinematic Viscosity <strong>of</strong> Asphalts T 201<br />
C.4 Summary <strong>of</strong> practice<br />
4.1 A compacted mix <strong>of</strong> <strong>aggregate</strong> and <strong>asphalt</strong> binder is aged in a <strong>for</strong>ced<br />
draft oven <strong>for</strong> 5 days at 85°C (185°F). The oven <strong>aging</strong> is designed to simulate the<br />
total <strong>aging</strong> the compacted mix will undergo during a 5 to 10 year service life after<br />
field placement and compaction.<br />
86
C.5 Significance and use<br />
5.1 The long-term <strong>aging</strong> practice simulates the in service <strong>aging</strong> <strong>of</strong><br />
<strong>asphalt</strong> concrete mixes after field placement and compaction.<br />
5.2 The properties and per<strong>for</strong>mance <strong>of</strong> <strong>asphalt</strong> concrete mixes and<br />
pavements may be more accurately predicted by using aged test samples.<br />
C.6 Apparatus<br />
6.1 Aging Test System A system which consists <strong>of</strong> a <strong>for</strong>ced draft oven<br />
which possesses the requirements specified in Table C.1.<br />
Table C.1. Minimum <strong>aging</strong> test system requirements<br />
Range, °C Resolution, °C Accuracy, °C<br />
Temperature Measurement 10 260 < 1 ± 1<br />
Temperature Control 25 250
C.8 Sampling<br />
8.1 Field <strong>asphalt</strong> concrete mixes shall be sampled in accordance with T<br />
168. <strong>Laboratory</strong> prepared <strong>asphalt</strong> concrete mixes shall be prepared and short-term<br />
aged in accordance with T-###.<br />
8.2 Compacted roadway samples shall have a cut specimen size which is<br />
102 ± 6 mm (4 ± 0.25 in.) in diameter by 152 ± 6 mm (6 ± 0.25 in.) in height.<br />
C.9 Specimen preparation<br />
9.1 Uncompacted <strong>Laboratory</strong> Mix Samples<br />
9.1.1 Heat the <strong>asphalt</strong> concrete to the desired compaction temperature.<br />
9.1.2 Compact a sufficient amount <strong>of</strong> mix to give the desired specimen<br />
size in accordance with T ###.<br />
NOTE 1 - Compact a sufficient amount <strong>of</strong> material to ensure that the final specimen size<br />
after 9.1.4 is 102 ± 6 mm in diameter by 152 ± 6 mm in height.<br />
9.1.3 Cool the compacted specimen to 60° ± 1°C (140° ± 1.8°F) in an<br />
oven set at 60°C (140°F). This will take approximately 2 h <strong>for</strong> a specimen that is<br />
102 ± 6 mm in diameter by 152 ± 6 mm in height.<br />
9.1.4 After cooling the specimen, apply a static load at a rate <strong>of</strong> 16,000<br />
lb/min to a maximum value <strong>of</strong> 5715 kg (12,600 lb), then release the load at the<br />
same rate. This procedure is to level the ends <strong>of</strong> the specimen.<br />
9.1.5 After cooling the specimen at room temperature overnight, extrude<br />
the specimen from the compaction mold.<br />
C.10 Procedure<br />
10.1 Place the compacted specimen on a rack in the <strong>for</strong>ced draft oven <strong>for</strong><br />
120 ± 0.5 h at a temperature <strong>of</strong> 85° ± 1°C (185°C ± 1.8°F).<br />
10.2 After 120 h, turn the oven <strong>of</strong>f, open the doors and allow the<br />
specimen to cool to room temperature. Do not touch or remove the specimen until<br />
it has cooled to room temperature. It will take approximately overnight to cool a<br />
specimen that is 102 ± 6 mm in diameter by 152 ± 6 mm in height.<br />
88
10.3 After cooling to room temperature, remove the specimen from the<br />
oven. The aged specimen is now ready <strong>for</strong> testing as required.<br />
C.11 Report<br />
11.1 Report the following in<strong>for</strong>mation:<br />
11.1.1 Asphalt Binder Grade<br />
11.1.2 Asphalt Binder Content in percent to the nearest 0.1<br />
percent<br />
11.1.3 Aggregate Type and Gradation<br />
11.1.4 Short-Term Aging Conditions the following in<strong>for</strong>mation as<br />
applicable:<br />
Mtn<br />
kg/m2<br />
11.1.4.1 Plant Mixing Temperature - in °C to the nearest 1°C<br />
11.1.4.2 <strong>Laboratory</strong> Mixing Temperature in °C to the nearest<br />
1°C<br />
11.1.4.3 Short-Term Aging Temperature in <strong>Laboratory</strong> in °C<br />
to the nearest 1°C<br />
11.1.4.4 Short-Term Aging Duration in <strong>Laboratory</strong> in min to<br />
the nearest 1 min<br />
11.1.5 Compaction Temperature in °C to the nearest 1°C<br />
11.1.6 Compacted Specimen Height in mm to the nearest 1 mm<br />
11.1.7 Compacted Specimen Diameter - in mm to the nearest 1<br />
11.1.8 Compacted Specimen Density in kg/m2 to the nearest 1<br />
11.1.9 Compacted Specimen Air Voids - in percent to the nearest<br />
0.1 percent<br />
11.1.10 Long-Term Aging Temperature in °C to the nearest 1°C<br />
89
11.1.11 Long-Term Aging Duration in min to the nearest 1 min<br />
C.12 Keywords<br />
12.1 Asphalt concrete, bituminous mixes, bituminous paving mixes, <strong>aging</strong>,<br />
long-term <strong>aging</strong>, <strong>asphalt</strong> concrete <strong>aging</strong>.<br />
90
Appendix D<br />
Detailed Resilient Modulus Results<br />
91
AGGREGATE -RC<br />
MODUWS (161)<br />
1.600<br />
u1ED<br />
IVA<br />
LP 116<br />
1.400 LP800<br />
111E6<br />
1.200<br />
1.000<br />
800<br />
IMO<br />
400<br />
200<br />
LIC1100<br />
06 7 b 9<br />
% VOIDS<br />
AGGREGATE - RD<br />
MODULUS (kat)<br />
10 6 7 8 9<br />
% VOIDS<br />
AGGREGATE - RH<br />
MODULUS (ksl)<br />
A A. c<br />
cm Non"<br />
10 6 7 e 9<br />
% VOIDS<br />
AGGREGATE - Rd<br />
MODULUS (ksi)<br />
10 6 7 9 9<br />
% VOIDS<br />
Figure D.1 Diametral Modulus: Long-Term Oven and Low-Pressure Oxidation Aging with Short-Term Oven<br />
Aging--Asphalt AAA-1.<br />
to
AGGREGATE - RC<br />
moomus peso<br />
1.800<br />
1.400<br />
1,200<br />
1.000<br />
800<br />
000<br />
400<br />
200<br />
7 a<br />
%VOIDS<br />
AGGREGATE - RD<br />
MODULUS NO<br />
0<br />
0<br />
I Mal<br />
0 0<br />
10 6 7 8 a<br />
%vows<br />
10 6 7<br />
AGGREGATE - RH<br />
MODULUS NO<br />
0<br />
1110<br />
A A o<br />
% VOIDS<br />
AGGREGATE - RJ<br />
DIAMETRAL MODULUS (1151)<br />
10 6 7 a 9<br />
% VOIDS<br />
Figure D.2 Diametral Modulus: Long-Term Oven and Low-Pressure Oxidation Aging with Short-Term Oven<br />
Aging--Asphalt A AB-1.<br />
10
AGGREGATE - RC<br />
MODUW 8 (kW)<br />
1,600<br />
111416133<br />
W OA<br />
LPI183<br />
1,400 IP811/<br />
1,200<br />
1,000<br />
800<br />
1.71215<br />
1/01100<br />
AGGREGATE - RD<br />
MODULUS(b1)<br />
600 0 0 fib<br />
400<br />
200<br />
0 6 7 8 9<br />
% VOIDS<br />
0<br />
A<br />
Ms<br />
10 6 7 8<br />
% VOIDS<br />
AGGREGATE - RH<br />
MODULUS Oat°<br />
O 0 o<br />
10 6 7<br />
% VOIDS<br />
10 6 7<br />
AGGREGATE - RJ<br />
DIAMETRAL MODULUS (W)<br />
0 p 0 AAA<br />
ow<br />
Figure D.3 Diametral Modulus: Long-Term Oven and Low-Pressure Oxidation Aging with Short-Term Oven<br />
Aging--Asphalt AAC-1.<br />
% VOIDS<br />
10
MODULUS (10:31)<br />
1.600<br />
1400<br />
1200<br />
1.000<br />
SOO<br />
eoo<br />
403<br />
AGGREGATE - RC AGGREGATE - RD AGGREGATE - RH AGGREGATE - RJ<br />
1701100<br />
0<br />
0<br />
iter<br />
MODULUS 030<br />
MODULUS (1.30<br />
. P<br />
o<br />
203 up D<br />
os<br />
7 6 9<br />
% VOIDS<br />
10 6 7<br />
% VOIDS<br />
10<br />
7<br />
% VOIDS<br />
0<br />
MODULUS (ks)<br />
10 7 8 9<br />
% VOIDS<br />
Figure D.4 Diametral Modulus: Long-Term Oven and Low-Pressure Oxidation Aging with Short-Term Oven<br />
Aging--Asphalt AAD-1.<br />
10
MODULUS (kb)<br />
1,800<br />
U"TED<br />
81r<br />
1,400 Lir<br />
IPS.)<br />
1.1t 110<br />
1,200<br />
AGGREGATE -RC AGGREGATE - RD AGGREGATE - RH AGGREGATE - RJ<br />
LT01100<br />
1.000 A A<br />
A<br />
0 o<br />
A<br />
800<br />
000<br />
400<br />
200<br />
0 8 7 8<br />
%VOIDS<br />
O<br />
MODULUS (1(S)<br />
A AA<br />
0<br />
10 0 7 8 9<br />
% VOIDS<br />
10<br />
MODULUS 004 MODULUS (ksi)<br />
0<br />
A A 0<br />
Lit<br />
<strong>of</strong><br />
/4 VOIDS<br />
10 6 7 8 G<br />
Figure D.5 Diametral Modulus: Long-Term Oven and Low-Pressure Oxidation Aging with Short-Term Oven<br />
Aging--Asphalt AAF-1.<br />
% VOIDS<br />
10
MODULUS (101)<br />
1,603<br />
1,400<br />
1,200<br />
LOCO<br />
030<br />
eoo<br />
400<br />
200<br />
Os<br />
AGGREGATE-RC AGGREGATE-RD AGGREGATE-RH AGGREGATE - RJ<br />
OA<br />
MODULUS 000 MODULUS OW) MODULUS (100<br />
0<br />
0 A oir<br />
ao 0<br />
00<br />
1111<br />
9 10 12 6 7 6 9 10 6 7 6 9 10 6 7 6 9 10<br />
%VOIDS %VOIDS %VOIDS %VOIDS<br />
Figure D.6 Diametral Modulus: Long-Term Oven and Low-Pressure Oxidation Aging with Short-Term Oven<br />
Aging--Asphalt AAG-1.<br />
A<br />
A<br />
on<br />
0<br />
0
AGGREGATE - RC<br />
MODULUS (ks<br />
1.600<br />
1.400<br />
1200<br />
11:00<br />
600<br />
400<br />
200<br />
A<br />
7 o 9<br />
% V0108<br />
A<br />
O<br />
0<br />
AGGREGATE - RD<br />
MODULUS (Iag)<br />
A<br />
A °.<br />
0<br />
10 6 7 8 9<br />
% VOIDS<br />
AGGREGATE - RH<br />
MODULUS Ocs1)<br />
1111<br />
A 0<br />
di<br />
10 6 7 8 9<br />
lc VOIDS<br />
AGGREGATE - RJ<br />
MODULUS (Icsi)<br />
A<br />
0<br />
III<br />
10 6 7 8 9<br />
% VOIDS<br />
Figure D.7 Diametral Modulus: Long-Term Oven and Low-Pressure Oxidation Aging with Short-Term Oven<br />
Aging--Asphalt AAK-1.<br />
A<br />
10<br />
00
MODULUS (Ics6<br />
1.600<br />
1.400<br />
1200<br />
1.000<br />
803<br />
603<br />
400<br />
200<br />
AGGREGATE - RC<br />
11.111<br />
gfir<br />
ILPr<br />
U.8110<br />
11%116<br />
uraroo<br />
0 6 7<br />
ak tit<br />
o°<br />
MI<br />
0 0<br />
% VOIDS<br />
AGGREGATE - RD<br />
MODULUS (kal)<br />
A ty<br />
milm_<br />
10 6 7 6 9<br />
% VOIDS<br />
AGGREGATE - RH<br />
MODULUS pcs1)<br />
0 0<br />
.ak<br />
Aw7<br />
A 0<br />
1441<br />
10 4 5 6 7<br />
% VOIDS<br />
AGGREGATE - RJ<br />
MODULUS (Icsi)<br />
t A<br />
Otin,<br />
al 111:<br />
8 6 7 8 9<br />
% VOIDS<br />
Figure D.8 Diametral Modulus: Long-Term Oven and Low-Pressure Oxidation Aging with Short-Term Oven<br />
AgingAsphalt AAM-1.<br />
10<br />
.0
Appendix E<br />
Tensile Strength Test Results<br />
Test Procedure<br />
The indirect tensile strength test is a test to determine the maximum strength <strong>of</strong> an<br />
<strong>asphalt</strong> concrete specimen. During the test, the specimen is loaded in the vertical<br />
diametral plane as <strong>for</strong> the diametral resilient modulus test. The specimen is loaded<br />
to failure at a set de<strong>for</strong>mation rate <strong>of</strong> 50 mm (2 in.) per minute. The<br />
measurements recorded during the test are load and de<strong>for</strong>mation in the horizontal<br />
direction. The ultimate load and the horizontal de<strong>for</strong>mation or strain level at the<br />
maximum load and reported. From the ultimate load the tensile strength can be<br />
calculated from:<br />
2 P it<br />
Tensile Strength "<br />
rc t D<br />
where:<br />
Materials<br />
Pa = ultimate load<br />
t = Specimen thickness, and<br />
D = Specimen diameter<br />
A mini study was completed using materials from the SHRP A-002A validation<br />
program. A selection <strong>of</strong> specimens from the materials used to conduct a dynamic<br />
mechanical analysis (Appendix H) study were used <strong>for</strong> the tensile strength analysis.<br />
Specimens were selected from a group <strong>of</strong> six <strong>asphalt</strong>-<strong>aggregate</strong> combinations.<br />
Aggregate RC and RH along with <strong>asphalt</strong>s AAD-1, AAF-1 and AAM-1.<br />
One specimen from each <strong>of</strong> the following <strong>aging</strong> levels was chosen to be tested:<br />
unaged, low pressure oxidation at 60° and 85°C (140° and 185°F), and long-term<br />
oven <strong>aging</strong> at 85° and 100°C (185° and 212°F). This resulted in 5 specimens<br />
from each <strong>asphalt</strong> <strong>aggregate</strong> group <strong>for</strong> a total <strong>of</strong> 30 specimens.<br />
Results<br />
Table G.1 shows a summary <strong>of</strong> the data collected <strong>for</strong> each specimen. Tensile<br />
strength, strain at yield, and diametral resilient modulus are the parameters that<br />
will be evaluated here.<br />
100
As shown in Tables 2-4, the diametral resilient modulus ranks the <strong>asphalt</strong>s, in<br />
order <strong>of</strong> most severe <strong>aging</strong>, AAD-1 > AAM-1 > AAF-1 in all cases. The<br />
rankings <strong>of</strong> the <strong>asphalt</strong>s according to the tensile strength are AAD-1 > AAF-1 ><br />
AAM-1 in all but one case. These rankings are different than the rankings based<br />
on modulus. The rankings based on the strain at yield have no distinct pattern <strong>of</strong><br />
rankings.<br />
Discussion<br />
It should be noted that this study was conducted with only one specimen at each<br />
conditioning level. It would be more useful to have more specimens tested at each<br />
level so that a more thorough statistical analysis could be run. Table 1 shows that<br />
the values <strong>for</strong> tensile strength <strong>for</strong> <strong>asphalt</strong>s AAF-1 and AAM-1 appear to be rather<br />
close in all cases. With a more thorough statistical analysis, these differences may<br />
be shown to be not significantly different; the analysis would show that only<br />
<strong>asphalt</strong> AAD-1 is different from both AAF-1 and AAM-1.<br />
Asphalts AAF-1 and AAM-1 are both classified as AC-20 <strong>asphalt</strong>s. The data<br />
collected from the tensile strength test show that these two <strong>asphalt</strong>s are very similar<br />
in tensile strength ratios. This would tend to show that the tensile strength test is<br />
not as sensitive as the resilient modulus test to the <strong>aging</strong> condition or, maybe to the<br />
<strong>asphalt</strong>-<strong>aggregate</strong> interaction.<br />
Conclusions<br />
1. The tensile strength test can use <strong>aging</strong> ratios to distinguish between different<br />
<strong>asphalt</strong>s mixed with the same <strong>aggregate</strong>.<br />
2. The tensile strength test may not be sensitive enough to rank <strong>asphalt</strong>s<br />
according to <strong>aging</strong> susceptibility.<br />
3. More specimens should be tested so that a more thorough statistical analysis<br />
may be per<strong>for</strong>med.<br />
101
Table E.1. Tensile strength test results<br />
Aging Sample Thickness Air Tensile Final Strain<br />
ID (in) Voids<br />
(%)<br />
Strength<br />
(psi)<br />
Modulus<br />
(ksi)<br />
at Yield<br />
(p-strain)<br />
LPO 85 1DCMSL 4.608 9.3 196 645 2085<br />
LPO 60 3DCMSL 4.615 9.6 135.5 450 2073<br />
LTOA 85 5DCMSL 4.587 8.9 181 615 1926<br />
LTOA 100 7DCMSL 4.626 9.3 156.5 611 2147<br />
BASE 11DCMB 4.573 8.5 87.9 182 3067<br />
LPO 85 1FCMSL 4.593 9.3 259.4 891 1141<br />
LPO 60 3FCMSL 4.509 7.8 264 898 1423<br />
LTOA 85 5FCMSL 4.585 9 233.4 943 2208<br />
LTOA 100 7FCMSL 4.576 9.1 220.1 1004 810<br />
BASE 11FCMB 4.591 9.1 185.5 458 1914<br />
LPO 85 1MCMSL 4.588 8.9 163.6 763 1298<br />
LPO 60 3MCMSL 4.55 8 157.8 580 1055<br />
LTOA 85 5MCMSL 4.583 8.5 156.4 796 1704<br />
LTOA 100 7MCMSL 4.626 9.2 140.9 750 1177<br />
BASE 11MC MB 4.568 7.9 120.4 346 2624<br />
Aging Sample Thickness Air Tensile Final Strain<br />
ID (in) Voids Strength Modulus at Yield<br />
( %) (psi) (ksi) (p-strain)<br />
LPO 85 1DHMSL 4.091 6.3 185.1 553 2564<br />
LPO 60 3DHMSL 4.294 8.9 127.1 316 3853<br />
LTOA 85 5DHMSL 4.277 8 138.5 385 4638<br />
LTOA 100 7DHMSL 4.209 6.6 131.1 348 2539<br />
BASE 11DHMB 4.198 5.6 100.8 174 5521<br />
LPO 85 1FHMSL 4.217 6.9 288.8 982 1937<br />
LPO 60 3FHMSL 4.214 7.4 264.9 1014 1802<br />
LTOA 85 5FHMSL 4.18 6.6 259.7 918 1975<br />
LTOA 100 7FH MSL 4.236 7.5 230 855 1377<br />
BASE 11FHMB 4.188 6.5 215 673 3299<br />
LPO 85 1MHMSL 4.207 6.8 169.8 563 1890<br />
LPO 60 3MHMSL 4.222 7.1 149.5 521 2810<br />
LTOA 85 5MHMSL 4.219 6.6 154.6 479 2932<br />
LTOA 100 7MHMSL 4.252 7.1 146.5 560 2847<br />
BASE 11 MHMB 4.145 4.6 140.4 338 4675<br />
102
Appendix F<br />
Dynamic Mechanical Analysis<br />
Test Method<br />
Dynamic mechanical analysis (DMA) and other methods <strong>of</strong> rheological testing have<br />
been used to characterize the mechanical behavior <strong>of</strong> <strong>asphalt</strong> binders and<br />
<strong>asphalt</strong>-<strong>aggregate</strong> mixes (Christensen and Anderson 1992; Tayebali et al. 1990 and<br />
1991; and Goodrich 1991). The concept <strong>of</strong> DMA has been described by C<strong>of</strong>fman<br />
et al. (1964) and by Sisko and Brunstrum (1968). DMA can characterize the linear<br />
viscoelastic behavior <strong>of</strong> <strong>asphalt</strong> binders and mixes by using a time-temperature<br />
superposition method. This is described by the time-dependent response<br />
(trans<strong>for</strong>med or master curve) and the temperature-dependent response (shift<br />
factors curve) (Christensen and Anderson 1992). The responses measured by<br />
DMA in a triaxial mode <strong>of</strong> testing are complex modulus (Es), storage modulus<br />
(E'), loss modulus (E"), and loss tangent (tan delta), as Figure F.1 shows.<br />
Papazian (1962) indicated that these dynamic moduli can provide insights into the<br />
time dependence <strong>of</strong> a material's response and can explain a material's behavior<br />
under varying loading rates and durations. For this reason, DMA was used to<br />
investigate the change in viscoelastic behavior <strong>of</strong> <strong>asphalt</strong>-<strong>aggregate</strong> mixes after<br />
accelerated laboratory <strong>aging</strong>.<br />
Test Procedures<br />
DMA was per<strong>for</strong>med using a modified triaxial mode <strong>of</strong> testing. A repeated axial<br />
load, with no confining pressure, was applied to a specimen using a method similar<br />
to the standard test method <strong>for</strong> dynamic modulus <strong>of</strong> <strong>asphalt</strong> mixes (ASTM<br />
D3497-79). The repeated load was a sinusoidal wave <strong>for</strong>m applied with a<br />
sequence <strong>of</strong> frequencies from 15 to 0.01 Hz at temperatures from 0 to 40°C (32°<br />
to 104°F). The frequency sweep was per<strong>for</strong>med from the highest frequency to the<br />
lowest frequency, beginning with the coldest temperature and proceeding to the<br />
warmer temperatures. Load and vertical de<strong>for</strong>mation were monitored during the<br />
test. Load was measured by a load cell at the bottom <strong>of</strong> the specimen. Vertical<br />
de<strong>for</strong>mation was measured by two linear voltage differential transducers (LVDTs)<br />
attached to the side <strong>of</strong> the specimen with a set <strong>of</strong> yokes (Figure F.2).<br />
The yokes were separated by four 2 in. spacers be<strong>for</strong>e they were glued with<br />
superglue to the specimen. The glue was allowed to set <strong>for</strong> 10 min at room<br />
temperature [25°C (77°F)] be<strong>for</strong>e the specimen was cooled to 0°C (32°F) in an<br />
environmental cabinet. A specimen with an imbedded thermocouple was also<br />
installed in the cabinet as a control specimen. When the control specimen reached<br />
0°C (32°F), the other specimens in the environmental cabinet were ready <strong>for</strong><br />
testing. A frequency sweep on a specimen takes about 25 min <strong>for</strong> each<br />
temperature.<br />
103
STRESS<br />
STRAIN<br />
TIME<br />
..011- PHASE SHIFT ANGLE<br />
Figure F.1. Dynamic mechanical analysis (Goodrich 1991)<br />
104<br />
COMPLEX MODULUS<br />
,*1 Peak Stress<br />
I Peak Strain<br />
STORAGE MODULUS<br />
E = E* I cos 5<br />
LOSS MODULUS<br />
E= le 'sin 6<br />
LOSS TANGENT<br />
tan 6 = E"/E'<br />
E<br />
E<br />
II
After the test at 0°C (32°F) was completed, the specimen was placed in an<br />
environmental cabinet set at 25°C (77°F). The control specimen was again used to<br />
monitor the temperature <strong>of</strong> the specimens in the environmental cabinet. As be<strong>for</strong>e,<br />
once the control specimen reached the next test temperature, the other specimens<br />
were ready <strong>for</strong> testing.<br />
During the test program, the load cell and LVDTs were calibrated at various<br />
temperatures. It was found that the calibration factors were constant within the<br />
range <strong>of</strong> testing temperatures.<br />
This test was non-destructive with the total recoverable de<strong>for</strong>mation limited to 200<br />
s-inches at both the lowest frequency (0.01 Hz) and highest test temperature [40°C<br />
(104°F)]. The test was per<strong>for</strong>med by adjusting the load to produce a recoverable<br />
strain <strong>of</strong> 25 kt-strain at 1 Hz. The stress required to induce the 25 p-strain at 1 Hz<br />
was used as the applied stress throughout the frequency sweep test. This ensured<br />
that the strain level did not exceed 100 s-strain at any other frequency or<br />
temperature. A procedure to control the strain at, <strong>for</strong> example, 100 /i-strain,<br />
would be preferable but more difficult to achieve.<br />
The test is per<strong>for</strong>med on an MTS servo-hydraulic semi-closed sloop control<br />
system. The data acquisition and analysis is per<strong>for</strong>med on a high-speed personal<br />
computer. The computer s<strong>of</strong>tware controls the MTS machine during the frequency<br />
sweep and saves the data to a file. The data was then processed to generate the<br />
dynamic moduli and phase angles.<br />
Test analysis<br />
The fundamental material responses obtained from DMA, characterizing the<br />
viscoelastic behavior <strong>of</strong> the materials as a function <strong>of</strong> frequency (loading time) and<br />
temperature, are the dynamic moduli: the complex modulus, the storage modulus,<br />
and the loss modulus. The loss tangent is calculated from the ratio <strong>of</strong> the storage<br />
modulus to the loss modulus. The dynamic moduli results are trans<strong>for</strong>med to a<br />
standard temperature, in this case 25°C (77°F), by using the time-temperature<br />
superposition principle to create a master curve. The general process <strong>of</strong><br />
trans<strong>for</strong>ming data to develop the master curve is illustrated in Figure F.3<br />
(Stephanos 1990).<br />
Figure F.4 shows a master curve constructed from DMA per<strong>for</strong>med on a<br />
short-term aged specimen. Data collected at 0°C (32°F) has been shifted to the<br />
right into higher frequency ranges while data at 40°C (104°F) has been shifted to<br />
the left into lower frequency ranges. The points thus line up to make a smooth<br />
sigmoidal curve that includes frequencies outside the original test range. Figure<br />
F.5 shows a plot <strong>of</strong> phase shift versus temperature <strong>for</strong> the data illustrated in Figure<br />
105
Lead to Signal<br />
Conditioner<br />
Yoke<br />
Lead to Signal<br />
Conditioner<br />
Lvdt<br />
Loading Piston<br />
Specimen<br />
I I<br />
Figure F.2. Unconfined triaxial modulus test<br />
Lead to Signal<br />
Conditioner<br />
Lvdt<br />
Adjustment<br />
Screw<br />
Teflon<br />
AI,/ Disk<br />
Load cell<br />
106
Log E<br />
cn<br />
1:3<br />
0<br />
2<br />
A<br />
ta<br />
Load Time tb Log time<br />
a. Modulus versus time in log-log space<br />
Log E<br />
co<br />
0<br />
2<br />
A<br />
T2<br />
ta tb Log time<br />
Alpha, a<br />
0<br />
b. Alpha versus temperature<br />
Log<br />
T2 Temperature<br />
a lag<br />
Co Adjusted time =<br />
0 T1<br />
Load Adjusted Time Load Time<br />
c. Master curve in log-log space d. Calculation <strong>of</strong> adjusted time<br />
t1<br />
Ts<br />
t1<br />
10 a<br />
Log time<br />
Figure F.3. Procedure <strong>for</strong> trans<strong>for</strong>ming modulus data to the master stiffness curve (Stephanos 1990).
F.4. Phase shift curves are unique <strong>for</strong> each specimen because they describe the<br />
amount <strong>of</strong> shift <strong>for</strong> each specimen at each test temperature. They are used to<br />
produce trans<strong>for</strong>med plots <strong>for</strong> each DMA parameter, e.g., complex modulus or<br />
phase angle, <strong>for</strong> any temperature within the range tested. In this study,<br />
trans<strong>for</strong>mations to 25°C (77°F) were used.<br />
Experiment Design<br />
The DMA procedure was run on a subset <strong>of</strong> the materials used in the validation <strong>of</strong><br />
the A-002A hypothesis. Six <strong>of</strong> the material combinations had all unaged,<br />
short-term aged, and long-term aged specimens subjected to the DMA procedure.<br />
Another 18 material combinations subjected only the unaged specimens and the<br />
100°C (212°F) <strong>for</strong> 2 days long-term aged specimens to the DMA procedure.<br />
The specimens were tested be<strong>for</strong>e and after the long-term <strong>aging</strong> procedure <strong>for</strong> all<br />
<strong>of</strong> the tested combinations. This data, along with the data from the unaged<br />
specimens, will allow <strong>aging</strong> ratios to be determined based on the different DMA<br />
parameters. These ratios can then be used to rank the <strong>asphalt</strong>s in order as to their<br />
<strong>aging</strong> susceptibility. These rankings can then be compared with the rankings based<br />
on the diametral resilient modulus and with the rankings from the A-002A testing.<br />
Materials<br />
The six combinations <strong>for</strong> which all the specimens were tested were combinations <strong>of</strong><br />
<strong>aggregate</strong>s RC and RH mixed with <strong>asphalt</strong>s AAD-1, AAF-1, and AAM-1. The<br />
other combinations that were only partially tested used <strong>aggregate</strong>s RC, RD, RH,<br />
and RJ in combination with <strong>asphalt</strong>s AAA-1, AAD-1, AAF-1, AAG-1, AAK-1,<br />
and AAM-1.<br />
All <strong>of</strong> the specimens in this study were compacted with the Cali<strong>for</strong>nia Kneeding<br />
Compactor to a target void level <strong>of</strong> 8 percent. Most <strong>of</strong> the specimens were within<br />
± 1 percent <strong>of</strong> the target. The specimens were 4 in. in diameter by approximately<br />
4 in. tall.<br />
Results<br />
The data presented here are obtained from tests on <strong>aggregate</strong>s RC and RH mixed<br />
with <strong>asphalt</strong>s AAD-1, AAF-1, and AAM-1. Tests on other mix combinations have<br />
not yet been completed. The test specimens were compacted at a nominal target<br />
air voids <strong>of</strong> 8 percent. The percent air voids <strong>for</strong> each specimen are shown in<br />
Table F.1.<br />
108
MASTER CURVE<br />
5,000<br />
Asphalt: MD-1<br />
Aggregate: RC<br />
Trans<strong>for</strong>med temp.: 25°C<br />
2,000<br />
*<br />
0°C<br />
0 0<br />
-Y 1,000 * 0 o °<br />
0<br />
Poo-<br />
500<br />
0<br />
2<br />
N 200<br />
0_<br />
cop<br />
0<br />
Qs *<br />
0<br />
25°C<br />
40°C<br />
100<br />
0<br />
50 0 *<br />
0<br />
0 *<br />
0 0 *<br />
20<br />
1E-05 0.001 0.1 10 1,000 100,000<br />
Frequency (Hz)<br />
Figure F.4. Master curve <strong>for</strong> short-term oven aged specimen<br />
*
1E<br />
Co<br />
a)<br />
Co<br />
al<br />
0)<br />
0 (1)<br />
(2)<br />
(3)<br />
(4)<br />
0<br />
Asphalt: AAD-1<br />
Aggregate: RC<br />
Trans<strong>for</strong>m d temp.: 25°C<br />
Short-term oven <strong>aging</strong><br />
PHASE SHIFT CURVE<br />
5 10 15 20 25 30 35 40<br />
Temperature ( °C)<br />
Figure F.5. Phase shift curve <strong>for</strong> short-term aged specimen
Figures F.6 through F.12 are complex modulus versus frequency master curves<br />
and phase angle curves <strong>for</strong> unaged, short-term oven aged, and long-term aged<br />
specimens. The plots <strong>for</strong> unaged specimens were obtained from DMA per<strong>for</strong>med<br />
on three specimens. The plots <strong>for</strong> short-term oven aged specimens were obtained<br />
from tests per<strong>for</strong>med on the same pair <strong>of</strong> specimens which were subsequently<br />
long-term aged and retested. Since four long-term <strong>aging</strong> methods were evaluated,<br />
a total <strong>of</strong> eight specimens were aged <strong>for</strong> each <strong>asphalt</strong>-<strong>aggregate</strong> combination. Only<br />
data <strong>for</strong> long-term <strong>aging</strong> at 85°C (185°F) is shown here <strong>for</strong> conciseness.<br />
Table F.2 shows the diametral resilient modulus <strong>aging</strong> ratios <strong>for</strong> each <strong>aging</strong><br />
treatment. The <strong>aging</strong> ratio is defined as the ratio <strong>of</strong> the diametral resilient modulus<br />
<strong>of</strong> the aged specimen to the unaged specimen. The <strong>aging</strong> ratios are plotted in<br />
Figure F.13 to show the diametral resilient modulus rankings <strong>of</strong> <strong>asphalt</strong>-<strong>aggregate</strong><br />
combinations <strong>for</strong> each <strong>aging</strong> treatment. The complex moduli at frequencies <strong>of</strong><br />
0.001, 1, and 1000 Hz are shown in Table F.3. These values are obtained from<br />
the master curves trans<strong>for</strong>med at 25°C (77°F). Table F.4 shows the DMA<br />
complex modulus ratios <strong>of</strong> aged specimens to unaged specimens <strong>for</strong> each <strong>aging</strong><br />
treatment, collected at frequencies <strong>of</strong> 0.001, 1, and 1000 Hz. Figure F.14 shows<br />
the complex modulus rankings <strong>of</strong> the <strong>asphalt</strong>-<strong>aggregate</strong> combinations.<br />
Discussion<br />
Typical data obtained by Christensen and Anderson (1992) from DMA results on<br />
<strong>asphalt</strong> binders are shown in Figure F.15. A master curve <strong>for</strong> a typical <strong>asphalt</strong><br />
binder shows that the complex modulus approaches a limiting elastic value at high<br />
frequency at about 1 GPa (145 ksi). The modulus decreases monotonically as the<br />
frequency is reduced. The curve at very low frequencies usually slopes at a 1:1<br />
ratio, which indicates that viscous flow has been reached.<br />
Master curves <strong>of</strong> complex modulus versus frequency <strong>for</strong> <strong>asphalt</strong> mixes were<br />
constructed which showed similar trends to the master curves <strong>for</strong> <strong>asphalt</strong> binders at<br />
high frequencies. The master curves show that the complex modulus at high<br />
frequencies generally approaches a limiting value <strong>of</strong> about 5,000 ksi after<br />
long-term <strong>aging</strong> treatments. As the frequency is reduced, the complex modulus<br />
decreases from the highest frequency to the lowest frequency following the "S"<br />
curve. It appears as though each complex modulus curve could be modeled by a<br />
linear portion in the middle frequencies, showing viscous response, and by curved<br />
portions at high and low frequencies, where elastic behavior is approached. The<br />
tendency towards elastic behavior at low frequencies is very apparent <strong>for</strong> the<br />
unaged specimen and indicates that the <strong>aggregate</strong> is dominating the response.<br />
However, <strong>for</strong> the short-term aged specimens, the complex moduli are higher and<br />
the elastic response is less evident at low frequencies. The complex moduli are<br />
even higher <strong>for</strong> long-term <strong>aging</strong> curves,<br />
111
B<br />
><br />
g<br />
k<br />
70,::r2.1:!:.1 ::,1.11::ir :.1,77:1,17:: ,N4q--,q',-1 ^',NNqq"q*.- "ql',,n<br />
1 i i i i i i<br />
1 5 E E k li at<br />
= -
Table F.2. Resilient modulus ratio <strong>for</strong> short-term and long-term <strong>aging</strong><br />
Aggregate Asphalt Short-Term<br />
Oven<br />
Aging Ratio<br />
Long-Term<br />
Oven @ 100°C<br />
Long-Term<br />
Oven @ 85°C<br />
Low Pressure<br />
Oxidation @<br />
85°C<br />
RC AAD-1 1.59 3.69 3.43 3.63<br />
AAF-1 1.34 2.01 1.90 2.18<br />
AAM-1 1.35 2.47 2.41 2.42<br />
RH AAD-1 1.72 4.03 2.84 2.21<br />
AAF-1 1.26 1.67 1.41 1.45<br />
AAM-1 1.36 1.97 1.67 1.91<br />
113
Table F.3. Complex modulus (ksi) data selected at frequencies, 0.001, 1, 1000<br />
Hz<br />
Complex Modulus (ksi)<br />
Aggregate Asphalt Frequency Unaged Short-term Long-Term Long-Term Low<br />
Oven @ Oven @ Oven @ Pressure<br />
135°C 100°C 85°C Oxidation<br />
@ 85°C<br />
RC AAD-1 0.001 42 50 105 155 195<br />
1 280 330 670 1020 1190<br />
1000 1400 1620 2180 2900 3300<br />
AAF-1 0.001 69 100 180 210 330<br />
1 710 890 1250 1450 _1850<br />
1000 2320 2650 3050 3300 4000<br />
AAM-1 0.001 50 85 160 130 215<br />
1 470 610 960 800 1200<br />
1000 1450 1950 2350 2100 2700<br />
RH AAD-1 0.001 35 42 65 48 55<br />
1 190 280 520 340 430<br />
1000 1680 2000 2420 2050 2150<br />
AAF-1 0.001 60 70 120 140 170<br />
1 740 890 1000 1100 1300<br />
1000 2750 3000 3100 3200 3400<br />
AAM-1 0.001 50 68 70 79 125<br />
1 495 550 650 770 1080<br />
1000 1950 2200 2350 2500 3050<br />
114
Table F.4. Complex modulus ratio selected at frequencies, 0.001, 1, 1000 Hz<br />
Complex Modulus Ratio'<br />
Aggregate Asphalt Frequency Unaged Short-term<br />
Oven @<br />
135°C<br />
Long-Term<br />
Oven @ 100°C<br />
Long-<br />
Term<br />
Oven @<br />
Low<br />
Pressure<br />
Oxidation<br />
85°C @ 85°C<br />
RC AAD-1 0.001<br />
1<br />
1000<br />
1.0<br />
1.0<br />
1.0<br />
1.2<br />
1.2<br />
1.2<br />
2.5<br />
2.4<br />
1.6<br />
3.7<br />
3.6<br />
2.1<br />
4.6<br />
4.3<br />
2.4<br />
AAF-1 0.001<br />
1<br />
1000<br />
1.0<br />
1.0<br />
1.0<br />
1.4<br />
1.3<br />
1.1<br />
2.6<br />
1.8<br />
13<br />
3.0<br />
2.0<br />
1.4<br />
4.8<br />
2.6<br />
1.7<br />
RH<br />
AAM-1<br />
AAD-1<br />
0.001<br />
1<br />
1000<br />
0.001<br />
1<br />
1000<br />
1.0<br />
1.0<br />
1.0<br />
1.0<br />
1.0<br />
1.0<br />
1.4<br />
1.1<br />
1.1<br />
1.2<br />
13<br />
1.2<br />
1.4<br />
1.3<br />
12<br />
1.9<br />
2.7<br />
1.4<br />
1.6<br />
1.6<br />
13<br />
1.4<br />
1.8<br />
12<br />
23<br />
22<br />
1.6<br />
1.6<br />
23<br />
13<br />
AAF-1 0.001<br />
1<br />
1000<br />
1.0<br />
1.0<br />
1.0<br />
1.2<br />
12<br />
1.1<br />
2.0<br />
1.4<br />
1.1<br />
23<br />
1.5<br />
12<br />
2.8<br />
1.8<br />
12<br />
AA.M-1 0.001<br />
1<br />
1000<br />
1.0<br />
1.0<br />
1.0<br />
1.7<br />
1.3<br />
13<br />
32<br />
2.0<br />
1.6<br />
2.6<br />
1.7<br />
1.4<br />
43<br />
2.6<br />
1.9<br />
115
N<br />
V 0<br />
2<br />
5,000<br />
2,000<br />
Asphalt MD-1<br />
iggantlete:Pl?emp.:25C<br />
1,000 a<br />
s.<br />
MASTER STIFFNESS CURVE<br />
500 Oa<br />
a<br />
04 A<br />
X 200 - 4193<br />
0.<br />
0 100<br />
201<br />
A<br />
A<br />
0.07,16<br />
PAt*<br />
4rAA<br />
.0<br />
".1<br />
I I I<br />
a<br />
00.<br />
Unaqed 9<br />
0<br />
0 0<br />
6<br />
60<br />
zt<br />
Unaged 11<br />
0 Is 0<br />
a<br />
0 0<br />
cy.<br />
4<br />
-2s<br />
A STOA 1<br />
STOA 2<br />
0 v --a<br />
co :1 X °<br />
A<br />
0.001 0.1 10 1,000 100,000<br />
Frequency (Hz)<br />
PHASE ANGLE CURVE<br />
.<br />
Unagoed 10<br />
LPO c5/85) 1<br />
LPO (p5) 2<br />
Asphalt AAD-1<br />
Unaqed 9<br />
Aggregate: RC<br />
Trans<strong>for</strong>med tamp.: 25'c Unawd 10<br />
A A-71.176-SA.<br />
op ire<br />
0<br />
00 0 0 0<br />
8 0 0 0 0 0<br />
A<br />
t?,'Sti:7°1-.11<br />
....go A<br />
0 ° 60460 C7a1" ea eib<br />
15 ilA<br />
a a cao<br />
raD ft 60:<br />
li94, AbAa<br />
441;AAA A.41E A_<br />
0 I I<br />
1E-05 0.001 0.1 10 1,000 100,000<br />
Frequency (Hz)<br />
Una %ed 11<br />
ST2A 1<br />
STOA 2<br />
LPO (/85) 1<br />
LPO (2/85) 2<br />
Figure F.6. Experimental data and regression data <strong>for</strong> master curve and<br />
phase angle curve<br />
116
Cl)<br />
5,000<br />
2,000<br />
1,000<br />
MASTER STIFFNESS CURVE<br />
.<br />
L. O<br />
Asphalt MD-I Unaged 9<br />
Aggregate: RH<br />
AL<br />
Trans<strong>for</strong>med temp.: 25C<br />
Unagoed 10<br />
"A ICJ)<br />
Una%ed 11<br />
STOA 1<br />
Cl) I o Pe STOA 2<br />
La A<br />
-5 or<br />
soo LPO (5/85) 1<br />
O<br />
X<br />
200<br />
0 100<br />
0 A<br />
O<br />
75<br />
A<br />
(I 040 96<br />
0 s<br />
A<br />
A II aft<br />
o<br />
R<br />
20<br />
1E-05 0.001 0.1 10 1,000 100,000<br />
Frequency (Hz)<br />
PHASE ANGLE CURVE<br />
LPO (5/85) 2<br />
Asphalt AAD-1 Unwed 9<br />
Aggregate: RH<br />
Trans<strong>for</strong>med temp.: 25C Una %ed 10<br />
Unagtd 11<br />
ST2A 1<br />
STOA 2<br />
LPO V85) 1<br />
a) 45 LPO (5/85) 2<br />
0_<br />
15<br />
;<br />
A A<br />
Anti.<br />
4)<br />
A A 6 co<br />
o<br />
O 0i 0<br />
0<br />
o o<br />
Po_<br />
1. a<br />
-I.: cob-11,00<br />
* * * 1'6 a g otkoi<br />
0 t t I I , I<br />
1E-05 0.001 0.1 10 1,000 100,000<br />
Frequency (Hz)<br />
Figure F.7. Master curve and phase angle curve <strong>for</strong> <strong>asphalt</strong> AAD-1 and<br />
<strong>aggregate</strong> RC<br />
I<br />
,<br />
117
5,000<br />
MASTER STIFFNESS CURVE<br />
2,000<br />
Asphalt AAF-1<br />
Aggregate: RC<br />
Trans<strong>for</strong>med temp.: 25C<br />
A A .<br />
t<br />
d,t .-04,1 0<br />
lA<br />
41" oa P<br />
b.<br />
Unaqed 9<br />
Unagoed 10<br />
Una%ed 11<br />
co<br />
1,000<br />
Cl)<br />
-5 500<br />
A.<br />
de<br />
: OA<br />
t fi0<br />
0<br />
0 °<br />
STOA 1<br />
STOA 2<br />
LPO Q/85) 1<br />
V<br />
2<br />
oX 200 a<br />
A 2<br />
A 4 0<br />
3<br />
U A to<br />
100 A<br />
A<br />
0 *<br />
0 0 0<br />
75<br />
15<br />
20<br />
0<br />
0 * 0<br />
III',<br />
o .0*<br />
t I I<br />
1E-05 0.001 0.1 10 1,000 100,000<br />
Frequency (Hz)<br />
0 ' I<br />
PHASE ANGLE CURVE<br />
118<br />
LPO (2/85) 2<br />
Asphalt AAF-1 Unwed 9<br />
Aggregate: RC<br />
Trans<strong>for</strong>med temp.: 25C Unapsd 10<br />
0<br />
Jot) ..1 i<br />
l ...<br />
Al- A.--a-ikailta. °A A A4<br />
triwst, gt,peVit &<br />
i .<br />
i , A 4 A<br />
a<br />
o II 1 i (%1<br />
1 I t I I I , I , I 1 I 1 1<br />
1E-05 0.001 0.1 10 1,000 100,000<br />
Frequency (Hz)<br />
Figure F.8. Master curve and phase angle curve <strong>for</strong> <strong>asphalt</strong> AAD-1 and<br />
<strong>aggregate</strong> RH<br />
A<br />
0<br />
*<br />
Unaqed 11<br />
ST2A 1<br />
STOA 2<br />
LPO (2/85) 1<br />
LPO 2
MASTER STIFFNESS CURVE<br />
5,000<br />
Asphalt AAF-1<br />
s: A Unaqed 9<br />
- Aggregate: RH 809.<br />
Trans<strong>for</strong>med temp.: 25C 'tato<br />
Unagoed 10<br />
2,000 A ect ° a<br />
9.) A A<br />
Unaged 11<br />
"'<br />
A<br />
1536<br />
STOA 1<br />
--Nc 1,000<br />
g STOA 2<br />
A<br />
a<br />
LPO V85) 1<br />
AA I 2<br />
V SCO<br />
AA 6<br />
tut, LPO (2/85) 2<br />
83<br />
2 0<br />
641 (9.<br />
A 0<br />
X 203 -A n<br />
A<br />
0<br />
0 100<br />
A A<br />
O<br />
A a-19 4`<br />
0<br />
0 A<br />
A 0<br />
.6<br />
0 *<br />
50 6<br />
O 0<br />
a<br />
20<br />
1E-05 0.001 0.1 10 1,000 100,000<br />
Frequency (Hz)<br />
Asphalt AAF-i<br />
Aggregate: RH<br />
Trans<strong>for</strong>med temp.: 25C<br />
rtii-7K<br />
a<br />
la 41 a' 1Cn°1tt:<br />
® A<br />
etiA C6<br />
PHASE ANGLE CURVE<br />
,01<br />
a<br />
Aap . 6<br />
"ZatavilL*011<br />
0 t , I , I I I I ,<br />
1E-05 0.001 0.1 10 1,000 100,000<br />
Frequency (Hz)<br />
Unwed 9<br />
Unwed 10<br />
UnaRed 11<br />
ST9A 1<br />
STOA 2<br />
LPO 5/135) 1<br />
LPO ( /es) 2<br />
Figure F.9. Master curve and phase angle curve <strong>for</strong> <strong>asphalt</strong> AAF-1 and<br />
<strong>aggregate</strong> RC<br />
119
-cr)<br />
O<br />
'II<br />
O<br />
a)<br />
0.<br />
0)<br />
5,000<br />
MASTER STIFFNESS CURVE<br />
-<br />
Asphalt AAM-1<br />
Aggregate: RC<br />
Trans<strong>for</strong>med temp.: 250<br />
A A<br />
2,000<br />
.<br />
a . se !ha 1,000<br />
6 25<br />
:t. 8. 6<br />
500<br />
e A<br />
. a A<br />
6 °<br />
°<br />
75<br />
200<br />
100<br />
0 o<br />
O °<br />
000°<br />
a 46°<br />
00<br />
e.`<br />
e<br />
C<br />
A<br />
000<br />
g<br />
20 1E-05 0.001 0.1 10 1,000 100,000<br />
Frequency (Hz)<br />
PHASE ANGLE CURVE<br />
Unaged 9<br />
Unaged 10<br />
Una %ed 11<br />
STOA 1<br />
STOA 2<br />
L.P0 V85) 1<br />
LPO (2/85) 2<br />
Unard 9<br />
Asph&t AARC M-i<br />
Aggregate:<br />
Transrmecl tamp.: 25'C UnaRed 10<br />
Unaud 11<br />
ST2A 1<br />
N 60 STOA 2<br />
r:a<br />
LPO (sips) 1<br />
V<br />
LPO (2/85) 2<br />
a's 45<br />
C<br />
CO 30<br />
Ep a491457 AA<br />
C1-<br />
15 a-<br />
*<br />
A<br />
A<br />
I -II 0 hod<br />
0 1 I 1 1,1,1,1.1,1,<br />
" AAiiVarlil%°<br />
1E-05 0.001 0.1 10 1,000 100,000<br />
Frequency (Hz)<br />
Figure F.10. Master curve and phase angle curve <strong>for</strong> <strong>asphalt</strong> AAF-1 and<br />
<strong>aggregate</strong> RH<br />
120
5,000<br />
MASTER STIFFNESS CURVE<br />
Asphalt AAM-1 Unaged 9<br />
- Aggregate: RH<br />
Trans<strong>for</strong>med tamp.: 25'C<br />
A 0a<br />
A A 0 41444 Unaqed 10<br />
A A 0 /<br />
2,000 A 417 *....e..<br />
49** AA<br />
Unaged 11<br />
a<br />
° P 4f * A<br />
1,000<br />
A<br />
STOA 1<br />
0 i ! A A<br />
. AA 0 STOA 2<br />
O ce, : Ile,- °<br />
500 a<br />
LPO (5/85) 1<br />
A gi 1<br />
O<br />
1501 4s LPO (2/85) 2<br />
2 a4 8 g<br />
X 200 fiet -a<br />
1 0 W2 -Et<br />
a) A<br />
Q.<br />
100 o<br />
0 A 0<br />
di. 0 et,<br />
o °<br />
Aa° a*<br />
°<br />
°C.°0i *11<br />
1 I I 20 1 I I<br />
I I<br />
I<br />
1E-05 0.001 0.1 10 1,000 100,000<br />
Frequency (Hz)<br />
PHASE ANGLE CURVE<br />
1E-05 0.001 0.1 10 1,000 100,000<br />
Frequency (Hz)<br />
Unaged 9<br />
Unwed 10<br />
Unavd 11<br />
ST2A 1<br />
STOA 2<br />
LPO V85) 1<br />
LPO (2/85) 2<br />
Figure F.11. Master curve and phase angle curve <strong>for</strong> <strong>asphalt</strong> AAM-1 and<br />
<strong>aggregate</strong> RC<br />
121
1e15<br />
1e4<br />
COMPLEX MODULUS<br />
LOSS TANGENT<br />
INN<br />
PIA<br />
a.<br />
1e2<br />
1e10<br />
0<br />
1e0<br />
1e5<br />
le-2<br />
1e15<br />
1 1 I<br />
I I I I l i<br />
1e0<br />
le-5<br />
1e0 1e5 1e10<br />
REDUCED FREQUENCY, RAD/S
depending on the type <strong>of</strong> treatment, and have similar trends to the short-term oven<br />
<strong>aging</strong> curves.<br />
The complex modulus data suggest that the unaged specimens at low frequencies,<br />
where the test temperature is high, correspond to the lower limit <strong>of</strong> viscous<br />
(flowing) behavior <strong>of</strong> the <strong>asphalt</strong>-<strong>aggregate</strong> mix and that they approach the<br />
conditions where the <strong>aggregate</strong> tends to dominate the material response. After<br />
undergoing short-term oven <strong>aging</strong>, the complex modulus <strong>of</strong> the <strong>asphalt</strong>-<strong>aggregate</strong><br />
mixes increased. At low frequencies and medium test temperature, the master<br />
curves slope to a 1:1 ratio which indicates that the mixes are undergoing viscous<br />
response. Similarly, the master curves <strong>for</strong> long-term aged specimens show the<br />
same trend with higher complex moduli at lower frequencies. At high frequencies<br />
and low test temperature, the master curve starts to approach an elastic asymptote<br />
as the <strong>asphalt</strong> stiffness approaches elastic behavior.<br />
Plots <strong>of</strong> phase angle versus frequency show that the curves peak in the frequency<br />
range <strong>of</strong> 0.01 to 1 Hz. Similar peaks are found in the data presented <strong>for</strong> modified<br />
<strong>asphalt</strong> mixes (Tayebali et al., 1991). This confirms that at an intermediate<br />
temperature or frequency, the <strong>asphalt</strong>-<strong>aggregate</strong> mix is more viscous than at high<br />
or low frequencies where either the <strong>asphalt</strong> or <strong>aggregate</strong> dominates the elastic<br />
response.<br />
The peak phase angles <strong>for</strong> unaged, short-term aged, and long-term aged specimens<br />
are less than 45°. After short-term <strong>aging</strong>, the phase angle peak is lower and<br />
shifted to the left, indicating that the specimen is stiffer and that the modulus has<br />
increased. Similarly, the phase angle peak <strong>for</strong> long-term aged specimens is flatter<br />
and lower than the short-term phase angle peak depending on the <strong>aging</strong> treatment.<br />
The long-term peak is shifted even more to the left, which shows that the specimen<br />
has become even stiffer. Hence, the phase angle curves are very good indicators<br />
<strong>of</strong> mixes becoming more viscous with <strong>aging</strong>. It may be feasible to determine<br />
limiting values <strong>of</strong> phase angle maxima or minima in order to control cracking <strong>of</strong><br />
<strong>asphalt</strong> pavements.<br />
At high temperature or low frequency, the combinations with <strong>aggregate</strong> RH have a<br />
lower complex modulus, and at low temperature or high frequency have a higher<br />
complex modulus than the combinations with <strong>aggregate</strong> RC. The RH combinations<br />
also have higher phase angle values that peaked at higher frequencies. Phase<br />
angles that are too high might be associated with pavement rutting. These high<br />
phase angles indicate that these mixes are more susceptible to modulus change with<br />
either frequency or temperature.<br />
The plots <strong>of</strong> master stiffness curve show that mixes with <strong>aggregate</strong> RC have a<br />
greater change in complex modulus after short-term and long-term <strong>aging</strong>s,<br />
especially at high temperature (or low frequency), than mixes with <strong>aggregate</strong> RH.<br />
123
The mixes become stiffer in the low frequencies region, which suggests that the<br />
mixes have undergone more <strong>aging</strong> after being long-term oven aged <strong>for</strong> 5 days at<br />
85°C. Similarly, the phase angle curves show that the phase angle peaks <strong>for</strong> RC<br />
mixes shifted more to the left than <strong>for</strong> RH mixes. This shows that the viscous<br />
component <strong>of</strong> RC mixes changed more than that <strong>of</strong> RH mixes after short-term and<br />
long-term <strong>aging</strong> treatments. The mixes with <strong>aggregate</strong> RH have higher peak phase<br />
angles than mixes with <strong>aggregate</strong> RC, which suggests that RH mixes are more<br />
viscous.<br />
At high frequency (or low temperature), the phase angle is small, indicating that<br />
the <strong>asphalt</strong> behaves like an elastic material. This is known as the "glassy" region<br />
where various types <strong>of</strong> molecules mobilities are "frozen-in" (Lazan 1968). As the<br />
frequency decreases (or the temperature increases), the phase angle reaches a<br />
maximum. The <strong>asphalt</strong> behaves like an elastic material at high frequency,<br />
gradually changes to a viscoelastic material and continues to change into a viscous<br />
material as the frequency decreases (or the temperature increases). After the phase<br />
angle maximum, the phase angle gradually decreases to a minimum where the mix<br />
is again in the viscoelastic phase, even though the <strong>asphalt</strong> viscosity continues to<br />
decrease. The <strong>aggregate</strong> appears to dominate the mix property at this point.<br />
The complex moduli at 0.001, 1, and 1000 Hz were obtained from the master<br />
curve plots <strong>of</strong> unaged, short-term and long-term <strong>aging</strong>s. The ratios were<br />
calculated by dividing the aged complex modulus to the unaged complex modulus.<br />
These ratios were compared to the ratios calculated using diametral resilient<br />
modulus data. It was found that the DMA ranking plots at 1 Hz have the same<br />
rankings as those plotted <strong>for</strong> the diametral resilient modulus <strong>for</strong> all <strong>aging</strong><br />
treatments. However, the plots at 0.001 and 1000 Hz vary <strong>for</strong> each treatment.<br />
These suggest that DMA can indicate the behavior <strong>of</strong> each <strong>asphalt</strong>-<strong>aggregate</strong> mix at<br />
different test temperature in terms <strong>of</strong> each mix's susceptibility to <strong>aging</strong>.<br />
124