EXPEDITION REPORT - Biosphere Expeditions
EXPEDITION REPORT - Biosphere Expeditions
EXPEDITION REPORT - Biosphere Expeditions

You also want an ePaper? Increase the reach of your titles
YUMPU automatically turns print PDFs into web optimized ePapers that Google loves.
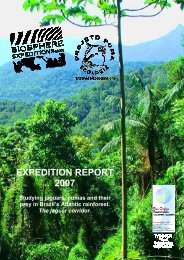
<strong>EXPEDITION</strong> <strong>REPORT</strong><br />
Expedition dates: 3 September – 3 November 2007<br />
Report published: November 2008<br />
Studying cheetahs, leopards and<br />
brown hyaenas of the African<br />
savannah bushland, Namibia.
<strong>EXPEDITION</strong> <strong>REPORT</strong><br />
Studying cheetahs, leopards and brown hyaenas of the<br />
African savannah bushland, Namibia.<br />
Expedition dates:<br />
3 September - 3 November 2007<br />
Report published:<br />
November 2008<br />
Authors:<br />
Birgit Förster & Harald Förster<br />
Okatumba Wildlife Research<br />
Matthias Hammer (editor)<br />
<strong>Biosphere</strong> <strong>Expeditions</strong><br />
2<br />
� Okatumba Wildlife Research<br />
www.okatumba.de
Abstract<br />
Namibia is thought to hold one third of the global cheetah population and it is one of the<br />
few African countries where six species of large carnivores occur. About 40% of the total<br />
area in Namibia is used for commercial livestock farming, 40% are communal areas and<br />
20% are national parks and restricted areas. Much of the wildlife lives outside protected<br />
areas on private farmland. Namibian farmland, therefore, has a crucial role to play in the<br />
sustainable management and conservation of the country’s wildlife in general and<br />
cheetahs in particular.<br />
Despite years of research by several organisations, so far no reliable population estimates<br />
for large carnivores on Namibian farmland exist. The million-dollar question “How many<br />
cheetahs does Namibia have?” still needs to be answered. This study aimed to compute<br />
indices that reflect true population density, but found that cheetah ecology on Namibian<br />
farmland generally makes it difficult to use spoor counts as an indirect sampling method.<br />
Whilst it is relatively easy to determine how many different individuals range over a specific<br />
area, it is difficult to estimate true population density.<br />
The cheetah’s relative genetic monomorphism is potentially important to its conservation,<br />
but to date there is no convincing evidence that the health status and reproduction of wild<br />
populations are compromised. On the contrary, free-ranging cheetahs on Namibian<br />
farmland are healthy, reproducing well and sustain more youngsters through to adulthood<br />
than in East African national parks, where lions and spotted hyaenas frequently kill<br />
cheetah offspring. Free-ranging cheetah populations are chiefly regulated by extrinsic<br />
factors such as persecution by humans, rather than intrinsic factors such as low genetic<br />
variability. In this context continued education of local farmers to reduce human-wildlife<br />
conflict is an important component of large carnivore conservation.<br />
This report presents the results of the third expedition at Okomitundu study site, which<br />
took place from 3 September to 3 November 2007. Due to the arid climate at Okomitundu,<br />
its carrying capacity is lower than it was in the previous study sites (Omitara and Seeis).<br />
Furthermore, poaching activities are a serious threat at Okomitundu. These two factors<br />
together result in lower densities of potential prey animals at Okomitundu study site and<br />
therefore in lower densities of large carnivores, cheetahs in particular. Investigation of this<br />
habitat was very important to depart from the regional level and to gain reliable information<br />
on a more national scale.<br />
The problem of game poaching is serious, but quantification of exact game losses well<br />
nigh impossible and this study argues that effective control of poaching can only be<br />
achieved through professional anti-poaching units, one of which is now installed locally.<br />
Furthermore, game count data demonstrate that potential prey animals on open farmland<br />
react to environmental factors, whereas game densities within game-proof fenced areas<br />
do not change significantly. Game animals within this area can not move and they have to<br />
cope with the given conditions. As a result prey availability is maintained and large<br />
carnivores benefit from this. If the management of game-proof fenced areas is done well,<br />
such areas may be very suitable conservation tools for rare or endangered species in<br />
particular.<br />
3<br />
� Okatumba Wildlife Research<br />
www.okatumba.de
Zusammenfassung<br />
Es wird angenommen, dass ein Drittel der weltweiten Gepardenpopulation in Namibia lebt.<br />
Außerdem gehört Namibia zu den wenigen afrikanischen Ländern, in denen sechs Arten von<br />
Großraubtieren vorkommen. Etwa 40% der Landesfläche werden für Nutztierwirtschaft<br />
genutzt, 40% sind kommunale Stammesgebiete und 20% sind Schutz- bzw. Sperrgebiete.<br />
Viele Wildtiere leben außerhalb von Schutzgebieten auf privatem Farmland. Folglich spielt das<br />
Farmland eine grosse Rolle, wenn es um eine nachhaltige Nutzung und den Erhalt der<br />
Wildtiere in Namibia geht. Dies gilt insbesondere für den Geparden.<br />
Trotz vieler Jahre Forschung verschiedener Organisationen existieren bis heute keine<br />
zuverlässigen Bestandesschätzungen für Großraubtiere auf Farmland in Namibia. Eine<br />
Antwort auf die Frage “Wie viele Geparden leben in Namibia?” muss immernoch gefunden<br />
werden. Diese Studie zielt darauf, Indikatoren für die tatsächliche Populationsdichte zu<br />
ermitteln, und hat herausgefunden, dass die Ökologie der Geparden es schwierig macht, das<br />
Zählen von Spurenhäufigkeiten als indirekte Methode zu benutzen. Es ist zwar relativ leicht,<br />
festzustellen, wieviele verschiedene Geparde in einem bestimmten Gebiet umher-streifen,<br />
aber es ist sehr schwierig, die tatsächliche Populationsdichte zu ermitteln.<br />
Die genetische Gleichartigkeit der Geparde ist zwar potenziell wichtig für deren Erhaltung,<br />
aber bis heute gibt es keine überzeugenden Beweise dafür, dass die Gesundheit und die<br />
Fortpflanzung wild lebender Populationen beeinträchtigt sind. Im Gegenteil befinden sich frei<br />
lebende Geparde auf Farmland in Namibia in einem sehr guten Gesundheitszustand.<br />
Außerdem pflanzen sie sich sehr gut fort und die Überlebensrate der Jungtiere ist weit höher<br />
als in Ostafrika, wo viele Gepardenjunge von Löwen und Gefleckten Hyänen getötet werden.<br />
Frei lebende Gepardenpopulationen werden überwiegend durch extrinsische Faktoren - wie<br />
die Verfolgung durch den Menschen - als durch intrinsische Faktoren - wie die geringe<br />
genetische Variabilität – reguliert. In diesem Kontext ist Umweltbildung eine wichtige<br />
Komponente zur Reduzierung des Mensch-Tier-Konflikts und für den Schutz großer<br />
Raubtiere.<br />
Dieser Bericht beschäftigt sich mit den Ergebnisse der dritten Expedition im Studiengebiet<br />
Okomitundu, die vom 03. Sep bis zum 03. Nov 2007 stattgefunden hat. Bedingt durch das<br />
trockene Klima ist die Tragfähigkeit der Weide geringer als in den vorigen Studiengebieten<br />
(Omitara und Seeis). Außerdem spielt die Wilderei auf Okomitundu eine grosse Rolle.<br />
Insgesamt führt dies zu einer deutlich geringeren Dichte potentieller Beutetiere und folglich<br />
auch zu einer geringeren Dichte von großen Raubtieren, insbesondere von Geparden. Eine<br />
Untersuchung dieses Habitats war notwendig, um die regionale Ebene zu verlassen und<br />
Informationen für das gesamte Land zu erhalten.<br />
Die Wilderei stellt ein ernstes Problem für das Studiengebiet dar, aber eine exakte<br />
Quantifizierung der Wildverluste ist nahezu unmöglich. Eine effektive Bekämpfung der<br />
Wilderei kann nur durch professionelle Anti-Wilderer-Einheiten gewährleistet werden und eine<br />
solche Einheit wurde inzwischen engagiert. Ergebnisse der Wildtierzählungen zeigen, dass<br />
Wildtiere auf offenem Farmland auf Umelteinflüsse reagieren, während Wilddichten im<br />
wildsicher eingezäunten Gebiet kaum schwanken. Wildtiere in diesem Gebiet können nicht<br />
wandern und sind gezwungen, mit den gegebenen Bedingungen zurecht zu kommen.<br />
Dadurch profitieren Raubtiere von der ständigen Verfügbarkeit ihrer Beutetiere. Sofern<br />
wildsicher eingezäunte Gebiete gut bewirtschaftet werden, stellen sie ein wertvolles Mittel für<br />
den Naturschutz dar.<br />
4<br />
� Okatumba Wildlife Research<br />
www.okatumba.de
Contents<br />
Abstract 3<br />
Zusammenfassung 4<br />
Contents 5<br />
1. Expedition Review 6<br />
1.1. Background 6<br />
1.2. Research Area 7<br />
1.3. Dates 7<br />
1.4. Local Conditions & Support 7<br />
1.5. Local Scientists 9<br />
1.6. Expedition Leader 9<br />
1.7. Expedition Teams 9<br />
1.8. Expedition Budget 10<br />
1.9. Acknowledgements 11<br />
1.10. Further Information & Enquiries 11<br />
2. Large Carnivores of the Namibian Farmland 12<br />
2.1. Introduction 12<br />
2.2. Study Area 14<br />
2.3. Study Animals 17<br />
2.4. Demography of Large Carnivores 18<br />
2.5. Population Density of Large Carnivores 26<br />
2.6. Prey Availability 41<br />
2.7. Poaching 50<br />
2.8. Carnivore Sightings 53<br />
2.9. Discussion & Conclusions 54<br />
2.10. Future of the Large Carnivore Research Project 59<br />
2.11. Acknowledgements 61<br />
2.12. References 62<br />
Appendix 1: List of Mammals at Okomitundu 66<br />
Appendix 2: List of Birds at Okomitundu 67<br />
Appendix 3: List of Daily Research Activities 69<br />
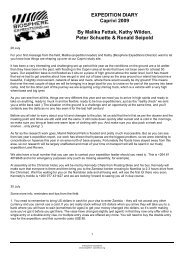
Appendix 4: 2007 Expedition Diary by Expedition Leader Peter Schütte 70<br />
5<br />
� <strong>Biosphere</strong> <strong>Expeditions</strong><br />
www.biosphere-expeditions.org
Please note: Each expedition report is written as a stand-alone document that can be read<br />
without having to refer back to previous reports. As such, much of this section, which<br />
remains valid and relevant, is a repetition from previous reports, copied here to provide the<br />
reader with an uninterrupted flow of argument and rationale.<br />
1.1. Background<br />
1. Expedition Review<br />
<strong>Biosphere</strong> <strong>Expeditions</strong> runs wildlife conservation research expeditions to all corners of the<br />
Earth. Projects are not tours, photographic safaris or excursions, but genuine research<br />
expeditions placing ordinary people with no research experience alongside scientists who<br />
are at the forefront of conservation work. <strong>Expeditions</strong> are open to all and there are no<br />
special skills (biological or otherwise) required to join. Expedition team members are<br />
people from all walks of life and of all ages, looking for an adventure with a conscience<br />
and a sense of purpose. More information about <strong>Biosphere</strong> <strong>Expeditions</strong> and its research<br />
expeditions can be found at www.biosphere-expeditions.org.<br />
This expedition report deals with an expedition to Namibia that ran from 3 September to 3<br />
November 2007. The expedition was part of a long-term research project on large<br />
carnivores living on farmland in Namibia. The expedition's emphases were on capture<br />
activities, radio-tracking, counting spoor (also known as tracks) frequencies and on<br />
recording prey animals by hide-based observations at water points and on game study<br />
drives.<br />
Namibia harbours the world’s highest population of cheetahs and is one of a few African<br />
countries that support six species of large carnivores. Lions, spotted hyaenas and wild<br />
dogs are mainly restricted to protected areas, but cheetahs, leopards and brown hyaenas<br />
still occur on areas with intensive livestock and/or game farming. Today about 40% of the<br />
total area in Namibia is used for commercial livestock breeding and it is estimated that this<br />
land provides the habitat for 90% of the current Namibian cheetah population. Ensuing<br />
conflict with humans has resulted in large numbers of predators being captured and/or<br />
shot. Large carnivores do kill livestock, but the extent of losses and financial damage to<br />
the farmers has to date not been properly quantified.<br />
Although the Namibian cheetah is a fascinating flagship species, its ecology is poorly<br />
understood and this makes conservation of the species difficult. Hunting quotas are set<br />
without scientific basis, removal through human conflict is poorly monitored and no reliable<br />
population density estimates exist (the frequently used and well-published figure of 2,500-<br />
3,000 individuals has been quoted for the past 20 years, but is very likely inaccurate as it<br />
is based on unscientific guesswork). Due to this lack of scientific data, the effectiveness of<br />
present conservation efforts are in doubt. New baseline data on population density,<br />
demography and ecology are thus urgently required. Data gathered during this expedition<br />
will be an essential ingredient to a new and effective conservation strategy for the<br />
Namibian cheetah, leopard and brown hyaena.<br />
6<br />
� <strong>Biosphere</strong> <strong>Expeditions</strong><br />
www.biosphere-expeditions.org
1.2. Research Area<br />
7<br />
� <strong>Biosphere</strong> <strong>Expeditions</strong><br />
www.biosphere-expeditions.org<br />
Flag and location of Namibia and study site.<br />
An overview of <strong>Biosphere</strong> <strong>Expeditions</strong>’ research sites,<br />
assembly points, base camp and office locations is at<br />
Google Maps.<br />
The research site lies in the central Namibian savannah and the terrain is level at around<br />
1200 metres altitude with rocky outcrops up to 1800 metres. The dominating vegetation<br />
type is open shrub savannah. The characteristic plant species are several acacia species<br />
like yellow-bark acacia, red thorn, black thorn and camel thorn.<br />
The core zone of the research area covers approximately 18,000 hectares (180 km 2 ) on<br />
conservancy farmland, as it is this farmland, not the national parks, which harbour 90% of<br />
the Namibian cheetah population. Conservancies are created by neighbouring farmers<br />
who agree to manage their land and livestock sustainably and in return are granted<br />
ownership of the game on their land by the state. In addition to the core zone, where most<br />
of the research activities take place, the research area has a perimeter zone of more than<br />
50,000 hectares (500 km 2 ), which is used as necessary, for example for radio-tracking.<br />
1.3. Dates<br />
The expedition in 2007 ran over a period of nine weeks and composed of a team of<br />
international research assistants, support personnel, local scientists, students and an<br />
expedition leader. Slot dates were 3 - 15 September | 17 - 29 September | 8 - 20 October |<br />
22 October - 3 November.<br />
Team members could join for multiple slots (within the periods specified). Dates were<br />
chosen at beginning of the rainy season when vegetation is still sparse (and animal<br />
visibility therefore high) and several research activities can be conducted simultaneously.<br />
1.4. Local Conditions & Support<br />
<strong>Biosphere</strong> <strong>Expeditions</strong> was collaborating with Okatumba Wildlife Research, a non-profit<br />
organisation that conducts research projects and is involved in wildlife management for<br />
conservancies.
Expedition Base<br />
The expedition team was based at Okomitundu Guest Farm, about 160 km northwest of<br />
Windhoek in a remote region of savannah farmland. The expedition base consisted of a<br />
central farm house and several guest houses for the expedition team. Team members<br />
shared twin or double rooms with a toilet, shower and all mod cons. Lunch and dinner was<br />
prepared for the team at Okomitundu Guest Farm. Breakfast packs were taken into the<br />
field. Vegetarians and special diets could be catered for. Okomitundu Guest Farm had<br />
220V mains electricity from European style sockets.<br />
Weather<br />
The habitat is semi-arid savannah climate with distinct wet and dry seasons. The summer<br />
rainfalls peak from February to April. The expeditions were in Namibia when it is hot and<br />
dry with the occasional downpour or thunderstorm. Day time temperatures reached 36°C,<br />
and night time temperature 18°C. The lowest temperature (early morning) was 8°C.<br />
Field Communications<br />
There was a telephone and fax at Okomitundu Guest Farm for emergency communication.<br />
Two-way radios were used for communication between teams around the study site. There<br />
was also mobile phone coverage at some sites around base.<br />
Transport & Vehicles<br />
Team members made their own way to the Windhoek assembly point. For the expedition,<br />
the team had the use of two Land Rover Defender 110 Station Wagons, two Land Rover<br />
Defender 130 Double Cabs, and various other vehicles. The vehicles were provided by<br />
Land Rover as part of its Fragile Earth policy, which is the company's commitment to the<br />
environment through the sponsorship of leading environmental organisations such<br />
<strong>Biosphere</strong> <strong>Expeditions</strong>, the development of sustainable practices and technologies and the<br />
company's 'Off-Road Code'.<br />
Medical Support & Insurance<br />
The expedition leader was trained first aider, and the expedition carried a comprehensive<br />
medical kit. Namibia’s healthcare system is of an excellent standard and the nearest<br />
doctor and hospital were in Windhoek. Emergency medical support was provided by SOS<br />
International. All team members were required to carry adequate travel insurance covering<br />
emergency medical evacuation and repatriation.<br />
The only medical incidents were some moderate headache, toothache and diarrhoea, as<br />
well as some minor cuts from thorn bushes.<br />
8<br />
� <strong>Biosphere</strong> <strong>Expeditions</strong><br />
www.biosphere-expeditions.org
1.5. Local Scientists<br />
Birgit & Harald Förster, originally from Germany, have lived and worked in Namibia since<br />
1997. Birgit Förster trained as a veterinary assistant and studied Biology. Harald Förster is<br />
a trained horticulturist and after his apprenticeship studied forestry, specialising in tropical<br />
forestry and wildlife biology. The Försters founded Okatumba Wildlife Research together<br />
with local farmers and a veterinarian in an effort, amongst other aims, to conduct research<br />
on the farmland habitat, especially regarding complex ecological patterns and human<br />
influence on wildlife populations. Their main research interest is in developing strategies<br />
for the sustainable use of natural resources and all their projects are conducted in close<br />
co-operation with the Namibian Ministry of Environment and Tourism (MET). Various MET<br />
scientists provide the Försters with logistical support as well as scientific advice.<br />
Okatumba Wildlife Research is also working with various universities and research<br />
institutes in Europe.<br />
1.6. Expedition Leader<br />
The expedition was led by Peter Schütte. Peter was born in Germany. He studied<br />
geography and cartography at the University of Bremen (Germany) and Göteborg<br />
Universitet (Sweden) and geoinformatics in Salzburg (Austria). He has worked on several<br />
mapping and remote sensing projects all over the world. In 2004 and 2005 Peter was<br />
involved in wildlife conservation projects in Namibia, where he joined <strong>Biosphere</strong><br />
<strong>Expeditions</strong> as member of the team of local scientists and was promptly bitten by the<br />
wildlife expeditions bug. He has travelled in Scandinavia, Iceland, Southern Africa, North<br />
America and Central Asia. Peter holds First Aid and Off-Road driving certificates and has<br />
worked in Namibia, Altai and Oman for <strong>Biosphere</strong> <strong>Expeditions</strong>.<br />
1.7. Expedition Teams<br />
The expedition team was recruited by <strong>Biosphere</strong> <strong>Expeditions</strong> and consisted of a mixture of<br />
all ages, nationalities and backgrounds. They were:<br />
3 - 15 Septemer 2007: Angela Benedetti (Switzerland), Claudia Blumenrath (Germany),<br />
Susanne Blumenrath (Germany), Linda Grosjean (France), Helga Haus-Seuffert<br />
(Germany), Ralf Herschbach (Germany), Hanne Hoeck (UK), Uwe Kullnick (Germany),<br />
John Rawnsley (UK), Karin Rochel (Germany), Kelly Rowett (UK), Keith Smith (UK)<br />
17 - 29 September 2007: Bill & Cathy Aynsley (UK), Nancy Blane (USA), Jennifer &<br />
Nicholas Gage (UK), Cassie Mercer (UK), Paul Miller (UK), Jens Mück (Germany), Mary<br />
Beth Pelzer (USA), Chris Steams (USA), Pearl Ting (Taiwan), Kathryn West (USA)<br />
8 - 20 October 2007: Pascale-Agnes Bas (France), Pamela Brey (USA), Richard<br />
Churchill-Coleman (UK), Corinne & Elliot Dupuy (Switzerland), Julie Ellis (UK), Peter<br />
Nacke (Germany), Paul Nederlof & Esther Nederlof-Mulders (UK), Jan Talbot (UK), Inga<br />
Van der Wees (Germany), Gabriele Zeh (Germany)<br />
22 October - 3 November 2007: Sian Adler (Czech Republic), Matthew Baum (USA),<br />
Stuart Carlyle (UK), Sandro Jakob (Switzerland), Ellie Hajee (UK), Andy Hunt (UK), Roger<br />
Kirkpatrick (UK), Genevieve L’Eplattenier (Switzerland), Ellen Medenwold (Germany),<br />
Stefan & Verena Thürey (Netherlands).<br />
9<br />
� <strong>Biosphere</strong> <strong>Expeditions</strong><br />
www.biosphere-expeditions.org
Also in 2007: Peter Lynch, Sue Watts, Fabian von Poser, Markus Müller (journalists),<br />
Annegret & Horst Fechter (Okomitundu managers), Sibylla, Alex, Tim, Esther & Oliver<br />
(Okatumba Wildlife Research interns), Miriam (Okomitundu trainee), Piet & Assa<br />
(trackers), Melschia, Wilika, Fine, Agnes, Annatjie & Emelie (Okomitundu domestic staff),<br />
Paul, Paulus, Adam, Niko, Sprinkhaan, Anton, Pinias (Okomitundu farm staff).<br />
1.8. Expedition Budget<br />
Each team member paid towards expedition costs a contribution of £1480 per person per<br />
two week slot. The contribution covered accommodation and meals, supervision and<br />
induction, a permit to access and work in the area, several non-personal equipment, all<br />
transport from and to the team assembly point. It did not cover excess luggage charges,<br />
travel insurance, personal expenses like telephone bills, souvenirs etc., as well as visa and<br />
other travel expenses to and from the assembly point (e.g. international flights). Details on<br />
how this contribution was spent are given below.<br />
Income £<br />
Expedition contributions 71,049<br />
Expenditure<br />
Base camp and food<br />
includes all meals, base camp equipment, gas, wood<br />
Transport<br />
includes fuel, car maintenance<br />
Equipment and hardware<br />
includes research materials & gear etc purchased in UK & Namibia<br />
<strong>Biosphere</strong> <strong>Expeditions</strong> staff<br />
includes salaries, travel and expenses to Namibia<br />
Local staff<br />
includes salaries, travel and expenses, gifts<br />
Administration<br />
includes permits, registration fees, sundries, etc.<br />
Scientific services & logistics organisation<br />
Payment to Okatumba Wildlife<br />
Team recruitment Namibia<br />
as estimated % of PR costs for <strong>Biosphere</strong> <strong>Expeditions</strong><br />
10<br />
� <strong>Biosphere</strong> <strong>Expeditions</strong><br />
www.biosphere-expeditions.org<br />
24,578<br />
3,994<br />
1,461<br />
7,470<br />
4,598<br />
1,678<br />
1,688<br />
5,002<br />
Income - Expenditure 20,579<br />
Total percentage spent directly on project 71%
1.9. Acknowledgements<br />
This expedition was conducted by <strong>Biosphere</strong> <strong>Expeditions</strong> which runs wildlife conservation<br />
expeditions all over the globe. Without our expedition team members (listed above) who<br />
provided an expedition contribution and gave up their spare time to work as research<br />
assistants, none of this research would have been possible. The support team and staff<br />
(also mentioned above) were central to making it all work on the ground. Thank you to all<br />
of you, and the ones we have not managed to mention by name (you know who you are)<br />
for making it all come true. <strong>Biosphere</strong> <strong>Expeditions</strong> would also like to thank Land Rover,<br />
Cotswold Outdoor, Globetrotter Ausrüstung, Buff and the Friends of <strong>Biosphere</strong> <strong>Expeditions</strong><br />
for their sponsorship and/or in-kind support.<br />
1.10. Further Information & Enquiries<br />
More background information on <strong>Biosphere</strong> <strong>Expeditions</strong> in general and on this expedition<br />
in particular including pictures, diary excerpts and a copy of this report can be found on the<br />
<strong>Biosphere</strong> <strong>Expeditions</strong> website www.biosphere-expeditions.org.<br />
Copies of this and other expedition reports can be accessed at www.biosphereexpeditions.org/reports.<br />
Enquires should be addressed to <strong>Biosphere</strong> <strong>Expeditions</strong> at the address given below.<br />
11<br />
� <strong>Biosphere</strong> <strong>Expeditions</strong><br />
www.biosphere-expeditions.org
Please note: Each expedition report is written as a stand-alone document that can be read<br />
without having to refer back to previous reports. As such, much of this section, which<br />
remains valid and relevant, is a repetition from previous reports, copied here to provide the<br />
reader with an uninterrupted flow of argument and rationale.<br />
2. Large Carnivores of the Namibian Farmland<br />
2.1. Introduction<br />
Birgit Förster & Harald Förster<br />
Okatumba Wildlife Research, Namibia<br />
Namibia is one of the few African countries, where six species of large carnivores occur:<br />
cheetah (Acinonyx jubatus), leopard (Panthera pardus), lion (Panthera leo), brown hyaena<br />
(Hyaena brunnea), spotted hyaena (Crocuta crocuta) and wild dog (Lycaon pictus).<br />
Namibia is thought to host one third of the cheetah’s world population (Bashir et al 2005).<br />
About 40% of the total area in Namibia is used for commercial livestock farming, 40% are<br />
communal areas and 20% are national parks and restricted areas (Berry 1990). It is<br />
estimated that commercial farmland provides the habitat for 95% of Namibia’s cheetah<br />
population (Marker 1998, Morsbach 1987) and about 80% of the commercially useable<br />
larger game species (Brown 1992). Therefore Namibian farmland has a crucial role to play<br />
in the sustainable management and conservation of the country’s wildlife.<br />
Most scientific knowledge on large carnivores is based on studies that were conducted in<br />
conservation areas like the Serengeti (Caro 1994, Durant 1998), the Kalahari (Funston et<br />
al. 2001, Mills 1984) or the Kruger National Park (Broomhall et al. 2003, Bowland 1995,<br />
Mills et al. 2004). In contrast very little is known about large carnivores living outside<br />
protected areas on private farmland in Namibia, a habitat in which they are much more<br />
difficult to monitor due to their timidity as well as logistical problems. Precisely because of<br />
this lack of information, this study will provide sound scientific data on cheetahs, leopards<br />
and brown hyaenas living in co-existence with Namibian farmers.<br />
Living conditions for carnivores vary substantially between protected areas and freehold<br />
farmland (Fig. 2.1.a). Therefore Namibian carnivore ecology in freehold farmland differs<br />
from carnivore ecology in national parks. Cheetahs, for example, show unusually large<br />
group sizes on Namibian farmland (Gaerdes 1974, Joubert 1984, McVittie 1979), prey size<br />
expands and litter sizes increase compared to East African cheetahs (McVittie 1979,<br />
Morsbach 1987, personal observation). Durant (1998), Joubert and Mostert (1975) and<br />
McVittie (1979) have argued that lack of inter-specific competition with lion and spotted<br />
hyaena in particular might be one of the main reasons for the success of the cheetah on<br />
farmland.<br />
12<br />
� Okatumba Wildlife Research<br />
www.okatumba.de
no lions, no<br />
spotted hyenas<br />
farmers + livestock<br />
fighting bush fires<br />
permanent<br />
grazing<br />
high prey densities<br />
optimal habitat for<br />
cheetah + leopard<br />
13<br />
� Okatumba Wildlife Research<br />
www.okatumba.de<br />
permanent<br />
water places<br />
Figure 2.1.a Important factors and environmental conditions of the farmland habitat.<br />
conditioned<br />
ownership<br />
Most of our research questions require data collection within different study sites to depart<br />
from the regional level and to get reliable information on a more national scale. Due to<br />
logistical reasons and financial constraints, we are not able to run several study sites<br />
simultaneously, but instead run them in succession. As a result this study needs to be<br />
carried out over a long time to gain a full understanding of large carnivore ecology on<br />
Namibian farmlands. Collaboration with <strong>Biosphere</strong> <strong>Expeditions</strong> is a great opportunity to<br />
receive research assistance for a certain time of the year, as well as additional funding on<br />
a long-term basis.<br />
African spring time (September - November) is the only time of the year when a variety of<br />
research activities can be carried out simultaneously. Therefore expeditions take place<br />
during this season (Fig. 2.1.b).<br />
In September and October most trees and shrubs are still leafless and detection rate for<br />
wildlife is high. This allows more accurate game counts than during vegetation periods.<br />
Besides, ground cover (grass) is sparse, so that carnivore tracks can be easily detected<br />
and followed. Due to the lack of rain during this season permanent access to all parts of<br />
the research area is possible. Traps are not washed away by flash floods and captured<br />
animals do not get hypothermic from being drenched. Furthermore temperatures are<br />
moderate so that trapped animals are neither harmed by frost during the night, nor by<br />
extreme heat during the day.
Figure 2.1.b. Time schedule of research activities conducted throughout the year.<br />
The expedition in 2007 took place from 3 September to 3 November. It was the third one<br />
at Okomitundu study site (Figs. 2.2.a, b & c). The expedition teams consisted of four<br />
groups of 12 team members plus staff (see 1.7). Each group worked for two weeks, and<br />
was divided daily into four research activity teams. Each team of three team members,<br />
which was guided by a local scientist, student or the expedition leader, had the use of a<br />
Land Rover Defender 110 Station Wagon or a Land Rover Defender 130 Double Cab.<br />
Team members rotated through the various activities daily. This expedition design led to a<br />
large amount of data being collected.<br />
2.2. Study Area<br />
The central coordinates of Okomitundu study site are 22°09’S and 16°16’E (Fig. 2.2.a).<br />
Figure 2.2.a. Satellite image of Okomitundu study site. Bold black line = farm boundaries. See also Google Maps.<br />
14<br />
� Okatumba Wildlife Research<br />
www.okatumba.de
The study site has a core area of about 180 km² where most research activities such as<br />
capture, mark and release, sample collection, telemetry, spoor count and spoor tracking as<br />
well as counting prey animals take place. Okomitundu consists of a game-proof fenced<br />
area (95 km²), which is the western part of the farm, and a cattle-proof fenced area (85<br />
km²), which is situated east of the main buildings. These two farm areas are divided by the<br />
district road (D1967) that runs from Wilhelmstal to Otjimbingwe (Fig 2.2.b). Okomitundu<br />
hosts a few goats and some cattle, but the predominant enterprise is a guest farm.<br />
Figure 2.2.b. Study site showing roads (red), tracks (dotted black), fences (brown), watering places (blue).<br />
The average farm size (commercial unit) in Namibia depends on the average annual<br />
rainfall and ranges from 5,000 ha in the North to 30,000 ha in the South (Brown 1992). For<br />
reasons of efficient livestock management, farm areas are divided into smaller units, called<br />
“camps”. Watering places are supplied with ground water pumped through wind power,<br />
each providing water for four camps. Livestock herds are rotated from camp to camp,<br />
depending on the season and quality of grass.<br />
Private farmland in Namibia is fenced in, either with stock-proof fences on cattle farms, or<br />
with game-proof fences on game farms. Many farmers substitute their decreasing<br />
revenues from livestock breeding by consumptive and non-consumptive use of wildlife<br />
(Barnes & de Jager 1996). This leads to both types of fences on one property. Stock-proof<br />
fences are 1.40 m in height and consist of five wires running between wooden poles.<br />
These fences keep cattle within restricted grazing areas (camps), but are no barrier for the<br />
local wildlife. Game-proof fences are either 1.40 m in height and consist of eight to eleven<br />
wires, or 2.20 m in height and consist of 18 to more than 20 wires.<br />
15<br />
� Okatumba Wildlife Research<br />
www.okatumba.de
The first type restricts “crawling” game like gemsbok (Oryx gazella) or hartebeest<br />
(Alcelaphus buselaphus), which can crawl under fences, but it can be crossed by<br />
“jumping” game like kudu (Tragelaphus strepsiceros) or eland (Taurotragus oryx), which<br />
jump over the fence. The second fence type prevents movement of jumping species too.<br />
However, holes dug by warthogs (Phacocoerus africanus) are also used by other species<br />
such as small antelopes such as steenbok (Raphicerus campestris) or duiker (Sylvicapra<br />
grimmia) and all carnivores (personal observation).<br />
Since Okomitundu is a game farm, few internal fences exist. One camp in the eastern part<br />
of the farm is used to keep some goats and cattle, as well as about 20 horses. Another<br />
camp in the western part serves to habituate game animals that are introduced to the<br />
game-proof fenced area.<br />
Large parts of Okomitundu are covered with open shrub savannah, followed by tree and<br />
shrub savannah and mountain vegetation. The remaining parts consist of closed shrub<br />
savannah, open and closed woodland, as well as watercourse woodland (Fig. 2.2.c).<br />
Figure 2.2.c. Vegetation map of the study site.<br />
Characteristic plant species are shepherd’s tree, trumpet thorn tree, grewia and justicia, as<br />
well as several acacia species like yellow-bark acacia, red thorn, black thorn and camel<br />
thorn.<br />
16<br />
� Okatumba Wildlife Research<br />
www.okatumba.de
Okomitundu study site hosts a variety of wildlife, and in June 2007 four sub-adult giraffes<br />
(two males, two females) were introduced into the game-proof fenced area. The dominant<br />
game species are kudu, gemsbok, mountain zebra, steenbok, warthog, hartebeest, eland<br />
and springbok. Densities of potential prey species are considered to be low to medium,<br />
and persecution of large carnivores by humans is assumed to be medium (personal<br />
observation and personal communication).<br />
2.3. Study Animals<br />
At Okomitundu the study expanded to the behavioural ecology of three large carnivore<br />
species: the cheetah, the leopard and the brown hyaena, all of them present outside<br />
protected areas on private farmland in Namibia.<br />
The cheetah is listed in Appendix I in CITES (Convention on International Trade in<br />
Endangered Species of Wild Fauna and Flora) and protection of this highly endangered<br />
species is of outstanding importance (Nowell & Jackson 1996). Since the 70s the<br />
cheetah’s distribution has been drastically reduced and fragmented. According to Marker<br />
(1998), Myers (1975) and Nowell & Jackson (1996), the global population fell from about<br />
30,000 animals in 1975 to fewer than 15,000 in the 90s. It is assumed that the vast<br />
majority of cheetah populations are concentrated in sub-Saharan Africa (Estes 1997) with<br />
Namibia having about one third of the world’s population. Significant populations are also<br />
present in Botswana, South Africa, Tanzania, Kenya and Zimbabwe (Bashir et al. 2005).<br />
The cheetah is the most specialized of all cats. It is lightly built with long, thin legs, small<br />
feet and a small, rounded head with foreshortened face. The ears are broad but low, and<br />
the teeth, especially the canines, are relatively small. Cheetahs have a tawny colouration<br />
with white underparts and fluffy hair on their abdomen and chest. The black, rounded<br />
spots are small and solid, and the outer part of the long, white-tipped tail is black and white<br />
ringed. Characteristic of this species are black “tear lines” running from the eyes to the<br />
mouth (Estes 1997). Cheetahs are diurnal and most active around sunrise and sunset.<br />
Females live either solitary or they are accompanied by their offspring. Male cheetahs may<br />
range alone or in coalitions of up to five animals (Skinner & Smithers 1990). These<br />
cheetah groups are considered to be brothers of the same litter. The cheetah is built for<br />
speed and specialised to prey on the fastest antelopes, especially gazelles. Cheetahs<br />
chase their intended prey over short distances (not more than 300 m) and kill them<br />
through strangulation. They lack the strength and weapons to defend their kill or their<br />
youngsters against aggressive competitors such as lions or spotted hyaenas. Thus<br />
Namibian farmland with permanent water supply, plenty of small to medium-sized prey<br />
mammals and no lions or spotted hyaenas provides an optimal habitat for the cheetah.<br />
The leopard is the most ubiquitous wild cat - it occurs throughout Africa and from the<br />
Arabian Peninsula through Asia to Manchuria and Korea. Nevertheless it is listed in<br />
Appendix II in CITES (Nowell & Jackson 1996).<br />
17<br />
� Okatumba Wildlife Research<br />
www.okatumba.de
In contrast to cheetahs, the leopard is the least specialized of the big cats (Estes 1997). It<br />
is strong and compact built with short and massive limbs, a wide head with short, powerful<br />
jaws and long canines. The base colour is tan, but highly variable depending on the<br />
habitat. The black spots are grouped in rosettes on the torso and upper limbs. The long tail<br />
is spotted or rosetted. Males are significantly bigger and heavier than females. Leopards<br />
are nocturnal and solitary. Mother and offspring stay together for about 20 months, but<br />
adults associate for mating purposes only. Both sexes are territorial and defensive against<br />
conspecifics of the same sex. Leopards are stalkers and pouncers; they do not chase their<br />
prey over long distances. Leopards kill their prey by biting through the throat and nape of<br />
the neck. They tend to prey on animals below 70 kg, which are predominantly mediumsized<br />
antelopes, as well as the young of larger species, but also hares, hyrax, birds and<br />
even insects. We hypothesise that the common practise of hiding and eating kills in trees<br />
is not observed where lions and hyaenas are not present, e.g. Namibian farmland.<br />
Like the leopard, the brown hyaena is listed in Appendix II in CITES. Its occurrence is<br />
limited to the South West Arid Zone, mainly Namibia and Botswana, but also South Africa<br />
(Estes 1997). The brown hyaena is of typical hyaena build, being higher at the shoulder<br />
than at the rump. Head, neck and shoulders are large. The brown hyaena has long,<br />
pointed ears, and the muzzle is broad with robust teeth for cracking bones. The shaggy<br />
coat is dark brown with partly straw-coloured hair; the legs are dark yellow-brown with<br />
black stripes. As in the cheetah, there is no significant difference between the sexes.<br />
Brown hyaenas are nocturnal and live in groups of up to 15 animals. These clans occupy<br />
fixed territories and their social structure is highly developed. The cubs are reared<br />
communally in a centrally located den. Brown hyaenas are opportunistic foragers that<br />
predominantly scavenge. They eat almost everything even insects, as well as various fruit<br />
and vegetables. Brown hyaenas show no more respect for leopards than for cheetahs.<br />
They are large and aggressive enough to chase a male leopard from its kill. It often<br />
happens that brown hyaenas cache some parts of a kill in a thicket or take scavenged<br />
items back to the den.<br />
2.4. Demography of Large Carnivores<br />
2.4.1. Introduction<br />
To understand the ecological factors that determine demographic trends in carnivores, it is<br />
important to study free-ranging populations under natural selection pressure. Vital rates of<br />
large carnivores have been reported in East Africa (Caro 1994, Laurenson 1995), but<br />
cheetahs, leopards and brown hyaenas in Namibia are subject to different conditions. Due<br />
to constant conflict with farmers, large carnivores in Namibia suffer high levels of removal<br />
(Marker et al. 2003a). Determination of vital rates and demographic parameters such as<br />
sex ratios, age and social structure, litter sizes and survivorship is needed to establish<br />
whether the level of removal threatens the long-term viability of the populations.<br />
18<br />
� Okatumba Wildlife Research<br />
www.okatumba.de
Due to persecution by humans, predators on Namibian farmland live very secretive lives<br />
(Gaerdes 1974, McVittie 1979, personal observation). The difficulty of observation in the<br />
wild, especially bushy areas, and the wariness of Namibian large carnivores require the<br />
use of indirect sampling methods, rather than depending on direct observations. This is<br />
why capture, mark and release, counting spoor frequencies and radio telemetry are<br />
combined in this study.<br />
2.4.2. Methodology<br />
Box traps are either located at cheetah marking trees (Fig. 2.4.2.b), in riverbeds, which are<br />
frequently used as travel routes by large carnivores, or near to fresh carcasses. While it is<br />
impossible to bait a cheetah (as cheetahs will only consume their own fresh kills), leopards<br />
and brown hyaenas can be baited by pieces of meat fixed in a box trap (personal<br />
observation). In order to capture cheetahs, marking trees, which function as an important<br />
place of communication for cheetahs, are enclosed in a thorny hedge, and the box trap is<br />
the only access route to the tree. Figure 2.4.2.a presents the box trap distribution within<br />
the study site during the expedition in 2007.<br />
Figure 2.4.2.a. Box traps locations during 2007 expedition.<br />
Study animals are live-trapped using capture cages with trap release doors at each end<br />
and a trigger plate in the middle (Fig. 2.4.2.b). Box traps are checked every morning. The<br />
members of the box trap team also search for carnivore tracks around the traps. Box traps<br />
were either found open, or closed without an animal inside or closed with an animal inside.<br />
19<br />
� Okatumba Wildlife Research<br />
www.okatumba.de
Captured animals, others than cheetahs, leopards or hyaenas were released by the box<br />
trap team immediately.<br />
Figure 2.4.2.b. Arming a box trap located at a cheetah marking tree.<br />
Large carnivores were immobilised, radio-collared (adults only), marked with ear tags and<br />
transponders (all animals), thoroughly investigated, sampled and released in the early<br />
morning of the following day with all expedition team members present (Fig. 2.4.2.c).<br />
Figure 2.4.2.c. Investigation of an immobilised brown hyaena.<br />
20<br />
� Okatumba Wildlife Research<br />
www.okatumba.de
Immobilisation of the study animals is achieved by using a blow pipe (cheetahs, hyaenas;<br />
Fig. 2.4.2.d) or a dart gun (leopards), the reversal agent is injected with a hand syringe.<br />
Cheetahs and leopards are immobilised with 0,4 ml HBM (Hellabrunner mixture: 100mg<br />
Ketamine + 125mg Xylazine/ml) per 10 kg body mass, and reversed with 1mg Yohimbine<br />
per 10 kg body mass. 15 to 20 minutes after administration of the antidote, the animal<br />
recovers from immobilisation. Darting is performed by a trained and authorised person,<br />
ideally a vet.<br />
Because of their different metabolism, brown hyaenas are immobilised with Zoletil (50<br />
mg/ml Tileatmine and 50 mg/ml Zolazepam). This drug is not reversible, so some of the<br />
team members must wait at the capture site until the animal wakes up on its own.<br />
Figure 2.4.2.d. Immobilisation of a brown hyaena using a blow pipe.<br />
From each immobilised animal, a set of samples are taken (2.4.2.e). These samples are<br />
stored either in ethanol (e.g. hairs for DNA analysis), in a deep freezer (e.g. faeces for<br />
prey identification) or in liquid nitrogen (e.g. saliva, blood for parasitology, virology). Blood<br />
samples are collected in three different tube types: red ones without any detergent, green<br />
ones with heparin and purple ones with EDTA.<br />
While working in the field blood samples are put into a cool box. Shortly after arrival at the<br />
farmhouse they are processed into serum, plasma, buffy coat and blood clots using a<br />
centrifuge. These component parts are then pipetted in plastic vials and stored in a liquid<br />
nitrogen container. Saliva, conjunctival fluid and nasal smear are put into liquid nitrogen<br />
immediately after taking the samples at the capture site.<br />
21<br />
� Okatumba Wildlife Research<br />
www.okatumba.de
Figure 2.4.2.e. Taking samples from a brown hyaena.<br />
Samples from our previous study sites were sent to the Institute for Zoo and Wildlife<br />
Research (IZW) in Berlin, Germany for analysis. Results gleaned from the analyses have<br />
recently been published by Wachter et al. 2006 and Thalwitzer 2007, showing that<br />
cheetahs living on Namibian farmland are in good to excellent health, reproduce well and<br />
rarely prey on live stock.<br />
Samples from the current study site were given to a laboratory based in South Africa and<br />
are in the process of being analysed. Results are expected for early 2010.<br />
2.4.3. Results<br />
Capture activities in the Okomitundu study site started in July 2005. Since then, seven<br />
cheetahs, six leopards and four brown hyaenas were captured (Table 2.4.3.a).<br />
Table 2.4.3.a. Large carnivores captured at Okomitundu study site from July 2005 to October 2007.<br />
Study animals NM NF NJM NJF N Tot N collared animals<br />
Free-ranging cheetahs 7 - - - 7 3<br />
Free-ranging leopards 4 2 - - 6 5<br />
Free-ranging brown hyaenas 1 - 3 - 4 1<br />
NM: number of adult males; NF: number of adult females; NJM: number of juvenile males; NJF: number of<br />
juvenile females; NTot: number of total animals.<br />
22<br />
� Okatumba Wildlife Research<br />
www.okatumba.de
All captured animals were immobilised, except one male leopard, which was very old and<br />
in a bad state of health, and two brown hyaenas, which were too young. One group of four<br />
sub-adult male cheetahs, as well as one brown hyaena were immobilised, but too young to<br />
be fitted with a collar. One male cheetah coalition (three animals), five leopards (three<br />
males, two females) and one male hyaena were radio-collared (Table 2.4.3.b).<br />
Table 2.4.3.b. Capture data of the study animals at Okomitundu.<br />
Date of capture ID Species Sex Age Mass Condition Collar Comments<br />
2005-08-08 F001 Cheetah male < 2 years 41 kg good no full stomach<br />
2005-08-07 F002 Cheetah male < 2 years 32 kg good no<br />
2005-08-08 F003 Cheetah male < 2 years 38 kg good no full stomach<br />
2005-08-08 F004 Cheetah male < 2 years 34 kg good no bleeding gums<br />
2005-08-10 F005 Cheetah male ~ 4 years 60 kg excellent yes<br />
2005-08-11 F006 Cheetah male ~ 4 years 57 kg excellent yes dead in Sep 2007<br />
2005-08-11 F007 Cheetah male ~ 4 years 56 kg excellent yes<br />
2005-10-30 F008 Leopard male 3-4 years 61 kg excellent yes dead in June 2006<br />
2005-11-15 - Leopard male very old N/A very bad no not immobilised<br />
2006-05-15 F009 Leopard female 2,5 years 29 kg excellent yes part of tail missing<br />
2006-06-04 F010 Leopard male > 8 years 52 kg good yes dead in July 2006<br />
2006-09-20 F011 Leopard male ~ 4 years 63 kg excellent yes dead in Nov 2006<br />
2006-09-21 F012 Leopard female ~ 3 years 32 kg excellent yes mating with F011 (?)<br />
2006-10-17 F013 Brown Hyaena male < 1 year 25 kg good no changing teeth<br />
2006-10-25 - Brown Hyaena male < 1 year N/A good no not immobilised<br />
2007-09-12 F014 Brown Hyaena male 3-4 years 34 kg good yes<br />
2007-09-23 - Brown Hyaena male < 2 years N/A good no not immobilised<br />
During the expedition six box traps were set throughout the study site (Fig. 2.4.2.a). Each<br />
trap, which is set active, counts as one trap night. One night with six armed box traps is<br />
therefore counted as six trap nights. During the expedition in 2007 box traps were active<br />
on 44 days with a total of 259 trap nights (Table 2.4.3.c).<br />
Table 2.4.3.c. Trapping effort and success during the expedition in 2007.<br />
23<br />
2007<br />
Group 1 Group 2 Group 3 Group 4<br />
Number of trap nights 61 66 66 66 259<br />
- open traps 44 49 49 61 203<br />
- closed but empty traps 9 10 12 1 32<br />
- captures 8 7 5 4 24<br />
� Okatumba Wildlife Research<br />
www.okatumba.de<br />
Total
The box trap team found 78.4% of the traps open, 12.3% per cent of the traps were closed<br />
but empty and 9.3% captured an animal (Fig. 2.4.3.a). Two hyaenas, one caracal, eleven<br />
baboons, three honey badgers, five porcupines and two warthogs were caught.<br />
closed but<br />
empty<br />
12.3%<br />
24<br />
captures<br />
9.3%<br />
� Okatumba Wildlife Research<br />
www.okatumba.de<br />
open traps<br />
78.4%<br />
Figure 2.4.3.a. Open traps, closed but empty traps and captures during the expedition in 2007.<br />
With a total of 1480 trap nights from July 2005 to November 2007 at Okomitundu study<br />
site an average of 87 trap nights per large carnivore capture can be calculated. All<br />
captured study animals at Okomitundu, except of one very old male leopard, were in a<br />
good to excellent condition.<br />
2.4.4. Discussion<br />
The number of captures at Okomitundu study site was too low to generate reliable data on<br />
the demography of large carnivores in this area. However, we were able to gather some<br />
information on leopard demography, identifying that the sex ratio between adults was two<br />
males to one female (n=6). Additional conclusions about cheetah, leopard and brown<br />
hyaena demography could be drawn through spoor counting and spoor tracking activities<br />
(see. 2.5.3).<br />
The ratio between open traps, closed but empty traps and captures at Okomitundu was<br />
almost equally distributed between the three expeditions in 2005, 2006 and 2007. In 2006<br />
the proportion of trapped large carnivores to total captures was relatively high. We used<br />
the same box trap locations in 2007 in the hope of achieving capture ratios similar to 2006,<br />
but were unable to. Prey availability in 2007 was higher than in 2006, and many more<br />
carnivore tracks were detected. Thus lower capture success in 2007 appears to be a result<br />
of learning: tracks of our study animals were around the traps, but the carnivores did not<br />
enter.
In 2006 and 2007 the number of captures decreased from the first to the last expedition<br />
group. Although this phenomenon did not occur in 2005, we assume this to be due to an<br />
intrinsic factor such as disturbance through running the expedition. Possible extrinsic<br />
factors, which were discussed for 2006, do not fit for 2007.<br />
In areas where cheetahs occur in higher densities than at Okomitundu (e.g. Omitara and<br />
Seeis study sites) they appear to be easier to capture. This is mainly due to their<br />
peculiarity of using marking trees for intra-specific communication. In those regions<br />
capture, mark and release is a very useful methodology to determine population<br />
demography of this species. In contrast to this, it appears to be more suitable to work with<br />
indirect sampling methods such as FIT (footprint identification technique - see 2.10. Future<br />
of the Large Carnivore Research Project) in regions with low cheetah density such as the<br />
Okomitundu study site.<br />
Regarding brown hyaenas we found that this species is extremely difficult to capture. We<br />
often detected hyaena tracks around the traps, and several times they managed to steal<br />
the bait out of an armed box trap without triggering the mechanism. For future research we<br />
therefore propose to establish “hyaena restaurants” and to dart the animals by use of a<br />
dart gun at the bait. Since the brown hyaena reacts very quickly to the drug the proposed<br />
method is safe, because the immobilised animal does not move far and will be found<br />
within a few minutes.<br />
Although it is easy to get leopards used to “leopard restaurants” (personal observation),<br />
which is very feasible for non-consumptive eco-tourism, the above darting method would<br />
not be suitable as leopards can take up to 20 minutes before reacting to the drug.<br />
Looking at cheetah captures in our previous study areas (Omitara and Seeis), sex ratio<br />
between juveniles (11 males and 10 females) was nearly 1:1, whilst sex ratio between<br />
adults (n=49) was strongly biased towards males with 3.9 males to 1 female. We believe<br />
this bias to be a product of our trapping methodology. Since marking trees are more<br />
frequently used by male cheetahs than by females, males are more likely to be captured.<br />
The sex ratio of 230 adult cheetahs examined by the Cheetah Conservation Fund (CCF)<br />
over a time period of twelve years was at 2.9 males to 1 female (Marker et al. 2003a) while<br />
AfriCat reports a sex ratio of 1.75 males to 1 female (Conradie 2006).<br />
Our findings that almost half of the males (n=19) roam alone, whilst the other half (n=20)<br />
live in coalitions matches with results from CCF and AfriCat. CCF examined 73 single<br />
males and 97 coalition males (Marker et al. 2003), and AfriCat found 16% of all captured<br />
cheetahs to be adult single males, while 20% were adult males in coalitions (Conradie<br />
2006). One doctoral student of the IZW (Institute for Zoo and Wildlife Research), who<br />
worked with us at Omitara and Seeis study sites, discovered that cub survival of cheetahs<br />
living on private farmland in Namibia is almost five times higher than in the Serengeti<br />
(Thalwitzer 2007). Moreover, the CCF found the proportion of young animals increased<br />
during their long-term study (Marker et al. 2003a). These findings support the theory that<br />
farmers predominantly have an impact on the adult cheetah population.<br />
25<br />
� Okatumba Wildlife Research<br />
www.okatumba.de
2.5. Population Density of Large Carnivores<br />
2.5.1. Introduction<br />
Monitoring the abundance and distribution of animals is fundamental to the research,<br />
management and conservation of wildlife populations. Estimates of abundance are<br />
particularly important where the principal objectives are to assess, maintain and enhance<br />
the size of endangered target populations. That is why this project aimed to establish<br />
spoor density as an index for true cheetah, leopard and brown hyaena density, similar to<br />
the methodology developed by Stander et al. (1997) for lion, leopard and wild dog. In order<br />
to do this, the true population density has to be ascertained by confirming the presence of<br />
each individual carnivore that uses the study area. Once this is done spoor counts can be<br />
made to asses the relationship between true population density and spoor density. The<br />
assumption is of course that there is a predictable relationship between the two and that<br />
higher population densities of large carnivores result in higher spoor densities, while lower<br />
spoor densities indicate lower population densities.<br />
In Namibia lions, spotted hyaenas and wild dogs are mainly restricted to protected areas,<br />
whereas cheetahs, leopards and brown hyaenas still occur on areas with intensive<br />
livestock and/or game farming (Berry et al. 1997). Bashir et al. (2005) and Kraus & Marker-<br />
Kraus (1991) think that Namibia hosts the largest population of cheetahs in the world, but<br />
to date no reliable population density estimates exist and Namibian cheetah ecology is<br />
poorly understood. This lack of scientific data makes management and conservation of the<br />
species difficult. We believe that the frequently used and well published figure of 2,000 to<br />
3,000 cheetahs for Namibia (Marker et al. 2003b, Morsbach 1987) underestimates the true<br />
population density considerably. More recent data from the Large Carnivore Atlas (Stander<br />
& Hanssen 2003) programme indicate that cheetah numbers might be double or even<br />
more than this.<br />
Direct assessments of population density depend on recognition of individuals and groups,<br />
and as such they are very expensive and time-consuming (Stander 1998). Indirect<br />
sampling methods (Becker et al. 1998, Martin & de Meulenaer 1988, Mills et al. 2001,<br />
Panwar 1979, Smallwood & Fitzhugh 1995) are cost-effective, objective and repeatable,<br />
but are questioned by some (Norton 1990). Stander (1998) criticises a general lack of<br />
understanding the results of indirect sampling because only a few studies have combined<br />
both direct and indirect measurements. In his study on lions, leopards and wild dogs he<br />
found a strong linear correlation between spoor density and true population density.<br />
2.5.2. Methodology<br />
The current project aims to provide reliable data on cheetah, leopard and brown hyaena<br />
density through a combination of mark-recapture (Caughley 1977, Cormack 1968, Otis<br />
1978), telemetry (MacDonald & Amlaner 1980, Sargeant 1980) and counting spoor<br />
frequencies (Stander 1998, Stander et al. 1997). All these techniques were employed by<br />
the expeditions at all study sites from 2002 to 2007.<br />
26<br />
� Okatumba Wildlife Research<br />
www.okatumba.de
Counting Spoor Frequencies<br />
Every morning the spoor counting team covered one of four different transects in search<br />
for large carnivore tracks that either run along the path or cross the path. This team was<br />
joined by a local tracker (bushman). One expedition team member and the tracker place<br />
themselves on the mudguard of the Land Rover (Fig. 2.5.2.a) to detect spoors while the<br />
Land Rover was driven at walking pace.<br />
Figure 2.5.2.a. Counting spoor frequencies along transects.<br />
The four transects were sampled alternately at equal frequency. When a cheetah, leopard<br />
or hyaena track was found, its GPS position was recorded using a Silva Multi-Navigator.<br />
All relevant information such as date, time, start and end position, as well as the total<br />
length of the transect, species, number of animals, sex and age class, freshness and<br />
direction of the track, and further comments were collected in data sheets. Negative<br />
results (no tracks found along transect x on day y) were included into data analyses.<br />
These data were entered into an Excel database to assess spoor density (number of<br />
individual carnivores’ spoor per area unit), as well as spoor frequency (number of<br />
kilometres per individual carnivore spoor) and to calculate correlation coefficients. Only<br />
fresh tracks (� 24 hours) were used for analysis. Observations of tracks were weighted by<br />
group size. Therefore, spoor refers not to a group of animals, but to an individual<br />
carnivore. An individual animal’s spoor was only counted once per day.<br />
27<br />
� Okatumba Wildlife Research<br />
www.okatumba.de
Radio Telemetry<br />
The VHF radio collars, receiver, headphones and antenna used in this study are from ATS<br />
(Advanced Telemetry Systems) in Minnesota, USA. The collars weigh 240 g, which is less<br />
than one per cent of the study animal’s body mass. They are fitted with activity and<br />
mortality sensors and emit three types of signals: resting signal - regular single signals<br />
when the animal is resting; activity signal - irregular signals of different rhythm when the<br />
animal is walking or running; mortality signal - regular single signals, but twice as frequent<br />
as the resting signal when either the collar was lost or the animal was dead<br />
The collars are equipped with a VHF antenna, 30 cm in length, extending 17cm from the<br />
collar. The other half of the antenna is embedded in the collar band. The batteries of the<br />
collars last for approximately three years.<br />
Every day the telemetry team covered central parts of the study area. To locate collared<br />
animals, the team stopped at vantage points (Figure 2.5.2.b) and tried to receive signals<br />
emanating from the surrounding area with the radio telemetry equipment (see cover page).<br />
At every stop the date, the time and the GPS position were recorded using a Silva Multi-<br />
Navigator. If a signal was detected, the signal bearing was measured with a Silva<br />
compass. The strength of the signal and the activity status of the study animal were<br />
recorded, too.<br />
Figure 2.5.2.b. Map of the study area with fixed spots (vantage points) to perform ground telemetry.<br />
28<br />
� Okatumba Wildlife Research<br />
www.okatumba.de
These data had to be collected at three different locations (triangulation) to get reliable<br />
information on cheetah and leopard positions and movements. Telemetry data were<br />
entered into an Excel database for further processing with different extensions to ArcView<br />
such as Home Range Extension, Animal Movement (Hooge & Eichenlaub 1997) or Spatial<br />
Analyst (Hooge et al. 2001). Various methods may be used to analyse telemetry data. In<br />
this report we look at two of them: the Minimum-Convex-Polygon (MCP) method and the<br />
Kernel method.<br />
The MCP method is one of the earliest (Hayne 1949) and still a widely used method for<br />
calculating home ranges (Harris et al. 1990). In this method the peripheral locations of a<br />
given data set are connected so that they form a polygon. The MCP method is very simple<br />
and the resulting home ranges are strictly comparable between studies, but it has several<br />
disadvantages. For example, the home range is highly correlated to the number of<br />
locations, and it does not give any information on how the area is used. Evaluation of<br />
areas that are more important to the animal than others is not possible with the MCP<br />
method. Besides, occasional exploration trips of an animal may lead to home range sizes<br />
that are (much) too large. This is why researchers often take a certain part of the locations<br />
(e.g. 95%) for data analysis only (see Fig 2.5.2.c).<br />
Currently, the Kernel method is considered to be the most suitable one for home range<br />
estimation (Powell 2000, Worton 1995). With this method a probability density function<br />
from the locations is calculated in order to determine a utility distribution. Home ranges are<br />
then defined by drawing contours around areas with equal intensity of use. From a<br />
biological point of view the Kernel method is much more reasonable than the MCP method<br />
(Fig. 2.5.2.d).<br />
Fig. 2.5.2.c. Home ranges of four female cheetahs<br />
using the MCP method (95%). Background: farm<br />
boundaries.<br />
Fig. 2.5.2.d. The same home ranges estimated with<br />
the Kernel method. Background: farm boundaries.<br />
To visualize this method each location is covered by a three-dimensional bell-curve, the<br />
kernel. Directly at the data point the intensity of use is high. The further away from the<br />
location, the flatter the kernel becomes, and the smaller the intensity of use by the animal<br />
is. The resulting home range looks like a hilly surface. Hills resemble areas that are<br />
intensely used by the animal, valleys show areas that are less frequently used. The<br />
method itself selects occasional explorations of the animal, which are not part of the<br />
estimated home range.<br />
29<br />
� Okatumba Wildlife Research<br />
www.okatumba.de
2.5.3. Results<br />
In 2007 expedition team members performed spoor counts along four different transects<br />
35 times (range 7-11 times each). They drove a total of 269 km. The expedition found 11<br />
cheetah tracks, 20 leopard tracks and 13 hyaena tracks during spoor count activities. An<br />
additional 24 cheetah tracks, 47 leopard tracks and 27 hyaena tracks were detected by<br />
chance (Table 2.5.3.a). This gives us a total amount of 35 cheetah tracks, 67 leopard<br />
tracks and 40 hyaena tracks.<br />
Table 2.5.3.a. Total numbers of large carnivore spoors detected during the expedition in 2007.<br />
Cheetah Leopard Brown Hyaena<br />
spoor count by chance spoor count by chance spoor count by chance<br />
Group 1 4 7 4 14 4 12<br />
Group 2 2 8 6 12 3 7<br />
Group 3 3 6 6 16 1 6<br />
Group 4 2 3 4 5 5 2<br />
TOTAL 11 24 20 47 13 27<br />
While the total amount of large carnivore spoors detected on expedition was similar during<br />
the previous two years (88 tracks in 2005 and 92 tracks in 2006), it increased during the<br />
expedition in 2007 to a total amount of 142 carnivore tracks. This increase was mainly due<br />
to spoors detected by chance: in 2005 team members detected 50 carnivore tracks while<br />
they were conducting other activities, in 2006 the expedition found 62 tracks somewhere in<br />
the field and in 2007 this figure was 98. The total amount of large carnivore spoors, which<br />
were detected by the expedition on transects, was 38 in 2005, 30 in 2006 and 44 in 2007.<br />
The composition of large carnivore species in 2007 was dominated by leopards (47.2%),<br />
while the proportion of cheetah and hyaena tracks was nearly equal (Fig. 2.5.3.a). This<br />
result matches with findings from 2006.<br />
hyaena<br />
28.2%<br />
30<br />
� Okatumba Wildlife Research<br />
www.okatumba.de<br />
cheetah<br />
24.6%<br />
leopard<br />
47.2%<br />
Figure 2.5.3.a. Ratio between large carnivore spoors detected during the expedition in 2007.
Figure 2.5.3.b. Locations of cheetah spoors that were detected during spoor counts (on transect, dark yellow dots) or<br />
other research activities (by chance, light blue dots) in September/October 2007.<br />
Figure 2.5.3.c. Locations of leopard spoors that were detected during spoor counts (on transect, dark yellow dots) or<br />
other research activities (by chance, light blue dots) in September/October 2007.<br />
31<br />
� Okatumba Wildlife Research<br />
www.okatumba.de
Figure 2.5.3.d. Locations of brown hyaena spoors that were detected during spoor counts (on transects, dark yellow<br />
dots) or other research activities (by chance, light blue dots) in September/October 2007.<br />
Figs. 2.5.3.b-d show the distribution of large carnivore spoors and indicate that cheetahs<br />
mainly range in the central part of the study site, while brown hyaenas predominantly<br />
occur in the eastern part. Leopards mainly range in the west, but also occur in the eastern<br />
part. This pattern (Fig. 2.5.3.g) was also observed in 2005 and 2006 (Figs. 2.5.3.e-f) and<br />
does not come as a surprise. Firstly leopards prefer mountainous habitat, as present in the<br />
western area. Secondly, a brown hyaena den is situated in the Apostle hills in the<br />
southeast of the study site. Thirdly, on Namibian farmland the leopard is the only<br />
competitor to the cheetah, and the latter is therefore likely to avoid areas where many<br />
leopards occur.<br />
On the basis of the large carnivore tracks detected during the 2007 expedition, seven<br />
individual cheetahs, nine individual leopards and six individual brown hyaenas were<br />
identified (Table 2.5.3.b).<br />
Table 2.5.3.b. Numbers of individual carnivores identified on the basis of<br />
tracks during the expedition in 2007.<br />
males females juveniles Total<br />
Cheetah 4 2 1 7<br />
Leopard 4 4 1 9<br />
Hyaena 3 2 1 6<br />
32<br />
� Okatumba Wildlife Research<br />
www.okatumba.de
Figure 2.5.3.e. Locations of cheetah (blue dots), leopard (green dots) and<br />
brown hyaena (yellow dots) spoors that were detected in October/November 2005.<br />
Figure 2.5.3.f. Locations of cheetah (blue dots), leopard (green dots) and<br />
brown hyaena (yellow dots) spoors that were detected in September/October 2006.<br />
33<br />
� Okatumba Wildlife Research<br />
www.okatumba.de
Figure 2.5.3.g. Locations of cheetah (blue dots), leopard (green dots) and<br />
brown hyaena (yellow dots) spoors that were detected in September/October 2007.<br />
During the expedition in October/November 2005 nine individual cheetahs were ranging<br />
within the core area of the Okomitundu study site. In 2006 the expedition team found<br />
spoors of five individual cheetahs only. Accordingly cheetah spoor density and spoor<br />
frequency varied from year to year (Table 2.5.3.c).<br />
Table 2.5.3.c. Cheetah spoor density and cheetah spoor frequency at Okomitundu in 2005, 2006 and 2007.<br />
Oct - Nov 2005<br />
Okomitundu<br />
34<br />
Sep - Oct 2006<br />
Okomitundu<br />
� Okatumba Wildlife Research<br />
www.okatumba.de<br />
Feb - Aug 2007<br />
Okomitundu<br />
Sep - Oct 2007<br />
Okomitundu<br />
Total number of transects 52 38 31 35<br />
Total number of kilometres driven 411 343 259 269<br />
Total number of cheetah tracks 20 7 18 11<br />
Spoor density (tracks per 100km²) 4.9 2.0 6.9 4.1<br />
Spoor frequency (km per track) 20.6 49.0 14.4 24.5<br />
The table above and the two tables below summarise the results of four different sets of<br />
spoor data at Okomitundu study site. In 2005 the expedition found 4.9 cheetah tracks per<br />
100 km² and spoor frequency was 20.6 km (range 0.2 to 57.9 km) per cheetah track (table<br />
2.5.3.c). In 2006 expedition team members counted 2.0 cheetah tracks per 100 km² only.<br />
Accordingly spoor frequency decreased to 49.0 km (range 0.2 to 98.6 km) per cheetah<br />
track. From February to August 2007 Okatumba Wildlife Research found an increase of<br />
6.9 cheetah tracks per 100 km² and spoor frequency was 14.4 km (range 0.2 to 30.8 km)
per cheetah track. During the 2007 expedition these figures decreased again: 4.1 cheetah<br />
tracks per 100 km² were detected and spoor frequency was 24.5 km (range 1.7 to 74.3<br />
km) per cheetah track (Table 2.5.3.c).<br />
In 2005 the expedition counted 2.2 leopard tracks per 100 km² and spoor frequency was<br />
45.6 km (range 1.7 to 55.2 km) per leopard track (Table 2.5.3.d). In 2006 expedition team<br />
members found an increase in spoor density to 3.5 leopard tracks per 100 km².<br />
Accordingly spoor frequency increased to 28.6 km (range 1.2 to 49.1 km) per leopard<br />
track. Data collected by Okatumba Wildlife Research from February to August 2007<br />
showed figures similar to those found during the 2005 expedition: 2.3 leopard tracks per<br />
100 km² were counted, and spoor frequency was 43.2 km (range 2.6 to 63.8 km) per<br />
leopard track. In contrast to this spoor density during the 2007 expedition was 7.5 leopard<br />
tracks per 100 km². Accordingly spoor frequency increased remarkably to 13.4 km (range<br />
0.7 to 40.9 km) per leopard track.<br />
Table 2.5.3.d. Leopard spoor density and leopard spoor frequency at Okomitundu in 2005, 2006 and 2007.<br />
Oct - Nov 2005<br />
Okomitundu<br />
35<br />
Sep - Oct 2006<br />
Okomitundu<br />
� Okatumba Wildlife Research<br />
www.okatumba.de<br />
Feb - Aug 2007<br />
Okomitundu<br />
Sep - Oct 2007<br />
Okomitundu<br />
Total number of transects 52 38 31 35<br />
Total number of kilometres driven 411 343 259 267<br />
Total number of leopard tracks 9 12 6 20<br />
Spoor density (tracks per 100km²) 2.2 3.5 2.3 7.5<br />
Spoor frequency (km per track) 45.6 28.6 43.2 13,4<br />
Brown hyaena spoor density shows less fluctuation from year to year than cheetah and<br />
leopard spoor densities. In 2005 the expedition found 2.2 hyaena tracks per 100 km² and<br />
spoor frequency was 45.6 km (range 1.3 to 74.7 km) per hyaena track (table 2.5.3.e). In<br />
2006 expedition team members counted 3.2 hyaena tracks per 100 km². Accordingly spoor<br />
frequency increased a little to 31.2 km (range 0.6 to 78.3 km) per hyaena track. From<br />
February to August 2007 Okatumba Wildlife Research counted 5.0 hyaena tracks per 100<br />
km² and spoor frequency was 19.9 km (range 0.8 to 80.1 km) per hyaena track. This<br />
increase was confirmed during the 2007 expedition: 4.9 hyaena tracks per 100 km² were<br />
detected and spoor frequency was 20.5 km (range 0.8 to 81.5 km) per hyaena track.<br />
Table 2.5.3.e. Hyaena spoor density and hyaena spoor frequency at Okomitundu in 2005, 2006 and 2007.<br />
Oct - Nov 2005<br />
Okomitundu<br />
Sep - Oct 2006<br />
Okomitundu<br />
Feb - Aug 2007<br />
Okomitundu<br />
Sep - Oct 2007<br />
Okomitundu<br />
Total number of transects 52 38 31 35<br />
Total number of kilometres driven 411 343 259 267<br />
Total number of hyaena tracks 9 11 13 13<br />
Spoor density (tracks per 100km²) 2.2 3.2 5.0 4.9<br />
Spoor frequency (km per track) 45.6 31.2 19.9 20.5
A coalition of three male cheetahs (F005, F006, F007) was trapped and radio-collared in<br />
August 2005. Since then 67 data points to calculate their home range were gathered. The<br />
three expeditions at Okomitundu study site performed ten successful triangulations on<br />
these study animals. Another eleven locations were extracted from spoor data of the three<br />
cheetahs, and once they were recaptured in September 2006. In addition to this scientists<br />
and interns of Okatumba Wildlife Research located the cheetah coalition 45 times outside<br />
the expeditions (Fig.2.5.3.h).<br />
Figure 2.5.3.h. 95% MCP home range of the male cheetah coalition (F005, F006, F007) showing their locations<br />
during the expeditions in 2005, 2006 and 2007 (light blue dots) and throughout the year (dark yellow dots).<br />
Since publication of data up to March 2007 in previous expedition reports, the coalition’s<br />
home range did not change substantially and the coalition appears to be fairly successful<br />
in holding its territory (Fig. 2.5.3.i).The three cheetahs traverse a comparatively small area<br />
(174 km²) and they even stayed there when living conditions became unfavourable as was<br />
the case after a very bad rainy season in 2006/2007. During the first few weeks after<br />
having been radio-collared, the coalition mainly ranged north of the Eulenkuppe hill, but<br />
later on, the core area (38 km²) of the cheetahs’ home range shifted to between<br />
Felixposten and Eulenkuppe (Fig. 2.5.3.i). A second core area around Zebraposten was<br />
occupied more frequently in 2007.<br />
36<br />
� Okatumba Wildlife Research<br />
www.okatumba.de
Sadly one of the three cheetahs (F006) was shot in September 2007 as trophy animal on a<br />
neighbouring farm. Data collected by Okatumba Wildlife Research until the end of<br />
December 2007 revealed that the two remaining coalition animals appear to maintain their<br />
home range and migration patterns. F005 and F007 still walk along their well-known travel<br />
routes, visit the same marking trees and drink at the same water places as before. Hence<br />
we believe that they are still strong enough to defend their territory against conspecifics.<br />
Figure 2.5.3.i. Kernel home range (95%) of the male cheetah coalition (F005, F006, F007).<br />
Two female leopards (F009, F012) were radio-collared in May 2006 and in September<br />
2006 respectively. Since then 40 (F009) and 39 (F012) data points to calculate their home<br />
ranges were gathered. The two expeditions in 2006 and 2007 performed 16 triangulations<br />
on F009. Expedition team members successfully located F012 23 times. An additional 24<br />
data points for F009 and 16 data points for F012 were gathered by Okatumba Wildlife<br />
Research outside the expeditions. Figures 2.5.3.j and 2.5.3.k show the resulting Kernel<br />
home ranges of the two study animals. The home range of F009 stayed almost the same<br />
compared to the previous expedition report, but the home range of F012 changed a little<br />
due to an increased number of locations. The home range of F009 is relatively small (64<br />
km²). This female mainly ranges around the Mathildenhöhe, but several times she was<br />
found on the neighbouring farm (Onjossa). She also travels west up to Johannesposten.<br />
37<br />
� Okatumba Wildlife Research<br />
www.okatumba.de
With a size if 143 km² the home range of F012 is more than double the size of the range<br />
used by F009. Compared to the previous expedition report, the core area of F012<br />
increased a little and shifted west. In 2007 this female leopard predominantly ranged north<br />
and northeast of Johannesposten, Several times she travelled southwest beyond the farm<br />
boundaries and east up to the Eulenkuppe hill. Both females spend some of their time on<br />
neighbouring farms north and northeast of the Kuduberg. Although the two home ranges<br />
overlap substantially (Fig. 2.5.3.l) we never located F009 and F012 at the same time at the<br />
same place. The two females appear to avoid each other.<br />
Figure 2.5.3.j. Kernel home range (95%) of the female leopard F009.<br />
38<br />
� Okatumba Wildlife Research<br />
www.okatumba.de
Figure 2.5.3.k. Kernel home range (95%) of the female leopard F012.<br />
Figure 2.5.3.l. MCP home ranges (95%) of the two female leopards.<br />
39<br />
� Okatumba Wildlife Research<br />
www.okatumba.de
2.5.4. Discussion<br />
Ecological field studies rely on the ability to make reliable estimates of animal abundance,<br />
but any estimate of abundance is influenced by sources of error associated with extrinsic<br />
(environmental) or intrinsic (methodological) factors. Consideration of these potential<br />
influences is very important for both study design and data analysis. The development of<br />
effective methods to monitor abundance of large carnivores presents particular challenges,<br />
as they are often secretive and widely dispersed.<br />
The data gathered does not allow for an accurate estimate of true population densities for<br />
any of the three large carnivore species at Okomitundu. On the one hand capture success<br />
was low. On the other hand, radio-collared animals, male leopards in particular, did not<br />
provide sufficient data due to being shot shortly after they were collared. Assuming that the<br />
spoor density of large carnivores shows a strong linear correlation with true density<br />
(Stander 1998), the above results at least reveal that cheetah density within the<br />
Okomitundu study site is much lower than it was in the Omitara and Seeis study site. At<br />
the same time leopard and hyaena densities are higher at Okomitundu than in the<br />
previous study area.<br />
It must also be noted that the four transects used for counting spoor frequencies were not<br />
truly random. Due to the heterogeneous habitat they were selected to cover different<br />
vegetation and geological types and to avoid very stony roads due to a low detectability of<br />
carnivore tracks on rocky soils. We therefore increased the number of transects and the<br />
total length of transects sampled throughout the year in order to improve data precision.<br />
Looking at the total numbers of spoors detected during the expeditions, it is clear that the<br />
ratio between cheetah spoors and leopard spoors changed markedly from 2005 to 2006.<br />
The proportion of cheetah spoors to the total numbers of large carnivore spoors decreased<br />
from 40.9% in 2005 to 28.3% in 2006, whilst the proportion of leopard spoors increased<br />
from 35.2% in 2005 to 45.6% in 2006. With 24.6% cheetah spoors and 47.2% leopard<br />
spoors this ratio was found again during the expedition in 2007. One reason may be that<br />
the cheetah tries to avoid interspecific competition with the leopard and therefore switches<br />
to areas with lower leopard density. Secondly, cheetahs may be more vulnerable to<br />
changing habitat conditions such as drought, which result in limited resources, especially<br />
food. Generally, the leopard and the brown hyaena are better adapted to poor habitat<br />
conditions than the cheetah (Estes 1997). Usually brown hyaenas live in groups, which<br />
occupy fixed territories, but they forage alone over long distances. Existence of a hyaena<br />
den at Okomitundu study site explains why the proportion of hyaena spoors was almost<br />
the same during all three expeditions (23.9% in 2005, 26.1% in 2006 and 28.2% in 2007).<br />
Continued male leopard removal through trophy hunting around Okomitundu makes it very<br />
difficult to assess the leopard density within the study site. Each time one leopard is killed<br />
or dies of natural causes, its territory becomes available to other males. Usually more than<br />
one male leopard would migrate to the area and try to take over this territory (Estes 1997,<br />
Skinner & Smithers 1990, Marker et al. 1996, personal observation). This may lead to a<br />
higher leopard density in the short term and possibly an overestimation in the long term.<br />
40<br />
� Okatumba Wildlife Research<br />
www.okatumba.de
2.6. Prey availability<br />
2.6.1. Introduction<br />
The large carnivore habitat, like any habitat, is the home of specific types of animals and<br />
must satisfy the requirements of all the animals in it for survival and successful existence.<br />
Fluctuations are an essential part of any ecosystem to keep the system viable. Thus the<br />
ecological limits set by the environment need to be monitored over the long term. In this<br />
context counting prey animals is a crucial contributor to the successful management and to<br />
conservation of predator populations. An obvious assumption is that high densities of<br />
potential prey animals support high carnivore densities, while low game densities lead to<br />
low carnivore densities. Since game counts are conducted in two different parts of the<br />
study site, the data may also be used to glean information about migration patterns of freeranging<br />
prey species on open farmland (which includes the cattle-proof fenced area) in<br />
comparison to prey species within the game-proof fenced area. Whilst animals living on<br />
the open farmland can react to external influences, animals within the game-proof fenced<br />
area cannot disperse.<br />
Wildlife populations on Namibian farmland are influenced by various factors such as<br />
drought, diseases, predation, poaching and management techniques such as live capture<br />
or trophy hunting. Each of these factors affect certain parts of a population, e.g. predators<br />
kill young, very old or sick animals. Trophy hunting predominantly takes old males, and live<br />
capture removes whole breeding units. Sustainable management of natural resources<br />
needs a scientific approach, and long-term monitoring of the population structure of the<br />
dominant game species is a very important tool to achieve this. This is why observations at<br />
waterholes are performed.<br />
2.6.2. Methodology<br />
Game Count<br />
Every afternoon the expedition team conducted a road strip count by driving along a<br />
predetermined counting route, covering all types of habitat of the study site without going<br />
along farm boundaries. This route was chosen as randomly as possible. The Land Rover<br />
was manned by one driver in the cab, and three observers and a tracker on the pick-up<br />
platform (Fig. 2.6.2.a).<br />
The driver operated the Land Rover at very low speed (about 15-20 km/h) and observers<br />
on the back counted all animals they detected on both sides of the road, no matter how far<br />
away they were detected. Team members also had to ensure that every single animal<br />
occurring on the transect line (angle = 0) was seen. When animals were detected, the<br />
observers signalled the driver to stop the vehicle.<br />
Observers then identified and counted all animals detected and recorded the distance to<br />
the Land Rover, the angle from the transect (midline of the Land Rover), the number of<br />
individuals and, if possible, the sex and age composition (Fig. 2.6.2.b).<br />
41<br />
� Okatumba Wildlife Research<br />
www.okatumba.de
Figure 2.6.2.a. Counting potential prey animals along transects.<br />
A protractor sheet on top of the Land Rover helped to assess angle and a range finder<br />
was used to measure distance. The km reading was recorded at each sighting and at the<br />
end of the count the total km driven was also recorded.<br />
Figure 2.6.2.b. Methodology of the road strip method.<br />
42<br />
� Okatumba Wildlife Research<br />
www.okatumba.de
One route (A) within the game-proof fenced area and another route (B) outside this area<br />
were covered alternately. Data were first entered into an Excel database and from there<br />
exported to the Distance Sampling program (Buckland et al. 1993, Burnham et al. 1980)<br />
for statistical analyses.<br />
Observations at Water Places<br />
Every morning animals were observed at one of the water places. For successful data<br />
sampling, the Land Rover was parked some hundred metres away from the observation<br />
post. Besides it was important for observers to place themselves against the wind, wear<br />
camouflage clothes, remain quiet and move as little as possible. When an animal or a<br />
group of animals approached, the number of individuals, sexes and age classes were<br />
determined. Data were recorded in pre-printed data sheets and entered into an Excel<br />
database for further processing.<br />
2.6.3. Results<br />
During the expedition road strip counts were conducted on 32 days, and a total of 607 km<br />
were driven (295 km on route A and 312 km on route B), which results in an average of<br />
18.9 km per counting day. In total 1828 potential prey animals were detected. The number<br />
of sighted animals per day ranged from 23 to 125 with an average of 62.1 on route A<br />
(n=17), and from 35 to 77 with an average of 53.5 on route B (n=15).<br />
Table 2.6.3.a. Game count effort during the expedition in 2007.<br />
Group 1 Group 2 Group 3 Group 4 TOTAL<br />
Number of transects 8 8 8 8 32<br />
Total km driven 158 154 138 157 607<br />
Total number of animals sighted 466 381 453 528 1828<br />
Average number of animals per day 58 51 57 66 57<br />
In 2007 we detected about 35% more animals than in 2006, which is almost the same<br />
amount of animals as in 2005. The average number of sighted animals per 10 km was 29<br />
in 2005, 21 in 2006 and 30 in 2007.<br />
The increase in total animal numbers from 2006 to 2007 was mainly due to the open<br />
farmland habitat. In 2007 the expedition team counted more than twice the numbers (802<br />
animals) on route B in this habitat than in 2006 (346 animals). Even in 2005 total numbers<br />
of animals in this area were about 30% less (583 animals) than in 2007. In contrast to this,<br />
animal numbers within the game-proof fenced area of route A did not change dramatically<br />
from year to year. In 2005 the expedition team counted 1236 animals on route A, in 2006<br />
this number was 969, and in 2007 it was 1026 animals.<br />
43<br />
� Okatumba Wildlife Research<br />
www.okatumba.de
With a total number of 770 detected animals the kudu was clearly the dominant species in<br />
both parts of the farm area, followed by oryx (284 animals), steenbok (222 animals) and<br />
hartebeest (187). In addition to this 82 springbok, 71, eland, 55 zebra, 42 ostrich, 39<br />
warthog, 39 wildebeest, 28 impala and one waterbuck were counted (table 2.6.3.b).<br />
Table 2.6.3.b. Potential prey animals sighted on two different transects during the expedition in 2007.<br />
Kudu Zebra Oryx Steenb Spring Harteb Ostrich Wartho Wildeb Impala Waterb Eland TOTAL<br />
Route A 353 18 111 108 77 187 9 16 39 28 1 71 1026<br />
Route B 417 37 173 114 5 - 33 23 - - - - 802<br />
TOTAL 770 55 284 222 82 187 42 39 39 28 1 71 1828<br />
The percentage of kudu was 34% within the game-proof fenced area and 51% on open<br />
farmland (Fig. 2.6.3.a). These figures match with the results from 2005 (36% kudu on<br />
route A and 49% kudu on route B). In 2006 the proportion of kudus on route A was also<br />
36%, but the proportion of kudu on route B was 32% only.<br />
The proportion of oryx to the total amount of sighted animals on route A doubled from the<br />
first to the second year (11% in 2005 and 23% in 2006), but declined again to 11% in<br />
2007. Comparable figures are found on open farmland: the proportion of oryx drastically<br />
increased from 2005 (15%) to 2006 (37%), but declined to 22% in 2007.<br />
Steenbok appear not to react that much to extrinsic factors such as drought. Their<br />
proportion to the total amount of sighted animals was almost stable in both parts of the<br />
farm. From 2005 to 2007 it varied between 10% and 12% on route A and between 10%<br />
and 16% on route B.<br />
The proportion of red hartebeest to the total game population within the game-proof fenced<br />
area steadily increased from 8% in 2005 to 10% in 2006 and 17% in 2007. At the same<br />
time the proportion of zebra to the total game population steadily declined from 13% in<br />
2005 to 5% in 2006 and 2% in 2007.<br />
Expedition 2007<br />
Route A<br />
1%<br />
2%<br />
17%<br />
4%<br />
8%<br />
3%<br />
11%<br />
Kudu Zebra Oryx<br />
Steenb Springb Harteb<br />
Ostrich Warthog Wildeb<br />
Impala Eland<br />
7%<br />
11%<br />
34%<br />
2%<br />
44<br />
� Okatumba Wildlife Research<br />
www.okatumba.de<br />
Expedition 2007<br />
Route B<br />
22%<br />
14%<br />
1%<br />
3%<br />
5%<br />
4%<br />
Kudu Zebra<br />
Oryx Steenb<br />
Springb Warthog<br />
Ostrich<br />
Figure 2.6.3.a. Ratio between the game species sighted on route A and route B during expedition in 2007.<br />
51%
Game densities in both parts of the farm were estimated for each expedition group as well<br />
as an average for the entire expedition (see tables and figures below). Fluctuations from<br />
one group to the other in all species are mainly due to set travel patterns of the animals<br />
within the study site. Since the transect covers a certain part of the study area only, one<br />
expedition group may pass many kudu and few steenbok, whereas the next group may<br />
record fewer kudu, but many steenbok. Statistically this variation is normal.<br />
Table 2.6.3.c. Estimated game densities (No. of animals per 10 km²) of the dominant game species within the game<br />
proof fenced area (route A) during the expedition in 2007.<br />
ROUTE A Group 1 Group 2 Group 3 Group 4 Entire expedition<br />
Kudu 68.31 30.97 53.75 37.09 47.53<br />
Mountain zebra 2.34 0.77 1.93 0.64 1.42<br />
Oryx 9.68 3.23 19.48 4.02 9.10<br />
Steenbok 9.57 20.25 26.41 35.42 22.91<br />
Springbok 23.71 0.00 5.25 6.27 8.80<br />
Warthog 1.61 0.00 5.25 10.80 4.42<br />
Rainfalls in Namibia are the most crucial factor for any kind of land use and they can vary<br />
significantly from year to year. Usually the rainy season starts in October and lasts to April<br />
with the main rainfalls from February to April. The rainy season in 2005/2006 started with<br />
some early rains at the end of September 2005 and as a whole was far above average. In<br />
contrast to this the following rainy season (2006/2007) was one of very little rain. As a<br />
result the grazing and browsing capacity of the study site decreased and potential prey<br />
animals migrated to other regions.<br />
80<br />
70<br />
60<br />
50<br />
40<br />
30<br />
20<br />
10<br />
0<br />
Expedition 2007: Game densities (No. of animals/10km²) - Route A<br />
Group 1 Group 2 Group 3 Group 4<br />
Figure 2.6.3.b. Estimated densities of the dominant game species within the game-proof fenced area in 2007.<br />
45<br />
� Okatumba Wildlife Research<br />
www.okatumba.de<br />
Kudu<br />
Oryx<br />
Warthog<br />
Springbok<br />
Steenbok<br />
Zebra
A comparison between both parts of the farm shows that in 2007 population densities of<br />
common game species such as kudu, mountain zebra, oryx, steenbok and warthog were<br />
higher on the open farmland (route B) than within the game-proof fenced area (route A).<br />
Although the rainy season in 2007/2008 did not provide early rain, game densities on the<br />
open part of the study site increased enormously. One likely explanation of this might be<br />
that grazing capacitiy on neighbouring properties was even worse than at Okomitundu due<br />
to livestock farming on these farms. Therefore game migrated towards Okomitundu.<br />
Table 2.6.3.d. Estimated game densities (No. of animals per 10 km²) of the dominant game species within open<br />
farmland (Route B) during the expedition in 2007.<br />
ROUTE B Group 1 Group 2 Group 3 Group 4 Entire expedition<br />
Kudu 44.59 41.42 103.85 35.56 56.36<br />
Mountain zebra 8.09 1.45 0.00 1.09 2.66<br />
Oryx 28.93 39.35 12.93 3.61 21.21<br />
Steenbok 25.02 24.96 36.36 30.50 29.21<br />
Springbok 0.00 0.00 0.00 1.56 0.39<br />
Warthog 7.85 1.06 5.36 7.44 5.43<br />
120<br />
100<br />
80<br />
60<br />
40<br />
20<br />
0<br />
Expedition 2007: Game densities (No. of animals/10km²) - Route B<br />
Group 1 Group 2 Group 3 Group 4<br />
Figure 2.6.3.c. Estimated dominant game species densities on open farmland in 2005.<br />
46<br />
� Okatumba Wildlife Research<br />
www.okatumba.de<br />
Kudu<br />
Oryx<br />
Warthog<br />
Springbok<br />
Steenbok<br />
On the basis of population densities, total numbers of dominant game species were<br />
calculated for the game-proof fenced area (95 km²), as well as for open farmland (85 km²).<br />
Results are presented in Table 2.6.3.i.<br />
Zebra
Table 2.6.3.e. Total numbers of kudu, zebra, oryx, steenbok, springbok and warthog within the game-proof fenced area<br />
(95km²) and on open farmland (85 km²). Numbers are calculated on the basis of estimated population densities during<br />
the expedition in 2007 (32 counting days in eight weeks).<br />
Kudu Zebra Oryx Steenbok Springbok Warthog TOTAL<br />
Game camp 2007 452 14 86 218 84 42 896<br />
Open farm 2007 479 23 180 248 3 46 979<br />
TOTAL 2007 931 37 266 466 87 88 1875<br />
Usually game-proof fenced areas host a larger variety of game species than the common<br />
stock-proof fenced farmlands, albeit with lower animal numbers per species. In 2005 and<br />
2007 we by and large confirmed this situation for the dominant game species within our<br />
study area - except for springbok, which were introduced into the game camp.<br />
In 2006 this situation changed completely, and animal numbers per species were generally<br />
lower on open farmland than within the game-proof fenced area. This was due to the lack<br />
of (early) rains at the study site.<br />
In 2007 expedition team members performed observations at water places on 35 days.<br />
Altogether 95 hours and five minutes were spent on this activity. The expedition team<br />
recorded a total of 301 sightings. Compared to the previous expeditions at Okomitundu, it<br />
is double the number of sightings per hour than in 2006, but half the number of sightings<br />
per hour than in 2005.<br />
The main species observed were kudu, warthog, hartebeest, oryx and steenbok, followed<br />
by eland, springbok and ostrich (Table 2.6.3.f).<br />
Table 2.6.3.f. Observation at waterholes data collected during the expedition in 2007.<br />
Kudu Warthog Hartebeest Oryx Steenbok Eland Springbok Ostrich Other<br />
Males 127 27 - 11 19 - - 9<br />
Females 154 37 - 14 27 - 1 -<br />
Juveniles 45 22 - 10 - 1 3 -<br />
unknown 40 15 75 33 15 29 10 1<br />
Total no. of<br />
animals<br />
No. of<br />
observations<br />
366 101 75 68 61 30 14 10<br />
85 48 10 30 59 3 7 9 50<br />
The expedition team collected some useful data on kudu, warthog, oryx and steenbok. Of<br />
366 kudu, 326 could be classified into males, females and juveniles, while 11% of the<br />
animals’ sex remained unknown. Since sexes are easy to distinguish by their horns (or<br />
absence thereof) in adult kudu, unknown animals are considered to be sub-adults. The<br />
ratio between adult male and female kudu was 1:1.2 and 29.2% of the females were<br />
accompanied by youngsters.<br />
47<br />
� Okatumba Wildlife Research<br />
www.okatumba.de
86 of 101 warthog could be classified into males, females and juveniles, while 14.9% of<br />
the animals’ sex remained unknown. The ratio between male and female warthog was<br />
1:1.37, and an average of 0.59 (range 0 to 3) youngsters per female was recorded.<br />
From 61 steenbok 46 could be classified into males and females, and the sex ration was 1<br />
male to 1.4 females. No youngsters were observed.<br />
In oryx about half of the observed animals could be classified into males, females and<br />
juveniles, whereas the other half remained unknown. The ratio between male and female<br />
oryx was 1:1.3, and 71% of the females were accompanied by youngsters.<br />
In some other species expedition team members were not able to distinguish between the<br />
sexes. Of 75 hartebeest, 30 eland and 14 springbok 71.4% to 100.0% of the animals’ sex<br />
remained unknown. These data can not be used to draw any conclusion about the<br />
population structure of the species.<br />
2.6.4. Discussion<br />
Prey availability and its fluctuation throughout the year is one of the most important factors<br />
for migration patterns and habitat preferences of our study animals. Due to the very large<br />
size of the study area, it is not possible to conduct a census in which all animals in a given<br />
area are counted individually. What can be done is a survey where a proportion of the<br />
individuals in the area is detected and recorded.<br />
Game densities (number of animals per unit area) were estimated using the Distance<br />
Sampling Program (Buckland et al. 1993). The data collected are a set of distances of<br />
detected animals, which are distributed sparsely across a large area, and there is no<br />
competing method to analyse those data. One of the major advantages of Distance<br />
Sampling is that some, or even many, of the objects may go undetected. Central to the<br />
concept of this method is the detection function (Fig. 2.6.4.a).<br />
The figure below shows the total number of sightings of kudu (single or in groups) within<br />
the game-proof fenced area (route A) and on open farmland (route B) during the<br />
expedition in 2005. As expected, detectability decreases with increasing distance from the<br />
transect line.<br />
Distance sampling theory considers certain variables such as the average group size or<br />
the spatial distribution of the animals. These factors are different between species. This is<br />
why in 2005 steenbok density within the game-proof fenced area, for instance, is higher<br />
than the density of zebra although fewer steenbok were detected during the game counts.<br />
48<br />
� Okatumba Wildlife Research<br />
www.okatumba.de
30<br />
25<br />
20<br />
15<br />
10<br />
5<br />
0<br />
Number of KuduSightings<br />
20 40 60 80 100 120 140 160 180 200 220 240 260 280 300<br />
Perpendicular Distance<br />
Figure 2.6.4.a. Example of decreasing detectability: number of sightings of<br />
kudu clusters with perpendicular distances from 20 to 300 metres during the expedition in 2005.<br />
49<br />
� Okatumba Wildlife Research<br />
www.okatumba.de<br />
RouteA<br />
RouteB<br />
Game count data reflect what happens to wildlife populations, i.e. natural incidents as well<br />
as management activities. This also applies to the results of expeditions at Okomitundu<br />
study site in 2005, 2006 and 2007. Whilst most of the animals in the game-proof fenced<br />
area cannot react to natural factors such as rain or drought, the animals on open farmland<br />
are able to move to other regions. Sometimes they travel very large distances to reach<br />
areas where it has already rained and fresh vegetation is available. Since oryx are well<br />
adapted to arid conditions, they are one of the last species to leave an area. This is likely<br />
to be the reason for the relatively high proportion of oryx on open farmland in 2006. Whilst<br />
the drastic decline in the zebra population is mainly due to capture activities that took<br />
place at Okomitundu in June 2006, we believe that springbok numbers were reduced<br />
significantly through predation.<br />
Unfortunately the expedition in 2007 did not experience early rains and as a result we<br />
were not able to test the hypothesis whether the drastic decline in animal numbers on<br />
open farmland in 2006 was due to a lack of rainfalls. Despite this the animals came back<br />
to Okomitundu and we believe that this is because grazing and browsing capacity on<br />
surrounding areas, where livestock farming takes place, was even worse than at our study<br />
site, forcing animals to Okomitundu as the best out of a number of bad options.<br />
In general the amount of wildlife management required depends on the size of an area and<br />
restrictions of movement within it. Whilst game populations on open farmland are able to<br />
roam over large areas and require little management, populations within a game-proof<br />
fenced area must be monitored and managed frequently. During periods when no natural<br />
water is available, sufficient artificial watering places have to be provided and the condition<br />
of the animals has to be monitored. In dry seasons some species may suffer and the<br />
manager/farmer will then live capture and sell some game, rather than letting all the
animals starve to death. Another option is to feed the animals, but this has financial<br />
implications and many game species do not take any fodder. If management is done<br />
properly, game-proof fenced areas can be very good conservation tools, for rare species in<br />
particular.<br />
In our previous study site (Omitara and Seeis) an average of 211 animals per transect<br />
were detected. This number is more than four times that of Okomitundu. This is because<br />
Okomitundu is more arid than the Seeis region and therefore grazing and browsing<br />
capacity is lower. Assuming that large carnivore density is limited by the availability of prey<br />
animals, it is not surprising that fewer carnivores are present at Okomitundu compared to<br />
Seeis. This is also supported by the Large Carnivore Atlas programme (Stander &<br />
Hanssen 2003) as well as our spoor data (see 2.5.3.).<br />
Leopards mainly range in the western parts of Okomitundu. Their prey availability within<br />
the game-proof fenced area did not change significantly in any of the three years. Besides<br />
that some leopards were shot, which meant that territories were available for takeover. So<br />
it is not surprising that the number of leopards increased from five individuals in 2005 to<br />
eight individuals in 2006 and nine individuals in 2007.<br />
Regarding cheetahs, which mainly range in the eastern parts of the area, conditions<br />
deteriorated in 2006 as prey availability on the open farmland dropped to less than half<br />
that in 2005. Secondly, the composition of prey species was dominated by oryx, which are<br />
good at fighting off predators. Thirdly, the dominance of the male coalition as described<br />
above makes it difficult for single cheetahs to move in. This explains why the number of<br />
individual cheetahs decreased from nine animals in 2005 to five animals in 2006. In 2007<br />
game numbers on the open farmland increased and prey composition was dominated by<br />
kudu instead of oryx. Living conditions for cheetahs became more favourable again and<br />
the number of cheetahs increased to seven individuals.<br />
2.7. Poaching<br />
2.7.1. Introduction<br />
Poaching activities are one of the most serious threats to wildlife populations. Usually<br />
poachers on Namibian farmland work with dogs and donkeys and they often destroy<br />
fences by cutting wires. Since Okomitundu borders onto Otjimbingwe (a housing estate of<br />
landless people) as well as two resettlement farms, the farm boundaries need to be<br />
checked regularly. Throughout the year this effort cannot be sustained on a daily basis.<br />
First of all the total fence line is about 70 km, secondly some parts of the fence are difficult<br />
to access, and thirdly there is simply no time for the limited number of farm staff to do this.<br />
During expeditions it is therefore a great asset to the study site to have the manpower<br />
necessary to check parts of the border fence frequently. Scientifically this activity aims to<br />
gather information about large carnivore tracks entering or leaving the core area and about<br />
poaching activity.<br />
50<br />
� Okatumba Wildlife Research<br />
www.okatumba.de
2.7.2. Methodology<br />
During the expedition in 2007 the border fence line was divided into four sections to be<br />
checked every afternoon of the second week. These segments were checked irregularly to<br />
keep the poachers guessing (the poachers would see through a regular pattern easily). A<br />
Land Rover was driven at low speed (max. 20km/h), and the team was accompanied by a<br />
farm worker. The worker and observers were standing on the platform. Each riverbed<br />
crossing the border, as well as each crawling hole dug underneath the fence were<br />
thoroughly investigated. When a cheetah, leopard or hyaena track was detected the date,<br />
time, GPS position, species, number of animals, sex and age class, freshness and<br />
direction of the track, and further comments were recorded in data sheets. All damage to<br />
the fence was also recorded on the data sheet and reported to the farm manager. Where<br />
possible, repairs were carried out by the farm worker immediately.<br />
Signs of poaching activities such as tracks of dogs and donkeys were also detected by<br />
chance while collecting other field data. The poachers’ tracks were first entered into an<br />
Excel database. Later these data were exported as text files for further processing with<br />
ArcView 3.2.<br />
2.7.3. Results<br />
The first two expedition groups found and fixed several incidences of damage to the<br />
border fence in each of the four segments. Very little damage to the border fence was<br />
detected during the last two expedition groups. Altogether the total number of poaching<br />
events declined from the first to the fourth expedition group (Fig. 2.7.3.a). From 5 to 14<br />
September expedition team members detected tracks of dogs and donkeys nine times.<br />
Eight signs of poaching events were found while the second expedition group worked in<br />
the field (19 to 28 September). During the third and fourth expedition group this number<br />
declined to six and two tracks of poachers respectively.<br />
The map below shows that tracks of dogs and donkeys are predominantly found in the<br />
eastern part of the farm area, which is due to the fact that poachers travel from Uitdraai to<br />
Onjossa (and back) or from Uitdraai to the gravel road that runs through Okomitundu and<br />
Ombujondindi. In the western part of the farm area poaching activities might be restricted<br />
by the game-proof fence, but tracks of dogs and donkeys are also found in this area. In the<br />
game camp poachers mainly come from and return to Otjimbingwe.<br />
51<br />
� Okatumba Wildlife Research<br />
www.okatumba.de
2.7.4. Discussion<br />
Figure 2.7.3.a. Locations of poachers’ spoors that were detected during the first (green dots),<br />
second (yellow dots), third (blue dots) and fourth (lilac dots) expedition group in 2007.<br />
After two and a half years at Okomitundu we consider poaching to be a serious threat to<br />
the study site, but quantification of game losses due to poaching activities seems to be<br />
nigh on impossible. Co-operation between the farm manager of Okomitundu and the<br />
expeditions worked well. In 2006 most of the damages to the border fence, which were<br />
reported to the manager, were repaired within a few days. In 2007 Okomitundu made farm<br />
workers available to join the border fence team and to repair damages immediately.<br />
In 2006 some of the fences were cut by poachers again. Nevertheless, daily checks of the<br />
border fence was successful, and the number of indirect signs of poachers such as spoors<br />
of dogs and donkeys or damage to the border fence declined from the beginning to the<br />
end of the expedition. This phenonemon was also observed during the expedition in 2007.<br />
At the same time it became clear that fighting against poaching activities is very time- and<br />
cost-consuming. We feel that effective and efficient control of poaching cannot be<br />
permanently guaranteed through the daily farm management and/or research activities.<br />
Thus, a professional anti-poaching unit needs to be engaged. This was done as a joint<br />
venture by several farmers of the Okawi Conservancy in November 2007. T<br />
52<br />
� Okatumba Wildlife Research<br />
www.okatumba.de
2.8. Carnivore Sightings<br />
2.8.1. Introduction<br />
Since large carnivores on Namibian farmland live very secretive lives, investigations of<br />
their behavioural ecology require indirect sampling methods, rather than depending on<br />
direct observations. Nevertheless cheetah, leopard or hyaena sightings take place from<br />
time to time. Apart from being very exciting events these sightings also provide important<br />
scientific data that need to be recorded and analysed.<br />
2.8.2. Methodology<br />
Occasionally carnivore sightings take place while working in the field. When this was the<br />
case, all relevant information such as date, time, GPS position, observer, species, number<br />
of animals, sex and age class, distance to the observer, and a brief description of the<br />
observation were recorded.<br />
2.8.3. Results<br />
In 2007 the expedition team recorded three large carnivore sightings (Table 2.8.3.a).<br />
Table 2.8.3.a. Large carnivore sightings at Okomitundu during the expeditions in 2007.<br />
Date Time GPS position Species<br />
2007 09-21 07:20<br />
2005 09-25 17:12<br />
2006 11-01 08:50<br />
2.8.4. Discussion<br />
22°07’191’’ S<br />
16°20’257’’ E<br />
22°08’574’’ S<br />
16°15’360’’ E<br />
22°09’448’’ S<br />
16°16’185’’ E<br />
No. of<br />
animals<br />
cheetah 1<br />
leopard 1<br />
leopard 1<br />
Sex Age Dist. Comments<br />
1 juvenile,<br />
sex unknown<br />
female<br />
(F012)<br />
female<br />
(F009)<br />
53<br />
� Okatumba Wildlife Research<br />
www.okatumba.de<br />
20 m<br />
adult 900 m<br />
adult 250 m<br />
cheetah cub was sitting on the road<br />
and calling for its mother, when the<br />
car stopped it ran away<br />
sighting took place during telemetry,<br />
F012 was walking along ridge of hill<br />
before entering cave or going<br />
behind the hill<br />
sighting took place during telemetry,<br />
F009 was lying on a rock and could<br />
be observed for about 30 minutes<br />
For us scientific studies are a kind of puzzle: some data and results are more spectacular<br />
than others, but the inconspicuous pieces are also needed to complete the puzzle. For<br />
example several surveys such as mapping the infrastructure and the vegetation are<br />
essential to work in the field and to interpret the data collected. Working in the field with a<br />
GPS and processing these data with GIS software to produce a map is very timeconsuming<br />
and labour-intensive. In contrast to this, each encounter with a free-ranging<br />
carnivore lasts for a short time only and provides less information, but is very thrilling.
2.9. Discussion & Conclusions<br />
Namibia is endowed with a variety of wildlife species living outside protected areas on<br />
private farmland. Farmers not only derive benefits from herbivore species such as meat<br />
and income security, but also carry costs of living with large carnivores (Murphy et al.<br />
2004). Conflict between farmers and large carnivores is mainly due to predation on<br />
livestock (personal communication).<br />
2.9.1. Okatumba Wildlife Research (OWR)<br />
Whilst wildlife in conservation areas benefits from Government protection, the same<br />
cannot be said of wildlife on commercial farmlands. It is therefore crucial to cooperate with<br />
farmers, assess their problems and include their questions into the research. This was the<br />
reason for ourselves, a veterinarian based in Windhoek, and some farmer families to found<br />
Okatumba Wildlife Research late 1997. After conducting a comprehensive farm survey by<br />
use of personal interviews in 1998, we worked very successfully with several farmers<br />
associations and conservancies. We involved the farmers actively into data collection (e.g.<br />
logistical support of diploma and doctoral students, performance of road strip counts,<br />
provision of utilisation data for all game species, capture, mark and release of large<br />
carnivores, sample collection of dead animals) and we presented our scientific results on a<br />
regular basis. In this way we could give the farmers a better understanding of the<br />
ecological role of large carnivores on their land. We also managed to clarify some<br />
misperceptions and to mitigate human-wildlife conflicts.<br />
Through networking with local ministries, para-statal institutions and non-governmental<br />
organisations Okatumba Wildlife Research contributed significantly to sustainable<br />
management and conservation of Namibia’s wildlife in general and large carnivores in<br />
particular. At present we do not think that persecution by humans is a serious threat to the<br />
Namibian cheetah population. If this would be the case Namibia could not maintain, or<br />
even increase, the largest cheetah population in the world - but evidence shows clearly<br />
that it does.<br />
2.9.2. Collaboration with <strong>Biosphere</strong> <strong>Expeditions</strong><br />
Before the start of the first expedition in 2002 we were sceptical about volunteer<br />
programmes, but after five years with <strong>Biosphere</strong> <strong>Expeditions</strong> we consider the combined<br />
team labour and funding approach to be an excellent concept. Each expedition team<br />
consisted of highly motivated people who came in their holiday time to support us as<br />
research assistants. The work they put in and their expedition contribution helped us to<br />
gather large amounts of data, which would not have been collected without them. Besides<br />
that we receive in-kind support such as, for example, the Land Rovers and this allows us<br />
to work with equipment, which would not be possible without <strong>Biosphere</strong> <strong>Expeditions</strong>. The<br />
post-expedition questionnaires showed that the expeditions from 2002 to 2007 were a real<br />
asset for all concerned. Local scientists received important assistance for their<br />
conservation work and team members increased their knowledge about habitats and/or<br />
species and gained some real hands-on research experience.<br />
54<br />
� Okatumba Wildlife Research<br />
www.okatumba.de
Some field techniques such as checking box traps or searching for marking trees are easy<br />
to learn, whilst others such as game counts, spoor tracking or radio telemetry require the<br />
acquisition of some specialised skills. The kind of standardisation whereby one person<br />
always samples the same data is impossible during an expedition, because all team<br />
members understandably want to take part in all research activities. Some data are more<br />
vulnerable to errors and quality problems than others and each expedition data set needs<br />
to be assessed on a case-by-case basis. In general, however, this is not a significant<br />
problem, as we have to be aware that the carnivore project is a long-term study, and most<br />
of the key questions require continuous data collection over a time period of several month<br />
or even years.<br />
Much money and effort is spent to get the expeditions off the ground and to collect a large<br />
amount of data. Entering these data into a database is crucial to the success of the<br />
expedition. If this is not done, parts of the research may be lost, and the money and the<br />
manpower to conduct it are wasted. Therefore, every afternoon all data collected by the<br />
expedition team from the morning and from the previous afternoon were entered into a<br />
laptop. Team members worked successfully and field data collected during seven<br />
expeditions contributed remarkably to increase our knowledge about cheetah, leopard and<br />
brown hyaenas living in co-existence with Namibian farmers.<br />
2.9.3. Population Density and Demography<br />
Capture activities in the previous study area (Omitara and Seeis) and at Okomitundu study<br />
site brought a totally different composition of large carnivore species to light. In the Seeis-<br />
Omitara region 70 cheetahs and four leopards went into the box traps from July 2002 to<br />
April 2005, whereas at Okomitundu seven cheetahs, six leopards and four brown hyaenas<br />
were caught from July 2005 to October 2007. This difference is most likely due to the<br />
different habitat conditions: Okomitundu is more arid and mountainous than Omitara-Seeis<br />
and it harbours lower densities of potential prey animals. On Namibian farmland the<br />
leopard is the only inter-specific competitor to the cheetah and as a result cheetahs should<br />
prefer areas with low leopard density.<br />
Data from this study, as well as results obtained by CCF and AfriCat (Conradie 2006,<br />
Marker et al. 2003a), reveal that the demography of Namibian cheetahs differs from their<br />
conspecifics in protected areas (Caro 1994, Laurenson 1995). Above all the Namibian<br />
cheetah population contains many more young animals than are found in the Serengeti.<br />
Thalwitzer (2007) compared cub survival on Namibian farmland with cub survival in the<br />
Serengeti and found that the chance of Namibian cheetah cubs to become independent<br />
from their mother is almost five times higher than that of Serengeti cubs. Looking at factors<br />
that drive population regulation, we find totally different situations: in national parks lions<br />
and spotted hyaenas kill a large proportion of the cheetah offspring (Laurenson 1992),<br />
whilst in Namibia farmers predominantly exert pressure on the adult population (Marker et<br />
al. 2003a, personal observation). The sex ratio between captured juvenile cheetahs was<br />
nearly 1:1, whereas the sex ratio between adult cheetahs was strongly biased to males. It<br />
is our belief that this bias is more likely to be an artefact of trapping the study animals at<br />
marking trees, rather than reflecting the true wild population demography.<br />
55<br />
� Okatumba Wildlife Research<br />
www.okatumba.de
Our investigation of the carnivores’ space use (with the aid of radio tracking) shows that<br />
cheetahs have very large home ranges and that the home ranges of individuals overlap<br />
substantially (Fig. 2.9.a). Male cheetah coalitions of two to three animals use small home<br />
ranges (60 to 170 km²) and appear to hold territories, whereas single males roam over<br />
very large areas up to 2000 km² with an average of 837 km². Home range sizes of female<br />
cheetahs are 230 to 480 km² and they vary with the reproductive status. When the females<br />
are in oestrus they use larger areas, but when they have cubs they range in small areas.<br />
The bigger the cubs grow, the larger the home range becomes. In contrast to this leopard<br />
home ranges are relatively small (20 to 400 km²) and the overlap of home ranges is less<br />
than in cheetahs (Balkenhol 2004).<br />
Figure 2.9.4.a. Cheetah home ranges (MCP 95%) of single males (blue polygons),<br />
male coalitions (green polygons) and females (red polygons) on farmland in Namibia.<br />
The above results demonstrate that cheetah ecology on Namibian farmland generally<br />
makes it difficult to use spoor counts as an indirect sampling method to determine true<br />
population density. Whilst it is relatively easy to determine how many different individuals<br />
range on a specific farm over a certain time period (e.g. 12 months), it is difficult to<br />
estimate the true population density (i.e. how many cheetahs live simultaneously in a<br />
defined area). It is also acknowledged that the sample sizes of all spoor data sets<br />
collected during the past and present expeditions are statistically small, but nevertheless<br />
the data and analyses are of ecological and economic importance.<br />
56<br />
� Okatumba Wildlife Research<br />
www.okatumba.de
After investigation of a third study area, which means another two or three years, we may<br />
reach our goal to determine indices for population densities. In the Seeis region spoor data<br />
of 16 cheetahs led to the result that one individual cheetah produces a spoor density of<br />
0.53 spoor per 100 km² and a spoor frequency of 188.8 km per spoor. At Okomitundu data<br />
of nine cheetahs (2005) resulted in comparable figures: one individual cheetah produced<br />
0.54 spoor per 100 km² and on average 185.4 km were needed to detect a spoor of this<br />
cheetah. In 2007 one individual cheetah produced 0.58 spoor per 100 km² and a spoor<br />
frequency of 171.5 km per spoor.<br />
Similar figures apply to the leopard: in 2005 spoor data of five leopards at Okomitundu led<br />
to the result that one individual leopard produced a spoor density of 0.44 spoors per 100<br />
km² and a spoor frequency of 228 km per spoor. In 2006 spoor data of eight leopards also<br />
resulted in a spoor density of 0.44 spoors per 100 km², and on average 229 km were<br />
needed to detect a spoor of this leopard. Unfortunately, leopard spoor density and leopard<br />
spoor frequency calculated from the expedition data in 2007 do not match with previous<br />
findings. They are about double those found in 2005 and 2006. Provided this to be due to<br />
an unknown source of error we still hope that we can underpin the above figures at<br />
another study area. If so, we might be able to estimate population densities for the entire<br />
commercial farmland in Namibia just by conducting spoor counts in different study sites.<br />
Then we would also be able to monitor trends in population density, which would be an<br />
invaluable asset for the conservation of large predators outside protected areas.<br />
Most of the carnivore species live solitary (Nowell & Jackson 1996), but some of the large<br />
predators (e.g. lions, spotted hyenas and wild dogs) form groups (Estes 1997). Caro<br />
(1994) described the cheetah as a species that contributes to a general understanding of<br />
sociality among carnivores. Eaton (1978) hypothesised that inter-specific competition<br />
suppresses grouping by cheetahs. This theory is based on the fact that cheetahs are<br />
disadvantaged by their morphology, which makes them vulnerable in confrontation with<br />
other, stronger, carnivores. The cheetah would never be able to defend itself, its cubs or<br />
its prey against lions, spotted hyaenas or wild dogs. In protected areas, where interspecific<br />
competition is high, it appears to be the better strategy to avoid other predators by<br />
living solitary and secretive. If Eaton’s theory is right, the absence of competitors may<br />
allow sociality in cheetahs. Accordingly, advantages of sociality such as increased hunting<br />
efficiency and reproductive success are reassessed, due to a low inter-specific competition<br />
on commercial farmland in Namibia. Results of our study confirm this at least for male<br />
cheetahs. Males that live in coalitions are above the average body weight and show a<br />
better physical and nutritional condition than single male cheetahs (Thalwitzer 2007).<br />
We are still waiting for results from DNA analyses that will provide information on genetic<br />
diversity, kinship, paternities, etc. For instance, they are likely to elucidate whether male<br />
cheetah coalitions are always brothers or whether these males are not necessarily related.<br />
If they are brothers, this would explain why Serengeti cheetahs live mainly solitary, rather<br />
than being social: since cheetah infants suffer high mortality caused by lions and spotted<br />
hyaenas (Laurensen et al. 1992), male cheetahs in national parks seldom, if ever have<br />
brothers.<br />
57<br />
� Okatumba Wildlife Research<br />
www.okatumba.de
Female cheetahs on Namibian farmland do not occur in coalition with other adult females,<br />
but due to their ability to raise their offspring to adulthood, they are usually accompanied<br />
by cubs, juveniles or sub-adults (personal observation).<br />
2.9.4. Genetic Variability<br />
Captive cheetah populations are faced with several health and reproductive problems:<br />
males were found to have high levels (71-76%) of abnormal sperm (Wildt et al. 1987),<br />
females conceived infrequently (Wildt et al. 1993), cub mortality was comparatively high<br />
(Marker & O’Brien 1989) and susceptibility to diseases is also high (Evermann et al. 1988,<br />
O’Brien et al. 1985). In the late 1980s it was recognised that the captive cheetah<br />
population in North American zoos was not self-sustaining (Marker & O’Brien 1989).<br />
Several molecular studies were conducted and a very low genetic variability of cheetahs<br />
was found (O’Brien et al. 1983, 1985, 1987).<br />
Generally, inbreeding depression can result in poor reproductive performance in both<br />
sexes, high juvenile mortality and high susceptibility to diseases. O’Brien et al. (1983)<br />
suggested that the genetic monomorphism of cheetahs is the result of a so-called<br />
demographic bottleneck. They further suggested that the more recent decline in the global<br />
cheetah population led to inbreeding between related individuals in small isolated<br />
populations. It was thought that these events were the reason for the observed inbreeding<br />
depression in captive cheetahs (O’Brien et al. 1985, 1987). Several studies cast doubt on<br />
the methodology applied and/or the results obtained by O’Brien (Caughley 1994, Lindburg<br />
et al. 1993, Merola 1994). Instead they proposed that many of the effects such as<br />
infertility, reduced litter sizes and increased susceptibility to diseases are limited to captive<br />
cheetahs and may be explained as artefacts of captivity. Merola (1994) suggested that the<br />
genetic make-up of the cheetah is a species-specific trait and not the result of a<br />
bottleneck. He states that terrestrial carnivores exhibit generally low genetic diversities<br />
(average 9%) and several carnivore species exhibit lower levels of heterozygosity and<br />
polymorphism than the cheetah does.<br />
However, the cheetah’s relative genetic monomorphism is potentially important to its<br />
conservation, but to date there is no evidence that the health and reproduction of wild<br />
populations are compromised. A study on free-ranging cheetahs in the Serengeti revealed<br />
that all adult females were reproducing and able to conceive within three weeks after the<br />
loss of a litter (Laurenson 1992). Results from blood analyses of this study revealed that<br />
free-ranging large carnivores on Namibian farmland are healthy and in a good to excellent<br />
condition (Thalwitzer 2007). Furthermore, they reproduce successfully (Schulze & Lonzer<br />
2006), and in an ecosytem without lions and spotted hyaenas cheetah cubs survive very<br />
well (personal observation, Thalwitzer 2007). These findings confirm the conclusion that<br />
free-ranging populations are chiefly regulated by extrinsic factors, rather than intrinsic<br />
factors such as low genetic variability.<br />
58<br />
� Okatumba Wildlife Research<br />
www.okatumba.de
2.9.5. Wildlife Management<br />
Before moving to the Okomitundu study site, we considered the density of the prey base to<br />
be medium (see 2.2.). After two years at Okomitundu we find that the availability of prey is<br />
low, especially on open farmland, compared to other regions in Namibia. Naturally, this<br />
also limits large carnivore densities. On the one hand Okomitundu is situated in a semiarid<br />
climate zone, which results in a lower grazing and browsing capacity than in other<br />
regions. On the other hand frequent poaching activities put pressure on game populations.<br />
Results of the game counts conducted during the expeditions in 2005, 2006 and 2007<br />
demonstrate that potential prey animals on open farmland react to environmental factors,<br />
whereas game densities within the game-proof fenced area did not change significantly.<br />
Game animals within this area can not move and they have to cope with the given<br />
conditions. As a result prey availability is maintained and large carnivores benefit from this.<br />
If the management of game-proof fenced areas is done well (see 2.6.4.), such areas may<br />
be very suitable conservation tools for rare or endangered species in particular.<br />
Persecution of large carnivores by humans, which was considered to be low to medium at<br />
the new study site (see 2.2.), is at least medium, or even high. Okomitundu protects large<br />
carnivores, but it is surrounded by several farmers that conduct trophy hunting on<br />
cheetahs and leopards. None of us like the fact that someone should come and kill these<br />
animals for pleasure, but the phrase “what pays stays” is a truth that needs to be<br />
accepted. We therefore support sustainable management of large carnivores, which also<br />
includes non-consumptive (e.g. photo tourism) and consumptive (e.g. trophy hunting)<br />
utilisation. Trophy hunting is controlled and limited through international agreements such<br />
as CITES and we are of the opinion that it is an important conservation tool, rather than a<br />
threat to the Namibian cheetah or leopard population. Nevertheless, it may cause local<br />
problems to the population structure or social organisation of the animals, if too much<br />
hunting in certain areas takes place. Our recommendation is therefore to better coordinate<br />
and to distribute trophy hunting on large carnivores on a national scale.<br />
Okatumba Wildlife Research has communicated this recommendation to the LCMAN<br />
(Large Carnivore Management Association of Namibia) and from there it is followed up<br />
together with the Permit Office of the MET (Ministry of Environment and Tourism).<br />
2.10. Future of the Large Carnivore Research Project<br />
Scientists and interns of Okatumba Wildlife Research continued data sampling (spoor<br />
count, telemetry and game count) at Okomitundu until the end of December 2007. In<br />
January 2008 the project moved to another study site between Windhoek and its<br />
international airport. As of February 2008 the large carnivore project, initiated and led by<br />
Okatumba Wildlife Research, is continued by a German biologist in collaboration with<br />
N/a’an ku sê Wildlife Sanctuary, a subsidiary organisation of the Harnas Wildlife<br />
Foundation, Namibia. The Förster family introduced the new research team into the<br />
project, assisted them for a while and then returned to Germany in March 2008.<br />
59<br />
� Okatumba Wildlife Research<br />
www.okatumba.de
The new project adheres to the current research objectives, and all methodologies<br />
described above are applied. Working with large carnivore tracks will be strengthened.<br />
Since cooperation with the farmer community was very difficult at Okomitundu study site, it<br />
shall be improved at N/a’an ku sê again. The priority of the project was and will be to assist<br />
the farmers in their management and to contribute to the solution of human-wildlife<br />
conflicts, rather than being at the forefront of scientific research.<br />
Further research at the new study site<br />
Habitat use is an important variable that influences spoor counts on roads. In a<br />
homogeneous habitat large carnivores would use roads at random, but in a heterogeneous<br />
habitat, such as the private farmland, cheetahs, leopards and hyaenas prefer certain areas<br />
and therefore spoor frequencies are not random. In addition, sampling effort must be as<br />
high as possible, as it is a crucial point for data analyses (Stander 1998). The more<br />
transects are counted and the longer these transects are, the better is the accuracy and<br />
precision of spoor frequency calculations. This is why the new research team at N/a’an ku<br />
sê study site performs spoor counts with help of local trackers throughout the year (except<br />
when ground cover is too dense).<br />
At the new study site the footprint identification technique (FIT) is tested for cheetahs and<br />
leopards. Originally this technique was developed to identify individual black and white<br />
rhino from their footprints (Alibhai & Jewell, 1997). It is now also used for tiger and tapir.<br />
FIT has several advantages: it is cost-effective, objective, repeatable and non-invasive to<br />
the animal. It provides not only knowledge about numbers and distribution of the study<br />
species, but also truly comprehensive data about ranging behaviour. Such findings are key<br />
to the implementation of strategies for protection and management. Besides, FIT uses the<br />
expert tracking and observation skills of indigenous people, which empowers local<br />
communities.<br />
In addition to working with carnivore spoors, radio tracking is continued. Whilst leopards<br />
use comparatively small home ranges only, cheetahs range over very large areas.<br />
Therefore space use of leopards can be monitored by use of ground telemetry, but<br />
determination of cheetah home ranges requires either aerial radio tracking or the use of<br />
GPS collars. The latter technology also provides additional useful information, to assess<br />
not only space use, but activity patterns of the study species too. Currently we are busy<br />
with fundraising to purchase some GPS collars for the new study site.<br />
Regarding population density the project should also think about other methodologies such<br />
as camera trapping and DNA analysis. Both methods are very time and cost consuming,<br />
but the benefit might be worthwhile.<br />
60<br />
� Okatumba Wildlife Research<br />
www.okatumba.de
Cheetahs, leopards and other carnivore species are often blamed by farmers for stock<br />
losses (goats, sheep and calves up to eight months of age), which results in indiscriminate<br />
killing of these carnivores (Marker et al. 1996, personal observation). Continuous<br />
determination of life history and demographic parameters such as sex ratios, age and<br />
social structure, litter sizes and survivorship need to establish whether the level of removal<br />
threatens the long-term viability of the populations. So, capture, mark and release will be<br />
continued at the new study site.<br />
One important step in solving conflicts between farmers and large carnivores is to provide<br />
reliable data on feeding habits and diet. Findings from the CCF (Cheetah Conservation<br />
Fund) and from the IZW (Institute for Zoo and Wildlife Research) have already shown that<br />
cheetahs and leopards rarely prey on livestock (Jauernig 2005, Marker et al. 2003b,<br />
Wachter et al. 2006). At N/a’an ku sê study site this project will also collect and analyse as<br />
many faecal samples as possible from captured study animals as well as from marking<br />
trees or elsewhere in the field. The more often it will be revealed that large carnivores<br />
rarely take livestock animals, the better it is.<br />
2.11. Acknowledgements<br />
First we would like to thank the Namibian Government, the Ministry of Environment and<br />
Tourism in particular, for giving us the permission to run wildlife conservation expeditions<br />
within the bounds of our large carnivore research project. We are deeply grateful to<br />
numerous farmers in and around our different study sites for their indispensable<br />
cooperation. Without their permission to work on their properties this study would not have<br />
been possible.<br />
Our thanks go to Kathy Wilden and Dr. Matthias Hammer from <strong>Biosphere</strong> <strong>Expeditions</strong> for<br />
five years of successful collaboration. We also thank the office personnel of <strong>Biosphere</strong><br />
<strong>Expeditions</strong> and the expedition leaders: Ben McNutt & Lisa Fenton (2002 and 2003), David<br />
Moore (2004 and 2005), Clare Fothergill (2006) and Peter Schütte (2007). All of them did a<br />
great job! Special thanks go to all expedition team members, who joined us out in the field,<br />
collected a large amount of data and at the same time supported the large carnivore<br />
research project with their financial contribution.<br />
We are grateful to Land Rover for providing essential vehicle support. Our thanks also go<br />
to Motorola for providing the two-way-radios and to Silva for providing binoculars, GPS<br />
instruments and compasses. We thank the Institute for Zoo and Wildlife Research in<br />
Germany for scientific advice during three years of collaboration, as well as the Messerli<br />
Foundation in Switzerland for financial support in the Omitara and Seeis study sites. Many<br />
thanks go to numerous interns who supported us during field work and data processing.<br />
Last, but not least we deeply thank Dr. Rudie and Marlice van Vuuren, the entire team of<br />
N/a’an ku sê Wildlife Sanctuary and Florian Weise for taking over the Large Carnivore<br />
Project and for continuing our work. We wish them good luck and all the best for the future.<br />
61<br />
� Okatumba Wildlife Research<br />
www.okatumba.de
2.12. References<br />
Alibhai, S.K. & Jewell, Z.C. (1997) Pilot study to investigate a spoor recognition system for<br />
censusing and monitoring black rhino in Etosha National Park. Reprt to the Ministry of Environment<br />
and Tourism, Namibia<br />
Balkenhol, N (2004) GIS-based analysis of home ranges and habitat selection of leopards<br />
(Panthera pardus) in Namibia. Diplomarbeit, Hochschule Vechta<br />
Barnes, J.I. & J.V.L. de Jager (1996) Economic and financial incentives for wildlife use on private<br />
land in Namibia and the implications for policy. South African Journal of Wildlife Research 26 (2):<br />
37-46<br />
Bashir, S., Durant, S.; Friedman, Y. (2005): Cheetah Census Technique Development Workshop.<br />
Cat News 42: 23<br />
Becker, E.F, M.A. Spindler & T.O. Osborne (1998) A population estimator based on network<br />
sampling of tracks in the snow. Journal of Wildlife Management 62 (3): 968-977<br />
Berry, H. (1990) Large-scale commercial wildlife utilization: Hunting, tourism and animal production<br />
in Namibia. In: Wildlife Research for Sustainable Development, 45-49. Ed. J.G. Brootenhuis, S.G.<br />
Njuguna and P.W. Kat. Proceedings of an International Conference held in Nairobi, April 1990.<br />
Berry, H. M., M. Bush, B. Davidson, O. Forge, B. Fox, J. Grisham, M. Howe, S. Hurlbut, L. Marker-<br />
Kraus, J. Martenson, L. Munson, K. Nowell, N. Schumann, T. Shille, F. Stander, K. Venzke, T.<br />
Wagener, D. Wildt, S.E. Seal, U. Seal (1997) Population and habitat viability assessment for the<br />
Namibian cheetah (Acinonyx jubatus) and lion (Panthera leo). Workshop Report, February 1997.<br />
Bowland, T. (1995) Jagluiperds van die Krugerwildtuin. Custos: 8-15<br />
Broomhall, L.S., Mills, M.G.L., du Toit, J.T. (2003) Home range and habitat use by cheetahs<br />
(Acinonyx jubatus) in the Kruger Park. J. Zool., Lond. 261: 119-128<br />
Brown, C. J., ed. (1992) Namibia's Green Plan (Environment and Development). Ministry of<br />
Environment and Tourism, Windhoek, Namibia.<br />
Buckland, S. T., D.R. Anderson, K.P. Burnham, J.L. Laake (1993) Distance sampling: Estimating<br />
abundance of biological populations. Chapman and Hall, London.<br />
Burnham, K. P., D.R. Anderson, J.L. Laake (1980) Estimation of density from line transect<br />
sampling of biological populations. Wildlife Monograph Number 72.<br />
Caro, T.M. (1994) Cheetahs of the Serengeti Plains. Group living in an asocial species. The<br />
University of Chicago Press, Chicago.<br />
Caughley, G. (1977) Analyses of vertebrate populations. John Wiley and Sons, London.<br />
Caughley, G.F. (1994) Directions in conservation biology. J. Animal Ecol. 65: 215-244<br />
Conradie, C. (2006) Cheetahs and leopards captured on farmland. AfriCat Newsletter 14(2): 1-3<br />
Cormack, R.M. (1968) The statistics of capture-recapture methods. Oceanogr. Mar. Biol. Annu.<br />
Rev. 6: 455-506.<br />
Durant, S.M. (1998) Competition refuges and coexistence: an example from Serengeti carnivores.<br />
Journal of Animal Ecology 67: 370-386.<br />
Eaton, R.L. (1978): The evolution of sociality in the felidae. In: The World’s Cats 3 (2), R.L. Eaton,<br />
ed., Carnivore Research Institute Seattle<br />
62<br />
� Okatumba Wildlife Research<br />
www.okatumba.de
Estes, R.D. (1997) The Behavior Guide to African Mammals. Library of Congress Cataloging-in-<br />
Publication Data. ISBN: 1-875091-10-6<br />
Evermann, J.F., Heeney, J.L., Roelke, M.E., McKeirnan, A.J., O’Brien, S.J. (1988) Biological and<br />
pathological consequences of feline infectious peritonitis virus infection in the cheetah. Arch. Virol.<br />
102: 155-171<br />
Funston, P.J., Herrmann, E., Babupi, P., Kruiper, A., Kruiper, H., Jaggers, H., Masule, K., Kruiper,<br />
K (2001) Spoor frequency estimates as a method of determining lion and other large mammal<br />
densities in the Kgalagadi Transfrontier Park.<br />
Gaerdes, J.H. (1974) Geparden in Südwestafrika. Mitteilungen der SWA Wissenschaftliche<br />
Gesellschaft 14 (9-12): 1-31.<br />
Harris, S., W.J. Cresswell, P.G. Forde, W.J. Trewhella, T. Wollard, S. Wray (1990) Home-range<br />
Analysis using Radio-Tracking Data - A Review of Problems and Techniques particularly as<br />
applied to the Study of Mammals. Mammal Review 20: 97-123<br />
Hayne, D.W. (1949) Calculation size of home range. Journal of Mammalogy 30: 1-18<br />
Hooge, P.N., Eichenlaub, W.M. (1997) Animal movement extension to Arc View ver. 2.0. Alaska<br />
Biological Science Centre - Biological Science Office, U.S. Geological Survey, Anchorage, AK,<br />
USA<br />
Hooge, P.N., Eichenlaub, W.M., Solomon, E.K. (2001) Using GIS to analyze animal movements in<br />
the marine environment. Alaska Biological Science Centre, U.S. Geological Survey Anchorage,<br />
Alaska<br />
Jauernig, O. (2005) Beutespektrum von Geparden (Acinonyx jubatus) auf kommerziellem<br />
Farmland in Namibia. Studienjahresarbeit, Humboldt Universität, Berlin.<br />
Joubert, E. (1984) The cheetah: South West Africa’s spotted enigma. South West Africa: 13-18.<br />
Joubert, E., P.K.N. Mostert (1975) Distribution patterns and status of some mammals in South<br />
West Africa. Madoqua 9: 5-44.<br />
Kraus, D., L. Marker-Kraus (1991) The status of the cheetah (Acinonyx jubatus). Report to the<br />
IUCN/SSC Cat Specialist Group.<br />
Laurenson, M.K. (1992) Reproductive strategies in wild female cheetahs. Ph.D. thesis. Univ. of<br />
Cambridge, Cambridge<br />
Laurenson, M.K. (1995) Implications of high offspring mortality for cheetah population dynamics.<br />
In: Sinclair, A.R.E., Arcese, P. (Eds.), Serengeti II: Dynamics, Management and Conservation of<br />
an Ecosystem. Serengeti Research Institute Workshop, Seronera, Tanzania. University of Chicago<br />
Press, Chicago, IL, pp. 385-389<br />
Lindburg, D.G., Durrant, B.S., Millard, S.E., Oosterhuis, J.E. (1993) Fertility assessment of cheetah<br />
males with poor quality semen. Zoo Biology 12(1): 97-104<br />
MacDonald, D.W., C.J. Amlaner (1980) A practical guide to radio tracking. In: A Handbook on<br />
Biotelemetry and Radio Tracking, Ed.: C.J. Amlaner & D.W. MacDonald, Pergamon Press, Oxford.<br />
Marker, L. (1998): Current status of the cheetah (Acinonyx jubatus). In B.L. Penzhorn, editor: A<br />
symposium on cheetahs as game ranch animals, 1-17. Wildlife Group of the South African<br />
Veterinary Association, Onderstepoort.<br />
63<br />
� Okatumba Wildlife Research<br />
www.okatumba.de
Marker, L., O’Brien, S.O. (1989) Captive breeding of the cheetah (Acinonyx jubatus) in North<br />
American zoos (1871-1986). Zoo Biology 8: 3-16<br />
Marker, L., D. Kraus, D. Barnett, S. Hurlbut (1996) Cheetah survival on Namibian farmlands.<br />
Cheetah Conservation Fund.<br />
Marker, L., Dickman, A.J., Mills, M.G.L., Macdonald, D.W. (2003a) Aspects of the management of<br />
cheetahs, Acinonyx jubatus jubatus, trapped on Namibian farmlands. Biological conservation 114:<br />
401-412<br />
Marker, L., Muntifering, J.R., Dickman, A.J., Mills, M.G.L., Macdonald, D.W. (2003b) Quantifying<br />
prey preferences of free-ranging Namibian cheetahs. South African Journal of Wildlife Research 33<br />
(1): 43-53<br />
Martin, R.B., T. de Meulenaer (1988) Survey of the status of the Leopard Pandera pardus in Sub-<br />
Saharan Africa. CITES, Switzerland.<br />
McVittie, R. (1979) Changes in the social behaviour of South West African cheetah. Madoqua 11<br />
(3): 171-184.<br />
Merola, M. (1994) A reassessment of homozygosity and the case of inbreeding depression in the<br />
cheetah, Acinonyx jubatus: Implications for conservation. Conservation Biology 8 (4): 961-971<br />
Mills, M.G.L. (1984) Prey selection and feeding habits of large carnivores in the southern Kalahari.<br />
Koedoe Supplement 27: 281-294<br />
Mills, M.G.L. (1991) Thick bush and stronger predators complicate cheetah’s hunt. Custos 19 (12):<br />
16-18<br />
Mills, M.G.L., J.M. Juritz, W. Zucchini (2001) Estimating the size of spotted hyaena (Crocuta<br />
crocuta) populations through playback recordings allowing for non-response. Animal Conservation<br />
4: 335-343.<br />
Mills, M.G.L., Broomhall, L.S., du Toit, J.T. (2004) Cheetah Acinonyx jubatus feeding ecology in<br />
the Kruger National Park and a comparison across African savanna habitats: is the cheetah only a<br />
successful hunter on open grassland plains? Wildlife Biology 10, 177-186<br />
Morsbach, D. (1987) Cheetahs in Namibia. Cat News 6: 26.<br />
Myers, N. (1975): The cheetah Acinonyx jubatus in Africa. IUCN Monograph No. 4. World<br />
Conservation Union, Morges, Switzerland.<br />
Murphy, C., Vaughan, C., Katjiua, J., Mulonga, S., Long, S.A. (2004) The costs of living with<br />
wildlife. In: Long, S.A. (2004 ed.) Livelihoods and CBNRM in Namibia. The findings of the WILD<br />
Project. Final Technical Report prepared for the Ministry of Environment and Tourism, Windhoek.<br />
Norton, P.M. (1990) How many leopards? A critism of Martin and de Meulenaer's population<br />
estimates for Africa. South African Journal of Science 86: 218-220.<br />
Nowell, K. & Jackson, P. (1996) Wild Cats. Status Survey and Action Plan. IUCN/SSC Cat<br />
Specialist Group. IUCN, Gland, Switzerland<br />
O’Brien, S.J., Wildt, D.E., Goldmann, D., Merril, C.R., Bush, M. (1983) The cheetah is depauperate<br />
in genetic variation. Science 221: 459-462<br />
64<br />
� Okatumba Wildlife Research<br />
www.okatumba.de
O’Brien, S.J., Roelke, M. E., Marker, L., Newman, A., Winkler, C.A., Meltzer, D., Colly, L.,<br />
Evermann, J.F., Bush, M., Wildt, D.E. (1985) Genetic basis for species vulnerability in the cheetah.<br />
Science 227: 1428-1434<br />
O’Brien, S.J., Wildt, D.E., Bush, M., Caro, T.M., FitzGibbon, C., Aggundey, I., Leakey, R.E. (1987)<br />
East African cheetahs: Evidence for two population bottlenecks? Proc. Natl. Acad. Sci. USA 84:<br />
508-511<br />
Otis, D.L., K.P. Burnham, G.C. White, D.R. Anderson (1978) Statistical inference from capture data<br />
on closed animal populations. Wildlife Monographs 62: 1-135.<br />
Panwar, H.S. (1979) A note on the tiger census technique based on pugmark tracings. Indian<br />
Forestry (Special issue on International Symposium on Tiger), February: 70-77.<br />
Powell, R.A. (2000) Animal Home Ranges and Territories and Home Range Estimators. In: Boitani,<br />
L. & T.K. Fuller (eds) Research Techniques in Animal Ecology - Controversies and Consequences:<br />
65-110, Columbia University Press, New York.<br />
Sargeant, A.B. (1980) Approaches, field considerations and problems associated with radio<br />
tracking carnivores. In: A Handbook on Biotelemetry and Radio Tracking, Ed.: C.J. Amlaner &<br />
D.W. MacDonald. Pergamon Press, Oxford.<br />
Schulze, S., Lonzer J. (2006): Why study cheetahs in Namibia? Roan News, Special Anniversary<br />
Edition 2006: 32-34<br />
Smallwood, K.S., E.L. Fitzhugh (1995) A track count for estimating mountain lion Felis concolor<br />
california population trends. Biological Conservation 71: 251-259.<br />
Stander, P.E. (1998) Spoor counts as indices of large carnivore populations: the relationship<br />
between spoor frequency, sampling effort and true density. Journal of Applied Ecology 35: 378-<br />
385.<br />
Stander, P.E., Hanssen L. (2003) Namibia Large Carnivore Atlas. Atlas Report by the Predator<br />
Conservation Trust, Dec 2003 Vol. 2<br />
Stander, P.E., Ghau //, Tsisaba, D., �oma, //, /ui, /. (1997) Tracking and the interpretation of spoor:<br />
a scientifically sound method in ecology. Jounal of Zoology, London 242: 329-341<br />
Thalwitzer, S. (2007) Reproductive activity in cheetah females, cub survival and health of male and<br />
female cheetahs on Namibian farmland. PhD thesis, Institute for Zoo and Wildlife Research, Freie<br />
Universität Berlin<br />
Wachter, B., Jauernig, O., Breitenmoser, U. (2006) Determination of prey hair in faeces of freeranging<br />
Namibian cheetahs with a simple method. Cat News 44: 8-9<br />
Wildt, D.E., O’Brien, S.J., Howard, J.G., Caro, T.M., Roelke, M.E., Brown, J.L., Bush, M. (1987)<br />
Similarity in ejaculate-endocrine characteristics in captive versus free-ranging cheetahs of two<br />
subspecies. Biol. Reprod. 36: 351-360<br />
Wildt, D.E., Brown, J.L., Bush, M., Barone, M.A., Cooper, K.A., Grisham, J., Howard, J.G. (1993)<br />
Reproductive status of cheetahs (Acinonyx jubatus) in North American zoos: the benefits of<br />
physiological surveys for strategicplanning. Zool. Biol. 12: 45-80<br />
Worton, B.J. (1995) Using Monte Carlo Simulation to evaluate Kernel-based home range<br />
estimators. Journal of Wildlife Management 59: 794-800<br />
65<br />
� Okatumba Wildlife Research<br />
www.okatumba.de
Appendix 1: List of mammals at Okomitundu<br />
1 Aardvark Orycteropus afer Erdferkel<br />
2 Aardwolf Proteles cristatus Erdwolf<br />
3 African wild cat Felis lybica Afrikanische Wildkatze<br />
4 Banded mongoose Mungos mungo Zebramanguste<br />
5 Bat-eared fox Otocyon megalotis Löffelhund<br />
6 Black wildebeest Connochaetes gnou Weißschwanzgnu<br />
7 Black-backed jackal Canis mesomelas Schabrackenschakal<br />
8 Blesbok Damaliscus dorcas phillipsi Blessbock<br />
9 Blue wildebeest Connochaetes taurinus Streifengnu<br />
10 Brown hyaena Hyaena brunnea Braune Hyäne<br />
11 Caracal Felis caracal Karakal (Wüstenluchs)<br />
12 Cape fox Vulpes chama Kapfuchs<br />
13 Chacma baboon Papio ursinus Tschakma-Pavian<br />
14 Cheetah Acinonyx jubatus Gepard<br />
15 Common duiker Sylvicapra grimmia Kronenducker<br />
16 Eland Taurotragus oryx Elanantilope<br />
17 Gemsbok Oryx gazella Oryx (Spiessbock)<br />
18 Giraffe Giraffa camelopardalis Giraffe<br />
19 Ground squirrel Xerus inauris Erdhörnchen<br />
20 Honey badger Mellivora capensis Honigdachs<br />
21 Impala Aepyceros melampus Schwarzfersenantilope<br />
22 Klipspringer Oreotragus oreotragus Klippspringer<br />
23 Kudu Tragelaphus strepsiceros Großer Kudu<br />
24 Leopard Panthera pardus Leopard<br />
25 Mountain zebra Equus zebra Bergzebra<br />
26 Pangolin Manis temminckii Steppen-Schuppentier<br />
27 Porcupine Hystrix africaeaustralis Stachelschwein<br />
28 Red hartebeest Alcelaphus buselaphus Kuhantilope<br />
29 Rock dassie Procavia capensis Klippschliefer<br />
30 Scrub hare Lepus saxatilis Buschhase<br />
31 Slender mongoose Galerella sanguinea Schlanke Manguste<br />
32 Small-spotted genet Genetta genetta Kleinflecken-Ginsterkatze<br />
33 Springbok Antidorcas marsupialis Springbock<br />
34 Springhare Pedetes capensis Springhase<br />
35 Steenbok Raphicerus campestris Steinbock<br />
36 Striped polecat Ictonyx striatus Zorilla (Streifeniltis)<br />
37 Suricate Suricata suricatta Erdmännchen<br />
38 Tree squirrel Paraxerus cepapi Ockerfuss-Buschhörnchen<br />
39 Warthog Phacochoerus aethiopicus Warzenschwein<br />
40 Waterbuck Kobus ellipsiprymnus Wasserbock<br />
41 Yellow mongoose Cynictis penicillata Fuchsmanguste<br />
66<br />
� Okatumba Wildlife Research<br />
www.okatumba.de
Appendix 2: List of birds at Okomitundu<br />
1 Acacia Pied Barbet Tricholaema leucomelas Rotstirnbartvogel<br />
2 African Grey Hornbill Tockus nasutus Grautoko<br />
3 African Hawk Eagle Hieraaetus spilogaster Habichtsadler<br />
4 African Hoopoe Upupa africana Wiedehopf<br />
5 African Red-eyed Bulbul Pycnonotus nigricans Maskenbülbül<br />
6 Amethyst Sunbird Chalcomitra amethystina Amethystglanzköpfchen<br />
7 Ant-eating Chat Myrmecocichla formicivora Termitenschmätzer<br />
8 Barn Owl Tyto alba Schleiereule<br />
9 Bearded Woodpecker Dendropicos namaquus Namaspecht<br />
10 Black-breasted Snake Eagle Circaetus pectoralis Schwarzbrust-Schlangenadler<br />
11 Black-cheeked Waxbill Estrilda erythronotos Elfenastrild<br />
12 Black-chested Prinia Prinia flavicans Brustbandprinie<br />
13 Black Eagle Aquila verreauxii Felsenadler<br />
14 Black Harrier Circus maurus Mohrenweihe<br />
15 Black Kite Milvus migrans Schwarzer Milan<br />
16 Northern Black Korhaan Eupodotis afraoides Gackeltrappe<br />
17 Black-shouldered Kite Elanus caeruleus Gleitaar<br />
18 Black-throated Canary Serinus atrogularis Angolagirlitz<br />
19 Blacksmith Plover Vanellus armatus Waffenkiebitz<br />
20 Booted Eagle Hieraaetus pennatus Zwergadler<br />
21 Bronze-winged Courser Rhinoptilus chalcopterus Bronzeflügel Rennvogel<br />
22 Brown-throated Martin Riparia paludicola Afrikanische Uferschwalbe<br />
23 Burchell's Sandgrouse Pterocles burchelli Fleckenflughuhn<br />
24 Cape Glossy Starling Lamprotornis nitens Rotschulterglanzstar<br />
25 Cape Sparrow Passer melanurus Kapsperling<br />
26 Cape Turtle Dove Streptopelia capicola Kapturteltaube<br />
27 Chestnut-vented Titbabbler Parisoma subcaeruleum Meisensänger<br />
28 Common Ostrich Struthio camelus Strauß<br />
29 Crimson-breasted Shrike Laniarius atrococcineus Rotbauchwürger<br />
30 Crowned Plover Vanellus coronatus Kronenkiebitz<br />
31 Double-banded Sandgrouse Pterocles bicinctus Nachtflughuhn<br />
32 Dusky Lark Pinarocorys nigricans Drossellerche<br />
33 Dusky Sunbird Cinnyris fusca Rußnektarvogel<br />
34 Giant Eagle Owl Bubo lacteus Milchuhu<br />
35 European Bee-eater Merops apiaster Europäischer Bienenfresser<br />
36 European Swallow Hirundo rustica Rauchschwalbe<br />
37 Fork-tailed Drongo Dicrurus adsimilis Trauerdrongo<br />
38 Gabar Goshawk Melierax gabar Gabarhabicht<br />
39 Golden-breasted Bunting Emberiza flaviventris Gelbbauchammer<br />
40 Great Sparrow Passer motitensis Rotbrauner Sperling<br />
41 Greater Striped Swallow Hirundo cucullata Streifenschwalbe<br />
42 Grey Lourie Corythaixoides concolor Graulärmvogel<br />
43 Groundscraper Thrush Psophocichla litsitsirupa Akaziendrossel<br />
44 Helmeted Guineafowl Numida meleagris Haubenperlhuhn<br />
45 Common House Martin Delichon urbica Mehlschwalbe<br />
46 House Sparrow Passer domesticus Haussperling<br />
47 Kalahari Robin Cercotrichas paena Kalahariheckensänger<br />
48 Kori Bustard Ardeotis kori Riesentrappe<br />
49 Lappet-faced Vulture Torgos tracheliotus Ohrengeier<br />
67<br />
� Okatumba Wildlife Research<br />
www.okatumba.de
50 Laughing Dove Streptopelia senegalensis Senegaltaube<br />
51 Lesser Kestrel Falco naumanni Rötelfalke<br />
52 Lilac-breasted Roller Coracias caudata Gabelracke<br />
53 Marico Flycatcher Bradornis mariquensis Maricoschnäpper<br />
54 Marico Sunbird Cinnyris mariquensis Bindennektarvogel<br />
55 Martial Eagle Polemaetus bellicosus Kampfadler<br />
56 Melba Finch Pytilia melba Buntastrild<br />
57 Monteiro's Hornbill Tockus monteiri Monteirotoko<br />
58 Mountain Chat Oenanthe monticola Bergschmätzer<br />
59 Namaqua Dove Oena capensis Kaptäubchen<br />
60 Namaqua Sandgrouse Pterocles namaqua Namaflughuhn<br />
61 Olive Bush Shrike Telophorus olivaceus Olivwürger<br />
62 Ovambo Sparrowhawk Accipiter ovampensis Ovambosperber<br />
63 Pale Chanting Goshawk Melierax canorus Weißbürzelsinghabicht<br />
64 Pale-winged Starling Onychognathus nabouroup Bergstar<br />
65 Pearl-breasted Swallow Hirundo dimidiata Perlbrustschwalbe<br />
66 Pearl-spotted Owl Glaucidium perlatum Perlkauz<br />
67 Pied Babbler Turdoides bicolor Elsterdrossling<br />
68 Pied Crow Corvus albus Schildrabe<br />
69 Pygmy Falcon Polihierax semitorquatus Zwergfalke<br />
70 Pririt Batis Batis pririt Priritschnäpper<br />
71 Red-backed Shrike Lanius collurio Neuntöter<br />
72 Red-billed Buffalo-weaver Bubalornis niger Büffelweber<br />
73 Red-billed Francolin Pternistes adspersus Rotschnabel Frankolin<br />
74 Red-billed Hornbill Tockus erythrorhynchus Rotschnabeltoko<br />
75 Red-billed Quelea Quelea quelea Blutschnabelweber<br />
76 Red-crested Korhaan Eupodotis ruficrista Rotschopftrappe<br />
77 Red-faced Mousebird Urocolius indicus Rotzügelmausvogel<br />
78 Rock Kestrel Falco rupicolis Turmfalke<br />
79 Rock Martin Hirundo fuligula Felsenschwalbe<br />
80 Rosy-faced Lovebird Agapornis roseicollis Rosenpapagei<br />
81 Rüppell´s Parrot Poicephalus rueppellii Rüppellpapagei<br />
82 Shaft-tailed Whydah Vidua regia Königswitwe<br />
83 Short-toed Rock Thrush Monticola brevipes Kurzzehenrötel<br />
84 Southern Grey-headed Sparrow Passer diffusus Graukopfsperling<br />
85 Southern Masked Weaver Ploceus velatus Maskenweber<br />
86 Southern White-crowned Shrike Eurocephalus anguitimens Weißscheitelwürger<br />
87 Steppe Buzzard Buteo buteo vulpinus Mäusebussard<br />
88 Swallow-tailed Bee-eater Merops hirundineus Schwalbenschwanz-Bienenfresser<br />
89 Tawny Eagle Aquila rapax Raubadler<br />
90 Violet-eared Waxbill Granatina granatina Blaubäckchen<br />
91 Wahlberg's Eagle Aquila wahlbergi Wahlbergadler<br />
92 White-backed Mousebird Colius colius Weißrückenmausvogel<br />
93 White-backed Vulture Gyps africanus Weißrückengeier<br />
94 White-browed Sparrow-weaver Plocepasser mahali Mahaliweber<br />
95 White-faced Scops Owl Ptilopsus granti Weißgesichtohreule<br />
96 Yellow-billed Hornbill Tockus leucomelas Gelbschnabeltoko<br />
97 Yellow Canary Serinus flaviventris Gelbbauchgirlitz<br />
68<br />
� Okatumba Wildlife Research<br />
www.okatumba.de
Appendix 3: List of daily research activities 2007<br />
Vehicle<br />
no<br />
1 Spoor count (vehicle)<br />
Morning Afternoon<br />
69<br />
� Okatumba Wildlife Research<br />
www.okatumba.de<br />
Week 1: Control of marking trees<br />
Week 2: Control of border fence<br />
2 Checking box traps Data entry<br />
3 Radio telemetry Game count<br />
4 Observation at water places Spoor tracking (on foot)
Appendix 4: 2007 expedition diary by expedition leader Peter Schütte<br />
29 August<br />
Hello everyone and welcome to <strong>Biosphere</strong> <strong>Expeditions</strong>’ Namibia 2007 diary. I’m Peter, your expedition<br />
leader for the upcoming four slots, and you will be hearing from me regularly over the next few weeks.<br />
Yesterday I arrived met up with Matthias, <strong>Biosphere</strong>'s founder and managing director. We went through<br />
paperwork and packed up the equipment – more is stored at the Okomitundu study site in Namibia. Harald,<br />
one of our scientists in Namibia, just rang to tell us the Land Rovers are ready and waiting!<br />
This will be <strong>Biosphere</strong>'s 7th expedition on cheetahs in Namibia and for the last couple of years leopards and<br />
brown hyaenas have also joined in.<br />
Later today I will be boarding a flight to Windhoek where it is warm (30°C) and sunny, so don't forget<br />
sunscreen!<br />
I am looking forward to meeting the scientists and we will get everything ready for the first team members<br />
arriving next Monday.<br />
I will write again from Okomitundu.<br />
Peter Schuette<br />
Expedition Leader<br />
31 August<br />
Made it to Namibia, but my luggage did not, so here is a word of warning. Apparently Johannesburg airport<br />
luggage handling is in chaos and there have been lots of cases of luggage not making it in time. If you are<br />
coming via Jo’burg, ask at check-in whether you can retrieve your luggage there and then re-check it for your<br />
Windhoek flight. This is should give you the best chance of emerging with your luggage in Windhoek.<br />
But on to brighter things: we’re all getting ready for you here, the farm and cars are prepped, most of the<br />
equipment is ready and we are all looking forward to slot 1’s arrival. A couple of days ago our interns also<br />
found tracks of the three collared cheetahs nearby, so it seems they have kindly proceeded to the farm in<br />
time for the expedition’s start! Looks like we just need you lot to get going now….<br />
4 September<br />
We spent the last days before the arrival of the first team members with preparing equipment and<br />
datasheets, last shopping etc.<br />
Yesterday Harald, Alex, Tim and me met the first slot team members in Windhoek. Everybody made it there<br />
in time (with all their luggage!). After the two hour drive to the study site at Okomitundu, we went straight into<br />
the introductory talks and risk assessment. Those who want to drive then joined the Land Rover off-road<br />
driving course led by Harald and myself whilst Alex, Tim and Sibylla (Okatumba interns) took the non-drivers<br />
for a drive to arm the box traps.<br />
All team members had first sightings like kudu, oryx, springbok and hornbills and later in the evening around<br />
the campfire mosquitoes were spotted too ;-) !<br />
This morning we started with a late (7:30!) breakfast, then Harald and Sibylla took everybody with two Land<br />
Rovers to check the box traps. No cheetah captured, but a honey badger in trap no 4 and a big male baboon<br />
in trap no 6. Not a bad start.<br />
The rest of the day we spent with presentations and talks about the research, explaining datasheets,<br />
research activities during the expedition and teaching team members how to use things like GPS, compass,<br />
radio telemetry equipment...<br />
70<br />
� <strong>Biosphere</strong> <strong>Expeditions</strong><br />
www.biosphere-expeditions.org
P.S.: My luggage was delivered on Sunday afternoon!!!<br />
5 September<br />
After two days of training and listening to presentations, we split up into our survey groups. Harald led the<br />
spoor tracking group with Linda, Angela and Uwe. They spotted fresh tracks of the three male cheetah<br />
coalition. They also had to check box trap no 2 and had to release a stubborn porcupine which did not want<br />
to get out!<br />
The box trap group (Sibylla, Hanne, John and Keith) had to check the other box traps, nothing was captured,<br />
but there were hyaena tracks around trap no 1! The box traps are located on trees where cheetahs<br />
frequently mark their territory or on places where leopards or brown hyaenas are passing by, or they are<br />
baited. Once captured, the animals will be immobilised to take blood samples and fit radio collars. That’s the<br />
plan anyway ;)<br />
Lots of tracks were spotted by the waterhole observation team (Tim, Kelly, Helga and Karin). This helps to<br />
determine prey density.<br />
I took the telemetry team (Ralf, Susi and Claudia) to Mathildenhöhe where we got signals of female leopard<br />
F009. We tried to get more signals for triangulation, which was not that easy, but our efforts were rewarded!<br />
We not only got signals, we also found her fresh tracks!<br />
After the report-back of all groups and Sibylla's presentation about carnivores, we split into the afternoon<br />
working groups.<br />
The afternoon activities are:<br />
Data entry – the bonus here is that you get to do something afterwards like hiking or horse riding.<br />
The game count team drove 20 km seeing kudu, oryx, ostrich, warthog etc. and finding fresh hyaena tracks.<br />
Game count also allows calculations about the game/prey density.<br />
The marking tree and the spoor tracking group went together to do some telemetry work and the search for<br />
tracks led by Harald, who was disappointed because the telemetry team in the morning followed the female<br />
leopard not "his" three cheetahs (there were no signals of them!!). Sadly we could get no signals at all in the<br />
afternoon. The compensation was seeing four giraffes and more fresh tracks of "Harald's" cheetahs.<br />
It's still a little bit too hot for this time of the year during the day, in the early morning 14°C, later 30°C with the<br />
sun beating down and back to long sleeves for sitting round the camp fire in the evenings. Welcome to<br />
Africa!<br />
6 September<br />
Harald's telemetry team received signals of our female leopard again. But today she is on the neighbouring<br />
farm. Telemetry point no 6 was the good one. Signals of a moving F 012, the other female leopard carrying a<br />
radio collar. There was no time left to try a triangulation, but they spotted eland, kudu, hartebeest and oryx!<br />
Spoor tracking today was really exciting. The group led by Birgit followed a leopard track up to a small<br />
plateau. Once on the plateau they found lots of bones – a leopard's dining room!<br />
8 September<br />
Yesterday's telemetry made Harald happy! Tim and his team got signals of two of the cheetah coalition,<br />
F005 and F006, on the neighbour's farm!<br />
Today's team triangulated F012 with a heroic effort of climbing camelthorn trees (very long thorns!) to get a<br />
little bit further off the ground for a better signal. Spoor counting and spoor tracking is quite successful too -<br />
71<br />
� <strong>Biosphere</strong> <strong>Expeditions</strong><br />
www.biosphere-expeditions.org
we found a lot of tracks of leopard, hyena and cheetah. So they are all here - somewhere, we just need a<br />
little bit of luck to see or capture them! But it’s early days.<br />
This morning's spoor counting team - they also had to check box trap no 2 - followed a fresh cheetah track<br />
getting closer and closer to the trap. But a couple of metres before the trap the cheetah turned away! So<br />
close!<br />
Also the exhausting walks in the sandy riverbed to find more cheetah marking trees bring positive results, as<br />
it appears that some trees have been reactivated by the cats.<br />
Everybody is now well into the daily research activities, so we are collecting data, data, data! For example,<br />
yesterday afternoon's game count saw a record number of animals with 28 different encounters including<br />
kudu, oryx, steenbok... and bat eared fox!<br />
But it's not only work, work, work. Everybody is enjoying the chats during the lunch breaks or at the campfire<br />
-having a beer or two - in the evening! And Leica (the border collie) keeps everybody busy throwing balls or<br />
sticks, Bruno (the labrador) and Bundu (cocker) always need to be patted vigorously. I think they absolutely<br />
love it when the expedition is around!<br />
9 September<br />
The Sunday started with a closed box trap no 1 again. These mongoose play a joke with us! And again there<br />
are hyaena tracks around. The box trap team continued on their way finding a porcupine in box trap no 2 and<br />
a young female baboon with a little baby holding on tightly to her belly. The other groups were very<br />
successful with spoor tracking yesterday afternoon and spoor counting this morning. They found cheetah<br />
tracks, which could be followed for several kilometres. Once lost Pete, one of our Bushmen trackers with<br />
amazing skills, found them again and again. Close to a known marking tree, they spotted tracks of three<br />
cheetahs, probably our male coalition. Furthermore fresh (
One big group led by Sibylla and Keith (data entry worked during lunch break today) went to Kuduspitze's<br />
foot to surveying the area. While climbing up the mountain on Sunday, Keith detected scat and a sandy,<br />
promising looking area. And, sure enough, they found two leopard tracks, albeit very old ones. Kelly, almost<br />
always late for coffee in the morning, missed the sunspiders caught by Hanne. Uwe really enjoys taking<br />
photographs of them - biologists :) The kitchen keeps us happy serving lunchboxes and in the evening oryx<br />
steak or boobotje!<br />
12 September<br />
Today was the day! I took Karin, Helga and Kelly to check the box traps. The long way to box trap no 1 was<br />
rewarded! A brown hyaena was sitting in the trap calmly and just staring at us. First we thought, it's a juvenile<br />
male, but Birgit's inspection later in the day found that it’s probably a female (it's not that easy to see with<br />
hyenas!). We will know for sure after tomorrow's examination when we will immobilise the animal. Hopefully<br />
he/she is an adult, then we can put on a radio collar! Unfortunately we don't have a collared hyaena yet. Last<br />
year's two captured animals were too young for a collar. So this would be the first!<br />
So we informed Harald and the whole team and everybody is really excited and happy. We left the animal<br />
with water in the box trap, Birgit is preparing everything for tomorrow. Wow, what a success!<br />
Usually it takes more than 140 trap nights to catch an animal in a trap (one night with six armed traps is six<br />
trap nights!). Normal work continued and after few results during the last few days (only single signals),<br />
telemetry was successful today. They managed to get a triangulation of F009, our female leopard, which was<br />
caught and collared last year. "Stumpy" (she has a very short tail) is reliable, she is always around!<br />
Watch this space for further news on the hyaena examination….<br />
13 September<br />
The whole team went out to the box trap this morning. On the way we checked box trap no 4, which was<br />
open and empty. The other four traps we secured yesterday so that we did not have to check them this<br />
morning whilst we are busy with the hyaena.<br />
The animal was extremely timid and watched Birgit and Harald carefully when they got closer to immobilise<br />
him. Him, because later on during the examination Birgit diagnosed that the animal is a healthy small adult<br />
male (approx. four years old).<br />
Birgit darted him and after 10 minutes we could bring him to the examination table. The body weight was 34<br />
kg and the neck circumference 48 cm, so we could put a radio collar on! This is the first collared brown<br />
hyena in the study site. He will give us information about where the den is and in which area he roams<br />
around. Unfortunately it was not possible to take blood samples. Hyaenas have got a very special<br />
metabolism and blood circulation with low blood pressure. This makes it really difficult to take blood samples.<br />
But a lot of other samples were takes such as fur, smears of ear and muzzle.<br />
After fitting an ear tag and the collar we laid him down in the shade to wake up, which took over one hour! He<br />
got up, still drugged and staggered about like a drunkard! Later in the afternoon we received his signals<br />
moving into the area where we presume the den must be.<br />
After the exciting morning we kept on working in our normal groups on our usual activities of game count,<br />
border fence and data entry, etc. In between the afternoon activities we armed all the other box traps again<br />
for tomorrow's round of checks. Alex's team not only got signals of our newly-collared hyaena - they also had<br />
signals of two of our (Harald's) cheetah coalition! So the task for tomorrow's telemetry group will be to try a<br />
triangulation.<br />
Quite a few leopard tracks were found over the last few days. A big male's for example very close to box trap<br />
no 3 (when the trap was not armed during the hyaena examination!) but luckily he didn't even notice the trap.<br />
Imagine the leopard would have walked into and straight out of the trap again whilst it was disarmed. How<br />
annoying that would have been!<br />
73<br />
� <strong>Biosphere</strong> <strong>Expeditions</strong><br />
www.biosphere-expeditions.org
15 September<br />
Yesterday the last day of data collection by the first team was completed. Again THAT porcupine was<br />
trapped in box trap no 2 and again it didn’t want to leave… We found many spoors today such as male<br />
leopard close to trap no 3 from Thursday, in the riverbed next to trap no 6 a female leopard and large a<br />
hyaena track around trap no 4! Whilst spoor counting, the team found two very fresh hyaena tracks.<br />
Unfortunately we also found spoors of poachers with donkeys and dogs again and the waterhole observation<br />
team led by Alex has seen people crossing the farm.<br />
I would like to say a big thank you to the first <strong>Biosphere</strong> <strong>Expeditions</strong> team for all the work collecting data and<br />
filling in datasheets! We had a lot of success in the last two weeks. 9 captures (one carnivore!), a large<br />
amount of tracks (12 x cheetah, 15 x hyaena, 18 x leopard) and lots of game sightings. I am sure the<br />
memory of the capture and examination of the brown hyena will stay with you for a long time! Not to mention<br />
the beautiful sunrise next to Eulenkuppe, the freezing mornings, all the steenboks around, the dogs and the<br />
honey badger!<br />
19 September<br />
After a hectic Monday morning in Windhoek shopping and organising, Sibylle, Tim, Alex and I picked up the<br />
new team members at Casa Piccolo. The usual procedures and lectures followed in the afternoon and<br />
everybody went to bed really early after this long day.<br />
On Tuesday we checked the box traps (nothing, not even spoors) and put bait in some. Game was spotted<br />
by the team members such as hartebeest, kudu, ostrich … Then Harald and I continued with presentations,<br />
explaining the equipment …<br />
Yesterday this year’s second team split up into the four working groups to starting the first day of data<br />
collection and this was to be the day of unusual encounters!<br />
The telemetry team led by myself found a desperate guinea fowl in box trap no 1, which must have entered<br />
the trap after the box trap team led by Harald checked the trap. Brave Nancy released the poor animal. On<br />
our way back to base we saw a rock monitor lizard just in the middle of the farm road, escaping into a tree.<br />
What a primeval animal!<br />
Sibylla’s spoor counting team found an old female cheetah spoor and the day of strange animals continued:<br />
they saw a pangolin, very unusual because they are nocturnal. Next to box trap no 4 we found massive<br />
leopard tracks, the spoor tracking team will follow them this in the afternoon. A neighbour reported some<br />
cattle losses, so we want to find out if is could be this leopard.<br />
It’s always interesting and exciting to meet different people from different countries and backgrounds. In this<br />
slot we have a whole variety from the UK, USA, Germany and Taiwan.<br />
20 September<br />
Today we had a lot of action! I went out with Mary Beth, Jenny and Pearl to check the box traps. The first<br />
one, where we put new bait yesterday was closed but empty. We could find tracks of a honey badger and<br />
spoors of digging underneath the trap. Somebody (the honey badger) was interested in the bait! In trap no 3<br />
we found a really unhappy juvenile. I immediately released the animal and it ran away. Such a beautiful small<br />
cat!<br />
Telemetry was successful today, they managed to do a triangulation of leopard F012 in the western part of<br />
the study site. She was moving, so it’ll be exciting to seeing where she will be tomorrow.<br />
And today was also the tracker’s day. We found nine tracks of different animals! Five leopard and four<br />
cheetah tracks. A female cheetah passed by trap no 2, missing it only by two metres. Like the leopard in the<br />
last week! Why don’t they go in? But it was a great successful day nevertheless.<br />
74<br />
� <strong>Biosphere</strong> <strong>Expeditions</strong><br />
www.biosphere-expeditions.org
24 September<br />
In the afternoon I dropped Harald and his team to check marking trees. Shortly before dropping them off, an<br />
African wildcat shot out off the bush. What a nice surprise seeing this cat.<br />
The game count and waterhole observation groups report a lot of sighting. Kudu, oryx, hartebeest, eland,<br />
steenbok, ostrich, baboon, warthog, impala, hyrax, cory bustard and jackal were all spotted. The record is a<br />
group of 64 (!) kudu so far.<br />
The search for spoors whether by chance or during spoor counting also brings good results. The teams<br />
found seven leopard, three cheetah and three hyena tracks in the last few days.<br />
The box traps, however, are successful only in capturing porcupine and baboon so far.<br />
On early Friday morning a neighbouring farmer informed Harald and Birgit that she had seen a cheetah cub<br />
in the middle of the gravel road obviously looking for its mother. So Birgit went with her team to following the<br />
mother’s track but they could only follow it to the border fence of one of the neighbouring farms we don’t<br />
have access to.<br />
Early Sunday morning brought a nice surprise. The box trap team radioed that there was a brown hyena in<br />
trap no 1. Birgit went there immediately to find that the animal was a juvenile. So Birgit and Harald decided to<br />
do a “hot release”, which means no examination, just setting the animal free. The reasons for this decision<br />
are: the animal is not adult, so we can not put a collar on and it’s always difficult to take blood samples<br />
because there is only very low blood pressure with immobilised hyenas. So an immobilisation would be<br />
unnecessarily stressful for the animal. Everybody met up at box trap no 1 and took good photographs of<br />
Harald releasing the hyena.<br />
In the afternoon the whole team drove up to Kuduspitze for telemetry and a short walk (Kathy, Chris, Jens,<br />
Tim and Alex hiked up!), later enjoying the stunning sunset and celebrating Nick’s birthday!<br />
Today is the day off and the whole team went with Harald, Alex and myself to Omaruru for shopping and<br />
joining the game drive at the game lodge with rhinos, elephants and hippos in the afternoon.<br />
26 September<br />
Back in the real wilderness of Okomitundu. Yesterday we placed new bait in box traps no 3 and no 5 and the<br />
teams started their daily field work again.<br />
Poor Harald had a small accident while blowing up a balloon for his kids it burst and a part of it hit his eye.<br />
So he had to go to Windhoek to see the doctor but luckily it’s only two scratches on the retina, he’ll be okay<br />
within a few days.<br />
No fresh tracks found in the morning - nothing to follow in the afternoon, so I took the spoor tracking team<br />
equipped with the telemetry stuff to the western part searching for “Harald’s” cheetahs. No sign of them, but<br />
instead we had very strong signals of female leopard F012, first moving then resting. We followed the signals<br />
and found her position on the foot of a hill. The search with binoculars was successful – the luckiest<br />
expedition leader on earth could see the beautiful cat for two seconds just disappearing behind bushes and<br />
rocks! WOW!<br />
After dinner the team split up into three teams. Two teams doing night observation (full moon!) at Alter<br />
Damm and Felixposten and the rest went with Tim for telemetry work in the Apostelhills searching for the<br />
collared hyena.<br />
After a short night we went out this morning as usual. At the report back (Harald is with us again – with one<br />
eye ;-)) a successful triangulation of F 012, several game sightings at Johannesposten and a two days old<br />
leopard spoor were reported. The box traps team and myself had to release two juvenile baboons, which<br />
were really scared when Kathy and I went to the trap to set them free.<br />
75<br />
� <strong>Biosphere</strong> <strong>Expeditions</strong><br />
www.biosphere-expeditions.org
30 September<br />
The last days of the 2007 second team’s data collection were quite successful and exciting. While climbing<br />
up hills for telemetry one team disturbed a troop of baboons complaining about the trouble-makers in their<br />
territory. And the efforts led to results: we had a lot of signals and triangulations of the leopards and a few of<br />
the newly collared hyaena. While spoor counting and checking the border fences our teams found a lot of<br />
evidence of poaching such as donkey and dog tracks as well as cut wires. One of the teams found very<br />
interesting sign of poachers such as a comb (!) and a wooden arrow in Herero style!<br />
Several tracks of cheetah, leopard and brown hyaena were spotted in the last few days, a new marking tree<br />
was found and the observation team on Felixposten on Friday morning had fourteen sightings including a<br />
troop of approximately thirty baboons.<br />
Mary Beth, Jenny and Pearl went out with me spoor counting on Friday morning and we were really lucky to<br />
see another African wildcat for several minutes close to the farm road.<br />
The second slot has come to an emotional end and team members travel back home or continue their<br />
adventures. A big thank you to everyone for your hard work in the field. I’m sure you will not forget moments<br />
such as Nick’s birthday at Mathildenhöhe, the release of the juvenile brown hyaena and the sightings of<br />
African wildcat and leopard!<br />
A special thank you to our vet from Georgia, US who fixed one wounded horse, you have done a great job!<br />
I am now in Windhoek for the next few days as we have one week off. Looking forward to slot three in a<br />
week.<br />
10 October<br />
Again we have quite an international mix here for slot three and everybody settled in on Monday. With the<br />
introductory talks and presentations now completed, this morning we split up into the teams and started the<br />
field work. Richard, Inga, Gabriele and Sue went spoor counting with Oliver and our tracker Piet. Like the<br />
telemetry team (Corinne, Pascale and Elliot) led by myself there was not much to report.<br />
Sibylla took Pamela, Jan and Julie out to check box traps. This was also uneventful, but they spotted a group<br />
of at least 25 impala, some ostriches and a snake (they are still busy debating what species it was). Peter<br />
and Paul were dropped at Alter Damm for observation. Last night and the night before were really cold<br />
(about six degrees centigrade in the morning) and quite windy, so not many animals were seen.<br />
But everyone now has an idea what the daily field work is like and we look forward to collecting more data in<br />
the days to come.<br />
11 October<br />
The morning has started promising. The telemetry team got signals of F012 again and managed a<br />
triangulation, so we now know quite well where her territory is and where she usually hangs around during<br />
the day. Additionally Assa found a very fresh track of her just on the road. In the afternoon Birgit and myself<br />
went back managing another triangulation and Birgit and some of the team members thought they saw her,<br />
but I still don’t believe it :-> In the days ahead we will keep looking and then we’ll see, if it was a rock or<br />
F012.<br />
Sue, Inga, Gabriele, Richard, myself and Piet checked the box traps when we came across a honey badger<br />
in trap no 5 and another one just outside. It seems like the juvenile was inside the cage, the mother outside<br />
very concerned and busy digging and investigating the trap for a release of her youngster.<br />
So better call the “bagder-man”! All of you who have been here during a honey badger capture/release<br />
know Harald’s stories about the dangerous beast that can, when provoked, be extremely dangerous.<br />
76<br />
� <strong>Biosphere</strong> <strong>Expeditions</strong><br />
www.biosphere-expeditions.org
We called our scientist to release the creature with the spoor counting and observation team joining us, and<br />
so we went close to the box trap with two cars. Birgit - jumping from the car onto the top of the trap, the<br />
mother honey badger must have been still around, lifting the gate and the creature ran out of the trap directly<br />
underneath the Double Cab car hiding on the back axle!<br />
Great!<br />
Now everybody stayed in the car, on the roof rack, on the back of the Double Cab or (Birgit) on top of the box<br />
trap with one young honey badger sitting underneath the car and another angry one somewhere around! So<br />
we tried to persuade the youngster to leave by driving around in the riverbed and finally after several tries the<br />
youngster jumped off disappearing into the bushes.<br />
So, please everybody, never make Harald an object of ridicule again about honey badgers. Just believe him!<br />
These are really dangerous animals ;-) they attack cars from underneath especially when there are people<br />
on the back!<br />
By the way, we also captured and released a juvenile baboon this morning and in the afternoon we replaced<br />
bait in two box traps and one riverbed hoping to attract leopards and hyaenas.<br />
15 October<br />
The last few days we have been busy with intensive field work. We came across closed traps with warthog or<br />
baboon, as well as empty ones. No carnivore captures so far with this group. But F012 is always around, we<br />
constantly have telemetry signals of her. We could also record some signals of one animal of the male<br />
cheetah coalition, namely F005.<br />
Peter and Paul solved the mystery of the F012 sighting last Thursday. They went for an observation shift<br />
back to the rock (telemetry poit “T5”) and it turned out that Birgit’s leopard sighting was a rock after all. What<br />
a pity!<br />
Observation and Game Count activities were very interesting this week. Lots of sightings, almost a new<br />
record (a group of 60! kudus) and interesting observations of animal behaviour on a very windy day. For<br />
example, one oryx needed more than an hour to decide to drink from the waterhole. We also saw an ancient<br />
warthog and an aardvark, very unusual for daytime!<br />
Again the team found signs of poaching as well as four fresh cheetah, two leopard and one hyena track<br />
around trap no 1.<br />
Unfortunately we did not manage to do a triangulation of our newly-collard hyaena, so we have to try a night<br />
telemetry shift next week again! This will be exciting - lying in wait for the hyaena in the dark.<br />
Spoor tracking in the afternoon, led by Sibylla and Piet, managed to following two parallel cheetah tracks,<br />
probably F005 and F007, for quite a distance and Harald (originally busy with game count!) was keen to see<br />
the animals, but the two teams chasing the cheetahs through the bush ran out of time and it got dark! But<br />
they must have been very close, they had such strong telemetry signals!<br />
Sunday’s afternoon started with five brave hikers (Elliot, Ester, Richard, Sibylla and myself) trying to beat the<br />
record up the Kuduspitze and missing it only by a few minutes! On the way down five lucky hikers and the<br />
rest of the team (who drove up) spotted a klipspringer and a troop of mountain zebras just before enjoying a<br />
stunning sunset!<br />
77<br />
� <strong>Biosphere</strong> <strong>Expeditions</strong><br />
www.biosphere-expeditions.org
20 October<br />
One of our morning activities, namely spoor counting (you sit together with a tracker on the bonnet/wing of<br />
one of our Land Rover Defenders and watch out for spoors on the farm road) was very successful. A lot of<br />
spoors were detected. All together as many as during slot no 1, so there is no disturbance through our<br />
movements. One cheetah track of two animals - probably F005 and F007- led directly to the box trap at<br />
Kuduposten. They surrounded the kraal, had a look into the trap but the track ended twenty centimetres in<br />
front of the cage. Another example how patient a field worker must be to have success with the studies. One<br />
day they will walk in again!<br />
We continued to chase hyena F014, but only some single weak signals reached us. Also during night<br />
telemetry brave Birgit took a team just in front of the den’s entrance.<br />
Observation gets more and more interesting. Animals shift their activity to the morning now because it’s<br />
getting really hot during the day, so all teams report many sightings at various observation points.<br />
On Wednesday afternoon the spoor tracking team following a female cheetah track, which was spotted in the<br />
morning, found spoors of a cheetah hunting probably a springbok, but no fresh kill was found.<br />
Thursday morning Harald’s nightmare continued! The box trap team reported a honey badger in trap six!<br />
After a closer look they found that the honey badger was stuck with its head in one of the gates, so Birgit and<br />
Harald decided to immobilise the youngster to get him out of this dangerous situation. So OWR’s first<br />
immobilisation of a honey badger took place. Once darted successfully by Harald we freed him and took<br />
pictures. What's not on the picture is how smelly this beautiful animals is!<br />
During the last few days of this year’s third group it has been very hot and cloudy, everybody expected rain<br />
but there was only a few drops and a little bit of thunder. Now I am sitting in Windhoek waiting for Monday’s<br />
arrival of slot no 4 and here is a huge downpour of rain, as always with thunder and lighting!<br />
This morning we had late breakfast, then after Harald’s summary report we made our way to Windhoek<br />
where the major part of the team spends the afternoon in the city before flying home. Thank you all for your<br />
participation and all your efforts. Safe travels.<br />
26 October<br />
The last team for this year’s Namibia expedition is now familiar with the study site. Daily data collection<br />
activities went perfectly smoothly from the third to the fourth group. Unfortunately the box traps stay<br />
frustratingly empty. Probably the cheetahs went further away following their prey to regions where rain has<br />
already fallen. So at the moment we have also few spoors and activity around the marking trees. But we<br />
hope that us changing the baits in box traps 1, 3, 5 and 6 will be rewarded in the next few days!<br />
During the day it gets really hot now, so we have shifted the afternoon activities from 15:30h to 16:00h.<br />
During game count in the afternoon we have an average of 21 sightings on both transects (A and B) mostly<br />
groups of kudu, hartebeest, oryx, springbok, lots of steenbok, ostrich, cory bustard, warthog and, of course,<br />
baboon.<br />
Very reliable are the leopards F009 and F012. Almost every day we receive signals, so we are able to do<br />
triangulations for a better calculation of their home ranges. Sometimes the teams are really close (the signals<br />
are very loud and strong) but the animals themselves are so well camouflaged and really hard to spot in the<br />
bush.<br />
Because of the full moon the visibility is very good in the night, so we’ve been putting in observation shifts at<br />
Alter Damm and Felixposten yesterday and tonight, sitting on a rock in the middle of the night listening to<br />
many strange noises seeing zebras, oryx and duikers approaching the waterhole. At Alter Damm one group<br />
spotted the very elusive caracal, the other group an aardvark!<br />
78<br />
� <strong>Biosphere</strong> <strong>Expeditions</strong><br />
www.biosphere-expeditions.org
28 October<br />
On Saturday morning Sian, Ellen, Sandro, Esther and Assa had to check the box trap at Zebraposten<br />
durings spoor count on transect 1. Gates were closed - it was a big male baboon set free by Sandro and<br />
Assa.<br />
Fresh hyaena tracks, but no signals. Harald’s assumption is that our hyaena must have somehow destroyed<br />
the transmitter – they do have extremely powerful jaws after all. But female leopard F009 is still around close<br />
to base, we heard strong signals from telemetry point 1 (veranda at swimming pool ;) even yesterday late in<br />
the evening. And we could hear warning calls of impala and others.This morning Sibylla with Verena, Peter<br />
and Stuart completeed another triangulation of her and in the afternoon we will be busy with more telemetry<br />
from the highest mountain in the study site, Kuduspitze.<br />
Everybody is looking forward to tomorrow’s day off, the heat around midday is now pretty bad, so we need to<br />
cool down in the pool now and then ;))<br />
31 October<br />
It seems like the animals are coming back to us. Spoor count could record couple hyaena and two cheetah<br />
tracks. Around box traps no 2 we found a female leopard spoor, unfortunately only around the trap!<br />
Observation is getting more and more exciting, yesterday’s team at Felixposten has seen 35 animals and<br />
this morning’s group could observe a snake eagle killing a sand growse. At telemetry point six, just south of<br />
Johannesposten, we found leopard scat and had strong signals of F012. Continuing the chase for cheetah<br />
signals of F005 and F007, we drove a long way on the main gravel road to cover a bigger area and the area<br />
north of the main study site.. This work was unfortunately unrewarded. No signals of our coalition.<br />
After the release of a warthog from trap 6 the highlight of the day was the giraffe sighting by Ellie, Andy and<br />
Roger during checking the border fence. And they spotted two very fresh cheetah tracks, one leopard track<br />
and a dead fox. What an action in one afternoon!!!! Spoor tracking in the afternoon followed the cheetah<br />
tracks found in the morning and could find a spot where the predator was hunting an oryx! So they are<br />
around, we just have to find them!!!<br />
Today’s afternoon when I just came back from Windhoek the first rain fell in Okomitundu! Game count got<br />
wet and we have been impressed by Matt’s well chosen gear including the red umbrella! Just before the rain<br />
came Sian, Sandro and Ellen spotted all four giraffes again approximately 10 km far away from yesterday’s<br />
spot.<br />
1 November<br />
On telemetry we got strong signals of F009, just like yesterday, and while trying a triangulation the signals<br />
got stronger and stronger. Only just could I prevent crazy Ellie from running towards the signal when<br />
suddenly Andy shouted: “I can see her”! And there she was just lying on a rock 150 m away from us! So<br />
close! We spent half an hour observing and through the binos we could see her eyes observing us too.<br />
Eventually we had to leave to go back to base.<br />
3 November<br />
On the last day of data collection Harald and his team managed a triangulation of both female leopards. The<br />
box trap team had to release a baby baboon. The 2007 expedition has come to the end and after two<br />
months of field work Okomitundu will now be a much quieter place. Let me thank everyone for their excellent<br />
contribution. It was vital for making the expedition a success! So long and I hope to see you on another<br />
expedition in the not too distant future.<br />
Peter Schuette<br />
Expedition Leader<br />
79<br />
� <strong>Biosphere</strong> <strong>Expeditions</strong><br />
www.biosphere-expeditions.org