Notes to the consolidated financial statements - Efacec
Notes to the consolidated financial statements - Efacec
Notes to the consolidated financial statements - Efacec

You also want an ePaper? Increase the reach of your titles
YUMPU automatically turns print PDFs into web optimized ePapers that Google loves.
1<br />
2<br />
Index<br />
Consolidated Financial Statement Documents<br />
Balance sheet and profi t and loss account 4<br />
Consolidated statement of changes <strong>to</strong> shareholders´ funds 6<br />
Consolidated Cash Flow Statement 8<br />
<strong>Notes</strong> <strong>to</strong> <strong>the</strong> <strong>consolidated</strong> fi nancial <strong>statements</strong> 9<br />
Individual Financial Statement Documents<br />
Balance sheet and profi t and loss account 48<br />
Individual statement of changes <strong>to</strong> Shareholders`s Funds 50<br />
Cash fl ow statement 52<br />
<strong>Notes</strong> <strong>to</strong> <strong>the</strong> Financial Statements 53<br />
Report and Opinion of <strong>the</strong> Statu<strong>to</strong>ry Audi<strong>to</strong>r 73<br />
Legal certifi cation of <strong>the</strong> <strong>consolidated</strong> and individual fi nancial <strong>statements</strong> 74<br />
1<br />
2008 Consolidated and<br />
Individual Financial Statments
3<br />
2008 Consolidated and<br />
Individual Financial Statments
Non-current assets<br />
EFACEC Capital, S.G.P.S., S.A. and Subsidiary Companies<br />
Consolidated balance sheets for years ended 31 December 2008 and 2007<br />
Assets<br />
The Accountant Board of Direc<strong>to</strong>rs<br />
4<br />
Amounts in Euro<br />
<strong>Notes</strong> 2008 2007<br />
Tangible fi xed assets 4 108,470,378 70,052,540<br />
Intangible assets 5 4,214,723 4,874,864<br />
Goodwill 5 25,714,281 22,110,396<br />
Financial investments in group and associated companies 6 7,365,885 7,560,600<br />
Financial investments in o<strong>the</strong>r companies 7 534.934 14.483<br />
Deb<strong>to</strong>rs and deferred costs 10 27.000 27.000<br />
Deferred tax assets 16 10,445,617 4,243,415<br />
Derivatives 8 0 345.574<br />
Current assets<br />
Total non-current 156,772,819 109,228,872<br />
Assets held for sale 11 931,196 1,242,908<br />
S<strong>to</strong>cks 11 60,272,731 47,225,497<br />
Cus<strong>to</strong>mers and accrued income 9 279,045,239 218,231,846<br />
Deb<strong>to</strong>rs and deferred costs 10 31,188,354 29,895,248<br />
Derivatives 8 0 1,062,540<br />
O<strong>the</strong>r fi nancial investments 12 16,992,032 1,526,260<br />
Cash and cash equivalents 12 110,526,411 10,213,594<br />
Shareholders’ Funds<br />
Shareholders’ Funds and Liabilities<br />
Total current 498,956,564 309,397,894<br />
Total assets 655,729,383 418,626,766<br />
Capital 13 41,641,416 41,641,416<br />
Reserves for fi nancial instruments 8 -3,732,754 1,244,307<br />
Reserves and retained earnings 19,924,336 28,486,074<br />
Consolidated net profi t 24,136,981 17,401,185<br />
Anticipated dividends 24 -6,034,000 -12,216,000<br />
Minority Interests 19 3,386,358 2,936,936<br />
Non-current liabilities<br />
Total shareholders’ funds 79,322,337 79,493,918<br />
Provisions 17 8,705,045 7,004,097<br />
Loans 15 104,504,798 64,340,649<br />
Suppliers 14 1,051,246 2,598,015<br />
Credi<strong>to</strong>rs and accruals 14 3,958,939 3,477,160<br />
Deferred tax liabilities 16 5,691,747 6,342,351<br />
Derivatives 8 2,347,029 0<br />
Current liabilities<br />
Total non-current liabilities 126,258,804 83,762,271<br />
Loans 15 136,195,368 46,819,426<br />
Shareholders’ loans 27 8,297,644 7,100,000<br />
Suppliers 14 103,814,476 79,788,610<br />
Credi<strong>to</strong>rs and accruals 14 46,337,973 27,052,078<br />
Deferred income 18 146,271,233 94,493,036<br />
Derivatives 8 9,231,548 117,426<br />
Total current liabilities 450,148,242 255,370,577<br />
Total shareholders’ funds and liabilities 655,729,383 418,626,766<br />
The <strong>Notes</strong> <strong>to</strong> <strong>the</strong> Accounts are an integral part of <strong>the</strong>se <strong>consolidated</strong> balance sheets
EFACEC Capital, S.G.P.S., S.A. and Subsidiary Companies<br />
Consolidated profit and loss account by nature for <strong>the</strong> years ended 31 December 2008 and 2007<br />
5<br />
Amounts in Euro<br />
<strong>Notes</strong> 2008 2007<br />
Sales and Services Rendered 3 606,216,504 440,323,101<br />
Cost of Sales and Materials Consumed -291,961,804 -204,802,346<br />
Change in production 3,024,848 11,771,333<br />
Third Party Supplies and Services 20 -165,143,963 -135,012,292<br />
Staff Costs -96,572,275 -79,233,191<br />
Depreciation 4 -8,372,107 -7,987,343<br />
Provisions 9, 10, 17 -2,675,685 -1,024,592<br />
O<strong>the</strong>r Operational Costs -3,112,377 -2,061,532<br />
O<strong>the</strong>r operating income 3,216,886 3,466,397<br />
Operating Profi ts 44,620,027 25,439,535<br />
Financial Costs (net) 21 -14,363,394 -4,865,583<br />
Losses/Gains in associated companies 6 637,908 1,097,969<br />
Losses/Gains in o<strong>the</strong>r companies 7 -1.965 13.213<br />
Income tax - deferred 22 4,665,634 -499,589<br />
Income tax - current 22 -10,833,589 -3,437,482<br />
Minority Interests - share of profi ts 19 -587.641 -346.878<br />
Consolidated net profi t 23 24,136,981 17,401,185<br />
The <strong>Notes</strong> <strong>to</strong> <strong>the</strong> Accounts are an integral part of <strong>the</strong>se <strong>consolidated</strong> balance sheets<br />
The Accountant Board of Direc<strong>to</strong>rs<br />
2008 Consolidated and<br />
Individual Financial Statments
EFACEC Capital, S.G.P.S., S.A. and Subsidiary Companies<br />
Consolidated statement of changes <strong>to</strong> shareholders’ funds as at 31 December 2008<br />
6<br />
<strong>Notes</strong> Share Capital<br />
Reserves for <strong>financial</strong><br />
instruments<br />
Balance as at 01.01.2007<br />
Application of profi t/loss<br />
41,641,416 1,439,901<br />
Dividend distribution 24<br />
Anticipated dividend distribution 24<br />
Cash fl ows hedging net of taxes 8, 16 -195,593<br />
Adjustments in associated companies<br />
Reversal of revaluation reserve<br />
Exchange rate differences in foreign shareholdings<br />
6<br />
Acquisition/Constitution of Subsidiaries<br />
O<strong>the</strong>r<br />
31<br />
Gains / (Losses) recognised in shareholders’ funds<br />
Net profi t for <strong>the</strong> fi nancial year<br />
0 -195,593<br />
Total gains recognised in 2007 0 -195,593<br />
Balance as at 31.12.2007 41,641,416 1,244,308<br />
Balance as at 01.01.2008<br />
Application of profi t/loss<br />
41,641,416 1,244,308<br />
Dividend distribution 24<br />
Anticipated dividend distribution 24<br />
Cash fl ows hedging net of taxes 8, 16 -4,977,062<br />
Adjustments in associated companies 6<br />
Revaluation of land<br />
Reversal of revaluation reserve<br />
Exchange rate differences in foreign shareholdings<br />
Acquisition/constitution of subsidiaries<br />
O<strong>the</strong>r<br />
31<br />
Gains / (Losses) recognised in shareholders’ funds 0 -4,977,062<br />
Net profi t for <strong>the</strong> fi nancial year<br />
Total gains recognised in 2008 0 -4,977,062<br />
Balance as at 31.12.2008 41,641,416 -3,732,754<br />
The Accountant
Attributable <strong>to</strong> shareholders<br />
Revaluation reserves<br />
Reserves and retained<br />
earnings<br />
Profit/Loss of <strong>the</strong> Financial<br />
Year<br />
7<br />
Minority Interests Total Shareholders’ Funds<br />
21,358,600 -1,516,572 17,075,631 2,626,381 82,625,357<br />
9,538,535 -9,538,535 0<br />
-7,537,096 -163,675 -7,700,771<br />
-12,216,000 -12,216,000<br />
71,515<br />
-195,593<br />
71,515<br />
-49,611 -49,611<br />
-226,675 -36,267 -262,942<br />
169,069 169,069<br />
-14,810 -674,907 17,401,185 -5,450 -695,168<br />
-64,421 8,708,467 -29,291,631 -36,324 -20,879,502<br />
17,401,185 346,878 17,748,063<br />
-64,421 8,708,467 -11,890,446 310,555 -3,131,438<br />
21,294,179 7,191,896 5,185,184 2,936,936 79,493,919<br />
21,294,179 7,191,896 5,185,184 2,936,936 79,493,919<br />
-8,035,815 8,035,815 0<br />
-13,221,000 -225,642 -13,446,642<br />
-6,034,000 -6,034,000<br />
-4,977,062<br />
95,287 95,287<br />
383,683 383,683<br />
-188,419 -188,419<br />
-749,948 -100,118 -850,065<br />
25,556 25,556<br />
15 -66,542 161,985 95,458<br />
195,279 -8,757,018 -11,219,185 -138,219 -24,896,204<br />
24,136,981 587,641 24,724,621<br />
195,279 -8,757,018 12,917,796 449,422 -171,582<br />
21,489,458 -1,565,122 18,102,980 3,386,358 79,322,336<br />
Board of Direc<strong>to</strong>rs<br />
2008 Consolidated and<br />
Individual Financial Statments
EFACEC Capital, S.G.P.S., S.A. and Subsidiary Companies<br />
Consolidated cash flow <strong>statements</strong> for <strong>the</strong> periods ended 31 December 2008 and 2007<br />
Operational activities<br />
The Accountant Board of Direc<strong>to</strong>rs<br />
8<br />
Amounts in Euro<br />
<strong>Notes</strong> 2008 2007<br />
Received from cus<strong>to</strong>mers 719,024,496 495,451,141<br />
Paid <strong>to</strong> suppliers 496,313,665 322,491,466<br />
Paid <strong>to</strong> staff 92,547,808 76,924,353<br />
Flow generated by operations 130,163,023 96,035,322<br />
Payment/receipt of corporation tax (4,229,764) (3,171,780)<br />
O<strong>the</strong>r revenue/payments in respect of operating activity (67,330,516) (81,615,839)<br />
Investment activities<br />
Revenues provided by:<br />
Net infl ow from operational activities [1] 58,602,743 11,247,703<br />
Financial investments 6,7 0 23,191<br />
Investment subsidies 17,283 15,346<br />
Interest and similar income 2,868,141 252,527<br />
Dividends 6 724,453 818,549<br />
Payments pertaining <strong>to</strong>:<br />
3,609,878 1,109,613<br />
Financial investments 6,7,12 19,107,261 12,089,839<br />
Tangible assets 4 35,312,756 8,918,834<br />
Intangible assets 5 0 0<br />
54,420,017 21,008,673<br />
Net outfl ow from investment [2] (50,810,140) (19,899,060)<br />
Financing activities<br />
Revenues provided by:<br />
Non-current loans obtained 15 14,378,757 0<br />
Current loans obtained/granted 15 290,400,608 53,940,765<br />
Capital increase, supplementary services and issue premiums 28,998 0<br />
Subsidies and donations 0 0<br />
Payments pertaining <strong>to</strong>:<br />
304,808,363 53,940,765<br />
Non-current loans obtained 15 359,259 521,406<br />
Current loans obtained/granted 15 174,205,515 16,679,772<br />
Amortisation of leasing contracts 4 86,277 16,995<br />
Interest and similar income 21 10,621,393 4,135,429<br />
Dividends 24 19,480,642 19,916,824<br />
204,753,086 41,270,425<br />
Flows generated by fi nancing activities [3] 100,055,277 12,670,340<br />
Change in cash and cash equivalents [A]-[B]+[C]-[D]+[E]=[1]+[2]+[3] 107,847,881 4,018,983<br />
Impact of exchange rate differences [A] 9,181,775 299,088<br />
Impact of change in consolidation perimeter [B] 120,451 356,499<br />
Cash and cash equivalents in discontinued units [C] 0 0<br />
Cash and cash equivalents at <strong>the</strong> beginning of <strong>the</strong> period [D] 11,739,854 7,663,459<br />
Cash and cash equivalents at <strong>the</strong> end of <strong>the</strong> period [E] 110,526,411 11,739,854
A. General information<br />
<strong>Notes</strong> <strong>to</strong> <strong>the</strong> <strong>consolidated</strong> <strong>financial</strong> <strong>statements</strong><br />
The EFACEC Group’s business activities cover an extensive range of high technology products and services. Diversity in creative<br />
and engineering capability enables us <strong>to</strong> offer technical solutions <strong>to</strong> a wide variety of activities and sec<strong>to</strong>rs in both internal and<br />
external markets.A signifi cant part of our output is in support of operational control <strong>to</strong>ols and management, developed in accordance<br />
with <strong>the</strong> most sophisticated consumer requirements. The variety of services and products which we offer include a wide<br />
range of equipment used in <strong>the</strong> transport and distribution of electricity, in control and control systems, electric traction, industrial<br />
electronics, telecommunications, au<strong>to</strong>mation and robotics and in engineering projects focused on industrial plants, transport and<br />
maintenance.<br />
The Group operates in a highly competitive market, and it is necessary <strong>to</strong> be alert <strong>to</strong> <strong>the</strong> constant developments and changes in<br />
cus<strong>to</strong>mer preferences and in new technologies. With this in mind, <strong>the</strong> Group has adapted its structure <strong>to</strong> ensure <strong>the</strong> most appropriate<br />
solution. In <strong>the</strong> 90's it assumed a commitment <strong>to</strong> internationalise and diversify activities that led <strong>to</strong> <strong>the</strong> setting up of<br />
branches and agents across more than 60 countries.Since 2000 <strong>the</strong> focus has been on analyzing and evaluating <strong>the</strong> strategies<br />
followed, developing business areas with greater added value and building up <strong>the</strong> Group with <strong>the</strong> adequate competencies for <strong>the</strong><br />
new market and organisational challenges.<br />
EFACEC Capital, holding company of <strong>the</strong> EFACEC Group, is a publicly quoted company with its headquarters in Arroteia, parish of<br />
Leça do Balio, Ma<strong>to</strong>sinhos in Portugal.<br />
B. Summary of main accounting policies<br />
The main accounting polices used <strong>to</strong> prepare <strong>the</strong>se <strong>consolidated</strong> fi nancial <strong>statements</strong> are described below. These policies have<br />
been consistently applied over <strong>the</strong> years unless o<strong>the</strong>rwise stated.<br />
1 Accounting policies<br />
1.1 Basis of preparation<br />
The <strong>consolidated</strong> fi nancial <strong>statements</strong> of EFACEC Capital, SGPS, SA were prepared in accordance with International Financial<br />
Reporting Standards (IFRS), as adopted by <strong>the</strong> European Union, in force on 01 January 2008.<br />
The <strong>consolidated</strong> fi nancial <strong>statements</strong> were prepared using his<strong>to</strong>rical costs with <strong>the</strong> exception of land, fi nancial assets and liabilities<br />
(including derivatives) which have been valued in <strong>the</strong> accounts at <strong>the</strong>ir fair value.<br />
The preparation of <strong>the</strong> fi nancial <strong>statements</strong> in accordance with <strong>the</strong> International Financial Reporting Standards requires <strong>the</strong> use of<br />
some important accounting estimates. It also requires that <strong>the</strong> management entity uses its judgement in <strong>the</strong> process of applying<br />
<strong>the</strong> accounting policies of <strong>the</strong> company. The area involving <strong>the</strong> greatest degree of judgement or complexity, or <strong>the</strong> area where <strong>the</strong><br />
assumptions and estimates are signifi cant for <strong>the</strong> fi nancial <strong>statements</strong>, relate <strong>to</strong> <strong>the</strong> estimate of goodwill impairment (Note 1.6).<br />
During this fi nancial year <strong>the</strong> interpretation IFRIC.11 IFRS.2 was manda<strong>to</strong>ry - Intra group transactions of Own Shares, producing<br />
no signifi cant impact of company accounting policies.<br />
At <strong>the</strong> end of this fi nancial year, <strong>the</strong> following standards were issued but not manda<strong>to</strong>ry as at 31 December 2008:<br />
- IFRS 2 Payment based on shares (2008 Update)<br />
- IFRS 3 Business combinations (2008 Update)<br />
- IFRS 8 Operating Segments;<br />
- IAS 1 Presentation of Financial Statements (2007 Update)<br />
- IAS 23 Cost of Loans Obtained – (2007 Update)<br />
- IAS 27 Consolidated and Separate Financial Statements (2008 update)<br />
- IAS 32 Financial instruments: Presentation (2008 Update)<br />
- IFRIC 13 Cus<strong>to</strong>mer Retention Programmes;<br />
- IFRIC 14 The Limit on a Defi ned Benefi t Asset, Minimum Financing Requirements and <strong>the</strong>ir Interaction<br />
- IFRIC 15 Agreements for <strong>the</strong> construction of real estate<br />
- IFRIC 16 Hedges of a net investment in a foreign operation<br />
9<br />
2008 Consolidated and<br />
Individual Financial Statments
In view of <strong>the</strong> fact that applying <strong>the</strong>se standards was not manda<strong>to</strong>ry for <strong>the</strong> fi nancial year beginning 1 January 2008, <strong>the</strong> Group<br />
decided not <strong>to</strong> adopt <strong>the</strong>m immediately.<br />
It is estimated however that <strong>the</strong>re would be no signifi cant impact from applying <strong>the</strong>m <strong>to</strong> <strong>the</strong> <strong>consolidated</strong> fi nancial <strong>statements</strong> of<br />
<strong>the</strong> Group for those standards which are applicable <strong>to</strong> <strong>the</strong> group.<br />
The preparation of <strong>the</strong> fi nancial <strong>statements</strong> in accordance with <strong>the</strong> International Financial Reporting Standards requires <strong>the</strong> use of<br />
some important accounting estimates. It also requires that <strong>the</strong> management entity uses its judgement in <strong>the</strong> process of applying<br />
<strong>the</strong> accounting policies of <strong>the</strong> company.<br />
1.2 Consolidation<br />
(a) Subsidiaries<br />
Subsidiaries are all those entities (including those Entities with Special Purposes) over which <strong>the</strong> Group has <strong>the</strong> power of decision<br />
concerning fi nancial and operational policies, generally where it holds over half of <strong>the</strong> voting rights. The existence and <strong>the</strong> impact<br />
of potential voting rights currently exercisable or convertible is taken in<strong>to</strong> consideration when it is assessed whe<strong>the</strong>r <strong>the</strong> Group<br />
has control over ano<strong>the</strong>r entity. Subsidiaries are <strong>consolidated</strong> from <strong>the</strong> date on which control is transferred <strong>to</strong> <strong>the</strong> Group, and are<br />
excluded from consolidation from <strong>the</strong> date on which that control ceases.<br />
The purchase method is used <strong>to</strong> account for <strong>the</strong> acquisition of subsidiaries. The cost of acquisition is measured by <strong>the</strong> fair value<br />
of <strong>the</strong> goods delivered, <strong>the</strong> instruments of share capital issued, <strong>the</strong> liabilities incurred or assumed on <strong>the</strong> date of acquisition, plus<br />
<strong>the</strong> directly attributable costs of acquisition. The identifi able assets acquired and <strong>the</strong> contingent liabilities taken on in a business<br />
merger are initially measured at <strong>the</strong>ir fair value on <strong>the</strong> date of acquisition, irrespective of <strong>the</strong> existence of minority interests. The<br />
excess of <strong>the</strong> cost of acquisition compared <strong>to</strong> <strong>the</strong> fair value of <strong>the</strong> Group’s share of <strong>the</strong> identifi able assets acquired is booked as<br />
goodwill (IFRS 3). If <strong>the</strong> cost of acquisition was less than <strong>the</strong> fair value of <strong>the</strong> net assets of <strong>the</strong> acquired subsidiary, <strong>the</strong> difference<br />
is refl ected directly in <strong>the</strong> Profi t and Loss Account.<br />
The transactions, balances and unrealised gains on operations that <strong>to</strong>ok place between group companies are eliminated. Unrealised<br />
losses are also eliminated, except if <strong>the</strong> transaction shows evidence of impairment relating <strong>to</strong> a transferred asset. The accounting<br />
policies of subsidiaries were changed whenever deemed necessary <strong>to</strong> ensure consistency with <strong>the</strong> policies used by <strong>the</strong> Group.<br />
The amount of Minority Interests is included in Shareholders’ Funds.<br />
The list of subsidiaries included in <strong>the</strong> consolidation perimeter is shown in Chapter G, as well as <strong>the</strong> respective impacts.<br />
(b) Associates<br />
Associates are all those entities over which <strong>the</strong> Group exercises a signifi cant infl uence but where <strong>the</strong> Group does not have control,<br />
generally shareholdings having between 20% and 50% of voting rights. Investments in associates are accounted for using <strong>the</strong><br />
equity method and are initially booked at cost. Investment of <strong>the</strong> Group in associates includes goodwill (from which accumulated<br />
impairment losses are deducted) that was identifi ed on acquisition (see Note 1.6).<br />
The share of <strong>the</strong> Group in gains and losses of its associates after acquisition is refl ected in <strong>the</strong> Profi t and Loss Account and its share<br />
of movements in reserves after acquisition is refl ected in reserves and in <strong>the</strong> accounting value of <strong>the</strong> investment. When <strong>the</strong> share<br />
of <strong>the</strong> Group in <strong>the</strong> losses of <strong>the</strong> associate is equal <strong>to</strong> or greater than <strong>the</strong> investment in <strong>the</strong> associate, including receivables not<br />
covered by guarantees, <strong>the</strong> Group does not recognize additional losses, unless <strong>the</strong>y have been caused by bonds or if <strong>the</strong> Group<br />
made payments in <strong>the</strong> name of <strong>the</strong> associate.<br />
If <strong>the</strong> cost of acquisition was less than <strong>the</strong> fair value of <strong>the</strong> net assets of <strong>the</strong> associates acquired, <strong>the</strong> difference is booked directly<br />
<strong>to</strong> Profi t and Loss.<br />
The goodwill identifi ed on acquisition of associates, less accumulated impairment losses, is shown in a specifi c line in <strong>the</strong> Balance<br />
Sheet.<br />
Unrealised gains on transactions with associates are eliminated when Group shareholdings are increased in associates. Unrealised<br />
losses are also eliminated, except if <strong>the</strong> transaction reveals evidence of impairment of a transferred asset. Accounting policies of<br />
associates are changed whenever necessary, <strong>to</strong> ensure consistency with <strong>the</strong> policies used by <strong>the</strong> Group.<br />
(c) Joint Ventures<br />
Interest in jointly controlled entities are booked <strong>the</strong> proportional consolidation method. The Group adds its share of profi ts/losses,<br />
assets, liabilities and cash fl ows of joint ventures on a line by line basis with similar items of <strong>the</strong> Group Consolidated Financial<br />
Statements.<br />
The Group recognises <strong>the</strong> proportion of gains and losses on <strong>the</strong> sale of Group assets <strong>to</strong> <strong>the</strong> Joint Venture that is attributable <strong>to</strong><br />
o<strong>the</strong>r partners. It does not recognize its share in <strong>the</strong> gains or losses of <strong>the</strong> joint venture that result from <strong>the</strong> purchase by <strong>the</strong> Group<br />
of assets belonging <strong>to</strong> <strong>the</strong> joint venture until it sells <strong>the</strong>m <strong>to</strong> an independent entity. The loss on <strong>the</strong> transaction is immediately<br />
recognised if <strong>the</strong>re is evidence of a reduction in <strong>the</strong> value of <strong>the</strong> net realisable value of current assets, or of an impairment loss.<br />
The accounting policies of joint ventures are changed whenever deemed necessary, <strong>to</strong> ensure consistency with <strong>the</strong> policies used<br />
by <strong>the</strong> Group.<br />
10
1.3 Reporting by segments<br />
A business segment is a group of activities and operations involved in <strong>the</strong> supply of products and services subject <strong>to</strong> risks and<br />
benefi ts that are different <strong>to</strong> o<strong>the</strong>r business segments. A geographical segment is involved in supplying products and services<br />
within a specifi c economic environment that is subject <strong>to</strong> different risks and benefi ts than those of segments that operate within<br />
o<strong>the</strong>r economic environments.<br />
1.4 Exchange rate conversion<br />
(a) Functional currency and for presentation purposes<br />
The fi gures included in <strong>the</strong> Financial Statements of each of <strong>the</strong> Group entities are stated using <strong>the</strong> currency of <strong>the</strong> country in<br />
which <strong>the</strong> unit operates (“The functional currency”). The <strong>consolidated</strong> Financial Statements are presented in Euro, this being <strong>the</strong><br />
functional and presentational currency of <strong>the</strong> Group accounts.<br />
(b) Transactions and Balances<br />
Transactions in currencies o<strong>the</strong>r than <strong>the</strong> Euro are converted <strong>to</strong> <strong>the</strong> functional currency using <strong>the</strong> exchange rate at <strong>the</strong> date of<br />
<strong>the</strong> transaction. Exchange gains and losses arising from <strong>the</strong> payment of transactions and from conversion at <strong>the</strong> rate on <strong>the</strong> balance<br />
sheet date of <strong>the</strong> assets and liabilities designated in a currency o<strong>the</strong>r than <strong>the</strong> Euro, are recognised in <strong>the</strong> Profi t and Loss<br />
Account.<br />
(c) Group Companies<br />
The fi nancial results and position of all Group entities (none of which use a currency of a country suffering hyper infl ation) that<br />
have a functional currency different <strong>to</strong> that of account presentation are converted <strong>to</strong> <strong>the</strong> presentation currency as follows:<br />
(I) The assets and liabilities of each balance sheet presented are converted at <strong>the</strong> exchange<br />
rate in force at <strong>the</strong> date of <strong>the</strong> Financial Statements;<br />
(II) Income and expenses of each Profi t and Loss Account are converted at <strong>the</strong> average<br />
exchange rate; and<br />
(III) The resulting exchange rate differences are shown in Shareholders’ Funds in <strong>the</strong> line<br />
Reserves.<br />
(d) Rates Used <strong>to</strong> Convert Major Foreign Currencies in<strong>to</strong> Euro<br />
In Group companies with headquarters abroad, <strong>the</strong> constant fi gures in <strong>the</strong> fi nancial <strong>statements</strong> relating <strong>to</strong> assets and liabilities,<br />
and included in <strong>the</strong> profi t and loss account, were converted in<strong>to</strong> Euro using <strong>the</strong> following exchange rates:<br />
For 1 monetary unit – Euro Final rate 2008 Average rate Final rate 2007<br />
Angola Kwanza AOA 100,99500 108,45275 -<br />
Argentina Peso ARS 4,80660 4,67176 4,63640<br />
Brazil Real BRL 3,24360 2,68064 2,59630<br />
Chile Peso CLP 886,86000 773,10083 -<br />
China Yuan CNY 10,78580 11,47006 10,75240<br />
Czech Republic Crown CZK 26,87500 25,00942 26,62800<br />
Algeria Dinar DZD 98,07515 95,26276 98,24060<br />
India Rupee INR 67,39500 64,14375 57,85500<br />
Morocco Dirham MAD 11,22475 11,35199 -<br />
Macao Pataca MOP 11,10940 11,81416 11,82440<br />
Malaysia Ringgit MYR 4,80480 4,89848 4,86820<br />
Mozambique New Metical MZN 35,21000 35,77542 34,81500<br />
Romania New Leu RON 4,02250 3,70529 -<br />
Singapore Dollar SGD 2,00400 2,07273 2,11630<br />
Tunisia Dinar TND 1,82640 1,80700 1,79470<br />
United States Dollar USD 1,39170 1,47362 1,47210<br />
Venezuela Bolívar VEF 2,98840 3,16429 (a)<br />
(a) On 1 January 2008, <strong>the</strong> Bolivar Fuerte (VEF) was introduced, equivalent <strong>to</strong> 1000 of <strong>the</strong> former Bolivar from Venezuela (VEB).<br />
11<br />
2008 Consolidated and<br />
Individual Financial Statments
1.5 Tangible Fixed Assets<br />
Land and buildings basically correspond <strong>to</strong> fac<strong>to</strong>ries and offi ces. Land is shown at fair value, based on periodic evaluations carried<br />
out at least every three years by external independent assessors. O<strong>the</strong>r tangible fi xed assets are shown at his<strong>to</strong>rical cost, less<br />
depreciation, including all expenditure directly attributable <strong>to</strong> <strong>the</strong> acquisition of <strong>the</strong> assets.<br />
Subsequent costs are included in <strong>the</strong> cost already booked for <strong>the</strong> asset, or recognised as separate assets, as deemed appropriate,<br />
but only when it is probable that economic benefi ts will accrue <strong>to</strong> <strong>the</strong> company and that <strong>the</strong> cost can be measured reliably. O<strong>the</strong>r<br />
expenditure for repairs and maintenance are recognised as costs within <strong>the</strong> period in which <strong>the</strong>y are incurred.<br />
Increases resulting from revaluations are shown in Reserves in Shareholders’ Funds. Each year, <strong>the</strong> difference between depreciation<br />
based on <strong>the</strong> re-valued amount of <strong>the</strong> asset taken <strong>to</strong> profi t and loss in <strong>the</strong> period, and depreciation based on <strong>the</strong> original cost<br />
of <strong>the</strong> asset, is transferred from fair value Reserves <strong>to</strong> Retained Profi ts.<br />
Land is not depreciated. Depreciation on o<strong>the</strong>r assets is calculated using <strong>the</strong> straight line method using <strong>the</strong> cost value or <strong>the</strong> revalued<br />
amount, in order <strong>to</strong> apportion <strong>the</strong>ir cost or re-valued amount over <strong>the</strong> useful life of <strong>the</strong> asset down <strong>to</strong> <strong>the</strong>ir residual value,<br />
as follows:<br />
Line Years<br />
Land -<br />
Buildings and O<strong>the</strong>r Constructions 25 - 50<br />
Plant and Equipment 8 - 12<br />
Vehicles 4 - 5<br />
Tools and Utensils 4 - 8<br />
Offi ce Equipment 4 - 6<br />
Depreciation begins in <strong>the</strong> month following that in which <strong>the</strong> asset entered service, in accordance with its useful life, as follows.<br />
Asset residual values and respective useful lives are revised and adjusted, if deemed necessary, at <strong>the</strong> balance sheet date. If <strong>the</strong><br />
amount booked is greater than <strong>the</strong> recoverable value of <strong>the</strong> asset, it is immediately adjusted <strong>to</strong> its estimated recoverable value<br />
(Note 1.7).<br />
Gains and/or losses on disposal or write offs are determined by calculating <strong>the</strong> difference between <strong>the</strong> net accounting value of <strong>the</strong><br />
asset, and its disposal or write off value, being in <strong>the</strong> latter case zero, and included in <strong>the</strong> Profi t or Loss for <strong>the</strong> period.<br />
1.6 Intangible Assets<br />
(a) Goodwill<br />
Goodwill represents <strong>the</strong> difference between <strong>the</strong> excess of <strong>the</strong> cost of acquisition and <strong>the</strong> fair value of identifi able assets and liabilities<br />
of <strong>the</strong> subsidiary/associate on <strong>the</strong> date of acquisition (Note 1.2).It is shown on a separate line in <strong>the</strong> Balance Sheet.<br />
Goodwill is subject <strong>to</strong> impairment tests on an annual basis, and is shown at cost, less accumulated impairment losses. Gains or<br />
losses resulting from <strong>the</strong> sale of an entity include <strong>the</strong> value of its respective goodwill.<br />
Goodwill is allocated <strong>to</strong> cash fl ow generating units (UGC) for carrying our impairment tests (Note 1.7). The amount recoverable<br />
from a UGC is calculated based on calculations of useful value. These calculations use cash fl ow projections based on fi nancial<br />
budgets approved by <strong>the</strong> management entity, covering a period of at least 4 years.<br />
The management entity works out <strong>the</strong> budgeted gross margin based on prior performance and its expectations for market development.<br />
The average weighted growth rate used is consistent with <strong>the</strong> forecasts included in sec<strong>to</strong>r reports. The discount rates used<br />
are before tax, and refl ect <strong>the</strong> specifi c risks related <strong>to</strong> <strong>the</strong> relevant sec<strong>to</strong>rs.<br />
b) Software<br />
The acquisition cost of software licences is capitalised and includes all costs incurred for its acquisition and those required <strong>to</strong> put<br />
<strong>the</strong> available software in<strong>to</strong> use. These costs are depreciated over <strong>the</strong> estimated useful life (not exceeding 5 years).<br />
Costs related <strong>to</strong> <strong>the</strong> development or maintenance of <strong>the</strong> software are recognised as costs of <strong>the</strong> period in which <strong>the</strong>y are incurred.<br />
Costs directly associated with <strong>the</strong> production of identifi able and unique software controlled by <strong>the</strong> Group, and which is probably<br />
going <strong>to</strong> generate future economic benefi ts that are superior <strong>to</strong> costs involved beyond one year, are recognised as intangible assets.<br />
Direct costs include staff costs <strong>to</strong> develop <strong>the</strong> software and a share of relevant fi xed costs.<br />
Software development costs recognised as assets are amortised over its estimated useful life (not exceeding 5 years).<br />
12
c) Research and development costs<br />
Expenditure on research is recognised as a cost in <strong>the</strong> period it is incurred. Costs related <strong>to</strong> development projects (concerning <strong>the</strong><br />
design and test of new products or improvements <strong>to</strong> existing products) are recognised as intangible assets when it is probable that<br />
<strong>the</strong> project will be a success, taking in<strong>to</strong> account its technical and commercial viability and <strong>the</strong> costs that can be reliably measured.<br />
O<strong>the</strong>r development expenditure is recognised as a cost of <strong>the</strong> period in which it is incurred. Development costs previously recognised<br />
as a cost are not recognised as an asset in subsequent periods. Development costs with a fi nite useful life that have been<br />
capitalised, are amortised from <strong>the</strong> beginning of commercial production of <strong>the</strong> product on a straight line bases over <strong>the</strong> period of<br />
expected benefi t, not exceeding fi ve years.<br />
1.7 Asset impairment<br />
Assets that do not have a defi ned useful life are not subject <strong>to</strong> amortisation, but are <strong>the</strong> object of annual impairment tests. Assets<br />
subject <strong>to</strong> amortisation are reviewed for impairment whenever events or changes in circumstances indicate that <strong>the</strong> value at which<br />
<strong>the</strong>y were booked may not be recoverable. An impairment loss is recognised by <strong>the</strong> amount by which <strong>the</strong> booked value of <strong>the</strong><br />
asset exceeds its recoverable value. The recoverable value is <strong>the</strong> highest of <strong>the</strong> fair value of <strong>the</strong> asset, less expenses required for<br />
sale, and its use value. To carry out impairment tests, assets are grouped <strong>to</strong>ge<strong>the</strong>r at <strong>the</strong> lowest level at which cash fl ows can be<br />
identifi ed separately (cash fl ow generating units, Note 1.6).<br />
1.8 Financial investments<br />
Financial investments in group companies excluded from consolidation (Chapter G) and o<strong>the</strong>r shareholdings are shown at acquisition<br />
cost.<br />
Financial investments in associated companies are valued using <strong>the</strong> Equity Method, as described in Note 1.2 (b).<br />
The Group checks at each balance sheet date whe<strong>the</strong>r <strong>the</strong>re is objective evidence as <strong>to</strong> impairment of any investment. If <strong>the</strong>re<br />
is such proof, <strong>the</strong> accumulated loss, calculated as <strong>the</strong> difference between <strong>the</strong> balance sheet value and <strong>the</strong> current fair value, is<br />
recognised in <strong>the</strong> profi t and loss account of <strong>the</strong> period in which <strong>the</strong> impairment occurred (Note 1.7).<br />
1.9 S<strong>to</strong>cks<br />
S<strong>to</strong>cks are presented at <strong>the</strong> lowest value between cost and net realisable value. The cost is calculated using <strong>the</strong> standard cost<br />
(which does not vary signifi cantly from actual production cost).<br />
The cost of fi nished products and manufacturing work in progress includes raw material costs, direct labour, o<strong>the</strong>r direct costs and<br />
manufacturing overheads (based on normal production capacity). The costs of loans obtained are excluded.<br />
Net realisable value is equal <strong>to</strong> <strong>the</strong> estimated selling price under normal business conditions, less variable selling costs. The cost<br />
of s<strong>to</strong>cks includes <strong>the</strong> transfer from shareholders’ funds of any loss or gain classifi ed as cash fl ow hedging related <strong>to</strong> <strong>the</strong> purchase<br />
of raw materials.<br />
1.10 Recognition of income and costs relating <strong>to</strong> contracts over several years<br />
Profi t on contracts which continue for more than one year are accounted for in accordance with <strong>the</strong> percentage of work completed<br />
by reference <strong>to</strong> partial delivery, segment identifi cation, assessment procedures or o<strong>the</strong>r means which allow reliable estimation of<br />
costs for completion of <strong>the</strong> work or <strong>the</strong> invoices which are <strong>to</strong> be sent <strong>to</strong> <strong>the</strong> cus<strong>to</strong>mer. When it is not possible <strong>to</strong> estimate profi ts<br />
and <strong>the</strong> costs with reasonable reliability, <strong>the</strong>n <strong>the</strong>y are recognised only when <strong>the</strong> product is delivered <strong>to</strong> <strong>the</strong> cus<strong>to</strong>mer, applying <strong>the</strong><br />
completed work criteria. In this case, <strong>the</strong> costs incurred until delivery are recorded in S<strong>to</strong>cks – Products and work in progress.<br />
Costs of contracts include raw materials and direct materials, direct labour and also allocated indirect costs, distributed as specifi ed<br />
in <strong>the</strong> contract. Sales and administration expenses are charged as costs as <strong>the</strong>y occur. Provisions are set up for any foreseen losses<br />
on completing a contract within <strong>the</strong> period in which <strong>the</strong>y are determined, and are immediately refl ected in <strong>the</strong> results. Changes <strong>to</strong><br />
contracts or estimates and forecast costs and/or profi ts and margins, arising from renegotiating of <strong>the</strong> conditions with cus<strong>to</strong>mers<br />
or from internal productivity, are recognised in <strong>the</strong> results from <strong>the</strong> period in which <strong>the</strong>y occur and taking in<strong>to</strong> account <strong>the</strong> stages<br />
of completion.<br />
When <strong>the</strong>re are materials which have not yet been used on <strong>the</strong> job or <strong>the</strong> installation, <strong>the</strong>re will be a balance on <strong>the</strong> account “Products<br />
and work in progress”.If this relates <strong>to</strong> receivables from cus<strong>to</strong>mers not yet invoiced, <strong>the</strong> resulting margin is not recognised. When<br />
<strong>the</strong> opposite situation occurs and <strong>the</strong> amount invoiced <strong>to</strong> <strong>the</strong> cus<strong>to</strong>mer is greater than <strong>the</strong> level of work completed, a deferred<br />
liability is set up representing a liability <strong>to</strong> a cus<strong>to</strong>mer for <strong>the</strong> work still <strong>to</strong> be completed.<br />
13<br />
2008 Consolidated and<br />
Individual Financial Statments
1.11 Accounts receivable from cus<strong>to</strong>mers and o<strong>the</strong>r deb<strong>to</strong>rs<br />
Accounts receivable from cus<strong>to</strong>mers and o<strong>the</strong>r deb<strong>to</strong>rs are initially recognised at <strong>the</strong>ir nominal or fair value, when different, less<br />
any impairment loss. The provision for receivable accounts impairment is set up when <strong>the</strong>re is objective evidence that <strong>the</strong> Group<br />
will not receive <strong>the</strong> entire amount outstanding, as per <strong>the</strong> original conditions established for <strong>the</strong> debt. The amount of <strong>the</strong> provision<br />
is <strong>the</strong> difference between <strong>the</strong> amount presented and <strong>the</strong> estimated present value of future cash fl ows, discounted at <strong>the</strong> effective<br />
interest rate. The amount of <strong>the</strong> provision is recognised in <strong>the</strong> profi t and loss account.<br />
1.12 Cash and cash equivalents<br />
The line “Cash and cash equivalents” includes cash, bank deposits, o<strong>the</strong>r short-term high liquidity investments and with initial<br />
maturities up <strong>to</strong> three months. Bank overdrafts are shown in <strong>the</strong> Balance Sheet under current liabilities in <strong>the</strong> line Loans.<br />
1.13 Share capital<br />
Ordinary shares are shown in shareholders’ funds.<br />
The incremental costs directly attributable <strong>to</strong> <strong>the</strong> issue of new shares or options are shown in shareholders’ funds as a reduction,<br />
net of taxes, of increases in share capital. The incremental costs directly attributable <strong>to</strong> <strong>the</strong> issue of new shares or options or <strong>the</strong><br />
acquisition of a new business are included in <strong>the</strong> cost of acquisition as part of <strong>the</strong> purchase price.<br />
1.14 Loans obtained<br />
Loans are initially recognised at <strong>the</strong>ir nominal value or fair value, whenever different, less any impairment loss. Later <strong>the</strong>y are<br />
shown at <strong>the</strong>ir amortised cost; any difference between receipts (net of transaction costs) and <strong>the</strong> amortised value is recognised in<br />
<strong>the</strong> profi t and loss account throughout <strong>the</strong> loan period, using <strong>the</strong> effective rate method.<br />
Loans are shown in current liabilities, unless <strong>the</strong> Group has an unconditional right <strong>to</strong> defer payment of <strong>the</strong> liability until at least 12<br />
months after <strong>the</strong> balance sheet date.<br />
1.15 Income tax and deferred taxes<br />
EFACEC Capital, S.G.P.S. opted for taxation based on <strong>consolidated</strong> profi ts as from 1993, currently covered by <strong>the</strong> “Special Rules<br />
for Taxation of Groups of Companies”. All Group companies whose headquarters are located in Portugal and are subject <strong>to</strong> <strong>the</strong><br />
Portuguese Corporate Income Tax (IRC), and where <strong>the</strong> direct and indirect share holding is greater than 90%, have been included<br />
in <strong>the</strong> tax consolidation in accordance with <strong>the</strong> applicable legislation. The <strong>consolidated</strong> tax charge is determined on <strong>the</strong> basis of <strong>the</strong><br />
arithmetic sum of taxable profi ts and losses as derived from individual companies’ tax returns.<br />
Deferred taxes are generally recognised using <strong>the</strong> liability method concerning temporary differences arising from <strong>the</strong> tax base<br />
of assets and liabilities and <strong>the</strong>ir respective values in <strong>the</strong> <strong>consolidated</strong> fi nancial <strong>statements</strong>. However, if <strong>the</strong> deferred tax arises<br />
through <strong>the</strong> initial recognition of an asset or liability in a transaction that is not a business concentration that at <strong>the</strong> date of <strong>the</strong><br />
transaction did not affect ei<strong>the</strong>r <strong>the</strong> accounting or fi scal result, it is not booked. Deferred taxes are determined by fi scal taxes (and<br />
laws) in force or substantially in force at <strong>the</strong> balance sheet date and which are expected <strong>to</strong> be applicable in <strong>the</strong> period when <strong>the</strong><br />
deferred tax asset or <strong>the</strong> payment of <strong>the</strong> deferred tax liability takes place. The tax rate that has been used <strong>to</strong> determine deferred<br />
taxes is that in force according <strong>to</strong> current legislation – 26.5% including local municipal tax.<br />
Deferred tax assets are recognised <strong>to</strong> <strong>the</strong> extent that it is probable that future taxable profi ts will be available <strong>to</strong> make use of <strong>the</strong><br />
timing difference.<br />
Deferred taxes on timing differences arising from investments in affi liates and associates are recognised, except when <strong>the</strong> Group<br />
is able <strong>to</strong> control <strong>the</strong> haphazard nature of <strong>the</strong> reversal of <strong>the</strong> timing difference and when it is probable that <strong>the</strong> timing difference<br />
does not revert in <strong>the</strong> foreseeable future.<br />
Deferred taxes are classifi ed as Current or Non-Current, according <strong>to</strong> <strong>the</strong> presentation of <strong>the</strong> amounts in <strong>the</strong> balance sheet <strong>to</strong> which<br />
<strong>the</strong>y relate, or <strong>to</strong> whe<strong>the</strong>r <strong>the</strong> respective timing differences are reverted in <strong>the</strong> short or medium/long-term.<br />
1.16 Provisions<br />
Provisions are booked when <strong>the</strong> Group has a legal or constructive obligation and that, as a result of past events, it is probable<br />
that an outfl ow of resources will be necessary <strong>to</strong> pay an obligation, and a reliable estimate of <strong>the</strong> amount of <strong>the</strong> obligation can be<br />
made.<br />
When <strong>the</strong>re is a number of similar obligations, <strong>the</strong> probability of generating an outfl ow is worked out <strong>to</strong>ge<strong>the</strong>r. The provision is<br />
booked even when <strong>the</strong> probability of an outfl ow, relating <strong>to</strong> an element included in <strong>the</strong> same class of obligations, may be reduced.<br />
14
1.17 Recognition of income<br />
Income covers <strong>the</strong> fair value of <strong>the</strong> sale of goods and services, net of taxes and commercial discounts and after elimination of<br />
internal sales.<br />
a) Sales<br />
The income recognised, in <strong>the</strong> case of multi-year contracts, in which <strong>the</strong> percentage of completion method is used, is in accordance<br />
with <strong>the</strong> policy defi ned for <strong>the</strong> recognition of income and costs related <strong>to</strong> multi-year contracts (Note 1.10).<br />
The sale of o<strong>the</strong>r goods is recognised when <strong>the</strong> products are delivered <strong>to</strong> and accepted by <strong>the</strong> cus<strong>to</strong>mer, and when payment of <strong>the</strong><br />
related receivable accounts is reasonably assured.<br />
b) Service Rendering<br />
The rendering of services is recognised in <strong>the</strong> accounting period in which <strong>the</strong>y are rendered, with reference <strong>to</strong> <strong>the</strong> phase of completion<br />
of <strong>the</strong> transaction at <strong>the</strong> balance sheet date.<br />
1.18 Leases<br />
Leases are classifi ed as operational leases if a signifi cant part of <strong>the</strong> inherent risks and benefi ts at <strong>the</strong> time <strong>the</strong> lease is taken on<br />
is retained by <strong>the</strong> lessor. Payments made for operational leases are booked in <strong>the</strong> profi t and loss account on settlement.<br />
Leases of tangible fi xed assets where <strong>the</strong> Group holds substantially all <strong>the</strong> risks and benefi ts associated with <strong>the</strong> asset are classifi<br />
ed as fi nancial leases. Financial leases are capitalised at <strong>the</strong> beginning of <strong>the</strong> lease for <strong>the</strong> lower of <strong>the</strong> fair value of <strong>the</strong> asset<br />
leased and <strong>the</strong> present value of <strong>the</strong> minimum payments of <strong>the</strong> lease. Each payment made is split between <strong>the</strong> capital sum due<br />
and <strong>the</strong> fi nancial costs, in order <strong>to</strong> obtain a constant rate on <strong>the</strong> debt outstanding. Lease obligations net of fi nancial charges are<br />
shown in O<strong>the</strong>r Credi<strong>to</strong>rs. The interest is booked <strong>to</strong> fi nancial costs in <strong>the</strong> lease period <strong>to</strong> a constant periodic interest rate on <strong>the</strong><br />
remaining debt of each period. Tangible fi xed assets acquired through fi nancial leases are depreciated over <strong>the</strong> lesser of <strong>the</strong> useful<br />
life of <strong>the</strong> asset or <strong>the</strong> lease period.<br />
1.19 Dividend distribution<br />
Dividend distribution <strong>to</strong> shareholders are recognised as a liability in <strong>the</strong> Group fi nancial <strong>statements</strong> in <strong>the</strong> period in which <strong>the</strong><br />
dividends are approved in <strong>the</strong> Shareholders’ General Meeting.<br />
1.20 Subsidies<br />
Subsidies received are booked at <strong>the</strong>ir fair value when a reasonable level of comfort exists that <strong>the</strong> subsidy will be received and<br />
<strong>the</strong> Group will comply with its obligations.<br />
Subsidies relating <strong>to</strong> <strong>the</strong> purchase of tangible fi xed assets are included in non-current Liabilities as deferred subsidies and are<br />
credited <strong>to</strong> <strong>the</strong> Profi t and Loss Account in proportion <strong>to</strong> <strong>the</strong> useful life of <strong>the</strong> corresponding assets.<br />
1.21 Discontinued operations<br />
A discontinued operation is a component of an entity that was ei<strong>the</strong>r written off or was classifi ed for sale or liquidation and: (a)<br />
represents a signifi cant line of business or geographical area of operation; (b) is part of <strong>the</strong> restructuring of an area of business<br />
or geographical area of operations; or (c) is a subsidiary acquired for sale.<br />
15<br />
2008 Consolidated and<br />
Individual Financial Statments
2. Financial risk management<br />
2.1 Fac<strong>to</strong>rs of <strong>financial</strong> risk<br />
The Group operates internationally and thus has exposure <strong>to</strong> <strong>the</strong> market, in particular <strong>to</strong> changes in interest rates, exchange rates<br />
and <strong>the</strong> price of raw materials.Thus Group activities are exposed <strong>to</strong> a variety of fi nancial risks: market risk (including exchange<br />
rate risk, fair value risk relating <strong>to</strong> interest rates and price risk), liquidity risk and cash fl ow risk associated with interest rates.<br />
The Group has no signifi cant concentrations of credit risk. Various fi nancial instruments are used <strong>to</strong> minimise <strong>the</strong> potential adverse<br />
effects on <strong>the</strong> fi nancial performance of <strong>the</strong> Group. However, <strong>the</strong> Group only uses such fi nancial instruments <strong>to</strong> cover risks arising<br />
from its business and activities (“hedging purposes”).<br />
a) Exchange rate risk<br />
The Group operates internationally, and as a result, is exposed <strong>to</strong> exchange rates risks. This risk arises from commercial transactions,<br />
recognition of assets and liabilities and net investments in external operations.<br />
The Group has signifi cant Sales and Service Rendering in countries outside <strong>the</strong> Euro zone, namely in US Dollars (USD). Group<br />
companies have carefully managed exchange risk cover, considering <strong>the</strong> operational margins in <strong>the</strong>ir business.Exchange risk cover<br />
is made from <strong>the</strong> proposal date in some cases or from <strong>the</strong> order date, until cash payment is received. In this way, not only are <strong>the</strong><br />
majority of balance sheet assets and liability values covered but also future sales linked with proposals (considering an acceptable<br />
level of success) and orders. Accordingly cover can be for several years depending on how long <strong>the</strong> project or installations take,<br />
refl ecting <strong>the</strong> possible period over several years which <strong>the</strong> work of Group companies can take place.<br />
b) Liquidity risk<br />
The management of liquidity risk implies maintaining a suffi cient level of cash and bank deposits, <strong>the</strong> viability of fl oating debt<br />
through adequate credit facilities, and skill in liquidating market positions. In line with <strong>the</strong> business needs, <strong>the</strong> Group Treasury<br />
aims at maintaining <strong>the</strong> fl exibility of <strong>the</strong> fl oating debt, keeping credit lines available.<br />
c) Cash fl ow risks and fair value related <strong>to</strong> interest rates<br />
Since <strong>the</strong> Group does not have assets that earn signifi cant amounts of interest, profi ts and cash fl ows are relatively independent<br />
of changes <strong>to</strong> market interest rates.<br />
Interest rate risks of <strong>the</strong> Group come from long-term loans. Loans with variable rates of interest expose <strong>the</strong> Group <strong>to</strong> cash fl ow<br />
risks related <strong>to</strong> interest rates.<br />
The Group manages interest rate cash fl ow risks associated <strong>to</strong> <strong>the</strong> interest rate by transforming variable interest rates in<strong>to</strong> swaps<br />
with fi xed interest rates or by establishing caps over <strong>the</strong> variable rate. In <strong>the</strong>se transactions, <strong>the</strong> Group agrees <strong>to</strong> exchange with<br />
o<strong>the</strong>r parties at specifi ed intervals (mainly half-yearly), <strong>the</strong> difference between amounts at contracted fi xed interest rate and<br />
amounts at a variable interest rate.<br />
2.2 Accounting for <strong>financial</strong> instruments – derivatives and hedging<br />
Derivatives are initially recognised at fair value and subsequently readjusted <strong>to</strong> <strong>the</strong>ir fair value. The method for recognising changes<br />
in fair value depends on whe<strong>the</strong>r <strong>the</strong> derivative is defi ned as a hedge instrument and if so, <strong>the</strong> nature of <strong>the</strong> asset/liability <strong>to</strong> be<br />
covered. The group arranges certain derivatives as: (1) fair value cover of recognised assets and liabilities or of commitments (fair<br />
value cover); (2) cover of highly probable forecast transactions (cash fl ow hedging).<br />
For each transaction, <strong>the</strong> Group prepares documentation <strong>to</strong> justify <strong>the</strong> relationship between <strong>the</strong> hedge instruments and <strong>the</strong> related<br />
assets/liabilities covered, as well as <strong>the</strong> objective of risk management and <strong>the</strong> strategy for taking out cover. The Group also documents<br />
its evaluation, both at <strong>the</strong> start of <strong>the</strong> cover and on a continuous basis, as <strong>to</strong> whe<strong>the</strong>r <strong>the</strong> derivatives used for cover effectively<br />
compensate for fl uctuations in fair value or in <strong>the</strong> cash fl ows of <strong>the</strong> items covered.<br />
The fair value of derivatives used <strong>to</strong> take out cover is disclosed in note 8, as well as <strong>the</strong> movements that <strong>to</strong>ok place in Shareholders’<br />
Funds.<br />
a) Fair value hedging<br />
Changes in <strong>the</strong> fair value of derivatives that are arranged and qualifi ed for fair value hedging are recognised in <strong>the</strong> profi t and<br />
loss account, <strong>to</strong>ge<strong>the</strong>r with changes <strong>to</strong> <strong>the</strong> fair value of <strong>the</strong> assets and liabilities covered (in <strong>the</strong> covered position) attributable <strong>to</strong><br />
covered risk.<br />
16
) Cash fl ow hedging<br />
The effective part of <strong>the</strong> change in fair value of derivatives that are arranged and qualifi ed for cash fl ow hedging is recognised in<br />
shareholders’ funds. The gain or loss related <strong>to</strong> <strong>the</strong> ineffective part is immediately recognised in <strong>the</strong> profi t and loss account.<br />
As pertains cover strategies that use options, in accordance with IAS 39 and complying with <strong>the</strong> effi ciency test, <strong>the</strong> strategy value<br />
is split in<strong>to</strong> <strong>the</strong> intrinsic value and <strong>the</strong> time value.<br />
The cumulative amounts in shareholders’ funds are reclassifi ed <strong>to</strong> profi t and loss in <strong>the</strong> same period in which <strong>the</strong> item covered<br />
generates gains and losses (for instance, when <strong>the</strong> covered sales forecast occurs). However, when <strong>the</strong> covered forecast transaction<br />
results in <strong>the</strong> recognition of a non-fi nancial asset (for example, s<strong>to</strong>cks) or non-fi nancial liability, <strong>the</strong> previously deferred gains and<br />
losses in shareholders’ funds are transferred and included in <strong>the</strong> initial measurement of that asset or liability.<br />
When a hedge instrument expires or is sold, or when a hedging does not comply with <strong>the</strong> accounting and qualifi cation criteria, any<br />
cumulative gain or loss existing at that moment in shareholders’ funds, remains in shareholders’ funds and is recognised when<br />
<strong>the</strong> forecast transaction is fi nally refl ected in <strong>the</strong> profi t and loss account. When <strong>the</strong> expected occurrence of a forecast transaction<br />
is no longer highly probable, <strong>the</strong> cumulative gains or losses refl ected in shareholders’ funds are immediately transferred <strong>to</strong> profi t<br />
and loss.<br />
c) Non-qualifi ed derivatives for hedging purposes<br />
Certain derivatives do not comply with hedging accounting and qualifi cation criteria. Changes in fair value of <strong>the</strong>se derivatives are<br />
immediately recognised in <strong>the</strong> profi t and loss account.<br />
2.3 Estimates of fair value<br />
The fair value of fi nancial instruments available on <strong>the</strong> current market (for instance publicly negotiated derivatives, negotiable<br />
instruments available for sale) is determined on <strong>the</strong> basis of quoted market prices at balance sheet date. The quoted market price<br />
used for fi nancial assets of <strong>the</strong> Group is <strong>the</strong> price received by shareholders on <strong>the</strong> current market; <strong>the</strong> quoted market price for<br />
fi nancial liabilities is <strong>the</strong> price paid on <strong>the</strong> current market.<br />
The fair value of fi nancial instruments not traded on <strong>the</strong> current market (for instance unquoted derivatives) is determined using<br />
enhancement techniques. The Group uses a variety of methods and reaches its conclusions based on market conditions at each<br />
balance sheet date. Quoted market prices or negotiation quotas for similar instruments are used for long-term debts. O<strong>the</strong>r techniques,<br />
such as estimates of discounted cash fl ows, are used <strong>to</strong> determine <strong>the</strong> fair value of o<strong>the</strong>r fi nancial instruments. The fair<br />
value of interest rate swaps is calculated based on <strong>the</strong> present value of estimated future cash fl ows. The fair value of interest rate<br />
futures contracts is determined using market exchange rates at <strong>the</strong> balance sheet date.<br />
The nominal value less estimated credit adjustments of receivable and payable accounts is assumed <strong>to</strong> be close <strong>to</strong> <strong>the</strong>ir fair value.<br />
The fair value of fi nancial liabilities is estimated by updating future contractual cash fl ows at <strong>the</strong> current market interest rate available<br />
for similar fi nancial instruments.<br />
17<br />
2008 Consolidated and<br />
Individual Financial Statments
C. Segment Information<br />
3. Reporting by activity segment<br />
Information by segments is presented for <strong>the</strong> geographical segments and businesses of <strong>the</strong> Group. The income, assets and liabilities<br />
of each segment correspond <strong>to</strong> those that are directly attributable <strong>to</strong> <strong>the</strong>m as well as those that can be attributed on a<br />
reasonable basis.<br />
Business segment<br />
A business segment is a separately identifi able part of <strong>the</strong> Group, committed <strong>to</strong> supplying a specifi c product or service, and that<br />
is subject <strong>to</strong> different risks and opportunities than those of o<strong>the</strong>r business segments.<br />
As at 31 December 2008, <strong>the</strong> Group was organized on a worldwide basis in<strong>to</strong> <strong>the</strong> following business segments:<br />
- SEN – Energy Solutions;<br />
- EES – Engineering, Environment and Services;<br />
- STL – Transport and Logistics;<br />
The information also includes a heading entitled “Various”, which groups <strong>to</strong>ge<strong>the</strong>r assets relating <strong>to</strong> corporate centres and investments<br />
in non-core Group business activities.<br />
Geographical segment<br />
A geographical segment is an individual area of <strong>the</strong> Group committed <strong>to</strong> providing products or services within a specifi c economic<br />
zone, and that is subject <strong>to</strong> different risks and opportunities than those of o<strong>the</strong>r economic zones.<br />
In addition <strong>to</strong> Portugal, <strong>the</strong> relevant geographic segments are those in countries or regions which <strong>the</strong> company has chosen as<br />
<strong>Efacec</strong> markets:<br />
- Spain - Latin America<br />
- Central Europe - United States<br />
- Maghreb - India<br />
- Sou<strong>the</strong>rn Africa<br />
3.1 Information by business segment<br />
3.1.1 Turnover<br />
The split of turnover amongst <strong>the</strong> main activity areas on 31 December 2008 and 2007 was as follows:<br />
31.12.2008<br />
Energy<br />
Engineering, Environment<br />
and Services<br />
18<br />
Transport and<br />
Logistics<br />
Various Total<br />
Gross sales by segment 256,961,526 271,727,908 109,635,637 1,301,926 639,626,997<br />
Sales between segments 8,346,645 7,965,033 17,098,815 0 33,410,492<br />
Consolidated sales 248,614,881 263,762,875 92,536,822 1,301,926 606,216,504<br />
31 December 2007<br />
Gross sales by segment 192,111,063 191,893,051 84,511,060 876,431 469,391,605<br />
Sales between segments 7,732,517 6,313,672 15,022,315 0 29,068,504<br />
Consolidated sales 184,378,546 185,579,380 69,488,745 876,431 440,323,101<br />
3.1.2 Profit/Loss<br />
Profi t and Losses by business segment for <strong>the</strong> years ended 31 December 2008 and 31 December 2007 were as follows:
31.12.2008<br />
Energy<br />
Engineering, Environment<br />
and Services<br />
19<br />
Transport and<br />
Logistics<br />
Various Total<br />
Operating profi ts 25,331,386 12,844,472 4,840,335 1,603,836 44,620,028<br />
Net fi nancial costs (Note 21) -8,690,000 -1,458,574 -1,115,974 -3,098,846 -14,363,394<br />
Losses/Gains in associates and o<strong>the</strong>r 50,385 505,861 -1,965 81,663 635,943<br />
Earnings before taxes 16,691,770 11,891,758 3,722,396 -1,413,347 30,892,577<br />
Income Tax -2,978,646 -3,040,417 -410,527 261,635 -6,167,954<br />
Minority Interests 0 0 0 -587,641 -587,641<br />
Net profi t for <strong>the</strong> period 13,713,125 8,851,341 3,311,869 -1,739,354 24,136,981<br />
31 December 2007<br />
Operating profi ts 13,587,774 5,027,018 3,034,272 3,790,470 25,439,535<br />
Net fi nancial costs (Note 21) -2,311,304 -367,764 -283,364 -1,903,152 -4,865,583<br />
Losses/Gains in associates and o<strong>the</strong>r 94,251 729,509 98,029 189,394 1,111,182<br />
Earnings before taxes 11,370,722 5,388,763 2,848,937 2,076,712 21,685,135<br />
Income Tax -2,411,462 -1,379,710 380,037 -525,936 -3,937,072<br />
Minority Interests 0 0 0 -346,878 -346,878<br />
Net profi t for <strong>the</strong> period 8,959,260 4,009,053 3,228,974 1,203,897 17,401,185<br />
The transfers and transactions between segments take place under normal commercial terms and under conditions applicable <strong>to</strong><br />
independent third parties.<br />
3.1.3 O<strong>the</strong>r Information<br />
31.12.2008<br />
Energy<br />
Engineering, Environment<br />
and Services<br />
Transport and<br />
Logistics<br />
Various Total<br />
Assets 199,682,306 259,229,316 91,850,878 104,966,883 655,729,383<br />
Liabilities 142,531,169 215,878,015 66,181,948 151,815,915 576,407,047<br />
Investments (Note 4 and 5) 17,645,479 28,064,026 896,892 3,548,210 50,154,607<br />
31 December 2007<br />
Assets 155,696,138 147,954,859 71,441,982 43,533,788 418,626,766<br />
Liabilities 106,760,696 119,161,029 47,547,070 65,664,054 339,132,848<br />
Investments (Note 4 and 5) 14,362,545 11,879,651 1,326,734 3,691,191 31,260,120<br />
Segment assets mainly include tangible fi xed assets, intangible assets, s<strong>to</strong>cks, derivatives for hedging of commercial transactions,<br />
accounts receivable and cash. Segment liabilities correspond <strong>to</strong> operational liabilities (including derivatives for commercial transactions<br />
hedging). Investments include additions <strong>to</strong> tangible and intangible fi xed assets, including goodwill (Note 4).<br />
3.2 Information by geographical segment<br />
Sales and Services Rendered are split based on <strong>the</strong> region in which <strong>the</strong> cus<strong>to</strong>mer is located. In <strong>the</strong> case of Assets and realized<br />
Investment, <strong>the</strong> criteria is based on <strong>the</strong> location of <strong>Efacec</strong> local structures.<br />
2008 Consolidated and<br />
Individual Financial Statments
D. <strong>Notes</strong> <strong>to</strong> <strong>the</strong> Balance Sheets as at 31 December 2008 and 31 December 2007<br />
4. Tangible fixed assets<br />
4.1 Movements that <strong>to</strong>ok place in <strong>the</strong> period<br />
Financial Year 2008<br />
Land and buildings<br />
Vehicles and equipment<br />
20<br />
Office equipment O<strong>the</strong>r Total<br />
Opening balance 40,309,919 15,326,608 1,662,787 12,753,227 70,052,540<br />
Exchange rate differences -20,209 -161,088 -14,199 860,079 664,583<br />
Entries <strong>to</strong> consolidation perimeter 0 262 5,868 0 6,130<br />
Exits from <strong>the</strong> consolidation perimeter 0 0 0 0 0<br />
Revaluation 463,392 -163,017 -735 -175 299,464<br />
Increases 3,727,908 23,311,703 1,109,082 17,440,460 45,589,154<br />
Decreases 0 -169,507 -112 -89,685 -259,304<br />
Depreciation charges -2,297,711 -4,338,805 -807,786 -212,781 -7,657,083<br />
Adjustments 3,859,321 6,466,085 280,883 -10,831,395 -225,106<br />
Closing balance 46,042,621 40,272,241 2,235,787 19,919,729 108,470,378<br />
Cost or fair value 108,650,571 109,747,491 24,702,109 26,484,033 269,584,205<br />
Cumulative depreciation -62,607,950 -69,475,250 -22,466,323 -6,564,304 -161,113,827<br />
Net value 46,042,621 40,272,241 2,235,787 19,919,729 108,470,378<br />
Financial Year 2007<br />
Opening balance 41,244,338 14,229,064 2,140,615 3,146,464 60,760,481<br />
Exchange rate differences -100,730 20,953 -6,499 -167,419 -253,695<br />
Entries <strong>to</strong> consolidation perimeter 5,569 832,161 34,838 0 872,568<br />
Exits from <strong>the</strong> consolidation perimeter 0 0 0 0 0<br />
Revaluation -46,262 -5,473 -62 -528 -52,325<br />
Increases 1,412,018 3,787,236 676,391 11,092,956 16,968,601<br />
Decreases -239,230 -155,009 -11,723 -42,320 -448,282<br />
Depreciation charges -2,285,793 -3,973,102 -1,276,205 -312,352 -7,847,452<br />
Adjustments 320,009 590,777 105,430 -963,574 52,642<br />
Closing balance 40,309,919 15,326,608 1,662,787 12,753,227 70,052,540<br />
Cost or fair value 101,182,843 91,022,921 24,554,481 19,521,500 236,281,746<br />
Cumulative depreciation -60,872,925 -75,696,314 -22,891,694 -6,768,273 -166,229,206<br />
Net value 40,309,919 15,326,608 1,662,787 12,753,227 70,052,540<br />
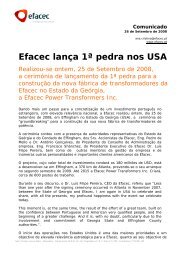
From <strong>the</strong> increase in tangible fi xed assets highlight goes <strong>to</strong> <strong>the</strong> investments in Spain that amounted <strong>to</strong> 17.558 thousand euro,<br />
of which 16.480 pertain <strong>to</strong> <strong>the</strong> implementation of 2 pho<strong>to</strong>voltaic stations. Investments in <strong>the</strong> United States represented 12.880<br />
thousand euro, pertaining mainly <strong>to</strong> <strong>the</strong> start of <strong>the</strong> construction of a transformer fac<strong>to</strong>ry. In Portugal, <strong>the</strong> power transformer production<br />
line started in 2006 was concluded still with an investment of approximately 6.000 thousand Euro.<br />
Depreciations are net of recognised investment subsidies within <strong>the</strong> period, <strong>to</strong>talling 336.610 Euro.<br />
4.2 Revaluations<br />
Buildings and o<strong>the</strong>r tangible fi xed assets of <strong>the</strong> Group were re-valued on 1 January 2004, using <strong>the</strong> monetary revaluation coeffi<br />
cients as part of <strong>the</strong> transition <strong>to</strong> IFRS (IFRS 1).<br />
The land included in <strong>the</strong> company assets is booked as fair value. The value of <strong>the</strong> lands was subject <strong>to</strong> update on 31 December<br />
2008 based on an evaluation carried out by independent external consultants resulting in an enhancement of around 488 thousand<br />
Euro whose compensation was recognised in shareholder's fund following <strong>the</strong> deduction of <strong>the</strong> respective deferred tax.
If tangible assets were shown at his<strong>to</strong>rical cost, <strong>the</strong> values in <strong>the</strong> balance sheet would be:<br />
4.3 Leased tangible assets<br />
31.12.2008 31.12.2007<br />
Cost 170,11,810 132,499,495<br />
Cumulative depreciation -92,607,923 -86,545,405<br />
Net Value 77,503,887 45,954,090<br />
The line Tangible Assets includes <strong>the</strong> following amounts for leased assets:<br />
31.12.2008 31.12.2007<br />
Financial leases 1,418,149 195,712<br />
Cumulative depreciation -57,486 -44,944<br />
Net value 1,360,663 150,768<br />
The responsibilities relating <strong>to</strong> <strong>the</strong>se contracts are refl ected in Liabilities in <strong>the</strong> line Suppliers and O<strong>the</strong>r Credi<strong>to</strong>rs (Note 14).<br />
4.4 Guarantees<br />
No pledges or guarantees exist on any assets.<br />
5. Intangible assets and goodwill<br />
5.1 Movements that <strong>to</strong>ok place in <strong>the</strong> period<br />
Financial Year 2008<br />
Goodwill R&D O<strong>the</strong>r Total<br />
Opening balance 22,110,396 659,124 4,179,740 26,985,260<br />
Exchange rate differences -116,859 0 -159 -117,018<br />
Entries <strong>to</strong> consolidation perimeter 0 0 23 23<br />
Exits from <strong>the</strong> consolidation perimeter 0 0 0 0<br />
Revaluation 0 0 0 0<br />
Increases 3,720,744 418,682 426,030 4,565,455<br />
Decreases 0 0 0 0<br />
Depreciation of <strong>the</strong> period 0 -405,145 -646,489 -1,051,634<br />
Adjustments 0 158,846 -611,929 -453,083<br />
Closing balance 25,714,280 1,322,685 2,892,038 29,929,004<br />
Financial Year 2007<br />
Opening balance 9,730,101 992,933 3,229,273 13,952,307<br />
Exchange rate differences 0 0 0 0<br />
Entries <strong>to</strong> consolidation perimeter 0 0 0 0<br />
Exits from <strong>the</strong> consolidation perimeter 0 0 0 0<br />
Revaluation 0 0 0 0<br />
Increases 12,380,295 82,786 1,828,438 14,291,519<br />
Decreases 0 0 0 0<br />
Depreciation of <strong>the</strong> period 0 -382,537 -833,887 -1,216,424<br />
Adjustments 0 1,942 -44,084 -42,142<br />
Closing balance 22,110,396 695,124 4,179,740 26,985,260<br />
5.2 Goodwill<br />
The breakdown of goodwill by subsidiary/associate company is as follows:<br />
21<br />
2008 Consolidated and<br />
Individual Financial Statments
22<br />
31.12.2008 31.12.2007<br />
ATM - Assistência Total em Manutenção, SA 4,577,159 4,577,159<br />
Grupo TECH M5 3,549,415 3,549,415<br />
Engimais 1,971,508 1,971,508<br />
O&M Serviços, S.A. 207,628 207,628<br />
ENT - Empresa Nacional de Telecomunicações, SA (a) 204,736 204,736<br />
BCI - BRISA Conservação de Infra-estruturas, SA 124,211 124,211<br />
Águas da Figueira, SA 54,791 54,791<br />
Bauen <strong>Efacec</strong>, SA 33,454 33,454<br />
<strong>Efacec</strong> Moçambique, Lda. 697,116 697,116<br />
<strong>Efacec</strong> Energy Service, Ltda. 585,579 585,579<br />
Advanced Control Systems, Inc. 10,104,798 10,104,798<br />
Aura de Guijo de Coria, SL 1,325,943 0<br />
Aura de Agudo, SL 880,628 0<br />
<strong>Efacec</strong> Power Transformers Inc. 635,832 0<br />
Total 25,714,281 22,110,396<br />
(a) In 2006, a merger of <strong>the</strong> net assets of this subsidiary in<strong>to</strong> EFACEC – Sistemas Electrónicos S.A <strong>to</strong>ok place.<br />
The variation noted in 2008 in <strong>the</strong> goodwill of Advanced Control Systems, Inc., acquired at <strong>the</strong> end of 2007 was <strong>the</strong> result of <strong>the</strong><br />
readjustment of <strong>the</strong> value of shareholder's funds at purchase date resulting from <strong>the</strong> recalculation of current assets. The impairment<br />
tests carried out prove that <strong>the</strong> increase in goodwill value is not prejudicial <strong>to</strong> its recovery through future cash-fl ows.<br />
The variation noted in <strong>Efacec</strong> Energy Service, Ltda. results from <strong>the</strong> interest rate update of <strong>the</strong> Brazilian Real, <strong>the</strong> currency in which<br />
goodwill was recognised.<br />
The o<strong>the</strong>r variations pertain <strong>to</strong> <strong>the</strong> acquisitions in 2008 of <strong>the</strong> <strong>to</strong>tal share capital of <strong>the</strong> Aura de Agudo, SL and Aura de Guijo de<br />
Coria, SL, both with headquarters in Spain. In each case, <strong>the</strong> values booked are equal <strong>to</strong> <strong>the</strong> difference between <strong>the</strong> cost of acquisition,<br />
already paid or payment <strong>to</strong> be expected in a short-term, compared <strong>to</strong> <strong>the</strong> accounting value of assets and liabilities. In <strong>the</strong><br />
above cases, <strong>the</strong>re were no corrections <strong>to</strong> <strong>the</strong> related accounting values. <strong>Efacec</strong> Power Transformers, Inc. is a new company in <strong>the</strong><br />
United States where costs with <strong>the</strong> creation of <strong>the</strong> company were booked as consolidation difference.<br />
Impairment tests were carried out <strong>to</strong> most companies justifying <strong>the</strong> goodwill value, based on <strong>the</strong> projections of <strong>the</strong> discounted<br />
future cash-fl ows having occurred no sort of value loss. In said tests <strong>the</strong> following assumptions were taken in<strong>to</strong> account<br />
Indica<strong>to</strong>rs<br />
WACC 9.30%<br />
OT 5 years 3.53%<br />
Spreads 2.43%<br />
OT 10 years 4.39%<br />
risk premium 5.00%<br />
In tests carried out <strong>to</strong> companies located in countries considered of risk, <strong>the</strong> risk premium registered an average of 3%-increase.<br />
5.3 Corporate concentrations<br />
Aura de Agudo, SL and Aura de Guijo de Coria, SL<br />
Acquisition<br />
In July 2008, <strong>the</strong> Group acquired from private partners 2 companies with headquarters in Toledo, Spain, designated Aura de<br />
Agudo, SL and Aura de Guijo de Coria, SL.<br />
The acquired net assets and goodwill were as follows:
Aura de Agudo Aura de Guijo de Coria, SL<br />
Acquisition value 800,000 1,200,00<br />
Direct costs pertaining <strong>to</strong> acquisition 84,628 129,943<br />
Total acquisition value 884,628 1,326,943<br />
Fair value of acquired assets 4,000 4,000<br />
Goodwill 880,628 1,325,943<br />
The goodwill is attributed <strong>to</strong> <strong>the</strong> profi tability expected from <strong>the</strong> acquired business. In both companies <strong>the</strong> business falls in<strong>to</strong> <strong>the</strong><br />
area of Power Generation, on pho<strong>to</strong>voltaic plants where no value loss is expected.<br />
Acquired assets and liabilities were as follows:<br />
Aura de Agudo Aura de Guijo de Coria, SL<br />
Cash and cash equivalents 2,828 3,007<br />
Intangible assets 1,172 993<br />
Acquired net assets 4,000 4,000<br />
As at 31 December 2008, <strong>the</strong> amounts yet <strong>to</strong> be paid pertaining <strong>to</strong> <strong>the</strong> acquisitions were 125,000 Euro for Aura de Agudo and<br />
187,500 Euro for Aura de Guijo de Coria, values included in <strong>the</strong> line O<strong>the</strong>r Credi<strong>to</strong>rs (Note 14).<br />
Effects of entry in<strong>to</strong> consolidation perimeter in <strong>the</strong> Net Profit and Balance Sheet<br />
Following <strong>the</strong> acquisition by <strong>Efacec</strong>, <strong>the</strong>se companies carried out important investments in <strong>the</strong> construction of pho<strong>to</strong>voltaic plants<br />
whose effects will come in<strong>to</strong> action as of 2009 through <strong>the</strong> sale of energy <strong>to</strong> a distribu<strong>to</strong>r.<br />
The acquisition effects of Aura de Agudo and of Aura de Guijo de Coria in <strong>the</strong> <strong>consolidated</strong> accounts are as follows:<br />
23<br />
Aura de Agudo Aura de Guijo de Coria, SL<br />
Investments 6,593,024 9,886,596<br />
Total income 0 0<br />
Net profi t<br />
Assets and liabilities<br />
-3,211 -4,349<br />
Assets of <strong>the</strong> subsidiary as at 31.12.2008 7,659,103 12,804,278<br />
Goodwill 880,628 1,325,943<br />
Effect on <strong>consolidated</strong> Assets as at 31.12.2008 8,539,731 12,804,278<br />
Liabilities of <strong>the</strong> subsidiary as at 31.12.2008 1,647,244 2,469,753<br />
Effect on <strong>the</strong> <strong>consolidated</strong> net Assets 6,892,487 10,334,524<br />
6. Investments in group and associated companies<br />
This line refl ects <strong>the</strong> value of investments made in associated companies, adjusted at <strong>the</strong> balance sheet date using <strong>the</strong> equity<br />
method. It includes <strong>the</strong> value of subsidiary companies, when for justifi able reasons; <strong>the</strong>y are excluded from <strong>the</strong> consolidation<br />
(Note 31.2), in which case <strong>the</strong>y are valued at acquisition cost. The line shows <strong>the</strong> value of shareholdings at <strong>the</strong> date of <strong>the</strong> Balance<br />
Sheet and <strong>the</strong> value of supplementary capital and loans granted <strong>to</strong> <strong>the</strong> entities concerned (Note 27). The movements during <strong>the</strong><br />
year were as follows:<br />
2008 Consolidated and<br />
Individual Financial Statments
24<br />
31.12.2008 31.12.2007<br />
Opening balance 7,560,600 7,290,641<br />
Increase in shareholding 50,000 75,222<br />
Decrease in shareholdings 0 0<br />
Quota in Associate Profi t 629,591 1,086,098<br />
O<strong>the</strong>r Movements in Equity of Associates -889,627 -725,389<br />
Exchange Rate Differences 15,321 -89,395<br />
Impairment Losses in Associates 0 0<br />
Loans granted 0 -76,577<br />
Closing Balance 7,365,885 7,560,600<br />
The amount booked in Increase in shareholdings refers <strong>to</strong> <strong>the</strong> participation in <strong>Efacec</strong> Maroc, a subsidiary set up at <strong>the</strong> end of 2008<br />
and not included in <strong>the</strong> consolidation for this fi nancial year (Note 31.2).<br />
The quota in profi t of associated companies refers mainly <strong>to</strong> S2M – Sociedade de Manutenção de Metropolitanos, SA (442.876<br />
Euro) and <strong>to</strong> EID – Empresa de Investigação e Desenvolvimen<strong>to</strong> de Electrónica, SA (268.546 Euro).<br />
The line “O<strong>the</strong>r movements in equity” includes 689.300 Euro for dividends distributed by <strong>the</strong> associate company S2M. On <strong>the</strong> o<strong>the</strong>r<br />
hand, as mentioned ahead, <strong>the</strong> integration method of Godrej <strong>Efacec</strong> (India) was changed in this same Note, so <strong>the</strong> shareholding<br />
value in said company <strong>to</strong>talling 269.920 Euro in December 2007, is no longer included in this line.<br />
Acquisition differences concerning shareholdings in O&M Services and in Águas da Figueira are shown in <strong>the</strong> line Goodwill (Note<br />
5.2).<br />
The shareholdings of <strong>the</strong> Group in <strong>the</strong> main associated companies, none of which are quoted on s<strong>to</strong>ck exchanges, are as follows:<br />
31.12.2008 Shareholding<br />
Investment<br />
Headquarters<br />
Assets<br />
Shareholders’<br />
Funds<br />
Total Income<br />
Net Profit % Amount<br />
EID - Emp. Invest. e Desenv. Electrónica, S.A. Lisbon 24,923,419 10,903,557 21,017,306 1,074,186 25,0 2,725,889<br />
Águas da Figueira, S.A. Fig. da Foz 69,231,059 2,404,814 11,478,554 -934,418 20.0 480,963<br />
S2M - Soc. de Manut. de Metropolitanos, S.A. Ma<strong>to</strong>sinhos 4,531,300 1,730,942 8.080.485 1.107.190 40.0 692,377<br />
O&M Serviços S.A. Mortágua 7,028,925 997,035 12,249,073 136,667 40.0 398,814<br />
SESCO EFACEC Sdn. Bhd. Malaysia 5,925,641 3,789,241 2,754,112 143,139 35.2 1,333,813<br />
Liaoyang EFACEC Electrical Equip. Co (a) (b) China 28,043,444 2,146,955 n.a. n.a. 36.3 778,915<br />
31 December 2007 Shareholding<br />
Investment<br />
Headquarters<br />
Assets<br />
Shareholders’<br />
Funds<br />
Total Income<br />
Net Profit % Amount<br />
EID - Emp. Invest. e Desenv. Electrónica, S.A. Lisbon 31,279,177 9,825,135 20,515,621 844,837 25.0 2,456,284<br />
Águas da Figueira, S.A. Fig. da Foz 71,313,031 2,805,354 11,650,341 -136,223 20.0 561,071<br />
S2M - Soc. de Manut. de Metropolitanos, S.A. Ma<strong>to</strong>sinhos 5,414,111 2,347,001 7,919,534 1,723,249 40.0 938,800<br />
O&M Serviços S.A. Mortágua 7,731,346 899,199 10,278,148 64,109 40.0 359,680<br />
Godrej EFACEC Au<strong>to</strong>mation & Robotics, Ltd. India 954,406 539,840 2,607,130 185,426 50.0 269,920<br />
SESCO EFACEC Sdn. Bhd. Malaysia 5,824,264 3,569,776 3,758,229 268,400 35.2 1,256,561<br />
Liaoyang EFACEC Electrical Equip. Co (a) (b) China 28,130,554 2,153,624 n.a. n.a. 36.3 781,335<br />
(a) Up <strong>to</strong> 31 December 2004, <strong>the</strong> equity method was not considered for use for this associate company given <strong>the</strong> low probability of<br />
transfer of funds, and for which an impairment loss of 2,259,554 Euro was booked, given that future cash fl ow projections indicate<br />
an overall loss. In 2004, 13.7% of <strong>the</strong> share capital of <strong>the</strong> company was acquired, so that <strong>the</strong> group held a <strong>to</strong>tal of around 36.28%,<br />
and <strong>the</strong> Equity Method was used. This acquisition generated goodwill of 200,000 Euro, which was entirely depreciated in 2004.<br />
(b) Since up <strong>to</strong> date accounts were not available, <strong>the</strong> numbers for this company refer <strong>to</strong> those as at 30 November 2006, with exchange<br />
rates being updated as at date of fi nancial <strong>statements</strong>.
(c) As at 31 December 2007, <strong>the</strong> Group owned 50% of <strong>Efacec</strong> Moçambique and <strong>consolidated</strong> using <strong>the</strong> equity method. In 2008<br />
<strong>the</strong> proportional method was applied as it was considered that <strong>the</strong> line <strong>to</strong> line global consolidation of assets/liabilities and of profi t<br />
components refl ects in a better way <strong>the</strong> interests of <strong>Efacec</strong> in this joint-venture.<br />
7. Financial investments in o<strong>the</strong>r companies<br />
The breakdown of this line is as follows:<br />
31.12.2008 31.12.2007<br />
Shareholding % Shareholding Shareholding % Shareholding<br />
Parts of share capital<br />
Portugal Space, S.A. (a) 325,000 16.25% 325,000 16.25%<br />
MARL Energia - Central Fo<strong>to</strong>voltáica, SA 163,158 10.00% 0<br />
O<strong>the</strong>rs 19,416 19,416<br />
507,574 344,416<br />
Financing Loans 359,259 0<br />
Total investment 866,833 344,416<br />
Impairment (a) -331,898 -329,933<br />
Net investment 534,934 14,483<br />
(a) In view of <strong>the</strong> fi nancial situation of this holding, an impairment loss was booked in <strong>the</strong> year for <strong>the</strong> value of <strong>the</strong> shareholding<br />
(325,000 Euro), as well as for <strong>the</strong> loan granted in <strong>the</strong> line “Deb<strong>to</strong>rs and Deferred Costs” (156,271 Euro).<br />
8. Derivatives<br />
In relation <strong>to</strong> fi nancial risk management described in Note 2, <strong>the</strong> evaluation of fi nancial instruments as at 31 December 2008 and<br />
31 December 2007 was as follows:<br />
Exchange rate risk<br />
Exchange rate risk hedging is done through options, of which at <strong>the</strong> balance sheet date 67 million USD and 500 million GBP were<br />
active in <strong>the</strong> Group, on which an upward adjustment of -1,306,067 Euro was made <strong>to</strong> refl ect fair value.<br />
Interest rate risk<br />
As at 31 December 2008, EFACEC featured a portfolio of interest rate derivatives <strong>to</strong>talling 87 million Euro for BEI loans and<br />
Commercial paper (Note 15), whose market valuation was negative by 2,347,029 Euro.<br />
“Commodity” price (copper)<br />
At <strong>the</strong> end of <strong>the</strong> year, <strong>the</strong> Group had options for copper price hedging on 3,750 <strong>to</strong>ns required for consumption in 2009 and 2010,<br />
<strong>the</strong> market valuation of which was negative by <strong>the</strong> sum of 7,925,481 Euro.<br />
The impact of <strong>the</strong>se valuations as at 31 December 2008 and 2007 can be summarised as follows:<br />
31.12.2008 31.12.2007<br />
Assets Liabilities Assets Liabilities<br />
Exchange rate option - Cash fl ow hedging 0 1,306,067 1,062,540 0<br />
Financing options - Cash fl ow hedging 0 2,347,029 345,574 0<br />
Copper options - Cash fl ow hedging 0 7,925,481 0 117,426<br />
Total 0 11,578,577 1,408,114 117,426<br />
* Non-current 0 2,347,029 345,574 0<br />
*Current 0 9,231,548 1,062,540 117,426<br />
The hedging instruments are booked in equity or directly in profi t, as described in Note 2.2.<br />
The movement in <strong>the</strong> line Financial Instruments Reserves was <strong>the</strong> result of <strong>the</strong> change in fair value between <strong>the</strong> various reporting<br />
periods, less <strong>the</strong> related deferred tax assets/liabilities (note 16).<br />
25<br />
2008 Consolidated and<br />
Individual Financial Statments
9. Cus<strong>to</strong>mers and accrued income<br />
The breakdown of this line as at 31 December 2008 and 31 December 2007 was as follows:<br />
26<br />
31.12.2008 31.12.2007<br />
Cus<strong>to</strong>mers - Current 176,939,488 150,185,865<br />
Cus<strong>to</strong>mers - Related parties (Note 27) 519,229 1,053,310<br />
Cus<strong>to</strong>mers - Bills Receivable 118,875 429,115<br />
Cus<strong>to</strong>mers - Doubtful Debts 10,036,035 8,351,376<br />
Accrued income - multi-year contracts (Note 29 89,828,258 57,936,793<br />
277,441,885 217,956,459<br />
Provision for cus<strong>to</strong>mer accounts impairment -9,203,255 -8,422,008<br />
Accounts Receivable from Cus<strong>to</strong>mers - Net 268,238,630 209,534,451<br />
Accrued Income - not covered by IFRS 7 10,806,608 8,697,395<br />
Total 279,045,239 218,231,846<br />
* Non-current 0 0<br />
*Current 279,045,239 218,231,846<br />
The fair value of receivables is <strong>the</strong> same as its accounting value. There is no concentration of credit risk pertaining <strong>to</strong> <strong>the</strong> accounts<br />
receivable from cus<strong>to</strong>mers and o<strong>the</strong>r deb<strong>to</strong>rs as <strong>the</strong> Group has a high number of world-wide cus<strong>to</strong>mers. As at 31 December 2008<br />
and 2007 <strong>the</strong> accounts receivable from cus<strong>to</strong>mers, including Profi t Increase in multi-year contracts, presented <strong>the</strong> following seniority<br />
structure, bearing in mind <strong>the</strong> maturity of open balances:<br />
31.12.2008 31.12.2007<br />
Balances not due<br />
Balances due<br />
170,872,447 151,884,915<br />
Up <strong>to</strong> 90 days 62,564,236 25,617,407<br />
From 90 <strong>to</strong> 360 days 28,229,627 20,438,745<br />
Over 360 days 15,775,576 20,015,392<br />
277,441,885 217,956,459<br />
Impairment -9,203,255 -8,422,008<br />
Net Deb<strong>to</strong>rs Balance 268,238,630 209,534,451<br />
During 2008, <strong>the</strong> Group booked 802,171 Euro for impairment adjustments on cus<strong>to</strong>mer receivables while reversal of provisions<br />
<strong>to</strong>talled 26,978 Euro in <strong>the</strong> same period. It is <strong>the</strong> company’s belief that <strong>the</strong> impairment losses estimated on accounts receivable<br />
are properly refl ected in <strong>the</strong> accounts and refl ect <strong>the</strong> real risk of loss. In spite of <strong>the</strong> fact that o<strong>the</strong>r sums exist with signifi cant<br />
delays in payment, provisions were not taken for <strong>the</strong>se, since situations of impairment were not found <strong>to</strong> exist. The amounts in<br />
Income Accruals included in this line relate <strong>to</strong> income for ongoing projects and work in progress, for which <strong>the</strong> stage of completion<br />
is greater than that of invoicing (Note 1.10 and 29).<br />
10. O<strong>the</strong>r deb<strong>to</strong>rs and deferred costs<br />
The breakdown of this line as at 31 December 2008 and 31 December 2007 was as follows:<br />
31.12.2008 31.12.2007<br />
O<strong>the</strong>r Deb<strong>to</strong>rs 19,868,948 12,534,520<br />
- Impairment losses -405,670 -405,670<br />
Accounts receivable from o<strong>the</strong>r Deb<strong>to</strong>rs - net 19,463,278 12,128,850<br />
Accounts receivable from related parties 1,226,88 1,178,637<br />
State and o<strong>the</strong>r public entities 7,966,776 14,247,200<br />
Deferred costs 2,559,012 2,367,561<br />
Total 31,215,954 29,922,248<br />
*Non-current 27,000 27,000<br />
*Current 31,188,954 29,895,248
The lines included in <strong>the</strong> active balances with State and o<strong>the</strong>r Public Entities as at 31 December 2008 and 31 December 2007<br />
registered <strong>the</strong> following breakdown:<br />
31.12.2008 31.12.2007<br />
Income Tax 0 1,849,185<br />
Value added tax <strong>to</strong> recover 6,039,066 12,398,015<br />
O<strong>the</strong>r taxes <strong>to</strong> recover 1,927,710 0<br />
27<br />
7,966,776 14,247,200<br />
The legislation change that occurred in 2007 concerning Value Added Tax in relation <strong>to</strong> construction contracts had a signifi cant<br />
impact on some Group companies. This change means <strong>the</strong> continuous existence of VAT credit balances with <strong>the</strong> State of substantial<br />
amounts, which are periodically subject <strong>to</strong> recovery processes. The line O<strong>the</strong>r Deb<strong>to</strong>rs is made up of balances with entities of<br />
various kinds, which overall are considered acceptable taking in<strong>to</strong> account <strong>the</strong> operational activities of <strong>the</strong> Group.<br />
11. S<strong>to</strong>cks<br />
31.12.2008 31.12.2007<br />
Raw materials 20,605,179 12,850,082<br />
Merchandise 2,816,071 1,484,131<br />
Work in progress 30,918,869 26,281,915<br />
Finished goods 5,932,612 6,609,368<br />
60,272,731 47,225,497<br />
The line Work in Progress includes work relating <strong>to</strong> multi-year contracts (Note 1.10 and 29).<br />
Buildings held for sale by <strong>the</strong> real estate company GEMP for <strong>the</strong> amount of 931,196 Euro (1,242,908 Euro at <strong>the</strong> end of 2007)<br />
were shown in <strong>the</strong> line Assets Held for Sale.<br />
12. Monetary instruments<br />
31.12.2008 31.12.2007<br />
Cash and cash equivalents<br />
Cash and Sight Deposits 17,249,589 10,213,594<br />
Time Deposits 58,936,577 0<br />
Short-term cash investments 34,340,246 1,526,260<br />
O<strong>the</strong>r Financial Investments<br />
110,526,411 11,739,854<br />
Captive deposits 16,992,032 0<br />
13. Share Capital<br />
The authorised capital is made up of 41,641,416 ordinary registered shares each having a par value of 1 Euro, and is entirely paid<br />
up. The company does not hold any own shares.<br />
2008 Consolidated and<br />
Individual Financial Statments
14. Suppliers, o<strong>the</strong>r credi<strong>to</strong>rs and accruals<br />
The breakdown of this line is as follows:<br />
28<br />
31.12.2008 31.12.2007<br />
Suppliers - Current account 88,246,600 72,418,135<br />
Suppliers - related parties (Note 27) 2,965,770 2,101,381<br />
Suppliers - bills payable 0 0<br />
Suppliers,invoices received and being checked 12,003,948 5,269,094<br />
103,216,319 79,788,610<br />
Fixed asset suppliers, Current account 1,649,404 2,598,015<br />
Total 104,865,722 82,386,625<br />
Non-current 1,051,246 2,598,015<br />
Current 103,814,476 79,788,610<br />
31.12.2008 31.12.2007<br />
State and o<strong>the</strong>r public entities 5,562,533 6,700,951<br />
O<strong>the</strong>r credi<strong>to</strong>rs - related parties 1,141,357 879,818<br />
O<strong>the</strong>r credi<strong>to</strong>rs - various 21,640,286 11,015,417<br />
Accruals: 21,952,737 11,933,052<br />
Accruals - costs for work in progress 8,322,483 524,837<br />
Accruals - remuneration <strong>to</strong> pay 9,908,650 8,542,833<br />
Accruals - interest <strong>to</strong> pay 578,082 1,029,176<br />
Accruals - insurance <strong>to</strong> pay 217,713 320,852<br />
Accruals - royalties <strong>to</strong> pay 154,729 119,776<br />
Accruals - o<strong>the</strong>r 2,771,080 1,395,578<br />
Total 50,296,912 30,529,238<br />
*Non-current 3,958,939 3,477,160<br />
*Current 46,337,973 27,052,078<br />
The non-current part of O<strong>the</strong>r Credi<strong>to</strong>rs includes <strong>the</strong> amount of 3,669,818 Euro corresponding <strong>to</strong> <strong>the</strong> discounted value of future<br />
payments in dollars within <strong>the</strong> scope of <strong>the</strong> acquisition of Advanced Control Systems, Inc. On 31 December 2008 <strong>the</strong> respective<br />
update was carried out resulting in a time effect of 297,603 Euro, and an unfavourable interest rate effect of 184,176 Euro, both<br />
booked under fi nancial cost for <strong>the</strong> year.<br />
The current amount due <strong>to</strong> Suppliers, for raw-materials and o<strong>the</strong>r services, is almost entirely due within 90 days, which refl ects<br />
<strong>the</strong> normal conditions negotiated with <strong>the</strong> company’s suppliers. As pertains Suppliers of fi xed assets, <strong>the</strong> value of 1,019,395 refers<br />
<strong>to</strong> a leasing contract for equipment which will be written off on a monthly basis across an 8-year period.<br />
31.12.2008 31.12.2007<br />
Suppliers<br />
Suppliers <strong>to</strong> pay - Current<br />
To be paid within 90 days 103,202,647 79,778,480<br />
To be paid in over 90 days 13,672 10,130<br />
Suppliers balance 103,216,319 79,788,610<br />
31.12.2008 31.12.2007<br />
Fixed Assets Suppliers<br />
Suppliers <strong>to</strong> pay - Non-current<br />
To be paid within 90 days 630,009 2,598,015<br />
To be paid in over 90 days 1,019,395 0<br />
Fixed assets suppliers balance 1,649,404 2,598,015<br />
The credit balances with State and O<strong>the</strong>r Public Entities as at 31 December 2008 and 31 December 2007 were made up as follows:
31.12.2008 31.12.2007<br />
Income Tax 1,659,590 0<br />
Value added tax - <strong>to</strong> pay 0 2,931,110<br />
Social security contributions 2,566,419 2,249,188<br />
Personal income tax 1,336,524 1,167,584<br />
O<strong>the</strong>rs 0 353,068<br />
29<br />
5,562,533 6,700,951<br />
In 2008, debt and credit balances with <strong>the</strong> State were compensated between Assets and Liabilities, respecting <strong>the</strong> equivalent<br />
natures of <strong>the</strong> taxes. For comparison purposes, if <strong>the</strong> compensation was not carried out, <strong>the</strong> VAT <strong>to</strong> be paid would be 3,129,968<br />
Euro<br />
15. Debt <strong>to</strong> Credit Institutions<br />
As at 31 December 2008 and 31 December 2007, loans and bank overdrafts, <strong>the</strong>ir average annual interest rates and o<strong>the</strong>r conditions<br />
were as follows:<br />
31.12.2008 31.12.2007<br />
Non-current<br />
Bank loans 22,802,328 22,500,000<br />
Commercial paper 77,500,00 40,000,000<br />
Reimbursable Subsidies 3,409,542 1,840,649<br />
O<strong>the</strong>r loans 2,792,928 0<br />
Current<br />
104,504,798 64,340,649<br />
Bank overdrafts 34,631,407 15,533,256<br />
Bank loans 13,404,339 7,594,589<br />
Commercial paper 87,500,000 20,000,000<br />
Reimbursable Subsidies 659,622 389,280<br />
O<strong>the</strong>r loans 0 3,302,301<br />
136,195,368 46,819,426<br />
Total loans 240,700,165 111,160,075<br />
Bank financing<br />
The Group has a long-term loan from 16 November 2004 with <strong>the</strong> European Investment Bank that as at 31 December 2008, registered<br />
a value of 22,500,000 Euro, of which 4,500,000 Euro booked in current liabilities. The loan features half-yearly interest rates<br />
indexed <strong>to</strong> Euribor rate, plus a maximum spread of 0.13%. The fi rst capital amortisation was on 15 June 2008 and <strong>the</strong> o<strong>the</strong>rs will<br />
be made on a yearly basis until 2013.<br />
Commercial paper<br />
On 8 July 2005, a Commercial Paper programme was agreed with a bank trade union, involving fi ve banks, up <strong>to</strong> a maximum value<br />
of 40,000,000 Euro. The programme has a contract period of 5 years with a requirement in excess of one year. The companies<br />
included in <strong>the</strong> Programme can issue Commercial Paper by direct placement or by auction. The issues underway are due on 12<br />
January 2009. In November 2006, a second Commercial Paper programme was also agreed with <strong>the</strong> Santander Totta Bank <strong>to</strong> a<br />
maximum value of 7,500,000 Euro. The programme has a contract period of 5 years with annual renewals. EFACEC Capital can<br />
issue Commercial Paper by direct placement. The current issue falls due on 13 July 2009. In November 2007, a Commercial Paper<br />
Programme was also agreed with <strong>the</strong> Fortis Bank S.A. <strong>to</strong> a maximum value of 12,500,000 Euro. The programme has a contract<br />
period of 5 years, which can be extended for periods of time <strong>to</strong> be agreed between <strong>the</strong> parties. The current issue falls due on 13<br />
November 2009. In April 2008, a Commercial Paper Programme was also agreed with <strong>the</strong> Santander Totta Bank <strong>to</strong> a maximum<br />
value of 20,000,000 Euro. This programme has a contract period of 3 years, and its reimbursement is made through half-yearly<br />
and consecutive amortisations <strong>to</strong> <strong>the</strong> value of 5,000,000 Euro, as of <strong>the</strong> 2nd year of <strong>the</strong> Programme. The current issue falls due on<br />
15 Oc<strong>to</strong>ber 2009. In June 2008, a Commercial Paper Programme was also agreed with <strong>the</strong> Caixa Geral de Depósi<strong>to</strong>s <strong>to</strong> a maximum<br />
value of 30,000,000 Euro. This programme has a contract period of 3 years with one year exemption period and <strong>the</strong> reimbursement<br />
is carried out through half-yearly amortisations <strong>to</strong> <strong>the</strong> value of 7,500,000 €. There are two simultaneous issues, one of 10,000,000<br />
€ which falls due on 21 April 2009 and ano<strong>the</strong>r <strong>to</strong> <strong>the</strong> value of 20.000.000 € which falls due on 2 February 2009. In August 2008 a<br />
Commercial paper programme was agreed upon with BPI <strong>to</strong> a maximum value of 15,000,000 Euro. The programme has a contract<br />
period of 6 months without renewal. The current issue falls due on 30 January 2009. In September 2008, a Commercial Paper<br />
Programme was also agreed with BARCLAYS <strong>to</strong> a maximum value of 10,000,000 Euro. This programme comprises <strong>Efacec</strong> Group<br />
2008 Consolidated and<br />
Individual Financial Statments
Companies and has period of 5 years with yearly renewals. <strong>Efacec</strong> Capital SGPS, SA carried out an issue for <strong>the</strong> <strong>to</strong>tal Programme<br />
that falls due on 8 April 2009. In Oc<strong>to</strong>ber 2008 a Commercial Paper Programme was agreed upon with <strong>the</strong> Espíri<strong>to</strong> San<strong>to</strong> Bank <strong>to</strong><br />
a maximum value of 30,000,000 Euro. This programme comprises <strong>Efacec</strong> Group Companies and has period of 5 years with yearly<br />
renewals. <strong>Efacec</strong> Capital SGPS, SA carried out an issue for <strong>the</strong> <strong>to</strong>tal Programme that falls due on 5 May 2009.<br />
Reimbursable subsidies<br />
These arise from contracts for investment projects fi nanced by European Union and Portuguese funds under <strong>the</strong> POE scheme. As at<br />
31 December 2008, this line included 4,069,163 Euro received from AICEP – Agência para o Investimen<strong>to</strong> e Comércio Externo de<br />
Portugal, by <strong>the</strong> subsidiary <strong>Efacec</strong> Energia between 2005 and 2008, pertaining <strong>to</strong> <strong>the</strong> three investment contracts. The reimbursement<br />
plans are half-yearly and go until 2015. The due part is less than a year away <strong>to</strong> <strong>the</strong> value of 659,622 Euro.<br />
Bank overdrafts<br />
Bank overdrafts involve <strong>the</strong> use of current credit accounts according <strong>to</strong> limits and conditions previously negotiated with fi nancial<br />
institutions and without defi ned reimbursement periods, although <strong>the</strong>y are assumed <strong>to</strong> be of short duration. The average rate of<br />
<strong>the</strong>se credits is indexed <strong>to</strong> Euribor plus an average spread of 0.96%.<br />
O<strong>the</strong>r loans<br />
The line O<strong>the</strong>r Non-Current Loans refers <strong>to</strong> a fi nancing operation celebrated with <strong>the</strong> Santander Totta Bank within <strong>the</strong> scope of <strong>the</strong><br />
MAIS Programme, for investment projects carried out by <strong>the</strong> company which can be assigned community funds.<br />
Debt Maturity<br />
The maturity dates of <strong>the</strong> loans as at 31 December 2008 are as follows:<br />
Non-current5<br />
Denomination of Loans<br />
< 1 year 1-5 years > 5 years Total<br />
Bank loans 0 20,802,328 0 20,802,328<br />
Commercial paper 0 77,500,000 0 77,500,00<br />
Reimbursable Subsidies 0 3,321,094 88,448 3,409,542<br />
O<strong>the</strong>r loans 0 2,792,928 0 2,792,928<br />
Total<br />
Current<br />
0 104,416,350 88,448 104,504,798<br />
Bank loans 34,631,407 0 0 34,631,407<br />
Commercial paper 13,404,339 0 0 13,404,339<br />
Bank overdrafts 87,500,00 0 0 87,500,00<br />
Reimbursable Subsidies 659,622 0 0 659,622<br />
O<strong>the</strong>r loans 0 0 0 0<br />
136,195,368 0 0 136,195,368<br />
Total loans 136,195,368 104,416,350 88,448 240,700,165<br />
The accounting value of Group loans is denominated in <strong>the</strong> following currencies:<br />
31.12.2008 31.12.2007<br />
Euro 229,264,998 105,532,281<br />
US Dollar 8,172,888 3,906,325<br />
New Metical 2,961,343 1,398,791<br />
Argentinian Peso 300,937 322,679<br />
30<br />
240,700,166 111,160,075<br />
Debt contracted by Group companies based in Portugal is wholly denominated in Euro. The o<strong>the</strong>r fi gures relate <strong>to</strong> fi nancing contracted<br />
locally by international companies.<br />
Effective interest rates<br />
The effective interest rates as at <strong>the</strong> balance sheet date were as follows:
31.12.2008 31.12.2007<br />
Bank overdrafts<br />
EUR 4.53% 4.91%<br />
USD 1.94% 13.23%<br />
MZN 15.05% 16.25%<br />
ARS 20.20% 13.94%<br />
Commercial paper<br />
EUR 5.45% 4.74%<br />
Medium/Long-Term Loans<br />
EUR 3.50% 4.92%<br />
USD 4.59%<br />
Reimbursable Subsidies<br />
EUR 3.67% 4.62%<br />
The above currencies correspond <strong>to</strong> those in which loans are denominated, and can vary from time <strong>to</strong> time from <strong>the</strong> indices used (in<br />
<strong>the</strong> case of <strong>the</strong> USD, in 2007).<br />
The fair value of current and non-current Debt <strong>to</strong> Credit Institutions is close <strong>to</strong> <strong>the</strong> balance sheet value due <strong>to</strong> <strong>the</strong> fact that <strong>the</strong><br />
contracted interest rate is <strong>the</strong> same as <strong>the</strong> market rate, given <strong>the</strong> fi nancing conditions in those countries in which <strong>Efacec</strong> operates.<br />
Interest rate risk<br />
During 2008, <strong>the</strong> net cash outfl ow of interest was 6,210 thousand Euro (Note 21).<br />
Due <strong>to</strong> <strong>the</strong> growth of <strong>the</strong> Group and accrued fi nancing needs, <strong>the</strong> gross fi nancial debt as at 31 December 2008 <strong>to</strong>talled 240,700<br />
thousand Euro. On <strong>the</strong> o<strong>the</strong>r hand, interest rates tended <strong>to</strong> rise until <strong>the</strong> end of <strong>the</strong> third quarter. As at 31 December 2008, <strong>the</strong><br />
overall rate of global EFACEC fi nancing increased <strong>to</strong> 5.17%% (compared <strong>to</strong> 4.81% in 2007), involving several currencies, countries<br />
and fi nancing methods. Statistically, as at 31 December 2008, this rate meant an annual gross cost of 12,437 thousand Euro. On<br />
<strong>the</strong> assumption that <strong>the</strong> value of debt as of that date will continue, <strong>the</strong> sensitivity <strong>to</strong> changes in interest rates can be calculated<br />
as follows:<br />
Tx Final Annual Cost Impact<br />
As at December 2008 EUR<br />
Reference fi gures (Base: 31.Dec.2008)<br />
Sensitivity<br />
5.17% 12,437,164<br />
-If fi nal rate increases 1% 6.17% 14,844,166 2,407,002<br />
-If fi nal rate decreases 1% 4.17% 10,030,163 -2,407,002<br />
As at December 2007 EUR<br />
Reference fi gures (Base: 31.Dec.2008)<br />
Sensitivity<br />
4.81% 5,341,447<br />
-If fi nal rate increases 1% 5.81% 6,453,037 1,111,590<br />
-If fi nal rate decreases 1% 3.81% 4,229,857 -1,111,590<br />
If <strong>the</strong>re were a worsening of <strong>the</strong> overall average rate of <strong>the</strong> Euro in 1%, <strong>the</strong> annual interest cost would be 14,844 thousand Euro. If<br />
on <strong>the</strong> o<strong>the</strong>r hand <strong>the</strong>re were a relief in overall interest rates of 1%, <strong>the</strong> annual interest rate cost would be 10,030 thousand Euro.<br />
The gross impact would be +/- 2,407 thousand Euro (+/- 1,112 thousand Euro in 2007). As pertains <strong>to</strong> <strong>the</strong> o<strong>the</strong>r currencies used<br />
in Group company fi nancing, <strong>the</strong> values are not <strong>to</strong>o relevant: for debt values at Balance date, <strong>the</strong> sensitivity <strong>to</strong> variations of <strong>the</strong><br />
USD was +/- 54 thousand Euro, and in <strong>the</strong> case of <strong>the</strong> Metical (Mozambique) it was +/- 29 thousand Euro. The Group manages<br />
<strong>the</strong> interest rate risk through derivatives contracted on its medium and long-term fi nancing, thus enabling <strong>the</strong> impact of interest<br />
changes <strong>to</strong> be mitigated (Note 2.1, 2.2 and 8).<br />
Unused Credit Lines<br />
The Group also has <strong>the</strong> following credit lines that have not yet been used:<br />
31<br />
2008 Consolidated and<br />
Individual Financial Statments
At variable rates<br />
32<br />
31.12.2008 31.12.2007<br />
Due within one year 13,876,047 35,109,890<br />
Due over one year 0 12,500,000<br />
13,876,047 47,609,890<br />
The credit lines due up <strong>to</strong> one year are au<strong>to</strong>matically renewed on an annual basis.<br />
The amount presented in 2007 due over 1 year referred <strong>to</strong> a Commercial Paper Programme agreed upon at <strong>the</strong> end of <strong>the</strong> year,<br />
whose issues effectively occurred in 2008.<br />
16. Deferred taxes<br />
The deferred tax assets and liabilities are as follows:<br />
31.12.2008 31.12.2007<br />
Deferred tax assets:<br />
Deferred tax assets recoverable after 12 months 10,445,617 4,243,415<br />
Deferred tax assets recoverable within 12 months 0 0<br />
Deferred tax liabilities:<br />
10,445,617 4,243,415<br />
Deferred tax liabilities recoverable after 12 months 5,691,747 6,342,351<br />
Deferred tax liabilities recoverable within 12 months 0 0<br />
5,691,747 6,342,351<br />
4,753,80 -2,098,936<br />
Deferred tax assets<br />
Deferred tax assets were split as follows:<br />
Impairment<br />
losses<br />
invest-<br />
Impairment<br />
losses<br />
works<br />
Impairment<br />
losses<br />
receivables/o<strong>the</strong>r<br />
Tax losses Options<br />
Adjust.<br />
IFRS<br />
O<strong>the</strong>r Total<br />
As at 01.01.2007 564,025 519,934 2,296,580 42,607 53,963 48,124 1,634,031 5,159,264<br />
Carried <strong>to</strong> profi t and loss -295 -90,852 189,111 -40,608 144,534 5,728 -1,067,994 -860,376<br />
Entries <strong>to</strong> consolidation perim- 0 0 0 0 0 125,086 0 125,086<br />
Exchange rate differences 0 0 0 0 0 -13,179 0 -13,179<br />
Carried <strong>to</strong> equity 0 0 0 0 -167,379 0 0 -167,379<br />
Exits from <strong>the</strong> consolidation 0 0 0 0 0 0 0 0<br />
O<strong>the</strong>r variations -41,411 -130,175 171,389 0 0 -13,452 13,649 0<br />
As at 31.12.2007 522,319 298,907 2,657,080 1,999 31,118 152,307 579,686 4,243,415<br />
Carried <strong>to</strong> profi t and loss 0 238,500 -20,113 423,494 1,536,523 -2,209 2,026,802 4,202,997<br />
Entries <strong>to</strong> consolidation perim- 0 0 0 0 0 0 7,469 7,469<br />
Exchange rate differences 0 0 0 59,408 0 -154 -810 58,444<br />
Carried <strong>to</strong> equity 0 0 0 0 1,500,682 0 0 1,500,682<br />
Exits from <strong>the</strong> consolidation 0 0 0 0 0 0 0 0<br />
O<strong>the</strong>r variations 0 0 0 585,763 0 -149,779 -3,374 432,610<br />
As at 31.12.2008 522,319 537,407 2,636,967 1,070,663 3,068,323 165 2,609,773 10,445,617<br />
The deferred tax assets for impairment losses will be carried <strong>to</strong> profi t and loss proportionately <strong>to</strong> <strong>the</strong> use of <strong>the</strong> related provisions.<br />
The deferred tax assets concerning impairment losses for investments are for shareholdings in Liaoyang EFACEC Electric Equipment<br />
Co Ltd (Note 6) and in Portugal Space (Note 7). The deferred tax asset for tax losses refers mainly <strong>to</strong> <strong>the</strong> subsidiary Advanced<br />
Control Systems, a company acquired by <strong>the</strong> Group in 2007. Deferred tax assets on tax losses are recognised depending on <strong>the</strong><br />
probability of taking advantage of <strong>the</strong> related tax benefi t through future taxable profi ts. The line "O<strong>the</strong>rs" includes deferred tax<br />
assets pertaining <strong>to</strong> <strong>the</strong> tax benefi ts for research and development (within <strong>the</strong> scope of SIFIDE) carried on <strong>to</strong> <strong>the</strong> value of 2,114<br />
thousand Euro.
Deferred tax liabilities<br />
The line Deferred Tax Liabilities is made up as follows:<br />
Revaluation (Note 1.5) Options (Note 8) O<strong>the</strong>r Total<br />
As at 01.01.2007 5,558,475 578,987 831,016 6,968,478<br />
Carried <strong>to</strong> profi t and loss -204,693 59,673 -215,767 -360,786<br />
Entries <strong>to</strong> consolidation perimeter 0 0 0 0<br />
Exchange rate differences 0 0 0 0<br />
Carried <strong>to</strong> equity 0 -265,340 0 -265,340<br />
Exits from <strong>the</strong> consolidation perimeter 0 0 0 0<br />
As at 31.12.2007 5,353,781 373,320 615,249 6,342,351<br />
Carried <strong>to</strong> profi t and loss -208,737 -79,320 -174,580 -462,637<br />
Entries <strong>to</strong> consolidation perimeter 0 0 6,530 6,530<br />
Exchange rate differences 0 0 -733 -733<br />
Carried <strong>to</strong> equity 104,200 -294,000 0 -189,800<br />
Exits from <strong>the</strong> consolidation perimeter 0 0 0 0<br />
O<strong>the</strong>r variations 0 0 -3,963 -3,963<br />
As at 31.12.2008 5,249,244 0 442,503 5,691,747<br />
The amount for revaluation of tangible assets refers <strong>to</strong> a free revaluation done in 2005, and is carried <strong>to</strong> profi t and loss through<br />
annual depreciation; <strong>the</strong> amount booked <strong>to</strong> shareholders’ funds refers <strong>to</strong> <strong>the</strong> line “Land” that was subject <strong>to</strong> revaluation at <strong>the</strong> end<br />
of 2008 (Note 4.2), entering <strong>the</strong> respective deferred tax liabilities.<br />
The line "O<strong>the</strong>rs" relates mainly <strong>to</strong> deferred tax liabilities concerning ATM and BCI maintenance contracts <strong>to</strong>talling 440,669 Euro.<br />
17. Provisions for risks and charges<br />
Pensions<br />
Financial shareholdings<br />
33<br />
O<strong>the</strong>r risks and<br />
charges<br />
As at 01.01.2007<br />
Carried <strong>to</strong> profi t and loss:<br />
534,003 661,018 5,838,348 7,033,369<br />
- Additional provisions 123,581 0 3,045,028 3,168,609<br />
- Reversal of provisions -59,324 0 -2,469,667 -2,528,991<br />
Variations in <strong>the</strong> consolidation perimeter 0 -661,018 0 -661,018<br />
Exchange rate differences 0 0 -7,871 -7,871<br />
As at 31.12.2007 598,260 0 6,405,837 7,004,097<br />
Carried <strong>to</strong> profi t and loss:<br />
- Additional provisions 96,534 0 3,167,288 3,263,821<br />
- Reversal of provisions -63,764 0 -1,376,719 -1,440,483<br />
Variations in <strong>the</strong> consolidation perimeter 0 0 24,531 24,531<br />
Exchange rate differences 0 0 -7,648 -7,648<br />
O<strong>the</strong>r variations 0 0 -139,274 -139,274<br />
As at 31.12.2008 631,030 0 8,074,015 8,705,045<br />
There is no environmental contingent liability.<br />
O<strong>the</strong>r risks and charges<br />
This line includes mainly provisions for amounts <strong>to</strong> receive from insurance companies, penalties, repairs and negative variances<br />
on works in progress. The additional provisions of <strong>the</strong> period mainly relate <strong>to</strong> variances on work projects in <strong>the</strong> subsidiaries <strong>Efacec</strong><br />
Energia and <strong>Efacec</strong> Ambiente.<br />
These amounts relate <strong>to</strong> situations which are being constantly analysed by <strong>the</strong> management of <strong>the</strong> various companies as <strong>to</strong><br />
EFACEC’s responsibility <strong>to</strong> cus<strong>to</strong>mers, and where an unfavourable outcome seems likely during <strong>the</strong> accounting period.<br />
Over <strong>the</strong> last few fi nancial years, <strong>the</strong> Group has incurred costs of after sales service and maintenance. These costs have been<br />
analysed, and if <strong>the</strong>y are signifi cant, have been subject <strong>to</strong> provisions being set up for future losses.In this way <strong>the</strong> future potential<br />
commitments of <strong>the</strong> Group are appropriately presented.<br />
Total<br />
2008 Consolidated and<br />
Individual Financial Statments
The amount shown as a reduction in provisions corresponds <strong>to</strong> <strong>the</strong> amount reversed out of <strong>the</strong> provision account as <strong>the</strong> related<br />
costs are recognised, or when <strong>the</strong> situation for which <strong>the</strong> provisions was set up, no longer exists.<br />
18. Deferred income<br />
31.12.2008 31.12.2007<br />
Investment subsidies 2,356,446 1,722,010<br />
Deferred invoicing 142,318,420 91,199,315<br />
O<strong>the</strong>r 1,596,367 1,571,711<br />
34<br />
146,271,233 94,493,036<br />
The timetable of invoicing <strong>to</strong> cus<strong>to</strong>mers is not strictly tied <strong>to</strong> <strong>the</strong> degree of completion of <strong>the</strong> related orders. The line Deferred<br />
Invoicing thus includes invoices issued but not yet recognized in terms of <strong>the</strong> stage of completion of <strong>the</strong> orders (<strong>Notes</strong> 1.10 and<br />
29).<br />
19. Minority Interests<br />
As at 31 December 2008 and 31 December 2007, <strong>the</strong> breakdown of minority interests was as follows:<br />
Min. Int.% 31.12.2008 31.12.2007<br />
<strong>Efacec</strong> Serviços de Manutenção e Assistência, S.A. 19.9 1,971,068 1,732,184<br />
<strong>Efacec</strong> Investimen<strong>to</strong>s e Concessões SGPS, S.A. 25.0 70,630 75,301<br />
<strong>Efacec</strong> International Financing SGPS, S.A. 45.0 578,215 571,874<br />
Bauen <strong>Efacec</strong>, S.A. 23.3 392,381 279,311<br />
<strong>Efacec</strong> Energy Service, Lda. 33.3 378,187 238,409<br />
<strong>Efacec</strong> Contracting Central Europe Gmbh 15.0 -47,238 0<br />
SVEP 8.0 30,609 27,522<br />
O<strong>the</strong>r 12,596 12,335<br />
3,386,358 2,936,936<br />
E. <strong>Notes</strong> <strong>to</strong> <strong>the</strong> Profit and Loss Account by nature for <strong>the</strong> years ended 31 December<br />
2008 and 31 December 2007<br />
20. Third Party Supplies and Services<br />
During <strong>the</strong> years ended 31 December 2008 and 31 December 2007, <strong>the</strong> main third party supplies and services were as follows:<br />
31.12.2008 31.12.2007<br />
Subcontracts 65,852,448 64,376,875<br />
Specialised work 33,792,963 25,291,042<br />
Goods transport 12,726,385 8,065,182<br />
Travel expenses and Accommodation 11,294,161 8,698,572<br />
Leasing and rentals 7,189,205 4,912,026<br />
Repairs and maintenance 4,452,308 3,841,323<br />
Tools and utensils for quick rescue 3,248,937 2,498,360<br />
Fuel 3,037,604 1,435,690<br />
Insurance 2,940,851 2,457,174<br />
Advertising and publicity 2,183,621 1,964,027<br />
Communications 2,173,558 1,769,132<br />
Electricity 2,158,399 1,223,658<br />
Fees 1,937,651 1,058,324<br />
Cleaning, Hygiene and Comfort 1,004,880 971,171<br />
O<strong>the</strong>r supplies and services 11,150,992 6,449,736<br />
165,143,963 135,012,292<br />
Given <strong>the</strong> business activity of <strong>the</strong> group, <strong>the</strong>re are no variances that merit special comment. Some signifi cant increase in percentage<br />
refl ects and accompany <strong>the</strong> Group's business growth.
21. Financial costs - net<br />
22. Income Tax<br />
31.12.2008 31.12.2007<br />
Interest payable:<br />
Bank loans (Note 15) 6,622,123 4,291,270<br />
35<br />
6,622,337 4,291,270<br />
Net foreign exchange gains /losses<br />
Gains/losses of fair value on fi nancial instruments:<br />
Transfer from Shareholders’ funds (Note 8):<br />
6,381,337 -57,834<br />
Foreign exchange options: Cash fl ow hedging 680,293 344,278<br />
O<strong>the</strong>r 679,641 287,869<br />
14,363,394 4,865,583<br />
31.12.2008 31.12.2007<br />
Current tax 10,367,592 3,540,141<br />
Deferred tax (note 16) -4,665,634 499,589<br />
Tax estimate 5,701,958 4,039,730<br />
Tax from previous years 465,996 -102,658<br />
The reconciliation of <strong>consolidated</strong> corporation tax is as follows:<br />
23. Profit per share<br />
6,167,954 3,937,072<br />
31,12,2008 31,12,2007<br />
Profi ts before Tax 30,892,576 21,685,135<br />
Tax rate 26.50% 26.50%<br />
Tax at rate of 26.5% 8,186,533 5,746,561<br />
Tax rate difference of foreign subsidiaries<br />
Permanent differences<br />
1,331,414 -32,127<br />
Costs not accepted fi scally 814,865 462,051<br />
Income not subject <strong>to</strong> tax<br />
Impairment losses of cus<strong>to</strong>mers<br />
-425,632 141,842<br />
Consolidation adjustments -166,842 -287,816<br />
Deducted R&D tax credit not deferred in 2007 -1,945,473 -1,924,250<br />
R&D tax credit <strong>to</strong> carry -2,113,991 0<br />
O<strong>the</strong>r 21,084 -66,530<br />
Income tax for <strong>the</strong> period 5,701,958 4,039,730<br />
Effective tax rate 18.46% 18.63%<br />
Basic<br />
The basic profi t per share is calculated by dividing shareholders’ profi t by <strong>the</strong> average weighted number of ordinary shares issued<br />
during <strong>the</strong> year, excluding possible own shares acquired by <strong>the</strong> company (Note 13).<br />
31.12.2008 31.12.2007<br />
Profi t attributable <strong>to</strong> shareholders 24,136,981 17,401,185<br />
Average weighted number of ordinary shares issued 41,641,416 41,641,416<br />
Basic profi t per share (euro per share) 0.58 0.42<br />
Diluted<br />
The diluted profi t per share is calculated adjusting <strong>the</strong> average weighted number of shares in circulation by including <strong>the</strong> impact<br />
of <strong>the</strong> conversion of all potentially diluting ordinary shares. In view of <strong>the</strong> fact that <strong>the</strong>re are nei<strong>the</strong>r options nor any convertible<br />
obligation on shares, <strong>the</strong> diluted profi t per share is equal <strong>to</strong> <strong>the</strong> basic profi t per share.<br />
2008 Consolidated and<br />
Individual Financial Statments
24. Dividends per share<br />
The dividend distribution of <strong>Efacec</strong> Capital SGPS, for 2008 and 2007, including anticipated distributions of profi t was as follows:<br />
Dividends paid<br />
36<br />
31.12.2008 31.12.2007<br />
Pertaining <strong>to</strong> fi nancial year 2006 7,537,096<br />
Pertaining <strong>to</strong> fi nancial year 2007 13,221,000 12,216,00<br />
Pertaining <strong>to</strong> fi nancial year 2008 6,034,000<br />
Total 19,255,000 19,753,096<br />
Average weighted number of ordinary shares issued 41,641,416 41,641,416<br />
Dividends per share (euro per share) 0.46 0.47<br />
The amount of dividends for minorities was 225,642 Euro (163,674 Euro in 2007), of which 218,842 Euro pertain <strong>to</strong> <strong>the</strong> subsidiary<br />
<strong>Efacec</strong> Serviços de Manutenção e Assistência, SA and 6,800 Euro were paid by SVEP – Segurança e Vigilância Electrónica de<br />
Pessoas, Lda.
F. O<strong>the</strong>r notes<br />
25. Contingencies<br />
The Group has contingent liabilities for bank guarantees and o<strong>the</strong>r contingencies related <strong>to</strong> its business. It is not believed that any<br />
signifi cant liabilities will arise from <strong>the</strong> contingent liabilities.<br />
37<br />
31.12.2008 31.12.2007<br />
Bank bills and o<strong>the</strong>r discounted securities 59,212 289,697<br />
Guarantees and performance bonds 377,143,814 217,140,025<br />
377,203,026 217,429,722<br />
Bank guarantees are nearly <strong>to</strong>tally connected <strong>to</strong> projects and orders in which <strong>the</strong> Group is involved and <strong>the</strong> cus<strong>to</strong>mers feature as<br />
benefi ciaries. The solid increase noted refl ects <strong>the</strong> growth of <strong>the</strong> commercial portfolio with special focus on <strong>the</strong> South American<br />
countries.<br />
26. Commitments<br />
26.1 Commitments for investments<br />
No materially relevant commitments made by <strong>the</strong> Group exist <strong>to</strong> acquire tangible or intangible fi xed assets.<br />
26.2 Commitments for operational leases, where <strong>the</strong> Group is lessee<br />
The Group leases a number of vehicles through irrevocable leasing contracts. The contracts have various lease periods, readjustment<br />
clauses and renewal rights. At <strong>the</strong> date of <strong>the</strong> Balance Sheet, <strong>the</strong> Group continued <strong>to</strong> have Long-Term Rental contracts<br />
(“renting”) considered as operational leases, for which future rental payments due <strong>to</strong>talled 4,010,182 Euro, with <strong>the</strong> following<br />
maturity dates:<br />
31.12.2008 31.12.2007<br />
Within 1 year 1,662,906 1,580,054<br />
Between 1 and 5 years 2,246,624 2,322,998<br />
Over 5 years 0 0<br />
27. Related party transactions/balances<br />
3,909,530 3,903,052<br />
The scope of this note concerns <strong>the</strong> disclosure of transactions that <strong>to</strong>ok place during <strong>the</strong> period under consideration, and debit and<br />
credit balances between <strong>the</strong> <strong>Efacec</strong> Group and entities which can be considered as related parties, taking in<strong>to</strong> consideration <strong>the</strong><br />
decision making infl uence involved. Related parties are unders<strong>to</strong>od as Associated companies, Shareholders and Board Direc<strong>to</strong>rs.<br />
Transactions and balances between Group companies which were eliminated on consolidation, are not disclosed.<br />
Those entities which have a over 20% of qualifi ed shareholding in <strong>the</strong> Group are:<br />
- <strong>Efacec</strong> Sistemas de Gestão, S.A 49.2%<br />
- Grupo José de Mello 25.4%<br />
- Grupo Têxtil Manuel Gonçalves 25.4%<br />
2008 Consolidated and<br />
Individual Financial Statments
27.1 Transactions in 2008 and 2007<br />
31.12.2008 31.12.2007<br />
Financial transactions<br />
Associated companies<br />
Supplementary services 0 71,871<br />
Loans granted 0 35,871<br />
Loans received 0 0<br />
Dividends received<br />
Shareholders<br />
725,105 818,685<br />
Loans granted 0 -1,070,000<br />
Loans received 1,195,000 7,100,000<br />
Dividends paid<br />
O<strong>the</strong>r entities<br />
19,255,000 19,753,096<br />
Loans granted 0 -108,073<br />
Loans received 0 0<br />
Dividends paid 225,642 163,674<br />
Current transactions<br />
Associated companies<br />
-17,560,537 -10,927,755<br />
Operational income and gains 1,851,448 2,127,887<br />
Operational costs and losses 323,902 383<br />
Financial income and gains 89,551 80,976<br />
Financial costs and losses 0 0<br />
Shareholders<br />
Operational income and gains 1,235,545 227,574<br />
Operational costs and losses 10,546,860 10,393,092<br />
Financial income and gains 0 0<br />
Financial costs and losses 358,558 52,079<br />
38<br />
-8,052,777 -8,009,117<br />
The commercial conditions under which <strong>the</strong>se transactions and services <strong>to</strong>ok place were under <strong>the</strong> same conditions for independent<br />
third parties.<br />
Received dividends refer essentially <strong>to</strong> <strong>the</strong> associate company S2M – Sociedade de Manutenção de Metropolitanos, SA (689,300 Euro<br />
in 2008 and 818,685 Euro in 2007). <strong>Efacec</strong> Sistemas de Gestão, in addition <strong>to</strong> being <strong>the</strong> main shareholder, also includes <strong>the</strong> <strong>Efacec</strong><br />
Group shared services unit, which means that it has <strong>the</strong> role of a service provider <strong>to</strong> all Group companies.<br />
Therefore, <strong>the</strong> Group presents operational costs <strong>to</strong> <strong>the</strong> value of 10,546,860 Euro (in 2007 <strong>the</strong>se services represented 10,392,994<br />
Euro).<br />
The value of Loans made and received also refers <strong>to</strong> <strong>Efacec</strong> Sistemas de Gestão, S.A.
27.2 Final balances resulting from commercial transactions<br />
31.12.2008 31.12.2007<br />
Debts owed by related parties<br />
Associated companies<br />
Loans granted 901,765 901,765<br />
Cus<strong>to</strong>mers and income accruals (note 9) 494,586 1,008,932<br />
O<strong>the</strong>rs deb<strong>to</strong>rs and deferred costs (note 10)<br />
Shareholders<br />
695,563 633,265<br />
Loans granted 0 0<br />
Cus<strong>to</strong>mers and income accruals (note 9) 24,643 44,379<br />
O<strong>the</strong>rs deb<strong>to</strong>rs and deferred costs (note 10)<br />
O<strong>the</strong>r entities<br />
357,522 545,372<br />
Loans granted 0 0<br />
O<strong>the</strong>rs deb<strong>to</strong>rs and deferred costs (note 10) 173,803 0<br />
Debt <strong>to</strong> related parties<br />
Associated companies<br />
2,647,882 3,133,712<br />
Loans received 0 0<br />
Suppliers (note 14) 235,059 383<br />
O<strong>the</strong>r Credi<strong>to</strong>rs (note 14) 0 44,536<br />
Shareholders<br />
Loans received 8,295,000 7,100,000<br />
Suppliers (note 14) 2,640,711 2,100,998<br />
O<strong>the</strong>r credi<strong>to</strong>rs (note 14)<br />
O<strong>the</strong>r entities<br />
1,018,678 835,282<br />
Loans received 0 0<br />
O<strong>the</strong>r credi<strong>to</strong>rs (note 14) 122,678 0<br />
39<br />
12,402,127 10,081,199<br />
Loans <strong>to</strong> associated companies refer <strong>to</strong> Águas da Figueira, SA. Pertaining <strong>to</strong> obtained loans, on 31 December 2008 <strong>the</strong> Group featured<br />
a loan of 8,295,000 Euro of its main shareholder EFACEC Sistemas de Gestão, S.A. Debt <strong>to</strong> shareholders refers essentially <strong>to</strong> <strong>Efacec</strong><br />
Sistemas de Gestão, SA., both in <strong>the</strong> line Suppliers and in O<strong>the</strong>r Credi<strong>to</strong>rs and it pertains <strong>to</strong> agreed shared services with said entity.<br />
27.3 Detail by entity of balances with related parties<br />
The amounts of Group assets and liabilities, which refer <strong>to</strong> related parties, can be broken down in<strong>to</strong> <strong>the</strong> following entities:<br />
2008 Consolidated and<br />
Individual Financial Statments
31.12.2008 31.12.2007<br />
Associated companies<br />
Águas da Figueira - Loans 901,765 901,765<br />
Águas da Figueira - Current 558,862 775,559<br />
O&M Serviços - Current 398,604 458,636<br />
S2M – Soc. Metropolitan Maintenance - Current 90,110 225,261<br />
Liaoyang <strong>Efacec</strong> Electrical Equipment - Current 4,805,449 4,807,949<br />
O<strong>the</strong>r -319,187 -1,379<br />
6,435,602 7,167,791<br />
Impairment -4,668,748 -4,668,748<br />
Shareholders<br />
1,766,854 2,499,043<br />
<strong>Efacec</strong> Sistemas de Gestão - Loans -8,295,000 -7,100,000<br />
<strong>Efacec</strong> Sistemas de Gestão - Current -2,987,994 -2,068,796<br />
Têxtil Manuel Gonçalves - Current 22,153 3,131<br />
O<strong>the</strong>r -311,384 -280,864<br />
O<strong>the</strong>r entities<br />
-11,572,225 -9,446,529<br />
Various 51,126 0<br />
The impairment booked relates <strong>to</strong> <strong>the</strong> debt owed by Liaoyang <strong>Efacec</strong> Electrical Equipment.<br />
27.4 Commitments and contingencies<br />
There are no purchase commitments or contingent liabilities pertaining <strong>to</strong> related parties.<br />
27.5 Remuneration of <strong>the</strong> Board of Direc<strong>to</strong>rs<br />
40<br />
51,126 0<br />
31.12.2008 31.12.2007<br />
Remunerations 2,770,446 1,906,063<br />
Life insurances / Pension Plans 156,354 88,060<br />
Allowances 5,646 25,838<br />
28. Interests in joint ventures<br />
2,932,446 2,019,961<br />
The Group has various shareholdings in joint ventures, ACE's (Note 31), which mainly supply services <strong>to</strong> <strong>the</strong> Engineering,<br />
Maintenance, Environment and Transport areas. The following amounts represent <strong>the</strong> shares of <strong>the</strong> Group of <strong>the</strong> assets and liabilities,<br />
sales and profi ts/losses of <strong>the</strong> joint ventures and are included in <strong>the</strong> fi nancial <strong>statements</strong>:<br />
In 2008, strong growth in earnings and in current assets and liabilities turnover was registered, resulting in <strong>the</strong> participation<br />
of <strong>Efacec</strong> in 2 large projects for <strong>the</strong> construction of electric plants in Brazil which are being developed by MABE Construção e<br />
Administração de Proje<strong>to</strong>s, Ltda., <strong>the</strong> entity in which <strong>the</strong> Group holds a 26.5% share.<br />
31.12.2008 31.12.2007<br />
Assets<br />
Non-current assets 60,813 74,747<br />
Current assets 66,528,914 4,223,759<br />
66,538,914 4,298,506<br />
Liabilities<br />
Non-current liabilities 119,037 120,356<br />
Current liabilities 62,675,494 3,664,247<br />
62,794,531 3,784,603<br />
Shareholders’ Funds 3,795,195 513,903<br />
Income 59,768,718 7,894,728<br />
Costs 55,499,784 7,737,153<br />
Profi t after tax 4,268,934 157,575
There are no contingent liabilities for <strong>the</strong> shareholdings of <strong>the</strong> Group in ACEs (joint ventures),likewise, <strong>the</strong> joint ventures do not<br />
have contingent liabilities.<br />
29. Multi-year contracts<br />
Amounts relating <strong>to</strong> multi-year contracts for <strong>the</strong> year ended 31 December 2008 were as follows:<br />
41<br />
<strong>Notes</strong> 31.12.2008 31.12.2007<br />
Income recognised in <strong>the</strong> period (closed and open contracts) 29.1 441,284,778 277,156,087<br />
Multi-Year Contracts still open as at 31 Dec. 2008<br />
Accumulated costs incurred <strong>to</strong> date (a) 1,079,477,534 744,245,214<br />
Margins recognised <strong>to</strong> date (a) 200,609,995 140,897,511<br />
Inven<strong>to</strong>ry in progress 29.2 9,590,454 8,096,899<br />
Income accruals 29.2 89,828,258 57,936,793<br />
Deferred income 29.2 130,362,696 51,423,942<br />
a) Non <strong>consolidated</strong> values, including those for previous fi nancial years for multi-year contracts still open as at 31.12.08.<br />
29.1 The reconciliation of <strong>the</strong> amount shown in <strong>the</strong> line Income recognised in <strong>the</strong> year concerning multi-year contracts closed or<br />
still open with <strong>the</strong> <strong>to</strong>tal of sales and services rendered, can be shown as follows:<br />
31.12.2008 31.12.2007<br />
Income recognised concerning multi-year contracts (note 1.10) 411,284,778 277,156,087<br />
Income relating <strong>to</strong> standard manufactured products 63,084,398 46,340,012<br />
Income relating <strong>to</strong> maintenance and assistance services 88,599,156 70,673,766<br />
O<strong>the</strong>r income 43,248,172 46,153,236<br />
Total <strong>consolidated</strong> sales and services 606,216,504 440,323,101<br />
29.2 Multi-year contracts for s<strong>to</strong>cks relate <strong>to</strong> costs incurred, which has not yet been used in a construction work or installation,<br />
and thus <strong>the</strong> margin resulting <strong>the</strong>reof has not been recognised yet.<br />
The accrued income represents situations in which <strong>the</strong> stage of invoicing is less than <strong>the</strong> stage of completion of <strong>the</strong> project involved,<br />
so an increase is made <strong>to</strong> recognize <strong>the</strong> respective margin. This situation involves a debit <strong>to</strong> <strong>the</strong> cus<strong>to</strong>mer for <strong>the</strong> work/<br />
installation already carried out (Note 9 – Accrued Income). When <strong>the</strong> opposite situation occurs, when <strong>the</strong> level of invoicing is<br />
greater than that of completion, <strong>the</strong>re is deferred income, which represent a credit of <strong>the</strong> cus<strong>to</strong>mer in relation <strong>to</strong> <strong>the</strong> project being<br />
worked on (Note 18 – Deferred Invoicing), <strong>the</strong> value of which will only be recognised in future years.<br />
2008 Consolidated and<br />
Individual Financial Statments
G. List of companies <strong>consolidated</strong><br />
30. Consolidation perimeter<br />
30.1 Companies included in consolidation<br />
Companies included in <strong>the</strong> consolidation, <strong>the</strong>ir registered offi ces, <strong>the</strong> shareholding held by EFACEC Capital SGPS, directly or indirectly,<br />
and <strong>the</strong> method of consolidation are as follows:<br />
Portuguese companies<br />
Company name Headquarters % Control Consol. Method<br />
<strong>Efacec</strong> Capital, SGPS, S.A. Ma<strong>to</strong>sinhos H INT<br />
<strong>Efacec</strong> Investimen<strong>to</strong>s e Concessões, SGPS, S.A. (a) Oeiras 75,0 INT<br />
<strong>Efacec</strong> International Financing, SGPS, S.A. (b) Ma<strong>to</strong>sinhos 55.0 INT<br />
<strong>Efacec</strong> Energia, Máquinas e Equipamen<strong>to</strong>s Eléctricos, S.A. (c) Ma<strong>to</strong>sinhos 100.0 INT<br />
<strong>Efacec</strong> Engenharia, S.A. Maia 100.0 INT<br />
<strong>Efacec</strong> Ambiente, S.A. Maia 100.0 INT<br />
<strong>Efacec</strong> Serviços de Manutenção e Assistência, S.A. Ma<strong>to</strong>sinhos 80.11 INT<br />
ATM – Assistência Total em Manutenção, S.A. Barreiro 100.0 INT<br />
BCI – BRISA Conservação de Infra-estruturas, S.A. Cascais 100.0 INT<br />
<strong>Efacec</strong> Sistemas de Electrónica, S.A. (d) Maia 100.0 INT<br />
<strong>Efacec</strong> Au<strong>to</strong>mação e Robótica, S.A. Maia 100.0 INT<br />
<strong>Efacec</strong> Marketing Internacional, S.A. Maia 100,0 INT<br />
GEMP – Empreendimen<strong>to</strong>s Imobiliários, S.A. Ma<strong>to</strong>sinhos 100.0 INT<br />
Empovar, S.A. Ma<strong>to</strong>sinhos 100.0 INT<br />
SVEP – Segurança e Vigilância Electrónica de Pessoas, Lda. Oeiras 92.0 INT<br />
S2M – Sociedade de Manutenção de Metropolitanos (Install. Fixas), S.A. Ma<strong>to</strong>sinhos 40.0 MEP<br />
O&M Serviços – Operação e Manutenção Industrial, S.A. Mortágua 40.0 MEP<br />
EID – Empresa de Investigação e Desenvolvimen<strong>to</strong> de Electrónica, S.A. Lisbon 25.0 MEP<br />
Águas da Figueira, S.A. (e) Figueira da Foz 20.0 MEP<br />
SMA - Serv. Manut. Centrais Termoeléctricas, ACE Oeiras 100.0 PRO<br />
SPORTSER - Serv. Manut. Electromecânica, ACE Oeiras 90.0 PRO<br />
OMAP - Operação e Manut. do Sec<strong>to</strong>r de Adubos, ACE Oeiras 90.0 PRO<br />
SMIQ - Serv. Manut. da Indústria Química, ACE Oeiras 60.0 PRO<br />
ASIQUIM - Assist. e Serviços p/ Indústria Química, ACE Estarreja 50.0 PRO<br />
Etarlima - Tratamen<strong>to</strong> de Efl uentes, ACE Viana do Castelo 50.0 PRO<br />
Ecobarcelos - Tratamen<strong>to</strong> de Efl uentes, ACE Barcelos 49.0 PRO<br />
Siemens, Setal, Dégremont e <strong>Efacec</strong> - Serv. Manut., ACE Amadora 33.0 PRO<br />
Siemens e <strong>Efacec</strong>, ACE Amadora 5.0 PRO<br />
MCT - Manut. em Centrais Térmicas ACE Oeiras 90.0 PRO<br />
Etarlis, ACE Leiria 50.0 PRO<br />
<strong>Efacec</strong> Omnistal, ACE Maia 50.0 PRO<br />
EME2 - Engenharia, Manutenção e Serviços, ACE Lisbon 40.0 PRO<br />
42
Foreign companies<br />
Company name Headquarters % Control Consol. Method<br />
Sou<strong>the</strong>rn Africa<br />
<strong>Efacec</strong> Angola, Lda. Luanda / Angola 100.0 INT<br />
<strong>Efacec</strong> Moçambique, Lda.<br />
Latin America<br />
Mapu<strong>to</strong> / Mozambique 100.0 INT<br />
<strong>Efacec</strong> do Brasil, Lda. S.Paulo / Brazil 100.0 INT<br />
BAUEN <strong>Efacec</strong>, S.A. Córdoba / Argentina 76.67 INT<br />
BAUEN <strong>Efacec</strong> Chile, S.A. Santiago / Chile 96.92 INT<br />
<strong>Efacec</strong> Energy Service, Ltda. Recife / Brazil 66.67 INT<br />
MABE Construção e Administração de Projec<strong>to</strong>s, Ltda. Fortaleza / Brazil 26.50 PRO<br />
Comercializadora de Equipos y Materiales MABE Limitada<br />
Spain<br />
Santiago / Chile 26.50 PRO<br />
<strong>Efacec</strong> Sistemas España, SL Madrid / Spain 100.0 INT<br />
Aura de Guijo de Coria, SL Toledo / Spain 100.0 INT<br />
Aura de Agudo, SL Toledo / Spain 100.0 INT<br />
<strong>Efacec</strong> Ikusi UTE<br />
United States<br />
Tenerife / Spain 50.00 PRO<br />
<strong>Efacec</strong> Florida, Inc. Atlanta / USA 100.0 INT<br />
<strong>Efacec</strong> Power Transformers Inc. Atlanta / USA 100.0 INT<br />
Advanced Control Systems, Inc.<br />
Europe<br />
Atlanta / USA 99.56 INT<br />
<strong>Efacec</strong> Praha, s.r.o. Prague / Czech Republic 100.0 INT<br />
<strong>Efacec</strong> Central Europe Limited, SRL Bucharest, Romania 100.0 INT<br />
<strong>Efacec</strong> Contracting Central Europe GmbH<br />
India<br />
Vienna / Austria 85.00 INT<br />
C&S <strong>Efacec</strong> MV India Pvt. Ltd. New Delhi / India 50.00 PRO<br />
<strong>Efacec</strong> C&S MV Components Pvt. Ltd. New Delhi / India 70.00 INT<br />
GODREJ <strong>Efacec</strong> Au<strong>to</strong>mation and Robotics, Ltd.<br />
Maghreb<br />
Mumbai / India 50.00 PRO<br />
<strong>Efacec</strong> Algérie, EURL<br />
The Rest of <strong>the</strong> World<br />
Algiers / Algeria 100.0 INT<br />
<strong>Efacec</strong> Singapore Pte Ltd Singapore 100.0 INT<br />
<strong>Efacec</strong> Asia-Pacifi c, Ltd. Macao 100.0 INT<br />
<strong>Efacec</strong> Malaysia Sdn.Bhd. (f) Kuching / Malaysia 61.00 INT<br />
SESCO <strong>Efacec</strong> Sdn.Bhd. (g) Kuching / Malaysia 35.20 MEP<br />
LEEEC - Liaoyang <strong>Efacec</strong> Electrical Equipment Co. Ltd. Ltd. Liaoyang / China 36.28 MEP<br />
<strong>Efacec</strong> Sistemas Venezuela, CA Caracas, Venezuela 65.00 INT<br />
Caption:<br />
INT – Integral Method of consolidation;<br />
MEP – Equity Method of consolidation;<br />
PRO – Proportional Method of consolidation;<br />
(a) This company was set up with <strong>the</strong> purpose of managing social holdings as an indirect way of carrying out economic activities<br />
and could also render administrative and management services as defi ned by law, namely <strong>the</strong> follow-up of concessions. The remaining<br />
25% of this company is owned by Caixa Investimen<strong>to</strong>s – Sociedade de Investimen<strong>to</strong>s, S.A.<br />
(b) This company was set up in 1999 in a partnership between <strong>Efacec</strong> and IPE, whose goal was <strong>to</strong> manage certain shareholdings<br />
in <strong>the</strong> Far East. As at 31 December 2007, it held 60% of EFACEC Malaysia SDN.BHD which in turn owned 23% of Sesco EFACEC,<br />
a company also based in Malaysia. With <strong>the</strong> disappearance of IPE, <strong>the</strong> shareholding of this entity is currently split between AICEP<br />
Capital with 40% and <strong>the</strong> Portuguese General Treasury Department with 5%.<br />
(c) In 2008, <strong>the</strong>re was a reorganisation of <strong>the</strong> companies of <strong>the</strong> Energy business area through a merger by incorporating assets<br />
of <strong>the</strong> former companies EFACEC DT, Transformadores de Distribuição de Energia, SA and EFACEC AMT, Aparelhagem de Média<br />
Tensão, SA in<strong>to</strong> EFACEC Energia, Máquinas e Equipamen<strong>to</strong>s Eléctricos, SA.<br />
(d) In 2008, this company merged <strong>the</strong> former companies TECH M5 Capital, SGPS, SA and TECH M5 Tecnologia in<strong>to</strong> Operadores<br />
de Redes, SA.<br />
(e) This company’s purpose is <strong>to</strong> use concessionary rights <strong>to</strong> s<strong>to</strong>re, treat and distribute water for public consumption, as well as<br />
collection and disposal of effl uents in <strong>the</strong> Figueira da Foz municipality.<br />
43<br />
2008 Consolidated and<br />
Individual Financial Statments
(f) This company is held by <strong>the</strong> group through EFACEC International Financing, S.G.P.S., S.A., which holds 60% and by EFACEC<br />
Capital, S.G.P.S., S.A., which holds 1%. Since EFACEC Capital, S.G.P.S., S.A. owns 55% of EFACEC International Financing,<br />
S.G.P.S., S.A., control is <strong>the</strong>refore exercised over EFACEC Malaysia;<br />
(g) 12.2% of this company is held directly by <strong>Efacec</strong> Energia.The remaining shareholding is held indirectly through <strong>the</strong> direct<br />
shareholding in <strong>Efacec</strong> International Financing SGPS, which has control of <strong>Efacec</strong> Malaysia, which in its turn holds 23% of Sesco<br />
<strong>Efacec</strong>.<br />
30.2 Companies excluded from consolidation<br />
Company name Headquarters % Control<br />
Reason for<br />
Exclusion<br />
Vestiparque, Lda. Oeiras 67.0 (A)<br />
<strong>Efacec</strong> Maroc, SARLAU Maroc 100.00 (B)<br />
(A) This company was set up on 30 August 2007 in partnership with Mota-Engil as part of <strong>the</strong> winning consortium of <strong>the</strong> second<br />
phase of <strong>the</strong> tender offer for <strong>the</strong> construction and operation of wind farms. It has not developed any activity yet and it is entered in<br />
Financial Investments at acquisition cost.<br />
(B) This company was set up in <strong>the</strong> 4th quarter of 2008 and is now in installation phase. It has not started activity and is entered as<br />
Financial Investments at acquisition cost.<br />
30.3 Changes <strong>to</strong> <strong>the</strong> consolidation perimeter<br />
In 2008, <strong>the</strong> Complementary Group of Companies “ASMI – Alverca, Serviços de Manutenção de Instalações Electromecânicas ACE"<br />
, was settled and removed from <strong>the</strong> consolidation perimeter, since <strong>the</strong> contract which led <strong>to</strong> its constitution terminated. Still in<br />
2008, <strong>the</strong> company MAP Consul<strong>to</strong>ria e Gestão, Lda. was also settled.<br />
These changes did not have any signifi cant impact on <strong>the</strong> accounts, which might affect <strong>the</strong>ir comparability with <strong>the</strong> previous<br />
year.<br />
On <strong>the</strong> o<strong>the</strong>r hand, <strong>the</strong> entry of various entities set up or acquired during 2008 were registered. These are already included in Note<br />
31.1, and are identifi ed in <strong>the</strong> following table:<br />
Company name Headquarters % Control Consol. Method<br />
<strong>Efacec</strong> Power Transformers Inc. Atlanta / USA 100.0 INT<br />
<strong>Efacec</strong> Central Europe Limited, SRL Bucharest, Romania 100.0 INT<br />
<strong>Efacec</strong> Contracting Central Europe GmbH Vienna / Austria 85.00 INT<br />
C&S <strong>Efacec</strong> MV India Pvt. Ltd. New Delhi / India 50.00 PRO<br />
<strong>Efacec</strong> C&S MV Components Pvt. Ltd New Delhi / India 70.00 INT<br />
Aura de Guijo de Coria, SL Toledo / Spain 100.0 INT<br />
Aura de Agudo, SL Toledo / Spain 100.0 INT<br />
MABE Construção e Administração de Projec<strong>to</strong>s, Ltda. Fortaleza / Brazil 26.50 PRO<br />
Comercializadora de Equipos y Materiales MABE Limitada Santiago / Chile 26.50 PRO<br />
Etarlis, ACE Leiria 50.00 PRO<br />
<strong>Efacec</strong> Omnistal, ACE Maia 50.00 PRO<br />
EME2 - Engenharia, Manutenção e Serviços, ACE Lisbon 40.00 PRO<br />
The impact of <strong>the</strong> entry of <strong>the</strong>se new activities led <strong>to</strong> relevant effects <strong>to</strong> <strong>the</strong> 2008 accounts. The following table features <strong>the</strong><br />
amounts with which <strong>the</strong>y contributed <strong>to</strong>ward <strong>the</strong> main lines in <strong>the</strong> Profi t and Loss Account and in <strong>the</strong> Balance Sheet, and <strong>the</strong> values<br />
that would appear in <strong>the</strong> fi nancial <strong>statements</strong> if <strong>the</strong>ir entry had not occurred.<br />
44
2008<br />
Impact of Entries on<br />
Perimeters<br />
45<br />
2008<br />
Adjusted by entries<br />
In <strong>the</strong> profi t and loss account<br />
Sales and Services Rendered 606,216,504 52,512,664 553,703,841 440,323,101<br />
Net Profi t<br />
In <strong>the</strong> Balance Sheet<br />
24,136,981 3,388,290 20,748,690 17,401,185<br />
Total Assets 655,729,383 91,067,670 564,661,713 418,626,766<br />
Fixed Assets 138,399,382 28,745,595 109,653,787 97,037,800<br />
Cash and cash equivalents 110,526,411 44,072,491 66,453,921 10,213,594<br />
Total Liabilities 576,407,046 87,808,797 488,598,249 339,132,848<br />
Shareholders’ Funds 79,322,337 3,258,873 76,063,464 79,493,918<br />
Leça do Balio, 27 March 2009<br />
Accountant responsible for Consolidation<br />
Mr. José Carlos Eiras Pin<strong>to</strong> de Oliveira<br />
The Board of Direc<strong>to</strong>rs<br />
Mr. Francisco de la Fuente Sánchez - Chairman<br />
Mr. Luís Filipe da Conceição Pereira - Vice-Chairman<br />
Ms. Maria do Rosário Mayoral Robles Machado Simões Ventura - Board Member<br />
Mr. Alber<strong>to</strong> de Freitas Martins - Board Member<br />
Mr. Alber<strong>to</strong> Joaquim Milheira Barbosa - Board Member<br />
Mr. Artur Fuchs - Board Member<br />
Prof. Daniel Bessa Fernandes Coelho - Board Member<br />
Prof. António do Prado Nogueira Leite - Board Member<br />
Prof. João Afonso Ramalho Sopas Pereira Ben<strong>to</strong> - Board Member<br />
Mr. José Manuel Gonçalves de Morais Cabral Board Member<br />
Mr. Luís Miguel Nogueira Freire Cortes Martins - Board Member<br />
2007<br />
2008 Consolidated and<br />
Individual Financial Statments
47<br />
2008 Consolidated and<br />
Individual Financial Statements
Non-current assets<br />
<strong>Efacec</strong> Capital, SGPS, S.A.<br />
Balance Sheets as at 31 December 2008 and 2007<br />
Assets<br />
The Chartered Accountant Board of Direc<strong>to</strong>rs<br />
48<br />
Amounts in Euro<br />
<strong>Notes</strong> 2008 2007<br />
Tangible fi xed assets 3 25,760,092 22,490,611<br />
Intangible assets 0 4,229<br />
Investments in group and associated companies 5 145,555,675 124,446,805<br />
Financial investments in o<strong>the</strong>r companies 5 533,934 11,517<br />
Deb<strong>to</strong>rs and deferred costs 8 462,598 27,000<br />
Deferred tax assets 15 1,221,721 598,579<br />
Derivatives 6 0 345,574<br />
Current assets<br />
Total non-current 173,534,020 147,924,316<br />
Cus<strong>to</strong>mers and accrued income 7 266,381 261,594<br />
Deb<strong>to</strong>rs and deferred costs 8 50,832,360 23,475,987<br />
O<strong>the</strong>r fi nancial investments 6,236,577 0<br />
Cash and cash equivalents 10 52,903,339 113,267<br />
Shareholders’ Funds<br />
Shareholders’ Funds and Liabilities<br />
Total current 110,238,657 23,850,849<br />
Total assets 283,772,677 171,775,165<br />
Capital 11 41,641,416 41,641,416<br />
Reserves for fi nancial instruments -1,725,066 253,997<br />
Reserves and retained earnings 21,661,471 19,633,473<br />
Net Profi t 20,080,238 26,776,666<br />
Anticipated dividends -6,034,000 -12,216,000<br />
Non-current liabilities<br />
Total shareholders’ funds 75,624,059 76,089,552<br />
Provisions 16 1,669,627 1,661,837<br />
Loans 12 81,500,000 48,500,000<br />
Deferred tax liabilities 15 3,531,672 3,513,491<br />
Derivatives 6 2,347,029 0<br />
Current liabilities<br />
Total non-current liabilities 89,048,327 53,675,328<br />
Loans 12 105,986,688 18,156,341<br />
Shareholders’ loans 23 8,295,000 7,100,000<br />
Suppliers 13 1,166,195 422,942<br />
Credi<strong>to</strong>rs and accruals 13 3,652,407 16,331,001<br />
Total current liabilities 119,100,290 42,010,284<br />
Total shareholders’ funds and liabilities 283,772,677 171,775,165<br />
The notes <strong>to</strong> <strong>the</strong> accounts are an integral part of <strong>the</strong>se <strong>consolidated</strong> balance sheets
<strong>Efacec</strong> Capital, SGPS, S.A.<br />
Consolidated profit and loss account by nature for <strong>the</strong> years ended 31 December 2008 and 2007<br />
49<br />
Amounts in Euro<br />
<strong>Notes</strong> 2008 2007<br />
Sales and Services Rendered 7,361,333 4,950,012<br />
Third Party Supplies and Services 17 -3,014,597 -1,568,872<br />
Staff Costs -2,751,546 -1,261,790<br />
Depreciation -846,595 -871,768<br />
Provisions 16 0 -37,359<br />
O<strong>the</strong>r Operational Costs -190,244 -259,854<br />
O<strong>the</strong>r operating income 1,763,032 1,418,860<br />
Operating Profi ts 2,321,384 2,369,229<br />
Financial Costs (net) 18 -3,066,172 -1,936,699<br />
Losses/Gains in associated companies 18 20,695,444 26,469,663<br />
Losses/Gains in o<strong>the</strong>r companies 0 5,429<br />
Income Tax 19 129,582 -130,956<br />
Net Profi t 20 20,080,238 26,776,666<br />
The notes <strong>to</strong> <strong>the</strong> accounts are an integral part of <strong>the</strong>se <strong>consolidated</strong> balance sheets<br />
The Chartered Accountant Board of Direc<strong>to</strong>rs<br />
2008 Consolidated and<br />
Individual Financial Statements
The Chartered Accountant<br />
<strong>Efacec</strong> Capital, SGPS, S.A.<br />
Statement of changes <strong>to</strong> Shareholder's Funds as at 31 December 2008<br />
50<br />
<strong>Notes</strong> Share Capital<br />
Reserves for Financial<br />
Instruments<br />
Balance as at 1 de January de 2007 41,641,416 -34,725<br />
Reinforcement of reserves through application of profi t<br />
Dividend distribution 21<br />
Cash fl ows hedging, net of taxes<br />
O<strong>the</strong>r<br />
6 288,721<br />
Gains / (Losses) recognised directly in shareholders’ funds<br />
Net profi t for <strong>the</strong> fi nancial year<br />
Anticipated dividends<br />
288,721<br />
Total gains recognised in 2007 288,721<br />
Balance as at 31 de December de 2007 41,641,416 253,996<br />
Balance as at 1 de January de 2008 41,641,416 253,996<br />
Reinforcement of reserves through application of profi t<br />
Dividend distribution 21<br />
Cash fl ows hedging, net of taxes<br />
Revaluation of land<br />
O<strong>the</strong>r<br />
6 -1,979,062<br />
Gains / (Losses) recognised directly in shareholders’ funds<br />
Net profi t for <strong>the</strong> fi nancial year<br />
Anticipated dividends<br />
0 -1,979,062<br />
Total gains recognised in 2008 0 -1,979,062<br />
Balance as at 31.12.2008 41,641,416 -1,725,066
Merger Reserve O<strong>the</strong>r Reserves Retained Profits Total Shareholders’ Funds<br />
4,026,949 9,152,090 13,991,531 68,777,261<br />
407,404 -407,404 0<br />
-7,537,096 -7,537,096<br />
288,721<br />
0<br />
0 407,404 -7,944,500 -7,248,375<br />
26,776,666 26,776,666<br />
-12,216,000 -12,216,000<br />
0 407,404 6,616,166 7,312,291<br />
4,026,949 9,559,494 20,607,697 76,089,552<br />
4,026,949 9,559,494 20,607,697 76,089,552<br />
7,386,697 -7,386,697 0<br />
-13,221,000 -13,221,000<br />
-1,979,062<br />
425,110 425,110<br />
263,222 263,222<br />
0 8,075,028 -20,607,697 -14,511,731<br />
20,080,238 20,080,238<br />
-6,034,000 -6,034,000<br />
0 8,075,028 -6,561,459 -465,493<br />
4,026,949 17,634,522 14,046,238 75,624,059<br />
51<br />
Board of Direc<strong>to</strong>rs<br />
2008 Consolidated and<br />
Individual Financial Statements
Operational activities<br />
<strong>Efacec</strong> Capital, SGPS, S.A.<br />
Cash Flow Statements for <strong>the</strong> periods ended 31 December 2008 and 2007<br />
The Chartered Accountant Board of Direc<strong>to</strong>rs<br />
52<br />
Amounts in Euro<br />
<strong>Notes</strong> 2008 2007<br />
Paid <strong>to</strong> suppliers 6,059,316 2,989,939<br />
Paid <strong>to</strong> staff 2,267,964 1,765,972<br />
Flow generated by operations (8,327,281) (4,755,911)<br />
Payment/receipt of corporation tax (795,103) 1,227,864<br />
O<strong>the</strong>r revenue/payments in respect of operating activity 9,313,304 10,272,430<br />
Investment activities<br />
Revenues provided by:<br />
Net infl ow from operational activities [1] 190,920 6,744,383<br />
Financial investments 5 250,000 509,277<br />
Interest and similar income 1,522,288 422,767<br />
Dividends 18 20,695,176 26,469,663<br />
Payments pertaining <strong>to</strong>:<br />
22,467,464 27,401,707<br />
Financial investments 5 27,440,456 2,261,966<br />
Tangible assets 3 1,918,913 1,182,846<br />
29,359,369 3,444,812<br />
Net outfl ow from investment [2] (6,891,905) 23,956,894<br />
Financing activities<br />
Revenues provided by:<br />
Non-current loans obtained 12 10,000,000 0<br />
Current loans obtained/granted 12 428,711,898 102,865,595<br />
Sale of own shares 0 0<br />
Payments pertaining <strong>to</strong>:<br />
438,711,898 102,865,595<br />
Non-current loans obtained 12 359,259 0<br />
Current loans obtained/granted 12 352,765,009 110,341,450<br />
Amortisation of leasing contracts 0 0<br />
Interest and similar income 6,841,571 3,390,806<br />
Dividends 21 19,255,000 19,753,150<br />
379,220,840 133,485,406<br />
Flows generated by fi nancing activities [3] 59,491,058 (30,619,811)<br />
Change in cash and cash equivalents [C]-[B]+[A]=[1]+[2]+[3] 52,790,072 81,467<br />
Merger impact [A] 0 0<br />
Cash and cash equivalents at <strong>the</strong> beginning of <strong>the</strong> period [B] 113,267 31,800<br />
Cash and cash equivalents at <strong>the</strong> end of <strong>the</strong> period [C] 52,903,339 113,267
A. General information<br />
<strong>Notes</strong> <strong>to</strong> <strong>the</strong> Financial Statements<br />
The activity of EFACEC Capital, SGPS, SA, as a holding company, cannot be studied separately from <strong>the</strong> group that it leads through<br />
<strong>the</strong> management of its subsidiary and associated companies, and <strong>the</strong> businesses run by each of <strong>the</strong>m. The diversity in terms of<br />
production and engineering competencies has left its mark on <strong>the</strong> management of this company and is demonstrated by <strong>the</strong> range<br />
of shareholdings held. The variety of services and products include a wide range of equipment used in electricity transport and<br />
distribution, in remote control systems, ventilation, electric traction, industrial electronics, telecommunications, au<strong>to</strong>mation and<br />
robotics and in engineering projects focused on industrial plant and maintenance.<br />
The company, and <strong>the</strong> group it represents operate in a highly competitive market, and it is necessary <strong>to</strong> be alert <strong>to</strong> <strong>the</strong> constant<br />
developments and changes in cus<strong>to</strong>mer preferences and in new technologies. With this in mind, <strong>the</strong> company has adapted its<br />
structure <strong>to</strong> ensure <strong>the</strong> most appropriate solution. During <strong>the</strong> last few years, in which <strong>the</strong>re has been a focus on internationalising<br />
and diversifying activities that has seen branches and agents set up across more than 30 countries, it has carried out projects<br />
and studies with <strong>the</strong> aim of streng<strong>the</strong>ning and consolidating its position, and rethinking its development strategy for <strong>the</strong> entire<br />
group.<br />
<strong>Efacec</strong> Capital, Holding company of <strong>the</strong> <strong>Efacec</strong> Group is a public liability company with headquarters at Arroteia, parish of Leça do<br />
Balio, Ma<strong>to</strong>sinhos in Portugal.<br />
The following <strong>Notes</strong> support and complement <strong>the</strong> Company's individual fi nancial <strong>statements</strong>.<br />
B. Summary of main accounting policies<br />
The main accounting polices used <strong>to</strong> prepare <strong>the</strong>se fi nancial <strong>statements</strong> are described below. These policies have been consistently<br />
applied over <strong>the</strong> years unless o<strong>the</strong>rwise stated.<br />
1.1 Basis of preparation<br />
The fi nancial <strong>statements</strong> were prepared using his<strong>to</strong>rical costs with <strong>the</strong> exception of land, fi nancial assets and liabilities (including<br />
derivatives) which have been valued in <strong>the</strong> accounts at <strong>the</strong>ir fair value.<br />
During this fi nancial year <strong>the</strong> interpretation IFRIC.11 IFRS.2 was manda<strong>to</strong>ry - Intra group transactions of Own Shares, producing<br />
no signifi cant impact of company accounting policies.<br />
At <strong>the</strong> end of this fi nancial year, <strong>the</strong> following standards were issued but not manda<strong>to</strong>ry as at 31 December 2008:<br />
- IFRS 2 Payment based on shares (2008 Update)<br />
- IFRS 3 Business combinations (2008 Update)<br />
- IFRS 8 Operating Segments;<br />
- IAS 1 Presentation of Financial Statements (2007 Update)<br />
- IAS 23 Cost of Loans Obtained – (2007 Update)<br />
- IAS 27 Consolidated and Separate Financial Statements (2008 update)<br />
- IAS 32 Financial instruments: Presentation (2008 Update)<br />
- IFRIC 13 Cus<strong>to</strong>mer Retention Programmes;<br />
- IFRIC 14 The Limit on a Defi ned Benefi t Asset, Minimum Financing Requirements and <strong>the</strong>ir Interaction<br />
- IFRIC 15 Contracts for <strong>the</strong> construction of buildings<br />
- IFRIC 16 Hedges of a net investment in a foreign operation<br />
In view of <strong>the</strong> fact that applying <strong>the</strong>se standards was not manda<strong>to</strong>ry for <strong>the</strong> year beginning 1 January 2008, <strong>the</strong> company decided<br />
not <strong>to</strong> adopt <strong>the</strong>m immediately.<br />
It is estimated however that <strong>the</strong>re would be no signifi cant impact from applying <strong>the</strong>m <strong>to</strong> <strong>the</strong> fi nancial <strong>statements</strong> of <strong>the</strong> company.<br />
The preparation of <strong>the</strong> fi nancial <strong>statements</strong> in accordance with <strong>the</strong> International Financial Reporting Standards requires <strong>the</strong> use of<br />
some important accounting estimates. It also requires that <strong>the</strong> management entity uses its judgement in <strong>the</strong> process of applying<br />
<strong>the</strong> accounting policies of <strong>the</strong> company.<br />
53<br />
2008 Consolidated and<br />
Individual Financial Statements
1.2 Tangible Fixed Assets<br />
separate, as deemed appropriate, only when it is likely that economic benefi ts fl ow <strong>to</strong> <strong>the</strong> company and <strong>the</strong> cost can be reliably<br />
measured. O<strong>the</strong>r expenditure for repairs and maintenance are recognised as costs within <strong>the</strong> period in which <strong>the</strong>y are incurred.<br />
Increases resulting from revaluations are shown in Reserves in Shareholders’ Funds. Each year, <strong>the</strong> difference between depreciation<br />
based on <strong>the</strong> re-valued amount of <strong>the</strong> asset taken <strong>to</strong> profi t and loss in <strong>the</strong> period, and depreciation based on <strong>the</strong> original cost<br />
of <strong>the</strong> asset, is transferred from fair value Reserves <strong>to</strong> Retained Profi ts.<br />
Land is not depreciated. Depreciation on o<strong>the</strong>r assets is calculated using <strong>the</strong> straight line method using <strong>the</strong> cost value or <strong>the</strong> revalued<br />
amount, in order <strong>to</strong> apportion <strong>the</strong>ir cost or re-valued amount over <strong>the</strong> useful life of <strong>the</strong> asset down <strong>to</strong> <strong>the</strong>ir residual value,<br />
as follows:<br />
Depreciation begins in <strong>the</strong> month following that in which <strong>the</strong> asset entered service, in accordance with its useful life, as follows:<br />
Line Years<br />
Land -<br />
Buildings and O<strong>the</strong>r Constructions 25 - 50<br />
Plant and Equipment 8 - 12<br />
Vehicles 4 - 5<br />
Tools and Utensils 4 - 8<br />
Offi ce Equipment 4 - 6<br />
Asset residual values and respective useful lives are revised and adjusted, if deemed necessary, at <strong>the</strong> balance sheet date.<br />
If <strong>the</strong> amount booked is greater than <strong>the</strong> recoverable value of <strong>the</strong> asset, it is immediately adjusted <strong>to</strong> its estimated recoverable<br />
value (Note 1.4).<br />
Gains and/or losses on disposal or write offs are determined by calculating <strong>the</strong> difference between <strong>the</strong> net accounting value of <strong>the</strong><br />
asset, and its disposal or write off value, being in <strong>the</strong> latter case zero, and included in <strong>the</strong> Profi t or Loss for <strong>the</strong> period.<br />
1.3 Intangible Assets<br />
a) Software<br />
The acquisition cost of software licences is capitalised and includes all costs incurred for its acquisition and those required <strong>to</strong> put<br />
<strong>the</strong> available software in<strong>to</strong> use. These costs are depreciated over <strong>the</strong> estimated useful life (not exceeding 5 years).<br />
Costs related <strong>to</strong> <strong>the</strong> development or maintenance of <strong>the</strong> software are recognised as costs of <strong>the</strong> period in which <strong>the</strong>y are incurred.<br />
Costs directly associated with <strong>the</strong> production of identifi able and unique software controlled by <strong>the</strong> company, and which is probably<br />
going <strong>to</strong> generate future economic benefi ts that are superior <strong>to</strong> costs involved beyond one year, are recognised as intangible assets.<br />
Direct costs include staff costs <strong>to</strong> develop <strong>the</strong> software and a share of relevant fi xed costs.<br />
Software development costs recognised as assets are amortised over its estimated useful life (not exceeding 5 years).<br />
1.4 Asset impairment<br />
Assets that do not have a defi ned useful life are not subject <strong>to</strong> amortisation, but are <strong>the</strong> object of annual impairment tests. Assets<br />
subject <strong>to</strong> amortisation are reviewed for impairment whenever events or changes in circumstances indicate that <strong>the</strong> value at which<br />
<strong>the</strong>y were booked may not be recoverable. An impairment loss is recognised by <strong>the</strong> amount by which <strong>the</strong> booked value of <strong>the</strong><br />
asset exceeds its recoverable value. The recoverable value is <strong>the</strong> highest of <strong>the</strong> fair value of <strong>the</strong> asset, less expenses required for<br />
sale, and its use value. To carry out impairment tests, assets are grouped <strong>to</strong>ge<strong>the</strong>r at <strong>the</strong> lowest level at which cash fl ows can be<br />
identifi ed separately (cash fl ow generating units or UGCs).<br />
The amount recoverable from a UGC is calculated based on calculations of useful value. These calculations use cash fl ow projections<br />
based on fi nancial budgets approved by <strong>the</strong> management entity, covering a period of at least 5 years.<br />
Assumptions have been used for <strong>the</strong> analysis of each UGC of <strong>the</strong> business segment. The management entity works out <strong>the</strong> budgeted<br />
gross margin based on prior performance and its expectations for market development. The average weighted growth rate<br />
used is consistent with <strong>the</strong> forecasts included in sec<strong>to</strong>r reports. The discount rates used are before tax, and refl ect <strong>the</strong> specifi c<br />
risks related <strong>to</strong> <strong>the</strong> relevant sec<strong>to</strong>rs.<br />
1.5 Financial investments<br />
Financial investments in group, associate and o<strong>the</strong>r companies are shown at acquisition cost.<br />
The Group checks at each balance sheet date whe<strong>the</strong>r <strong>the</strong>re is objective evidence of impairment of any investment. If <strong>the</strong>re is such<br />
proof, <strong>the</strong> accumulated loss, calculated as <strong>the</strong> difference between <strong>the</strong> balance sheet value and <strong>the</strong> current fair value, is recognised<br />
54
in <strong>the</strong> profi t and loss account of <strong>the</strong> period in which <strong>the</strong> impairment occurred (Note 1.4).<br />
The company only recognises income <strong>to</strong> <strong>the</strong> extent that it receives distributions from cumulative net profi ts of <strong>the</strong> shareholding<br />
held, following <strong>the</strong> date of its acquisition. Distributions received in excess from <strong>the</strong>se profi ts are considered as a recovery of <strong>the</strong><br />
investment, and as such are booked as a reduction in <strong>the</strong> cost of <strong>the</strong> investment.<br />
1.6 S<strong>to</strong>cks<br />
S<strong>to</strong>cks are presented at <strong>the</strong> lowest value between cost and net realisable value. The cost is calculated using <strong>the</strong> standard cost<br />
(which does not vary signifi cantly from actual production cost).<br />
The cost of fi nished products and manufacturing work in progress includes raw material costs, direct labour, o<strong>the</strong>r direct costs and<br />
manufacturing overheads (based on normal production capacity). The costs of loans obtained are excluded.<br />
Net realisable value is equal <strong>to</strong> <strong>the</strong> estimated selling price under normal business conditions, less variable selling costs. The cost<br />
of s<strong>to</strong>cks includes <strong>the</strong> transfer from shareholders’ funds of any loss or gain classifi ed as cash fl ow hedging related <strong>to</strong> <strong>the</strong> purchase<br />
of raw materials.<br />
1.7 Recognition of income and costs in contracts over several years<br />
Profi t on contracts which continue for more than one year are accounted for in accordance with <strong>the</strong> percentage of work completed<br />
by reference <strong>to</strong> partial delivery, segment identifi cation, assessment procedures or o<strong>the</strong>r means which allow reliable estimation of<br />
costs for completion of <strong>the</strong> work or <strong>the</strong> invoices which are <strong>to</strong> be sent <strong>to</strong> <strong>the</strong> cus<strong>to</strong>mer. When it is not possible <strong>to</strong> estimate profi ts<br />
and <strong>the</strong> costs with reasonable reliability, <strong>the</strong>n <strong>the</strong>y are recognised only when <strong>the</strong> product is delivered <strong>to</strong> <strong>the</strong> cus<strong>to</strong>mer, applying <strong>the</strong><br />
completed work criteria. In this case, <strong>the</strong> costs incurred until delivery are recorded in S<strong>to</strong>cks – Products and work in progress.<br />
Costs of contracts include raw materials and direct materials, direct labour and also allocated indirect costs, distributed as specifi<br />
ed in <strong>the</strong> contract. Sales and administration expenses are charged as costs as <strong>the</strong>y occur. Provisions are set up for any foreseen<br />
losses on completing a contract within <strong>the</strong> period in which <strong>the</strong>y are determined, and are immediately refl ected in <strong>the</strong> results.<br />
Changes <strong>to</strong> contracts or estimates and forecast costs and/or profi ts and margins, arising from renegotiating of <strong>the</strong> conditions with<br />
cus<strong>to</strong>mers or from internal productivity, are recognised in <strong>the</strong> results from <strong>the</strong> period in which <strong>the</strong>y occur and taking in<strong>to</strong> account<br />
<strong>the</strong> stages of completion.<br />
When <strong>the</strong>re are materials which have not yet been used on <strong>the</strong> job or <strong>the</strong> installation, <strong>the</strong>re will be a balance on <strong>the</strong> account<br />
“Products and work in progress”.If this relates <strong>to</strong> receivables from cus<strong>to</strong>mers not yet invoiced, <strong>the</strong> resulting margin is not recognised.<br />
When <strong>the</strong> opposite situation occurs and <strong>the</strong> amount invoiced <strong>to</strong> <strong>the</strong> cus<strong>to</strong>mer is greater than <strong>the</strong> level of work completed,<br />
a deferred liability is set up representing a liability <strong>to</strong> a cus<strong>to</strong>mer for <strong>the</strong> work still <strong>to</strong> be completed.<br />
1.8 Accounts receivable from cus<strong>to</strong>mers and o<strong>the</strong>r deb<strong>to</strong>rs<br />
Accounts receivable from cus<strong>to</strong>mers and o<strong>the</strong>r deb<strong>to</strong>rs are initially recognised at <strong>the</strong>ir nominal or fair value, when different, less<br />
any impairment loss. The provision for deb<strong>to</strong>r impairment is set up when <strong>the</strong>re is objective evidence that <strong>the</strong> Group will not receive<br />
<strong>the</strong> entire amount outstanding, as per <strong>the</strong> original conditions established for <strong>the</strong> debt. The amount of <strong>the</strong> provision is <strong>the</strong> difference<br />
between <strong>the</strong> amount presented and <strong>the</strong> estimated present value of future cash fl ows, discounted at <strong>the</strong> effective interest rate. The<br />
amount of <strong>the</strong> provision is recognised in <strong>the</strong> profi t and loss account.<br />
1.9 Cash and cash equivalents<br />
The line Cash and cash equivalents includes cash, bank deposits, o<strong>the</strong>r short-term high liquidity investments and with initial maturities<br />
up <strong>to</strong> three months. Bank overdrafts are shown in <strong>the</strong> Balance Sheet under current liabilities in <strong>the</strong> line Loans.<br />
1.10 Share capital<br />
Ordinary shares are shown in shareholders’ funds.<br />
The incremental costs directly attributable <strong>to</strong> <strong>the</strong> issue of new shares or options are shown in shareholders’ funds as a reduction,<br />
net of taxes, of cash from increases in share capital. The incremental costs directly attributable <strong>to</strong> <strong>the</strong> issue of new shares or options<br />
or <strong>the</strong> acquisition of a new business are included in <strong>the</strong> cost of acquisition as part of <strong>the</strong> purchase price.<br />
55<br />
2008 Consolidated and<br />
Individual Financial Statements
1.11 Loans Obtained<br />
Loans are initially recognised at <strong>the</strong>ir nominal value or fair value, whenever different, less any impairment loss. Loans are subsequently<br />
presented at amortised cost. Any difference between receipts (net of transaction costs) and <strong>the</strong> amortized value is recognised<br />
in <strong>the</strong> profi t and loss account throughout <strong>the</strong> loan period, using <strong>the</strong> effective rate method.<br />
Loans are shown in current liabilities, unless <strong>the</strong> company has an unconditional right <strong>to</strong> defer payment of <strong>the</strong> liability until at least<br />
12 months after <strong>the</strong> balance sheet date.<br />
1.12 Income tax and deferred taxes<br />
EFACEC Capital, SGPS opted for taxation based on <strong>consolidated</strong> profi ts as from 1993, currently covered by <strong>the</strong> “Special Rules for<br />
Taxation of Groups of Companies”, (Article 36 of <strong>the</strong> Corporate Income Tax Code - CIRC). All Group companies whose headquarters<br />
are located in Portugal and are subject <strong>to</strong> <strong>the</strong> Portuguese Corporate Income Tax (IRC), and where <strong>the</strong> direct and indirect<br />
share holding is greater than 90%, have been included in <strong>the</strong> tax consolidation in accordance with <strong>the</strong> applicable legislation. The<br />
<strong>consolidated</strong> tax charge is determined on <strong>the</strong> basis of <strong>the</strong> arithmetic sum of taxable profi ts and losses as derived from individual<br />
companies’ tax returns.<br />
Deferred taxes are generally recognised using <strong>the</strong> liability method concerning temporary differences arising from <strong>the</strong> carrying<br />
amounts of assets and liabilities for <strong>consolidated</strong> fi nancial reporting purposes and amounts used for income tax purposes. However,<br />
if <strong>the</strong> deferred tax arises through <strong>the</strong> initial recognition of an asset or liability in a transaction that is not a business concentration<br />
that at <strong>the</strong> date of <strong>the</strong> transaction did not affect ei<strong>the</strong>r <strong>the</strong> accounting or fi scal result, it is not booked. Deferred taxes are determined<br />
by fi scal taxes (and laws) in force or substantially in force at <strong>the</strong> balance sheet date and which are expected <strong>to</strong> be applicable<br />
in <strong>the</strong> period when <strong>the</strong> deferred tax asset or <strong>the</strong> payment of <strong>the</strong> deferred tax liability takes place.<br />
The tax rate that has been used <strong>to</strong> determine deferred taxes is that of current legislation - 25%, plus <strong>the</strong> maximum local tax possible<br />
- 1.5% of taxable profi t.<br />
Deferred tax assets are recognised <strong>to</strong> <strong>the</strong> extent that it is probable that future taxable profi ts will be available <strong>to</strong> make use of <strong>the</strong><br />
timing difference.<br />
Deferred taxes on timing differences arising from investments in subsidiaries and associates are recognised, except when <strong>the</strong><br />
Group is able <strong>to</strong> control <strong>the</strong> haphazard nature of <strong>the</strong> reversal of <strong>the</strong> timing difference and when it is probable that <strong>the</strong> timing difference<br />
does not revert in <strong>the</strong> foreseeable future.<br />
1.13 Provisions<br />
Provisions are booked when <strong>the</strong> company has a legal or constructive obligation when, as a result of past events, it is probable<br />
that an outfl ow of resources will be necessary <strong>to</strong> pay an obligation, and a reliable estimate of <strong>the</strong> amount of <strong>the</strong> obligation can be<br />
made.<br />
When <strong>the</strong>re is a number of similar obligations, <strong>the</strong> probability of generating an outfl ow is worked out <strong>to</strong>ge<strong>the</strong>r. The provision is<br />
booked even when <strong>the</strong> probability of an outfl ow, relating <strong>to</strong> an element included in <strong>the</strong> same class of obligations, may be reduced.<br />
1.14 Recognition of income<br />
Income covers <strong>the</strong> fair value of <strong>the</strong> sale of goods and services, net of taxes and commercial discounts and after elimination of<br />
internal sales.<br />
Services rendered<br />
The rendering of services is recognised in <strong>the</strong> accounting period in which <strong>the</strong>y are rendered, with reference <strong>to</strong> <strong>the</strong> phase of completion<br />
of <strong>the</strong> transaction at <strong>the</strong> balance sheet date.<br />
1.15 Leases<br />
Leases are classifi ed as operational leases if a signifi cant part of <strong>the</strong> inherent risks and benefi ts at <strong>the</strong> time <strong>the</strong> lease is taken on is<br />
retained by <strong>the</strong> lessor. Payments made for operational leases are booked in <strong>the</strong> profi t and loss account on settlement.<br />
Leases of tangible fi xed assets where <strong>the</strong> Group holds substantially all <strong>the</strong> risks and benefi ts associated with <strong>the</strong> asset are classifi ed<br />
as fi nancial leases. Financial leases are capitalised at <strong>the</strong> beginning of <strong>the</strong> lease for <strong>the</strong> lower of <strong>the</strong> fair value of <strong>the</strong> asset leased<br />
and <strong>the</strong> present value of <strong>the</strong> minimum payments of <strong>the</strong> lease. Each payment made is split between <strong>the</strong> capital sum due and <strong>the</strong><br />
fi nancial costs, in order <strong>to</strong> obtain a constant rate on <strong>the</strong> debt outstanding. Lease obligations net of fi nancial charges are shown in<br />
O<strong>the</strong>r Credi<strong>to</strong>rs. The interest is booked <strong>to</strong> fi nancial costs in <strong>the</strong> lease period <strong>to</strong> a constant periodic interest rate on <strong>the</strong> remaining<br />
debt of each period. Tangible fi xed assets acquired through fi nancial leases are depreciated over <strong>the</strong> lesser of <strong>the</strong> useful life of <strong>the</strong><br />
asset or <strong>the</strong> lease period.<br />
56
1.16 Subsidies<br />
Subsidies received are booked at <strong>the</strong>ir fair value when a reasonable level of comfort exists that <strong>the</strong> subsidy will be received and<br />
<strong>the</strong> Group will comply with its obligations.<br />
Subsidies relating <strong>to</strong> <strong>the</strong> purchase of tangible fi xed assets are included in non-current Liabilities as deferred subsidies and are<br />
credited <strong>to</strong> <strong>the</strong> Profi t and Loss Account in proportion <strong>to</strong> <strong>the</strong> useful life of <strong>the</strong> corresponding assets.<br />
1.17 Dividend distribution<br />
Dividend distribution <strong>to</strong> shareholders are recognised as a liability in <strong>the</strong> company’s fi nancial <strong>statements</strong> in <strong>the</strong> period in which <strong>the</strong><br />
dividends are approved in <strong>the</strong> Shareholders’ General Meeting.<br />
2. Financial risk management<br />
2.1 Fac<strong>to</strong>rs of <strong>financial</strong> risk<br />
The Group operates internationally and thus has exposure <strong>to</strong> <strong>the</strong> market, in particular <strong>to</strong> changes in interest rates, exchange rates<br />
and <strong>the</strong> price of raw materials.Thus Group activities are exposed <strong>to</strong> a variety of fi nancial risks: market risk (including exchange<br />
rate risk, fair value risk relating <strong>to</strong> interest rates and price risk), liquidity risk and cash fl ow risk associated with interest rates.<br />
The Group has no signifi cant concentrations of credit risk. Various fi nancial instruments are used <strong>to</strong> minimise <strong>the</strong> potential adverse<br />
effects on <strong>the</strong> fi nancial performance of <strong>the</strong> Group. However, <strong>the</strong> Group only uses such fi nancial instruments <strong>to</strong> cover risks arising<br />
from its business and activities (“hedging purposes”).<br />
Exchange rate risk<br />
The Group operates internationally, and as a result, is exposed <strong>to</strong> exchange rates risks. This risk arises from commercial transactions,<br />
recognition of assets and liabilities and net investments in external operations.<br />
The Group has signifi cant Sales and Service Rendering in countries outside <strong>the</strong> Euro zone, namely in US Dollars (USD). Group<br />
companies are required <strong>to</strong> carefully manage exchange risk cover, considering <strong>the</strong> operational margins in <strong>the</strong>ir business.Exchange<br />
risk cover is made from <strong>the</strong> proposal date in some cases or from <strong>the</strong> order date, until cash payment is received. In this way, not<br />
only are <strong>the</strong> majority of balance sheet assets and liability values covered but also future sales linked with proposals (considering<br />
an acceptable level of success) and orders. Accordingly cover can be for several years depending on how long <strong>the</strong> project or installations<br />
take, refl ecting <strong>the</strong> possible period over several years which <strong>the</strong> work of Group companies can take place.<br />
Liquidity risk<br />
The management of liquidity risk implies maintaining a suffi cient level of cash and bank deposits, <strong>the</strong> viability of fl oating debt<br />
through adequate credit facilities, and skill in liquidating market positions. In line with <strong>the</strong> business needs, <strong>the</strong> Group Treasury<br />
aims at maintaining <strong>the</strong> fl exibility of <strong>the</strong> fl oating debt, keeping credit lines available.<br />
Cash fl ow risks and fair value related <strong>to</strong> interest rates<br />
Since <strong>the</strong> Group does not have assets that earn signifi cant amounts of interest, profi ts and cash fl ows are relatively independent<br />
of changes <strong>to</strong> market interest rates.<br />
Interest rate risks of <strong>the</strong> Group come from long-term loans. Loans with variable rates of interest expose <strong>the</strong> Group <strong>to</strong> cash fl ow<br />
risks related <strong>to</strong> interest rates.<br />
The Group manages interest rate cash fl ow risks associated <strong>to</strong> <strong>the</strong> interest rate by transforming variable interest rates in<strong>to</strong> swaps<br />
with fi xed interest rates or by establishing caps over <strong>the</strong> variable rate. In <strong>the</strong>se transactions, <strong>the</strong> Group agrees <strong>to</strong> exchange with<br />
o<strong>the</strong>r parties at specifi ed intervals (mainly half-yearly), <strong>the</strong> difference between amounts at contracted fi xed interest rate and<br />
amounts at a variable interest rate.<br />
57<br />
2008 Consolidated and<br />
Individual Financial Statements
2.2 Accounting for <strong>financial</strong> instruments – derivatives and hedging<br />
Derivatives are initially recognised at fair value and subsequently readjusted <strong>to</strong> <strong>the</strong>ir fair value. The method for recognising changes<br />
in fair value depends on whe<strong>the</strong>r <strong>the</strong> derivative is defi ned as a hedge instrument and if so, <strong>the</strong> nature of <strong>the</strong> asset/liability <strong>to</strong><br />
be covered. The group arranges certain derivatives as: (1) fair value cover of recognised assets and liabilities or of commitments<br />
(fair value cover); (2) cover of highly probable forecast transactions (cash fl ow hedging).<br />
For each transaction, <strong>the</strong> Group prepares documentation <strong>to</strong> justify <strong>the</strong> relationship between <strong>the</strong> hedge instruments and <strong>the</strong> related<br />
assets/liabilities covered, as well as <strong>the</strong> objective of risk management and <strong>the</strong> strategy for taking out cover. The Group also<br />
documents its evaluation, both at <strong>the</strong> start of <strong>the</strong> cover and on a continuous basis, as <strong>to</strong> whe<strong>the</strong>r <strong>the</strong> derivatives used for cover<br />
effectively compensate for fl uctuations in fair value or in <strong>the</strong> cash fl ows of <strong>the</strong> items covered.<br />
The fair value of derivatives used <strong>to</strong> take out cover is disclosed in note 6, as well as <strong>the</strong> movements that <strong>to</strong>ok place in Shareholders’<br />
Funds.<br />
a) Fair value hedging<br />
Changes in <strong>the</strong> fair value of derivatives that are arranged and qualifi ed for fair value hedging are recognised in <strong>the</strong> profi t and<br />
loss account, <strong>to</strong>ge<strong>the</strong>r with changes <strong>to</strong> <strong>the</strong> fair value of <strong>the</strong> assets and liabilities covered (in <strong>the</strong> covered position) attributable <strong>to</strong><br />
covered risk.<br />
b) Cash fl ow hedging<br />
The effective part of <strong>the</strong> change in fair value of derivatives that are arranged and qualifi ed for cash fl ow hedging is recognised in<br />
shareholders’ funds. The gain or loss related <strong>to</strong> <strong>the</strong> ineffective part is immediately recognised in <strong>the</strong> profi t and loss account.<br />
As pertains cover strategies that use options, in accordance with IAS 39 and complying with <strong>the</strong> effi ciency test, <strong>the</strong> strategy value<br />
is split in<strong>to</strong> <strong>the</strong> intrinsic value and <strong>the</strong> time value.<br />
In accordance with <strong>the</strong> treatment referred above, <strong>the</strong> intrinsic value should be presented in shareholders’ funds (assuming <strong>the</strong><br />
strategy is effi cient), while <strong>the</strong> temporal value should be booked <strong>to</strong> <strong>the</strong> profi t and loss account.<br />
The cumulative amounts in shareholders’ funds are reclassifi ed <strong>to</strong> profi t and loss in <strong>the</strong> same period in which <strong>the</strong> item covered<br />
generates gains and losses (for instance, when <strong>the</strong> covered sales forecast occurs). However, when <strong>the</strong> covered forecast transaction<br />
results in <strong>the</strong> recognition of a non-fi nancial asset (for example, s<strong>to</strong>cks) or non-fi nancial liability, <strong>the</strong> previously deferred gains and<br />
losses in shareholders’ funds are transferred and included in <strong>the</strong> initial measurement of that asset or liability.<br />
When a hedge instrument expires or is sold, or when a hedging does not comply with <strong>the</strong> accounting and qualifi cation criteria, any<br />
cumulative gain or loss existing at that moment in shareholders’ funds, remains in shareholders’ funds and is recognised when<br />
<strong>the</strong> forecast transaction is fi nally refl ected in <strong>the</strong> profi t and loss account. When <strong>the</strong> expected occurrence of a forecast transaction<br />
is no longer highly probable, <strong>the</strong> cumulative gains or losses refl ected in shareholders’ funds are immediately transferred <strong>to</strong> profi t<br />
and loss.<br />
c) Non-qualifi ed derivatives for hedging purposes<br />
Certain derivatives do not comply with hedging accounting and qualifi cation criteria. Changes in fair value of <strong>the</strong>se derivatives are<br />
immediately recognised in <strong>the</strong> profi t and loss account.<br />
2.3 Estimates of fair value<br />
The fair value of fi nancial instruments available on <strong>the</strong> current market (for instance publicly negotiated derivatives, negotiable<br />
instruments available for sale) is determined on <strong>the</strong> basis of quoted market prices at balance sheet date. The quoted market price<br />
used for fi nancial assets of <strong>the</strong> Group is <strong>the</strong> price received by shareholders on <strong>the</strong> current market; <strong>the</strong> quoted market price for<br />
fi nancial liabilities is <strong>the</strong> price paid on <strong>the</strong> current market.<br />
The fair value of fi nancial instruments not traded on <strong>the</strong> current market (for instance unquoted derivatives) is determined using<br />
enhancement techniques. The Group uses a variety of methods and reaches its conclusions based on market conditions at each<br />
balance sheet date. Quoted market prices or negotiation quotas for similar instruments are used for long-term debts. O<strong>the</strong>r techniques,<br />
such as estimates of discounted cash fl ows, are used <strong>to</strong> determine <strong>the</strong> fair value of o<strong>the</strong>r fi nancial instruments. The fair<br />
value of interest rate swaps is calculated based on <strong>the</strong> present value of estimated future cash fl ows. The fair value of interest rate<br />
futures contracts is determined using market exchange rates at <strong>the</strong> balance sheet date.<br />
The nominal value less estimated credit adjustments of receivable and payable accounts is assumed <strong>to</strong> be close <strong>to</strong> <strong>the</strong>ir fair value.<br />
The fair value of fi nancial liabilities is estimated by updating future contractual cash fl ows at <strong>the</strong> current market interest rate available<br />
for similar fi nancial instruments.<br />
58
C. <strong>Notes</strong> on <strong>the</strong> Balance Sheets as at 31 December 2008 and 2007<br />
3. Tangible fixed assets<br />
3.1 Movements that <strong>to</strong>ok place in <strong>the</strong> period<br />
Financial Year 2008<br />
Land and buildings<br />
Vehicles and equipment<br />
59<br />
Office equipment O<strong>the</strong>r Total<br />
Opening balance 20,542,974 200 26,694 1,920,742 22,490,612<br />
Merger 0 0 0 0 0<br />
Revaluation 572,900 0 0 0 572,900<br />
Accrual 2,269,291 0 12,738 1,256,918 3,538,947<br />
Decreases 0 0 0 0 0<br />
Depreciation charges -830,903 -200 -15,492 0 -846,595<br />
Adjustments 1,875,462 46,233 776 -1,918,243 4,228<br />
Closing balance 24,429,724 46,233 24,716 1,259,417 25,760,092<br />
2008. December<br />
Cost or fair value 61,290,670 303,020 957,712 1,295,941 63,847,343<br />
Cumulative depreciation -36,860,946 -256,787 -932,995 -36,523 -38,087,251<br />
Net value 24,429,724 46,233 24,717 1,259,418 25,760,092<br />
Financial Year 2007<br />
Opening balance 21,387,051 1,531 42,932 1,605 21,433,119<br />
Merger 0 0 0 0 0<br />
Revaluation 0 0 0 0 0<br />
Accrual 0 0 4,371 1,920,742 1,925,113<br />
Decreases 0 0 0 0 0<br />
Depreciation charges -844,077 -1,330 -22,214 0 -867,621<br />
Adjustments 0 0 1,605 -1,605 0<br />
Closing balance 20,542,974 201 26,694 1,920,742 22,490,611<br />
2007, December<br />
Cost or fair value 56,573,017 258,390 944,198 1,961,494 59,737,099<br />
Cumulative depreciation -36,030,043 -258,189 -917,503 -40,752 -37,246,487<br />
Net value 20,542,974 201 26,694 1,920,742 22,490,612<br />
3.2 Revaluations<br />
Buildings and o<strong>the</strong>r tangible fi xed assets of <strong>the</strong> Group were re-valued on 1 January 2004, using <strong>the</strong> monetary revaluation coeffi<br />
cients as part of <strong>the</strong> transition <strong>to</strong> IFRS (IFRS 1). The land included in <strong>the</strong> company assets is booked as fair value. The value of<br />
<strong>the</strong> land was subject <strong>to</strong> update on 31 December 2008, based on an evaluation carried out by independent external consultants<br />
resulting in an enhancement of around 421 thousand Euro, whose compensation was recognised in equity less <strong>the</strong> respective<br />
deferred tax.<br />
If tangible assets were shown at his<strong>to</strong>rical cost, <strong>the</strong> values in <strong>the</strong> balance sheet would be:<br />
3.3 Guarantees<br />
31.12.2008 31.12.2007<br />
Acquisition value 20,891,129 17,353,785<br />
Cumulative depreciation 10,799,118 10,145,458<br />
His<strong>to</strong>ric net value 10,092,011 7,208,327<br />
No pledges or guarantees exist on any assets.<br />
2008 Consolidated and<br />
Individual Financial Statements
4. Intangible assets<br />
As at 31 December 2008 <strong>the</strong>re were no Intangible Assets.<br />
5. Financial Investments<br />
5.1. Investments in group and associated companies<br />
This line includes <strong>the</strong> value of <strong>the</strong> shareholdings involved and loans granted. The movements during <strong>the</strong> year were as follows:<br />
60<br />
31.12.2008 31.12.2007<br />
Opening balance 124,446,805 129,965,394<br />
Share in profi t 0 0<br />
Increase in shareholding 2,870,870 1,269,165<br />
Decrease in shareholdings -250,000 0<br />
O<strong>the</strong>r equity movements 0 992,801<br />
Impairment loss 0 0<br />
Loans granted 0 -7,280,555<br />
Supplementary services 18,488,000 -500,000<br />
Closing balance 145,555,675 124,446,805<br />
The acquisition of fi nancial holdings refers essentially <strong>to</strong> <strong>the</strong> acquisition of subsidiary capital: Aura de Agudo (884,628 Euro),<br />
Aura de Guijo de Coria (1,329,943 Euro), <strong>Efacec</strong> Central Europe (244,137 Euro) and C&S EFACEC MV Índia (376,763 Euro). The<br />
shareholdings of <strong>the</strong> company in <strong>the</strong> main group and associated companies, none of which are quoted on s<strong>to</strong>ck exchanges, were<br />
as follows:<br />
31.12.2008 31.12.2007<br />
Value % Holding Cap. Propr. Value % Holding Cap. Propr.<br />
Group companies<br />
<strong>Efacec</strong> Energia, Máq. Equip. Elect. S.A. 34,882,194 100.0% 52,506,403 34,882,194 100.0% 41,652,659<br />
<strong>Efacec</strong> Engenharia, S.A. 7,481,968 100.0% 18,856,650 7,481,968 100.0% 11,817,985<br />
<strong>Efacec</strong> Ambiente 1,246,995 100.0% 8,105,582 1,246,996 100.0% 7,830,747<br />
<strong>Efacec</strong> Serviços Manutenção Assistênca, S,A. 2,849,772 38.0% 8,427,993 2,849,772 38.0% 7,498,994<br />
<strong>Efacec</strong> Sistemas de Electrónica, S.A. 8,203,618 100.0% 21,187,713 8,203,618 100.0% 20,970,724<br />
<strong>Efacec</strong> Au<strong>to</strong>mação e Robótica, S.A. 6,572,918 100.0% 6,104,570 6,572,918 100.0% 4,336,310<br />
<strong>Efacec</strong> Investimen<strong>to</strong>s e Concessões, SGPS, S.A. 1,350,000 75.0% 910,575 1,350,000 75.0% 849,152<br />
<strong>Efacec</strong> International Financing, SGPS 419,738 55.0% 732,067 419,738 55.0% 736,335<br />
<strong>Efacec</strong> Marketing Internacional, S.A. 3,307,628 100.0% 756,924 3,307,628 100.0% 1,827,662<br />
Gemp - Emprendim. Imobiliários, S.A. 142,157 100.0% 775,027 142,157 100.0% 810,859<br />
Empovar, S.A. 15,844,886 100.0% 4,210,845 15,844,886 100.0% 4,695,752<br />
Tech M5 Capital, SGPS 250,000 49.7% 1,438,875<br />
<strong>Efacec</strong> Angola, Lda. 1,269,165 98.3% 1,534,321 1,269,165 80.0% 539,540<br />
<strong>Efacec</strong> Moçambique, Lda. 5,649 2.4% 1,347,475 0 49.0% -1,697,601<br />
<strong>Efacec</strong> do Brasil, Lda. 521,813 3.9% 2,472,801 521,813 3.9% 3,089,311<br />
BAUEN <strong>Efacec</strong>, S.A. 679,797 76.6% 1,970,333 679,796 76.6% 1,197,045<br />
<strong>Efacec</strong> Praha, s.r.o. 263,223 100.0% 731,654 263,223 100.0% 979,817<br />
<strong>Efacec</strong> Malaysia SDN. BHD. (a) 12,097 1.0% 675,273 12,097 1.0% 658,736<br />
<strong>Efacec</strong> Sist. Venezuela, C.A. 88,721 65.0% 2,732 88,721 65.0% 2,583<br />
<strong>Efacec</strong> Central Europe Limited, SRL 244,137 100.0% 227,186<br />
Aura de Agudo, SL 884,628 100.0% 789<br />
Aura de Guijo de Coria, SL 1,329,943 100.0% -349<br />
C&S <strong>Efacec</strong> MV India Pvt. Ltd. 376,763 50.0% 441,452<br />
<strong>Efacec</strong> Contracting Central Europe GmbH 29,750 85.0% -315,518<br />
Associated companies<br />
88,007,560 85,386,690<br />
EID - Emp. Invest. Desenvolv. Elect.,S.A. 2,319,737 25.0% 10,903,557 2,319,737 25.0% 9,825,135<br />
O&M Serviços – Operação e Manutenção Industrial,<br />
S.A.<br />
10,000 2.0% 997,035 10,000 2.0% 899,199<br />
Liaoyang EFACEC Elect. Equip. Corp. (b) 812,428 36.3% 2,146,955 812,428 36.3% 2,153,624<br />
3,142,165 3,142,165<br />
Total Inv. in Group and Assoc. companies 91,149,725 88,528,855
a) The last accounts available were as at December 2007.<br />
b) The last accounts available were as at November 2006.<br />
The values shown correspond <strong>to</strong> <strong>the</strong> cost of acquisition of <strong>the</strong> holdings, except in those cases where an impairment loss had been<br />
recorded, presented in <strong>the</strong> following table:<br />
Acquisition Cost Impairment Net Value<br />
Liaoyang EFACEC Elect. Equip. Corp. 2,458,442 -1,646,014 812,428<br />
<strong>Efacec</strong> Moçambique, Lda. 123,827 -118,178 5,649<br />
EFACEC Angola, Lda. 1,370,545 -101,380 1,269,165<br />
3,952,814 -1,865,571 2,087,242<br />
This line also includes benefi ts and fi nancing loans <strong>to</strong> <strong>the</strong> following subsidiaries and associated companies:<br />
Supplementary Services<br />
61<br />
31.12. 2008 31.12. 2007<br />
<strong>Efacec</strong> Energia, Máquinas e Equipamen<strong>to</strong>s Eléctricos, S.A. 28,000,000 14,000,000<br />
<strong>Efacec</strong> Engenharia, S.A. 3,000,000 1,000,000<br />
<strong>Efacec</strong> Ambiente, S.A. 5,000,000 4,000,000<br />
<strong>Efacec</strong> Sistemas de Electrónica, S.A. 3,900,000 3,900,000<br />
<strong>Efacec</strong> Au<strong>to</strong>mação e Robótica, S.A. 2,000,000 600,000<br />
GEMP – Empreendimen<strong>to</strong>s Imobiliários, S.A. 600,000 600,000<br />
<strong>Efacec</strong> Moçambique, Lda. 88,000 0<br />
Financing Loans<br />
42,588,000 24,100,000<br />
Empovar, S.A. 1,997,596 1,997,596<br />
<strong>Efacec</strong> Serviços de Manutenção e Assistência, S.A. 8,038,315 8,038,315<br />
<strong>Efacec</strong> Au<strong>to</strong>mação e Robótica, S.A. 0 0<br />
<strong>Efacec</strong> Investimen<strong>to</strong>s e Concessões, SGPS, S.A. 1,319,420 1,319,420<br />
<strong>Efacec</strong> Angola, Lda. 350,171 350,171<br />
<strong>Efacec</strong> Moçambique, Lda. 112,448 112,448<br />
11,817,950 11,817,950<br />
Total Loans 54,405,950 35,917,950<br />
5.1 Financial investments in o<strong>the</strong>r companies<br />
This line includes <strong>the</strong> value of <strong>the</strong> shareholdings in O<strong>the</strong>r companies and loans granted. The movements during <strong>the</strong> year were as<br />
follows:<br />
31.12.2008 31.12.2007<br />
Opening balance 11,517 15,365<br />
Increase in share capital 0 0<br />
Acquisition of investments 163,158 0<br />
Disposal of investment 0 -3,848<br />
Financing Loans 359,259 0<br />
O<strong>the</strong>r 0 0<br />
Closing balance 533,934 11,517<br />
The movements within <strong>the</strong> period refer <strong>to</strong> <strong>the</strong> acquisition of a position in <strong>the</strong> share capital of MARL Energia - Central Fo<strong>to</strong>voltaica,<br />
SA and <strong>to</strong> <strong>the</strong> concession of a loan <strong>to</strong> <strong>the</strong> same company.<br />
6. Derivatives<br />
In relation <strong>to</strong> fi nancial risk management described in Note 2, <strong>the</strong> evaluation of fi nancial instruments as at 31 December 2008 and<br />
2007 was as follows:<br />
Interest rate risk<br />
As at 31 December 2008, <strong>Efacec</strong> featured a portfolio of interest rate derivatives <strong>to</strong>talling 87 million Euro for BEI loans and Commercial paper (Note<br />
12), whose market valuation was negative by 2,347,029 Euro.<br />
2008 Consolidated and<br />
Individual Financial Statements
62<br />
31.12.2008 31.12.2007<br />
Assets Liabilities Assets Liabilities<br />
Financing options - cash fl ow hedging 0 2,347,029 345,574 0<br />
Total 0 2,347,029 345,574 0<br />
Non-current 0 2,347,029 345,574 0<br />
Current 0 0 0 0<br />
The hedging option contracts were booked in Shareholders’ Funds as described in Note 2.2. The movement in <strong>the</strong> line Financial<br />
Instruments Reserves was <strong>the</strong> result of <strong>the</strong> change in fair value between <strong>the</strong> various reporting periods, less <strong>the</strong> related deferred<br />
tax assets/liabilities (note 15).<br />
7. Cus<strong>to</strong>mers and accrued income<br />
31.12.2008 31.12.2007<br />
Cus<strong>to</strong>mers - Current 34,407 22,224<br />
Cus<strong>to</strong>mers - Related parties (Note 23) 0 239,371<br />
Accrued Income - multi-year contracts 0 0<br />
34,407 261,594<br />
Provision for cus<strong>to</strong>mer accounts impairment 0 0<br />
Accounts Receivable from Cus<strong>to</strong>mers - Net 34,407 261,594<br />
Accrued Income - not covered by IFRS 7 231,974 0<br />
Total 266,381 261,594<br />
Non-current 0 0<br />
Current 266,381 261,594<br />
8. O<strong>the</strong>r deb<strong>to</strong>rs and deferred costs<br />
The breakdown of this line as at 31 December 2008 and 31 December 2007 was as follows:<br />
31.12.2008 31.12.2007<br />
O<strong>the</strong>r Deb<strong>to</strong>rs 327,559 665,565<br />
- Impairment Losses -249,399 -249,399<br />
Accounts receivable from o<strong>the</strong>r Deb<strong>to</strong>rs - net 78,160 416,166<br />
Accounts receivable from related parties (Note 23) 51,136,467 21,396,294<br />
O<strong>the</strong>r deb<strong>to</strong>rs - Financial assets IFRS7 51,214,627 21,812,461<br />
O<strong>the</strong>r Deb<strong>to</strong>rs - not covered by IFRS7 26,242 28,257<br />
State and o<strong>the</strong>r public entities 46,219 1,649,928<br />
Deferred costs 7,870 12,342<br />
Total 51,294,958 23,502,987<br />
Non-current 462,598 27,000<br />
Current 50,832,360 23,475,987<br />
All third party non-current debts are due within fi ve years of <strong>the</strong> balance sheet date.<br />
As at 31 December 2008 and 2007, <strong>the</strong> values <strong>to</strong> receive from O<strong>the</strong>r Deb<strong>to</strong>rs featured <strong>the</strong> following seniority analysis based on<br />
due dates for payment on balances outstanding:<br />
31.12.2008 31.12.2007<br />
Balances not due<br />
Balances due<br />
50,808,957 21,812,460<br />
Up <strong>to</strong> 90 days 0 0<br />
From 90 <strong>to</strong> 360 days 0 0<br />
Over 360 days 405,670 405,670<br />
O<strong>the</strong>r deb<strong>to</strong>rs - fi nancial assets IFRS 7 51,214,627 22,218,130<br />
Impairment -405,670 -405,670<br />
Net balance of o<strong>the</strong>r deb<strong>to</strong>rs - IFRS7 50,808,958 21,812,460
9. S<strong>to</strong>cks<br />
The company features no s<strong>to</strong>cks.<br />
10. Cash and cash equivalents<br />
11. Share Capital<br />
Cash and cash equivalents 31.12.2008 31.12.2007<br />
Cash and Sight Deposits 203,340 113,267<br />
Time Deposits 52,700,000 0<br />
Short-term cash investments 0 0<br />
52,903,339 113,267<br />
O<strong>the</strong>r fi nancial investments 31.12.2008 31.12.2007<br />
Captive deposits 6,236,577 0<br />
The authorised capital is made up of 41,641,416 ordinary registered shares each having a par value of 1 Euro, and is entirely paid<br />
up. The company does not hold any own shares.<br />
12. Debt <strong>to</strong> Credit Institutions<br />
As at 31 December 2008 and 31 December 2007, loans and bank overdrafts, <strong>the</strong>ir average annual interest rates and o<strong>the</strong>r conditions<br />
were as follows:<br />
31.12.2008 31.12.2007<br />
Non-current<br />
Bank loans 18,000,000 22,500,000<br />
Commercial paper 63,500,000 26,000,000<br />
Current<br />
81,500,000 48,500,000<br />
Bank loans 4,500,000 4,500,000<br />
Commercial paper 87,500,000 7,500,000<br />
Bank current accounts 13,986,688 6,156,341<br />
105,986,688 18,156,341<br />
Total loans 187,486,688 66,656,341<br />
Bank financing<br />
<strong>Efacec</strong> Capital has a long-term loan from 16 November 2004 with <strong>the</strong> European Investment Bank that as at 31 December 2008,<br />
registered a value of 22,500,000 Euro, of which 4,500,000 Euro booked in current liabilities. The loan features half-yearly interest<br />
rates indexed <strong>to</strong> Euribor rate, plus a maximum spread of 0.13%. The fi rst capital amortisation was on 15 June 2008 and <strong>the</strong> o<strong>the</strong>rs<br />
will be made on a yearly basis until 2013.<br />
Commercial paper<br />
On 8 July 2005, a Commercial Paper programme was agreed with a bank trade union, involving fi ve banks, up <strong>to</strong> a maximum<br />
value of 40,000,000 Euro. The programme has a contract period of 5 years with a requirement in excess of one year. The companies<br />
included in <strong>the</strong> Programme can issue Commercial Paper by direct placement or by auction. <strong>Efacec</strong> Capital made an issue of<br />
26,000,000 Euro which falls due on 12 January 2009.<br />
In November 2006, a Commercial Paper programme was agreed with <strong>the</strong> Santander Totta Bank <strong>to</strong> a maximum value of 7,500,000<br />
Euro. The programme has a contract period of 5 years with annual renewals. EFACEC Capital can issue Commercial Paper by direct<br />
placement. The current issues fall due on 13 de July de 2009.<br />
In November 2007, a Commercial Paper programme was agreed with <strong>the</strong> Fortis Bank <strong>to</strong> a maximum value of 12,500,000 Euro.<br />
The programme has a contract period of 5 years, which can be extended for periods of time <strong>to</strong> be agreed between <strong>the</strong> parties. The<br />
current issues fall due on 13 de November de 2009.<br />
63<br />
2008 Consolidated and<br />
Individual Financial Statements
In April 2008, a Commercial Paper programme was agreed with <strong>the</strong> Santander Totta Bank <strong>to</strong> a maximum value of 20,000,000<br />
Euro. This programme has a contract period of 3 years, and its reimbursement is made through half-yearly and consecutive amortisations<br />
<strong>to</strong> <strong>the</strong> value of 5,000,000 Euro, as of <strong>the</strong> 2nd year of <strong>the</strong> Programme. The current issues fall due on 15 de Oc<strong>to</strong>ber de<br />
2009.<br />
In June 2008, a Commercial Paper programme was agreed with Caixa Geral de Depósi<strong>to</strong>s <strong>to</strong> a maximum value of 30,000,000 Euro.<br />
This programme has a contract period of 3 years with one year exemption period and <strong>the</strong> reimbursement is carried out through<br />
half-yearly amortisations <strong>to</strong> <strong>the</strong> value of 7,500,000 €. There are two simultaneous issues, one <strong>to</strong> <strong>the</strong> value of 10,000,000 € which<br />
falls due on 21 April 2009 and <strong>the</strong> o<strong>the</strong>r <strong>to</strong> <strong>the</strong> value of 20,000,000 € which falls due on 2 February 2009.<br />
In August 2008, a Commercial Paper programme was agreed with <strong>the</strong> BPI Bank <strong>to</strong> a maximum value of 15,000,000 Euro. The<br />
programme has a contract period of 6 months without renewal. The current issues fall due on 30 January 2009.<br />
In September 2008, a Commercial Paper programme was agreed with BARCLAYS <strong>to</strong> a maximum value of 10,000,000 Euro. This<br />
programme comprises <strong>Efacec</strong> Group Companies and has period of 5 years with yearly renewals. <strong>Efacec</strong> Capital carried out an issue<br />
for <strong>the</strong> <strong>to</strong>tal Programme that falls due on 8 de April de 2009.<br />
In Oc<strong>to</strong>ber 2008, a Commercial Paper programme was agreed with <strong>the</strong> Banco Espíri<strong>to</strong> San<strong>to</strong> <strong>to</strong> a maximum value of 30,000,000<br />
Euro. This programme comprises <strong>Efacec</strong> Group Companies and has period of 5 years with yearly renewals. <strong>Efacec</strong> Capital carried<br />
out an issue for <strong>the</strong> <strong>to</strong>tal Programme that falls due on 05 May 2009.<br />
Bank overdrafts<br />
Bank overdrafts involve <strong>the</strong> use of current credit accounts according <strong>to</strong> limits and conditions previously negotiated with fi nancial<br />
institutions and without defi ned reimbursement periods, although <strong>the</strong>y are assumed <strong>to</strong> be of short duration. The average rate of<br />
<strong>the</strong>se credits is indexed <strong>to</strong> Euribor plus an average spread of 0.96%.<br />
Debt Maturity<br />
The maturity dates of <strong>the</strong> loans as at 31 December 2008 are as follows:<br />
< 1 year 1-5 years > 5 years Total<br />
Non-current<br />
Bank loans 18,000,000 18,000,000<br />
Commercial paper 63,500,000 63,500,000<br />
Bond loans 0 0<br />
Reimbursable Subsidies 0<br />
O<strong>the</strong>r loans 0<br />
0 81,500,000 0 81,500,000<br />
Current<br />
Bank overdrafts 13,986,688 13,986,688<br />
Bank loans 4,500,000 4,500,000<br />
Commercial paper 87,500,000 87,500,000<br />
Bond loans 0<br />
Bank current accounts 0<br />
Reimbursable Subsidies<br />
O<strong>the</strong>r loans<br />
0<br />
105,986,688 0 0 105,986,688<br />
Total loans 105,986,688 81,500,000 0 187,486,688<br />
Denomination of Loans<br />
The Company loans are all in Euro.<br />
Effective interest rates<br />
The effective interest rates as at <strong>the</strong> balance sheet date were as follows:<br />
64<br />
31.12.2008 31.12.2007<br />
Euro Euro<br />
Bank overdrafts 4.53% 4.91%<br />
Commercial paper 5.43% 4.74%<br />
Bank loans 3.50% 4.92%
The fair value of current and non-current bank loans is close <strong>to</strong> that of <strong>the</strong> balance sheet, in view of <strong>the</strong> fact that <strong>the</strong> contracted<br />
interest rate is <strong>the</strong> same as that of <strong>the</strong> market.<br />
Interest rate risk<br />
During 2008, <strong>the</strong> net cash outfl ow of interest was 6,423 thousand Euro (Note 18).<br />
Due <strong>to</strong> <strong>the</strong> growth of <strong>Efacec</strong> Capital and accrued fi nancing needs, <strong>the</strong> gross fi nancial debt as at 31 December 2008 <strong>to</strong>talled<br />
187,487 thousand Euro. On <strong>the</strong> o<strong>the</strong>r hand, interest rates tended <strong>to</strong> rise until <strong>the</strong> end of <strong>the</strong> third quarter. As at 31 December<br />
2008, <strong>the</strong> overall average rate of fi nancing of <strong>Efacec</strong> Capital was 5.131%.<br />
Statistically, as at 31 December 2008, this rate meant an annual gross cost of 9,620 thousand Euro. On <strong>the</strong> assumption that <strong>the</strong><br />
value of loans as of that date will continue, <strong>the</strong> sensitivity <strong>to</strong> changes in interest rates can be calculated as follows:<br />
December 2008 Final Rate Annual Cost Impact<br />
Reference fi gures (base 31 Dec.2008)<br />
Sensitivity<br />
5.13% 9,620,131<br />
If fi nal rate increases 1% 6.13% 11,494,998 1,874,867<br />
If fi nal rate decreases 1% 4.13% 7,745,265 -1,874,867<br />
December 2007 Final Rate Annual Cost Impact<br />
Reference fi gures (base 31 Dec.2007)<br />
Sensitivity<br />
4.81% 3,587,829<br />
If fi nal rate increases 1% 5.81% 4,333,739 745,910<br />
If fi nal rate decreases 1% 3.81% 2,841,919 -745,910<br />
If <strong>the</strong>re were a worsening of <strong>the</strong> overall average rate of 1%, <strong>the</strong> annual interest cost would be 11,495 thousand Euro. If on <strong>the</strong><br />
o<strong>the</strong>r hand <strong>the</strong>re were a relief in overall interest rates of 1%, <strong>the</strong> annual interest rate cost would be 7,745 thousand Euro. The<br />
gross impact would be +/- 1,875 thousand Euro.<br />
<strong>Efacec</strong> Capital manages <strong>the</strong> interest rate risk through derivatives contracted on its medium and long-term fi nancing, thus enabling<br />
<strong>the</strong> impact of interest changes <strong>to</strong> be mitigated (Note 6).<br />
Unused Credit Lines<br />
The Company also has <strong>the</strong> following credit lines that have not yet been used:<br />
31.12.2008 31.12.2007<br />
At variable rates<br />
Due within one year 4,031,124 15,155,000<br />
Due after 1 year 0 12,500,000<br />
4,031,124 27,655,000<br />
The credit lines due up <strong>to</strong> one year are annually au<strong>to</strong>matically renewed for working capital.<br />
13. Suppliers, credi<strong>to</strong>rs and accruals<br />
Suppliers 31.12.2008 31.12.2007<br />
Suppliers - Current account 133,907 10,331<br />
Suppliers - related parties (Note 23) 1,034,361 0<br />
Suppliers - bills payable 0 0<br />
Suppliers,invoices received and being checked -2,148 0<br />
1,166,121 10,331<br />
Fixed Assets Suppliers 74 412,611<br />
Total 1,166,195 422,942<br />
Non-current 0 0<br />
Current 1,166,195 422,942<br />
65<br />
2008 Consolidated and<br />
Individual Financial Statements
O<strong>the</strong>r Credi<strong>to</strong>rs 31.12.2008 31.12.2007<br />
O<strong>the</strong>r credi<strong>to</strong>rs - various 356,433 53,545<br />
O<strong>the</strong>r credi<strong>to</strong>rs: related parties 1,744,948 15,450,546<br />
O<strong>the</strong>r deb<strong>to</strong>rs - Financial assets IFRS7 2,101,381 15,504,091<br />
O<strong>the</strong>r various credi<strong>to</strong>rs not covered by IFRS7 245,736 0<br />
State and o<strong>the</strong>r public entities 914,434 281,294<br />
Cost Accruals: 390,856 545,616<br />
Cost Accruals - costs for work in progress 4,641 0<br />
Cost Accruals - remuneration <strong>to</strong> pay 218,248 148,476<br />
Cost Accruals - interest <strong>to</strong> pay 0 394,384<br />
Cost Accruals - insurance <strong>to</strong> pay 0 181<br />
Cost Accruals - o<strong>the</strong>r 167,968 2,576<br />
Total 3,652,407 16,331,001<br />
Non-current 0 0<br />
Current 3,652,407 16,331,001<br />
The current amount due <strong>to</strong> Suppliers, whe<strong>the</strong>r for services or fi xed assets, is almost entirely due within 90 days, which refl ects <strong>the</strong><br />
normal conditions negotiated with <strong>the</strong> Company’s Suppliers.<br />
14. Deferred income<br />
There is no Deferred Income.<br />
15. Deferred taxes<br />
Deferred tax assets and liabilities are set off against each o<strong>the</strong>r if <strong>the</strong> company has a legally executable right <strong>to</strong> set off current<br />
tax assets against current tax liabilities, and when <strong>the</strong> deferred taxes concern <strong>the</strong> same tax authority. End of year values were as<br />
follows:<br />
2008 2007<br />
Deferred tax assets<br />
Deferred tax assets recoverable after 12 months 1,221,721 598,579<br />
Deferred tax assets recoverable within 12 months 0 0<br />
Deferred tax liabilities<br />
1,221,721 598,579<br />
Deferred tax liabilities recoverable after 12 months 3,531,672 3,513,491<br />
Deferred tax liabilities recoverable within 12 months 0 0<br />
3,531,672 3,513,491<br />
Total -2,309,951 -2,914,912<br />
The movements on deferred tax assets and liabilities during <strong>the</strong> year were as follows:<br />
Impairment<br />
Losses Inv. Fin.<br />
Impairment Losses<br />
Cus<strong>to</strong>mers/O<strong>the</strong>r<br />
66<br />
Options Adjust. IFRS O<strong>the</strong>r Total<br />
As at 1 de January de 2007 564,025 0 15,447 27,432 606,904<br />
Carried <strong>to</strong> profi t and loss -294 0 -1,877 6,366 4,195<br />
Carried <strong>to</strong> equity 0 0 -12,520 -12,520<br />
O<strong>the</strong>r variations -41,412 41,412 0<br />
As at 31 de December de 2007 522,319 41,412 0 1,050 33,798 598,579<br />
Carried <strong>to</strong> profi t and loss 0 0 0 -885 2,064 1,179<br />
Carried <strong>to</strong> equity 0 0 621,963 0 0 621,963<br />
O<strong>the</strong>r variations 0 0 0 0 0 0<br />
As at 31,12,2008 522,319 41,412 621,963 165 35,862 1,221,721<br />
Deferred tax assets for provisions will be written off proportionately <strong>to</strong> <strong>the</strong> use of <strong>the</strong> related provisions.<br />
Deferred tax assets for provisions on investments correspond <strong>to</strong> shareholdings in Liaoyang <strong>Efacec</strong> Electric Equipment Corp. Ltd.<br />
and Portugal Space, SA.<br />
Deferred tax booked in shareholders’ funds during <strong>the</strong> period concerns hedging operations for fi nancing (Note 6).
Revaluation Options Total<br />
As at 1 de January de 2007 3,461,021 3,461,021<br />
Carried <strong>to</strong> profi t and loss -39,107 -39,107<br />
Carried <strong>to</strong> equity 91,577 91,577<br />
As at 31 de December de 2007 3,421,914 91,577 3,513,491<br />
Carried <strong>to</strong> profi t and loss -38,033 0 -38,033<br />
Carried <strong>to</strong> equity 147,790 -91,577 56,213<br />
As at 31.12.2008 3,531,672 0 3,531,672<br />
The deferred tax liabilities booked in Shareholders’ Equity relate <strong>to</strong> <strong>the</strong> update of <strong>the</strong> tax base for land and its revaluation <strong>to</strong> fair<br />
value in this fi nancial year.<br />
All deferred tax assets booked are based on a 26.5%- tax rate.<br />
16. Provisions for risks and charges<br />
67<br />
Pensions<br />
Financial Shareholdings<br />
Total<br />
As at 01.01.2007<br />
Carried <strong>to</strong> profi t and loss:<br />
103,515 1,534,297 1,637,812<br />
Additional provisions 24,025 0 24,025<br />
Reversal of provisions 0 0 0<br />
As at 31.12.2007 127,540 1,534,297 1,661,837<br />
Carried <strong>to</strong> profi t and loss:<br />
Additional provisions 7,790 0 7,790<br />
Reversal of provisions 0 0 0<br />
As at 31.12.2008 135,330 1,534,297 1,669,627<br />
This provision for fi nancial investment relates <strong>to</strong> fi nancial shareholdings that have impairment losses (<strong>Efacec</strong> Angola and <strong>Efacec</strong><br />
Moçambique), <strong>the</strong> investment value of which is wholly provisioned.<br />
There is no environmental contingent liability.<br />
2008 Consolidated and<br />
Individual Financial Statements
D. <strong>Notes</strong> <strong>to</strong> <strong>the</strong> Profit and Loss Account for <strong>the</strong> years ended 31 December 2008 and 2007<br />
17. Third Party Supplies and Services<br />
68<br />
2008 2007<br />
Subcontracts 0 0<br />
Specialised work 1,819,592 497,931<br />
Advertising and publicity 655,680 509,007<br />
Travel expenses and Accommodation 205,192 144,211<br />
Leasing and rentals 112,186 83,011<br />
Fees 29,591 8,527<br />
Fuel 26,381 19,146<br />
Expenses and representation 24,582 53,248<br />
O<strong>the</strong>r supplies and services 141,392 253,791<br />
3,014,597 1,568,872<br />
The most representative line is that of specialised work, whose progress in 2008 is related <strong>to</strong> <strong>the</strong> high number of projects underway<br />
connected <strong>to</strong> <strong>the</strong> organization and internationalisation of <strong>the</strong> Group that <strong>the</strong> company heads<br />
18. Financial Results<br />
18.1 Financial Costs - Net<br />
2008 2007<br />
Supported interest rates 6,423,212 3,587,936<br />
Obtained interest rates 3,385,127 1,660,236<br />
Net interest rates 3,038,085 1,927,700<br />
Net foreign exchange gains /losses -356 -348<br />
O<strong>the</strong>r 28,443 9,347<br />
Losses/Gains in group and associated companies<br />
3,066,172 1,936,699<br />
2008 2007<br />
Dividends received 20,695,444 26,469,663<br />
O<strong>the</strong>r 0 0<br />
The dividends received by <strong>the</strong> company were as follows:<br />
Dividends received<br />
20,695,444 26,469,663<br />
2008 2007<br />
<strong>Efacec</strong> Sistemas de Electrónica, S.A. 3,355,654 13,500,000<br />
<strong>Efacec</strong> Energy, Mach. 15,484,000 5,300,000<br />
<strong>Efacec</strong> Ambiente, S.A. 0 3,360,000<br />
<strong>Efacec</strong> Ambiente, S.A. 0 3,092,000<br />
Tech M5 Capital, SGPS, SA (a) 0 905,037<br />
<strong>Efacec</strong> Serv. Manutenção e Assistência, SA 418,000 312,626<br />
<strong>Efacec</strong> Marketing Internacional, S.A. 1,436,000 0<br />
O&M Serviços, S.A. 1,790 0<br />
20,695,444 26,469,663<br />
b) Merger in 2006 with <strong>Efacec</strong> – Sistemas Electrónica, SA
19. Income Tax<br />
The reconciliation of <strong>the</strong> tax rate is as follows:<br />
20. Profit per share<br />
2008 2007<br />
Current tax 85,914 -220,588<br />
Deferred tax (note 15) 39,212 43,302<br />
Tax charge for <strong>the</strong> period 125,126 -177,286<br />
Tax from previous years 4,456 46,331<br />
129,582 -130,956<br />
2008 2007<br />
Profi t before tax 19,950,656 26,907,621<br />
Theoretical rate 26.5% 26.5%<br />
Theoretical tax<br />
Permanent differences<br />
5,286,924 7,130,520<br />
Dividends received -5,484,293 -7,014,461<br />
Costs not accepted fi scally 13,314 89,265<br />
O<strong>the</strong>r 58,929 -28,038<br />
Tax charge for <strong>the</strong> period -125,126 177,286<br />
Effective rate -0.6% 0.7%<br />
Basic<br />
The basic profi t per share is calculated by dividing shareholders’ profi t by <strong>the</strong> average weighted number of ordinary shares issued<br />
during <strong>the</strong> year, excluding ordinary shares acquired by <strong>the</strong> company and held as own shares.<br />
2008 2007<br />
Profi t attributable <strong>to</strong> shareholders 20,080,238 26,776,666<br />
Average weighted number of ordinary shares issued 41,641,416 41,641,416<br />
Basic profi t per share (€ per share) 0.48 0.64<br />
Diluted<br />
The diluted profi t per share is calculated adjusting <strong>the</strong> average weighted number of shares in circulation by including <strong>the</strong> impact<br />
of <strong>the</strong> conversion of all potentially diluting ordinary shares. In view of <strong>the</strong> fact that <strong>the</strong>re are no options or convertible obligations<br />
on shares, <strong>the</strong> diluted profi t per share is equal <strong>to</strong> <strong>the</strong> basic profi t per share.<br />
21. Dividends per share<br />
The dividend distribution of <strong>Efacec</strong> Capital SGPS, for 2008 and 2007, including anticipated distributions of profi t was as follows:<br />
69<br />
2008 2007<br />
Dividends paid<br />
Pertaining <strong>to</strong> fi nancial year 2006 7,537,096<br />
Pertaining <strong>to</strong> fi nancial year 2007 13,221,000 12,216,000<br />
Pertaining <strong>to</strong> fi nancial year 2008 6,034,000<br />
Total 19,255,000 19,753,096<br />
Average weighted number of ordinary shares issued 41,641,416 41,641,416<br />
Dividends per share (€ per share) 0.46 0.47<br />
2008 Consolidated and<br />
Individual Financial Statements
E. O<strong>the</strong>r <strong>Notes</strong><br />
22. Contingencies<br />
22.1 Guarantees<br />
The company has contingent liabilities for bank guarantees and o<strong>the</strong>rs, and o<strong>the</strong>r contingencies connected with its business. It is<br />
not believed that any signifi cant liabilities will arise from <strong>the</strong> contingent liabilities.<br />
22.1 Commitments<br />
70<br />
2008 2007<br />
Bank Guarantees 93,810,566 36,135,702<br />
Investment commitments<br />
There are no commitments assumed by <strong>the</strong> company <strong>to</strong> acquire tangible or intangible fi xed assets.<br />
Commitments for operational leases – where <strong>the</strong> Group is lessee<br />
The company leases a number of vehicles through irrevocable leasing contracts. The contracts have various lease periods, readjustment<br />
clauses and renewal rights. At <strong>the</strong> date of <strong>the</strong> balance sheet, <strong>the</strong> company continued <strong>to</strong> have Long-Term Rental contracts<br />
(“Renting”) considered as operational leases, for which future rental payments due <strong>to</strong>talled 176,714 Euro, with <strong>the</strong> following maturity<br />
dates:<br />
23. Transactions with related parties<br />
2008 2007<br />
Within 1 year 66,343 74,801<br />
Between 1 and 5 years 110,371 124,997<br />
Over 5 years 0 0<br />
176,714 199,798<br />
Those entities which have a qualifi ed shareholding in <strong>the</strong> group are:<br />
<strong>Efacec</strong> Sistemas de Gestão, S.A. 49.20%<br />
Têxtil Manuel Gonçalves, S.A. 25.40%<br />
José de Mello - SGPS, S.A. 25.40%<br />
The following transactions <strong>to</strong>ok place with related parties (Group companies, Associates and Direc<strong>to</strong>rs):<br />
23.1 Transactions in 2008 and 2007<br />
2008 2007<br />
Financial transactions<br />
Group companies<br />
Loans granted 24,674,954 14,393,837<br />
Loans received 11,255,546 12,373,840<br />
Dividends received<br />
Associated companies<br />
20,693,654 26,469,663<br />
Dividends received<br />
Shareholders<br />
1,790 0<br />
Loans received 1,195,000 7,100,000<br />
8,471,036 31,549,665<br />
%
2008 2007<br />
Current transactions<br />
Group companies<br />
Operatinonal income and gains 8,573,926 6,239,808<br />
Operational costs and losses 253,998 399,109<br />
Financial income and gains 3,085,694 1,653,563<br />
Financial costs and losses<br />
Shareholders<br />
77,428 981,718<br />
Operatinonal income and gains 450,406 30,000<br />
Operational costs and losses 356,774 350,963<br />
Financial costs and losses 358,558 52,079<br />
11,063,268 6,139,503<br />
The commercial conditions under which <strong>the</strong>se transactions and services <strong>to</strong>ok place were under <strong>the</strong> same conditions for independent<br />
third parties.<br />
23.2 Final balances resulting from commercial transactions<br />
2008 2007<br />
Debts owed by related parties<br />
Group companies<br />
Loans granted 41,997,890 17,479,207<br />
Cus<strong>to</strong>mers and income accruals (note 7) 0 205,589<br />
O<strong>the</strong>rs deb<strong>to</strong>rs and deferred costs (note 8)<br />
Shareholders<br />
9,055,925 3,581,181<br />
Cus<strong>to</strong>mers and income accruals (note 7) 0 33,781<br />
O<strong>the</strong>rs deb<strong>to</strong>rs and deferred costs (note 8)<br />
O<strong>the</strong>r entities<br />
59,941 313,195<br />
O<strong>the</strong>rs deb<strong>to</strong>rs and deferred costs (note 8) 22,711 22,711<br />
51,136,467 21,635,665<br />
2008 2007<br />
Debt <strong>to</strong> related parties<br />
Group companies<br />
Loans received 1,064,926 12,320,471<br />
Suppliers (Note 13) 603,980 0<br />
O<strong>the</strong>r credi<strong>to</strong>rs (note 13)<br />
Shareholders<br />
473,568 3,016,873<br />
Loans received 8,295,000 7,100,000<br />
Suppliers (Note 13) 430,381 0<br />
O<strong>the</strong>r credi<strong>to</strong>rs (note 13)<br />
O<strong>the</strong>r entities<br />
194,879 101,625<br />
O<strong>the</strong>r credi<strong>to</strong>rs (note 13) 11,576 11,576<br />
11,074,310 22,550,545<br />
71<br />
2008 Consolidated and<br />
Individual Financial Statements
23.2 Detail by Entity of Balances with Related Parties<br />
2008 2007<br />
Group companies:<br />
<strong>Efacec</strong> Sistemas de Electrónica, SA 14,307,573 11,755,832<br />
Aura de Guijo de Coria, SL 9,008,930 0<br />
Aura de Agudo, SL 6,011,070 0<br />
<strong>Efacec</strong> Marketing Internacional, SA 4,059,963 -627,070<br />
<strong>Efacec</strong> - Energia, Máquinas e Equip. Eléctrico, SA 3,839,207 1,131,430<br />
<strong>Efacec</strong> Au<strong>to</strong>mação e Robótica, SA 3,200,394 -168,290<br />
<strong>Efacec</strong> Engenharia,SA 1,890,434 -4,218,454<br />
<strong>Efacec</strong> - Serviços de Manutenção e Assistência, SA 1,441,414 3,408,685<br />
<strong>Efacec</strong> Sistemas de Electrónica, SA 1,193,230 0<br />
<strong>Efacec</strong> Contracting Central Europe GmbH 725,000 0<br />
<strong>Efacec</strong> Angola, Lda. 435,598 450,359<br />
<strong>Efacec</strong> Ambiente, SA 337,590 -5,738,947<br />
Tech M5 Capital, SGPS 0 -1,186,000<br />
O<strong>the</strong>r 2,460,948 1,121,089<br />
Shareholders:<br />
48,911,341 5,928,633<br />
<strong>Efacec</strong> Sistemas de Gestão - Loans -8,295,000 -7,100,000<br />
<strong>Efacec</strong> Sistemas de Gestão - Current -565,319 245,351<br />
O<strong>the</strong>r entities:<br />
-8,860,319 -6,854,649<br />
Portugal Space, S.A. 156,271 156,271<br />
O<strong>the</strong>r 11,136 11,136<br />
167,407 167,407<br />
Impairment -156,271 -156,271<br />
23.4 Commitments and contingencies<br />
There are no purchase commitments or contingent liabilities pertaining <strong>to</strong> related parties.<br />
23.5 Remuneration of <strong>the</strong> Board of Direc<strong>to</strong>rs<br />
Leça do Balio, 27 March 2009<br />
The Chartered Accountant<br />
Ms. Ana Paula Baltar Castro Ferreira<br />
The Board of Direc<strong>to</strong>rs<br />
72<br />
11,136 11,136<br />
2008 2007<br />
Remunerations 1,458,704 667,103<br />
Life insurances / Pension Plans 5,646 28,700<br />
Allowances 50,159 0<br />
1,514,509 695,803<br />
Mr. Francisco de la Fuente Sánchez - Chairman<br />
Mr. Luís Filipe da Conceição Pereira - Vice-Chairman<br />
Mr. Alber<strong>to</strong> Joaquim Milheira Barbosa - Board Member<br />
Mr. Alber<strong>to</strong> de Freitas Martins - Board Member<br />
MR. Artur Fuchs - Board Member<br />
Ms. Maria do Rosário Mayoral Robles Machado Simões Ventura - Board Member<br />
Prof. António do Prado Nogueira Leite - Board Member<br />
Prof. Daniel Bessa Fernandes Coelho - Board Member<br />
Prof. João Afonso Ramalho Sopas Pereira Ben<strong>to</strong> - Board Member<br />
Mr. José Manuel Gonçalves de Morais Cabral - Board Member<br />
Mr. Luís Miguel Nogueira Freire Cortes Martins - Board Member
To <strong>the</strong> Shareholders,<br />
Report and Opinion of <strong>the</strong> Supervisory Board<br />
1. In accordance with <strong>the</strong> law and <strong>the</strong> mandate conferred upon us, we herewith submit on our report and opinion on <strong>the</strong> Board<br />
of Direc<strong>to</strong>rs’ Report and <strong>the</strong> Consolidated and Individual Financial Statements of EFACEC Capital, S.G.P.S., S.A., presented by <strong>the</strong><br />
Board of Direc<strong>to</strong>rs for <strong>the</strong> year ended 31st December 2008;<br />
2. The Report and <strong>the</strong> Consolidated and Individual Financial Statements show clearly what happened during <strong>the</strong> fi nancial year and<br />
from its contents it can be inferred <strong>the</strong> reality of <strong>the</strong> company inclusively its perspectives for <strong>the</strong> future in accordance with clause<br />
66 of <strong>the</strong> Code of <strong>the</strong> Commercial Companies;<br />
3. We did not record any situation that did not respect <strong>the</strong> applicable statutes or legal rules;<br />
4. We analysed <strong>the</strong> Legal Certifi cation of <strong>the</strong> Consolidated and Individual Statements with which we agree and appended here<strong>to</strong>.<br />
On <strong>the</strong>se terms we are of <strong>the</strong> opinion that <strong>the</strong> General Shareholders Meeting approves:<br />
Por<strong>to</strong>, 31st March 2009<br />
a) The Report and <strong>the</strong> Consolidated and Individual Financial Statements for <strong>the</strong> year ended 31st December 2008;<br />
b) The proposal for profi t appropriation, as stated in <strong>the</strong> Annual Report.<br />
The Supervisory Board<br />
Mr. Luís Valente de Oliveira<br />
Chairman<br />
Ms. Maria Leonor Aires<br />
Board<br />
Mr. Luís Black Freire d’Andrade<br />
Board<br />
73<br />
2008 Consolidated and<br />
Individual Financial Statements
Introduction<br />
Report of Statu<strong>to</strong>ry Audi<strong>to</strong>rs<br />
1. We have audited <strong>the</strong> <strong>consolidated</strong> and individual fi nancial <strong>statements</strong> of EFACEC Capital, SGPS, S.A., comprising <strong>the</strong> <strong>consolidated</strong><br />
and individual balance sheet as at 31 December 2008, (which shows <strong>to</strong>tal assets of Euros 655,729,383 and Euros 283,772,677,<br />
respectively, a <strong>to</strong>tal <strong>consolidated</strong> equity of Euros 79,322,337 including <strong>to</strong>tal minority interests of Euros 3,386,358, an individual<br />
equity of Euros 75,624,059, and a net <strong>consolidated</strong> profi t of Euros 24,136,981 and a net individual profi t of Euros 20,080,238),<br />
<strong>the</strong> <strong>consolidated</strong> <strong>statements</strong> of income by nature, <strong>the</strong> <strong>consolidated</strong> statement of changes in equity and <strong>the</strong> <strong>consolidated</strong> cash<br />
fl ow statement for <strong>the</strong> year <strong>the</strong>n ended and <strong>the</strong> corresponding notes <strong>to</strong> <strong>the</strong> accounts.<br />
Responsibilities<br />
2. It is <strong>the</strong> responsibility of <strong>the</strong> Company’s Management <strong>to</strong> prepare <strong>the</strong> Direc<strong>to</strong>rs’ Report and Consolidated and Individual Financial<br />
Statements that present fairly, in all material respects, <strong>the</strong> fi nancial position of <strong>the</strong> company and its subsidiaries, <strong>the</strong> <strong>consolidated</strong><br />
and individual changes in equity, <strong>the</strong> <strong>consolidated</strong> and individual result of <strong>the</strong>ir operations, and <strong>the</strong>ir <strong>consolidated</strong> and individual<br />
cash fl ows, as well as <strong>to</strong> adopt appropriate accounting policies and criteria and <strong>to</strong> maintain adequate systems of internal<br />
accounting controls.<br />
3. Our responsibility is <strong>to</strong> express an independent and professional opinion on <strong>the</strong>se <strong>consolidated</strong> and individual fi nancial <strong>statements</strong><br />
based on our examination.<br />
Scope<br />
4. Except as discussed in <strong>the</strong> paragraph 7 below, we conducted our examination in accordance with <strong>the</strong> Standards and Technical<br />
Recommendations approved by <strong>the</strong> Institute of Statu<strong>to</strong>ry Audi<strong>to</strong>rs which require that we plan and perform <strong>the</strong> examination <strong>to</strong><br />
obtain reasonable assurance about whe<strong>the</strong>r <strong>the</strong> <strong>consolidated</strong> and individual fi nancial <strong>statements</strong> are free of material misstatement.<br />
Accordingly, our examination included: (i) verifi cation that <strong>the</strong> subsidiary´s fi nancial <strong>statements</strong> have been examined<br />
and for <strong>the</strong> cases where such an examination was not carried out, verifi cation, on a test basis, of <strong>the</strong> evidence supporting <strong>the</strong><br />
amounts and disclosures in <strong>the</strong> <strong>consolidated</strong> fi nancial <strong>statements</strong>, and assessing <strong>the</strong> reasonableness of <strong>the</strong> estimates, based on<br />
<strong>the</strong> judgments and criteria of Management used in <strong>the</strong> preparation of <strong>the</strong> <strong>consolidated</strong> and individual fi nancial <strong>statements</strong>; (ii)<br />
verifi cation of <strong>the</strong> consolidation operations and, when applicable, <strong>the</strong> utilization of <strong>the</strong> equity method; (iii) assessing <strong>the</strong> appropriateness<br />
and consistency of <strong>the</strong> accounting principles used and <strong>the</strong>ir disclosure, as applicable; (iv) assessing <strong>the</strong> applicability<br />
of <strong>the</strong> going concern basis of accounting; and (v) evaluating <strong>the</strong> overall presentation of <strong>the</strong> <strong>consolidated</strong> and individual fi nancial<br />
<strong>statements</strong>.<br />
5. Our audit also covered <strong>the</strong> verifi cation that <strong>the</strong> <strong>consolidated</strong> and individual fi nancial information included in <strong>the</strong> management<br />
report is in agreement with <strong>the</strong> <strong>consolidated</strong> and individual fi nancial <strong>statements</strong>.<br />
6. We believe that our examination provides a reasonable basis for our opinion.<br />
Qualifi cation<br />
7. The fi nancial <strong>statements</strong> of <strong>the</strong> subsidiary, <strong>Efacec</strong> Brasil, have not been integrated for consolidation purpose, as no fi nancial<br />
information was available at year end. As a result, we cannot determine <strong>the</strong> effect on Consolidated Financial Statements as at<br />
31 December 2008.<br />
Opinion<br />
8. In our opinion, except for <strong>the</strong> effects of such adjustments, if any, as might have been determined <strong>to</strong> be necessary, if <strong>the</strong> scope<br />
limitations referred <strong>to</strong> in paragraph nº 7 above had not existed, <strong>the</strong> <strong>consolidated</strong> and individual fi nancial <strong>statements</strong> referred <strong>to</strong><br />
above, present fairly in all material respects, <strong>the</strong> <strong>consolidated</strong> and individual fi nancial position of EFACEC Capital, SGPS, S.A as<br />
at 31 December 2008, <strong>the</strong> <strong>consolidated</strong> and individual results of <strong>the</strong>ir operations and <strong>the</strong>ir cash fl ows for <strong>the</strong> year <strong>the</strong>n ended<br />
in accordance with International Financial Reporting Standards as adopted by <strong>the</strong> EU.<br />
Por<strong>to</strong>, 3 April 2009<br />
PricewaterhouseCoopers & Associados, S.R.O.C., Lda.<br />
Represented by:<br />
António Joaquim Brochado Correia, R.O.C.<br />
74