


Create successful ePaper yourself
Turn your PDF publications into a flip-book with our unique Google optimized e-Paper software.
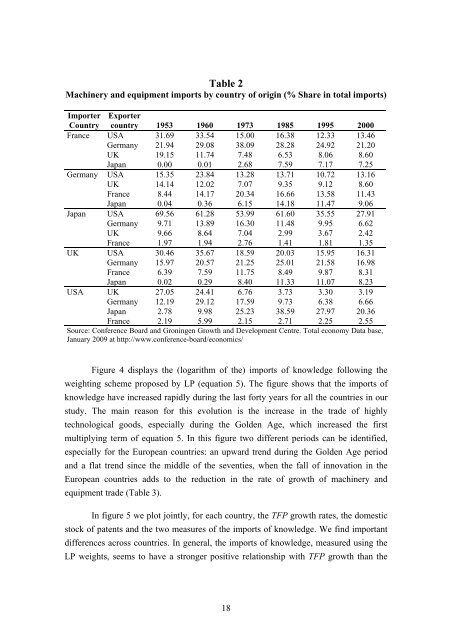
Table 2<br />
Machinery and equipment imports by country of origin (% Share in total imports)<br />
Importer<br />
Country<br />
Exporter<br />
country 1953 1960 1973 1985 1995 2000<br />
France USA 31.69 33.54 15.00 16.38 12.33 13.46<br />
Germany 21.94 29.08 38.09 28.28 24.92 21.20<br />
UK 19.15 11.74 7.48 6.53 8.06 8.60<br />
Japan 0.00 0.01 2.68 7.59 7.17 7.25<br />
Germany USA 15.35 23.84 13.28 13.71 10.72 13.16<br />
UK 14.14 12.02 7.07 9.35 9.12 8.60<br />
France 8.44 14.17 20.34 16.66 13.58 11.43<br />
Japan 0.04 0.36 6.15 14.18 11.47 9.06<br />
Japan USA 69.56 61.28 53.99 61.60 35.55 27.91<br />
Germany 9.71 13.89 16.30 11.48 9.95 6.62<br />
UK 9.66 8.64 7.04 2.99 3.67 2.42<br />
France 1.97 1.94 2.76 1.41 1.81 1.35<br />
UK USA 30.46 35.67 18.59 20.03 15.95 16.31<br />
Germany 15.97 20.57 21.25 25.01 21.58 16.98<br />
France 6.39 7.59 11.75 8.49 9.87 8.31<br />
Japan 0.02 0.29 8.40 11.33 11.07 8.23<br />
USA UK 27.05 24.41 6.76 3.73 3.30 3.19<br />
Germany 12.19 29.12 17.59 9.73 6.38 6.66<br />
Japan 2.78 9.98 25.23 38.59 27.97 20.36<br />
France 2.19 5.99 2.15 2.71 2.25 2.55<br />
Source: Conference Board and Groningen Growth and Development Centre. Total economy Data base,<br />
January 2009 at http://www.conference-board/economics/<br />
Figure 4 displays the (logarithm of the) imports of knowledge following the<br />
weighting scheme proposed by LP (equation 5). The figure shows that the imports of<br />
knowledge have increased rapidly during the last forty years for all the countries in our<br />
study. The main reason for this evolution is the increase in the trade of highly<br />
technological goods, especially during the Golden Age, which increased the first<br />
multiplying term of equation 5. In this figure two different periods can be identified,<br />
especially for the European countries: an upward trend during the Golden Age period<br />
and a flat trend since the middle of the seventies, when the fall of innovation in the<br />
European countries adds to the reduction in the rate of growth of machinery and<br />
equipment trade (Table 3).<br />
In figure 5 we plot jointly, for each country, the TFP growth rates, the domestic<br />
stock of patents and the two measures of the imports of knowledge. We find important<br />
differences across countries. In general, the imports of knowledge, measured using the<br />
LP weights, seems to have a stronger positive relationship with TFP growth than the<br />
18


