

The role of ICT in reducing carbon emissions in the EU
ICT_Carbon_Reduction_EU
ICT_Carbon_Reduction_EU

You also want an ePaper? Increase the reach of your titles
YUMPU automatically turns print PDFs into web optimized ePapers that Google loves.
<strong>The</strong> <strong>role</strong> <strong>of</strong> <strong>ICT</strong> <strong>in</strong> reduc<strong>in</strong>g <strong>carbon</strong> <strong>emissions</strong> <strong>in</strong> <strong>the</strong> <strong>EU</strong> - May 2016<br />
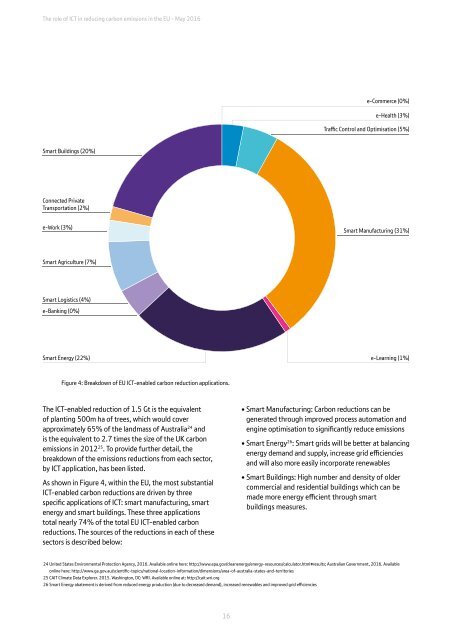
e-Commerce (0%)<br />
e-Health (3%)<br />
Traffic Control and Optimisation (5%)<br />
Smart Build<strong>in</strong>gs (20%)<br />
Connected Private<br />
Transportation (2%)<br />
e-Work (3%)<br />
Smart Manufactur<strong>in</strong>g (31%)<br />
Smart Agriculture (7%)<br />
Smart Logistics (4%)<br />
e-Bank<strong>in</strong>g (0%)<br />
Smart Energy (22%)<br />
e-Learn<strong>in</strong>g (1%)<br />
Figure 4: Breakdown <strong>of</strong> <strong>EU</strong> <strong>ICT</strong>-enabled <strong>carbon</strong> reduction applications.<br />
<strong>The</strong> <strong>ICT</strong>-enabled reduction <strong>of</strong> 1.5 Gt is <strong>the</strong> equivalent<br />
<strong>of</strong> plant<strong>in</strong>g 500m ha <strong>of</strong> trees, which would cover<br />
approximately 65% <strong>of</strong> <strong>the</strong> landmass <strong>of</strong> Australia 24 and<br />
is <strong>the</strong> equivalent to 2.7 times <strong>the</strong> size <strong>of</strong> <strong>the</strong> UK <strong>carbon</strong><br />
<strong>emissions</strong> <strong>in</strong> 2012 25 . To provide fur<strong>the</strong>r detail, <strong>the</strong><br />
breakdown <strong>of</strong> <strong>the</strong> <strong>emissions</strong> reductions from each sector,<br />
by <strong>ICT</strong> application, has been listed.<br />
As shown <strong>in</strong> Figure 4, with<strong>in</strong> <strong>the</strong> <strong>EU</strong>, <strong>the</strong> most substantial<br />
<strong>ICT</strong>-enabled <strong>carbon</strong> reductions are driven by three<br />
specific applications <strong>of</strong> <strong>ICT</strong>: smart manufactur<strong>in</strong>g, smart<br />
energy and smart build<strong>in</strong>gs. <strong>The</strong>se three applications<br />
total nearly 74% <strong>of</strong> <strong>the</strong> total <strong>EU</strong> <strong>ICT</strong>-enabled <strong>carbon</strong><br />
reductions. <strong>The</strong> sources <strong>of</strong> <strong>the</strong> reductions <strong>in</strong> each <strong>of</strong> <strong>the</strong>se<br />
sectors is described below:<br />
• Smart Manufactur<strong>in</strong>g: Carbon reductions can be<br />
generated through improved process automation and<br />
eng<strong>in</strong>e optimisation to significantly reduce <strong>emissions</strong><br />
• Smart Energy 26 : Smart grids will be better at balanc<strong>in</strong>g<br />
energy demand and supply, <strong>in</strong>crease grid efficiencies<br />
and will also more easily <strong>in</strong>corporate renewables<br />
• Smart Build<strong>in</strong>gs: High number and density <strong>of</strong> older<br />
commercial and residential build<strong>in</strong>gs which can be<br />
made more energy efficient through smart<br />
build<strong>in</strong>gs measures.<br />
24 United States Environmental Protection Agency, 2016. Available onl<strong>in</strong>e here: http://www.epa.gov/cleanenergy/energy-resources/calculator.html#results; Australian Government, 2016. Available<br />
onl<strong>in</strong>e here: http://www.ga.gov.au/scientific-topics/national-location-<strong>in</strong>formation/dimensions/area-<strong>of</strong>-australia-states-and-territories<br />
25 CAIT Climate Data Explorer. 2015. Wash<strong>in</strong>gton, DC: WRI. Available onl<strong>in</strong>e at: http://cait.wri.org<br />
26 Smart Energy abatement is derived from reduced energy production (due to decreased demand), <strong>in</strong>creased renewables and improved grid efficiencies<br />
16