Urban ecology - The Baltic Sea Project
Urban ecology - The Baltic Sea Project
Urban ecology - The Baltic Sea Project

You also want an ePaper? Increase the reach of your titles
YUMPU automatically turns print PDFs into web optimized ePapers that Google loves.
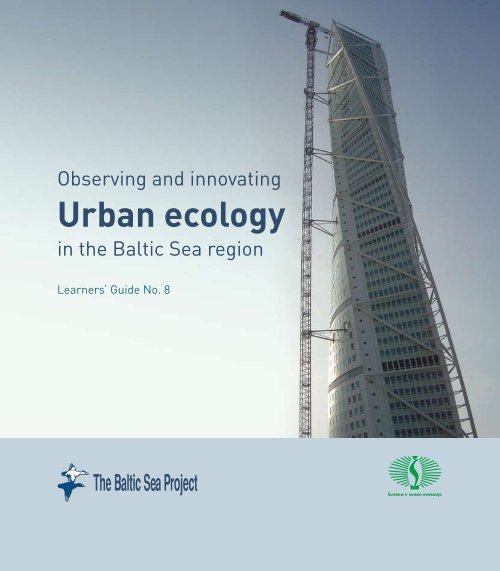
Observing and innovating<br />
<strong>Urban</strong> <strong>ecology</strong><br />
in the <strong>Baltic</strong> <strong>Sea</strong> region<br />
Learners’ Guide No. 8<br />
<strong>The</strong> <strong>Baltic</strong> <strong>Sea</strong> <strong>Project</strong>
Observing and innovating<br />
<strong>Urban</strong> <strong>ecology</strong><br />
in the <strong>Baltic</strong> <strong>Sea</strong> region<br />
Learners’ Guide No. 8<br />
<strong>The</strong> <strong>Baltic</strong> <strong>Sea</strong> <strong>Project</strong>
ISBN 978-9986-528-14-2<br />
2009<br />
Editor’s note<br />
This book has been produced within the UNESCO Associated Schools network „<strong>The</strong> <strong>Baltic</strong> <strong>Sea</strong> <strong>Project</strong>“ as „Learners Guide No. 8“<br />
about <strong>Urban</strong> Ecology, Vilnius 2009. <strong>The</strong> previous titles can be seen and a number of them downloaded from BSP website<br />
www.bspinfo.lt<br />
Further information about BSP on this website.<br />
To the reader<br />
This is basically a geography handbook in the sense that urban development and life mainly is regarded from the classical geographical<br />
point of view which tells that the cultivated landscape and first of all the towns and cities are man made. <strong>The</strong>y are technological and social<br />
constructions, made by the humans who use nature as location, a workshop or a resource chamber.<br />
Through a long history of the humans, this practice has changed the nature a lot, and consequently, the response from the nature is still growth<br />
of cities and still increasing use of natural resources, both of which are similar powerful changes of the natural balance.<br />
<strong>The</strong>y are known as climate changes, pollution, environmental problems, a wide range of which have been described and analysed for the sake<br />
of inspiration and education in the previously edited “Learners Guides” from this school network.<br />
<strong>The</strong> purpose of this book No. 8 is to inspire the reader (teachers, students and pupils of the <strong>Baltic</strong> region) to use their already trained skills<br />
against the environmental problems caused by the growing cities.<br />
<strong>The</strong>se problems will not be minor in the future due to the perspective to have a doubled number of citizens in the World within the next 40<br />
years. Solutions to the problems require more awareness and knowledge, which is the way to create more sustainable cities. Let us hope that the<br />
handbook will help stimulate this process.<br />
Per Werge<br />
Edition: August 2009.
Preface by the BSP International Coordinator 2009<br />
Natural environment surrounding us is the base for existence and survival of humanity, particularly in the 21st century when a considerable<br />
part of our world surface is covered artificially. However, urbanization is picking up its speed towards its growth and sometimes it seems that to<br />
implement the future vision of sustainable development in such conditions is impossible. Fortunately, the requirements of the increasing world<br />
population have lately started to match the awareness of life harmony. <strong>The</strong> challenges of sustainable development have become the right way<br />
guide for urbanization, and research into urban <strong>ecology</strong> helps humanity realize their living environment as a living ecosystem with all nature<br />
valuables which is a safeguard for better quality of health and life.<br />
A reasonable compromise to be reached between developing cities, people and nature is our basic mission and the reason for publishing the<br />
book ”<strong>The</strong> <strong>Baltic</strong> <strong>Sea</strong> project Learners’ Guide No. 8”. Improved ecological knowledge amongst students and teachers from the <strong>Baltic</strong> <strong>Sea</strong><br />
countries, also their close cooperation will lead to more awareness of the most sensitive issues of urbanization. Success of our future life depends<br />
on both all and each of us.<br />
I would like to express my appreciation to the international editorial team for preparing BSP Learners’ Guide No. 8, particularly Soren<br />
Levring, the author of “<strong>Urban</strong> <strong>ecology</strong>” core idea and the initiator of a guide edition, also Per Werge for his profound good-will input as an<br />
editor. I am thankful to Stanislav Babitch, a member of the editorial team, for his efforts in preparation of the guide, and also other authors<br />
for contributing to it with their informative articles. And finally I am grateful to Lithuanian Young Naturalist Centre, Lithuanian Ministry<br />
of Education and Science and Danish ASP-board for sponsoring this publication.<br />
I deeply believe that all of you live to the principles of sustainability, therefore I wish you to spread sensible urban ideas among people around<br />
you. Good luck in practicing with the guide!<br />
Miglė Simanavičienė<br />
General and national coordinator of<br />
the <strong>Baltic</strong> <strong>Sea</strong> <strong>Project</strong> within UNESCO ASPnet
6<br />
digital<br />
camera<br />
Diagram of the learning environment<br />
nesting box<br />
camera<br />
ACTIVE<br />
CITIZEN<br />
scientific thinking<br />
Castle<br />
harbour<br />
roads<br />
adult community<br />
college<br />
applying<br />
Gate<br />
Gate<br />
teacher<br />
reasoning<br />
Market<br />
1 km<br />
parks<br />
poster<br />
streets<br />
display case<br />
group<br />
intelligence<br />
emotions<br />
Water mill<br />
ortfolio ofwater analysis<br />
Market town 1300-1800<br />
Jolkbynjoki<br />
Government<br />
/ pw 2009<br />
Trade+Citizens<br />
Workshops and craftsmen<br />
Lower class housing and gardens<br />
Rampart or town wall<br />
Learners Guide 8: <strong>Urban</strong> <strong>ecology</strong><br />
Content<br />
1. Introduction. Why urban <strong>ecology</strong>? /by Per Werge p. 9<br />
2. <strong>The</strong> state of urban <strong>ecology</strong> today worldwide: global or local, or both? Did sustainable cities ever exist? p. 15<br />
Recent policy and technology: Visions of today.<br />
3. <strong>Urban</strong> development in the <strong>Baltic</strong> area through the history and their dependency on resources and transport till p. 21<br />
today and in the future. Authors: Stanislav Babitch, Olga Gladkaya, Marina Petrova, Olga Verzhbitskaya,<br />
University of St. Petersburg.<br />
4. Case studies/examples from the <strong>Baltic</strong> <strong>Sea</strong> region on how to solve the demand of the cities in a sustainable way; p. 37<br />
plus research studies and practices for pupils and students through school projects.<br />
4.1 Germany: <strong>Urban</strong> climate as a component of sustainable city-planning (<strong>The</strong> Humboldt University studies) p. 39<br />
(referred by Per Werge)<br />
4.2 Sweden – Malmö: Planning of water runoff and harvesting in cities by green roofs and park straits. p. 47<br />
Author: Jonas Oskarsson, Swedish National coordinator <strong>Baltic</strong> <strong>Sea</strong> <strong>Project</strong> (BSP).<br />
4.3 Finland: Bird adaptation to urbanization. Author: Tuovi Ronkainen, Finland’s national coordinator BSP. p. 51<br />
4.4 Poland: Green belts as climate regulation in city planning. p. 57<br />
Authors: Dr Beata Węgrzynek, Silesian University, Katowice, the Faculty of Biology and Environmentalism;<br />
Lidia Janas and Dr Jolanta Mol with students of II Konopnicka Grammar School, Katowice.<br />
Translated by Magdalena Kubica – II Konopnicka Grammar School, Katowice.<br />
4.5 Denmark: Zero energy cities - Sønderborg geothermal district heating and zero energy strategy. p. 63<br />
Author: Morten Menné, Sønderborg municipality - Zero energy buildings.<br />
4.6 Denmark: Nakskov H 2 society /by Per Werge p. 71<br />
4.7 Lithuania: Nuclear power, how is the technology until now (Ignalina) and how to solve the problems of p. 83<br />
resources of uranium and the waste problem? Will there be development from the technology of fission to fusion?<br />
Why do the populations of some of the <strong>Baltic</strong> <strong>Sea</strong> countries refuse to build up a nuclear power supply (DK),<br />
others extend their capacity (Finland, Russia), or keep the existing plants running (Sweden, Germany, Lithuania).<br />
Author: Ona Beinoravičiūtė, Ministry of Economy of the Republic of Lithuania, Nuclear Energy and Radioactive<br />
Waste Management Department<br />
5. <strong>Urban</strong> planning as the tool for urban <strong>ecology</strong> /by Per Werge p. 99<br />
A view to the future of the city p. 109<br />
7. Literature, sources and links p. 112<br />
Observing and innovating <strong>Urban</strong> <strong>ecology</strong> in the <strong>Baltic</strong> <strong>Sea</strong> region 7
8<br />
<strong>The</strong> panoramic view of Hong Kong<br />
<strong>The</strong> “Turning Torso”, Malmö, Sweden<br />
Introduction<br />
By Per Werge, Nykøbing Katedralskole, DK<br />
Chapter 1. Why urban <strong>ecology</strong>?<br />
<strong>Urban</strong> <strong>ecology</strong> is a strange concept or idea. Is a city by nature<br />
anything but the opposite of nature? Nevertheless urban<br />
<strong>ecology</strong> describes the cooperation between the natural and<br />
artificial environments of the city. Before the city or town<br />
was founded, the area had been pure nature. <strong>The</strong> city just<br />
transformed the nature. Instead of natural landscapes, we got<br />
cityscapes, or urban environment. Even so the cities are still<br />
exposed to the climate (now changed) and still partly fed by<br />
local resources (air, water, local products), but an important<br />
new condition is that still more resources are taken from the<br />
nature somewhere else, and still more non-used resources are, as<br />
waste, to be transported out of the city.<br />
This is central: the natural input-output balance of energy and<br />
materials for the settlement, its metabolism, is out of natural<br />
balance. In addition to this the imbalance is growing: the<br />
urban areas are now home ground for half of all population<br />
on Earth. This causes a steady growing demand for supply to<br />
urbanisations from non-urbanised areas far from the cities.<br />
<strong>The</strong> shown setting already gives us the two main components of<br />
“urban <strong>ecology</strong>”: the natural and cultural environment.<br />
12<br />
10<br />
8<br />
6<br />
4<br />
2<br />
Billions<br />
0<br />
Source: UN 1998<br />
1950 1970 1990 2110 2130 2150<br />
Figure 1.1. Big cities as part of the total World population 1950-2050<br />
Supply of a typical <strong>Baltic</strong> city today<br />
input<br />
food and water<br />
produced goods<br />
wood and paper<br />
building materials<br />
Linear reproduction<br />
output<br />
waste<br />
exhaust<br />
<strong>The</strong> nature delivers naturally four, the culture the fifth<br />
environmental sphere:<br />
thoughtless<br />
throw away<br />
household and<br />
industrial waste<br />
Figure 1.2. This model is often used to show the industrialised city as a<br />
parasite of the worlds environment (After “<strong>The</strong> Gaia Atlas of Cities” and<br />
Mellemfolkeligt Samvirke, Copenhagen 1993<br />
1. <strong>The</strong> geosphere: landscape, soil and subsoil, hills, coasts,<br />
shores.<br />
2. <strong>The</strong> hydrosphere: lakes, water streams, coastal water, soil<br />
water and ground water.<br />
3. <strong>The</strong> atmosphere: the air, as a reservoir for radiation<br />
and other processes, the climate with its temperatures,<br />
precipitation or droughts.<br />
4. <strong>The</strong> biosphere: the vegetation and animals and people<br />
(humans are the first primates!).<br />
5. <strong>The</strong> antroposphere (or society) delivers all the cultural<br />
installations which transform the nature: buildings, roads,<br />
railroads, canals, water and sewage pipelines, power<br />
system, refuse removal, etc., and (again) population as<br />
cultural citizens with certain urban behaviour located in a<br />
complicated network infrastructure.<br />
In this network all locations are not equal. Some of them are<br />
central and used by an immense number of people, others are<br />
peripheral.<br />
Observing and innovating <strong>Urban</strong> <strong>ecology</strong> in the <strong>Baltic</strong> <strong>Sea</strong> region. Chapter 1 9
10<br />
<strong>The</strong> supply of a modern city (Hong Kong)<br />
Input Output<br />
Tons per day Export waste<br />
Food 5.985 602<br />
Animal food 335<br />
Food waste 393<br />
Soft water 1.068.000<br />
Ocean water 3.600.000<br />
Sewage 819.000<br />
Sludge 6.301<br />
Goods 18.000 8.154<br />
Liquid fuel 11.030 612<br />
Solid fuel 193 140<br />
Glass 270 65 152<br />
Plastic 680 324 184<br />
Concrete 3.572 11<br />
Wood 1.889 140 637<br />
Iron and steel 1.878 140 65<br />
Paper 1.015 97 691<br />
Other waste 728<br />
Oxygen 27.000<br />
CO 155<br />
Greenhouse gasses:<br />
CO2 26.000<br />
CH4 29<br />
NOx 110<br />
Particles 42<br />
Figure 1.3. <strong>The</strong> input of world based resources to a big city is much<br />
higher than the output. (After Ken Newcombe et all 1978)<br />
What happened when the city was built?<br />
<strong>The</strong> roofs of the buildings cover the land surface<br />
<strong>The</strong> traffic zones are treated with asphalt or concrete<br />
Precipitation is lead into pipes, not to the soil or plants<br />
<strong>The</strong> transport sector uses energy from abroad<br />
<strong>The</strong> houses and households use energy from abroad<br />
Food and resources come from outside<br />
<strong>The</strong> domestic production is not consumed locally<br />
Waste is only recycled partly, most is burned or deposited<br />
Figure 1.4. <strong>The</strong> nature is partly set aside in a city<br />
<strong>The</strong> uneven infrastructure causes uneven use of resources. In<br />
general a city uses resources from allover, from local gardens and<br />
fields in the surrounding area and local industry, but (as said)<br />
further more from production sites placed elsewhere or in other<br />
countries.<br />
<strong>The</strong>se resources are of all sorts: air, water, food, fuel, clothes,<br />
building materials, consumer goods, as the example from Hong<br />
Kong shows.<br />
Most of them cause by consumption organic or chemical waste<br />
or exhaust, which influence the urban environment and make<br />
its balance unstable. Thus the balance is unstable on both sides:<br />
there will be extremes in the supply of resources as well as on<br />
the refuse side.<br />
<strong>Urban</strong> <strong>ecology</strong> embraces all these processes, as they are<br />
elements of big natural bio-geochemical cycles i.e. the water<br />
cycle, the carbon cycle, the oxygen cycle, the nitrogen cycle,<br />
etc. <strong>The</strong> perspective in this handbook will be to focus on the<br />
nature influence and its response to human urban activity, and<br />
conversely, to observe how much or little the environmental<br />
aspects are taken into account by urbanisation during the<br />
remarkable extension of the cities, that is going on right now<br />
and will continue worldwide.<br />
<strong>The</strong> option is to determine a range of focus or research areas,<br />
which cover the headlines of urban <strong>ecology</strong> of today and create<br />
opportunities for further work and research for schools at our<br />
stage:<br />
<strong>Urban</strong> housing<br />
<strong>Urban</strong> traffic<br />
<strong>Urban</strong> climate<br />
<strong>Urban</strong> water runoff<br />
<strong>Urban</strong> water supply<br />
<strong>Urban</strong> energy supply<br />
<strong>Urban</strong> waste and refuse removal and recycling<br />
<strong>Urban</strong> planning<br />
<strong>Urban</strong> wildlife and vegetation changes<br />
Another general option is to create young citizens who will<br />
be aware of both the opportunities and the risk, as well as<br />
necessary solutions to be taken regarding city planning and<br />
development in the future, and are both willing to and capable<br />
to handle the development based on environmental knowledge<br />
and experience.<br />
This perspective was already launched and expressed clearly in<br />
the Calcutta charter 1990:<br />
<strong>The</strong> Charter of Calcutta<br />
We are at a turning point in history.<br />
Our planetary environment is severely damaged.<br />
Desertification is spreading, the globe is warming.<br />
Entire eco-systems are under threat.<br />
And the city is at the centre of the storm of destruction.<br />
But that is the key!<br />
We must cease seeing the city as a problem.<br />
We must see the city as the solution.<br />
For the city is our home.<br />
It is what we make it to be.<br />
It is where we live.<br />
If we fail to seize the future,<br />
We will be consumed by the past.<br />
<strong>The</strong> Future begins NOW!<br />
Let the Charter of Calcutta be simple & clear,<br />
To be heard by all,<br />
And filled with hope & vision.<br />
Why urban <strong>ecology</strong> should be<br />
subject for education, also along<br />
the coasts of the <strong>Baltic</strong> <strong>Sea</strong>?<br />
First a focus on the population:<br />
As mentioned: since 2007 half of the population on Earth live<br />
in urban areas, i.e. 3 billion people. <strong>The</strong> growth until 2050 is<br />
predicted to direct all newcomers in the world to towns and<br />
cities. This will double the urban population, while the rural<br />
population will remain the same.<br />
By 2050 the UN prognosis tells about 6 billion citizens in<br />
urban areas. 6,000,000,000 people. Imagine how to build –<br />
before 2050, within 40 years – as much urbanisation as there<br />
already exists, built through 6,000 years!<br />
In the Nordic and <strong>Baltic</strong> countries the urban growth is far from<br />
the drama going on in the developing countries, but here is<br />
regarded the same centralisation trend of migration from the<br />
outskirts and rural regions to the big cities and their suburbs.<br />
<strong>The</strong> 20 largest cities of the nine BSP-countries grew from<br />
1960 to 2008 from about 12 m to 20 m, suburbs included.<br />
Parallel to this a few new cross-boundary con-urbanisations<br />
have developed with shared labour and commercial markets<br />
in the region, as a consequence partly of political visions and<br />
<strong>The</strong> location of <strong>Baltic</strong> cities<br />
What will happen<br />
to these cities<br />
by the expected<br />
climatic and<br />
environmental<br />
changes?<br />
Figure 1.5. <strong>Sea</strong> trade and transport placed most bigger cities at the<br />
coast of the <strong>Baltic</strong> <strong>Sea</strong>. By a raised sea level this position will be a<br />
threat. A solution could be a cooperation of building a huge dam<br />
with locks blocking the Danish Straits after the Dutch’ model from<br />
the Rhine-Maas Delta. Here a series of dams and locks protect the<br />
hinterland from ocean floodings. <strong>The</strong> <strong>Baltic</strong> <strong>Sea</strong> will then turn into a<br />
freshwater lake as it was 8000 and 10.000 years ago.<br />
planning, partly for economical and commercial reasons, e.g.<br />
the Over Torneå/Umeå (Finland/Sweden) and the Øresund<br />
region (Denmark/Sweden).<br />
It is worth noticing that most big cities of the region are located<br />
along the coast, originally founded as seaports. <strong>The</strong> sea has been<br />
vital as their origin and lifeline.<br />
Of the 20 biggest cities in the region only four are located<br />
in the hinterland, although at rivers: Warsaw and Krakow in<br />
Poland, Vilnius in Lithuania and Berlin in Germany, if we<br />
decide to include Berlin as a vital city for the <strong>Baltic</strong> region<br />
(though it according to hydrography belongs to the Elbe river<br />
system).<br />
<strong>The</strong> changing climate makes the sea represent a future threat<br />
to all the coastal urban areas: if warmer climate melts the ice<br />
from the ice cap of Greenland and the Antarctic, the ocean level<br />
will rise between 1-2 meters by the year of 2100 depending on<br />
various factors.<br />
With this scenery: how to avoid flooding of the city centres, all<br />
exposed to the sea?<br />
Observing and innovating <strong>Urban</strong> <strong>ecology</strong> in the <strong>Baltic</strong> <strong>Sea</strong> region. Chapter 1 11
12<br />
Figure 1.7. Fit towns is a new suburban concept launched in 2007 by the British government. It is meant to create suburbs where the citizens can<br />
only walk or cycle internally. By this the town can help curing two cultural diseases: <strong>The</strong> CO 2 emission from the traffic and the fat, unfit and unhealthy<br />
behaviour of the population<br />
Will flooding barriers like <strong>The</strong> Thames Barrier east of London<br />
or <strong>The</strong> Delta Plan south of Rotterdam, be necessary elements of<br />
city planning in the future?<br />
Must the <strong>Baltic</strong> countries in cooperation build long and tall<br />
dams across the Danish straits from island to island to block<br />
the rising Atlantic Ocean level? A project like this will make it<br />
possible to keep the recent sea level inside the <strong>Baltic</strong> <strong>Sea</strong>. This<br />
sea on its side will change to a fresh water lake when the saline<br />
ocean water is kept outside the barrier.<br />
<strong>The</strong> future extension and reorganisation of the cities in the<br />
<strong>Baltic</strong> region thus ask the same questions and apply similar<br />
solutions as the main urban areas globally. Due to long<br />
traditions of the city development and planning, and due to<br />
(on a global scale) a good economical, political and technical<br />
standard as well as the tradition to involve a politically<br />
committed and skilled population, also through the periods<br />
of crisis, - the way the urban problems are solved may deliver<br />
potentially “good examples” and useful technology to other<br />
regions. <strong>The</strong> important part here is to be played by a welleducated<br />
and trained young generation with sufficient critical<br />
knowledge and sense of commitment.<br />
Again: here is the reason for this handbook.<br />
Observing and innovating <strong>Urban</strong> <strong>ecology</strong> in the <strong>Baltic</strong> <strong>Sea</strong> region. Chapter 1 13
14<br />
Sassi di Matera, Italy<br />
Chapter 2. <strong>The</strong> state of urban <strong>ecology</strong> today worldwide:<br />
Global, local – or both?<br />
By Per Werge<br />
How is the strategy for urban <strong>ecology</strong> today in the shade of globalization of the market economy<br />
About 1998<br />
Global strategy<br />
Government and institutions<br />
Laws, rules and regulations for traffic,<br />
buildings, energy savings, recycling etc.<br />
Figure 2.1. An optional global strategy for urban <strong>ecology</strong> was put back by a strategy for liberalism and globalization at the turn of the 21st Century.<br />
<strong>Urban</strong> <strong>ecology</strong> development now depends on local projects, which may give it a new breath.<br />
<strong>The</strong> focus on urban <strong>ecology</strong> as a cure against uncontrolled<br />
growth of unhealthy oversize cities worldwide possibly began<br />
in the 1960s. At this stage de-colonisation and political<br />
independence of the former colonial countries and revitalisation<br />
of the industrialised countries after World War II<br />
had led to an economic and demographic expansion of unseen<br />
dimensions. <strong>The</strong> Old World cities grew remarkably, but cities<br />
of the Third World grew even more, all of them connected to<br />
and stimulated by the creation of the liberalised world market<br />
economy or trade links to the expanding communist economy.<br />
Trade and production within the market turned to be an<br />
attraction to migrants searching for work and improvement of<br />
their living, which in turn seemed to be the key generator of<br />
urban growth.<br />
<strong>The</strong> dark side of this process was first seriously recognised and<br />
described during the 1970s, when the international oil crisis<br />
and recession dominated the liberal market economy. <strong>The</strong> crisis<br />
made it obvious that the mega-cities’ extreme consumption of<br />
After a 2000<br />
A strategy to activate the locals<br />
Sustainability as an urbanization process<br />
Use of local conditions i.e. local resources<br />
for sustainable livelihoods<br />
energy and other resources was unsustainable, and the supply<br />
and handling of waste had grown not only to ecologically<br />
irrational dimensions but also economically unrealistic size.<br />
During the 1970s, a partly <strong>ecology</strong> and partly morality<br />
based trend picked up the discussion and advice on urban<br />
sustainability, both in an ecological and economical sense.<br />
Most advice was generalised and delivered standard methods<br />
for recycling of materials from the waste, energy conservation<br />
through better insulation standards for housing and<br />
processing, and rationalised use of materials in building and<br />
housing, optimised water household, and advice on reduced<br />
consumption of goods in general.<br />
A romantic or anarchistic version of this trend was to stimulate<br />
young families to re-migrate to the countryside to build a<br />
subsistence economy on a small-scale farming and vegetable<br />
growing.<br />
<strong>The</strong> political consensus by this resulted in a row of conferences<br />
and decisions on a global scale. Most known is <strong>The</strong> United<br />
Nations Conference on Environment and Development, at<br />
Observing and innovating <strong>Urban</strong> <strong>ecology</strong> in the <strong>Baltic</strong> <strong>Sea</strong> region. Chapter 2 15
16<br />
Figure 2.2. Shibam in Yemen is one of a range of old originally isolated<br />
towns in the Middle East and the Mediterranean where draught and<br />
sparse natural resources forced the citizens to recycle and minimize<br />
consumption. (Illustrations and information about the cave dwellings<br />
and sustainable towns in the Mediterranean are mainly from the<br />
www.sassiweb.it and as source for Sassiweb: Pietro Laureano, the<br />
Ipogea Institute of Matera, Basilicata, Italy; website: www.laureano. it)<br />
Rio de Janeiro from 3 to 14 June 1992, when regulations by<br />
both governments and municipalities according to general<br />
environmental standards were decided to be universal. <strong>The</strong><br />
decisions were published as Agenda 21, telling how to handle<br />
the environment in the 21st Century.<br />
Since 1992, local and state authorities in many countries<br />
followed the advice, also according to demands for urban<br />
standards, with more or less successful realisation. <strong>The</strong> need<br />
for economic growth, and the uneven booming or periodic<br />
regionally recessing World economy from about 1993 to 2008<br />
made intelligent planning overtaken by “wild” urban growth<br />
upon a technological and political platform of “yesterday”.<br />
All the advice from the conferences was referred to as too<br />
centralised, too general, and the legislative standards for<br />
urbanisation were – and are –in most regions too weak to avoid<br />
the power and will of both local and international financial or<br />
commercial, and entrepreneurial groups.<br />
Only where strong local groups of inhabitants, planners,<br />
politicians – using the opportunities of politically well<br />
organised and democratic communities – worked for urban<br />
sustainable solutions optional in the specific local region or<br />
city, there happened to develop new towns or districts, or single<br />
buildings which add new urbanised and sustainable perspectives<br />
to the former, either through new use of technology, materials<br />
or planning.<br />
Even in the Nordic countries with their long tradition of<br />
democratic, social and environmental commitment of the<br />
citizens, sustainable urbanisation has not been the main<br />
strategy. On the contrary the massive growth in welfare during<br />
the last 25 years has increased the consumption of resources<br />
extremely upon a non-sustainable basis of carbon exhausting<br />
technology (motor cars and carbon or oil burning power plants)<br />
and widespread settlements in suburbs and former villages, and<br />
in the open landscape to answer peoples’ demand for ”a house<br />
with a garden” and green non-polluted surroundings.<br />
This housing pattern creates still more need for private<br />
transportation to the workplaces, which on their turn<br />
increasingly either are located along the main traffic arteries<br />
(motorways) and secondly, along railways outside the old town<br />
centres (especially production, distribution or service firms),<br />
while research, information and administration departments<br />
often settle in reclaimed former industrial districts or harbour<br />
areas in the city, near the universities with their source of<br />
researchers. A new urbanisation type is made: the highwayconnected<br />
roadside city. Some of them are 100 km long. (See<br />
chapter 5) If these roadside cities and the urban sprawl should<br />
ever be sustainable, new transport systems and technology will<br />
be needed. For the city centre itself the technical solutions may<br />
be easier, but for all existing urbanisation the expenses of the<br />
change will be massive. For the future, urbanisation options<br />
for creation of new sustainable towns are necessary. Are they at<br />
hand?<br />
<strong>The</strong> origin of the settlements on la Murgia - 8000-3000<br />
years ago<br />
Figure 2.3. <strong>The</strong> natural caves in Basilicata in southern Italy’s dry karstic<br />
landscape La Murgia were first used of hunters, later changed into<br />
agricultural cellars and housing.<br />
+<br />
Did sustainable cities ever exist?<br />
This opens a simple question: Did sustainable cities ever exist?<br />
A study of a city, which among similar towns was an example of<br />
full subsistence through thousands of years, may make it clear<br />
that sustainability through subsistence has no chance for cities<br />
based on trade and more or less regulated market economy.<br />
Anyway, some of the principles for carrying out the former<br />
sustainable towns are interesting and still inspiring (and may be<br />
reused).<br />
A case study of Sassi di Matera in Southern Italy, origins of<br />
which go back 12.000-8.000 years, shows an environmental<br />
adaptation to a steppe climate, cool and wet in winter, hot and<br />
dry in summer in combination with the use of natural (later<br />
extended) caves in the riffs of the chalk rocks for store of food<br />
and for housing.<br />
By digging cisterns in the rock underneath the dwellings and<br />
leading the winter rain to them, the inhabitants were able to<br />
conserve fresh non-polluted water from winter to summer.<br />
Though the town at its largest content might have been 10,000,<br />
it still grew most of its own food supply. Waste, waste water and<br />
manure were recycled, and the nearest gardens were on the roof<br />
of the lower cliff dwelling. <strong>The</strong> local chalk-sandstone named<br />
Tuffa was used as building material. New stones came when a<br />
cave was extended into the cliffs. Transportation was by all this<br />
reduced to a minimum.<br />
Which environmental history is told<br />
by the Sassi example<br />
(UNESCO WHE 1996)<br />
Though big - at its largest 18,000-20,000 citizens - Sassi was<br />
never more than a village with its self-sufficiency, its inhabitants<br />
consumed nearly all products. Through long periods, it took<br />
very little part in any network or relation to the “outer” world.<br />
First, the break of its isolation during the remarkable world<br />
trade revival of the 18th century did send - against its tradition<br />
- emigrants also to this remote region; and overpopulation of<br />
the caves started.<br />
<strong>The</strong> intelligent water collection system was then broken by poor<br />
people who began to use cisterns as dwellings. <strong>The</strong> capacity of<br />
water conservation decreased while the consumption increased.<br />
<strong>The</strong> sustainable household ended.<br />
Though Sassi di Matera was more a village than a town, what is<br />
then to learn from its example?<br />
Figure 2.4. After having been the bad conscience of<br />
Italy in the 1950s due to the poor living conditions in<br />
the overpopulated Sassi cave dwellings, the Sassi was<br />
abandoned from 1960 to the 1990s. <strong>The</strong>n people like<br />
Pietro Laureano got aware of its former sustainability<br />
and adaptation to the local environment, and promoted a<br />
protection movement. In 1996 Sassi was declared a World<br />
Heritage Site by UNESCO.<br />
Left: A model of Sassi, showing the recycling of most<br />
materials, i.e. water, manure from both people and<br />
animals for production of food on the roof terraces. Also,<br />
the building of fronts on the caves looking like real gables<br />
is shown - building stones came from inner extensions of<br />
the cave. <strong>The</strong> water management begins with collection of<br />
rainfall “Acque meteorique” led to the blue cisterns under<br />
the floor of every cave<br />
Observing and innovating <strong>Urban</strong> <strong>ecology</strong> in the <strong>Baltic</strong> <strong>Sea</strong> region. Chapter 2 17
18<br />
Figure 2.5. <strong>The</strong> Italian architect Pietro Laureano resumed the<br />
knowledge about urban <strong>ecology</strong> from his studies of sustainable<br />
cave dwellings and towns in the following schedule to underline the<br />
differences from modern urban and industrial development: (Compare<br />
the values with the planners values in Chapter 5)<br />
Modern knowledge contra<br />
traditional knowledge<br />
According to Pietro Laureano, the Ipogea Institute, Matera<br />
Specific solution Multipurpose system<br />
Immediate efficacy Functionalism in the<br />
long run<br />
Specialization Holism<br />
Dominant powers Autonomy<br />
Separation Integration<br />
External resources Internal inputs<br />
Conflicts Symbiosis<br />
Monoculture Relationship and complexity<br />
Uniformity Diversity<br />
Severity Flexibility<br />
Expensive maintenance Self-regulation and work<br />
intensity<br />
Internationalization Contextualizing<br />
Waste Saving<br />
Technicism and Symbolism + wealth<br />
rationalism of meanings<br />
Dependence Autopoiesis (Independency)<br />
Recent policy and technology:<br />
Examples and visions of today<br />
Let us resume:<br />
<strong>The</strong> concept and the real function of a town and city is<br />
primarily to form the location and connections for production<br />
of knowledge and products, either in the city’s workplaces or<br />
transported from other cities or the countryside. Secondarily,<br />
to function as a distribution network for the products to fulfil<br />
their purpose: to be used (consumed). Furthermore, the city<br />
houses homes for its producers and distributors as well as the<br />
cultural, political and social institutions and their employees<br />
necessary for the city’s development and administration.<br />
This concept creates a row of necessary demands for solid as<br />
well as immaterial resources to supply production of all kind,<br />
to build and preserve the physical infrastructure for housing,<br />
distribution, transport, consumption and recreation.<br />
Expressed more simply, the city consists of buildings of many<br />
kinds, connected by networks of roads, water and sewage<br />
pipelines as well as of power and communication lines. <strong>The</strong><br />
“eco-question” related to this construction and the use of it is<br />
also simple: Can it be done in a fully sustainable way?<br />
<strong>The</strong> sustainable town of Matera from the past showed a<br />
balanced <strong>ecology</strong> based on low consumption of local resources<br />
and recycling. Almost no materials or food came from abroad,<br />
trade and transport was extremely limited to the surrounding<br />
agricultural land and based on land transport done by animals<br />
or people. This transport constituted at the same time the<br />
communication lines. Muscular power and wood for fire, oil<br />
for light were the scarce energy sources used. <strong>The</strong> town stayed<br />
literally unchanged and independent of external supply through<br />
hundreds of years, with very little growth in population.<br />
Its decline as sustainable habitation came as told because of<br />
rapid immigration in a period (18th Century) of growing<br />
World trade.<br />
During the last two centuries, neither the basic population nor<br />
the political powerful landowners, traders or governors wanted<br />
the sustainability and independency continued. <strong>The</strong>y wanted to<br />
profit from the market.<br />
On the contrary, Matera as well as all other cities, has been<br />
redefined as <strong>The</strong> Site of modern life, because of modernization,<br />
given through close connection to the growing world trade<br />
market for industrial products and resources.<br />
After the unrolling of the communist planning economy nearly<br />
all regions and cities in the world are supplied according to the<br />
liberal market philosophy and hence built and expanded by use<br />
of materials, products and energy principally (and more or less)<br />
delivered through the world market.<br />
WTO, <strong>The</strong> World Trade Organisation, has grown to the<br />
economically and legally most powerful international<br />
institution with supernational legislation and a status of a<br />
supernational Court according not only to the concept of<br />
“free trade”, but also to “Trade-Related Aspects of Intellectual<br />
Property Rights, of patents, and of pharmaceuticals and public<br />
health”.<br />
Through the concept of free trade, very different regions of the<br />
world are brought in direct competition, what concerns the<br />
price of the final products as the consumer meets them in the<br />
supermarket and other retailers or importers.<br />
<strong>The</strong> conditions for the production vary enormously from<br />
country to country and region to region: salary, local prices,<br />
living costs, technology, energy supply, infrastructure, legislation<br />
for nature protection and work environment, for safety and<br />
security in general, and “hidden” state support or corruption<br />
make together a setup totally opaque or impenetrable for<br />
anyone.<br />
<strong>The</strong>re are only few options for evaluation of products regarding<br />
their ecological, social or political sustainability. <strong>The</strong> market<br />
price and quality of the final product will generally be the only<br />
values to consider for the costumer, and they do not tell the full<br />
story.<br />
As illustration: the concept of free trade meant still by year<br />
2009 that the CO2-emission from shipping and air transport<br />
was not counted as a part of any national emission, which<br />
means that even the real transportation costs are not included<br />
in the calculations for a product, neither economically nor<br />
environmentally.<br />
Until the economic world crisis from 2008 and the shift<br />
in the international evaluation of the climate change most<br />
city planners or politicians (or just citizens) prefacing<br />
environmentally sustainable solutions in production,<br />
construction and consumption had little support from the<br />
leading political and economical nomenclature. <strong>The</strong> concept of<br />
free trade was stronger than environmental sustainability as a<br />
political leading concept.<br />
Since the environmental warnings for the Globe of the 1960-<br />
70s from <strong>The</strong> Club of Rome 1968 and the internationally<br />
agreed headlines in the 1990s based on the UN Conference<br />
for the Environment in Rio 1992 there has been a turning in<br />
the promotion of urban <strong>ecology</strong> solutions from “the general”<br />
perspective to “the local”. In many countries, planners and<br />
entrepreneurs have developed local urban technology, mostly<br />
green housing, zero energy buildings, electric transport systems,<br />
but also urban <strong>ecology</strong> projects for a full-scale towns or suburbs,<br />
though still local solutions.<br />
This has happened due to the fact that the largest nations of the<br />
world like USA, China and Russia, never signed nor respected<br />
the Rio Declaration on Environment and Development, and<br />
still more powerful WTO had never argued for environmental<br />
solutions before free trade. <strong>The</strong> international crisis since 2008<br />
and the renewed focus on the accelerating climate effects in<br />
symbiosis with new political structures first of all in America,<br />
may introduce urban <strong>ecology</strong> on a wider scale than the local,<br />
which will be welcomed and necessary in the light of the<br />
proposed building of new towns for 3 billion people within 40<br />
years time.<br />
Nevertheless local solutions have shown a variety of options,<br />
and the importance of using local ideas, resources and materials<br />
is inevitable. It is simply one of the fundamental components<br />
of urban <strong>ecology</strong>, as well as it is a strategy “to break through the<br />
barriers” for unsustainable urban development.<br />
Let us make a giro, a round, to a range of innovations going on<br />
in the <strong>Baltic</strong> <strong>Sea</strong> region by the year 2009, when an International<br />
UN Climate Conference involving all the world’s countries is<br />
being held in December in Copenhagen.<br />
Observing and innovating <strong>Urban</strong> <strong>ecology</strong> in the <strong>Baltic</strong> <strong>Sea</strong> region. Chapter 2 19
20<br />
Map of the extent of Hansa about 1400, fragment<br />
Carta marina, a wallmap of Scandinavia, by Olaus Magnus. <strong>The</strong> caption reads : A Marine map and Description of the Northern Lands and of their<br />
Marvels, most carefully drawn up at Venice in the year 1539 through the generous assistance of the Most Honourable Lord Hieronymo QuiriNo.<br />
Chapter 3. <strong>The</strong> influence of historical and economical<br />
factors on urban development in the <strong>Baltic</strong> <strong>Sea</strong> region<br />
Authors: Stanislav Babitch, Olga Gladkaya, Marina Petrova, Olga Verzhbitskaya, University of St. Petersburg<br />
Résumé: This chapter describes the foundation and further development of the <strong>Baltic</strong> regional cities as centres for extraction and<br />
production and trading of raw materials and food. <strong>The</strong> trade established through the history the region as a transport corridor<br />
based mainly on shipping, connecting the cities in an urban network and connecting North-Eastern Europe with Central and<br />
Southern Europe. It is stated that the future role for the regional cities in the global economical geography will be to revive and<br />
extend the position as transport corridor. By creation of new transport technology i.e. intermodal terminals connecting sea-<br />
and land transport the cities will still be keeping and improve their role as transport knots. <strong>The</strong> chapter does not step into the<br />
discussion on how transport may obtain environmental sustainability. It delivers a basic knowledge on the conditions for the<br />
existence of the cities in the region, and hence represents a starting point for creation of a future sustainability.<br />
<strong>Urban</strong>isation factors<br />
We want to consider the following factors that influence the<br />
process of forming urban networks and the structure of urban<br />
areas; natural resources and the economic-geographic position.<br />
<strong>The</strong> main resources that influence economic development in the<br />
<strong>Baltic</strong> <strong>Sea</strong> region are:<br />
● wood,<br />
● fish (herring, sprat),<br />
● amber,<br />
● iron ore,<br />
● non-ferrous metals.<br />
During the definite period salt was a resource that influenced<br />
the main process.<br />
Since the middle of the 20th century recreational resources have<br />
become a factor.<br />
<strong>The</strong> second main factor is the economic-geographic position<br />
of the region (transit). This factor had its greatest influence in<br />
several periods:<br />
● Viking Age,<br />
● Hanseatic League times,<br />
● Soviet times,<br />
● Nowadays.<br />
Economic-geographic position directly influences the<br />
foundation and location of towns. This economic-geographic<br />
position determines the attitude of places, districts or towns<br />
toward outside objects that play some economic role and also<br />
the presence of resources.<br />
We indicated that main resources influenced the structure of<br />
the urban area and urban network in the <strong>Baltic</strong> <strong>Sea</strong> region (see<br />
Pic. 1).<br />
Wood<br />
<strong>The</strong> first factor that we picked out is a very important<br />
resource—wood. Wood satisfies various human needs. It is the<br />
base resource for the timber industry and woodworking and<br />
is one of the main elements used in recreational potential and<br />
human dwellings and it regulates and cleans surface runoff,<br />
prevents soil erosion, preserves and increases soil fertility, saves<br />
genetic biodiversity, enriches the atmosphere with oxygen and<br />
guards air from pollution, and takes part in the formation of<br />
the climate. <strong>The</strong> flora in wooded areas is a unique provider of<br />
wild fruits and berries, nuts and mush rooms, valuable species<br />
of herbs, and specific raw materials for different industrial<br />
branches.<br />
Observing and innovating <strong>Urban</strong> <strong>ecology</strong> in the <strong>Baltic</strong> <strong>Sea</strong> region. Chapter 3 21
22<br />
Because of these unique characteristics, this resource influences<br />
the process of settlement. Many towns are founded in the place<br />
of pro duc tion forests and woodworking.<br />
A sufficient amount of wood can be used for various purposes:<br />
● primary wood processing,<br />
● furniture,<br />
● paper, cardboard (building of pulp and paper mill).<br />
<strong>The</strong>re are some good examples of such towns in Russia. Segezha<br />
is one of them. <strong>The</strong> pulp and paper mill in Segezha is the<br />
biggest hail growth enterprise.<br />
Pict. 1. Map of the “factors” which influenced the<br />
development of the cities in the <strong>Baltic</strong> <strong>Sea</strong> region<br />
Pic. 2. Pulp and paper mill in Segezha<br />
Pic. 3. Pulp and paper mill in Svetogorsk<br />
One more example is Svetogorsk. At the end of the 19th<br />
century, a pulp factory started working at the place of the<br />
present settlement. It later developed into a cardboard and<br />
paper mill and even later to a pulp and paper mill. A dormitory<br />
grew around the factory and then became a town. <strong>The</strong> same<br />
process happened for many other towns in Sweden and Finland<br />
(Imatra, Kayaaani).<br />
To found a pulp and paper mill two other factors, electricity<br />
and water resources, are needed. <strong>The</strong>se factors are almost always<br />
joined together (hydroelectric station). Only one resource is not<br />
enough to develop a town; there is also the need for energy. For<br />
example, the Syassky pulp and paper mill has been the main<br />
enterprise in the town since 1928. It provides heat, drinking<br />
water, and hot water.<br />
Pic. 4. Tampere paper mill<br />
It is very important to mention the ecological factor that limits<br />
industrial development, also including the pulp and paper<br />
industry. This kind of industry pollutes the water and air. Many<br />
pulp and paper mills in the <strong>Baltic</strong> <strong>Sea</strong> region were built in the<br />
middle of the 20th century when the ecological factor was not<br />
so important as nowadays. That is why many pulp and paper<br />
mills were located inside the city limits, and this is important<br />
for city development.<br />
An example is the Swedish company IKEA, which is the biggest<br />
furniture producer in Sweden. <strong>The</strong> small town Agunnaryd is<br />
famous for this company. IKEA has shops in 44 coun tries,<br />
and most of these shops belong to the IKEA Group. <strong>The</strong> main<br />
principle of the com pany is the compact transportation and<br />
storage of furniture and also the possibility to assemble the<br />
furniture oneself. For this reason, the fini shed products are<br />
exported to other countries.<br />
Pic. 5. Catching of herrings in Oresund by Falsterbo by year 1200<br />
Observing and innovating <strong>Urban</strong> <strong>ecology</strong> in the <strong>Baltic</strong> <strong>Sea</strong> region. Chapter 3 23
24<br />
Pic. 6. Commercial herring catch Pic. 7. Amber hunters with harpoons and nets<br />
Fish<br />
Fish have always played an important role in the economic<br />
development of the region and influenced the formation of<br />
urban networks and structure of urban areas till the end of the<br />
20th century, when fish resources were over fished.<br />
<strong>The</strong> water of the <strong>Baltic</strong> <strong>Sea</strong> is recognized as not suitable for food<br />
fishing. <strong>The</strong> biggest exploita tion of fishing resources occurred<br />
at the time of the Hanseatic League. At that time, towns like<br />
Lübeck in north-western Germany, towns in Skaane in Sweden,<br />
etc. experienced the most development.<br />
Many experts considered the migration of her ring to the coast<br />
of Holland to be one of the reasons for the Hansa’s decline and<br />
an influ ence on the successful development of cities in Holland.<br />
Amber<br />
Amber is a mineral of many names: jantar, good stone, sacred<br />
stone, gold of the north, <strong>Baltic</strong> gold, and electron. Thanks<br />
to its own inner light and beauty, amber has always been a<br />
favourite stone used for adornment, especially in Europe. For<br />
example, the fashion of wearing amber bead necklaces began<br />
in the Middle Ages. Some people believed in both its mystical<br />
properties and its medical qualities. In any case, people have<br />
used amber with pleasure since the beginning of time<br />
<strong>The</strong> <strong>Baltic</strong> <strong>Sea</strong> region has been the original source of amber<br />
since prehistoric times. <strong>The</strong> most common amber in Western<br />
Europe comes from Russia, Poland, Germany, Denmark and<br />
Lithuania. <strong>The</strong> major supply of <strong>Baltic</strong> amber comes from a<br />
1,000-square-kilometer area of the Samland Peninsula, which<br />
is now known as the Kaliningrad Oblast. Towns were founded<br />
in this historic district as far back as the time of the Roman<br />
Empire. But in particular in the Middle Ages, when amber<br />
trading was occu pied by the Hanseatic League, there was intensive<br />
development of a network of cities. But the trading of the<br />
Hansa trading monopoly was reorganized in 1255 after the<br />
Teutonic Order succeeded in overtaking the <strong>Baltic</strong> Sam land<br />
with its rich locations for finding amber. Subsequently, the<br />
Teutonic Order made laws to organize sales and upgrading<br />
all amber fin dings exclusively in Lübeck (near Hamburg) and<br />
Bruges (near Antwerp). Exactly due to the Teutonic Order,<br />
Konigsberg (in future Kali ningrad) was founded in 1255. <strong>The</strong><br />
Hansa trading monopoly ended in 1525, and any other amber<br />
trading routes to/from the <strong>Baltic</strong> States were virtually cut off<br />
from 1255 to 1525.<br />
Lübeck may be considered the access to the <strong>Baltic</strong> <strong>Sea</strong> for<br />
Hamburg, and the towns on the direct route between Lübeck<br />
and Hamburg (which connected the towns Borndiek,<br />
Hamberge, Ammersbek, Berne, and Hamburg) may be<br />
seen as amber trading settlements. <strong>The</strong> names may have been<br />
given within the Hansa period (1255–1525). <strong>The</strong>refore,<br />
some resear chers suppose that the city of Antwerp (Spanish<br />
name: Amberes) may very well demonstrate the amber trading<br />
facilities at the time of the Hansa monopolies. Of course<br />
trading routes may have existed before 1255.<br />
Nowadays amber mines in Kaliningrad supply 99 percent of the<br />
<strong>Baltic</strong> amber collected. Until the 19th century, amber was mined<br />
and gathe red by hand from the sea. In the later part of the 19th century, mining operations became much more sophisticated<br />
as dredging and mining for amber began. Since then, millions<br />
of kilograms of <strong>Baltic</strong> amber have been mined. A small town in<br />
Kaliningrad Oblast has the world’s largest amber mine.<br />
Pic. 8. Amber museum in Kaliningrad<br />
Pic. 9. One of the main amber products<br />
At present amber is used in many fields. Amber acid was<br />
discovered to act as a biosti mulant: it stimulates the nervous<br />
system, regulates the work of the kidneys and inte stines, and is<br />
an anti-inflammatory and antitoxic agent. This ingredient is the<br />
basis for ointments and creams to treat rheumatic and asthmatic<br />
ailments, skin ulcerations and irritations, and bronchial,<br />
throat and thyroid conditions. <strong>The</strong> acid and oil obtained<br />
from amber are also used in the cosmetics industry since they<br />
destroy free radicals and bacteria, have disinfectant properties,<br />
and alleviate the effects of burns and insect bites. For these<br />
reasons, manufacturers have been trying to outdo each other<br />
by offering ever new ideas on how to use amber: you can buy<br />
mattresses and cushions, mats for pets filled with amber, insoles<br />
with amber fine, back and neck sup ports for drivers, amber<br />
incense sticks, and many other objects of this kind. Amber has<br />
antiseptic properties that protect the tree from various diseases.<br />
Pic. 10. Engelsberg Ironworks<br />
Iron<br />
Ore deposits of the Swedish iron concern to be one of the<br />
richest in the World, both on con centration of stocks of ore,<br />
and under the main tenance in it of metal. <strong>The</strong> main iron-ore<br />
area in the country is above the polar circle, in Lapland. Other<br />
iron ore area - Bergslagen, which has been known since the<br />
Middle Ages—is located in Average Sweden. Among deposits<br />
of nonferrous metals, the most considerable are located in<br />
Norrland. This deposit of complex sulphidic ores in the<br />
Buliden-Kristineberg area contains copper, zinc, lead, gold,<br />
silver, and arsenic. A lead deposit (Lajsvall) and copper (Aitik).<br />
<strong>The</strong> mining business in Sweden began and reached considerable<br />
lifting in the Vendel era (6th –8th centuries). <strong>The</strong> main role was<br />
played here by ore-bearing zones to the west and to the north<br />
of Lake Mälaren, especially extensive in the field of Dalarna.<br />
Operation of deposits of mountain both marsh ores and<br />
the control over the transportation of iron raw materials on<br />
waterways to Lake Mälaren and then through Helgyo and later<br />
through Birka created an economic basis for concentration<br />
of the politi cal power of Swedish Konungs. Gotland was<br />
an important link during this process. <strong>The</strong> location of the<br />
island promoted its transfor mation into a reloading point for<br />
the export of iron from the area of Lake Mälaren and other<br />
places of continental Sweden to the east and the south on<br />
Russian rivers. On Gotland, metal could be worked into easily<br />
transported, partly finished products, mainly sword blades.<br />
Iron, in comparison with furs, wax and slaves, which were<br />
earlier usually considered the basic articles of trade, was an item<br />
needed daily and it therefore represented the best subject of<br />
barter. Estimating the exact influence of the extension of the<br />
iron trade is difficult. While the majority of Swedish cities grew<br />
Observing and innovating <strong>Urban</strong> <strong>ecology</strong> in the <strong>Baltic</strong> <strong>Sea</strong> region. Chapter 3 25
26<br />
or decrea sed less than 20 percent during the late Middle Ages,<br />
cities such as Stockholm and Arboga that to a large extent made<br />
a living from the iron trade grew more than 50 percent, and at<br />
cities Lidköping and Hedemora iron was probable so to explain<br />
their occurrence in the middle of the 15 th century.<br />
Herräng and the area rich with ores form Herrängsfältet which<br />
is the biggest area of a mining industry within the Stockholm<br />
County. Iron ore began to be extracted in Herräng at the end<br />
of the 16th century. <strong>The</strong> city was then known as Kuggvass, and<br />
one interpretation of the name is that Hansa ships moored in<br />
that place. Mines have been located at coast, with out any source<br />
of hydraulic power to extort water from a deposit. <strong>The</strong> mining<br />
industry was therefore at a low level of development. In 1753<br />
attention moved to Lappgruvan deposit and the mechanical<br />
device known as a stånggång. <strong>The</strong> mining industry in Herräng<br />
has been stopped for some time.<br />
<strong>The</strong> company Herrängs Gruf AB was founded in 1889 by<br />
Natanael Fryoding, who advertised in several newspapers to<br />
get financial support. He even advertised in the Times, and in<br />
advertising he named Herräng the “new Dannemora”.<br />
Results were however not so good as Fryoding had hoped, and<br />
some mines were closed after 1 year of operation. <strong>The</strong> mining<br />
industry in Herräng gradually fell into decay to 1961. <strong>The</strong><br />
metal works still operated, using ore from other mines, until<br />
1969, when it was closed. <strong>The</strong> foundry is used today by another<br />
company, Roslagsgjuteriet.<br />
<strong>The</strong> extracting area of central Sweden is often mentioned as<br />
Bergslagen. Bergslagen was important since the Middle Ages<br />
within the mountain and iron and steel industry. <strong>The</strong>re are sites<br />
where iron has been received in 400 A.D., the Extracting area of<br />
the Central Sweden needs to be distinguished from Malmfälten,<br />
an extracting area of Northern Sweden, concentra ted in cities<br />
of Kiruna and Malmberget which importance increased in the<br />
20th century and especially during the Second World War.<br />
Bergslagen covers the old landscapes of Västmanland, Dalarna<br />
(south) and Värmland (east). <strong>The</strong> main Cities of Bergslagen<br />
are Nora, Fagersta, Sala, Kristinehamn, Filipstad, Ludvika and<br />
Hedemora.<br />
<strong>The</strong> northern extracting area of Sweden and the cities that<br />
were pioneers in the development of the iron ore industry<br />
are now in decline. Malmberget (Ore Mountain) is a miner’s<br />
city in Gällivare Municipality, Norrbotten County, northern<br />
Sweden (Lappland). Malmberget is known as the main site for<br />
the extraction of iron ore from deep mines, which is done by<br />
the company LKAB. Gropen (Hole) has a deep deposit. Today<br />
Gropen is in decline as the underground mining industry<br />
undermines the area, and the seismic events caused by the<br />
mining industry regularly stir up Malmberget.<br />
<strong>The</strong> first “Swedish” settlers arrived in the area of Kiruna<br />
from the southeast, nearby Masugns byn where the first iron<br />
ore mining industry opened in 1647. However the city has<br />
appeared only in 1900 when there has been begun a lining<br />
railway «the Ore Line» (has been opened per 1903). In<br />
connection with metallurgy decline, in this area tourism began<br />
to develop actively. <strong>The</strong> former industrial mines have improved<br />
and now best-selling excursions in the past of mining business<br />
of Sweden there are led.<br />
With development of new technologies the Swedish cities – the<br />
centres of metallurgy not lost their value, but also could grasp<br />
the Euro pean leadership. <strong>The</strong> Berslagen area is the centre of an<br />
iron and steel industry, the largest in the EU. Sweden’s share<br />
in the global iron market amounts to more than 1 percent.<br />
<strong>The</strong> Centres of qualitative metallurgy of Sandviken, Hufors,<br />
Fagersta, Avesta, Degerfos, Hagfors and others are concentrated<br />
in the old mining area Berrslagen on which share to have 2/3<br />
steel melts, including 9/10 the qualitative. Large factories of a<br />
full metallurgical cycle are built in Burleng and in ore - export<br />
ports Luleå and Okselösund. Over 40% of all steel is melted<br />
in electric furnaces. <strong>The</strong> main centres of nonferrous metallurgy<br />
are Sheleftero (copper and lead), Sundsvall (aluminium),<br />
and Vester ås and Finspong (hire of nonferrous metals). <strong>The</strong><br />
main centres of shipbuilding are located on the western and<br />
south-western coast of Sweden: Göteborg (Götawerken and<br />
Eriksberg), Malm (Kockums), Uddevalla, and Landskrona.<br />
Salt<br />
Salt has played a prominent part in the deve lop ment of man’s<br />
activities, trade, politics and culture since prehistoric times.<br />
Man’s primary use of salt is as an essential dietary item for both<br />
him and his domestic animals. Salt has also been used since<br />
prehistoric times for flavouring, pickling, preserving, and curing<br />
meat and fish and for tanning. <strong>The</strong>se features have made salt an<br />
important part of human culture and civilization. As one writer<br />
points out, “From the cells in our brains and bones to customs<br />
that spice our languages, salt pene tra tes every aspect of our<br />
existence”.<br />
Expressions such as worth his salt, above the salt, old salt, loyal to<br />
one’s salt, the salt of life, and salary, are used every day. Different<br />
cultures have variously held salt as a symbol of divini ty, purity,<br />
Pict.11a: Salt is on the table for many purposes<br />
welcome, hospitality, wit or wis dom. In Sanskrit the word<br />
lavanya, which expresses grace, beauty and charm, is derived<br />
from the word for salt, lavana.<br />
Salt has been equally important in trade and politics. Many<br />
earlier cultures used it as cur rency. Some primitive tribes gave<br />
its weight in gold to purchase salt. For almost 300 years, salt<br />
also influenced the development of trade and the cities of the<br />
<strong>Baltic</strong> <strong>Sea</strong> region. <strong>The</strong> Hanseatic League initially developed on<br />
the salt trade. <strong>The</strong> impetus for the formation of the Hanseatic<br />
League was trade along the Salt Road that ran between the<br />
German cities of Hamburg and Lübeck.<br />
<strong>The</strong> salt, which was used to salt and dry meat and fish, making<br />
transport and distribution possible, was mined in Kiel and<br />
Lueneburg. <strong>The</strong> salt was sold in Eastern Europe, including<br />
Novgorod, so not only did Hansa cities develop, but also<br />
Russian cities like Novgorod and Pskov. In those cities, leather<br />
tanning flourished, and the leather trade developed. But as time<br />
went on, salt gradually lost its power. Nowadays one of the<br />
latest witnesses of salt might be the Lübeck-Elbe Canal, which<br />
was used as a waterway and trade route from the “salt city” of<br />
Lüneburg to the Hanseatic city of Lübeck. In certain periods,<br />
the develop ment of the city was influenced by its econo micgeographic<br />
position. That is why we will choose some periods.<br />
<strong>The</strong> epoch of the Vikings<br />
It is possible to define three basic stages of development of early<br />
urban centres in the <strong>Baltic</strong> region. <strong>The</strong> first stage (from the<br />
8 th century to the first half of the 9 th century) is characterized<br />
by a gradual concentration of handicraftsmen and merchants<br />
Pic. 11b. Old salt storehouses in Luebeck<br />
in traditional places for ships to be docked and other central<br />
points on ways of messages and connected with the limited<br />
barter.<br />
<strong>The</strong> most ancient Danish protocities (Dankirke, Southern<br />
Hedeby, Ribe) are obliged by the occurrence and development<br />
of international trade and the concentration connected with<br />
it of craft activity. Possibly, the new settlements which grow<br />
subsequently in the medieval period — Århus, Slagelse,<br />
Odenses, etc. - have same origins.<br />
Pic.12. <strong>The</strong> Old Salt Route passing Lüneburger Heide<br />
Observing and innovating <strong>Urban</strong> <strong>ecology</strong> in the <strong>Baltic</strong> <strong>Sea</strong> region. Chapter 3 27
28<br />
Some minor seaside trading places stopped at the first stage of<br />
development or because of an insufficient economic power of<br />
district or adverse communication-geographic conditions. In<br />
places where these sorts of adverse condi tions were not present,<br />
at the second stage of development (9th –11th centuries) the<br />
old centres could be transformed into multiethnic early urban<br />
settlements (Ladoga, Rerik, Hedeby, Ralsvik); or new trading<br />
places were based near old settlements.<br />
Paviken was a rich trading and crafts settle ment on Gotland.<br />
Mentslin, at the mouth of the river to the Foam, was the<br />
same type of settle ment. It soon, however, receded into the<br />
background and eventually drew back after Szczecin and Volin<br />
were founded in the second half of the 9th century. In Denmark<br />
Ribe and, apparently, Århus also rose gradually. In the east,<br />
Slavic earths not later than boundary IX-X centuries as the<br />
Slavic centre Novgorod advances to the forefront.<br />
Pic.13. Trade routes of the <strong>Baltic</strong> <strong>Sea</strong><br />
Region during the Hanseatic period<br />
<strong>The</strong> third stage was connected with the conso lidation of the<br />
domination of the feudal nobility and statehood in Poland,<br />
in the area of the Obodrits, in Denmark, Sweden and Russia.<br />
Basically it began in the second half of the 10 th century. On the<br />
southern coast of <strong>Baltic</strong> <strong>Sea</strong> at this stage, there was Gdansk,<br />
Kolobrzeg, Szczecin, Usedom and Old Luebeck. In Denmark<br />
Hedeby, Ribe, and Århus were perhaps reconstructed. In<br />
Sweden, there was Sigtuna. On Gotland, origin of Visby, which<br />
replaced old Paviken.<br />
<strong>The</strong> expansion of the network of sea commu nications in the<br />
10 th and 11 th centuries, the increase of the tonnage of courts,<br />
and better arrangement of overland trading routes promoted<br />
that the network of the operating largest new centres early<br />
urban type appeared more rare, than during previous time.<br />
So, for example, the island of Rügen, before the boundary of<br />
the IX-X centuries - the important link in the trading message<br />
focused on coasting navigation, has appeared out of the basic<br />
Pic. 14. Trade road through Russia in Vikings time<br />
Pic. 15. Nicholas Roerich “Saint Nikolay”<br />
trading routes and sea trade. In the 10th and 11th centuries, large<br />
vessels from the island Zealand got directly to the mouth of the<br />
Oder without coming to Rügen.<br />
Århus rouse about year 900 on a cape in a river mouth.<br />
Protected by shaft and possessing a convenient waterway, it<br />
drew handicraftsmen and merchants whose interests were<br />
connected with the east and the north. Such early cities as<br />
Roskilde, Odense and Viborg rose simulta neous ly with Arhus,<br />
and at the same time in the second half of the 11th century<br />
Hedeby in southern Jutland gave way to a new city—Schlezvig.<br />
At the time of the Knut the Great (at the beginning of the 11th century, there was Lund, an important religious centre at a<br />
crossroads in Skåne, the southern extremity of the Scandinavian<br />
peninsula, which was under Danish control.<br />
In the vicinity and territory of Visby, which later was an<br />
important centre of the Hanseatic League, traces of activity of<br />
trading commu ni ties from the Viking age, representing themselves<br />
an initial stage of development of this medieval centre,<br />
are opened. Trade as a leading employment was already being<br />
promoted during the Viking age.<br />
Mining was one of the important factors for the development<br />
of cities in Sweden at this stage. Extracted in Sweden, iron was<br />
exported to Europe. Gotland was an important link in this<br />
process. <strong>The</strong> position of the island promoted its transformation<br />
into a reloading point for the export of iron from the area<br />
around Lake Mälaren and other places of continental Sweden<br />
to the east and the south on Russian rivers. On Gotland,<br />
metal could be worked into easily transported, partly finished<br />
products, mainly sword blades. It was the counter-response to<br />
the stream of silver that reached the islands from the east.<br />
<strong>The</strong> formation of early cities in<br />
Russia<br />
Connecting two lakes, Volkhov was a major part of the<br />
Varangian trading routes: Ladoga and Ilmen. However<br />
movement across Volkhov was at a loss set of thresholds, and<br />
near most difficult of them in the 8th century there was a<br />
settlement that now is known as Old Ladoga. <strong>The</strong> exact date of<br />
its foundation is unknown, but as archaeological excavations<br />
testify, it occurred not later than 753.<br />
In the IX-XI centuries, Ladoga was a port city that served as a<br />
place of contact of various ethnic groups and cultures: Slavs,<br />
Finns and Scandinavians.<br />
Approximately at the same time one more ancient city,<br />
Novgorod, was also founded. <strong>The</strong> reasons for its origin are<br />
very similar—since the most ancient times through Priilmene<br />
the international Baltijsko-Volga trading way which promoted<br />
formation at sources of Volkhov of the centre of political<br />
interaction of local Finno-Ugric tribes and come here in the<br />
6th –8th centuries of Slavs came. Here in 859 year Novgorod also<br />
has arisen. At first, it was a small settlement with not numerous<br />
inhabi tants. But with expansion of trade, Novgorod started<br />
to gain strength and soon became the capital of a rich state<br />
stretching from the Gulf of Finland to the Ural Moun tains.<br />
<strong>The</strong> ships ancient citizens of Novgorod went to New Land,<br />
Spitsbergen, Norway, Sweden, Denmark, Germany, and Poland.<br />
Observing and innovating <strong>Urban</strong> <strong>ecology</strong> in the <strong>Baltic</strong> <strong>Sea</strong> region. Chapter 3 29
30<br />
<strong>The</strong> establishment of constant trade from the Varangian in<br />
Greeks promoted the develop ment of Novgorod as a major<br />
point of transit trade. Finds of the treasures containing West<br />
European and east coins, and also nonferrous metals, precious<br />
fabrics, vessels testify to it for wine and olive oil from the<br />
Western Europe and Byzantium. At the same time, furs, honey,<br />
wax, flax and hemp from Novgorod were known all across<br />
Europe, including England.<br />
By the end of the Viking age and immediately after it, in the<br />
11th –13th centuries, almost all early proto-cities disappeared. In<br />
their place or near them, new, already actually medieval cities<br />
grew. Strengthening of commercial relations with Northern<br />
Europe in the 12th century increased the value of the cities that<br />
were on trading routes.<br />
<strong>The</strong> example of Novgorod<br />
<strong>The</strong> city of Novgorod did in this period not lose its value, but<br />
developed into one of the largest trade centres of Northern<br />
Europe. On the boundary of the 11th –12th centuries in<br />
Novgorod, its own merchants formed corpora tions (Ivansky<br />
hundred) and a foreign trading court yard: Gothic (belonging<br />
to inhabitants of the island Gotland), and German (Peterhof).<br />
<strong>The</strong> inhabitants of Novgorod, in turn, made some thing similar<br />
in Visby (on Gotland).<br />
<strong>The</strong> 13th –15th centuries were times of blossom for Novgo rod.<br />
For its period it was a big city with a population of 25–30<br />
thousand, comparable to Lübeck, Vienna and Prague. And<br />
Old Ladoga in the 12th century became one of the suburbs<br />
of Novgorod, a key link in the system of strengthening the<br />
protection of Novgorod from external enemies.<br />
Pic.17. Burial mound near Novaya Ladoga<br />
Pic.16. Nicholas Roerich “Volokut Volokom” showing how the Vikings<br />
pulled their vessels across the watersheds from river to river<br />
And nevertheless loses the value as a conside rable port<br />
city. Cities from the very beginning became centres of<br />
administration and suppor ters of the church. <strong>The</strong>ir functions<br />
as centres of internal and external exchange are especially<br />
appreciable. And then, up to the end of the Middle Ages, in<br />
their economic activities of function of an exchange, trade,<br />
including transit, were economically leaders, they overtook<br />
concentration there crafts and crafts.<br />
<strong>The</strong> city of Smolensk is such an example. Having arisen in<br />
863 year as a city of the union of tribes, then it has developed<br />
in large transit point on a way from the Varangian in Greeks.<br />
In the 12th century, Smolensk was large point of trade and<br />
craft manufacture and a military fortress. Besides, thanks to<br />
the political activity of Smolensk princes, from Smolensk the<br />
Novgorod trade coped even. Smolensk became the first Russian<br />
city that is mentioned at the creation of the Hansa. With it<br />
in 1229 the society of German merchants concluded its first<br />
contract. It became a push for the formation of Hansa.<br />
<strong>The</strong> Hanseatic League<br />
By the end of the epoch of the Vikings and immediately after<br />
it, in the 11 th –13 th centuries, almost all the early Scandinavian<br />
cities disappea red. In their place or nearby them new, already<br />
actually medieval cities grew:<br />
Pic. 18. Apollinari Vasnetsov “Novgorod Marketplace”<br />
Uppsala, Skara, Linchyoping, Tele, and the Squid in Sweden;<br />
Ribe, Shlezvig, Roskilde, Viborg, Copenhagen (Zealand),<br />
Aarhus and Aalborg (Jutland), Odense (Fyn), and Lund and<br />
Malmo (Skåne) in Denmark; Nidaros-Tronheim, Bergen,<br />
Stavanger, Tønsberg and Oslo in Norway, and also smaller cities<br />
and towns.<br />
Cities from the very beginning became centres of<br />
administration and taxes and supported in gene ral royalty and<br />
the church. <strong>The</strong>ir functions as centres of internal and exter nal<br />
exchange are especially appreciable. And then, up to the end of<br />
the Middle Ages end, in their economic activities functions of<br />
exchange, trade, including transit, were econo mic leaders, they<br />
overtook concentration of crafts. <strong>The</strong> island of Gotland was<br />
famous. Almost the entire population of the island was involved<br />
in trade; it turned into a republic of trading bonds.<br />
In the 13th century, German colonies were created in the main<br />
Sweden ports, including Abo (Turku) in Finland, and in all<br />
the major cities of Denmark and Norway. Bergen (present -day<br />
Norway) in general got under the power of the Hansa.<br />
One century before Lübeck has received the first privileges<br />
in the north — the future head of Vends Hansa. In the 13th century and especially after the second half of the 14th century,<br />
great numbers of German burghers began to move to the<br />
Scandinavian cities. As a result, handicraftsmen, dealers, and<br />
ship owners from Hanseatic, primarily Vends, cities made up<br />
an appreciable part of the Scandina vian townspeople, especially<br />
their more well-founded layers. <strong>The</strong>y took dominating<br />
economic and imperialistic positions not only in Stockholm,<br />
Copenhagen, Bergen where they had the offices, but also in<br />
less known city centres. <strong>The</strong>y conducted Scandina vian naviga-<br />
Observing and innovating <strong>Urban</strong> <strong>ecology</strong> in the <strong>Baltic</strong> <strong>Sea</strong> region. Chapter 3 31
32<br />
Pic.19. Map of Hanseatic Union<br />
Pict.19a: Tapestry showing Hansa merchants standing i a map of the<br />
Hansa Union<br />
tion closely connected with city trade. Already at a passing<br />
on a medieval map of Northern Europe rather non-uniform<br />
distribution of cities on this territory is found out.<br />
Cities of Denmark and Norway are located close to the coasts.<br />
<strong>The</strong> Danish coast is covered with cities, but they are small,<br />
and more considerable centres are unique. In Sweden many<br />
cities were founded in remote places, but near big lakes and<br />
navigable rivers with convenient outlets to the sea. Here there<br />
are more appreciable cities, and between them there is a fierce<br />
struggle for the rights of active foreign trade, i.e. the possibility<br />
not only to import, but also to export. Stockholm, leaning<br />
against government support, used so-called trading compulsion<br />
method, compelling other cities to take out a number of the<br />
important export goods, in particular, metals, only through the<br />
port and as a result has sharply come off in the development<br />
other cities of the country.<br />
Groups of Hanseatic cities<br />
Hanseatic cities were located in the territories of the modern<br />
states of the <strong>Baltic</strong> region and the EU:<br />
● In the territory of Germany: in Mecklenburg, Golshtejne,<br />
at the river mouth of the Elbe at the North <strong>Sea</strong> (Hamburg,<br />
Kiel, Lübeck), Brandenburg (Berlin, Brandenburg), former<br />
East and West Prussia (Torun [Torn], Königsberg, Gdansk<br />
[Danzig], Memel), present Westphalia and Lower Rhine<br />
(Dortmund, Muenster, Cologne), and present Lower<br />
Saxony to the south of the Elbe, partially present Saxony-<br />
Anhalt (Bremen, Magdebourg, Halle)<br />
● In the territory of present Poland: present Pomorsky<br />
and Western-Pomorske land Poland (Szczecin [Stettin],<br />
Kolobrzeg [Kyolberg]).<br />
● In the territory of present-day <strong>Baltic</strong>: Tallinn, Tartu, Riga,<br />
and Tsesin.<br />
● In the territory of present-day Holland: Amsterdam and<br />
Kampen.<br />
● In the territory of present-day Sweden: the island Gotland<br />
and part of the east coast of Sweden: the cities of Visby, the<br />
Squid.<br />
In 1492, Ivan III founded Ivangorod. In Ger man documents it<br />
was called Kontr-Narva. It carried out the functions of a post<br />
and often repulsed the attacks of Germans, Swedes and Poles.<br />
<strong>The</strong> original customs point which asses sed with gathering the<br />
goods passing from Hansa to Russia was its one more function.<br />
Soviet times<br />
In these times, the inside links of the <strong>Baltic</strong> <strong>Sea</strong> region grew<br />
stronger. Many of the previously independent countries<br />
were absorbed by the Soviet Union. <strong>The</strong> formation of urban<br />
networks was planned with the government. In the 1970s,<br />
gas and oil were directed from the Soviet Union to Europe<br />
and pipelines were built. In such a way, new towns involved<br />
in petroleum processing and the chemical indu stry appeared<br />
(Mažeikiai, Lithuania; Polotsk, Belarus; Kirishi, Russian<br />
Federation). Oil ports were also built (Ventspils, Latvia; Vyborg,<br />
Russian Federation).<br />
Town surveying and city architecture of the Soviet period was<br />
specific for the most part of the east countries of the <strong>Baltic</strong><br />
<strong>Sea</strong> region (Poland, Latvia, Lithuania, the northern part of<br />
Germany). It was a time of optimization in usage of nuclear<br />
Pic. 20. Typical architecture of the Hansa – from Stockholm<br />
stations. Several nuclear stations were built and surrounding<br />
territories were settled (Sosnovy Bor, Russian Federation;<br />
Ignalina, Lithuania; Oskarhamn, Sweden; etc.).<br />
Nowadays<br />
In the present period, the formation of city networks is<br />
characterized by the intensification of the use of transit position<br />
in connection with the formation of the European policy of<br />
intermodal corridors. <strong>The</strong> increase in the transport of resources<br />
from Russia to Western Europe influences the formation of the<br />
city network and city structure.<br />
In recent decades, the southern <strong>Baltic</strong> region has lost its<br />
industrial functions. Cities and industrial factories have fallen<br />
into decay. To give new life to this area, it is necessary to think<br />
of the main and unique resource which the <strong>Baltic</strong> region<br />
has—its economic-geographic position. Throughout history,<br />
the southern <strong>Baltic</strong> region has played the role of gateway to<br />
Scandinavia and the countries of continental Europe, and it also<br />
now provides access to emerging markets in Russia and Asia.<br />
So, nowadays the policy of intermodal corri dors can become a<br />
factor for the development of cities. <strong>The</strong> term corridor means<br />
the set of all types of transport in coordination, functioning<br />
in a defined direction and participating in the transportation<br />
of concrete cargo. <strong>The</strong> transport corridor is a consolidation in<br />
one strong Euro pean transport artery and the fruitful interaction<br />
of the following transport components: Rail, road, sea,<br />
river, pipeline, and air trans port. It is also a conso lidation of the<br />
accom panying infrastruc tural elements: IT and access roads,<br />
customs, border posts, warehouses, etc.<br />
<strong>The</strong> idea of creating intermodal transport corridors is included<br />
in European transport policy. In compliance of this policy, ten<br />
corridors, with four passing through the <strong>Baltic</strong> region, have<br />
been developed. Regional trans port hubs should be located on<br />
interna tional or national transport corridors. <strong>The</strong> best variant is<br />
the interaction of all hubs.<br />
In cities through which corridors will run, powerful transport<br />
hubs for maintenance of steady passenger and cargo transport<br />
between regional cities can be created. Ports can raise their<br />
competitiveness by creating ports hubs—ports intended<br />
for transfer of transit cargo. Besides, favourable to the cities<br />
which are on a way of corridors will develop the railway and<br />
automobile networks. In this case, they can become large<br />
transit centres on the road from Europe to Asia. A position<br />
Observing and innovating <strong>Urban</strong> <strong>ecology</strong> in the <strong>Baltic</strong> <strong>Sea</strong> region. Chapter 3 33
34<br />
in the southern <strong>Baltic</strong> area is especially good in this case. In<br />
the southern <strong>Baltic</strong> region now, the volume of passenger and<br />
freight traffic is rapidly increa sing. Insufficient development of<br />
existing infrastructure and transport systems, however, does not<br />
allow effective and rational admini stration of this growth to be<br />
exercised.<br />
Now freight traffic between Asia and Europe is carried out<br />
mainly on water routes through the Pacific, Indian and Atlantic<br />
oceans. <strong>The</strong> transit time of freight traffic to Europe through<br />
the Suez Canal from Japan or South Korea takes 35–40 days.<br />
Transit time on the Trans-Siberian highway takes only 16–18<br />
days. Thus, develop ment of railway junctions in the southern<br />
<strong>Baltic</strong> region and north-west region of Russia will strengthen<br />
the economy of those areas, create new cities, and have a good<br />
effect on the transport system of the EU.<br />
In regions through which transport corridors will pass, the<br />
markets of services, support branches, tourism infrastructure,<br />
and rest will develop. Adequate loading and development of<br />
a transport infrastructure will create addi ti onal stimulus for<br />
other branches of the economy—from power before retail<br />
trade. And this will have an effect not only along transport<br />
corridors. For example, a sharp increase in the volume of<br />
cargo transportation by rail will increase the requirement for<br />
rolling stock, and loading of whole our industry will increase.<br />
Assembly, metallurgical manufactures will receive real orders.<br />
<strong>The</strong>re will be a real possi bi lity to modernize industry, which<br />
is now not competitive and lead it to the necessary level. New<br />
industries—for example the manufacture railway-auto ferries—<br />
will be created. This type of transport will be one of the most<br />
demanded at formation of new intermodal system. By means<br />
of such ferries, it will be possible to deal with the problem of<br />
different track width in Europe and Russia.<br />
A policy of carrying of intermodal corridors out in a life is just<br />
started. <strong>The</strong>re have already been certain successes. In Russia new<br />
ports, which apply for becoming large transport hubs along the<br />
line goods traffics have been created. It is possible to give the<br />
example of Ust-Luga, a small settlement in Leningrad Oblast.<br />
Here a new port terminal which urged to become the largest on<br />
the <strong>Baltic</strong> <strong>Sea</strong> has been constructed. <strong>The</strong> purpose of building of<br />
port at Ust-Luga was to overcome the potential insufficiency of<br />
capacity of the port in St. Petersburg and to remove from a city<br />
zone cargoes causing pollu tion and transport problems.<br />
<strong>The</strong> reason for a choice of this place is the uni que natural<br />
features of Luga Bay. First, it is caused by possibility of yearround<br />
use of the port with the short period of the help of the<br />
ice breaker for courts. Second, a deep water of water area is<br />
combined with short channels of approach (3.7 km compared<br />
with 35 km for Port of St. Petersburg). <strong>The</strong>re are no restrictions<br />
on the further expansion of territories to gene rate a customs<br />
warehouse and industrial zones in the port. Ust-Luga Port<br />
is actually located on the border of the Russian Federation<br />
and the European Union. It is in harmony with a network of<br />
transportation in the north-west area, which plays an essential<br />
role in the organization of shipments of transit within the<br />
European transport infrastructure.<br />
Ust-Luga Port was designed to be a universal port.<br />
Multipurpose terminals and operational zones will render<br />
services of an overload and additional processing of more<br />
than 20 catego ries of cargo. Because of the use of modern<br />
technologies, the equipment terminals are able to present<br />
competitive terms of services. <strong>The</strong>re are four terminals now<br />
working in the port: a coal terminal of an overload, the<br />
terminal of an overload of sulphur, a complex of the ferry of<br />
the motor railway, and the universal reloading complex. <strong>The</strong><br />
port is involved in active con struc tion of the multipurpose<br />
complex “Jug-2”, the container and terminals for bunkering,<br />
and complexes for the overload of general cargo, bulk cargo,<br />
liquefied gas, and other types of cargo.<br />
<strong>The</strong> new oil port at Primorsk, the final point of the <strong>Baltic</strong><br />
pipeline system, is also an important link in new transport<br />
system of the northwest. By results of work, in August 2008 the<br />
oil terminal at Primorsk passed 4.745 million tonnes of crude<br />
oil, 24 percent more than in August of the previous year.<br />
<strong>The</strong> example of the city of Vysotsk, one of the smallest cities<br />
in Russia, is also interesting. Only 1719 inhabitants live<br />
there. Nevertheless, it is now one of the most important oil<br />
terminals in Russia. Throughout its history, Vysotsk was a<br />
seaport, a convenient and reliable harbour for the merchant<br />
marine and navy fleet. Now the port, which is located on an<br />
island, is connected to the continent with a new highway and<br />
a single-line railway. Since the middle of 1990 Vysotsk Port has<br />
experienced active development connected with the realization<br />
of some investments in civil engineering designs for new<br />
terminal complexes. By 2010, the turnover of goods in the port<br />
should reach 15 million tonnes a year (including general cargo).<br />
So, it is obvious that the successfully realized factor of successful<br />
economic-geographic position together with the actively spent<br />
transport policy of the EU can become a starting point for the<br />
development of the <strong>Baltic</strong> <strong>Sea</strong> region.<br />
Questionnaire for Chapter 3<br />
<strong>The</strong> origin of the town<br />
How was the historical resource-basis for the foundation of<br />
your town or city?<br />
Research for its:<br />
1. Natural resources<br />
2. Production in and around the city<br />
3. <strong>The</strong> city’s own trade<br />
4. Transit trade, using the geographical position<br />
5. <strong>The</strong> position in the regional infrastructure<br />
6. Draw a map (a model) of these components<br />
Describe and analyse the development till now<br />
1. How has the resource-basis changed?<br />
2. and the production of the city?<br />
3. <strong>The</strong> trade internal<br />
4. Trade for transit<br />
5. <strong>The</strong> regional infrastructure<br />
6. Draw an updated map<br />
Predict the future urban development!<br />
Try to make two scenarios:<br />
1. A future development which is a simple prognosis (forecast)<br />
based on the present trend according to industrial and<br />
economic state and technology, administrative level, educational<br />
standard and composition of infrastructure.<br />
2. Try to go in details with a scenario for the same urban<br />
parameters as above, if all CO2-exhausting (producing)<br />
machinery is being forbidden and must be replaced by<br />
technology based on renewable energy supply<br />
Future attraction of the <strong>Baltic</strong> region?<br />
What has been the overall attractions for people concerning<br />
their living until now through the main periods?<br />
What would you expect them to be in the future - state the<br />
reasons!<br />
<strong>The</strong> regions biggest cities 2005<br />
1. St. Petersburg (RS): 4.100.000<br />
2. Berlin (D): 3.416.255<br />
3. Warszawa (PL): 2.000.000<br />
4. Hamburg (D): 1.743.627<br />
5. København (DK): 1.230.607<br />
6. Stockholm (S): 1.212.196<br />
7. Gdynia, Sopot, Gdansk, (PL): 949.700<br />
8. Kraków (PL): 756.267<br />
9. Riga (LV): 720.000<br />
10. Helsinki (SF): 559.046<br />
11. Vilnius (LT): 550.000<br />
12. Göteborg (S): 500.085<br />
13. Kaliningrad (RS): 423.651<br />
14. Szczecin (PL): 411.119<br />
15. Tallinn (EE): 401.694<br />
16. Novgorod (RS): 240.000<br />
17. Lübeck (D): 211.825<br />
18. Pskov (RS): 203.000<br />
19. Rostock (D): 197.218<br />
20. Klaipėda (LT): 194.400<br />
Total a. 20 mio citizens<br />
Observing and innovating <strong>Urban</strong> <strong>ecology</strong> in the <strong>Baltic</strong> <strong>Sea</strong> region 35
36<br />
Chapter 4. What is “on” the agenda for urban <strong>ecology</strong> in<br />
the BSP-area<br />
Résumé: This chapter presents a range of cases from the countries at the <strong>Baltic</strong> <strong>Sea</strong>, aimed to show a variety<br />
of local research and projects on urban <strong>ecology</strong>, based mainly on “green” technology, some of them at the<br />
same time new technologies.<br />
Observing and innovating <strong>Urban</strong> <strong>ecology</strong> in the <strong>Baltic</strong> <strong>Sea</strong> region. Chapter 4 37
38<br />
Case 1. Research on the implications of the changed climate in big cities.<br />
<strong>Urban</strong> climate – like climate on a steppe - dry,<br />
sometimes flooded, extreme temperatures and wind<br />
variations<br />
<strong>The</strong> department of Geography at the Alexander Humboldt<br />
University in Berlin represents a long tradition of studying the<br />
urban climate and its influence on the health conditions for<br />
the living in cities. <strong>The</strong> purpose of these studies is naturally<br />
to analyse how the city may react to the consequences of<br />
extreme climate variations, not only directly when heat or cold<br />
conditions appear, but also the planning process for the city<br />
before it is built:<br />
<strong>The</strong> focus is primarily on the planning, renovation and<br />
regeneration of the cities.<br />
Based upon these studies professor Dr. Wilfried Endlicher in<br />
October 2007 at a symposium in Amsterdam about urban<br />
climate changes published the below referred demonstration of<br />
the Humboldt University study:<br />
<strong>The</strong> basic point of the study is that<br />
global warming is inevitable<br />
● Emission of green house gases will continue in the future.<br />
● Increasing world population will emit probably even more<br />
green house gases.<br />
● Global warming has started decades before and is in strong<br />
relation with the emission of green house gases.<br />
● Following the IPCC, global warming will increase weather<br />
extremes.<br />
16ºC is nearby the mean temperature also in the seaports of the<br />
<strong>Baltic</strong> <strong>Sea</strong> in July: Stockholm, Helsinki, St.Petersburg, Tallin,<br />
Riga, Klaipėda, Gdynia, Rostock and Copenhagen. <strong>Sea</strong>ports<br />
though may be cooled by wind from the seaside and will not<br />
show the same increase in temperatures as inland cities.<br />
Figure 4.1. How temperatures will change in a Swiss city within the next<br />
75 years - a rise of 4-5ºC within 100 years, from usually about 16ºC in<br />
the period 1961-90 to a level around 20-21ºC in the period 2071-2100.<br />
<strong>The</strong> creation of the urban climate<br />
Studies of urban climate have shown how temperatures and<br />
other climate components vary from the rural outskirts of the<br />
city to the centre as shown on the figure of the cross-section<br />
below (Figure 4.2). <strong>The</strong> geographers describe the variations as<br />
if there were islands of heat climate (UHI). <strong>The</strong> warmest and<br />
driest and most windy heat islands are located where most<br />
land is covered with asphalt or concrete, where the buildings<br />
are naked concrete or steel and glass buildings. <strong>The</strong> taller the<br />
buildings, the more radiation (reflection of heat and cold); the<br />
taller, the more wind-catching (creation of turbulence).<br />
Infrared monitoring from satellites has contributed to the<br />
documentation of the complicated heat landscape of a city. <strong>The</strong><br />
example of Berlin (Figure 4.3) shows clearly how much higher<br />
the re-radiation of the solar energy is in summer from the<br />
central business and government districts compared to the open<br />
fields around the city.<br />
Observing and innovating <strong>Urban</strong> <strong>ecology</strong> in the <strong>Baltic</strong> <strong>Sea</strong> region. Chapter 4 39
40<br />
Figure 4.2. Generalised cross-section of typical urban heat island UHI<br />
Figure 4.3. A summer days variation in temperatures in Berlin. Blue<br />
collars indicate cool micro climate, red warmer climate<br />
Figure 4.4. <strong>The</strong> street as canyon Figure 4.5. Health<br />
<strong>The</strong> Figure 4.4 of the microclimate in the denser part of the<br />
city illustrates, how the street in the city functions as if it was a<br />
canyon.<br />
Tall dark buildings of concrete, brick stone, glass and steel<br />
border the street and its pavement is usually dark asphalt upon<br />
a box of gravel and stones.<br />
Most of these materials absorb and accumulate, due to their<br />
low heat density, radiation from the sun and reflect it soon as<br />
infrared radiation.<br />
Only one side of the street is usually exposed to the sun, the<br />
other side is in the shade, causing great temperature differences<br />
between one side of the street canyon and the other, and<br />
between top and bottom of the canyon.<br />
This causes again strong air movements between the colder<br />
parts of the street (where the cold air keeps a higher pressure)<br />
and the warmer parts, where the pressure is low.<br />
<strong>The</strong> curves of wind and temperatures in the street canyon show<br />
a complicated relation between sun-heated surfaces and the<br />
cooler materials in the shadow:<br />
<strong>The</strong> heating of the sunny side of the street tends to raise the<br />
temperature of the air on this side. <strong>The</strong> result is a strong wind<br />
in the centre of the street canyon attempting to equalize the<br />
temperature (and pressure) between the two canyon wings.<br />
Apart from these specific street conditions in the centre, there<br />
had been almost no wind.<br />
This wind is an urban phenomenon, closely connected to the<br />
absorption of solar radiation in the city.<br />
Implications of heat and cold on<br />
health<br />
During a number of years the summer temperatures in Europe<br />
have reached a higher level than before, as a consequence of the<br />
global warming.<br />
<strong>The</strong> Humboldt University describes the influence on health as<br />
shown in the model (Figure 4.5):<br />
Figure 4.6: Heat and death correlation. Figure 4.6 left shows how closely<br />
changes in temperature were related to death during ten years, from<br />
1986 to 1996, in different cities of Europe. London as the biggest city<br />
was influenced most by both cold and extreme heat.<br />
Long-term adaptation<br />
Reduction of<br />
outdoor and<br />
indoor thermal<br />
stress<br />
Reduction of<br />
indoor thermal<br />
stress<br />
Lead time necessary:<br />
<strong>Urban</strong> planning<br />
● Albedo<br />
● Ventilation; air flow<br />
● Green and open spaces; trees<br />
● Shadowing<br />
Building design<br />
● <strong>The</strong>rmal capacity of the building<br />
● Position of the apartment<br />
● Control of solar irradiation<br />
● Passive cooling<br />
● Green walls and roofs<br />
Figure 4.7. Changes to be made in the cities to avoid the worse effects<br />
of heat<br />
As the figure shows, many people can feel aggravation of their<br />
diseases already by 2°C higher temperature than usual.<br />
A serious 3°C increase in number of people dying of heatrelated<br />
conditions has been observed lately.<br />
With the temperatures higher than 4ºC above the usual level,<br />
the situation will be out of control: the health care institutions<br />
will no longer cover medical service, there will be lack of<br />
drinking water and food on a bigger scale, a real possibility of<br />
infections and other illnesses due to bad sanitary conditions and<br />
hunger.<br />
What is to be done within a short<br />
term and in the long run?<br />
In the short run, Germany’s example shows that mass media<br />
public warnings against heat must be provided first advising<br />
people in the cities to stay inside or in the shade, and to keep<br />
their habitation cool throughout the hot period.<br />
More steps ought to be taken to prevent heat effect on<br />
population: specified health care service readiness, extended<br />
opening hours of cool shopping centres and other covered areas,<br />
swimming pools and public baths, adjustment of the working<br />
hours to the temperatures like siestas in „Mediterranean style”<br />
(i.e. from 1-4 pm).<br />
<strong>The</strong> conclusion about the correlation of health and heat<br />
according to the Humboldt-University:<br />
● Global and local warming are superimposed in cities.<br />
● Heat waves are related to global warming and will become<br />
during the summer months more frequent in the future.<br />
● Human beings are not only influenced by high<br />
temperatures; high direct solar radiation, an high air<br />
humidity as well as low wind speeds contribute to extremes<br />
of “Perceived Temperature” during heat waves.<br />
● Mortality values and cardiovascular diseases show<br />
significant peaks in large cities heat waves (ex.g. European<br />
heat wave 2003).<br />
● Heat waves have not to be considered as pure weather<br />
phenomena, but are closely related to human health, age,<br />
behaviour, social structures, housing conditions, medical<br />
care and so on.<br />
● <strong>Urban</strong> planning has to take into account aspects of human<br />
bioclimatology.<br />
How can urban planning reduce<br />
warmer climate?<br />
To be helpful the researchers of the Humboldt University<br />
recommend the following (in the model figure 4.7) to develop<br />
better conditions in the cities in relation to the extreme urban<br />
climate.<br />
<strong>The</strong> proposals for greener cities are followed by a number of<br />
examples of how to create lower temperatures: more green,<br />
shaded and ventilated spaces, also shadow systems in the parks<br />
and avenues, changed building methods, materials, colours of<br />
the buildings and roofs, use of green roofs and walls to improve<br />
the albedo (reflection of radiation „back into space“).<br />
Observing and innovating <strong>Urban</strong> <strong>ecology</strong> in the <strong>Baltic</strong> <strong>Sea</strong> region. Chapter 4 41
42<br />
Figure 4.9. Green avenues, gardens, hanging walls and grass greens<br />
create different microclimates, cooler and more humid than open<br />
squares with pavement of concrete and asphalt<br />
Figure 4.8. Green roof in Warsaw Figure 4.10. New housing in Travemünde pro tec ted from heat by “green<br />
walls” and hanging gardens but still surrounded by dark grey concrete<br />
pavement.<br />
As the examples above show, there are already climate<br />
improvements around in the <strong>Baltic</strong> region: Warsaw, Berlin,<br />
Travemünde…. However, as the examples of heat illustrated,<br />
they are still only minor islands in the ocean of tall, dark<br />
concrete and glass buildings, which fill up the attractive central<br />
districts in the bigger cities.<br />
(Ed: Per Werge, based on a web-published congresspresentation<br />
2007 by the Humboldt-University of Berlin, with<br />
permission)<br />
Figures 4.11. and 4.12. <strong>The</strong> sun orbit in two central squares in Berlin:<br />
<strong>The</strong> 60 year old Alexander Platz and the 2005 “reborn” Potsdamer Platz<br />
<strong>The</strong> two examples above from Berlin show remarkable differences in<br />
solar energy input (sun orbit) corresponding to the form of the urban<br />
space or square:<br />
<strong>The</strong> Berlin Alexander Platz is nearly fully exposed to the sun at<br />
mid-day, while the new Potsdamer Platz is planned to give maximum<br />
shadow and the pedestrian area is furthermore protected by reflective<br />
glass roofs. In suburbs like Dahlem the trees in the alleys protect the<br />
pedestrians most when the sun is at its peak. Besides, open spaces are<br />
half covered by the leaves of bushes and trees, keeping temperatures<br />
low and humidity high.<br />
Observing and innovating <strong>Urban</strong> <strong>ecology</strong> in the <strong>Baltic</strong> <strong>Sea</strong> region. Chapter 4 43
44<br />
Questionnaire for Chapter 4.1<br />
Practice: Climate measuring in a city<br />
Aim: to observe, register and evaluate the local urban climate<br />
compared to the general climate of the region. Time of the year is<br />
equal.<br />
Draw a simple map of your town, city or just a district. Or,<br />
simply print a section of a map of your town from the internet.<br />
● Accentuate different urban components:<br />
● A garden city area, inside a garden<br />
● An approach road<br />
● An open square in a suburb<br />
● A court in a carreé of council housing (flats) A main street<br />
in the centre<br />
● A big square in the centre<br />
● A small square<br />
● A park in the centre<br />
Use a small portable weather station to measure the most<br />
significant climate parameters. If it is not available, a simple<br />
thermometer can be useful, combined with estimations of wind<br />
force according to Beaufort’s scale:<br />
● Temperature<br />
● Pressure<br />
● Wind force and wind chill<br />
● Humidity<br />
● Or, if it is raining or snowing, precipitation<br />
Study the figures 4.2 and 4.4 and make your measurements<br />
close to buildings in the centre of streets, squares or gardens<br />
and, if possible at a height above streets and squares.<br />
Register all the data of every place, also the precise spot where<br />
they were taken (altitude, in the shade, in the sun, asphalt road,<br />
green lawn or bushes)<br />
If you began with an estimation (hypothesis) of what the<br />
climate ought to be, compare and evaluate all the data<br />
according to a generalized climate model (i.e. Köppen)<br />
Questions:<br />
How and where did you find differences from average standards<br />
of the season?<br />
What explains the variations?<br />
Is the degree of some variations as extreme as to require a special<br />
reaction from the city or health authorities?<br />
Where do you find the most attractive and healthy climate in<br />
the town?<br />
Are good and bad districts the same in all seasons?<br />
What can be done to mediate extreme temperatures of urban<br />
climate in your town or district?<br />
Influence on the planning process:<br />
If you find your measuring remarkable, you can try to arrange<br />
a meeting with the local planning authorities to discuss the<br />
matter and the possible changes that can be made to improve<br />
the urban climate.<br />
Reports to local media will possibly inspire them to take up the<br />
subject<br />
Observing and innovating <strong>Urban</strong> <strong>ecology</strong> in the <strong>Baltic</strong> <strong>Sea</strong> region. Chapter 4 45
46<br />
Picture 1. <strong>The</strong> “Turning Torso” was<br />
built as a symbol for an urban planning<br />
exhibition in Malmö a.2000, placed<br />
as a new city district upon a former<br />
industrial polder at the coast, originally<br />
hosting car manufacturing and ship<br />
building. <strong>The</strong> Torso is now a symbol of<br />
the new spirit for green revitalisation<br />
of the city. <strong>The</strong> grassland between<br />
the buildings is the “banks“ of an<br />
artificial stream leading runoff water<br />
to the coast. Before this happens, the<br />
rainwater is delayed by the passage<br />
and infiltration of many green roofs and<br />
artificial lakes and parks, located in<br />
many districts of Malmö.<br />
Case 2: A project to naturalize the water runoff and prevent flooding in the<br />
city<br />
<strong>The</strong> green roofs of Malmö<br />
Green roofs: a way of bringing <strong>ecology</strong> into our urban areas?<br />
Author: Jonas Oskarsson Swedish National coordinator <strong>Baltic</strong> <strong>Sea</strong> <strong>Project</strong> (BSP)<br />
Growing plants on rooftops, or green roofs, has been a practice<br />
since ancient times and there have been many reasons for<br />
doing so. <strong>The</strong> rooftop is most of times free from shadows, thus<br />
making it easy to grow plants. In addition, it was convenient to<br />
have close access to herbs or flowers especially for people living<br />
in the city. Tall plants or trees on the rooftops could also give<br />
some shelter from the sun. Most of all, studies have shown that<br />
plants bring peace and harmony to the human mind.<br />
In warmer countries, this was done on flat roofs whilst in<br />
the colder Nordic climate, the roofs had to be sloped due to<br />
snow during winter. <strong>The</strong> green roofs gave insulation during<br />
winter and cooled the house down during summer due to<br />
the evaporation from the plants. However, with modern<br />
architecture, urbanization, and economic growth, the green<br />
roofs became obsolete and equated with poverty.<br />
What about today, is it possible that the green roofs<br />
will find their way back to our urban communities?<br />
In the city of Malmö, in the very south of Sweden, there are<br />
ongoing pilot projects where large areas have been provided<br />
with green roofs and the effects are still being evaluated. <strong>The</strong><br />
aim is to increase the green areas in the city.<br />
Research and development of new materials have already<br />
brought a completely new spectrum of options to explore the<br />
possibility of bringing green roofs back to practice. <strong>The</strong>re are<br />
two types of modern roofs, which have longer life spans than<br />
the conventional roofs.<br />
One type, called the extensive roof, is fairly light and can be<br />
applied on most existing roofs even slightly sloped ones. This<br />
roof has a thin layer of vegetation, mainly based on mosses and<br />
sedum plants, and is not made for humans to walk on.<br />
<strong>The</strong> other type, the intensive roof, has a deeper layer for the roots<br />
to grow in and therefore could provide more lush vegetation.<br />
Intensive roofs can carry trees and bushes and can even work<br />
as a green recreation area for urban dwellers. This, of course,<br />
comes with an added weight, which leads to the need of a<br />
Picture 2. An old fashion version of a green roof, well integrated in its<br />
surroundings. “Back Antes stuga” in Hästmahult Sweden. (Photo: Karin<br />
Gunnarsson)<br />
Picture 3. A view of an extensive green roof. Augustenborg, Malmö.<br />
(Photo: Karin Gunnarsson)<br />
Observing and innovating <strong>Urban</strong> <strong>ecology</strong> in the <strong>Baltic</strong> <strong>Sea</strong> region. Chapter 4 47
48<br />
Picture 4. An intensive green roof with wild grapes, grass, and<br />
succulents. Augustenborg, Malmö. (Photo: Karin Gunnarsson)<br />
strong construction. However, a great number of modern<br />
houses we find in the urban areas today already have strong<br />
concrete constructions with flat, lifeless and often dull roofs,<br />
which are of no other use but for keeping the rain out and the<br />
heat or cold from coming in.<br />
<strong>The</strong> urban heat island effect causes a higher temperature in the<br />
cities compared to its surrounding areas. This is mainly a result<br />
of air-conditioning, traffic, and a more dense population. If the<br />
roofs were covered with vegetation, there would be a cooling<br />
effect due to the evaporation from the plants. A vegetated area<br />
also absorbs a lot less heat than an ordinary dark roof. Green<br />
roofs would provide a cooling effect on a structure; therefore,<br />
less energy would be used for cooling it during summer.<br />
In winter, less energy would be required to heat up a building<br />
because of the improved insulation.<br />
Picture 5. An intensive green roof, part of a recreational garden with<br />
wheel chair friendly floors Augustenborg, Malmö.<br />
<strong>The</strong> air quality in urban areas often causes respiratory problems,<br />
mainly due to traffic releasing nitrous oxides, stirring up dust<br />
particles containing heavy metals such as cadmium and lead.<br />
<strong>The</strong> vegetation would absorb a lot of this. Green roofs would<br />
also significantly reduce noise pollution in the city.<br />
Cities and urban areas are home for just a few species that have<br />
managed to adapt themselves to a sterile monoculture habitat.<br />
Green areas would serve as ecological islands and corridors,<br />
which are of great importance for creating new habitats<br />
promoting an increased biodiversity.<br />
Aside from the ecological, energy saving and health promoting<br />
benefits of green roofs, we must not forget its aesthetical and<br />
holistic aspects. <strong>The</strong>re have been studies made, asking people to<br />
describe a place they want to go to if they felt stressed or sad.<br />
<strong>The</strong> majority of respondents described a place in the middle of<br />
greenery and nature. It seems like nature has a good impact on<br />
our mental wellbeing. If we cannot move back to nature, we<br />
could do our best to bring nature closer to us.<br />
Since this is an article in a Learner’s Guide, how could<br />
environmental education in our schools make use of the<br />
concept of green roofs? Just introducing the idea would<br />
improve the knowledge and insights of students about green<br />
roofs and possibly, in the long run, other cities would follow<br />
the Malmö example. Many schools are already sterile boxlike<br />
buildings, so why not to use some of their areas for growing<br />
plants and involving students with hands-on education, where<br />
they can participate and develop new ideas, methods and get<br />
to learn more about <strong>ecology</strong>, energy efficiency, and sustainable<br />
development? It is a pity we are not doing much to make<br />
our urban life greener. Maybe through education and more<br />
awareness, we will see green roofs on our homes and buildings<br />
once again in the future.<br />
Sources:<br />
Gunnarsson, Karin. 2008. En studie av fem kommuners<br />
inställning och attityder till gröna tak. Dissertation Malmö<br />
University TBBUY-2008 BIBLKOD-XX<br />
Obendorfer et al. 2007. Green Roofs as <strong>Urban</strong> Ecosystems:<br />
Ecological Structures, Functions, and Services. BioScience, Volume<br />
57, Issue 10 November 2007<br />
Peck et al. 1999. Greenbacks from green roofs: forging a<br />
new industry in Canada. (http://www.greenroofs.org/pdf/<br />
Greenbacks.pdf)<br />
Ottosson, Åsa & Mats. 2006. Naturkraft, Om naturens<br />
lugnande, stärkande och läkande effekter. Scand book Falun 2006<br />
ISBN 91-46-21234-5<br />
Observing and innovating <strong>Urban</strong> <strong>ecology</strong> in the <strong>Baltic</strong> <strong>Sea</strong> region. Chapter 4 49
50<br />
Case 3. Finnish school project on monitoring the urbanized life of birds<br />
and bats<br />
Birds’ adaptation to urbanization<br />
Reprint of a PowerPoint demonstration of a school project in Kirkkonummi in Finland, now extended to a<br />
Commenius project on „outdoor activities“ for three partner schools in Italy, Finland and Sweden.<br />
Author: Tuovi Ronkainen, Finland’s national BSP coordinator<br />
From sparrow to barnacle goose<br />
<strong>The</strong> world is urbanizing and this can be seen as the change in<br />
the species of living organisms.<br />
<strong>The</strong> town is a versatile and valuable habitat.<br />
<strong>The</strong> study of urbanization gives students a chance to genuine<br />
cooperation with other agents.<br />
digital<br />
camera<br />
Information and communication technology serves the study of<br />
urbanization very well.<br />
<strong>The</strong> students will get active to have an influence on their own<br />
environment.<br />
Diagram of the learning environment<br />
nesting box<br />
camera<br />
definition guides<br />
ACTIVE<br />
CITIZEN<br />
scientific thinking<br />
adult community<br />
college<br />
inflatable boat<br />
GPS<br />
the bridge of Vårnäs<br />
applying<br />
teacher<br />
reasoning<br />
parks<br />
poster<br />
fish trap<br />
Observation blog<br />
streets<br />
display case<br />
group<br />
intelligence<br />
emotions<br />
Portfolio ofwater analysis<br />
Jolkbynjoki<br />
Observing and innovating <strong>Urban</strong> <strong>ecology</strong> in the <strong>Baltic</strong> <strong>Sea</strong> region. Chapter 4 51
52<br />
Old and new Pigeons nest under every eaves of the school all the year round.<br />
1. Detecting the need for research<br />
<strong>The</strong> centre of Kirkkonummi is changing now more than it has<br />
in a hundred years, from a village into a town. Now it is the last<br />
chance to survey the current species and valuable areas and to<br />
start follow-up research.<br />
<strong>The</strong> project started as a school-specific advanced high school<br />
biology course in spring 2008.<br />
2. How can urbanization be<br />
studied?<br />
<strong>The</strong> birds, mammals and bats of the town centre were chosen as<br />
the indicator species.<br />
Everyone can see the changes in the bird species, especially the<br />
reproduction of pigeons and jackdaws.<br />
Bats haven’t been studied very much. <strong>The</strong>y are a typical species<br />
for old wooden houses and stone buildings.<br />
3. Man and water in the town<br />
<strong>The</strong> River Jolkbynjoki flows in the middle of the area that is<br />
under construction and its channel will be moved in 2009.<br />
<strong>The</strong> river group studied the species of the river (plants,<br />
fishes, water invertebrates), the quality of the water (nitrates,<br />
phosphates, pH, oxygen level) and the river’s suitability for<br />
recreational use.<br />
<strong>The</strong> River Jolkbynjoki turned out to be a bad boating route.<br />
4. Creating the research plan<br />
<strong>The</strong> students planned their research: the observation routes and<br />
the observation times (for three weeks, three times a week).<br />
<strong>The</strong> students followed the nesting and other behaviour of the<br />
birds with the help of the cameras in the nesting box and in the<br />
nest under the eaves.<br />
<strong>The</strong> film of the nesting of a<br />
great tit recorded by the camera in<br />
the nesting box was shown in the<br />
corridor of the school.<br />
5. Bat study<br />
<strong>The</strong> poster of the project<br />
A bat expert gave a lecture and led the first night trip to the<br />
woods.<br />
With the help of the school’s computer analyst and the expertise<br />
of the Museum of Natural History the school acquired a bat<br />
detector of its own.<br />
<strong>The</strong> bat group planned and took night trips.<br />
6. Recruiting participants and<br />
getting publicity for the project<br />
To get observations, an observation blog was set up<br />
(http://muuttuva-porkkala.blogspot.com).<br />
<strong>The</strong> local newspaper wrote a story about the project and<br />
encouraged the towns people to use the blog.<br />
<strong>The</strong> information on the aims of the project and its expected<br />
impact with some illustrative material was placed in the display<br />
case located in the school corridor.<br />
<strong>The</strong> bat detector in use<br />
Batmen and batwomen<br />
7. Many agents are involved<br />
<strong>The</strong> head of the town’s cultural services told the students about<br />
the history of the town centre and took part in the trips.<br />
<strong>The</strong> adult community college and the environmental association<br />
also participated in the project and took the bat-observation<br />
trips as a part of their own program.<br />
Observing and innovating <strong>Urban</strong> <strong>ecology</strong> in the <strong>Baltic</strong> <strong>Sea</strong> region. Chapter 4 53
54<br />
<strong>The</strong> humble surroundings of Porkkala High School revealed<br />
an interesting spectrum of bird species.<br />
8. <strong>The</strong> first part was ready in spring<br />
2008<br />
<strong>The</strong> bird group, the bat group and the water group published<br />
their studies. <strong>The</strong> bat group became interested in continuing<br />
the research on their own during the summer and the fall.<br />
<strong>The</strong> project continues with a follow-up study in the same area<br />
in spring 2009 and it will extend outside the town centre in<br />
spring 2010.<br />
9. Expanding the project<br />
<strong>The</strong> experiences gained from the project have been taken into<br />
a guidebook on urban <strong>ecology</strong> of the <strong>Baltic</strong> <strong>Sea</strong> <strong>Project</strong> of <strong>The</strong><br />
Finnish National Board of Education.<br />
<strong>The</strong> project gave a lot of material to Porkkala High School’s<br />
COMENIUS <strong>Project</strong> (Finland, Sweden, Italy) called “Outdoor<br />
Activities”. http://comoutdoorscience.com<br />
Outdoor activities<br />
From sparrow to barnacle goose<br />
● <strong>The</strong> most important pedagogical method of the project is<br />
exploratory learning. It accentuates:<br />
● Making reliable observations about the environment,<br />
scientific thinking.<br />
● Using group intelligence, the school, the town, the<br />
university and the third sector.<br />
● <strong>The</strong> analysis and application of the results, sharing the<br />
information.<br />
Observing and innovating <strong>Urban</strong> <strong>ecology</strong> in the <strong>Baltic</strong> <strong>Sea</strong> region. Chapter 4 55
56<br />
Figure 1. Summer in the Murckowski Forest reserve (Photo Michał Mackiewicz)<br />
Case 4. Ecology of the city<br />
Katowice – an industrial desert or a green city?<br />
Wooded areas as the green lungs of the city<br />
dr Beata Węgrzynek – Silesian University, Katowice, the Faculty of Biology and Environmentalism,<br />
Lidia Janas and dr Jolanta Mol with students of II Konopnicka Grammar School, Katowice.<br />
Translated by Magdalena Kubica – II Konopnicka Grammar School, Katowice<br />
Introduction<br />
Regardless of the future climate change on Earth, forests are<br />
undoubtedly one of the most important factors influencing the<br />
level of carbon dioxide in the atmosphere. While looking for<br />
some solutions in order to struggle with global warming, we<br />
must not forget about the role of this ecosystem as one of the<br />
most vital factors moderating climate change.<br />
Forests and other wooded areas are a crucial part of the city’s<br />
greenery and their history is as long as the history of cities<br />
themselves. An urban forest is a notion, which is much broader<br />
than the one used in traditional forestry, as it concerns not<br />
only ‘typical’ forests but also small wooded areas like parks,<br />
gardens and separate trees. Wooded areas in big cities have<br />
varied functions: they are the habitats for numerous plants<br />
and animals, conservation areas for nature and landscape,<br />
absorbers of air, water and soil pollution, they also regulate the<br />
climate, thus positively influencing the inhabitants’ health, they<br />
also function as ecological education centres and the places<br />
where people can rest and relax. <strong>The</strong>y produce large amounts<br />
of oxygen and phytoncides; they serve as air ionizators, noise<br />
reducers and microclimate modifiers.<br />
<strong>The</strong> more intense the urbanisation becomes, the more intense<br />
the industry is, and the denser the population is, the more<br />
valuable each wooded area should be for the inhabitants of<br />
the city. Katowice is an example of an industrial and densely<br />
populated city.<br />
Figure 2. A saprothropic Calocera viscosa in the Murckowski Forest (Photo<br />
Michał Siwek)<br />
Katowice – the most densely<br />
wooded city in the voivodeship<br />
Katowice is situated in the largest Polish industrial area –<br />
Upper Silesian Industry Area (Górnośląski Okręg Przemysłowy).<br />
It is the capital city of the most urbanised agglomeration in<br />
the country and one of the most heavily populated regions<br />
in Europe (4 million inhabitants). This is the reason why<br />
Katowice is perceived as an environmentally degraded area,<br />
simply an ecological desert. <strong>The</strong> data concerning the natural<br />
resources of the city contradict this view. 28% of the city area is<br />
covered by forests (the average forestation of Poland is 28.7%).<br />
Observing and innovating <strong>Urban</strong> <strong>ecology</strong> in the <strong>Baltic</strong> <strong>Sea</strong> region. Chapter 4 57
58<br />
Additionally, Silesian Culture and Recreation Park, created in<br />
the 1960s on the post-industrial wasteland, functions as the<br />
‘green lungs’ of the region. It is one of the largest urban parks in<br />
Europe (600 ha), situated on the border between Katowice and<br />
Chorzow. We should not forget about the role of other parks,<br />
squares and cemeteries where old trees grow.<br />
<strong>Urban</strong> forests are situated mainly in the southern part of<br />
Katowice, where the most precious wooded areas were<br />
designated as two nature reserves. <strong>The</strong> ‘Murckowski Forest’<br />
nature reserve, which takes more than 102 ha, was created to<br />
preserve the temperate mixed forest, which is the remains of the<br />
Old Growth Silesian Forest. In the reserve, there are numerous<br />
endangered and rare species of plants, fungi and animals as well<br />
as a 150-year-old beech forest. In the smaller ‘Ochojec’ reserve<br />
situated in the valley of the Slepiotka River (25 ha) there is a<br />
relict population of the mountain plant Clasping Twistedstalk<br />
(Streptopus amplexifolius). Some enclaves of ‘wild nature’ can<br />
also be found in the city centre. Besides the above mentioned<br />
natural reserves, there are 40 areas which are valuable from<br />
the biological point of view. A variety of endangered and rare<br />
species has been found in those areas (Tokarska-Guzik and<br />
others 2002). <strong>The</strong>y play a very important ecological role, for<br />
example, amphibians breed and birds nest there. Those areas<br />
also serve as wildlife corridors. <strong>The</strong>y play the educational and<br />
recreational role for the inhabitants of the region as well.<br />
Ideas for ecological classes<br />
Teenagers can develop their ecological awareness and sensitivity<br />
by taking part in outdoor classes in a natural ‘laboratory’ – a<br />
forest situated in the city where they live. It enables them<br />
to learn in an attractive way about the ecosystem and the<br />
phenomena taking place in it.<br />
Young people can also develop the feeling of responsibility for<br />
the activities done in the natural environment. <strong>The</strong> classes of<br />
this kind help to show students the links between the elements<br />
of ecosystems, the mechanisms and consequences of negative<br />
changes caused by human activity, they should also encourage<br />
students to plan and conduct their own research, gather and<br />
work on the data, and monitor the decisions of the City<br />
Council which affect the natural environment.<br />
Figure 3. A parasitic Inonotus obliquus growing on a tree in the Panewnicki<br />
Forest (Photo Michał Prażanowski)<br />
Figure 4. A common brackenfern (Pteridium aquilinum) and a common<br />
male fern (Dryopteris filix-mas) growing at one of the stops on the didactic<br />
path (Photo Bartosz Piekaruś)<br />
<strong>The</strong> aims of outdoor classes may<br />
be:<br />
● recognising common and rare or endangered species of<br />
plants and animals<br />
● biodiversity of organisms and their habitats<br />
● diversity of animal activities (e.g. breeding activity)<br />
● monitoring phenological phenomena<br />
● analysis of the density and the age structure of the forest<br />
● monitoring the anthropogenic changes in the ecosystem<br />
(e.g. illegal dumps)<br />
● comparing the climatic conditions in the forest and outside<br />
it<br />
● analysis of the occurrence of bioindicators<br />
● finding and drawing food webs<br />
● watching the secondary succession of the ecosystem<br />
● learning about the rules of forest industry (e.g. a lesson with<br />
a forester)<br />
● comparing forests with different levels of anthropogenic<br />
changes<br />
● planning/organising activities to improve the condition of<br />
the natural environment in the neighbourhood<br />
Research concerning natural<br />
resources of Katowice<br />
<strong>The</strong> important quality of urban forests is their size, but the<br />
variation of their life forms (biodiversity) is also vital. Young<br />
people attending II Konopnicka Secondary School in Katowice<br />
conduct varied forms of research concerning the natural<br />
environment in their city. Long-term research and theses based<br />
on this research are often connected with the forest ecosystem<br />
or urban forests. Teenagers create ecological didactic paths<br />
in chosen areas in Katowice and at the same time learn some<br />
information about the environment, practise some scientific<br />
research methods and realise extracurricular activities. Such<br />
outdoor classes are aimed at young people living near wooded<br />
areas in their city.<br />
<strong>The</strong> thesis entitled ‘A didactic path along the Slepiotka River’<br />
deals with the results of the research concerning plants growing<br />
along the banks of the Slepiotka River flowing through one<br />
of districts of Katowice. <strong>The</strong> thesis was based on the analysis<br />
of aquatic and reed plants and some chemical elements of the<br />
water and soil from the river banks. <strong>The</strong> author describes the<br />
didactic path, characterising plant associations that can be<br />
found there: a riparian forest, bog plants, reed plants and plants<br />
typical of temperate coniferous forests of mixed forests.<br />
Figure 5. A meadow horsetail (Equisetum pratense) growing at one of the<br />
stops on the didactic path (Photo Bartosz Piekaruś)<br />
<strong>The</strong> thesis entitled ‘A didactic path in Katowice-Ligota’ is an<br />
interesting work based on the research conducted in one of<br />
the districts of Katowice. <strong>The</strong> path is divided into five sections<br />
related to various habitats, which enables the visitor to watch<br />
various species of animals and plants, typical of each habitat.<br />
<strong>The</strong> author of the thesis mentions species of trees growing in the<br />
described area, which are rare species in Poland: the Caucasian<br />
wingnut (Pteryocarya fraxinifolia) and the Japanese larch (Larix<br />
kaempferi).<br />
<strong>The</strong> thesis entitled ‘Polystichum species – an ecological cycle<br />
path in Katowice’ is a work concerning various polystichum<br />
species, which are not very well known, but quite interesting.<br />
<strong>The</strong> author focuses the reader’s attention on two conservation<br />
reliant species: the great horsetail (Equisetum telmateia) and the<br />
stiff clubmoss (Lycopodium annotinum).<br />
Observing and innovating <strong>Urban</strong> <strong>ecology</strong> in the <strong>Baltic</strong> <strong>Sea</strong> region. Chapter 4 59
60<br />
Figure 6. <strong>The</strong> Slepiotka River in Katowice-Ligota (Photo Hanna<br />
Palowska)<br />
<strong>The</strong> thesis entitled „<strong>The</strong> composition dendroflora of chosen<br />
complexes in Katowice with the special emphasis on foreign<br />
species’ represents another kind of research work. <strong>The</strong> research<br />
was concentrated on listing the dominant species of trees and<br />
bushes, the level of anthropogenic change and the level of<br />
hazard to biodiversity, the source of which is foreign invasive<br />
species. <strong>The</strong> prunus serotina (Prunus serotina) and the northern<br />
red oak (Quercus rubra) turned out to be the most dangerous<br />
for Polish tree species.<br />
<strong>The</strong> author of the thesis entitled ‘<strong>The</strong> comparative study of the<br />
species composition of vascular plants growing on pavements<br />
in Katowice’ describes the species of plants growing between<br />
pavement tiles in the city centre. <strong>The</strong> results of the research<br />
show that the plants growing in such places are anemogamic<br />
heliofits, hemicryptophytes, many of which are thought to be<br />
medicinal plants.<br />
<strong>The</strong> thesis entitled ‘Mycological biodiversity of the chosen area<br />
in the Murckowski Forest’ enables the readers to get to know 51<br />
species of fungi found by the author in the chosen area. During<br />
the research the author found in the forest two rare species of<br />
fungi: the parasol mushroom (Macrolepiota procera) and the oak<br />
oyster mushroom (Pleurotus dryinus). <strong>The</strong> phenomenon of the<br />
migration of forest species to cities, e.g. to parks and cemeteries,<br />
is also described in the thesis.<br />
<strong>The</strong> author of the thesis entitled ‘Biodiversity of trees and<br />
bushes in chosen cemeteries in Katowice’ conducted the<br />
research in three cemeteries, the result of which was identifying<br />
38 species of dendroflora. <strong>The</strong> author emphasises the mass<br />
occurrence of a decorative foreign species of the common box<br />
(Buxus sempervirens), which is rare in other parts of the city, and<br />
the thuja occidentalis (Thuja occidentalis).<br />
Conclusion<br />
<strong>The</strong> answer to the question asked at the beginning is the<br />
statement that contrary to a popular belief that Katowice is a<br />
grey city deprived of greenery, it turns out to be a very attractive<br />
city from the biological point of view. Some wooded areas may<br />
be called the sanctuaries of natural life in our voivodeship.<br />
<strong>The</strong> fact that we notice biodiversity in our surroundings is<br />
very important. Being aware of how much we can lose due to<br />
our half-baked activities, we will be ready to undertake some<br />
activities preventing the devastation of our surroundings –<br />
wooded areas in the city where we live.<br />
Forests both help people to shape their living conditions and<br />
enable the regeneration of the natural environment. Our<br />
existence was, is and will be dependent on the condition of<br />
woodlands on Earth.<br />
Bibliography:<br />
Geszprych M. 2006. Lasy miejskie w Polsce. Aura 10: 9-10.<br />
Gil W. 2009. Las a zmiana klimatu. Echa leśne 1: 7-9.<br />
Tokarska-Guzik B., Rostański A., Kupka R. 2002. Katowice.<br />
Przyroda miasta. Nature in the city. Publisher “Kubajak”.<br />
Krzeszowice.<br />
Wika S. Rola lasu w życiu człowieka i regeneracji środowiska<br />
przyrodniczego. Problemy środowiska i jego ochrony. Katowice.<br />
1994.<br />
Wika S. (red.) 1999. Lasy województwa śląskiego. Publisher<br />
“Kubajak”. Krzeszowice.<br />
Questionnaire 4.2<br />
Check the water runoff in your city:<br />
1. Compare two maps of your city or district, an old and a new<br />
one, where the locations and the beds of rivers, streams and<br />
brooks are visible. Where and how are the streams now: open<br />
water, pipes? Have lakes been reclaimed?<br />
2. How much runoff is brought to the sea through impermeable<br />
pipes compared to the entire rain- and snowfall (precipitation)?<br />
Try to get this information from the water supply and runoff<br />
authorities.<br />
3. Which (former) streams, lakes and ponds will be possible to<br />
restore and re-open?<br />
4. Find opportunities for creating new lakes and ponds and<br />
slow streams in order to reduce the thread of flooding of low<br />
streets and downtown areas during torrential rain.<br />
5. Make a research on which cities in the <strong>Baltic</strong> region are at<br />
highest risk for flooding? What has been planned to avoid<br />
flooding?<br />
Check the sewage system and capacity<br />
1. Find (if possible) through the municipality or regional<br />
authorities (i.e. internet pages) a map of the sewage system of<br />
the town and information of its capacity. Compare this with the<br />
potential surface runoff of water, led to the pipes. Is the capacity<br />
of the system sufficient to adapt heavy rainfall?<br />
2. Which solutions could be made to avoid runoff water into<br />
the pipes (and thus flooding of the sewage treatment plants) in<br />
your city: Green roofs and more parks, separate pipes for runoff,<br />
new ponds or underground containers?<br />
Questionnaire 4.3<br />
How un-natural is your environment?<br />
1. Register the most typical species of plants and wild animals<br />
in your surrounding urban landscape to be aware of its<br />
biodiversity.<br />
2. Compare this with a list of typical species for the natural<br />
landscape that would have existed if the town had not occupied<br />
the area.<br />
3. Explain the special demand for the species of a certain<br />
biotope, which makes it impossible for some species to stay in a<br />
city-scape and favourable for others to arrive.<br />
4. What can be done to re-enclose missing species in your<br />
district?<br />
Questionnaire 4.4<br />
Has your town any green belts or spots?<br />
What can you do to make it more green?<br />
1. Copy a local map and highlight the green areas, parks and<br />
woods.<br />
2. How much of the area is covered with woods? (In percent).<br />
Compare green zones and areas of Katowice to other cities.<br />
3. What happened to former green areas, i.e. forests, military<br />
training grounds, green commons, demolished industrial areas?<br />
4. Check the local plans for new green areas it is often possible<br />
to find this info on the local authorities’ internet pages. Check<br />
what is going to be planted in and around new urban areas and<br />
suburbs too.<br />
5. Measure the air quality and micro climate (temperature,<br />
humidity, wind, etc.) inside green city belts and outside (in the<br />
streets). See also chapter 4.1 about urban climate. Compare the<br />
measurements.<br />
6. Analyse where optional new green belts might bring fresher<br />
air to densely polluted city districts.<br />
7. Publish your results in reports and send them to the city<br />
government and local media.<br />
Observing and innovating <strong>Urban</strong> <strong>ecology</strong> in the <strong>Baltic</strong> <strong>Sea</strong> region 61
62<br />
A solar panel in Marla, Cirque de Mafate, Réunion<br />
Sønderborg<br />
Geothermal power technologies<br />
Case 5. A project to neutralize the city’s CO 2 emission<br />
Zero-energy cities<br />
Sønderborg among other Danish cities launched 2007 a plan for independence of carbon hydrates (gas and oil) by<br />
use of geothermal energy and zero energy housing combined with a strategy for teaching the citizens “sustainable<br />
practice”<br />
Author: Morten Menné, <strong>The</strong> Climate Section, Sønderborg Municipality, Denmark<br />
<strong>Project</strong>Zero in Sønderborg<br />
CO 2-neutral in 2029<br />
Background<br />
Before the last reform by year 2007, the Danish State<br />
administration was organized on the regional level through<br />
14 counties (amter), and on the local level through 225<br />
municipalities. Sønderjyllands Amt was the southernmost<br />
county bordering Germany. A survey few years earlier had<br />
shown that:<br />
● the educational level in the county was the lowest in<br />
Denmark.<br />
● the income was among the lowest of all counties<br />
● the average age increased - the younger generations moved<br />
to more central places in Denmark<br />
<strong>The</strong>se perspectives inspired a range of trades men to form a<br />
think tank named Futura South. In the lead was Jørgen Mads<br />
Clausen, CEO for Danfoss, Denmark’s largest industrial group.<br />
Danfoss is owned by the Clausen-family and located in the<br />
municipality, but operating all over the world.<br />
<strong>The</strong> think tank produced different visions over the years; most<br />
visionary was probably the <strong>Project</strong>Zero of 2007. <strong>Project</strong>Zero is<br />
both the name of the vision and the name of the organisation,<br />
made to realise the vision.<br />
<strong>The</strong> Vision<br />
Sønderborg Kommune is the geographical area, which still after<br />
the reform represents the municipality of Sønderborg. <strong>The</strong> area<br />
is around 500 km2 with 77,000 inhabitants. 20,000 live in the<br />
countryside, the main part in the city – of these 30,000 inside<br />
Sønderborg, where the 752-year-old core is surrounded by<br />
modern districts of garden city and industrial areas.<br />
To reach the target of CO2-neutrality it is necessary to make<br />
intensive efforts within all areas of the modern society: housing,<br />
transport, behaviour, industry, public service, etc.<br />
Many other cities have ambitious aims for reducing their CO2 emission, but only few aim for total CO2-neutrality. None of<br />
these made exact plans on how to reach the goal, and on the<br />
global level, there are no experiences to learn from.<br />
Upon this <strong>Project</strong>Zero decided to reach the goal through a<br />
reduction of the consumption of energy. More cities - among<br />
them Danish - reduced the CO2-emission remarkably by<br />
relaying their energy supply from fossil fuel to sustainable<br />
energy, primarily within district heating and electricity. <strong>The</strong>se<br />
cities though did not reduce the total consumption of energy.<br />
Observing and innovating <strong>Urban</strong> <strong>ecology</strong> in the <strong>Baltic</strong> <strong>Sea</strong> region. Chapter 4 63
64<br />
Figure 4.4.2. <strong>The</strong> CO 2 - emission targets for Sønderborg compared to<br />
London, EU, and the World<br />
<strong>Project</strong>Zero should be an example for the World of the<br />
possibility to proceed with the existing lifestyle based on<br />
continuous growth even though the energy consumption has<br />
been the half. This halved energy supply must naturally remain<br />
CO 2-free.<br />
<strong>The</strong> last target reminds of the birth of <strong>Project</strong>Zero as an<br />
industrial project. <strong>The</strong> introduction to this article hence<br />
underlines that the motive power behind <strong>Project</strong>Zero and all<br />
connected innovations together is an exercise for the population<br />
(as a humoristic storyteller - and a liar - Munchausen did) to lift<br />
itself by the hair.<br />
<strong>The</strong> negative trend must be changed into a positive spiral made<br />
from economic growth, increasing employment and population,<br />
but also a reduced consumption of energy and reduced impact<br />
on the climate.<br />
<strong>The</strong> Sønderborg districts industry has both national and<br />
international strength positions, especially within heating<br />
technology: cooling, light, process control, motion controls,<br />
water treatment, district heating, fuel cells and solar panels.<br />
Sønderborg municipality’s total CO2 emission is measured<br />
as 875,750 tons in 2007, or about 11,4 ton per inhabitant<br />
(according to international standards). <strong>The</strong> value is a bit higher<br />
than average in the country. <strong>The</strong> Sønderborg area hosts both<br />
the largest Danish industrial concern (Danfoss), and the largest<br />
bacon factory. <strong>The</strong>se conditions will irresistibly pull the CO2 emission and counteract the positive effect of a great district<br />
heating network mostly based on waste incineration.<br />
<strong>The</strong> organisation<br />
<strong>Project</strong>Zero is a public-private-partnership of<br />
● Danfoss A/S<br />
● SYD ENERGI A/S<br />
● DONG Energy A/S<br />
● Nordea Danmark Foundation<br />
● Sønderborg municipality<br />
<strong>Project</strong>Zero has at the moment 5 employees. <strong>The</strong>re is no<br />
intention of building the organisa tion bigger. It is the society<br />
that must cooperate, not a single organisation.<br />
<strong>Project</strong>Zero’s websites are www.projectzero.dk and<br />
www.brightgreenbusiness.com.<br />
One of the biggest tasks for <strong>Project</strong>Zero is to produce a<br />
timetable versus 2029 by involving active people, consultants<br />
and partners.<br />
Activating the citizens<br />
As mentioned an important element in the timetable is to make<br />
as many people involved as possible. This work runs parallel to<br />
the work with the timetable. All 77,000 inhabitants will not<br />
be active <strong>Project</strong>Zero ambassadors, for sure, but less can do<br />
it, though the behaviour and traditions of use of energy has<br />
to be changed for the wider part of the population through<br />
campaigns for new behaviour. Broad groups may be let out of<br />
sight, out of range, though.<br />
This creates the necessity for industrial deve lop ment of products<br />
with much lower energy consumption, which automatically will<br />
reduce the need of energy.<br />
As in all campaigns with the aim of changing attitudes, it seems<br />
easier to influence children than adults. Thus, the schools in<br />
Sønderborg are important co-operators, which through the time<br />
will teach children already on the nursery school level. Little<br />
children learn to save water easily.<br />
Example 1<br />
As an example it is optional to ask people to cycle instead<br />
of using the car. 20-25% of all car drives are shorter than 3<br />
km. To improve the consciousness on cycling an idea could<br />
be to inspire the bakers to sell a new roll or bread named a<br />
“cycle helmet“, sold for two prices:<br />
● Ordinary price for cycling<br />
costumers.<br />
● Raised CO 2-price for<br />
costumers by car.<br />
Commitment of people through<br />
the Bright Green Youth Climate<br />
conference<br />
In spring 2009, 250 CO2-intelligent families are pointed out<br />
as hosts for ca. 500 youngsters from all over, who in August<br />
2009 will join the BGY – “Bright Green Youth” – youth climate<br />
conference in Sønderborg. BGY is held before the COP15<br />
UN Climate Conference in Copen hagen in December 2009.<br />
<strong>The</strong> Bright Green Youth programme will learn from exact<br />
expe rien ces with the climate change by youngsters as the next<br />
step creates “young solutions” of the challenges. <strong>The</strong> BGY is<br />
developed and done in close cooperation between <strong>Project</strong>Zero<br />
and Danfoss Universe, supported by Sønderborg municipality<br />
among others. <strong>The</strong> conference is expected to attract great<br />
international media supervision, but will be used for activation<br />
of the local citizens as well.<br />
Look for more information on www.brightgreenyouth.org<br />
<strong>The</strong> staff of the municipality as role<br />
models for the citizens<br />
Sønderborg municipality employs about 7,700 people. This<br />
corresponds to 10 per cent of the inha bi tants, though not all<br />
of them live in the district. <strong>The</strong> education board decided to<br />
support the <strong>Project</strong>Zero vision; but how can 7,700 people in<br />
the staff contribute to the CO 2-neutrality for the municipality<br />
not later than 2029?<br />
Example 2<br />
Sønderborg Municipality participates in the international<br />
campaign for turning off the light. This was first launched<br />
as a cultural event, but is at the same time reminding people<br />
on energy-saving<br />
Example 3<br />
I may 2008 <strong>Project</strong>Zero in cooperation with the 21 village<br />
guilds of the district and a number of its consulting and<br />
engeneering firms organized 4 Energy Roadshows with<br />
focus on the most energy-and CO 2-efficient renovation<br />
an saving and supply. Nearly 400 households joined the<br />
meetings in the evenings. <strong>The</strong> concept supposes to be copied<br />
through the next years in combination with proper courses<br />
Example 4<br />
<strong>Project</strong>Zero has among the interested families selected 100<br />
families as <strong>Project</strong>Zero role-models. <strong>The</strong>y will be trained<br />
educationally in order to optimise the use of energy within<br />
own household and work.<br />
<strong>Project</strong>Zero helps from January 2009 to January 2010 117<br />
enthusiastic families with reduction of their CO2 emission.<br />
<strong>The</strong> ZEROfamilies will show the Sønderborg districts other<br />
households how to join the vision of making Sønderborg<br />
CO2 neutral not later than 2029.<br />
<strong>The</strong> families will through the Learning period get<br />
knowledge and experience on how to spend less energy<br />
in the daily run - both according to the household itself<br />
and the practice in the traffic and on work this might be<br />
everything from boiling eggs to driving the car with a<br />
minimum of energy consumption.<br />
<strong>Project</strong>Zero cooperates with the Education Centre South<br />
and the company Southern Energy on the project. <strong>The</strong><br />
ZEROfamilies will get invitation to training, sparring and<br />
to use tools, which match their own ambitions and wishes<br />
for change of use of electricity, water, heat, petrol etc. - the<br />
ZEROfamily project should be driven by the intention of<br />
changing behaviour in the society.<br />
Observing and innovating <strong>Urban</strong> <strong>ecology</strong> in the <strong>Baltic</strong> <strong>Sea</strong> region. Chapter 4 65
66<br />
<strong>The</strong> ZEROfamily is a project too to involve the children<br />
and youth of the families to make it more fun and good<br />
learning for the entire family. <strong>The</strong> <strong>Project</strong>Zero arranges five<br />
great theme days for the families during the year, to learn<br />
them smarter behaviour in the home, in the traffic, during<br />
the cooking, but they will also get to know about handing<br />
of and recycling waste. All together there are 208 children in<br />
the 117 families of them 60 teenagers.<br />
<strong>The</strong> families are invited to a family day at Danfoss Universe<br />
to learn about climate and energy. Besides they may<br />
compete through “<strong>The</strong> Challenge of the Month” for a prize.<br />
On the homepage the families may place a profile ’MY<br />
ZERO’, where they in own words tell about their family<br />
and daily life as pioneers for the lifestyle of the future.<br />
<strong>The</strong> staff of the municipality gets different roles:<br />
● At their daily work they may contribute to minor energy<br />
consumption.<br />
● Nearly all colleagues are in touch with the citizens during a<br />
day. <strong>The</strong> staff thus got a unique opportunity to act as a role<br />
model and to spread the awareness in the population.<br />
● <strong>The</strong> staff deals with family and friends in their leisure time,<br />
where awareness is spread too.<br />
<strong>The</strong> municipality appointed a secretary for the climate to work<br />
for 20 pct lower energy consumption in the municipality<br />
buildings in 2009 than 2007:<br />
● <strong>The</strong> municipality’s service managers got a 3½ day AMU<br />
course on EUC South – together with service managers<br />
from the housing organisations, invited by the municipality.<br />
● All municipal buildings have energy saving systems.<br />
● An Energy foundation is made to finance the municipality’s<br />
own energy optimising innovations, based on a pay back<br />
period of 10 years.<br />
● Energy advisors are engaged to advise the institutions about<br />
energy saving.<br />
● An energy consultant shall support 56 institutions for<br />
children with energy reductions. Only few of them may<br />
have own service managers.<br />
Sustainable energy supply<br />
As told, it is important that energy supply be based on<br />
sustainable energy sources. This is the reason why the<br />
municipality works with a row of sustainable energy<br />
technologies.<br />
Solar energy<br />
In 2008, Sønderborg District Heating Company built the first<br />
part of a sun collector of 3,000 m 2 . Fully built it will cover<br />
11,000 m 2 , delivering hot water to 1,200 homes. <strong>The</strong> collector<br />
is designed as a recreational public park, where people will get<br />
the opportunity of looking at remnants of a very early Viking<br />
Age house from the year 800 AD.<br />
Example 5<br />
Since the 1st of January 2008 Sønderborg town council has<br />
passed a number of regulations for new building concerning<br />
the level of energy consumption, which as minimum must<br />
be “Class 1”, two levels higher than the minimum standard<br />
for low energy housing<br />
Geothermal energy<br />
Not only in Iceland may you collect unpolluted hot water<br />
from the underground. This is pos sib le in Denmark too, where<br />
geothermal installations are built in Thisted and Copenhagen.<br />
Studies show that there are layers of under ground heat and<br />
water aquifers of sandstone at many locations of Denmark.<br />
While many countries like Sweden and Nor way are located<br />
upon hard and impermeable rock, Denmark is placed in a<br />
geological basin of easy permeable layers. Here the crystalline<br />
rock is typically deeper than two kilometres and overlaid by<br />
thick layers of sandstone, clay and chalk, of which sandstone is<br />
especially suitable for adoption and drawing of water, pumped<br />
down though drilled pipes. DONG Energy and Sønderborg<br />
District Heating cooperate on building a geothermal plant to<br />
heat 5,000 households within few years. <strong>The</strong> entire investments<br />
will be about 21 m Euros.<br />
Since there is 70°C hot water in the under ground below many<br />
locations in Denmark, it presents a great potential of a CO2 -free supplement to the existing district heating networks.<br />
Geothermal heat is not only sustai nable and without CO2 emission, but will ensure a stable energy price for 30 years.<br />
<strong>The</strong>re will be a borehole 1 - 2½ km deep, where the sandstone<br />
is layered, and from there geother mal water 30-80°C is pumped<br />
to the surface. <strong>The</strong> deeper the drilling, the warmer the layers -<br />
in Denmark the temperature usually increases 25-30°C pr. km.<br />
A model of the geothermal district heating system in construction in<br />
Sønderborg and Copenhagen and already in function in Thisted, DK.<br />
Below the city is recognized a thick layer of sandstone or other water<br />
permeable rock, which in the depth of 2 km is capable to heat water<br />
up till 70 o C. Through an exchanger the heat is transmitted to the<br />
circulating water in the already existing district heating pipelines<br />
In the geothermal plant, the heat is extracted by means of heat<br />
pumps and exchangers. <strong>The</strong> heat is pumped as hot water from<br />
the underground to the district heating plant and is through<br />
the exchanger transmitted to the district heating water, which<br />
circulates in a closed system of pipes passing all the connected<br />
residents and homes. After use, the cooler geothermal water is<br />
re-circulated to the underground through the second borehole,<br />
just ten meters from the first hole on the surface. <strong>The</strong> second<br />
hole though is not vertical, but returns the water to a place 1½<br />
km from the drawing pipe mouth in order not to cool the hot<br />
sandstone layers.<br />
Geothermal heat in combination with bio fuel, electricity<br />
and heat from the waste incineration plant and solar energy is<br />
expected to cover Sønderborg city and partly its surrounding<br />
area completely with sustainable and CO2 -neutral energy from<br />
2013.<br />
Within the Hydrogen technology Sønderborg Municipality<br />
takes part in a project run by Danfoss “Danish micro power<br />
and heating based on fuel cells ” and with 8 Danish firms as<br />
participants. <strong>The</strong> aim is to develop hydrogen fuel cells for<br />
family homes. <strong>The</strong> installations based on natural gas are tested<br />
in Sønderborg, and the hydrogen installations in Lolland (see<br />
the next case study on the Lolland H2 Society.) Connected to<br />
<strong>The</strong> model shows the extension of Zero energy homes in three steps<br />
within the project period: First the fuel cell plants, then ten detached<br />
houses connected and finally 100 before 2012<br />
this project another project named “Application of bio-energy<br />
in micro power and heating” is conducted with the aim of<br />
showing how bio-energy can be used in fuel cells.<br />
<strong>The</strong> technology in short:<br />
● Micro power and heating plants produce energy by the<br />
technology of fuel cells.<br />
● In combination with oxygen fuel cells trans form hydrogen<br />
or natural gas to electricity and heat through a chemical<br />
process without proper combustion.<br />
● In the micro power and heating plant many fuel cells are<br />
connected in “stacks” to build adequate electric voltage.<br />
● All hydrogen or natural gas will not be transformed to<br />
electricity of the fuel cell. <strong>The</strong> loss is converted into useful<br />
heat.<br />
<strong>The</strong> Danish Micro Power and Heating <strong>Project</strong> tests the<br />
technology where the fuel cells receive either hydrogen or<br />
natural gas.<br />
In the micro power and heating plant for natural gas there is an<br />
initial process converting gas to useful fuel. <strong>The</strong> project runs six<br />
years from 2006 to 2012, in three steps.<br />
Observing and innovating <strong>Urban</strong> <strong>ecology</strong> in the <strong>Baltic</strong> <strong>Sea</strong> region. Chapter 4 67
68<br />
Denmark’s first Energy+ Home<br />
<strong>The</strong> SIB Zero+ Building (www.sibzero.dk) comprises the<br />
construction of Denmark’s first detached house which is<br />
not just a house of high energy standard (the passive house<br />
standard), but is self-sufficient of all necessary energy for high<br />
comfort: climate and ventila tion, all electric equipment and<br />
floor heating, etc. <strong>The</strong> energy is produced by a 46 m 2 PV<br />
(photovoltaic) installation on the roof, using the electric grid<br />
as a buffer. A surplus of produced electricity is delivered to the<br />
grid.<br />
<strong>The</strong> home has been inhabited since 1st of February 2009 by<br />
a family, who was trained in energy-saving behaviour. <strong>The</strong><br />
building and its concept of reaching the standard of CO 2neutrality<br />
as just a single household has especially recalled<br />
interest of citizens from the city itself and from foreign<br />
countries. Hence, the SIB Zero+ building project has already<br />
established a role model for energy neutral new building.<br />
During the next years schools, housing, sports centres, public<br />
institutions and firms will be built the same way with the<br />
energy supply integrated in the construction. <strong>The</strong> development<br />
is possible through a close cooperation between the involved<br />
architects, engineers and the educational centre EUC South.<br />
<strong>The</strong> Zero+ Home - a modern<br />
building of brickstones and<br />
concrete with a 46 m 2 PV<br />
(photovoltaic) solar panel on<br />
the roof<br />
Questionnaire 4.5<br />
How the +energy house is made<br />
<strong>The</strong> construction of a zero-energy consuming house, both<br />
for industry and private homes, has involved architects and<br />
companies in many countries through a number of years; many<br />
countries claimed that they were “<strong>The</strong> First” to make it: Austria,<br />
Germany, Sweden, Finland, Denmark, etc.<br />
<strong>The</strong> Zero+ Home is simple in terms of construction:<br />
1. Thick walls with 500 mm insulation under the floor, in the<br />
walls and roof.<br />
2. Specialized energy glass in all windows.<br />
3. Solar cells on the roof to produce electricity.<br />
4. Heat rewinding ventilation.<br />
This zero-energy building named the Energy Flex House is ready<br />
for demonstration for the COP 15, the UN climate conference in<br />
Copenhagen Dec. 2009<br />
How to optimise the use of solar energy in the Austrian Solar Active House<br />
Installations in a Zero energy building<br />
According to Technology Denmark - a group of independent<br />
technical institutes. Source: EnergyFlexLab<br />
Photovoltaics<br />
Solar heaters<br />
Low energy windows<br />
Minimised edge losses<br />
Vacuum insulation<br />
Building envelope as heat storage incl. PCM<br />
Ventilation and heat system with heat pump<br />
Energy effective hot water installation<br />
Energy effective ventilation system<br />
Heating systems for low energy building<br />
Replacing el-consumption with heat<br />
Flexible el-consumption<br />
Electric car and loading dock<br />
Intelligent and interactive user interface<br />
Lighting, LED, white goods etc.<br />
Minimising electricity consumption for operation<br />
Optimised control of energy consumption<br />
Micro CHP from fuel cells<br />
DH for low energy building<br />
<strong>The</strong> installations above are all represented in the<br />
EnergyFlexHouse (left). How many of them are possible to<br />
install in an existing building?<br />
Energy balance - Solar Active House<br />
Heat loss 8.000 kWh<br />
Energy Hot water 3.500 kWh<br />
Demand Ventilation 500 kWh<br />
Solar+pump 1.100 kWh<br />
Total 13.100 kWh<br />
Energy Solar+pump 5.500 kWh<br />
Saving Heat rewind 4.000 kWh<br />
and Passive sun 2.000 kWh<br />
production Solar cells 1.600 kWh<br />
Total 13.100 kWh<br />
Netto energy consumption 0 kWh<br />
Observing and innovating <strong>Urban</strong> <strong>ecology</strong> in the <strong>Baltic</strong> <strong>Sea</strong> region 69
70<br />
Map of Lolland and Falster in Denmark, ca. 1900<br />
Case 6: A Danish project to build a sustainable region through reuse of all<br />
waste and sewage water and by building an over-capacity of wind- and<br />
wave-energy production<br />
Creating H 2-community Lolland<br />
<strong>The</strong> town Nakskov and the island Lolland try to pull themselves<br />
from 25 years of crisis and poverty to a balanced sustainable<br />
independence of oil, gas and coal.<br />
<strong>The</strong> chapter was originally made as a PowerPoint presentation:<br />
Author: Per Werge, Nykøbing Katedralskole, Denmark<br />
Turbulent Lolland<br />
Is the island going to be one of the World’s first allround<br />
sustainable regions?<br />
Nakskov, a city founded a. 1200, through most of the industrial<br />
era an important ship building site, ran into a deep crisis as part<br />
of the international crisis of the 1980s. Nakskov's vital shipyard<br />
and most manufacturing industry shut down.<br />
Until 2000 Danisco Sugar was the only remaining big industry<br />
in Nakskov, and the entire island Lolland suffered through 12-<br />
14 years from unemployment rates up to 25% and replacement<br />
of many qualified people for social clients from the big cities.<br />
From a. 2000 this view changed into its contrast: Lolland insists<br />
of being one of Europe’s leading sustainable communities based<br />
on new energy- and recycling tools.<br />
What is now on the shipyard?<br />
First of all: <strong>The</strong> shipyard was demolished and the empty site<br />
opened for new use “from scratch”<br />
Second: <strong>The</strong> knock-down state of flat Lolland applied for help<br />
from EU and the State – and invited wind power and recycling<br />
technology in the 1990es.<br />
By 1999 Vestas Wind Power company built a wing production<br />
plant in Nakskov – and the municipality revised its<br />
development visions:<br />
1. Sustainable production by use of local resources and local<br />
energy,<br />
2. Recycling of waste to be used as resources.<br />
Observing and innovating <strong>Urban</strong> <strong>ecology</strong> in the <strong>Baltic</strong> <strong>Sea</strong> region. Chapter 4 71
72<br />
A model of sustainable production<br />
and the role of recycling of energy and waste<br />
Nature regarded as a resource base for sustainable use only /Per Werge 2009<br />
NATURE<br />
geographical environment<br />
Energy source<br />
Precipitation/ climate/<br />
Sun/wind/waves<br />
Soil<br />
Subsurface<br />
Government policy<br />
Requirements<br />
in the society for<br />
consumption and<br />
reproduction<br />
market circulation<br />
infrastructure<br />
Production<br />
Raw<br />
materials<br />
Plants/flora<br />
CASE: Hydrogen society Lolland:<br />
Waste-treatment and recycling<br />
Waste water for gas, heat and electricity<br />
Biomass/manure for gas, heat and electricity<br />
Wind power for electricity<br />
Wave energy (type: Poseidon) for electricity<br />
Waste for heat and electricity (incineration)<br />
Electrical hydrolyse of water for hydrogen<br />
to use in fuel cells for heat and electricity<br />
Root zone to catch nutrients + heavy metals<br />
Algae bassins to catch CO 2 for oil<br />
production<br />
Animals/fauna<br />
Waste<br />
Waste water<br />
Knowledge<br />
Qualifications<br />
Labour<br />
Public/private joint<br />
ventures Inc.<br />
SOCIETY<br />
Means of<br />
production/<br />
tools/<br />
technology<br />
Waste disposal<br />
(must be avoid)<br />
H2-lollands sub organisations:<br />
Bass, <strong>Baltic</strong> <strong>Sea</strong> Solutions (Holeby)<br />
LOKE (holding)<br />
Partners:<br />
Universities in USA, DK<br />
Energy firms DONG, SEAS, NVE<br />
Energy techn. firms: Danfoss, Risø, IRD<br />
Nakskov Gymnasium, HTX og Celf<br />
(schools)<br />
Public support: EU, <strong>The</strong> Danish State,<br />
Lolland municipality<br />
<strong>The</strong> recycling site was an eye<br />
opener<br />
Re-use sites are usually bad - hidden areas - far from the town<br />
centre Nakskov Miljø- og Genbrugsplads is far to south west,<br />
but not hidden<br />
It’s a park<br />
Designed as a green park fully equipped with electric and<br />
electronic installations for concerts, meetings, outdoor<br />
exhibitions and open air theatre built amphitheatrical on top<br />
of and covering the recycle containers, under the open sky and<br />
with a view to Nakskov Fjord as natural wings.<br />
A model of sustainable production<br />
and the role of recycling of energy<br />
and waste<br />
Nature regarded as a resource base for sustainable use only<br />
Per Werge 2009<br />
A vision was found:<br />
Lolland may better take the lead in showing cleaver treatment<br />
of local resources rather than to compete with the worlds core<br />
areas for sparse and expensive world market resources.<br />
Local resources?<br />
Available: Wind, sea waves, agri-industrial products,<br />
unemployed people<br />
Shortage: Long educated people<br />
CASE: Hydrogen society Lolland:<br />
● Waste-treatment and recycling<br />
● Waste water for gas, heat and electricity<br />
● Biomass/manure for gas, heat and electricity<br />
● Wind power for electricity<br />
● Wave energy (type: Poseidon) for electricity<br />
● Waste for heat and electricity (incineration)<br />
● Electrical hydrolyse of water for hydrogen to use in fuel<br />
cells for heat and electricity<br />
● Root zone to catch nutrients + heavy metals<br />
● Algae basins to catch CO 2 for oil production<br />
H 2-Lollands sub organisations:<br />
● Bass, <strong>Baltic</strong> <strong>Sea</strong> Solutions (Holeby)<br />
● LOKE (holding)<br />
Partners:<br />
● Universities in USA, DK<br />
● Energy firms DONG, SEAS, NVE<br />
● Energy techn. firms: Danfoss, Risø, IRD<br />
● Nakskov Gymnasium, HTX og Celf (schools)<br />
● Public support: EU, <strong>The</strong> Danish State, Lolland<br />
municipality<br />
Nakskov’s recycling park is now a<br />
design for industrial supply from<br />
local resources<br />
Nakskov’s former shipyard is now designed as the city’s<br />
environmental base camp:<br />
It is location for the recycling park for solid waste, for<br />
a sewage water treatment plant, a district heating plant<br />
in combination with a biomass (biogas) plant and wind<br />
generators, and next door lies Vestas Blades (building of<br />
generator wings).<br />
<strong>The</strong> park includes an exhibition of new energy prototypes:<br />
1. An electrolysis converter for water H2O to H2 and O2 2. Hydrogen Fuel cells<br />
A vision in five green<br />
spectacles:<br />
● Wave and wind power<br />
● Hydrogen society<br />
● Windpower Academy<br />
● Rapsol – locally produced rape seed<br />
oil<br />
● Biomass<br />
Observing and innovating <strong>Urban</strong> <strong>ecology</strong> in the <strong>Baltic</strong> <strong>Sea</strong> region. Chapter 4 73
74<br />
How Fuel Cells work<br />
<strong>The</strong> hydrogen community<br />
By use of wind-generated electricity water H2O is split<br />
into hydrogen H2 and oxygen O2 H2 is from the electrolyser lead through pipes to nearby<br />
fuel cells FC CHP installed in ordinary houses in a<br />
village (Vestenskov)<br />
H2 functions as fuel and creates either heat or electricity<br />
or both<br />
Chemistry of a Fuel Cell<br />
Anode side: 2H2 => 4H+ + 4e-<br />
Cathode side: O2 + 4H+ + 4e- => 2H2O Net reaction: 2H2 + O2 => 2H2O Wave and wind power<br />
Around Lolland-Falster 500 wind generators already produce 1<br />
million kWh per year – more than 150% of the consumption.<br />
Offshore Nysted is planned a second wind farm adding 50%<br />
to this production. Besides, the small old generators will be<br />
substituted by taller ones, up to 200 meter.<br />
Northwest of Lolland is located a test wave engine connected<br />
to wind engines – a promising technology due to the steady<br />
movements of ocean waves<br />
<strong>The</strong> fuel cell<br />
<strong>The</strong> fuel cell works similar to a battery; though the solid<br />
materials (anode and cathode) are not consumed through the<br />
process.<br />
Instead the hydrogen gas H2 is “used”, decomposed at the<br />
anode into protons (H+) and neutrons (e-).<br />
<strong>The</strong> protons passes through a membrane to meet oxygen (O2) at the cathode, creating water (H2O), but only if the electrons<br />
move through an electric consumer to the cathode.<br />
This moving of electrons is named “electricity”<br />
Observing and innovating <strong>Urban</strong> <strong>ecology</strong> in the <strong>Baltic</strong> <strong>Sea</strong> region. Chapter 4 75
76<br />
<strong>The</strong> Basics of Biogas Plant<br />
Biomass<br />
Organic waste is in Denmark produced in a large scale by the<br />
agri-industrial sector:<br />
<strong>The</strong> projected Biogas Plant in Nakskov shall process dried liquid<br />
manure and crops (straw) and deliver biogas to a new plant for<br />
production of electricity or district heating.<br />
Waste from the process, fibres, is either incinerated or used as<br />
manure again.<br />
Rapsol – rape seed oil<br />
40% of the buildings in open landscape are still heated by small<br />
oil burners. <strong>The</strong> rape seed oil company Rapsol in Bandholm<br />
was established 2007 to deliver local and sustainable fuel to<br />
these decentralized small oil-burners.<br />
<strong>The</strong> seed covers 4000 ha on Lolland-Falster-Møn producing<br />
5000 ton oil /year<br />
Another use might be as CO2-neutral fuel for vehicles - a hot<br />
issue at the moment - or as a local food ingredient<br />
Source: www.rechargenews.com<br />
Notice also questionnaire 4.6.2<br />
Vindeby<br />
Nøjsomhed hed<br />
Saunsø<br />
Kappel K II<br />
Kappel KKappel<br />
I<br />
Lolland-Falster<br />
By Per Werge. Sources: Bass, Lolland municipality, “How stuff<br />
works”, Wikipedia<br />
Offshore algae farms for energy<br />
production?<br />
A group of scientists, led by Jonathan Trent, NASA, 2009 is<br />
exploring the ambitious idea of wiring up the 11 turbine towers<br />
at the veteran Vindeby offshore wind farm in the <strong>Baltic</strong> <strong>Sea</strong><br />
to large-scale floating membrane enclosures (named Omega)<br />
housing high-yield algae cultures.<br />
<strong>The</strong> Omega enclosures are covered by glass or V-resistant<br />
polyethylene. An underside of a NASA-devised membrane uses<br />
the process of forward osmosis to take seawater contaminated<br />
by chemical fertiliser run-off and desalinate it, while also supercharging<br />
the contained algae culture with the nutrients and<br />
water it needs before flushing surplus fresh water into the sea.<br />
Brought to the shore the harvested algae can be squeezed out<br />
for oil, and the remains will make perfectly good fertiliser.<br />
Windpower Academy<br />
<strong>The</strong> vision of IWAL – an International Windpower Academy<br />
on Lolland – is connected to the intention of creating a<br />
windpower research institute direct linked to the 350 MW<br />
Nysted/Redsand Wind Parks and to the project of 11 giant 200<br />
m tall test wind towers in Kappel, Lolland. IWAL’s planned<br />
“House of Energy” is meant to be both a science adventure park<br />
and a centre for research and education. If succeeded the centre<br />
may attract the qualified people that Lolland lacks.<br />
Lolland looks still turbulent –<br />
but in a constructive sense<br />
Lolland municipality’s energy policy of 2007 says that by<br />
year 2015 90% of all buildings shall be heated by sustainable<br />
sources. By year 2020 consumption of electricity has to be<br />
reduced by 25% of the 2004-level.<br />
<strong>The</strong> overall policy for Lolland<br />
By this is to create new development based on sustainable<br />
energy production- and energy saving technology thus creating<br />
new educations, new combined research – and production<br />
firms. Lolland call this policy concept CTF, Community<br />
Testing Facilities, which informs on the intention of being<br />
Europe’s practical test centre No. 1 for several renewable energy<br />
technologies.<br />
Observing and innovating <strong>Urban</strong> <strong>ecology</strong> in the <strong>Baltic</strong> <strong>Sea</strong> region. Chapter 4 77
78<br />
Questionnaire 4.6.1: Perpetuum mobile?<br />
Many people ask if the fuel cell could be the furnace and motor of tomorrow. It is more flexible concerning energy output than a gas-, oil- or<br />
coal furnace or engine, and produces no CO 2; but how efficient is it?<br />
Another question often raised is how much energy will be lost through the transformation of energy from i.e. wind power or wave power to<br />
hydrogen H 2, converted by electrolysis? Is the experiment on Lolland in reality an impossible dream of the “perpetuum mobile”?<br />
<strong>The</strong> following exercise is done at DTU, <strong>The</strong> Danish Technical University, Copenhagen, by Ole Trinhammer, and open for reuse here: (with<br />
permission)<br />
<strong>The</strong> fuel cell: Effect and efficiency<br />
After this exercise, you will be able to tell, how the fuel cell will<br />
get its best performance in a power plant or car. It will increase<br />
your understanding of the exercise and make it easier to report<br />
if you first answer the question “before the practice” - before<br />
practicing.<br />
Aim: Finding the average production of electric effect and<br />
determination of the efficiency.<br />
Diagram: look at the model<br />
Equipment: A fuel cell, decade-resistance, amperemeter,<br />
voltmeter, stopwatch, hydrogen from electrolysis, an electrolysis<br />
cell with energy supply of a. 2 V<br />
Setup: Let hydrogen pass weakly through the cell for some<br />
minutes to “refresh” it before measuring. <strong>The</strong> hydrogen to be<br />
fed into the cell must be ready in a separate container of known<br />
volume. If the hydrogen is delivered from an electrolysis cell<br />
with measurable stores, the stores may be filled with oxygen and<br />
hydrogen, and the electrolysis is to stop when ready.<br />
Tips on electrolysis:<br />
Fill with demineralised water. Connect the electrolysis cell with<br />
energy supply of 2 V, i.e. from a solar panel. A limit for the<br />
current intensity may be respected.<br />
Be patient: <strong>The</strong> cell may first work after some time if it has<br />
been out of use for a long time, i.e. caused by draught. Leave<br />
the cell with water. Be patient with the fuel cell too.<br />
Tricks on operating the gas:<br />
<strong>The</strong> gas has to be controlled by binding screws upon the tubes.<br />
This works quite simple. <strong>The</strong> two exhausts must be open<br />
while the fuel cell is “aired” by hydrogen. When ready for<br />
measuring, the input and output on the hydrogen side should<br />
be closed. Check that the hydrogen store is filled. <strong>The</strong>n stop the<br />
electrolysis. <strong>The</strong> exhaust on the hydrogen side must stay closed<br />
during the measuring - if not, you cannot control the amount<br />
of consumed hydrogen.<br />
Now the supply can begin. Generally, it is necessary to exercise<br />
how to open correct for supply more times. It is important too<br />
that the cell produces electricity immediately after opening<br />
of the hydrogen supply. To ensure this you may start the<br />
measuring short after the cell has run under similar conditions<br />
as the new situation.<br />
Measurements:<br />
Current I and tension U at the fuel cell is noticed at a certain<br />
load, i.e. 2.0 ohm. Measure the time t for consume of the H2 cubic content V<br />
Tip: Start and stop the time measurement when the water<br />
surface passes a rule on the store. Think about what to do, if I<br />
and U change during the process. Repeat by another load, i.e.<br />
0,5 ohm and a number more...<br />
Data processing:<br />
Calculate the average production of electric tension P = U . I<br />
and the total production of electric energy within the period of<br />
t.<br />
Calculate the energy of the consumed volume of hydrogen<br />
Efuel = HV. V,<br />
where HV is the heating value 12 J/mL by 25°C and 1 atm.<br />
Calculate the efficiency.<br />
<strong>The</strong> efficiency is measured in %. Measurements and results<br />
must be collected in a table as below:<br />
Conclusion:<br />
Compare the effect and efficiency at different loads. Comment<br />
on them.<br />
<strong>The</strong> resistance in the exercise is a demonstration of the load,<br />
which could be either of a motor in a car or the electric grid<br />
when connected to the power plant. Which load would be<br />
reasonable if we use the fuel cell in a sports car where the wish<br />
is a fast acceleration by a given stack of cells? Which load is<br />
reasonable for a fuel cell in a power plant, where the most<br />
efficient use of fuel is wanted?<br />
Optional:<br />
It might happen that hydrogen leak out during the practice.<br />
This risk is possible to check by filling the store with hydrogen,<br />
and then after some minutes to check the volume.<br />
“Before the practice”<br />
Effect and efficiency. A fuel cell delivers 208 mA by 0,695 V<br />
during 180 seconds by a consumption of 5,7 mL hydrogen at<br />
25°C and 1 atm.<br />
Calculate the effect P of the cell and the efficiency n<br />
Answer:<br />
n = E electric<br />
E fuel<br />
R V t U I P E electric E fuel η<br />
Ω mL s V A W J J %<br />
2,0<br />
0.5<br />
......<br />
......<br />
Observing and innovating <strong>Urban</strong> <strong>ecology</strong> in the <strong>Baltic</strong> <strong>Sea</strong> region 79
80<br />
Questionnaire 4.6.2. Are algae capable to deliver the future<br />
fuel to the world?<br />
Why Algae?<br />
Published by Bass, October 3, 2008<br />
Figure 1. Botryococcus braunii<br />
With the availability of petroleum diminishing, the largest<br />
world reserves of petroleum existing in politically unstable<br />
regions and, most importantly, the adverse effects of burning<br />
petroleum on global climate, there is a critical need to find<br />
alternative, sustainable, and carbon-neutral fuels. It is well<br />
known that some plants produce significant quantities of oil<br />
and since they use CO2 from the atmosphere to synthesize this<br />
oil, burning this same oil as a fuel is carbon neutral.<br />
It is clear from the scientific literature that micro algae, or at<br />
least some species of micro algae, have the potential to produce<br />
significant amounts of oil. Indeed, it is estimated that some<br />
fast-growing species that produce over 50% oil (by dry weight)<br />
could provide enough oil to replace petroleum diesel in the US<br />
if approximately 1% of the total land that is now dedicated<br />
to farming and grazing in the US (i.e. about 10 million acres)<br />
were transformed into algae farms. Algae, including micro<br />
algae, have been cultivated around the world for food, vitamins,<br />
nutraceuticals, edible oils, fertilizers, animal feed and other<br />
products.<br />
Why then is so little bio fuel currently being produced from<br />
algae?<br />
<strong>The</strong> short answer is that we do not know how to do it on a scale<br />
that would be economical and that would not adversely impact<br />
our environment.<br />
From 1978 to 1996, the Office of Fuels Development at DOE<br />
funded a program under the National Renewable Energy<br />
Laboratory known as the „Aquatic Species Program“. <strong>The</strong><br />
research began as a project looking into using algae to sequester<br />
CO 2 emitted by coal and natural gas power plants. When<br />
it was observed that some algae species produce significant<br />
quantities of oil, the project shifted its focus to growing oilproducing<br />
algae as a potential source of bio diesel. This research<br />
indicated that many species produce oil, but few species have<br />
what it would take for oil production. For production, the<br />
requirements include: significant oil content per cell, a usable<br />
fatty-acid profile, rapid growth rates, reasonable nutrient<br />
requirements and other growth conditions, hardiness to<br />
environmental fluctuations, and resistance to invasion from<br />
other species. All of these features can be manipulated by the<br />
appropriate selection of species and selective breeding. In<br />
fact, fast-growing algae have been studied extensively for not<br />
only oil (lipid), but also a variety of other valued products<br />
including biomass, hydrogen, hydrocarbons, vitamins, alcohols,<br />
carbohydrates, methane, and syngas.<br />
Why Offshore?<br />
Thought Experiment<br />
It is argued that algae cultivation need not compete with<br />
agriculture, because the algae do not require fertile land, but<br />
only places with adequate sunlight and supplies of water (fresh<br />
or salt water), nutrients, and an infrastructure for harvesting<br />
and processing. Current efforts to produce algae in the US are<br />
all focused on land-based systems, either open ponds, referred<br />
to as „open raceways“, or closed bioreactors, consisting of arrays<br />
of clear tubing or flat panels.<br />
<strong>The</strong> major costs associated with both of these systems involve:<br />
● Land<br />
● Water<br />
● Open and/or closed photo bioreactors<br />
● Electricity<br />
● Nutrients, including CO2 ● Maintaining cultivation conditions<br />
● Harvesting and dewatering algae biomass<br />
● Processing biomass/oil<br />
Raceways are considered the more economical systems at<br />
approx $40,000/acre, while the current designs of closed<br />
bioreactors on land are estimated to be close to $1,000,000/acre<br />
(Benemann 2007: Algae Biomass Summit; <strong>Sea</strong>ttle).<br />
Some disadvantages of the open raceways however, are lower<br />
yields, evaporation, and intrusions of ‘weed’ species. <strong>The</strong>re are<br />
no problems with closed bioreactors, but the current closed<br />
designs have problems with scaling to sufficient size for bio fuels<br />
production, temperature control, and bio fouling limiting light<br />
availability; all of which influence the economics of their use for<br />
algae production.<br />
In both systems, water is going to be a major issue in the future.<br />
<strong>The</strong>re are marine algae that produce oil and there are coastal<br />
lands or salt water aquifers in many areas of the US that could<br />
be used to cultivate algae. Pumping salt water from the ocean<br />
or from salty aquifers is energy intensive however, even in<br />
open systems the problem of evaporation remains; if the salt<br />
concentration gets too high, the algae die.<br />
<strong>The</strong> question of where algae farms for biofuels should be<br />
located is an important one. In addition to the need for water<br />
(salt water for growth and freshwater for maintaining the right<br />
salinity), there is the need for adequate sunlight and a supply of<br />
essential nutrients, including CO2. Both the freshwater and the<br />
nutrients can be supplied by municipal wastewater, but algae<br />
farms should not be too close to cities for the same reason as pig<br />
farms should not be too close to cities: they will smell bad. As<br />
the distance between the algae farm and the source of nutrients<br />
increases, the issue of plumbing and pumping or trucking<br />
affects the economics of the farms.<br />
<strong>The</strong> growing need for oil and the potential productivity of algae<br />
are driving significant investments in addressing the challenges<br />
for their cultivation, but most of the current effort seems to<br />
be focused on perfecting some land-based system and there<br />
has been little discussion of moving algae cultivation offshore.<br />
Clearly, many of the problems with land-based systems<br />
disappear offshore (e.g. space, water mixing, temperature<br />
control, and nutrient availability). <strong>The</strong>re are new problems<br />
with infrastructure, access, ship costs, tracking, marine<br />
traffic, environmental impact, durability, control, harvesting,<br />
processing, and so on, but are these and other imagined<br />
problems so formidable to eliminate offshore algae cultivation<br />
as a possibility?<br />
It was the purpose of the Wind, <strong>Sea</strong>, and Algae Workshop in<br />
Lolland Denmark, April 20-22, 2009 to address the question:<br />
Is it possible to produce algae-based carbon-neutral biofuels for<br />
the world offshore?<br />
Figure 2. Model of a marine algae farm<br />
A basic environmental question to this is:<br />
Will the production of this kind decrease the total amount of<br />
CO2-emission to the “greenhouse” atmosphere, if the algae<br />
are fed by emission from industrial and urban coal-, oil- and<br />
gas burning? This emission may be led by pipes straight to the<br />
raceways or “omegas”, or just to the atmosphere, from where<br />
the algae will digest it.<br />
Observing and innovating <strong>Urban</strong> <strong>ecology</strong> in the <strong>Baltic</strong> <strong>Sea</strong> region 81
82<br />
Ignalina RBMK reactor tube tops<br />
Ignalina Nuclear Power Plant, Lithuania<br />
Case 7: <strong>The</strong> history of the development of nuclear power based energy<br />
production worldwide and shut down of the Lithuanian nuclear power<br />
plant. <strong>The</strong> decision on the construction of the new plant has been made but<br />
the implementation of it has long horizons. 2016 is the earliest estimated<br />
operation start time<br />
Focus on <strong>The</strong> Ignalina Nuclear Power Plant Challenges<br />
Nuclear energy is used worldwide to generate large amounts of electricity reliably and without CO 2 production. Lithuania<br />
operating one nuclear power plant is a member of the nuclear industry world.<br />
Author: Ona Beinoravičiūtė, Ministry of Economy of the Republic of Lithuania, Nuclear Energy and Radioactive Waste Management<br />
Department<br />
This study focuses on the description of the function and conditions of the Lithuanian nuclear plant in Ignalina, where according to the<br />
agreement with the EU the last remaining reactor will be closed in 2009. <strong>The</strong> study does not discuss the role of nuclear power in the<br />
world facing increasing emission of greenhouse gasses from carbon and oil burning energy plants. Using objective figures it shows present<br />
stage of the nuclear sector, ongoing and planned expansion of nuclear energy production. It gives a detailed description of the problems<br />
concerning shut down of nuclear plants as well as handling of radioactive waste.<br />
Nuclear Power in the World<br />
Currently 32 countries operate 436 nuclear power reactors.<br />
(Picture 2). Five of them are in a long-term shutdown phase<br />
and 44 reactors producing a total 38 GW capacity (Picture 3).<br />
In 2009 two reactors in Japan (Hamaoka nuclear power plant<br />
(further in the text – NPP)) and one at Ignalina NPP will<br />
finally stop operation.<br />
Currently 65 reactors are in operation and they are 24-25 years<br />
old and nine reactors – 40-42 years old.<br />
First nuclear reactors were small, but now there is a great variety<br />
of sizes, ranging from the smallest four reactors of 12 MW of<br />
Bilibino NPP in Russia (Chukchi Autonomous Okrug) to the<br />
largest two reactors of 1560 MW of Chooz-B NPP in France<br />
(Ardennes).<br />
<strong>The</strong> largest number of closed reactors is in the United Kingdom<br />
– 26 (they are also the oldest), United States – 28, Germany –<br />
19, France – 11. <strong>The</strong>se countries also have the largest experience<br />
in decommissioning works and could be good examples for<br />
other countries in gaining decommissioning knowledge.<br />
In the past 5 years many countries began building new reactors,<br />
others made decisions to start new units including such<br />
countries as Iran, Philippines, and United Arab Emirates, which<br />
have never had nuclear power reactors before. Russia’s current<br />
ambitious goal is to put into operation 2 new reactors each year<br />
starting 2013.<br />
Alongside power generating nuclear reactors, research reactors<br />
are in operation as well. <strong>The</strong>re are about 280 of such reactors<br />
operating, in 56 countries. Some of those produce radioactive<br />
isotopes for medical purposes.<br />
<strong>The</strong> History of Nuclear Power<br />
Often scientists seeking one aim make use of their discoveries<br />
for other purposes. In the beginning all works related to<br />
nuclear fission were aimed at using nuclear power for weapon<br />
production.<br />
With the start of the World War II in 1939 research of nuclear<br />
fission moved from Europe to the U.S., Such a research was<br />
carried out in great secrecy. In 1941 the Manhattan project<br />
was started and in 1942 the first nuclear „reactor“ Chicago Pile<br />
1 was constructed under the abandoned Alonzo Staggs Field<br />
Observing and innovating <strong>Urban</strong> <strong>ecology</strong> in the <strong>Baltic</strong> <strong>Sea</strong> region. Chapter 4 83
84<br />
Nuclear share in electricity generation in 2008<br />
Pakistan<br />
India<br />
China<br />
Brazil<br />
Netherlands<br />
Mexico<br />
South Africa<br />
Argentina<br />
UK<br />
Canada<br />
Russia<br />
Romania<br />
Spain<br />
USA<br />
Japan<br />
Germany<br />
Finland<br />
Czech Republic<br />
Bulgaria<br />
S. Korea<br />
Hungary<br />
Switzerland<br />
Armenia<br />
Slovenia<br />
Sweden<br />
Ukraine<br />
Belgium<br />
Slovakia<br />
Lithuania<br />
France<br />
stadium, at the University of Chicago. <strong>The</strong> reactor was made<br />
as a pile of graphite blocks with uranium (U235) pellets. <strong>The</strong><br />
reaction was controlled by cadmium-coated rods that absorbed<br />
neutrons. Withdrawing the rods would increase neutron activity<br />
in the pile resulting in a self-sustainable chain reaction. Reinsertion<br />
of the rods would slow the reaction. <strong>The</strong> aim of the<br />
Manhattan project was to produce material for nuclear bombs,<br />
therefore 6 years later the bombs produced with the help of this<br />
reactor were dropped on the cities Hiroshima and Nagasaki in<br />
Japan.<br />
<strong>The</strong> use of nuclear reactors to produce electricity started in<br />
1954. On 26 June, in Obninsk (a city near Moscow (former<br />
USSR), the first semi-experimental 5 MW nuclear reactor<br />
Obninsk APS-1 (light water cooled graphite reactor) (Picture<br />
4) was connected to the public electricity grid. From this time<br />
on nuclear science moved from strictly military to civilian<br />
applications. Although still for a long time, the primary purpose<br />
of nuclear reactors remained military.<br />
Number of reactors in operation in 2009<br />
Calder Hall (Sellafield, Cumbria, United Kingdom) was the<br />
world’s first nuclear power station to produce electricity in<br />
commercial quantities. <strong>The</strong> first reactor was connected to the<br />
grid in 1956. <strong>The</strong> power plant had 4 Magnox reactors capable<br />
of generating 50 MW of power each and it was closed in 2003<br />
after 47 years of operation.<br />
Since then many countries started building nuclear power<br />
plants and they were generally built with high safety standards<br />
in mind. Nevertheless, there have been two serious accidents.<br />
<strong>The</strong> first (by INES scale level 5) occurred in 1979 at Three Mile<br />
Island NPP (Pennsylvania, USA) in a widely used PWR reactor<br />
type, resulting in serious reactor core damage, but without<br />
consequential environmental damage. <strong>The</strong> second (by INES<br />
scale level 7) occurred seven years later in Ukraine (former<br />
USSR) in 1986 at Chernobyl NPP (Picture 5) in a RMBK<br />
type reactor, resulting in serious and widespread environmental<br />
consequences.<br />
Number of reactors under Construction in 2009<br />
1.91 Armenia 1<br />
2.03 Lithuania 1<br />
2.15 Netherlands 1<br />
3.12 Slovenia 1<br />
3.80 Argentina 2<br />
4.04 Brazil 2<br />
5.25 Bulgaria 2<br />
6.18 Romania 2<br />
13.45 Mexico 2<br />
14.80 Pakistan 2<br />
South 16.86 Africa 2<br />
Finland 17.54 4<br />
Hungary 18.27 4<br />
Slovakia 19.66 4<br />
Switzerland 24.93 5<br />
Czech Republic28.29<br />
6<br />
Belgium 29.73 7<br />
Spain 32.458<br />
Sweden 32.9210<br />
China 35.6211<br />
Ukraine 37.15 15<br />
India 39.2217<br />
Germany 39.3517<br />
Canada 41.7118<br />
UK 42.0419<br />
S. Korea<br />
47.40 20<br />
Russia<br />
53.76 31<br />
Japan<br />
56.42<br />
France<br />
USA<br />
53<br />
72.8959<br />
76.18<br />
Armenia<br />
Lithuania<br />
Netherlands<br />
Slovenia<br />
Argentina<br />
Brazil<br />
Bulgaria<br />
Romania<br />
Mexico<br />
Pakistan<br />
South Africa<br />
Finland<br />
Hungary<br />
Slovakia<br />
Switzerland<br />
Czech Republic<br />
Belgium<br />
Spain<br />
Sweden<br />
China<br />
Ukraine<br />
India<br />
Germany<br />
Canada<br />
UK<br />
S. Korea<br />
Russia<br />
Japan<br />
France<br />
USA<br />
1<br />
1<br />
1<br />
1<br />
2<br />
2<br />
2<br />
2<br />
2<br />
2<br />
2<br />
4<br />
4<br />
4<br />
5<br />
6<br />
7<br />
8<br />
10<br />
11<br />
15<br />
17<br />
17<br />
18<br />
19<br />
20<br />
31<br />
53<br />
59<br />
104<br />
USA 1<br />
Argentina 1<br />
Finland 1<br />
France 1<br />
Iran 1<br />
Pakistan 1<br />
Bulgaria<br />
2<br />
Ukraine<br />
2<br />
Japan<br />
2<br />
S. Korea<br />
5<br />
India<br />
6<br />
Russian Federation<br />
8<br />
China<br />
11<br />
0 2 4 6 8 10 12<br />
Picture 3. Number of nuclear reactors under construction in the world<br />
in 2009, IAEA<br />
0 10 20 30 0 40 50 20 60 4070 8060<br />
80 100 0 0 20 20 40 40 60 6080 100 80 120 100 0 20 40 60 80 100 120<br />
Picture 1. Nuclear share in electricity generation in 2008, IAEA.<br />
Picture 2. Number of nuclear reactors in operation in the world in 2009,<br />
IAEA.<br />
Many lessons have been learned from these two events.<br />
Over the years a global nuclear safety culture has evolved<br />
through international 104 collaborative efforts to strengthen<br />
safety worldwide. Binding international agreements, codes<br />
of practice, non-binding safety standards and guides along<br />
with international review and advisory services now exist.<br />
Agreements among countries on Early Notification of a Nuclear<br />
Accident (entered into force in 1986) and Assistance in the<br />
Case of a Nuclear Accident or Radiological Emergency (1986),<br />
Convention on Nuclear Safety (1996), Convention on Safety<br />
of Spent Fuel Management and Safety of Radioactive Waste<br />
Management (1997). International Atomic Energy Agency’s<br />
(IAEA) inspectors can check a nuclear power plant’s condition<br />
at any time and regularly organize safety missions in nuclear<br />
power plants.<br />
Germany: Influenced by the Chernobyl accident several<br />
countries decided to stop their nuclear power plants. In 2000,<br />
the German Government officially announced its intention<br />
to phase out the use of nuclear power. <strong>The</strong> Minister of<br />
Environment, Nature Conservation and Nuclear Safety, reached<br />
an agreement with energy companies on the gradual shut down<br />
of the country’s nineteen nuclear power plants and a cessation<br />
of civil usage of nuclear power by 2020.<br />
Picture 4. <strong>The</strong> Obninsk reactor near Moscow, IAEA<br />
Picture 5. Chernobyl NPP Unit 3 Shelter.<br />
Italy: In a referendum in 1987 following the Chernobyl<br />
accident, Italy decided to place a moratorium on nuclear<br />
power. <strong>The</strong> 5 years moratorium covered both power generation<br />
and construction of new nuclear power plants from 1988 to<br />
1992. <strong>The</strong> construction of two new nuclear power plants was<br />
stopped, and in 1988 the Italian Government ended all nuclear<br />
constructions. <strong>The</strong> Caorso reactor, which was shut down in<br />
October 1986 for the annual refuelling remained shut down<br />
ever since. In 1990 the Trino NPP was closed. <strong>The</strong> remaining<br />
units of Garigliano and Latina had already been closed down<br />
in August 1978 and November 1986, respectively. At the same<br />
time the decision was made to close down a number of facilities<br />
relevant to the fuel cycle: enriched uranium extraction facility,<br />
fuel elements production factory, reprocessing of spend fuel and<br />
the plutonium plant. As a result, Italy is not currently active in<br />
the nuclear energy sector.<br />
Observing and innovating <strong>Urban</strong> <strong>ecology</strong> in the <strong>Baltic</strong> <strong>Sea</strong> region. Chapter 4 85
86<br />
Spain: Spain passed a moratorium against nuclear power<br />
plants before others – in 1983. Spain had constructed but not<br />
started Lemoniz NPP, Valdecaballeros NPP Unit 2, and Trillo<br />
NPP Unit 2. This was an achievement by the communities<br />
living in the surroundings of nuclear plants. In 1994, definitive<br />
cessation was decided for the nuclear power plants under the<br />
moratorium. Present Law on Energy Sector does not include<br />
any nuclear power plants under construction, project or license<br />
application, and in the short term there are no known electric<br />
companies planning to build new nuclear power plants.<br />
Nevertheless, many nuclear power plants and especially those in<br />
U.S., make renovations and ask nuclear safety regulatory bodies<br />
to prolong operation licence for minimum 20 years.<br />
Reactors in operation by type in 2009<br />
300<br />
250<br />
200<br />
150<br />
100<br />
50<br />
0<br />
264<br />
92<br />
PWR BWR<br />
Reactor types<br />
44<br />
PHWR<br />
Every reactor type has its own advantages and disadvantages<br />
from the point of view of safety and economics. This includes<br />
many details, e.g. type of coolant, moderator, fuel type and<br />
assemblies form, amount of radioactive waste generated during<br />
operation, decommissioning and etc.<br />
18<br />
GCR<br />
16<br />
LWGR<br />
FBR<br />
Picture 6. Nuclear reactors in operation by type in 2009, IAEA<br />
2<br />
PWR Pressurized Water Reactors<br />
<strong>The</strong> most widely spread, used in 264 nuclear power plants, are<br />
the PWR type reactors (e.g. Ringhals NPP (Sweden), Biblis<br />
NPP (Germany) etc.) (Picture 7). Russian design PWR reactors<br />
are called VVER (e.g. Kozloduy NPP (Bulgaria), Bohunice<br />
NPP (Slovakia), Loviisa NPP (Finland), and Leningrad NPP<br />
(Russia)). Pressurized water reactors in which the heat generated<br />
by nuclear chain reaction from nuclear fuel is dissipated using<br />
highly pressurized (superheated, about 160 bar) water to<br />
achieve high temperature and avoid boiling within the core.<br />
<strong>The</strong> cooling water transfers its heat to the secondary system in<br />
a steam generator. Fuel used is 4% enriched uranium oxide,<br />
moderator – water, coolant – water as well. <strong>The</strong>y were originally<br />
designed in the U.S. for use in nuclear submarines.<br />
<strong>The</strong> most advanced PWR reactors are called European<br />
pressurized reactors (EPR) (produced by Areva). <strong>The</strong><br />
construction of such reactors started in Olkiluoto NPP<br />
(Finland) and at Flamanville NPP (France), also in the nearest<br />
future construction works of EPR reactors are foreseen in<br />
France, China, United Arab Emirates, and India.<br />
EPR design includes more safety measures, enhanced efficiency<br />
with the capacity of up to 1650 MW. It can use 5% enriched<br />
uranium oxide fuel.<br />
BWR Boiling Water Reactors<br />
Another wide spread type of reactors is boiling water reactors<br />
(BWR) (Picture 8). <strong>The</strong>re are 92 BWR reactors in operation<br />
in the world (e.g. Forsmark and Oskarsamn NPPs (Sweden),<br />
Gundremmingen NPP (Germany). <strong>The</strong> difference comparing<br />
with PWR reactor is that BWR has only 1 circuit of boiling<br />
water (primary loop) where steam produced goes straight to<br />
turbines. It also uses 4% enriched uranium oxide fuel, with<br />
water serving as both moderator and coolant.<br />
PHWR Pressurized Heavy Water<br />
Reactor<br />
44 units of pressurized heavy water reactors are now in<br />
operation all over the world. A Canadian company made 42<br />
of them and they are called CANDU reactors. <strong>The</strong>se reactors<br />
use natural uranium oxide fuel (that allows reducing uranium<br />
enriching costs) and heavy water (D2O) as both coolant and<br />
moderator. (heavy water production costs a lot).<br />
Control<br />
rods<br />
Pressured<br />
water<br />
Container<br />
Reactor<br />
vessel<br />
Picture 7. Structural scheme of PWR reactor<br />
Reactor<br />
vessel<br />
Container<br />
Control<br />
rods<br />
Picture 8. Structural scheme of BWR reactor<br />
Steam generator<br />
Turbine<br />
Turbine<br />
Condenser<br />
Condenser<br />
Generator<br />
Generator<br />
Observing and innovating <strong>Urban</strong> <strong>ecology</strong> in the <strong>Baltic</strong> <strong>Sea</strong> region. Chapter 4 87
88<br />
Picture 9. Structural scheme of a RBMK reactor<br />
GCR Gas Cooled Reactors<br />
<strong>The</strong>re are two types of gas cooled reactors (GCR) – Magnox in<br />
United Kingdom and UNGG (Uranium Naturel Graphite Gaz)<br />
in France. Currently 18 such reactors are in operation. In these<br />
reactors natural uranium metal with magnox cladding is used<br />
as a fuel, graphite serves as moderator and pressurized CO 2 as<br />
coolant.<br />
FBR Fast Breeder Reactor<br />
<strong>The</strong> fast breeder reactor (FBR) is a fast neutron reactor<br />
designed to breed fuel by producing more fissile material than<br />
it consumes. Fuel in such reactors is uranium/plutonium oxide,<br />
no moderator and liquid sodium serves as coolant. Only 2 FBR<br />
reactors are now in operation - Beloyarsky NPP Unit 3 (Russia)<br />
and Phenix NPP (France). Most of FBR reactors are old and<br />
in decommissioning stage (e.g. Dounrey NPP in Scotland).<br />
One FBR reactor is under construction in India. Fast breeder<br />
reactors are now under discussion in the nuclear community<br />
due to the possibility of reduction of spent fuel storage and<br />
disposal costs.<br />
LWGR (RBMK) Light Water Graphite<br />
moderated Reactors<br />
(Chernobyl type)<br />
Light water cooled graphite moderated reactors or RBMK (a<br />
Russian acronym for „channelized large power reactor“) needs<br />
more attention because of the Chernobyl NPP Unit 3 accident<br />
(totally there are 4 Units at Chernobyl NPP, 3 of them are in<br />
decommissioning stage) and the Ignalina NPP in Lithuania<br />
(the most advanced RBMK). RBMK reactors were built only<br />
in former Soviet Union and now 16 of them are in operation<br />
(including very small reactors of Bilibino NPP). Eight of them<br />
are being decommissioned and one under construction (Kursk<br />
NPP Unit 5, Russia).<br />
RBMK reactor (Picture 9) has two cooling loops, a direct cycle.<br />
Fuel assemblies are loaded into individual channels which allow<br />
refuelling of the plant without putting it off line. All other<br />
types of reactors have to be stopped, used fuel removed and<br />
fresh fuel loaded into a reactor. Massive graphite blocks are used<br />
as moderator, water as coolant and 3.6% enriched uranium<br />
oxide as fuel. <strong>The</strong> difference from other types of reactors is the<br />
absence of containment (as in VVER reactors). Containment as<br />
„safety factor“ is mostly used when describing RBMK reactors’<br />
safety drawbacks. Containment is made of very thick reinforced<br />
Picture 10a and 10b. <strong>The</strong> Ignalina nuclear Power Plant at the shore of<br />
Lake Drukšiai<br />
sealed concrete and includes all the cooling circuit and is meant<br />
to avoid discharge of radioactive materials in case of an accident<br />
in a reactor core.<br />
Nevertheless RBMK reactors are equipped with a biological<br />
shielding, which is similar to containment, but is made of a<br />
number of compartments but still does not cover all of the<br />
cooling circuit. <strong>The</strong>re are many other kinds of safety measures<br />
in RBMK reactors, such as automatic security and control<br />
systems, accidental reactor cooling system, accident localization<br />
system, fuel assemblies sealing system in reactor core and many<br />
others. Graphite stack is located in a sealed cavity and entire<br />
reactor is filled with helium and nitrogen mixture, which<br />
prevents graphite oxidation and improves heat transfer from<br />
graphite to fuel channels.<br />
Totally 2,052 channels penetrate the reactor’s graphite stack.<br />
1,661 channels are used for fuel loading and others are<br />
needed for rod control, accommodate sensors, temperature<br />
instrumentation, make gas sampling etc. In case of incidents<br />
or accidents, even those not related directly to the reactor,<br />
the Ignalina’s RBMK can be stopped in a couple of seconds<br />
automatically.<br />
As in all nuclear power plants – here safety is first. A welltrained<br />
personnel is prepared for normal and extreme situations.<br />
Possible incidents and accidents (e.g. technological, human,<br />
from inside and outside, including airplane crash) are calculated<br />
and safety measures are continuously improved. <strong>The</strong> personnel<br />
are due to continuous training in handling of all possible risk<br />
elements.<br />
<strong>The</strong> Ignalina Nuclear Power Plant<br />
faces decommissioning<br />
Ignalina NPP (Picture 10) was built to supply electricity for the<br />
North Western part of Soviet Union (Lithuania, Latvia, Belarus,<br />
Kaliningrad region). Lithuania at that time already had many<br />
thermal power plants and was well connected by electricity<br />
networks with surrounding regions. After geological research<br />
the location was chosen at the bank of the big lake Drukšiai,<br />
which needed to be used as a coolant for the nuclear power<br />
plant. Preparation works began in 1974 and in 1983 the Unit<br />
1 of Ignalina NPP started producing electricity, in 1987 Unit 2<br />
began operation. It was foreseen to build 4 units, but in 1989 it<br />
was decided to stop construction works of the third unit, which<br />
at that time was almost 60% complete. After the collapse of the<br />
Soviet Union the Ignalina NPP was overtaken by Lithuania and<br />
is located just ~ 7 km from Latvia and Belarus borders.<br />
So far the Ignalina NPP has been working without any major<br />
incidents. But following international pressure based on<br />
„unsafety of RBMK“ the Lithuanian Government in 1991<br />
signed a Grant Agreement on Nuclear Safety stating that the<br />
country commits not to change fuel channels in first reactor<br />
in 2005 as was required by the technology. This meant that<br />
the reactor could not continue operation. In 2000 Lithuania<br />
adopted the Law on Ignalina NPP Unit 1 Decommissioning<br />
and country’s preparation for final shut down of the plant<br />
started. During many years of negotiations on joining European<br />
Union one of the conditions was closing of Ignalina NPP.<br />
<strong>The</strong>refore in the Protocol No 4 of the Treaty on Accession to<br />
European Union it was stated that Lithuania „has committed<br />
to close Unit 1 of the Ignalina Nuclear Power Plant before 2005<br />
and Unit 2 by 2009“ and on other side European Union<br />
Observing and innovating <strong>Urban</strong> <strong>ecology</strong> in the <strong>Baltic</strong> <strong>Sea</strong> region. Chapter 4 89
90<br />
Picture 11. Bohunice NPP, Slovakia<br />
„Recognizing that the decommissioning of the Ignalina Nuclear<br />
Power Plant is of a long-term nature and represents for Lithuania<br />
an exceptional financial burden not commensurate with its<br />
size and economic strength, the Union shall, in solidarity with<br />
Lithuania, provide adequate additional Community assistance to<br />
the decommissioning effort beyond 2006“. Similar commitments<br />
were made for Kozloduy NPP (Bulgaria) and Bohunice NPP<br />
(Slovakia) (Picture 11), which have Russian type VVER<br />
reactors.<br />
Financing the shut down of a<br />
nuclear plant<br />
Decommissioning of nuclear plant is one other stage of their<br />
life cycle, which was not in consideration for many years. Only<br />
during the last 15 years, when many nuclear power plants and<br />
nuclear facilities were shut down, decommissioning became an<br />
important problematic issue.<br />
After final shut down of a nuclear plant it becomes an object,<br />
which needs to be removed. It creates different kinds of waste.<br />
Nevertheless, such an object needs special safety attention<br />
because of the presence of spent nuclear fuel, radioactive waste,<br />
hazardous waste and enormous amounts of concrete and metal<br />
waste.<br />
First question may arise how much all works will cost and how<br />
much time the process will take. In theory every nuclear power<br />
plant had to have a special fund for its decommissioning and<br />
waste management. In the early stage funds were accumulated<br />
only for very few nuclear power plants. For example, for<br />
Ignalina NPP the Decommissioning Fund was not established<br />
until 1995. Ignalina NPP pays 6% to the fund from the income<br />
it gets from sold electricity. At present only 60 million Euros are<br />
collected in the fund. <strong>The</strong>refore European Union gives financial<br />
support to Lithuania for decommissioning of Ignalina NPP. It is<br />
calculated that the whole decommissioning process of Ignalina<br />
NPP will take around 30 years and will cost around 2.4 billion<br />
Euros, excluding spend fuel disposal.<br />
Decommissioning strategy<br />
For decommissioning process a strategy needs to be developed.<br />
<strong>The</strong> ways of how the plant will be dismantled and what will<br />
be left on the site need to be decided. Possible options include<br />
immediate dismantling when everything including the reactor<br />
is dismantled a step at a time, defer dismantling when all<br />
buildings surrounding reactor are removed and the reactor<br />
building left to decrease radioactivity for 30-80 years. This<br />
method allows increasing of decommissioning fund by interest<br />
rate and it is suitable when a power plant has more units in<br />
operation. Entombment when everything is dismantled and<br />
removed, except for the reactor itself, which would be stabilized<br />
with concrete and left covered for ever. This method now is<br />
chosen only for some small research nuclear reactors but for a<br />
big nuclear reactor it is impossible to make long-term safety<br />
assessment.<br />
For Ignalina NPP Lithuania has chosen the immediate<br />
dismantling strategy. This decision was influenced by many factors:<br />
1) Personnel. Immediate dismantling strategy allows using<br />
the operational personnel of the plant for decommissioning<br />
works, and hence causes minor social problems in the region.<br />
<strong>The</strong> Ignalina NPP is the biggest job-suggesting place in the<br />
region and redundant workers could not find jobs neither in<br />
the region nor in Lithuania. <strong>The</strong>re are no other nuclear facilities<br />
in the country which would need nuclear specialists. Also, as<br />
most of the personnel are Russian speakers their integration<br />
in the labour market in other regions of Lithuania would<br />
be complicated. In addition, if the plant is not dismantled<br />
immediately there will not be any nuclear specialists left in the<br />
country. Later decommissioning works will demand hiring of<br />
foreign specialists.<br />
2) Technology. Existing techniques, equipment, technologies<br />
in the world already allow decontamination and dismantling of<br />
nuclear facilities safely. Safe management of waste technologies<br />
also exists. Other proposed option - safe enclosure for 30 years<br />
would not have substantial influence on radioactivity decreasing<br />
of the reactor core of Ignalina NPP.<br />
3) Infrastructure. Exiting infrastructure such as roads,<br />
equipment, buildings, water, and electricity and heating systems<br />
would need renovation after 30 years.<br />
4) Finance. Ignalina NPP Decommissioning Fund is not<br />
sufficient to cover all decommissioning and radioactive<br />
waste management costs. <strong>The</strong> European Union is supporting<br />
decommissioning of Ignalina NPP, but nobody could guarantee<br />
that Lithuania would get support after 30 years.<br />
Construction works<br />
IAEA had prepared recommendations and requirements<br />
for dismantling of big nuclear facilities. Following those<br />
recommendations Ignalina NPP prepared <strong>The</strong> Final<br />
Decommissioning Plan that includes detailed description of the<br />
entire decommissioning period of the plant, including, safety<br />
issues, possible dismantling techniques, radiation protection<br />
programme, environment protection programme, waste<br />
management programme, site restoration etc.<br />
Before the start of decommissioning new projects have to be<br />
implemented. <strong>The</strong> pre-decommissioning period of Ignalina<br />
NPP began in 2000. From then there have been several facilities<br />
at Ignalina NPP site commissioned. <strong>The</strong> main requirement for<br />
the Lithuanian nuclear regulatory body (State Atomic Energy<br />
Safety Inspectorate) was to built heat and steam boilers near<br />
the Ignalina NPP. During operation the nuclear power plant<br />
produces not only electricity, but also steam, heat and hot<br />
water for its own needs as well as for district heating of the<br />
nearby Visaginas town. After the final shut down of Unit 1 the<br />
possibility of an incidental stop of the only remaining Unit 2 in<br />
a cold winter would cause a catastrophic lack of district heating<br />
for the plant and for Visaginas people. To prevent this there<br />
were new boilers built and 108 km of gas pipeline from Pabradė<br />
to Visaginas constructed to assure gas supplies for those boilers.<br />
Another new building appeared near the plant – technical<br />
documentation archive. Information maintaining, storage is<br />
another very important issue arising in the course of nuclear<br />
facilities decommissioning. In many other countries, which<br />
started decommissioning of nuclear facilities, it appeared that<br />
many documents we either missing, or it became impossible to<br />
read older electronic documents because computer technology<br />
fast development and nobody was able to read files recorded<br />
using old technologies. At Ignalina NPP old archive was not<br />
capable to accommodate all documents; many documents<br />
were kept just at offices at plant departments. <strong>The</strong> new archive<br />
meets all modern document maintenance and record keeping<br />
international requirements and it is meant for minimum of 100<br />
years which is not very much for nuclear industry, having in<br />
mind radioactive waste storage time needs.<br />
Removing of such big electricity source from all electricity<br />
networks also requires special attention. JSC „Lithuanian<br />
Energy“ asked to build 330 kV compensating reactor (special<br />
transformer) that would be used after the shut down of both<br />
Ignalina NPP Units.<br />
In the mean time Ignalina NPP built a liquid radioactive waste<br />
cementation facility that will allow stabilizing and packing all<br />
operational and decommissioning liquid radioactive waste in a<br />
safe manner into 2,00 l metal drums (Picture 12a, 12b). Metal<br />
drums (4 of them) are put into concrete containers and stored<br />
until final disposal repository will be available.<br />
Radioactive waste<br />
General radioactive waste treatment paths are presented in<br />
Picture 13.<br />
Radioactive waste final treatment technologies also have a short<br />
history. In most cases in many nuclear facilities radioactive<br />
waste was just segregated by activities and kept in temporary<br />
storages or in earlier times just filled in excavated trenches<br />
around a nuclear facility. Such cases can be found in many<br />
countries (e.g. Port Hope town in Canada, having uranium<br />
enrichment plant now realized that 6 areas are contaminated of<br />
very low level radioactive waste, La Manche storage in France,<br />
many points in Russia including a sunken nuclear submarines<br />
reactors in the Barents sea, Swedish radioactive waste in the<br />
<strong>Baltic</strong> sea). Many programmes of restoration of territories, of<br />
removal of radioactive waste and management them by modern<br />
technologies have been now started.<br />
Solid radioactive waste at Ignalina NPP was kept in concrete<br />
bunkers (Picture 14) separated only by activity. In 2008 all<br />
those bunkers were opened to check the condition of waste<br />
and to take examples. It was found that the waste is a mix<br />
of concrete, metals, woods (Picture 15). <strong>The</strong>re is an ongoing<br />
project on building solid radioactive waste treatment and<br />
storage facilities. All waste from present storages will be<br />
removed, sorted, characterized, treated, conditioned, packed,<br />
stored and later disposed.<br />
<strong>The</strong> facility will include incinerator for burnable waste, super<br />
compactor, packaging equipment, and storage area for longactive<br />
radioactive waste.<br />
Observing and innovating <strong>Urban</strong> <strong>ecology</strong> in the <strong>Baltic</strong> <strong>Sea</strong> region. Chapter 4 91
92<br />
Pretreatment<br />
Conditioning<br />
Disposal/<br />
reuse<br />
Waste Treatment Paths<br />
Solid Waste Liquid Waste<br />
unburnable burnable burnable unburnable<br />
Segregation/<br />
Dismantling/<br />
Decontamination<br />
Fill up/<br />
Pouring<br />
Unconditional<br />
Reuse<br />
Incineration Evaporation<br />
Supercompaction Drying<br />
Melting/<br />
Conditional<br />
Reuse<br />
Picture 13. Classical scheme of radioactive waste treatment paths<br />
Radioactive metal waste melting technologies exist and<br />
are successfully used in Sweden, Germany for example.<br />
Technologies for recycling of metals currently allow around<br />
97% recycling level. Slightly radioactive metals can be reused<br />
for production of drums for radioactive waste storage. Swedish<br />
incineration and melting facility in Studsvik propose radioactive<br />
waste treatment services for other countries, because it is not<br />
always economically reasonable to have such facilities in every<br />
country.<br />
Radioactive waste classification system in Ignalina NPP<br />
represents disposal options for separate groups of the waste<br />
(Table).<br />
<strong>The</strong> Ignalina NPP decommissioning includes projects of<br />
building very low-level waste repository – landfill (Picture 17)<br />
and near surface repository for low and intermediate short-live<br />
radioactive waste (Picture 19). <strong>The</strong>y will be built close to the<br />
nuclear power plant too.<br />
Packing<br />
Intermediate Storage<br />
Final Disposal<br />
Solidifying/<br />
Cementation<br />
Vitrification<br />
In 2008 materials free release facility was constructed (Picture<br />
21). This facility is necessary to remove materials from<br />
radiological control after decontamination. Afterwards materials<br />
can be reused as waste disposed in conventional landfills.<br />
That allows decreasing of radioactive waste disposal costs. For<br />
Ignalina NPP landfill repository the calculated disposal cost<br />
is 240 euro/m 3 , for near surface repository – 2,400 euro/m 3 ,<br />
temporary storage – 500 Euro/m 3 .<br />
Spent nuclear fuel<br />
Spent nuclear fuel is removed from reactors and stored in water<br />
pools, adjusted to reactors, for cooling. After min 5 years it can<br />
be moved to long-term spent fuel storage. From 1995 Ignalina<br />
NPP is operating dry spent nuclear fuel storage that now<br />
contains 20 CONSTOR and 108 CASTOR metal-concrete<br />
dual-purpose (storage and transportation) containers (Picture<br />
22) produced by a German company GNB in the Czech factory<br />
„Škoda“. This type of container can accommodate 51 fuel<br />
Picture 14. Ignalina NPP solid radioactive waste storage bunkers<br />
Picture 15. Mixed operational radioactive waste<br />
Picture 17. Landfill repository model<br />
Observing and innovating <strong>Urban</strong> <strong>ecology</strong> in the <strong>Baltic</strong> <strong>Sea</strong> region. Chapter 4 93
94<br />
Waste Group Definition<br />
Surface dose<br />
rate<br />
Conditioning Disposal method<br />
0 Exempt waste Not required<br />
Management and disposal as<br />
conventional waste<br />
Short-lived low and intermediate level waste<br />
A Very low level waste (VLLW) ≤0.5 mSv/h Not required<br />
Very low level waste repository<br />
(Landfill Facility)<br />
B Low level waste (LLW-SL) 0.5-2 mSv/h Required Near surface repository<br />
C Intermediate level waste (ILW-SL) >2 mSv/h Required Near surface repository<br />
Long-lived low and intermediate level waste<br />
D Low level waste (LLW-LL) ≤10 mSv/h Required<br />
Near surface repository (cavities at<br />
intermediate depth)<br />
E Intermediate level waste (ILW-LL) >10 mSv/h Required Deep geological repository<br />
Spent sealed sources<br />
F (SSS) Required<br />
Near surface or deep geological<br />
repository<br />
assembly or 102 bundles. Nuclear fuel assembly in Ignalina<br />
NPP reactors is 7 m length (Picture 23). By technology it is<br />
specially prepared to cut into 2 pieces and after cutting it can be<br />
stored. Nevertheless it is not enough space in this storage facility<br />
to accommodate all spent nuclear fuel which is in water pools<br />
near reactors and will be produced during operation of the<br />
plant. This problem arises not only in Ignalina NPP but also in<br />
Kozloduy NPP, Chernobyl NPP and many other nuclear power<br />
plants. Primarily, when Lithuania was part of Soviet Union, it<br />
was planned that spent nuclear fuel would be transported back<br />
to Russia. However, not a single fuel assembly was transported<br />
since Russia did not start reprocessing of RBMK fuel (due to<br />
low enrichment of RBMK fuel it is not economically worthy<br />
to reprocess). It is calculated that after closing of Ignalina NPP<br />
Unit 2 there will be a need for storage of approximately 18000<br />
Picture 21. Ignalina NPP free-release facility construction finishing<br />
fuel assemblies. This need has created an ongoing project for<br />
building new dry spent nuclear fuel storage. <strong>The</strong>re fuel will<br />
be stored in a new type 190 containers with max of 91 fuel<br />
assemblies (182 fuel bundles); also specialized containers<br />
for damaged fuel assemblies are created. Totally in both the<br />
facilities there will be around 22 000 fuel assemblies. For both<br />
storages safety assessment is done for a 50 year storage term.<br />
<strong>The</strong> Lithuanian Radioactive Waste<br />
Management Strategy foresees that spent nuclear fuel could<br />
be transported to other countries which have facilities for<br />
reprocessing or disposal (at the moment not existing), to use<br />
European initiative of European regional repository or, if no<br />
other solutions will be possible, to start research works for<br />
deep geological (in 500 m) disposal repository in Lithuania.<br />
Preliminary studies show, that Lithuanian ground is not very<br />
suitable for a deep underground repository.<br />
At present after rejecting ideas and theories about sending spent<br />
nuclear fuel into space or sinking it in the world’s oceans, the<br />
only safe disposal option remaining is underground repository.<br />
<strong>The</strong>re are no such repositories in the world. <strong>The</strong> most advance<br />
research works on this matter are done only in Finland, Sweden<br />
and the U.S.<br />
On the other hand, with intensive use of natural sources, in the<br />
future spent nuclear fuel can be a source of many radionuclides<br />
and other materials, therefore the Japanese model of a deep<br />
geological repository includes retrievability option.<br />
Picture 22. Ignalina NPP dry spent fuel storage<br />
Reprocessing of spent nuclear fuel is done for research reactors,<br />
VVER reactors, and PWR reactors. France, UK, Russia, USA,<br />
and Japan have such facilities. After reprocessing high level<br />
radioactive waste is vitrified and is send back to the country of<br />
origin.<br />
<strong>The</strong> lack of a solution for the final treatment and storage of<br />
spent nuclear fuel in reality stops the development of nuclear<br />
industry. IAEA has initiated several working groups of experts<br />
to find the solution of this problem.<br />
Further the projects for the Ignalina NPP include: preparation<br />
of decontamination and dismantling engineering documents<br />
for every building and facility that have to be removed, full<br />
technical and radiological characterization of the plant, removal<br />
of spent nuclear fuel from reactors (till 2015), removal of<br />
unnecessary equipment, decontamination, dismantling of<br />
buildings (Picture 24).<br />
<strong>The</strong> final site restoration is foreseen at the level of “brown field”,<br />
as the radioactive waste repositories, spent nuclear fuel storage<br />
will stay in place for many years.<br />
Picture 23. Ignalina RBMK fresh fuel assemblies hanging in the reactor<br />
hall<br />
Lithuania has made the decision to build a new<br />
nuclear power plant (Visaginas NPP) on the same<br />
site using existing infrastructure, but presently only<br />
environmental impact assessment study has been<br />
prepared.<br />
Editorial note: According to the magazine „Lithuania in the<br />
World“ Nov-Dec 2008 this plant, build by either French,<br />
Canadian or American companies, and with financial support<br />
from the EU, won’t be in operation before 2016, even in case of<br />
most optimistic scenario.<br />
Used information sources:<br />
1. http://www.iaea.org<br />
2. B. Barre, P.R. Bauquis. Understanding the Future Nuclear<br />
Power. Editions Hirle, 2007.<br />
Observing and innovating <strong>Urban</strong> <strong>ecology</strong> in the <strong>Baltic</strong> <strong>Sea</strong> region. Chapter 4 95
96<br />
Questionnaire 4.7<br />
<strong>The</strong> Chernobyl accident has caused a long discussion of the safety<br />
and economic reason by using nuclear power plants. Here are some<br />
of the main questions and answers:<br />
How serious was the accident?<br />
UNSCEAR, <strong>The</strong> United Nations Scientific Committee on the<br />
Effects of Atomic Radiation in 2002 stated that the Chernobyl<br />
nuclear reactor accident April 26, 1986 was the most serious<br />
accident ever to occur in the nuclear power industry. <strong>The</strong><br />
reactor was destroyed during the accident and considerable<br />
amounts of radioactive materials were released to the<br />
environment. <strong>The</strong> accident caused the deaths of 56 workers and<br />
children and radiation injuries to over a hundred others.”<br />
What is the accident damage estimate?<br />
It is estimated by the IAEA Chernobyl Forum 2005, that 4,000<br />
people got sick with thyroid cancer. 336,000 people were<br />
relocated from the accident zone. <strong>The</strong> damage caused by the<br />
accident is estimated several hundred billions US dollars.<br />
What happened to the Chernobyl reactor? Was it an<br />
accidental disaster or experiment?<br />
UNSCEAR notices further: “<strong>The</strong> accident at the Chernobyl<br />
reactor happened during an experimental test of the electrical<br />
control system as the reactor was being shut down for routine<br />
maintenance. <strong>The</strong> operators, in violation of safety regulations,<br />
had switched off important control systems and allowed the<br />
reactor to reach unstable, low-power conditions. A sudden<br />
power surge caused a steam explosion that ruptured the reactor<br />
vessel, allowing further violent fuel-steam interactions that<br />
destroyed the reactor core and severely damaged the reactor<br />
building. Subsequently, an intense graphite fire burned for<br />
10 days. Under those conditions, large releases of radioactive<br />
materials took place.”<br />
This explanation indicates that the nuclear plant as such was<br />
safe, but that the operators were too young, inexperienced and<br />
unaware of the risk they took with the experiment.<br />
Why should Chernobyl be unsafe?<br />
It is noticed, that design features (such as a positive void<br />
coefficient type of reactor, use of graphite in construction, and<br />
lack of a containment building) are generally cited as the causes<br />
of the accident.<br />
Further information and discussions are to find on the internet,<br />
for example from IAEA:<br />
http://www.iaea.org/NewsCentre/Focus/Chernobyl/index.html<br />
(incl. many links)<br />
How to count on the period of radioactive decay?<br />
Storage of radioactive wastes is to allow them to decay to lower<br />
radioactivity levels; either while awaiting processing for reuse<br />
as fuel; or to temporarily store them awaiting disposal. For<br />
spent nuclear fuel, the „storage for decay“ period may be many<br />
hundreds of thousands of years.<br />
Until now the storage problem is not solved for more than a<br />
shorter period by deposition in former coal or underground<br />
salt mines or deep in rocky underground stores, and the final<br />
expenses for storage is not known.<br />
Activities:<br />
Make a research on the actual state for storage of nuclear waste.<br />
Compare prices for nuclear fuel to oil, coal and bio fuel.<br />
Find and consider the amount of uranium in the World. Which<br />
countries will be the new strategic energy-suppliers of a possible<br />
leading energy sector? Which countries will be dependant on<br />
their supply?<br />
Observing and innovating <strong>Urban</strong> <strong>ecology</strong> in the <strong>Baltic</strong> <strong>Sea</strong> region. Chapter 4 97
98<br />
Figure 5.1. Bogota in Colombia is a 8 m inhabitants<br />
city which politics for sustainable development is<br />
a composition of physical and socio-economical<br />
planning and democratic will: In the downtown area,<br />
the government demolished 20 HA of buildings that<br />
had been taken over by drug dealers and gangs in<br />
order to create more space for public parks and<br />
green areas. A country club is now a park too. Cycle<br />
lanes are made across the city to reduce cars.<br />
Chapter 5. How can the city be the solution for overconsuming<br />
cities?<br />
Cycling, insulation and renewable energy make a sustainable urbanisation<br />
possible. Democratic urban planning may be the tool for it, if the citizens<br />
go for influence.<br />
By Per Werge, Geographer at Nykøbing Katedralskole, Denmark<br />
“Cities in the developing world are expanding, populations grow,<br />
and we need more housing. Over the next 40 years, more cities will<br />
be built in the third world than exist today in total.<br />
In societies like ours, we never had the money to follow the 20th<br />
century city model – which is now widely regarded as a mistake. So<br />
now is the time to build different and better cities.<br />
We need a model that provides higher density rather than suburbs,<br />
with pedestrian streets only, so that no children grow up more than<br />
three blocks away from a park. We need a city where everybody can<br />
walk, and where people are able to buy groceries without using the<br />
car. We should create cities with networks of bicycle and pedestrian<br />
lanes not only in the city centre but all over the city.”<br />
“Protected cycle paths and pavements are very strong symbols of<br />
democracy. <strong>The</strong>y show that a citizen on a 30-dollar bicycle is<br />
equally important as the one in a 30,000-dollar car.”<br />
“To create a more inclusive city, where people feel equal, we need<br />
to invest a lot more in public spaces. Providing adequate leisure<br />
activities for the less wealthy citizens is very important. While other<br />
people go to restaurants, go on vacation or stay at home in their<br />
gardens during their leisure time, poor families can only afford<br />
to stay at home in small 40 m2 homes – sometimes even smaller.<br />
Public spaces like sport facilities, parks and pavements offer an<br />
alternative. At the very least, a democratic environment should<br />
include public spaces.“<br />
Enrique Peñalosa interviewed in “Monday Morning”, Copenhagen<br />
2007<br />
If we face the words above of Bogotá’s city mayor from 1998,<br />
Enrique Peñalosa, we must consider, that no society up till now<br />
has created a city without geographical and social disparities<br />
such as social ghettos for the different economic and social<br />
classes, and subcultural enclaves for various “cultures”.<br />
Though this setup is vital for innovations and change of<br />
production and living conditions, it means in many periods -<br />
often economic febrile times with groups of new rich people<br />
surrounded by growing poverty- that the build-in social tension<br />
gets up to the city’s surface, visible as social rebellion and<br />
disorder, as we have seen in the city centres and suburbs of<br />
Paris, London, Athens, Copenhagen, Los Angeles, Mexico City<br />
and many other big cities during the last decades.<br />
<strong>The</strong> concept of sustainable cities hence requires wider<br />
government than physical infrastructure solutions and<br />
sustainable energy supply alone.<br />
It requires a balanced cooperation and involvement of both<br />
“rich and poor”, families and singles, youngsters and elderly,<br />
firms and private people in changing the city’s old central<br />
district to areas with access to lots of public places. <strong>The</strong> suburbs<br />
are also to be planned and built as mixed and complex urban<br />
structures with the same intention.<br />
We have seen how rapidly even old quarters can change - old<br />
harbour docklands home for prostitution and drunk seamen are<br />
being gentrified - taken over by well off people and companies<br />
- and old working class districts changed into “downtown”<br />
recreational and displaying environments with fancy cafés,<br />
restaurants, theatres and cinemas, clubs and exhibitions.<br />
On the contrary we have also seen nearly new architectural<br />
designed housing and offices and commercial buildings being<br />
derelict sites - all together within one or two decades.<br />
Bad government, no long-range or far-sighted democratic will<br />
or influence from the citizens - and thus an open gate for shortsighted<br />
speculative investors and entrepreneurs.<br />
From a sustainable point of view, economically, socially and<br />
environmentally, this is a disastrous way of urbanisation.<br />
Observing and innovating <strong>Urban</strong> <strong>ecology</strong> in the <strong>Baltic</strong> <strong>Sea</strong> region. Chapter 5 99
100<br />
Castle<br />
harbour<br />
roads<br />
Gate<br />
Gate<br />
Market<br />
1 km<br />
Water mill<br />
Let us take a look to how the cities developed in northern<br />
Europe through the main historical periods of growth<br />
reflecting the key factors such as production and trading sites,<br />
housing districts for the main social groups (historical classes),<br />
government districts and the traffic network that links these<br />
functions together.<br />
All this connected to the perspective of searching for a<br />
future more sustainable - possibly fully sustainable - urban<br />
development.<br />
Pre-industrial towns until a.1800<br />
During the pre-industrial periods all work was man made, i.e.<br />
hand made craft, most resources came from the local district<br />
except special raw materials (logs, iron and other metals) or<br />
products (cloth, amber, fine food, weapons, spices) as described<br />
in chapter 3. Transport was based on animal or human power<br />
with the wind as supplement for boats and ships.<br />
This means that energy consumption was fully delivered by<br />
renewable resources (wood), the only machines were powered<br />
by wind (the sun) or streaming waters (the gravity).<br />
Market town 1300-1800<br />
Government<br />
/ pw 2009<br />
Trade+Citizens<br />
Workshops and craftsmen<br />
Lower class housing and gardens<br />
Rampart or town wall<br />
Figure 5.2. During its initial centuries<br />
the city mainly belonged to its<br />
surrounding resources: heating and<br />
housing based on wood and clay or local<br />
stones; food, work and transport based<br />
on animal and human power i.e. food<br />
from agricultural production and finally<br />
wind and water power.<br />
<strong>The</strong> town or city was rarely larger than 1-2 km x 2-3 km.<br />
Everyone could move all over the area just by walking - longer<br />
distances by sailing, riding, or in a horse carriage.<br />
Industrial towns a.1850-1950<br />
During the industrial period these old cities were surrounded<br />
by new urban layers of manufacturing industry based first on<br />
steam machines, later diesel and electric engines. New railway<br />
lines and greater harbours for steam ships went straight to the<br />
gate of the old city, which in turn changed to be CBD centre of<br />
a big city (Central Business District), filled with finance, trade<br />
of all scales and small crafts and industrial backyard firms. Still<br />
graded housing for various classes like before.<br />
New growing classes of industrial workers settled in the next<br />
urban layer or “ring” around the industrial city, while new rich<br />
industrialists or tradesmen as a new “gentry” built countryside<br />
or seaside villas outside the city, after all forming new districts<br />
of garden cities. A growing middle class of tradesmen and<br />
leading people from the public and private administration and<br />
the education as well as information and science sector settled<br />
in detached housing or better apartments than the workers in a<br />
ring next to the workers circle.<br />
Industrialists<br />
housing<br />
Harbour<br />
1 km<br />
Gate<br />
Gate<br />
<strong>The</strong> infrastructure during this century expanded to most corners<br />
of the world: already before the year 1900, most mountain<br />
chains were penetrated with tunnels for railways. <strong>The</strong> railways<br />
crossed all continents, later supplied by a widespread extension<br />
of asphalt roads for motor vehicles and by harbour facilities.<br />
Inside the centre many cities got underground railways and<br />
electric tramways in the streets. After a.1920, still more private<br />
cars occurred bringing the new rich people from the garden<br />
cities to the centre. Commuting was at this period a privilege<br />
for better-off people.<br />
Regarding the consumption of resources, the industrial town<br />
belonged by far to the local region anymore. Raw materials,<br />
energy, building materials, some components and semimanufacture,<br />
a lot of food, luxury and many daily products<br />
and even specialised manpower were imported by ship, train,<br />
and later in the period on a limited scale by truck, flight - all<br />
consuming first coal, later besides coal using diesel, petrol or<br />
electricity (mostly produced by coal).<br />
1 km<br />
1 km<br />
Central Station<br />
Garden city - housing for the gentry<br />
Industrial town<br />
1850-1950<br />
/ pw 2009<br />
Government<br />
Hotels and stores<br />
Shopping district<br />
CBD Central Business District<br />
Parks and ring road<br />
Railway<br />
Figure 5.3. <strong>The</strong> industrial era opened<br />
the city for speculation in poor housing<br />
for the working class, what later<br />
provoked stricter city legislation.<br />
Middle class<br />
housing<br />
Manufakturing<br />
industry<br />
Working<br />
class<br />
housing<br />
Post-industrial cities 1950-2010<br />
This was the period of globalization of the market economy,<br />
first through de-colonization of the former European overseas<br />
colonies and their change to independent developing countries,<br />
from 1990 through change of most communist planning<br />
economies to market economies.<br />
<strong>The</strong> open borders for finance, trade and manpower caused the<br />
widest and most penetrating reorganisation of the production<br />
and migration of people ever in history. For the city, the<br />
globalization meant a similar reorganisation.<br />
As still more of the manufacturing industry moved to the<br />
developing countries and former planning economies due<br />
to their lower salaries and weak labour and environmental<br />
protection, the size of the industrial working class diminished<br />
in the former industrial countries. Instead, the sector for all<br />
kind of services grew: from basic maintenance, from retail to<br />
financial and commercial service, both private and public, and<br />
for information, education and research.<br />
Observing and innovating <strong>Urban</strong> <strong>ecology</strong> in the <strong>Baltic</strong> <strong>Sea</strong> region. Chapter 5<br />
101
102<br />
Gentry<br />
housing<br />
Marina<br />
Recreational Harbour<br />
new canal town<br />
Overseas<br />
Port<br />
University & Science park<br />
1 km<br />
Gate<br />
Gate<br />
Garden city<br />
1 km<br />
Central Station<br />
Garden city<br />
CITY 3<br />
Shopping and<br />
council housing<br />
Garden city<br />
While immigrants together with the lower middle class and<br />
educational youth took over the old working class districts, the<br />
fast growing middle class from the service sector moved out of<br />
town to new built suburbs or garden cities, or to next provincial<br />
town. After all, this caused general urbanization even of the<br />
countryside especially for villages located near motorways and<br />
railways.<br />
<strong>The</strong> new rich “gentry” from trade, high tech, IT and finance<br />
settled in new recreational seaside residential areas in the<br />
old harbour or property along the coast. <strong>The</strong> city centre was<br />
transformed to a recreational shopping and cultural area with<br />
museums and theatres. In connection to this, new quarters for<br />
bars, cafés, experimental theatres, music stages and cinemas<br />
aroused from the improved former industrial district.<br />
In most cities the old centre has restrictions for cars.<br />
Pedestrians, cyclists, buses and metros make the transport.<br />
However, around the centre the physical transport is mainly<br />
CITY 2<br />
Shopping and<br />
council housing<br />
Airport<br />
Motorway<br />
Railway<br />
Commercial corridor<br />
Postindustrial city<br />
1950-2010<br />
/ pw 2009<br />
Lower<br />
middle class<br />
Middle class<br />
housing<br />
Cafées, cinemas,<br />
artisans, university<br />
Working class<br />
& immigrants<br />
Center for recreation<br />
displaying, shopping<br />
Ring road<br />
Park<br />
Government<br />
City hotels and stores<br />
<strong>The</strong>atres, museums<br />
Figure 5.4. <strong>The</strong> motorization has since the 1950-70s changed the size and composition of the city dramatically. It will be crucial for obtaining<br />
sustainability to get rid of the oil-based motor technology. Notice the commercial corridors growth along the motorways. It is here the citizens by car<br />
catch their large consumer goods, causing traffic jams and massive long lasting CO2-emission every evening and weekend.<br />
motor cars and trucks. Many suburbs, in particular garden<br />
cities, are badly served by public transport. Besides, the retail<br />
of goods and even grocery stores have moved out of town to<br />
satellite sub-cities with commercial centres and to roadside<br />
commercial corridors, built along the motorways with easy<br />
access for cars, vans and trucks, but with no access by bus or<br />
train - and long distances for bicycles.<br />
This way of location of the commercial service sector will<br />
link future city development to motoring for long and make<br />
lower greenhouse gas-emission nearly impossible as long as the<br />
engines of the cars burn petrol and oil.<br />
How to make the city sustainable?<br />
<strong>The</strong> question on how to change the over-consuming and<br />
exhausting city in an environmentally friendly direction has in<br />
the light of climate changes and urban expansion been in focus<br />
for discussion at many international conferences and meetings<br />
for urban planners and environmentalists through the last<br />
decade.<br />
Let us take one of them, a congress about “<strong>The</strong> future of<br />
cities” held in Copenhagen September 2007 for 700 planners,<br />
politicians, researchers and students from 40 countries.<br />
<strong>The</strong>y passed a common “Copenhagen Agenda for Sustainable<br />
Cities” of 10 principles:<br />
<strong>The</strong> basic statement was, that since the challenges for the cities<br />
derive from the city itself, the solutions must be developed<br />
there.<br />
Another statement was, that cities by nature ought to be<br />
environmentally-friendly because they concentrate population<br />
and thus should reduce heating and transport.<br />
Both statements sound visionary, but can never cover the reality<br />
that most citizens originally moved from the country to the<br />
city or back to urbanized villages due to bad living conditions.<br />
In the city or the urban sprawl they had just to use existing<br />
technology for heating and transport and to take the jobs and<br />
products available from the globalized market. Alone they had<br />
no chance to break this pattern of dependency between the<br />
globalized city and the World market.<br />
Nevertheless, the Copenhagen City Agenda brought good<br />
visions for sustainable city governance, and promises to deliver<br />
“specific issues” about “healthy future for global cities” at the<br />
UN Global Climate Summit in Copenhagen December 2009.<br />
<strong>The</strong> 10 principles in the City Agenda were:<br />
1. Re-discover the city<br />
2. Re-define city values<br />
3. Involve every day experts<br />
4. Break down “silos” (adm. structures)<br />
5. Re-distribute urban decision-making<br />
6. De-design urban planning<br />
7. Promote corporate urban responsibility<br />
8. Go global - for environmental technology<br />
9. Embrace chaos, crisis and change<br />
10. Encourage passion in urban leadership<br />
Figure 5.5. In 2009, many governments such as in the USA and the<br />
Nordic countries predicted a farewell to the motor car within 15 or 20<br />
years. But will people give up individual transport or will other cars<br />
occur out side city?<br />
<strong>The</strong>se principles are all democratic i.e. human and political<br />
objectives. <strong>The</strong>y do not pinpoint how and by which means and<br />
technology the future city exactly may develop in a sustainable<br />
direction.<br />
However, among the contributions to the conference the<br />
concrete pieces of advice were numerous: urban density is<br />
fundamental for reduction of energy consumption, both to<br />
transport and heating, that has been ignored in Europe and<br />
USA, but will not be in China (prof. Richard Burdett, London)<br />
He also calls for strong and visionary urban leadership to force<br />
private companies and investors to be interested in participating<br />
in the development of cities.<br />
Democratic leadership is also fundamental for Joel Kotkin, the<br />
author of „<strong>The</strong> City“.<br />
“<strong>The</strong> concept of the city is driven by two equally important<br />
visions: (1) Do we care about what happens to our city? This is<br />
highly dependent on governmental institutions.<br />
(2) On a lower scale, these feelings must be brought down to<br />
the local neighbourhood to help engage people locally and<br />
strengthen their feelings towards the city.”<br />
Many contributors mentioned the infrastructure as well as<br />
building standard as crucial for sustainability. <strong>The</strong> former mayor<br />
of Bogota Enrique Peñalosa thinks that people in cities like<br />
Amsterdam and Copenhagen underestimate the importance of<br />
cycling.<br />
Cycling and walking are beside energy-saving also instruments<br />
for keeping the population healthy simply because they get<br />
motion. As for the British fit towns, this strategy is seen as<br />
Observing and innovating <strong>Urban</strong> <strong>ecology</strong> in the <strong>Baltic</strong> <strong>Sea</strong> region. Chapter 5<br />
103
104<br />
Industry<br />
100 m<br />
Micro-Rayon for 10.000 inh. (ca. 40 ha)<br />
Secondary School<br />
Station Center/<br />
Common house<br />
Super<br />
markets<br />
Kindergarten School<br />
Industry<br />
“medicine” against the global obesity epidemic of fat people.<br />
<strong>Urban</strong> planning may reduce lifestyle obesity and diabetes, and<br />
make a farewell to car driving in towns easier.<br />
Figure 5.5 shows how common private cars have become,<br />
without any sign of decreasing demand for private cars. If car<br />
driving is going to be restricted inside cities, there will be a need<br />
for a new quality of flexible and cheap public transport, either<br />
light rails or simply electric busses in separate bus lanes like in<br />
Bogota and Brasilia, where a bus system with high frequency<br />
move 500,000 citizens as fast as a metro for a tenth of the cost<br />
of a subway.<br />
A similar view of the importance of the good infrastructure of a<br />
“healthy” city was given by Anthony Capon, Australia:<br />
/ pw 2009<br />
Blocks with flats<br />
Road<br />
Railway<br />
Figure 5.6. During the communist era the planners in Eastern Europe realised a model for suburbs, which is actual again due to the need for Zero<br />
consuming cities: the unit of a suburb was home for 5-15,000 people in flats, of which none had longer walking distance than 8 minutes to all central<br />
facilities: shops, transport, work, kindergartens and schools, sports and leisure areas.<br />
Institute<br />
HEALTHY CITY CHECKLIST<br />
● less than 500 m to a bus, train or tram stop with regular<br />
services (min. every 30 min)<br />
● less than 500 m to shops<br />
● less than 500 m to parks<br />
● less than 30 min to education, employment, social and<br />
cultural opportunities<br />
● safe walking and cycling paths to a primary and secondary<br />
school<br />
● mix of housing types and prices, suitable for various life<br />
phases<br />
● housing built or adapted using environmental principles<br />
● good outdoor and indoor air quality<br />
● sense of community in the neighbourhood<br />
● tolerant and safe environment<br />
Railway<br />
Railway<br />
Road<br />
Road<br />
Micro-Rayon for 10.000 inh. (ca. 40 ha)<br />
Micro-Rayon for 10.000 inh. (ca. 40 ha)<br />
Railway<br />
Road<br />
Micro-Rayon for 10.000 inh. (ca. 40 ha)<br />
Among the other contributions to the creation of a sustainable<br />
city were instructions for green housing, i.e. energy saving,<br />
well insulated but ventilated buildings as demonstrated in the<br />
example of Sønderborg's zero housing.<br />
How the power for electricity and heating is produced is<br />
another core question for the future sustainable city. <strong>The</strong><br />
example of Sønderborg shows how a local solution based on<br />
geothermal energy reduces the need for fuel. Another local<br />
solution used biogas or biogas generated by wind power.<br />
Housing in huge districts may be heated these ways, or by solar<br />
energy. <strong>The</strong> technology is at hand, investments, planning and<br />
good democratic governance is what will be needed!<br />
Hence, as for inhabitants in the cities of the future, it is up to<br />
the citizens to take part - take “the other part” - in a democratic<br />
partnership with the government for sustainable urbanization!<br />
Gate<br />
Gate<br />
Figure 5.7. By location of a row of<br />
suburbs, the city grew without losing the<br />
composition of local democratic governing<br />
units. Fast busses, trains and cycle paths<br />
connected the “rayon” with both work and<br />
education places, and the old city centre<br />
with its recreational, historical and cultural<br />
institutions.<br />
Observing and innovating <strong>Urban</strong> <strong>ecology</strong> in the <strong>Baltic</strong> <strong>Sea</strong> region. Chapter 5<br />
105
106<br />
Questionnaire 5: How to check the planning of your own<br />
city - make it future-ready!<br />
What to do for BSP-schools.<br />
Research schedule:<br />
An idea-sketch on how to implement and push more<br />
sustainable development and technology in the local, regional<br />
or national urbanisation process.<br />
Research schedule (proposal) for any town and city.<br />
Check the urban development since 1991 (Rio) for its<br />
sustainability:<br />
How did the Rio-convention affect the planning of urban areas<br />
according to sustainability?<br />
Check by use of maps and other documents which new districts<br />
and constructions have been made.<br />
Check all parts of the city: the town centre, harbour, suburbs,<br />
other districts.<br />
Check the plans for the future extension of the city, among<br />
them for suburbs.<br />
Ask the local administration of the municipality for information<br />
and plans.<br />
<strong>Sea</strong>rch internet homepages.<br />
Traffic<br />
To what degree are principles of sustainability integrated in the<br />
traffic planning now and for the future?<br />
Check by observations and use of maps the infrastructure,<br />
i.e. roads, cycle paths, pedestrian areas (footpaths, pedestrian<br />
streets, pavements, squares); rail- and tramways; waterways,<br />
canals, harbours, airports. Draw a map of the infrastructure.<br />
What are the priorities of transport forms now: walking,<br />
cycling, scooter, bus, automobile, train?<br />
Are there plans for alternative transport or roads: windbreaks<br />
for cycle paths, light rails or trams, bus lanes, pedestrian streets<br />
and districts, electric cars, airship zeppelin?<br />
Energy account<br />
Register the energy production and use, type, limits. Try to get<br />
information from local authorities, energy plants, energy and<br />
environmental organisations.<br />
Buildings<br />
Check insulation, energy efficiency, design – how does law give<br />
the statutory standards?<br />
How far are they from zero-energy standard?<br />
Materials – to what extent are building materials local? Global<br />
(imported)?<br />
Consumption and use of materials. Treatment of waste<br />
How is the collection/sorting of waste?<br />
To what extent is waste reused or recycled?<br />
How is environmental scrap treated?<br />
Green surroundings as climate zones<br />
Draw simple mapping sketches of green networks, belts or lonely<br />
spots. Parks and urban forests. Sports grounds. Green courtyards.<br />
River, lake, coast promenades.<br />
What happens to former harbour and docklands? Deserted or<br />
gentrified?<br />
Water household<br />
Is the supply from the surface or ground water, or both?<br />
Does the community feed the groundwater or let the runoff run?<br />
What happens to runoff of surface water?<br />
How is waste water and sewage water treated? Visit the local<br />
waste water treatment plant.<br />
Draw a map on how the treatment plants cover the city’s need.<br />
Planning<br />
Draw a simple plan for the future development of your city as a<br />
healthy city.<br />
Send your proposals and plans for a better city to the government<br />
and local newspapers!<br />
Observing and innovating <strong>Urban</strong> <strong>ecology</strong> in the <strong>Baltic</strong> <strong>Sea</strong> region. Chapter 5<br />
107
108<br />
A view into the future of the city - what is on its way to be<br />
realised?<br />
<strong>Urban</strong> greenhouse<br />
American scientist have already<br />
long talked about skyscrapers as<br />
greenhouses for growing of vegetables<br />
for the cities. <strong>The</strong> Swedish food<br />
company Plantagon is may be going<br />
to build them soon.<br />
<strong>The</strong> main argument is that though humans originally lived in<br />
the wild nature as well as plants and animals, most people now<br />
live in towns. Since modern farming is still more critical for the<br />
nature due to its use of chemi stry it will be more environ mental<br />
friendly if basic food is produced in tall greenhouses separated<br />
from the nature:<br />
Water and organic waste can be reused, the growing is<br />
independent of the weather. It will not occupy agricultural land,<br />
which is a limited resource, transport to the consumer is short.<br />
(More sources: among them “www.squidoo.com” and “Ingeniøren”,<br />
Copenhagen 2009)<br />
Will the shipping emission be solved by new high tech<br />
vessels ?<br />
As the supply of the cities for 90% rely on trans port of goods,<br />
this sectors energy con sump tion is crucial for the efforts to<br />
developing sustainable cities.<br />
<strong>The</strong> BP Oil Co, which runs 50 super tankers estimated 2007<br />
that the global fleet of 70,000 ships uses approximately 200m<br />
tonnes of fuel a year and this is expected to grow to 350m<br />
tonnes a year by 2020. Carbon dioxide emis sions from shipping<br />
will then be 4% of the global total. Aviation counts for 2%.<br />
Without action the International Maritime Organization<br />
predicts that by 2020, emissions from ships would increase up<br />
to 72%.<br />
(Source: <strong>The</strong> Guardian 3 march 2007)<br />
Either shipping nor air transport is covered by the Kyoto<br />
accord. How then to solve the problem of the growing CO2 emission from this sector?<br />
<strong>The</strong> Japanese shipyard CoNippon Yusen KK (NYK) is going<br />
to try. <strong>The</strong> company plans to complete the development of a<br />
future container ship by year 2030, 353 m long and mainly<br />
powered by fuel cells of 40 megawatts using liquefied natural<br />
gas as hydrogen source.<br />
<strong>The</strong> aim is to reduce the CO 2-emission per ton-mile by 69% by<br />
this technological innovation. Besides the fuel cell engine the<br />
“super eco ship” from NYK will use a sort of high tech lamels<br />
as sails to use when the wind is useful, supplied by energy from<br />
solar cells.<br />
Involved in the project is the NYK-owned Maritime Techology<br />
Institute in cooperation with the Finnish consulting company<br />
Elomatic and the Italian ship design company Garroni Progetti.<br />
(Source NYK Lines April 2009)<br />
Observing and innovating <strong>Urban</strong> <strong>ecology</strong> in the <strong>Baltic</strong> <strong>Sea</strong> region. Chapter 5<br />
109
110<br />
Private transport to the city - do electric vehicles make the<br />
future?<br />
Which one of these electric vehicles will be the future means of<br />
transport in the city and outside it? <strong>The</strong> electric BYD car from China or<br />
the German bicycle with an electric motor built-in on the front wheel,<br />
the battery is on the back (Manufacturers photos)<br />
Many researchers and manufacturers try these years to conquer<br />
the future market for individual sustainable vehicles to use<br />
both inside and outside the cities. Bicycles have a great future,<br />
no doubt, inside and between suburbs. Transport to and from<br />
the settle ments in the countryside - the urban sprawl - and for<br />
travelling as indivi dual tourists will for long keep millions of<br />
people heading for a private non-polluting car.<br />
Does it exist?<br />
One vision deals with the promotion of the fuel cell as engine<br />
in cars and trucks shown at the left. This concept is based on a<br />
production of hydrogen by converting wind or solar power to<br />
electricity and further on by electrolysis to H2. Another vision ask why electricity can’t be used straight as<br />
it is in cars with electric engines. Until now the limitation<br />
for this concept has been the low capacity of the battery, but<br />
manufacturers are working to solve the problem. One of them<br />
is the Chinese manufacturer of accumulators BYOD, which<br />
through a number of years also produced electric cars, named<br />
BYD (Buy Your Dream). <strong>The</strong> next years will show which trend<br />
is the strongest.<br />
Are the cities’ “downtowns” to rescue from flooding?<br />
One of the greatest environmental threats to the cities in the future is<br />
flooding caused by a still warmer climate, both due to rising sea level<br />
and to higher precipitation. Considering the shape of the <strong>Baltic</strong> <strong>Sea</strong><br />
there are only two or three relatively slim and shallow (7-11 m) water<br />
straits or gates from the <strong>Baltic</strong> <strong>Sea</strong> to the ocean, which during westerly<br />
storm carry big quanti ties of water to the <strong>Baltic</strong> basin.<br />
A rise of just ½ m (expected within 50 years) will cause severe flooding<br />
in the low centres - the crowded down towns - of most coastal cities in<br />
the region. But the regions geomorphological development points out<br />
a solution: A barrier of the Danish Straights, similar to the Deltaplan<br />
in Holland. Here a sensible very low delta zone has been protected<br />
from both ocean flooding and flooding from rain brought by the<br />
rivers.<br />
After a serious flooding of 15.000<br />
hectares in 1953, Holland built a<br />
huge flooding protection system<br />
of the delta area for the Rhine,<br />
Maas and Schelde rivers between<br />
Rotterdam and Antwerpen. Gates<br />
can be locked for the ocean during<br />
storm and sluises let the ships pass<br />
the locks at normal tide.<br />
Photos by Deltawerken.com<br />
Observing and innovating <strong>Urban</strong> <strong>ecology</strong> in the <strong>Baltic</strong> <strong>Sea</strong> region. Chapter 5<br />
111
112<br />
Literature and references, links etc.<br />
Most used sources are mentioned directly in connection to or inside each chapter. Further links are:<br />
Links<br />
http://www.iclei.org search system for urban <strong>ecology</strong> websites<br />
http://www.nweurope.org/page/projetIdea.php?p=&id=241<br />
EU-project for urban development<br />
http://auto.howstuffworks.com/ How stuff works: Very instructive website on all sorts of technologies and their function,<br />
even the newest: fuel cells and solar cells<br />
http://www.iisd.ca/ Canadian International Institute for Sustainable Development<br />
http://www2.wupperinst.org German Institute for Sustainable Development<br />
http://www.dcue.dk Danish centre for urban <strong>ecology</strong><br />
http://www.urban<strong>ecology</strong>.net/ <strong>The</strong> <strong>Urban</strong> Ecology Centre, Montreal, Quebec, Canada<br />
http://www.urban<strong>ecology</strong>.org.au/ Australian Research Centre for <strong>Urban</strong> Ecology. Royal Botanic Gardens, Melbourne<br />
http://www.earthcharter.org/youth/ <strong>The</strong> youth group of Earth Charter;<br />
http://www.users.on.net/ Australian website on sustainability<br />
http://www.worldwatch.org. <strong>The</strong> World Watch Institute<br />
http://www.environment.fi/ Finlands ministery for Environment<br />
http://www.mappeonline.com/unesco/atlas/<br />
<strong>The</strong> Ipogea Institute of Matera (Research institute for traditional knowledge on sustainable<br />
development in the Mediterranean and Middle East)<br />
www.greenroof.se a Swedish firm producing green roofs<br />
Further readings:<br />
<strong>Urban</strong> Ecology: An International Perspective on the Interaction Between Humans and Nature. By John M. Marzluff. Contributions<br />
of Eric Shulenberger, Wilfried Endlicher, Marina Alberti, Gordon Bradley, Clare Ryan. Springer Verlag 2008. ISBN 0387734112,<br />
9780387734118
<strong>The</strong> UNESCO Associated Schools <strong>Project</strong><br />
Hurricane Katrina aftermath in New Orleans, 2005