Q3 2010 Analyst Presentation
Q3 2010 Analyst Presentation
Q3 2010 Analyst Presentation

You also want an ePaper? Increase the reach of your titles
YUMPU automatically turns print PDFs into web optimized ePapers that Google loves.
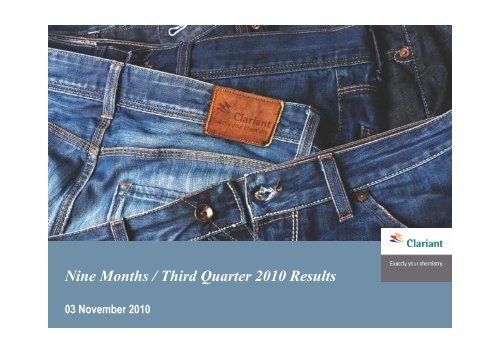
Nine Months / Third Quarter <strong>2010</strong> Results<br />
03 November <strong>2010</strong>
Agenda<br />
Highlights and key figures first nine months<br />
Financial results third quarter<br />
Business review<br />
Outlook<br />
9M <strong>2010</strong> / <strong>Q3</strong> <strong>2010</strong>, <strong>Analyst</strong>s <strong>Presentation</strong>, 3 November <strong>2010</strong> (Copyright Clariant. All rights reserved.)<br />
Slide 2 / 55
Highlights and key figures first nine<br />
months<br />
Success of the restructuring program leveraged by the favorable and robust economic<br />
environment in the first nine months:<br />
– Local currency sales grew 14% year-on-year<br />
– Gross profit margin improved to 28.5% from 23.1% in 9M 2009<br />
– EBIT before exceptionals rose 253% to CHF 576 million from CHF 163 million<br />
– EBIT margin before exceptionals at 10.6% vs. 3.3%<br />
– Net income CHF 144 million compared to net loss CHF 127 million<br />
Sales price increases fully compensated for higher raw material costs at the end of the period<br />
– Focus on further selective sales price increases where necessary<br />
Final decisions to optimize production footprint within the Global Network Optimization<br />
Program (GANO) taken in October<br />
– Savings of at least CHF 100 million annually by 2013 expected<br />
9M <strong>2010</strong> / <strong>Q3</strong> <strong>2010</strong>, <strong>Analyst</strong>s <strong>Presentation</strong>, 3 November <strong>2010</strong> (Copyright Clariant. All rights reserved.)<br />
Highlights and key figures first nine months<br />
Slide 3 / 55
Agenda<br />
Highlights and financial results nine months<br />
Financial results third quarter<br />
Business review<br />
Outlook<br />
9M <strong>2010</strong> / <strong>Q3</strong> <strong>2010</strong>, <strong>Analyst</strong>s <strong>Presentation</strong>, 3 November <strong>2010</strong> (Copyright Clariant. All rights reserved.)<br />
Slide 4 / 55
Key figures third quarter<br />
Sales in CHF mn 1 709 1 691<br />
Gross margin* 27.9% 25.3%<br />
EBIT before exceptionals in CHF mn 28.7% 182 29.2% 107<br />
EBIT margin before exceptionals 10.6% 6.3%<br />
Net income in CHF mn 109** 25<br />
Operating cash flow in CHF mn 173 193<br />
9M <strong>2010</strong> / <strong>Q3</strong> <strong>2010</strong>, <strong>Analyst</strong>s <strong>Presentation</strong>, 3 November <strong>2010</strong> (Copyright Clariant. All rights reserved.)<br />
<strong>Q3</strong>/10 <strong>Q3</strong>/09 in CHF in LC<br />
* restated gross margin includes freight costs as of 1 January <strong>2010</strong> / reported gross margin in <strong>Q3</strong> 2009 was 30.1%<br />
** includes a one-time benefit from the capitalization of tax assets of CHF 45 mn<br />
+1%<br />
Financial results third quarter<br />
+8%<br />
Slide 5 / 55
Single- to double-digit sales growth in all<br />
regions despite more challenging base<br />
Sales growth in local currencies<br />
Sales mix:<br />
– Volume +5%<br />
– Price +3%<br />
– Acq./div. 0%<br />
– Currency –7%<br />
Single-digit to double-digit sales growth in<br />
local currency in all regions<br />
Significant currency impact on top-line<br />
growth due to Swiss franc appreciation<br />
Close to 50% of sales generated in the<br />
emerging markets of Asia, Latam, MEA<br />
9M <strong>2010</strong> / <strong>Q3</strong> <strong>2010</strong>, <strong>Analyst</strong>s <strong>Presentation</strong>, 3 November <strong>2010</strong> (Copyright Clariant. All rights reserved.)<br />
<strong>Q3</strong>/10<br />
+8%<br />
Total sales <strong>Q3</strong>/10: CHF 1 709 mn<br />
incl. China<br />
105 / +5%<br />
+6%<br />
+9%<br />
incl. Brazil<br />
149 / 0%<br />
+11%<br />
Sales growth in local currencies<br />
<strong>Q3</strong>/09<br />
–14%<br />
Financial results third quarter<br />
incl. Germany<br />
223 / +13%<br />
Asia/<br />
Pacific<br />
383 Europe, Middle<br />
Latin<br />
America<br />
308<br />
North<br />
America<br />
216<br />
East & Africa<br />
802<br />
+9%<br />
Middle East & Africa<br />
135 / +9%<br />
Slide 6 / 55
Gross margin management successful<br />
Gross margin significantly higher versus year-ago<br />
period<br />
Gross margin remained close to first half-year<br />
level despite seasonally higher idle facility costs<br />
Sales price increases of 1% fully offset rising raw<br />
material costs of less than 2% sequentially<br />
9M <strong>2010</strong> / <strong>Q3</strong> <strong>2010</strong>, <strong>Analyst</strong>s <strong>Presentation</strong>, 3 November <strong>2010</strong> (Copyright Clariant. All rights reserved.)<br />
<strong>Q3</strong>/10 <strong>Q3</strong>/09*<br />
Gross margin 27.9% 25.3%<br />
* restated gross margin includes freight costs as of 1 January <strong>2010</strong> / reported gross margin in <strong>Q3</strong> 2009 was 30.1%<br />
Financial results third quarter<br />
sales price increases<br />
RM cost increases (sales-weighted)<br />
2008 2009 <strong>2010</strong><br />
Slide 7 / 55
Operating margin before exceptionals<br />
rises on lower SG&A costs<br />
EBIT before exceptionals in CHF mn 182 107<br />
EBIT margin before exceptionals 10.6% 6.3%<br />
Operating income before exceptionals items up 70% compared to the same quarter<br />
of the previous year<br />
Operating income before exceptionals margin at the level of H1 <strong>2010</strong> despite the<br />
normal seasonal pattern in demand and seasonally higher idle facility costs<br />
SG&A costs lower in absolute numbers due to restructuring benefits and a favorable<br />
FX impact<br />
SG&A costs in percent of sales down to 15.6% in <strong>Q3</strong> <strong>2010</strong> from 17.3% in <strong>Q3</strong> 2009<br />
9M <strong>2010</strong> / <strong>Q3</strong> <strong>2010</strong>, <strong>Analyst</strong>s <strong>Presentation</strong>, 3 November <strong>2010</strong> (Copyright Clariant. All rights reserved.)<br />
<strong>Q3</strong>/10<br />
<strong>Q3</strong>/09<br />
Financial results third quarter<br />
Slide 8 / 55
Solid cash flow generation driven by<br />
operating result<br />
Operating cash flow in CHF mn<br />
9M <strong>2010</strong> / <strong>Q3</strong> <strong>2010</strong>, <strong>Analyst</strong>s <strong>Presentation</strong>, 3 November <strong>2010</strong> (Copyright Clariant. All rights reserved.)<br />
<strong>Q3</strong>/10<br />
Cash flow before changes in working capital rose to CHF 116 million in <strong>Q3</strong> <strong>2010</strong><br />
compared to CHF 78 million in <strong>Q3</strong> 2009 as operating income improved<br />
Cash flow also driven by lower impact from inventories build-up compared to H1 <strong>2010</strong><br />
and continuation of strict net working capital management<br />
NWC in % of sales down to 19.7% as of end <strong>Q3</strong> <strong>2010</strong> from 23.2% as of <strong>Q3</strong> 2009<br />
Restructuring and impairment costs of CHF 45 million, cash-out CHF 37 million<br />
Ramp-up of capex to CHF 55 million vs. CHF 26 million in the year-ago period, driven<br />
by investments in China and relocation of production within the context of GANO<br />
173<br />
<strong>Q3</strong>/09<br />
193<br />
Financial results third quarter<br />
Slide 9 / 55
Financial result – net debt further reduced<br />
Financial result in CHF mn<br />
9M <strong>2010</strong> / <strong>Q3</strong> <strong>2010</strong>, <strong>Analyst</strong>s <strong>Presentation</strong>, 3 November <strong>2010</strong> (Copyright Clariant. All rights reserved.)<br />
<strong>Q3</strong>/10<br />
Financial result nearly flat at CHF –27 million versus CHF –28 million in <strong>Q3</strong> 2009, as<br />
lower financial and interest expenses more than offset the negative currency result<br />
Slightly lower interest expenses of CHF –19 million vs. CHF –21 million in <strong>Q3</strong> 2009<br />
Cash and cash equivalents – including short-term deposits of CHF 643 million –<br />
improved to CHF 1 272 million from CHF 1 140 million at year-end 2009 and<br />
CHF 1 221 million at end Q2 <strong>2010</strong><br />
Net debt down to CHF 302 million from CHF 545 million at year-end 2009 and<br />
CHF 379 million at the end of Q2 <strong>2010</strong><br />
Gearing improved to 16% from 29% at year-end 2009 and from 20% at end Q2 <strong>2010</strong><br />
–27<br />
<strong>Q3</strong>/09<br />
–28<br />
Financial results third quarter<br />
Slide 10 / 55
Agenda<br />
Highlights and financial results nine months<br />
Financial results third quarter<br />
Business review<br />
Outlook<br />
9M <strong>2010</strong> / <strong>Q3</strong> <strong>2010</strong>, <strong>Analyst</strong>s <strong>Presentation</strong>, 3 November <strong>2010</strong> (Copyright Clariant. All rights reserved.)<br />
Slide 11 / 55
Business unit sales, EBITDA and EBIT<br />
margins<br />
Third quarter <strong>2010</strong><br />
Business Unit / Reporting Segment:<br />
BU Industrial & Consumer Specialties<br />
BU Masterbatches<br />
BU Pigments<br />
BU Textile Chemicals<br />
BU Oil & Mining Services<br />
BU Leather Services<br />
Performance Chemicals*<br />
Group total<br />
Sales<br />
CHF mn<br />
341<br />
315<br />
301<br />
199<br />
142<br />
1 709<br />
9M <strong>2010</strong> / <strong>Q3</strong> <strong>2010</strong>, <strong>Analyst</strong>s <strong>Presentation</strong>, 3 November <strong>2010</strong> (Copyright Clariant. All rights reserved.)<br />
76<br />
335<br />
% CHF<br />
–2<br />
3<br />
6<br />
–1<br />
4<br />
1<br />
–2<br />
1<br />
Change<br />
% LC<br />
* includes the four business units Additives, Detergents & Intermediates, Emulsions, Paper Specialties<br />
** before exceptional items<br />
9<br />
11<br />
11<br />
3<br />
10<br />
5<br />
6<br />
8<br />
EBITDA**<br />
margin<br />
%<br />
15.8<br />
12.4<br />
21.9<br />
9.5<br />
11.3<br />
13.2<br />
13.1<br />
13.6<br />
Business review<br />
EBIT**<br />
margin<br />
%<br />
13.5<br />
10.2<br />
19.3<br />
6.0<br />
11.3<br />
11.8<br />
10.1<br />
10.6<br />
Slide 12 / 55
ICS with improved margins, favorable<br />
demand situation in Masterbatches<br />
Industrial & Consumer Specialties<br />
Sales in CHF mn<br />
<strong>Q3</strong><br />
<strong>2010</strong><br />
341<br />
<strong>Q3</strong><br />
<strong>2010</strong><br />
315<br />
Change<br />
(LC)<br />
Masterbatches<br />
Sales in CHF mn<br />
<strong>Q3</strong><br />
2009<br />
46<br />
+9% 348<br />
+93%<br />
13.5%<br />
Change<br />
(LC)<br />
<strong>Q3</strong><br />
2009<br />
Good demand across the whole portfolio<br />
32<br />
+11% 305<br />
+22%<br />
10.2%<br />
9M <strong>2010</strong> / <strong>Q3</strong> <strong>2010</strong>, <strong>Analyst</strong>s <strong>Presentation</strong>, 3 November <strong>2010</strong> (Copyright Clariant. All rights reserved.)<br />
Demand driven by the Industrial Applications segment:<br />
construction, paints & coatings, lubricants<br />
Agrochemicals continued to recover in-line with market,<br />
demand in Consumer Care segment remained high<br />
Demand from all end markets including automotive,<br />
packaging, and textiles remained at good levels<br />
Impact from replenishment of inventories in some end<br />
markets softened<br />
Further optimization of production network initiated<br />
Business review<br />
EBIT before exc. in CHF mn<br />
<strong>Q3</strong><br />
<strong>2010</strong><br />
<strong>Q3</strong><br />
<strong>2010</strong><br />
Change<br />
(LC)<br />
Change<br />
(LC)<br />
<strong>Q3</strong><br />
2009<br />
27<br />
7.8%<br />
EBIT before exc. in CHF mn<br />
<strong>Q3</strong><br />
2009<br />
28<br />
9.2%<br />
Slide 13 / 55
Pigments with excellent performance,<br />
Textile Chemicals with good growth in Asia<br />
Pigments<br />
Sales in CHF mn<br />
<strong>Q3</strong><br />
<strong>2010</strong><br />
301<br />
<strong>Q3</strong><br />
<strong>2010</strong><br />
199<br />
Change<br />
(LC)<br />
Textile Chemicals<br />
Sales in CHF mn<br />
<strong>Q3</strong><br />
2009<br />
58<br />
+11% 284<br />
+115%<br />
19.3%<br />
Change<br />
(LC)<br />
<strong>Q3</strong><br />
2009<br />
No sign of weakness in demand<br />
12<br />
+3% 200<br />
+47%<br />
6.0%<br />
9M <strong>2010</strong> / <strong>Q3</strong> <strong>2010</strong>, <strong>Analyst</strong>s <strong>Presentation</strong>, 3 November <strong>2010</strong> (Copyright Clariant. All rights reserved.)<br />
Coatings: demand from decorative segment and from<br />
automotive industry remained strong<br />
Printing: good demand for pigments used in packaging<br />
inks and in non-impact printing applications<br />
Demand from the textile industry remained solid<br />
Relocation of BU headquarters to Singapore mid 2011<br />
Transfer of production to Asia proceeding well:<br />
production started in other plants, inventories build-up<br />
to guarantee supply during transition phase<br />
Business review<br />
EBIT before exc. in CHF mn<br />
<strong>Q3</strong><br />
<strong>2010</strong><br />
<strong>Q3</strong><br />
<strong>2010</strong><br />
Change<br />
(LC)<br />
Change<br />
(LC)<br />
<strong>Q3</strong><br />
2009<br />
28<br />
9.9%<br />
EBIT before exc. in CHF mn<br />
<strong>Q3</strong><br />
2009<br />
8<br />
4.0%<br />
Slide 14 / 55
OMS strengthened market position, Leather<br />
Services benefited from luxury car boom<br />
Oil & Mining Services<br />
Sales in CHF mn<br />
<strong>Q3</strong><br />
<strong>2010</strong><br />
142<br />
<strong>Q3</strong><br />
<strong>2010</strong><br />
76<br />
Change<br />
(LC)<br />
Leather Services<br />
Sales in CHF mn<br />
<strong>Q3</strong><br />
2009<br />
16<br />
+10% 136<br />
–6%<br />
11.3%<br />
Change<br />
(LC)<br />
<strong>Q3</strong><br />
2009<br />
Strength in global oil drilling activity<br />
9<br />
+5% 75<br />
+56%<br />
11.8%<br />
9M <strong>2010</strong> / <strong>Q3</strong> <strong>2010</strong>, <strong>Analyst</strong>s <strong>Presentation</strong>, 3 November <strong>2010</strong> (Copyright Clariant. All rights reserved.)<br />
Mining Services: upward trend continuing, but at<br />
a slower pace than in H1 <strong>2010</strong><br />
BU further strengthened market positions in the Middle<br />
East and in Latin America<br />
Continuing good demand from the premium car<br />
segment<br />
More moderate growth in the upholstery and shoe<br />
segment<br />
Market share gains in Latin America<br />
Business review<br />
EBIT before exc. in CHF mn<br />
<strong>Q3</strong><br />
<strong>2010</strong><br />
<strong>Q3</strong><br />
<strong>2010</strong><br />
Change<br />
(LC)<br />
Change<br />
(LC)<br />
<strong>Q3</strong><br />
2009<br />
16<br />
11.8%<br />
EBIT before exc. in CHF mn<br />
<strong>Q3</strong><br />
2009<br />
6<br />
8.0%<br />
Slide 15 / 55
Performance Chemicals – increased sales<br />
prices offset higher raw material costs<br />
Performance Chemicals*<br />
Sales in CHF mn<br />
<strong>Q3</strong><br />
<strong>2010</strong><br />
335<br />
* the Performance Chemicals segment includes the business units:<br />
- Additives<br />
Change<br />
(LC)<br />
- Detergents & Intermediates<br />
- Emulsions<br />
- Paper Specialties<br />
<strong>Q3</strong><br />
2009<br />
34<br />
+6% 343 demand for paper chemicals and dyes stable<br />
+49%<br />
10.1%<br />
9M <strong>2010</strong> / <strong>Q3</strong> <strong>2010</strong>, <strong>Analyst</strong>s <strong>Presentation</strong>, 3 November <strong>2010</strong> (Copyright Clariant. All rights reserved.)<br />
Additives: continued good demand in all businesses<br />
D&I: good demand and high capacity utilization<br />
Emulsion: flat sales in lc versus year-ago quarter<br />
Business review<br />
EBIT before exc. in CHF mn<br />
<strong>Q3</strong><br />
<strong>2010</strong><br />
Change<br />
(LC)<br />
<strong>Q3</strong><br />
2009<br />
26<br />
7.6%<br />
Slide 16 / 55
Agenda<br />
Highlights and financial results nine months<br />
Financial results third quarter<br />
Business review<br />
Outlook<br />
9M <strong>2010</strong> / <strong>Q3</strong> <strong>2010</strong>, <strong>Analyst</strong>s <strong>Presentation</strong>, 3 November <strong>2010</strong> (Copyright Clariant. All rights reserved.)<br />
Slide 17 / 55
Our roadmap – restructuring program<br />
completed in <strong>2010</strong>, ready to shift our focus<br />
Timeline<br />
Focus<br />
Actions<br />
< 2009 > <strong>2010</strong><br />
Restructuring<br />
Project Clariant<br />
Cash generation<br />
Cost cutting<br />
Complexity<br />
reduction<br />
9M <strong>2010</strong> / <strong>Q3</strong> <strong>2010</strong>, <strong>Analyst</strong>s <strong>Presentation</strong>, 3 November <strong>2010</strong> (Copyright Clariant. All rights reserved.)<br />
Continuous improvement<br />
Clariant Excellence<br />
People Excellence<br />
Operational Excellence<br />
Commercial Excellence<br />
Profitable growth<br />
Growth & Opportunities<br />
Innovation Excellence<br />
Portfolio management<br />
Outlook<br />
Slide 18 / 55
Making progress to achieve our full-year<br />
<strong>2010</strong> targets<br />
11%<br />
10%<br />
9%<br />
8%<br />
7%<br />
6%<br />
5%<br />
4%<br />
Operating margin<br />
before exceptionals<br />
6.3%<br />
10.6%<br />
<strong>Q3</strong> 2009 <strong>Q3</strong> <strong>2010</strong><br />
EBIT before exceptional<br />
items above 9%<br />
18.0%<br />
17.5%<br />
17.0%<br />
16.5%<br />
16.0%<br />
15.5%<br />
15.0%<br />
9M <strong>2010</strong> / <strong>Q3</strong> <strong>2010</strong>, <strong>Analyst</strong>s <strong>Presentation</strong>, 3 November <strong>2010</strong> (Copyright Clariant. All rights reserved.)<br />
SG&A in % of sales<br />
17.3%<br />
15.6%<br />
<strong>Q3</strong> 2009 <strong>Q3</strong> <strong>2010</strong><br />
SG&A costs in-line with<br />
peer group companies<br />
24%<br />
23%<br />
22%<br />
21%<br />
20%<br />
19%<br />
18%<br />
Outlook<br />
NWC in % of sales<br />
23.2%<br />
19.7%<br />
<strong>Q3</strong> 2009 <strong>Q3</strong> <strong>2010</strong><br />
Net working capital down<br />
to 19.7%, FY target of 20%<br />
Slide 19 / 55
GANO project finalized – execution<br />
until 2013<br />
Business Unit<br />
Industrial & Consumer<br />
Specialties<br />
Masterbatches<br />
Paper Specialties<br />
Pigments<br />
Textile Chemicals<br />
FTE reduction<br />
9M <strong>2010</strong> / <strong>Q3</strong> <strong>2010</strong>, <strong>Analyst</strong>s <strong>Presentation</strong>, 3 November <strong>2010</strong> (Copyright Clariant. All rights reserved.)<br />
Pontypridd (UK)<br />
CIVAC (MX)<br />
Muttenz (CH)<br />
Muttenz (CH)<br />
approx. 1 100 – 1 200<br />
Estimated GANO-related impact on P&L and Cash-flow statement <strong>2010</strong>-2013:<br />
P&L effect (Restr. & Imp.)<br />
Cash–out (excl. capex)<br />
Site closure<br />
Plant / production line closure<br />
Lachine (CA)<br />
Milford (US)<br />
Guatemala City<br />
site consolidation<br />
Resende (BR)<br />
Thane (IN)<br />
Onsan (KR)<br />
<strong>2010</strong> – 2013<br />
Gendorf (DE)<br />
Sefakoy (TR)<br />
Delta (CA)<br />
McHenry (US)<br />
Huningue (FR)<br />
Hoechst (DE)<br />
Tianjin (CN)<br />
Huningue (FR)<br />
Roha (IN)<br />
Shizuoka (JP)<br />
2009/10: ~ CHF 290 mn 2011–13: < CHF 100 mn<br />
2009/10: ~ CHF 50 mn 2011–13: ~ CHF 180 mn<br />
→ Total net annual savings realized after 2013: ≥ CHF 100 million<br />
→ Nanterre (FR): move of France headquarters to Lamotte (FR)<br />
Outlook<br />
Reinach (CH)<br />
Reinach (CH)<br />
Slide 20 / 55
Outlook – business conditions for the<br />
fourth quarter<br />
Environment<br />
For the remainder of the year, Clariant expects stable trading conditions<br />
Clariant expects a return to normal seasonality, with a traditionally weaker<br />
fourth quarter<br />
Raw material costs are expected to rise further but at a slower pace than in<br />
the first nine months of the year<br />
9M <strong>2010</strong> / <strong>Q3</strong> <strong>2010</strong>, <strong>Analyst</strong>s <strong>Presentation</strong>, 3 November <strong>2010</strong> (Copyright Clariant. All rights reserved.)<br />
Outlook<br />
Slide 21 / 55
Outlook – Clariant<br />
Ongoing restructuring program will be finalized by the end of <strong>2010</strong>, company will<br />
then be managed for profitable growth as of 2011<br />
Some of the measures – in particular related to the GANO activities – will not be<br />
completely implemented before 2013<br />
<strong>2010</strong> guidance:<br />
High single-digit sales growth in local currency compared to 2009<br />
Operating income margin before exceptional items above 9%, raised from above 8%<br />
Operating cash flow will remain strong<br />
Return on invested capital (ROIC) above industry average by the end of <strong>2010</strong><br />
9M <strong>2010</strong> / <strong>Q3</strong> <strong>2010</strong>, <strong>Analyst</strong>s <strong>Presentation</strong>, 3 November <strong>2010</strong> (Copyright Clariant. All rights reserved.)<br />
Outlook<br />
Slide 22 / 55
Calendar of upcoming corporate events<br />
16 February 2011 Full-year Results <strong>2010</strong><br />
31 March 2011 Annual General Meeting, Basel<br />
02 May 2011 First Quarter Results 2011<br />
27 July 2011 Second Quarter Results 2011<br />
31 October 2011 Third Quarter Results 2011<br />
9M <strong>2010</strong> / <strong>Q3</strong> <strong>2010</strong>, <strong>Analyst</strong>s <strong>Presentation</strong>, 3 November <strong>2010</strong> (Copyright Clariant. All rights reserved.)<br />
Slide 23 / 55
IR contacts<br />
Dr. Ulrich Steiner<br />
Head Investor Relations<br />
Phone +41 (0) 61 469 67 45<br />
Mobile +41 (0) 79 297 27 07<br />
email ulrich.steiner@clariant.com<br />
Dr. Siegfried Schwirzer<br />
Investor Relations Officer<br />
Phone +41 (0) 61 469 67 49<br />
Mobile +41 (0) 79 718 45 98<br />
email siegfried.schwirzer@clariant.com<br />
Edith Schwab<br />
Phone +41 (0) 61 469 67 48<br />
Fax +41 (0) 61 469 67 67<br />
email edith.schwab@clariant.com<br />
Mirjam Grieder<br />
Phone +41 (0) 61 469 67 66<br />
Fax +41 (0) 61 469 67 67<br />
email mirjam.grieder@clariant.com<br />
Clariant International Ltd Hardstrasse 61 4133 Pratteln Switzerland investor-relations@clariant.com<br />
9M <strong>2010</strong> / <strong>Q3</strong> <strong>2010</strong>, <strong>Analyst</strong>s <strong>Presentation</strong>, 3 November <strong>2010</strong> (Copyright Clariant. All rights reserved.)<br />
Slide 24 / 55
Backup Slides –<br />
Nine Months / Third Quarter <strong>2010</strong> Results<br />
9M <strong>2010</strong> / <strong>Q3</strong> <strong>2010</strong>, <strong>Analyst</strong>s <strong>Presentation</strong>, 3 November <strong>2010</strong> (Copyright Clariant. All rights reserved.)<br />
Slide 25 / 55
Clariant’s products and services are<br />
delivered through 10 Business Units (1)<br />
Additives<br />
A leading provider of<br />
flame retardants,<br />
waxes and polymer<br />
additives<br />
for effects in plastics,<br />
coatings and other<br />
applications.<br />
Detergents &<br />
Intermediates<br />
A leading supplier of<br />
key raw materials and<br />
intermediates to the<br />
detergents, agro and<br />
pharmaceutical<br />
industries.<br />
Emulsions<br />
9M <strong>2010</strong> / <strong>Q3</strong> <strong>2010</strong>, <strong>Analyst</strong>s <strong>Presentation</strong>, 3 November <strong>2010</strong> (Copyright Clariant. All rights reserved.)<br />
A supplier of waterbased<br />
emulsions/polymer<br />
dispersions for paints,<br />
coatings, adhesives,<br />
construction, sealants<br />
and for the textile,<br />
leather and paper<br />
industries.<br />
Industrial &<br />
Consumer Specialties<br />
A leading provider of<br />
specialty chemicals and<br />
application solutions<br />
for the consumer care<br />
and industrial markets.<br />
Backup slides<br />
Leather Services<br />
A leading supplier of<br />
chemicals and services<br />
to the leather industry.<br />
Slide 26 / 55
Clariant’s products and services are<br />
delivered through 10 Business Units (2)<br />
Masterbatches<br />
A leader in coloration<br />
and functionality of<br />
plastics, supplying the<br />
packaging, consumer<br />
goods, medical, textile<br />
and automotive<br />
sectors.<br />
Oil & Mining<br />
Services<br />
A leading provider of<br />
products and services<br />
to the oil, refinery and<br />
mining industries.<br />
9M <strong>2010</strong> / <strong>Q3</strong> <strong>2010</strong>, <strong>Analyst</strong>s <strong>Presentation</strong>, 3 November <strong>2010</strong> (Copyright Clariant. All rights reserved.)<br />
Paper Specialties<br />
A leading provider of<br />
optical brighteners,<br />
colorants and<br />
functional chemicals<br />
for paper and<br />
packaging applications.<br />
Pigments<br />
A leading global<br />
provider of organic<br />
pigments and dyes for<br />
coatings,paints,<br />
printing, plastics and<br />
special applications.<br />
Backup slides<br />
Textile Chemicals<br />
A leading producer of<br />
dyes and chemicals for<br />
the textile industry<br />
including apparel,<br />
upholstery, fabrics and<br />
carpets.<br />
Slide 27 / 55
Peer group ROIC<br />
Measuring performance<br />
based on relative ROIC*<br />
Ems-Chemie<br />
Lubrizol<br />
Croda<br />
PolyOne<br />
Rhodia<br />
Nalco<br />
BASF<br />
Akzo Nobel<br />
Albemarle<br />
Evonik<br />
Kemira<br />
CLARIANT<br />
Dow Chemical<br />
DSM<br />
Lanxess<br />
Celanese<br />
Rockwood<br />
Solvay<br />
Cytec<br />
Wacker<br />
Huntsman<br />
Arkema<br />
Mitsubishi Chemical<br />
0.1<br />
1.0<br />
0.9<br />
2.1<br />
2.1<br />
2.6<br />
* source: calculated from annual reports<br />
9M <strong>2010</strong> / <strong>Q3</strong> <strong>2010</strong>, <strong>Analyst</strong>s <strong>Presentation</strong>, 3 November <strong>2010</strong> (Copyright Clariant. All rights reserved.)<br />
3.7<br />
4.2<br />
4.1<br />
2009 average<br />
6.6%<br />
5.0<br />
5.7<br />
5.5<br />
5.8<br />
6.2<br />
7.3<br />
7.1<br />
7.6<br />
7.5<br />
9.6<br />
11.5<br />
0 5 10 15 20 25<br />
12.9<br />
18.5<br />
Backup slides<br />
20.8<br />
Slide 28 / 55
Restated group gross profit and<br />
SG&A 2009<br />
Starting 1 January <strong>2010</strong>, Clariant reports freight costs as included in the costs of goods<br />
sold line (before: in selling, general & administrative costs)<br />
This change affects line items as follows:<br />
Lower gross profit and gross profit margin<br />
Lower absolute selling, general & administrative costs and lower SG&A costs in<br />
percentage of sales<br />
All other figures remain unchanged.<br />
9M <strong>2010</strong> / <strong>Q3</strong> <strong>2010</strong>, <strong>Analyst</strong>s <strong>Presentation</strong>, 3 November <strong>2010</strong> (Copyright Clariant. All rights reserved.)<br />
Backup slides<br />
Slide 29 / 55
Restated group gross profit 2009<br />
Group gross profit margin 2009 & <strong>2010</strong> – in CHF mn<br />
Gross profit reported<br />
- margin<br />
Gross profit restated<br />
- margin<br />
Quarterly figures<br />
600<br />
400<br />
200<br />
0<br />
379<br />
303<br />
471<br />
399<br />
Q1<br />
379<br />
23.6%<br />
303<br />
18.9%<br />
Q2<br />
471<br />
29.3%<br />
399<br />
24.8%<br />
509 506<br />
428 427<br />
9M <strong>2010</strong> / <strong>Q3</strong> <strong>2010</strong>, <strong>Analyst</strong>s <strong>Presentation</strong>, 3 November <strong>2010</strong> (Copyright Clariant. All rights reserved.)<br />
<strong>Q3</strong><br />
509<br />
30.1%<br />
428<br />
25.3%<br />
Q4<br />
506<br />
29.6%<br />
427<br />
25.0%<br />
FY/09<br />
1 865<br />
28.2%<br />
1 557<br />
23.5%<br />
Q1/10<br />
–<br />
–<br />
521<br />
28.7%<br />
Q1 2009 Q2 2009 <strong>Q3</strong> 2009 Q4 2009 Q1 <strong>2010</strong> Q2 <strong>2010</strong> <strong>Q3</strong> <strong>2010</strong><br />
reported restated margin reported / in % of sales reported margin restated / in % of sales restated<br />
n/a<br />
521<br />
n/a<br />
547<br />
Backup slides<br />
n/a<br />
477<br />
Q2/10<br />
–<br />
–<br />
547<br />
28.9%<br />
<strong>Q3</strong>/10<br />
–<br />
–<br />
477<br />
27.9%<br />
Slide 30 / 55
Restated group SG&A 2009<br />
Group SG&A costs 2009 & <strong>2010</strong> – in CHF mn<br />
SG&A costs reported<br />
- in % of sales<br />
SG&A costs restated<br />
- in % of sales<br />
Quarterly figures<br />
400<br />
300<br />
200<br />
100<br />
0<br />
reported restated<br />
Q1<br />
357<br />
22.2<br />
281<br />
17.5<br />
Q2<br />
371<br />
23.1<br />
299<br />
18.6<br />
357 371 373 369<br />
281<br />
9M <strong>2010</strong> / <strong>Q3</strong> <strong>2010</strong>, <strong>Analyst</strong>s <strong>Presentation</strong>, 3 November <strong>2010</strong> (Copyright Clariant. All rights reserved.)<br />
<strong>Q3</strong><br />
373<br />
22.0<br />
292<br />
17.3<br />
369<br />
21.6<br />
290<br />
17.0<br />
FY/09<br />
1 470<br />
22.2<br />
1 162<br />
17.6<br />
299 292 290 307 309<br />
Q1/10<br />
Q1 2009 Q2 2009 <strong>Q3</strong> 2009 Q4 2009 Q1 <strong>2010</strong> Q2 <strong>2010</strong> <strong>Q3</strong> <strong>2010</strong><br />
–<br />
–<br />
307<br />
16.9<br />
margin reported / in % of sales reported margin restated / in % of sales restated<br />
n/a<br />
Q4<br />
n/a<br />
Backup slides<br />
n/a<br />
267<br />
Q2/10<br />
–<br />
–<br />
309<br />
16.3<br />
<strong>Q3</strong>/10<br />
–<br />
–<br />
267<br />
15.6<br />
Slide 31 / 55
Key financials – nine months<br />
Nine months<br />
Sales<br />
Local currency growth (LC)<br />
- Organic growth rate*<br />
- Acquisitions/Divestments<br />
Currencies<br />
Gross profit**<br />
EBITDA before exceptionals<br />
EBITDA<br />
Operating income before exceptionals<br />
Operating income<br />
Net income / loss<br />
Operating cash flow<br />
9M <strong>2010</strong> / <strong>Q3</strong> <strong>2010</strong>, <strong>Analyst</strong>s <strong>Presentation</strong>, 3 November <strong>2010</strong> (Copyright Clariant. All rights reserved.)<br />
CHF mn<br />
5 420<br />
14%<br />
14%<br />
0%<br />
–3%<br />
1 545<br />
731<br />
541<br />
576<br />
335<br />
144<br />
365<br />
<strong>2010</strong><br />
% of sales<br />
100%<br />
28.5%<br />
13.5%<br />
10.0%<br />
10.6%<br />
6.2%<br />
2.7%<br />
CHF mn<br />
4 904<br />
1 130<br />
331<br />
–127<br />
533<br />
2009<br />
% of sales<br />
* organic growth: volume and price effects excluding the impact of changes in foreign currency exchange rates and acquisitions/divestments<br />
** gross profit includes freight costs as of first quarter <strong>2010</strong>. Reported gross profit in 9M 2009 was CHF 1 359 million, gross margin 27.7%<br />
206<br />
163<br />
3<br />
Backup slides<br />
100%<br />
23.1%<br />
6.7%<br />
4.2%<br />
3.3%<br />
0.1%<br />
2.6%<br />
Slide 32 / 55
Sales – nine months<br />
Sales growth in local currencies<br />
Sales mix:<br />
– Volume 14%<br />
– Price 0%<br />
– Acq./div. 0%<br />
– Currency –3%<br />
9M <strong>2010</strong> / <strong>Q3</strong> <strong>2010</strong>, <strong>Analyst</strong>s <strong>Presentation</strong>, 3 November <strong>2010</strong> (Copyright Clariant. All rights reserved.)<br />
9M/10<br />
+14%<br />
Total sales 9M/10: CHF 5 420 mn<br />
+17%<br />
+12%<br />
incl. Brazil<br />
446 / +3%<br />
incl. China<br />
321 / +28%<br />
Sales growth in local currencies<br />
Backup slides<br />
9M/09<br />
–18%<br />
incl. Germany<br />
738 / +22%<br />
Asia/<br />
Pacific<br />
1 154 Europe, Middle<br />
Latin<br />
America<br />
920<br />
North<br />
America<br />
669<br />
+14%<br />
East & Africa<br />
2 677<br />
+15%<br />
Middle East & Africa<br />
426 / +15%<br />
Slide 33 / 55
Business unit sales, EBITDA and EBIT<br />
margins – nine months<br />
Nine months <strong>2010</strong><br />
Business Unit / Reporting Segment:<br />
BU Industrial & Consumer Specialties<br />
BU Masterbatches<br />
BU Pigments<br />
BU Textile Chemicals<br />
BU Oil & Mining Services<br />
BU Leather Services<br />
Performance Chemicals*<br />
Group total<br />
Sales<br />
CHF mn<br />
1 128<br />
981<br />
907<br />
634<br />
438<br />
251<br />
1 081<br />
5 420<br />
9M <strong>2010</strong> / <strong>Q3</strong> <strong>2010</strong>, <strong>Analyst</strong>s <strong>Presentation</strong>, 3 November <strong>2010</strong> (Copyright Clariant. All rights reserved.)<br />
% CHF<br />
7<br />
17<br />
14<br />
10<br />
4<br />
27<br />
7<br />
11<br />
Change<br />
% LC<br />
* includes the four business units Additives, Detergents & Intermediates, Emulsions, Paper Specialties<br />
** before exceptional items<br />
14<br />
21<br />
17<br />
11<br />
5<br />
30<br />
11<br />
14<br />
EBITDA**<br />
margin<br />
16.5<br />
12.7<br />
21.7<br />
9.6<br />
12.1<br />
13.5<br />
14.8<br />
13.5<br />
Backup slides<br />
%<br />
EBIT**<br />
margin<br />
%<br />
14.0<br />
10.4<br />
18.9<br />
6.8<br />
11.4<br />
12.0<br />
11.9<br />
10.6<br />
Slide 34 / 55
Cash flow – nine months<br />
Nine months<br />
Net income / loss<br />
Depreciation, amortization and impairment<br />
Other<br />
Payments for restructuring<br />
Operating cash flow before working capital changes<br />
Changes in working capital and provisions<br />
Operating cash flow<br />
Cash flow from investing activities<br />
thereof: property, plant & equipment<br />
thereof: changes in current financial assets<br />
thereof: acquisitions, disposals and other<br />
Cash flow before financing<br />
9M <strong>2010</strong> / <strong>Q3</strong> <strong>2010</strong>, <strong>Analyst</strong>s <strong>Presentation</strong>, 3 November <strong>2010</strong> (Copyright Clariant. All rights reserved.)<br />
<strong>2010</strong><br />
CHF mn<br />
144<br />
206<br />
22<br />
–106<br />
266<br />
99<br />
365<br />
–783<br />
–118<br />
–665<br />
0<br />
-418<br />
Backup slides<br />
2009<br />
CHF mn<br />
–127<br />
203<br />
53<br />
–131<br />
–2<br />
535<br />
533<br />
–75<br />
–96<br />
5<br />
16<br />
458<br />
Slide 35 / 55
Financial result – nine months<br />
Nine months<br />
Interest income<br />
Other financial income<br />
Total financial income<br />
Interest expenses<br />
Other financial expenses<br />
Currency result, net<br />
Total financial expenses<br />
Total financial result<br />
9M <strong>2010</strong> / <strong>Q3</strong> <strong>2010</strong>, <strong>Analyst</strong>s <strong>Presentation</strong>, 3 November <strong>2010</strong> (Copyright Clariant. All rights reserved.)<br />
<strong>2010</strong><br />
CHF mn<br />
6<br />
2<br />
8<br />
–56<br />
–14<br />
–50<br />
–120<br />
2009<br />
CHF mn<br />
5<br />
2<br />
7<br />
–61<br />
–11<br />
–18<br />
–90<br />
– 112 –83<br />
Backup slides<br />
Slide 36 / 55
Sales and EBITDA margins by business<br />
unit – nine months<br />
Nine months <strong>2010</strong><br />
Business Unit / Segment:<br />
BU Industrial & Consumer Specialties<br />
BU Masterbatches<br />
BU Pigments<br />
BU Textile Chemicals<br />
BU Oil & Mining Services<br />
BU Leather Services<br />
Performance Chemicals*<br />
Group total<br />
Sales in % of group<br />
Industrial &<br />
Consumer Specialties<br />
Performance<br />
Chemicals*<br />
20%<br />
Leather Services<br />
21% 18%<br />
4%<br />
8%<br />
12%<br />
Masterbatches<br />
17%<br />
Oil & Mining Services<br />
CHF mn<br />
1 128<br />
981<br />
907<br />
634<br />
438<br />
251<br />
1 081<br />
5 420<br />
Pigments<br />
Textile Chemicals<br />
9M <strong>2010</strong> / <strong>Q3</strong> <strong>2010</strong>, <strong>Analyst</strong>s <strong>Presentation</strong>, 3 November <strong>2010</strong> (Copyright Clariant. All rights reserved.)<br />
Sales<br />
% LC<br />
+14<br />
+21<br />
+17<br />
+11<br />
+5<br />
+30<br />
+11<br />
+14<br />
EBITDA**<br />
EBITDA**<br />
% of Group<br />
23<br />
15<br />
24<br />
7<br />
6<br />
4<br />
21<br />
100<br />
Industrial &<br />
Consumer Specialties<br />
Performance<br />
Chemicals*<br />
EBITDA margin**<br />
% <strong>2010</strong> % 2009<br />
16.5<br />
9.4<br />
12.7<br />
9.4<br />
21.7<br />
6.9<br />
9.6<br />
2.9<br />
12.1<br />
10.9<br />
13.5<br />
1.0<br />
14.8<br />
7.7<br />
13.5<br />
6.7<br />
* includes the four business units Additives, Detergents & Intermediates, Emulsions, Paper Specialties; ** before exceptional items<br />
21%<br />
23%<br />
4% 6%<br />
15%<br />
7%<br />
Leather Services<br />
Oil & Mining Services<br />
Backup slides<br />
24%<br />
Masterbatches<br />
Pigments<br />
Textile Chemicals<br />
Slide 37 / 55
Business Unit sales and EBIT before<br />
exceptional items – nine months (1)<br />
Industrial & Consumer Specialties Masterbatches<br />
Sales in CHF mn<br />
9M<br />
<strong>2010</strong><br />
1 128<br />
Pigments<br />
Change<br />
(LC)<br />
Sales in CHF mn<br />
9M<br />
<strong>2010</strong><br />
907<br />
9M<br />
2009<br />
EBIT before exc. in CHF mn<br />
9M<br />
<strong>2010</strong><br />
Change<br />
(LC)<br />
9M<br />
2009<br />
158<br />
69<br />
102<br />
+14% 1 052<br />
+148% 981 +21% 842<br />
14.0%<br />
6.6%<br />
10.4%<br />
+97%<br />
Change<br />
(LC)<br />
9M<br />
2009<br />
EBIT before exc. in CHF mn<br />
9M<br />
<strong>2010</strong><br />
Change<br />
(LC)<br />
171<br />
+17% 797<br />
+530%<br />
18.9%<br />
9M<br />
2009<br />
28<br />
3.5%<br />
9M <strong>2010</strong> / <strong>Q3</strong> <strong>2010</strong>, <strong>Analyst</strong>s <strong>Presentation</strong>, 3 November <strong>2010</strong> (Copyright Clariant. All rights reserved.)<br />
Sales in CHF mn<br />
9M<br />
<strong>2010</strong><br />
Change<br />
(LC)<br />
Textile Chemicals<br />
Sales in CHF mn<br />
9M<br />
<strong>2010</strong><br />
634<br />
Change<br />
(LC)<br />
9M<br />
2009<br />
9M<br />
2009<br />
EBIT before exc. in CHF mn<br />
9M<br />
<strong>2010</strong><br />
Backup slides<br />
Change<br />
(LC)<br />
43<br />
+11% 578<br />
–<br />
6.8%<br />
9M<br />
2009<br />
54<br />
6.4%<br />
EBIT before exc. in CHF mn<br />
9M<br />
<strong>2010</strong><br />
Change<br />
(LC)<br />
9M<br />
2009<br />
0<br />
0.0%<br />
Slide 38 / 55
Business Unit sales and EBIT before<br />
exceptional items – nine months (2)<br />
Oil & Mining Services Leather Services<br />
Sales in CHF mn<br />
9M<br />
<strong>2010</strong><br />
438<br />
Change<br />
(LC)<br />
9M<br />
2009<br />
EBIT before exc. in CHF mn<br />
9M<br />
<strong>2010</strong><br />
Change<br />
(LC)<br />
9M<br />
2009<br />
50<br />
43<br />
30<br />
+5% 423<br />
+17% 251 +30% 197<br />
11.4%<br />
10.2%<br />
12.0%<br />
–<br />
Performance Chemicals*<br />
Sales in CHF mn<br />
9M<br />
<strong>2010</strong><br />
1 081<br />
Change<br />
(LC)<br />
9M<br />
2009<br />
EBIT before exc. in CHF mn<br />
9M<br />
<strong>2010</strong><br />
Change<br />
(LC)<br />
129<br />
+11% 1 015<br />
+227%<br />
11.9%<br />
9M<br />
2009<br />
42<br />
4.1%<br />
9M <strong>2010</strong> / <strong>Q3</strong> <strong>2010</strong>, <strong>Analyst</strong>s <strong>Presentation</strong>, 3 November <strong>2010</strong> (Copyright Clariant. All rights reserved.)<br />
Sales in CHF mn<br />
9M<br />
<strong>2010</strong><br />
Change<br />
(LC)<br />
9M<br />
2009<br />
EBIT before exc. in CHF mn<br />
9M<br />
<strong>2010</strong><br />
Backup slides<br />
Change<br />
(LC)<br />
9M<br />
2009<br />
–2<br />
–1.0%<br />
* the Performance Chemicals segment includes the business units:<br />
- Additives<br />
- Detergents & Intermediates<br />
- Emulsions<br />
- Paper Specialties<br />
Slide 39 / 55
Key financials – third quarter<br />
Third quarter<br />
Sales<br />
Local currency growth (LC)<br />
Net income<br />
- Organic growth rate*<br />
- Acquisitions/Divestments<br />
Currencies<br />
Gross profit**<br />
EBITDA before exceptionals<br />
EBITDA<br />
Operating income before exceptionals<br />
Operating income<br />
Operating cash flow<br />
9M <strong>2010</strong> / <strong>Q3</strong> <strong>2010</strong>, <strong>Analyst</strong>s <strong>Presentation</strong>, 3 November <strong>2010</strong> (Copyright Clariant. All rights reserved.)<br />
CHF mn<br />
1 709<br />
8%<br />
8%<br />
0%<br />
–7%<br />
477<br />
232<br />
206<br />
182<br />
137<br />
109<br />
173<br />
<strong>2010</strong><br />
% of sales<br />
100%<br />
27.9%<br />
13.6%<br />
12.1%<br />
10.6%<br />
8.0%<br />
6.4%<br />
CHF mn<br />
1 691<br />
428<br />
163<br />
25<br />
193<br />
2009<br />
% of sales<br />
* organic growth: volume and price effects excluding the impact of changes in foreign currency exchange rates and acquisitions/divestments<br />
** gross profit incl. freight costs as of first quarter <strong>2010</strong>. Reported gross profit in third quarter 2009 was CHF 509 million, gross margin 30.1%<br />
132<br />
107<br />
71<br />
Backup slides<br />
100%<br />
25.3%<br />
9.6%<br />
7.8%<br />
6.3%<br />
4.2%<br />
1.5%<br />
Slide 40 / 55
Cash flow – third quarter<br />
Third quarter<br />
Net income<br />
Depreciation, amortization and impairment<br />
Other<br />
Payments for restructuring<br />
Operating cash flow before working capital changes<br />
Changes in working capital and provisions<br />
Operating cash flow<br />
Cash flow from investing activities<br />
thereof: property, plant & equipment<br />
thereof: changes in current financial assets<br />
thereof: acquisitions, disposals and other<br />
Cash flow before financing<br />
9M <strong>2010</strong> / <strong>Q3</strong> <strong>2010</strong>, <strong>Analyst</strong>s <strong>Presentation</strong>, 3 November <strong>2010</strong> (Copyright Clariant. All rights reserved.)<br />
<strong>2010</strong><br />
CHF mn<br />
109<br />
69<br />
–25<br />
–37<br />
116<br />
57<br />
173<br />
–339<br />
–55<br />
–282<br />
–2<br />
–166<br />
Backup slides<br />
2009<br />
CHF mn<br />
25<br />
61<br />
37<br />
–45<br />
78<br />
115<br />
193<br />
8<br />
–26<br />
2<br />
32<br />
201<br />
Slide 41 / 55
Financial result – third quarter<br />
Third quarter<br />
Interest income<br />
Other financial income<br />
Total financial income<br />
Interest expenses<br />
Other financial expenses<br />
Currency result, net<br />
Total financial expenses<br />
Total financial result<br />
9M <strong>2010</strong> / <strong>Q3</strong> <strong>2010</strong>, <strong>Analyst</strong>s <strong>Presentation</strong>, 3 November <strong>2010</strong> (Copyright Clariant. All rights reserved.)<br />
<strong>2010</strong><br />
CHF mn<br />
2<br />
0<br />
2<br />
–19<br />
–1<br />
–9<br />
–29<br />
2009<br />
CHF mn<br />
1<br />
1<br />
2<br />
–21<br />
–5<br />
–4<br />
–30<br />
–27 –28<br />
Backup slides<br />
Slide 42 / 55
Sales and EBITDA margins by business<br />
unit – third quarter<br />
Third quarter <strong>2010</strong><br />
Business Unit / Segment:<br />
BU Industrial & Consumer Specialties<br />
BU Masterbatches<br />
BU Pigments<br />
BU Textile Chemicals<br />
BU Oil & Mining Services<br />
BU Leather Services<br />
Performance Chemicals*<br />
Group total<br />
Sales in % of group Masterbatches<br />
Industrial &<br />
Consumer Specialties<br />
Performance<br />
Chemicals*<br />
20%<br />
20%<br />
Leather Services<br />
4%<br />
8%<br />
18%<br />
12%<br />
18%<br />
Oil & Mining Services<br />
CHF mn<br />
341<br />
315<br />
301<br />
199<br />
142<br />
76<br />
335<br />
1 709<br />
Pigments<br />
Textile Chemicals<br />
9M <strong>2010</strong> / <strong>Q3</strong> <strong>2010</strong>, <strong>Analyst</strong>s <strong>Presentation</strong>, 3 November <strong>2010</strong> (Copyright Clariant. All rights reserved.)<br />
Sales<br />
% LC<br />
+9<br />
+11<br />
+11<br />
+3<br />
+10<br />
+5<br />
+6<br />
+8<br />
EBITDA**<br />
EBITDA**<br />
% of Group<br />
22<br />
16<br />
26<br />
8<br />
6<br />
4<br />
18<br />
100<br />
Industrial &<br />
Consumer Specialties<br />
Performance<br />
Chemicals*<br />
Leather Services<br />
EBITDA margin**<br />
% <strong>2010</strong> % 2009<br />
15.8<br />
10.6<br />
12.4<br />
11.8<br />
21.9<br />
13.0<br />
9.5<br />
7.0<br />
11.3<br />
12.5<br />
13.2<br />
9.3<br />
13.1<br />
11.1<br />
13.6<br />
9.6<br />
Oil & Mining Services<br />
* includes the four business units Additives, Detergents & Intermediates, Emulsions, Paper Specialties; **before exceptional items<br />
22%<br />
18%<br />
16%<br />
4% 6%<br />
Backup slides<br />
8%<br />
Masterbatches<br />
26%<br />
Pigments<br />
Textile Chemicals<br />
Slide 43 / 55
Quarterly Business Unit sales and EBIT<br />
before exceptional items 2009/<strong>2010</strong> (1)<br />
Industrial & Consumer Specialties<br />
500<br />
400<br />
300<br />
200<br />
100<br />
0<br />
Sales<br />
380<br />
- margin<br />
EBIT bef. exceptionals<br />
- margin<br />
24<br />
324<br />
18<br />
EBITDA bef. exceptionals<br />
348<br />
Quarterly figures* 2009 & <strong>2010</strong> – in CHF mn<br />
27<br />
373<br />
9M <strong>2010</strong> / <strong>Q3</strong> <strong>2010</strong>, <strong>Analyst</strong>s <strong>Presentation</strong>, 3 November <strong>2010</strong> (Copyright Clariant. All rights reserved.)<br />
46<br />
Q1<br />
380<br />
34<br />
8.9%<br />
24<br />
6.3%<br />
420<br />
67<br />
Q2<br />
324<br />
28<br />
8.6%<br />
18<br />
5.6%<br />
367<br />
<strong>Q3</strong><br />
348<br />
37<br />
10.6%<br />
27<br />
7.8%<br />
341<br />
45 46<br />
Q1 2009 Q2 2009 <strong>Q3</strong> 2009 Q4 2009 Q1 <strong>2010</strong> Q2 <strong>2010</strong> <strong>Q3</strong> <strong>2010</strong><br />
Q4<br />
373<br />
57<br />
15.3%<br />
46<br />
100<br />
80<br />
60<br />
40<br />
20<br />
0<br />
12.3%<br />
FY/09<br />
1 425<br />
156<br />
10.9%<br />
115<br />
8.1%<br />
Sales EBIT bef.<br />
exceptionals<br />
Q1/10<br />
420<br />
76<br />
18.1%<br />
67<br />
16.0%<br />
Backup slides<br />
Q2/10<br />
367<br />
56<br />
15.3%<br />
45<br />
12.3%<br />
EBIT bef.<br />
exceptionals – margin<br />
<strong>Q3</strong>/10<br />
341<br />
54<br />
15.8%<br />
46<br />
13.5%<br />
* unaudited<br />
Slide 44 / 55
Quarterly Business Unit sales and EBIT<br />
before exceptional items 2009/<strong>2010</strong> (2)<br />
Masterbatches<br />
400<br />
300<br />
200<br />
100<br />
0<br />
Sales<br />
260<br />
- margin<br />
EBIT bef. exceptionals<br />
- margin<br />
6<br />
277<br />
20<br />
EBITDA bef. exceptionals<br />
305<br />
Quarterly figures* 2009 & <strong>2010</strong> – in CHF mn<br />
28<br />
280<br />
9M <strong>2010</strong> / <strong>Q3</strong> <strong>2010</strong>, <strong>Analyst</strong>s <strong>Presentation</strong>, 3 November <strong>2010</strong> (Copyright Clariant. All rights reserved.)<br />
18<br />
Q1 2009 Q2 2009 <strong>Q3</strong> 2009 Q4 2009 Q1 <strong>2010</strong> Q2 <strong>2010</strong> <strong>Q3</strong> <strong>2010</strong><br />
Q1<br />
260<br />
15<br />
5.8%<br />
6<br />
2.3%<br />
321<br />
32<br />
Q2<br />
277<br />
28<br />
10.1%<br />
20<br />
7.2%<br />
345<br />
38<br />
<strong>Q3</strong><br />
305<br />
36<br />
11.8%<br />
28<br />
9.2%<br />
315<br />
32<br />
Q4<br />
280<br />
26<br />
9.3%<br />
18<br />
50<br />
40<br />
30<br />
20<br />
10<br />
0<br />
6.4%<br />
FY/09<br />
1 122<br />
105<br />
9.4%<br />
72<br />
6.4%<br />
Sales EBIT bef.<br />
exceptionals<br />
Q1/10<br />
321<br />
40<br />
12.5%<br />
32<br />
10.0%<br />
Backup slides<br />
Q2/10<br />
345<br />
46<br />
13.3%<br />
38<br />
11.0%<br />
EBIT bef.<br />
exceptionals – margin<br />
<strong>Q3</strong>/10<br />
315<br />
39<br />
12.4%<br />
32<br />
10.2%<br />
* unaudited<br />
Slide 45 / 55
Quarterly Business Unit sales and EBIT<br />
before exceptional items 2009/<strong>2010</strong> (3)<br />
Pigments<br />
400<br />
300<br />
200<br />
100<br />
0<br />
Sales<br />
240<br />
EBITDA bef. exceptionals<br />
- margin<br />
EBIT bef. exceptionals<br />
- margin<br />
273 284 275 281<br />
14<br />
Quarterly figures* 2009 & <strong>2010</strong> – in CHF mn<br />
28<br />
–14<br />
9M <strong>2010</strong> / <strong>Q3</strong> <strong>2010</strong>, <strong>Analyst</strong>s <strong>Presentation</strong>, 3 November <strong>2010</strong> (Copyright Clariant. All rights reserved.)<br />
20<br />
Q1 2009<br />
-14<br />
Q2 2009 <strong>Q3</strong> 2009 Q4 2009 Q1 <strong>2010</strong> Q2 <strong>2010</strong> <strong>Q3</strong> <strong>2010</strong><br />
Q1<br />
240<br />
–5<br />
–2.1%<br />
–5.8%<br />
45<br />
Q2<br />
273<br />
23<br />
8.4%<br />
14<br />
5.1%<br />
325<br />
68<br />
<strong>Q3</strong><br />
284<br />
37<br />
13.0%<br />
28<br />
9.9%<br />
301<br />
58<br />
Q4<br />
275<br />
28<br />
10.2%<br />
20<br />
80<br />
60<br />
40<br />
20<br />
0<br />
-20<br />
7.3%<br />
FY/09<br />
1 072<br />
83<br />
7.7%<br />
48<br />
4.5%<br />
Sales EBIT bef.<br />
exceptionals<br />
Q1/10<br />
281<br />
54<br />
19.2%<br />
45<br />
16.0%<br />
Backup slides<br />
Q2/10<br />
325<br />
77<br />
23.7%<br />
68<br />
20.9%<br />
EBIT bef.<br />
exceptionals – margin<br />
<strong>Q3</strong>/10<br />
301<br />
66<br />
21.9%<br />
58<br />
19.3%<br />
* unaudited<br />
Slide 46 / 55
Quarterly Business Unit sales and EBIT<br />
before exceptional items 2009/<strong>2010</strong> (4)<br />
Textile Chemicals<br />
250<br />
200<br />
150<br />
100<br />
50<br />
0<br />
Sales<br />
180<br />
- margin<br />
EBIT bef. exceptionals<br />
- margin<br />
-9<br />
EBITDA bef. exceptionals<br />
198 200 199 204<br />
1<br />
Quarterly figures* 2009 & <strong>2010</strong> – in CHF mn<br />
8<br />
Q1 2009 Q2 2009 <strong>Q3</strong> 2009 Q4 2009 Q1 <strong>2010</strong> Q2 <strong>2010</strong> <strong>Q3</strong> <strong>2010</strong><br />
9M <strong>2010</strong> / <strong>Q3</strong> <strong>2010</strong>, <strong>Analyst</strong>s <strong>Presentation</strong>, 3 November <strong>2010</strong> (Copyright Clariant. All rights reserved.)<br />
–3<br />
–9<br />
0<br />
Q1<br />
180<br />
–1.7%<br />
–5.0%<br />
9<br />
Q2<br />
198<br />
6<br />
3.0%<br />
1<br />
0.5%<br />
231<br />
22<br />
<strong>Q3</strong><br />
200<br />
14<br />
7.0%<br />
8<br />
4.0%<br />
199<br />
12<br />
Q4<br />
199<br />
6<br />
3.0%<br />
0<br />
30<br />
20<br />
10<br />
0<br />
-10<br />
0.0%<br />
FY/09<br />
777<br />
23<br />
3.0%<br />
0<br />
0.0%<br />
Sales EBIT bef.<br />
exceptionals<br />
Q1/10<br />
204<br />
15<br />
7.4%<br />
9<br />
4.4%<br />
Backup slides<br />
Q2/10<br />
231<br />
27<br />
11.7%<br />
22<br />
9.5%<br />
EBIT bef.<br />
exceptionals – margin<br />
<strong>Q3</strong>/10<br />
199<br />
19<br />
9.5%<br />
12<br />
6.0%<br />
* unaudited<br />
Slide 47 / 55
Quarterly Business Unit sales and EBIT<br />
before exceptional items 2009/<strong>2010</strong> (5)<br />
Oil & Mining Services<br />
160<br />
120<br />
80<br />
40<br />
0<br />
Sales<br />
156<br />
- margin<br />
EBIT bef. exceptionals<br />
- margin<br />
131<br />
EBITDA bef. exceptionals<br />
136<br />
17 16<br />
10<br />
Quarterly figures* 2009 & <strong>2010</strong> – in CHF mn<br />
155 148 148 142<br />
22 21<br />
Q1 2009 Q2 2009 <strong>Q3</strong> 2009 Q4 2009 Q1 <strong>2010</strong> Q2 <strong>2010</strong> <strong>Q3</strong> <strong>2010</strong><br />
9M <strong>2010</strong> / <strong>Q3</strong> <strong>2010</strong>, <strong>Analyst</strong>s <strong>Presentation</strong>, 3 November <strong>2010</strong> (Copyright Clariant. All rights reserved.)<br />
Q1<br />
156<br />
18<br />
11.5%<br />
17<br />
10.9%<br />
Q2<br />
131<br />
11<br />
8.4%<br />
10<br />
7.6%<br />
13<br />
<strong>Q3</strong><br />
136<br />
17<br />
12.5%<br />
16<br />
11.8%<br />
16<br />
Q4<br />
155<br />
24<br />
15.5%<br />
22<br />
30<br />
20<br />
10<br />
0<br />
14.2%<br />
FY/09<br />
578<br />
70<br />
12.1%<br />
65<br />
11.2%<br />
Sales EBIT bef.<br />
exceptionals<br />
Q1/10<br />
148<br />
22<br />
14.9%<br />
21<br />
14.2%<br />
Backup slides<br />
Q2/10<br />
148<br />
15<br />
10.1%<br />
13<br />
8.8%<br />
EBIT bef.<br />
exceptionals – margin<br />
<strong>Q3</strong>/10<br />
142<br />
16<br />
11.3%<br />
16<br />
11.3%<br />
* unaudited<br />
Slide 48 / 55
Quarterly Business Unit sales and EBIT<br />
before exceptional items 2009/<strong>2010</strong> (6)<br />
Leather Services<br />
100<br />
80<br />
60<br />
40<br />
20<br />
0<br />
Sales<br />
51<br />
- margin<br />
EBIT bef. exceptionals<br />
- margin<br />
-9<br />
71<br />
EBITDA bef. exceptionals<br />
1<br />
Quarterly figures* 2009 & <strong>2010</strong> – in CHF mn<br />
75<br />
6<br />
9M <strong>2010</strong> / <strong>Q3</strong> <strong>2010</strong>, <strong>Analyst</strong>s <strong>Presentation</strong>, 3 November <strong>2010</strong> (Copyright Clariant. All rights reserved.)<br />
82<br />
7<br />
Q1 2009 Q2 2009 <strong>Q3</strong> 2009 Q4 2009 Q1 <strong>2010</strong> Q2 <strong>2010</strong> <strong>Q3</strong> <strong>2010</strong><br />
Q1<br />
51<br />
–8<br />
–15.7%<br />
–9<br />
–17.6%<br />
84<br />
10<br />
Q2<br />
71<br />
3<br />
4.2%<br />
1<br />
1.4%<br />
91<br />
11<br />
<strong>Q3</strong><br />
75<br />
7<br />
9.3%<br />
6<br />
8.0%<br />
76<br />
9<br />
Q4<br />
82<br />
8<br />
9.8%<br />
7<br />
15<br />
10<br />
5<br />
0<br />
-5<br />
8.5%<br />
FY/09<br />
279<br />
10<br />
3.6%<br />
5<br />
1.8%<br />
Sales EBIT bef.<br />
exceptionals<br />
Q1/10<br />
84<br />
11<br />
13.1%<br />
10<br />
11.9%<br />
Backup slides<br />
Q2/10<br />
91<br />
13<br />
14.3%<br />
11<br />
12.1%<br />
EBIT bef.<br />
exceptionals – margin<br />
<strong>Q3</strong>/10<br />
76<br />
10<br />
13.2%<br />
9<br />
11.8%<br />
* unaudited<br />
Slide 49 / 55
Quarterly Business Unit sales and EBIT<br />
before exceptional items 2009/<strong>2010</strong> (7)<br />
Performance Chemicals (including Additives, Detergents & Intermediates, Emulsions, Paper Specialties)<br />
400<br />
300<br />
200<br />
100<br />
0<br />
Sales<br />
- margin<br />
EBIT bef. exceptionals<br />
- margin<br />
337 335 343 346 359<br />
26<br />
EBITDA bef. exceptionals<br />
26 23<br />
Q1 2009<br />
-10<br />
Q2 2009 <strong>Q3</strong> 2009 Q4 2009 Q1 <strong>2010</strong> Q2 <strong>2010</strong> <strong>Q3</strong> <strong>2010</strong><br />
Quarterly figures* 2009 & <strong>2010</strong> – in CHF mn<br />
–10<br />
9M <strong>2010</strong> / <strong>Q3</strong> <strong>2010</strong>, <strong>Analyst</strong>s <strong>Presentation</strong>, 3 November <strong>2010</strong> (Copyright Clariant. All rights reserved.)<br />
Q1<br />
337<br />
2<br />
0.6%<br />
–3.0%<br />
41<br />
Q2<br />
335<br />
38<br />
11.3%<br />
26<br />
7.8%<br />
387<br />
54<br />
<strong>Q3</strong><br />
343<br />
38<br />
11.1%<br />
26<br />
7.6%<br />
335<br />
34<br />
Q4<br />
346<br />
35<br />
10.1%<br />
23<br />
60<br />
40<br />
20<br />
0<br />
-20<br />
6.6%<br />
FY/09<br />
1 361<br />
113<br />
8.3%<br />
65<br />
4.8%<br />
Sales EBIT bef.<br />
exceptionals<br />
Q1/10<br />
359<br />
52<br />
14.5%<br />
41<br />
11.4%<br />
Backup slides<br />
Q2/10<br />
387<br />
64<br />
16.5%<br />
54<br />
14.0%<br />
EBIT bef.<br />
exceptionals – margin<br />
<strong>Q3</strong>/10<br />
335<br />
44<br />
13.1%<br />
34<br />
10.1%<br />
* unaudited<br />
Slide 50 / 55
Debt maturity profile as of 30 Sept <strong>2010</strong><br />
Liquidity headroom<br />
Open undrawn<br />
credit facilities<br />
at local affiliates<br />
Open undrawn<br />
credit facilities<br />
in Switzerland<br />
Cash*<br />
2500<br />
2000<br />
1500<br />
1000<br />
500<br />
in CHF mn<br />
* incl. short-term deposits >94d<br />
0<br />
800<br />
200<br />
1 272<br />
9M <strong>2010</strong> / <strong>Q3</strong> <strong>2010</strong>, <strong>Analyst</strong>s <strong>Presentation</strong>, 3 November <strong>2010</strong> (Copyright Clariant. All rights reserved.)<br />
Maturities of financial debt<br />
800<br />
700<br />
600<br />
500<br />
400<br />
300<br />
200<br />
100<br />
0<br />
Local rollover loans for<br />
net working capital<br />
financing<br />
33<br />
249<br />
783<br />
269<br />
Backup slides<br />
Bonds & private placements<br />
Uncommitted & other loans<br />
105<br />
133<br />
0<br />
2<br />
<strong>2010</strong> 2011 2012 2013 2014 2015 2016<br />
Slide 51 / 55
Sales and cost structure – nine months<br />
Global sales distribution in % Global cost distribution in %<br />
EUR<br />
43<br />
CHF<br />
0<br />
Emerging<br />
markets<br />
28<br />
GBP<br />
2<br />
USD<br />
23<br />
JPY<br />
4<br />
These distributions represent an approximation to total cash in- and outflows and are closely linked to transaction exposures<br />
9M <strong>2010</strong> / <strong>Q3</strong> <strong>2010</strong>, <strong>Analyst</strong>s <strong>Presentation</strong>, 3 November <strong>2010</strong> (Copyright Clariant. All rights reserved.)<br />
CHF<br />
7<br />
EUR<br />
51<br />
Emerging<br />
markets<br />
17<br />
Backup slides<br />
JPY<br />
2<br />
USD<br />
22<br />
GBP<br />
1<br />
Slide 52 / 55
Top 20 products in percentage of total<br />
raw material costs<br />
Ranking Product<br />
1 Ethylene<br />
2 Polyethylene<br />
3 Ethylene oxide<br />
4 Acetic anhydride<br />
5 Propyleneglycol<br />
6 Sodium hydroxide<br />
7 N-Paraffin C14-C17<br />
8 Cetyl/dodecyl alcohol<br />
9 Vinyl acetate<br />
10 Titanium dioxide<br />
11 Propylene oxide<br />
12 Ethylenediamine<br />
13 29H,31H-Phthalocyanine copper salt<br />
14 Butyl acrylate<br />
15 Tallow fatty acid<br />
16 Amsonic acid (DAST)<br />
17 Acetic acid<br />
18 Acetaldehyde<br />
19 3,3'-Dichlorobenzidine dihydrochloride<br />
20 Phosphorus white<br />
Over 15 300 products in total<br />
Approx. 190 products account for 50% of raw material costs<br />
Approx. 3 000 products account for 90% of raw material costs<br />
9M <strong>2010</strong> / <strong>Q3</strong> <strong>2010</strong>, <strong>Analyst</strong>s <strong>Presentation</strong>, 3 November <strong>2010</strong> (Copyright Clariant. All rights reserved.)<br />
15%<br />
16%<br />
Backup slides<br />
69%<br />
Top 5 Top 6 - 20 Others<br />
Slide 53 / 55
Raw material classification and dependence<br />
on oil price<br />
Dependence on oil price Product groups<br />
Independent<br />
35%<br />
Indirectly dependent<br />
via feedstock<br />
(e.g. benzene, phenol)<br />
50%<br />
15%<br />
Directly<br />
dependent<br />
9M <strong>2010</strong> / <strong>Q3</strong> <strong>2010</strong>, <strong>Analyst</strong>s <strong>Presentation</strong>, 3 November <strong>2010</strong> (Copyright Clariant. All rights reserved.)<br />
Specialty chemicals<br />
incl. aromatics and<br />
oleochemicals<br />
Petrochemicals<br />
40%<br />
40%<br />
Backup slides<br />
20%<br />
Base<br />
chemicals<br />
Slide 54 / 55
Disclaimer<br />
This presentation contains certain statements that are neither reported financial results nor other<br />
historical information. This presentation also includes forward-looking statements.<br />
Because these forward-looking statements are subject to risks and uncertainties, actual future<br />
results may differ materially from those expressed in or implied by the statements. Many of these<br />
risks and uncertainties relate to factors that are beyond Clariant’s ability to control or estimate<br />
precisely, such as future market conditions, currency fluctuations, the behavior of other market<br />
participants, the actions of governmental regulators and other risk factors such as: the timing and<br />
strength of new product offerings; pricing strategies of competitors; the Company's ability to<br />
continue to receive adequate products from its vendors on acceptable terms, or at all, and to<br />
continue to obtain sufficient financing to meet its liquidity needs; and changes in the political,<br />
social and regulatory framework in which the Company operates or in economic or technological<br />
trends or conditions, including currency fluctuations, inflation and consumer confidence, on a<br />
global, regional or national basis.<br />
Readers are cautioned not to place undue reliance on these forward-looking statements, which<br />
speak only as of the date of this document. Clariant does not undertake any obligation to publicly<br />
release any revisions to these forward-looking statements to reflect events or circumstances<br />
after the date of these materials.<br />
9M <strong>2010</strong> / <strong>Q3</strong> <strong>2010</strong>, <strong>Analyst</strong>s <strong>Presentation</strong>, 3 November <strong>2010</strong> (Copyright Clariant. All rights reserved.)<br />
Slide 55 / 55