New 3D TRASAR® Membrane Technology increases plant ... - Nalco
New 3D TRASAR® Membrane Technology increases plant ... - Nalco
New 3D TRASAR® Membrane Technology increases plant ... - Nalco

You also want an ePaper? Increase the reach of your titles
YUMPU automatically turns print PDFs into web optimized ePapers that Google loves.
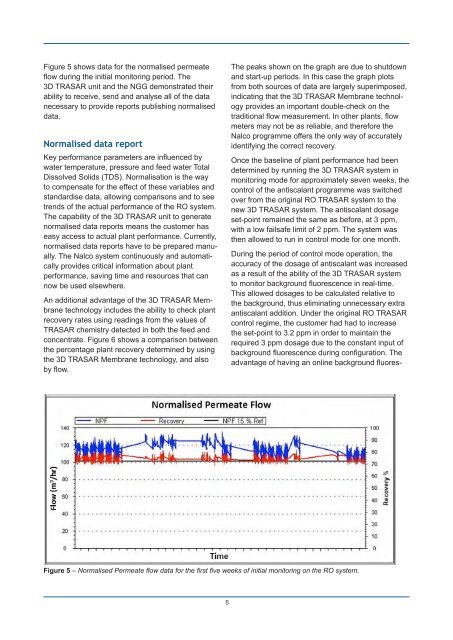
Figure 5 shows data for the normalised permeate<br />
flow during the initial monitoring period. The<br />
<strong>3D</strong> TRASAR unit and the NGG demonstrated their<br />
ability to receive, send and analyse all of the data<br />
necessary to provide reports publishing normalised<br />
data.<br />
Normalised data report<br />
Key performance parameters are influenced by<br />
water temperature, pressure and feed water Total<br />
Dissolved Solids (TDS). Normalisation is the way<br />
to compensate for the effect of these variables and<br />
standardise data, allowing comparisons and to see<br />
trends of the actual performance of the RO system.<br />
The capability of the <strong>3D</strong> TRASAR unit to generate<br />
normalised data reports means the customer has<br />
easy access to actual <strong>plant</strong> performance. Currently,<br />
normalised data reports have to be prepared manually.<br />
The <strong>Nalco</strong> system continuously and automatically<br />
provides critical information about <strong>plant</strong><br />
performance, saving time and resources that can<br />
now be used elsewhere.<br />
An additional advantage of the <strong>3D</strong> TRASAR <strong>Membrane</strong><br />
technology includes the ability to check <strong>plant</strong><br />
recovery rates using readings from the values of<br />
TRASAR chemistry detected in both the feed and<br />
concentrate. Figure 6 shows a comparison between<br />
the percentage <strong>plant</strong> recovery determined by using<br />
the <strong>3D</strong> TRASAR <strong>Membrane</strong> technology, and also<br />
by flow.<br />
The peaks shown on the graph are due to shutdown<br />
and start-up periods. In this case the graph plots<br />
from both sources of data are largely superimposed,<br />
indicating that the <strong>3D</strong> TRASAR <strong>Membrane</strong> technology<br />
provides an important double-check on the<br />
traditional flow measurement. In other <strong>plant</strong>s, flow<br />
meters may not be as reliable, and therefore the<br />
<strong>Nalco</strong> programme offers the only way of accurately<br />
identifying the correct recovery.<br />
Once the baseline of <strong>plant</strong> performance had been<br />
determined by running the <strong>3D</strong> TRASAR system in<br />
monitoring mode for approximately seven weeks, the<br />
control of the antiscalant programme was switched<br />
over from the original RO TRASAR system to the<br />
new <strong>3D</strong> TRASAR system. The antiscalant dosage<br />
set-point remained the same as before, at 3 ppm,<br />
with a low failsafe limit of 2 ppm. The system was<br />
then allowed to run in control mode for one month.<br />
During the period of control mode operation, the<br />
accuracy of the dosage of antiscalant was increased<br />
as a result of the ability of the <strong>3D</strong> TRASAR system<br />
to monitor background fluorescence in real-time.<br />
This allowed dosages to be calculated relative to<br />
the background, thus eliminating unnecessary extra<br />
antiscalant addition. Under the original RO TRASAR<br />
control regime, the customer had had to increase<br />
the set-point to 3.2 ppm in order to maintain the<br />
required 3 ppm dosage due to the constant input of<br />
background fluorescence during configuration. The<br />
advantage of having an online background fluores-<br />
Figure 5 – Normalised Permeate flow data for the first five weeks of initial monitoring on the RO system.<br />
5