Exploring livelihoods of the urban poor in Kampala, Uganda
Exploring livelihoods of the urban poor in Kampala, Uganda
Exploring livelihoods of the urban poor in Kampala, Uganda

Create successful ePaper yourself
Turn your PDF publications into a flip-book with our unique Google optimized e-Paper software.
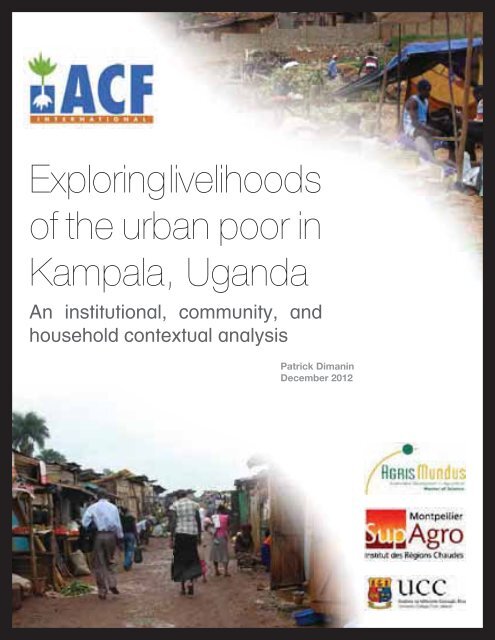
<strong>Explor<strong>in</strong>g</strong> <strong>livelihoods</strong><br />
<strong>of</strong> <strong>the</strong> <strong>urban</strong> <strong>poor</strong> <strong>in</strong><br />
<strong>Kampala</strong>, <strong>Uganda</strong><br />
An <strong>in</strong>stitutional, community, and<br />
household contextual analysis<br />
Patrick Diman<strong>in</strong><br />
December 2012
Abstract<br />
The <strong>urban</strong> <strong>poor</strong> <strong>in</strong> <strong>Kampala</strong>, <strong>Uganda</strong> represent a large portion <strong>of</strong> <strong>the</strong> population ula lati tion on <strong>of</strong><br />
f th t<strong>the</strong> e ca capi capital pi p ta tal ci city city, ty ty, ye yyet t li litt little tt t le is<br />
documented about <strong>the</strong>ir <strong>livelihoods</strong>. The ma<strong>in</strong> objective <strong>of</strong> this study was to ga<strong>in</strong> a general gen ener er al all understand<strong>in</strong>g<br />
und nd n er st an andi di d ng<br />
<strong>of</strong> <strong>the</strong> <strong>livelihoods</strong> present amongst <strong>the</strong> population <strong>of</strong> <strong>the</strong> <strong>urban</strong> <strong>poor</strong> and <strong>the</strong> context <strong>in</strong> considered which hich <strong>the</strong>y th <strong>the</strong>y ey<br />
exist, so as to form a foundation for future programm<strong>in</strong>g.<br />
Three groups <strong>of</strong> <strong>urban</strong> <strong>poor</strong> <strong>in</strong> <strong>the</strong> city were identi ed through qualitative <strong>in</strong>terviews: street children, squatters,<br />
and slum dwellers. Slum dwellers became <strong>the</strong> pr<strong>in</strong>cipal <strong>in</strong>terest upon consider<strong>in</strong>g <strong>the</strong> context, aims and limits<br />
<strong>of</strong> <strong>the</strong> study. Qualitative <strong>in</strong>terviews with key actors at community and household levels, questionnaires at a<br />
household level, and several o<strong>the</strong>r supplementary <strong>in</strong>vestigations formed <strong>the</strong> rema<strong>in</strong>der <strong>of</strong> <strong>the</strong> study. Ultimately,<br />
six different livelihood strategies were identi ed and described: Non-<strong>poor</strong> Casual Labourers, Poor Casual<br />
Labourers, Non-quali ed Salary, Quali ed Salary, Vocation or Services, and Petty Traders and Street Vendors.<br />
Each <strong>of</strong> <strong>the</strong> livelihood strategies identi ed held vulnerabilities, though <strong>the</strong> severity <strong>of</strong> <strong>the</strong>se varies between both<br />
<strong>the</strong> type <strong>of</strong> vulnerability and group.<br />
Vulnerabilities <strong>of</strong> <strong>the</strong> entire slum population <strong>of</strong> <strong>Kampala</strong> <strong>in</strong>clude land tenure issues, malnutrition monitor<strong>in</strong>g,<br />
and enumeration <strong>in</strong>formation. Those at a community and area level <strong>in</strong>clude <strong>the</strong> risk <strong>of</strong> persistent ood<strong>in</strong>g,<br />
unhygienic and unsanitary practices, and full realisation <strong>of</strong> bene ts <strong>of</strong> social networks. F<strong>in</strong>ally, major household<br />
vulnerabilities <strong>in</strong>cluded lack <strong>of</strong> <strong>urban</strong> agriculture, and lack <strong>of</strong> credit.<br />
i
ii<br />
Table <strong>of</strong> Contents<br />
Introduction 1<br />
Context 2<br />
2.1 The Study Area 2<br />
2.2 Progress<strong>in</strong>g Economic and Social Development 3<br />
2.3 Population Growth and <strong>the</strong> Rural-Urban L<strong>in</strong>k<br />
2.4 Poverty <strong>in</strong> <strong>Kampala</strong>: How Prevalent and How<br />
4<br />
Severe? 4<br />
2.5 Government Policies for <strong>the</strong> Urban Poor 5<br />
3.1 Interest <strong>of</strong> Research 8<br />
3.2 Research Question 9<br />
3.3 Objectives 9<br />
3.3.1 Ma<strong>in</strong> Objective 9<br />
3.3.2 Sub-Objectives 9<br />
Methodology 10<br />
4.1 Frameworks 10<br />
4.1.1 Conceptual Frameworks 10<br />
4.1.2 Analytical Framework 11<br />
4.2 Approaches and Tools 12<br />
4.2.1 Qualify<strong>in</strong>g ‘Urban Poor’ for <strong>the</strong> Study 12<br />
4.3 Phase 1 – Identi cation and Speci cation <strong>of</strong><br />
Groups and Areas for Fur<strong>the</strong>r Investigation 13<br />
4.3.1 Study Tools<br />
4.4 Phase 2 – Exploration <strong>of</strong> <strong>livelihoods</strong> and <strong>the</strong><br />
13<br />
conditions <strong>in</strong> which <strong>the</strong>y exist 15<br />
4.4.1 Community Level 15<br />
4.4.2 Household Level 16<br />
4.5 O<strong>the</strong>r Study Tools 17<br />
4.5.1 Observation 17<br />
4.5.2 Food Security Indicators 18<br />
4.5.3 Livelihood Pro les 18<br />
4.5.4 Malnutrition Indicators 18<br />
4.5.5 Water Quality Tests 19<br />
4.5.6 Markets 19<br />
4.5.7 Literature 19<br />
4.5.8 Cop<strong>in</strong>g Mechanisms 19<br />
4.6 Data Analysis 20<br />
4.7 Study limits and biases 20<br />
4.7.1 Scope <strong>of</strong> <strong>the</strong> study 20<br />
4.7.2 Dif culties encountered 20<br />
4.7.3 Logistic/organizational issues 20<br />
4.7.4 Methodological Biases 21<br />
Results 22<br />
5.1 Phase 1 – Identi cation and Speci cation <strong>of</strong><br />
Urban Poor Groups 22<br />
5.1.1 Street Children and <strong>the</strong>ir Mo<strong>the</strong>rs 22<br />
5.1.2 Squatters 23<br />
5.1.3 Slum Dwellers 23<br />
5.2 Area Pro les 23<br />
5.2.1 Namuwongo 23<br />
5.2.2 Bwaise 24<br />
5.2.3 Kisenyi<br />
5.3 Phase 2 – Exploration <strong>of</strong> <strong>livelihoods</strong> and <strong>the</strong><br />
24<br />
conditions <strong>in</strong> which <strong>the</strong>y exist<br />
5.3.1 Demographics and Pro le <strong>of</strong><br />
25<br />
Respondent Households 25<br />
5.3.2 F<strong>in</strong>ancial Capital 27<br />
5.3.3 Human Capital 32<br />
5.3.4 Social Capital 37<br />
5.3.5 Physical Capital 39<br />
5.3.6 Natural Capital 44<br />
5.3.7 Food Security 47<br />
5.4 Livelihood Pro les/Strategies 52<br />
5.4.1 Wealth Group<strong>in</strong>gs 52<br />
5.4.2 Livelihood Strategies 54
Discussion 66<br />
6.1 Global Level 66<br />
6.1.1 Census and Statistics <strong>of</strong> Slums and<br />
Their Residents 66<br />
6.1.2 Land Tenure 67<br />
6.1.3 Scal<strong>in</strong>g-up Nutrition Monitor<strong>in</strong>g and<br />
Health Capacities 67<br />
6.2 Community and Area Levels 68<br />
6.2.1 Flood<strong>in</strong>g and Infrastructure 69<br />
6.2.2 Rubbish 70<br />
6.2.3 Toilets 70<br />
6.2.4 Social Networks 70<br />
6.3 Household and Individual Level 71<br />
6.3.1 Universal Signi cance 71<br />
6.3.2 By Livelihood Strategy 72<br />
6.4 Livelihood Capitals and Food Security 75<br />
6.4.1 F<strong>in</strong>ancial 75<br />
6.4.2 Human 75<br />
6.4.3 Social 76<br />
6.4.4 Physical 76<br />
6.4.5 Natural 76<br />
6.4.6 Food Security 76<br />
6.5 Fur<strong>the</strong>r Research 77<br />
Conclusion 79<br />
Bibliography 80<br />
List <strong>of</strong> Appendices 85<br />
iii ii iii iiii
iv<br />
List <strong>of</strong> Abbreviations<br />
ACF<br />
Action Aga<strong>in</strong>st Hunger/Action<br />
Contre la Faim<br />
CBN Cost <strong>of</strong> Basic Needs<br />
CBO Community Based Organisation<br />
CHO Carbohydrate<br />
CPI Consumer Price Index<br />
DHS Demographic and Health Survey<br />
FANTA<br />
Food and Nutrition Technical<br />
Assistance<br />
FEI Food-energy Intake<br />
FSL Food Security and Livelihoods<br />
HEA Household Economic Approach<br />
HfA Height for Age<br />
HFIAS<br />
HIV/AIDS<br />
Household Food Insecurity<br />
Access Scale<br />
Human Immunode ciency Virus/<br />
Acquired Immunode ciency<br />
Syndrome<br />
IDDS Individual Dietary Diversity Score<br />
IDP Internally Displaced Person<br />
IL Income Level Poverty<br />
IP Income Position Poverty<br />
KCCA <strong>Kampala</strong> Capital City Authority<br />
LC Local Councilor<br />
LRA Lord’s Resistance Army<br />
MUAC Mid-upper Arm Circumference<br />
NGO Non-governmental Organisation<br />
NHS National Household Survey<br />
NSDF<br />
NUT Nutrition<br />
National Slum Dwellers<br />
Federation <strong>of</strong> <strong>Uganda</strong><br />
OTP Outpatient Treatment Programme<br />
OVC<br />
Orphans and O<strong>the</strong>r Vulnerable<br />
Children<br />
PEAP Poverty Eradication Action Plan<br />
SDI Slum Dwellers International<br />
SLF<br />
Susta<strong>in</strong>able Livelihoods<br />
Framework<br />
TFP Therapeutic Feed<strong>in</strong>g Programme<br />
UN United Nations<br />
UNDP<br />
UN-<br />
HABITAT<br />
United Nations Development<br />
Programme<br />
United Nations Human<br />
Settlements Programme<br />
UNICEF United Nations Children’s Fund<br />
WASH Water, Sanitation and Hygiene<br />
WfA Weight for Age<br />
WfH Weight for Height<br />
WFP World Food Programme
List <strong>of</strong> Figures<br />
Figure 1: Food And Nutrition Security Conceptual Framework 10<br />
Figure 2: Analytical Framework 12<br />
Figure 3: Number Of People Per Household As A Percentage Of The Total 26<br />
Figure 4: Areas Of Orig<strong>in</strong> Of Migrants 26<br />
Figure 5: Number Of Respondents By Primary Income Activity 27<br />
Figure 6: Daily Income Means And Variance By Income Activity 27<br />
Figure 7: Variance Of Debt Amounts 28<br />
Figure 8: Commodity Contribution To Price Index Over 18 Months Prior To Household Study 29<br />
Figure 9: Price Index For 18 Months Prior To Household Study 29<br />
Figure 10: Normalised Price Variation By Commodity Over 18 Months Prior To Household Study 30<br />
Figure 11: Proportions Of Reasons For Not Attend<strong>in</strong>g School 32<br />
Figure 13: Number Of Admissions To Therapeutic Feed<strong>in</strong>g Programmes And Outpatient Treatment<br />
Programmes<br />
36<br />
Figure 12: Proportion Of OTP Admissions By Health Centre 36<br />
Figure 14: Trends Possibly Associated With Malnutrition Treatment Programme Admissions 37<br />
Figure 15: Prevalence Of Overcrowd<strong>in</strong>g By Crowd<strong>in</strong>g Index 39<br />
Figure 16: Who Fetches Water? 40<br />
Figure 17: Variance Of Water Use Per Individual Per Day 41<br />
Figure 18: Food Groups Consumed With<strong>in</strong> The Past 24 Hours By % Of Respondents. 46<br />
Figure 19: Distribution Of Child Dietary Diversity Scores And Thresholds 46<br />
Figure 20: Child Dietary Diversity By Area 47<br />
Figure 21: HFIAS Conditions For Total Sample Population 47<br />
Figure 22: HFIAS Doma<strong>in</strong> By Number Of HFIAS Respondents 48<br />
Figure 23: HFIAS DOMAIN DISAGGREGATED BY AREA 49<br />
Figure 24: HFIAS Severity And Prevalence 49<br />
Figure 25: Adapted Food Consumption Score 50<br />
Figure 26: Adapted Food Consumption Score By Area 50<br />
Figure 27: Times Eaten In The Past 24 Hours, All Areas 50<br />
Figure 28: Times Eaten In The Past 24 Hours, By Area 50<br />
Figure 29: Proportion Of Livelihood Strategies Present In The Investigated Areas 53<br />
Figure 30: Median Incomes Vs Median Total Expenditures By Livelihood Pro le 53<br />
Figure 31: Poor Casual Labourer Asset Mix 54<br />
Figure 32: Poor Casual Labourer Daily Expense Variation With CBN L<strong>in</strong>e 55<br />
Figure 33: Activity Pro le - Poor Casual Labourer 55<br />
Figure 34: Non-Poor Casual Labourer Asset Mix 56<br />
Figure 35: Non-Poor Casual Labourer Daily Expense Variation With CBN L<strong>in</strong>e 57<br />
Figure 36: Activity Pro le Of Non-Poor Casual Labourer 57<br />
v
vi<br />
Figure 37: Petty Trader/Street Vendor Asset Mix 58<br />
Figure 39: Activity Pro le Of Street Vendor 59<br />
Figure 38: Petty Trader/Street Vendor Daily Expense Variation With CBN L<strong>in</strong>e 59<br />
Figure 40: Market Vendor Activity Pro le 59<br />
Figure 41: Vocation/Service Asset Mix 60<br />
Figure 42: Vocation/Service Daily Expense Variation With CBN L<strong>in</strong>e 60<br />
Figure 43: Vocation/Service Activity Pro le 61<br />
Figure 44: Quali ed Salary Asset Mix 62<br />
Figure 45: Quali ed Salary Daily Expense Variation With CBN L<strong>in</strong>e 62<br />
Figure 46: Quali ed Salary Activity Pro le 63<br />
Figure 47: Non-Quali ed Salary Asset Mix 64<br />
Figure 48: Non-Quali ed Salary Daily Expense Variation With CBN L<strong>in</strong>e 64<br />
Figure 49: Non-Quali ed Salary Activity Pro le 65<br />
List <strong>of</strong> Maps<br />
Map 1: <strong>Uganda</strong> With Locale Of <strong>Kampala</strong> 2<br />
Map 2: <strong>Kampala</strong> City/District 2<br />
Map 3: Identi ed Slum Areas Of <strong>Kampala</strong> District 24<br />
Map 4: Regions Of <strong>Uganda</strong> As Designated For This Study 26<br />
Map 5: Location Of Supported Health Centres 35<br />
Map 6: Water Network Of <strong>Kampala</strong> 40<br />
Map 7: Topographic Relief Indicat<strong>in</strong>g Floodpla<strong>in</strong> Of Central And Mak<strong>in</strong>dye Divisions 45<br />
List <strong>of</strong> Tables<br />
Table 1: Climate Of <strong>Kampala</strong> 3<br />
Table 2: Poverty L<strong>in</strong>e Calculations 13<br />
Table 3: Ages Of Household Members 25<br />
Table 4: Ranked Reason For Mov<strong>in</strong>g To <strong>Kampala</strong> 26<br />
Table 5: Rank<strong>in</strong>g Of Debts By Lender 28<br />
Table 6: Price Comparisons Between Kisugu And Namuwongo Markets 31<br />
Table 7: Insuf cient Access To Healthcare 33<br />
Table 8: Illness Prevalence By Rank<strong>in</strong>g 34<br />
Table 9: Proportion Receiv<strong>in</strong>g Support 38<br />
Table 10: Forms Of Support Received 38<br />
Table 11: Are Water Conta<strong>in</strong>ers Covered? 41<br />
Table 12: Prevalence Of Zoonotic Disease Cases At Mulago Hospital, Mar ‘05-Feb ‘06 44<br />
Table 13: HFIAS Score 48<br />
Table 14: Ranked Sources Of Food 51<br />
Table 15: Distribution Of Population Under Different Poverty L<strong>in</strong>es 52<br />
Table 16: Livelihood Strategy Representation By Slum 54
Introduction<br />
Action Aga<strong>in</strong>st Hunger-USA is part <strong>of</strong> <strong>the</strong><br />
Action Contre la Faim (ACF) <strong>in</strong>ternational<br />
network, whose mandate addresses <strong>the</strong><br />
treatment and prevention <strong>of</strong> malnutrition <strong>of</strong> <strong>the</strong><br />
world’s most vulnerable populations. With a multisectoral<br />
approach, <strong>the</strong> ACF network lays claim to<br />
over ve million bene ciaries annually <strong>in</strong> <strong>the</strong> more<br />
than 40 countries <strong>in</strong> which <strong>the</strong>y are active.<br />
ACF-USA has been operat<strong>in</strong>g <strong>in</strong> <strong>Uganda</strong> s<strong>in</strong>ce<br />
1981. Headquartered <strong>in</strong> <strong>the</strong> political, economic and<br />
commercial capital <strong>of</strong> <strong>Kampala</strong>, <strong>the</strong>ir projects range<br />
nationally between <strong>the</strong> organisation’s three ma<strong>in</strong> areas<br />
<strong>of</strong> <strong>in</strong>tervention: Food Security and Livelihoods (FSL);<br />
Water, Sanitation and Hygiene (WASH); and Nutrition<br />
and Health (NUT).<br />
<strong>Kampala</strong>’s <strong>urban</strong> population is near<strong>in</strong>g 1.7 million<br />
people and is grow<strong>in</strong>g at rate higher than <strong>the</strong> natural<br />
population growth (births-deaths), suggest<strong>in</strong>g<br />
migration <strong>in</strong>to <strong>the</strong> city as well as expansion <strong>of</strong> <strong>the</strong><br />
<strong>urban</strong>ised areas surround<strong>in</strong>g <strong>the</strong> delimited district.<br />
Alongside ACF’s current programm<strong>in</strong>g structure<br />
which is focused <strong>in</strong> <strong>the</strong> north and north-east <strong>of</strong> <strong>the</strong><br />
country (bene ciaries are typically ex-IDPs and <strong>poor</strong><br />
pastoralists), ACF-USA <strong>Uganda</strong> is presently scal<strong>in</strong>gup<br />
<strong>the</strong>ir capacities and programm<strong>in</strong>g <strong>in</strong> <strong>urban</strong> areas,<br />
speci cally <strong>in</strong> <strong>Kampala</strong>.<br />
Urban <strong>livelihoods</strong> are fundamentally different from <strong>the</strong>ir<br />
rural counterparts as <strong>the</strong> types <strong>of</strong> <strong>in</strong>come activities vary<br />
widely, goods and services are pr<strong>in</strong>cipally exchanged<br />
for cash, basic services such as <strong>in</strong>frastructure and<br />
transport are more widely available, and <strong>the</strong> areas<br />
with<strong>in</strong> <strong>the</strong> city are more densely populated.<br />
To fur<strong>the</strong>r develop an understand<strong>in</strong>g <strong>of</strong> <strong>the</strong> people<br />
and <strong>the</strong> circumstances <strong>in</strong> which <strong>the</strong>y live, ACF-USA<br />
<strong>Uganda</strong> had commissioned a four-month project to<br />
uncover and characterize <strong>the</strong> ma<strong>in</strong> issues affect<strong>in</strong>g<br />
<strong>the</strong> susta<strong>in</strong>ability <strong>of</strong> <strong>the</strong> <strong>livelihoods</strong> <strong>of</strong> <strong>the</strong> <strong>poor</strong> <strong>in</strong> <strong>urban</strong><br />
<strong>Kampala</strong>. This came about <strong>in</strong> <strong>the</strong> form <strong>of</strong> an <strong>in</strong>ternship<br />
to address who were <strong>the</strong> <strong>urban</strong> <strong>poor</strong> and to speci cally<br />
exam<strong>in</strong>e <strong>the</strong> FSL, NUT and WASH conditions <strong>of</strong> <strong>the</strong>se<br />
populations. The study commenced on 2 April and <strong>the</strong><br />
research concluded on 24 July, 2012.<br />
Recent monitor<strong>in</strong>g conducted prior to <strong>the</strong> study<br />
at Mwanamugimu Child Nutrition Unit at Mulago<br />
National Referral Hospital <strong>in</strong> <strong>Kampala</strong> demonstrated<br />
a 4-fold <strong>in</strong>crease <strong>in</strong> admissions to <strong>the</strong>rapeutic feed<strong>in</strong>g<br />
programmes <strong>in</strong> <strong>the</strong> six months between January and<br />
June 2011. With no programmes currently operat<strong>in</strong>g <strong>in</strong><br />
<strong>the</strong> <strong>Kampala</strong> area, ACF chose to implement this study<br />
and form a general <strong>in</strong>dication <strong>of</strong> who and where are<br />
<strong>the</strong> <strong>urban</strong> <strong>poor</strong> with<strong>in</strong> <strong>the</strong> city <strong>of</strong> <strong>Kampala</strong>, which are<br />
<strong>the</strong> issues that <strong>the</strong>y face, how can <strong>the</strong>ir <strong>livelihoods</strong> be<br />
characterized, and ultimately what <strong>in</strong>terventions could<br />
be proposed to help improve <strong>the</strong>ir situation.<br />
This study was conducted at <strong>in</strong>stitutional, community<br />
and household levels with <strong>the</strong> aim <strong>of</strong> uncover<strong>in</strong>g <strong>the</strong><br />
key forces that act upon <strong>the</strong> targeted populations.<br />
This report will describe and present justi cation <strong>of</strong> <strong>the</strong><br />
methods chosen to accomplish this goal, <strong>the</strong> resultant<br />
nd<strong>in</strong>gs <strong>of</strong> <strong>the</strong> study, followed by a syn<strong>the</strong>sis <strong>of</strong> nal<br />
ideas and suggestion <strong>of</strong> areas for fur<strong>the</strong>r <strong>in</strong>vestigation.<br />
1
2<br />
Context<br />
<strong>Uganda</strong> is a landlocked country <strong>in</strong> <strong>the</strong> eastern<br />
region <strong>of</strong> Africa which shares land borders with<br />
Rwanda, <strong>the</strong> Democratic Republic <strong>of</strong> Congo,<br />
South Sudan and Kenya and maritime borders along<br />
Lake Victoria with Tanzania. The country is divided <strong>in</strong>to<br />
four adm<strong>in</strong>istrative regions (Nor<strong>the</strong>rn, Eastern, Central<br />
and Western) and fur<strong>the</strong>r divided <strong>in</strong>to 111 districts.<br />
<strong>Kampala</strong> District (coterm<strong>in</strong>ous with <strong>Kampala</strong> city), <strong>the</strong><br />
commercial and political capital <strong>of</strong> <strong>the</strong> country and<br />
focus <strong>of</strong> this study, is located <strong>in</strong> <strong>the</strong> Central Division<br />
on <strong>the</strong> nor<strong>the</strong>rn coastl<strong>in</strong>e <strong>of</strong> Lake Victoria (0°18’N,<br />
32°34’E) and covers approximately 176km2 <strong>of</strong> land.<br />
The population<br />
was predicted<br />
to be at just<br />
below 36 million<br />
<strong>in</strong>habitants as<br />
<strong>of</strong> July 2012<br />
(The World Bank<br />
2011). Of this<br />
population, 13%<br />
live <strong>in</strong> <strong>urban</strong><br />
areas and is<br />
grow<strong>in</strong>g at an<br />
estimated rate<br />
<strong>of</strong> 4.8%, with<br />
<strong>the</strong> capital city <strong>of</strong> <strong>Kampala</strong> hold<strong>in</strong>g 1.659 million<br />
<strong>in</strong> 2011 (UBOS 2010a; The World Bank 2011). The<br />
country designates both English and Swahili as <strong>of</strong> cial<br />
languages, though up to 41 o<strong>the</strong>r languages have<br />
current speakers (Lewis 2009).<br />
<strong>Uganda</strong> acquired <strong>in</strong>dependence from The United<br />
K<strong>in</strong>gdom <strong>in</strong> 1962 and s<strong>in</strong>ce <strong>the</strong>n has had a tumultuous<br />
past, <strong>in</strong>clud<strong>in</strong>g <strong>the</strong> brutal dictatorship <strong>of</strong> Idi Am<strong>in</strong> <strong>in</strong><br />
<strong>the</strong> 1970s. More recently, Joseph Kony had led <strong>the</strong><br />
Lord’s Resistance Army (LRA) <strong>in</strong> a revolt aga<strong>in</strong>st <strong>the</strong><br />
<strong>Uganda</strong>n state that had lasted for more than 20 years.<br />
Peace talks <strong>in</strong> 2006 saw an end to <strong>the</strong> <strong>in</strong>surgency and<br />
with that, <strong>the</strong> beg<strong>in</strong>n<strong>in</strong>g <strong>of</strong> <strong>the</strong> return <strong>of</strong> almost 1.8<br />
million <strong>in</strong>ternally displaced persons throughout <strong>the</strong><br />
north <strong>of</strong> <strong>the</strong> country.<br />
2.1<br />
The Study Area<br />
<strong>Kampala</strong> district limits were orig<strong>in</strong>ally demarcated<br />
by <strong>the</strong> seven ma<strong>in</strong> hills <strong>in</strong> <strong>the</strong> city, however <strong>the</strong>y have<br />
been cont<strong>in</strong>uously expanded upon (most recently <strong>in</strong><br />
2001) to account for <strong>urban</strong> sprawl and population<br />
growth (UN-HABITAT 2007).<br />
The city-district is<br />
fur<strong>the</strong>r divided <strong>in</strong>to<br />
ve adm<strong>in</strong>istrative<br />
divisions:<br />
<strong>Kampala</strong> Central,<br />
Kawempe,<br />
N a k a w a ,<br />
Mak<strong>in</strong>dye, and<br />
Rubaga with <strong>the</strong><br />
Central division<br />
compris<strong>in</strong>g <strong>the</strong>
central bus<strong>in</strong>ess district. The district has an area <strong>of</strong><br />
approximately 189 km2, <strong>of</strong> which 13km2 is Lake<br />
Victoria and o<strong>the</strong>r waterways. Population density is<br />
a de n<strong>in</strong>g characteristic <strong>of</strong> any <strong>urban</strong> area, to which<br />
<strong>Kampala</strong> claims 9629.4 persons per km2 (UBOS<br />
2010b).<br />
The namesake hills (<strong>Kampala</strong> means hill <strong>of</strong> <strong>the</strong><br />
Impala <strong>in</strong> <strong>the</strong> native Buganda language) make up<br />
<strong>the</strong> predom<strong>in</strong>ant geographical feature <strong>of</strong> <strong>the</strong> city,<br />
<strong>the</strong> largest <strong>of</strong> which (Muyenga) reaches 1306m at its<br />
summit. The lowest po<strong>in</strong>t <strong>of</strong> <strong>the</strong> city resides on <strong>the</strong><br />
shores <strong>of</strong> Lake Victoria at Murchison Bay, stand<strong>in</strong>g at<br />
1137m above sea level. The low ly<strong>in</strong>g areas along <strong>the</strong><br />
Bay and cont<strong>in</strong>u<strong>in</strong>g toward <strong>the</strong> centre <strong>of</strong> town via <strong>the</strong><br />
Nakirubo channel are ei<strong>the</strong>r beach area or swampy<br />
marshland. The hills and surround<strong>in</strong>g areas are<br />
typically fertile soils that are heavily vegetated where<br />
<strong>the</strong> built environs does not <strong>in</strong>hibit wild growth.<br />
<strong>Kampala</strong> lays near <strong>the</strong> Equator claim<strong>in</strong>g a tropical<br />
climate with two ra<strong>in</strong>y seasons per year: <strong>the</strong> rst last<strong>in</strong>g<br />
from February to April, and <strong>the</strong> second from August to<br />
November. Because <strong>of</strong> <strong>the</strong> hilly landscape and yearlong<br />
ra<strong>in</strong>fall, <strong>the</strong> low-ly<strong>in</strong>g areas are prone to ood<strong>in</strong>g.<br />
2.2<br />
Progress<strong>in</strong>g Economic and Social<br />
Development<br />
Despite a dif cult past, <strong>Uganda</strong> has made <strong>in</strong>roads<br />
regard<strong>in</strong>g economic and social development. For<br />
a number <strong>of</strong> years, <strong>the</strong> food security <strong>of</strong> <strong>the</strong> country<br />
has had a central place <strong>in</strong> <strong>the</strong> <strong>of</strong> cial plans <strong>of</strong> <strong>the</strong><br />
government as it adopted <strong>the</strong> United Nations (UN)<br />
pr<strong>in</strong>ciples <strong>of</strong> <strong>the</strong> Humanitarian Right to Food <strong>in</strong> 1987.<br />
TABLE 1: CLIMATE OF KAMPALA<br />
Month Jan Feb Mar Apr May Jun Jul Aug Sep Oct Nov Dec Year<br />
Record High (°C) 33 36 33 33 29 29 29 29 31 32 32 32 36<br />
Average High (°C) 28 28 27 26 25 25 25 25 27 27 27 27 26.4<br />
Average Low (°C) 18 18 18 18 17 17 17 16 17 17 17 17 17.3<br />
Record Low (°C) 12 14 13 14 15 12 12 12 13 13 14 12 12<br />
Ra<strong>in</strong>fall (mm) 46 61 130 175 147 74 46 86 91 97 122 99 1174<br />
This was accomplished through <strong>the</strong> rati cation <strong>of</strong><br />
<strong>the</strong> UN Committee on Economic, Social and Cultural<br />
Rights <strong>in</strong> 1987, as well as mention<strong>in</strong>g food security as<br />
a National Objective and Directive Pr<strong>in</strong>ciple <strong>of</strong> State<br />
Policy <strong>in</strong> <strong>the</strong> Constitution <strong>of</strong> 1995 (Government <strong>of</strong><br />
<strong>Uganda</strong> 1995):<br />
The State shall –<br />
(a) Take appropriate steps to encourage people<br />
to grow and store adequate food;<br />
(b) Establish national food reserves<br />
(c) Encourage and promote proper nutrition<br />
through mass education and o<strong>the</strong>r appropriate<br />
means <strong>in</strong> order to build a healthy State.<br />
With <strong>the</strong>se commitments to food security for <strong>the</strong><br />
citizens <strong>of</strong> <strong>Uganda</strong>, recent years have seen <strong>the</strong><br />
country labelled on aggregate as food secure, along<br />
with a marked decrease <strong>of</strong> 16% <strong>in</strong> <strong>the</strong> number <strong>of</strong><br />
impoverished people between 2002/3 (39%) and<br />
2009/10 (23%) (WFP 2012).<br />
Generally, <strong>Uganda</strong> has seen a rapid rate <strong>of</strong> economic<br />
development and an <strong>in</strong>crease <strong>in</strong> <strong>the</strong> standard <strong>of</strong> liv<strong>in</strong>g<br />
for its citizens <strong>in</strong> recent years. Its gross domestic<br />
product has consistently had a growth rate above<br />
5.9% s<strong>in</strong>ce 2002 and <strong>the</strong> Human Development Index<br />
has <strong>in</strong>creased 52% s<strong>in</strong>ce 1985 which <strong>the</strong>y have<br />
achieved despite <strong>the</strong> rebel <strong>in</strong>surgency occurr<strong>in</strong>g<br />
for <strong>the</strong> majority <strong>of</strong> <strong>the</strong> period. This be<strong>in</strong>g said, with a<br />
current rank <strong>of</strong> 161, though <strong>the</strong>y are ahead <strong>of</strong> <strong>the</strong>ir<br />
neighbours Rwanda, Sudan and Democratic Republic<br />
<strong>of</strong> <strong>the</strong> Congo, <strong>Uganda</strong> is placed <strong>in</strong> <strong>the</strong> category <strong>of</strong><br />
‘Low Human Development’ (UNDP 2011; WFP 2012).<br />
3
4<br />
2.3<br />
Population Growth and <strong>the</strong> Rural-<br />
Urban L<strong>in</strong>k<br />
The last decade has seen <strong>the</strong> global population<br />
dynamically shift so that for <strong>the</strong> rst time <strong>in</strong> history,<br />
<strong>the</strong> majority <strong>of</strong> people are liv<strong>in</strong>g <strong>in</strong> <strong>urban</strong> areas<br />
ra<strong>the</strong>r than <strong>in</strong> rural environments, s<strong>in</strong>ce pass<strong>in</strong>g <strong>the</strong><br />
threshold <strong>in</strong> 2008 (although <strong>the</strong> speci c period is<br />
disputed) (United Nations 2011). S<strong>in</strong>ce all regions<br />
<strong>of</strong> <strong>the</strong> world are expected to reach this threshold by<br />
<strong>the</strong> year 2030, <strong>the</strong> need for heightened attention and<br />
more comprehensive <strong>urban</strong> plann<strong>in</strong>g <strong>in</strong> <strong>the</strong>se cities is<br />
apparent (UN-HABITAT 2008).<br />
Sub-Saharan Africa claims <strong>the</strong> highest rate <strong>of</strong> <strong>urban</strong><br />
population growth <strong>in</strong> <strong>the</strong> world, and <strong>Uganda</strong> is not an<br />
exception to this trend, hav<strong>in</strong>g <strong>in</strong>creased <strong>the</strong> <strong>urban</strong><br />
population from 137,000 <strong>in</strong> 1960 to <strong>the</strong> 2012 estimate <strong>of</strong><br />
1.6 million (The World Bank 2011; Cohen 2004; United<br />
Nations 2011). In 2009, a previous study by ACF had<br />
estimated <strong>Kampala</strong> with a population <strong>of</strong> 1.4 million;<br />
yield<strong>in</strong>g a current day an <strong>in</strong>crease <strong>of</strong> 12.5% <strong>in</strong> 3 years<br />
(UMoH et al. 2009; The World Bank 2011). The country<br />
has also experienced <strong>urban</strong> population growth rates<br />
<strong>of</strong> above 4.5% s<strong>in</strong>ce 2006 which has been well above<br />
both <strong>the</strong> natural population growth rate (births-deaths<br />
per 1000/10) and <strong>the</strong> rural population growth rate for<br />
<strong>the</strong> last 20 years (The World Bank 2011). The rural<br />
population growth rate has been below <strong>the</strong> natural<br />
growth rate s<strong>in</strong>ce 1993, suggest<strong>in</strong>g that migration<br />
from <strong>the</strong>se areas plays a crucial role.<br />
Rural to <strong>urban</strong> migration is a global trend that touts<br />
economic opportunities and social upward mobility<br />
even for people with limited assets, education and/or<br />
skill-sets. However <strong>in</strong> addition to usual migration, for<br />
<strong>the</strong> past 26 years multiple con icts around <strong>Uganda</strong><br />
had forced approximately 1.8 million <strong>in</strong>ternally<br />
displaced persons to seek refuge ei<strong>the</strong>r <strong>in</strong> camps<br />
or through migration. Compound<strong>in</strong>g this population<br />
growth, a long period <strong>of</strong> drought <strong>in</strong> <strong>the</strong> <strong>poor</strong> pastoralist<br />
Karamoja region <strong>in</strong> <strong>the</strong> north-east <strong>of</strong> <strong>the</strong> country<br />
had forced persons to seek better farmland or o<strong>the</strong>r<br />
sources <strong>of</strong> <strong>in</strong>come (ACF 2011; Stites & Akabwai 2012;<br />
Hovil et al. 2001; Baxter & Burrall 2011; Krause-Vilmar<br />
2011).<br />
Mov<strong>in</strong>g to <strong>urban</strong> centres can be viewed as a cop<strong>in</strong>g<br />
mechanism for <strong>the</strong> rural <strong>poor</strong>. It is highly dependent<br />
on <strong>the</strong> livelihood pro le as some may seek to move<br />
permanently <strong>in</strong> search <strong>of</strong> better services, opportunities<br />
for work, or better hous<strong>in</strong>g or security; while o<strong>the</strong>rs may<br />
move seasonally to nd work dur<strong>in</strong>g <strong>the</strong> agriculturally<br />
unproductive periods <strong>of</strong> <strong>the</strong> year (ACF 2012; Stites &<br />
Akabwai 2012; Lucas 2006). However major <strong>urban</strong><br />
centres are not <strong>the</strong> usual primary dest<strong>in</strong>ation <strong>in</strong> <strong>the</strong>se<br />
migrations. Rural residents, when migrat<strong>in</strong>g, will<br />
typically rst nd <strong>the</strong>ir ways to a large regional town<br />
or city, only after this step might <strong>the</strong>y eventually move<br />
on to a larger area, <strong>in</strong> this case, <strong>Kampala</strong> (Stites &<br />
Akabwai 2012).<br />
Despite <strong>the</strong> hopes that a migrant might hold <strong>of</strong> <strong>the</strong>ir<br />
new environment, <strong>in</strong>creased <strong>urban</strong>ization br<strong>in</strong>gs with<br />
it a host <strong>of</strong> issues <strong>in</strong> develop<strong>in</strong>g countries. Previous<br />
studies have noted that unemployment, <strong>in</strong>suf cient<br />
<strong>in</strong>frastructure, gaps <strong>in</strong> <strong>the</strong> capacity <strong>of</strong> service delivery,<br />
overcrowd<strong>in</strong>g, negative environmental impacts, and<br />
hous<strong>in</strong>g shortages become prevalent (D Maxwell et<br />
al. 2000; Todaro 1996).<br />
2.4<br />
Poverty <strong>in</strong> <strong>Kampala</strong>: How Prevalent<br />
and How Severe?<br />
Urban <strong>livelihoods</strong> are fundamentally different from<br />
<strong>the</strong>ir rural counterparts as <strong>in</strong>come activities are spread<br />
amongst a widely differ<strong>in</strong>g amount <strong>of</strong> sectors. Also,<br />
<strong>the</strong>re is a reliance on cash for basic needs <strong>of</strong> daily life<br />
(water, food, hous<strong>in</strong>g, etc.) and social services (such<br />
as health care) are <strong>of</strong> a closer proximity. Physical<br />
security is also said to be much less <strong>of</strong> a concern.<br />
Markets are more accessible and less prone to stock
shortages, and <strong>urban</strong> life has been widely cited as<br />
relatively more food secure by rural-<strong>urban</strong> migrants<br />
(Stites & Akabwai 2012). For <strong>the</strong> <strong>urban</strong> <strong>poor</strong>, issues<br />
can arise that relate to <strong>the</strong> cont<strong>in</strong>uous need for cash<br />
when employment for unskilled workers is typically<br />
day-labour, hous<strong>in</strong>g prices are markedly higher (<strong>in</strong><br />
some cases prohibitively so), sexual harassment and<br />
exploitation are more prevalent, and discrim<strong>in</strong>ation<br />
and harassment are wide-spread as multiple ethnic<br />
and social groups are located with<strong>in</strong> close proximity to<br />
one ano<strong>the</strong>r (Stites & Akabwai 2012).<br />
The <strong>urban</strong> <strong>poor</strong> are a population <strong>in</strong> <strong>Kampala</strong> that is<br />
not necessarily ignored, but a large knowledge gap<br />
exists regard<strong>in</strong>g precisely which groups constitute<br />
this demographic and what exactly characterizes<br />
<strong>the</strong>ir <strong>livelihoods</strong>. No <strong>of</strong> cial census <strong>in</strong>formation exists<br />
that speci cally target <strong>the</strong> <strong>urban</strong> <strong>poor</strong> throughout<br />
<strong>the</strong> country, much less <strong>in</strong> its capital city. Anecdotal<br />
evidence from multiple non-governmental sources<br />
suggest that between 55-65% <strong>of</strong> <strong>the</strong> population reside<br />
<strong>in</strong> slum areas, and this gure does not account for<br />
those who are homeless or do not claim a place <strong>of</strong><br />
regular residence (i.e. squatters) (UN-HABITAT 2007).<br />
The government does however classify groups that<br />
are vulnerable to poverty <strong>in</strong> <strong>the</strong> National Household<br />
Survey, though no speci c mention is made to <strong>the</strong><br />
<strong>urban</strong> <strong>poor</strong>. Poverty at an <strong>of</strong> cial level is calculated<br />
based pr<strong>in</strong>cipally on food item consumption, though<br />
it does account for a few o<strong>the</strong>r non-food items.<br />
Accord<strong>in</strong>g to <strong>the</strong> most recent report, <strong>the</strong> population<br />
below <strong>the</strong> <strong>of</strong> cial poverty l<strong>in</strong>e <strong>in</strong> <strong>Kampala</strong> is listed at<br />
4.0%, <strong>the</strong> lowest rate <strong>of</strong> any disaggregated region <strong>in</strong><br />
<strong>Uganda</strong> (UBOS 2010b). This is contrary to nd<strong>in</strong>gs by<br />
UNDP which claim that an estimated 20% live below<br />
<strong>the</strong> poverty l<strong>in</strong>e(UN-HABITAT 2007). This may be an<br />
issue <strong>of</strong> measurement or <strong>of</strong> methodology, however <strong>in</strong><br />
ei<strong>the</strong>r case a standard basel<strong>in</strong>e is not transparent.<br />
Urban poverty is also exam<strong>in</strong>ed <strong>in</strong> <strong>of</strong> cial statistics by<br />
wealth qu<strong>in</strong>tiles which are calculated every ve years<br />
<strong>in</strong> <strong>the</strong> Demographic and Health Survey. Accord<strong>in</strong>g to<br />
this measure, 90% <strong>of</strong> residents <strong>in</strong> <strong>Kampala</strong> are <strong>in</strong> <strong>the</strong><br />
highest wealth qu<strong>in</strong>tile when compared to o<strong>the</strong>r <strong>urban</strong><br />
areas <strong>in</strong> <strong>the</strong> country. These wealth quali cations were<br />
determ<strong>in</strong>ed on <strong>in</strong>come and expenditure data collected<br />
from 2,770 households <strong>in</strong> 2011 (UBOS 2011).<br />
As evidenced above, a signi cant divide exists<br />
between <strong>the</strong> un<strong>of</strong> cial gures and those presented by<br />
<strong>the</strong> government. Consider<strong>in</strong>g that nearly 1 million <strong>of</strong><br />
<strong>Kampala</strong>’s population is purportedly liv<strong>in</strong>g <strong>in</strong> <strong>in</strong>formal<br />
settlements or slum areas, one can <strong>in</strong>fer that more<br />
<strong>in</strong>formation is needed to properly address <strong>the</strong> issues<br />
fac<strong>in</strong>g this neglected demographic.<br />
2.5<br />
Government Policies for <strong>the</strong> Urban<br />
Poor<br />
<strong>Uganda</strong>’s national government has <strong>in</strong>stituted policies<br />
that are directed toward reduc<strong>in</strong>g <strong>the</strong> level <strong>of</strong> poverty<br />
<strong>in</strong> <strong>the</strong> country. On a macroeconomic level, <strong>Uganda</strong><br />
was <strong>the</strong> rst country to develop and submit a Poverty<br />
Reduction Strategy Paper to <strong>the</strong> International Monetary<br />
Fund and World Bank <strong>in</strong> its application for debt relief<br />
under <strong>the</strong> Highly Indebted Poor Countries Initiative <strong>in</strong><br />
1998. The paper was labelled <strong>the</strong> Poverty Eradication<br />
Action Plan (PEAP), and <strong>in</strong> June 2001 it was approved,<br />
mak<strong>in</strong>g <strong>Uganda</strong> <strong>the</strong> rst country to bene t from partial<br />
debt relief under <strong>the</strong> IMF <strong>in</strong>itiative (UMoFPED &<br />
European Commission 2002).<br />
Revised <strong>in</strong> 2000, <strong>the</strong> PEAP is <strong>the</strong> government’s<br />
participatory approach to a national development<br />
plan to reduce poverty. One <strong>of</strong> <strong>the</strong> pilot districts for <strong>the</strong><br />
approach, <strong>the</strong> pro le <strong>of</strong> <strong>Kampala</strong> was undertaken <strong>in</strong><br />
1999 over two months with <strong>the</strong> objectives <strong>of</strong> enhanc<strong>in</strong>g<br />
knowledge about <strong>the</strong> nature and causes <strong>of</strong> poverty<br />
and appropriate strategies for action, build<strong>in</strong>g district<br />
capacity to plan for poverty reduction, develop<strong>in</strong>g<br />
a national system for qualitative and participatory<br />
poverty monitor<strong>in</strong>g, and establish<strong>in</strong>g <strong>the</strong> capacity for<br />
5
6<br />
participatory policy research <strong>in</strong> <strong>Uganda</strong> (UMoFPED<br />
2000). The areas selected and pro led with<strong>in</strong> <strong>Kampala</strong><br />
were narrowed to four parishes, Bwaise II, Kisenyi<br />
II, Luzira and Nakulabye. Aside from qualitative<br />
data, results were mostly assembled from <strong>the</strong> 1991<br />
Population and Hous<strong>in</strong>g Census.<br />
The government <strong>of</strong> <strong>Uganda</strong> has current day policies<br />
that are better targeted to <strong>the</strong> <strong>urban</strong> <strong>poor</strong>. Notably, <strong>the</strong><br />
M<strong>in</strong>istry <strong>of</strong> Gender, Labour and Social Development<br />
has created <strong>the</strong> Secretariat for Orphans and o<strong>the</strong>r<br />
Vulnerable Children (OVC), as well as <strong>the</strong> M<strong>in</strong>istry <strong>of</strong><br />
Hous<strong>in</strong>g, Labour and Urban Development which <strong>in</strong><br />
turn created <strong>the</strong> National Slum Upgrad<strong>in</strong>g Strategy<br />
and Action Plan.<br />
Vulnerable Children<br />
The OVC targets <strong>the</strong> 19% <strong>of</strong> children <strong>in</strong> <strong>Kampala</strong> which<br />
it classi es as vulnerable. It characterizes vulnerable<br />
children as between 0-17 years <strong>of</strong> age, and ei<strong>the</strong>r<br />
an orphan, a child who is over 6 years old and out<br />
<strong>of</strong> school, a child with a disability, child labourers, a<br />
child <strong>in</strong> a child-headed household, a child who was<br />
married, idle children, non-orphaned children who are<br />
not liv<strong>in</strong>g with <strong>the</strong>ir parents, and children liv<strong>in</strong>g <strong>in</strong> an<br />
elderly person-headed household. The policy affords<br />
recommendations for actions and partnerships to<br />
improve <strong>in</strong> 9 identi ed key priority areas:<br />
• Education<br />
• Health<br />
• Psychosocial Support<br />
• Socio-economic Security<br />
• Food Security and Nutrition<br />
• Care and Support<br />
• Child Protection<br />
• Legal Support<br />
• Capacity Streng<strong>the</strong>n<strong>in</strong>g and Resource<br />
Mobilisation<br />
The recommended focus <strong>in</strong> <strong>the</strong> National Orphans<br />
and o<strong>the</strong>r Vulnerable Children Policy is at a household<br />
level as it serves <strong>the</strong> broadest set <strong>of</strong> target groups<br />
(approximately 80% <strong>of</strong> <strong>the</strong> identi ed OVC <strong>in</strong> <strong>Kampala</strong>)<br />
(KCCA 2008). This be<strong>in</strong>g said, orphans and street<br />
children are not explicitly mentioned <strong>in</strong> <strong>the</strong> plan with<br />
regards to programm<strong>in</strong>g.<br />
In <strong>the</strong> case <strong>of</strong> <strong>the</strong> street children, be<strong>in</strong>g a ‘rogue’ or<br />
‘vagabond’ has only recently been decrim<strong>in</strong>alised <strong>in</strong><br />
<strong>Uganda</strong> s<strong>in</strong>ce <strong>the</strong> adoption <strong>of</strong> <strong>the</strong> Children’s Statute<br />
<strong>in</strong> 1996. In reality, this statute (now re-adm<strong>in</strong>istered<br />
as <strong>the</strong> Children’s Act) has seen little <strong>in</strong> <strong>the</strong> way <strong>of</strong><br />
progress for street children (Wernham 2004). S<strong>in</strong>ce<br />
2002, street children that are found on <strong>the</strong> street are<br />
collected by police dur<strong>in</strong>g unannounced round-ups.<br />
These children are <strong>the</strong>n brought to Kampar<strong>in</strong>gisa<br />
National Rehabilitation Centre, where <strong>the</strong>y are kept<br />
for a period <strong>of</strong> 6 months until be<strong>in</strong>g returned to <strong>the</strong>ir<br />
place <strong>of</strong> orig<strong>in</strong>, though time spent at <strong>the</strong> centre <strong>of</strong>ten<br />
cont<strong>in</strong>ues for longer due to a lack <strong>of</strong> resources (Bett et<br />
al. 2005; van Blerk 2006).<br />
Slum Dwellers<br />
In 1986 <strong>the</strong> rst policy that regarded slum-dwellers<br />
was described with<strong>in</strong> <strong>the</strong> National Human Settlement<br />
Policy. This speci cally addressed improv<strong>in</strong>g access<br />
to <strong>in</strong>frastructure and services at affordable standards,<br />
and provid<strong>in</strong>g suf cient residential land and plots <strong>in</strong><br />
<strong>urban</strong> areas (UNDP & UMoLHUD 2008). This policy<br />
was amended by <strong>the</strong> National Shelter Strategy <strong>in</strong><br />
1987, with <strong>the</strong> goal <strong>of</strong> provid<strong>in</strong>g adequate shelter for<br />
all by <strong>the</strong> year 2000. As conceded by <strong>the</strong> <strong>Uganda</strong>n<br />
Government, this strategy did not suf ciently assess<br />
<strong>the</strong> needs <strong>of</strong> <strong>the</strong> <strong>urban</strong> <strong>poor</strong>. The PEAP also did not<br />
adequately address <strong>the</strong> importance <strong>of</strong> hous<strong>in</strong>g (and<br />
<strong>the</strong>refore slums). Consequently, this resulted <strong>in</strong> <strong>the</strong><br />
denial <strong>of</strong> <strong>the</strong> sector hav<strong>in</strong>g necessary resources for<br />
actors such as CBOs and NGOs to act effectively<br />
(UNDP & UMoLHUD 2008).<br />
As a result, <strong>the</strong> government released its <strong>of</strong> cial policy<br />
on slum areas <strong>in</strong> 2008, <strong>the</strong> National Slum Upgrad<strong>in</strong>g
and Action Plan. The overall goal <strong>of</strong> ‘slum upgrad<strong>in</strong>g’<br />
as stated by <strong>the</strong> government is ‘to improve <strong>the</strong> liv<strong>in</strong>g<br />
conditions <strong>of</strong> slum residents liv<strong>in</strong>g <strong>the</strong> most depressed<br />
physical conditions <strong>in</strong> <strong>Uganda</strong>’s <strong>urban</strong> areas on a<br />
susta<strong>in</strong>able basis and to prevent future slum growth’<br />
(UNDP & UMoLHUD 2008).<br />
The plan lists speci c objectives to achieve this goal:<br />
• To develop affordable and participatory<br />
measures for upgrad<strong>in</strong>g hous<strong>in</strong>g conditions<br />
and related support <strong>in</strong>frastructure <strong>in</strong> slum<br />
areas<br />
• To plan and implement <strong>in</strong> collaboration<br />
with stakeholders programmes and pilot<br />
projects to m<strong>in</strong>imize, elim<strong>in</strong>ate and curtail<br />
<strong>the</strong> growth <strong>of</strong> slums<br />
• To harness central government’s and<br />
<strong>urban</strong> authority’s resources <strong>in</strong> enhanc<strong>in</strong>g <strong>the</strong><br />
contribution <strong>of</strong> slums to <strong>the</strong> <strong>urban</strong> economy<br />
• To ensure and appropriate <strong>in</strong>stitutional<br />
framework and mechanisms for effective<br />
implementation <strong>of</strong> slum upgrad<strong>in</strong>g<br />
programmes by different stakeholders.<br />
These objectives are atta<strong>in</strong>ed through strategies that<br />
deal with tenure regularization and affordable land,<br />
<strong>the</strong> supply <strong>of</strong> affordable hous<strong>in</strong>g, improvement <strong>of</strong><br />
<strong>urban</strong> <strong>in</strong>frastructure and basic services, develop<strong>in</strong>g<br />
a slum-sensitive <strong>urban</strong> plann<strong>in</strong>g framework, nanc<strong>in</strong>g<br />
<strong>of</strong> slum upgrad<strong>in</strong>g, <strong>in</strong>clusion and participation <strong>of</strong> slum<br />
residents and o<strong>the</strong>r stakeholders (UNDP & UMoLHUD<br />
2008).<br />
Slum upgrad<strong>in</strong>g has been a feature <strong>of</strong> NGO and<br />
government <strong>in</strong>itiatives before <strong>the</strong> plan was devised,<br />
mostly those that improve <strong>in</strong>frastructure or access<br />
to basic services. A number <strong>of</strong> areas have already<br />
undergone this form <strong>of</strong> development, although<br />
before <strong>the</strong> slum upgrad<strong>in</strong>g policy took hold, <strong>the</strong> lack<br />
<strong>of</strong> protection from land tenure issues allowed land<br />
and structure owners to raise rents and sell <strong>of</strong>f <strong>the</strong>ir<br />
properties, alienat<strong>in</strong>g <strong>the</strong> orig<strong>in</strong>al residents.<br />
As it stands, <strong>the</strong>re are gaps <strong>in</strong> <strong>the</strong> policies that target<br />
<strong>the</strong> <strong>urban</strong> <strong>poor</strong>. Though <strong>the</strong> groups are recognised at a<br />
policy level by both government and o<strong>the</strong>r <strong>in</strong>stitutions<br />
such as NGOs and CBOs, <strong>in</strong>terventions and contextdriven<br />
actions rema<strong>in</strong> limited.<br />
7
8<br />
Research<br />
There are certa<strong>in</strong> aspects <strong>of</strong> <strong>livelihoods</strong> that<br />
are particular to <strong>urban</strong> areas. ACF (2010) has<br />
identi ed some <strong>of</strong> <strong>the</strong>se issues that <strong>in</strong>deed perta<strong>in</strong><br />
to <strong>the</strong> study <strong>of</strong> <strong>urban</strong> <strong>Kampala</strong>.<br />
• Urban environments, because <strong>of</strong><br />
<strong>the</strong>ir dependency on services, are more<br />
susceptible to changes or shocks made <strong>in</strong><br />
policy<br />
• Urban districts are unique from one ano<strong>the</strong>r<br />
as each has its own social organization and<br />
methods <strong>of</strong> access<strong>in</strong>g services.<br />
• Multiple social and economic models<br />
make target<strong>in</strong>g for a new project more<br />
complex<br />
• Urbanization creates <strong>urban</strong> sprawl, which<br />
yields new, marg<strong>in</strong>alized areas as costs<br />
for provid<strong>in</strong>g services to <strong>the</strong>se areas are<br />
prohibitive<br />
• Contrary to rural areas, poverty is only one<br />
cause <strong>of</strong> exclusion <strong>in</strong> <strong>urban</strong> areas. Social<br />
capital can play a higher role.<br />
• The formal labour market <strong>of</strong>ten excludes<br />
<strong>the</strong> recent rural <strong>poor</strong> migrants. When<br />
employment is obta<strong>in</strong>ed, it is <strong>of</strong>ten temporary.<br />
Thus, labourers from rural backgrounds<br />
have dif culties adjust<strong>in</strong>g to demands <strong>of</strong><br />
non-agricultural work.<br />
3.1<br />
Interest <strong>of</strong> Research<br />
In addition to <strong>the</strong> general effects <strong>of</strong> rapid<br />
<strong>urban</strong>ization, <strong>the</strong> health and nutrition consequences<br />
are becom<strong>in</strong>g prevalent <strong>in</strong> <strong>Kampala</strong>. mp mpal al ala. a. a Thi This hi h s is evi evidenced vi v de denc nc nced ed<br />
by a recent extraord<strong>in</strong>ary <strong>in</strong>crease e <strong>in</strong><br />
n th t<strong>the</strong> e ad aadmission mi miss ss ssio io ion n<br />
<strong>of</strong> children to malnutrition treatment pr prog programmes og o ra ramm mm mmes es<br />
with<strong>in</strong> <strong>the</strong> previous year and was one <strong>of</strong> <strong>the</strong> <strong>in</strong>stigat<strong>in</strong>g stig igat at a <strong>in</strong> i g<br />
factors for <strong>the</strong> study.<br />
As <strong>the</strong>re has been an <strong>in</strong>crease <strong>in</strong> population <strong>in</strong> <strong>the</strong><br />
city itself, one may <strong>in</strong>fer from <strong>the</strong> issues previously<br />
identi ed by ACF that <strong>the</strong>re has been a change <strong>in</strong><br />
dynamic between FSL, NUT and WASH components<br />
which are apparent at household, community, and/or<br />
<strong>in</strong>stitutional/policy levels. Therefore <strong>the</strong>re is a need for<br />
<strong>the</strong>se aspects to be assessed <strong>in</strong> order to ga<strong>in</strong> a proper<br />
basel<strong>in</strong>e.<br />
One may also <strong>in</strong>fer that due to basic economic<br />
models, <strong>the</strong> <strong>in</strong>crease <strong>in</strong> population has created a<br />
higher demand for food, water, and basic services.<br />
The effects <strong>of</strong> this shift <strong>in</strong> <strong>the</strong> demand curve need to<br />
be properly pro led.<br />
An issue for this particular study is that ACF has limited<br />
prior experience <strong>in</strong> non-crisis <strong>urban</strong> assessments,<br />
notably <strong>in</strong> <strong>Uganda</strong>. Only scattered <strong>in</strong>formation exists<br />
on <strong>the</strong> <strong>urban</strong> <strong>poor</strong> <strong>in</strong> <strong>Kampala</strong> and to date, no formal<br />
study has attempted to comprehensively pro le <strong>the</strong><br />
<strong>livelihoods</strong> and <strong>the</strong> <strong>in</strong>teractions <strong>of</strong> FSL, NUT and WASH<br />
with<strong>in</strong> <strong>the</strong>se groups. This leaves a lack <strong>of</strong> precedent<br />
regard<strong>in</strong>g <strong>the</strong> implementation <strong>of</strong> <strong>the</strong> study.<br />
The absence <strong>of</strong> reliable data <strong>in</strong>dicates that <strong>the</strong> issues<br />
are globally unknown at household, community and
<strong>in</strong>stitutional levels; <strong>the</strong>refore a syn<strong>the</strong>sis <strong>of</strong> <strong>in</strong>formation<br />
from each <strong>of</strong> <strong>the</strong>se levels is needed to properly pro le<br />
and understand <strong>the</strong> context and daily lives <strong>of</strong> <strong>the</strong><br />
<strong>urban</strong> <strong>poor</strong>.<br />
3.2<br />
Research Question<br />
Given <strong>the</strong>se calls to <strong>in</strong>vestigation, <strong>the</strong> research<br />
problem is presented as:<br />
3.3 Objectives<br />
What are <strong>the</strong> livelihood strategies <strong>of</strong> <strong>the</strong> <strong>urban</strong> <strong>poor</strong> <strong>in</strong> <strong>Kampala</strong> and which are <strong>the</strong><br />
forces that promote or oppose <strong>the</strong>ir susta<strong>in</strong>ability?<br />
With <strong>the</strong> research question <strong>in</strong> m<strong>in</strong>d and <strong>the</strong> context<br />
<strong>of</strong> <strong>the</strong> study given, <strong>the</strong> research was performed with<br />
achiev<strong>in</strong>g <strong>the</strong> follow<strong>in</strong>g objectives:<br />
3.3.1 Ma<strong>in</strong> Objective<br />
• To ga<strong>in</strong> a general understand<strong>in</strong>g <strong>of</strong> <strong>the</strong> <strong>livelihoods</strong> present amongst <strong>the</strong> population <strong>of</strong> <strong>the</strong> <strong>urban</strong><br />
<strong>poor</strong> <strong>in</strong> <strong>Kampala</strong>, <strong>Uganda</strong> and <strong>the</strong> context <strong>in</strong> which <strong>the</strong>y exist, so as to form a foundation for future<br />
programm<strong>in</strong>g that is effective and well targeted.<br />
3.3.2 Sub-Objectives<br />
• To identify which populations are vulnerable groups and characterize <strong>the</strong> ma<strong>in</strong> livelihood pro les,<br />
identify<strong>in</strong>g speci c vulnerabilities and cop<strong>in</strong>g mechanisms<br />
• To pro le food access, availability, and utilization <strong>in</strong> <strong>Kampala</strong> as it perta<strong>in</strong>s to <strong>the</strong> targeted groups<br />
• To identify health and malnutrition issues associated with targeted group <strong>livelihoods</strong><br />
• To characterize water access, availability and quality, as well as that <strong>of</strong> sanitation and hygiene for<br />
<strong>the</strong> identi ed groups.<br />
9
10<br />
Methodology<br />
4.1 Frameworks<br />
In order to realise <strong>the</strong> objective, frameworks were put<br />
<strong>in</strong> place to guide <strong>the</strong> plann<strong>in</strong>g, implementation and<br />
subsequent analysis <strong>of</strong> <strong>the</strong> study.<br />
4.1.1 Conceptual Frameworks<br />
At <strong>the</strong> orig<strong>in</strong> <strong>of</strong> this project, two <strong>the</strong>oretical frameworks<br />
were presented as guidel<strong>in</strong>es for <strong>the</strong> assessment.<br />
The Susta<strong>in</strong>able Livelihoods Framework (SLF) was<br />
considered to pro le <strong>the</strong> targeted groups <strong>in</strong> a holistic<br />
manner; that is, to consider all factors and assets that<br />
may affect an <strong>in</strong>dividual’s livelihood. For <strong>the</strong> sake <strong>of</strong><br />
this study, <strong>the</strong> de nition <strong>of</strong> a livelihood is taken from<br />
Chambers and Conway (1992):<br />
A livelihood comprises <strong>the</strong> capabilities, assets<br />
(stores, resources, claims and access) and<br />
activities required for a means <strong>of</strong> liv<strong>in</strong>g: a livelihood<br />
is susta<strong>in</strong>able which can cope with and recover<br />
from stress and shocks, ma<strong>in</strong>ta<strong>in</strong> or enhance its<br />
capabilities and assets, and provide susta<strong>in</strong>able<br />
livelihood opportunities for <strong>the</strong> next generation;<br />
and which contributes net bene ts to o<strong>the</strong>r<br />
<strong>livelihoods</strong> at <strong>the</strong> local and global levels and <strong>in</strong> <strong>the</strong><br />
short and long term.<br />
The SLF is an approach which <strong>in</strong>corporates <strong>the</strong><br />
susta<strong>in</strong>able human development approach as<br />
adopted by UNDP along with <strong>the</strong> concept <strong>of</strong> capitals<br />
and capabilities as described by Amartya Sen. To<br />
illum<strong>in</strong>ate <strong>the</strong> different levels <strong>of</strong> causes that can lead to<br />
malnutrition, <strong>the</strong> UNICEF Causal Model <strong>of</strong> Malnutrition<br />
was also considered as a widely accepted framework<br />
so as to be able to describe <strong>the</strong> processes and forces<br />
<strong>in</strong>volved contribut<strong>in</strong>g to malnutrition with<strong>in</strong> <strong>the</strong>se<br />
groups.<br />
Upon review <strong>of</strong> <strong>the</strong> food security assessment <strong>of</strong> high<br />
density <strong>urban</strong> areas <strong>in</strong> Kenya (Nzuma & Ochola,<br />
2010), a third conceptual framework was adopted<br />
retroactively for this project. The Food and Nutrition
Security Conceptual Framework as described by<br />
<strong>the</strong> World Food Programme (2009) provides an<br />
encompass<strong>in</strong>g viewpo<strong>in</strong>t on <strong>the</strong> factors that come <strong>in</strong>to<br />
play <strong>in</strong> an assessment such as this. This framework<br />
takes <strong>in</strong>to account <strong>the</strong> ve capitals and exposure to<br />
shocks from <strong>the</strong> SLF, and <strong>in</strong>corporates <strong>the</strong> hierarchy<br />
<strong>of</strong> actors that may <strong>in</strong> uence malnutrition from <strong>the</strong><br />
causal model <strong>of</strong> malnutrition. Additionally, it expla<strong>in</strong>s<br />
<strong>the</strong> <strong>in</strong>teractions and contexts at <strong>in</strong>dividual, household,<br />
and community levels and is <strong>the</strong>refore <strong>the</strong> most holistic<br />
model to implement <strong>in</strong> this context.<br />
The ve capitals <strong>of</strong> <strong>the</strong> SLF are given as a base to<br />
describe different <strong>livelihoods</strong>, and do so through<br />
<strong>in</strong>teraction <strong>in</strong> addition to <strong>the</strong>ir <strong>in</strong>dividual merits. The<br />
follow<strong>in</strong>g descriptions are adapted from DFID (1999)<br />
Economic/F<strong>in</strong>ancial<br />
One <strong>of</strong> <strong>the</strong> key livelihood assets, nancial capital<br />
describes <strong>the</strong> nancial and economic resources that<br />
are available to an <strong>in</strong>dividual to achieve <strong>the</strong>ir livelihood<br />
objectives. Urban areas hav<strong>in</strong>g pr<strong>in</strong>cipally cashbased<br />
economies, this is one <strong>of</strong> <strong>the</strong> most apparent<br />
capitals to consider as it can be converted <strong>in</strong>to and<br />
utilized for o<strong>the</strong>r capitals and assets. In an <strong>urban</strong><br />
context and <strong>the</strong>refore <strong>the</strong> context <strong>of</strong> this study, it is <strong>the</strong><br />
most commonly utilized capital for direct achievement<br />
<strong>of</strong> livelihood objectives such as purchas<strong>in</strong>g food to<br />
reduce food <strong>in</strong>security or purchas<strong>in</strong>g medication to<br />
alleviate or prevent illness.<br />
Human<br />
Human capital can be considered all <strong>the</strong> th<strong>in</strong>gs that<br />
a human be<strong>in</strong>g can contribute to <strong>the</strong> livelihood <strong>of</strong> a<br />
household, such as knowledge, skills, and capacities<br />
to work and adapt. At its most fundamental level <strong>in</strong><br />
an <strong>urban</strong> context, human capital can be considered<br />
a factor <strong>of</strong> <strong>the</strong> amount and quality <strong>of</strong> labour available<br />
to a household, which can differ dependent on <strong>the</strong><br />
aforementioned qualities.<br />
Social<br />
Networks and connectedness can <strong>in</strong>crease people’s<br />
trust and ability to work toge<strong>the</strong>r and expand <strong>the</strong>ir<br />
access to wider <strong>in</strong>stitutions. This <strong>in</strong>crease <strong>in</strong> trust can<br />
give a sense <strong>of</strong> community to an area, can diffuse <strong>the</strong><br />
workload for a project, and can help <strong>in</strong> <strong>the</strong> upkeep and<br />
management <strong>of</strong> communal resources.<br />
Natural<br />
Natural capital describes all <strong>of</strong> <strong>the</strong> natural public<br />
resources that are available to an <strong>in</strong>dividual for<br />
support<strong>in</strong>g <strong>the</strong>ir livelihood. This <strong>in</strong>cludes a wide range<br />
<strong>of</strong> assets, from <strong>the</strong> <strong>in</strong>tangible such as <strong>the</strong> atmosphere<br />
and biodiversity, to divisible assets used directly<br />
for production such as trees and land. In an <strong>urban</strong><br />
context, natural capital is not necessarily as <strong>in</strong> uential<br />
as <strong>the</strong> o<strong>the</strong>rs or as it may be <strong>in</strong> an agricultural/rural<br />
sett<strong>in</strong>g, however environmental issues such as ra<strong>in</strong>fall<br />
and ood<strong>in</strong>g or drought, and <strong>the</strong> natural capital that it<br />
takes to provide <strong>the</strong> food that is delivered to <strong>the</strong> <strong>urban</strong><br />
centres are extremely important.<br />
Physical<br />
Physical capital describes <strong>the</strong> available <strong>in</strong>frastructure<br />
that is used to support <strong>livelihoods</strong>. This can mean<br />
transport, shelter, water supply and sanitation, energy,<br />
communications, and tools that aid productivity.<br />
Lack<strong>in</strong>g one or more <strong>of</strong> <strong>the</strong>se dimensions can<br />
impact health and can place obstacles <strong>in</strong> <strong>the</strong> way <strong>of</strong><br />
access<strong>in</strong>g education, health services or <strong>in</strong>hibit <strong>in</strong>come<br />
generation.<br />
4.1.2 Analytical Framework<br />
A study performed by Concern Worldwide <strong>in</strong> Dhaka,<br />
Bangladesh described a contextual analysis and<br />
target<strong>in</strong>g system which Concern had utilized to review<br />
<strong>the</strong> pert<strong>in</strong>ence and ef cacy <strong>of</strong> its ongo<strong>in</strong>g programs<br />
<strong>in</strong> <strong>the</strong> city’s slum areas. The summary <strong>of</strong> this project<br />
provided a base to work from <strong>in</strong> terms <strong>of</strong> design<strong>in</strong>g <strong>the</strong><br />
11
12<br />
analytical framework for this study. Figure 2 describes<br />
<strong>the</strong> framework that was adapted with <strong>the</strong> goal <strong>of</strong><br />
provid<strong>in</strong>g evidence-based reason<strong>in</strong>g for <strong>in</strong>clusion <strong>of</strong><br />
<strong>the</strong> groups that will be pro led, with speci c focus<br />
on <strong>the</strong> ACF mandate <strong>of</strong> treat<strong>in</strong>g underly<strong>in</strong>g causes <strong>of</strong><br />
malnutrition.<br />
4.2<br />
Approaches and Tools<br />
The study was ra<strong>the</strong>r large <strong>in</strong> context and needed to<br />
be both comprehensive and well-targeted to t with<strong>in</strong><br />
<strong>the</strong> constra<strong>in</strong>ts as detailed <strong>in</strong> <strong>the</strong> study limits section.<br />
It was <strong>the</strong>refore conducted <strong>in</strong> two phases.<br />
The rst phase was implemented at an <strong>in</strong>stitutional level,<br />
i.e. key actors who ei<strong>the</strong>r work with or are <strong>in</strong> uential <strong>in</strong><br />
<strong>the</strong> policies that concern <strong>the</strong> target population. This<br />
was accomplished by identify<strong>in</strong>g groups that could<br />
be <strong>in</strong>cluded under <strong>the</strong> study’s general target <strong>of</strong> ‘<strong>urban</strong><br />
<strong>poor</strong> <strong>in</strong> <strong>Kampala</strong>’. The groups that were identi ed<br />
were <strong>the</strong>n detailed so that speci c groups could be<br />
selected for fur<strong>the</strong>r <strong>in</strong>vestigation <strong>in</strong> <strong>the</strong> study.<br />
Phase two <strong>of</strong> <strong>the</strong> study was a targeted and detailed<br />
analysis <strong>of</strong> <strong>the</strong> issues that contribute to a livelihood <strong>in</strong><br />
<strong>the</strong> slums, with speci c attention paid to food security,<br />
nutrition, as well as water, sanitation and hygiene.<br />
This portion <strong>of</strong> <strong>the</strong> study focused on key actors <strong>in</strong> <strong>the</strong><br />
community level as well as a household study that<br />
considered <strong>the</strong> <strong>in</strong>dividual context.<br />
4.2.1 Qualify<strong>in</strong>g ‘Urban Poor’ for <strong>the</strong> Study<br />
The rst goal <strong>of</strong> <strong>the</strong> study was to de ne and standardize<br />
<strong>the</strong> term ‘<strong>urban</strong> <strong>poor</strong>’ for <strong>the</strong> relevant context. The<br />
Contextual analysis <strong>of</strong> <strong>urban</strong> <strong>poor</strong> at <strong>in</strong>stitutional and<br />
community levels<br />
Identification <strong>of</strong> vulnerable groups<br />
Specification and selection <strong>of</strong> groups for fur<strong>the</strong>r<br />
Collection <strong>of</strong> household-level data<br />
Syn<strong>the</strong>sis and analysis <strong>of</strong> <strong>in</strong>formation<br />
Identification <strong>of</strong> possible areas <strong>of</strong> <strong>in</strong>tervention<br />
phrase ‘<strong>urban</strong> <strong>poor</strong>’ evokes a relation with poverty,<br />
though poverty itself is not a standardized de nition.<br />
Therefore multiple dimensions had to be considered<br />
along with <strong>the</strong>ir merits and shortcom<strong>in</strong>gs. Due to <strong>the</strong><br />
standardized methods associated with <strong>the</strong>m, economic<br />
measures were <strong>of</strong> primary consideration while o<strong>the</strong>r<br />
aspects served to complement <strong>the</strong> nd<strong>in</strong>gs.<br />
4.2.1.1 Relative Measures<br />
The rst methods used were measures <strong>of</strong> relative<br />
poverty, that is, to de ne poverty by where a<br />
speci c <strong>in</strong>come falls with<strong>in</strong> a certa<strong>in</strong> group (Bellù &<br />
Liberati 2005b). In this case, <strong>the</strong> poverty threshold<br />
was determ<strong>in</strong>ed by consider<strong>in</strong>g <strong>the</strong> group as all<br />
respondents who provided <strong>in</strong>come <strong>in</strong>formation. For<br />
this, <strong>in</strong>come level (IL) and <strong>in</strong>come position (IP) poverty<br />
were calculated.<br />
Income level is de ned as any <strong>in</strong>come less than<br />
<strong>the</strong> mean <strong>of</strong> <strong>the</strong> group (utilised <strong>in</strong> this exercise) or<br />
any percentage <strong>the</strong>re<strong>of</strong>. Income position considers<br />
position <strong>in</strong> <strong>the</strong> percentile rank. Income position was<br />
determ<strong>in</strong>ed us<strong>in</strong>g qu<strong>in</strong>tiles.<br />
4.2.1.2 Absolute Measures<br />
Development <strong>of</strong><br />
criteria for <strong>in</strong>clusion<br />
<strong>in</strong> <strong>the</strong> study<br />
(Based on ACF<br />
mandate <strong>of</strong><br />
malnutrition)<br />
An absolute measure de nes a poverty l<strong>in</strong>e that is<br />
used as a threshold. This is similarly determ<strong>in</strong>ed by<br />
<strong>in</strong>formation from a population; however, whe<strong>the</strong>r an<br />
<strong>in</strong>dividual is considered to be <strong>in</strong> poverty or not is<br />
based on a threshold that is determ<strong>in</strong>ed by a measure<br />
such as <strong>in</strong>come or expenses and is thus not relative to
<strong>the</strong> rest <strong>of</strong> said population (Bellù & Liberati 2005a).<br />
The <strong>Uganda</strong>n Government utilizes <strong>the</strong> Cost <strong>of</strong> Basic<br />
Needs (CBN) poverty determ<strong>in</strong>ation which, simply put,<br />
measures expenditure on food and is <strong>the</strong>n adjusted for<br />
o<strong>the</strong>r non-food items by essentially <strong>in</strong>creas<strong>in</strong>g <strong>the</strong> limits<br />
by ma<strong>the</strong>matical derivation (Ravallion & Bidani 1994).<br />
This is a complex measure and as such a poverty limit<br />
for ‘Central District Urban <strong>Uganda</strong>’, calculated <strong>in</strong> 1993<br />
by Appleton (2003), was used after be<strong>in</strong>g adjusted for<br />
<strong>in</strong> ation as is commonly done <strong>in</strong> <strong>the</strong>se measures (Citro<br />
& Michael 1995).<br />
Lastly, <strong>the</strong> Food Energy Intake (FEI) measure was<br />
used. This measure is similar to <strong>the</strong> CBN, however<br />
it does not account for non-food items. It essentially<br />
de nes poverty by a m<strong>in</strong>imum food <strong>in</strong>take that is<br />
required to lead a decent life (Wodon 1997). This limit<br />
was for ‘Urban’ regions <strong>in</strong> <strong>Uganda</strong> and was taken from<br />
a study that utilised data from 1992 and likewise was<br />
adjusted for <strong>in</strong> ation (Okurut et al. 2002).<br />
4.3<br />
Phase 1 – Identi cation and<br />
Speci cation <strong>of</strong> Groups and<br />
Areas for Fur<strong>the</strong>r Investigation<br />
4.3.1 Study Tools<br />
TABLE 1: POVERTY LINE CALCULATIONS<br />
Measure<br />
Poverty<br />
IL IP CBN FEI<br />
L<strong>in</strong>e -<br />
UShs/day<br />
25255 18000 854 446<br />
Semi-Structured Interviews were sought with actors<br />
from representative organizations from each capital<br />
<strong>of</strong> <strong>the</strong> Susta<strong>in</strong>able Livelihood Framework. Examples <strong>of</strong><br />
<strong>the</strong> <strong>in</strong>terview topics can be found <strong>in</strong> Appendix I.<br />
Human – Government health centres III and IV<br />
(3 <strong>in</strong>terviews); M<strong>in</strong>istry for Gender, Labour,<br />
Social Development (1), Mulago National<br />
Referral Hospital (2)<br />
Natural – Urban Agriculture Organizations (2);<br />
M<strong>in</strong>istry for Lands, Hous<strong>in</strong>g and Urban<br />
Development (1)<br />
Social – UN-HABITAT (1); Local Council<br />
Representatives (3); Community Based<br />
Organizations (2); M<strong>in</strong>istry for Gender, Labour,<br />
Social Development (1)<br />
Physical – M<strong>in</strong>istry for Lands, Hous<strong>in</strong>g and<br />
Urban Development (1); UN-HABITAT (UNDP)<br />
(1), Community Shelters <strong>Uganda</strong> (1)<br />
F<strong>in</strong>ancial – Groups who provide credit/sav<strong>in</strong>gs<br />
programs for <strong>urban</strong> <strong>poor</strong> (2)<br />
Total <strong>in</strong>stitutional <strong>in</strong>terviews: 22<br />
4.3.1.1 Institutional Level Investigation<br />
The rst phase <strong>of</strong> <strong>the</strong> study lasted for approximately<br />
one month. Non-governmental organizations that had<br />
ei<strong>the</strong>r already been work<strong>in</strong>g with <strong>urban</strong> <strong>poor</strong> groups or<br />
were plann<strong>in</strong>g <strong>the</strong>ir own assessments were contacted<br />
through ACF’s <strong>in</strong>-country pr<strong>of</strong>essional network.<br />
Governmental and UN organizations were selected<br />
based on <strong>the</strong>ir areas <strong>of</strong> focus which were obta<strong>in</strong>ed<br />
through <strong>the</strong>ir websites or through <strong>the</strong> <strong>Uganda</strong> National<br />
NGO Forum, previous published studies and reports,<br />
and recommendations by ACF-USA <strong>Uganda</strong> staff.<br />
The pr<strong>in</strong>ciple goal <strong>of</strong> <strong>the</strong>se <strong>in</strong>terviews was to determ<strong>in</strong>e<br />
through qualitative <strong>in</strong>vestigation which group<strong>in</strong>gs were<br />
utilised to classify <strong>the</strong> <strong>urban</strong> <strong>poor</strong> with<strong>in</strong> <strong>the</strong> city.<br />
The group<strong>in</strong>gs were based on ‘lifestyle’ ra<strong>the</strong>r than<br />
any speci c geographic, economic or demographic<br />
characteristic because <strong>of</strong> <strong>the</strong> aforementioned lack <strong>of</strong><br />
13
14<br />
census data on <strong>the</strong> <strong>urban</strong> <strong>poor</strong>. Three groups were<br />
decidedly well cited as fall<strong>in</strong>g <strong>in</strong>to <strong>the</strong> context <strong>of</strong> <strong>the</strong><br />
phrase ‘<strong>urban</strong> <strong>poor</strong>’, us<strong>in</strong>g <strong>in</strong>dicat<strong>in</strong>g phrases such<br />
as ‘food <strong>in</strong>secure’ and ‘marg<strong>in</strong>alized’ as well as cit<strong>in</strong>g<br />
issues with <strong>the</strong>ir <strong>livelihoods</strong> such as unemployment or<br />
underemployment, lack <strong>of</strong> suitable hous<strong>in</strong>g, and be<strong>in</strong>g<br />
at higher risk for both chronic and acute communicable<br />
diseases. Tak<strong>in</strong>g account <strong>of</strong> <strong>the</strong>se <strong>in</strong>dications, four<br />
criteria had to be met to be considered for <strong>in</strong>clusion<br />
<strong>in</strong> this study:<br />
Lack<strong>in</strong>g source <strong>of</strong> regular or suf cient <strong>in</strong>come<br />
Typical work for <strong>the</strong> <strong>urban</strong> <strong>poor</strong> is that <strong>of</strong> unskilled<br />
labour on a per-diem basis, leav<strong>in</strong>g a daily uncerta<strong>in</strong>ty<br />
<strong>of</strong> a m<strong>in</strong>imal <strong>in</strong>come. For <strong>the</strong> majority <strong>of</strong> <strong>urban</strong> <strong>poor</strong><br />
<strong>in</strong> <strong>Kampala</strong>, work is typically <strong>in</strong> <strong>the</strong> sectors <strong>of</strong> petty<br />
trade, casual unskilled labour, illicit/immoral activities<br />
(prostitution, <strong>the</strong>ft, etc.), or any comb<strong>in</strong>ation <strong>the</strong>re<strong>of</strong>.<br />
Susceptible to or affected by regular illness<br />
Chronic exposure to disease causes a multitude <strong>of</strong><br />
complications which <strong>in</strong>hibits <strong>the</strong> patient’s ability to<br />
work through lowered productivity or lost work<strong>in</strong>g<br />
days. Any one day not work<strong>in</strong>g can mean a day without<br />
food. If this person is <strong>the</strong> primary <strong>in</strong>come earner <strong>of</strong> a<br />
household <strong>the</strong> effect can reach each <strong>in</strong>dividual that<br />
is a part <strong>of</strong> that household. This effect can also be<br />
seen when <strong>the</strong>re is an ill child or elderly relative <strong>in</strong> <strong>the</strong><br />
household, as one <strong>in</strong>come-earner is forced to miss<br />
a day <strong>of</strong> work to look after <strong>the</strong> ill. Additionally, as <strong>the</strong><br />
<strong>poor</strong> <strong>of</strong>ten live <strong>in</strong> con ned residences, communicable<br />
diseases are more easily spread.<br />
Liv<strong>in</strong>g <strong>in</strong> unsuitable/uncerta<strong>in</strong> shelter<br />
Hous<strong>in</strong>g for <strong>the</strong> <strong>poor</strong> is <strong>of</strong>ten limited to <strong>in</strong>formal<br />
structures <strong>of</strong> unsuitable build<strong>in</strong>g materials which<br />
typically consist <strong>of</strong> one multi-purpose room that is<br />
occupied by more than one person. No public/social<br />
hous<strong>in</strong>g is available <strong>in</strong> <strong>Kampala</strong>, so <strong>the</strong> <strong>poor</strong> who do<br />
not have access to hous<strong>in</strong>g <strong>in</strong> <strong>the</strong> slum areas reside<br />
ei<strong>the</strong>r as squatters <strong>in</strong> <strong>the</strong> aforementioned shelters<br />
attached to permanent structures, or are homeless.<br />
Household/<strong>in</strong>dividual lacks access to basic services<br />
Slum areas and o<strong>the</strong>r <strong>in</strong>formal settlements are<br />
notoriously underserved <strong>in</strong> regards to basic services.<br />
Water, sanitation and hygiene are <strong>the</strong> most frequently<br />
cited as severe issues by <strong>the</strong> <strong>in</strong>terviewed actors.<br />
Water sources and <strong>the</strong>ir quality are ill-managed s<strong>in</strong>ce<br />
public wells are not regularly tested for safety and <strong>the</strong><br />
availability can depend on <strong>the</strong> season. Water may also<br />
be a daily expense for a household and if puri cation<br />
procedures are not regularly adhered to, can be a<br />
source <strong>of</strong> illness for <strong>the</strong> users. Public latr<strong>in</strong>es that are<br />
functional are prone to over ow<strong>in</strong>g and ood<strong>in</strong>g dur<strong>in</strong>g<br />
ra<strong>in</strong>s. The biological hazards that occur with this are<br />
implicit, and <strong>the</strong> regularity <strong>of</strong> <strong>the</strong>se occurrences yields<br />
a severe and persistent risk <strong>of</strong> illness to those whom<br />
are affected. Sanitation and collection <strong>of</strong> rubbish is<br />
also irregular and limited. Designated refuse sites are<br />
generally not present with<strong>in</strong> <strong>in</strong>formal settlements and<br />
those that exist are lled quickly.<br />
After identi cation <strong>of</strong> <strong>the</strong> groups, decision for fur<strong>the</strong>r<br />
<strong>in</strong>vestigation was based on consultation with <strong>the</strong> ACF-<br />
USA staff <strong>in</strong> both <strong>Uganda</strong> and at <strong>the</strong> headquarters <strong>in</strong><br />
New York. The nal selection was based on ease <strong>of</strong><br />
identi cation, accessibility and potential number <strong>of</strong><br />
those affected (hence number <strong>of</strong> potential bene ciaries<br />
<strong>of</strong> future programm<strong>in</strong>g).<br />
It was <strong>the</strong>n decided to focus on slum areas and <strong>the</strong>ir<br />
residents.<br />
The geographic designation and standardised<br />
characteristics <strong>of</strong> a slum (expanded upon below) make<br />
this group <strong>the</strong> most easily accessible and likewise<br />
provides <strong>the</strong> largest population for <strong>in</strong>vestigation.<br />
A large number <strong>of</strong> slum areas exist with<strong>in</strong> <strong>Kampala</strong> and<br />
each has a different context associated with it based<br />
on location, pr<strong>in</strong>ciple activities, and overall standard<br />
<strong>of</strong> liv<strong>in</strong>g. Identi cation <strong>of</strong> slum areas was completed<br />
through previous data reported by <strong>the</strong> <strong>Kampala</strong> City<br />
Capital Authority (KCCA) (UN-HABITAT 2007), <strong>the</strong>
M<strong>in</strong>istry <strong>of</strong> Lands Hous<strong>in</strong>g and Urban Development,<br />
and utiliz<strong>in</strong>g Google Maps s<strong>of</strong>tware. A slum area was<br />
de ned us<strong>in</strong>g <strong>the</strong> criteria as speci ed by UN-HABITAT<br />
(2003):<br />
1. Lack <strong>of</strong> basic services<br />
2. Substandard hous<strong>in</strong>g or illegal and<br />
<strong>in</strong>adequate build<strong>in</strong>g structures<br />
3. Overcrowd<strong>in</strong>g and high-density<br />
4. Unhealthy liv<strong>in</strong>g conditions and<br />
hazardous locations<br />
5. Insecure tenure; irregular or <strong>in</strong>formal<br />
settlements<br />
6. Poverty and social exclusion<br />
A seventh criterion was de ned by a m<strong>in</strong>imum<br />
settlement size, with an example from Kolkata <strong>of</strong> 700<br />
square meters. However <strong>the</strong> KCCA does not <strong>of</strong>fer this<br />
<strong>in</strong>formation and as such, was omitted for <strong>the</strong> purposes<br />
<strong>of</strong> this study. A previous study had found that <strong>in</strong> 2003,<br />
slum areas had a population density <strong>of</strong> over 14,000<br />
people per square kilometre, nearly 5000 more<br />
residents than <strong>the</strong> <strong>Kampala</strong> average <strong>in</strong> 2011 (UMoH et<br />
al. 2009; The World Bank 2011).<br />
On <strong>the</strong> basis <strong>of</strong> this <strong>in</strong>formation, as well as <strong>the</strong><br />
aforementioned <strong>in</strong>stitutional <strong>in</strong>terviews, three slum<br />
areas were identi ed to be <strong>the</strong> ‘worst <strong>of</strong>f’ by <strong>the</strong> actors<br />
<strong>in</strong>terviewed, despite empirical evidence not be<strong>in</strong>g<br />
available as data for additional characterisation <strong>of</strong> <strong>the</strong><br />
slums. These circumstances hav<strong>in</strong>g been considered,<br />
<strong>the</strong> areas <strong>of</strong> Bwaise I, II, and III, Kisenyi III, and<br />
Namuwongo were selected for <strong>in</strong>clusion <strong>in</strong> this study.<br />
A previous nutrition monitor<strong>in</strong>g survey <strong>in</strong> <strong>the</strong> slums and<br />
<strong>the</strong> government’s district pro le for <strong>the</strong> development<br />
<strong>of</strong> its national Slum Upgrad<strong>in</strong>g Strategy and Action<br />
Plan identi ed two <strong>of</strong> <strong>the</strong> three same areas which were<br />
chosen for this study (Kisenyi and Bwaise), validat<strong>in</strong>g<br />
<strong>the</strong> selection (UMoFPED 2000; UMoH et al. 2009).<br />
4.4<br />
Phase 2 – Exploration <strong>of</strong> <strong>livelihoods</strong><br />
and <strong>the</strong> conditions <strong>in</strong> which <strong>the</strong>y<br />
exist<br />
Once <strong>the</strong> groups were speci ed for <strong>in</strong>clusion <strong>in</strong> <strong>the</strong><br />
study, fur<strong>the</strong>r <strong>in</strong>vestigation was needed to form an<br />
appropriate pro le <strong>of</strong> each area, pay<strong>in</strong>g special<br />
attention to <strong>the</strong> three ma<strong>in</strong> areas <strong>of</strong> <strong>in</strong>terest for this<br />
study: FSL, NUT, and WASH while also <strong>in</strong>corporat<strong>in</strong>g<br />
<strong>the</strong> ve capitals <strong>of</strong> <strong>the</strong> SLF.<br />
4.4.1 Community Level<br />
The rst step was sensitization <strong>of</strong> <strong>the</strong> communities.<br />
Members <strong>of</strong> <strong>the</strong> National Slum Dwellers Federation<br />
(NSDF) network <strong>of</strong> sav<strong>in</strong>gs groups were contacted<br />
through <strong>the</strong>ir association with Shack/Slum Dwellers<br />
International (SDI). These members aided <strong>the</strong> research<br />
by play<strong>in</strong>g <strong>the</strong> role <strong>of</strong> key-<strong>in</strong>formants to each area.<br />
These <strong>in</strong>formants were typically a leader <strong>of</strong> a sav<strong>in</strong>gs<br />
group with<strong>in</strong> <strong>the</strong> slum community itself and also held<br />
higher leadership roles with<strong>in</strong> <strong>the</strong> community. The<br />
Bwaise representative was an elected local councillor<br />
(LC), <strong>the</strong> Kisenyi representative was <strong>the</strong> head <strong>of</strong> Kiti<br />
School and an LC, and <strong>the</strong> Namuwongo representative<br />
had previously been work<strong>in</strong>g as a team leader with a<br />
local NGO which had programmes <strong>in</strong> <strong>the</strong> area.<br />
Interviews were held with each <strong>of</strong> <strong>the</strong> key <strong>in</strong>formants<br />
at <strong>the</strong> SDI <strong>of</strong> ces. These <strong>in</strong>terviews were guided by<br />
conversation topics as listed <strong>in</strong> Appendix II. These<br />
<strong>in</strong>terviews were meant to ga<strong>in</strong> a general understand<strong>in</strong>g<br />
<strong>of</strong> <strong>the</strong> slums <strong>in</strong> terms <strong>of</strong> major issues as viewed by <strong>the</strong><br />
<strong>in</strong>terviewees from a position <strong>of</strong> leadership, and also<br />
from <strong>the</strong> resident’s po<strong>in</strong>t <strong>of</strong> view.<br />
A transect walk was <strong>the</strong>n performed and was guided<br />
by <strong>the</strong> key <strong>in</strong>formant to observe and clarify <strong>the</strong> ideas<br />
orig<strong>in</strong>ally presented dur<strong>in</strong>g <strong>the</strong>se <strong>in</strong>terviews. Dur<strong>in</strong>g<br />
<strong>the</strong> walk, <strong>in</strong>formal discussions were held with residents,<br />
shop owners, and workers who were encountered to<br />
fur<strong>the</strong>r clarify <strong>the</strong>se ideas as well as ask about <strong>the</strong>ir<br />
daily lives.<br />
15
16<br />
4.4.2 Household Level<br />
Ga<strong>in</strong><strong>in</strong>g a pro le and general understand<strong>in</strong>g <strong>of</strong> <strong>the</strong> <strong>livelihoods</strong> and daily life <strong>in</strong> <strong>the</strong> slums from a household<br />
perspective was a crucial part <strong>of</strong> this <strong>in</strong>vestigation. To accomplish this, questionnaires were adm<strong>in</strong>istered to<br />
45 households <strong>in</strong> each <strong>of</strong> <strong>the</strong> three slum areas. The questionnaires were developed on a model presented by<br />
ACF for livelihood analysis <strong>in</strong> <strong>urban</strong> sett<strong>in</strong>gs (ACF 2010a). This was subsequently adapted upon consultation<br />
with ACF staff <strong>in</strong> both <strong>Uganda</strong> and New York. The nal survey was comprehensive <strong>in</strong> nature and covered <strong>the</strong><br />
follow<strong>in</strong>g subjects:<br />
• Household composition and demographics<br />
» Ages and genders <strong>of</strong> HH members<br />
» Education<br />
» Migration<br />
» Religion<br />
• Hous<strong>in</strong>g<br />
» Crowd<strong>in</strong>g<br />
» Tenure<br />
• Social Support<br />
» Group/Association membership<br />
» Forms <strong>of</strong> support<br />
• WASH<br />
» Water access, availability and quality<br />
» Latr<strong>in</strong>e use<br />
» Hygiene practices<br />
» Rubbish<br />
4.4.2.1 Sampl<strong>in</strong>g<br />
• Food Security<br />
» Access, Availability, Utilisation<br />
» Sources <strong>of</strong> food and Markets<br />
• Health<br />
» Illnesses<br />
» Mosquito nets<br />
» Access/availability <strong>of</strong> health facilities<br />
• F<strong>in</strong>ances<br />
» Incomes<br />
» Expenses<br />
» Debts<br />
Households were chosen by <strong>the</strong> enumerators, guided by <strong>in</strong>structions to choose a variety <strong>of</strong> households that<br />
described <strong>the</strong> wide range <strong>of</strong> <strong>livelihoods</strong> with<strong>in</strong> <strong>the</strong> area. This was partly because speci c enumeration data and<br />
mapp<strong>in</strong>g were not available. Justi ably, scienti c sampl<strong>in</strong>g measures were not utilised, as <strong>the</strong> goal <strong>of</strong> this part<br />
<strong>of</strong> <strong>the</strong> study was to explore issues experienced as a community and to highlight those that a household may<br />
face, yet not necessarily categorically.<br />
4.4.2.2 Implementation<br />
The questionnaires were adm<strong>in</strong>istered by six enumerators <strong>in</strong> each <strong>of</strong> <strong>the</strong> three areas. The compensated<br />
enumerators were residents <strong>in</strong> <strong>the</strong> slums that <strong>the</strong>y were <strong>in</strong>vestigat<strong>in</strong>g and were recruited by <strong>the</strong> aforementioned<br />
contacts.<br />
The questionnaires were trialled with members <strong>of</strong> <strong>the</strong> ACF-USA <strong>Uganda</strong> Staff, <strong>the</strong> three contacts with<strong>in</strong> <strong>the</strong> slum<br />
areas, and one resident <strong>in</strong> each <strong>of</strong> <strong>the</strong> slums.<br />
One workweek was devoted to this portion <strong>of</strong> <strong>the</strong> household study. On Monday, 28 May 2012, tra<strong>in</strong><strong>in</strong>g sessions
Area<br />
Namuwongo Kisenyi Bwaise<br />
# <strong>of</strong><br />
Respondents<br />
Area<br />
were held with <strong>the</strong> enumerators, followed by three<br />
days for each enumerator to adm<strong>in</strong>ister 9 surveys,<br />
end<strong>in</strong>g with a discussion on <strong>the</strong>ir experiences and<br />
general trends <strong>in</strong> <strong>the</strong> elds <strong>in</strong> a group format on Friday,<br />
1 June 2012.<br />
Tra<strong>in</strong><strong>in</strong>gs were held <strong>in</strong> groups <strong>of</strong> all six enumerators<br />
<strong>in</strong> each <strong>of</strong> <strong>the</strong> areas <strong>of</strong> <strong>in</strong>vestigation. Each question <strong>in</strong><br />
<strong>the</strong> questionnaire was expla<strong>in</strong>ed and described with<br />
regard to what <strong>the</strong> question was target<strong>in</strong>g and what<br />
it meant to <strong>the</strong> study as a whole. Subsequently, one<br />
member <strong>of</strong> <strong>the</strong> group trialled <strong>the</strong> questionnaire with<br />
ano<strong>the</strong>r member while <strong>the</strong> pr<strong>in</strong>cipal <strong>in</strong>vestigator <strong>of</strong>fered<br />
commentary and guidance on <strong>the</strong> proper ask<strong>in</strong>g <strong>of</strong> <strong>the</strong><br />
question and record<strong>in</strong>g <strong>of</strong> <strong>the</strong> subsequent response.<br />
This was re<strong>in</strong>forced by a “cheat sheet” that was given to<br />
each enumerator with <strong>the</strong> same guidance <strong>in</strong>formation<br />
as provided dur<strong>in</strong>g <strong>the</strong> <strong>in</strong>itial presentation <strong>of</strong> <strong>the</strong><br />
questionnaire to <strong>the</strong> enumerators. This guidance note<br />
also elaborated on <strong>the</strong> goals <strong>of</strong> each <strong>of</strong> <strong>the</strong> speci c<br />
<strong>in</strong>dicator questions.<br />
The enumerators were asked to perform three surveys<br />
per day over <strong>the</strong> course <strong>of</strong> three days, for a total <strong>of</strong><br />
9 from each enumerator and 45 represent<strong>in</strong>g each<br />
slum. At a random time dur<strong>in</strong>g <strong>the</strong> adm<strong>in</strong>istration <strong>of</strong><br />
<strong>the</strong> questionnaires, <strong>the</strong> pr<strong>in</strong>ciple <strong>in</strong>vestigator arrived<br />
to observe and answer questions that <strong>the</strong> respondent<br />
may have had, as well as to address any concerns or<br />
questions that <strong>the</strong> enumerator had.<br />
# <strong>of</strong><br />
Respondents<br />
Area<br />
The enumerators were ga<strong>the</strong>red toge<strong>the</strong>r <strong>the</strong> follow<strong>in</strong>g<br />
day for <strong>the</strong> collection <strong>of</strong> <strong>the</strong> surveys, payment for <strong>the</strong>ir<br />
services, and for a guided discussion on key po<strong>in</strong>ts<br />
<strong>the</strong>y had noted. They were guided by talk<strong>in</strong>g po<strong>in</strong>ts as<br />
listed <strong>in</strong> Appendix IV.<br />
4.5<br />
O<strong>the</strong>r Study Tools<br />
Tools were also used that were universally utilised<br />
throughout both phases <strong>of</strong> <strong>the</strong> study or for separate<br />
sub-<strong>in</strong>vestigations.<br />
4.5.1 Observation<br />
# <strong>of</strong><br />
Respondents<br />
Soweto 11 Kiti 31 Kamalimali 3<br />
Kanyogoga 10 Nook 5 Lufula 8<br />
Kasavu 5 Church Area 1 Jamubula 8<br />
Namuwongo A 8 Lubiri Triangle 1 Katogo 3<br />
Namuwongo B 9 Kasato 1 Lutwa 1<br />
O<strong>the</strong>r 1 Luzige 1 Mubowa 2<br />
Sapoba 1 Mabukalu 1<br />
Isambola 1<br />
Bugalami 1<br />
Total Population <strong>of</strong> Zones:<br />
Unknown<br />
Total Population <strong>of</strong> Zones:<br />
~12,800<br />
Total Population <strong>of</strong> Zones:<br />
~8800<br />
Due to <strong>the</strong> sensitive nature <strong>of</strong> some <strong>of</strong> <strong>the</strong> questions<br />
(latr<strong>in</strong>e use, hygiene practices, etc.), visual<br />
observation played a key role <strong>in</strong> determ<strong>in</strong><strong>in</strong>g some<br />
<strong>of</strong> <strong>the</strong> conditions with<strong>in</strong> and around <strong>the</strong> households.<br />
The enumerators were asked to note any presence <strong>of</strong><br />
human or animal faeces, stand<strong>in</strong>g or stagnant water,<br />
or household rubbish with<strong>in</strong> <strong>the</strong> close vic<strong>in</strong>ity <strong>of</strong> each<br />
household visited.<br />
4.5.2 Food Security Indicators<br />
It was requested by ACF that speci c <strong>in</strong>dustrystandard<br />
food security <strong>in</strong>dicators be utilised to aid <strong>in</strong><br />
identi cation <strong>of</strong> issues that may affect food security<br />
at a household level. Speci cally, Food Consumption<br />
Score (FCS), Household Food Insecurity Access Scale<br />
17
18<br />
(HFIAS), and Individual Dietary Diversity (IDDS) were<br />
utilised. A description <strong>of</strong> how <strong>the</strong>se were collected and<br />
calculated can be found <strong>in</strong> Appendix V.<br />
4.5.3 Livelihood Pro les<br />
As <strong>the</strong> ma<strong>in</strong> objective <strong>of</strong> this project, livelihood pro les<br />
were developed by tak<strong>in</strong>g key <strong>in</strong>formation from a<br />
number <strong>of</strong> different <strong>in</strong>dicators and <strong>the</strong> ve capitals <strong>of</strong><br />
<strong>the</strong> SLF. Their development was based largely on <strong>the</strong><br />
household questionnaire data, though contextual data<br />
that was also ga<strong>the</strong>red dur<strong>in</strong>g <strong>the</strong> prelim<strong>in</strong>ary phase<br />
<strong>in</strong>terviews held <strong>in</strong> uence as well.<br />
The guidel<strong>in</strong>es presented by <strong>the</strong> Household Economy<br />
Approach (HEA) and adapted for <strong>urban</strong> <strong>livelihoods</strong><br />
was <strong>the</strong> pr<strong>in</strong>ciple guide <strong>in</strong> develop<strong>in</strong>g <strong>the</strong>se pro les.<br />
This was considered as it utilises a multi-dimensional<br />
approach to de ne <strong>livelihoods</strong>, <strong>in</strong>clud<strong>in</strong>g wealth<br />
breakdown, sources <strong>of</strong> food, sources <strong>of</strong> cash,<br />
expenditure, hazards, and hazard responses (Seaman<br />
et al. 2000). HEA was also recommended by ACF-USA<br />
staff as a guidel<strong>in</strong>e for development <strong>of</strong> <strong>the</strong>se pro les.<br />
The asset pentagons were based on data that was<br />
taken from <strong>the</strong> household study for each livelihood<br />
pro le so as to form a base. Values were calculated<br />
and standardised to a maximum <strong>of</strong> 1, and from <strong>the</strong>n<br />
adjusted to re ect <strong>in</strong>formation that was not collected<br />
by <strong>the</strong> questionnaires, i.e. qualitative <strong>in</strong>formation from<br />
<strong>in</strong>terviews and observations. The equations utilised for<br />
<strong>the</strong> rst step are presented hereafter:<br />
4.5.4 Malnutrition Indicators<br />
Malnutrition <strong>in</strong>dicators were not speci cally explored<br />
dur<strong>in</strong>g this study. Though malnutrition is a pr<strong>in</strong>ciple<br />
area <strong>of</strong> activity for ACF-USA, it was decided that it<br />
was not feasible for this study given <strong>the</strong> limits. Most<br />
notably because <strong>of</strong> <strong>the</strong> tra<strong>in</strong><strong>in</strong>g <strong>in</strong>volved for both<br />
<strong>the</strong> pr<strong>in</strong>ciple <strong>in</strong>vestigator and <strong>the</strong> enumerators, <strong>the</strong><br />
relative <strong>in</strong>vasiveness <strong>of</strong> tak<strong>in</strong>g physical measurements<br />
as opposed to pos<strong>in</strong>g questions, <strong>the</strong> non-statistical<br />
signi cance <strong>of</strong> <strong>the</strong> resultant data, and that <strong>the</strong> ultimate<br />
goal was not a basel<strong>in</strong>e or monitor<strong>in</strong>g <strong>of</strong> malnutrition.<br />
Aside from this, malnutrition <strong>in</strong>formation is still<br />
accessible <strong>in</strong> <strong>the</strong> form <strong>of</strong> <strong>the</strong> ACF-USA study <strong>of</strong> 2009,<br />
where <strong>in</strong>dicator measurements were taken <strong>in</strong> <strong>the</strong> form<br />
<strong>of</strong> mid-upper arm circumference (MUAC), height for<br />
age (HfA), weight for age (WfA), and weight for height<br />
(WfH) with a supplementary test for bilateral oedema.<br />
A glossary <strong>of</strong> malnutrition terms can be found <strong>in</strong><br />
Appendix VI.<br />
Some <strong>in</strong>formation related to <strong>the</strong> chronic malnutrition<br />
nd<strong>in</strong>gs are here<strong>in</strong> presented from this study. These<br />
<strong>in</strong>dicators are exam<strong>in</strong>ed <strong>in</strong> <strong>the</strong> context <strong>of</strong> malnutrition<br />
by compar<strong>in</strong>g <strong>the</strong> values to a reference population<br />
(calculated by <strong>the</strong> National Center for Health Statistics<br />
at <strong>the</strong> Center for Disease Control <strong>in</strong> <strong>the</strong> USA (WHO<br />
1995)). A z-score is <strong>the</strong>n gured and represents <strong>the</strong><br />
number <strong>of</strong> standard deviations from <strong>the</strong> mean. A child<br />
with z-score <strong>of</strong> -2 is typically viewed as affected by<br />
malnourishment, with lower z-scores represent<strong>in</strong>g<br />
higher severity (The Wellcome Trust 2000; WHO &<br />
UNICEF 2009).<br />
The chronic malnutrition measurements and <strong>in</strong>dicators<br />
from <strong>the</strong> 2009 study are presented and expla<strong>in</strong>ed<br />
with<strong>in</strong> <strong>the</strong> results section.<br />
Acute malnutrition <strong>in</strong>dicators represent a speci c po<strong>in</strong>t<br />
<strong>in</strong> time, and thus <strong>the</strong> nd<strong>in</strong>gs <strong>of</strong> <strong>the</strong> 2009 study are not<br />
relevant <strong>in</strong> <strong>the</strong> context <strong>of</strong> this paper. It does however<br />
rema<strong>in</strong> a discussion po<strong>in</strong>t as <strong>the</strong> contexts <strong>of</strong> both
chronic and acute malnutrition require understand<strong>in</strong>g<br />
to form a better comprehension <strong>of</strong> <strong>the</strong> subject as a<br />
whole. Thus, brief de nitions are given here<strong>in</strong>:<br />
Low WfH is usually an <strong>in</strong>dication <strong>of</strong> a recent severe<br />
weight loss that can usually be attributed to a recent<br />
illness such as diarrhoea or starvation.<br />
MUAC is a measure that can <strong>in</strong>dicate a risk <strong>of</strong> mortality<br />
and is ano<strong>the</strong>r measure for acute malnutrition.<br />
Comb<strong>in</strong><strong>in</strong>g weight for height with MUAC and presence<br />
<strong>of</strong> oedema gives a more comprehensive view <strong>of</strong> acute<br />
malnutrition.<br />
Weight for age is a standard measurement, though<br />
it is not always accurate as it does not account for<br />
non-stunted short children or naturally tall, th<strong>in</strong><br />
children. Dif cult to <strong>in</strong>terpret by itself, this is typically<br />
used for population screen<strong>in</strong>g and monitor<strong>in</strong>g, as <strong>the</strong><br />
<strong>in</strong>formation on an <strong>in</strong>dividual child can be mislead<strong>in</strong>g<br />
(WHO 1995; Trowbridge 1979; WHO & UNICEF 2009).<br />
4.5.5 Water Quality Tests<br />
Water sources <strong>in</strong> <strong>the</strong> slums were tested for bacterial<br />
contam<strong>in</strong>ation by Escherichia coli. Triplicate samples<br />
from each water source be<strong>in</strong>g <strong>in</strong>vestigated were taken<br />
after a period <strong>of</strong> four ra<strong>in</strong>-free days so as to assure<br />
that <strong>the</strong> spr<strong>in</strong>g itself was be<strong>in</strong>g tested and not run<strong>of</strong>f<br />
water. The tests were conducted through <strong>the</strong> use<br />
<strong>of</strong> a pr<strong>of</strong>essional-grade portable membrane- lter<br />
<strong>in</strong>cubation kit.<br />
4.5.6 Markets<br />
L<strong>in</strong>k<strong>in</strong>g food security to nancial/economic and<br />
physical capitals, markets were <strong>in</strong>vestigated.<br />
4.5.6.1 Market Survey<br />
One-day market prices were surveyed at two dist<strong>in</strong>ct<br />
markets with<strong>in</strong> <strong>the</strong> vic<strong>in</strong>ity <strong>of</strong> Namuwongo slum. As <strong>the</strong><br />
units <strong>of</strong> sale were arbitrary and not exact weights or<br />
volumes, <strong>the</strong>y were recorded and photographed to<br />
provide a visual representation <strong>of</strong> <strong>the</strong> unit <strong>of</strong> sale which<br />
can be found <strong>in</strong> Appendix VII. The food basket utilised<br />
<strong>in</strong> this market survey was improvisational <strong>in</strong> that a<br />
proper list<strong>in</strong>g <strong>of</strong> food basket items was unavailable.<br />
This items chosen to be surveyed were done so by<br />
advice <strong>of</strong> market vendors and <strong>the</strong> accompany<strong>in</strong>g<br />
enumerator<br />
4.5.6.2 Market Prices<br />
Historical price data for multiple commodities at<br />
Nakasero and Ow<strong>in</strong>o markets were taken from<br />
InfoTrade <strong>Uganda</strong> (AGMIS & Infotrade <strong>Uganda</strong> 2011).<br />
This food basket represents those commodity prices<br />
which were most commonly surveyed by Infotrade<br />
enumerators.<br />
4.5.7 Literature<br />
Previous studies and literature were utilised to more<br />
ef ciently guide <strong>the</strong> study throughout all phases<br />
<strong>in</strong>clud<strong>in</strong>g pre-plann<strong>in</strong>g, plann<strong>in</strong>g, implementation, and<br />
analysis.<br />
4.5.8 Cop<strong>in</strong>g Mechanisms<br />
How <strong>the</strong> <strong>poor</strong> dealt with potential hazards and<br />
shocks was vital <strong>in</strong>formation to collect. Ultimately, <strong>the</strong><br />
<strong>in</strong>formation was collected by adapt<strong>in</strong>g questions that<br />
were relevant to <strong>the</strong> <strong>urban</strong> context from <strong>the</strong> Cop<strong>in</strong>g<br />
Strategies Index <strong>in</strong>to <strong>the</strong> Household Food Insecurity<br />
Access Scale questionnaire. The resultant data<br />
was <strong>the</strong>n weighted accord<strong>in</strong>g to <strong>the</strong> CSI weights,<br />
aggregated and analysed as a cop<strong>in</strong>g mechanism<br />
score on a scale from 0 to 39.<br />
The key difference <strong>in</strong> this method from <strong>the</strong> standard<br />
cop<strong>in</strong>g strategies <strong>in</strong>dex is that it gives a timescale over<br />
a month ra<strong>the</strong>r than a week, which is more pert<strong>in</strong>ent<br />
toward <strong>the</strong> holisitic and non-monitor<strong>in</strong>g aims <strong>of</strong> this<br />
study.<br />
It also allows for <strong>the</strong> <strong>in</strong>terviewee to dist<strong>in</strong>guish <strong>the</strong>ir<br />
answer by ‘<strong>of</strong>ten’, ‘sometimes’, ‘rarely’, or ‘never’;<br />
allow<strong>in</strong>g <strong>the</strong> respondent to express <strong>the</strong>ir own<br />
perception <strong>of</strong> frequency <strong>of</strong> cop<strong>in</strong>g strategies utilised.<br />
19
20<br />
To <strong>the</strong> knowledge <strong>of</strong> <strong>the</strong> pr<strong>in</strong>cipal <strong>in</strong>vestigator, this<br />
method has not been utilised before and has not been<br />
validated for fur<strong>the</strong>r use <strong>in</strong> o<strong>the</strong>r contexts. Thus, <strong>the</strong><br />
results obta<strong>in</strong>ed should be used only as a comparitive<br />
measure with<strong>in</strong> <strong>the</strong> sample populations <strong>of</strong> this study.<br />
4.6<br />
Data Analysis<br />
Data entry for <strong>the</strong> household study was done so<br />
through use <strong>of</strong> Sph<strong>in</strong>x Plus2 s<strong>of</strong>tware, version 5.1.0.7.<br />
Data validation and statistical analysis was carried<br />
out through Micros<strong>of</strong>t Of ce Excel 2007, version<br />
12.0.662.5000.<br />
Qualitative data was processed through manual<br />
analysis <strong>of</strong> audio record<strong>in</strong>gs and notes.<br />
4.7<br />
Study limits and biases<br />
The study encountered limits and dif culties throughout<br />
<strong>the</strong> pre-plann<strong>in</strong>g, plann<strong>in</strong>g, implementation and<br />
analysis phases.<br />
4.7.1 Scope <strong>of</strong> <strong>the</strong> study<br />
The study was requested as an undertak<strong>in</strong>g to<br />
uncover, explore, and understand some <strong>of</strong> <strong>the</strong> major<br />
issues that affect <strong>the</strong> <strong>livelihoods</strong> <strong>of</strong> <strong>Kampala</strong>’s <strong>urban</strong><br />
<strong>poor</strong>. Because <strong>of</strong> this, statistical representation <strong>of</strong> any<br />
whole population was not a primary goal <strong>of</strong> this study.<br />
Therefore, <strong>the</strong> results presented here<strong>in</strong> are meant to<br />
be solely <strong>in</strong>dicative, not representative.<br />
4.7.2 Dif culties encountered<br />
Access to many government agencies was dif cult<br />
with regards to schedul<strong>in</strong>g <strong>in</strong>terviews or nd<strong>in</strong>g<br />
current contact <strong>in</strong>formation. Because <strong>of</strong> non-response<br />
or schedul<strong>in</strong>g con icts, some <strong>of</strong> <strong>the</strong> agencies or<br />
organizations that may have proven bene cial to<br />
fur<strong>the</strong>r develop <strong>the</strong> context were unavailable.<br />
A proposed sub-project exam<strong>in</strong><strong>in</strong>g mo<strong>the</strong>rs and<br />
children who are currently attend<strong>in</strong>g a malnutrition<br />
treatment programme and reside <strong>in</strong> slum areas was<br />
orig<strong>in</strong>ally planned with a partner organisation <strong>in</strong><br />
<strong>Kampala</strong>. Ultimately, <strong>the</strong> study did not eventuate after an<br />
agreement could not be reached regard<strong>in</strong>g <strong>in</strong>tellectual<br />
property rights. The plann<strong>in</strong>g and negotiation <strong>of</strong> this<br />
proposed study occurred concurrently with <strong>the</strong> Phase<br />
1 <strong>in</strong>vestigations. As <strong>the</strong> study did not eventuate, <strong>the</strong><br />
time allotted to plann<strong>in</strong>g and negotiation was ultimately<br />
lost.<br />
4.7.3 Logistic/organizational issues<br />
This study had no allocated budget. Given <strong>the</strong> lack<br />
<strong>of</strong> fund<strong>in</strong>g, <strong>the</strong> sample size <strong>of</strong> <strong>the</strong> household study<br />
had to be limited, though <strong>the</strong> subject matter still<br />
comprehensive enough as to properly demonstrate<br />
some <strong>of</strong> <strong>the</strong> key <strong>livelihoods</strong> and some key issues <strong>the</strong>y<br />
face.<br />
The <strong>urban</strong> <strong>poor</strong> population <strong>of</strong> <strong>Kampala</strong> is large <strong>in</strong><br />
both number and <strong>in</strong>habited area. Each slum area has<br />
<strong>the</strong>ir own context associated with it, though for <strong>the</strong><br />
sake <strong>of</strong> this study only those designated as <strong>the</strong> three<br />
most vulnerable were <strong>in</strong>vestigated. Admittedly, this<br />
itself was an arbitrary measure at <strong>the</strong> time as formal<br />
studies or statistics relat<strong>in</strong>g speci cally to <strong>the</strong> slums<br />
ei<strong>the</strong>r as a whole or <strong>in</strong>dividually were limited or nonexistent.<br />
Therefore, <strong>the</strong> selection <strong>of</strong> areas and groups<br />
for fur<strong>the</strong>r <strong>in</strong>vestigation was based nearly entirely on<br />
anecdotal, qualitative <strong>in</strong>formation. Though <strong>the</strong> pro l<strong>in</strong>g<br />
<strong>of</strong> <strong>the</strong> selected areas was conducted successfully, <strong>the</strong><br />
results may not be pert<strong>in</strong>ent to o<strong>the</strong>r groups or areas<br />
with<strong>in</strong> <strong>Kampala</strong>.<br />
The time allotted for this study was four months.<br />
Because <strong>of</strong> this limited time, <strong>the</strong> population <strong>of</strong> <strong>the</strong><br />
study had to be scaled down so as to be sure to<br />
thoroughly <strong>in</strong>vestigate <strong>the</strong> key areas <strong>of</strong> <strong>the</strong> orig<strong>in</strong>al<br />
terms <strong>of</strong> reference.
4.7.4 Methodological Biases<br />
Some <strong>of</strong> <strong>the</strong> <strong>in</strong>stitutional actors had certa<strong>in</strong> motivations<br />
and biases toward <strong>the</strong> sample population. There is<br />
a dist<strong>in</strong>ct tension between <strong>the</strong>se two groups, and<br />
because <strong>of</strong> this, <strong>the</strong> quality <strong>of</strong> <strong>in</strong>formation from <strong>the</strong><br />
qualitative <strong>in</strong>terviews may have been compromised.<br />
Many residents <strong>of</strong> <strong>the</strong> slums refused to take part <strong>in</strong><br />
<strong>the</strong> study, and likewise those who did were notably<br />
hesitant. Many who refused to take part had claimed<br />
that many studies are done <strong>in</strong> <strong>the</strong> areas, yet no apparent<br />
programm<strong>in</strong>g has resulted from <strong>the</strong>m. Survey fatigue<br />
<strong>of</strong> <strong>the</strong> residents <strong>in</strong> <strong>the</strong> slums may have <strong>in</strong> uenced <strong>the</strong><br />
results to an unknown degree.<br />
The questionnaire itself was comprehensive <strong>in</strong><br />
nature, and as such had 199 data po<strong>in</strong>ts associated<br />
with it. Though this length was noted dur<strong>in</strong>g <strong>the</strong><br />
triall<strong>in</strong>g (and <strong>the</strong> questionnaire subsequently scaled<br />
down), <strong>the</strong> length <strong>of</strong> <strong>the</strong> questionnaire along with <strong>the</strong><br />
sensitivity <strong>of</strong> <strong>the</strong> subject matter resulted <strong>in</strong> fatigue <strong>of</strong><br />
<strong>the</strong> respondents, multiple missed or <strong>in</strong>complete data<br />
po<strong>in</strong>ts, and, <strong>the</strong>refore, possibly <strong>in</strong>accurate <strong>in</strong>formation.<br />
The Food Consumption Score <strong>in</strong>dicator is a 7-day<br />
recall measure <strong>of</strong> frequency and diversity <strong>of</strong> diets. To<br />
account for respondent fatigue, <strong>the</strong> FCS was scaled<br />
down to a one-day measure to be collected along with<br />
<strong>the</strong> IDDS. As a result <strong>the</strong>se measures may not be as<br />
accurate nor reliable as has been previously validated<br />
<strong>in</strong> o<strong>the</strong>r studies.<br />
The Household Dietary Diversity question was misphrased<br />
on <strong>the</strong> questionnaire, and as such did not<br />
collect <strong>in</strong>formation related to <strong>the</strong> household, but that<br />
<strong>of</strong> <strong>the</strong> <strong>in</strong>dividual dietary diversity <strong>of</strong> <strong>the</strong> respondent.<br />
Though this was noticed and accounted for dur<strong>in</strong>g<br />
tra<strong>in</strong><strong>in</strong>gs, <strong>the</strong> questionnaires had already been pr<strong>in</strong>ted<br />
and distributed; <strong>the</strong>refore <strong>the</strong> data is not submissible<br />
for analysis.<br />
The <strong>in</strong>dex utilised to characterise cop<strong>in</strong>g strategies<br />
was adapted from <strong>the</strong> Cop<strong>in</strong>g Strategies Index (Daniel<br />
Maxwell & Caldwell 2008) to account for frequency <strong>of</strong><br />
occurrence over a period <strong>of</strong> one month as opposed<br />
to 7 days. Upon analysis <strong>of</strong> <strong>the</strong> results, <strong>the</strong> raw data<br />
appeared <strong>in</strong>conclusive. It was <strong>the</strong>n put <strong>in</strong>to a scale<br />
format so as to simplify <strong>the</strong> responses and create<br />
a more generalised picture <strong>of</strong> <strong>the</strong> use <strong>of</strong> cop<strong>in</strong>g<br />
mechanisms for comparison between groups. The<br />
scale format yielded more decisive results; however,<br />
it is a completely novel approach and has not been<br />
validated <strong>in</strong> previous studies.<br />
21
22<br />
Results<br />
As <strong>the</strong> study was comprehensive <strong>in</strong> exam<strong>in</strong><strong>in</strong>g<br />
<strong>the</strong> factors <strong>in</strong> uenc<strong>in</strong>g <strong>livelihoods</strong> <strong>of</strong> <strong>the</strong> <strong>urban</strong><br />
<strong>poor</strong>, <strong>the</strong> results are presented <strong>in</strong> l<strong>in</strong>e with <strong>the</strong><br />
chronology <strong>of</strong> <strong>the</strong> study.<br />
The rst phase <strong>of</strong> <strong>the</strong> study which exam<strong>in</strong>ed <strong>the</strong><br />
<strong>in</strong>stitutional actors and forces presents <strong>the</strong> conclusions<br />
made from <strong>the</strong> <strong>in</strong>formation collected by <strong>the</strong> means<br />
noted <strong>in</strong> <strong>the</strong> methodology.<br />
The second phase <strong>of</strong> <strong>the</strong> study, that which exam<strong>in</strong>ed<br />
community and household levels, presents <strong>the</strong> results<br />
as speci ed by ei<strong>the</strong>r represent<strong>in</strong>g <strong>the</strong> entire sample<br />
<strong>of</strong> households or as disaggregated by slum area when<br />
relevant. Relevancy is determ<strong>in</strong>ed by a disaggregated<br />
result that is <strong>of</strong> note, and one that <strong>the</strong> sample <strong>of</strong><br />
respondents represents a result with a certa<strong>in</strong> degree<br />
<strong>of</strong> con dence, i.e. a reply rate <strong>of</strong> more than 50% <strong>of</strong><br />
respondents <strong>in</strong> <strong>the</strong> relevant category.<br />
5.1<br />
Phase 1 – Identi cation and<br />
Speci cation <strong>of</strong> Urban Poor<br />
Groups<br />
The prelim<strong>in</strong>ary phase <strong>of</strong> <strong>the</strong> <strong>in</strong>vestigation is to<br />
determ<strong>in</strong>e which are <strong>the</strong> groups that can be considered<br />
<strong>urban</strong> <strong>poor</strong> with<strong>in</strong> <strong>Kampala</strong> and, fur<strong>the</strong>rmore, which<br />
are to be <strong>in</strong>cluded for fur<strong>the</strong>r <strong>in</strong>vestigation given <strong>the</strong><br />
constra<strong>in</strong>ts as noted <strong>in</strong> <strong>the</strong> study limits.<br />
The <strong>Uganda</strong>n government’s poverty <strong>in</strong>vestigations<br />
are measured dur<strong>in</strong>g <strong>the</strong> National Household Survey<br />
(NHS), with <strong>the</strong>ir methodology centred on an economic<br />
analysis <strong>of</strong> private consumption as a measure <strong>of</strong><br />
welfare, despite a large number <strong>of</strong> dimensions be<strong>in</strong>g<br />
recognized such as material, physical, and social<br />
well be<strong>in</strong>g (UBOS 2004). Resultantly, <strong>the</strong> national<br />
poverty l<strong>in</strong>e was last derived <strong>in</strong> 1993/94 at 85,000<br />
<strong>Uganda</strong>n shill<strong>in</strong>gs (USD $34) per month, hav<strong>in</strong>g not<br />
been adjusted for consumer price <strong>in</strong>dex (CPI) <strong>in</strong> ation<br />
(vary<strong>in</strong>g widely <strong>in</strong> <strong>the</strong> past decade from -0.3% <strong>in</strong> 2002<br />
to 13.01% <strong>in</strong> 2011 and at 3.9% <strong>in</strong> 2012) (The World<br />
Bank 2011; UBOS 2010b).<br />
<strong>Uganda</strong> has claimed a 4% poverty rate accord<strong>in</strong>g<br />
to this measure with<strong>in</strong> <strong>Kampala</strong> <strong>in</strong> 2012 (UMoFPED<br />
2012). Interest<strong>in</strong>gly, estimates <strong>of</strong> poverty <strong>in</strong> <strong>Kampala</strong><br />
vary widely depend<strong>in</strong>g on <strong>the</strong> report<strong>in</strong>g <strong>in</strong>stitution<br />
with scarce report<strong>in</strong>g on <strong>the</strong> actual methodologies<br />
utilized to gure such statistics. In examples <strong>of</strong> <strong>the</strong>se<br />
discrepancies, UN-HABITAT (2007) reported 38.9%<br />
<strong>of</strong> residents <strong>in</strong> absolute poverty. Additionally, The<br />
Observer, a bi-weekly <strong>in</strong>dependent newspaper, cited<br />
17.6% <strong>of</strong> <strong>Kampala</strong>’s population as liv<strong>in</strong>g under <strong>the</strong><br />
poverty l<strong>in</strong>e <strong>in</strong> 2010 (Mwesigye 2010).<br />
After consider<strong>in</strong>g <strong>the</strong>se criteria, three groups were<br />
decided upon for fur<strong>the</strong>r speci cation: Street Children<br />
(also <strong>in</strong>clud<strong>in</strong>g mo<strong>the</strong>rs <strong>of</strong> <strong>the</strong> children, though most<br />
are orphans), Squatters, and Slum Dwellers.
5.1.1 Street Children and <strong>the</strong>ir Mo<strong>the</strong>rs<br />
Street children and mo<strong>the</strong>rs were orig<strong>in</strong>ally cited <strong>in</strong> <strong>the</strong><br />
project’s terms <strong>of</strong> reference by ACF-USA <strong>Uganda</strong> to<br />
be a ma<strong>in</strong> group <strong>of</strong> <strong>in</strong>terest, and have been <strong>the</strong> subject<br />
<strong>of</strong> a number <strong>of</strong> various studies s<strong>in</strong>ce <strong>the</strong> late 1990s<br />
due to <strong>the</strong> noted rapid <strong>in</strong>crease <strong>in</strong> <strong>the</strong>ir numbers<br />
(Young 2003; KCCA 2008; Wernham 2004; Gackle<br />
et al. 2007; Munene & Nambi 1996). Typically, <strong>the</strong>se<br />
children are orphans that have come from rural <strong>poor</strong><br />
areas. Orig<strong>in</strong>at<strong>in</strong>g ma<strong>in</strong>ly from <strong>the</strong> <strong>poor</strong> north-eastern<br />
region <strong>of</strong> Karamoja, food and physical <strong>in</strong>security have<br />
compelled some parents to send <strong>the</strong>ir children to<br />
<strong>urban</strong> centres to seek <strong>in</strong>come (Mulumba & Mlahagwa<br />
2009; Kalibala & Elson 2009). This population is one <strong>of</strong><br />
<strong>the</strong> most visible <strong>in</strong> <strong>Kampala</strong>, as <strong>the</strong>y are typically found<br />
on <strong>the</strong> streets <strong>of</strong> heavily traf cked areas approach<strong>in</strong>g<br />
pass<strong>in</strong>g cars to ask for money. They are an identi ed<br />
vulnerable group by <strong>the</strong> <strong>Uganda</strong>n Government and<br />
fall under policy as directed by <strong>the</strong> OVC Secretariat.<br />
However, <strong>Uganda</strong> has enacted laws that forcibly<br />
evict street children from <strong>the</strong> <strong>Kampala</strong> centre, and<br />
relocat<strong>in</strong>g <strong>the</strong>m to ‘reception centres’ located around<br />
<strong>the</strong> h<strong>in</strong>terlands <strong>of</strong> <strong>the</strong> city (Bett et al. 2005). Because<br />
<strong>of</strong> <strong>the</strong> unknown tim<strong>in</strong>g and execution <strong>of</strong> <strong>the</strong>se roundups,<br />
know<strong>in</strong>g <strong>the</strong> actual number (estimates range from<br />
2,500 to 10,000) <strong>of</strong> street children at any given period<br />
is not feasible. This br<strong>in</strong>gs <strong>the</strong> problem <strong>of</strong> properly<br />
target<strong>in</strong>g <strong>the</strong> population, and given that <strong>the</strong>ir presence<br />
<strong>in</strong> <strong>Kampala</strong> is under cont<strong>in</strong>ual threat <strong>of</strong> eviction, <strong>the</strong><br />
assurance <strong>of</strong> <strong>the</strong> effectiveness <strong>of</strong> any programm<strong>in</strong>g for<br />
<strong>the</strong>se bene ciaries is made that much more dif cult.<br />
The largest proportion <strong>of</strong> registered NGOs <strong>in</strong> <strong>Kampala</strong><br />
deal pr<strong>in</strong>cipally with children and children’s rights,<br />
and more so <strong>the</strong>re are a number <strong>of</strong> NGOs and CBOs<br />
whose prime mandate is to host <strong>the</strong>se children and<br />
provide services such as education, shelter, food and<br />
healthcare.<br />
5.1.2 Squatters<br />
Squatter households were identi ed as a group that<br />
may also be vulnerable. This group is characterized<br />
by not claim<strong>in</strong>g an <strong>of</strong> cial residence but liv<strong>in</strong>g <strong>in</strong><br />
improvised or abandoned structures that are typically<br />
hidden beh<strong>in</strong>d large build<strong>in</strong>gs on ma<strong>in</strong> roads. These<br />
residences are considered as <strong>in</strong>formal settlements;<br />
but differ however from <strong>the</strong>ir slum counterparts as <strong>the</strong>y<br />
do not usually exist as multiple, densely populated<br />
households <strong>in</strong> a large area.<br />
Ultimately, <strong>the</strong> disorganized nature <strong>of</strong> <strong>the</strong> squatter<br />
households, <strong>the</strong> lack <strong>of</strong> <strong>of</strong> cial statistics or<br />
demographic data, and <strong>the</strong> sceptical demeanour <strong>of</strong><br />
<strong>the</strong> households make this group dif cult to target for<br />
fur<strong>the</strong>r <strong>in</strong>vestigation. They are <strong>the</strong> only identi ed group<br />
which <strong>the</strong> pr<strong>in</strong>cipal <strong>in</strong>vestigator was not been able<br />
to identify organisations or programmes speci cally<br />
target<strong>in</strong>g this group.<br />
5.1.3 Slum Dwellers<br />
Slum Dwellers were an identi ed group <strong>in</strong> <strong>the</strong><br />
prelim<strong>in</strong>ary phase and are <strong>the</strong> ma<strong>in</strong> focus <strong>of</strong> this study.<br />
Though <strong>the</strong>re are limited to no <strong>of</strong> cial statistics relat<strong>in</strong>g<br />
to <strong>the</strong> populations liv<strong>in</strong>g <strong>in</strong> <strong>the</strong> slums, numerous local<br />
NGOs who work <strong>in</strong> <strong>the</strong> areas and a UN-HABITAT report<br />
(2007) estimate that more than 1 million people live<br />
<strong>in</strong> <strong>the</strong> slum areas <strong>of</strong> <strong>Kampala</strong>, mak<strong>in</strong>g up 60% <strong>of</strong> <strong>the</strong><br />
population.<br />
5.2<br />
Area Pro les<br />
The slum areas that were chosen are pro led along<br />
with reason<strong>in</strong>g for <strong>in</strong>clusion <strong>in</strong> <strong>the</strong> study.<br />
5.2.1 Namuwongo<br />
Namuwongo is located on <strong>the</strong> marg<strong>in</strong>s <strong>of</strong> <strong>the</strong><br />
Nakirubo canal, a waterway lead<strong>in</strong>g from <strong>the</strong> central<br />
bus<strong>in</strong>ess district to Murchison Bay. The area border<br />
is demarcated by out-<strong>of</strong>-service railroad tracks on <strong>the</strong><br />
east, Nakirubo canal to <strong>the</strong> west, <strong>the</strong> Industrial area to<br />
23
24<br />
<strong>the</strong> north and Murchison Bay to <strong>the</strong> south. Population<br />
statistics do not exist for this area.<br />
Namuwongo slum has a history that sets itself apart<br />
from o<strong>the</strong>r slum areas. Its orig<strong>in</strong>s are from <strong>the</strong> late<br />
1970s to early 1980s, when <strong>the</strong> slum used to reside<br />
uphill from its current location. In <strong>the</strong> mid-1990s, <strong>the</strong><br />
government <strong>of</strong> <strong>Uganda</strong> had started <strong>in</strong>frastructure<br />
improvement and basic service delivery projects<br />
as a form <strong>of</strong> slum-upgrad<strong>in</strong>g. The residents <strong>of</strong> <strong>the</strong><br />
slums were displaced while <strong>the</strong> <strong>in</strong>frastructural works<br />
were happen<strong>in</strong>g; however <strong>the</strong> government had told<br />
<strong>the</strong> dwellers <strong>the</strong>y would be able to return once <strong>the</strong><br />
works were completed. Land tenure <strong>in</strong> <strong>the</strong> slums nds<br />
most dwellers as tenants who do not own <strong>the</strong> land<br />
nor structure that <strong>the</strong>y live <strong>in</strong>; <strong>the</strong>refore legal right to<br />
residence was not necessarily given to <strong>the</strong> tenants.<br />
Once <strong>the</strong> works were nished, <strong>the</strong> land-owners<br />
<strong>in</strong>creased <strong>the</strong> rents to levels that prohibited <strong>the</strong> orig<strong>in</strong>al<br />
tenants from re-enter<strong>in</strong>g <strong>the</strong>ir homes. The land was<br />
<strong>the</strong>n sold and developed <strong>in</strong>to shops and hous<strong>in</strong>g, as<br />
well as some public build<strong>in</strong>gs.<br />
Slum upgrad<strong>in</strong>g had unwitt<strong>in</strong>gly created a form <strong>of</strong><br />
gentri cation, caus<strong>in</strong>g <strong>the</strong> orig<strong>in</strong>al residents to resettle<br />
at <strong>the</strong> current location, which is on signi cantly more<br />
marg<strong>in</strong>al land and with a signi cantly higher risk <strong>of</strong><br />
ood<strong>in</strong>g.<br />
5.2.2 Bwaise<br />
Bwaise slum is just north <strong>of</strong> <strong>the</strong> Nor<strong>the</strong>rn Bypass road<br />
and straddles <strong>the</strong> border <strong>of</strong> <strong>Kampala</strong> District. It was<br />
consistently noted by government <strong>of</strong> cials and local<br />
NGOs as <strong>the</strong> slum that is <strong>the</strong> ‘worst <strong>of</strong>f’ <strong>of</strong> those identi ed.<br />
Enumeration has been<br />
planned for households<br />
focus<strong>in</strong>g on hous<strong>in</strong>g and<br />
basic services by Slum<br />
Dwellers International/<br />
ACToge<strong>the</strong>r <strong>Uganda</strong>/<br />
National Slum Dwellers<br />
Federation <strong>of</strong> <strong>Uganda</strong><br />
under <strong>the</strong> mandate <strong>of</strong> <strong>the</strong><br />
National Slum Upgrad<strong>in</strong>g<br />
Policy, though <strong>the</strong> data<br />
has not yet been validated<br />
nor analysed . It is fur<strong>the</strong>r<br />
divided <strong>in</strong>to parishes<br />
Bwaise I, II, and III. The<br />
<strong>in</strong>vestigated area has an<br />
approximate population<br />
<strong>of</strong> 12,800 (UMoH et al.<br />
2009).<br />
5.2.3 Kisenyi<br />
Kisenyi slum is located<br />
<strong>in</strong> <strong>the</strong> central division<br />
<strong>of</strong> <strong>Kampala</strong>, and is <strong>the</strong><br />
oldest stand<strong>in</strong>g slum
area <strong>in</strong> <strong>Kampala</strong> District hav<strong>in</strong>g its orig<strong>in</strong>s from <strong>the</strong><br />
early 1970’s. It is <strong>the</strong> focus <strong>of</strong> many <strong>of</strong> <strong>the</strong> ma<strong>in</strong> slum<br />
projects and <strong>in</strong>terventions by government and NGOs.<br />
As such, much more <strong>in</strong>formation is available on <strong>the</strong><br />
area. Extensive enumeration and mapp<strong>in</strong>g has been<br />
performed by SDI. The enumerators have mapped<br />
toilets, markets (dist<strong>in</strong>guished between goods),<br />
streets and alleys through <strong>the</strong> slum, water sources, and<br />
structural dimensions. Kisenyi is divided <strong>in</strong>to Kisenyi I,<br />
II, III, with <strong>the</strong> ma<strong>in</strong> slum area placed <strong>in</strong> Kisenyi III.<br />
Kisenyi II is considered a slum area as well, however<br />
<strong>in</strong> <strong>the</strong> 1990s <strong>the</strong> parish had undergone upgrad<strong>in</strong>g<br />
projects similar to Namuwongo, though this did not<br />
result <strong>in</strong> partition<strong>in</strong>g as direct as Namuwongo.<br />
This area was <strong>the</strong> focus for <strong>the</strong> household survey as<br />
Kisenyi I and II are undergo<strong>in</strong>g cont<strong>in</strong>ual land and<br />
property development. Enumeration data from NSDF<br />
states that 5,553 households are <strong>in</strong> this locale. The<br />
population <strong>of</strong> <strong>the</strong> areas that were <strong>in</strong>vestigated stands<br />
at approximately 8,800 (UMoH et al. 2009).<br />
5.3<br />
Phase 2 – Exploration <strong>of</strong> <strong>livelihoods</strong><br />
and <strong>the</strong> conditions <strong>in</strong> which <strong>the</strong>y<br />
exist<br />
The second phase <strong>of</strong> <strong>the</strong> study reveals <strong>the</strong> more detailed<br />
<strong>in</strong>vestigation <strong>in</strong>to <strong>the</strong> three slum areas. The subsequent<br />
nd<strong>in</strong>gs demonstrate <strong>in</strong>formation ga<strong>the</strong>red from each<br />
<strong>of</strong> <strong>the</strong> <strong>in</strong>stitutional, community, and household levels.<br />
The results are presented <strong>in</strong> a structure that del<strong>in</strong>eates<br />
each <strong>of</strong> <strong>the</strong> ve capitals <strong>of</strong> <strong>the</strong> SLF, as well as three<br />
expanded sections speci cally dedicated to <strong>the</strong><br />
core concepts <strong>of</strong> <strong>the</strong> study: food security, nutrition<br />
and health, and water, sanitation and hygiene. All <strong>of</strong><br />
<strong>the</strong> follow<strong>in</strong>g <strong>in</strong>formation presented<br />
under each capital is <strong>in</strong> relation to<br />
support <strong>the</strong> general understand<strong>in</strong>g <strong>of</strong><br />
malnutrition and its root causes with<strong>in</strong><br />
this populace.<br />
The household <strong>in</strong>vestigation yielded 135 surveys<br />
as performed by compensated enumerators. After<br />
validation <strong>of</strong> <strong>the</strong> data, closed-question responses<br />
were utilised from 119 <strong>of</strong> <strong>the</strong> surveys, ultimately<br />
represent<strong>in</strong>g 543 <strong>in</strong>dividuals. Though <strong>the</strong> rema<strong>in</strong><strong>in</strong>g<br />
16 samples were not <strong>in</strong>cluded <strong>in</strong> <strong>the</strong> general results,<br />
open-ended questions and observations as noted<br />
by <strong>the</strong> enumerators for <strong>the</strong>se households were still<br />
taken <strong>in</strong>to account. The results from <strong>the</strong> survey portion<br />
<strong>of</strong> <strong>the</strong> study are presented as for <strong>the</strong> entire sample<br />
population <strong>of</strong> all three slums and disaggregated where<br />
appropriate.<br />
5.3.1 Demographics and Pro le <strong>of</strong><br />
Respondent Households<br />
The demographics <strong>of</strong> <strong>the</strong> respondents show an equal<br />
distribution between male and female household<br />
members, which is <strong>in</strong> l<strong>in</strong>e with <strong>the</strong> national statistics<br />
for <strong>urban</strong> sett<strong>in</strong>gs. 17% <strong>of</strong> households had children<br />
less than 6 months <strong>of</strong> age. This data is not collected<br />
nationally but was done so <strong>in</strong> this case as this is <strong>the</strong><br />
age group which <strong>the</strong> child is meant to be uniquely<br />
breastfeed<strong>in</strong>g, though breastfeed<strong>in</strong>g practices<br />
were not exam<strong>in</strong>ed fur<strong>the</strong>r. The sample households<br />
show a younger demographic than <strong>the</strong> national data<br />
as <strong>the</strong>y typically have more school aged children<br />
(between 5-15 years), which is <strong>in</strong> l<strong>in</strong>e with previous<br />
nd<strong>in</strong>gs (UMoFPED 2000; UMoH et al. 2009; UNDP<br />
& UMoLHUD 2008). The average age <strong>of</strong> a male head<br />
<strong>of</strong> household is 39 years old and female is 43. Males<br />
make up 58% <strong>of</strong> <strong>the</strong> heads <strong>of</strong> households (69% national<br />
<strong>urban</strong>, 70.5% national all) and females account for <strong>the</strong><br />
rema<strong>in</strong><strong>in</strong>g 42% (31%, 29.5%).<br />
TABLE 1: AGES OF HOUSEHOLD MEMBERS<br />
Slum HH >6 mos 6mos-5 years 5-15 years<br />
16-60<br />
years<br />
60+ years Total<br />
Male (n=286) 3% 12% 40% 45% 1% 50%<br />
Female (n=287) 3% 10% 70% 49% 1% 50%<br />
National Urban Under 5 5-15 years<br />
16-60<br />
years<br />
60+ years Total<br />
Male 17% 25% 55% 2% 48%<br />
Female 15% 27% 55% 4% 52%<br />
25
26<br />
The size <strong>of</strong> this sample <strong>of</strong> slum<br />
households averaged 4.8<br />
persons per household, which<br />
is larger than <strong>the</strong> national<br />
average <strong>of</strong> 4.1. Namuwongo<br />
households were <strong>the</strong> largest<br />
on average with 5.2 persons,<br />
and Kisenyi <strong>the</strong> smallest<br />
with 4.5. The data shows<br />
that <strong>the</strong> 4.8 average <strong>in</strong> <strong>the</strong><br />
sample population is largely<br />
<strong>in</strong> uenced by 4-6 members<br />
per household, whereas <strong>the</strong><br />
national gure represents<br />
a more equal distribution<br />
between 1 and 4 members. This comes <strong>in</strong>to greater<br />
signi cance when consider<strong>in</strong>g overcrowd<strong>in</strong>g, which is<br />
discussed <strong>in</strong> <strong>the</strong> Physical capital section.<br />
Migration is one <strong>of</strong> <strong>the</strong> key contribut<strong>in</strong>g factors to<br />
<strong>Kampala</strong>’s population growth. Of all respondents, only<br />
14% stated that <strong>the</strong>y were born <strong>in</strong> <strong>Kampala</strong>, and <strong>of</strong><br />
those who moved <strong>in</strong>to <strong>the</strong> city, 68% have lived <strong>the</strong>re<br />
for longer than 7 years.<br />
Just over half <strong>of</strong> <strong>the</strong> respondents who had been<br />
migrants had come from Buganda (<strong>the</strong> district<br />
surround<strong>in</strong>g <strong>Kampala</strong>). West Nile and Acholi are <strong>the</strong> two<br />
areas that were<br />
worst affected by<br />
<strong>the</strong> LRA con ict<br />
last<strong>in</strong>g from 1986<br />
until 2006, though<br />
toge<strong>the</strong>r <strong>the</strong>y<br />
account for only<br />
12% <strong>of</strong> migrants,<br />
all <strong>of</strong> whom live<br />
<strong>in</strong> Namuwongo.<br />
This is contrary<br />
to <strong>the</strong> nd<strong>in</strong>gs<br />
<strong>in</strong> <strong>the</strong> previous<br />
ACF study, as it states that <strong>the</strong> dwellers are mostly<br />
from neighbour<strong>in</strong>g countries and <strong>the</strong> north and east<br />
portions <strong>of</strong> <strong>the</strong> country (UMoH et al. 2009). None <strong>of</strong> <strong>the</strong><br />
respondents had <strong>in</strong>dicated <strong>the</strong>y were orig<strong>in</strong>ally from<br />
Karamoja.<br />
Of <strong>the</strong>se migrants, 86% came from rural areas and<br />
<strong>the</strong> rema<strong>in</strong><strong>in</strong>g 14 % came from <strong>urban</strong> areas. This<br />
is contradictory to nd<strong>in</strong>gs that migration patterns<br />
typically move from rural areas to a nearby <strong>urban</strong><br />
area, <strong>the</strong>n nally a major <strong>urban</strong> centre—<strong>in</strong> this case,<br />
<strong>Kampala</strong> (Stites & Akabwai 2012).<br />
The referr<strong>in</strong>g study did however focus on Karamojong<br />
people from <strong>the</strong> nor<strong>the</strong>ast <strong>of</strong> <strong>the</strong> country, <strong>of</strong> which this<br />
survey did not claim any respondents.<br />
One reason<strong>in</strong>g for this may be that Karamojong are<br />
a traditional pastoralist culture, and when <strong>the</strong>y arrive<br />
to <strong>the</strong> city <strong>the</strong>y may not adapt or <strong>in</strong>tegrate well to a<br />
cash and <strong>in</strong>come TABLE 1: RANKED REASON FOR MOVING TO<br />
based economy<br />
KAMPALA (N=168)<br />
(ACF 2010a; Reason Rank<br />
Stites & Akabwai F<strong>in</strong>d work 1<br />
2012). Because Services available <strong>in</strong> <strong>the</strong> city 2<br />
<strong>of</strong> this, <strong>the</strong>y are<br />
not as likely to<br />
Family reasons<br />
Better hous<strong>in</strong>g<br />
Social pressure/war<br />
3<br />
4<br />
5<br />
nd hous<strong>in</strong>g O<strong>the</strong>r 6<br />
<strong>in</strong> a slum area Less risk <strong>of</strong> natural hazard 7
or will seek out o<strong>the</strong>r populations <strong>of</strong> Karamojong for<br />
support. They are noted as <strong>the</strong> <strong>poor</strong>est population<br />
<strong>in</strong> <strong>Uganda</strong>, and rural skills do not translate well <strong>in</strong>to<br />
<strong>urban</strong> employment skills. Therefore <strong>the</strong>y may not have<br />
<strong>the</strong> means to acquire lodg<strong>in</strong>g and, <strong>in</strong> fact, <strong>the</strong> same<br />
study says that <strong>the</strong> majority return to Karamoja, albeit<br />
forcibly by <strong>the</strong> government after be<strong>in</strong>g found homeless<br />
(Gackle et al. 2007; Bett et al. 2005; Stites & Akabwai<br />
2012).<br />
When asked why <strong>the</strong>y had chosen to move to <strong>Kampala</strong>,<br />
46% <strong>of</strong> <strong>the</strong> respondents had stated more than one<br />
reason. Nearly half stated it was to nd work or better<br />
pay<strong>in</strong>g work. 48% <strong>of</strong> <strong>the</strong> migrants had said that <strong>the</strong>y<br />
had changed <strong>the</strong>ir type <strong>of</strong> work s<strong>in</strong>ce mov<strong>in</strong>g to<br />
<strong>Kampala</strong>, <strong>the</strong> majority <strong>of</strong> which were formerly farmers<br />
or pastoralists. The two ma<strong>in</strong> reasons expla<strong>in</strong><strong>in</strong>g why<br />
<strong>the</strong>y had changed <strong>the</strong>ir type <strong>of</strong> work were that if <strong>the</strong>y<br />
were agriculturalists <strong>the</strong>re was no land available to<br />
farm, and o<strong>the</strong>rs did not have capital to start a bus<strong>in</strong>ess<br />
<strong>in</strong> <strong>the</strong>ir new area <strong>of</strong> residence.<br />
5.3.2 F<strong>in</strong>ancial Capital<br />
Income <strong>in</strong>formation collected <strong>in</strong> this study is quite<br />
extensive, and 80% <strong>of</strong> respondents provided at least<br />
some <strong>in</strong>formation on <strong>the</strong>ir <strong>in</strong>come sources. Contrary<br />
to what was previously<br />
thought, <strong>the</strong> majority<br />
For reference, <strong>the</strong> average<br />
exchange rate dur<strong>in</strong>g <strong>the</strong><br />
<strong>of</strong> households (66%) study period has been<br />
reported only one<br />
calculated as:<br />
source <strong>of</strong> <strong>in</strong>come,<br />
26% with two, and<br />
1 US dollar (USD) =<br />
2485 2485 <strong>Uganda</strong>n shill<strong>in</strong>gs<br />
(UShs)<br />
8% with three. 78% <strong>of</strong><br />
respondents replied<br />
1 Euro (EUR) =<br />
3160 3160 <strong>Uganda</strong>n shill<strong>in</strong>gs<br />
that <strong>the</strong>ir primary source<br />
<strong>of</strong> <strong>in</strong>come is every day,<br />
(UShs)<br />
with o<strong>the</strong>r <strong>in</strong>come sources ei<strong>the</strong>r once/twice per week<br />
(16%) or less than once/week (6%).<br />
Households were categorized <strong>in</strong>to eight types<br />
dependent on <strong>the</strong> primary <strong>in</strong>come source. These<br />
were justi ed by <strong>the</strong> type <strong>of</strong> work as detailed by <strong>the</strong><br />
respondent. Casual labour and petty trade/street<br />
vendors were <strong>the</strong> most common types, account<strong>in</strong>g<br />
for just under half <strong>of</strong> all respondents (n=91) which<br />
is agrees with previous studies (UN-HABITAT 2007;<br />
UMoFPED 2000; UNDP & UMoLHUD 2008).<br />
As <strong>in</strong>comes are bound to shift <strong>in</strong> a casual labour<br />
market, approximations <strong>of</strong> low and high daily <strong>in</strong>comes<br />
were given, thus <strong>the</strong> average <strong>of</strong> <strong>the</strong>se two gures is<br />
what is presented. Though many respondents gave<br />
27
28<br />
types <strong>of</strong> <strong>in</strong>come sources,<br />
<strong>the</strong>y were less forthright<br />
with amounts; leav<strong>in</strong>g<br />
a limited sample <strong>of</strong> 52<br />
respondents (55% <strong>of</strong><br />
those report<strong>in</strong>g any<br />
<strong>in</strong>come <strong>in</strong>formation).<br />
Income levels have been<br />
divided <strong>in</strong>to quartiles<br />
based on <strong>the</strong> total<br />
household daily <strong>in</strong>come,<br />
with those reported at<br />
frequencies <strong>of</strong> ‘a few<br />
times per week’ and<br />
‘once per week or less’<br />
subsequently adjusted<br />
for periodicity. The results show a wide variance for<br />
each type <strong>of</strong> <strong>in</strong>come source, with <strong>the</strong> trend across all<br />
categories <strong>of</strong> <strong>the</strong> maximum far outreach<strong>in</strong>g <strong>the</strong> upper<br />
limit <strong>of</strong> <strong>the</strong> middle 50% <strong>of</strong> <strong>in</strong>come earners, suggest<strong>in</strong>g<br />
overestimation by some <strong>of</strong> <strong>the</strong> respondents.<br />
5.3.2.1 Debts<br />
Debts were had <strong>in</strong> <strong>the</strong> past year by <strong>the</strong> vast majority<br />
<strong>of</strong> respondents (84%). The most frequently stated<br />
reason for tak<strong>in</strong>g on <strong>the</strong> debt was for food, followed by<br />
medical or health costs and nally school fees. Of <strong>the</strong><br />
respondents who had taken debt, 42% had multiple<br />
uses for <strong>the</strong> extra money. The debt amounts ranged<br />
from as little as 2500 to as large as 1,000,000 UShs,<br />
though <strong>the</strong> median amount was just under 200,000. The<br />
average debt taken out to be used solely for food was<br />
113,700. The average loan drawn on only for school<br />
and education costs gured at 185,000 shill<strong>in</strong>gs.<br />
All <strong>in</strong>dividuals that borrowed TABLE 1: RANKING OF<br />
money for bus<strong>in</strong>ess purposes<br />
DEBTS BY LENDER<br />
used <strong>the</strong> loan exclusively for this Lender Rank<br />
purpose, at an average amount NGO 1<br />
<strong>of</strong> 445,000.<br />
Family/<br />
Neighbour<br />
2<br />
Shop 2<br />
5.3.2.1 Markets<br />
Loan<br />
Shark<br />
2<br />
There are markets <strong>in</strong> close Bank 3<br />
proximity <strong>of</strong> almost every neighbourhood <strong>in</strong> <strong>Kampala</strong>,<br />
and <strong>the</strong> slum areas are not an exception. Two major<br />
markets exist <strong>in</strong> <strong>Kampala</strong>, Ow<strong>in</strong>o (with<strong>in</strong> <strong>the</strong> central<br />
bus<strong>in</strong>ess district) and Nakasero (just east <strong>of</strong> <strong>the</strong><br />
central bus<strong>in</strong>ess district). Smaller markets where<br />
slum-dwellers typically shop purchase food ma<strong>in</strong>ly<br />
from two sources: ei<strong>the</strong>r from buy<strong>in</strong>g at <strong>the</strong> larger<br />
markets <strong>in</strong> town and sell<strong>in</strong>g locally at a higher price, or<br />
through direct deliveries from <strong>the</strong> producers that are<br />
made roughly once/week to <strong>the</strong>se smaller markets.<br />
Produce is much cheaper for both <strong>the</strong> vendors and<br />
<strong>the</strong> consumers on this day and most slum dwellers will<br />
purchase food to last at least half <strong>of</strong> <strong>the</strong> week.<br />
5.3.2.1a Pric<strong>in</strong>g <strong>of</strong> Foodstuffs<br />
Pric<strong>in</strong>g <strong>of</strong> produce is sold ei<strong>the</strong>r by piece or arbitrary<br />
units such as ‘piles’ <strong>of</strong> yams, where <strong>the</strong> vendor will<br />
stack up an even look<strong>in</strong>g amount <strong>of</strong> yams and sell<br />
<strong>the</strong>m for <strong>the</strong> same price. The only commodities that<br />
are sold by weight are meat (except poultry, sold by<br />
whole bird), ours and pulses.<br />
Historical price data on food basket items from both<br />
Ow<strong>in</strong>o and Nakasero markets for <strong>the</strong> 18 month period<br />
prior to <strong>the</strong> household study (between December<br />
2010, and May 2012) show price uctuations and <strong>the</strong><br />
relative percentage make up <strong>of</strong> <strong>the</strong> food basket <strong>of</strong><br />
pulses/legumes, meat/ sh, fruit, carbohydrates, and<br />
dairy.<br />
The data displays daily prices <strong>of</strong> 36 commodities at<br />
both retail and wholesale levels. As wholesale prices<br />
more accurately represent <strong>the</strong> seasonality <strong>of</strong> <strong>the</strong><br />
goods for sale, this price <strong>in</strong>formation was utilised to<br />
create this chart.<br />
Additionally, as <strong>the</strong> wholesale prices ultimately<br />
<strong>in</strong> uence retail prices, this <strong>in</strong>formation was used to<br />
display what commodities are <strong>in</strong> uenc<strong>in</strong>g <strong>the</strong> price<br />
<strong>in</strong>dex at any po<strong>in</strong>t <strong>in</strong> <strong>the</strong> 18 month period <strong>in</strong> Figure<br />
7. Prote<strong>in</strong> from meat and sh make up <strong>the</strong> bulk <strong>of</strong><br />
<strong>the</strong> <strong>in</strong>dex, account<strong>in</strong>g for nearly 60% <strong>of</strong> <strong>the</strong> total
throughout <strong>the</strong> year, whereas <strong>the</strong> pr<strong>in</strong>ciple source <strong>of</strong><br />
calories (carbohydrates such as sorghum, matooke,<br />
cassava, and maize) make up approximately 20-25%.<br />
The trends with<strong>in</strong> <strong>the</strong> <strong>in</strong>dex presented show an overall<br />
<strong>in</strong>crease <strong>of</strong> 23% <strong>in</strong> <strong>the</strong> food basket for retail prices<br />
and 37% <strong>in</strong> wholesale prices, a marked <strong>in</strong>crease over<br />
<strong>the</strong> 20.1% CPI <strong>in</strong> ation rate and 15.1% for <strong>the</strong> Annual<br />
Food In ation rate for <strong>the</strong> same period (UBOS 2012).<br />
29
30<br />
A 5-day mov<strong>in</strong>g average trend l<strong>in</strong>e was overlaid on <strong>the</strong><br />
data po<strong>in</strong>ts to mitigate major daily variation <strong>in</strong> prices,<br />
though this is considered below <strong>in</strong> Figure 9. Given <strong>the</strong>se<br />
gures, one can see that direct <strong>in</strong>creases <strong>in</strong> wholesale<br />
prices are not necessarily immediately passed along<br />
to <strong>the</strong> consumer through <strong>the</strong> retail equivalents, though<br />
<strong>the</strong> overall trend is still evident.<br />
Daily prices can vary at <strong>the</strong> markets for a number <strong>of</strong><br />
factors; <strong>the</strong> most <strong>in</strong> uential as noted by vendors <strong>in</strong><br />
Ow<strong>in</strong>o and Nakasero is that heavy ra<strong>in</strong>s can make<br />
<strong>the</strong> roads impassable, prevent<strong>in</strong>g ef cient delivery <strong>of</strong><br />
goods from <strong>the</strong> areas which <strong>the</strong>y orig<strong>in</strong>ate. Normalized<br />
price data from this 18 month period shows that prices<br />
do not vary wildly very <strong>of</strong>ten (<strong>the</strong> median 50% <strong>of</strong> prices<br />
are mostly with<strong>in</strong> a ±0.05 z-score <strong>of</strong> <strong>the</strong> mean). All<br />
price uctuations that occurred at ±2 z-scores below<br />
<strong>the</strong> mean were <strong>in</strong> a 6-week period <strong>of</strong> Sep-Nov 2011.<br />
This po<strong>in</strong>t <strong>in</strong> <strong>the</strong> year is <strong>in</strong> <strong>the</strong> middle <strong>of</strong> <strong>the</strong> second<br />
ra<strong>in</strong>y season, and one can postulate that this would<br />
have had an effect on <strong>the</strong>se prices, i.e. a product<br />
cannot be delivered and <strong>the</strong>refore <strong>the</strong> prices would<br />
<strong>in</strong>crease on that day, while <strong>the</strong> follow<strong>in</strong>g days see<br />
both <strong>the</strong> previous and current days order ful lled, thus
lower<strong>in</strong>g prices due to <strong>in</strong>creased supply.<br />
Market facilities range from simple, outdoor stands<br />
to sheltered permanent structures. The <strong>in</strong>vestigated<br />
markets <strong>in</strong> Namuwongo, Bwaise and Kisenyi have<br />
no cold storage facilities aside from selected meat<br />
vendors, thus <strong>the</strong> price and quality decrease <strong>in</strong>versely<br />
with days after procurement.<br />
It should be noted that petty traders exist with<strong>in</strong> <strong>the</strong><br />
slums as well, <strong>of</strong>ten sell<strong>in</strong>g foodstuffs at lower prices<br />
that can be found at markets, though <strong>the</strong> product<br />
selection is typically limited to sweet potatoes,<br />
tomatoes, onions, cassava, and/or Irish potatoes<br />
5.3.2.1b Impact on prices <strong>of</strong> slum upgrad<strong>in</strong>g<br />
In order to <strong>in</strong>vestigate cost <strong>of</strong> liv<strong>in</strong>g <strong>in</strong>creases due to<br />
Namuwongo’s previously mentioned upgrad<strong>in</strong>g and<br />
subsequent displacement <strong>of</strong> slum dwellers; a market<br />
price survey was conducted <strong>in</strong> order to compare<br />
TABLE 1: PRICE COMPARISONS BETWEEN KISUGU AND NAMUWONGO MARKETS<br />
Product Units Nam’go Kisugu +/-/= Product Units Nam’go Kisugu +/-/=<br />
Staple CHO Vegetables<br />
Maize flour KG 1600 2000 400 Carrots 6 pieces 2000 1200 -800<br />
Cassava flour KG 1400 1400 0 Eggplant 3 pieces 300 500 200<br />
Sorghum flour KG 1400 1600 200 Kusmumawiki 1 bunch 500 500 0<br />
Millet flour KG 2800 2600 -200 Cabbage head 1000 2000 1000<br />
Rce KG 3200 3600 400 Green pepper 3 pieces 1000 200 -800<br />
Cassava Whole root 2000 3000 1000 Okra 4 piecees 100 200 100<br />
Matooke Branch 15000 15000 0 Fruits<br />
Meat (prote<strong>in</strong>) Banana Cluster 1000 2000 1000<br />
Beef KG<br />
Whole<br />
7000 7500 500 P<strong>in</strong>eapple Whole fruit 2000 2000 0<br />
Chicken chicken 10000 12000 2000 Lemon 3 pieces 1000 900 -100<br />
Sheep KG 10000 10000 0 Watermelon Whole fruit 5000 5000 0<br />
Goat meat KG 10000 10000 0 Fat<br />
Prote<strong>in</strong> Pulses Vegetable oil 5 liters 28,500 28000 -500<br />
Beans KG 1800 1800 0 Fuel<br />
prices where slum dwellers (Namuwongo Market)<br />
and residents <strong>of</strong> <strong>the</strong> upgraded area (Kisugu Market)<br />
typically shop. Many goods are sold at differ<strong>in</strong>g prices<br />
for differ<strong>in</strong>g levels <strong>of</strong> quality (class <strong>of</strong> our, breed <strong>of</strong><br />
chicken or hen/cock). Data were collected on prices<br />
<strong>of</strong> all different grades, however, for <strong>the</strong> sake <strong>of</strong> this<br />
comparison, <strong>the</strong> cheapest quality or smallest unit was<br />
used.<br />
As stated previously, <strong>the</strong> food basket utilised was<br />
improvised upon advice <strong>of</strong> <strong>the</strong> guide and market<br />
vendors and was not scienti cally determ<strong>in</strong>ed.<br />
The numbers show that Kisugu market was more<br />
expensive with 13 products cost<strong>in</strong>g more. 11 products<br />
were equal and 9 products were more expensive.<br />
This is not a signi cant difference, though staple<br />
carbohydrates were on <strong>the</strong> whole more expensive and<br />
make up <strong>the</strong> bulk <strong>of</strong> daily calories <strong>in</strong> <strong>the</strong> diets <strong>of</strong> slum<br />
dwellers.<br />
Lentils KG 2000 2000 0 Charcoal Per bas<strong>in</strong> 1000 1000 0<br />
Vegetables Per sack 60000 50000 -10000<br />
Tomatoes 3 pieces 300 1000 700 Firewood bundle 1000 1000 0<br />
Irish potatoes small heap 1000 1000 0 Hygiene<br />
Local yams small heap 1000 2000 1000 Soap<br />
Wash<strong>in</strong>g<br />
1 pcs <strong>of</strong><br />
250G 2,500 2000 -500<br />
Onions 3 pieces 300 600 300 powder 250G 3,000 4000 1000<br />
31
32<br />
When deriv<strong>in</strong>g a basic food basket which comprises<br />
seasonal commodities from each <strong>of</strong> <strong>the</strong> food<br />
consumption score food groups (matooke, rice, beef,<br />
tomatoes, beans, p<strong>in</strong>eapple, and vegetable oil), <strong>the</strong><br />
price differences is 1,100 UShs more expensive at<br />
Kisugu market. This is not a seem<strong>in</strong>gly large <strong>in</strong>crease<br />
(approximately 0.44 USD), though it is nearly 300<br />
shill<strong>in</strong>gs more expensive than <strong>the</strong> CBN l<strong>in</strong>e calculation<br />
for a day’s worth <strong>of</strong> food.<br />
5.3.3 Human Capital<br />
A major part <strong>of</strong> this study, human capital conta<strong>in</strong>s<br />
health and care practices while fur<strong>the</strong>r expand<strong>in</strong>g<br />
on malnutrition. This is complemented by <strong>in</strong>formation<br />
about child education systems and data collected by<br />
<strong>the</strong> survey.<br />
5.3.3.1 Education<br />
<strong>Uganda</strong> had adopted a policy <strong>of</strong> universal free<br />
primary education <strong>in</strong> 1996. Nationally, government<br />
primary school fees still exist with a national average<br />
<strong>of</strong> 9006 shill<strong>in</strong>gs with additional fees averag<strong>in</strong>g at<br />
nearly 16,000. Obviously, this is far from free, however<br />
<strong>the</strong> non-government equivalent can average nearly<br />
260,000 shill<strong>in</strong>gs with an additional 167,000 shill<strong>in</strong>gs<br />
<strong>in</strong> ancillary costs (W<strong>in</strong>kler & Sondergaard 2008).<br />
The survey did not dist<strong>in</strong>guish private from public<br />
education, and as such average fees were calculated<br />
to be 60,000 shill<strong>in</strong>gs. The additional fees that are<br />
charged cover <strong>the</strong> costs <strong>of</strong> books, materials, and <strong>in</strong><br />
some cases uniforms. Fur<strong>the</strong>rmore, costs may come<br />
<strong>in</strong> <strong>the</strong> way <strong>of</strong> school lunches which can cost between<br />
1000 and 2500 shill<strong>in</strong>gs/day as reported by a school<br />
teacher <strong>in</strong> Kisenyi.<br />
<strong>Uganda</strong> was <strong>the</strong> rst country <strong>in</strong> Africa to <strong>of</strong>fer free<br />
universal secondary education <strong>in</strong> addition to primary<br />
school, and has done so for <strong>the</strong> past six years. Despite<br />
this <strong>of</strong>fer<strong>in</strong>g, one third <strong>of</strong> <strong>the</strong> school aged children are<br />
not enrolled (30% <strong>of</strong> males between 5-15 years, 35%<br />
<strong>of</strong> females). When asked why <strong>the</strong> children would not<br />
go to school, nearly two-thirds <strong>of</strong> respondents said it<br />
was because <strong>of</strong> school fees or o<strong>the</strong>r ancillary costs.<br />
5.3.3.2 Health and Care Practices<br />
<strong>Uganda</strong>’s public health system operates on a<br />
referral basis as <strong>Kampala</strong>’s public health centres<br />
are designated with <strong>the</strong> Roman numeral II-IV. Health<br />
centres II are able to treat common diseases and<br />
are run by a nurse. If a patient’s needs require more<br />
attention or expertise, <strong>the</strong>y are sent to a Health centre<br />
III or IV, or if needed, to a referral hospital. The <strong>Uganda</strong><br />
M<strong>in</strong>imum Health Care Package provides free care<br />
classi ed under four particular clusters: (UMoH 2010)<br />
• Health promotion, environmental health<br />
and community health<br />
• Maternal and child health<br />
• Communicable diseases control<br />
• Prevention and control <strong>of</strong> noncommunicable<br />
diseases, disabilities, <strong>in</strong>juries<br />
and mental health problems<br />
Approximately 60 health centres III and IV are located<br />
throughout <strong>the</strong> city, and at least one is <strong>in</strong> walk<strong>in</strong>g<br />
distance to each slum area that was <strong>in</strong>vestigated.<br />
Additionally, more than 800 private cl<strong>in</strong>ics and 22 not<br />
for pro t centres serve <strong>the</strong> District (Atukunda 2011).
Doctors and nurses were <strong>in</strong>terviewed at Kawempe<br />
Health Centre IV (near Bwaise), Kisugu Health Centre<br />
III (Namuwongo) and Kiruddu Health Centre III on <strong>the</strong><br />
outskirts <strong>of</strong> <strong>the</strong> city.<br />
The physicians had stated that a lack <strong>of</strong> drugs and<br />
wait<strong>in</strong>g times were <strong>the</strong> most common reasons that<br />
someone would not seek treatment, along with miss<strong>in</strong>g<br />
a day <strong>of</strong> work (and <strong>the</strong>refore <strong>in</strong>come) and nobody<br />
to watch over <strong>the</strong>ir children. Health centres perform<br />
outreach programs <strong>in</strong> <strong>the</strong> neighbour<strong>in</strong>g areas that<br />
typically consist <strong>of</strong> education about proper self and<br />
child care practices.<br />
One <strong>of</strong> <strong>the</strong> busier health centres <strong>in</strong> <strong>the</strong> city, Kawempe an atypical high concentration <strong>of</strong> Muslim households<br />
Health Centre IV serves a population <strong>of</strong> about 675,000<br />
people. On a daily basis, <strong>the</strong> centre sees 200-250<br />
<strong>in</strong> <strong>the</strong> border<strong>in</strong>g slum <strong>of</strong> Bwaise.<br />
outpatients, 80-100 antenatal, 50-60<br />
The household survey exam<strong>in</strong>ed some<br />
teenagers seek<strong>in</strong>g birth control and STD<br />
TABLE 1: INSUFFICIENT<br />
ACCESS TO HEALTHCARE<br />
basic health practices and access and<br />
tests, 50-60 o<strong>the</strong>rs for family plann<strong>in</strong>g,<br />
utilization <strong>of</strong> services. Public health<br />
and 18-20 <strong>in</strong>patient maternity. This gives Namuwongo 67% centres such as those <strong>in</strong>terviewed<br />
a daily range <strong>of</strong> 410 – 510 patients, for<br />
Bwaise 54%<br />
(54%) and private cl<strong>in</strong>ics (27%) account<br />
a staff <strong>of</strong> 15 nurses and 1 doctor. The<br />
number <strong>of</strong> patients <strong>in</strong>creases each<br />
Kisenyi<br />
All<br />
49%<br />
57%<br />
for <strong>the</strong> most <strong>of</strong>ten visited health service<br />
providers. In Bwaise, <strong>the</strong> LC recounted<br />
time a new service is added. Seasonal<br />
that most residents will self-diagnose<br />
changes <strong>in</strong> patient presentation occur dur<strong>in</strong>g <strong>the</strong> and seek treatment at <strong>in</strong>formal pharmacies <strong>in</strong> <strong>the</strong><br />
ra<strong>in</strong>y seasons which are typically school children who slums, though <strong>the</strong>se residents reported a lower usage<br />
are seek<strong>in</strong>g treatment for sk<strong>in</strong> and upper respiratory rate <strong>of</strong> pharmacies (11%) than <strong>the</strong> o<strong>the</strong>r two areas<br />
<strong>in</strong>fections, and more recently, measles.<br />
(14%).<br />
The bulk <strong>of</strong> <strong>the</strong> patients at <strong>the</strong> health centres are<br />
children and those seek<strong>in</strong>g medication for tuberculosis<br />
and antiretrovirals. One <strong>in</strong>terview occurred dur<strong>in</strong>g a<br />
mass-vacc<strong>in</strong>ation day, and it was observed that when<br />
a nurse announced for all mo<strong>the</strong>rs with HIV+ children<br />
to stand <strong>in</strong> a queue to receive counsell<strong>in</strong>g before<br />
treatment, approximately half <strong>of</strong> <strong>the</strong> 50-60 mo<strong>the</strong>rs and<br />
children came to stand <strong>in</strong> l<strong>in</strong>e. The 2011 DHS states<br />
that 80.3% <strong>of</strong> women <strong>in</strong> <strong>Kampala</strong> have been tested<br />
for HIV, with 96.1% know<strong>in</strong>g where to get <strong>the</strong> test.<br />
Likewise, only 69.5% <strong>of</strong> men have been tested with<br />
96.6% know<strong>in</strong>g where to get <strong>the</strong> test (UBOS 2011).<br />
It has recently reported that after a steady decl<strong>in</strong>e <strong>in</strong><br />
<strong>the</strong> rate <strong>of</strong> HIV <strong>in</strong>fection s<strong>in</strong>ce <strong>the</strong> 1990s, <strong>Uganda</strong> has<br />
recently recorded its rst <strong>in</strong>crease <strong>in</strong> <strong>in</strong>fection rate<br />
at 7.3% for 2012, which is allegedly attributed to <strong>the</strong><br />
shift <strong>in</strong> public health programm<strong>in</strong>g to abst<strong>in</strong>ence-only<br />
promotion dur<strong>in</strong>g <strong>the</strong> early 2000s (Kron 2012).<br />
Kawempe Health Centre also serves a large Muslim<br />
population. The doctor noted that <strong>the</strong> Muslim culture<br />
<strong>of</strong> polygamy and high fertility typically meant more<br />
people liv<strong>in</strong>g <strong>in</strong> a s<strong>in</strong>gle household (typically one or two<br />
rooms) and presented more <strong>of</strong>ten with communicable<br />
diseases, though this <strong>in</strong>vestigation showed no<br />
difference between Muslim households and o<strong>the</strong>rs, nor<br />
In terms <strong>of</strong> be<strong>in</strong>g able to access health services, 57%<br />
<strong>of</strong> respondents said <strong>the</strong>y were not able to go as <strong>of</strong>ten<br />
as <strong>the</strong>y need, <strong>of</strong> which about 2/3rds <strong>of</strong> respondents<br />
resided <strong>in</strong> Namuwongo. The majority <strong>of</strong> compla<strong>in</strong>ts<br />
were that it was too expensive to seek treatment, as<br />
well as compla<strong>in</strong>ts <strong>of</strong> <strong>the</strong> costs <strong>of</strong> tests, consultations,<br />
and medic<strong>in</strong>e.<br />
As all services are provided for free at <strong>the</strong> public<br />
health centres, <strong>the</strong>re appears to be a gap <strong>in</strong> <strong>the</strong><br />
communication <strong>of</strong> <strong>the</strong> services available. It was<br />
admitted by staff at each health centre that it is not<br />
33
34<br />
uncommon for <strong>the</strong> centre to not have enough medic<strong>in</strong>e<br />
<strong>in</strong>ventoried to supply it to those <strong>in</strong> need; <strong>the</strong>refore <strong>the</strong><br />
patients are forced to go elsewhere for <strong>the</strong> drugs and<br />
pay for <strong>the</strong>m, should <strong>the</strong>y be able to afford <strong>the</strong>m.<br />
In terms <strong>of</strong> illnesses, 94% <strong>of</strong> households claimed<br />
to have had one member or more become ill <strong>in</strong> <strong>the</strong><br />
previous month. The most commonly reported was<br />
malaria, with 75% <strong>of</strong> respondents say<strong>in</strong>g that <strong>the</strong>y had<br />
had <strong>the</strong> illness at least once <strong>in</strong> <strong>the</strong> previous month,<br />
which happened to be <strong>the</strong> tail end <strong>of</strong> <strong>the</strong> heavier <strong>of</strong> <strong>the</strong><br />
two ra<strong>in</strong>y seasons. Similarly, 52% <strong>of</strong> households with<br />
children reported that a child <strong>in</strong> <strong>the</strong> household had<br />
malaria <strong>in</strong> <strong>the</strong> same timeframe. Both <strong>of</strong> <strong>the</strong>se gures<br />
are higher than <strong>the</strong> <strong>Kampala</strong> average for malaria<br />
<strong>in</strong>cidence for a 30-day recall period which stands at<br />
44.6%, though <strong>the</strong> survey does not <strong>in</strong>dicate what time<br />
<strong>of</strong> year this recall took place (UBOS 2010b). Doctors<br />
have noted that if a person has a fever <strong>the</strong>y are likely<br />
to th<strong>in</strong>k that it is malaria, so <strong>the</strong>se results are solely<br />
anecdotal and not necessarily representative <strong>of</strong> <strong>the</strong><br />
malaria prevalence with<strong>in</strong> <strong>the</strong> sample population.<br />
TABLE 1: ILLNESS PREVALENCE BY RANKING<br />
Respondent Rank Child Rank<br />
Malaria 1 Malaria 1<br />
ARI 2 Measles 2<br />
Diarrhea 3 Diarrhea 3<br />
Measles 4 ARI 4<br />
Sk<strong>in</strong> Infections 5 Sk<strong>in</strong> Infections 5<br />
Chronic<br />
Diseases<br />
5<br />
Chronic<br />
Diseases<br />
6<br />
O<strong>the</strong>r 5 O<strong>the</strong>r --<br />
There was a district-wide measles outbreak reported<br />
by each <strong>of</strong> <strong>the</strong> health centres, and <strong>the</strong>se results con rm<br />
that 42% <strong>of</strong> children (19% <strong>of</strong> adults) have reported to<br />
have had measles with<strong>in</strong> <strong>the</strong> month prior to <strong>the</strong> survey,<br />
despite child measles vacc<strong>in</strong>ation reported at 82% for<br />
<strong>Kampala</strong> <strong>in</strong> 2011 (n=86) (UBOS 2011).<br />
Similarly, 30% <strong>of</strong> households with children have<br />
reported that <strong>the</strong> child has had diarrhoea (14% <strong>of</strong><br />
adults, 0.8% <strong>Kampala</strong> average). Also reported were<br />
25% <strong>of</strong> adults with respiratory illnesses and 18% <strong>of</strong><br />
children (19% <strong>Kampala</strong>).<br />
Mosquito nets are used <strong>in</strong> 87% <strong>of</strong> <strong>the</strong> households<br />
(82% <strong>Kampala</strong>), 50% <strong>of</strong> which are untreated (42.5%<br />
<strong>Kampala</strong>). 54% <strong>of</strong> respondents had claimed that every<br />
member <strong>of</strong> <strong>the</strong> household sleeps under mosquito<br />
nets. 75% <strong>of</strong> children sleep under <strong>the</strong> net, which is<br />
on parity with <strong>the</strong> <strong>of</strong> cial gure <strong>of</strong> 74%. Likewise, 74%<br />
<strong>of</strong> men and 77% <strong>of</strong> women use <strong>the</strong> nets . There was<br />
no evident <strong>in</strong>crease <strong>of</strong> cases <strong>of</strong> malaria due to nonuse<br />
<strong>of</strong> mosquito nets, see<strong>in</strong>g that 95% <strong>of</strong> adult cases<br />
<strong>of</strong> malaria (97% <strong>of</strong> children) were experienced by<br />
households that do <strong>in</strong>deed use <strong>the</strong> nets.<br />
5.3.3.2a Malnutrition<br />
As stated previously, malnutrition is <strong>the</strong> key area <strong>of</strong><br />
<strong>in</strong>tervention for ACF and is necessary to exam<strong>in</strong>e <strong>in</strong> this<br />
study. No speci c data (MUAC, oedema, age, height<br />
or weight) at <strong>the</strong> household level was collected dur<strong>in</strong>g<br />
this study as expla<strong>in</strong>ed <strong>in</strong> <strong>the</strong> Study Limits section.<br />
However as mentioned, a previous study by ACF had<br />
collected malnutrition <strong>in</strong>dicator data and as such will<br />
be presented here alongside measurements presented<br />
<strong>in</strong> <strong>the</strong> 2011 National Demographic and Health Survey<br />
(DHS). For <strong>the</strong> sake <strong>of</strong> this study, admission data to<br />
malnutrition treatment programmes is presented that<br />
was ga<strong>the</strong>red by Mwanamugimu Child Nutrition Unit,<br />
<strong>the</strong> primary malnutrition treatment centre <strong>in</strong> <strong>Kampala</strong><br />
at Mulago National Referral Hospital.<br />
Is Malnutrition Present?<br />
HfA, WfA, and WfH are collected every ve years by<br />
<strong>the</strong> <strong>Uganda</strong>n Government dur<strong>in</strong>g <strong>the</strong> Demographic<br />
and Health Survey. However, representation <strong>of</strong> <strong>the</strong><br />
population may be questionable as measurements<br />
were taken from only 132 children under 5 years <strong>of</strong><br />
age <strong>in</strong> <strong>Kampala</strong> <strong>in</strong> 2011 (UBOS 2011).<br />
A previous study by ACF <strong>in</strong> 2009 had taken HfA,
WfA, MUAC, and WfH measurements <strong>in</strong> two <strong>of</strong> <strong>the</strong><br />
same three slum areas which are <strong>in</strong>vestigated by this<br />
report. As acute malnutrition <strong>in</strong>dicators such as WfA<br />
and MUAC are not relevant to <strong>the</strong> current context, only<br />
chronic malnutrition factors are presented here<strong>in</strong>.<br />
Stunt<strong>in</strong>g is a measure that usually describes long-term<br />
chronic malnutrition and is quali ed by a low height for<br />
age. <strong>Uganda</strong> has historically had one <strong>of</strong> <strong>the</strong> highest<br />
rates <strong>of</strong> childhood stunt<strong>in</strong>g <strong>in</strong> Africa (Kikafunda et al.<br />
1998). A child <strong>of</strong> z-score <strong>of</strong> -2 can be viewed as stunted,<br />
with -3 or lower as severely stunted. Accord<strong>in</strong>g to <strong>the</strong><br />
2011 DHS, 12.6% <strong>of</strong> children <strong>in</strong> <strong>Kampala</strong> were stunted<br />
with 2.2% severely so (UBOS 2011). In 2009, stunt<strong>in</strong>g<br />
was calculated at rates <strong>of</strong> 28% as stunted with 7.5%<br />
severely so with<strong>in</strong> <strong>the</strong> slums (UMoH et al. 2009).<br />
Weight for age can also be an <strong>in</strong>dicator <strong>of</strong> chronic<br />
malnutrition, though without cont<strong>in</strong>ual monitor<strong>in</strong>g<br />
at a population level <strong>the</strong> <strong>in</strong>dicator itself is relatively<br />
arbitrary. Regardless, <strong>the</strong> rates <strong>in</strong> <strong>Kampala</strong> show a<br />
decrease between 2006 and 2011, with underweight<br />
children lessen<strong>in</strong>g from 10.3 to 9.6% with a -2 z-score<br />
and -3 z-score from 2.6 to 1.4% (UBOS 2011; UBOS<br />
2006). In <strong>the</strong> 2009 study, total underweight children<br />
were 7.7% with .7% severely underweight.<br />
A rapid assessment study to address stunt<strong>in</strong>g <strong>in</strong><br />
<strong>Uganda</strong> performed by <strong>the</strong> M<strong>in</strong>istry <strong>of</strong> Health had<br />
found that <strong>in</strong> 2011, stunt<strong>in</strong>g <strong>in</strong> <strong>urban</strong> areas was<br />
characterised at 26% with a -2 z-score along with<br />
underweight at 11% (UMoH 2011). This is not explicitly<br />
<strong>in</strong> <strong>Kampala</strong>, but provides both a po<strong>in</strong>t <strong>of</strong> reference<br />
and a po<strong>in</strong>t <strong>of</strong> contradiction to <strong>the</strong> census nd<strong>in</strong>gs,<br />
fur<strong>the</strong>r question<strong>in</strong>g <strong>the</strong> applicability <strong>of</strong> secondary<br />
government data.<br />
TFP and OTP Admissions<br />
In <strong>Kampala</strong>, Mwanamugimu Child Nutrition Unit at<br />
Mulago National Referral Hospital receives <strong>the</strong> more<br />
severe cases <strong>of</strong> malnutrition from <strong>Kampala</strong> and<br />
surround<strong>in</strong>g districts. The stark <strong>in</strong>crease <strong>of</strong> admission<br />
numbers between January and June 2011 to both<br />
its Therapeutic Feed<strong>in</strong>g Programmes (TFPs) and its<br />
Outpatient Treatment Programmes (OTPs) were one <strong>of</strong><br />
<strong>the</strong> orig<strong>in</strong>al <strong>in</strong>stigat<strong>in</strong>g factors <strong>of</strong> this study. Therapeutic<br />
feed<strong>in</strong>g programmes (TFP) are <strong>in</strong>-patient treatments<br />
for malnutrition, generally receiv<strong>in</strong>g patients that<br />
are suffer<strong>in</strong>g from severe acute malnourishment (as<br />
described by WfH and MUACs with a z-score <strong>of</strong> -3<br />
and/or presence <strong>of</strong> bilateral oedema).<br />
35
36<br />
OTPs are adm<strong>in</strong>istered both at Mwanamugimu and<br />
supported programmes at ve health centre III and IVs<br />
(that were opened with <strong>the</strong> assistance <strong>of</strong> ACF) around<br />
<strong>the</strong> district. Two <strong>of</strong> <strong>the</strong> health centres that adm<strong>in</strong>ister<br />
<strong>the</strong> outpatient programmes are located with<strong>in</strong> one<br />
kilometre <strong>of</strong> two <strong>of</strong> <strong>the</strong> slums <strong>in</strong>vestigated, while <strong>the</strong><br />
o<strong>the</strong>r two are located on <strong>the</strong> outer edges <strong>of</strong> <strong>the</strong> district.<br />
60% <strong>of</strong> new admissions to supported OTPs over <strong>the</strong><br />
year preced<strong>in</strong>g <strong>the</strong> household study have come from<br />
<strong>the</strong> health centres that border <strong>the</strong> <strong>in</strong>vestigated slum<br />
areas.<br />
Figure 13 displays <strong>the</strong> number <strong>of</strong> admissions <strong>in</strong>to<br />
<strong>the</strong>rapeutic feed<strong>in</strong>g programs at Mwanamugimu for all<br />
<strong>of</strong> and <strong>the</strong> total admissions for <strong>the</strong> outpatient programs<br />
at Mwanamugimu and supported health centres III<br />
and IV throughout <strong>the</strong> city from December 2010 until<br />
May 2012.<br />
The doctors and nurses at each <strong>in</strong>terviewed health<br />
centre had stated that cases <strong>of</strong> malnutrition are<br />
rarely ever brought to <strong>the</strong> health centre expressly for<br />
malnutrition. Ra<strong>the</strong>r, <strong>the</strong>y present with ano<strong>the</strong>r illness<br />
and malnutrition is an ancillary diagnosis.<br />
<strong>Explor<strong>in</strong>g</strong> peaks <strong>in</strong> <strong>the</strong> admission trends<br />
Consider<strong>in</strong>g <strong>the</strong> framework as utilised <strong>in</strong> this study,<br />
it is evident that cases <strong>of</strong> malnutrition can arise from<br />
multidimensional causes.<br />
To <strong>in</strong>vestigate <strong>the</strong> <strong>in</strong>crease that spurred this study, one<br />
must regard one <strong>of</strong> <strong>the</strong> primary factors <strong>in</strong> uenc<strong>in</strong>g a<br />
successful livelihood <strong>in</strong> this context- <strong>the</strong> price <strong>of</strong> food.<br />
Fur<strong>the</strong>rmore <strong>the</strong> most <strong>of</strong>ten cited issue with liv<strong>in</strong>g <strong>in</strong> a<br />
slum area, ood<strong>in</strong>g, is displayed.<br />
By overlay<strong>in</strong>g this <strong>in</strong>formation, <strong>the</strong> correlations between<br />
trends become evident. While consider<strong>in</strong>g ra<strong>in</strong>fall and<br />
new admissions, one can postulate that high levels <strong>of</strong><br />
ra<strong>in</strong>fall will cause ood<strong>in</strong>g <strong>in</strong> some areas (slums <strong>in</strong> this<br />
case) br<strong>in</strong>g<strong>in</strong>g waterborne diseases along with <strong>the</strong>m<br />
and caus<strong>in</strong>g children to seek medical assistance and,<br />
if malnourished, be<strong>in</strong>g diagnosed as such.<br />
There is also an apparent correlation between<br />
admissions and price <strong>in</strong>dex. As households <strong>in</strong> <strong>urban</strong><br />
centres depend pr<strong>in</strong>cipally on cash for ma<strong>in</strong>ta<strong>in</strong><strong>in</strong>g<br />
<strong>the</strong>ir livelihood, an <strong>in</strong>crease <strong>in</strong> prices when <strong>in</strong>comes<br />
do not <strong>in</strong>crease <strong>in</strong> turn may cause duress <strong>in</strong> provid<strong>in</strong>g<br />
appropriate amounts <strong>of</strong> food to <strong>the</strong> household<br />
members. As this is an <strong>urban</strong> centre, markets may<br />
source <strong>the</strong>ir <strong>in</strong>ventory from any number <strong>of</strong> areas, and<br />
thus shortages due to seasonality are not common.<br />
However, any circumstance that results <strong>in</strong> low yields will<br />
raise <strong>the</strong> prices with<strong>in</strong> <strong>the</strong> markets <strong>in</strong>-k<strong>in</strong>d. As <strong>in</strong>come
activities <strong>in</strong> <strong>Kampala</strong> are widely varied, any rise or fall<br />
<strong>in</strong> <strong>the</strong>ir levels may not be <strong>in</strong>-l<strong>in</strong>e with <strong>the</strong> seasonality <strong>of</strong><br />
prices, leav<strong>in</strong>g <strong>the</strong> population vulnerable.<br />
With that, price <strong>in</strong>dex and ra<strong>in</strong>fall are also strongly<br />
correlated. As <strong>the</strong> grow<strong>in</strong>g/ra<strong>in</strong>y season cont<strong>in</strong>ues,<br />
food stores become more depleted until <strong>the</strong> next<br />
harvest. Thus, scarcity <strong>in</strong> <strong>the</strong> agricultural regions will<br />
relay an <strong>in</strong>crease <strong>in</strong> price at <strong>the</strong> markets.<br />
Anecdotal evidence <strong>of</strong> malnutrition <strong>in</strong> <strong>the</strong> slums<br />
It was noted by nurses at Kisugu health centre that<br />
when outreach programs are performed <strong>in</strong> <strong>the</strong> slums,<br />
observation dictates that malnutrition is widespread<br />
throughout <strong>the</strong> slum areas, though <strong>the</strong>se claims are not<br />
con rmed through test<strong>in</strong>g by <strong>the</strong> staff. The <strong>in</strong>terviewee<br />
claimed that <strong>the</strong> health centre diagnoses 3-5 cases <strong>of</strong><br />
malnutrition (<strong>of</strong> a total <strong>of</strong> 200 outpatients) per workday<br />
(M-F) on a yearlong basis. The cases that are identi ed<br />
as severe malnutrition are referred to Mwanamugimu<br />
for treatment. Though <strong>the</strong> programs are free <strong>of</strong> charge,<br />
many <strong>of</strong> <strong>the</strong> patients do not follow this referral as <strong>the</strong>y<br />
cannot afford transport costs, <strong>the</strong>y would have no one<br />
to look after <strong>the</strong>ir o<strong>the</strong>r children, or that <strong>the</strong>y cannot<br />
afford to miss a day <strong>of</strong> <strong>in</strong>come to seek treatment.<br />
Less severe cases <strong>of</strong> malnourishment at Kisugu<br />
Health Centre are simply given education on proper<br />
nutrition, as Kisugu health centre is not a centre that<br />
has a sponsored OTP programme by Mwanamugimu.<br />
It should be noted that Kisugu does not keep statistics<br />
<strong>the</strong> number cases <strong>of</strong> diagnosed malnourishment.<br />
As not all cases <strong>of</strong> malnourishment follow through on<br />
<strong>the</strong> referral to Mwanamugimu, and that Mwanamugimu<br />
and supported health centres receive cases <strong>of</strong><br />
malnourishment from both with<strong>in</strong> and outside<br />
<strong>Kampala</strong> District, <strong>the</strong> collected and reported statistics<br />
may not be accurately describ<strong>in</strong>g <strong>the</strong> prevalence <strong>of</strong><br />
malnourishment speci cally with<strong>in</strong> <strong>Kampala</strong>. As area<br />
<strong>of</strong> residence is not recorded dur<strong>in</strong>g admission, no<br />
collected data can relate malnourishment to <strong>the</strong> slum<br />
areas, despite its apparent presence.<br />
5.3.4 Social Capital<br />
Community groups, networks, and political <strong>in</strong> uence<br />
were all considered to demonstrate <strong>the</strong> use <strong>of</strong> social<br />
capital with<strong>in</strong> <strong>the</strong> areas.<br />
5.3.4.1 Community Groups and Networks<br />
In terms <strong>of</strong> social capital, nearly half <strong>of</strong> <strong>the</strong> <strong>in</strong>terviewees<br />
are a member <strong>of</strong> a community group or organization.<br />
The majority are members <strong>of</strong> <strong>the</strong> NSDF sav<strong>in</strong>gs<br />
37
38<br />
organization, though <strong>the</strong>se results may be skewed as<br />
some <strong>of</strong> <strong>the</strong> enumerators were also members. Drama<br />
and church groups came <strong>in</strong> second and third on <strong>the</strong><br />
list, respectively.<br />
As an example <strong>of</strong> <strong>the</strong> work that social support can<br />
accomplish, <strong>the</strong> NSDF <strong>in</strong> Kisenyi slum spent <strong>the</strong> better<br />
part <strong>of</strong> a decade rais<strong>in</strong>g money and solicit<strong>in</strong>g grants to<br />
build a new community build<strong>in</strong>g. The now operational<br />
facility conta<strong>in</strong>s pay toilets, access to water from <strong>the</strong><br />
city water network, meet<strong>in</strong>g rooms, health service<br />
<strong>of</strong> ces and <strong>the</strong> <strong>of</strong> ces <strong>of</strong> <strong>the</strong> organisation.<br />
TABLE 1: PROPORTION<br />
RECEIVING SUPPORT<br />
Reception <strong>of</strong> different<br />
forms <strong>of</strong> support was<br />
Namuwongo 67% measured dur<strong>in</strong>g <strong>the</strong><br />
Bwaise 46%<br />
survey. Items <strong>in</strong>vestigated<br />
Kisenyi<br />
All<br />
49%<br />
54%<br />
were<br />
food<br />
cash, remittance,<br />
or labour and<br />
were separated by six different sources. 49 <strong>of</strong> 119<br />
respondents had claimed to have received some form<br />
<strong>of</strong> support, 23 <strong>of</strong> which claimed more than one source.<br />
The most frequent was receiv<strong>in</strong>g cash from friends<br />
or family with 86% <strong>of</strong> those who received support<br />
claim<strong>in</strong>g so.<br />
5.3.4.2 Political In uence<br />
It was noted dur<strong>in</strong>g <strong>in</strong>terviews that <strong>the</strong> large population<br />
<strong>of</strong> <strong>the</strong> slums yield a high potential political <strong>in</strong> uence, if<br />
only due to <strong>the</strong>ir numbers. This, however, is not taken<br />
advantage <strong>of</strong> as community organization beyond<br />
sav<strong>in</strong>gs, drama and church groups is limited and<br />
those that do exist represent a small fraction <strong>of</strong> <strong>the</strong><br />
community. Local Council (LC) leaders are elected to<br />
Friends/<br />
Family<br />
TABLE 1: FORMS OF SUPPORT RECEIVED<br />
F<strong>in</strong>ancial<br />
groups<br />
Church<br />
groups<br />
Community<br />
leaders<br />
Government UN/NGO O<strong>the</strong>r<br />
Cash (n=70) 60% 26% 4% 1% 3% 6%<br />
Remittance (n=8) 25% 13% 63%<br />
Food (n=34) 62% 12% 3% 3% 18% 3%<br />
Labour (n=3) 100%<br />
represent each area <strong>in</strong> <strong>the</strong> local government, and <strong>the</strong><br />
LCs provide a forum for suggestions and compla<strong>in</strong>ts<br />
about life <strong>in</strong> <strong>the</strong> slums. One LC represents a certa<strong>in</strong><br />
area <strong>of</strong> <strong>the</strong> city, as a result each slum may have several<br />
LCs dependent on its size. The LCs are typically from<br />
<strong>the</strong> areas that <strong>the</strong>y represent and cont<strong>in</strong>ue to reside<br />
<strong>in</strong> <strong>the</strong> said area. Many residents stated that though<br />
<strong>the</strong> LCs are normally open to listen to <strong>the</strong> concerns <strong>of</strong><br />
<strong>the</strong>ir constituency, little change eventuates from <strong>the</strong>ir<br />
meet<strong>in</strong>gs.
5.3.5 Physical Capital<br />
Physical <strong>in</strong>frastructure <strong>in</strong> any slum area is notoriously<br />
<strong>poor</strong>. Hous<strong>in</strong>g is <strong>of</strong>ten substandard as once-temporary<br />
structures have become permanent, roads are illma<strong>in</strong>ta<strong>in</strong>ed<br />
(if at all existent), and unregulated and<br />
unmetered electricity present<strong>in</strong>g multiple risks are<br />
some <strong>of</strong> <strong>the</strong> issues that may affect slum dwellers (UN-<br />
HABITAT 2003).<br />
5.3.5.1 Hous<strong>in</strong>g<br />
The majority <strong>of</strong> hous<strong>in</strong>g materials <strong>in</strong> <strong>the</strong> slum areas<br />
consist <strong>of</strong> brick, wood frame and mud, or recovered<br />
timber walls with corrugated metal ro<strong>of</strong>s. Mud<br />
walls br<strong>in</strong>g opportunities for rodent, <strong>in</strong>sect, and<br />
microbiological growth, <strong>in</strong>creas<strong>in</strong>g <strong>the</strong> chance <strong>of</strong><br />
disease. Poor ventilation <strong>in</strong> <strong>the</strong>se structures are<br />
catalysts to respiratory diseases such as tuberculosis<br />
(MT Ruel et al. 1998; UN-HABITAT 2008; UN-HABITAT<br />
2003). Floor<strong>in</strong>g is typically ei<strong>the</strong>r dirt or concrete,<br />
depend<strong>in</strong>g on <strong>the</strong> level <strong>of</strong> construction. Structures<br />
found on ma<strong>in</strong> thoroughfares typically have concrete<br />
foundations with dirt footpaths. Shop owners tend<br />
to live with<strong>in</strong> <strong>the</strong> shop <strong>the</strong>mselves along with <strong>the</strong>ir<br />
families.<br />
The houses are located along dirt paths that <strong>of</strong>ten<br />
have open dra<strong>in</strong>s and sewage runn<strong>in</strong>g through <strong>the</strong>m.<br />
The houses are constructed <strong>in</strong> very high-density and<br />
share <strong>the</strong>ir land with livestock such as goats, cows<br />
and chickens, as well as with local bus<strong>in</strong>esses. The<br />
high density hous<strong>in</strong>g leave very cramped walkways<br />
that are <strong>poor</strong>ly lit, leav<strong>in</strong>g risk <strong>of</strong> physical violence and<br />
rape (Massey 2011).<br />
5.3.5.2 Crowd<strong>in</strong>g<br />
82% <strong>of</strong> <strong>the</strong> households conta<strong>in</strong>ed two rooms or less,<br />
<strong>of</strong> which nearly half claimed just one room. Comb<strong>in</strong><strong>in</strong>g<br />
this with an average household size <strong>of</strong> 4.8 persons,<br />
overcrowd<strong>in</strong>g is a major concern. The crowd<strong>in</strong>g<br />
<strong>in</strong>dex is a validated <strong>in</strong>dicator as a ratio <strong>of</strong> members<br />
<strong>of</strong> a household to number <strong>of</strong> rooms <strong>in</strong> <strong>the</strong> home and is<br />
adjusted for couples (counted as 1) and small children<br />
(counted as 0.5). A household is overcrowded if <strong>the</strong><br />
<strong>in</strong>dex is greater than 1. An overall overcrowd<strong>in</strong>g rate <strong>of</strong><br />
88% is found <strong>in</strong> <strong>the</strong> <strong>in</strong>vestigated slums. Overcrowd<strong>in</strong>g<br />
can heighten <strong>the</strong> possibility <strong>of</strong> disease transmission<br />
between household members.<br />
5.3.5.3 Energy and Communication<br />
Electricity connections were not <strong>in</strong>vestigated aside<br />
from cost. Typically, dwell<strong>in</strong>gs are connected to<br />
<strong>the</strong> energy grid through a third party; one house<br />
will have an <strong>of</strong> cial connection which is <strong>the</strong>n split to<br />
o<strong>the</strong>r households. The connected houses pay a at<br />
rate <strong>of</strong> 20,000 shill<strong>in</strong>gs per month for an unmetered<br />
connection.<br />
As evidenced through <strong>the</strong> <strong>in</strong>terviews with <strong>the</strong> slum<br />
dwellers, an overwhelm<strong>in</strong>g majority have a mobile<br />
phone or access to a mobile phone. Charcoal is <strong>the</strong><br />
primary form <strong>of</strong> energy for cook<strong>in</strong>g and is widely<br />
available.<br />
5.3.5.4 Transport<br />
Not <strong>of</strong> cially <strong>in</strong>vestigated <strong>in</strong> <strong>the</strong> household survey,<br />
transport is an issue for <strong>the</strong> slum dwellers. There are<br />
no formal roads with<strong>in</strong> <strong>the</strong> slums <strong>the</strong>mselves, though<br />
paths that would allow vehicle access are available,<br />
however sparse. The walkways and alleys with<strong>in</strong> <strong>the</strong><br />
39
40<br />
slums are typically made <strong>of</strong> mud and conta<strong>in</strong> open<br />
concrete or natural dra<strong>in</strong>s.<br />
Due to cost and spatial restrictions, most transport<br />
with<strong>in</strong> <strong>the</strong> slums is done on foot. Because <strong>of</strong> this, most<br />
bus<strong>in</strong>esses and services that are frequented by <strong>the</strong><br />
slum dwellers are with<strong>in</strong> a reasonable distance to <strong>the</strong><br />
slum area. Public transport is available <strong>in</strong> <strong>the</strong> form <strong>of</strong><br />
Matatu taxis (who follow pre-de ned routes) or Boda<br />
boda motorcycle taxis, as well as a newly <strong>in</strong>itiated<br />
publically subsidized private bus system, though <strong>the</strong><br />
routes are not yet very extensive. Boda bodas are an<br />
important source <strong>of</strong> <strong>in</strong>come for slum dwellers, though<br />
<strong>the</strong> service is over-saturated with providers <strong>the</strong>reby<br />
yield<strong>in</strong>g <strong>in</strong>consistent <strong>in</strong>comes as competition for<br />
passengers is high.<br />
5.3.5.5 Water<br />
One <strong>of</strong> <strong>the</strong> key aspects <strong>of</strong> this study and areas <strong>of</strong><br />
<strong>in</strong>tervention is exam<strong>in</strong><strong>in</strong>g <strong>the</strong> availability, access, and<br />
quality <strong>of</strong> water to <strong>the</strong> slum populations. <strong>Kampala</strong> has<br />
an extensive water<br />
network that draws<br />
from Lake Victoria at<br />
<strong>the</strong> sou<strong>the</strong>rn shore<br />
<strong>of</strong> Mak<strong>in</strong>dye division,<br />
along with three<br />
treatment plants.<br />
There is one sewage<br />
treatment plant <strong>in</strong> <strong>the</strong><br />
west <strong>of</strong> <strong>the</strong> district,<br />
serv<strong>in</strong>g mostly <strong>the</strong><br />
colonial bus<strong>in</strong>ess<br />
district. O<strong>the</strong>r sewage<br />
dra<strong>in</strong>s <strong>in</strong>to Nakirubo<br />
channel<br />
Victoria.<br />
or Lake<br />
5.3.5.5a Water<br />
Access<br />
Accord<strong>in</strong>g to <strong>the</strong><br />
2010 <strong>Uganda</strong> Water<br />
Supply Atlas, 85% <strong>of</strong><br />
residents <strong>in</strong> <strong>Kampala</strong><br />
have access to<br />
<strong>the</strong> water network<br />
(UMoWE 2010).<br />
Kisenyi and Bwaise<br />
areas have had<br />
prepaid metered taps <strong>in</strong>stalled throughout <strong>the</strong> areas,<br />
however <strong>the</strong>y are no longer functional <strong>in</strong> Bwaise. The<br />
meters <strong>in</strong> Kisenyi function by a magnetized key r<strong>in</strong>g<br />
which <strong>the</strong> users can recharge when needed. They are<br />
charged 20 shill<strong>in</strong>g for 20 litres <strong>of</strong> water.<br />
Water source access is not dist<strong>in</strong>guished by ra<strong>in</strong>y and<br />
dry seasons, as may be <strong>the</strong> case <strong>in</strong> rural <strong>Uganda</strong>.<br />
The majority <strong>of</strong> respondents (69%) access water<br />
through <strong>the</strong> city water network, by means <strong>of</strong> <strong>the</strong><br />
aforementioned taps<br />
or a private owner/<br />
operator. 76% had<br />
done so accord<strong>in</strong>g<br />
to <strong>the</strong> 2009 nutrition<br />
assessment (UMoH et<br />
al. 2009). The majority<br />
<strong>of</strong> respondents (88%)<br />
said that primarily<br />
<strong>the</strong>y pay for water,<br />
though water costs<br />
are typically charged<br />
per 20 litres and can<br />
vary between 20<br />
shill<strong>in</strong>gs as previously<br />
noted, to between<br />
100-200 shill<strong>in</strong>gs at<br />
privately operated<br />
taps. Protected wells<br />
and spr<strong>in</strong>gs are<br />
available <strong>in</strong> <strong>the</strong> slum
areas and are <strong>the</strong> second most common source <strong>of</strong><br />
water. Unprotected wells are also available and are<br />
<strong>the</strong> third highest usage rate, though <strong>in</strong>terviewees said<br />
that children typically frequent <strong>the</strong>se sources for <strong>the</strong><br />
reason that <strong>the</strong> protected source is too far.<br />
81% <strong>of</strong> respondents said that <strong>the</strong>ir primary source <strong>of</strong><br />
water was less than 400 meters from <strong>the</strong>ir residence<br />
(57% less than 200m).<br />
Water is collected mostly by children, with women and<br />
‘any adult <strong>in</strong> <strong>the</strong> household’ shar<strong>in</strong>g second place.<br />
Water delivery provides a source <strong>of</strong> <strong>in</strong>come for <strong>poor</strong><br />
casual labourers and children. It is fetched from <strong>the</strong><br />
public wells and is usually charged at 100 shill<strong>in</strong>gs per<br />
20L jerry can.<br />
5.3.5.5b Water Use and<br />
Quality<br />
An overwhelm<strong>in</strong>g majority<br />
transport and store <strong>the</strong>ir water<br />
<strong>in</strong> jerry cans, typically <strong>in</strong> 20<br />
L capacity, though only 56%<br />
have covered vessels for both<br />
transport and storage.<br />
On median, a household will<br />
use 80 litres <strong>of</strong> water per day,<br />
translat<strong>in</strong>g <strong>in</strong>to 20 litres per<br />
person. Speci c uses <strong>of</strong> <strong>the</strong><br />
water were not determ<strong>in</strong>ed, but<br />
one may assume that at <strong>the</strong>se<br />
large volumes, <strong>the</strong> water will<br />
have multiple purposes outside <strong>of</strong> dr<strong>in</strong>k<strong>in</strong>g. 59% <strong>of</strong><br />
households make three or more trips to collect water<br />
each day, while consider<strong>in</strong>g that 70% <strong>of</strong> respondents<br />
take less than 30 m<strong>in</strong>utes to fetch water per trip, with 16%<br />
TABLE 1: ARE WATER CONTAINERS COVERED?<br />
Conta<strong>in</strong>er Covered Uncovered<br />
Storage 72.9% 27.1%<br />
Transport 38.1% 61.9%<br />
tak<strong>in</strong>g over 50 m<strong>in</strong>utes.<br />
Two water sources from each slum were tested for faecal<br />
coliform bacteria by means <strong>of</strong> E. coli as an <strong>in</strong>dication<br />
<strong>of</strong> contam<strong>in</strong>ation. All but one sample were from <strong>the</strong><br />
most frequented wells <strong>in</strong> <strong>the</strong> areas <strong>of</strong> <strong>in</strong>vestigation. The<br />
outlier sample was taken from <strong>the</strong> water dispensers<br />
<strong>in</strong> Kisenyi to test for any contam<strong>in</strong>ation or seepage<br />
through <strong>the</strong> pipes.<br />
All samples returned negative results for contam<strong>in</strong>ation.<br />
Although <strong>the</strong>se results were clean, one CBO had<br />
stated dur<strong>in</strong>g an <strong>in</strong>terview that 78 <strong>of</strong> 79 wells tested<br />
<strong>in</strong> slum areas <strong>of</strong> <strong>Kampala</strong> were contam<strong>in</strong>ated. The<br />
samples for this study were taken after four days <strong>of</strong> dry<br />
wea<strong>the</strong>r, <strong>the</strong>refore ra<strong>in</strong>fall and/or ood<strong>in</strong>g may have an<br />
impact on contam<strong>in</strong>ation <strong>of</strong> <strong>the</strong> sources as toilets and<br />
dra<strong>in</strong>s over ow.<br />
88% <strong>of</strong> 112 respondents claimed to treat <strong>the</strong>ir water<br />
before use, with 98% claim<strong>in</strong>g that boil<strong>in</strong>g was <strong>the</strong><br />
primary method.<br />
5.3.5.6 Sanitation and Hygiene<br />
Sanitation and hygiene are very sensitive subjects for<br />
<strong>the</strong> respondents, consequently some results from <strong>the</strong><br />
survey may not be reliably <strong>in</strong>dicative. Observations<br />
noted by <strong>the</strong> enumerators are <strong>of</strong>fered to better illustrate<br />
<strong>the</strong> scenario.<br />
Privately owned improved pit latr<strong>in</strong>es are available <strong>in</strong><br />
all slum areas and are charged at a cost <strong>of</strong> 100-200<br />
shill<strong>in</strong>gs per use. Many <strong>of</strong> <strong>the</strong> latr<strong>in</strong>es are <strong>in</strong> a state<br />
<strong>of</strong> disrepair, and cleanl<strong>in</strong>ess is a prime concern and<br />
deterrent to potential users (EUWI 2011; Massey<br />
2011). As mentioned previously, Kisenyi has a large<br />
community centre that conta<strong>in</strong>s ush toilets at a cost<br />
<strong>of</strong> 100 shill<strong>in</strong>gs/use.<br />
All areas report at least 88% <strong>of</strong> residents us<strong>in</strong>g latr<strong>in</strong>es<br />
as opposed to o<strong>the</strong>r forms <strong>of</strong> human waste disposal.<br />
41
42<br />
A previous study <strong>in</strong>dicates that a latr<strong>in</strong>e carries an<br />
average <strong>of</strong> 82 daily users (EUWI 2011). Most are<br />
public (70%), though 35% <strong>of</strong> residents <strong>in</strong> Kisenyi use<br />
toilets that are <strong>in</strong> <strong>the</strong> house, contrast<strong>in</strong>g with only 3%<br />
<strong>in</strong> Namuwongo. Households that use an improved or<br />
unimproved latr<strong>in</strong>e or that do not use latr<strong>in</strong>es at all held<br />
a slightly higher rate <strong>of</strong> illnesses, averag<strong>in</strong>g 3.9 <strong>in</strong> <strong>the</strong><br />
last 30 days, compared to 3.1 for households that use<br />
ush toilets <strong>in</strong> <strong>the</strong> house. Cost is a prohibitive factor<br />
to us<strong>in</strong>g latr<strong>in</strong>es; consequently, alternatives such as<br />
green spaces, y<strong>in</strong>g latr<strong>in</strong>es, dra<strong>in</strong>age, or canals<br />
had evidence <strong>of</strong> quite frequent use <strong>in</strong> some areas.<br />
Enumerators had observed that 27% <strong>of</strong> households<br />
had human faeces <strong>in</strong> <strong>the</strong> vic<strong>in</strong>ity <strong>of</strong> <strong>the</strong> residence,<br />
likewise 16% <strong>in</strong> Namuwongo and 9% <strong>in</strong> Kisenyi.<br />
For those that responded af rmatively to not us<strong>in</strong>g<br />
latr<strong>in</strong>es, reason<strong>in</strong>g was evenly split between cost and<br />
cleanl<strong>in</strong>ess <strong>of</strong> <strong>the</strong> facilities. A previous study has noted<br />
that night time trips to latr<strong>in</strong>es carry a risk <strong>of</strong> danger,<br />
such as <strong>the</strong>ft, rape or assault, most notably for women<br />
(Massey 2011)<br />
Regular ood<strong>in</strong>g <strong>in</strong> <strong>the</strong> areas cause <strong>the</strong> latr<strong>in</strong>es<br />
to over ow, and this mix<strong>in</strong>g with excrement that is<br />
strewn about <strong>in</strong> dra<strong>in</strong>s, channels and ly<strong>in</strong>g about <strong>in</strong><br />
plastic bags, can lead to serious sanitation and health<br />
concerns. The <strong>poor</strong> dra<strong>in</strong>age <strong>of</strong> <strong>the</strong> areas also means<br />
this fetid oodwater rema<strong>in</strong>s stand<strong>in</strong>g days after<br />
<strong>the</strong> ra<strong>in</strong>, notably <strong>in</strong> structures with concrete oors.<br />
Namuwongo and Bwaise are particularly susceptible<br />
to this as <strong>the</strong>y have not had upgrad<strong>in</strong>g projects<br />
implemented. This is demonstrated by enumerators<br />
observ<strong>in</strong>g stagnant and <strong>of</strong>ten green-coloured water at<br />
44 and 47% <strong>of</strong> households <strong>in</strong> each slum respectively.<br />
Hand wash<strong>in</strong>g with soap is a common practice, and<br />
92% laid claim to do<strong>in</strong>g so after us<strong>in</strong>g <strong>the</strong> toilet as well<br />
as before eat<strong>in</strong>g.<br />
Rubbish is disposed <strong>of</strong> ma<strong>in</strong>ly <strong>in</strong> wastelands and green<br />
spaces, though b<strong>in</strong>s that are collected by <strong>the</strong> KCCA are<br />
available <strong>in</strong> Kisenyi slum. Piles <strong>of</strong> rubbish are typically<br />
burned, though if <strong>the</strong>re is an abandoned structure, this<br />
usually serves as a secondary land ll if it is not ooded<br />
with water. A common compla<strong>in</strong>t from <strong>the</strong> respondents<br />
was that <strong>the</strong>re were no designated dump<strong>in</strong>g sites. This<br />
is demonstrated by <strong>the</strong> enumerator’s observations that<br />
19% <strong>of</strong> households had rubbish openly ly<strong>in</strong>g about,<br />
with Bwaise particularly affected at 37% <strong>of</strong> households.<br />
Rubbish also accumulates <strong>in</strong> dra<strong>in</strong>s result<strong>in</strong>g <strong>in</strong><br />
blockages that can catalyze ood<strong>in</strong>g, though <strong>in</strong><br />
some areas <strong>the</strong> KCCA employs workers to clear <strong>the</strong><br />
dra<strong>in</strong>s once per week (though natural dra<strong>in</strong>s are not<br />
accounted for). Flood<strong>in</strong>g caused by rubbish was listed<br />
as one <strong>of</strong> <strong>the</strong> ma<strong>in</strong> concerns by <strong>the</strong> respondents when<br />
given <strong>the</strong> chance to freely respond to what is <strong>the</strong> ma<strong>in</strong><br />
issue with slum life.<br />
5.3.5.7 Land Tenure<br />
Multiple systems <strong>of</strong> tenure dictate ownership and<br />
use <strong>of</strong> <strong>the</strong> land with<strong>in</strong> <strong>the</strong> slums. Four types <strong>of</strong> tenure<br />
exist with<strong>in</strong> <strong>Kampala</strong>: Mailo tenure (expla<strong>in</strong>ed below),<br />
Customary tenure (traditional land ownership),<br />
Freehold (similar to Mailo yet smaller parcels and<br />
not royally decreed), and Leasehold (an agreement<br />
between <strong>the</strong> owner and lessee).<br />
Mailo tenure describes land that was divided between<br />
<strong>the</strong> Kabaka (k<strong>in</strong>g) <strong>of</strong> <strong>Uganda</strong>, o<strong>the</strong>r nobles, and<br />
<strong>the</strong> protectorate government as a result <strong>of</strong> <strong>the</strong> 1900<br />
Buganda Agreement and may hold ei<strong>the</strong>r private or<br />
<strong>of</strong> cial status. All <strong>of</strong> cial Mailo land was transformed<br />
<strong>in</strong>to public land <strong>in</strong> 1967, while private lands rema<strong>in</strong>ed<br />
unchanged. This form <strong>of</strong> ownership sees <strong>the</strong> land as<br />
held <strong>in</strong> permanent title, though it persuades squatters<br />
and slum development <strong>in</strong> that <strong>the</strong> land owners are<br />
typically absentee, and <strong>the</strong>refore do not regulate <strong>the</strong><br />
activities (Daniel 2011; Lastarria-Cornhiel 2003).<br />
<strong>Kampala</strong> City Council held <strong>of</strong> cial Mailo land with<strong>in</strong> <strong>the</strong><br />
district until <strong>the</strong> constitution <strong>of</strong> 1995 was enacted which<br />
abolished all statutory leases. The land subsequently<br />
reverted to customary tenure. In 1998, <strong>the</strong> Land Act<br />
gave customary land owners <strong>the</strong> option to petition<br />
to convert <strong>the</strong>ir land to ei<strong>the</strong>r Mailo or freehold land,<br />
lead<strong>in</strong>g many <strong>of</strong> <strong>the</strong> land owners to convert to private
Mailo tenure. Along with this conversion, <strong>the</strong> constitution<br />
<strong>of</strong> 1995 makes formal plann<strong>in</strong>g a non-requirement for<br />
acquisition <strong>of</strong> this land, mean<strong>in</strong>g <strong>Kampala</strong> city does<br />
not own nor have jurisdiction over <strong>the</strong> land, yet has <strong>the</strong><br />
power to control development with<strong>in</strong> <strong>the</strong> city, yield<strong>in</strong>g<br />
multiple con icts and land disputes throughout <strong>the</strong><br />
years (Daniel 2011; UN-HABITAT 2007).<br />
To date, approximately 50% <strong>of</strong> <strong>the</strong> land <strong>in</strong> <strong>Kampala</strong> is<br />
under Mailo tenure and most slum areas are located<br />
on ei<strong>the</strong>r private Mailo land or under customary land<br />
titles. Slums rest<strong>in</strong>g on Mailo land has seen that <strong>the</strong><br />
residents are <strong>of</strong>ten reluctant to <strong>in</strong>vest <strong>in</strong> its development<br />
or ma<strong>in</strong>ta<strong>in</strong><strong>in</strong>g a susta<strong>in</strong>able environment on <strong>the</strong><br />
plot, as fear <strong>of</strong> any <strong>in</strong>vestment <strong>in</strong> this course could<br />
be nulli ed at any <strong>in</strong>stant by <strong>the</strong> landowner through<br />
eviction (Daniel 2011; UN-HABITAT 2007).<br />
In <strong>the</strong> <strong>in</strong>vestigated slums, 84% <strong>of</strong> respondents were<br />
tenants who pay rent to ei<strong>the</strong>r a land or structure owner<br />
or both. Bwaise had <strong>the</strong> highest rate <strong>of</strong> ownership at<br />
26% with Namuwongo <strong>the</strong> lowest at 7%. The majority<br />
<strong>of</strong> owners <strong>in</strong> Kisenyi owned <strong>the</strong> structure <strong>in</strong> which <strong>the</strong>y<br />
lived while ei<strong>the</strong>r pay<strong>in</strong>g rent or squatt<strong>in</strong>g on <strong>the</strong> land<br />
hold<strong>in</strong>g <strong>the</strong> structure. In Bwaise, <strong>the</strong> majority owned <strong>the</strong><br />
land and likewise paid someone to build <strong>the</strong> structure<br />
and now pay rent for <strong>the</strong> structure. In Namuwongo,<br />
all <strong>of</strong> those who claimed ownership happened to own<br />
both <strong>the</strong> land and <strong>the</strong> shelter, possibly as a result <strong>of</strong><br />
<strong>the</strong> resettlement after <strong>the</strong> slum upgrad<strong>in</strong>g projects<br />
<strong>in</strong> <strong>the</strong> mid-1990s (all respondent owners were ei<strong>the</strong>r<br />
born <strong>in</strong> <strong>Kampala</strong> or have been <strong>in</strong> <strong>the</strong> area longer than<br />
16 years).<br />
88% <strong>of</strong> all respondents worried about be<strong>in</strong>g evicted<br />
from <strong>the</strong>ir residence. The primary fear <strong>of</strong> eviction was<br />
by way <strong>of</strong> <strong>the</strong> landlord for all respondents. This was<br />
stated as that <strong>the</strong>y have no legal claim to <strong>the</strong> land<br />
on which <strong>the</strong>y live; <strong>the</strong> landlord may sell <strong>the</strong>ir parcel<br />
at any po<strong>in</strong>t and <strong>the</strong>reby evict those who live <strong>in</strong> <strong>the</strong><br />
structure. The second major reason for fear <strong>of</strong> eviction<br />
was by means <strong>of</strong> local authorities. The tenuous and<br />
complex arrangement between land owners, renters,<br />
and city plann<strong>in</strong>g <strong>of</strong> cials yields cont<strong>in</strong>ual fear that<br />
<strong>the</strong>ir residences could be evicted and possibly<br />
demolished.<br />
43
44<br />
5.3.6 Natural Capital<br />
Urban agriculture is one <strong>of</strong> <strong>the</strong> ma<strong>in</strong> trends presently<br />
to <strong>in</strong>crease food security <strong>in</strong> <strong>urban</strong> <strong>poor</strong> populations<br />
worldwide. In fact, <strong>urban</strong> agriculture <strong>in</strong> <strong>Kampala</strong> is<br />
apparent due to <strong>the</strong> presence <strong>of</strong> livestock and zerograz<strong>in</strong>g<br />
activities <strong>in</strong> <strong>the</strong> slums, however it has not<br />
realised its full potential. Additionally, as ood<strong>in</strong>g was<br />
cited as <strong>the</strong> primary concern by <strong>the</strong> respondents, this<br />
was developed to <strong>the</strong> capacity possible for this study.<br />
5.3.6.1 Urban Agriculture<br />
Urban agriculture has been legal <strong>in</strong> <strong>Kampala</strong> s<strong>in</strong>ce<br />
2004, though legalization did not signi cantly alter <strong>the</strong><br />
levels <strong>of</strong> agriculture that were already be<strong>in</strong>g practiced<br />
(Lee-Smith 2005). This be<strong>in</strong>g said, agriculture is<br />
practiced ma<strong>in</strong>ly outside <strong>of</strong> <strong>the</strong> densely populated<br />
central areas <strong>of</strong> <strong>Kampala</strong> District, as <strong>the</strong> lack <strong>of</strong> land<br />
for graz<strong>in</strong>g livestock or rais<strong>in</strong>g crops at a volume<br />
suf cient for sale and/or self-consumption <strong>in</strong> <strong>the</strong> <strong>urban</strong><br />
centre is prohibitive for <strong>the</strong> <strong>poor</strong> (Nuwagaba et al.<br />
2003; D. Maxwell et al. 1998). It has been noted that<br />
slum dwellers may travel up to two kilometres out <strong>of</strong><br />
town to have access to land. With<strong>in</strong> <strong>the</strong> slum areas,<br />
zero-graz<strong>in</strong>g livestock systems have been supported<br />
by a number <strong>of</strong> projects <strong>in</strong> <strong>the</strong> past, however it has<br />
been seen that water sources are shared with <strong>the</strong><br />
animals which can be conducive to microbiological<br />
contam<strong>in</strong>ation by creat<strong>in</strong>g breed<strong>in</strong>g grounds for waterborne<br />
and <strong>in</strong>sect and animal vectored diseases. The<br />
enumerators noted livestock nearby <strong>the</strong> households<br />
<strong>in</strong> nearly 13% <strong>of</strong> all residences <strong>of</strong> <strong>the</strong> respondents <strong>in</strong><br />
Bwaise slum, though this number is notably less <strong>in</strong><br />
Namuwongo (7%) and Kisenyi (2%). However, animal<br />
faeces were observed <strong>in</strong> <strong>the</strong> vic<strong>in</strong>ity <strong>of</strong> 24% <strong>of</strong> <strong>the</strong><br />
households <strong>in</strong> Namuwongo.<br />
Overall, <strong>urban</strong> agriculture is not a common practice<br />
<strong>in</strong> <strong>the</strong> slums. As mentioned before, one <strong>of</strong> <strong>the</strong> ma<strong>in</strong><br />
reasons for a farmer not cont<strong>in</strong>u<strong>in</strong>g <strong>the</strong>ir occupation<br />
once migrat<strong>in</strong>g to <strong>Kampala</strong> is a lack <strong>of</strong> land. Sack<br />
gardens are a project that is be<strong>in</strong>g implemented by<br />
Community Shelters <strong>Uganda</strong>, though residents who<br />
have participated <strong>in</strong> this project have experienced<br />
<strong>the</strong>fts <strong>of</strong> both produce and <strong>the</strong> sacks <strong>the</strong>mselves.<br />
Ro<strong>of</strong> gardens are not present <strong>in</strong> <strong>the</strong> areas <strong>in</strong>vestigated,<br />
and one can postulate that <strong>the</strong> <strong>poor</strong> quality <strong>of</strong> roo ng<br />
materials and construction (steep angles and<br />
<strong>in</strong>stability) are a prohibitive factor.<br />
SDI has projects where residents who partake <strong>in</strong><br />
<strong>in</strong>come generat<strong>in</strong>g activities <strong>in</strong> one slum will travel to<br />
ano<strong>the</strong>r area to tra<strong>in</strong> o<strong>the</strong>r residents <strong>in</strong> <strong>the</strong>ir practice.<br />
For example, Nakawa slum has participated <strong>in</strong> this<br />
program with mushrooms, eggs and corn; and Kisenyi<br />
had <strong>the</strong> same experience with chickens, goats, and<br />
small community gardens.<br />
Interviewees had stated that any sort <strong>of</strong> <strong>urban</strong><br />
agriculture is at risk <strong>of</strong> <strong>the</strong>ft and damage due to<br />
vandals.<br />
Kisenyi slum has had a portion <strong>of</strong> it razed by <strong>the</strong> KCCA,<br />
leav<strong>in</strong>g a vast open green space which would be ideal<br />
for garden<strong>in</strong>g for supplementary food sources. Land<br />
tenure issues however <strong>in</strong>hibit this development, as<br />
<strong>the</strong> owners <strong>of</strong> <strong>the</strong> land have nal say <strong>of</strong> any activities<br />
performed on <strong>the</strong> lot, as expanded upon <strong>in</strong> <strong>the</strong> physical<br />
capital section. If a garden was allowed to be planted,<br />
<strong>the</strong> landowner may at any po<strong>in</strong>t evict <strong>the</strong> persons and<br />
activities from <strong>the</strong> land.<br />
Shar<strong>in</strong>g soil and water with livestock can cause<br />
transfer <strong>of</strong> zoonotic diseases between animals<br />
and humans. One study found animal sourced<br />
food-borne gastroenteritis (caus<strong>in</strong>g diarrhoea and<br />
vomit<strong>in</strong>g), brucellosis (loss <strong>of</strong> appetite and weakness),<br />
Mycobacterium bovis tuberculosis (respiratory<br />
distress), and neuro-cysticercosis (epilepsy, spasms,<br />
seizures) present <strong>in</strong> <strong>the</strong> slums <strong>of</strong> <strong>Kampala</strong> (Makita<br />
et al. 2011). Table 12 shows <strong>the</strong> prevalence <strong>of</strong> <strong>the</strong>se<br />
identi ed diseases accord<strong>in</strong>g to one study.
TABLE 1: PREVALENCE OF ZOONOTIC DISEASE CASES<br />
AT MULAGO HOSPITAL, MAR '05-FEB '06<br />
(ADAPTED FROM MAKITA ET.AL. 2011)<br />
Zoonoses<br />
Animal source foodborne<br />
gastroenteritis<br />
Leptospirosis is a decreas<strong>in</strong>gly rare bacterial disease<br />
that claims fatality rates <strong>of</strong> 10-50%. It is transferred<br />
through contact with animal ur<strong>in</strong>e or rodents<br />
and <strong>in</strong>cidences are cont<strong>in</strong>ually ris<strong>in</strong>g along with<br />
<strong>urban</strong>ization <strong>in</strong> slums around <strong>the</strong> world (Maciel et al.<br />
2008; R. B. Reis et al. 2008). Its presence has been<br />
noted <strong>in</strong> <strong>Uganda</strong> though not speci cally <strong>in</strong>vestigated<br />
<strong>in</strong> <strong>urban</strong> areas to date (Ellis 1984; Bus<strong>in</strong>ge 2007;<br />
Senior 2010).<br />
5.3.6.2 Flood<strong>in</strong>g<br />
Estimated<br />
Cases<br />
% <strong>of</strong><br />
Total<br />
Cases<br />
1201 34%<br />
Brucellosis 679 N/A<br />
M. bovis tuberculosis 98 12%<br />
Neuro-cysticercosis 19-27 9-14%<br />
Because <strong>of</strong> <strong>the</strong> year-long ra<strong>in</strong>fall and hilly landscape,<br />
<strong>the</strong> low-ly<strong>in</strong>g areas are constantly at risk <strong>of</strong> ood<strong>in</strong>g.<br />
There are areas <strong>of</strong> <strong>Kampala</strong> which have<br />
suf cient <strong>in</strong>frastructure to manage high<br />
levels <strong>of</strong> ra<strong>in</strong>fall, though <strong>the</strong>se are typically<br />
areas that are located on hillsides. The slum<br />
areas are generally on marg<strong>in</strong>al land with<br />
<strong>poor</strong> dra<strong>in</strong>age, typically <strong>in</strong> <strong>the</strong> valleys and<br />
border<strong>in</strong>g natural waterways such as <strong>the</strong><br />
case <strong>of</strong> Namuwongo. Flood<strong>in</strong>g is noted to<br />
occur nearly every time a ra<strong>in</strong> passes, and<br />
because <strong>of</strong> <strong>the</strong> <strong>poor</strong> dra<strong>in</strong>age <strong>in</strong> <strong>the</strong> areas<br />
<strong>the</strong> water rema<strong>in</strong>s, becom<strong>in</strong>g stagnant<br />
and fetid. Map7 displays a topographic<br />
relief map <strong>of</strong> Kisenyi and Naumuwongo<br />
to illustrate <strong>the</strong> potential oodpla<strong>in</strong> <strong>of</strong> <strong>the</strong><br />
areas surround<strong>in</strong>g <strong>the</strong> slums.<br />
Flood<strong>in</strong>g was cited by <strong>the</strong> respondents<br />
as <strong>the</strong>ir largest concern about slum<br />
life. As previously noted, ood<strong>in</strong>g may<br />
cause latr<strong>in</strong>es to over ow and br<strong>in</strong>g with it fetid<br />
oodwater. Dra<strong>in</strong>s that run through <strong>the</strong> slums are<br />
<strong>of</strong>ten repositories for household rubbish and litter, and<br />
become easily blocked dur<strong>in</strong>g ra<strong>in</strong>s. The dra<strong>in</strong>s <strong>the</strong>n<br />
over ow, spread<strong>in</strong>g <strong>the</strong>ir contents throughout <strong>the</strong> area.<br />
Floodwater may also enter <strong>the</strong> hous<strong>in</strong>g br<strong>in</strong>g<strong>in</strong>g with it<br />
human and animal excrement that would normally be<br />
found ei<strong>the</strong>r <strong>in</strong> “ y<strong>in</strong>g toilets” (plastic bags) or <strong>in</strong> green<br />
spaces. Because <strong>of</strong> lack <strong>of</strong> exposure to sunlight, dirt<br />
oors can rema<strong>in</strong> damp and muddy for days follow<strong>in</strong>g<br />
<strong>the</strong> ra<strong>in</strong>s. Concrete oors hold stagnant water for a<br />
length <strong>of</strong> time after <strong>the</strong> ood<strong>in</strong>g occurs, provid<strong>in</strong>g a<br />
breed<strong>in</strong>g ground for mosquitoes and o<strong>the</strong>r disease<br />
vectors (MT Ruel et al. 1998; Chennamaneni 2007;<br />
UNDP & UMoLHUD 2008; Nzuma & Ochola 2010).<br />
Beyond <strong>the</strong> implicit effects on health that ood<strong>in</strong>g<br />
br<strong>in</strong>gs, it was also noted by multiple slum-dwellers<br />
that ood<strong>in</strong>g <strong>in</strong>duces children to not attend school,<br />
bus<strong>in</strong>esses to shut down or <strong>in</strong>hibit<strong>in</strong>g <strong>the</strong>ir own<br />
<strong>in</strong>come activities, ru<strong>in</strong><strong>in</strong>g goods with<strong>in</strong> and outside <strong>the</strong><br />
home, and <strong>in</strong> some <strong>in</strong>stances caus<strong>in</strong>g death <strong>of</strong> young<br />
children when <strong>the</strong> oods occur at night.<br />
45
46<br />
5.3.7 Food Security<br />
Food security, ano<strong>the</strong>r ma<strong>in</strong> aspect <strong>of</strong> this study and<br />
area <strong>of</strong> <strong>in</strong>tervention <strong>of</strong> ACF, is de ned by <strong>the</strong> World<br />
Food Programme as ‘when all people, at all times, have<br />
physical and economic access to suf cient, safe and<br />
nutritious food to meet <strong>the</strong>ir dietary needs and food<br />
preferences for an active and healthy life’ (WFP 2009).<br />
The level <strong>of</strong> food security is determ<strong>in</strong>ed <strong>in</strong> a number<br />
<strong>of</strong> ways, however <strong>the</strong> general goal is to describe <strong>the</strong><br />
aspects <strong>of</strong> food availability (<strong>the</strong> physical presence <strong>of</strong><br />
food), food access (<strong>the</strong> household’s ability to acquire<br />
adequate amounts <strong>of</strong> food) and food utilisation (<strong>the</strong><br />
households use <strong>of</strong> <strong>the</strong> food and an <strong>in</strong>dividual’s ability to<br />
absorb and metabolise <strong>the</strong> nutrients) for a population,<br />
which are typically analysed by speci c <strong>in</strong>dicators.<br />
5.3.7.1 Indicators<br />
Speci c <strong>in</strong>dicators are used by ACF to describe <strong>the</strong><br />
access, availability, and utilisation <strong>of</strong> food with<strong>in</strong> a<br />
population. This study speci cally targeted child<br />
IDDS (Individual Dietary Diversity Score), Household<br />
Food Insecurity Access Scale (HFIAS), and <strong>the</strong> Food<br />
Consumption Score (FCS). Additional <strong>in</strong>formation was<br />
collected to describe <strong>the</strong> access to food.<br />
Figure 18 shows that <strong>the</strong> pr<strong>in</strong>ciple food groups <strong>of</strong><br />
<strong>the</strong> respondents with<strong>in</strong> <strong>the</strong> past 24 hours consisted<br />
primarily <strong>of</strong> starchy carbohydrates like roots/tubers<br />
(76%), complex carbohydrates like cereals and gra<strong>in</strong>s<br />
(70%). Just less than half <strong>of</strong> <strong>the</strong> respondents had<br />
consumed vegetables (47%), or prote<strong>in</strong> from pulses/<br />
legumes (40%) or meat (35%). The questionnaire <strong>in</strong><br />
Appendix III describes what foods were suggested to<br />
represent <strong>the</strong>se categories.<br />
5.3.7.1a Child Dietary Diversity<br />
Dietary diversity was <strong>in</strong>vestigated as a key <strong>in</strong>dicator<br />
<strong>of</strong> food and nutrition security, exam<strong>in</strong><strong>in</strong>g <strong>the</strong> number<br />
<strong>of</strong> different food groups eaten dur<strong>in</strong>g <strong>the</strong> previous day<br />
by an <strong>in</strong>dividual. In general, <strong>in</strong>dividuals <strong>in</strong> <strong>urban</strong> areas<br />
tend to have a higher dietary diversity than <strong>the</strong>ir rural<br />
counterparts. This, however, is compensated <strong>in</strong> many<br />
cases by consum<strong>in</strong>g smaller portions <strong>of</strong> <strong>the</strong> foods, a<br />
cop<strong>in</strong>g mechanism which can negate <strong>the</strong> effects <strong>of</strong><br />
high dietary diversity (M Savy et al. 2008; Oldewage-<br />
Theron & Kruger 2011)<br />
Dietary diversity scores have been cited as a good<br />
<strong>in</strong>dicator <strong>of</strong> child general nutritional status and<br />
signi cant <strong>in</strong>teraction with HfA z-Scores has also been<br />
noted, <strong>of</strong> particular importance when assess<strong>in</strong>g nonbreast<br />
fed children as complementary foods can make<br />
up for <strong>the</strong> lack <strong>of</strong> nutrition <strong>in</strong> feed<strong>in</strong>g formula (Arimond<br />
& M. T. Ruel 2004). Dietary diversity must be looked
at alongside o<strong>the</strong>r food security <strong>in</strong>dicators however,<br />
as alone it is not necessarily associated with o<strong>the</strong>r<br />
anthropometric measurements <strong>in</strong> children (Sealey-<br />
Potts 2010).<br />
Independent dietary diversity scores were calculated<br />
for ‘<strong>the</strong> youngest child who is not currently<br />
breastfeed<strong>in</strong>g.’ The thresholds used were based on<br />
a previous study <strong>of</strong> <strong>the</strong> population <strong>in</strong> Amura, <strong>Uganda</strong><br />
(ACF 2010b). A score <strong>of</strong> 1-3 yielded ‘Poor’ diversity, 4-6:<br />
‘Borderl<strong>in</strong>e’, and 7-8: ‘Acceptable’. Figure 19 displays<br />
<strong>the</strong> results <strong>of</strong> child IDDS and resultant thresholds for<br />
<strong>the</strong> entire population (n=84). This accounts for <strong>the</strong><br />
majority (91%) <strong>of</strong> households with children between 6<br />
months and 15 years.<br />
Figure 20 displays <strong>the</strong>se results as disaggregated by<br />
area. This amount <strong>of</strong> <strong>poor</strong> DDS is concern<strong>in</strong>g with<strong>in</strong><br />
<strong>the</strong> sample population. 69% <strong>of</strong> <strong>the</strong> children <strong>in</strong> <strong>the</strong><br />
households surveyed have a <strong>poor</strong> dietary diversity,<br />
and a fur<strong>the</strong>r 25% are on <strong>the</strong> borderl<strong>in</strong>e. Only 6% <strong>of</strong><br />
<strong>the</strong> households show and acceptable child dietary<br />
diversity, all <strong>of</strong> which were located <strong>in</strong> Kisenyi.<br />
5.3.7.1b Household Food Insecurity<br />
Access<br />
The HFIAS was utilized to measure food security and<br />
severity with<strong>in</strong> <strong>the</strong> household at a population level.<br />
The HFIAS utilises a set <strong>of</strong> 9 questions to determ<strong>in</strong>e<br />
a household’s own perception <strong>of</strong> food security, as well<br />
as food deprivation at both quality and consumption<br />
levels. The questions were presented to <strong>the</strong> respondent<br />
with <strong>the</strong> options <strong>of</strong> never, once or twice every two<br />
weeks (rarely), once or twice every week (sometimes),<br />
and multiple times per week (<strong>of</strong>ten).<br />
Conditions<br />
The conditions section <strong>of</strong> <strong>the</strong> HFIAS presents a<br />
disaggregated viewpo<strong>in</strong>t <strong>of</strong> <strong>the</strong> behaviours and<br />
perceptions <strong>of</strong> <strong>the</strong> respondent households. By<br />
display<strong>in</strong>g this <strong>in</strong>formation as separate responses,<br />
one assumes a better understand<strong>in</strong>g <strong>of</strong> which<br />
conditions are particularly <strong>in</strong> uenc<strong>in</strong>g <strong>the</strong> scale.<br />
This is meant to be <strong>in</strong>dicative <strong>of</strong> food security at a<br />
community level, and is presented to give <strong>the</strong> reader<br />
a general idea <strong>of</strong> <strong>the</strong> conditions that <strong>the</strong> population is<br />
fac<strong>in</strong>g. The conditions show that at least 54% <strong>of</strong> <strong>the</strong><br />
respondents have felt some level <strong>of</strong> food <strong>in</strong>security at<br />
any frequency. Frequency shows that once or twice<br />
per week and less than once per week make up <strong>the</strong><br />
bulk <strong>of</strong> <strong>the</strong> responses for any category.<br />
47
48<br />
Doma<strong>in</strong><br />
The questions presented <strong>in</strong> <strong>the</strong> HFIAS <strong>in</strong>dicator come<br />
<strong>in</strong> <strong>the</strong> form <strong>of</strong> three doma<strong>in</strong>s. Figure 20 displays <strong>the</strong>se<br />
results as <strong>in</strong>dicative <strong>of</strong> all slum areas as a whole.<br />
This is meant to display an idea <strong>of</strong> frequency <strong>of</strong><br />
food security issues. Anxiety and uncerta<strong>in</strong>ty about<br />
household food supply is <strong>the</strong> least recognised<br />
doma<strong>in</strong>, yet still describes 67% <strong>of</strong> households feel<strong>in</strong>g<br />
some frequency <strong>the</strong>re<strong>of</strong>, with 19% <strong>of</strong>ten so. 95% <strong>of</strong><br />
<strong>the</strong> population experiences a form <strong>of</strong> <strong>in</strong>suf cient food<br />
quality, <strong>of</strong> which 29% experiences this multiple times<br />
every week. Lastly, <strong>in</strong>suf cient <strong>in</strong>take is experienced<br />
by 86% <strong>of</strong> <strong>the</strong> sample, <strong>of</strong> which 25% happens <strong>of</strong>ten.<br />
These results are disaggregated by slum area with<br />
Bwaise contribut<strong>in</strong>g 11 samples, Kisenyi 43, and<br />
Namuwongo 43. All doma<strong>in</strong>s are experienced by<br />
at least half <strong>of</strong> <strong>the</strong> sample population <strong>in</strong> each area.<br />
Figure 23 shows that Namuwongo has consistently<br />
responded to <strong>the</strong>se three doma<strong>in</strong>s <strong>in</strong> <strong>the</strong> af rmative,<br />
with at least 33% stat<strong>in</strong>g that <strong>the</strong>y experience <strong>the</strong>se<br />
conditions multiple times per week.<br />
HFIAS Score<br />
This is a score that describes a household’s food<br />
security by a numerical value from 0 (secure) to 27<br />
(severely <strong>in</strong>secure). It can be considered a population<br />
measure, by a re ection <strong>of</strong> a household’s perception<br />
<strong>of</strong> its own food security. Given this, it can show how<br />
prevalent food <strong>in</strong>security is with<strong>in</strong> <strong>the</strong> community.<br />
The median score for <strong>the</strong> entirety <strong>of</strong> <strong>the</strong> sample<br />
population is 15. When regard<strong>in</strong>g <strong>the</strong> disaggregated<br />
results, one can see that this score is signi cantly<br />
<strong>in</strong> uenced by Kisenyi, whose median score is <strong>the</strong><br />
lowest at 8. HFIAS is not conducted under <strong>the</strong> <strong>Uganda</strong>n<br />
Government DHS or NHS censuses, however for<br />
reference, <strong>in</strong>dependent studies have shown <strong>urban</strong><br />
West African household median HFIAS scores <strong>of</strong> 4<br />
to 5 (considered as secure) (Becquey et al. 2010).<br />
Fur<strong>the</strong>rmore, after <strong>the</strong> 2008 price crisis <strong>in</strong> Burk<strong>in</strong>a<br />
Faso, scores <strong>in</strong> <strong>urban</strong> Ouagadougou averaged at 9.0<br />
(SD 5.6) (Mart<strong>in</strong>-Prevel<br />
TABLE 1: HFIAS SCORE<br />
et al. 2012). Urban slums<br />
<strong>in</strong> Bangladesh had mean<br />
Median<br />
Population<br />
food security scores<br />
Score<br />
<strong>of</strong> between 13.5 and All 15<br />
11.1, with an average Bwaise 20<br />
value <strong>of</strong> 12.2 (Benson Namuwongo 22<br />
Kisenyi 8<br />
2007). With<strong>in</strong> a <strong>Uganda</strong>n<br />
context, a referential<br />
mean score for a population <strong>of</strong> rural <strong>in</strong>habitants liv<strong>in</strong>g<br />
with HIV/AIDS was 15.2 (SD 5.0) (Kadiyala & Rawat<br />
2012). In this study, <strong>the</strong> lowest average <strong>of</strong> all areas was<br />
Kisenyi at 10.3 (SD 7.1), with all areas represent<strong>in</strong>g an<br />
average <strong>of</strong> 16.0 (SD 9.0).<br />
Severity and Prevalence<br />
Though severity and prevalence are not utilised by ACF<br />
as <strong>the</strong> thresholds have not been validated for universal<br />
use, <strong>the</strong> results as obta<strong>in</strong>ed by <strong>the</strong> FANTA guidel<strong>in</strong>es<br />
are presented (Coates et al. 2007). O<strong>the</strong>r studies<br />
<strong>in</strong> <strong>the</strong> past have used <strong>the</strong> same FANTA guidel<strong>in</strong>es.<br />
This allows a m<strong>in</strong>imal basis for comparison, despite<br />
<strong>the</strong> question <strong>of</strong> <strong>the</strong> applicability <strong>of</strong> <strong>the</strong> thresholds. It<br />
should be kept <strong>in</strong> m<strong>in</strong>d however, that though <strong>the</strong>se<br />
comparisons are presented, methodologies and aims<br />
<strong>of</strong> this study and those <strong>of</strong> <strong>the</strong> comparatives are notably<br />
disparate and <strong>the</strong>refore a direct correlation should not
e drawn. These results display to what extent and<br />
severity food security is experienced by <strong>the</strong> sample<br />
population. The results <strong>in</strong> Figure 23 are presented as<br />
percentage totals <strong>of</strong> respondents and <strong>in</strong>clude both all<br />
areas as well as separated by slum.<br />
This result tells us that more than 75% <strong>of</strong> households<br />
<strong>in</strong> all slum areas are severely food <strong>in</strong>secure, pay<strong>in</strong>g<br />
notable attention to Bwaise (100%) and Namuwongo<br />
(93%). For comparison, Benson (2007) found that <strong>in</strong><br />
Dhaka, Bangladesh 66.3% were labelled as severely<br />
food <strong>in</strong>secure, and ano<strong>the</strong>r 23.1% as moderately so.<br />
The same population <strong>of</strong> HIV/AIDS patients <strong>in</strong> <strong>Uganda</strong><br />
claims a mean <strong>of</strong> 66.1% as severely food <strong>in</strong>secure<br />
(Kadiyala & Rawat 2012). The study exam<strong>in</strong><strong>in</strong>g food<br />
security <strong>in</strong> Ouagadougou after <strong>the</strong> 2008 price crisis<br />
saw all levels <strong>of</strong> food <strong>in</strong>security at 78.0%, whereas <strong>in</strong><br />
this study <strong>the</strong> levels were 98%, with only 2% as food<br />
secure.<br />
5.3.7.1c Food Consumption Score<br />
Food consumption scores are presented as an <strong>in</strong>dicator<br />
<strong>of</strong> household dietary adequacy, ma<strong>in</strong>ly focus<strong>in</strong>g on<br />
macronutrients and energy. The FCS for this study<br />
was adapted from a 7-day model for <strong>in</strong>formation from<br />
a 24-hour recall. This is mostly because <strong>of</strong> respondent<br />
fatigue due to <strong>the</strong> large amount <strong>of</strong> o<strong>the</strong>r <strong>in</strong>formation<br />
that had been collected. It is possible that this may<br />
have skewed <strong>the</strong> results, though should still serve as<br />
complementary <strong>in</strong>formation to <strong>the</strong> o<strong>the</strong>r <strong>in</strong>dicators. The<br />
standard thresholds were utilised as opposed to those<br />
that are altered to adjust for sugar and oil eaten on a<br />
daily basis (only 17% <strong>of</strong> <strong>the</strong> population had consumed<br />
49
50<br />
sugar and 19% oils or fats with<strong>in</strong> <strong>the</strong> recall period).<br />
By disaggregat<strong>in</strong>g this <strong>in</strong>formation by area, we<br />
can see that Kisenyi has a high <strong>in</strong> uence on <strong>the</strong><br />
Acceptable consumption scores when part <strong>of</strong> <strong>the</strong><br />
whole population, which is <strong>in</strong> l<strong>in</strong>e with both <strong>the</strong><br />
HFIAS and <strong>the</strong> IDDS scores. Interest<strong>in</strong>g to note is<br />
<strong>the</strong> difference <strong>of</strong> those results <strong>in</strong> Namuwongo, which<br />
does not re ect <strong>the</strong> results <strong>of</strong> <strong>the</strong> o<strong>the</strong>r <strong>in</strong>dicators. This<br />
may be expla<strong>in</strong>ed by <strong>the</strong> methodology, <strong>in</strong> that as this<br />
<strong>in</strong>dicator was adapted from a 7-day model to a oneday<br />
model, anomalies <strong>in</strong> <strong>the</strong> diets may have occurred<br />
and may not be fully representative.<br />
5.3.7.2 O<strong>the</strong>r Food Security Information<br />
O<strong>the</strong>r <strong>in</strong>formation was collected that perta<strong>in</strong>s to food<br />
security and <strong>the</strong> diets <strong>of</strong> <strong>the</strong> slum dwellers.<br />
5.3.7.2a Frequency <strong>of</strong> meals<br />
In addition to <strong>the</strong> 24 hour recall <strong>of</strong> <strong>the</strong> IDDS and FCS,<br />
frequency <strong>of</strong> meals eaten was obta<strong>in</strong>ed by ask<strong>in</strong>g<br />
how many times both <strong>the</strong> respondent and children<br />
under <strong>the</strong> age <strong>of</strong> two have eaten <strong>in</strong> <strong>the</strong> past 24 hours.<br />
‘Eaten’ can account for both meals and snacks and<br />
was differentiated as such because <strong>in</strong> <strong>Uganda</strong>, when<br />
eat<strong>in</strong>g it is only considered a meal if matooke, cassava<br />
or ano<strong>the</strong>r starchy carbohydrate are consumed.<br />
Two meals for <strong>the</strong> respondent seem to be <strong>the</strong> prevail<strong>in</strong>g<br />
statistic <strong>in</strong> all areas beside Kisenyi where 3 or more<br />
accounted for 100%. This is keep<strong>in</strong>g <strong>in</strong> l<strong>in</strong>e with <strong>the</strong><br />
o<strong>the</strong>r food security <strong>in</strong>dicators<br />
that displayed Kisenyi as<br />
relatively better <strong>of</strong>f than both<br />
Namuwongo and Bwaise.<br />
When consider<strong>in</strong>g children<br />
under two years <strong>of</strong> age, only<br />
50 respondents had claimed<br />
to have a child tt<strong>in</strong>g <strong>the</strong> age.<br />
Under <strong>the</strong> age <strong>of</strong> two was<br />
chosen as this is one <strong>of</strong> <strong>the</strong><br />
most important periods to<br />
prevent stunt<strong>in</strong>g as caused<br />
by food <strong>in</strong>take. Bwaise was<br />
<strong>the</strong> only area who had children that have eaten 0<br />
times <strong>in</strong> <strong>the</strong> past day, though this only represents 2<br />
households.
5.3.7.2b Sources <strong>of</strong> Food<br />
Table 14 displays <strong>the</strong> sources <strong>of</strong> food that <strong>the</strong><br />
respondents had claimed. 93% <strong>of</strong> respondents had<br />
claimed just one food source, which aside from Bwaise<br />
slum, were all purchases. Bwaise had <strong>the</strong> most varied<br />
food sources, however <strong>the</strong> majority (76%) claimed<br />
purchas<strong>in</strong>g as <strong>the</strong> primary method. 88 percent had<br />
said that <strong>the</strong>y had acquired food by purchase <strong>in</strong> <strong>the</strong><br />
last 24 hours. These results are not presented by area<br />
as purchase is overwhelm<strong>in</strong>gly <strong>the</strong> ma<strong>in</strong> method <strong>of</strong><br />
acquir<strong>in</strong>g food, which is consistent with <strong>the</strong> literature.<br />
TABLE 1: RANKED SOURCES OF FOOD<br />
# <strong>of</strong><br />
Instances Rank<br />
Purchase 98 1<br />
Food Aid 6 2<br />
Household<br />
Farm<strong>in</strong>g/Livestock<br />
5 3<br />
Gift 1 4<br />
O<strong>the</strong>r 1 4<br />
Exchange/Barter 0 --<br />
51
52<br />
5.4<br />
Livelihood Pro les/Strategies<br />
Livelihoods are multidimensional and can be dif cult<br />
to differentiate due to <strong>the</strong> sheer amount <strong>of</strong> variables<br />
associated with <strong>the</strong>m. For this study, multiple<br />
dimensions were <strong>in</strong>deed considered for livelihood<br />
pro les, but special consideration was taken with<br />
expenditure and <strong>in</strong>comes.<br />
Poverty estimates for <strong>Kampala</strong> are widely varied,<br />
possibly due to limited data sources, method <strong>of</strong><br />
calculation, or non-speci city toward populations.<br />
For <strong>the</strong> rst step <strong>of</strong> <strong>the</strong> livelihood pro le, four different<br />
calculations were assessed to determ<strong>in</strong>e <strong>the</strong> scale<br />
<strong>of</strong> poverty with<strong>in</strong> <strong>the</strong> sample population. Though <strong>the</strong><br />
sample size is too small to relate to <strong>the</strong> entire <strong>urban</strong><br />
5.4.1 Wealth Group<strong>in</strong>gs<br />
<strong>poor</strong> population, this was done so to give evidencebased<br />
reason<strong>in</strong>g to <strong>the</strong> terms “very <strong>poor</strong>”, “<strong>poor</strong>”,<br />
“middle”, and “better <strong>of</strong>f” when group<strong>in</strong>g by wealth.<br />
The gures <strong>in</strong> Table 15 show a wide discrepancy<br />
between <strong>the</strong>se classi cations. It should be noted<br />
however that all are above <strong>the</strong> <strong>of</strong> cial rate <strong>of</strong> 4% for<br />
<strong>urban</strong> residents. Notably, <strong>the</strong> CBN measure reported<br />
24% as below <strong>the</strong> poverty l<strong>in</strong>e, 20% more than <strong>the</strong><br />
<strong>Uganda</strong>n Government’s gure for <strong>Kampala</strong> us<strong>in</strong>g a<br />
similar measurement. Though <strong>in</strong>terest<strong>in</strong>gly, this more<br />
closely re ects <strong>the</strong> most recent <strong>of</strong> cial national poverty<br />
l<strong>in</strong>e statistic (<strong>in</strong>clud<strong>in</strong>g rural areas) at 24.5% (UBOS<br />
2010b).<br />
As an expense-based poverty limit is more suitable<br />
to this context and that nearly double <strong>the</strong> sample size<br />
had <strong>in</strong>formation available to calculate <strong>the</strong> absolute<br />
measures, this study will consider respondents who<br />
fell under <strong>the</strong> CBN l<strong>in</strong>e as ‘Poor’ and those that fall<br />
under <strong>the</strong> FEI l<strong>in</strong>e as ‘Very Poor’.<br />
For <strong>the</strong> ‘Middle’ and ‘Better <strong>of</strong>f’ groups, <strong>the</strong> thresholds<br />
were set based on <strong>the</strong> mean daily food expenditure,<br />
1943 UShs. I.e. those that are above <strong>the</strong> CBN poverty<br />
l<strong>in</strong>e but below <strong>the</strong> mean are considered “Middle” while<br />
those above <strong>the</strong> mean are “Better Off”.<br />
To fur<strong>the</strong>r complement <strong>the</strong> justi cation <strong>of</strong> us<strong>in</strong>g <strong>the</strong> poverty l<strong>in</strong>e, wealth group<strong>in</strong>gs were developed to demonstrate<br />
asset and nancial wealth differentiation <strong>of</strong> <strong>the</strong> sample population. For this purpose, own<strong>in</strong>g a residence is<br />
considered a measure <strong>of</strong> asset wealth and clearly differentiates those groups that fall below <strong>the</strong> CBN l<strong>in</strong>e.<br />
Crowd<strong>in</strong>g <strong>in</strong>dex is also used as a measure <strong>of</strong> asset wealth, though <strong>the</strong> only apparent differentiation separates<br />
<strong>the</strong> better <strong>of</strong>f category.
Although, as previously noted, <strong>in</strong>come levels <strong>in</strong> this<br />
study were questionable, <strong>the</strong> expense to <strong>in</strong>come ratio<br />
was <strong>in</strong>cluded to fur<strong>the</strong>r demonstrate <strong>the</strong> differentiation<br />
between <strong>the</strong> groups.<br />
Wealth groups were not particularly differentiated<br />
by number <strong>of</strong> <strong>in</strong>come sources amongst <strong>the</strong> sample<br />
population. In l<strong>in</strong>e with previous <strong>urban</strong> studies, <strong>in</strong>come<br />
source types varied greatly and, along with wealth<br />
group<strong>in</strong>gs, formed a suf cient differentiation to de ne<br />
livelihood pro les. The sources were listed through<br />
open-ended response by <strong>the</strong> respondents and were<br />
recorded without a particular nam<strong>in</strong>g convention.<br />
These were <strong>the</strong>n classi ed <strong>in</strong>to broad groups.<br />
To better de ne <strong>the</strong>se <strong>in</strong>come source types, some<br />
examples are given for each category as listed by <strong>the</strong><br />
respondents:<br />
Casual Labour: Usually listed as casual<br />
labour or self-employed (con rmed by<br />
<strong>in</strong>terviews with <strong>the</strong> respondents). O<strong>the</strong>rs<br />
<strong>in</strong>clude Boda-boda (motorcycle) taxi drivers,<br />
timber carry<strong>in</strong>g, or water fetch<strong>in</strong>g.<br />
Petty Trade/Street vendor: Typically a<br />
vendor <strong>of</strong> s<strong>in</strong>gle commodity foodstuffs<br />
(tomatoes, sugar cane, chapatti, etc.). Also<br />
<strong>in</strong>cludes ‘local brew’ vendors, water vendors<br />
(private tap operators) money changers,<br />
various non-food items (charcoal) and<br />
mechanical spare parts for cars or bodabodas.<br />
Vocation: Skilled service delivery or artisans<br />
such as hair dressers, welders, craft makers,<br />
electrical workers or carpenters.<br />
Public/Private Salary – Nonquali ed:<br />
unskilled salaried positions such as street<br />
sweepers, rubbish collectors, security<br />
guards, or sav<strong>in</strong>gs group collectors<br />
Public/Private Salary – Quali ed: Salaried<br />
position that requires tra<strong>in</strong><strong>in</strong>g such as<br />
Policemen, Nurses, teachers, or traditional<br />
birth attendants.<br />
A common designation was that <strong>of</strong> bus<strong>in</strong>essman/<br />
woman. This term is used broadly and can mean<br />
anyth<strong>in</strong>g from own<strong>in</strong>g a storefront to <strong>in</strong>frequent casual<br />
labour.<br />
As details were limited <strong>in</strong> <strong>the</strong> speci cation <strong>of</strong> <strong>in</strong>come<br />
sources dur<strong>in</strong>g <strong>the</strong> data collection, this was discounted<br />
<strong>in</strong> <strong>the</strong>se group<strong>in</strong>gs though it should be noted that it<br />
accounts for 6% <strong>of</strong> respondents primary source <strong>of</strong><br />
<strong>in</strong>come.<br />
53
54<br />
5.4.2 Livelihood Strategies<br />
From this <strong>in</strong>formation group<strong>in</strong>gs can be developed that characterise different livelihood strategies. Consider<strong>in</strong>g<br />
<strong>the</strong> CBN poverty l<strong>in</strong>e as a <strong>poor</strong>/non <strong>poor</strong> cut-<strong>of</strong>f and consider<strong>in</strong>g primary <strong>in</strong>come sources and asset capitals,<br />
pro les have been developed for six livelihood strategies.<br />
These classi cations were developed <strong>in</strong> consideration <strong>of</strong> <strong>the</strong> guidel<strong>in</strong>es as presented by <strong>the</strong> HEA. The most<br />
<strong>in</strong> uential factor <strong>in</strong> determ<strong>in</strong><strong>in</strong>g <strong>the</strong> group<strong>in</strong>gs were wealth group<strong>in</strong>g and type <strong>of</strong> <strong>in</strong>come activity as described<br />
below. By us<strong>in</strong>g two <strong>of</strong> <strong>the</strong> most concrete characteristics available from <strong>the</strong> household study, <strong>the</strong> identi cation<br />
<strong>of</strong> <strong>the</strong>se groups more accurately re ects how <strong>the</strong> respondents identify <strong>the</strong>mselves. Additionally, complementary<br />
<strong>in</strong>formation taken from <strong>the</strong> four rema<strong>in</strong><strong>in</strong>g capitals <strong>of</strong> <strong>the</strong> SLF has been considered <strong>in</strong> <strong>the</strong> development <strong>of</strong> <strong>the</strong><br />
pro les.<br />
Each pro le is presented and described below, with<br />
charts exam<strong>in</strong><strong>in</strong>g <strong>the</strong>ir daily expenditure, a visual<br />
representation and explanation <strong>of</strong> <strong>the</strong>ir livelihood asset<br />
mix, and an example activity pro le. Charts compar<strong>in</strong>g<br />
<strong>the</strong> subsequently discussed <strong>in</strong>formation across <strong>the</strong><br />
different pro les can be found <strong>in</strong> Appendix VIII. As<br />
<strong>in</strong>come activities may vary dependent on location, size<br />
and demographics <strong>of</strong> slum areas, it should be noted<br />
that <strong>the</strong>se pro les have been developed to describe<br />
<strong>the</strong> sample population <strong>in</strong>vestigated <strong>in</strong> this study only<br />
and may not perta<strong>in</strong> to <strong>the</strong> larger <strong>urban</strong> <strong>poor</strong> populace.<br />
5.4.2.1 Poor Casual Labourers<br />
Respondents claim<strong>in</strong>g a type <strong>of</strong> casual labour as <strong>the</strong>ir primary source <strong>of</strong> <strong>in</strong>come fall <strong>in</strong>to this category. Mak<strong>in</strong>g<br />
up 1/3rd <strong>of</strong> respondents and are spread nearly evenly across wealth groups. Hence, it was necessary to<br />
dist<strong>in</strong>guish <strong>the</strong> pro les. They are differentiated as “<strong>poor</strong>” as <strong>the</strong>y fall below <strong>the</strong> previously de ned CBN poverty<br />
l<strong>in</strong>e for this population.<br />
Demographics and Asset Capitals<br />
70% <strong>of</strong> <strong>poor</strong> casual labourers claimed to have<br />
changed work s<strong>in</strong>ce mov<strong>in</strong>g to <strong>Kampala</strong>, all <strong>of</strong> whom<br />
were formerly farmers and claimed <strong>the</strong> lack <strong>of</strong> land as<br />
<strong>the</strong>ir primary reason for not cont<strong>in</strong>u<strong>in</strong>g <strong>the</strong> activity. This<br />
is <strong>the</strong> only group that did not have any respondents<br />
who owned nei<strong>the</strong>r <strong>the</strong> land nor structure <strong>the</strong>y live<br />
<strong>in</strong>. Poor casual labourers claim <strong>the</strong> second-lowest<br />
rate <strong>of</strong> membership <strong>of</strong> groups or associations <strong>in</strong> <strong>the</strong>ir<br />
communities at only 1/3rd <strong>of</strong> respondents. Additionally
this group is <strong>the</strong> least likely to have received a form<br />
<strong>of</strong> support (cash, food, work, etc.) from a network<br />
(mostly UN/NGO or family/friends); only 30% hav<strong>in</strong>g<br />
claimed so. The nancial capital portion was heavily<br />
<strong>in</strong> uenced by <strong>the</strong> low debt/<strong>in</strong>come ratio, despite 89%<br />
claim<strong>in</strong>g to have taken on debt with<strong>in</strong> <strong>the</strong> previous<br />
year, but subsequently adjusted for <strong>the</strong> wealth<br />
group<strong>in</strong>gs be<strong>in</strong>g entirely <strong>in</strong> <strong>the</strong> <strong>poor</strong> and very <strong>poor</strong><br />
categories. Poor casual labourers were also <strong>the</strong> users<br />
<strong>of</strong> <strong>the</strong> least amount <strong>of</strong> water per person per day at a<br />
median value <strong>of</strong> 10L, with a median cost <strong>of</strong> just 33<br />
UShs.<br />
Expenses<br />
The daily expenses by <strong>poor</strong> casual labourers are kept<br />
m<strong>in</strong>imal, with food expenses show<strong>in</strong>g <strong>the</strong> widest variation. The median total daily expenditure <strong>in</strong> this group is<br />
3110 UShs. Rent takes up <strong>the</strong> vast majority <strong>of</strong> <strong>the</strong>ir monthly expenses. This group claims <strong>the</strong> highest proportion<br />
<strong>of</strong> household with children attend<strong>in</strong>g school (80%), and 100% <strong>of</strong> households hav<strong>in</strong>g at least one child under 5<br />
years old despite education be<strong>in</strong>g <strong>the</strong> largest expenditure with<strong>in</strong> <strong>the</strong> “o<strong>the</strong>r” expense periodicity.<br />
Activity Pro le<br />
The activity pro le <strong>of</strong> a man <strong>in</strong> Namuwongo slum is displayed <strong>in</strong> Figure 33. As a representation <strong>of</strong> a typical day,<br />
two ma<strong>in</strong> po<strong>in</strong>ts can be taken from this schedule. First, that <strong>the</strong> man spends <strong>the</strong> bulk <strong>of</strong> <strong>the</strong> day search<strong>in</strong>g for<br />
work. This may constitute him actively approach<strong>in</strong>g<br />
job sites and ask<strong>in</strong>g for work, or wait<strong>in</strong>g at his or a<br />
friend’s home or on a ma<strong>in</strong> footpath for someone to<br />
propose work to him. Second, <strong>the</strong> man stated that<br />
his eat<strong>in</strong>g for <strong>the</strong> day depended on whe<strong>the</strong>r or not<br />
he found work for <strong>the</strong> day. He said that when he did<br />
<strong>in</strong> fact nd work, it was typically fetch<strong>in</strong>g water.<br />
Food Security and Cop<strong>in</strong>g Mechanisms<br />
Regard<strong>in</strong>g food security <strong>in</strong>dicators, <strong>poor</strong> casual labourers claimed <strong>the</strong> highest proportion <strong>of</strong> ‘<strong>poor</strong>’ FCS scores<br />
<strong>of</strong> all <strong>the</strong> livelihood strategies pro led. Additionally, <strong>the</strong> households <strong>in</strong> this group were <strong>the</strong> only ones to claim<br />
100% <strong>of</strong> <strong>the</strong>ir child IDDS scores under <strong>the</strong> ‘<strong>poor</strong>’ threshold. When consider<strong>in</strong>g <strong>the</strong> HFIAS <strong>in</strong>dicators, 85% <strong>of</strong> <strong>the</strong><br />
group displayed some anxiety and uncerta<strong>in</strong>ty about <strong>the</strong> household food supply, similar to <strong>the</strong> non-<strong>poor</strong> casual<br />
labourers. 100% <strong>of</strong> respondents claimed <strong>in</strong>suf cient food quality (30% responded as ‘<strong>of</strong>ten’), compared to 85%<br />
<strong>of</strong> <strong>the</strong>ir non-<strong>poor</strong> counterparts. Insuf cient food <strong>in</strong>take was cited by 90% <strong>of</strong> residents, similar to <strong>the</strong> non-<strong>poor</strong>.<br />
Some form <strong>of</strong> food <strong>in</strong>security (mild, moderate, severe) was claimed by 100% <strong>of</strong> <strong>the</strong> respondents, as did all<br />
groups. The HFIAS score calculated for this group was 12.1, while <strong>the</strong> mean for all groups was 11.2.<br />
55
56<br />
Cop<strong>in</strong>g mechanisms that were employed by this group were identi ed by an altered cop<strong>in</strong>g mechanism <strong>in</strong>dex<br />
score, as noted <strong>in</strong> <strong>the</strong> methodology. Poor casual labourers were <strong>the</strong> only group to have a signi cantly higher<br />
cop<strong>in</strong>g strategies <strong>in</strong>dex score (17.6) from <strong>the</strong> mean (10.9). This was mostly <strong>in</strong> uenced by 60% <strong>of</strong> respondents<br />
claim<strong>in</strong>g to have sent a family member away to beg, <strong>the</strong> highest proportion <strong>of</strong> all groups. This group also<br />
claimed 80% <strong>of</strong> respondents have stopped health or education expenses with<strong>in</strong> <strong>the</strong> last month, 40% more than<br />
<strong>the</strong> next highest group. Additionally, 100% <strong>of</strong> <strong>poor</strong> casual labourers claimed to have reduced all expenses<br />
with<strong>in</strong> <strong>the</strong> same time period. They have also claimed <strong>the</strong> highest proportions <strong>of</strong> sell<strong>in</strong>g productive assets (60%)<br />
and tak<strong>in</strong>g on new debt (70%).<br />
Hazards and Vulnerability Context<br />
As <strong>the</strong>ir situation is primarily casual labour, <strong>the</strong> ma<strong>in</strong> hazards are any <strong>of</strong> those that can affect a daily <strong>in</strong>come,<br />
such as illness <strong>of</strong> <strong>the</strong> head <strong>of</strong> household or child. The uncerta<strong>in</strong>ty <strong>of</strong> <strong>in</strong>come can be considered <strong>the</strong> most<br />
apparent and persistent vulnerability, and because <strong>of</strong> this <strong>the</strong> caual labourer may need to seek o<strong>the</strong>r means<br />
to achieve <strong>the</strong>ir livelihood outcomes. As <strong>the</strong>se <strong>poor</strong> casual labourers were located mostly <strong>in</strong> Namuwongo,<br />
an environmental hazard exists <strong>in</strong> <strong>the</strong>ir susceptibility to ood<strong>in</strong>g. As mentioned <strong>in</strong> <strong>the</strong> natural capital section,<br />
ood<strong>in</strong>g can spread disease and depreciate or destroy assets, and <strong>in</strong> some cases can be life-threaten<strong>in</strong>g.<br />
Lastly, land tenure affects this group. Ownership <strong>of</strong> a residence is a rarity amongst this group, and coupled with<br />
<strong>the</strong> uncerta<strong>in</strong>ty <strong>of</strong> <strong>in</strong>come and <strong>the</strong> persistent threat by city plann<strong>in</strong>g regulators, a lack <strong>of</strong> shelter is a persistent<br />
threat.<br />
5.4.2.2 Non-Poor Casual Labourers<br />
Respondents who claimed casual labour as <strong>the</strong>ir primary source <strong>of</strong> <strong>in</strong>come, but were fell <strong>in</strong>to <strong>the</strong> ‘Middle’ and<br />
‘Better Off’ (above <strong>the</strong> CBN l<strong>in</strong>e) categories, justi ed <strong>the</strong>m as be<strong>in</strong>g non-<strong>poor</strong>. Non-<strong>poor</strong> casual labourers are<br />
also differentiated from <strong>the</strong>ir <strong>poor</strong> counterparts <strong>in</strong> that <strong>the</strong> majority (45%) have been liv<strong>in</strong>g <strong>in</strong> <strong>Kampala</strong> for over<br />
16 years.<br />
Demographics and Asset Capitals<br />
The majority <strong>of</strong> this group uses tap water dur<strong>in</strong>g <strong>the</strong> ra<strong>in</strong>y season. This is mostly represented by Namuwongo<br />
slum (private taps or water merchants) and prices may not be as regular as <strong>the</strong> public water dispensers <strong>in</strong><br />
Kisenyi. It should be noted that dur<strong>in</strong>g <strong>the</strong> dry season,<br />
use <strong>of</strong> public wells for water <strong>in</strong>creases. Possibly,<br />
as ra<strong>in</strong>fall slows, <strong>the</strong> risk <strong>of</strong> contam<strong>in</strong>ation by waste<br />
lessens. Physical capital was heavily <strong>in</strong> uenced by <strong>the</strong><br />
fact that only 5% were owners <strong>of</strong> <strong>the</strong> land or structure<br />
<strong>the</strong>y lived <strong>in</strong>, and 0% had a toilet with<strong>in</strong> <strong>the</strong> house.<br />
Only 20% <strong>of</strong> non-<strong>poor</strong> labourers claimed membership<br />
<strong>in</strong> a community group, <strong>the</strong> second lowest <strong>of</strong> all <strong>the</strong><br />
groups. This group had <strong>the</strong> highest ratio <strong>of</strong> expenses/<br />
<strong>in</strong>come and second highest ratio <strong>of</strong> debt to <strong>in</strong>come,<br />
which heavily <strong>in</strong> uenced <strong>the</strong> nancial capital portion.<br />
This group did claim <strong>the</strong> highest natural capital level,<br />
as it had 5% <strong>of</strong> respondents sourc<strong>in</strong>g food from <strong>urban</strong>
agriculture or livestock as well as a high usage <strong>of</strong> water<br />
from wells dur<strong>in</strong>g <strong>the</strong> dry season. Natural capital was<br />
adjusted to account for <strong>the</strong> exposure to ood<strong>in</strong>g as <strong>the</strong><br />
majority lived <strong>in</strong> Namuwongo, one <strong>of</strong> <strong>the</strong> most oodprone<br />
areas due to its border on <strong>the</strong> Nakirubo canal.<br />
Expenses<br />
Non-<strong>poor</strong> and <strong>poor</strong> casual labourers are seen to have<br />
similar daily <strong>in</strong>comes, yet <strong>the</strong> differentiat<strong>in</strong>g factor is<br />
that <strong>the</strong> non-<strong>poor</strong> tends to have higher daily expenses.<br />
Once aga<strong>in</strong>, food makes up <strong>the</strong> largest variation <strong>of</strong><br />
daily expenditure for this group, yet transportation<br />
has <strong>the</strong> highest median value. The total median daily<br />
expenditure for this group is more than double that <strong>of</strong><br />
<strong>the</strong> Poor Casual Labourers at 6490 UShs. Rent is <strong>the</strong><br />
predom<strong>in</strong>ant monthly expense with loan repayments as<br />
<strong>the</strong> second highest, with an average debt taken out at 271,400 UShs. The debt taken out was used mostly for<br />
rent, though most <strong>of</strong> those that borrowed claimed at least two reasons for tak<strong>in</strong>g on <strong>the</strong> loan.<br />
Activity Pro le<br />
The activity pro le for this group sees <strong>the</strong> ma<strong>in</strong> difference<br />
from <strong>the</strong> <strong>poor</strong> casual labourer that <strong>the</strong> respondent had<br />
work to attend on <strong>the</strong> day <strong>of</strong> <strong>the</strong> <strong>in</strong>terview. Additionally,<br />
hav<strong>in</strong>g a regular job affords <strong>the</strong> worker to spend weekends<br />
as leisure time, <strong>in</strong> this <strong>in</strong>stance, visit<strong>in</strong>g with friends.<br />
Food Security and Cop<strong>in</strong>g Mechanisms<br />
Only 10% <strong>of</strong> <strong>the</strong> respondents had an FCS score fall under<br />
<strong>the</strong> ‘<strong>poor</strong>’ threshold, with 60% fall<strong>in</strong>g <strong>in</strong>to <strong>the</strong> ‘acceptable’<br />
marg<strong>in</strong>s. Contrast<strong>in</strong>g this however is 60% <strong>of</strong> <strong>the</strong> households with children fall<strong>in</strong>g under <strong>the</strong> ‘<strong>poor</strong>’ child IDDS<br />
threshold, and <strong>the</strong> rema<strong>in</strong><strong>in</strong>g 40% as ‘borderl<strong>in</strong>e’. The HFIAS score was 13.2, <strong>the</strong> highest <strong>of</strong> all groups. Some<br />
frequency <strong>of</strong> anxiety and uncerta<strong>in</strong>ty as well as <strong>in</strong>suf cient food quality was felt by 85% <strong>of</strong> households, <strong>the</strong><br />
second highest and second lowest values <strong>of</strong> all groups, respectively. 95% <strong>of</strong> respondent households also<br />
claimed <strong>in</strong>suf cient food <strong>in</strong>take at equal frequency proportions. Non-<strong>poor</strong> casual labourers were <strong>the</strong> only group<br />
<strong>in</strong> <strong>the</strong>se calculations that had a respondent listed <strong>in</strong> <strong>the</strong> ‘food secure’ category <strong>of</strong> severity and prevalence,<br />
though 84% rema<strong>in</strong>ed as severely <strong>in</strong>secure and <strong>the</strong> residual 11% moderately so.<br />
Non-<strong>poor</strong> casual labourers claimed <strong>the</strong> lowest proportion <strong>of</strong> sell<strong>in</strong>g non-productive assets and <strong>the</strong> second<br />
lowest proportion <strong>of</strong> productive assets <strong>of</strong> all groups, suggest<strong>in</strong>g sell<strong>in</strong>g <strong>of</strong>f assets to compensate for lack <strong>of</strong><br />
money is not a common mechanism for this group. This be<strong>in</strong>g said, <strong>the</strong> <strong>in</strong>dex score for this group was 9.8 (mean<br />
10.9). This is <strong>in</strong> uenced by <strong>the</strong> 42% <strong>of</strong> households hav<strong>in</strong>g claimed send<strong>in</strong>g a family member away to beg <strong>in</strong> <strong>the</strong><br />
last month at least once, which is <strong>the</strong> highest weighted category <strong>of</strong> <strong>the</strong> six <strong>in</strong>dex <strong>in</strong>dicators.<br />
Hazards and Vulnerability Context<br />
57
58<br />
Like <strong>the</strong>ir <strong>poor</strong> counterparts, <strong>the</strong> ma<strong>in</strong> hazard is <strong>the</strong> uncerta<strong>in</strong>ty <strong>of</strong> <strong>in</strong>come. The difference arises <strong>in</strong> <strong>the</strong>ir<br />
expenditure levels with <strong>the</strong>ir median food expenditure at 1300 UShs per person, one and a half times larger<br />
than <strong>the</strong> limit imposed by <strong>the</strong> CBN l<strong>in</strong>e. This suggests a safety net <strong>in</strong> terms <strong>of</strong> food expenditure, <strong>in</strong> that <strong>the</strong><br />
<strong>poor</strong> casual labourers are surviv<strong>in</strong>g on less than half, although accord<strong>in</strong>g to <strong>the</strong> poverty l<strong>in</strong>e, this expense level<br />
registers as food <strong>in</strong>secure.<br />
Additionally, high levels <strong>of</strong> debt repayments lead to higher nancial <strong>in</strong>security, compound<strong>in</strong>g <strong>the</strong> negative<br />
effects <strong>of</strong> casual labour as a primary <strong>in</strong>come source.<br />
5.4.2.3 Petty Traders/Street Vendors<br />
The strik<strong>in</strong>g majority <strong>of</strong> those who were characterized as petty traders/street vendors were <strong>in</strong> <strong>the</strong> middle and<br />
better <strong>of</strong>f wealth groups. Compris<strong>in</strong>g ano<strong>the</strong>r third <strong>of</strong> <strong>the</strong> respondents, all but 16% (four respondents) were<br />
classi ed as above <strong>the</strong> CBN limit.<br />
Demographics and Asset Capitals<br />
This group represents <strong>the</strong> lowest proportion <strong>of</strong><br />
respondents who have changed <strong>the</strong>ir type <strong>of</strong> work<br />
s<strong>in</strong>ce mov<strong>in</strong>g to <strong>Kampala</strong>, only 19%. Only 16% <strong>of</strong> <strong>the</strong><br />
migrants <strong>of</strong> this group have been <strong>in</strong> <strong>Kampala</strong> less than<br />
6 years, though it boasts <strong>the</strong> highest proportion (nearly<br />
one quarter) which were non-migrants and born with<strong>in</strong><br />
<strong>the</strong> district.<br />
Petty traders claimed 100% membership <strong>of</strong> a social<br />
or community group, with 56% receiv<strong>in</strong>g at least one<br />
form <strong>of</strong> support such as cash, remittances and food.<br />
These primarily came from family and friends, but also<br />
from NGOs and <strong>the</strong>ir community or sav<strong>in</strong>gs groups.<br />
Physical capital is <strong>the</strong> second highest <strong>of</strong> all <strong>the</strong> groups,<br />
yet due to low percentages <strong>of</strong> residence ownership<br />
and latr<strong>in</strong>es <strong>in</strong> <strong>the</strong> house, this rema<strong>in</strong>s relatively low.<br />
Natural capital rema<strong>in</strong>s low due to low usage <strong>of</strong> water<br />
from wells, though this was <strong>the</strong> only o<strong>the</strong>r group to<br />
claim food from <strong>urban</strong> farm<strong>in</strong>g.<br />
Expenses<br />
Transportation makes up <strong>the</strong> highest median<br />
expenditure for this group, which is expected as<br />
people that are trad<strong>in</strong>g may need to be able to move<br />
to collect <strong>the</strong>ir products and as well to nd customers.<br />
Many <strong>of</strong> <strong>the</strong> petty traders do <strong>the</strong>ir bus<strong>in</strong>ess by walk<strong>in</strong>g<br />
<strong>in</strong> an area and hawk<strong>in</strong>g <strong>the</strong>ir goods, ra<strong>the</strong>r than sitt<strong>in</strong>g
<strong>in</strong> one spot and wait<strong>in</strong>g for customers to come to <strong>the</strong>m. Types <strong>of</strong> fuel were not differentiated <strong>in</strong> <strong>the</strong> questionnaire,<br />
thus <strong>the</strong> fact that fuel is second highest expenditure could imply charcoal use for sell<strong>in</strong>g street food, or petrol<br />
costs for transportation. The total median daily expenses for this group are 6550 UShs. Rent is once aga<strong>in</strong> <strong>the</strong><br />
highest monthly cost, with education be<strong>in</strong>g <strong>the</strong> highest cost <strong>in</strong> <strong>the</strong> ‘o<strong>the</strong>r’ category.<br />
Activity Pro les<br />
Two activity pro les are listed for this group as two different<br />
types <strong>of</strong> vendor are presented. One owns and lives <strong>in</strong> his shop<br />
<strong>in</strong> Namuwongo slum, and <strong>the</strong> o<strong>the</strong>r sells second hand shoes on<br />
a blanket next to <strong>the</strong> railroad tracks that demarcate <strong>the</strong> old slum<br />
area from <strong>the</strong> new one.<br />
The shoe saleswoman’s activities are largely <strong>in</strong> uenced by <strong>the</strong><br />
wea<strong>the</strong>r. As she works on a footpath on an uncovered parcel<br />
whose location can change daily, any ra<strong>in</strong> can prevent her from<br />
do<strong>in</strong>g bus<strong>in</strong>ess which can have high consequences dur<strong>in</strong>g<br />
<strong>the</strong> two ra<strong>in</strong>y seasons. She works 12 hours per day and shares<br />
lunch and d<strong>in</strong>ner with <strong>the</strong> o<strong>the</strong>r vendors along <strong>the</strong> footpath.<br />
The shop owner lives <strong>in</strong> a house that is attached to <strong>the</strong> shop. This allows him to stay at work longer, but also<br />
have <strong>the</strong> conveniences <strong>of</strong> eat<strong>in</strong>g at home with his family. He leaves <strong>the</strong> shop for 3 hours every Wednesday to<br />
go to <strong>the</strong> larger Ow<strong>in</strong>o or Nakasero markets to re-stock on <strong>in</strong>ventory.<br />
Food Security and Cop<strong>in</strong>g Mechanisms<br />
Petty traders and street vendors had overall <strong>the</strong> highest<br />
proportion <strong>of</strong> respondents <strong>in</strong> positive food security classi cations<br />
accord<strong>in</strong>g to <strong>the</strong> <strong>in</strong>dicators. This group had <strong>the</strong> highest<br />
proportion (72%) <strong>in</strong> <strong>the</strong> acceptable range <strong>of</strong> food consumption<br />
scores. Additionally, only 68% or so were labelled <strong>in</strong> <strong>the</strong> <strong>poor</strong><br />
group<strong>in</strong>g <strong>of</strong> child IDDS, with <strong>the</strong> second highest percentage<br />
(7%) <strong>in</strong> <strong>the</strong> acceptable bracket <strong>of</strong> all groups. This group had <strong>the</strong><br />
lowest HFIAS score at 9.1 (mean 11.2). Likewise, this group ahd<br />
<strong>the</strong> lowest proportion <strong>of</strong> respondents claim<strong>in</strong>g any frequency <strong>of</strong><br />
anxiety or uncerta<strong>in</strong>ty <strong>of</strong> food (40%), <strong>in</strong>suf cient food quality (75%), and <strong>in</strong>suf cient food <strong>in</strong>take (65%).When<br />
consider<strong>in</strong>g severity and prevalence, petty traders/street vendors had <strong>the</strong> lowest proportion <strong>of</strong> all groups fall<strong>in</strong>g<br />
<strong>in</strong>to severe food <strong>in</strong>security (70%).<br />
Petty traders/street vendors held to <strong>the</strong> mean <strong>in</strong> terms <strong>of</strong> <strong>the</strong> modi ed cop<strong>in</strong>g strategies <strong>in</strong>dex at 10.9. The<br />
mechanism most <strong>of</strong>ten cited was ‘reduc<strong>in</strong>g all expenses’ at 78%. They also held <strong>the</strong> second highest rate <strong>of</strong><br />
send<strong>in</strong>g a family member away to beg at 45% <strong>of</strong> respondents. Like <strong>the</strong> non-<strong>poor</strong> casual labourers, <strong>the</strong>re were<br />
not high <strong>in</strong>stances <strong>of</strong> sell<strong>in</strong>g non-productive (21%) or productive assets (11%).<br />
59
60<br />
Hazards and Vulnerability Context<br />
Be<strong>in</strong>g <strong>in</strong> an <strong>urban</strong> sett<strong>in</strong>g, as cash is <strong>the</strong> primary means to acheiv<strong>in</strong>g livelihood objectives, <strong>in</strong>come once aga<strong>in</strong><br />
plays <strong>the</strong> most important role. Hazards that can directly affect <strong>the</strong> petty traders’ <strong>in</strong>comes can be considered<br />
that which would lessen <strong>the</strong>ir customer base such as <strong>in</strong>clement wea<strong>the</strong>r.<br />
Food vendors may be more subject to seasonal production <strong>of</strong> crops and <strong>the</strong> resultant price uctuations. Hazards<br />
may also come <strong>in</strong> <strong>the</strong> form <strong>of</strong> a short supply <strong>of</strong> a particular commodity <strong>in</strong> <strong>the</strong> city, though this is rare. More likely,<br />
price shifts throughout <strong>the</strong> year as noted by <strong>the</strong> price <strong>in</strong>dex may have a larger impact.<br />
For those who utilise a large amount <strong>of</strong> transport, <strong>the</strong>y may be more vulnerable to uctuations <strong>in</strong> petrol costs. As<br />
a large proportion <strong>of</strong> this group are food vendors, <strong>the</strong>y seem to be less susceptible to food <strong>in</strong>security accord<strong>in</strong>g<br />
to <strong>the</strong> <strong>in</strong>dicators. Most food vendors claimed multiple products to adapt to seasonality.<br />
5.4.2.4 Vocation/Services<br />
Vocation or services require a skill that is learned or materials that are not necessarily available to <strong>the</strong> general<br />
population. These respondents were limited <strong>in</strong> numbers, however were represented <strong>in</strong> each <strong>of</strong> <strong>the</strong> wealth<br />
groups, so separation based by expenditure levels was not needed.<br />
Demographics and Asset Capitals<br />
This group had <strong>the</strong> highest education expenses, yet<br />
<strong>in</strong>terest<strong>in</strong>gly also claimed <strong>the</strong> highest proportion <strong>of</strong><br />
children not attend<strong>in</strong>g school (7 <strong>of</strong> 10 respondents<br />
with school aged-children) with about half reason<strong>in</strong>g<br />
that school fees are too high. A household may put<br />
higher value on hav<strong>in</strong>g a trade, skill, or education<br />
and <strong>the</strong>refore spends more money on tra<strong>in</strong><strong>in</strong>g for<br />
<strong>the</strong>ir children. Likewise, <strong>the</strong> children may be work<strong>in</strong>g<br />
alongside <strong>the</strong> primary <strong>in</strong>come earners, though no<br />
households claimed this reason<strong>in</strong>g for not send<strong>in</strong>g<br />
children to school. Natural capital is <strong>the</strong> lowest <strong>of</strong> all<br />
<strong>the</strong> groups, and this is display<strong>in</strong>g <strong>the</strong> lowest water<br />
usage rate from wells <strong>of</strong> all <strong>the</strong> groups, as well as no<br />
food sourced from <strong>urban</strong> farm<strong>in</strong>g.<br />
Expenses<br />
The largest variation by far for this group<strong>in</strong>g is fuel. The boxplot was scaled to 10000 UShs to allow for<br />
comparisons, though it should be noted that <strong>the</strong> maximum fuel use for this group topped out at 25000 UShs/<br />
day.<br />
The highest median expense, transportation, may be related to <strong>the</strong> variation <strong>in</strong> fuel costs. Average daily<br />
expenditure for this group was 9520 UShs, <strong>the</strong> highest <strong>of</strong> all groups. Rent had <strong>the</strong> lowest median <strong>of</strong> all <strong>the</strong><br />
groups <strong>in</strong> terms <strong>of</strong> monthly expenditure.
Activity Pro le<br />
The activity pro le for this group is demonstrated by a<br />
man who was mak<strong>in</strong>g small oil lamps from discarded<br />
alum<strong>in</strong>ium food cans. The man works all week long and<br />
has a fairly normal schedule, work<strong>in</strong>g 11 hours per day<br />
mak<strong>in</strong>g <strong>the</strong> small lamps at his workshop area which<br />
is 500 meters from his home. He is not married and<br />
prepares supper and breakfast for himself, though he<br />
pays children to fetch lunch for him while he is work<strong>in</strong>g.<br />
Food Security and Cop<strong>in</strong>g Mechanisms<br />
The respondents <strong>in</strong> <strong>the</strong> Vocation/Service groups had<br />
<strong>the</strong> second highest proportion <strong>in</strong> <strong>the</strong> ‘acceptable’<br />
range <strong>of</strong> food consumption scores at nearly 70%.<br />
Likewise, <strong>the</strong>y had <strong>the</strong> second lowest proportion <strong>in</strong> <strong>the</strong><br />
‘<strong>poor</strong>’ range at 15%. This group claimed <strong>the</strong> highest proportion <strong>of</strong> children (10%) <strong>in</strong> <strong>the</strong> ‘acceptable’ range <strong>of</strong><br />
IDDS and <strong>the</strong> lowest number categorised as ‘<strong>poor</strong>’ (just under 60%). In contrast to <strong>the</strong>se <strong>in</strong>dicators, severely<br />
food <strong>in</strong>secure described 92% <strong>of</strong> <strong>the</strong> population <strong>of</strong> respondents, with <strong>the</strong> rema<strong>in</strong><strong>in</strong>g 8% as moderately so. This<br />
group also claimed <strong>the</strong> second highest HFIAS score <strong>of</strong> 12.9. Additionally, over 90% <strong>of</strong> all vocation/service<br />
respondents claimed at least 1 <strong>in</strong>stance <strong>of</strong> anxiety and uncerta<strong>in</strong>ty <strong>of</strong> food, <strong>in</strong>suf cient quality, and <strong>in</strong>suf cient<br />
<strong>in</strong>take <strong>in</strong> <strong>the</strong> last 30 days.<br />
Vocation/Service respondents claimed <strong>the</strong> lowest proportion <strong>of</strong> send<strong>in</strong>g a family member away to beg at only<br />
8%. They did claim <strong>the</strong> second highest percentage <strong>of</strong> respondent household who had reduced all expenses<br />
at least once <strong>in</strong> <strong>the</strong> previous month. The <strong>in</strong>dex score gured for this group was at 10.25 which is just below <strong>the</strong><br />
mean.<br />
5.4.2.5 Quali ed Salary<br />
Hazards<br />
Hazards and shocks are evidently related with fuel. This<br />
may come <strong>in</strong> <strong>the</strong> form <strong>of</strong> oil prices, price <strong>of</strong> charcoal, or<br />
price <strong>of</strong> paraf n (<strong>the</strong> ma<strong>in</strong> fuel used for light<strong>in</strong>g <strong>in</strong>side a<br />
house when electricity is not present). If <strong>the</strong> <strong>in</strong>dividual<br />
uses transportation to sell <strong>the</strong>ir goods at major markets<br />
where, as evidenced earlier, food is notably cheaper,<br />
<strong>the</strong> <strong>in</strong>dividual may be forced to pay more for food at a<br />
smaller market if transportation costs rise to prohibitive<br />
levels.<br />
Salary positions that require a quali cation, whe<strong>the</strong>r it be formal education or tra<strong>in</strong><strong>in</strong>g, are considered ano<strong>the</strong>r<br />
group. These are generally represented by <strong>the</strong> ‘Better <strong>of</strong>f’ groups as well as those <strong>in</strong> <strong>the</strong> higher strata <strong>of</strong><br />
61
62<br />
‘Middle’ groups. These positions are listed exclusively<br />
as positions funded by <strong>the</strong> public sector, such as<br />
nurses, teachers and law enforcement. Quali ed<br />
Salaried households represent <strong>the</strong> smallest portion<br />
<strong>of</strong> respondents. This group represents <strong>the</strong> highest<br />
proportion <strong>of</strong> migrants who come from an <strong>urban</strong> area,<br />
though admittedly it is only 20%.<br />
Demographics and Asset Capitals<br />
Quali ed salaried households claim <strong>the</strong> highest social<br />
capital due to <strong>the</strong>ir high membership <strong>of</strong> community<br />
groups, <strong>the</strong> highest human capital due to <strong>the</strong> highest<br />
amount <strong>of</strong> children attend<strong>in</strong>g school and <strong>the</strong> second<br />
highest access to health care, <strong>the</strong> highest nancial<br />
capital due to <strong>the</strong>ir low expense to <strong>in</strong>come ratio and <strong>the</strong>ir low debt to <strong>in</strong>come ratio, and <strong>the</strong> highest physical<br />
capital because <strong>of</strong> <strong>the</strong>ir residential ownership, access to tap water, and hav<strong>in</strong>g toilets <strong>in</strong> <strong>the</strong> house. They do<br />
claim <strong>the</strong> second lowest natural capital due to non-use <strong>of</strong> public wells nor <strong>urban</strong> farm<strong>in</strong>g.<br />
This group claims <strong>the</strong> highest proportion <strong>of</strong> households that are owners <strong>of</strong> ei<strong>the</strong>r <strong>the</strong> land or <strong>the</strong> structure. It is<br />
plausible that ownership <strong>of</strong> one or both <strong>of</strong> <strong>the</strong>se assets reduces <strong>the</strong> amount <strong>of</strong> expenditure on rent, as rent is<br />
<strong>the</strong> second lowest <strong>of</strong> all <strong>the</strong> groups. As <strong>the</strong>y exert some form <strong>of</strong> ownership over <strong>the</strong>ir household, 50% have a<br />
toilet with<strong>in</strong> <strong>the</strong> household, compared to <strong>the</strong> entire sample population which only claims 20% toilet ownership.<br />
Expenses<br />
The quali ed salary groups claims <strong>the</strong> highest cost<br />
<strong>of</strong> water per day at an average <strong>of</strong> 400 shill<strong>in</strong>gs, yet<br />
use <strong>the</strong> least amount per person at 12 litres/day. This<br />
group also boasts <strong>the</strong> highest usage rate <strong>of</strong> water from<br />
<strong>the</strong> city network (83%), <strong>in</strong> uenc<strong>in</strong>g physical capital,<br />
though this group is mostly represented by Kisenyi<br />
slum which has metered access to water.<br />
Education fees are <strong>the</strong> lowest <strong>of</strong> all groups, yet only<br />
half <strong>of</strong> this group have children attend<strong>in</strong>g school. As<br />
<strong>the</strong>re are many respondents who are teachers <strong>in</strong> this<br />
category, <strong>the</strong>re may be government subsidies on<br />
school fees for <strong>the</strong>ir children. This group was also<br />
<strong>the</strong> only group that reported a giv<strong>in</strong>g a loan to o<strong>the</strong>rs,<br />
though this is only one respondent.<br />
Food is <strong>the</strong> largest median expenditure and has <strong>the</strong> largest variation. Total median daily expenditure gures at<br />
2390 UShs per household member.
Activity Pro le<br />
The activity pro le was taken from one <strong>of</strong> <strong>the</strong> nurses<br />
at Kisugu Health Centre near Namuwongo slum. The<br />
nurse has a more rigid schedule to conform to when<br />
compared to previous groups due to <strong>the</strong> <strong>in</strong>stitutional<br />
nature <strong>of</strong> her work. She works all week long between a<br />
12-13 hour shift. In order to make time to go to church,<br />
she must come <strong>in</strong> to work early before church to<br />
compensate for <strong>the</strong> lost time, <strong>the</strong>n return to work once<br />
<strong>the</strong> service has nished.<br />
Food Security and Cop<strong>in</strong>g Mechanisms<br />
Interest<strong>in</strong>gly, despite <strong>the</strong> relative high levels and<br />
regularity <strong>of</strong> <strong>in</strong>come, expenditure and asset capital<br />
security, <strong>the</strong> food security <strong>in</strong>dicators do not show a<br />
group that is signi cantly better <strong>of</strong>f than <strong>the</strong> o<strong>the</strong>rs.<br />
The food consumption scores were directly <strong>in</strong> l<strong>in</strong>e with<br />
<strong>the</strong> averages <strong>of</strong> all groups at a 3-1-1 ratio (60% <strong>poor</strong>, 20% borderl<strong>in</strong>e, 20% acceptable). Likewise, 80% <strong>of</strong><br />
households with children have a ‘<strong>poor</strong>’ IDDS, with <strong>the</strong> rema<strong>in</strong><strong>in</strong>g 20% as ‘borderl<strong>in</strong>e’. 83% <strong>of</strong> households were<br />
noted as severely food <strong>in</strong>secure, with <strong>the</strong> rema<strong>in</strong><strong>in</strong>g 17% as moderately so and none as food secure. The<br />
HFIAS score was 10.2, just below <strong>the</strong> mean but not signi cantly so. The quali ed salary households did feel<br />
<strong>the</strong> second lowest occurrences <strong>of</strong> anxiety and uncerta<strong>in</strong>ty about food, though 100% <strong>of</strong> households felt both<br />
<strong>in</strong>suf cient quality and <strong>in</strong>take <strong>of</strong> food <strong>in</strong> <strong>the</strong> previous month.<br />
The differentiat<strong>in</strong>g factor from <strong>the</strong> food security <strong>in</strong>dicators however, is that quali ed salary households have<br />
<strong>the</strong> only cop<strong>in</strong>g strategies score that is notably less than <strong>the</strong> mean at 6.7. This is mostly because none <strong>of</strong> <strong>the</strong><br />
respondents <strong>in</strong>dicated for any <strong>of</strong> <strong>the</strong> <strong>in</strong>dex measures that <strong>the</strong>y have experienced <strong>the</strong>m ‘<strong>of</strong>ten’ <strong>in</strong> <strong>the</strong> previous<br />
month. Additionally, <strong>the</strong> only <strong>in</strong>dex measure that was above 33% <strong>of</strong> respondents was <strong>the</strong> cop<strong>in</strong>g strategy <strong>of</strong><br />
reduc<strong>in</strong>g all expenses at 83% do<strong>in</strong>g so at least once <strong>in</strong> <strong>the</strong> previous month.<br />
Hazards and Vulnerability Context<br />
Hav<strong>in</strong>g a salaried <strong>in</strong>come, this group is less vulnerable to <strong>the</strong> daily uncerta<strong>in</strong>ty that comes with casual or less<br />
formal <strong>in</strong>come sources. Hazards still exist <strong>in</strong> that those who are employed by <strong>the</strong> government will be subject to<br />
shifts <strong>in</strong> policy to <strong>the</strong> degree that it may alter <strong>the</strong>ir job and <strong>in</strong>come security. Vulnerabilities to price shocks still<br />
exist, though to a lesser extent than <strong>the</strong> o<strong>the</strong>r pro les.<br />
5.4.2.6 Non-Quali ed Salary<br />
Non-Quali ed Salary households are employed by ei<strong>the</strong>r <strong>the</strong> public or private sector. Speci c positions <strong>in</strong>clude<br />
street sweepers, rubbish collectors and security guards. This represents <strong>the</strong> second smallest group<strong>in</strong>g <strong>of</strong><br />
respondents. Most <strong>in</strong>cluded <strong>in</strong> this group were <strong>in</strong> <strong>the</strong> ‘middle’ and ‘better <strong>of</strong>f’ wealth group<strong>in</strong>gs.<br />
63
64<br />
Demographics and Asset Capitals<br />
This group represents <strong>the</strong> highest proportion <strong>of</strong> migrants<br />
that come from a rural area at 90% <strong>of</strong> respondents,<br />
suggest<strong>in</strong>g ease <strong>of</strong> adaptation from rural to <strong>urban</strong><br />
employment, despite 86% <strong>of</strong> respondents say<strong>in</strong>g<br />
<strong>the</strong>y have changed <strong>the</strong>ir type <strong>of</strong> work s<strong>in</strong>ce com<strong>in</strong>g<br />
to <strong>Kampala</strong>. Reasons vary from a lack <strong>of</strong> capital to<br />
re-open a shop that <strong>the</strong>y used to operate, to no land<br />
to cont<strong>in</strong>ue agricultural activities, to a former teacher<br />
and current NSDF sav<strong>in</strong>gs group collector say<strong>in</strong>g that<br />
a teacher’s salary (reported as approximately 8000<br />
UShs/day) is too low to live on <strong>in</strong> <strong>Kampala</strong>. 66% have<br />
lived <strong>in</strong> <strong>Kampala</strong> for longer than 7 years, and 22% <strong>of</strong><br />
<strong>the</strong> respondents were non-migrants who were born with<strong>in</strong> <strong>the</strong> district.<br />
Non quali ed salary households hold <strong>the</strong> title <strong>of</strong> <strong>the</strong> highest median use <strong>of</strong> water per day per person at 25<br />
litres, and <strong>the</strong> second highest expense on water at 150UShs/person/.day. This group also claims <strong>the</strong> best<br />
accessibility to healthcare, with only 22% claim<strong>in</strong>g <strong>in</strong>suf cient access to health services. This group claims <strong>the</strong><br />
second-lowest nancial capital, primarily due to hav<strong>in</strong>g <strong>the</strong> highest debt/<strong>in</strong>come and second highest expense/<br />
<strong>in</strong>come ratio.<br />
Expenses<br />
Food was <strong>the</strong> highest expenditure <strong>in</strong> this group,<br />
averag<strong>in</strong>g nearly 2700 UShs per day, though<br />
transportation claim<strong>in</strong>g a higher median value (1750<br />
to 1110 UShs). Total median daily expenditure was<br />
calculated at 4040 UShs per day per household<br />
member. Rent gures cont<strong>in</strong>ue <strong>the</strong> trend <strong>of</strong> be<strong>in</strong>g <strong>the</strong><br />
highest median monthly cost.<br />
Activity Pro le<br />
The activity pro le represent<strong>in</strong>g this group is from<br />
a security guard who was return<strong>in</strong>g from work <strong>in</strong><br />
Namuwongo slum. At only 8 hours per day, <strong>the</strong> guard<br />
claims <strong>the</strong> least amount <strong>of</strong> hours worked <strong>of</strong> all <strong>the</strong> pro les. The pro le shows that <strong>the</strong>re is a signi cant more<br />
amount <strong>of</strong> time for leisure time between work and go<strong>in</strong>g to bed for <strong>the</strong> day, with time to go to church on Sundays<br />
as well.<br />
Food Security and Cop<strong>in</strong>g Mechanisms<br />
The non-quali ed salary worker pro le has <strong>the</strong> second highest amount <strong>of</strong> respondents with an FCS <strong>in</strong> <strong>the</strong><br />
‘acceptable’ range at 65%, while also hav<strong>in</strong>g <strong>the</strong> second highest amount <strong>in</strong> <strong>the</strong> ‘<strong>poor</strong>’ bracket, second to <strong>the</strong><br />
<strong>poor</strong> casual labourers. They also have <strong>the</strong> second highest proportion <strong>of</strong> respondents labelled as severely<br />
food <strong>in</strong>secure at 88%, with <strong>the</strong> rema<strong>in</strong><strong>in</strong>g 12% classi ed a moderately food <strong>in</strong>secure. The non-quali ed salary
households have an HFIAS score <strong>of</strong> 12.5, a full po<strong>in</strong>t<br />
above <strong>the</strong> mean, though only <strong>the</strong> third highest <strong>of</strong> all<br />
groups. This pro le fell <strong>in</strong>to <strong>the</strong> middle <strong>of</strong> <strong>the</strong> pack <strong>of</strong> all<br />
<strong>the</strong> groups concern<strong>in</strong>g anxiety and uncerta<strong>in</strong>ty about<br />
food supply, though touted <strong>the</strong> highest proportion <strong>of</strong><br />
households claim<strong>in</strong>g <strong>in</strong>suf cient quality at <strong>the</strong> ‘<strong>of</strong>ten’<br />
frequency. It was also <strong>the</strong> only o<strong>the</strong>r group beside<br />
quali ed salary to have 100% <strong>of</strong> all respondents claim<br />
<strong>in</strong>suf cient food <strong>in</strong>take at least once <strong>in</strong> <strong>the</strong> previous<br />
month.<br />
The households with<strong>in</strong> this pro le claim a modi ed<br />
cop<strong>in</strong>g <strong>in</strong>dex score which is slightly above <strong>the</strong> mean<br />
at 10.4. The most common strategies <strong>in</strong>dicated were tak<strong>in</strong>g on new debt and reduc<strong>in</strong>g all expenses with 63%<br />
<strong>of</strong> respondents claim<strong>in</strong>g so. This pro le did claim <strong>the</strong> highest proportion <strong>of</strong> households who had sold nonproductive<br />
assets at 50%, and <strong>the</strong> second lowest <strong>of</strong> send<strong>in</strong>g a family member to beg at 25%.<br />
Hazards and Vulnerability Context<br />
Once aga<strong>in</strong> <strong>the</strong> salaried groups are less prone to variation <strong>in</strong> <strong>the</strong>ir daily <strong>in</strong>comes; however <strong>the</strong>y are more at risk<br />
to <strong>the</strong> whim <strong>of</strong> <strong>the</strong>ir employer. The vulnerability comes with <strong>the</strong> low median <strong>in</strong>comes, as fur<strong>the</strong>r described by<br />
<strong>the</strong> high debt to <strong>in</strong>come ratio.<br />
Long work<strong>in</strong>g hours may have negative affects on one’s health as well as similarly negative affects on social<br />
capital. The unavailability <strong>of</strong> <strong>the</strong> <strong>in</strong>dividual to partake <strong>in</strong> regualr social avctivities such as church, leisure activities,<br />
or spend<strong>in</strong>g time with friends and family may impede <strong>the</strong> development <strong>of</strong> social safety nets should <strong>the</strong> need for<br />
<strong>the</strong>m arise.<br />
Additionally, any shock that may affect <strong>the</strong> availability or access to water may have an impact on ei<strong>the</strong>r water<br />
usage or expenses.<br />
65
66<br />
Discussion<br />
The results section <strong>of</strong> this report displayed<br />
nd<strong>in</strong>gs <strong>in</strong> three manners, at a global level<br />
which concerns policies, organisations and key<br />
actors who <strong>in</strong> uence <strong>livelihoods</strong> <strong>in</strong> <strong>the</strong> slums as an<br />
outside force; at a community level which considers<br />
<strong>the</strong> population <strong>of</strong> respondents both as a whole and<br />
disaggregated to consider each area’s unique context;<br />
and at <strong>the</strong> level <strong>of</strong> households while consider<strong>in</strong>g <strong>the</strong>ir<br />
livelihood strategies for a different perspective <strong>of</strong><br />
context and a more holistic analysis.<br />
The patterns identi ed <strong>in</strong> each <strong>of</strong> <strong>the</strong>se sections<br />
represent signi cant issues that affect <strong>the</strong> susta<strong>in</strong>ability<br />
<strong>of</strong> <strong>the</strong> <strong>livelihoods</strong> <strong>of</strong> <strong>the</strong> slum dwellers. In this manner,<br />
<strong>the</strong> issues are highlighted as possible areas for future<br />
programm<strong>in</strong>g.<br />
6.1<br />
Global Level<br />
Key actors that have direct <strong>in</strong> uence over life <strong>in</strong> <strong>the</strong><br />
slums <strong>of</strong> <strong>Kampala</strong> but do not necessarily live <strong>in</strong> <strong>the</strong><br />
slums <strong>the</strong>mselves nor perform direct programm<strong>in</strong>g <strong>in</strong><br />
<strong>the</strong> areas are typically policy makers at a government<br />
level. This <strong>in</strong>vestigation <strong>in</strong>cluded <strong>in</strong>formation given by<br />
many M<strong>in</strong>istries <strong>of</strong> <strong>the</strong> Government <strong>of</strong> <strong>Uganda</strong> which<br />
provide coord<strong>in</strong>ation and support services to CBOs<br />
and local NGOs who do deliver programm<strong>in</strong>g <strong>in</strong> <strong>the</strong><br />
slums.<br />
The issues identi ed by <strong>the</strong>se actors can be<br />
considered transversal, <strong>in</strong> that shifts <strong>in</strong> macro-level el l<br />
policy can affect not just slum-dwellers, but also any<br />
number <strong>of</strong> o<strong>the</strong>r possible groups (i.e. money for slum<br />
projects can be raised <strong>in</strong> <strong>the</strong> national or local budgets,<br />
though <strong>the</strong> money to pay for such shifts may be taken<br />
from o<strong>the</strong>r programmes). The level <strong>of</strong> impact <strong>of</strong> <strong>the</strong>se<br />
decisions and resultant shifts <strong>in</strong> programm<strong>in</strong>g direction<br />
are potentially widespread and need to be considered<br />
carefully by those who form policies.<br />
6.1.1 Census and Statistics <strong>of</strong> Slums and<br />
Their Residents<br />
The lack <strong>of</strong> statistics at a government level needs to<br />
be improved to properly address <strong>the</strong> issues faced by<br />
<strong>the</strong> slum populace. The gap <strong>in</strong> knowledge <strong>of</strong> even <strong>the</strong><br />
most basic components <strong>of</strong> a census such as number<br />
<strong>of</strong> households or population yields an <strong>in</strong>consistent<br />
and ultimately <strong>in</strong>coherent viewpo<strong>in</strong>t <strong>of</strong> <strong>the</strong> dynamics<br />
<strong>of</strong> slum life.<br />
Statistics that <strong>in</strong>deed do exist to describe <strong>the</strong> <strong>poor</strong> <strong>in</strong><br />
<strong>Kampala</strong> do not re ect <strong>the</strong> <strong>in</strong>formation given by NGOs<br />
and UN organisations that have done <strong>in</strong>dependent<br />
studies, much less <strong>the</strong> nd<strong>in</strong>gs <strong>in</strong> this report (given<br />
that this report was not meant to represent <strong>the</strong> entire<br />
slum populace). Information such as number under <strong>the</strong><br />
poverty l<strong>in</strong>e, distribution <strong>of</strong> wealth <strong>in</strong> <strong>the</strong> district, and<br />
number <strong>of</strong> members <strong>of</strong> household per rooms <strong>in</strong> a house<br />
are ei<strong>the</strong>r lack<strong>in</strong>g or mislead<strong>in</strong>g as <strong>the</strong>y compare <strong>the</strong><br />
entire population <strong>of</strong> <strong>Kampala</strong> (not just slum dwellers)<br />
to <strong>the</strong> national stage. This <strong>in</strong>formation needs to be
disaggregated for slum dwellers and o<strong>the</strong>r groups <strong>of</strong><br />
<strong>urban</strong> <strong>poor</strong> to properly identify and ultimately monitor<br />
issues over a long term that are addressed <strong>in</strong> <strong>the</strong> NHS<br />
and DHS when <strong>the</strong>y are performed.<br />
Obviously it is not feasible to do this dur<strong>in</strong>g <strong>the</strong> NHS<br />
and DHS studies at <strong>the</strong>ir current capacities; however<br />
a comprehensive basel<strong>in</strong>e study <strong>of</strong> all slum areas<br />
<strong>in</strong> <strong>Kampala</strong> funded and/or adm<strong>in</strong>istered by <strong>the</strong><br />
government which focuses on <strong>the</strong>se populations is a<br />
necessary rst step toward acknowledgement <strong>of</strong> <strong>the</strong>ir<br />
<strong>in</strong>habitants and effective policy and programm<strong>in</strong>g<br />
target<strong>in</strong>g <strong>the</strong> betterment <strong>of</strong> <strong>the</strong> slums.<br />
6.1.2 Land Tenure<br />
An issue that has attempted to be addressed <strong>in</strong><br />
<strong>the</strong> past by government is that <strong>of</strong> land tenure and<br />
plann<strong>in</strong>g. Though <strong>the</strong> government has made <strong>in</strong>roads<br />
toward a system <strong>of</strong> land ownership and property<br />
rights that is both more simpli ed and accessible for<br />
<strong>the</strong> <strong>poor</strong> <strong>in</strong> <strong>the</strong> past, <strong>the</strong>re is still more that can be<br />
done. Fear <strong>of</strong> eviction at any moment is pervasive<br />
and poses a cont<strong>in</strong>uous threat to those <strong>in</strong> <strong>the</strong> slum<br />
areas. For example, a resident may face eviction even<br />
if <strong>the</strong>y have paid rent once <strong>the</strong>ir landlord decides to<br />
sell <strong>the</strong> plot to developers; if <strong>the</strong> district government<br />
decides that a slum area is too close to ma<strong>in</strong> roads or<br />
condemns <strong>the</strong> construction <strong>of</strong> <strong>the</strong> houses and shops;<br />
or if <strong>the</strong> national government enacts a policy to fur<strong>the</strong>r<br />
develop public lands with<strong>in</strong> <strong>the</strong> city that may impact<br />
<strong>livelihoods</strong> by limit<strong>in</strong>g resources or opportunities such<br />
as <strong>urban</strong> farm<strong>in</strong>g. The lack <strong>of</strong> <strong>in</strong>suf cient <strong>of</strong> cial land<br />
title or certa<strong>in</strong> guarantee <strong>of</strong> residence for <strong>the</strong> renters,<br />
or legal perpetuity <strong>of</strong> ownership for <strong>the</strong> landlords <strong>in</strong><br />
some <strong>in</strong>stances <strong>of</strong>fers large areas for improvement.<br />
Once a more certa<strong>in</strong> and direct land tenure structure<br />
can be realised, <strong>the</strong> residents <strong>of</strong> <strong>the</strong> slums may be<br />
more <strong>in</strong>cl<strong>in</strong>ed to <strong>in</strong>vest <strong>in</strong> <strong>the</strong>ir own community. These<br />
<strong>in</strong>vestments may come <strong>in</strong> <strong>the</strong> form <strong>of</strong> community<br />
gardens, groups <strong>of</strong> people who are tra<strong>in</strong>ed to regularly<br />
ma<strong>in</strong>ta<strong>in</strong> <strong>in</strong>frastructure such as dra<strong>in</strong>s and electrical<br />
connections, sanitation committees <strong>of</strong>fer<strong>in</strong>g low-cost<br />
or free latr<strong>in</strong>es <strong>in</strong> exchange for clean<strong>in</strong>g or o<strong>the</strong>r<br />
services, or <strong>in</strong>stallation <strong>of</strong> lights above <strong>the</strong> pathways<br />
to <strong>the</strong> latr<strong>in</strong>es to lessen security risks and dim<strong>in</strong>ish use<br />
<strong>of</strong> y<strong>in</strong>g toilets, for example.<br />
This does pose dif culties however. The <strong>of</strong> cial<br />
government policy towards slum areas with<strong>in</strong> <strong>Kampala</strong><br />
is one <strong>of</strong> slum upgrad<strong>in</strong>g as laid out <strong>in</strong> <strong>the</strong> National<br />
Slum Upgrad<strong>in</strong>g Strategy and Action Plan, though<br />
to accomplish this objective it is necessary that <strong>the</strong><br />
policy makers enforce and enact <strong>the</strong>se policies as well<br />
as cont<strong>in</strong>ue to develop <strong>the</strong>m fur<strong>the</strong>r <strong>in</strong> a participatory<br />
manner, as had been done with <strong>the</strong> orig<strong>in</strong>al document.<br />
The success <strong>of</strong> slum upgrad<strong>in</strong>g <strong>in</strong> Kisenyi II parish<br />
and Namuwongo had ultimately led to a form <strong>of</strong><br />
gentri cation <strong>of</strong> <strong>the</strong>se communities. These issues were<br />
addressed by <strong>the</strong> 2008 upgrad<strong>in</strong>g policy document<br />
which acknowledged <strong>the</strong> need for tenure statute<br />
reform, though examples <strong>of</strong> slum upgrad<strong>in</strong>g to similar<br />
degrees eventuat<strong>in</strong>g after this policy document was<br />
<strong>in</strong>stituted are not currently available.<br />
It needs to be recognised <strong>of</strong> cially at a policy level<br />
that slum dwellers contribute a vital part to <strong>the</strong> city and<br />
national economy, and <strong>in</strong> some cases, contribute to<br />
<strong>the</strong> economies <strong>of</strong> o<strong>the</strong>r areas by send<strong>in</strong>g remittances<br />
to family and friends <strong>in</strong> o<strong>the</strong>r parts <strong>of</strong> <strong>the</strong> country.<br />
That is not to disregard <strong>the</strong> fact that each slum has<br />
an economy with<strong>in</strong> itself, along with multiple types <strong>of</strong><br />
<strong>livelihoods</strong> that depend on it.<br />
6.1.3 Scal<strong>in</strong>g-up Nutrition Monitor<strong>in</strong>g and<br />
Health Capacities<br />
One <strong>of</strong> <strong>the</strong> key nd<strong>in</strong>gs is that malnutrition is not<br />
explicitly viewed as a major area <strong>of</strong> concentration<br />
for government health centres <strong>in</strong> <strong>Kampala</strong>, aside<br />
from Mwanamugimu Child Nutrition Unit and <strong>the</strong><br />
ve supported health centres. Patients visit<strong>in</strong>g a<br />
government health centre that is not supported by<br />
Mwanamugimu are limited <strong>in</strong> <strong>the</strong>ir options <strong>of</strong> treat<strong>in</strong>g<br />
malnutrition to ei<strong>the</strong>r education about proper nutrition<br />
67
68<br />
or a referral to a supported centre or Mwanamugimu<br />
itself.<br />
As stated, referred patients may not follow through<br />
on <strong>the</strong> referral due to fear <strong>of</strong> a loss <strong>of</strong> <strong>in</strong>come for <strong>the</strong><br />
day or travel distance, among o<strong>the</strong>rs. Additionally,<br />
as Mwanamugimu receives patients from outside <strong>the</strong><br />
district, this data should not be seen as representative<br />
<strong>of</strong> only <strong>Kampala</strong>. These patient records from<br />
Mwanamugimu and <strong>the</strong> supported centres are <strong>the</strong> only<br />
government-sponsored data deal<strong>in</strong>g with malnutrition<br />
<strong>in</strong> <strong>Kampala</strong>.<br />
Extend<strong>in</strong>g <strong>the</strong> capacities <strong>of</strong> <strong>the</strong> supported treatment<br />
centres to <strong>the</strong> rema<strong>in</strong><strong>in</strong>g 55 health centres III and IV <strong>in</strong><br />
<strong>the</strong> district (those that could be equipped to deal with<br />
outpatient programmes) may not be economically<br />
feasible. This said, basic knowledge <strong>of</strong> malnutrition<br />
cases such as number and prevalence <strong>in</strong> an area is<br />
not available outside <strong>of</strong> those centres which already<br />
conduct programm<strong>in</strong>g.<br />
Simple recordkeep<strong>in</strong>g tasks performed by <strong>the</strong> doctor<br />
or nurse who diagnoses and/or refers malnutrition<br />
cases could be easily updated and centralised at<br />
Mwanamugimu. Information such as location <strong>of</strong><br />
residence <strong>of</strong> <strong>the</strong> <strong>in</strong>dividual and number <strong>of</strong> cases<br />
diagnosed per centre would greatly improve <strong>the</strong><br />
knowledge and <strong>the</strong> monitor<strong>in</strong>g <strong>of</strong> malnutrition <strong>in</strong><br />
<strong>Kampala</strong> <strong>in</strong>-k<strong>in</strong>d. This would allow better temporal<br />
analysis and add a spatial dimension, allow<strong>in</strong>g<br />
identi cation <strong>of</strong> malnutrition <strong>in</strong> selected areas. This<br />
extension <strong>of</strong> nutrition record keep<strong>in</strong>g and centralisation<br />
and analysis at Mwanamugimu could also be applied<br />
to o<strong>the</strong>r medical issues that have known relation to<br />
malnutrition, such as diarrhoea and HIV/AIDS.<br />
Fur<strong>the</strong>rmore, as outreach programmes are already<br />
performed <strong>in</strong> <strong>the</strong> slums by most health centres,<br />
monitor<strong>in</strong>g <strong>of</strong> child anthropometric measurements<br />
could be completed by <strong>the</strong> nurses after proper<br />
tra<strong>in</strong><strong>in</strong>g on techniques and service delivery has been<br />
performed.<br />
Health centres with a perpetual low <strong>in</strong>ventory <strong>of</strong> drugs<br />
which deters people from seek<strong>in</strong>g necessary treatment<br />
and/or spend<strong>in</strong>g unnecessarily at private pharmacies<br />
for drugs that are normally <strong>of</strong>fered for free is a health<br />
issue that is district and nation-wide. Provid<strong>in</strong>g drugs<br />
at regular <strong>in</strong>tervals <strong>in</strong> quantities that make up <strong>the</strong><br />
gap is someth<strong>in</strong>g that could lessen prevalence <strong>of</strong><br />
both illnesses and malnutrition. However, it would<br />
be potentially costly to organise supply <strong>of</strong> <strong>the</strong> drugs,<br />
logistically dif cult to coord<strong>in</strong>ate all <strong>the</strong> centres<br />
<strong>in</strong> <strong>Kampala</strong>, and ultimately unsusta<strong>in</strong>able without<br />
cont<strong>in</strong>ual fund<strong>in</strong>g.<br />
6.2<br />
Community and Area Levels<br />
There are actors that currently contribute to <strong>the</strong><br />
cont<strong>in</strong>uation and development <strong>of</strong> slums <strong>in</strong> <strong>Kampala</strong>.<br />
Both local and <strong>in</strong>ternational NGOs that have<br />
programm<strong>in</strong>g directed explicitly toward slum dwellers<br />
and/or all <strong>urban</strong> <strong>poor</strong> populations, local government<br />
agencies and <strong>of</strong> cials, local council representatives,<br />
and UN departments have all contributed or are<br />
currently contribut<strong>in</strong>g to <strong>in</strong>creas<strong>in</strong>g awareness and<br />
programm<strong>in</strong>g <strong>in</strong> <strong>the</strong> slum areas.<br />
The issues identi ed at this level are not as transversal<br />
as those implicated by policy, however <strong>the</strong>y can affect<br />
ei<strong>the</strong>r multiple or all slum areas with<strong>in</strong> <strong>Kampala</strong> with a<br />
concern<strong>in</strong>g regularity. Plann<strong>in</strong>g <strong>of</strong> projects to alleviate<br />
<strong>the</strong>se issues must take place only after proper<br />
identi cation <strong>of</strong> those areas most <strong>in</strong> need.<br />
it has been shown throughout this report that <strong>the</strong><br />
three areas contrast <strong>in</strong> as many ways as <strong>the</strong>y can be<br />
compared. The differ<strong>in</strong>g contexts amongst three slum<br />
areas that are identi ed by <strong>in</strong>stitutional actors as <strong>the</strong><br />
‘worst <strong>of</strong>f’ <strong>in</strong> <strong>Kampala</strong>, show that each area has a unique<br />
identity that has developed through demographics
and previous <strong>in</strong>terventions to name a few. Additionally,<br />
<strong>in</strong>come activities can differ widely between areas,<br />
as those found with<strong>in</strong> <strong>the</strong> areas <strong>in</strong>vestigated are well<br />
mixed, however <strong>in</strong> <strong>the</strong> case <strong>of</strong> Luzira slum which is <strong>of</strong><br />
close proximity to Murchison Bay, a large proportion <strong>of</strong><br />
<strong>in</strong>dividuals’ <strong>in</strong>ome activities center around <strong>the</strong> water,<br />
such as sh<strong>in</strong>g. <strong>Kampala</strong> be<strong>in</strong>g <strong>the</strong> large district that it<br />
is, <strong>the</strong>re are areas that are more rural and less dense,<br />
those that are less prone to ood<strong>in</strong>g, those that are<br />
less reliant on markets because <strong>of</strong> <strong>urban</strong> farm<strong>in</strong>g,<br />
and those that are pr<strong>in</strong>cipally populated by people<br />
orig<strong>in</strong>at<strong>in</strong>g from a particular area <strong>of</strong> <strong>Uganda</strong>, to name<br />
a few.<br />
All <strong>of</strong> <strong>the</strong> contexts listed above validate <strong>the</strong> need for<br />
study and target<strong>in</strong>g <strong>of</strong> each potentially vulnerable area<br />
and population, with livelihood pro les subsequently<br />
developed for each.<br />
6.2.1 Flood<strong>in</strong>g and Infrastructure<br />
One <strong>of</strong> <strong>the</strong> ma<strong>in</strong> issues raised by <strong>in</strong>terviews at<br />
<strong>in</strong>stitutional, community and <strong>in</strong>dividual levels is <strong>the</strong><br />
persistent risk <strong>of</strong> ood<strong>in</strong>g <strong>of</strong> <strong>the</strong> areas. Instant effects<br />
from ood<strong>in</strong>g can eventuate most notably dur<strong>in</strong>g <strong>the</strong><br />
ra<strong>in</strong>y season: economies can shut down as workers<br />
are unable to access <strong>the</strong>ir workplace or <strong>the</strong>ir materials<br />
are damaged by ood water, children will not go to<br />
school as <strong>the</strong> roads and alleys with<strong>in</strong> <strong>the</strong> slum become<br />
impassable, and <strong>in</strong> some <strong>in</strong>stances ash ood<strong>in</strong>g has<br />
resulted <strong>in</strong> death <strong>of</strong> young children.<br />
Longer term risks are also a factor, as ood water may<br />
spread animal or human faeces as well as rubbish,<br />
creat<strong>in</strong>g a haven <strong>of</strong> growth for disease and vectors <strong>of</strong><br />
<strong>the</strong>se diseases. Flood<strong>in</strong>g can also damage or destroy<br />
structures, as wood frames may rot and grow mould,<br />
mud walls may be washed away, and metal frames<br />
and ro<strong>of</strong>s may rust, lead<strong>in</strong>g to nancial implications<br />
along with <strong>the</strong> health consequences.<br />
One <strong>of</strong> <strong>the</strong> key <strong>in</strong>terventions <strong>of</strong> slum upgrad<strong>in</strong>g policies<br />
worldwide is <strong>the</strong> development <strong>of</strong> <strong>in</strong>frastructure. The<br />
two areas that have undergone upgrad<strong>in</strong>g projects as<br />
identi ed <strong>in</strong> this study (Kisenyi II and Namuwongo), have<br />
all had successful improvements to <strong>the</strong>ir <strong>in</strong>frastructure<br />
due to major <strong>in</strong>vestment. Improved dra<strong>in</strong>age has<br />
led to signi cantly less ood<strong>in</strong>g <strong>in</strong> <strong>the</strong> areas and as<br />
a result less exposure to <strong>the</strong> aforementioned risks.<br />
Unfortunately, <strong>the</strong>se projects were put <strong>in</strong> place without<br />
land tenure or renter protection as described <strong>in</strong> <strong>the</strong><br />
previous section, and ultimately <strong>in</strong>creased <strong>the</strong> cost <strong>of</strong><br />
liv<strong>in</strong>g <strong>in</strong> <strong>the</strong> areas and forced out those who could not<br />
afford <strong>the</strong> <strong>in</strong>creases.<br />
As stated previously, present day sees a degree<br />
<strong>of</strong> protection <strong>of</strong> land tenure after upgrad<strong>in</strong>g<br />
projects. Should <strong>the</strong>se be deemed suf cient or that<br />
o<strong>the</strong>r protections or guarantees are put <strong>in</strong> place,<br />
<strong>in</strong>frastructural improvements would alleviate to a<br />
signi cant degree <strong>the</strong> exposure to <strong>the</strong> aforementioned<br />
risks. The community-wide scale would ensure a large<br />
amount <strong>of</strong> bene ciaries and would also be one <strong>of</strong> <strong>the</strong><br />
more visible <strong>in</strong>terventions to <strong>the</strong> residents <strong>the</strong>mselves.<br />
Dif culties present <strong>the</strong>mselves <strong>in</strong> obta<strong>in</strong><strong>in</strong>g plann<strong>in</strong>g<br />
permissions for <strong>the</strong>se projects. As with any<br />
bureaucracy, <strong>the</strong> government acts as a sort <strong>of</strong> key<br />
holder to major public works projects and because<br />
<strong>of</strong> <strong>the</strong> complicated land tenure system, land owners<br />
may also need to be <strong>in</strong>cluded <strong>in</strong> <strong>the</strong> plann<strong>in</strong>g process.<br />
Areas that undergo successful upgrad<strong>in</strong>g projects<br />
will also be more attractive to those residents who<br />
live <strong>in</strong> areas which are not upgraded, possibly forc<strong>in</strong>g<br />
<strong>the</strong> cost <strong>of</strong> rent upward and/or rais<strong>in</strong>g <strong>the</strong> already<br />
egregious levels <strong>of</strong> crowd<strong>in</strong>g <strong>in</strong> <strong>the</strong>se areas.<br />
This said, major <strong>in</strong>frastructural improvements would<br />
be <strong>the</strong> ideal, but not necessarily <strong>the</strong> only option. A<br />
more economic and less politically demand<strong>in</strong>g, albeit<br />
less permanent, option presents itself <strong>in</strong> improv<strong>in</strong>g <strong>the</strong><br />
current open dra<strong>in</strong>s <strong>in</strong> <strong>the</strong> areas by plac<strong>in</strong>g ventilated<br />
concrete or wire mesh as covers. This would prevent<br />
rubbish and litter from enter<strong>in</strong>g <strong>the</strong> dra<strong>in</strong>s and clogg<strong>in</strong>g<br />
<strong>the</strong>m, lead<strong>in</strong>g to a more ef cient use <strong>of</strong> present<br />
<strong>in</strong>frastructure. Though this would not necessarily<br />
69
70<br />
account for heavy ra<strong>in</strong>falls that over ow dra<strong>in</strong>s, it may<br />
lessen <strong>the</strong> number <strong>of</strong> <strong>in</strong>stances <strong>of</strong> ood<strong>in</strong>g over <strong>the</strong><br />
course <strong>of</strong> a ra<strong>in</strong>y season.<br />
6.2.2 Rubbish<br />
Household rubbish and litter are ubiquitous throughout<br />
all <strong>of</strong> <strong>the</strong> visited slums and is a major concern for <strong>the</strong>se<br />
areas. The residents readily make and acknowledge<br />
<strong>the</strong> connection between rubbish and ood<strong>in</strong>g as<br />
mentioned <strong>in</strong> <strong>the</strong> previous section. What may not be as<br />
obvious is <strong>the</strong> connection to rubbish and disease. Aside<br />
from personal human waste, improperly disposed <strong>of</strong><br />
rubbish can become a habitat and breed<strong>in</strong>g ground<br />
for vectors <strong>of</strong> disease such as rodents and <strong>in</strong>sects.<br />
The health implications can be serious, with a number<br />
<strong>of</strong> potentially fatal diseases and illnesses already<br />
found with<strong>in</strong> <strong>the</strong> slums.<br />
Some <strong>of</strong> <strong>the</strong> <strong>in</strong>vestigated areas have rubbish collection<br />
service, <strong>of</strong> which <strong>the</strong> residents are required to pay for.<br />
Properly designated dump<strong>in</strong>g sites, as well as timely<br />
and cost-ef cient (for both <strong>the</strong> provider and <strong>the</strong> user)<br />
collection services would greatly enhance not only <strong>the</strong><br />
apparent aes<strong>the</strong>tic <strong>of</strong> <strong>the</strong> slum area to <strong>the</strong> bene ciaries,<br />
but also lessen <strong>the</strong> exposure to ood<strong>in</strong>g and diseases.<br />
6.2.3 Toilets<br />
Latr<strong>in</strong>es exist with<strong>in</strong> each <strong>of</strong> <strong>the</strong> visited slum areas,<br />
though access is limited to some <strong>of</strong> <strong>the</strong> slum residents.<br />
As non-use <strong>of</strong> toilets is predom<strong>in</strong>antly related to <strong>the</strong>ir<br />
cost, <strong>the</strong> most apparent method <strong>of</strong> improv<strong>in</strong>g access<br />
is to <strong>in</strong>tervene <strong>in</strong> costs. As <strong>the</strong>se latr<strong>in</strong>es are largely<br />
privately owned, <strong>the</strong> fees from <strong>the</strong> toilets can vary<br />
depend<strong>in</strong>g on <strong>the</strong> owner <strong>of</strong> <strong>the</strong> facility. Introduc<strong>in</strong>g free<br />
or low cost latr<strong>in</strong>es <strong>in</strong> exchange for clean<strong>in</strong>g services<br />
(cleanl<strong>in</strong>ess be<strong>in</strong>g ano<strong>the</strong>r cause <strong>of</strong> non-usage)<br />
as suggested <strong>in</strong> <strong>the</strong> land tenure section may have<br />
competitive disadvantages to <strong>the</strong> owners <strong>of</strong> <strong>the</strong>se<br />
latr<strong>in</strong>es, affect<strong>in</strong>g <strong>the</strong>ir daily <strong>in</strong>come and ultimately<br />
<strong>the</strong>ir livelihood. As it is unknown to this study if <strong>the</strong><br />
owners <strong>of</strong> <strong>the</strong>se latr<strong>in</strong>es live <strong>in</strong> <strong>the</strong> slums <strong>the</strong>mselves or<br />
not, this is an issue to be fur<strong>the</strong>r <strong>in</strong>vestigated should it<br />
be a recommended course <strong>of</strong> action.<br />
Personal security at <strong>the</strong> latr<strong>in</strong>es and on <strong>the</strong> pathways to<br />
<strong>the</strong> latr<strong>in</strong>es was also noted as a deterrent <strong>of</strong> use. While<br />
hir<strong>in</strong>g guards to protect <strong>the</strong> areas is an extreme and<br />
costly measure, more patrols by police may help ease<br />
<strong>the</strong>se fears. As <strong>the</strong> slum residents can be sceptical <strong>of</strong><br />
new people <strong>in</strong> <strong>the</strong> area, enhanc<strong>in</strong>g police presence<br />
may have a negative effect. Police are viewed<br />
suspiciously by slum residents as <strong>the</strong>y are employed<br />
by <strong>the</strong> KCCA, <strong>the</strong> <strong>in</strong>stitution most <strong>of</strong>ten associated<br />
with evictions. It would be paramount to assure <strong>the</strong><br />
residents that police are <strong>the</strong>re to heighten security<br />
as opposed to any malevolent purpose. Likewise, it<br />
would be necessary to assure that <strong>the</strong> police ma<strong>in</strong>ta<strong>in</strong><br />
this role.<br />
Additionally, an economical and less politically <strong>in</strong>volved<br />
method could be to <strong>in</strong>stall solar light<strong>in</strong>g for <strong>the</strong> areas<br />
and possibly along <strong>the</strong> pathways. Possibly deterr<strong>in</strong>g<br />
potential crim<strong>in</strong>als, <strong>the</strong> security <strong>in</strong> <strong>the</strong> area overall may<br />
be lifted and would <strong>the</strong>reby generate bene ciaries<br />
throughout <strong>the</strong> community. Theft <strong>of</strong> <strong>the</strong> lights would<br />
need to be addressed, as well as potential objections<br />
by residents whose homes are directly exposed to <strong>the</strong><br />
lights at night.<br />
6.2.4 Social Networks<br />
Social groups claim high membership rates <strong>in</strong> <strong>the</strong><br />
slums and vary between common bonds. Sav<strong>in</strong>gs<br />
groups, church groups and drama groups were all<br />
noted by <strong>the</strong> household level respondents. Develop<strong>in</strong>g<br />
on this <strong>the</strong>me, each group has a sense <strong>of</strong> community<br />
between its members. This can be seen through <strong>the</strong><br />
potential bias <strong>of</strong> NSDF enumerators adm<strong>in</strong>ister<strong>in</strong>g<br />
questionnaires to mostly o<strong>the</strong>r NSDF members. Thus,<br />
orig<strong>in</strong>ally a study limit, this bias has shown that social<br />
groups with<strong>in</strong> <strong>the</strong> slums form a sense <strong>of</strong> community.<br />
Develop<strong>in</strong>g new groups that br<strong>in</strong>g people toge<strong>the</strong>r
to work toward a common purpose, or even simply<br />
acknowledges that <strong>the</strong>y have a common bond, can<br />
give a greater sense <strong>of</strong> community and thus a greater<br />
respect for <strong>the</strong>ir community. Identify<strong>in</strong>g <strong>the</strong> possible<br />
avenues for group creation, <strong>the</strong> motivations to be<br />
part <strong>of</strong> a group, <strong>the</strong> commonalities between potential<br />
members, and <strong>the</strong> common goals to work toward<br />
may be a cumbersome and tax<strong>in</strong>g process that<br />
will eventuate to a still relatively non-representative<br />
number <strong>of</strong> participants.<br />
Form<strong>in</strong>g a community group that residents are members<br />
<strong>of</strong> just by liv<strong>in</strong>g <strong>in</strong> <strong>the</strong>ir slum, with issues identi ed at<br />
a community level and thus common goals to work<br />
toward and advocate for, can develop <strong>the</strong> sense<br />
<strong>of</strong> community even fur<strong>the</strong>r. As it stands, <strong>the</strong>re are a<br />
limited number <strong>of</strong> voices that have <strong>in</strong> uence <strong>in</strong> a slum<br />
area. Form<strong>in</strong>g an organised group which is detailed<br />
and motivated to achieve <strong>the</strong>ir goals as a community<br />
can empower not only <strong>the</strong> community members itself,<br />
but also <strong>the</strong> LC to advocate for <strong>the</strong>ir area even more<br />
so.<br />
Alternatively, organis<strong>in</strong>g <strong>the</strong> already existent groups<br />
<strong>in</strong>to a larger umbrella forum <strong>in</strong> each community could<br />
prove effective. As people are already members <strong>of</strong><br />
social groups, <strong>the</strong>y understand <strong>the</strong> usefulness and<br />
bene ts <strong>of</strong> membership. Add<strong>in</strong>g a ‘power <strong>in</strong> numbers’<br />
element can prove a motivat<strong>in</strong>g factor. Representation<br />
on a national level is already evident through NSDF<br />
and o<strong>the</strong>r organisations advocat<strong>in</strong>g for slum rights<br />
and programm<strong>in</strong>g, however each slum area has its<br />
own unique context and can use that context to fur<strong>the</strong>r<br />
its own social development. District organisation<br />
between communities could lead to opportunities<br />
such as trade, fur<strong>the</strong>r skills exchange and tra<strong>in</strong><strong>in</strong>g,<br />
and social events such as football matches.<br />
Fur<strong>the</strong>rmore, tak<strong>in</strong>g advantage <strong>of</strong> higher levels <strong>of</strong><br />
community organisation can allow <strong>the</strong> slums to realise<br />
<strong>the</strong>ir potential political power. Be<strong>in</strong>g an approximated<br />
60% <strong>of</strong> <strong>Kampala</strong>’s population, <strong>the</strong> voice <strong>of</strong> <strong>the</strong> slum<br />
dwellers could advocate much more effectively if <strong>the</strong>y<br />
recognised <strong>the</strong>ir potential impact.<br />
6.3<br />
Household and Individual Level<br />
Issues that were identi ed through <strong>the</strong> questionnaire<br />
data and discussions with <strong>the</strong> residents that could<br />
perta<strong>in</strong> to a household or an <strong>in</strong>dividual serve as<br />
guidance for future programm<strong>in</strong>g at this level. There<br />
is programm<strong>in</strong>g that is already <strong>in</strong> place which is<br />
supported by local NGOs and CBOs and deals with<br />
smaller scale <strong>in</strong>terventions, such as <strong>in</strong>come generat<strong>in</strong>g<br />
activities. Though <strong>the</strong> bene ciary base is relatively<br />
limited when compared to global and community level<br />
<strong>in</strong>terventions, <strong>the</strong> positive effects are seen daily by <strong>the</strong><br />
bene ciary and <strong>in</strong> such cases are much more visible<br />
and appreciated by <strong>the</strong> recipients.<br />
6.3.1 Universal Signi cance<br />
Similar issues were found <strong>in</strong> each <strong>of</strong> <strong>the</strong> <strong>in</strong>vestigated<br />
areas. The matters were discovered to be <strong>of</strong> signi cant<br />
importance regardless <strong>of</strong> livelihood strategy.<br />
6.3.1.1 Urban Agriculture<br />
Though <strong>urban</strong> agriculture has been legalised with<strong>in</strong><br />
<strong>the</strong> previous decade <strong>in</strong> <strong>Kampala</strong>, advantage has not<br />
necessarily been taken <strong>of</strong> this opportunity with<strong>in</strong> <strong>the</strong><br />
slum areas. As stated <strong>in</strong> <strong>the</strong> natural capital section,<br />
this may be because <strong>of</strong> <strong>the</strong> perceived risk <strong>of</strong> <strong>the</strong>ft or<br />
vandalism as forms <strong>of</strong> <strong>urban</strong> agriculture such as sack<br />
gardens have been subjected to.<br />
This said, food was <strong>the</strong> highest daily cost for all<br />
livelihood groups aside from Vocation and Services.<br />
Complementary sources <strong>of</strong> food to those <strong>of</strong> purchase<br />
could not only alleviate <strong>the</strong> costs, but also improve<br />
<strong>the</strong> nutritional content <strong>of</strong> <strong>the</strong> diets. To counteract<br />
71
72<br />
<strong>the</strong> fears <strong>of</strong> <strong>in</strong>dividual projects, implement<strong>in</strong>g <strong>urban</strong><br />
agriculture on a community basis would give a sense<br />
<strong>of</strong> proprietorship to a larger amount <strong>of</strong> <strong>in</strong>dividuals and<br />
households. Kisenyi and Bwaise slum all had large<br />
vacant areas which were left after evictions. <strong>Explor<strong>in</strong>g</strong><br />
ownership rights <strong>of</strong> <strong>the</strong>se plots and subsequently<br />
determ<strong>in</strong><strong>in</strong>g a way to permit crop growth <strong>in</strong> a legal<br />
manner, as well as protect<strong>in</strong>g <strong>the</strong> plant<strong>in</strong>gs from<br />
damage (such as hoop houses or locked gates),<br />
would greatly improve <strong>the</strong> food security <strong>of</strong> all those<br />
<strong>in</strong>volved.<br />
These could be implemented alongside <strong>the</strong> current<br />
social and community groups, or take on an even<br />
larger bene ciary base if community groups as<br />
presented earlier were to eventuate. Additionally,<br />
hav<strong>in</strong>g permitted agricultural activities <strong>in</strong> <strong>the</strong> areas<br />
could ease <strong>the</strong> transition for new migrants who are<br />
com<strong>in</strong>g from farm<strong>in</strong>g backgrounds, giv<strong>in</strong>g <strong>the</strong>m time<br />
to adjust to a cash-based economy as well as time<br />
to learn new skills that better suit <strong>the</strong> types <strong>of</strong> work<br />
available <strong>in</strong> <strong>Kampala</strong>.<br />
Increas<strong>in</strong>g <strong>the</strong> <strong>urban</strong> agriculture would dramatically<br />
<strong>in</strong>crease <strong>the</strong> natural capital <strong>in</strong> <strong>the</strong>se areas, which is<br />
cited by <strong>the</strong> residents currently as <strong>the</strong> most limited<br />
capital.<br />
6.3.1.2 Credit and Sav<strong>in</strong>gs<br />
Already present <strong>in</strong> <strong>the</strong> slum areas through a number <strong>of</strong><br />
different actors, sav<strong>in</strong>gs groups make up a signi cant<br />
portion <strong>of</strong> slum dweller community groups. These<br />
groups are locally organised and <strong>in</strong>ternationally<br />
supported by organisations like SDI. They are already<br />
present, work<strong>in</strong>g, and trusted <strong>in</strong> many <strong>of</strong> <strong>the</strong> slum areas<br />
<strong>in</strong> <strong>Kampala</strong>. As ACF does not directly work <strong>in</strong> sav<strong>in</strong>gs<br />
or micro nance capacities, a partnership with SDI or<br />
a support<strong>in</strong>g role to <strong>the</strong> local organisations could help<br />
grow <strong>the</strong>ir membership base with<strong>in</strong> <strong>the</strong> slums where<br />
<strong>the</strong>y currently work, and extend it to those where <strong>the</strong>y<br />
currently do not.<br />
Formal credit was cited as largely unavailable to <strong>the</strong><br />
slum residents. Small loans for food and education<br />
expenses were commonly noted, however <strong>in</strong>ability to<br />
access credit to start or cont<strong>in</strong>ue a bus<strong>in</strong>ess was a<br />
shortfall. Lenders are typically wary <strong>of</strong> slum dwellers<br />
due to <strong>the</strong>ir uncerta<strong>in</strong> <strong>in</strong>comes and limited collateral<br />
to <strong>of</strong>fer aga<strong>in</strong>st larger loans. Support<strong>in</strong>g credit and<br />
nanc<strong>in</strong>g to slum dwellers where <strong>the</strong>re is a gap <strong>in</strong><br />
service could <strong>of</strong>fer potential bene ts for bus<strong>in</strong>ess<br />
owners and those look<strong>in</strong>g to start a formal bus<strong>in</strong>ess<br />
and break out <strong>of</strong> <strong>the</strong> <strong>in</strong>formal sector.<br />
6.3.2 By Livelihood Strategy<br />
A way <strong>of</strong> identify<strong>in</strong>g bene ciaries and design<strong>in</strong>g<br />
programm<strong>in</strong>g that best suits <strong>the</strong>ir needs is by<br />
livelihood strategy. Shar<strong>in</strong>g commonalities <strong>in</strong> type <strong>of</strong><br />
work, <strong>in</strong> access to <strong>the</strong> asset capitals, and <strong>in</strong> daily life<br />
allow programm<strong>in</strong>g to be catered for a speci c group.<br />
6.3.2.1 Poor and Non-Poor Casual Labourers<br />
One <strong>of</strong> <strong>the</strong> ma<strong>in</strong> hazards for casual labourers is <strong>the</strong><br />
uncerta<strong>in</strong>ty <strong>of</strong> a daily <strong>in</strong>come. The slight marg<strong>in</strong>s <strong>of</strong><br />
<strong>in</strong>come to expenditure which persist day to day leave<br />
<strong>the</strong>se groups vulnerable to any shock which disrupts<br />
<strong>the</strong>ir ability or <strong>the</strong> availability <strong>of</strong> work. This be<strong>in</strong>g one<br />
<strong>of</strong> <strong>the</strong> most prevalent issues, programm<strong>in</strong>g directed<br />
at <strong>in</strong>creas<strong>in</strong>g <strong>the</strong> level or knowledge <strong>of</strong> work can be<br />
signi cantly bene cial.<br />
A low-cost and high visibility programme would be a<br />
jobs board <strong>in</strong> each <strong>of</strong> <strong>the</strong> slums. Access to classi ed<br />
ads <strong>in</strong> newspapers or an <strong>in</strong>ternet connection both<br />
have cost implications, and even so, <strong>the</strong> jobs listed<br />
<strong>the</strong>re<strong>in</strong> do not advertise for work typically suited to<br />
<strong>the</strong> casual labourer. Casual labourers will usually nd<br />
work by ask<strong>in</strong>g friends, neighbours, family, passersby,<br />
or worksite foremen. Alter<strong>in</strong>g <strong>the</strong> dynamic so that<br />
employers seek<strong>in</strong>g workers can give those casual<br />
labourers a more rout<strong>in</strong>e and <strong>the</strong>refore reliable way <strong>of</strong><br />
nd<strong>in</strong>g work could raise <strong>the</strong> amount <strong>of</strong> jobs that <strong>the</strong><br />
casual labourer can option on a daily basis. In essence,
those search<strong>in</strong>g for help could post announcements<br />
on <strong>the</strong> jobs board when work becomes available.<br />
These positions could range from unskilled labour for<br />
one s<strong>in</strong>gle task to highly skilled, multi-week projects.<br />
One <strong>of</strong> <strong>the</strong> ma<strong>in</strong> issues with a jobs board is it may<br />
exclude those who are illiterate, though an <strong>in</strong>dividual<br />
motivated to nd work for <strong>the</strong> day is not discouraged<br />
from wait<strong>in</strong>g for <strong>the</strong> poster to come to <strong>the</strong> board <strong>in</strong> <strong>the</strong><br />
morn<strong>in</strong>g. This act could also act as a meet<strong>in</strong>g po<strong>in</strong>t,<br />
so those look<strong>in</strong>g for workers for a quick task could<br />
approach <strong>the</strong> board and hire a labourer who is wait<strong>in</strong>g.<br />
Ano<strong>the</strong>r issue may be vett<strong>in</strong>g <strong>of</strong> <strong>the</strong> employers as it<br />
could also translate as an opportunity for exploitation<br />
<strong>of</strong> workers. If vett<strong>in</strong>g were enacted for a period <strong>of</strong> time<br />
follow<strong>in</strong>g <strong>the</strong> <strong>in</strong>stallation <strong>of</strong> <strong>the</strong> board, trust would build<br />
as employers become known. Logistical dif culties<br />
could arise <strong>in</strong> sensitization <strong>of</strong> <strong>the</strong> communities as well<br />
as identify<strong>in</strong>g potential employers.<br />
Skills tra<strong>in</strong><strong>in</strong>g, handicrafts and education can also be<br />
implemented. Giv<strong>in</strong>g <strong>the</strong> casual labourers technical or<br />
trade skills can raise <strong>the</strong>ir chances at nd<strong>in</strong>g a better<br />
pay<strong>in</strong>g job that lasts for a longer period <strong>of</strong> time. This<br />
<strong>of</strong> course has cost and fund<strong>in</strong>g implications, and does<br />
not <strong>of</strong>fer guarantees <strong>of</strong> work. As <strong>the</strong> availability <strong>of</strong><br />
construction work <strong>in</strong> <strong>Kampala</strong> is highly seasonal due<br />
to rural agriculturalists migrat<strong>in</strong>g to <strong>the</strong> city for work <strong>in</strong><br />
<strong>the</strong> <strong>of</strong>f-season, trade jobs can be highly competitive<br />
at times.<br />
Additionally, should <strong>in</strong>frastructural works such as<br />
dra<strong>in</strong>age improvement be put <strong>in</strong> action, traditional<br />
programmes such as cash for work can be utilised and<br />
target this group as bene ciaries while also provid<strong>in</strong>g<br />
tra<strong>in</strong><strong>in</strong>g on <strong>the</strong> trade skills necessary to complete <strong>the</strong><br />
projects.<br />
As noted previously, local NGOs <strong>in</strong> <strong>Kampala</strong> perform<br />
skill exchange, where slum-dwellers with a particular<br />
skill such as mushroom grow<strong>in</strong>g or charcoal production<br />
will travel to ano<strong>the</strong>r area to teach this skill to <strong>the</strong><br />
residents <strong>the</strong>re, who <strong>the</strong>n pay it forward. This type <strong>of</strong><br />
programm<strong>in</strong>g could be fur<strong>the</strong>r identi ed, supported<br />
and expanded upon as it demonstrates model for skill<br />
development and growth throughout all communities.<br />
6.3.2.2 Vocation and Services<br />
Slums typically have ra<strong>the</strong>r <strong>in</strong>sular economies. Most<br />
provisions for daily life are bought with<strong>in</strong> <strong>the</strong> slums<br />
and products produced <strong>in</strong> <strong>the</strong> slums are designed for<br />
and pr<strong>in</strong>cipally sold to o<strong>the</strong>r slum dwellers. Expand<strong>in</strong>g<br />
<strong>the</strong>ir market base by encourag<strong>in</strong>g trade avenues for<br />
hand-crafted products at <strong>the</strong> larger Ow<strong>in</strong>o or Nakasero<br />
Markets or at tourist souvenir outlets would mitigate<br />
<strong>the</strong> stigma a potential buyer may have from buy<strong>in</strong>g <strong>in</strong><br />
a slum area or from someone who is sell<strong>in</strong>g on <strong>the</strong> side<br />
<strong>of</strong> <strong>the</strong> road. This could be accomplished by form<strong>in</strong>g a<br />
cooperative <strong>of</strong> tradesmen and craft makers and aid<strong>in</strong>g<br />
<strong>the</strong>m to open a storefront <strong>in</strong> an area with higher foot<br />
traf c, lend<strong>in</strong>g a higher perception <strong>of</strong> legitimacy to <strong>the</strong><br />
sellers and products. Likewise, a brand<strong>in</strong>g effort could<br />
help promote products from <strong>the</strong> slums. As packag<strong>in</strong>g<br />
is limited for <strong>the</strong>se products, this could be done by<br />
signs or badges worn by <strong>the</strong> vendors and service<br />
deliverers.<br />
Expand<strong>in</strong>g <strong>the</strong>ir product base could also be<br />
accomplished. Tra<strong>in</strong><strong>in</strong>g on new methods <strong>of</strong> production<br />
or service delivery as well as supply<strong>in</strong>g a resource for<br />
new or better productive goods can enhance <strong>the</strong>ir<br />
bus<strong>in</strong>ess opportunities.<br />
As this groups ma<strong>in</strong> variation and highest expenditure<br />
is related to fuel, this is <strong>the</strong> most obvious economic<br />
hazard for <strong>the</strong> group. However as <strong>the</strong> <strong>in</strong>formation is<br />
limited <strong>in</strong> this study on what types <strong>of</strong> fuel this accounts<br />
for, fur<strong>the</strong>r <strong>in</strong>vestigation would need to be performed<br />
to properly plan and decide which areas are most <strong>in</strong><br />
need <strong>of</strong> assistance.<br />
6.3.2.3 Petty Traders and Street Vendors<br />
The largest representation <strong>of</strong> households <strong>in</strong> this<br />
study are <strong>the</strong> Petty Traders and Street Vendors. This<br />
group sells a wide variety <strong>of</strong> products although <strong>the</strong>y<br />
are typically s<strong>in</strong>gle or a limited number <strong>of</strong> commodity<br />
73
74<br />
goods. The group’s 100% membership rate <strong>in</strong> social<br />
or community groups allows for relatively easy access<br />
for any programm<strong>in</strong>g that may be developed to bene t<br />
<strong>the</strong>se households.<br />
As most <strong>of</strong> <strong>the</strong>se households deal with ei<strong>the</strong>r sell<strong>in</strong>g<br />
raw commodities or street food, not only <strong>the</strong>ir own food<br />
<strong>in</strong>take but also <strong>the</strong>ir daily <strong>in</strong>comes may be threatened<br />
by any price hikes at <strong>the</strong> markets that are relayed by a<br />
shortage <strong>in</strong> <strong>the</strong> areas where <strong>the</strong>y are grown. Therefore,<br />
this group could take particular advantage <strong>of</strong> <strong>urban</strong><br />
agriculture. The group membership could act as an<br />
organis<strong>in</strong>g force, nd<strong>in</strong>g land with<strong>in</strong> <strong>the</strong> slum or at a<br />
nearby location <strong>in</strong> <strong>the</strong> district to raise crops or livestock.<br />
Communal ownership <strong>of</strong> <strong>the</strong>se agricultural plots<br />
would deter <strong>the</strong>ft or vandalism as any crime acted<br />
upon <strong>the</strong>se gardens would affect signi cantly more<br />
people. The power <strong>in</strong> numbers, mutual respect and<br />
cooperation with<strong>in</strong> <strong>the</strong> group would account for any<br />
dist<strong>urban</strong>ce to <strong>the</strong> success <strong>of</strong> <strong>the</strong> project. This could<br />
also be organised as a cooperative, <strong>the</strong>reby giv<strong>in</strong>g<br />
equal power to each <strong>in</strong>dividual who is a member.<br />
Additionally, an organisation <strong>of</strong> <strong>the</strong> members at this<br />
level could act once aga<strong>in</strong> as a brand<strong>in</strong>g mechanism,<br />
where street vendors may wear badges while work<strong>in</strong>g.<br />
This would let buyers know that not only can <strong>the</strong>y<br />
trust <strong>the</strong> products <strong>the</strong>y are buy<strong>in</strong>g, but that <strong>the</strong>y are<br />
contribut<strong>in</strong>g to <strong>the</strong> successful livelihood <strong>of</strong> a speci c<br />
group.<br />
6.3.2.4 Non-Quali ed Salary<br />
Salaried households have <strong>the</strong> advantage over casual<br />
labourers and o<strong>the</strong>r daily <strong>in</strong>come earners <strong>in</strong> that a salary<br />
is guaranteed and <strong>the</strong>y can <strong>the</strong>refore more properly<br />
design and apply a household budget. Tra<strong>in</strong><strong>in</strong>gs on<br />
creat<strong>in</strong>g household budgets to most ef ciently use<br />
<strong>in</strong>come over <strong>the</strong> course <strong>of</strong> a pay period could be<br />
bene cial <strong>in</strong> this course, as this group has <strong>the</strong> second<br />
highest expense to <strong>in</strong>come ratio. This does not account<br />
for shocks, however an already high membership rate<br />
<strong>in</strong> social and community groups allows for ease <strong>of</strong><br />
access to scale up sav<strong>in</strong>gs programmes to account<br />
for unseen shocks.<br />
High debt to <strong>in</strong>come ratio is a noted issue for this group<br />
with loans taken out from a variety <strong>of</strong> different lenders.<br />
Improv<strong>in</strong>g access to affordable xed-rate credit from<br />
a trusted organisation could alleviate troubles <strong>the</strong><br />
household may experience with debt repayment.<br />
Capacity build<strong>in</strong>g <strong>of</strong> skills that relate to <strong>the</strong>ir type<br />
<strong>of</strong> work could also improve <strong>the</strong>ir stand<strong>in</strong>g <strong>in</strong> <strong>the</strong>ir<br />
current workplace. Do<strong>in</strong>g this <strong>in</strong>dependently would<br />
not be feasible as coord<strong>in</strong>ation <strong>of</strong> <strong>the</strong> different types<br />
<strong>of</strong> work alone would be logistically prohibitive. Aid<strong>in</strong>g<br />
employers through sponsor<strong>in</strong>g workshops at some<br />
<strong>of</strong> <strong>the</strong> most common employers may be an avenue<br />
to explore, however an understand<strong>in</strong>g <strong>of</strong> improved<br />
<strong>in</strong>comes as a result <strong>of</strong> sponsor<strong>in</strong>g <strong>the</strong> workshops<br />
would need to be agreed upon.<br />
Lower<strong>in</strong>g <strong>the</strong> daily expenses is an optimal approach.<br />
This group claims <strong>the</strong> highest water usage and<br />
<strong>the</strong> second highest water costs <strong>of</strong> any group. By<br />
protect<strong>in</strong>g unprotected wells and encourag<strong>in</strong>g <strong>the</strong>ir<br />
use this group could bene t from cost sav<strong>in</strong>gs. This is<br />
<strong>in</strong> addition to <strong>the</strong> <strong>urban</strong> agriculture to lower food costs<br />
as noted earlier.<br />
6.3.2.5 Quali ed Salary<br />
By most accounts <strong>the</strong> quali ed salary is <strong>the</strong> best<br />
<strong>of</strong>f <strong>of</strong> <strong>the</strong> identi ed groups. High asset values <strong>in</strong> all<br />
<strong>of</strong> <strong>the</strong> SLF capitals aside from Natural, and stability<br />
and suf ciency <strong>in</strong> <strong>the</strong>ir <strong>in</strong>comes lend this group to be<br />
<strong>the</strong> most stable. This however only considers <strong>the</strong>ir<br />
<strong>livelihoods</strong> relative to <strong>the</strong> o<strong>the</strong>r group<strong>in</strong>gs <strong>in</strong> this study,<br />
that is to say, <strong>the</strong>ir situation <strong>in</strong> <strong>the</strong> context <strong>of</strong> liv<strong>in</strong>g <strong>in</strong><br />
<strong>Kampala</strong> does not qualify <strong>the</strong>m as signi cantly better<br />
<strong>of</strong>f than o<strong>the</strong>r slum dwellers.<br />
The teach<strong>in</strong>g <strong>of</strong> new skills or <strong>in</strong>come generat<strong>in</strong>g<br />
activities to this group is dif cult as many <strong>of</strong> <strong>the</strong><br />
jobs consist <strong>of</strong> long hours (typically 12 hours/day),<br />
leav<strong>in</strong>g little time to balance <strong>the</strong>ir social and work<br />
lives with ano<strong>the</strong>r <strong>in</strong>come source that demands more<br />
time resources. Should this avenue be pursued,<br />
<strong>the</strong>se activities should target o<strong>the</strong>r members <strong>in</strong> <strong>the</strong>
household which have greater exibility <strong>in</strong> <strong>the</strong>ir time<br />
commitments.<br />
This group has high rates <strong>of</strong> ownership <strong>of</strong> <strong>the</strong> land and/<br />
or structure that <strong>the</strong>y live <strong>in</strong>. This is a po<strong>in</strong>t that can be<br />
expanded upon as land tenure is one <strong>of</strong> <strong>the</strong> major issues<br />
for slum residents, as has been noted. Discover<strong>in</strong>g<br />
opportunities and pathways to ownership, <strong>the</strong>reby<br />
<strong>in</strong>creas<strong>in</strong>g <strong>the</strong> physical capital for <strong>the</strong> rema<strong>in</strong><strong>in</strong>g 50%<br />
who currently rent, would fur<strong>the</strong>r lend a sense <strong>of</strong> pride<br />
and respect for <strong>the</strong>ir area <strong>of</strong> residence. This may <strong>the</strong>n<br />
have <strong>the</strong> same knock-on effects as mentioned <strong>in</strong> <strong>the</strong><br />
land tenure section.<br />
Additionally, access to credit for structural improvement<br />
loans and/or tra<strong>in</strong><strong>in</strong>g for <strong>the</strong> skills to complete <strong>the</strong><br />
work would be bene cial for those who already own.<br />
Properly built structures that are built with materials<br />
that are not conducive to microbiological growth<br />
would lessen disease <strong>in</strong>cidence with<strong>in</strong> <strong>the</strong> household.<br />
Though <strong>the</strong> scope <strong>of</strong> this sort <strong>of</strong> project is small, it<br />
could have a large impact that is highly important to<br />
<strong>the</strong> bene ciaries.<br />
6.4<br />
Livelihood Capitals and Food<br />
Security<br />
Urban life <strong>in</strong> <strong>Kampala</strong> relies on <strong>the</strong> ve capitals <strong>of</strong> <strong>the</strong><br />
SLF, as it does <strong>in</strong> rural contexts. The dynamics however<br />
are different, <strong>in</strong> that <strong>the</strong>re is such a great emphasis<br />
placed on <strong>the</strong> nancial and economic as it is <strong>the</strong><br />
primary means to achiev<strong>in</strong>g livelihood goals such as<br />
be<strong>in</strong>g food secure or <strong>in</strong> good health. That be<strong>in</strong>g said,<br />
a brief summary <strong>of</strong> each capital and it’s importance to<br />
a susta<strong>in</strong>able livelihood is given.<br />
6.4.1 F<strong>in</strong>ancial<br />
As stated <strong>in</strong>comes and expenses dom<strong>in</strong>ate life <strong>in</strong><br />
<strong>urban</strong> sett<strong>in</strong>gs, not only for <strong>the</strong> <strong>poor</strong> and vulnerable,<br />
but for <strong>the</strong> greater population. Food security and, to a<br />
lesser extent, access to health services are pr<strong>in</strong>cipally<br />
achieved through cash transactions at markets.<br />
The implications for this can be great, as steady<br />
ga<strong>in</strong>ful employment can be a rarity amongst certa<strong>in</strong><br />
populations. Job skills development is limited for <strong>the</strong><br />
<strong>poor</strong>er populations and adaptation <strong>of</strong> rural skills to<br />
an <strong>urban</strong> environment can be challeng<strong>in</strong>g for recent<br />
migrants. Additionally, <strong>the</strong> demand <strong>of</strong> unskilled work<br />
for <strong>the</strong>se populations can change with seasonality,<br />
as workers from <strong>the</strong> rural areas conven <strong>in</strong> <strong>Kampala</strong> to<br />
search for employment dur<strong>in</strong>g <strong>the</strong> lean period.<br />
The availability and access to ga<strong>in</strong>ful employment<br />
does however lead to a ra<strong>the</strong>r robust <strong>in</strong>formal sector.<br />
Each area that was <strong>in</strong>vestigated had an economy<br />
unto itself. The <strong>in</strong>sular nature <strong>of</strong> many <strong>of</strong> <strong>the</strong> economic<br />
activities with<strong>in</strong> an area provides a steady yet sti ed<br />
base for <strong>in</strong>comes and expenses. It does however also<br />
lend itself to higher social capital, as many actors <strong>in</strong><br />
<strong>the</strong> slums take part <strong>in</strong> sav<strong>in</strong>gs groups that are speci c<br />
to each slum area and recieve support <strong>in</strong> it’s vary<strong>in</strong>g<br />
forms.<br />
6.4.2 Human<br />
With<strong>in</strong> <strong>the</strong> sample populations, health services were<br />
available at m<strong>in</strong>imal cost to all through government<br />
programm<strong>in</strong>g. The acceptance and use <strong>of</strong> <strong>the</strong>se<br />
services were only partially developed <strong>in</strong> this study,<br />
however certa<strong>in</strong> issues did become apparent.<br />
Malnutrition has been noted anecdotally to exist with<strong>in</strong><br />
<strong>the</strong> slum populations. The extent and root causes <strong>of</strong><br />
this condition are unknown to this study, yet similarly<br />
display <strong>the</strong> need for improved monitor<strong>in</strong>g.<br />
Though school enrolment was ra<strong>the</strong>r high, education<br />
was consistently noted as one <strong>of</strong> <strong>the</strong> largest expenses<br />
for a household. Universal free primary education is<br />
given free through government programmes, though<br />
75
76<br />
<strong>the</strong> ancillary costs can reach prohibitive levels for<br />
some families. Formal education’s <strong>in</strong>herent liaison with<br />
lifetime <strong>in</strong>come earn<strong>in</strong>g potential proves a great need<br />
for affordability and quality <strong>of</strong> <strong>the</strong>se programmes.<br />
6.4.3 Social<br />
The importance <strong>of</strong> network<strong>in</strong>g and social groups<br />
was <strong>in</strong>advertently displayed through this research<br />
as enumerators from Kisenyi utilised <strong>the</strong>se groups<br />
to complete <strong>the</strong>ir surveys. Whe<strong>the</strong>r this displays a<br />
bias <strong>in</strong> <strong>the</strong> methodology or that social groups are <strong>in</strong><br />
large adherence with<strong>in</strong> Kisenyi is unknown, however<br />
<strong>the</strong> use and value <strong>of</strong> <strong>the</strong>se groups as seen by <strong>the</strong>ir<br />
participants becomes evident.<br />
Church, drama, and sav<strong>in</strong>gs groups are all areas<br />
that br<strong>in</strong>g <strong>the</strong> community toge<strong>the</strong>r and give a form<br />
<strong>of</strong> power to <strong>the</strong> participants. Harness<strong>in</strong>g this social<br />
power and utilis<strong>in</strong>g it to improve programm<strong>in</strong>g and to<br />
help one ano<strong>the</strong>r achieve livelihood objectives is a key<br />
area that should be utilised to <strong>the</strong> fullest extent.<br />
In a broader context, <strong>the</strong> political <strong>in</strong> uence <strong>of</strong> <strong>the</strong> sheer<br />
number <strong>of</strong> slum dwellers with<strong>in</strong> <strong>Kampala</strong> needs to be<br />
realised. This <strong>in</strong> uence can be used appropriately to<br />
advocate to <strong>in</strong>stitutions for improved <strong>in</strong>frastructure,<br />
improved access to basic services, and improved<br />
susta<strong>in</strong>ability <strong>in</strong> day to day life.<br />
6.4.4 Physical<br />
Hous<strong>in</strong>g and land tenure are <strong>of</strong> prime concern for<br />
physical capital. Uncerta<strong>in</strong>ty <strong>of</strong> permanence <strong>in</strong> an<br />
<strong>in</strong>dividuals’ residence may be <strong>in</strong>hibit<strong>in</strong>g <strong>in</strong>vestment<br />
<strong>in</strong> <strong>the</strong> community or <strong>the</strong> household. Should tenure be<br />
secured through <strong>the</strong> appropriate channels, <strong>in</strong>vestment<br />
<strong>in</strong> community gardens and farms, schools, rubbish<br />
collection, and social capital can all be expected to<br />
improve.<br />
Overcrowd<strong>in</strong>g is an issue that is not easily dealt with<br />
<strong>in</strong> <strong>the</strong> slums, as one room houses for large families are<br />
<strong>the</strong> norm. Expand<strong>in</strong>g structures means a substantial<br />
capital <strong>in</strong>vestment and is limited due to <strong>the</strong> physical<br />
crowd<strong>in</strong>g <strong>of</strong> <strong>the</strong> already present structures <strong>in</strong> <strong>the</strong> area.<br />
Infrastructure development can be <strong>of</strong> great use.<br />
Not only roads to access markets and improve<br />
transportation <strong>of</strong> both people and goods, but improved<br />
dra<strong>in</strong>age <strong>of</strong> ra<strong>in</strong>water and scheduled refuse collection<br />
are areas for needed improvement.<br />
6.4.5 Natural<br />
Urban farm<strong>in</strong>g is not present as a large force to combat<br />
food <strong>in</strong>security <strong>in</strong> <strong>the</strong> slums andis limited by space, by<br />
crime, and by opportunity. Water is available through<br />
wells, though is subject to <strong>the</strong> seasonality that comes<br />
with <strong>the</strong> two ra<strong>in</strong>y seasons. Fur<strong>the</strong>rmore, this water may<br />
be contam<strong>in</strong>ated by bacteria, yield<strong>in</strong>g water that is not<br />
potable and may unexpected health implications.<br />
Urban livestock farm<strong>in</strong>g has been shown by previous<br />
studies to be a source <strong>of</strong> zoonotic diseases, and<br />
as such proper farm hygiene practices need to be<br />
adhered to for those currently rais<strong>in</strong>g animals, and for<br />
any future programm<strong>in</strong>g.<br />
6.4.6 Food Security<br />
Though <strong>the</strong> food security <strong>in</strong>dicators come from a small<br />
sample population, it raises some red ags. Largely,<br />
<strong>the</strong> most reliable <strong>in</strong>dicators represented <strong>in</strong> this study<br />
(that is, those that have been validated and not altered<br />
to t <strong>the</strong> constra<strong>in</strong>ts <strong>of</strong> this exercise) display selfperception<br />
<strong>of</strong> <strong>the</strong> respondent’s own food security. This<br />
self-perception is largely negative, <strong>in</strong> that <strong>the</strong> majority<br />
identify <strong>the</strong>mselves as severely food <strong>in</strong>secure.<br />
Indicators such as childhood dietary diversity and<br />
food consumption score do display trends between<br />
<strong>the</strong> areas <strong>of</strong> <strong>in</strong>vesitgation, though <strong>the</strong> degree <strong>of</strong> <strong>the</strong><br />
two do differ. When consider<strong>in</strong>g IDDS for children and
<strong>the</strong> HFIAS when disaggregated by area, one notes<br />
that both Bwaise and Namuwongo are notably worse<br />
<strong>of</strong>f than Kisenyi which has pro ted from <strong>in</strong>stitutional<br />
programs and <strong>in</strong>terventions. FCS tells a similar story,<br />
though <strong>the</strong> degree <strong>of</strong> severity is lessened.<br />
The <strong>in</strong>dicators do diverge, however, when consider<strong>in</strong>g<br />
<strong>the</strong> objective measures <strong>of</strong> IDDS and FCS. Not meant<br />
to re ect self-perception, <strong>the</strong> data suggests con ict<strong>in</strong>g<br />
extents <strong>of</strong> food <strong>in</strong>security. As FCS is a household<br />
measure, it could be expla<strong>in</strong>ed by adults that have a<br />
higher dietary diversity than children, and <strong>the</strong>refore<br />
represents a more food secure situation than a child<br />
IDDS. it must not be forgotten, however, that <strong>the</strong> FCS<br />
was altered to suit this particular study, and <strong>the</strong>refore<br />
<strong>the</strong> methodology has not been validated and may<br />
yield mislead<strong>in</strong>g results.<br />
The results on <strong>the</strong> whole do <strong>in</strong>dicate potential drastic<br />
levels <strong>of</strong> food <strong>in</strong>security, and as such fur<strong>the</strong>r exempli es<br />
<strong>the</strong> need for more targeted and specialised study and<br />
monitor<strong>in</strong>g.<br />
6.5<br />
Fur<strong>the</strong>r Research<br />
This study has highlighted some <strong>of</strong> <strong>the</strong> major issues that<br />
face slum dwellers <strong>in</strong> three different area contexts. The<br />
scope and aims <strong>of</strong> this study however only describe<br />
a selection <strong>of</strong> <strong>the</strong> issues from a selected portion <strong>of</strong><br />
slum residents. Because <strong>of</strong> this, fur<strong>the</strong>r research and<br />
development <strong>of</strong> <strong>the</strong> understand<strong>in</strong>g <strong>of</strong> <strong>the</strong> presented<br />
ideas is necessary to fully comprehend <strong>the</strong> <strong>livelihoods</strong><br />
<strong>of</strong> <strong>the</strong> broader slum population <strong>in</strong> <strong>Kampala</strong> and <strong>the</strong><br />
various contexts <strong>in</strong> which <strong>the</strong>y exist.<br />
The primary need is proper enumeration <strong>of</strong> <strong>the</strong> slum<br />
populations. The lack <strong>of</strong> <strong>in</strong>formation that exists about<br />
slum dwellers, let alone <strong>the</strong>ir <strong>livelihoods</strong>, is a call <strong>in</strong><br />
itself for fur<strong>the</strong>r <strong>in</strong>vestigation. Demographic statistics,<br />
complete and detailed area descriptions, expanded<br />
understand<strong>in</strong>g <strong>of</strong> <strong>the</strong> capacities and weaknesses <strong>of</strong><br />
slum dwellers are all needed to know not only <strong>the</strong><br />
context <strong>of</strong> <strong>the</strong>ir livelihood situations, but also to what<br />
extent speci c issues impede <strong>the</strong>ir susta<strong>in</strong>ability as<br />
well as how <strong>the</strong> population manages <strong>the</strong>se issues.<br />
Once <strong>the</strong> enumeration has been done, a formal<br />
basel<strong>in</strong>e study should be implemented with<strong>in</strong> <strong>the</strong><br />
populations. These basel<strong>in</strong>e surveys should be multidimensional<br />
and cooperative between organisations<br />
and government, so as to <strong>in</strong>clude <strong>in</strong>formation pert<strong>in</strong>ent<br />
to all organisations that are participat<strong>in</strong>g <strong>in</strong> a form <strong>of</strong><br />
<strong>urban</strong> programm<strong>in</strong>g <strong>in</strong> <strong>Kampala</strong>.<br />
Expand<strong>in</strong>g from <strong>the</strong> basel<strong>in</strong>e studies, on-go<strong>in</strong>g<br />
monitor<strong>in</strong>g activities <strong>of</strong> <strong>the</strong> issues highlighted here<strong>in</strong><br />
and those subsequently discovered should be<br />
performed at regular periods. These should be focused<br />
on <strong>the</strong> activities <strong>of</strong> <strong>the</strong> coord<strong>in</strong>at<strong>in</strong>g <strong>in</strong>stitutions, but<br />
also <strong>in</strong>clude statistics that can be used to monitor<br />
population growth with<strong>in</strong> <strong>the</strong> areas on a shorter term<br />
basis than <strong>the</strong> national censuses allow.<br />
Speci c to ACF, nutrition monitor<strong>in</strong>g should be<br />
completed that focuses on slums yet disaggregated<br />
by area. Price monitor<strong>in</strong>g at major markets <strong>of</strong> <strong>Kampala</strong><br />
(possibly <strong>in</strong> conjunction with Infotrade <strong>Uganda</strong>) <strong>in</strong><br />
addition to locat<strong>in</strong>g <strong>the</strong> sources <strong>of</strong> <strong>in</strong>ventory for <strong>the</strong>se<br />
markets and monitor<strong>in</strong>g <strong>the</strong>ir climates and seasonal<br />
production data could aid <strong>in</strong> prevent<strong>in</strong>g price hikes<br />
or allow for <strong>in</strong>terventions for when steep price hikes<br />
occur.<br />
After development <strong>of</strong> <strong>the</strong>se monitor<strong>in</strong>g and record<br />
keep<strong>in</strong>g programmes, <strong>the</strong> causal factors <strong>in</strong> uenc<strong>in</strong>g<br />
spikes <strong>in</strong> admission rates need to be properly identi ed<br />
and characterised.<br />
Seasonality should also be monitored with regard<br />
to <strong>in</strong>come activities and levels. This may identify<br />
lean periods throughout <strong>the</strong> year that are speci c to<br />
<strong>Kampala</strong>’s slum residents and possibly <strong>the</strong> greater<br />
77
78<br />
<strong>urban</strong> population. By identify<strong>in</strong>g <strong>the</strong>se, more effective<br />
programm<strong>in</strong>g measures can be implemented to<br />
mitigate any negative effects that variables such as<br />
wea<strong>the</strong>r and annual migration cycles may cause.<br />
Information shar<strong>in</strong>g between organisations work<strong>in</strong>g <strong>in</strong><br />
<strong>the</strong> slums should be developed. Because <strong>of</strong> <strong>the</strong> limited<br />
knowledge <strong>of</strong> which organisations and agencies<br />
are target<strong>in</strong>g this population, a cooperative <strong>in</strong>terorganisation<br />
slum work<strong>in</strong>g group should be proposed.<br />
This group should hold access to all <strong>of</strong> <strong>the</strong> resources<br />
developed by each <strong>of</strong> <strong>the</strong> organisations work<strong>in</strong>g <strong>in</strong><br />
<strong>the</strong> areas to centralise <strong>the</strong> data collected. This would<br />
<strong>in</strong>clude both <strong>in</strong>ternational and local NGOs as well as<br />
CBOs.<br />
Additionally, even though <strong>urban</strong> programm<strong>in</strong>g is on<br />
<strong>the</strong> rise, donor organisations are ei<strong>the</strong>r not properly<br />
sensitized to <strong>the</strong> issues at hand <strong>in</strong> <strong>Kampala</strong> or lack<br />
<strong>the</strong> funds or <strong>in</strong>terest to develop <strong>the</strong>se programmes.<br />
Information shar<strong>in</strong>g and advocacy to donor<br />
organisations could develop <strong>the</strong> awareness needed<br />
to properly address <strong>the</strong> issues at hand.
Conclusion<br />
A<br />
comprehensive livelihood analysis had not before been completed <strong>in</strong> <strong>the</strong> slums <strong>of</strong> <strong>Kampala</strong>. With <strong>the</strong><br />
pal ala. Wit it ith th <strong>the</strong><br />
realization <strong>of</strong> this study, issues have been identi ed that can affect slum residents throughout <strong>the</strong> district, ict<br />
with<strong>in</strong> <strong>the</strong> communities that were <strong>in</strong>vestigated, and with<strong>in</strong> <strong>the</strong> households that were surveyed. This<br />
research pa<strong>in</strong>ts a picture <strong>of</strong> what successes and failures <strong>urban</strong> life has on <strong>the</strong> <strong>poor</strong>er populations <strong>of</strong> <strong>Kampala</strong><br />
city, though through this picture, one understands that an <strong>urban</strong> livelihood is dependent on context.<br />
Each <strong>of</strong> <strong>the</strong> areas <strong>in</strong>vestigated have a context unto <strong>the</strong>mselves, and <strong>the</strong>refore to properly understand <strong>the</strong> lives<br />
<strong>of</strong> <strong>the</strong> 1,000,000 residents <strong>in</strong> <strong>the</strong> slums, fur<strong>the</strong>r research is necessary. Kisenyi, an area that has pro ted from<br />
<strong>in</strong>terventions, can act as <strong>the</strong> poster child for successes and gaps <strong>in</strong> slum programm<strong>in</strong>g. Comparison <strong>of</strong> Kisenyi<br />
to Bwaise and Namuwongo br<strong>in</strong>gs about stark differences <strong>in</strong> <strong>the</strong> quality and standard <strong>of</strong> liv<strong>in</strong>g <strong>in</strong> each <strong>of</strong><br />
<strong>the</strong>se areas. Cit<strong>in</strong>g <strong>the</strong>se three areas as a precedent, one can see that similar areas as viewed by <strong>in</strong>stitutional<br />
actors can be differentiated through multiple means. Slum areas <strong>in</strong> <strong>the</strong> h<strong>in</strong>terland <strong>of</strong> <strong>Kampala</strong> District may have<br />
differences <strong>in</strong> <strong>in</strong>come activities, <strong>in</strong> demographics, and <strong>in</strong> access to services, and <strong>the</strong>refore demand <strong>the</strong>ir own<br />
<strong>in</strong>vestigation.<br />
The identi cation <strong>of</strong> such strik<strong>in</strong>g different livelihood pro les with<strong>in</strong> <strong>the</strong> relatively small sample population <strong>of</strong> this<br />
study shows that even at an area level, programm<strong>in</strong>g needs to be fur<strong>the</strong>r targeted. All groups were identi ed<br />
as dependent on cash to achieve <strong>the</strong>ir livelihood objectives, through regularity and amount <strong>of</strong> <strong>in</strong>comes became<br />
a de n<strong>in</strong>g factor. Casual laborers are found to be at a signi cantly higher vulnerability to price shocks, where<br />
Quali ed Salary workers that can afford to live <strong>in</strong> areas with better developed <strong>in</strong>frastructure are less vulnerable<br />
to environmental shocks such as ood<strong>in</strong>g.<br />
Along with <strong>the</strong> need for fur<strong>the</strong>r study on <strong>the</strong> areas and <strong>the</strong> people, this paper has identi ed <strong>in</strong>stances <strong>of</strong><br />
services and <strong>in</strong>stitutions that can bene t from immediate action. Population enumeration is <strong>the</strong> rst step to<br />
properly targeted programm<strong>in</strong>g. In <strong>the</strong> case <strong>of</strong> ACF, malnutrition and health basel<strong>in</strong>es and regular monitor<strong>in</strong>g<br />
are needed to determ<strong>in</strong>e <strong>the</strong> seasonality and susceptibility <strong>of</strong> succumb<strong>in</strong>g to malnutrition for selected groups.<br />
The capacities for development with<strong>in</strong> <strong>the</strong> slums are great, though without proper understand<strong>in</strong>g <strong>of</strong> <strong>the</strong> people<br />
with<strong>in</strong>, that potential is limited. This said, one can now ascerta<strong>in</strong> that <strong>the</strong>re is a need for improved recognition<br />
<strong>of</strong> <strong>the</strong> population at an <strong>in</strong>stitution and policy level, <strong>the</strong>re is a need for surveillance and monitor<strong>in</strong>g <strong>of</strong> <strong>the</strong><br />
vulnerabilities <strong>of</strong> <strong>the</strong>se populations, and <strong>the</strong>re is a need for <strong>in</strong>tervention to give <strong>the</strong> help <strong>the</strong>y require.<br />
79
80<br />
Bibliography<br />
ACF, 2010A. Identi cation Of Vulnerable People In<br />
Urban Environments, Palaiseau.<br />
Acf, 2010B. Integrated Surveillance System Gulu<br />
District, Gulu, <strong>Uganda</strong>.<br />
Acf, 2011. Nutrition And Food Security Assessment In<br />
Refugee Settlements In West Nile Region And South-<br />
West <strong>Uganda</strong>,<br />
Acf, 2012. Rural-Urban L<strong>in</strong>kages : Zimbabwe, Harare.<br />
Agmis & Infotrade <strong>Uganda</strong>, 2011. Market Prices.<br />
Available At: Http://Www.Infotradeuganda.Com<br />
[Accessed October 2, 2012].<br />
Appleton, S., 2003. Regional Or National Poverty<br />
L<strong>in</strong>es ? The Case Of <strong>Uganda</strong> In The 1990S.<br />
Arimond, M. & Ruel, M.T., 2004. Community And<br />
International Nutrition Dietary Diversity Is Associated<br />
With Child Nutritional Status : Evidence From 11<br />
Demographic And Health Surveys 1 , 2. J. Nutr,<br />
(August), Pp.2579–2585.<br />
Atukunda, M., 2011. The Tragedy Of <strong>Uganda</strong>’s<br />
Healthcare System.<br />
Baxter, D. & Burrall, A., 2011. Mov<strong>in</strong>g To Catch Up:<br />
Migration Of Ex-Combatants In <strong>Uganda</strong>, Wash<strong>in</strong>gton<br />
D.C.<br />
Becquey, E. Et Al., 2010. The Household Food<br />
Insecurity Access Scale And An Index-Member Dietary<br />
Diversity Score Contribute Valid And Complementary<br />
Information On Household Food Insecurity In An<br />
Urban West-African Sett<strong>in</strong>g. The Journal Of Nutrition,<br />
140(12), Pp.2233–40. Available At: Http://Www.Ncbi.<br />
Nlm.Nih.Gov/Pubmed/20962154 [Accessed October<br />
9, 2012].<br />
Bellù, L.G. & Liberati, P., 2005A. Impacts Of Policies<br />
On Poverty: Absolute Poverty L<strong>in</strong>es, Rome.<br />
Bellù, L.G. & Liberati, P., 2005B. Impacts Of Policies<br />
On Poverty: Relative Poverty L<strong>in</strong>es, Rome.<br />
Benson, T., 2007. Study Of Household Food Security In<br />
Urban Slum Areas Of Bangladesh , 2006, Bangladesh.<br />
Bett, A., Russell, S.D. & Kabanda, M.P., 2005.<br />
<strong>Uganda</strong>’s Response To Street Children : Investigat<strong>in</strong>g<br />
The Validity And Impact Of The Kampar<strong>in</strong>gisa National<br />
Rehabilitation Centre ( Knrc ) In Work<strong>in</strong>g With Street<br />
Children In <strong>Uganda</strong>, Kent, Uk, Pasadena, Usa.<br />
Van Blerk, L., 2006. Diversity And Difference In The<br />
Everyday Lives Of <strong>Uganda</strong>n Street Children: The<br />
Signi cance Of Age And Gender For Understand<strong>in</strong>g<br />
The Use Of Space. Social Dynamics, 32(1), Pp.47–<br />
74. Available At: Http://Www.Tandfonl<strong>in</strong>e.Com/Doi/<br />
Abs/10.1080/02533950608628719.<br />
Boudreau, T, 2008. The Practitioners’ Guide To The<br />
Household Economy Approach, Available At: Http://<br />
Scholar.Google.Com/Scholar?Hl=En&Btng=Search&
Q=Intitle:<strong>the</strong>+Practitioners+Guide+To+The+Househo<br />
ld+Economy+Approach#2 [Accessed April 9, 2012].<br />
Bus<strong>in</strong>ge, C., 2007. Mysterious Fever Hits Western<br />
<strong>Uganda</strong>. Bbc Monitor<strong>in</strong>g Africa.<br />
Chambers, R. And Conway, G.R., 1992. Susta<strong>in</strong>able<br />
Rural Livelihoods: Practical Concepts For The 21St<br />
Century, Institute Of Development Studies Discussion<br />
Papers, 296. Cambridge.<br />
Chennamaneni, R., 2007. Food And Nutritional<br />
Security In The Slums Of Hyderabad, Berl<strong>in</strong>. Available<br />
At: Http://Ideas.Repec.Org/P/Ags/Huiaan/6392.Html<br />
[Accessed April 9, 2012].<br />
Citro, C.F. & Michael, R.T., 1995. Measur<strong>in</strong>g Poverty:<br />
A New Approach 1St Ed., Wash<strong>in</strong>gton D.C.: National<br />
Academy Press.<br />
Coates, J., Sw<strong>in</strong>dale, A. & Bil<strong>in</strong>sky, P., 2007. Household<br />
Food Insecurity Access Scale (H as) For Measurement<br />
Of Household Food Access: Indicator Guide (V. 3),<br />
Wash<strong>in</strong>gton D.C.<br />
Cohen, B., 2004. Urban Growth In Develop<strong>in</strong>g<br />
Countries: A Review Of Current Trends And A Caution<br />
Regard<strong>in</strong>g Exist<strong>in</strong>g Forecasts. World Development,<br />
32(1), Pp.23–51. Available At: Http://L<strong>in</strong>k<strong>in</strong>ghub.<br />
Elsevier.Com/Retrieve/Pii/S0305750x03001967<br />
[Accessed July 19, 2012].<br />
D d, 1999. Susta<strong>in</strong>able Livelihoods Guidance Sheets,<br />
London.<br />
Daniel, A., 2011. The Relationship Between Susta<strong>in</strong>able<br />
Development Of Land And Land Tenure Systems In<br />
<strong>Uganda</strong>, <strong>Kampala</strong>.<br />
Euwi, 2011. Where Do <strong>Kampala</strong>’s Poor “Go”? Research<br />
Evidence For Policy, (July).<br />
Ellis, W.A., 1984. Bov<strong>in</strong>e Leptospirosis In The Tropics:<br />
Prevalence , Pathogenesis And Control. Preventive<br />
Veterniary Medic<strong>in</strong>e, 2, Pp.411–421.<br />
Gackle, J.W., Lolem, G. & Kabanda, M.P., 2007.<br />
Karamojong Street Children And Adults In <strong>Kampala</strong> ,<br />
<strong>Uganda</strong>: A Situational Analysis Investigat<strong>in</strong>g The Root<br />
Causes , Issues Faced , And Current Responses,<br />
<strong>Kampala</strong> Ug, Kent Uk.<br />
Government Of <strong>Uganda</strong>, 1995. Constitution Of The<br />
Republic Of <strong>Uganda</strong>, Government Of <strong>Uganda</strong>.<br />
Hovil, L., Naggaga, A. & Lomo, Z., 2001. The<br />
Phenomenon Of Forced Migration In <strong>Uganda</strong>: An<br />
Overview Of Policy And Practice In An Historical<br />
Context. , (1).<br />
Kcca, 2008. City Council Of <strong>Kampala</strong>: Ovc Strategic<br />
Plan, <strong>Kampala</strong>.<br />
Kadiyala, S. & Rawat, R., 2012. Food Access And<br />
Diet Quality Independently Predict Nutritional Status<br />
Among People Liv<strong>in</strong>g With Hiv In <strong>Uganda</strong>. Public<br />
Health Nutrition, (February), Pp.1–7. Available At:<br />
Http://Www.Ncbi.Nlm.Nih.Gov/Pubmed/22348289<br />
[Accessed October 9, 2012].<br />
Kalibala, S. & Elson, L., 2009. Protect<strong>in</strong>g Hope :<br />
Situation Analysis Of Vulnerable Children In <strong>Uganda</strong>,<br />
<strong>Kampala</strong>.<br />
Kikafunda, J.K. Et Al., 1998. Risk Factors For Early<br />
Childhood Malnutrition In <strong>Uganda</strong>. Pediatrics, 102(4),<br />
Pp.1–8.<br />
Krause-Vilmar, J., 2011. The Liv<strong>in</strong>g A<strong>in</strong>’t Easy: Urban<br />
Refugees In <strong>Kampala</strong>, New York.<br />
Kron, J., 2012. In <strong>Uganda</strong>, An Aids Success Story<br />
Comes Undone. The New York Times. Available At:<br />
Http://Www.Nytimes.Com/2012/08/03/World/Africa/<br />
In-<strong>Uganda</strong>-An-Aids-Success-Story-Comes-Undone.<br />
Html?_R=0 [Accessed October 17, 2012].<br />
Lastarria-Cornhiel, S., 2003. <strong>Uganda</strong> Country Brief:<br />
Property Rights And Land Markets, Madison, Usa.<br />
Lee-Smith, D., 2005. Development Of New City<br />
Ord<strong>in</strong>ances On Urban Agriculture, <strong>Kampala</strong> Timel<strong>in</strong>e<br />
And Analysis, <strong>Kampala</strong>.<br />
81
82<br />
Lewis, P.M. Ed., 2009. Ethnologue: Languages Of The<br />
World Sixteenth., Dallas: Sil International. Available At:<br />
Http://Www.Ethnologue.Com.<br />
Lucas, R.E.B., 2006. Migration And Economic<br />
Development In Africa: A Review Of Evidence. Journal<br />
Of African Economies, 15(Supplement 2), Pp.337–<br />
395. Available At: Http://Jae.Oxfordjournals.Org/Cgi/<br />
Doi/10.1093/Jafeco/Ejl032 [Accessed September 2,<br />
2012].<br />
Maciel, E. A P. Et Al., 2008. Household Transmission Of<br />
Leptospira Infection In Urban Slum Communities. Plos<br />
Neglected Tropical Diseases, 2(1), P.E154. Available<br />
At: Http://Www.Pubmedcentral.Nih.Gov/Articlerender.<br />
Fcgi?Artid=2270796&Tool=Pmcentrez&Rendertype=<br />
Abstract [Accessed July 25, 2012].<br />
Makita, K. Et Al., 2011. Evidence-Based Identi cation<br />
Of The Most Important Livestock Related Zoonotic<br />
Diseases In <strong>Kampala</strong> , <strong>Uganda</strong>. J. Vet. Med. Sci.,<br />
73(8), Pp.991–1000.<br />
Mart<strong>in</strong>-Prevel, Y. Et Al., 2012. The 2008 Food Price<br />
Crisis Negatively Affected Household Food Security<br />
And Dietary Diversity In Urban Burk<strong>in</strong>a Faso. The<br />
Journal Of Nutrition, 142(9), Pp.1748–55. Available<br />
At: Http://Www.Ncbi.Nlm.Nih.Gov/Pubmed/22833656<br />
[Accessed October 9, 2012].<br />
Massey, K., 2011. Insecurity And Shame: Exploration<br />
Of The Impact Of The Lack Of Sanitation On Women<br />
In The Slums Of <strong>Kampala</strong>, <strong>Uganda</strong>, <strong>Kampala</strong>.<br />
Maxwell, D Et Al., 2000. Urban Livelihoods And<br />
Food And Nutrition Security In Greater Accra,<br />
Ghana, Wash<strong>in</strong>gton D.C. Available At: Http://Www.<br />
Who.Int/Entity/Nutrition/Publications/Foodsecurity/<br />
Livelihoods_foodsecurity_ghana.Pdf [Accessed April<br />
9, 2012].<br />
Maxwell, Daniel & Caldwell, R., 2008. The Cop<strong>in</strong>g<br />
Strategies Index: Field Methods Manual, Wash<strong>in</strong>gton<br />
D.C.<br />
Maxwell, Daniel, Lev<strong>in</strong>, Carol & Csete, J., 1998. Does<br />
Urban Agriculture Help Prevent Malnutrition? Evidence<br />
From <strong>Kampala</strong>, Wash<strong>in</strong>gton D.C.<br />
Mulumba, D. & Mlahagwa, W., 2009. Policy Analysis<br />
Report : Mapp<strong>in</strong>g Migration In <strong>Uganda</strong>, <strong>Kampala</strong>.<br />
Munene, J.C. & Nambi, J., 1996. Understand<strong>in</strong>g<br />
And Help<strong>in</strong>g Street Children In <strong>Uganda</strong>. Community<br />
Development Journal, 31(4), Pp.343–350.<br />
Mwesigye, S., 2010. News Feature: The Forgotten<br />
Poor Of <strong>Kampala</strong>. The Weekly Observer. Available At:<br />
Http://Www.Observer.Ug/Index.Php?Option=Com_co<br />
ntent&Task=View&Id=7979&Itemid=59 [Accessed<br />
September 21, 2012].<br />
Nuwagaba, A., Mwesigwa, D. & Kiguli, J., 2003.<br />
Overview Of Urban Agriculture : A <strong>Uganda</strong>n Case<br />
Study, <strong>Kampala</strong>.<br />
Nzuma, J. & Ochola, S., 2010. Comprehensive Food<br />
Security And Vulnerability Analysis ( Cfsva ) And<br />
Nutrition Assessment: Kenya High Density Urban<br />
Areas, Rome.<br />
Okurut, F.N., Odwee, J.J. & Adebua, A., 2002.<br />
Determ<strong>in</strong>ants Of Regional Poverty In <strong>Uganda</strong>, Nairobi.<br />
Oldewage-Theron, W. & Kruger, R., 2011. Dietary<br />
Diversity And Adequacy Of Women Caregivers In<br />
A Peri-Urban Informal Settlement In South Africa.<br />
Nutrition (B<strong>urban</strong>k, Los Angeles County, Calif.), 27(4),<br />
Pp.420–7. Available At: Http://Www.Ncbi.Nlm.Nih.<br />
Gov/Pubmed/20688475 [Accessed October 9, 2012].<br />
Ravallion, M. & Bidani, B., 1994. How Robust Is A<br />
Poverty Pro le ? The World Bank Economic Review,<br />
8(1), Pp.75–102.<br />
Reis, R.B. Et Al., 2008. Impact Of Environment And<br />
Social Gradient On Leptospira Infection In Urban<br />
Slums. Plos Neglected Tropical Diseases, 2(4),<br />
P.E228. Available At: Http://Www.Pubmedcentral.Nih.<br />
Gov/Articlerender.Fcgi?Artid=2292260&Tool=Pmcent<br />
rez&Rendertype=Abstract [Accessed July 26, 2012].
Ruel, Mt Et Al., 1998. Urban Challenges To Food<br />
And Nutrition Security: A Review Of Food Security,<br />
Health, And Caregiv<strong>in</strong>g In The Cities, Wash<strong>in</strong>gton D.C.<br />
Available At: Http://Www.Mendeley.Com/Research/<br />
Fcnd-Discussion-Papers-Conta<strong>in</strong>-Prelim<strong>in</strong>ary-<br />
Material-Research-Results-Circulated-Prior-Full-Peer-<br />
Review-Order-Stimulate-Discussion-Critical-Comment-It-Expected-Most-Discussion-Papers-Eventually-<br />
Published-Some-1/ [Accessed April 9, 2012].<br />
Savy, M Et Al., 2008. Are Dietary Diversity Scores<br />
Related To The Socio-Economic And Anthropometric<br />
Status Of Women Liv<strong>in</strong>g In An Urban Area In Burk<strong>in</strong>a<br />
Faso? Public Health Nutrition, 11(2), Pp.132–<br />
41. Available At: Http://Www.Ncbi.Nlm.Nih.Gov/<br />
Pubmed/17565760 [Accessed October 9, 2012].<br />
Sealey-Potts, C., 2010. Nutrient Adequacy And<br />
Diversity: Predictors Of Child Growth. Journal Of<br />
The American Dietetic Association, 110(9), P.A25.<br />
Available At: Http://L<strong>in</strong>k<strong>in</strong>ghub.Elsevier.Com/Retrieve/<br />
Pii/S0002822310007923 [Accessed October 9, 2012].<br />
Seaman, J. Et Al., 2000. The Household Economy<br />
Approach A Resource Manual For Practitioners<br />
Developmen. A. D<strong>in</strong>gle & P. Mcdiarmid, Eds., London:<br />
Save The Childrent.<br />
Senior, K., 2010. Leptospirosis And Weil’s Syndrome:<br />
Cause For Concern? The Lancet Infectious Diseases,<br />
10(12), Pp.823–824. Available At: Http://L<strong>in</strong>k<strong>in</strong>ghub.<br />
Elsevier.Com/Retrieve/Pii/S1473309910702681<br />
[Accessed October 17, 2012].<br />
Stites, E. & Akabwai, D., 2012. Life In Town : Migration<br />
From Rural Karamoja To Moroto And Mbale, Boston.<br />
The Wellcome Trust, 2000. Topics In International<br />
Health - Nutrition.<br />
The World Bank, 2011. <strong>Uganda</strong> Data. Available<br />
At: Http://Data.Worldbank.Org/Country/<strong>Uganda</strong><br />
[Accessed September 12, 2012].<br />
Todaro, M.P., 1996. Income Expectations, Rural-Urban<br />
Migration And Employment In Africa. International<br />
Labour Review, 135(3-4), Pp.421–444.<br />
Trowbridge, F.L., 1979. Cl<strong>in</strong>ical And Biochemical<br />
Characteristics Associated With Anthropometric<br />
Nutritional. American Journal Of Cl<strong>in</strong>ical Nutrition,<br />
32(April), Pp.758–766.<br />
Ubos, 2010A. 2010 Mid-Year Projected Population For<br />
Town Councils, <strong>Kampala</strong>.<br />
Ubos, 2012. Consumer Price Index, <strong>Kampala</strong>.<br />
Ubos, 2011. <strong>Uganda</strong> Demographic And Health Survey,<br />
<strong>Kampala</strong>.<br />
Ubos, 2006. <strong>Uganda</strong> Demographic And Health Survey,<br />
<strong>Kampala</strong>.<br />
Ubos, 2004. <strong>Uganda</strong> National Household Survey,<br />
<strong>Kampala</strong>.<br />
Ubos, 2010B. <strong>Uganda</strong> National Household Survey<br />
2009/2010, <strong>Kampala</strong>.<br />
Um<strong>of</strong>ped, 2012. Poverty Status Report: Poverty<br />
Reduction And The National Development Process,<br />
<strong>Kampala</strong>.<br />
Um<strong>of</strong>ped, 2000. <strong>Uganda</strong> Participatory Poverty<br />
Assessment<br />
<strong>Kampala</strong>.<br />
Process: <strong>Kampala</strong> District Report,<br />
Um<strong>of</strong>ped & European Commission, 2002. <strong>Uganda</strong> -<br />
European Community: Country Strategy Paper And<br />
National Indicative Programme For The Period 2002-<br />
2007, <strong>Kampala</strong>.<br />
Umoh, 2010. Health Sector Strategic Plan, <strong>Kampala</strong>.<br />
Umoh, 2011. Strategies Used To Monitor And Address<br />
Stunt<strong>in</strong>g In <strong>Uganda</strong>, <strong>Kampala</strong>.<br />
Umoh, Unicef & Acf, 2009. Nutritional Anthropometric<br />
Survey Of Children Under Five Years Of Age: Informal<br />
Settlements In <strong>Kampala</strong> City, <strong>Kampala</strong>.<br />
83
84<br />
Umowe, 2010. <strong>Uganda</strong> Water Supply Atlas 2010Th<br />
Ed., <strong>Kampala</strong>: M<strong>in</strong>istry Of Water And Environment.<br />
Un-Habitat, 2007. Situation Analysis Of Informal<br />
Settlements In <strong>Kampala</strong>, Nairobi.<br />
Un-Habitat, 2008. State Of The World’s Cities<br />
2010/2011, Nairobi.<br />
Un-Habitat, 2003. The Challenge Of Slums: Global<br />
Report On Human Settlements United Nations Human<br />
Settlements Programme, Ed., London: Earthscan.<br />
Undp, 2011. Human Development Report 2011-<br />
Susta<strong>in</strong>ability And Equity: A Better Future For All, New<br />
York.<br />
Undp & Umolhud, 2008. National Slum Upgrad<strong>in</strong>g<br />
Strategy And Action Plan, <strong>Kampala</strong>.<br />
United Nations, 2011. World Urbanization Prospects<br />
The 2011 Revision, New York.<br />
Wfp, 2009. Emergency Food Security Assessment<br />
Handbook Second., Rome: World Food Programme.<br />
Wfp, 2012. <strong>Uganda</strong> Overview. Available At: Http://Www.<br />
Wfp.Org/Countries/<strong>Uganda</strong>/Overview [Accessed<br />
March 10, 2012].<br />
Who, 1995. Physical Status: The Use And Interpretation<br />
Of Anthropometry, Geneva.<br />
Who & Unicef, 2009. Who Child Growth Standards<br />
And The Identi cation Of Severe Acute Malnutrition In<br />
Infants And Children, Geneva.<br />
Wernham, M., 2004. An Outside Chance: Street<br />
Children And Juvenile Justice - An International<br />
Perspective 1St Ed., London: Consortium For Street<br />
Children.<br />
W<strong>in</strong>kler, D. & Sondergaard, L., 2008. The Ef ciency Of<br />
Public Education In <strong>Uganda</strong>, <strong>Kampala</strong>.<br />
Wodon, Q., 1997. Food Energy Intake And Cost Of<br />
Basic Needs: Measur<strong>in</strong>g Poverty In Bangladesh.<br />
Journal Of Development Studies, 34(2), Pp.66–<br />
101. Available At: Http://Www.Tandfonl<strong>in</strong>e.Com/<br />
Doi/Abs/10.1080/00220389708422512<br />
September 24, 2012].<br />
[Accessed<br />
Young, L., 2003. The “Place” Of Street Children In<br />
<strong>Kampala</strong>, <strong>Uganda</strong>: Marg<strong>in</strong>alisation, Resistance, And<br />
Acceptance In The Urban Environment. Environment<br />
And Plann<strong>in</strong>g D: Society And Space, 21(5), Pp.607–<br />
627. Available At: Http://Www.Envplan.Com/Abstract.<br />
Cgi?Id=D46j [Accessed August 15, 2012].
List <strong>of</strong> Appendices<br />
I SLF Capital Organisation Interview - Example Outl<strong>in</strong>es<br />
II SDI Key Informant Interview Outl<strong>in</strong>e<br />
III Household Questionnaire Form<br />
IV Enumerator Interview Topics<br />
V Details on Food Security Indicators<br />
VI Malnutrition Indicators<br />
VII Photos <strong>of</strong> Units <strong>of</strong> sale<br />
VIII Comparative Livelihood Charts and Tables<br />
85
Appendix I - Example SLF Capital Interview Guides<br />
Human Capital<br />
Health Centre Semi-Structured Interviews<br />
About <strong>the</strong> Health Centre<br />
S<strong>in</strong>ce when has this health center been operat<strong>in</strong>g?<br />
How many employees? Volunteers?<br />
Sources <strong>of</strong> fund<strong>in</strong>g?<br />
What areas does <strong>the</strong> centre serve? (re: catchment)<br />
Where do <strong>the</strong> clients come from? (are <strong>the</strong>re clients from outside this area)<br />
Which organisations or groups provide support, ei<strong>the</strong>r f<strong>in</strong>ancial or practical?<br />
About <strong>the</strong> services<br />
What types <strong>of</strong> services does <strong>the</strong> Health Center <strong>of</strong>fer?<br />
For what services do you refer clients?<br />
Are <strong>the</strong>re any community programs <strong>of</strong>fered? (outreach, etc.)<br />
What are <strong>the</strong> costs to <strong>the</strong> users?<br />
How are <strong>the</strong> services made known to <strong>the</strong> population? (advertis<strong>in</strong>g, word <strong>of</strong> mouth, etc.)<br />
About <strong>the</strong> clientele<br />
How many people does <strong>the</strong> center serve on a weekly/monthly basis? (regular patients, irregular)<br />
Are <strong>the</strong>re seasonal changes <strong>in</strong> <strong>the</strong> amount <strong>of</strong> people served (ra<strong>in</strong>y season higher disease?)<br />
Can you characterize <strong>the</strong> different groups <strong>of</strong> people who come <strong>in</strong>?<br />
-Area <strong>of</strong> residence<br />
-Areas <strong>of</strong> orig<strong>in</strong> (if migrants)<br />
-Parent? Child?<br />
-Age <strong>of</strong> Both?<br />
-Size <strong>of</strong> households<br />
-Type <strong>of</strong> work/Sources <strong>of</strong> <strong>in</strong>come<br />
-Income level<br />
-Sources <strong>of</strong> water<br />
Is malnutrition prevalent amongst any <strong>of</strong> <strong>the</strong>se groups? (is one group more prone than ano<strong>the</strong>r)<br />
What is <strong>the</strong> typical level <strong>of</strong> malnutrition severity that presents <strong>in</strong> <strong>the</strong> health centers?<br />
Do <strong>the</strong> cases <strong>of</strong> malnutrition usually present with o<strong>the</strong>r illnesses? (Diarrhea, measles, cholera?)<br />
Do people who successfully complete a malnutrition program come back for fur<strong>the</strong>r treatment? (readmitted<br />
to feed<strong>in</strong>g programme)<br />
Which illnesses seem to be <strong>the</strong> most prevalent?<br />
-Who are <strong>the</strong> people most affected<br />
Which illnesses seem to be related to seasonal changes?<br />
-Who are <strong>the</strong> people most affected
Physical Capital<br />
Community Shelters <strong>Uganda</strong><br />
General description <strong>of</strong> users<br />
What sort <strong>of</strong> work does CSU do?<br />
What programmes do <strong>the</strong>y have <strong>in</strong> <strong>Kampala</strong>?<br />
Where?<br />
How are recipients determ<strong>in</strong>ed?<br />
How is it funded?<br />
Who are <strong>the</strong> primary users <strong>of</strong> <strong>the</strong> service <strong>in</strong> <strong>Kampala</strong>?<br />
Where do <strong>the</strong> users come from?<br />
Description <strong>of</strong> <strong>the</strong> users<br />
Can you characterize <strong>the</strong> different groups <strong>of</strong> users?<br />
Area <strong>of</strong> orig<strong>in</strong><br />
Families? S<strong>in</strong>gle parents? Ages?<br />
H (health education, nutrition, knowledge, capacity to work)<br />
S<br />
P (Rented Owned? Watsan below)<br />
N (use <strong>of</strong> land?)<br />
F (below)<br />
Wat/san<br />
Where <strong>in</strong> <strong>Kampala</strong> are <strong>the</strong> primary projects related to watsan<br />
How are <strong>the</strong> areas determ<strong>in</strong>ed<br />
Who are <strong>the</strong> target populations/where are <strong>the</strong> areas (delimitations)<br />
Legal awareness<br />
Can you describe <strong>the</strong> services provided?<br />
Is it advocacy or legal representation provided? Land rights?<br />
Economic<br />
What programmes?<br />
What sort <strong>of</strong> <strong>in</strong>come generat<strong>in</strong>g activities?<br />
Labour assistance?<br />
Credit services?<br />
Sav<strong>in</strong>gs?<br />
Hous<strong>in</strong>g<br />
What sort <strong>of</strong> hous<strong>in</strong>g is provided <strong>in</strong> <strong>Kampala</strong>?<br />
Size based on number <strong>of</strong> people?<br />
Families? S<strong>in</strong>gles?<br />
How are <strong>the</strong> beneficiaries determ<strong>in</strong>ed?<br />
Characterizations <strong>of</strong> beneficiaries <strong>in</strong> which areas are hous<strong>in</strong>g provided?
Natural Capital<br />
M<strong>in</strong>istry for Lands, Hous<strong>in</strong>g and Urban Development<br />
What are <strong>the</strong> plann<strong>in</strong>g objectives for <strong>Kampala</strong>? How have <strong>the</strong>y changed <strong>in</strong> <strong>the</strong> past 10 years?<br />
What is <strong>the</strong> M<strong>in</strong>istry responsible for <strong>in</strong> <strong>Kampala</strong>?<br />
Have <strong>the</strong>re been any formal <strong>in</strong>vestigations relat<strong>in</strong>g to <strong>the</strong> population <strong>in</strong>crease and <strong>the</strong> <strong>urban</strong> <strong>poor</strong>?<br />
What is <strong>the</strong> state <strong>of</strong> <strong>the</strong> art on <strong>the</strong> subject?<br />
Have <strong>the</strong>re been any formal <strong>in</strong>vestigations <strong>in</strong> to <strong>the</strong> <strong>in</strong>formal settlements? (slums)<br />
What are <strong>the</strong> current national policies regard<strong>in</strong>g slums <strong>in</strong> <strong>Kampala</strong>, and nationwide?<br />
Are policies seen as effective methods <strong>of</strong> <strong>in</strong>tervention?<br />
Which, <strong>in</strong> yours and <strong>the</strong> op<strong>in</strong>ion <strong>of</strong> your colleagues, would you assume to be <strong>the</strong> slums that have <strong>the</strong><br />
worst circumstances when regard<strong>in</strong>g th<strong>in</strong>gs like poverty, <strong>in</strong>frastructure, and access to basic services?<br />
How do you believe slum-dwellers perceive <strong>the</strong> government?
Appendix II: SDI Key Informant Interviews<br />
About you<br />
What is your role <strong>in</strong> <strong>the</strong> organization? In <strong>the</strong> community?<br />
What is your pr<strong>of</strong>ession?<br />
How long have you been with SDI/NSDF?<br />
About <strong>the</strong> organization<br />
How many members <strong>of</strong> NSDF are <strong>in</strong> your area?<br />
How long has NSDF been active <strong>in</strong> your area?<br />
How many people does NSDF employ as sav<strong>in</strong>gs collectors/o<strong>the</strong>r work <strong>in</strong> your area?<br />
What programs does NSDF <strong>of</strong>fer <strong>in</strong> your area? Which are <strong>the</strong> most popular?<br />
About <strong>the</strong> issues<br />
Can you describe <strong>the</strong> situation <strong>of</strong> food? Is it always available? Is it affordable? Is it fresh and healthy?<br />
How do most people get <strong>the</strong>ir food/where do <strong>the</strong>y shop (if purchase)?<br />
Is <strong>the</strong>re any agriculture <strong>in</strong> <strong>the</strong> area?<br />
What is <strong>the</strong> hardest th<strong>in</strong>g for residents <strong>in</strong> your area when consider<strong>in</strong>g food?<br />
Is <strong>the</strong>re a government health centre nearby?<br />
What are <strong>the</strong> ma<strong>in</strong> illnesses? Do <strong>the</strong>y change with <strong>the</strong> time <strong>of</strong> year?<br />
Do you know if malnutrition is an issue or not <strong>in</strong> your area?<br />
Where do most people get <strong>the</strong>ir water? Do <strong>the</strong>y pay for it? Is it always available?<br />
Are <strong>the</strong>re any o<strong>the</strong>r popular sources <strong>of</strong> water?<br />
What are <strong>the</strong> typical types <strong>of</strong> employment?<br />
How many jobs/sources <strong>of</strong> <strong>in</strong>come do people have, on average?<br />
Can you describe <strong>the</strong> system <strong>of</strong> rent<strong>in</strong>g or own<strong>in</strong>g a house?<br />
What are <strong>the</strong> ma<strong>in</strong> expenses for an average person? Daily? Monthly?<br />
What are <strong>the</strong> ma<strong>in</strong> issues associated with liv<strong>in</strong>g <strong>in</strong> your area?<br />
What are <strong>the</strong> ma<strong>in</strong> benefits associated with liv<strong>in</strong>g <strong>in</strong> your area?<br />
What, <strong>in</strong> your op<strong>in</strong>ion, should be <strong>the</strong> first th<strong>in</strong>g to be improved <strong>in</strong> your area?
Appendix III - Questionnaire Form<br />
DIVISION<br />
HOUSEHOLD<br />
ID<br />
PARISH<br />
1. NUMBER OF ROOMS IN THE HOUSE<br />
2.<br />
HEAD OF HOUSEHOLD<br />
Person responsible for <strong>the</strong> runn<strong>in</strong>g <strong>of</strong> <strong>the</strong> household<br />
every day, and who makes f<strong>in</strong>al decisions<br />
regard<strong>in</strong>g distribution and use <strong>of</strong> resources<br />
INTERVIEWER<br />
NAME<br />
Male 1 Age<br />
Female 2<br />
3<br />
Total number <strong>of</strong> members <strong>of</strong> <strong>the</strong><br />
household (<strong>in</strong>clud<strong>in</strong>g <strong>in</strong>terviewee)<br />
COMPOSITION OF HOUSEHOLD MALE FEMALE<br />
4<br />
Number <strong>of</strong> children under <strong>the</strong> age <strong>of</strong> 6<br />
months<br />
5<br />
Number <strong>of</strong> children between <strong>the</strong> ages <strong>of</strong><br />
6 and 59 months<br />
6<br />
Number <strong>of</strong> children between 5 and 15<br />
years <strong>of</strong> age<br />
7<br />
Of <strong>the</strong> children between 5 and 15 years <strong>of</strong><br />
age, how many attend school?<br />
8<br />
Number <strong>of</strong> adults between <strong>the</strong> ages <strong>of</strong> 16<br />
and 60<br />
9<br />
Number <strong>of</strong> adults over <strong>the</strong> age <strong>of</strong> 60<br />
10<br />
IF THE CHILDREN DO NOT ATTEND SCHOOL,<br />
WHAT IS THE REASON? MARK ALL THAT<br />
APPLY<br />
School fees/costs<br />
1<br />
Transportation<br />
2<br />
The children must work<br />
3<br />
School is not important<br />
4<br />
Discrim<strong>in</strong>ation (gender, religion, etc)<br />
5<br />
There is no school<br />
6<br />
O<strong>the</strong>r<br />
7<br />
No response<br />
98<br />
11 HOW LONG HAVE YOU LIVED IN KAMPALA?<br />
Born here (go to question 14) 1<br />
Less than 6 months<br />
2<br />
Less than 2 years<br />
3<br />
Between 2 - 6 years<br />
4<br />
Between 7 - 16 years<br />
5<br />
More than 16 years<br />
6<br />
NOTES<br />
DATE _______/_______ / 2012<br />
12<br />
BEFORE MOVING TO KAMPALA, WHICH<br />
AREA DID YOU LIVE? MARK (R) FOR<br />
RURAL AREA OR (U) FOR URBAN<br />
Acholi Lango<br />
Ankole Sebel<br />
Buganda Teso<br />
Bugis Toro<br />
Bukedi West Nile<br />
Bunyoro Outside <strong>of</strong> <strong>Uganda</strong><br />
Busoga<br />
Karamoja<br />
Kigezi<br />
(specify country below)<br />
14<br />
WHAT LANGUAGE DO YOU SPEAK<br />
WITH YOUR FAMILY IN THE HOUSE?<br />
1 English 10 Masaba<br />
2 Luganda 11 Nyankore<br />
3 Swahili 12 Rwanda<br />
4 Adhola 13 Saamia<br />
5 French 14 Soga<br />
6 Gwere 15 Teso<br />
7 Karamojong 16 Tooro<br />
8 Lugbara 17 O<strong>the</strong>r (specify)<br />
9 Luo<br />
ZONE<br />
13<br />
IF YOU MOVED TO KAMPALA, WHAT<br />
WERE THE MAIN REASONS?<br />
MARK ALL THAT APPLY<br />
To f<strong>in</strong>d work<br />
1<br />
For services available <strong>in</strong> <strong>the</strong> city (school, health,<br />
<strong>urban</strong> life, electricity, etc.)<br />
2<br />
Social pressure<br />
3<br />
Less exposure to natural hazard<br />
4<br />
To reunite with family <strong>in</strong> <strong>Kampala</strong>/family reasons 5<br />
Better hous<strong>in</strong>g conditions<br />
O<strong>the</strong>r (specify):<br />
6<br />
No response 98<br />
7
15 WHAT IS YOUR RELIGION?<br />
Christian<br />
Muslim<br />
Traditional<br />
None<br />
O<strong>the</strong>r (specify)<br />
No response<br />
16<br />
Owner<br />
Mark all that apply<br />
Renter<br />
Mark one<br />
WHAT IS YOUR HOUSING STATUS?<br />
MARK WITH AN (X)<br />
Homeless<br />
O<strong>the</strong>r (specify)<br />
No response<br />
TENANT<br />
LAND STRUCTURE<br />
SUBTENANT<br />
FOR FREE<br />
98<br />
SUBTENANT<br />
FOR SERVICES/<br />
EXCHANGE<br />
17<br />
ARE YOU WORRIED THAT YOU MAY BE<br />
EVICTED FROM YOUR RESIDENCE?<br />
Yes No (skip to<br />
question 19)<br />
Does not know/Refuse to answer<br />
1 2 98<br />
IF YES, FOR WHAT REASONS?<br />
18<br />
MARK ALL THAT APPLY<br />
Rent owed<br />
Risk <strong>of</strong> eviction by <strong>the</strong> Local authorities<br />
Risk <strong>of</strong> eviction by National authorities<br />
Risk <strong>of</strong> eviction by landlord<br />
The documents I have do not protect me (no<br />
contract, no identity documents, etc.)<br />
By my spouse/family member<br />
O<strong>the</strong>r (specify)<br />
NOTES<br />
1<br />
2<br />
5<br />
6<br />
7<br />
99<br />
1<br />
2<br />
3<br />
4<br />
5<br />
6<br />
7<br />
ARE YOU A MEMBER OF ANY<br />
19 GROUPS OR ASSOCIATIONS IN<br />
YOUR COMMUNITY?<br />
Yes (please list name and<br />
No<br />
type below)<br />
20<br />
WHERE DO YOU GET YOUR DRINKING<br />
WATER?<br />
RAINY SEASON/DRY SEASON R D<br />
Tap/city water network 1 1<br />
Protected well/spr<strong>in</strong>g 2 2<br />
Unprotected/Natural well/spr<strong>in</strong>g 3 3<br />
Ra<strong>in</strong>water harvest<strong>in</strong>g 4 4<br />
Buy from water merchant 5 5<br />
Bottled water<br />
O<strong>the</strong>r (specify)<br />
6 6<br />
7 7<br />
No response 98 98<br />
21 DO YOU PAY FOR WATER?<br />
1 Yes 2 No<br />
How much for one 20L<br />
jerry can? (if o<strong>the</strong>r unit<br />
is used, please specify)<br />
TYPE OF<br />
22 STORAGE<br />
CONTAINER<br />
Clay pot<br />
1<br />
Jerry can<br />
2<br />
Bucket<br />
3<br />
O<strong>the</strong>r (specify)<br />
24<br />
Storage<br />
Transport<br />
WATER AND SANITATION<br />
4<br />
TYPE OF<br />
23 TRANSPORT<br />
CONTAINER<br />
Clay pot<br />
1<br />
Jerry can<br />
2<br />
Bucket<br />
3<br />
O<strong>the</strong>r (specify)<br />
ARE THE CONTAINERS COVERED?<br />
IF YES, MARK WITH AN (X)<br />
4
25<br />
COLLECTING WATER FROM A WELL<br />
OR STREET FOUNTAIN<br />
Number <strong>of</strong> times per day<br />
Volume <strong>of</strong> conta<strong>in</strong>ers used<br />
Number <strong>of</strong> conta<strong>in</strong>ers for each trip<br />
Who collects <strong>the</strong><br />
water?<br />
Time needed to go to <strong>the</strong> water<br />
po<strong>in</strong>t (round trip + wait<strong>in</strong>g time)<br />
Distance to <strong>the</strong> most <strong>of</strong>ten used<br />
water source<br />
26<br />
DO YOU USE LATRINES?<br />
FOLLOW THE ARROWS<br />
Yes<br />
<br />
26A THE LATRINES<br />
ARE: <br />
In <strong>the</strong> house<br />
At a neighbours<br />
Public<br />
1<br />
2<br />
3<br />
No<br />
<br />
26B WHY NOT? <br />
Too expensive<br />
Not safe<br />
Too dirty<br />
It is too far<br />
O<strong>the</strong>r (specify)<br />
27A. TYPES OF 27B WHERE DO<br />
LATRINES <br />
YOU GO? <br />
Simple pit latr<strong>in</strong>e 1 River/Canal 1<br />
Dra<strong>in</strong>able pit latr<strong>in</strong>e 2 Dra<strong>in</strong>age 2<br />
Flush toilet 3 Plastic bags 3<br />
ECOSAN 4 Green spaces 4<br />
O<strong>the</strong>r (specify)<br />
O<strong>the</strong>r (specify)<br />
5<br />
28<br />
WHERE DO YOU PUT YOUR<br />
HOUSEHOLD RUBBISH?<br />
B<strong>in</strong>s 1 Wasteland 7<br />
Burn<strong>in</strong>g 2 Open channel/dra<strong>in</strong> 8<br />
In <strong>the</strong> street 4 O<strong>the</strong>r (Specify)<br />
Swamp/River/<br />
10<br />
Natural areas<br />
5<br />
Secondary landfill 6 No response 98<br />
NOTES<br />
1<br />
2<br />
3<br />
4<br />
5<br />
5<br />
WHAT ARE THE TIMES THAT YOU WASH<br />
29<br />
YOUR HANDS? MARK (X) ALL THAT APPLY<br />
After us<strong>in</strong>g <strong>the</strong> toilet<br />
Wash<strong>in</strong>g <strong>the</strong> babies bottom<br />
Before feed<strong>in</strong>g <strong>the</strong> child<br />
Before food preparation<br />
Before eat<strong>in</strong>g<br />
30 DO YOU TREAT YOUR DRINKING WATER?<br />
Yes<br />
1<br />
No<br />
2<br />
What method do you use?<br />
Boil Chlor<strong>in</strong>ation Solar (Sodis) Filter O<strong>the</strong>r<br />
(specify)<br />
1 2 3 4<br />
31 DESCRIBE THE AVAILABILITY OF WATER<br />
Dry<br />
Season<br />
32 COULD YOU TELL US WHAT THE<br />
YOUNGEST CHILD WHO IS NOT CURRENTLY<br />
BREASTFEEDING ATE AND DRANK YESTERDAY?<br />
Read <strong>the</strong> list <strong>of</strong> foods below and mark with an (X) if yes<br />
Millet, sorghum, maize, rice, gruel or any o<strong>the</strong>r cereal?<br />
Potatoes, cassava, any o<strong>the</strong>r food based on roots or<br />
tubers<br />
Vegetables rich <strong>in</strong> vitam<strong>in</strong> A (pumpk<strong>in</strong>, carrots, sweet<br />
potatoes, mangoes, papayas, etc.?)<br />
O<strong>the</strong>r fruits and vegetables? (bananas, apples, avocados,<br />
tomatoes, etc.)<br />
Meat or poultry, fish or seafood (beef, mutton, goat,<br />
pork, liver, <strong>of</strong>fal, etc.)<br />
Eggs<br />
Food based on peas, lentils, beans, soy, groundnuts?<br />
Dairy products (cheese, yoghurt, milk, fresh cream,<br />
etc.)<br />
Food cooked with oil or fat?<br />
Ra<strong>in</strong>y<br />
Season<br />
Good, enough water is available at all<br />
times<br />
1 1<br />
Fair, water is available but <strong>the</strong>re is low<br />
pressure<br />
2 2<br />
Poor, water is unavailable or <strong>in</strong>consistent 3 3<br />
FOOD AND HEALTH
COULD YOU TELL US ABOUT THE FOOD YOU HAVE CONSUMED IN PAST 24 HOURS?<br />
33 Number <strong>of</strong> times <strong>the</strong> CHILDREN<br />
UNDER THE AGE OF 2 have eaten<br />
<strong>in</strong> <strong>the</strong> past 24 hours?<br />
34 Number <strong>of</strong> times <strong>the</strong><br />
RESPONDANT has eaten?<br />
35. Sources <strong>of</strong> food<br />
mark all that apply<br />
0 1 0 1 Purchase 1<br />
1 2 1 2 Exchange/barter 2<br />
2 3 2 3 Gift 3<br />
3 4 3 4 Household farm<strong>in</strong>g/livestock 4<br />
More than 3 7 More than 3 5 Food aid 5<br />
No children under 2 8 O<strong>the</strong>r (specify) 6<br />
No response 98 No response 98 No response 98<br />
36 WHICH FOODS HAS THE RESPONDANT EATEN IN THE LAST 24 HOURS?<br />
Read <strong>the</strong> list below and mark an (X) if <strong>the</strong> respondent has eaten that food<br />
Cereals (Maize, sorghum, bread, rice, millet, wheat, biscuits)<br />
Roots (potatoes, yams, cassava, sweet potatoes) or Matoke<br />
Vegetables? (Tomatoes, eggplants, courgettes, cabbage, turnips, cassava leaves, any o<strong>the</strong>r wild leaves)<br />
Fruits? (Mango,papaya, banana, etc.)<br />
Meat or poultry? (Beef, mutton, chicken, goat, pork, bush meat,liver, <strong>of</strong>fal-kidneys, spleen, lung, etc)<br />
Eggs?<br />
Fish or seafood?<br />
Food made with peas, lentils, beans?<br />
Dairy products? (cheese, yogurt, milk, fresh cream, etc)<br />
Oils and fats? (palm oil or o<strong>the</strong>r vegetable oil, butter, mayonnaise, etc.)<br />
Sugar? (granulated or cubed, sweet dr<strong>in</strong>ks, honey, jam, candies, etc.)<br />
O<strong>the</strong>r foods? (condiments, c<strong>of</strong>fee, tea, etc.)<br />
37 WHAT ARE THE MAIN PROBLEMS ASSOCIATED WITH, IF ANY, THAT YOU ENCOUNTER LIVING IN<br />
THIS NEIGHBOURHOOD?<br />
WRITE DOWN THE PROBLEM AND ASK THEM TO DESCRIBE IT, HOW THEY MANAGE THESE<br />
DIFFICULTIES, AND WHO IS IN CHARGE OF THEM IN THE COMMUNITY (POLICE, LC, ETC...)
38 CAN YOU TELL US ABOUT THE MEALS YOU’VE HAD IN THE LAST 30 DAYS?<br />
IF THEY RESPOND “YES”, ASK HOW OFTEN WITH THE POSSIBLE ANSWERS BELOW<br />
POSSIBLE<br />
ANSWERS:<br />
0 - No/Never<br />
1 - Yes, once or twice per week<br />
In <strong>the</strong> last 30 days have you been worried your household would not have enough food?<br />
2 - Yes, once or twice every 2 weeks<br />
3 - Yes, multiple times every week<br />
...was anybody <strong>in</strong> your household unable to eat some <strong>of</strong> <strong>the</strong> food you usually prefer to eat because <strong>of</strong> a lack <strong>of</strong><br />
resources?<br />
...did anybody <strong>in</strong> your household have to eat <strong>the</strong> same th<strong>in</strong>g every day?<br />
...did anybody <strong>in</strong> your household have to eat food that would usually ra<strong>the</strong>r not eat?<br />
...did anybody <strong>in</strong> your household have to reduce <strong>the</strong> amount eaten dur<strong>in</strong>g a meal?<br />
...did it happen that <strong>the</strong>re was noth<strong>in</strong>g to eat at all <strong>in</strong> your house?<br />
...has anybody <strong>in</strong> your household gone a whole day without eat<strong>in</strong>g?<br />
...did you have to send a family member to beg because <strong>of</strong> a lack <strong>of</strong> resources to buy food?<br />
...did you have to sell non-productive assets (jewellery, carpets, house furniture, cloth<strong>in</strong>g, etc.)?<br />
...did you have to sell productive assets (tools and mach<strong>in</strong>es for work, materials for work, etc.)?<br />
...did you have to stop education or health expenditures?<br />
....did you have to get <strong>in</strong>to debt by tak<strong>in</strong>g out a loan or mortgage?<br />
...did you have to reduce all expenses?<br />
...did you have to send at least one family member away for work?<br />
...did you have to send all family members away for work?<br />
...did anybody <strong>in</strong> your household have to reduce <strong>the</strong> usual number <strong>of</strong> daily meals because <strong>of</strong> a lack <strong>of</strong> food?<br />
...did anybody <strong>in</strong> your household go to bed hungry at night?
39<br />
MOST OF THE TIME, WHERE DO YOU GO<br />
FIRST TO SEEK ADVICE OR TREATMENT<br />
FOR ILLNESS?<br />
Nowhere, it will pass<br />
1<br />
Traditional healer<br />
2<br />
Government health centre/hospital 3<br />
Private cl<strong>in</strong>ic<br />
5<br />
Pharmacy<br />
6<br />
Parents/Family/Friends<br />
O<strong>the</strong>rs (specify)<br />
7<br />
No response<br />
DO YOU USE HEALTH SERVICES AS<br />
40<br />
OFTEN AS YOU NEED TO?<br />
Yes (skip to question 42)<br />
No<br />
No response<br />
41<br />
IF YOU ANSWERED NO TO THE PREVIOUS<br />
QUESTION, WHAT ARE THE REASONS?<br />
MARK ALL THAT APPLY<br />
No facilities nearby<br />
1<br />
Wait<strong>in</strong>g time too long<br />
2<br />
Facilities not adequately equipped<br />
3<br />
Staff shortcom<strong>in</strong>gs<br />
4<br />
Consultations too expensive<br />
5<br />
Tests too expensive<br />
6<br />
Medic<strong>in</strong>e too expensive<br />
7<br />
Lack <strong>of</strong> medic<strong>in</strong>e<br />
8<br />
Not aware <strong>of</strong> <strong>the</strong>ir existence<br />
9<br />
Staff attitude not good<br />
O<strong>the</strong>r (specify)<br />
10<br />
No response<br />
42 DO YOU USE MOSQUITO NETS WITHIN THE<br />
HOUSEHOLD?<br />
Yes, untreated nets (without <strong>in</strong>secticide)<br />
Yes, treated nets (with <strong>in</strong>secticide)<br />
No<br />
No response<br />
NOTES<br />
8<br />
98<br />
1<br />
2<br />
98<br />
11<br />
98<br />
1<br />
2<br />
3<br />
98<br />
43<br />
WHO SLEEPS UNDER THE MOSQUITO<br />
NETS? (MARK (X) FOR ALL THAT APPLY)<br />
Adult Men Adult Women Children<br />
44<br />
COULD YOU TELL US ABOUT THE<br />
ILLNESSES YOUR HOUSEHOLD HAS<br />
EXPERIENCED IN THE LAST MONTH?<br />
MARK HOW MANY TIMES<br />
THEY HAVE SOUGHT<br />
TREATMENT IN THE PAST<br />
MONTH FOR EACH<br />
Diarrhoea<br />
Malaria<br />
Respiratory illness<br />
Measles<br />
Sk<strong>in</strong> Infection<br />
Chronic Disease (HIV/<br />
AIDS, Hepatitis, etc.)<br />
O<strong>the</strong>r (specify)<br />
WOULD YOU TELL US ABOUT YOUR HOUSE-<br />
HOLD’S 5 MAIN DAILY EXPENDITURES?<br />
45. List 1 to 5 ma<strong>in</strong><br />
expenditures<br />
1 Food<br />
2 Water<br />
3 Sanitation, waste<br />
4 Hygiene products<br />
5 Hous<strong>in</strong>g/rent<br />
6 Transportation<br />
7 Electricity<br />
8 Telephone<br />
9 Health<br />
10 Cloth<strong>in</strong>g<br />
11Fuel (wood, etc)<br />
12 Education<br />
13 Debt repayment<br />
14 Loan to o<strong>the</strong>rs<br />
15 Sav<strong>in</strong>gs<br />
16 Tobacco/Alcohol<br />
17 O<strong>the</strong>r (specify)<br />
Respondent<br />
INCOME AND EXPENSES<br />
1-5 46<br />
Amount<br />
(Shill<strong>in</strong>gs)<br />
Children<br />
under <strong>the</strong><br />
age <strong>of</strong> 5<br />
47 Change <strong>of</strong><br />
price <strong>in</strong> <strong>the</strong> last<br />
year (+/=/-)
48 SOURCE OF<br />
INCOME<br />
1<br />
2<br />
3<br />
4<br />
5<br />
6<br />
7<br />
8<br />
9<br />
10<br />
11<br />
53<br />
49 WHO<br />
(FATHER, MOTHER, GRAND-<br />
PARENT, AUNT, UNCLE, CHILD,<br />
ETC...)<br />
IF YOU HAVE MOVED TO KAMPALA FROM<br />
ANOTHER AREA, HAS YOUR TYPE OF WORK<br />
CHANGED?<br />
Yes (please list <strong>the</strong> old type <strong>of</strong> work below, eg<br />
farmer)<br />
54<br />
No<br />
(skip to<br />
question 55)<br />
IF YOU ANSWERED YES TO THE PREVIOUS<br />
QUESTION, WHY DID YOU NOT CONTINUE<br />
THIS TYPE OF WORK IN KAMPALA?<br />
50 SITUATION<br />
1= EVERY DAY<br />
2= A FEW TIMES/WEEK<br />
3=ONCE PER WEEK OR<br />
LESS<br />
55<br />
Yes<br />
1<br />
<br />
No<br />
2<br />
<br />
DAILY INCOMES<br />
51 LOW<br />
AMOUNT<br />
52 HIGH<br />
AMOUNT<br />
HAS YOUR HOUSEHOLD BEEN IN DEBT<br />
WITHIN THE PREVIOUS YEAR?<br />
FOLLOW ARROWS<br />
56 FOR WHICH EXPENSE: 57 LOAN TAKEN WITH<br />
Food 1 Bank 1<br />
Medical costs/illness<br />
2<br />
NGO/Local<br />
association<br />
2<br />
Bus<strong>in</strong>ess 3 Family 3<br />
Transportation/travel 4 Neighbour 4<br />
Wedd<strong>in</strong>g/funeral 5 Shopkeeper 5<br />
School expenses 6 Loan shark 6<br />
O<strong>the</strong>r (specify)<br />
O<strong>the</strong>r (specify)<br />
58. HOW MUCH WAS<br />
BORROWED?<br />
59 .HAVE YOU DONE ANYTHING<br />
EXCEPTIONAL TO ENSURE YOU HAVE<br />
ENOUGH MONEY?<br />
60 PLEASE MARK THE FORMS OF SUPPORT YOU HAVE RECEIVED IN THE LAST MONTH, IF ANY<br />
FROM WHOM Friends/Family Credit/Sav<strong>in</strong>gs Church Community Government UN/NGO O<strong>the</strong>r<br />
FORM OF SUPPORT <br />
Cash<br />
Remittance<br />
Food<br />
Labour<br />
O<strong>the</strong>r (specify)<br />
Group Groups Leaders<br />
7<br />
7
Thank you for your time!<br />
To <strong>the</strong> <strong>in</strong>terviewer: please note observations on <strong>the</strong> presence <strong>of</strong> human or animal faeces, stagnant<br />
water, or livestock that are near to <strong>the</strong> household.<br />
If you have any questions, please call Patrick : 0781057237
Appendix IV: Enumerator Discussion Topics<br />
Thanks for help<strong>in</strong>g with <strong>the</strong> study<br />
Initial reception by <strong>the</strong> respondents (open and will<strong>in</strong>g or closed and skeptical?)<br />
F<strong>in</strong>al perceptions <strong>of</strong> <strong>the</strong> respondent’s op<strong>in</strong>ion on <strong>the</strong> questionnaire<br />
Your perceptions on <strong>the</strong> questionnaire form (difficult to understand or expla<strong>in</strong>?, etc.)<br />
Your perceptions on adm<strong>in</strong>ister<strong>in</strong>g <strong>the</strong> questionnaire<br />
How long did an average questionnaire take? Shortest and longest as well.<br />
Trends noticed (between ages, genders, children/none, etc.)<br />
What topics were too sensitive? What topics were <strong>the</strong>y happy to talk more about?<br />
Most commonly cited issue (question 37)<br />
Observations? (last sheet <strong>of</strong> questionnaire)<br />
Thank you once aga<strong>in</strong>.
Appendix V – Food Security Indicators<br />
As adapted from FANTA and ACF guidance notes<br />
Dietary Diversity Scores<br />
IDDS is an <strong>in</strong>dicator for <strong>in</strong>dividual nutrient adequacy, where <strong>the</strong> HDDS is used as a proxy measure <strong>of</strong> <strong>the</strong><br />
socio-economic level <strong>of</strong> <strong>the</strong> household.<br />
To identify a dietary diversity score for an <strong>in</strong>dividual or a household, a 24-hour recall <strong>of</strong> <strong>the</strong> food groups <strong>the</strong>y<br />
had consumed <strong>in</strong> <strong>the</strong> past 24 hours is completed. This is done by read<strong>in</strong>g a list <strong>of</strong> food groups and example<br />
foods that are typical to <strong>the</strong> local context. Each time a respondent <strong>in</strong>dividual or household has stated eat<strong>in</strong>g<br />
that food <strong>in</strong> <strong>the</strong> recall period, an (X) is marked on <strong>the</strong> questionnaire.<br />
The number <strong>of</strong> food groups are <strong>the</strong>n tallied. This number becomes <strong>the</strong> DDS. The score itself is <strong>the</strong>n measured<br />
aga<strong>in</strong>st certa<strong>in</strong> thresholds to give a general categorization <strong>of</strong> Poor, Borderl<strong>in</strong>e, or Acceptable.<br />
When compared across a population and with regular monitor<strong>in</strong>g, <strong>the</strong> DDS scores can act as a proxy measure<br />
<strong>of</strong> food security.<br />
Food Groups and Weights<br />
HDDS Food Groups (Score: 0-12) IDDS (Children) Food Groups (Score: 0-8)<br />
No Food group Food items No Food group<br />
1 Cereals (Staples) Maize , maize porridge, rice,<br />
sorghum, millet pasta, bread<br />
2 Roots & Tubers<br />
(Staples)<br />
3 Pulses / legumes /<br />
nuts<br />
Cassava, potatoes and sweet<br />
potatoes<br />
Beans, Peas, groundnuts and<br />
cashew nuts<br />
1<br />
Gra<strong>in</strong>s, roots or tubers<br />
2 Vitam<strong>in</strong> A-rich plant foods<br />
3 O<strong>the</strong>r fruits or vegetables<br />
4 Vegetables Vegetables and leaves 4 Meat, poultry, fish, seafood<br />
5 Fruit Fruit 5 Eggs<br />
6 Meat, poultry, <strong>of</strong>fal Beef, goat, poultry, pork, eggs<br />
and fish<br />
6 Pulses/legumes/nuts<br />
7 Fish & seafood 7 Milk and milk products<br />
8 Milk / Dairy products Milk, yogurt, cheese or o<strong>the</strong>r 8 Foods cooked <strong>in</strong> oil/fat<br />
9 Eggs<br />
10 Sugar Sugar, sugar products, honey<br />
11 Oils Oils, fats and butter<br />
12 Condiments Tea, C<strong>of</strong>fee, Spices
Food Consumption Score<br />
Similar to <strong>the</strong> dietary diversity scores, <strong>the</strong> food consumption score is an <strong>in</strong>dex that takes <strong>in</strong>to account not only<br />
<strong>the</strong> diversity <strong>of</strong> a diet, but by account<strong>in</strong>g for frequency and quality, a more representative <strong>in</strong>dicator <strong>of</strong> an<br />
<strong>in</strong>dividual’s food security. This is done through weight<strong>in</strong>g different food groups based on <strong>the</strong>ir nutritional and<br />
caloric values.<br />
The data is collected <strong>in</strong> a similar manner, though traditionally <strong>the</strong> recall period is 7 days. For this study, 24<br />
hours were used to account for respondent fatigue. This may have had an impact on <strong>the</strong> results as this<br />
adaptation has not been validated <strong>in</strong> previous studies.<br />
The results <strong>of</strong> <strong>the</strong> scores can <strong>the</strong>m be cross-tabulated with o<strong>the</strong>r food security <strong>in</strong>dicators to ga<strong>in</strong> a more<br />
holistic viewpo<strong>in</strong>t <strong>of</strong> <strong>the</strong> food security situation <strong>of</strong> a household.<br />
FoodGroupsandWeights<br />
No Foodgroup Fooditems Weights Reasonforweights<br />
1 Cereals<br />
(Staples)<br />
2 Tubers<br />
(Staples)<br />
Maize, maize porridge, rice,<br />
sorghum,milletpasta,bread<br />
Cassava, potatoes and sweet<br />
potatoes<br />
3 Pulses Beans, Peas, groundnuts and<br />
cashewnuts<br />
2<br />
Energy dense, prote<strong>in</strong> content lower and <strong>poor</strong>er<br />
qualitythanlegumes,micronutrients<br />
2 Energy dense, prote<strong>in</strong> content lower and <strong>poor</strong>er<br />
qualitythanlegumes,micronutrients<br />
3 Energy dense, high amounts <strong>of</strong> prote<strong>in</strong> but <strong>of</strong> lower<br />
qualitythanmeats,micronutrients,lowfat.<br />
4 Vegetables Vegetablesandleaves 1 Lowenergy,lowprote<strong>in</strong>,n<strong>of</strong>at,micronutrients<br />
5 Fruit Fruits 1 Lowenergy,lowprote<strong>in</strong>,n<strong>of</strong>at,micronutrients<br />
6 Meat and<br />
fish<br />
Beef, goat, poultry, pork, eggs<br />
andfish<br />
4 Highest quality prote<strong>in</strong>, easily absorbable<br />
micronutrients, energy dense, fat. Even when<br />
consumed <strong>in</strong> small quantities, improvements to <strong>the</strong><br />
quality<strong>of</strong>dietarelarge.<br />
7 Milk Milkyogurtando<strong>the</strong>rdiary 4 Highest quality prote<strong>in</strong>, micronutrients, vitam<strong>in</strong> A,<br />
energy. However, milk could be consumed only <strong>in</strong><br />
very small amounts and should <strong>the</strong>n be treated as<br />
condiment and <strong>the</strong>refore reclassification <strong>in</strong> such<br />
casesisneeded.<br />
8 Sugar Sugarandsugarproducts 0.5 Emptycalories.Usuallyconsumed<strong>in</strong>smallquantities.<br />
9 Oils Oils,fatsandbutter 0.5 Energy dense but usually no o<strong>the</strong>r micronutrients.<br />
Usuallyconsumed<strong>in</strong>smallquantities.<br />
10 Condiments Condiments 0
Household Food Insecurity Access Scale<br />
This scale measures food security and its severity at a household level. A set <strong>of</strong> 9 questions are used (see<br />
question 38 on <strong>the</strong> questionnaire <strong>in</strong> Annex III) to dist<strong>in</strong>guish:<br />
Feel<strong>in</strong>gs <strong>of</strong> uncerta<strong>in</strong>ty or anxiety over food;<br />
Perceptions that food is <strong>of</strong> <strong>in</strong>sufficient quantity;<br />
Perceptions that food is <strong>of</strong> <strong>in</strong>sufficient quality;<br />
Reported reductions <strong>of</strong> food <strong>in</strong>take;<br />
Reported consequences <strong>of</strong> reduced food <strong>in</strong>take;<br />
Feel<strong>in</strong>gs <strong>of</strong> shame for resort<strong>in</strong>g to socially unacceptable means to obta<strong>in</strong> food resources.<br />
Along with frequency <strong>of</strong> occurrence <strong>in</strong>formation, a number <strong>of</strong> different <strong>in</strong>dicat<strong>in</strong>g variables can be calculated.<br />
Conditions<br />
Doma<strong>in</strong>
HFIAS Scale Score<br />
Prevalence and Severity<br />
Once aga<strong>in</strong>, <strong>the</strong>se <strong>in</strong>dicators can be cross-tabulated with o<strong>the</strong>r food security <strong>in</strong>dicators to form a more holistic<br />
comprehension <strong>of</strong> <strong>the</strong> situation.
Cop<strong>in</strong>g Strategies Index<br />
The cop<strong>in</strong>g strategies <strong>in</strong>dex measures behavior <strong>in</strong> terms <strong>of</strong> <strong>the</strong> actions people take (cop<strong>in</strong>g strategies) when<br />
<strong>the</strong>y cannot access enough food. This can be ei<strong>the</strong>r food security or <strong>livelihoods</strong> cop<strong>in</strong>g strategies. This is<br />
typically a 7-day recall period where <strong>the</strong> respondent is asked to cite how many times <strong>in</strong> a week <strong>the</strong>y have used<br />
a particular cop<strong>in</strong>g method. For this study, <strong>the</strong> cop<strong>in</strong>g strategies questions were adapted from livelihood<br />
strategies ra<strong>the</strong>r than food security, and comb<strong>in</strong>ed with <strong>the</strong> HFIAS questions to:<br />
1. Account for respondent fatigue<br />
2. Give a longer recall period (30 days)<br />
3. Add a more qualitative scale <strong>of</strong> frequency (rarely, sometimes, <strong>of</strong>ten)<br />
These cop<strong>in</strong>g strategies were <strong>the</strong>n weighted accord<strong>in</strong>g to <strong>the</strong>ir severity and multiplied by <strong>the</strong> correspond<strong>in</strong>g<br />
frequency variable.<br />
This disaggregated <strong>in</strong>formation was analysed for key po<strong>in</strong>ts. The <strong>in</strong>formation was also ultimately put <strong>in</strong>to a<br />
Livelihood Cop<strong>in</strong>g Strategy Index Scale Score (similar to <strong>the</strong> HFIAS score), which gave a more def<strong>in</strong>itive<br />
viewpo<strong>in</strong>t <strong>of</strong> <strong>the</strong> difference between group<strong>in</strong>gs.<br />
Livelihoods Cop<strong>in</strong>g Strategy Index Weights<br />
In <strong>the</strong> past 30 days, if <strong>the</strong>re have been times when you did not have enough food or money to buy food, how<br />
<strong>of</strong>ten has your household had to: (rarely, sometimes <strong>of</strong>ten)<br />
No Livelihoods Cop<strong>in</strong>g Strategy CS Weight 1=least severe, 2=moderate,<br />
3=severe, 4=very severe<br />
1 Sell non-productive assets (jewellery, carpets, house furniture,<br />
etc.)<br />
1<br />
2 Beg 4<br />
3 Get <strong>in</strong>to debt, take out loan or mortgage 3<br />
4<br />
Sell productive assets (female livestock, gr<strong>in</strong>der, sow<strong>in</strong>g<br />
mach<strong>in</strong>e, tools, piece <strong>of</strong> land, etc.)<br />
5 Stop education/health expenditures 2<br />
6 Reduce all expenses 2<br />
Orig<strong>in</strong>ally, <strong>the</strong> <strong>in</strong>dex conta<strong>in</strong>ed a question about send<strong>in</strong>g family members away to work, though data<br />
validation confirmed that this was misrepresented by <strong>the</strong> enumerators or misunderstood by <strong>the</strong> respondents<br />
and was subsequently omitted.<br />
3
Appendix VI: Malnutrition Glossary<br />
Acute malnutrition<br />
Acute malnutrition is caused by a decrease <strong>in</strong> food consumption and/or illness that results <strong>in</strong> sudden weight<br />
loss or oedema. This can be caused by emergency situations, seasonal variances, or parasitic <strong>in</strong>fections, for<br />
example.<br />
Weight for height (WfH) is a measure that considers a ratio <strong>of</strong> a child’s weight to <strong>the</strong>ir height (2-18 years old)<br />
or length (0-24 months old). A score that is figured to be -2 z-scores below <strong>the</strong> <strong>in</strong>ternationally def<strong>in</strong>ed mean<br />
for children <strong>of</strong> <strong>the</strong> same age can be labelled moderate wast<strong>in</strong>g. A score that is -3 z-scores below <strong>the</strong> mean<br />
represents severe wast<strong>in</strong>g.<br />
Mid-upper Arm Circumference (MUAC) takes <strong>the</strong> numeric measurement <strong>of</strong> circumference on a child’s upper<br />
arm. Thresholds may vary, though for a child between 6 and 59 months <strong>of</strong> age, a MUAC <strong>of</strong> less than 12.5cm<br />
is considered moderately malnourished, and below 11cm severely malnourished.<br />
Nutritional/bilateral pitt<strong>in</strong>g oedema is a sign <strong>of</strong> retention <strong>of</strong> water <strong>in</strong> <strong>the</strong> tissues <strong>of</strong> <strong>the</strong> body. This diagnosis <strong>in</strong><br />
<strong>the</strong> field comes about from apply<strong>in</strong>g thumb pressure for approximately 3 seconds to <strong>the</strong> tops <strong>of</strong> feet. If oedema<br />
is present, <strong>the</strong> impression <strong>of</strong> <strong>the</strong> thumb pr<strong>in</strong>t will rema<strong>in</strong> for at least a few seconds after <strong>the</strong> thumb is removed.<br />
Presence <strong>of</strong> oedema on both feet is a sign <strong>of</strong> severe acute malnutrition, namely kwashiorkor.<br />
Marasmus – A form <strong>of</strong> severe acute malnutrition that is characterized by <strong>the</strong> wast<strong>in</strong>g <strong>of</strong> body tissues. This<br />
typically results from a lack <strong>of</strong> sufficient caloric dietary <strong>in</strong>take. Symptoms can <strong>in</strong>clude over-def<strong>in</strong>ition <strong>of</strong><br />
bones (primarily <strong>the</strong> ribs), sk<strong>in</strong>ny limbs, and loose sk<strong>in</strong>.<br />
Kwashiorkor – A form <strong>of</strong> severe acute malnutrition that is characterized by <strong>the</strong> presence <strong>of</strong> bi-lateral oedema<br />
and a weight for height z-score <strong>of</strong> greater than or equal to -2. Typically results from a severe prote<strong>in</strong><br />
deficiency. Symptoms can <strong>in</strong>clude hair changes, dermatosis, and a large belly.<br />
Marasmic kwashiorkor – A comb<strong>in</strong>ation <strong>of</strong> prote<strong>in</strong> and caloric deficiency. The condition is characterized by<br />
severe tissue wast<strong>in</strong>g, dehydration, loss <strong>of</strong> subcutaneous fat, lethargy, and growth retardation.<br />
Global Acute Malnutrition (GAM) – The cumulative prevalence <strong>of</strong> both moderate and severe malnourishment<br />
with<strong>in</strong> a population.<br />
Chronic Malnutrition<br />
Chronic malnutrition – a form <strong>of</strong> malnutrition that is caused by improper dietary <strong>in</strong>take over a long time<br />
period or by repeated <strong>in</strong>fection/disease.<br />
Height for Age (HfA) compares <strong>the</strong> height <strong>of</strong> a child to <strong>the</strong> median height <strong>of</strong> a reference population for<br />
children <strong>of</strong> <strong>the</strong> same age. This is a measure <strong>of</strong> stunt<strong>in</strong>g.<br />
Stunt<strong>in</strong>g is a condition where an <strong>in</strong>dividual is shorter than a well-nourished person <strong>of</strong> <strong>the</strong> same age. This is<br />
caused primarily by chronic malnutrition. A z-score <strong>of</strong> -2 below <strong>the</strong> mean is referred to as moderately stunted,<br />
and a score <strong>of</strong> -3 is referred to as severely stunted.
Appendix VII – Visual Reference <strong>of</strong> Units <strong>of</strong> Sale<br />
<br />
<br />
<br />
Roots/half roots <strong>of</strong> cassava Piles <strong>of</strong> local yams<br />
<br />
Branches <strong>of</strong> Matooke<br />
B<strong>in</strong>s/bags <strong>of</strong> Irish potatoes
UShs<br />
UShs<br />
Appendix VIII – Comparative Livelihood Charts<br />
Daily Expense Medians<br />
<br />
Food Fuel Tobacco/Alcohol Sanitation Transportation Water<br />
5000<br />
4500 <br />
4000<br />
3500<br />
3000<br />
2500<br />
2000<br />
1500<br />
1000<br />
500<br />
0<br />
<br />
Vocation/Service Qualified Salary Poor Casual Petty Non-Poor Casual Non-Qualified<br />
Labourer Trader/Street<br />
Vendor<br />
Labour Salary<br />
UShs<br />
70000<br />
60000<br />
50000<br />
40000<br />
30000<br />
20000<br />
10000<br />
0<br />
80000<br />
70000<br />
60000<br />
50000<br />
40000<br />
30000<br />
20000<br />
10000<br />
0<br />
Monthly Expense Medians<br />
Debt Electricity Health Hygiene Rent Sav<strong>in</strong>gs Telephone<br />
Vocation/Service Qualified Salary Poor Casual<br />
Labourer<br />
Petty<br />
Trader/Street<br />
Vendor<br />
O<strong>the</strong>r Periodicity Expense Medians<br />
cloth<strong>in</strong>g Education loan<br />
Non-Poor<br />
Casual Labour<br />
Non-Qualified<br />
Salary
100%<br />
90%<br />
80%<br />
70%<br />
60%<br />
50%<br />
40%<br />
30%<br />
20%<br />
10%<br />
0%<br />
100%<br />
90%<br />
80%<br />
70%<br />
60%<br />
50%<br />
40%<br />
30%<br />
20%<br />
10%<br />
0%<br />
NPCL<br />
PCL<br />
NQS<br />
QS<br />
VS<br />
<br />
HFIAS Scale Score<br />
<br />
PTSV<br />
Anxiety and uncerta<strong>in</strong>ty<br />
about household food<br />
supply<br />
All 11.2<br />
NPCL 13.2<br />
PCL 12.1<br />
NQS 12.5<br />
QS 10.2<br />
VS 12.9<br />
PTSV 9.1<br />
HFIAS Severity and Prevalence<br />
NPCL<br />
PCL<br />
NQS<br />
QS<br />
VS<br />
PTSV<br />
Insufficient food quality<br />
(<strong>in</strong>clud<strong>in</strong>g variety and<br />
preferences)<br />
100%<br />
90%<br />
80%<br />
70%<br />
60%<br />
50%<br />
40%<br />
30%<br />
20%<br />
10%<br />
0%<br />
HFIAS Doma<strong>in</strong><br />
NPCL<br />
PCL<br />
NQS<br />
QS<br />
VS<br />
Severely Insecure<br />
Moderately Insecure<br />
Mildly Insecure<br />
Food Secure<br />
PTSV<br />
Insufficient food <strong>in</strong>take<br />
and it's physical<br />
consequences<br />
Food Consumption Scores<br />
Poor Borderl<strong>in</strong>e Acceptable<br />
Never<br />
Often<br />
Sometimes<br />
Rarely
100%<br />
80%<br />
60%<br />
40%<br />
20%<br />
0%<br />
Sent all family members away for work<br />
Sent a family member away from work<br />
Reduced all expenses<br />
Taken on debt<br />
Stopped education or health expenditure<br />
Sold productive assets<br />
Sold non-productive assets<br />
Sent a family member to beg<br />
Sent all family members away for work<br />
Sent a family member away from work<br />
Reduced all expenses<br />
Taken on debt<br />
Stopped education or health expenditure<br />
Sold productive assets<br />
Sold non-productive assets<br />
Sent a family member to beg<br />
Sent all family members away for work<br />
Sent a family member away from work<br />
Reduced all expenses<br />
Taken on debt<br />
Stopped education or health expenditure<br />
Sold productive assets<br />
Sold non-productive assets<br />
Sent a family member to beg<br />
Child IDDS<br />
NPCL Cop<strong>in</strong>g Mechs<br />
0 5 10 15<br />
0 5 10 15<br />
NQS Cop<strong>in</strong>g Mechs<br />
0 1 2 3 4 5 6 7 8<br />
0 1 2 3 4 5 6 7 8<br />
PTSV Cop<strong>in</strong>g Mechs<br />
0 5 10 15 20<br />
0 5 10 15 20<br />
Acceptable<br />
Borderl<strong>in</strong>e<br />
Poor<br />
Rarely<br />
Sometimes<br />
Often<br />
Rarely<br />
# <strong>of</strong> Responses<br />
Sometimes<br />
Often<br />
Total Respondents<br />
Rarely<br />
Sometimes<br />
Often<br />
Total Respondents
Sent all family members away for work<br />
Sent a family member away from work<br />
Reduced all expenses<br />
Taken on debt<br />
Stopped education or health expenditure<br />
Sold productive assets<br />
Sold non-productive assets<br />
Sent a family member to beg<br />
Sent all family members away for work<br />
Sent a family member away from work<br />
Reduced all expenses<br />
Taken on debt<br />
Stopped education or health expenditure<br />
Sold productive assets<br />
Sold non-productive assets<br />
Sent a family member to beg<br />
Sent all family members away for work<br />
Sent a family member away from work<br />
Reduced all expenses<br />
Taken on debt<br />
Stopped education or health expenditure<br />
Sold productive assets<br />
Sold non-productive assets<br />
Sent a family member to beg<br />
Median<br />
Daily<br />
Income<br />
Median<br />
Daily<br />
Expense<br />
PCL Cop<strong>in</strong>g Mechs<br />
0 2 4 6 8 10<br />
0 2 4 6 8 10<br />
QS Cop<strong>in</strong>g Mechs<br />
0 1 2 3 4 5 6<br />
0 1 2 3 4 5 6<br />
VOCSERV Cop<strong>in</strong>g Mechs<br />
0 2 4 6 8 10 12<br />
0 2 4 6 8 10 12<br />
Has<br />
Debt<br />
Debt<br />
amts<br />
F<strong>in</strong>ancial<br />
Monthly<br />
Income<br />
Rarely<br />
Debt/Income<br />
Ratio<br />
Sometimes<br />
Debt/Expense<br />
Ratio<br />
Non-Poor Casual Labourer 10250 6492 83% 271429 307500 0.88 0.63<br />
Poor Casual Labourer 15125 4036 89% 193333 453750 0.43 0.27<br />
Non-qualified Salary 15000 6547 75% 418786 450000 0.93 0.44<br />
Qualified Salary 15000 3111 100 156714 450000 0.35 0.21<br />
Vocation/Service 18571 2387 90% 300000 557143 0.54 0.13<br />
Petty Trader/Street Vendor 26429 9517 69% 196000 792870 0.25 0.36<br />
Often<br />
Total Respondents<br />
Rarely<br />
Sometimes<br />
Often<br />
# Respondents<br />
Rarely<br />
Sometimes<br />
Often<br />
# <strong>of</strong> Respondents
Child<br />
Not In<br />
School<br />
Human Physical<br />
Sufficient<br />
Access to<br />
Healthcare<br />
Owners <strong>of</strong><br />
structures/<br />
land<br />
Tap water <strong>in</strong><br />
ra<strong>in</strong>y<br />
season<br />
latr<strong>in</strong>e <strong>in</strong> <strong>the</strong><br />
house?<br />
Non-Poor Casual Labourer 50% 65% 5% 60% 0%<br />
Poor Casual Labourer 20% 50% 0% 50% 0%<br />
Non-qualified Salary 43% 22% 11% 44% 22%<br />
Qualified Salary 50% 83% 50% 83% 50%<br />
Vocation/Service 70% 75% 25% 55% 0%<br />
Petty Trader/Street Vendor 40% 44% 8% 72% 16%<br />
Membe<br />
r <strong>of</strong><br />
Social<br />
Group<br />
Social O<strong>the</strong>r<br />
Received at<br />
least 1 form<br />
<strong>of</strong> support<br />
Percent <strong>of</strong><br />
Sample<br />
Work<br />
Change?<br />
Median Water<br />
pp/day<br />
Non-Poor Casual Labourer 20% 65% 24% 53% 20.0<br />
Poor Casual Labourer 33% 30% 12% 70% 10.0<br />
Non-qualified Salary 38% 78% 11% 86% 25.0<br />
Qualified Salary 100% 67% 7% 25% 13.3<br />
Vocation/Service 58% 83% 15% 56% 20.0<br />
Petty Trader/Street Vendor 100% 56% 30% 19% 20.0