

Head OF Old riVer Barrier installatiOn and FlOWs - San Joaquin ...
Head OF Old riVer Barrier installatiOn and FlOWs - San Joaquin ...
Head OF Old riVer Barrier installatiOn and FlOWs - San Joaquin ...

You also want an ePaper? Increase the reach of your titles
YUMPU automatically turns print PDFs into web optimized ePapers that Google loves.
ChapTer 4<br />
<strong>Head</strong> <strong>OF</strong> <strong>Old</strong> <strong>riVer</strong> <strong>Barrier</strong><br />
<strong>installatiOn</strong> <strong>and</strong> <strong>FlOWs</strong><br />
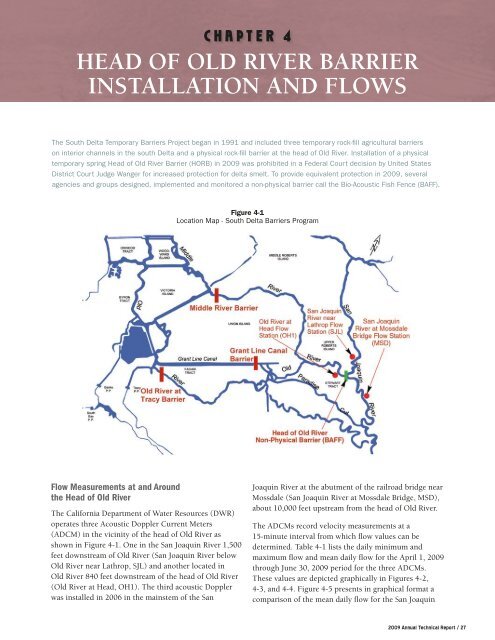
The South Delta Temporary <strong>Barrier</strong>s Project began in 1991 <strong>and</strong> included three temporary rock-fill agricultural barriers<br />
on interior channels in the south Delta <strong>and</strong> a physical rock-fill barrier at the head of <strong>Old</strong> River. Installation of a physical<br />
temporary spring <strong>Head</strong> of <strong>Old</strong> River <strong>Barrier</strong> (HORB) in 2009 was prohibited in a Federal Court decision by United States<br />
District Court Judge Wanger for increased protection for delta smelt. To provide equivalent protection in 2009, several<br />
agencies <strong>and</strong> groups designed, implemented <strong>and</strong> monitored a non-physical barrier call the Bio-Acoustic Fish Fence (BAFF).<br />
Flow Measurements at <strong>and</strong> Around<br />
the <strong>Head</strong> of <strong>Old</strong> River<br />
The California Department of Water Resources (DWR)<br />
operates three Acoustic Doppler Current Meters<br />
(ADCM) in the vicinity of the head of <strong>Old</strong> River as<br />
shown in Figure 4-1. One in the <strong>San</strong> <strong>Joaquin</strong> River 1,500<br />
feet downstream of <strong>Old</strong> River (<strong>San</strong> <strong>Joaquin</strong> River below<br />
<strong>Old</strong> River near Lathrop, SJL) <strong>and</strong> another located in<br />
<strong>Old</strong> River 840 feet downstream of the head of <strong>Old</strong> River<br />
(<strong>Old</strong> River at <strong>Head</strong>, OH1). The third acoustic Doppler<br />
was installed in 2006 in the mainstem of the <strong>San</strong><br />
Figure 4-1<br />
Location Map - South Delta <strong>Barrier</strong>s Program<br />
<strong>Joaquin</strong> River at the abutment of the railroad bridge near<br />
Mossdale (<strong>San</strong> <strong>Joaquin</strong> River at Mossdale Bridge, MSD),<br />
about 10,000 feet upstream from the head of <strong>Old</strong> River.<br />
The ADCMs record velocity measurements at a<br />
15-minute interval from which flow values can be<br />
determined. Table 4-1 lists the daily minimum <strong>and</strong><br />
maximum flow <strong>and</strong> mean daily flow for the April 1, 2009<br />
through June 30, 2009 period for the three ADCMs.<br />
These values are depicted graphically in Figures 4-2,<br />
4-3, <strong>and</strong> 4-4. Figure 4-5 presents in graphical format a<br />
comparison of the mean daily flow for the <strong>San</strong> <strong>Joaquin</strong><br />
2009 Annual Technical Report / 27
River gage at Mossdale Bridge (MSD) <strong>and</strong> the <strong>San</strong><br />
<strong>Joaquin</strong> River near Vernalis gage (VNS) for the same<br />
April 1st through June 30th period.<br />
As 2009 was a sequential dry-year relaxation (see<br />
Chapter 2 <strong>and</strong> 3) because of the continued drought, the<br />
impact of reduced flows in the <strong>San</strong> <strong>Joaquin</strong> River <strong>and</strong> not<br />
having a physical flow barrier at the head of <strong>Old</strong> River<br />
needed to be evaluated. As shown in Table 4-1, during<br />
the VAMP fish release <strong>and</strong> tracking period (4/22/- 6/13),<br />
on average 75% of the flow recorded in the <strong>San</strong> <strong>Joaquin</strong><br />
River at Mossdale Bridge (MSD) was moving into <strong>Old</strong><br />
River (OH1) <strong>and</strong> 25% was continuing downstream in<br />
the mainstem <strong>San</strong> <strong>Joaquin</strong> River toward the gage near<br />
Lathrop (SJL). During the entire period of record shown<br />
in Table 4-1, the average flow split was 80%:20%.<br />
It was agreed by the CALFED Water Management<br />
Operations Team (WOMT) that during VAMP, exports<br />
from the State <strong>and</strong> federal project pumping would be<br />
held to a level as close as possible to a 1:1 ratio with<br />
the <strong>San</strong> <strong>Joaquin</strong> River flow recorded at Vernalis (VNS).<br />
During the VAMP fish release <strong>and</strong> tracking period (4/22/-<br />
6/13), as shown in Table 4-2, export flows averaged<br />
100% (1 : 1) of the flow recorded at the <strong>San</strong> <strong>Joaquin</strong><br />
River at Vernalis (VNS) gage <strong>and</strong> averaged 110% (1.1 : 1)<br />
of the flow recorded at the <strong>San</strong> <strong>Joaquin</strong> River at Mossdale<br />
Bridge (MSD) gage. During the entire time period shown<br />
in Table 4-2 (4/1 – 6/30), export flows averaged 160%<br />
of the flow recorded at the <strong>San</strong> <strong>Joaquin</strong> River at Vernalis<br />
(VNS) gage. This ratio increased to 190% when the flow<br />
recorded at the <strong>San</strong> <strong>Joaquin</strong> River at Mossdale Bridge<br />
(MSD) gage was considered.<br />
Development of a <strong>Barrier</strong> at the <strong>Head</strong> of <strong>Old</strong> River<br />
(The following section is a summary of work conducted<br />
by DWR <strong>and</strong> the U. S. Bureau of Reclamation (USBR) in<br />
cooperation with VAMP <strong>and</strong> will be presented in full in<br />
Technical Memor<strong>and</strong>um 86-68290-09-05 by the USBR.<br />
Contact person for further information is Mark Bowen,<br />
Reclamation Technical Service Center, Denver, Colorado)<br />
A physical rock barrier at the head of <strong>Old</strong> River has been<br />
used in the past to prevent juvenile Chinook salmon<br />
from entering <strong>Old</strong> River because survival appears<br />
to be lower in <strong>Old</strong> River than it is in the mainstem<br />
<strong>San</strong> <strong>Joaquin</strong> River (Newman, 2008). Each spring<br />
installation of a physical temporary <strong>Head</strong> of <strong>Old</strong> River<br />
<strong>Barrier</strong> (HORB) had been used until 2007 when it was<br />
prohibited in a Federal Court decision by United States<br />
District Court Judge Wanger for increased protection<br />
for delta smelt. This prohibition continued during the<br />
2009 VAMP. The U. S. Bureau of Reclamation (USBR)<br />
<strong>and</strong> DWR working in coordination with Fish Guidance<br />
Systems (Southampton, Engl<strong>and</strong>), Jacobs Engineering<br />
28 / 2009 Annual Technical Report<br />
Photo 4-1<br />
Bubble <strong>Barrier</strong> Being Tested at the Divergence of the <strong>San</strong><br />
<strong>Joaquin</strong> River <strong>and</strong> <strong>Old</strong> River During the 2009 VAMP. Photo<br />
taken from the North Bank.<br />
(Southampton, Engl<strong>and</strong>), EIMCO Water Technologies<br />
(Salt Lake City, UT), Hydroacoustic Technology Inc.<br />
(Seattle, WA), <strong>and</strong> the VAMP Technical Committee<br />
designed, implemented, <strong>and</strong> monitored a non-physical<br />
barrier called the Bio-Acoustic Fish Fence (BAFF). The<br />
BAFF was deployed upstream of the divergence of the<br />
<strong>San</strong> <strong>Joaquin</strong> River <strong>and</strong> <strong>Old</strong> River. The BAFF was 112<br />
m long <strong>and</strong> was placed at a 24 degree angle incident to<br />
the <strong>San</strong> <strong>Joaquin</strong> River west shore as shown in Figure<br />
4-6. This layout was to allow the BAFF to maximize fish<br />
guidance down the mainstem of the <strong>San</strong> <strong>Joaquin</strong> River<br />
<strong>and</strong> away from <strong>Old</strong> River as depicted in Figure 4-7. The<br />
goal of the BAFF was to deter anadromous salmonid<br />
juveniles from entering <strong>Old</strong> River.<br />
The BAFF was made up of three components: sound,<br />
bubble curtain, <strong>and</strong> hi-intensity light-emitting diode<br />
(LED) strobe lights as depicted in Figure 4-8. The BAFF<br />
components, air, sound <strong>and</strong> light are attached to a truss<br />
style frame mounted 0.45 m off the river bottom. This<br />
height allowed passage of sturgeon, both green <strong>and</strong><br />
white, under the BAFF. The physical structure of the<br />
BAFF is shown in Figure 4-9.<br />
An important function of the BAFF is to emit sound in<br />
a frequency range of 5 to 600 Hz which acts as the main<br />
deterrent to salmon smolts. The primary function of the<br />
bubble curtain is to contain the sound generated by the<br />
sound projectors by encapsulating the sound within the<br />
bubble curtain, allowing a precise linear wall of sound<br />
to be developed (Photo 4-1). The trapping of the sound<br />
signal within the air curtain prevented saturation of the<br />
area surrounding the BAFF with sound. Sound levels<br />
are designed to fall to ambient levels within a distance
Table 4-1<br />
Measured Flows in <strong>San</strong> <strong>Joaquin</strong> river near Mossdale, <strong>Old</strong> river at <strong>Head</strong> <strong>and</strong> <strong>San</strong> <strong>Joaquin</strong> river near Lathrop (below <strong>Old</strong> river)<br />
Date Minimum<br />
Flow (cfs)<br />
<strong>Old</strong> river at <strong>Head</strong> (OH1) <strong>San</strong> <strong>Joaquin</strong> river below <strong>Old</strong> river (SJL) <strong>San</strong> <strong>Joaquin</strong> river at Mossdale (MSD) Flow Split (% of Total Flow)<br />
Maximum<br />
Flow (cfs)<br />
Mean Daily<br />
Flow (cfs)<br />
Minimum<br />
Flow (cfs)<br />
Maximum<br />
Flow (cfs)<br />
Mean Daily<br />
Flow (cfs)<br />
Minimum<br />
Flow (cfs)<br />
Maximum<br />
Flow (cfs)<br />
Mean Daily<br />
Flow (cfs)<br />
OH1 SJL<br />
4/1/2009 -757 1368 679 -1656 1891 58 -1078 2226 892 92.1% 7.9%<br />
4/2/2009 -441 1307 697 -1587 1737 27 -715 1984 828 96.3% 3.7%<br />
4/3/2009 -541 1708 815 -1464 1691 114 -636 1983 873 87.7% 12.3%<br />
4/4/2009 -295 1630 950 -1261 1431 81 -602 1769 856 92.2% 7.8%<br />
4/5/2009 -342 1723 954 -1207 1262 38 -424 1719 810 96.2% 3.8%<br />
4/6/2009 -472 1687 851 -1284 1415 65 -488 1651 751 92.9% 7.1%<br />
4/7/2009 -482 1765 804 -1474 1549 44 -727 1737 686 94.8% 5.2%<br />
4/8/2009 -165 1739 853 -1445 1435 74 -642 1769 799 92.1% 7.9%<br />
4/9/2009 -262 1980 1020 -1458 1562 107 -657 2005 961 90.5% 9.5%<br />
4/10/2009 -395 1992 1112 -1537 1669 82 -554 2135 1039 93.1% 6.9%<br />
4/11/2009 -90 1980 1195 -1555 1732 130 -558 2199 1130 90.2% 9.8%<br />
4/12/2009 144 1883 1297 -1496 1564 144 -228 2171 1265 90.0% 10.0%<br />
4/13/2009 17 1979 1270 -1403 1513 132 -262 2327 1302 90.6% 9.4%<br />
4/14/2009 -293 1803 1141 -1406 1760 165 -307 2162 1181 87.3% 12.7%<br />
4/15/2009 -224 1634 1067 -1127 1435 268 -249 2161 1248 79.9% 20.1%<br />
4/16/2009 -57 1468 1023 -959 1376 245 -58 2090 1205 80.7% 19.3%<br />
4/17/2009 53 1612 969 -842 1272 260 225 2028 1216 78.9% 21.1%<br />
4/18/2009 3 1626 953 -955 1256 234 169 2051 1179 80.3% 19.7%<br />
4/19/2009 170 1917 1070 -991 1239 325 179 2296 1417 76.7% 23.3%<br />
4/20/2009 238 1997 1251 -969 1316 404 611 2412 1673 75.6% 24.4%<br />
4/21/2009 416 2186 1421 -980 1472 432 663 2574 1818 76.7% 23.3%<br />
4/22/2009 595 2264 1433 -1069 1555 404 682 2559 1784 78.0% 22.0%<br />
4/23/2009 165 2472 1452 -1274 1766 390 372 2766 1751 78.8% 21.2%<br />
4/24/2009 166 2412 1445 -1299 1880 474 418 2838 1870 75.3% 24.7%<br />
4/25/2009 -93 2445 1464 -1235 2048 532 416 2917 1933 73.4% 26.6%<br />
4/26/2009 270 2545 1578 -1388 1884 490 423 3082 2048 76.3% 23.7%<br />
4/27/2009 199 2500 1576 -1298 2066 502 475 3091 2068 75.8% 24.2%<br />
4/28/2009 14 2509 1551 -1455 2235 542 423 3167 2057 74.1% 25.9%<br />
4/29/2009 58 2400 1475 -1219 2143 631 468 3036 2108 70.0% 30.0%<br />
4/30/2009 244 2298 1452 -1031 1967 633 626 3039 2100 69.6% 30.4%<br />
5/1/2009 438 2319 1483 -888 1781 582 778 2956 2047 71.8% 28.2%<br />
5/2/2009 510 2428 1522 -982 1785 637 907 3051 2159 70.5% 29.5%<br />
5/3/2009 739 2549 1690 -813 1801 714 1303 3063 2370 70.3% 29.7%<br />
5/4/2009 798 2593 1714 -867 1769 732 1380 3004 2382 70.1% 29.9%<br />
5/5/2009 827 2623 1739 -1067 1848 651 1179 3091 2301 72.7% 27.3%<br />
5/6/2009 575 2691 1721 -1017 1833 611 981 3200 2226 73.8% 26.2%<br />
5/7/2009 363 2651 1670 -1224 1899 621 813 3114 2181 72.9% 27.1%<br />
5/8/2009 364 2608 1655 -1137 1962 596 750 3139 2155 73.5% 26.5%<br />
5/9/2009 366 2667 1677 -1222 2015 600 805 3269 2217 73.7% 26.3%<br />
5/10/2009 318 2715 1705 -1199 2121 631 898 3319 2292 73.0% 27.0%<br />
5/11/2009 406 2703 1780 -1169 2147 645 1035 3439 2378 73.4% 26.6%<br />
5/12/2009 407 2752 1779 -1130 2300 758 1143 3434 2482 70.1% 29.9%<br />
5/13/2009 466 2660 1764 -858 2086 748 1443 3385 2509 70.2% 29.8%<br />
5/14/2009 713 2524 1707 -808 2040 727 1379 3360 2464 70.1% 29.9%<br />
5/15/2009 637 2518 1589 -731 1889 725 1184 3115 2328 68.7% 31.3%<br />
5/16/2009 732 2444 1574 -741 1740 706 1254 2979 2288 69.0% 31.0%<br />
5/17/2009 718 2362 1579 -789 1627 653 1168 2868 2196 70.7% 29.3%<br />
5/18/2009 557 2421 1545 -1049 1636 545 1006 2823 2063 73.9% 26.1%<br />
5/19/2009 574 2356 1471 -1263 1768 557 732 2810 1950 72.5% 27.5%<br />
5/20/2009 414 2328 1455 -1172 1705 499 398 2810 1890 74.4% 25.6%<br />
5/21/2009 315 2365 1418 -1266 1762 397 243 2932 1790 78.1% 21.9%<br />
5/22/2009 -133 2379 1339 -1557 2121 351 -72 2942 1646 79.2% 20.8%<br />
5/23/2009 -276 2353 1289 -1746 2202 327 -175 2945 1589 79.8% 20.2%<br />
5/24/2009 -297 2426 1326 -1771 2272 346 -246 2997 1630 79.3% 20.7%<br />
5/25/2009 -514 2531 1340 -1795 2279 305 -343 2998 1568 81.5% 18.5%<br />
5/26/2009 -687 2473 1303 -1772 2337 289 -366 2918 1511 81.8% 18.2%<br />
5/27/2009 -618 2368 1215 -1694 2256 263 -551 2748 1389 82.2% 17.8%<br />
5/28/2009 -702 2287 1101 -1641 2254 272 -507 2653 1307 80.2% 19.8%<br />
5/29/2009 -654 2246 1022 -1472 2015 247 -547 2552 1247 80.5% 19.5%<br />
5/30/2009 -327 2111 1033 -1431 1749 273 -463 2404 1257 79.1% 20.9%<br />
5/31/2009 -457 2023 954 -1374 1743 331 -466 2219 1216 74.2% 25.8%<br />
6/1/2009 -407 2034 1000 -1478 1707 275 -588 2264 1174 78.4% 21.6%<br />
6/2/2009 -342 2164 1060 -1472 1709 231 -505 2363 1203 82.1% 17.9%<br />
6/3/2009 -1415 1741 227 -672 2388 1099<br />
6/4/2009 -1558 1909 211 -859 2345 992<br />
6/5/2009 -1542 1940 188 -976 2370 918<br />
6/6/2009 -1488 1931 140 -947 2278 849<br />
6/7/2009 -1458 2080 192 -923 2469 986<br />
6/8/2009 -1506 2177 239 -669 2650 1149<br />
6/9/2009 -1470 2134 250 -613 2565 1140<br />
6/10/2009 -1399 1930 225 -720 2364 1039<br />
6/11/2009 -798 1996 875 -1335 1944 231 -617 2334 987 79.1% 20.9%<br />
6/12/2009 -598 1894 838 -1253 1759 191 -708 2173 901 81.4% 18.6%<br />
6/13/2009 -528 1881 774 -1284 1601 158 -683 1945 775 83.1% 16.9%<br />
6/14/2009 -426 1769 789 -1330 1490 199 -812 1857 811 79.9% 20.1%<br />
6/15/2009 -517 1728 754 -1326 1511 180 -856 1735 785 80.8% 19.2%<br />
6/16/2009 -475 1649 726 -1355 1591 127 -1008 1814 683 85.1% 14.9%<br />
6/17/2009 -768 1785 705 -1412 1745 135 -1162 1870 626 83.9% 16.1%<br />
6/18/2009 -820 1778 671 -1491 1877 105 -1223 2034 619 86.5% 13.5%<br />
6/19/2009 -1011 1706 596 -1580 1815 17 -1316 2040 457 97.2% 2.8%<br />
6/20/2009 -1046 1927 642 -1726 1863 88 -1289 2170 550 87.9% 12.1%<br />
6/21/2009 -1091 2051 714 -1749 1858 158 -1222 2342 726 81.8% 18.2%<br />
6/22/2009 -992 2028 795 -1696 1978 126 -1177 2374 817 86.4% 13.6%<br />
6/23/2009 -1051 1908 820 -1697 2068 111 -1093 2458 855 88.1% 11.9%<br />
6/24/2009 -769 2048 899 -1849 2173 96 -972 2498 963 90.3% 9.7%<br />
6/25/2009 -489 2113 1017 -1701 2080 202 -716 2573 1137 83.4% 16.6%<br />
6/26/2009 -174 1896 1040 -1513 2013 260 -267 2454 1231 80.0% 20.0%<br />
6/27/2009 83 1879 1077 -1297 1665 305 -415 2372 1282 78.0% 22.0%<br />
6/28/2009 25 1732 963 -1397 1512 232 -696 2082 1090 80.6% 19.4%<br />
6/29/2009 -92 1720 973 -1433 1418 77 -781 1937 895 92.7% 7.3%<br />
6/30/2009 -358 2092 919 -1520 1482 83 -908 1985 805 91.7% 8.3%<br />
No Data<br />
2009 Annual Technical Report / 29<br />
chapter 4
Flow (cfs)<br />
Flow (cfs)<br />
3000<br />
2500<br />
2000<br />
1500<br />
1000<br />
500<br />
-500<br />
-1000<br />
30 / 2009 Annual Technical Report<br />
0<br />
Figure 4-2<br />
Daily Flow Range - <strong>Old</strong> River at <strong>Head</strong> (OH1)<br />
Mean Daily Flow<br />
-1500<br />
4/1/09 4/11/09 4/21/09 5/1/09 5/11/09 5/21/09 5/31/09 6/10/09 6/20/09 6/30/09<br />
3000<br />
2500<br />
2000<br />
1500<br />
1000<br />
500<br />
0<br />
-500<br />
-1000<br />
-1500<br />
-2000<br />
Figure 4-3<br />
Daily Flow Range - <strong>San</strong> <strong>Joaquin</strong> River below <strong>Old</strong> River Near Lathrop (SJL)<br />
Mean Daily Flow<br />
-2500<br />
4/1/09 4/11/09 4/21/09 5/1/09 5/11/09 5/21/09 5/31/09 6/10/09 6/20/09 6/30/09
Flow (cfs)<br />
Flow (cfs)<br />
4000<br />
3000<br />
2000<br />
1000<br />
0<br />
-1000<br />
-2000<br />
3000<br />
2500<br />
2000<br />
1500<br />
1000<br />
500<br />
Figure 4-4<br />
Daily Flow Range - <strong>San</strong> <strong>Joaquin</strong> River at Mossdale Bridge (MSD)<br />
Mean Daily Flow<br />
4/1/09 4/11/09 4/21/09 5/1/09 5/11/09 5/21/09 5/31/09 6/10/09 6/20/09 6/30/09<br />
0<br />
Figure 4-5<br />
<strong>San</strong> <strong>Joaquin</strong> River Flow near Vernalis (VNS) <strong>and</strong> at Mossdale Bridge (MSD)<br />
<strong>San</strong> <strong>Joaquin</strong> River at Mossdale<br />
<strong>San</strong> <strong>Joaquin</strong> River near Vernalis<br />
4/1/09 4/11/09 4/21/09 5/1/09 5/11/09 5/21/09 5/31/09 6/10/09 6/20/09 6/30/09<br />
2009 Annual Technical Report / 31<br />
chapter 4
Table 4-2<br />
Measured Flows in <strong>San</strong> <strong>Joaquin</strong> river near Vernalis (VnS) as Compared to Export Flows at the State Water Project<br />
(SWP-Banks Pumping Plant) <strong>and</strong> the Central Valley Project (CVP-Tracy Pumping Plant)<br />
Date<br />
32 / 2009 Annual Technical Report<br />
<strong>San</strong> <strong>Joaquin</strong> river<br />
near Vernalis (VnS)<br />
[a]<br />
Mean Daily Flow**<br />
(cfs)<br />
<strong>San</strong> <strong>Joaquin</strong> river<br />
at Mossdale Bridge<br />
(MSD) [B]<br />
Mean Daily Flow**<br />
(cfs)<br />
State Water<br />
Project (SWP) at<br />
Harvey O Banks<br />
Pumping Plant<br />
(HrO)<br />
Mean Daily Flow**<br />
(cfs)<br />
Central Valley<br />
Project (CVP) at<br />
Tracy Pumping<br />
Plant (TrP)<br />
Mean Daily Flow**<br />
(cfs)<br />
<strong>San</strong> <strong>Joaquin</strong> river<br />
Flow at Mossdale<br />
Bridge(MSD) as %<br />
of Flow Measured<br />
near Vernalis(VnS)<br />
Exports as a ratio<br />
of SJr Flow near<br />
Vernalis (VnS)<br />
Exports as a ratio<br />
of SJr Flow at the<br />
Mossdale Bridge<br />
(MSD)<br />
(%) Exports : VnS Exports : MSD<br />
4/1/2009 1,060 892 2202 2614 84 4.5 : 1 5.4 : 1<br />
4/2/2009 1,050 828 2202 2611 79 4.6 : 1 5.8 : 1<br />
4/3/2009 1,070 873 2202 2017 82 3.9 : 1 4.8 : 1<br />
4/4/2009 1,060 856 2168 1747 81 3.7 : 1 4.6 : 1<br />
4/5/2009 1,080 810 2148 1746 75 3.6 : 1 4.8 : 1<br />
4/6/2009 1,070 751 1099 1114 70 2.1: 1 2.9 : 1<br />
4/7/2009 1,060 686 1095 859 65 1.8 : 1 2.8 : 1<br />
4/8/2009 1,100 799 1094 1314 73 2.2 : 1 3.0 : 1<br />
4/9/2009 1,180 961 1474 1841 81 2.8 : 1 3.4 : 1<br />
4/10/2009 1,250 1039 1099 1841 83 2.4 :1 2.8 : 1<br />
4/11/2009 1,280 1130 1648 2531 88 3.3 : 1 3.7 : 1<br />
4/12/2009 1,370 1265 2192 2743 92 3.6 : 1 3.9 : 1<br />
4/13/2009 1,370 1302 2161 2783 95 3.6 : 1 3.8 : 1<br />
4/14/2009 1,320 1181 1106 2167 89 2.5 : 1 2.8 : 1<br />
4/15/2009 1,300 1248 2182 1144 96 2.6 : 1 2.7 : 1<br />
4/16/2009 1,300 1205 2201 851 93 2.3 : 1 2.5 : 1<br />
4/17/2009 1,310 1216 1086 851 93 1.5 : 1 1.6 : 1<br />
4/18/2009 1,320 1179 1084 853 89 1.5 : 1 1.6 : 1<br />
4/19/2009 1,570 1417 1077 852 90 1.2 : 1 1.4 : 1<br />
4/20/2009 1,830 1673 1077 850 91 1.1 : 1 1.2 : 1<br />
4/21/2009 1,960 1818 1074 853 93 1.0 : 1 1.1 : 1<br />
4/22/2009 1,980 1784 1077 854 90 1.0 : 1 1.1 : 1<br />
4/23/2009 1,910 1751 1077 971 92 1.1 : 1 1.2 : 1<br />
4/24/2009 1,980 1870 1075 1016 94 1.1 : 1 1.1 : 1<br />
4/25/2009 2,010 1933 354 905 96 0.6 : 1 0.7 : 1<br />
4/26/2009 2,110 2048 135 858 97 0.5 : 1 0.5 : 1<br />
4/27/2009 2,170 2068 138 856 95 0.5 : 1 0.5 : 1<br />
4/28/2009 2,160 2057 1085 859 95 0.9 : 1 0.9 : 1<br />
4/29/2009 2,140 2108 670 857 98 0.7 : 1 0.7 : 1<br />
4/30/2009 2,110 2100 447 855 100 0.6 : 1 0.6 : 1<br />
5/1/2009 2,180 2047 1079 923 94 0.9 : 1 1.0 : 1<br />
5/2/2009 2,350 2159 1077 1018 92 0.9 : 1 1.0 : 1<br />
5/3/2009 2,490 2370 1078 1022 95 0.8 : 1 0.9 : 1<br />
5/4/2009 2,490 2382 1077 1012 96 0.8 : 1 0.9 : 1<br />
5/5/2009 2,440 2301 1078 1018 94 0.9 : 1 0.9 : 1<br />
5/6/2009 2,420 2226 675 1021 92 0.7 : 1 0.8 : 1<br />
5/7/2009 2,400 2181 1088 1015 91 0.9 : 1 1.0 : 1<br />
5/8/2009 2,390 2155 1085 957 90 0.9 : 1 0.9 : 1<br />
5/9/2009 2,470 2217 1083 971 90 0.8 : 1 0.9 : 1<br />
5/10/2009 2,540 2292 2182 966 90 1.2 : 1 1.4 : 1<br />
5/11/2009 2,620 2378 2447 966 91 1.3 : 1 1.4 : 1<br />
5/12/2009 2,640 2482 0 935 94 0.4 : 1 0.4 : 1<br />
5/13/2009 2,650 2509 0 912 95 0.3 : 1 0.4 : 1<br />
5/14/2009 2,530 2464 0 1804 97 0.7 : 1 0.7 : 1<br />
5/15/2009 2,400 2328 1260 1807 97 1.3 : 1 1.3 : 1<br />
5/16/2009 2,340 2288 1138 1803 98 1.3 : 1 1.3 : 1<br />
5/17/2009 2,340 2196 1126 1806 94 1.3 : 1 1.3 : 1<br />
5/18/2009 2,300 2063 2193 1360 90 1.5 : 1 1.7 : 1<br />
5/19/2009 2,130 1950 1758 899 92 1.2 : 1 1.4 : 1<br />
5/20/2009 2,030 1890 627 898 93 0.8 : 1 0.8 : 1<br />
5/21/2009 1,970 1790 798 901 91 0.9 : 1 0.9 : 1<br />
5/22/2009 1,880 1646 424 897 88 0.7 : 1 0.8 : 1<br />
5/23/2009 1,820 1589 1391 899 87 1.3 : 1 1.4 : 1<br />
5/24/2009 1,780 1630 1295 896 92 1.2 : 1 1.3 : 1<br />
5/25/2009 1,690 1568 1323 898 93 1.3 : 1 1.4 : 1<br />
5/26/2009 1,650 1511 1290 899 92 1.3 : 1 1.4 : 1<br />
5/27/2009 1,540 1389 1328 901 90 1.4 : 1 1.6 : 1<br />
5/28/2009 1,450 1307 209 981 90 0.8 : 1 0.9 : 1<br />
5/29/2009 1,390 1247 455 1006 90 1.1 : 1 1.2 : 1<br />
5/30/2009 1,370 1257 0 842 92 0.6 : 1 0.7 : 1<br />
5/31/2009 1,330 1216 0 0 91 0.0 : 1 0.0 : 1<br />
6/1/2009 1,370 1174 413 1002 86 1.0 : 1 1.2 : 1<br />
6/2/2009 1,340 1203 418 1007 90 1.1 : 1 1.2 : 1<br />
6/3/2009 1,310 1099 652 1008 84 1.3 : 1 1.5 : 1<br />
6/4/2009 1,200 992 511 1010 83 1.3 : 1 1.5 : 1<br />
6/5/2009 1,150 918 606 1009 80 1.4 : 1 1.8 : 1<br />
6/6/2009 1,130 849 602 1003 75 1.4 : 1 1.9 : 1<br />
6/7/2009 1,190 986 559 1006 83 1.3 : 1 1.6 : 1<br />
6/8/2009 1,280 1149 419 1007 90 1.1 : 1 1.2 : 1<br />
6/9/2009 1,220 1140 467 1007 93 1.2 : 1 1.3 : 1<br />
6/10/2009 1,150 1039 491 1015 90 1.3 : 1 1.4 : 1<br />
6/11/2009 1,100 987 477 1019 90 1.4 : 1 1.5 : 1<br />
6/12/2009 1,010 901 486 1018 89 1.5 : 1 1.7 : 1<br />
6/13/2009 1,000 775 476 1020 77 1.5 : 1 1.9 : 1<br />
6/14/2009 1,020 811 558 1013 80 1.5 : 1 1.9 : 1<br />
6/15/2009 1,020 785 466 1016 77 1.5 : 1 1.9 : 1<br />
6/16/2009 947 683 485 999 72 1.6 : 1 2.2 : 1<br />
6/17/2009 902 626 418 1338 69 1.9 : 1 2.8 : 1<br />
6/18/2009 871 619 489 1662 71 2.5 : 1 3.5 : 1<br />
6/19/2009 785 457 530 1671 58 2.8 : 1 4.8 : 1<br />
6/20/2009 810 550 532 1675 68 2.7 : 1 4.0 : 1<br />
6/21/2009 925 726 550 1678 79 2.4 : 1 3.1 : 1<br />
6/22/2009 1,000 817 548 1673 82 2.2 : 1 2.7 : 1<br />
6/23/2009 1,010 855 352 1674 85 2.0 : 1 2.4 : 1<br />
6/24/2009 1,170 963 222 1678 82 1.6 : 1 2.0 : 1<br />
6/25/2009 1,240 1137 135 1671 92 1.5 : 1 1.6 : 1<br />
6/26/2009 1,310 1231 137 1670 94 1.4 : 1 1.5 : 1<br />
6/27/2009 1,320 1282 329 1662 97 1.5 : 1 1.6 : 1<br />
6/28/2009 1,120 1090 167 1663 97 1.6 : 1 1.7 : 1<br />
6/29/2009 1,080 895 1126 1663 83 2.6 : 1 3.1 : 1<br />
6/30/2009 979 805 1707 1762 82 3.5 : 1 4.3 : 1<br />
** Data taken from CDEC (http://cdec.water.ca.gov/)<br />
Note: column [B] data is provisional subject to revision.
Figure 4-6<br />
Approximate Location of the Bio-Acoustic Fish Fence (BAFF) (shown as a red line) at the Divergence of <strong>San</strong> <strong>Joaquin</strong> River<br />
(SJR) <strong>and</strong> <strong>Old</strong> River (OR). Locations of the Underwater Hydrophones are Shown by the Numbers in the Colored Circles. The<br />
Yellow Dotted Line is VAMP Fish Tag 5072 as the Fish Approached <strong>and</strong> Passed Through the BAFF on 5/14/09 at 12:41<br />
Hours while the barrier was off. (Data From Bowen et al. (in press)).<br />
Figure 4-7<br />
Schematic of Probable Operation of the Bio-Acoustic Fish<br />
Fence (BAFF) planned <strong>and</strong> developed for deployment at the<br />
Divergence of <strong>San</strong> <strong>Joaquin</strong> River (SJR) <strong>and</strong> <strong>Old</strong> River (OR).<br />
(Figure courtesy of EIMCO Water Technologies)<br />
Figure 4-8<br />
Basic Components of the Bio-Acoustic Fish Fence (BAFF)<br />
planned <strong>and</strong> developed for deployment at the Divergence of<br />
<strong>San</strong> <strong>Joaquin</strong> River (SJR) <strong>and</strong> <strong>Old</strong> River (OR). (Figure courtesy<br />
of EIMCO Water Technologies)<br />
Sound contours<br />
Air curtain<br />
Sound projectors<br />
Strobe lights<br />
2009 Annual Technical Report / 33<br />
chapter 4
of 3 m from the bubble curtain. The light is generated<br />
by an array of LED strobe lights that create white light<br />
in a vertically orientated beam of 22º beam width. This<br />
allows the light beam to be projected onto the rising<br />
bubble curtain. The narrow beam angle minimizes light<br />
saturation of the area surrounding the BAFF. This served<br />
to reflect the beam <strong>and</strong> improve visibility from the<br />
direction of approaching fish.<br />
Installation of the BAFF began on April 7th. After the<br />
BAFF was deployed, four (4) underwater hydrophones<br />
were deployed (Figure 4-6) to provide for 2D tracking<br />
in the vicinity of the BAFF. Each hydrophone was<br />
connected to an on-shore receiver capable of tracking<br />
the acoustic tags implanted in the juvenile Chinook<br />
salmon by the VAMP Fish Monitoring Program. The<br />
receiver <strong>and</strong> hydrophone array was constructed by<br />
the same manufacturer as those used in the VAMP<br />
receiver network so the acoustic tags could be detected<br />
at the HORB <strong>and</strong> throughout the Delta by VAMP. Each<br />
VAMP acoustic tagged fish transmits an underwater<br />
signal or acoustic “ping” that sends identification<br />
information about the tagged fish to the hydrophones.<br />
The hydrophones around the HORB were deployed in an<br />
array at known locations that maximize spacing of the<br />
hydrophones in two dimensions. For two dimensional<br />
tracking, tags pings must be received on at least<br />
34 / 2009 Annual Technical Report<br />
Figure 4-9<br />
Physical Structure of the Bio-Acoustic Fish Fence (BAFF) Similar to that Deployed at the Divergence<br />
of the <strong>San</strong> <strong>Joaquin</strong> River <strong>and</strong> <strong>Old</strong> River During the 2009 VAMP.<br />
three hydrophones. Figure 4-6 shows a typical twodimensional<br />
(2D) track of one tagged salmon smolt as<br />
it approaches the BAFF. The smolt shown in Figure 4-6<br />
passed through the BAFF while the BAFF was off.<br />
The hydrophone array cannot provide a 2D position<br />
behind the BAFF when the BAFF is on because a ping<br />
must be received on three hydrophones to provide a 2D<br />
position. When the BAFF is in operation, hydrophones<br />
2, 3, <strong>and</strong> 4 (see Figure 4-6) are unlikely to receive a ping<br />
because the bubble curtain portion of the BAFF blocks<br />
sound passage.<br />
A full report on the efficiency of the BAFF is in<br />
preparation at the time of this report writing. Initial<br />
results however show that the BAFF appears to be<br />
very efficient (>80%) in deterring acoustically tagged<br />
fish from entering <strong>Old</strong> River. The testing of the BAFF<br />
was during a period of time when the flow split was<br />
averaging 75% down <strong>Old</strong> River (Table 4-1). When the<br />
BAFF was off, it appears only 25% of the tagged salmon<br />
smolts remained in the mainstem <strong>San</strong> <strong>Joaquin</strong> River, a<br />
value similar to that found by Holbrook et al. (2009) in<br />
2008 when no barrier was present <strong>and</strong> the flow split was<br />
68% down <strong>Old</strong> River <strong>and</strong> 32% down the mainstem <strong>San</strong><br />
<strong>Joaquin</strong> River.
One of the things that complicated the analysis of the<br />
BAFF efficiency was the very high loss rate of tagged<br />
fish from the point of release at Durham Ferry to the<br />
<strong>Head</strong> of <strong>Old</strong> River. Hydrophones in the vicinity of the<br />
BAFF showed a high proportion of the tagged fish never<br />
arrived in the vicinity of the BAFF; loss rates ranged<br />
from 25 – 61 % for the 7 VAMP release groups. It is<br />
unclear what caused the loss but predation is highly<br />
likely. This is supported by the findings in the immediate<br />
vicinity of the BAFF that showed that predation rates<br />
ranged from 12 – 40 % for the seven groups released at<br />
Durham Ferry. The combined loss rate from Durham<br />
Ferry to the BAFF <strong>and</strong> the loss rate in the vicinity of<br />
the BAFF combined to show a loss rate between 60<br />
-76% of the seven groups released at Durham Ferry.<br />
This extremely high loss rate needs to be evaluated <strong>and</strong><br />
if possible mitigated. A full report on the effectiveness<br />
of the 2009 Non-Physical Fish <strong>Barrier</strong> (BAFF) will be<br />
prepared by the USBR in the coming months.<br />
South Delta Temporary Agricultural <strong>Barrier</strong>s Project<br />
(The following section is a summary of work conducted<br />
by the California Department of Water Resources (DWR)<br />
with guidance from the National Marine Fisheries Service<br />
(NMFS). In 2009, this project included evaluating the<br />
movement of salmon <strong>and</strong> steelhead smolts in the interior<br />
channels of the South Delta <strong>and</strong> was done in cooperation<br />
with VAMP. Results of this effort will be presented in<br />
full in DWR Technical Reports. Contact person for<br />
further information is Mark Holderman or Kevin Clark,<br />
California Department of Water Resources, Bay-Delta Unit,<br />
Sacramento, California)<br />
The South Delta Temporary <strong>Barrier</strong>s Project (TBP) began<br />
in 1991 <strong>and</strong> consists of the construction, operation, <strong>and</strong><br />
monitoring of four temporary rock-fill barriers (Figure<br />
4-1). Three of the barriers, located in three South Delta<br />
channels (Grant Line Canal, <strong>Old</strong> <strong>and</strong> Middle rivers),<br />
are constructed seasonally <strong>and</strong> operate during the<br />
agricultural season, usually April through November.<br />
They are designed to: (1) improve water levels <strong>and</strong><br />
circulation patterns for agricultural users <strong>and</strong> (2) collect<br />
data for the design of permanent barriers. The fourth<br />
barrier, located at the head of <strong>Old</strong> River, is installed<br />
during the spring as a fish barrier. The head of <strong>Old</strong><br />
River <strong>Barrier</strong> is normally installed to prevent fall-run<br />
<strong>San</strong> <strong>Joaquin</strong> River Chinook salmon smolts <strong>and</strong> Central<br />
Valley steelhead smolts from migrating down through<br />
<strong>Old</strong> River towards the Central Valley Project (CVP) <strong>and</strong><br />
the State Water Project (SWP) export facilities. However,<br />
a recent court order <strong>and</strong> a subsequent United States Fish<br />
<strong>and</strong> Wildlife Service (USFWS) biological opinion (BO)<br />
has restricted the spring installation of a physical barrier<br />
at the head of <strong>Old</strong> River <strong>Barrier</strong> in order to protect Delta<br />
Smelt. The head of <strong>Old</strong> River <strong>Barrier</strong> is discussed in<br />
more detail in the previous section which explains the<br />
present effort to try a non-physical barrier to eliminate<br />
concerns for the impacts on Delta smelt.<br />
Because of varying hydrological conditions <strong>and</strong> concerns<br />
for endangered fish species, the number of temporary<br />
agricultural barriers installed <strong>and</strong> the installation<br />
schedules have been slightly different each year of the<br />
program. Installation, operation, <strong>and</strong> removal of the<br />
temporary agricultural barriers have raised concerns as<br />
they may harm, harass, or cause mortality to juvenile<br />
Chinook salmon, juvenile steelhead, <strong>and</strong> juvenile green<br />
sturgeon. The TBP, therefore, is performed in compliance<br />
with the terms <strong>and</strong> conditions of the National Marine<br />
Fisheries Service (NMFS) BO <strong>and</strong> incidental take<br />
permits. A recent NMFS (2008) BO requires that a<br />
fishery monitoring program be established to (1)<br />
examine the movements <strong>and</strong> survival of listed fish<br />
through the channels of the South Delta <strong>and</strong> (2) examine<br />
predation effects associated with the TBP.<br />
To comply with the requirements of the NMFS (2008)<br />
BO, the California Department of Water Resources<br />
(DWR) designed <strong>and</strong> initiated a three year study (2009<br />
– 2011) comprised of a series of acoustic biotelemetry<br />
experiments similar to those now being conducted under<br />
the Vernalis Adaptive Management Plan (VAMP) to:<br />
• Evaluate juvenile salmon <strong>and</strong> juvenile steelhead<br />
behavior <strong>and</strong> movement patterns directly adjacent to<br />
the temporary barriers;<br />
• Evaluate predatory fish behavior <strong>and</strong> movement<br />
patterns directly adjacent to the temporary barriers;<br />
• Develop quantitative estimates of survival of juvenile<br />
salmon <strong>and</strong> steelhead migrating through the South<br />
Delta; <strong>and</strong><br />
• Evaluate juvenile green sturgeon behavior <strong>and</strong><br />
movements patterns within the South Delta.<br />
The first year of the experimental field investigation<br />
included a pilot study conducted March – June 2009. In<br />
order to track the movement of acoustic tagged salmon<br />
<strong>and</strong> steelhead throughout the South Delta, a broad<br />
scale receiver network was used to monitor acoustic<br />
tagged predators (striped bass, largemouth bass <strong>and</strong><br />
white catfish) <strong>and</strong> acoustic tagged salmon <strong>and</strong> steelhead<br />
in a manner similar to that done in the 2009 VAMP<br />
(see Figure 1-2). The network of fixed-point receivers<br />
was set up to cover the South Delta including <strong>Old</strong><br />
River, Middle River, Grant Line Canal, Clifton Court<br />
Forebay <strong>and</strong> the fish facilities. These receivers were<br />
placed in conjunction with those of the VAMP to limit<br />
duplication of effort <strong>and</strong> allow maximum use of the<br />
2009 Annual Technical Report / 35<br />
chapter 4
data collected by both programs. In addition, an array<br />
of hydrophones <strong>and</strong> receivers capable of tracking fish in<br />
two dimensions was installed at the <strong>Old</strong> River <strong>Barrier</strong> at<br />
Tracy to examine the behavior of tagged fishes as they<br />
interacted with the barrier.<br />
The pilot study was designed to (1) test various<br />
assumptions inherent in the experimental design for<br />
quantifying survival of juvenile salmonids in the South<br />
Delta, <strong>and</strong> (2) provide preliminary information on the<br />
behavior of these fishes near the temporary barriers.<br />
Results of the studies will be used to assess the potential<br />
significance of the temporary barriers to salmon <strong>and</strong><br />
steelhead migrating through the South Delta. Results of<br />
these investigations will also provide useful information<br />
on predator-prey interactions that could serve to reduce<br />
the potential vulnerability of juvenile Chinook salmon,<br />
steelhead, <strong>and</strong> other fish species to predation mortality<br />
near the temporary barriers.<br />
Results of the 2009 pilot study in combination with<br />
information from similar survival investigations, such as<br />
those performed as part of the VAMP, will be used as part<br />
of the technical foundation for the 2010 <strong>and</strong> 2011 fullscale<br />
studies. The specific objectives of the experimental<br />
investigations are to provide qualitative <strong>and</strong> quantitative<br />
information about the movement, behavior, <strong>and</strong> survival<br />
of juvenile salmon, steelhead, <strong>and</strong> green sturgeon within<br />
the South Delta. Results of the fishery investigation are<br />
intended, in part, to provide information on the design<br />
<strong>and</strong> operation of the future permanent operable gates.<br />
36 / 2009 Annual Technical Report<br />
The permanent operable gates are a major component of<br />
the South Delta Improvements Program (SDIP) which<br />
is currently in the planning, design, <strong>and</strong> environmental<br />
documentation development processes.<br />
The study design will be looking a several important<br />
management questions including:<br />
• Does relative abundance of predatory fish change in<br />
response to the installation of the temporary barriers?<br />
• Do predatory fish exhibit site fidelity or learned<br />
behavior near the temporary barriers?<br />
• What is the response of predatory fish behavior to<br />
changes in the near field hydraulics associated with<br />
the temporary barriers?<br />
• Does the distribution <strong>and</strong> behavior of predatory fish<br />
vary in response to operation of the temporary barriers<br />
(i.e. flap gates open or flap gates closed)?<br />
• What is the behavior of sensitive fish species (salmon,<br />
steelhead, <strong>and</strong> green sturgeon) as they pass the<br />
temporary barriers?<br />
• What is the survival of out migrating juvenile salmon<br />
<strong>and</strong> juvenile steelhead within the South Delta during<br />
the time when the temporary barriers are installed?<br />
A full study design is available from the technical team<br />
at the California Department of Water Resources.