Unit 3: Probability - ProblemGambling.ca
Unit 3: Probability - ProblemGambling.ca
Unit 3: Probability - ProblemGambling.ca

You also want an ePaper? Increase the reach of your titles
YUMPU automatically turns print PDFs into web optimized ePapers that Google loves.
<strong>Unit</strong> 3: <strong>Probability</strong> Appendix B<br />
Teacher resource 3<br />
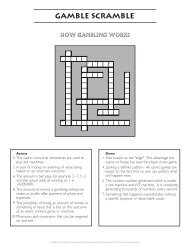
coins, Dice and <strong>ca</strong>rds<br />
InTroDucTIon<br />
Provide the students with copies of the Student Resource 4: Coins, Dice and Cards. Ask them to<br />
answer questions 1 and 2. Coins and dice should be available for students to use.<br />
Question 1a to e gives students first-hand experience with coins and random chance. It is<br />
designed to show students that they <strong>ca</strong>nnot predict what will happen next. If they get more<br />
heads than tail during the first 20 flips, they may not necessarily get more tail then heads<br />
during the next 20 flips.<br />
Question 2a, the students are told that the coin has already been flipped 14 times and they are<br />
asked to flip the coin an additional 36 times to equal 50 flips in total. Question 2a is designed to<br />
illustrate the fact that the number of heads and tails may not even up.<br />
Question 2b, the students are told that the coin has already been flipped 414 times and they are<br />
asked to flip the coin an addition 36 times to equal 450 flips in total. Question 2b is designed to<br />
illustrate the fact that even though the actual number of flips may not even up, the percentage<br />
of heads and tails will be much close to 50% than in question 2a. The fact that the percentage<br />
converges towards 50% creates and illusion that random chance corrects itself. The reality is<br />
that the difference of 10 more heads than tails becomes proportionally smaller as the sample<br />
size increases, but the number of heads and tails does not actually even up.<br />
Question 3 asks the students to compare the results of question 2a with those from 2b. They<br />
will typi<strong>ca</strong>lly find that the actual number of heads and tails in each question does not converge<br />
toward the same number but will on average preserve the difference of 10, but the percentage<br />
of heads and tails will converge towards 50%. So for question 2a, the results might be 30 heads<br />
and 20 tails and the percentages would be 60% heads and 40% tails. For question 2b the<br />
results might be 230 heads and 220 tails which would be 51.1% and 48.8%. This illustrates that<br />
the percentage of heads and tails gets closer to 50%, but the actual number of heads and tails<br />
does not. Therefore betting on tails neither helps or hurts ones chance of winning.<br />
The key concepts here are:<br />
1. that random chance is not self correcting<br />
2. a difference in heads and tail is not corrected, but becomes less noticeable (washed out)<br />
by subsequent flips<br />
3. any betting strategy that depends on the idea that random chance will even things up will<br />
not work.<br />
The idea that differences get less noticeable as you increase the sample is also illustrated<br />
in Student Resource 6: Coin Flips. After 14 flips, a difference of 10 more heads than tails<br />
looks really large, but after 414 flips a difference of 10 heads is hard to see at all. The fact that<br />
the difference gets less and less noticeable leads to the incorrect belief that random chance<br />
corrects itself.<br />
Youth Making Choices: Gambling Prevention Program www.<strong>ProblemGambling</strong>.<strong>ca</strong><br />
p. 1<br />
3.26