Contents List of Figures
Contents List of Figures
Contents List of Figures

You also want an ePaper? Increase the reach of your titles
YUMPU automatically turns print PDFs into web optimized ePapers that Google loves.
294 6 MACRO– AND MICRO–JETS DRIVEN BY BLACK HOLES<br />
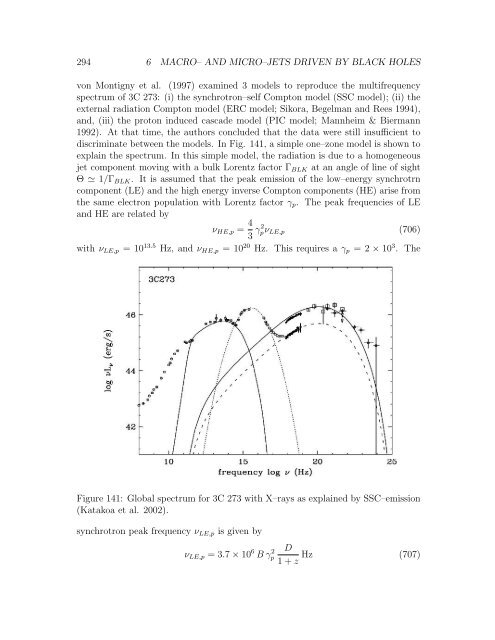
von Montigny et al. (1997) examined 3 models to reproduce the multifrequency<br />
spectrum <strong>of</strong> 3C 273: (i) the synchrotron–self Compton model (SSC model); (ii) the<br />
external radiation Compton model (ERC model; Sikora, Begelman and Rees 1994),<br />
and, (iii) the proton induced cascade model (PIC model; Mannheim & Biermann<br />
1992). At that time, the authors concluded that the data were still insufficient to<br />
discriminate between the models. In Fig. 141, a simple one–zone model is shown to<br />
explain the spectrum. In this simple model, the radiation is due to a homogeneous<br />
jet component moving with a bulk Lorentz factor ΓBLK at an angle <strong>of</strong> line <strong>of</strong> sight<br />
Θ 1/ΓBLK. It is assumed that the peak emission <strong>of</strong> the low–energy synchrotrn<br />
component (LE) and the high energy inverse Compton components (HE) arise from<br />
the same electron population with Lorentz factor γp. The peak frequencies <strong>of</strong> LE<br />
and HE are related by<br />
νHE,p = 4<br />
(706)<br />
3 γ2 pνLE,p<br />
with νLE,p = 10 13.5 Hz, and νHE,p = 10 20 Hz. This requires a γp = 2 × 10 3 . The<br />
Figure 141: Global spectrum for 3C 273 with X–rays as explained by SSC–emission<br />
(Katakoa et al. 2002).<br />
synchrotron peak frequency νLE,p is given by<br />
νLE,p = 3.7 × 10 6 B γ 2 p<br />
D<br />
Hz (707)<br />
1 + z