Bacterial Disinfectant Efficacy Using Flow Cytometry - BD Biosciences
Bacterial Disinfectant Efficacy Using Flow Cytometry - BD Biosciences
Bacterial Disinfectant Efficacy Using Flow Cytometry - BD Biosciences

Create successful ePaper yourself
Turn your PDF publications into a flip-book with our unique Google optimized e-Paper software.
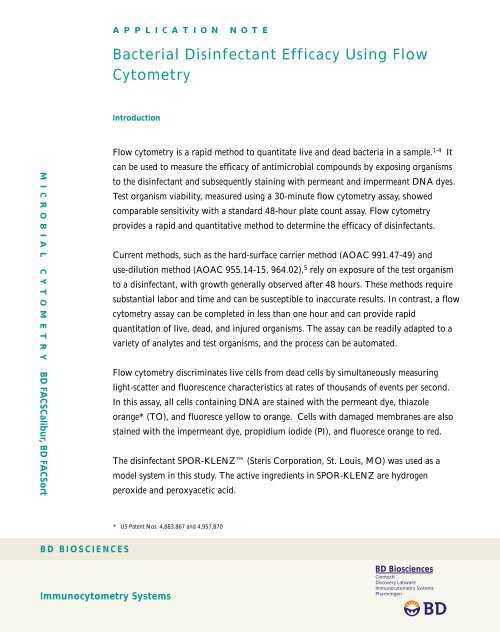
A P P L I C A T I O N N O T E<br />
<strong>Bacterial</strong> <strong>Disinfectant</strong> <strong>Efficacy</strong> <strong>Using</strong> <strong>Flow</strong><br />
<strong>Cytometry</strong><br />
Introduction<br />
M I C R O B I A L C Y T O M E T R Y <strong>BD</strong> FACSCalibur, <strong>BD</strong> FACSort Immunocytometry Systems<br />
<strong>BD</strong> BIOSCIENCES<br />
<strong>Flow</strong> cytometry is a rapid method to quantitate live and dead bacteria in a sample. 1-4 It<br />
can be used to measure the efficacy of antimicrobial compounds by exposing organisms<br />
to the disinfectant and subsequently staining with permeant and impermeant DNA dyes.<br />
Test organism viability, measured using a 30-minute flow cytometry assay, showed<br />
comparable sensitivity with a standard 48-hour plate count assay. <strong>Flow</strong> cytometry<br />
provides a rapid and quantitative method to determine the efficacy of disinfectants.<br />
Current methods, such as the hard-surface carrier method (AOAC 991.47-49) and<br />
use-dilution method (AOAC 955.14-15, 964.02), 5 rely on exposure of the test organism<br />
to a disinfectant, with growth generally observed after 48 hours. These methods require<br />
substantial labor and time and can be susceptible to inaccurate results. In contrast, a flow<br />
cytometry assay can be completed in less than one hour and can provide rapid<br />
quantitation of live, dead, and injured organisms. The assay can be readily adapted to a<br />
variety of analytes and test organisms, and the process can be automated.<br />
<strong>Flow</strong> cytometry discriminates live cells from dead cells by simultaneously measuring<br />
light-scatter and fluorescence characteristics at rates of thousands of events per second.<br />
In this assay, all cells containing DNA are stained with the permeant dye, thiazole<br />
orange* (TO), and fluoresce yellow to orange. Cells with damaged membranes are also<br />
stained with the impermeant dye, propidium iodide (PI), and fluoresce orange to red.<br />
The disinfectant SPOR-KLENZ (Steris Corporation, St. Louis, MO) was used as a<br />
model system in this study. The active ingredients in SPOR-KLENZ are hydrogen<br />
peroxide and peroxyacetic acid.<br />
* US Patent Nos. 4,883,867 and 4,957,870<br />
<strong>BD</strong> <strong>Biosciences</strong><br />
Clontech<br />
Discovery Labware<br />
Immunocytometry Systems<br />
Pharmingen
R6<br />
Dead<br />
Figure 1 Gating and analysis strategy for<br />
bacterial populations, using a sample of<br />
P. aeruginosa stained with TO and PI in a<br />
TruCOUNT Tube<br />
R2<br />
Beads<br />
Figure 1A<br />
R3<br />
2 www.bdbiosciences.com<br />
R1<br />
P. aeruginosa<br />
Figure 1B<br />
Figure 1C<br />
A. FSC vs SSC dot plot with the bacterial<br />
population on-scale, with region R1 set<br />
liberally around the target population,<br />
region R2 set around the beads<br />
B. FL2 vs SSC dot plot with region R3 set<br />
around the stained bacteria<br />
R5<br />
Injured<br />
R4<br />
Live<br />
C. FL1 vs FL3 dot plot gated on (R1 OR R2)<br />
AND R3, with regions set around the live,<br />
injured, and dead bacterial populations<br />
Materials and Methods<br />
Bacteria<br />
Pseudomonas aeruginosa (ATCC Catalog No. 15442), Salmonella<br />
choleraesuis (ATCC Catalog No. 10708), Staphylococcus aureus (ATCC<br />
Catalog No. 6538) were obtained from ATCC and cultured using<br />
Trypticase Soy Agar (<strong>BD</strong> Diagnostic Systems, Sparks, MD, Catalog No.<br />
221185) and Trypticase Soy Broth (<strong>BD</strong> Diagnostic Systems Catalog No.<br />
221092). Prior to use, cultures were inoculated from a single colony.<br />
Treatment and Staining<br />
Bacteria were exposed for 10 minutes with rotation to SPOR-KLENZ (Steris<br />
Catalog No. 6525-01) that was diluted serially between 1:2 and 1:512 in<br />
sterile water. Treated bacteria were split into two groups. One group was<br />
plated on RODAC D/E Neutralizing Agar (<strong>BD</strong> Diagnostic Systems, Catalog<br />
No. 221232) to neutralize residual SPOR-KLENZ and checked for growth<br />
after 48 hours. Several dilutions were plated to assure that at least one<br />
culture had an acceptable number of colonies. The second group was<br />
prepared for flow cytometric analysis. An aliquot was diluted 10- to 20-fold<br />
in phosphate buffered saline containing 0.2% Pluronic F-68 (BASF<br />
Corporation, Mount Olive, NJ, Catalog No. 51554728) and 1 mM EDTA<br />
and incubated at 37°C for an additional 10 minutes. This additional<br />
incubation proved to be necessary for the efficient uptake of propidium<br />
iodide (data not shown), presumably because the membrane integrity of<br />
damaged cells had to degrade to readily admit the dye.<br />
A 200-µL sample was added to a TruCOUNT Tube (<strong>BD</strong> <strong>Biosciences</strong>, San<br />
Jose, CA, Catalog No. 340567), containing a known quantity of fluorescent<br />
beads. The beads were required to determine the actual volume of sample<br />
analyzed. Thiazole orange and propidium iodide were added to final<br />
concentrations of 420 nM and 48 µM, respectively. Samples were vortexed<br />
and analyzed after a 5- to 10-minute incubation.<br />
Dye solutions used: Thiazole orange solution, 17 µM (<strong>BD</strong> <strong>Biosciences</strong><br />
Catalog No. 349483), or equivalent at 8.1 µg/mL (FW 476.6) in dimethyl<br />
sulfoxide (DMSO). Propidium iodide solution, 1.9 mM (<strong>BD</strong> <strong>Biosciences</strong><br />
Catalog No. 349483), or equivalent at 1.3 mg/mL (FW 668.4) in water.<br />
<strong>Flow</strong> Cytometer Setup<br />
A <strong>BD</strong> FACSCalibur flow cytometer was optimized using CaliBRITE 3<br />
beads (<strong>BD</strong> <strong>Biosciences</strong> Catalog No. 349502), to verify instrument<br />
performance.<br />
PMT voltages and threshold levels were adjusted using an unstained sample<br />
of diluted bacteria. The bacterial population was positioned so that it was<br />
entirely on scale on an FSC vs SSC plot (Figure 1). For fluorescence<br />
measurements, FL1, FL2, and FL3 PMT voltages were adjusted to place the<br />
unstained population in the lower left quadrant of two parameter plots (data<br />
not shown).
Instrument settings for the results below were as follows:<br />
• Threshold—SSC<br />
• FSC—E01, logarithmic amplification<br />
• SSC—375 V, logarithmic amplification<br />
• FL1—600 V, logarithmic amplification<br />
• FL3— 800 V, logarithmic amplification<br />
• Compensation—none used<br />
Data Acquisition and Analysis<br />
Data files were acquired and analyzed using <strong>BD</strong> CellQuest software. Ten thousand events<br />
were acquired per sample in Acquisition-to-Analysis mode. The bacterial population was gated<br />
using a combination of FSC, SSC, and FL2 (Figure 1, R1 and R3). Dead, live and injured<br />
populations were discriminated using FL1 vs FL3.<br />
Figure 2 Change in live and dead populations of P. aeruginosa with<br />
10- to 90- minute exposure to 3.1% SPOR-KLENZ<br />
Dead<br />
Live<br />
Injured<br />
10 min 30 min 50 min<br />
70 min 90 min<br />
www.bdbiosciences.com 3
Results and Discussion<br />
Figure 2 shows the change in viability of P. aeruginosa populations over 90 minutes of exposure to<br />
SPOR-KLENZ. Figures 3 and 4, respectively, compare the effect of SPOR-KLENZ on S. aureus and P.<br />
aeruginosa by flow cytometry and plate counting. The observed change in viability with S. aureus was<br />
equivalent in both methods. P. aeruginosa showed a greater difference in response between the<br />
methods than S. aureus, perhaps due to differences in the cell envelope. Similar results were observed<br />
for Salmonella (data not shown). Maximal killing was observed with both methods at the same<br />
disinfectant concentration.<br />
<strong>Flow</strong> cytometry allows evaluation of disinfectant or preservative efficacy in as short as 30 minutes and<br />
allows the quantitation of live and dead cells. Results are comparable with standard microbiological<br />
plate counts. The approach could be applied to a variety of applications, including prediction of<br />
disinfectant stability and potency, and microbial studies where greater than 100 organisms per mL<br />
need to be detected, such as antimicrobial effectiveness, nutritional studies, and evaluation of<br />
non-sterile products.<br />
Figure 3 Comparison of flow cytometry and plate counting on S. aureus<br />
Figure 4 Comparison of flow cytometry and plate counting on P. aeruginosa<br />
www.bdbiosciences.com 4
Hints<br />
• TO fluoresces primarily in FL1 and FL2; PI fluoresces primarily in FL3. Therefore, the best<br />
discrimination of live and dead populations is on an FL1 vs FL3 plot. This method can be applied<br />
with a variety of buffer systems, but optimal resolution requires some surfactant to be present in<br />
the staining buffer.<br />
• There will be differences between bacteria in their abilities to take up TO and PI. The LPS on<br />
gram-negative bacteria can interfere with the uptake of TO and other permeant dyes. Interference<br />
can be largely overcome by inclusion of 1 mM EDTA in the staining buffer, which has been<br />
reported to remove the LPS from the bacteria.<br />
• In practice, staining protocols must be adjusted to the bacteria being analyzed.<br />
• Thiazole orange is hydrophobic. Stock solutions should be maintained in DMSO or alcohol. TO<br />
concentration will decrease over time in aqueous solution due to adsorption to surfaces.<br />
• TO staining is adequate for analysis at 2 to 5 minutes but requires at least 15 minutes to achieve<br />
maximum intensity. PI stains very quickly, while TO enters the cells more slowly.<br />
• Setting FSC and SSC on logarithmic amplification assures that a wide range of bacterial sizes can<br />
appear on-scale and helps present recognizable populations for gating.<br />
• An event rate of ≤1000 events per second minimizes the chance of coincidence and improves<br />
population resolution. High event rates can be corrected either by dilution or by decreasing the<br />
instrument flow rate.<br />
• At least 1000 bead events should be collected to provide reliable concentration data.<br />
• If the population of interest cannot be adequately resolved using an SSC threshold alone, a<br />
secondary threshold on FL1 can be used. An FL1 threshold alone might not be adequate due to the<br />
large amount of small fluorescent debris that can be present in a stained bacterial sample.<br />
• If high background counts are observed on an instrument, the staining buffer and sheath fluid<br />
should be checked for particles. An instrument cleaning cycle and a drain/fill cycle can also reduce<br />
noise.<br />
• Samples can be checked by flourescence microscopy to confirm that target organisims are stained.<br />
• Stained samples and extra dye solution should be disposed according to local regulations.<br />
www.bdbiosciences.com 5
<strong>BD</strong> <strong>Biosciences</strong> publishes this<br />
method as a service to investigators.<br />
Detailed support for non–flow<br />
cytometric aspects of this<br />
procedure might not be<br />
available from <strong>BD</strong> <strong>Biosciences</strong>.<br />
<strong>BD</strong> <strong>Biosciences</strong> www.bdbiosciences.com<br />
Asia Pacific<br />
Tel (65) 6-860-1437<br />
Fax (65) 6-860-1593<br />
Brazil<br />
Tel (55) 11 5185-9995<br />
Fax (55) 11 5185-9895<br />
Canada<br />
Tel (888) 259-0187<br />
Fax (905) 542-9391<br />
References<br />
1. Davey HM, Kell DB. <strong>Flow</strong> cytometry and cell sorting of heterogeneous<br />
microbial populations: the importance of single cell analyses.<br />
Microbiological Reviews. 1996;60:641-696.<br />
2. Shapiro HN. Microbial analysis at the single-cell level: tasks and<br />
techniques. Journal of Microbiological Methods. 2000;42:3-16.<br />
3. Nebe-von-Caron G, Stephens PJ, Hewitt CJ, Powell JR, Badley RA.<br />
Analysis of bacterial function by multi-colour fluorescence flow cytometry<br />
and single cell sorting. Journal of Microbiological Methods.<br />
2000;42:97-114.<br />
4. Nebe-von-Caron G, Stephens PJ, Badley RA. <strong>Bacterial</strong> detection and<br />
differentiation by cytometry and fluorescent probes. Proceedings of the<br />
Royal Microbiological Society. 1999;34:321-327.<br />
5. Horwitz W. Official Methods of Analysis of AOAC International. 17th<br />
Edition. Association of Official Agricultural Chemists. 2000.<br />
Contributors<br />
Rana Alsharif, Martin Tapia, William Godfrey<br />
<strong>BD</strong> <strong>Biosciences</strong>, San Jose, CA<br />
Jon Wannlund, Mandar Nagar<br />
<strong>BD</strong> Diagnostic Systems, Sparks, MD<br />
For Research Use Only. Not for use in diagnostic procedures.<br />
Trypticase, RODAC, TruCOUNT, FACSCalibur, CaliBRITE, and CellQuest are trademarks of<br />
Becton, Dickinson and Company.<br />
Pipetman is a trademark of Rainin Instrument Company, Inc.<br />
SPOR-KLENZ is a trademark of Steris Corporation.<br />
Pluronic is a trademark of BASF Corporation.<br />
® 2001 Becton, Dickinson and Company<br />
Clontech Discovery Labware Immunocytometry Systems PharMingen<br />
Europe<br />
Tel (32) 53-720-211<br />
Fax (32) 53-720-450<br />
Japan<br />
Tel 0120-8555-90<br />
Mexico<br />
Tel (52) 5-284-8281<br />
Fax (52) 5-284-8288<br />
United States<br />
Tel (877) 232-8995<br />
Fax (408) 954-2347<br />
recycled FM 32438<br />
23-6288-00 8/2001<br />
<strong>BD</strong> <strong>Biosciences</strong><br />
Clontech<br />
Discovery Labware<br />
Immunocytometry Systems<br />
Pharmingen