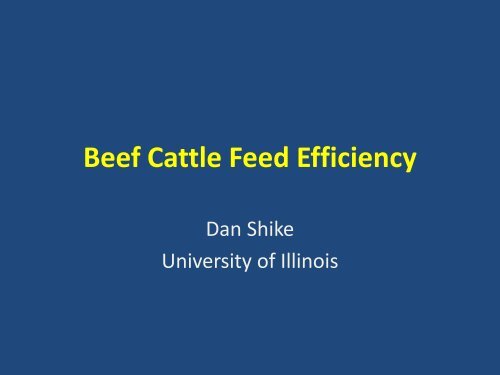
Beef Cattle Feed Efficiency - Dan Shike (University of
Beef Cattle Feed Efficiency - Dan Shike (University of
Beef Cattle Feed Efficiency - Dan Shike (University of

You also want an ePaper? Increase the reach of your titles
YUMPU automatically turns print PDFs into web optimized ePapers that Google loves.
<strong>Beef</strong> <strong>Cattle</strong> <strong>Feed</strong> <strong>Efficiency</strong><br />
<strong>Dan</strong> <strong>Shike</strong><br />
<strong>University</strong> <strong>of</strong> Illinois
• Introduction<br />
Outline<br />
• Definitions <strong>of</strong> feed efficiency<br />
• <strong>Feed</strong>lot closeout data<br />
• Challenges we face<br />
• New technology<br />
• Cow efficiency<br />
• Summary
Why all the buzz about efficiency?<br />
• Decreasing acres for crop production<br />
• Increasing world population<br />
• Increased utilization <strong>of</strong> food for fuel<br />
• Increasing feed cost (including forages)<br />
• Other inputs increasing in cost (fuel,<br />
transportation, fertilizer)
<strong>Feed</strong> costs and pr<strong>of</strong>itability<br />
• <strong>Feed</strong> costs have historically been 50-70% <strong>of</strong> the cost <strong>of</strong><br />
production in beef enterprises<br />
• As corn prices approached and exceeded $7 per bushel, feed<br />
costs were nearly 80% <strong>of</strong> the cost in many feedlot operations<br />
• A feed efficiency improvement <strong>of</strong> approximately 10% across<br />
the entire feedlot sector would reduce feed costs $1.2 Billion<br />
in 2011 (Weaber, 2011)<br />
• Fewer resources used = improved global food security
A 1% improvement in feed efficiency has the same<br />
economic impact as 3% improvement in rate <strong>of</strong> gain
Measures <strong>of</strong> feed efficiency<br />
• Gross feed efficiency: ratio <strong>of</strong> live-weight gain<br />
to dry matter intake (DMI)<br />
– 0.12 – 0.22 (higher number better)<br />
• <strong>Feed</strong> conversion ratio (FCR): DMI to gain ratio<br />
– 4.5 – 7.5 (lower number better)<br />
• FCR is a gross efficiency measurement – DOES<br />
NOT attempt to partition feed inputs into<br />
portions needed to support maintenance and<br />
growth requirements
Measures <strong>of</strong> feed efficiency<br />
• Why not just select for FCR?<br />
• FCR is negatively correlated with:<br />
– Postweaning ADG<br />
– Yearling BW<br />
– Cow mature size
Risks <strong>of</strong> selecting for FCR<br />
• Selecting for improved FCR<br />
will indirectly:<br />
– Increase genetic merit for<br />
growth<br />
– Increase cow mature size<br />
– Increase feed costs for the<br />
cow herd
Measures <strong>of</strong> efficiency<br />
• Residual <strong>Feed</strong> Intake (RFI)<br />
– The difference between actual intake and<br />
predicted intake based on animal’s gain, body<br />
weight, and composition<br />
– NEGATIVE RFI IS GOOD!<br />
• Required less feed then predicted<br />
– Independent <strong>of</strong> growth and mature size<br />
– Linked to biologically relevant traits linked with<br />
feed efficiency<br />
• Digestibility, heat production, protein turnover
Measures <strong>of</strong> efficiency<br />
• Residual Average Daily Gain (RADG)<br />
– The difference between actual gain and<br />
predicted gain based on animals intake, body<br />
weight, and composition<br />
– POSITIVE RADG IS GOOD!<br />
• Gained more weight than predicted<br />
– Correlated to growth
On a feed:gain basis, beef cattle are least efficient<br />
compared to other livestock<br />
< 2:1 < 3.5:1 > 6:1
Poultry Improvement<br />
• 250% improvement in<br />
efficiency since 1957
<strong>Feed</strong>/Gain (DM)<br />
9<br />
8.5<br />
8<br />
7.5<br />
7<br />
6.5<br />
6<br />
Fifteen years <strong>of</strong> Iowa <strong>Feed</strong>lot Enterprise<br />
Records (<strong>Feed</strong> <strong>Efficiency</strong>, 1978-1992)<br />
Rate <strong>of</strong> Change-- .047 lb./year<br />
1976 1978 1980 1982 1984 1986 1988 1990 1992<br />
Year<br />
1 pound improvement in FE/20 years<br />
Loy, 1993
Fifteen years <strong>of</strong> Midwestern <strong>Feed</strong>lot Closeouts<br />
(<strong>Feed</strong> <strong>Efficiency</strong>, 600-800 lb. steers, 1988-2002)<br />
<strong>Feed</strong>/gain (DM)<br />
9<br />
8.5<br />
8<br />
7.5<br />
7<br />
6.5<br />
6<br />
Rate <strong>of</strong> Change-- .033 lb./year<br />
1985 1990 1995 2000 2005<br />
Year<br />
1 pound improvement in FE/30 years<br />
Loy, 2004
Midwestern Closeout Summaries (<strong>Feed</strong><br />
<strong>Efficiency</strong>, 700-800 lb. steers, last 10 years)<br />
<strong>Feed</strong>/Gain (DM)<br />
9<br />
8.5<br />
8<br />
7.5<br />
7<br />
6.5<br />
6<br />
Rate <strong>of</strong> Change– none!<br />
2001 2003 2005 2007 2009 2011<br />
Year<br />
Land O’ Lakes/Purina <strong>Feed</strong>s, yearly closeout summaries<br />
http://www.beeflinks.com/articles.htm
(Reinhardt, Waggoner, KSU)
Conclusion—feedlot closeout data<br />
• The rate <strong>of</strong> improvement has slowed<br />
• The genetics <strong>of</strong> feed efficiency is a largely<br />
untapped source <strong>of</strong> improvement
Why are beef cattle less efficient?<br />
• <strong>Feed</strong> higher<br />
fiber diets
Why are beef cattle less efficient?<br />
• Rumen<br />
Fermentation<br />
• Bacteria produce<br />
VFA’s<br />
• Bacteria produce<br />
methane
Why are beef cattle less efficient?<br />
• High maintenance<br />
requirement<br />
• > 50% <strong>of</strong> feed<br />
intake used for<br />
maintenance
Why are beef cattle less efficient?<br />
• No selection for feed efficiency<br />
• Why?<br />
– Individual feeding<br />
– Expensive facilities<br />
– High labor requirement<br />
– Lack <strong>of</strong> social interaction decreases<br />
feed intake<br />
– Difficult to compare at varying<br />
body compositions
Advances in technology allowing improved feed<br />
efficiency measurement<br />
• GrowSafe Units<br />
– Radio frequency ID<br />
– Wireless<br />
communication<br />
– Custom s<strong>of</strong>tware<br />
giving < 2% error in<br />
feed intake
Advances in technology allowing improved<br />
feed efficiency measurement<br />
• Ultrasound technology<br />
• Repeated<br />
measurements:<br />
– 12 th rib backfat<br />
– Rump fat<br />
– Marbling<br />
– Ribeye area
Why is feed efficiency important?<br />
• <strong>Feed</strong> cost are 65-70% <strong>of</strong><br />
all costs<br />
• 1% improvement in feed<br />
efficiency = 3%<br />
improvement ADG
Understanding the components <strong>of</strong><br />
feed efficiency<br />
• More efficient cattle may have improved<br />
digestion or metabolism <strong>of</strong> nutrients, or<br />
• More efficient cattle may utilize absorbed<br />
nutrients more efficiently
Understanding the components <strong>of</strong><br />
• Maintenance<br />
– Genetic and environmental component<br />
– Impacted by metabolic rate, cellular<br />
efficiency<br />
• Production<br />
feed efficiency<br />
– Growth-impacted by body composition,<br />
nutrient partitioning<br />
– Fetal growth, milk production, body<br />
condition change
<strong>Beef</strong> cow efficiency<br />
• What about cow efficiency?<br />
– ~70% <strong>of</strong> feed resources for cowherd<br />
– ~70% <strong>of</strong> feed for maintenance<br />
– ~50% OF ALL FEED TO MAINTAIN<br />
COWHERD<br />
• How do we define cow<br />
efficiency?<br />
– Pounds <strong>of</strong> calf weaned per unit <strong>of</strong><br />
feed intake<br />
– What about reproduction<br />
– What about longevity
High Maintenance Cow<br />
• High milk production<br />
Maintenance energy<br />
• High visceral organ weight<br />
• High body lean mass<br />
• Low body fat mass<br />
• High output and high input<br />
Low Maintenance Cow<br />
• Low milk production<br />
• Low visceral organ weight<br />
• Low body lean mass<br />
• High body fat mass<br />
• Low output and low input
Restricted feed resources<br />
• Favors more moderate size,<br />
moderate milk production<br />
• “Low maintenance” breeds<br />
are most efficient<br />
– Angus, Red Poll<br />
• High maintenance breeds<br />
are least efficient<br />
– Simmental, Charolais,<br />
Limousin, Gelbvieh<br />
Environment<br />
Jenkins and Ferrell, 1994<br />
Abundant feed resources<br />
• Favors larger, heavier<br />
milking biological types<br />
• “High maintenance” breeds<br />
are most efficient<br />
– Simmental, Charolais,<br />
Limousin, Gelbvieh<br />
• Low maintenance breeds<br />
are least efficient<br />
– Hereford, Angus, Red Poll
Intake<br />
• Why not just select for intake?<br />
– Who wants cows with extremely high intake?<br />
– Who wants cows with extremely low intake?<br />
• Does that mean we would have selected for cows with<br />
poor appetite or that don’t want to actively forage?
Variation in cow efficiency<br />
Small<br />
Cow Big Cow<br />
Moderate<br />
Cow<br />
Moderate<br />
Cow<br />
BW, lbs 1186 1453 1306 1308<br />
Milk Production, lbs 15.8 23.0 17.8 20.4<br />
Hip Height, in. 52 53.0 53.0 53.5<br />
BCS 5.5 6.0 6.0 5.5<br />
DMI, lbs 56.6 45.4 54.4 35.8<br />
Adcock et al., 2010
<strong>Beef</strong> cow efficiency<br />
• Can we select for improved feed efficiency in<br />
the feedlot without having negative impacts<br />
on the cowherd?<br />
• Or better yet is there a way to select for<br />
improved feed efficiency in feedlot that will<br />
improve cow efficiency?
<strong>Beef</strong> cow efficiency<br />
• What about diet type?<br />
– <strong>Feed</strong>lot efficiency trials – high-energy, grain-based<br />
– Cowherd – moderate to low-energy, forage-based<br />
• Why would they be the same?<br />
– Maintenance energy (heat production, protein<br />
turnover)<br />
• Why might they be different?<br />
– Intake regulation<br />
• Grain – chemostatic<br />
• Forage – fill-regulated
Comparing RFI (forage vs. grain)
Comparing RFI 2007<br />
Sire Grain RFI Forage RFI<br />
A -.58 -.18<br />
B -.42 -.03<br />
C -.10 -.46<br />
D .10 .44<br />
E .12 .29<br />
F .95 .00
Comparing RFI 2008<br />
Sire Grain RFI Forage RFI<br />
A -1.18 -.12<br />
B -0.98 -.33<br />
C -0.90 .88<br />
D -0.69 -.28<br />
E -0.55 -.35<br />
F -0.27 .78<br />
G -0.18 -.38<br />
H -0.16 -.52
Comparing RFI 2008<br />
Sire Grain RFI Forage RFI<br />
I -0.10 .38<br />
J 0.02 .93<br />
K 0.13 -1.06<br />
L 0.13 .18<br />
M 0.38 .21<br />
N 0.63 .03<br />
O 0.74 -.47<br />
P 0.85 .61
Forage vs. Grain<br />
• Continue to collect data<br />
• Identify genetics that are superior for both<br />
• Let the geneticists figure out how to select<br />
for it!!
Summary<br />
• Changing dynamics force producers to look at<br />
efficiency<br />
• Several definitions <strong>of</strong> feed efficiency<br />
• <strong>Beef</strong> industry has made minimal progress in<br />
efficiency<br />
• New technology will facilitate progress<br />
• Cow efficiency has unique challenges<br />
• Still have a lot to learn!!