Province of Romblon - UNDP in the Philippines
Province of Romblon - UNDP in the Philippines
Province of Romblon - UNDP in the Philippines
Create successful ePaper yourself
Turn your PDF publications into a flip-book with our unique Google optimized e-Paper software.
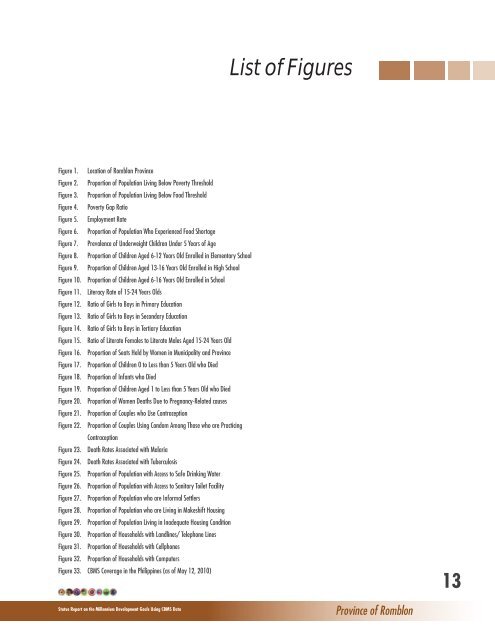
Figure 1. Location <strong>of</strong> <strong>Romblon</strong> <strong>Prov<strong>in</strong>ce</strong><br />
Figure 2. Proportion <strong>of</strong> Population Liv<strong>in</strong>g Below Poverty Threshold<br />
Figure 3. Proportion <strong>of</strong> Population Liv<strong>in</strong>g Below Food Threshold<br />
Figure 4. Poverty Gap Ratio<br />
Figure 5. Employment Rate<br />
Figure 6. Proportion <strong>of</strong> Population Who Experienced Food Shortage<br />
Figure 7. Prevalence <strong>of</strong> Underweight Children Under 5 Years <strong>of</strong> Age<br />
Figure 8. Proportion <strong>of</strong> Children Aged 6-12 Years Old Enrolled <strong>in</strong> Elementary School<br />
Figure 9. Proportion <strong>of</strong> Children Aged 13-16 Years Old Enrolled <strong>in</strong> High School<br />
Figure 10. Proportion <strong>of</strong> Children Aged 6-16 Years Old Enrolled <strong>in</strong> School<br />
Figure 11. Literacy Rate <strong>of</strong> 15-24 Years Olds<br />
Figure 12. Ratio <strong>of</strong> Girls to Boys <strong>in</strong> Primary Education<br />
Figure 13. Ratio <strong>of</strong> Girls to Boys <strong>in</strong> Secondary Education<br />
Figure 14. Ratio <strong>of</strong> Girls to Boys <strong>in</strong> Tertiary Education<br />
Figure 15. Ratio <strong>of</strong> Literate Females to Literate Males Aged 15-24 Years Old<br />
Figure 16. Proportion <strong>of</strong> Seats Held by Women <strong>in</strong> Municipality and <strong>Prov<strong>in</strong>ce</strong><br />
Figure 17. Proportion <strong>of</strong> Children 0 to Less than 5 Years Old who Died<br />
Figure 18. Proportion <strong>of</strong> Infants who Died<br />
Figure 19. Proportion <strong>of</strong> Children Aged 1 to Less than 5 Years Old who Died<br />
Figure 20. Proportion <strong>of</strong> Women Deaths Due to Pregnancy-Related causes<br />
Figure 21. Proportion <strong>of</strong> Couples who Use Contraception<br />
Figure 22. Proportion <strong>of</strong> Couples Us<strong>in</strong>g Condom Among Those who are Practic<strong>in</strong>g<br />
Contraception<br />
Figure 23. Death Rates Associated with Malaria<br />
Figure 24. Death Rates Associated with Tuberculosis<br />
Figure 25. Proportion <strong>of</strong> Population with Access to Safe Dr<strong>in</strong>k<strong>in</strong>g Water<br />
Figure 26. Proportion <strong>of</strong> Population with Access to Sanitary Toilet Facility<br />
Figure 27. Proportion <strong>of</strong> Population who are Informal Settlers<br />
Figure 28. Proportion <strong>of</strong> Population who are Liv<strong>in</strong>g <strong>in</strong> Makeshift Hous<strong>in</strong>g<br />
Figure 29. Proportion <strong>of</strong> Population Liv<strong>in</strong>g <strong>in</strong> Inadequate Hous<strong>in</strong>g Condition<br />
Figure 30. Proportion <strong>of</strong> Households with Landl<strong>in</strong>es/ Telephone L<strong>in</strong>es<br />
Figure 31. Proportion <strong>of</strong> Households with Cellphones<br />
Figure 32. Proportion <strong>of</strong> Households with Computers<br />
Figure 33. CBMS Coverage <strong>in</strong> <strong>the</strong> Philipp<strong>in</strong>es (as <strong>of</strong> May 12, 2010)<br />
List <strong>of</strong> Figures<br />
Status Report on <strong>the</strong> Millennium Development Goals Us<strong>in</strong>g CBMS Data <strong>Prov<strong>in</strong>ce</strong> <strong>of</strong> <strong>Romblon</strong><br />
13


