Housing and Support Program (HASP): Final Evaluation Report
Housing and Support Program (HASP): Final Evaluation Report
Housing and Support Program (HASP): Final Evaluation Report

Create successful ePaper yourself
Turn your PDF publications into a flip-book with our unique Google optimized e-Paper software.
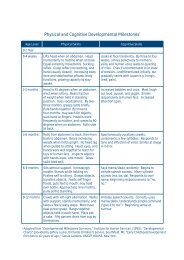
6.7 Physical <strong>and</strong> mental health<br />
Links between mental illness <strong>and</strong> premature death<br />
have brought the physical health of individuals with<br />
mental health conditions into focus in recent times.<br />
We invited clients to provide a rating of their physical<br />
health. While 35% of clients rated their physical health<br />
as very good/excellent, 25% rated their physical<br />
health as being poor/fair (see graph below). Almost<br />
half of the clients (49.3%) indicated that they had a<br />
physical health problem <strong>and</strong> 33% claimed to be taking<br />
medications for physical health problems.<br />
Fig. 6.4 Rating of physical <strong>and</strong> mental health<br />
Percent<br />
45<br />
40<br />
35<br />
30<br />
25<br />
20<br />
15<br />
10<br />
5<br />
0<br />
Poor<br />
Legend Physical<br />
health<br />
Fair<br />
Good<br />
Mental<br />
health<br />
Very<br />
good<br />
Excellent<br />
Three-quarters of the clients (n=60) smoked cigarettes<br />
with a daily intake of between fi ve <strong>and</strong> 50 cigarettes<br />
(average daily use was 20.5 cigarettes, sd= 8.2). In the<br />
month prior to interview, 41 clients (53.9%) had drunk<br />
alcohol, with two clients claiming to have had alcohol<br />
on every day in the past month. One-third of those who<br />
had alcohol had only two drinks on the days that they<br />
consumed alcohol. Four of the clients claimed to have<br />
had cannabis in the month prior to interview.<br />
6.8 Overall quality of life<br />
An overall rating of quality of life was obtained by<br />
asking clients to rate their quality of life on a 10-point<br />
scale where ‘1’ was the worst quality of life possible<br />
<strong>and</strong> ‘10’ was the best quality of life possible. <strong>HASP</strong><br />
clients provided a mean rating of 6.87 out of a possible<br />
total score of 10.<br />
Fig. 6.5 Rating of overall quality of life<br />
Percent<br />
25<br />
20<br />
15<br />
10<br />
5<br />
0<br />
One<br />
Two Three Four<br />
Five<br />
<strong>HASP</strong><br />
Six<br />
Seven Eight<br />
Nine<br />
Ten<br />
<strong>Housing</strong> <strong>and</strong> <strong>Support</strong> <strong>Program</strong> (<strong>HASP</strong>)<br />
59