Chapter 6: Elasticity, Consumer Surplus, and Producer Surplus
Chapter 6: Elasticity, Consumer Surplus, and Producer Surplus
Chapter 6: Elasticity, Consumer Surplus, and Producer Surplus

Create successful ePaper yourself
Turn your PDF publications into a flip-book with our unique Google optimized e-Paper software.
$3<br />
2<br />
1<br />
P<br />
a<br />
0 10 20 30 40<br />
(a)<br />
Elastic<br />
$3<br />
2<br />
1<br />
P<br />
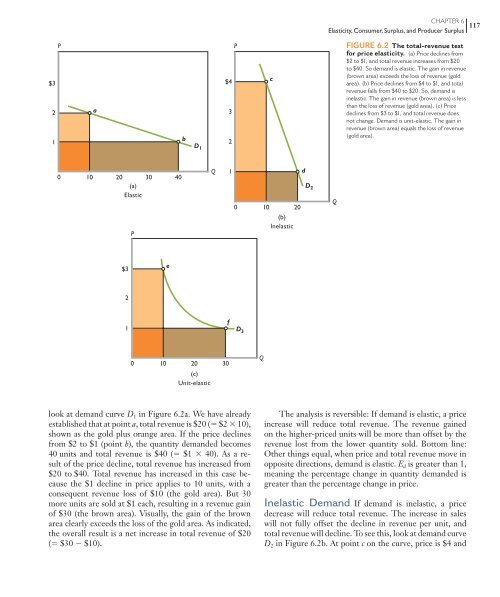
look at dem<strong>and</strong> curve D 1 in Figure 6.2 a. We have already<br />
established that at point a , total revenue is $20 ( $2 10),<br />
shown as the gold plus orange area. If the price declines<br />
from $2 to $1 (point b ), the quantity dem<strong>and</strong>ed becomes<br />
40 units <strong>and</strong> total revenue is $40 ( $1 40). As a result<br />
of the price decline, total revenue has increased from<br />
$20 to $40. Total revenue has increased in this case because<br />
the $1 decline in price applies to 10 units, with a<br />
consequent revenue loss of $10 (the gold area). But 30<br />
more units are sold at $1 each, resulting in a revenue gain<br />
of $30 (the brown area). Visually, the gain of the brown<br />
area clearly exceeds the loss of the gold area. As indicated,<br />
the overall result is a net increase in total revenue of $20<br />
( $30 $10).<br />
e<br />
b<br />
D 1<br />
0 10 20 30<br />
(c)<br />
Unit-elastic<br />
Q<br />
$4<br />
f<br />
3<br />
2<br />
1<br />
P<br />
0 10 20<br />
D 3<br />
Q<br />
c<br />
(b)<br />
Inelastic<br />
d<br />
D 2<br />
CHAPTER 6<br />
<strong>Elasticity</strong>, <strong>Consumer</strong>, <strong>Surplus</strong>, <strong>and</strong> <strong>Producer</strong> <strong>Surplus</strong> 117<br />
Q<br />
FIGURE 6.2 The total-revenue test<br />
for price elasticity. (a) Price declines from<br />
$2 to $1, <strong>and</strong> total revenue increases from $20<br />
to $40. So dem<strong>and</strong> is elastic. The gain in revenue<br />
(brown area) exceeds the loss of revenue (gold<br />
area). (b) Price declines from $4 to $1, <strong>and</strong> total<br />
revenue falls from $40 to $20. So, dem<strong>and</strong> is<br />
inelastic. The gain in revenue (brown area) is less<br />
than the loss of revenue (gold area). (c) Price<br />
declines from $3 to $1, <strong>and</strong> total revenue does<br />
not change. Dem<strong>and</strong> is unit-elastic. The gain in<br />
revenue (brown area) equals the loss of revenue<br />
(gold area).<br />
The analysis is reversible: If dem<strong>and</strong> is elastic, a price<br />
increase will reduce total revenue. The revenue gained<br />
on the higher-priced units will be more than offset by the<br />
revenue lost from the lower quantity sold. Bottom line:<br />
Other things equal, when price <strong>and</strong> total revenue move in<br />
opposite directions, dem<strong>and</strong> is elastic. E d is greater than 1,<br />
meaning the percentage change in quantity dem<strong>and</strong>ed is<br />
greater than the percentage change in price.<br />
Inelastic Dem<strong>and</strong> If dem<strong>and</strong> is inelastic, a price<br />
decrease will reduce total revenue. The increase in sales<br />
will not fully offset the decline in revenue per unit, <strong>and</strong><br />
total revenue will decline. To see this, look at dem<strong>and</strong> curve<br />
D 2 in Figure 6.2 b. At point c on the curve, price is $4 <strong>and</strong>