

US Economic Briefing: High Frequency Indicators
US Economic Briefing: High Frequency Indicators
US Economic Briefing: High Frequency Indicators

Create successful ePaper yourself
Turn your PDF publications into a flip-book with our unique Google optimized e-Paper software.
80000<br />
78000<br />
76000<br />
74000<br />
72000<br />
70000<br />
68000<br />
66000<br />
64000<br />
62000<br />
60000<br />
80000<br />
78000<br />
76000<br />
74000<br />
72000<br />
70000<br />
68000<br />
66000<br />
64000<br />
62000<br />
60000<br />
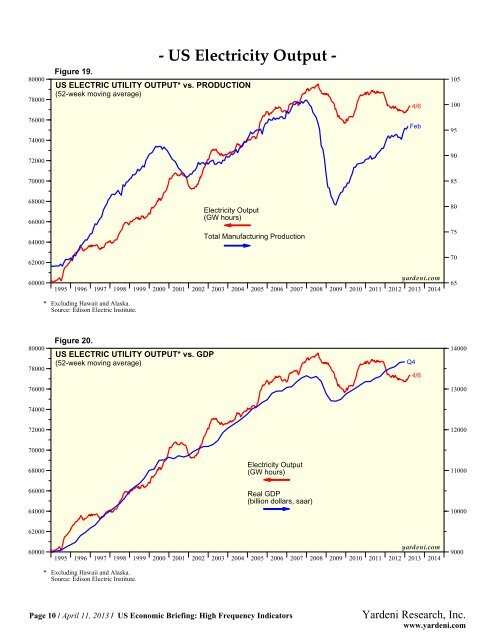
Figure 19.<br />
<strong>US</strong> ELECTRIC UTILITY OUTPUT* vs. PRODUCTION<br />
(52-week moving average)<br />
Electricity Output<br />
(GW hours)<br />
Total Manufacturing Production<br />
1995 1996 1997 1998 1999 2000 2001 2002 2003 2004 2005 2006 2007 2008 2009 2010 2011 2012 2013 2014<br />
* Excluding Hawaii and Alaska.<br />
Source: Edison Electric Institute.<br />
Figure 20.<br />
<strong>US</strong> ELECTRIC UTILITY OUTPUT* vs. GDP<br />
(52-week moving average)<br />
4/6<br />
Feb<br />
yardeni.com<br />
1995 1996 1997 1998 1999 2000 2001 2002 2003 2004 2005 2006 2007 2008 2009 2010 2011 2012 2013 2014<br />
* Excluding Hawaii and Alaska.<br />
Source: Edison Electric Institute.<br />
- <strong>US</strong> Electricity Output -<br />
Electricity Output<br />
(GW hours)<br />
Real GDP<br />
(billion dollars, saar)<br />
Page 10 / April 11, 2013 / <strong>US</strong> <strong>Economic</strong> <strong>Briefing</strong>: <strong>High</strong> <strong>Frequency</strong> <strong>Indicators</strong><br />
Q4<br />
4/6<br />
yardeni.com<br />
105<br />
100<br />
95<br />
90<br />
85<br />
80<br />
75<br />
70<br />
65<br />
14000<br />
13000<br />
12000<br />
11000<br />
10000<br />
9000<br />
Yardeni Research, Inc.<br />
www.yardeni.com