a ChIP-Seq case study - Genomatix
a ChIP-Seq case study - Genomatix
a ChIP-Seq case study - Genomatix

Create successful ePaper yourself
Turn your PDF publications into a flip-book with our unique Google optimized e-Paper software.
PPARgamma in adipocyte differentiation - a <strong>ChIP</strong>-<strong>Seq</strong> <strong>case</strong> <strong>study</strong><br />
Example analysis using <strong>Genomatix</strong> technologies to <strong>study</strong> a <strong>ChIP</strong>-<strong>Seq</strong> data on PPARgamma.<br />
Intention and extent<br />
This <strong>case</strong> <strong>study</strong> shows an example of an analysis workflow suitable for <strong>ChIP</strong>-<strong>Seq</strong> data. It is intended to show<br />
options and approaches. This <strong>study</strong> will cover topics such as:<br />
• peak finding and analysis for known transcription factor binding sites,<br />
• definition of de novo binding site matrices from cluster sequences,<br />
• identification and analysis of potential target genes including associated pathways,<br />
• promoter analysis and identification of a common regulatory framework in a gene subset and subsequent<br />
scan of all annotated promoters for matches for this framework,<br />
• positional correlations for different data sets,<br />
• data visualization.<br />
Data source<br />
This <strong>study</strong> is based on data from a publication <strong>study</strong>ing PPARgamma, a key regulator in adipocyte<br />
differentiation. Using <strong>ChIP</strong>-<strong>Seq</strong> Nielsen et al. (Genes Dev. 2008; 22(21): 2953–2967, PMID: 18981474)<br />
followed the changes in the genome-wide profile of PPARgamma, RXR and PolII binding sites during<br />
adipocyte differentiation over 6 days.<br />
For demonstration we will focus on the changes in PPARgamma binding sites between day 0 and day 6,<br />
analyze these and extract associated genes and pathways. For both time points, 3 replicates for the<br />
PPARgamma <strong>ChIP</strong> are available. For correlations, data sets for RXR and PollI from the same publication will<br />
be included.<br />
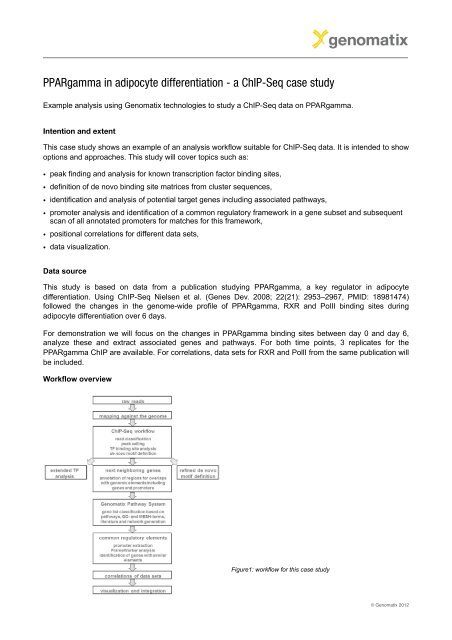
Workflow overview<br />
Figure1: workflow for this <strong>case</strong> <strong>study</strong><br />
© <strong>Genomatix</strong> 2012
Mapping<br />
The first step in NGS data analysis is the alignment (also called "mapping") of the raw sequences against<br />
reference sequences such as genomes or transcriptomes. The mapping on the <strong>Genomatix</strong> Mining Station<br />
(GMS) is performed in two steps: first all potential mapping positions for the reads are identified through<br />
short unique sequence stretches (anchors) followed by a whole read alignment to find the best match.<br />
<strong>Seq</strong>uence type detection and nucleotide statistics calculation are automatically performed on a GMS during<br />
data upload and quality control. Statistics include number of reads, GC content and nucleotide distribution<br />
over read length.<br />
Using the graphical user interface (GUI) on a GMS, several mappings can be started at the same time.<br />
Figure 2 shows the setup screen for the PPARgamma samples from day 0. The 32 nt raw sequences were<br />
mapped against the mouse genome library (NCBI_build37) allowing one point mutation in the first mapping<br />
step (deep) and requiring at least 92% alignment quality for the whole read. The alignment results are<br />
reported for uniquely mapping reads but also for reads with up to 50 hits (multiple hits) in bigBED and BAM<br />
file format. These files can be converted to BED and SAM format during result export.<br />
Figure 2: Settings for genomic mapping of day 0 PPARgamma-<strong>ChIP</strong> data.<br />
After completion of the mapping the results can be accessed from the interface and a mapping statistics is<br />
shown. In total, 7 and 6 million reads were mapped uniquely for day 0 and day 6, respectively (Figure 3).<br />
Only these were used for further analysis on the <strong>Genomatix</strong> Genome Analyzer (GGA).<br />
© <strong>Genomatix</strong> 2012
Downstream analysis<br />
Figure 3: Mapping statistics for PPARg day0 (sample 2): Unique hits<br />
- reads mapping only once in the genome; multiple hits - reads<br />
mapping between 2 and 50 times in the genome; ambiguous hits -<br />
reads mapping more than 50 times in the genome; insufficient<br />
quality hits - reads which could not be mapped fulfilling the<br />
alignment quality; ignored hits - reads where no anchor seed could<br />
be found.<br />
The downstream analysis was performed on the <strong>Genomatix</strong> Genome Analyzer (GGA) which provides a user<br />
friendly interface to the whole <strong>Genomatix</strong> Software Suite and the NGS-Data analysis module. Data<br />
generated on the GMS are directly accessible from the GGA.<br />
Data import<br />
The data were imported via the file upload page which can be accessed from all tasks (use the „Add BED<br />
files ...“ button) and allows direct upload from the GMS, mounted storage devices or local computers. All<br />
BED or bigBED files uploaded for the active project are then be displayed in the project management and<br />
are available for further analysis.<br />
<strong>ChIP</strong>-<strong>Seq</strong> workflow<br />
To obtain a first overview of the data we recommend the use of the <strong>ChIP</strong>-<strong>Seq</strong> workflow which can be found<br />
in the ‘NGS Analysis’ menu of the navigation bar on top of the page. The workflow comprises the following<br />
steps:<br />
• peak finding (clustering) using three algorithms (NGSAnalyzer, MACS, SICER) for samples with and<br />
without replicates and controls and a subsequent evaluation using DE<strong>Seq</strong>, edgeR or the Audic & Claverie<br />
approach.<br />
• read and cluster classification for overlap with genomic features such as exons, introns, promoters and<br />
intergenic regions.<br />
• analysis of TF binding sites for overrepresentation in the peak sequences<br />
• extraction of sequences underlying the peaks (from reference genome)<br />
• de novo motif definition for generation of a new or confirmation of a known site.<br />
All these tasks can be setup in one go (Figures 5 & 7):<br />
For this example, the replicates for PPARgamma day 6 were selected as experiment and replicates from day<br />
0 as control. PPARgamma should not be expressed at this stage so that these samples can be considered<br />
as background.<br />
© <strong>Genomatix</strong> 2012
Figure 5: <strong>ChIP</strong>-<strong>Seq</strong> workflow setup: All BED files uploaded within the active project are available for analysis and can be selected as<br />
treatment or control samples.<br />
For clustering, default settings (NGSAnalyzer with 100bp window size and automatic read density threshold<br />
calculation based on Poisson distribution) were used.<br />
Only clusters which were present in at least 2 replicates (65%) with an overlap of 100 bp were considered.<br />
For statistical evaluation of the remaining clusters edgeR was used (default).<br />
Further options, like ‘Cluster Classification and Statistics’, ‘Extraction of <strong>Seq</strong>uences for all Clusters’,<br />
‘Transcription Factor Binding Site Overrepresentation’, and ‘Definition of new Binding Sites in Clusters’ are<br />
selected by default.<br />
Figure 6: <strong>ChIP</strong>-<strong>Seq</strong> workflow setup: Selection of peak finding algorithm and parameter setup for replicate treatment and statistical<br />
analysis.<br />
As a last step, the analysis was named and submitted.<br />
© <strong>Genomatix</strong> 2012
Figure 7: Naming and submitting the analysis.<br />
After completion of the analysis, the result can be accessed through the link provided in the notification email<br />
or via the ‘Project Management’ under ‘Project & Accounts’ in the navigation bar.<br />
The result page lists the parameters and programs used and the results of the subtasks selected. All results<br />
can be downloaded or saved in the ‘Project Management’.<br />
The clustering results<br />
In this example, more than 10,000 clusters were called in the single samples, but only 8,291 are detected in<br />
at least two PPARgamma-day6-<strong>ChIP</strong> replicates. Of these 7,747 clusters show a statistical significant<br />
enrichment compared to the day0 controls. This number is comparable to the results from Nielsen et al. who<br />
report about 7,000 PPARgamma enriched regions.<br />
11.6% of these are located in promoter regions, which corresponds to an 4.5 fold enrichment.<br />
All BED containing the positional information for the different cluster categories can be downloaded or saved<br />
in the „Project Management“ for further (more detailed) analyses. For this example it is sufficient to save the<br />
BED file for the significant enriched regions in the "Project Management"<br />
(PPARg_day6_vs_day0_enriched_regions.bed).<br />
Figure 8: <strong>ChIP</strong>-<strong>Seq</strong> workflow<br />
results: Clustering result<br />
overview shows that 8,291<br />
PPARgamma peaks are found<br />
in at least 2 samples in day 6<br />
but not in day 0. All detailed<br />
results can be downloaded.<br />
© <strong>Genomatix</strong> 2012
Transcription Factor Binding Site Overrepresentation in clusters<br />
The analysis of predicted transcription factor binding sites in the cluster regions shows a clear enrichment for<br />
the V$PERO binding site family, which comprises the PPAR/RXR heterodimer binding sites (DR1 elements).<br />
TF-binding site families combine binding sites from transcription factors with similar matrix and biology and<br />
thereby avoid unnecessary large and confusing outputs. The top scoring of V$PERO shows that the <strong>ChIP</strong><br />
enrichment was successful (Figure 9).<br />
Also among the top scoring families is V$RXRF, which contains binding sites for other RXR heterodimers.<br />
Finding new binding sites in clusters: de novo motif definition<br />
Figure 9: <strong>ChIP</strong>-<strong>Seq</strong> workflow results:<br />
Overrepresentation analysis for transcription factor<br />
binding sites. Top ranking family V$PERO contains<br />
the PPARgamma/RXR heterodimer binding sites<br />
(DR1 elements). The links underlying the family<br />
abbreviations provide comprehensive information on<br />
members and the generation of the matrix family.<br />
The last part of the workflow, the de novo binding site definition, yields the IUPAC consensus motif<br />
NNAGSNSAGNN with S standing for C or G. The Workflow uses fixed parameters and is optimized for<br />
compact binding sites, thus it picks up only one conserved half site of the PPARg/RXR binding site. To<br />
improve the results, the analysis can be rerun with refined parameters using the task ‘CoreSearch’ (see<br />
below) accessible under ‘Pattern Definition’ in the navigation bar. Therefore, it is recommended to save the<br />
sequences of the top 1,000 regions and/or all clusters.<br />
Extended TF- binding site analysis<br />
Overrepresentation of TF families has been covered as part of the workflow. The same analysis can be<br />
performed for individual matrices or TF-modules with one fixed partner using the ‘Overrepresented TF<br />
binding sites’ task under ‘NGS Analyses’. For this analysis the previously saved BED file<br />
(PPARg_day6_vs_day0_enriched_regions.bed) containing the positions of the significant regions can be<br />
used.<br />
The top scoring individual matrix is V$PPAR_RXR.0.1, which describes the PPAR/RXR heterodimer binding<br />
sites (DR1), with matches in more than 50% of the input sequences (Figure 10).<br />
Figure 10: Overrepresentation analysis for individual<br />
matrices within the enriched peak regions yields<br />
V$PPAR_RXR binding sites as top scoring.<br />
© <strong>Genomatix</strong> 2012
The "Module overrepresentation" subtask searching for combinations of other binding sites with V$PERO<br />
(i.e. potential interaction partners) within 50 bp distance returns with frequent combinations of V$PERO with<br />
V$NF1F, V$NR2F, the well-known partner V$RXR but also with V$CEBP. These results are in line with the<br />
original publication where the authors report a high overlap between PPARg, RXR and C/EBP binding sites.<br />
Figure 11: Analysis of transcription factor combinations with V$PERO between 10 to 50 bp shows an overrepresentation of V$NF1F<br />
binding sites. The underlying distances are displayed in a graph behind the ‘list‘-link (see figure 12 left). The distance score can be used<br />
as indicator for a preferential distance between two transcription factor binding sites.<br />
Support for a functional interaction between the PPAR/RXR site binding protein and one or more V$NRF1<br />
family members comes from the distance relation of the binding sites (Figure 12, left). A quick check for<br />
literature cocitations in GePS revealed that PPARgamma can inhibit NF-I binding (Figure 12 right).<br />
Figure 12: left: display of observed distances between the V$PERO and the V$NF1F site show a preference at about 15 bp, hinting to a<br />
functional interaction.<br />
right: Cocitation analysis for PPARgamma and RXRalpha with members of the V$NF1F binding site family (human).<br />
Refined de novo motif definition<br />
With the background knowledge that PPARgamma binds the direct repeat of AGGTCA the motif definition<br />
task can be rerun with a 9 bp alignment core (instead of the 7bp used in the workflow) and a reduced<br />
sequence constraint (at least 50% of sequences must contain the motif instead of 75%) for the sequences of<br />
the top 1,000 clusters. Using these parameters the program returns a matrix with the consensus “N<br />
NGGNCA G AGGNN” which resembles the DR1 element and the matrix presented in the publication. Figure<br />
13 shows the nucleotide distribution matrix and the sequence logo.<br />
© <strong>Genomatix</strong> 2012
Figure 13: Nucleotide distribution matrix and sequence logo for de novo binding site generated from the top 1,000 cluster sequences.<br />
Biological classification of neighboring genes<br />
The aim of most <strong>ChIP</strong>-<strong>Seq</strong> experiments is to identify potential target genes which can then be associated<br />
with pathways to explore the underlying mechanisms. Although long distance regulation occurs, proximal<br />
effects play an important role in gene regulation. Genes located in proximity of the binding sites can be<br />
identified by either correlation of primary transcripts with enriched regions (using GenomeInspector) or by<br />
annotation of these regions for overlap with promoters or nearby genes (using ‘Annotation and statistics‘<br />
under ‘NGS Analysis‘, Figure 14).<br />
Figure 14: Setup screen for ‘General annotation and statistics‘ used to identify regions overlapping with various genomic features<br />
ncluding genes and promoters but also for identification of gene located up- and downstream of the enriched regions.<br />
© <strong>Genomatix</strong> 2012
After submission, the regions will be annotated for overlap with loci, exons, introns, promoters, transcription<br />
start sites, intergenic regions, microRNAs and repeats but also for the next neighboring genes up- and<br />
downstream from the region for both sense and anti-sense strand. A statistic will be displayed and the results<br />
can be downloaded completely or filtered for one or more of the categories. The results can be browsed<br />
(Figure 15) and GeneIDs of all genes overlapping with the input region or with their promoter can be<br />
extracted (Figure 16).<br />
Figure 15: ‘Annotation and Statistics‘ result page: neighboring genes and overlapping features are listed for each region, links to further<br />
gene information and the GenomeBrowser for visualization are provided.<br />
Figure 16: ‘Annotation and Statistics‘ result page: regions can be filtered by overlap and geneIDs of nearby genes can be extracted.<br />
For this example, the geneIDs of genes where promoters overlapped with PPARgamma enriched regions<br />
were downloaded as text file. To analyze the corresponding genes, the gene IDs can then be transferred to<br />
the <strong>Genomatix</strong> Pathway System by simple copy and paste or upload of the saved file.<br />
© <strong>Genomatix</strong> 2012
Pathway analysis with GePS<br />
The <strong>Genomatix</strong> Pathway System uses information from public sources combined with proprietary databases<br />
to characterize gene lists based on statistical analysis of literature, pathways and GO- and MeSH-terms.<br />
Pathways and networks can be generated and superimposed with user data. GePS can be accessed from<br />
the navigation bar under ‘Genomes & Data’.<br />
Figure 17: <strong>Genomatix</strong> Pathway System (GePS) overview screen showing the different entry options.<br />
To analyze the genes with PPARgamma binding sites in the promoter region, the file containing the geneIDs<br />
was uploaded and the organism was selected (Figure 18). Alternatively, the geneIDs could have been pasted<br />
into the setup screen.<br />
Figure 18: <strong>Genomatix</strong> Pathway System setup screen. GeneIDs or symbols can be entered via copy and paste or file upload. Available<br />
annotation types are listed. These will be used for classification and can be used as data filter for the analyzed genes.<br />
The first result GePS delivers is a characterization of the gene list based on pathways, Gene Ontology,<br />
MeSH-term and <strong>Genomatix</strong> proprietary annotation. Overrepresentation of biological terms associated with<br />
genes from the input list are calculated and listed in the left panel together with the respective p-value.<br />
© <strong>Genomatix</strong> 2012
Canonical pathways are only available for human but for other organisms genes can be mapped to the<br />
human orthologs before the analysis. Here literature based pathways (from <strong>Genomatix</strong> Literature Mining)<br />
were considered and show PPARgamma and alpha pathways as top scorers. The top ranking processes and<br />
diseases are related to metabolism. The tissue filter shows peroxisomes and adipocytes and even the cell<br />
line used in the experiment (3T3 L1). Reassuring is that PPARgamma is the most cocited transcription factor<br />
for the genes analyzed, indicating an enrichment for potential PPARgamma targets. The results fit well with<br />
PPARgamma being a key player in lipid metabolism.<br />
The results can be used as filters for networks or to construct new ones. The network below was generated<br />
by clicking on the top ranking pathway ‘Peroxisome proliferative activated …’. It shows PPARgamma as<br />
central transcription factor and known target genes such as Lpl. Dotted connection lines indicate<br />
automatically retrieved literature cocitations while solid lines indicate expert curated annotation. The latter<br />
ones show for example that Lpl and Sod1 are activated and Adipoq is inhibited by PPARgamma. Ucp2 and<br />
Rxra are greyed out since these two genes do not fulfill the additional filter ‘lipid metabolic process’ under<br />
‘Biological Processes’ applied (Figure 20).<br />
Comprehensive information about genes and connections can be retrieved by double click on the gene<br />
symbol and the line, respectively (Figure 21).<br />
Figure 19: Gene classification results for genes with PPARgamma binding in the promoter based on <strong>Genomatix</strong> literature Mining, GO-<br />
and MeSH-terms.<br />
© <strong>Genomatix</strong> 2012
Figure 20: Network generated for genes assigned to the literature pathway ‘lipid Peroxisome proliferative activated receptor alpha‘ and<br />
filtered for additional assignment to the biological process GO-term ‘lipid metabolic process‘ based on literature cocitations. Genes in<br />
yellow boxes fulfill both criteria, genes in grey boxes are not assigned to the GO-term ‘lipid metabolic process‘. Solid and dotted lines<br />
represent expert curated and literature retrieved interactions, respectively. Arrows indicate direct activation, diamonds modulation, and<br />
line/circle indicated inhibition.<br />
Figure 21: Additional information that can be browsed in the <strong>Genomatix</strong> Pathway System upon double click on the gene or connection of<br />
interest.<br />
© <strong>Genomatix</strong> 2012
Identification of common regulatory elements in promoters<br />
Transcription factors often act synergistically to achieve and coordinate cell type specific gene expression.<br />
These functional combinations are often conserved in terms of organization, distance, and orientation of the<br />
individual elements forming so-called modules or frameworks.<br />
The GePS network (Figure 20) shows that PPARgamma activates Lpl (lipoprotein lipase), Ucp2 (uncoupling<br />
protein 2) and Scd1 (stearoyl-CoA desaturase 1), all expressed in adipocytes. To investigate whether these<br />
three genes share regulatory elements their promoters were extracted and searched for common<br />
frameworks.<br />
Promoter sequence extraction<br />
The promoters for all alternative transcripts were extracted from the Eldorado database using<br />
‘Gene2Promoter’ under ‘Genomes & Data’ (Figure 22). Mus musculus was selected as organism and the<br />
three gene symbols were entered into the keyword search section.<br />
Figure 22: Gene2Promoter input page.<br />
The summary on top of the result page lists a total of 36 transcripts and 14 promoters for the three input<br />
genes which are shown in the table below (Figure 23)<br />
© <strong>Genomatix</strong> 2012
Figure 23: Interactive Gene2Promoter result page listing all alternative transcripts and promoters for selected genes. Additional<br />
information such as conservation and CAGE tag support are provided together with links for more comprehensive information and<br />
visualization.<br />
10 of the 36 promoters belong to relevant transcripts (2 for Lpl and Scd1, 6 for Ucp2). Only these were<br />
selected for further analysis with FrameWorker.<br />
Figure 24: Interactive Gene2Promoter result page: Promoters can be selected and tested for presence of transcription factor binding<br />
sites, corresponding sequences can be extracted and directly analyzed in serval subtasks.<br />
Identification of common regulatory elements<br />
The low number of sequences allowed an exhaustive analysis in FrameWorker, meaning that all promoter<br />
combinations for the three genes will be tested separately, resulting in 24 combinations. The analysis was<br />
run with default parameters except that the maximum distance variance was increased to 20. One of the 24<br />
combinations returned a framework consisting of three transcription factor binding sites: V$RXRF, V$KLFS<br />
© <strong>Genomatix</strong> 2012
and V$EGRF with distances of roughly 80 and 100 bp between the single sites (Figure 25). The model does<br />
not contain a PPARgamma site but members of the three families, while not directly linked to adipocytes, are<br />
associated with lipid homeostasis, glucose transport and response to glucose and insulin stimulus,<br />
respectively.<br />
The model was saved and subsequently used for a ModelInspector analysis.<br />
Identification of genes sharing the identified model and overlay with meta-data<br />
Figure 25:<br />
FrameWorker result: Transcription factor combination (framework)<br />
common to promoters from the three input genes (Lpl, Ucp2 and<br />
Scd1) consisting of three transcription factor binding site families<br />
with defined distance and orientation. The framework was saved<br />
and all mouse promoters were subsequently scanned for<br />
matches.<br />
ModelInspector is a program that performs a sequence scan for presence of predefined TF-combinations,<br />
called frameworks or modules. For this example, all mouse promoters of annotated genes were scanned for<br />
the presence of the V$RXRF-V$KLFS-V$EGRF-framework returning 271 matches in promoters of 199<br />
genes. The included GO-term analysis showed ‘metabolic process’ as top category with 115 associated<br />
genes and a very low p-value, indicating that the module can enrich for genes associated with metabolism.<br />
The 199 geneIDs were extracted and imported into GePS. Figure 26 shows the network which was<br />
generated by starting with PPARgamma and the option to extend networks by frequently cocited genes. The<br />
dots on both sites of the gene boxes are the visualization of the <strong>ChIP</strong>-<strong>Seq</strong> enrichment (in promoter regions)<br />
which have been imported as metadata. Absence of PolII clusters in promoters can indicate reduced gene<br />
transcription but can also indicate a very short initiation time, thus not leading to enrichments.<br />
Figure 26: Network generated from<br />
genes fulfilling two criteria: a) being<br />
identified in the ModelInspector run<br />
as harboring the V$RXRF-V$KLFS-<br />
V$EGRF framework in at least one<br />
promoter and b) being cocited with<br />
PPARgamma in PubMed abstracts.<br />
The dots besides gene boxes<br />
indicate the presence of<br />
PPARgamma, RXR or PolII clusters<br />
called in the data from Nielsen et al.<br />
(2008)<br />
© <strong>Genomatix</strong> 2012
Correlation between different data sets<br />
PPARgamma binds to peroxisome proliferator response elements as a heterodimer with retinoic X receptor<br />
(RXR) and RXR binding sites have been found to be overrepresented in the TF analysis (see above).<br />
Therefore, it would be interesting to analyze the overlap between PPARgamma and RXR binding sites. The<br />
RXR-<strong>ChIP</strong> data are derived from the same publication and have been processed similar to the PPARgamma<br />
set.<br />
Positional correlations between genomic elements and/or user data can be performed in the task<br />
‘GenomeInspector’ which can be accessed from ‘NGS Analysis’ in the navigation bar. Using the<br />
PPARgamma set as an anchor and calculating the distance distribution profile for the RXR data set results in<br />
the curve shown in Figure 27. Regions contributing to the correlation can be extracted from both sets and<br />
used for further analysis (e.g. annotation and pathway analysis or framework analysis).<br />
Figure 27: Positional correlation of PPARgamma enriched regions (aligned with their middle at 0) with the RXR enriched regions<br />
generated in GenomeInspector. The graph shows a clear overlap between the two data sets. Regions contributing to the correlation can<br />
be extracted.<br />
Data visualization<br />
In the genome browser the data can be visualized in the genomic context, overlayed with general annotation,<br />
proprietary data from <strong>Genomatix</strong> or other <strong>ChIP</strong>-<strong>Seq</strong> or RNA-<strong>Seq</strong> data sets. This allows an integration of<br />
different datasets and a quick assessment of the state at the locus of interest. Figure 27 shows the Scd1<br />
locus (located on the antisense strand) with PPARgamma, RXR and PolII raw reads and the positions of the<br />
called clusters. The graph shows only background for the PPARgamma data at day 0 but a strong<br />
enrichment at 5‘ promoter and several upstream and downstream regions, indicating potential enhancer<br />
regions. The RXR data show a similar picture. At day 0, PolII is found at the potential enhancer regions and<br />
the promoter. After adipocyte differentiation at day 6, PolII is no longer enriched at the promoter and<br />
enhancers but spreads over the whole gene body - reflecting the PPARgamma expression.<br />
© <strong>Genomatix</strong> 2012
Figure 28: Visualization of the Scd1 locus in the genome browser. Alternative transcripts are shown in black. Single reads are shown for<br />
day 0 and day 6 for PPARgamma (blue), RXR (read) and PolII (green). For day 6 these are overlayed with the called clusters in the<br />
same but lighter color.<br />
Summary<br />
Based on the data published by Nielsen et al. (2008) we showed comprehensive <strong>ChIP</strong>-<strong>Seq</strong> analysis pipeline<br />
from mapping down to pathway analysis.<br />
The raw reads were mapped to the mouse genome and unique alignments were clustered to identify regions<br />
of enriched read density indicating PPARgamma, RXR or PolII binding, respectively. The 7,747 regions<br />
identified in the PPARgamma data set showed a strong overrepresentation of in silico predicted<br />
PPARgamma binding sites indicating the successful <strong>ChIP</strong> experiment. Further analysis showed frequent cooccurrence<br />
of V$NF1F binding sites in about 15 bp distance and CEBP binding sites. The latter being in<br />
agreement with the publication. De novo motif definition extracted the “N NGGNCA G AGGNN“ consensus<br />
sequence, which resembles parts of the DR1 element, the known PPARgamma/RXR heterodimer binding<br />
site.<br />
To identify potential PPARgamma targets, genes up- and downstream of the enriched regions were<br />
determined. Genes with PPARgamma binding within their promoter were extracted and analyzed with the<br />
<strong>Genomatix</strong> Pathway System. Overrepresented pathways, GO- and MeSH-terms indicated PPAR pathways<br />
and general metabolic processes. The TF most frequent cocited with these genes is PPARgamma, again<br />
confirming the experiment. In the network generated from the top scoring pathway ‘Peroxisome proliferative<br />
activator …’. expert curated annotation shows direct activation of the three genes (Lpl, Scd1, Ucp2) by<br />
PPARgamma. The 10 relevant promoters from the three genes were exhaustively analyzed for common<br />
regulatory motifs. A V$RXRF-V$KLFS-V$EGRF was detected and used to scan all mouse promoters. This<br />
scan yielded 271 matches in promoters of 199 genes. GO-term analysis for these genes revealed an<br />
association with ‘metabolic processes’. Furthermore, the overlap between the PPARgamma and RXR<br />
enrichment was determined. And finally, the data sets were visualized in the genomic context.<br />
© <strong>Genomatix</strong> 2012
For more information on <strong>Genomatix</strong> solutions and services, please visit:<br />
http://www.genomatix.com<br />
Visit<br />
http://www.youtube.com/user/<strong>Genomatix</strong>Webcasts<br />
for tutorials and demo videos.<br />
Find us on facebook at:<br />
http://www.facebook.com/genomatix<br />
http://www.genomatix.com<br />
Contact Germany<br />
<strong>Genomatix</strong> Software GmbH<br />
Bayerstr. 85a<br />
80335 Munich<br />
Germany<br />
phone +49 89 599766 0<br />
email info@genomatix.de<br />
Contact USA<br />
<strong>Genomatix</strong> Software Inc.<br />
3025 Boardwalk, Suite 160<br />
Ann Arbor, MI 48108<br />
USA<br />
phone +1 877 436 6628<br />
email sales-us@genomatix.com<br />
© <strong>Genomatix</strong> 2012