Where are Europe's Assets? - geomer GmbH
Where are Europe's Assets? - geomer GmbH
Where are Europe's Assets? - geomer GmbH

Create successful ePaper yourself
Turn your PDF publications into a flip-book with our unique Google optimized e-Paper software.
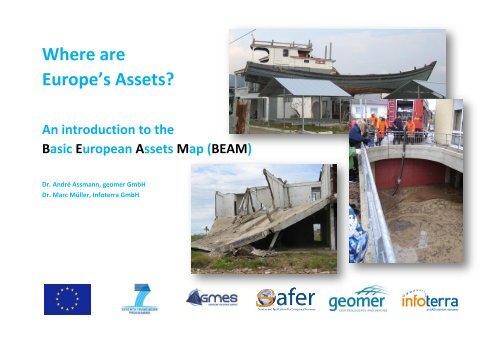
<strong>Where</strong> <strong>are</strong><br />
Europe’s <strong>Assets</strong>?<br />
An introduction to the<br />
Basic European <strong>Assets</strong> Map (BEAM)<br />
Dr. André Assmann, <strong>geomer</strong> <strong>GmbH</strong><br />
Dr. Marc Müller, Infoterra <strong>GmbH</strong>
Section 1: Introduction<br />
Service Offer<br />
BEAM (Basic European <strong>Assets</strong> Map) has been developed to estimate,<br />
evaluate and comp<strong>are</strong> real and potential damages caused by natural<br />
disasters all across Europe, focussing both on European and national<br />
studies, which results in a significant advantage in cross border <strong>are</strong>as.<br />
Furthermore, the service concept is designed in a way that it can easily be<br />
refined to more detailed land use and statistical data.<br />
BEAM displays assets in monetary values per <strong>are</strong>a unit (€/m²). The<br />
complete asset information is composed of different layers, as within a<br />
damage assessment calculation each type of asset needs to be calculated<br />
applying a different damage function.<br />
The information provided is completed by an additional layer showing the<br />
population density.<br />
Benefits<br />
BEAM is designed to perform cross border studies and to comp<strong>are</strong> potential<br />
damages throughout Europe using a reliable and uniform data base. An<br />
additional advantage is the fact that the underlying methodology is scalable<br />
and can be adapted to more detailed land use and statistical data if<br />
required. Furthermore, as BEAM is coupled to the CORINE data set, it can<br />
be used for multi temporal analysis.<br />
As the concept strictly separates assets from damages, it can easily be<br />
applied to all types of risk and is thus an ideal basis for multi-risk-analysis.<br />
How to apply BEAM<br />
Damage assessment can be conducted in two different ways: either by<br />
applying damage functions that provide a direct output of losses in<br />
monetary value, or by following a two step approach which first calculates<br />
the assets and then applies damage functions that calculate the losses in a<br />
percentage.<br />
BEAM resorts to the second approach. Thus, the underlying asset layers can<br />
be used for various types of hazards (e.g. in a multi risk analysis) and the<br />
damage functions can be applied in different regions. For example, the<br />
damage function for an average car can be the same in different countries<br />
or regions, although the age and value of an average car will probably<br />
differ.<br />
The damage functions applied <strong>are</strong> not part of BEAM itself, but can be<br />
supplied by the user or upon demand created for various types of hazard<br />
(e.g. floods, earthquakes).<br />
BEAM<br />
Asset layer 4<br />
Asset layer 3<br />
Asset layer 2<br />
Asset layer 1<br />
Damage map<br />
Set x<br />
Hazard map<br />
x<br />
Dam. function 4<br />
Dam. function 3<br />
Dam. function 2<br />
Damage function<br />
1<br />
or<br />
or<br />
Set y<br />
Hazard map<br />
y<br />
Dam. function 4<br />
Dam. function 3<br />
Dam. function 2<br />
Damage function<br />
1<br />
Set z<br />
Hazard map<br />
z<br />
Dam. function 4<br />
Dam. function 3<br />
Dam. function 2<br />
Damage function<br />
1<br />
3
Area Covered<br />
BEAM has been designed to be used all over Europe. As it is based mainly<br />
on CORINE (land cover) and EUROSTAT (statistics) data it can be applied<br />
wherever these or similar data sets <strong>are</strong> accessible. Outside these <strong>are</strong>as the<br />
applicability can be checked upon request.<br />
Fully processed products - ready for delivery - <strong>are</strong> available for 12 European<br />
countries; further production is done on demand.<br />
Update Frequency<br />
A complete update of the maps is scheduled together with each upcoming<br />
CORINE release and will carry the same release number as the CLC-version.<br />
On demand, additional updates can be performed on a yearly basis, with<br />
regard to the statistical data and/or the update of the complementary land<br />
use data sources.<br />
History of BEAM<br />
Like many products BEAM did not start from zero. Some European studies<br />
on flood risk assessment as well as very detailed local studies have been<br />
used to develop background knowledge for the BEAM product.<br />
In particular, experiences from creating risk maps for the rivers Rhine, Elbe<br />
and Odra <strong>are</strong> referred to. Further developments (e.g. Weser) have been<br />
performed within the projects PREVIEW (FP6), RISK-EOS (GSE) and finally<br />
SAFER (FP7), all funded by the European Union and ESA, respectively.<br />
Further <strong>Assets</strong> Map Products (AM+ / HiRAM)<br />
BEAM is one component of a complete product line which is currently<br />
under development. Depending on the user requirements, the level of<br />
detail can be enhanced (HiRAM) or additional data sets can be used to<br />
optimize the final product (AM+). Further, a layer displaying critical<br />
infrastructure may be added.<br />
4
Section 2: Technical Specifications<br />
Projection and coordinate system: Lambert Azimuthal Equal Area, ETRS<br />
1989 LAEA, others and on request.<br />
BEAM consists of the following set of asset layers:<br />
Population density<br />
Private housing: buildings and equipment (urban immobile)<br />
Household goods (urban mobile)<br />
Vehicles<br />
Industry: buildings and equipment (net asset value, immobile)<br />
Industry: stock in trade (mobile)<br />
Service and trade: buildings and equipment (net asset value, immobile)<br />
Service and trade: stock in trade (mobile)<br />
Agriculture: buildings and equipment (net asset value, immobile)<br />
Agriculture: stock in trade without livestock, mobile)<br />
Agriculture: livestock<br />
Additionally, BEAM contains one combined layer that covers asset values<br />
for:<br />
Arable land<br />
Grassland<br />
Forest<br />
Road network<br />
Green urban <strong>are</strong>as and sport <strong>are</strong>as<br />
This aggregated layer can easily be related to single land use classes as this<br />
information is contained in another column of the data file.<br />
5
Pricing<br />
The prices for the production of a country-wide BEAM data set <strong>are</strong> available<br />
on request and depend on <strong>are</strong>a size and data availability. Countries outside<br />
EUROSTAT/OECD data coverage can be processed at additional costs for<br />
data procurement.<br />
Delivery<br />
Data can be delivered either as Shape-File, Geodatabase or ESRI-Grid. The<br />
data may be provided via internet or DVD. A web-based download system is<br />
envisaged for the future.<br />
For further Information and Data Requests, please contact:<br />
<strong>geomer</strong> <strong>GmbH</strong>, Dr. André Assmann<br />
69126 Heidelberg, Im Breitspiel 11B, Germany<br />
Phone: +49 6221 89458 41<br />
E-Mail: aassm@<strong>geomer</strong>.de<br />
or<br />
Infoterra <strong>GmbH</strong>, Dr. Marc Müller<br />
88090 Immenstaad, Claude-Dornier-Strasse, Germany<br />
Phone: +49 7545 8 8439<br />
E-Mail: marc.mueller@infoterra-global.com<br />
© <strong>geomer</strong> <strong>GmbH</strong> & Infoterra <strong>GmbH</strong>, 2012<br />
6
Section 3: Concept of BEAM<br />
General Remarks<br />
BEAM is composed of two major<br />
components: The asset volume taken from<br />
the statistics and the land use data needed<br />
to disaggregate these values. In some cases<br />
addition statistical data <strong>are</strong> needed to<br />
perform intermediate steps. Details of this<br />
process <strong>are</strong> described below for each layer.<br />
CORINE 2006<br />
NAVTEQ data<br />
Enhanced land<br />
cover<br />
Central data base<br />
and GIS<br />
<strong>Assets</strong> maps with<br />
layer separation<br />
Statistics<br />
Market prices at<br />
national level<br />
Damage functions<br />
Damage<br />
calculation<br />
Hazard maps<br />
Damage<br />
assessment maps<br />
Data used for BEAM<br />
The basis for the background land use information is the CORINE land cover<br />
information. This is subsequently enhanced by additional data sources<br />
(NAVTEQ). These enhancements relate mainly to the introduction of small<br />
settlement <strong>are</strong>as as well as the traffic infrastructure (roads, railways, etc.).<br />
In order to cover social-economic data needs, data from the EUROSTAT<br />
data base <strong>are</strong> processed and analysed. Additional values <strong>are</strong> being gathered<br />
from the national statistical institutes as well as from other sources.<br />
Production Background<br />
Data processing and analysis <strong>are</strong> carried out based on a geo-enabled<br />
relational database system, compatible to OGC standards. The data is also<br />
ready-to-use for INSPIRE-related activities and projects.<br />
The set of baseline data follows the same standards for each country<br />
covered in the BEAM database system. Data for additional countries can<br />
7
easily be created by processing the spatial land use data model and by<br />
entering the basic statistical figures.<br />
Assumptions and Definitions<br />
Due to the complexity of the topic and the <strong>are</strong>a covered, it is not feasible to<br />
integrate all types of assets. As the product is related to risk assessment in<br />
the context of natural hazards, the following assumptions were made:<br />
Only direct assets (tangible) <strong>are</strong> taken into account (see diagram below).<br />
The product is based on the so-called net concept, which reflects the<br />
current market value of an asset (not restoration costs or insured<br />
assets).<br />
No costs for the building ground <strong>are</strong> included as it is assumed that the<br />
value assigned to it will not change in the case of an event.<br />
No external planning costs <strong>are</strong> included (i.e. building permits) as they<br />
will not apply for a simple restoration after an event.<br />
No costs due to production downtimes <strong>are</strong> taken into account.<br />
Monetary asset<br />
(net)<br />
Productive<br />
property<br />
Reproducible<br />
tangible assets<br />
Fixed assets Stock<br />
Asset total<br />
Tangible asset<br />
Property for<br />
normal use<br />
Buildings Equipment<br />
Non reprod.<br />
tangible assets<br />
Human capital<br />
Non tangible<br />
asset<br />
Privat use Public use<br />
Source: M. Frenkel & K.D. John, 1999 (modified)<br />
Economically<br />
exploitable rights<br />
Additional assumptions concerning model-specific values <strong>are</strong> made to feed<br />
the different calculation models.<br />
Population Density<br />
In case of a hazardous event, the estimation of figures for the potentially<br />
affected population is of highest priority. Thanks to good data availability,<br />
the statistical base figures need to be allocated according to land use only,<br />
under consideration of different density classes.<br />
Population per<br />
NUTS region<br />
Land use: urban<br />
Population<br />
density per<br />
NUTS region<br />
Population<br />
density: urban<br />
NUTS<br />
boundary<br />
x% y%<br />
Population<br />
density:<br />
suburban<br />
Land use:<br />
suburban<br />
<br />
8
Private Housing<br />
Private housing accounts for the largest portion of the total asset. The<br />
processing details <strong>are</strong> schematically displayed in the diagram below. The<br />
parameters <strong>are</strong> chosen mainly due to their general availability across<br />
Europe. Tests performed comparing the output to results from the more<br />
detailed input data (i.e. living <strong>are</strong>a per NUTS region) showed only<br />
neglectable deviations.<br />
Average living<br />
<strong>are</strong>a per flat<br />
Average <strong>are</strong>a<br />
per flat<br />
Building asset<br />
per NUTS<br />
region<br />
Construction<br />
costs per m²<br />
Number of flats<br />
per region<br />
Asset per <strong>are</strong>a<br />
for urban units<br />
(€/m²)<br />
Degression rate<br />
Land use: (sub-)<br />
urban fabric<br />
NUTS<br />
boundary<br />
<br />
The approach considers only construction costs, additional values based on<br />
special locations (e.g. city centre) <strong>are</strong> not taken into account, as these will<br />
endure natural disasters. Further, the added value of a building, which<br />
could be considered an asset of building ground, has been excluded in this<br />
approach.<br />
Household<br />
Household assets <strong>are</strong> very difficult to capture as there is only little<br />
information available. The values that can be found for some countries, e.g.<br />
from the insurance sector, need to be transferred to other countries where<br />
such information is not available. Price index relation and the average<br />
expenditure on household goods <strong>are</strong> used for that purpose. The allocation<br />
is done by using the available information on the total living <strong>are</strong>a under the<br />
assumption that the size of dwellings relates directly to the value of<br />
household assets - an assumption also made by the insurance industry.<br />
Average value<br />
of household<br />
per m²<br />
Average value<br />
of household<br />
per country<br />
Household<br />
asset per<br />
NUTS region<br />
Price relation<br />
in Europe<br />
Total living <strong>are</strong>a<br />
Asset per<br />
urban unit<br />
Expenditure on<br />
household per<br />
year<br />
Degression rate<br />
Land use:<br />
(sub)urban fabric<br />
NUTS<br />
boundary<br />
9
Vehicles<br />
The vehicle assets layer covers cars and motorbikes. Other vehicles <strong>are</strong><br />
mostly covered within the net asset value of the applicable economic<br />
sector. In this field of analysis, the availability of data in the official statistics<br />
data is very poor. Therefore, the data (especially prices and information for<br />
the value decrease curve) were compiled from various other sources.<br />
Further details can be taken from the diagram.<br />
Average price<br />
of new cars<br />
Average price<br />
per country<br />
Number of<br />
vehicles<br />
Class<br />
composition<br />
Price relation<br />
in Europe<br />
Value decrease<br />
curve<br />
Asset per<br />
vehicle<br />
Asset per<br />
urban unit<br />
Info on value<br />
decrease<br />
NUTS<br />
boundary<br />
Initial registration<br />
Agecomposition<br />
of<br />
vehicles<br />
Land use: urban<br />
fabric<br />
Industry:<br />
Buildings and Equipment (net asset value, immobile)<br />
For the buildings and equipment the total net asset value is provided by the<br />
national statistics accounts, generally only on national level. This value is<br />
distributed to the desired NUTS level by using the number of employees as<br />
an indicator and, in a further step, by the land use. Not only the designated<br />
industrial <strong>are</strong>as <strong>are</strong> considered but, to a minor extent, the settlement <strong>are</strong>a<br />
as well, as some of the industry is located there.<br />
Total net assets<br />
Tangible fixed<br />
assets per<br />
employee<br />
Total assets<br />
per NUTS<br />
region<br />
Employees in<br />
industry<br />
Rate of stock<br />
volume<br />
Asset per<br />
urban unit<br />
(€/m²)<br />
Industry: Stock in Trade (mobile)<br />
NUTS<br />
boundary<br />
Land use:<br />
industry<br />
A<br />
As the stock in trade is not longer covered directly by the official statistics<br />
(as it was the case at least in some countries in the past), it has to be<br />
derived and updated from the latest available figures and is now calculated<br />
as a percentage of the net asset value.<br />
10
Service and Trade: Buildings and Equipment (net asset<br />
value, immobile)<br />
The methodology is analogue to that applied for the industrial assets, i.e.<br />
the totals for each country <strong>are</strong> collected from the statistics and <strong>are</strong> then<br />
spatially disaggregated based on the land use information.<br />
Service and Trade: Stock in Trade (mobile)<br />
Again, due to the non-availability of direct data, the stock volume has to be<br />
estimated based on the net asset value. As the overall service sector has<br />
only a very little stock volume but the subsection of the trade-sector a quite<br />
large one, the relation of trade to the other services needs to be taken into<br />
account for the stock estimation. This relation ranges from about 3 to 10%.<br />
Agriculture: Buildings and Equipment (net asset value,<br />
immobile)<br />
In the agricultural sector, the asset disaggregation is performed using the<br />
employees’ figures in this sector. The scheme is again identical to the one<br />
used for the industry and service sector assets.<br />
Agriculture: Stock in Trade without Livestock (mobile)<br />
The agricultural stock in trade can be divided into livestock and further<br />
stock. As the livestock covers the lion's sh<strong>are</strong> of the mobile assets and has<br />
to be allocated to different land use classes, it needs to be separated from<br />
the other stock assets.<br />
Agriculture: Livestock<br />
Thanks to very detailed agricultural statistics, the livestock distribution is<br />
well documented. Based on national market prices, which differ quite a lot<br />
between the countries, the number of livestock can be converted into a<br />
monetary asset value. The disaggregation process considers the relation<br />
between indoor breeding and grazing by assigning a part of the asset to<br />
rural settlement <strong>are</strong>as and another part to grassland.<br />
Numbers of<br />
livestock<br />
Land use:<br />
suburban fabric<br />
Constant <strong>Assets</strong><br />
NUTS boundary<br />
x%<br />
Livestock per<br />
NUTS<br />
Types of land use where the corresponding assets <strong>are</strong> not (or only partially)<br />
covered by the statistical figures <strong>are</strong> estimated by average construction or<br />
maintenance costs. For each land use class an appropriate value in €/m² has<br />
been derived from different publications and previous studies. External<br />
costs such as planning costs, ecological compensation costs, construction<br />
permit etc. <strong>are</strong> not included.<br />
All constant values <strong>are</strong><br />
combined in one column of<br />
the value table, if needed<br />
they can be reallocated by<br />
the underlying land use<br />
class.<br />
Asset<br />
Asset per<br />
Livestock<br />
livestock unit<br />
Asset class:<br />
livestock. suburban<br />
Asset class:<br />
livestock pasture<br />
Construction<br />
cost per m²<br />
Meat price<br />
per kg<br />
Conversion<br />
factors: unit to kg<br />
Horses: market<br />
price per unit<br />
y%<br />
Degression rate<br />
Asset per <strong>are</strong>a<br />
Land use:<br />
pasture<br />
Land use: roads<br />
11
For further Information and Data Requests, please contact:<br />
<strong>geomer</strong> <strong>GmbH</strong>, Dr. André Assmann<br />
69126 Heidelberg, Im Breitspiel 11B, Germany<br />
Phone: +49 6221 89458 41<br />
E-Mail: aassm@<strong>geomer</strong>.de<br />
or<br />
Infoterra <strong>GmbH</strong>, Dr. Marc Müller<br />
88090 Immenstaad, Claude-Dornier-Strasse, Germany<br />
Phone: +49 7545 8 8439<br />
E-Mail: marc.mueller@infoterra-global.com<br />
© <strong>geomer</strong> <strong>GmbH</strong> & Infoterra <strong>GmbH</strong>, 2012<br />
12