Shipping Statistics and Market Review - Institut für ...
Shipping Statistics and Market Review - Institut für ...
Shipping Statistics and Market Review - Institut für ...

Create successful ePaper yourself
Turn your PDF publications into a flip-book with our unique Google optimized e-Paper software.
<strong>Shipping</strong> <strong>Statistics</strong><br />
<strong>and</strong> <strong>Market</strong> <strong>Review</strong><br />
FOCUS 2004<br />
World merchant<br />
fleet<br />
Tanker fleet<br />
World merchant fleet<br />
by ownership patterns<br />
Bulk fleet<br />
General cargo <strong>and</strong><br />
container shipping<br />
Cruise fleet<br />
World shipbuilding<br />
Maritime casualties<br />
World port development<br />
Major shipping countries <strong>and</strong><br />
seaborne market developments<br />
Coverage<br />
<strong>Institut</strong>e of <strong>Shipping</strong> Economics <strong>and</strong> Logistics<br />
48<br />
6<br />
th year of<br />
publication<br />
<strong>Market</strong> Analysis<br />
<strong>Market</strong> <strong>Review</strong><br />
Statistical Topics
ISL <strong>Shipping</strong> <strong>Statistics</strong> <strong>and</strong> <strong>Market</strong> <strong>Review</strong> ( SSMR )<br />
Volume 48 (2004)<br />
published 9 times per year<br />
(double issues Jan./Feb., Aug./Sep. <strong>and</strong> Oct/Nov.)<br />
ISSN 0947 - 0220<br />
Copyright - <strong>Institut</strong>e of <strong>Shipping</strong> Economics<br />
<strong>and</strong> Logistics (ISL), Bremen<br />
All rights reserved. No part of this publication may be reproduced, stored in a<br />
retrieval system, or transmitted, in any form or by any means, electronic,<br />
photocopying, recording or otherwise, without prior permission of the editors.<br />
ISL does not guarantee the accuracy of the information<br />
contained in "ISL <strong>Shipping</strong> <strong>Statistics</strong> <strong>and</strong> <strong>Market</strong> <strong>Review</strong> (SSMR) " nor does<br />
it accept responsibility for errors or omissions or their consequences.<br />
Editors:<br />
Prof. Dr. Manfred Zachcial<br />
Christel Heideloff<br />
Editorial Assistant:<br />
Dieter Stockmann<br />
Research Staff:<br />
Fleet Data Base: Reinhard Monden<br />
Port Data Base: Christel Heideloff, Dieter Stockmann<br />
Published <strong>and</strong> distributed by ISL<br />
Universitätsallee GW1, Block A<br />
28359 Bremen, Fed. Rep. of Germany<br />
Printed by Druckservice Wümme<br />
Subscription department:<br />
Phone: + 49-421 22096-38<br />
Fax: + 49-421 22096-55<br />
E-Mail: subscription@isl.org<br />
Internet: http://www.isl.org<br />
ISL Publications <strong>and</strong> Databases<br />
We publish analyses <strong>and</strong> information<br />
services <strong>and</strong> have factual databases at our<br />
disposal for statistical market research.<br />
Publications <strong>and</strong> Information Services<br />
Publication series with emphasis on current topics<br />
Statistical market data for the maritime economy<br />
Forecast <strong>Review</strong> of important statements on future development of<br />
shipping markets, shipbuilding, ports, economy <strong>and</strong> trade<br />
Orders: E-Mail: subscription@isl.org<br />
Databases<br />
Numerous data bases used for market analyses, statistical publications,<br />
information services <strong>and</strong> customers’ enquiries, World trade, World<br />
merchant fleet, Cruise fleet, Port Data Base<br />
ISL contacts:<br />
marsearch@isl.org<br />
if you need analytical support from our research staff<br />
portbase@isl.org<br />
is<br />
your contact for all information concerning ports <strong>and</strong> port statistics<br />
subscription@isl.org<br />
is<br />
your direct contact for orders, price requests, changes of addresses<br />
etc.<br />
Mrs. Heideloff (Editor) Phone: + 49-421 22096-32<br />
Subscription:<br />
SSMR rates 2004<br />
E-Mail: heideloff@isl.org<br />
Printed Version Printed Version plus additional CD-ROM<br />
per issue<br />
€ 330.- € 420.-<br />
Single issue Single issue plus additional CD-ROM<br />
€ 54.- € 64.-<br />
Including postage <strong>and</strong> packing<br />
Germany*<br />
€ 372.25<br />
Rest of World<br />
surface Mail<br />
€ 468.55<br />
€ 358.12<br />
Air mail<br />
€ 448.12<br />
€ 452.71 € 542.71<br />
SSMR <strong>and</strong> <strong>Shipping</strong> <strong>Statistics</strong> Yearbook 2003 as package<br />
(including postage <strong>and</strong> packing)<br />
Printed Version<br />
Germany*<br />
Printed Version plus additional<br />
(Yearbook) CD-ROM<br />
€ 555.29<br />
Rest of World<br />
surface Mail<br />
€ 599.16<br />
€ 530.72<br />
Air mail<br />
€ 571.72<br />
€ 641.16 € 682.16<br />
* incl. VAT (MwSt.)<br />
Cancellation 3 months before end of calendar year<br />
ISL Information Centre / Library<br />
We advise <strong>and</strong> inform fast,<br />
comprehensively <strong>and</strong> professionally<br />
about markets, industries <strong>and</strong> business.<br />
The ISL library is one of the largest special libraries in the sectors of<br />
shipping economics <strong>and</strong> logistics worldwide. As a central information<br />
spot, it has international literature <strong>and</strong> economic data at its disposal.<br />
Subjects<br />
<br />
<br />
<br />
<br />
<br />
<strong>Shipping</strong> <strong>and</strong> Ports<br />
Shipbuilding <strong>and</strong> Supply Industry<br />
Economy <strong>and</strong> Commerce<br />
Transport, Logistics<br />
Information <strong>and</strong> Communication Systems within Logistics<br />
Services<br />
<br />
<br />
<br />
<br />
Brief information<br />
Investigations about literature <strong>and</strong> facts<br />
Special customer profiles<br />
Provision of photocopies<br />
Enquiries<br />
Enquiries by Phone +49 421-22 096-44/46<br />
Hours of Business Mo Th 9:00 - 16:30 CET<br />
Fr 9:00 - 14:30 CET
<strong>Shipping</strong> <strong>Statistics</strong><br />
<strong>and</strong> <strong>Market</strong> <strong>Review</strong> ( SSMR)<br />
FOCUS<br />
GENERAL CARGO AND<br />
CONTAINER SHIPPING<br />
Coverage<br />
<strong>Market</strong> Analysis<br />
ISL Seabase<br />
<strong>Market</strong> <strong>Review</strong><br />
Statistical Topics<br />
<strong>Institut</strong>e of <strong>Shipping</strong> Economics <strong>and</strong> Logistics<br />
No 6<br />
June 2004
Statistical topics in detail ISL<br />
I THE SHIPPING MARKET<br />
1.1 TONNAGE LAID-UP 29 - 31<br />
8 By Month 2003 <strong>and</strong> 2004 8 By Country Groups of Registration <strong>and</strong> Ship Type<br />
8 By Year of Build <strong>and</strong> Ship Type<br />
8 By Major Flags <strong>and</strong> Ship Type<br />
8 Reported Monthly Tonnage Reduction <strong>and</strong> Addition by Ship Type<br />
1.2 TONNAGE BROKEN-UP 32 - 33<br />
8 By Month 2003 <strong>and</strong> 2004 8 By Major Flags <strong>and</strong> Ship Type<br />
8 By Year of Build <strong>and</strong> Ship Type 8 By Country Groups of Registration <strong>and</strong> Ship Type<br />
1.3 SPECIAL FLEETS - GENERAL CARGO AND CONTAINER SHIPS 34 - 50<br />
8 Total General Cargo Fleet 8 By Size Class <strong>and</strong> Division of Age<br />
8 Fleet Development by Ship Type 8 General Cargo Reefer Ships<br />
8 Total General Cargo Fleet by Ship Type <strong>and</strong> Registered Flags According 8 By Major Flags<br />
to Regions<br />
8 By Size Class <strong>and</strong> Division of Age<br />
8 Total General Cargo Fleet by Ship Type <strong>and</strong> Countries of Domicile 8 Ro-Ro Cargo Fleet<br />
According to Regions<br />
8 By Major Flags<br />
8 Total General Cargo Fleet by Ship Type <strong>and</strong> Top Ten Countries of Domicile 8 By Size Class <strong>and</strong> Division of Age<br />
8 Total General Cargo Fleet by Registered Flags According to Country 8 Fully Cellular Container Fleet<br />
Groups <strong>and</strong> Division of Age<br />
8 Fleet Development<br />
8 Total General Cargo Fleet by Countries of Domicile According to Country 8 By Size Class <strong>and</strong> Division of Age<br />
Groups <strong>and</strong> Division of Age<br />
8 By Registered Flags <strong>and</strong> Countries of Domicile According to<br />
8 General Cargo Single-Deck Fleet<br />
Country Groups<br />
8 By Major Flags 8 By Registered Flags <strong>and</strong> Countries of Domicile According to Regions<br />
8 By Size Class <strong>and</strong> Division of Age 8 By Major Flags<br />
8 General Cargo Multi-Deck Fleet 8 By Size Class <strong>and</strong> Division of TEU-Capacity<br />
8 By Major Flags 8 By Country Groups <strong>and</strong> Division of TEU-Capacity<br />
8 By Size Class <strong>and</strong> Division of Age 8 Top 15 Container Operators<br />
8 Fleet of Special General Cargo Ships<br />
8 By Major Flags<br />
8 The Global Players<br />
2 FREIGHT MARKET 51 - 57<br />
8 Hamburg Index of Container Ship Charter Rates 8 Lloyd's <strong>Shipping</strong> Economist Tramp Trip Charter Indices<br />
8 German Sea Freight Indices 8 Maritime Research Freight Indices<br />
II SHIPBUILDING<br />
1 WORLD SHIPBUILDING 58-59<br />
8 Number of Contracts by Ship Type March 2003 - Junel 2004<br />
8 Existing Container Fleet by Yard of Build According to Year of Build <strong>and</strong> TEU Size Class<br />
2 SHIP TYPE SURVEY 60 - 63<br />
8 General Cargo Ships on Order 8 Fully Cellular Container Ships on Order<br />
III PORTS AND SEA CANALS<br />
1 PORT SURVEYS 64 - 71<br />
8 World Container Port Traffic by Country 8 Regional Spreading of Container Traffic of Selected Ports<br />
8 Total Container Traffic of Selected Ports by Region 8 Container Services on Major Trade Routes <strong>and</strong> Service Frequency<br />
2 SEA CANALS 72 - 74<br />
8 Monthly <strong>Shipping</strong> <strong>and</strong> Goods Traffic Overview 8 Kiel Canal<br />
DEFINITIONS OF STATISTICAL CONTENT 75<br />
FIGURES<br />
Page Page<br />
I- 1 General Cargo Ships - Fleet Development 38 III- 1 Container Traffic at Major American Ports by Region 66<br />
I- 2 General Cargo Fleet - Annual Tonnage Changes 38 III- 2 Container Traffic at Major Asian Ports by Region 67<br />
I- 3 General Cargo Fleet - Age Structure by Year of Build 38 III- 3 Container Traffic at Major European Ports by Region 68<br />
I- 4 Container Ships - Age Structure by Size Class 47 III- 4 Regional Spreading of Major American Ports by Region 69<br />
I- 5 Container Ships - by Registered Flags <strong>and</strong> Countries of Domicile<br />
According to Regions<br />
II- 1 Container <strong>and</strong> General Cargo Fleet - Orderbook as of<br />
January 1st, 1994 - 2003<br />
2 SSMR June 2004<br />
Page<br />
47 III- 5 Regional Spreading of Major Asian Ports by Region 70<br />
47 III- 6 Regional Spreading of Major European Ports by Region 71<br />
59 III- 7 Kiel Canal - Transit <strong>and</strong> Sectional Goods Traffic 1993 - 2003 73
ISL <strong>Market</strong> Analysis 2004<br />
CONTAINER AND GENERAL CARGO FLEET DEVELOPMENT, SUPPLY/DEMAND PATTERNS AND<br />
WORLD CONTAINER PORT DEVELOPMENT<br />
As of January 1 st , 2004, the fully cellular container fleet<br />
stood at 3,036 ships with 90.2 mill dwt equal to 6.4<br />
mill TEU total <strong>and</strong> the general cargo fleet comprised<br />
16,487 ships with 95.2 mill dwt equal to 1.9 mill TEU.<br />
Together these fleet segments had, in terms of dwt<br />
tonnage, a share of 22.1 per cent of the total world<br />
merchant fleet (ships of 300 gt <strong>and</strong> over). The world<br />
merchant fleet had a total capacity of 8.6 mill TEU,<br />
whereby at the beginning of 2004, 74.7 per cent of this<br />
capacity was attributable to the fully cellular container<br />
THE WORLD CONTAINER FLEET<br />
Tonnage supply 2004<br />
In the period of 2000-2004, the TEU-capacity of the<br />
world container fleet grew per year on average by<br />
10.6 per cent, whereas the number of the container<br />
vessels rose by 5.6 per cent <strong>and</strong> the deadweight<br />
tonnage by 9.3 per cent.<br />
During the year 2003, the fully cellular container fleet<br />
grew by “just” 8.6 per cent (based on TEU). Compared<br />
with 1994, the fully cellular container fleet has more<br />
than doubled its TEU capacity (+ 215 %), whereby the<br />
disproportionate increase of the TEU capacity indicates<br />
the trend towards larger container ships.<br />
Fig. 1: Container fleet development as of January 1st ,<br />
1986 – 2004 (Index 1986 = 100)<br />
ISL 2004<br />
pages<br />
43-48<br />
In the period of 1999-2003, 850 container ships with<br />
32.4 mill dwt <strong>and</strong> 2.5 mill TEU were added to the<br />
trading fleet. In the same period only 176 container<br />
ships with 3.5 mill dwt were reported as broken-up.<br />
The average ship size continued to increase during<br />
2003 <strong>and</strong> stood at 2,126 TEU at the beginning of<br />
2004 compared to 1,782 TEU in 2000 <strong>and</strong> 1,503<br />
fleet compared with TEU/shares of 48.8 per cent in<br />
1989 <strong>and</strong> 67.6 per cent in 2000.<br />
Besides supply <strong>and</strong> dem<strong>and</strong> patterns the ISL market<br />
analysis presents assumptions on future containerised<br />
trade developments <strong>and</strong> includes information on<br />
container traffic for the leading world ports. Included in<br />
the SSMR issue is an extract of a new information<br />
service - the “ISL Monthly Container Port Monitor”<br />
(compare pages in the middle of this issue).<br />
TEU in 1995. The post-Panamax fleet accounts for<br />
286 vessels with a share of 25 per cent of the total<br />
TEU capacity.<br />
During 2003, 172 container ships were added to the<br />
fleet with a capacity of 7.2 mill dwt <strong>and</strong> 0.57 mill TEU<br />
respectively. Compared with previous years these new<br />
entries had an extremely high average capacity,<br />
namely 3,320 TEU. 26 fully cellular ships were in sizes<br />
of 6,000 TEU <strong>and</strong> above (compared with 25 ships<br />
during 2002 <strong>and</strong> 9 ships during 2000).<br />
Fig. 2: Container fleet additions <strong>and</strong> reductions<br />
during 1993 – 2003 (in mill dwt) 1<br />
ISL 2004<br />
Ships added to the world container fleet during 2003<br />
represent 5.7 per cent of all fully cellular container<br />
ships, 7.9 per cent of the deadweight tonnage <strong>and</strong> 8.8<br />
per cent of the TEU-capacity of the active container<br />
fleet at the beginning of 2004.<br />
1 Additions - newbuildings entering the fleet refer to the fleet data of<br />
the following year. Reductions - broken-up tonnage refers to the<br />
fleet data of the respective year<br />
SSMR June 2004 3
Container <strong>and</strong> general cargo fleet, supply/dem<strong>and</strong>, ports<br />
Tab. 1: Key figures on world fully cellular container fleet 2004/2003<br />
Size class No of 1,000 1,000<br />
dwt-%<br />
change over<br />
No of 1,000 1,000<br />
dwt-%<br />
change over<br />
(TEU) ships TEU dwt prev period ships TEU dwt prev period<br />
TOTAL FLEET (JANUARY 1st, 2004)<br />
TOTAL ORDER BOOK (JANUARY 1st, 2004)<br />
unknown 15 ... 28 -87.4 14 ... 151 ...<br />
- 999 868 483 7625 0.8 55 44 570 87.1<br />
1000 - 1999 902 1271 19312 2.8 63 91 1181 44.9<br />
2000 - 2999 508 1256 18223 5.1 103 264 3512 70.6<br />
3000 - 3999 270 931 12816 5.7 36 118 1600 112.3<br />
4000 - 4999 234 1026 13929 9.7 95 417 5299 89.3<br />
5000 - 5999 130 717 8729 12.3 74 396 4937 118.6<br />
6000 - 6999 80 517 6529 32.1 29 190 2296 20.4<br />
> = 7000 29 224 3022 31.8 119 967 11802 301.9<br />
Total 3036 6424 90214 7.7 588 2487 31348 120.1<br />
Total prev. year 2905 5893 83744 10.0 316 1109 14244 -14.4<br />
ADDITION TO FLEET DURING 2003<br />
BROKEN-UP DURING 2003<br />
unknown 1 ... 3 900.0 1 58 - -<br />
- 999 28 20 244 -21.6 26 14 292 49.4<br />
1000 - 1999 27 35 463 -42.5 15 20 363 -1.2<br />
2000 - 2999 38 96 1317 -3.6 7 18 298 ...<br />
3000 - 3999 11 35 450 29.2 - - - -<br />
4000 - 4999 24 104 1260 -41.1 - - - -<br />
5000 - 5999 17 95 1156 -0.1 - - - -<br />
6000 - 6999 19 123 1536 -9.9 - - - -<br />
> = 7000 7 60 725 77.4 - - - -<br />
Total 172 568 7155 -13.2 49 110 953 4.9<br />
Total prev. year<br />
Ships of 300 gt <strong>and</strong> over<br />
ISL based on LR/Fairplay<br />
207 634 8240 32.4 42 52 908 87.3<br />
The large amount of new ships entering the container<br />
fleet throughout the last years is decisive for the age<br />
profile. Container ships are much younger than any<br />
other ship type within the world merchant fleet. At the<br />
beginning of 2004, their average age stood at 10.5<br />
years. 27.5 per cent of all container ships were<br />
attributable to building years in the period of 1999-<br />
2003 <strong>and</strong> 26.4 per cent were built before 1989. The<br />
latter age class represent, in terms of tonnage, only<br />
20.6 per cent of the total container fleet which is equal<br />
to a TEU share of 17.9 per cent. Thus, the scrapping<br />
potential in the container shipping market is limited.<br />
Based on the average age of broken-up tonnage for<br />
the year 2003, which stood at nearly 26 years, there<br />
are about 150 ships with 2.2 mill dwt equal to 0.12<br />
mill TEU in this age category.<br />
In the period of 2000-2004, the TEU-capacity of fully<br />
cellular container ships up to 999 TEU increased on<br />
average by 2.6 per cent, whereas the size classes<br />
1,000-1,999 TEU <strong>and</strong> 2,000-3,999 TEU grew by 4.0<br />
per cent <strong>and</strong> 6.1 per cent respectively. A record high<br />
was realised by ships in sizes above 4,000 TEU. Their<br />
TEU-capacity increased in the period 2000-2004 on<br />
average by 24.1 per cent yearly.<br />
Thus, looking at the size development of container<br />
ships there is, as in previous years, a marked tendency<br />
towards larger units. At the beginning of 2004, 473<br />
fully cellular container ships, equal to a share of 38.7<br />
4 SSMR June 2004<br />
per cent of the total TEU-capacity of the world cellular<br />
container fleet, were attributable to sizes above 4,000<br />
TEU. Moreover 109 container ships with approx.<br />
741,000 TEU were attributable to size categories of<br />
6,000 TEU <strong>and</strong> over, other 148 ships in this size<br />
category stood in the order book of January 1 st , 2004.<br />
Fig. 3: Container fleet development by TEU-size<br />
classes as of January 1 st , 2000 – 2004<br />
ISL 2004
Container <strong>and</strong> general cargo fleet, supply/dem<strong>and</strong>, ports<br />
The largest container ships in service at the beginning<br />
of 2004 are four OOCL ships with a capacity of 8,063<br />
TEU, like the “OOCL Shenzhen” 2 .<br />
Container fleet by ownership patterns<br />
<strong>and</strong> ship operators 2004<br />
Pages<br />
48; 70-72<br />
At the beginning of 2004, the container tonnage (dwt)<br />
registered for OECD countries had a share of 30.8 per<br />
cent of the world fully cellular container fleet, whereas<br />
in 1991 their share stood at 44.3 per cent (ship of<br />
1000 gt <strong>and</strong> over).<br />
Fig. 4: Container fleet development by country groups<br />
as of January 1st , 1994-2004 (ships of 1000<br />
gt <strong>and</strong> over)<br />
ISL 2004<br />
Over one third of the container TEU-tonnage belongs<br />
to the open registry flags Panama <strong>and</strong> Liberia. At the<br />
beginning of 2004, 583 container ships with 20.7 mill<br />
dwt <strong>and</strong> 1.5 mill TEU were registered in Panama which<br />
is equal 23.0 per cent of the total TEU capacity of the<br />
world fully cellular container fleet. Liberia ranks on the<br />
second place with 376 vessels having a capacity of<br />
0.95 mill TEU representing 14.8 per cent of the total<br />
TEU capacity of the world fully cellular container fleet.<br />
At the beginning of 2004, the German registered fully<br />
cellular container fleet stood at 0.46 mill TEU (2003:<br />
0.51 mill TEU) <strong>and</strong> is the third largest flag in world<br />
container fleet ranking.<br />
At the beginning of 2004, the top ten open registry<br />
flags registered 51.8 per cent of the world container<br />
tonnage (dwt). In the period of 2000-2004, they<br />
increased their registered tonnage volume in container<br />
shipping yearly on average by 13.1 per cent.<br />
2 But 19 container ships (of the Maersk S-class serie) range as officially<br />
indicated by A.P. Möller between 6,418 <strong>and</strong> 7,226 TEU, whereas experts<br />
estimate their TEU-capacity up to 8,500 TEU.<br />
Tab. 2: Container fleet by national <strong>and</strong> foreign flag<br />
distribution as of January 1 st ,2000 – 2004<br />
National flags Total foreign flag share<br />
Year No mill dwt No mill dwt No dwt<br />
2000 989 26.8 2,287 60.6 56.8 55.7<br />
2001 1,001 27.9 2,406 65.4 58.4 57.4<br />
2002 1,001 29.3 2,524 71.6 60.3 59.0<br />
2003 987 30.1 2,640 76.8 62.6 60.8<br />
2004 965 30.8 2,848 86.2 66.1 64.3<br />
ISL based on LR/Fairplay; ships of 1000 gt <strong>and</strong> over, excl.<br />
unknown<br />
At the beginning of 2004, the “country of domicile”<br />
analysis, including container ships of 1,000 gt <strong>and</strong><br />
over, reflects that 64.3 per cent of the container<br />
tonnage was not registered in the country of domicile of<br />
the owner, but flagged-out. Whereby 76.8 per cent of<br />
the container tonnage, in terms of dwt, was attributable<br />
to OECD-countries (excl. unknown) 3 .<br />
Tab. 3: World container fleet (registered <strong>and</strong><br />
controlled) by region as of January 1 st , 2004<br />
(1) dwt % share of world fleet 2004<br />
(2) dwt %- change over prev year<br />
(3) Average yearly growth rate 2000 - 2004 (dwt)<br />
Controlled Registered<br />
(1) (2) (3) (1) (2) (3)<br />
Europe 56.9 19.5 14.1 27.4 7.6 8.7<br />
of which EU 50.5 20.3 86.4 25.1 1.9 8.9<br />
North America 5.0 5.6 4.4 3.7 1.7 1.8<br />
Latin <strong>and</strong> South America 0.1 -66.1 -16.5 31.0 -1.7 10.7<br />
Asia <strong>and</strong> Oceania 33.5 3.7 3.9 23.5 0.7 4.5<br />
Africa 0.1 -11.9 -30.4 14.5 -12.6 20.7<br />
Unknown 4.4 -42.8 10.5<br />
Total<br />
Ships of 1000 gt <strong>and</strong> over<br />
ISL based on LR/Fairplay<br />
100.0 7.7 9.3 100.0 7.7 9.3<br />
There is a strong concentration on European <strong>and</strong> Asian<br />
shipowners. At the beginning of 2004, European<br />
shipowners controlled at least 3.7 mill TEU equal to<br />
60.0 per cent of the total TEU capacity of the world<br />
container fleet. At the same time the share of Asian <strong>and</strong><br />
Oceanian owners reached 34.5 per cent. In the period<br />
of 2000-2004, European <strong>and</strong> Asian container<br />
shipowners increased their fleets, measured in TEU, per<br />
year by 15.6 per cent <strong>and</strong> 5.1 per cent respectively.<br />
As far as container ship operators are concerned the<br />
container shipping industry has gone through a period<br />
of massive concentration which is not necessarily<br />
reflected in the above ownership analysis.<br />
Approx. 65 per cent of all fully cellular container ships<br />
<strong>and</strong> 75 per cent of the global TEU capacity is<br />
3 Based on the total world merchant fleet excluding ships where the country<br />
of domicile is unknown.<br />
SSMR June 2004 5
Container <strong>and</strong> general cargo fleet, supply/dem<strong>and</strong>, ports<br />
controlled by only 15 operators. The largest is Maersk-<br />
Seal<strong>and</strong>, operating a capacity of 778.000 TEU equal<br />
to 13.0 per cent of the total world fleet capacity. Nine<br />
of the top 15 operators are with major parts of their<br />
fleets involved global alliances. As shown in Fig. 8,<br />
about 28 per cent of the total container capacity is<br />
employed in three alliances (CHKY alliance, Gr<strong>and</strong><br />
Alliance incl. Gr<strong>and</strong> Americana <strong>and</strong> New World<br />
Alliance). Together with the big three “independent<br />
carriers”, namely Maersk-Seal<strong>and</strong>, MSC <strong>and</strong><br />
Evergreen, these “Global Players” have a market share<br />
of 56 per cent on the total TEU-capacity in world<br />
container shipping.<br />
Fig. 5: TEU-capacity of top ranking containership<br />
operators as of February 2003 <strong>and</strong> 2004<br />
ISL based MDS Transmodal<br />
In container shipping charter activities have a growing<br />
importance. According to MDS Transmodal 46.3 per<br />
cent of the world container fleet capacity4 of the 15 top<br />
ranking operators (based on TEU) is chartered in. For<br />
comparison, in 1998 only 28 per cent of their TEU<br />
capacity was attributable to charter tonnage. Especially<br />
German shipowners are the counterpart in the<br />
container charter market providing container operators<br />
with additional ships. Charter strategies of container<br />
operators differ significantly. Whereas COSCO has<br />
only a share of eight per cent of chartered in container<br />
ships the share for CSCL or Hanjin stood at over 70 per<br />
cent.<br />
Container fleet operations of the “Global Players“<br />
concentrates on the Europe-Far East, Transatlantic <strong>and</strong><br />
Transpacific trades. As far as ship operations are<br />
concerned the most important trading region is the<br />
Transpacific. In the trade between Far East <strong>and</strong> North<br />
America 312 container ships involved in 66 services<br />
4 Ships of 1,000 TEU <strong>and</strong> over. Figures are based on the MDS Transmodal<br />
Containership Databank as of February 2004<br />
6 SSMR June 2004<br />
are operating, thereof 94 vessels of the CHKY alliance<br />
with about 0.4 mill TEU. The largest container vessels<br />
are employed in the “Europe-Far East” trade with an<br />
average capacity of 5.290 TEU. In this trade Maersk-<br />
Seal<strong>and</strong> is involved with 39 carriers with (average<br />
capacity 6.018 TEU). Related to all relations, Maersk-<br />
Seal<strong>and</strong> employed by far the largest ship units (about<br />
5.000 TEU). In the Transatlantic trade only two Global<br />
Players have major market shares with 38.9 per cent<br />
(Gr<strong>and</strong> Americana) <strong>and</strong> 24.7 per cent (Maersk-<br />
Seal<strong>and</strong>).<br />
Tab. 4: Fully cellular container ships by major<br />
operators as of February, 2004<br />
Total % chartered av ship size<br />
Operator No 1000 TEU No TEU in TEU<br />
MAERSK 250 778.2 46.0 35.9 3,113<br />
MSC 165 475.6 50.9 48.1 2,882<br />
EVERGREEN 140 429.2 13.6 10.1 3,066<br />
PONL 126 385.7 61.1 51.7 3,061<br />
HANJIN 76 291.6 72.4 65.1 3,837<br />
APL 67 269.9 46.3 41.1 4,028<br />
CMA-CGM 84 253.7 52.4 53.4 3,020<br />
NYK 68 201.6 50.0 37.1 2,965<br />
COSCO 63 196.5 7.9 7.9 3,119<br />
K-LINE 58 194.4 69.0 61.6 3,352<br />
MOL 52 173.9 57.7 49.6 3,344<br />
OOCL 39 167.1 41.0 36.5 4,285<br />
HAPAG-LLOYD 41 163.9 29.3 19.9 3,998<br />
CSCL 41 151.8 73.2 41.9 3,702<br />
YANGMING 52 140.2 44.2 40.6 2,696<br />
OTHERS/UNKNOWN 842 1,695 44.3 43.9 2,012<br />
Total 2,164 5,968 45.7 40.9 2,758<br />
Note: excl. unknown operators; Ships of 1000 TEU <strong>and</strong> over<br />
APL includes NOL; CMA-CGM includes ANL-CL <strong>and</strong> Ybarra;<br />
Evergreen includes Hatsu Marine <strong>and</strong> Lloyd Triestino; Hanjin includes<br />
Senator; Maersk SeaL<strong>and</strong> includes Safmarine; NYK includes TSK;<br />
P&O Nedlloyd includes Farrell <strong>and</strong> P&O Swire; Evergreen includes<br />
Hatsu Marine <strong>and</strong> Lloyd Triestino.<br />
ISL based on MDS Transmodal<br />
Tab 5: The “Global Players” tonnage employed in<br />
container trades 2004<br />
Alliance / Operator No<br />
Europe Far East Transatlantic Transpacific<br />
1000<br />
TEU No<br />
1000<br />
TEU No<br />
1000<br />
TEU<br />
Maersk Seal<strong>and</strong> 39 234.7 32 114.2 48 222.2<br />
CHKY Alliance<br />
Gr<strong>and</strong> Alliance<br />
70 337.3 8 28.4 94 396.9<br />
(Gr<strong>and</strong> Amer.) 68 360.8 46 179.8 60 272.8<br />
New World Alliance 24 136.5 12 49.0 45 216.0<br />
MSC 24 136.5 14 41.7 14 52.0<br />
Evergreen 29 137.9 12 48.9 51 221.8<br />
Total 254 1,343.7 124 461.8 312 1,381.8<br />
Note: Figues includes Pendulum services;carrying capacities are counted<br />
in every trade; Europe incl. MED; Transatlantic incl. Gulf of Mexico; ships<br />
ISL based on MDS Transmodal
Container <strong>and</strong> general cargo fleet, supply/dem<strong>and</strong>, ports<br />
WORLD GENERAL CARGO FLEET<br />
Tonnage supply 2004<br />
As of January 1 st 2004, the world general cargo fleet<br />
consisted of 16,487 ships with 95.2 mill dwt <strong>and</strong> 1.9<br />
mill TEU. In the period 2000 – 2004 the world general<br />
cargo fleet in terms of dwt decreased yearly by 1.2 per<br />
cent, whereas, in terms of TEU, the fleet increased by<br />
1.6 per cent yearly.<br />
Tab. 6: General cargo fleet development as of<br />
January 1 st , 2000 <strong>and</strong> 2004<br />
pages<br />
32-42<br />
2000 2004 Av. growth Average age<br />
rate 00-'04 (years)<br />
Ship type No dwt No dwt No dwt 2000 2004<br />
Single deck 8634 40.8 8663 42.9 0.1 1.2 19.8 21.3<br />
Multi deck 5018 35.3 4232 27.3 -4.2 -6.2 23.2 26.2<br />
Special ships 1321 7.4 1173 6.8 -2.9 -2.2 17.8 19.8<br />
Reefer shps 1121 9.4 1239 10.1 2.5 1.8 18.1 19.7<br />
Ro/Ro cargo ships 1134 7.2 1180 8.2 1.0 3.4 18.1 19.6<br />
Total 17228 100.1 16487 95.2 -1.1 -1.2 20.5 22.2<br />
Ships of 300 gt <strong>and</strong> over; tonnage in mill.<br />
ISL based on LR/Fairplay<br />
Deployment of general cargo ships is related towards<br />
specific commodities <strong>and</strong>/or trades (short sea shipping).<br />
Their operating niches range between the liner industry<br />
<strong>and</strong> the market for smaller bulk carriers.<br />
The general cargo fleet is composed of various subtypes<br />
(Compare Table 6) having their own momentum<br />
in the market. General cargo single-deck ships<br />
increased their tonnage shares on the total general<br />
cargo fleet from 40.8 per cent in 2000 to 45.0 per<br />
cent at the beginning of 2004. In the same period,<br />
multi deckers dwt-share decreased from 35.3 per cent<br />
to 28.7 per cent in 2004.<br />
During the period of 1999-2003, 1,898 general cargo<br />
ships with 18.2 mill dwt were reported to be broken-up,<br />
thereof 963 multi deckers with a tonnage of 11.5 mill<br />
dwt. During the same period 1,224. general cargo<br />
ships (newbuildings <strong>and</strong> other entries) with 11.2 mill<br />
dwt were added to the fleet. In terms of tonnage these<br />
new entries were attributable to single-deck ships (64.5<br />
per cent), special ships (13.4 per cent) <strong>and</strong> ro-ro cargo<br />
ships (14.5 per cent). Single-deck ships grew steadily in<br />
number <strong>and</strong> tonnage throughout the last years.<br />
Looking at the year 2003, demolitions exceeded fleet<br />
additions (newbuildings <strong>and</strong> other entries) by 2.5 mill<br />
dwt. As a result, the general cargo fleet decreased, by –<br />
1.6 per cent comparing tonnage figures as of January<br />
1st , 2003 <strong>and</strong> 2004.<br />
Fig. 6: General cargo fleet – additions <strong>and</strong> reductions<br />
1993 – 2003 (in mill dwt) 5<br />
ISL 2004<br />
At the beginning of 2004, general cargo ships had an<br />
average age of 22.2 years. Nearly 70 per cent of all<br />
general cargo ships, which equals to more than two<br />
thirds of the total deadweight tonnage, were already<br />
built before 1989, whereby the age profile for the<br />
various sub-types of the general cargo fleet differs.<br />
Overaging of the general cargo fleet is especially true<br />
for the multi-deck fleet. As of January 1 st , 2004, multideckers<br />
had an average age of 26.2 years, besides<br />
cargo/passenger ships (average age 32.5) the oldest<br />
fleet segment. Thus, future scrapping activities in the<br />
field of general cargo shipping will largely be<br />
concentrated on this fleet segment.<br />
Fig. 7: General cargo fleet by ship type <strong>and</strong> division<br />
of age as of January 1 st , 2004 (No of ships)<br />
5 see footnote 1<br />
ISL 2004<br />
SSMR June 2004 7
General cargo <strong>and</strong> container fleet, supply/dem<strong>and</strong>, ports<br />
Tab. 7: Key figures on world general cargo fleet in 2004/2003<br />
Multi-/Single- Special Reefer Ro-Ro cargo<br />
deck ships ships ships ships<br />
Size class No of 1,000 No of 1,000 No of 1,000 No of 1,000 No of 1,000<br />
(dwt) ships dwt ships dwt ships dwt ships dwt ships dwt<br />
- 4999 8783 18901 638 1030 555 1264 653 1341 10629 22536 -0.8<br />
5000 - 9999 2351 16228 153 1195 391 2803 279 2031 3174 22258 -2.1<br />
10000 - 19999 1158 16799 352 4992 227 2690 160 2232 1897 26713 -3.0<br />
> = 20000 603 18256 96 2857 - - 88 2567 787 23680 -0.3<br />
Total 12895 70184 1239 10075 1173 6758 1180 8171 16487 95187 -1.6<br />
Total prev. Year 13061 71715 1200 9829 1225 7073 1182 8137 16668 96754<br />
- 4999 110 363 4 9 - - 6 9 120 381 -3.6<br />
5000 - 9999 104 753 7 55 1 5 12 93 124 906 24.9<br />
10000 - 19999 60 741 23 356 5 62 22 305 110 1464 9.3<br />
> = 20000 35 1273 36 817 - - 13 285 84 2375 24.5<br />
Total 309 3129 70 1237 6 67 53 693 438 5126 17.4<br />
Total prev. Year 281 2975 33 446 8 78 61 869 383 4367<br />
- 4999 67 180 10 12 5 14 5 3 87 209 -6.1<br />
5000 - 9999 26 193 4 25 - - 6 43 36 261 -39.0<br />
10000 - 19999 19 257 7 109 - - 10 143 36 509 0.7<br />
> = 20000 14 476 1 23 - - 5 123 20 622 37.5<br />
Total 126 1106 22 169 5 14 26 312 179 1601 -41.6<br />
Total prev. Year 260 2287 25 100 5 24 31 332 321 2743<br />
- 4999 207 478 22 48 11 28 18 44 258 598 292.1<br />
5000 - 9999 78 567 10 74 15 119 6 45 109 805 92.9<br />
10000 - 19999 104 1594 5 61 1 11 4 64 114 1730 15.9<br />
> = 20000 29 709 6 219 - - 2 53 37 980 -21.2<br />
Total 418 3348 43 402 27 157 30 206 518 4114 5.6<br />
Total prev. Year 289 3218 32 406 16 114 12 158 349 3896<br />
Ships of 300 gt <strong>and</strong> over<br />
ISL based on LR/Fairplay;<br />
TOTAL GENERAL CARGO FLEET AS OF JANUARY 1st, 2004<br />
TOTAL ORDER BOOK AS OF JANUARY 1st, 2004<br />
ADDITION TO FLEET DURING 2003<br />
BROKEN-UP DURING 2003<br />
Tab. 8: General cargo fleet by division of age <strong>and</strong> ship type as of January 1 st , 2004<br />
8 SSMR June 2004<br />
Total<br />
general cargo fleet<br />
dwt %change<br />
over<br />
prev. year<br />
before 1984 1984 - 1988<br />
Year of build<br />
1989 - 1993 1994 - 1998 1999 - 2004 Total<br />
Ship type No dwt No dwt No dwt No dwt No dwt No dwt<br />
Single-deck ships 4436 17140 1059 6137 1110 4262 1314 8925 744 6394 8663 42858 20.9<br />
Multi-deck ships 3097 19504 651 4427 291 1839 144 1063 49 493 4232 27326 25.5<br />
Special ships 539 2293 236 1468 241 1852 108 742 49 402 1173 6758 19.1<br />
Reefer ships 603 4195 238 2542 122 675 129 1168 147 1495 1239 10075 19.6<br />
Ro-Ro ships 644 4128 134 1022 111 591 132 827 159 1603 1180 8171 19.4<br />
Total 9319 47260 2318 15596 1875 9220 1827 12725 1148 10387 16487 95187 21.8<br />
Ships of 300 gt <strong>and</strong> over; tonnage in 1000<br />
S ISL based ISL on b LR/Fairplay d LR/F l<br />
Assuming that ships of the total general cargo fleet<br />
have an average age of approx. 29 years 6 before<br />
they are scrapped, the demolition potential for the<br />
current general cargo fleet had at least a volume of<br />
about 14 mill dwt, thereof 6 mill dwt single <strong>and</strong> multi<br />
6 Assumption based on ISL broken-up tonnage analysis for the year 2003.<br />
Average<br />
age<br />
deck ships each. This broken-up potential represents<br />
more than 15 per cent of the current fleet equal to<br />
about 4,300 ships<br />
The world general cargo fleet is largely composed of<br />
ships in smaller size classes. At the beginning of<br />
2004, 10,629 ships were attributable to sizes up to<br />
4,999 dwt. Figures on the world general cargo fleet,<br />
summarised in Table 7, indicate that only 4.8 per cent
Container <strong>and</strong> general cargo fleet, supply/dem<strong>and</strong>, ports<br />
of all general cargo ships, equal to 24.9 per cent of<br />
the total general cargo tonnage, had sizes of 20,000<br />
dwt <strong>and</strong> above. The order book shows a different size<br />
distribution. At the beginning of 2004, about 46 per<br />
cent of the total cargo tonnage on order were<br />
attributable to this size segment (+ 20,000 dwt).<br />
Ownership patterns 2004<br />
pages<br />
33-37<br />
As of January 1 st , 2004, 38.3 mill dwt equal to 42.1<br />
per cent of the total general cargo tonnage were<br />
registered for the top ten open registry flags 7 (ships of<br />
1000 gt <strong>and</strong> over). Compared with last year`s<br />
tonnage figures, these ten flags decreased their<br />
tonnage by 4.8 per cent.<br />
Fig. 8: General cargo fleet by major country groups<br />
as of January 1 st , 2004 (ships of 1,000 gt<br />
<strong>and</strong> over)<br />
ISL 2004<br />
Within the period 2000 – 2004, the top ten open<br />
registry flags lost about 5.7 mill dwt (- 13.0 per cent ),<br />
in particular the new EU members Cyprus <strong>and</strong> Malta<br />
lost together 4.0 mill dwt in the mentioned period.<br />
These losses are broken-up tonnage as well as flag<br />
changes in equal shares.<br />
On the contrary, OECD countries’ registered flag<br />
shares on the world general cargo fleet (ships of 1000<br />
gt <strong>and</strong> over) increased their tonnage throughout the<br />
period of 1991-2003 by 11.9 per cent (+2,1 mill<br />
dwt). As of January 1st, 2004, OECD countries’ share<br />
on the world general cargo fleet stood at 22.0 per<br />
cent compared with18.7 per cent in 2000.<br />
Panama is the leading register for general cargo<br />
ships. At the beginning of 2004, 1.547 general cargo<br />
ships with 13.4 mill dwt were registered in Panama<br />
which is equal to 14.7 per cent of the total general<br />
7 Bahamas, Bermuda, Cyprus, Liberia, Panama, Malta, Saint Vincent,<br />
Marshall Isl<strong>and</strong>s, Vanuatu, Antigua & Barbuda <strong>and</strong> Cayman Isl<strong>and</strong>s<br />
cargo fleet (ships of 1000 gt <strong>and</strong> over). The<br />
dominance of the Panamanian flag is given for single<br />
deckers as well as special cargo <strong>and</strong> reefer ships<br />
whereas at the beginning of 2004, the leading flags<br />
for ro-ro ships <strong>and</strong> multi-deckers were the US <strong>and</strong> the<br />
PR China respectively.<br />
Tab. 9: General cargo fleet by national <strong>and</strong> foreign<br />
flag distribution as of January 1st , 2004<br />
Total foreign flag share<br />
Ship type No mill dwt No dwt<br />
Single-deck ships 4654 34.6 44.6 56.2<br />
Multi-deck ships 2711 22.3 49.6 48.7<br />
Special ships 840 9.4 59.8 65.9<br />
Reefer ships 912 6.1 74.5 81.4<br />
Ro-Ro cargo ships 766 7.3 42.4 39.1<br />
General cargo ships 9883 79.8 49.9 55.6<br />
ISL based on LR/Fairplay; ships of 1000 gt <strong>and</strong> over, excl. unknown<br />
The ISL analysis according to country of domicile,<br />
including general cargo ships of 1,000 gt <strong>and</strong> over,<br />
showed that at the beginning of 2004, 55.6 per cent<br />
of the general cargo tonnage was not registered in<br />
the country of domicile of the owner, but flagged-out.<br />
OECD-countries control, in terms of dwt, at least 62<br />
per cent of the world general cargo fleet 8 .<br />
Tab. 10: World general cargo fleet (registered <strong>and</strong><br />
controlled) by region as of January 1 st ,<br />
2004<br />
(1) dwt % share of world fleet 2004<br />
(2) dwt %- change over prev year<br />
(3) Average yearly growth rate 2000 - 2004 (dwt)<br />
County Groups Controlled Registered<br />
(1) (2) (3) (1) (2) (3)<br />
Europe 45.4 -2.8 -2.5 25.1 -2.6 -2.6<br />
of which EU 27.0 -3.2 -2.5 11.2 1.9 2.0<br />
North America 4.4 -1.5 11.3 3.3 1.7 26.4<br />
Latin <strong>and</strong> South America 1.6 -2.1 -5.1 31.4 -1.7 -1.8<br />
Asia <strong>and</strong> Oceania 35.2 2.5 -1.4 34.9 0.7 0.2<br />
Africa 1.1 -10.7 -10.8 5.3 -12.6 -7.3<br />
Unknown 12.4 -7.3 3.4<br />
Total<br />
Ships of 1000 gt <strong>and</strong> over<br />
ISL based on LR/Fairplay<br />
100.0 -1.6 -1.2 100.0 -1.6 -1.2<br />
The regional grouping of countries of domicile<br />
highlights that as of January 1 st , 2004, at least 51.8<br />
per cent of the world general cargo fleet (in terms of<br />
tonnage) was attributable to European shipowners<br />
<strong>and</strong> further 40.2 per cent was controlled by Asian <strong>and</strong><br />
Oceanian shipping companies (total tonnage<br />
excluding ships of which the country of domicile is<br />
unknown).<br />
8 Based on the total world merchant fleet excluding ships where the<br />
country of domicile is unknown.<br />
SSMR June 2004 9
Container <strong>and</strong> general cargo fleet, supply/dem<strong>and</strong>, ports<br />
SUPPLY / DEMAND PATTERNS IN<br />
CONTAINER AND GENERAL CARGO<br />
SHIPPING<br />
Global Insight - World trade outlook <strong>and</strong> world<br />
contaierised trade development up to 2006 9<br />
Pages<br />
49-61<br />
Nowhere has the building momentum in the global<br />
recovery been more joyously received than among<br />
shipowners. Liner operators are making money, <strong>and</strong><br />
they are euphoric about it. Box rates are increasing<br />
steadily, <strong>and</strong> the full ships have encouraged a sharp<br />
increase in the orderbook stretching deliveries out to<br />
2007, despite rising new build prices.<br />
Since the bursting of the IT bubble in 2000, the world<br />
has had three years to adjust <strong>and</strong> absorb the resulting<br />
damage to the economy. Terrorist attacks, the<br />
Afghanistan <strong>and</strong> Iraq wars, escalating energy prices,<br />
<strong>and</strong> corporate accounting sc<strong>and</strong>als have diverted<br />
economic resources, raised social costs, <strong>and</strong> reduced<br />
investors’ <strong>and</strong> consumers’ confidence <strong>and</strong>, therefore,<br />
slowed the economic recovery process. Continuing<br />
technology progress, population growth, <strong>and</strong><br />
government monetary <strong>and</strong> fiscal stimulus have helped<br />
to keep the global recovery on track. Entering 2004,<br />
although the recovery has not yet played out, the<br />
economies of most major countries have returned to<br />
healthy conditions, with the structure <strong>and</strong> sustained<br />
strength to continue growing. Non-Japan Asia <strong>and</strong> the<br />
United States are taking the lead in this new round of<br />
economic expansion, followed by Australia, New<br />
Zeal<strong>and</strong>, Canada, the United Kingdom, <strong>and</strong> then<br />
Japan. Even Germany has returned to positive growth,<br />
<strong>and</strong> the whole Eurozone has climbed out of recession.<br />
Other economies, whether they experienced a<br />
recession or maintained economic growth, are all<br />
boosted by the recovery of the world’s major<br />
economies. Global Insight’s latest forecast for the<br />
world as a whole is for real GDP in 2004 to increase<br />
by 4 per cent.<br />
World full-container traffic is predicted to reach 69.7<br />
million TEUs in 2004, an increase of 6.4 per cent<br />
over last year. This is only a slightly slower growth<br />
than in 2003 (which was 6.8 per cent), but far<br />
superior to the meagre 1.1per cent growth in 2001.<br />
With economic growth strong in most importing<br />
regions, <strong>and</strong> with China exporting so much liner<br />
cargo, the drivers of this increase are clear. Its<br />
container exports are more than double those of the<br />
9 The contribution is based on the World Trade Service published<br />
by Global Insight. Compare www.globalinsight.com<br />
10 SSMR June 2004<br />
United States. Also, the growth of China's exports is<br />
projected to be one of the fastest in the world.<br />
The amazing dominance of China as an exporter of<br />
containerised cargo can be seen in table 11; China's<br />
exports in 2005 will be more than double its exports<br />
in 2000. Its average annual growth of 6 per cent will<br />
keep it in the top position throughout the forecast<br />
period.<br />
This year, China will gain another 5 per cent share of<br />
total container exports over 2003, an amazing feat.<br />
Tab. 11: Five Largest Container Exporting Nations<br />
(Thous<strong>and</strong>s of TEUs)<br />
av. yearly<br />
growth<br />
Export-Country 2004 2005 2006 '04-'06 in %<br />
China 15,339 17,086 18,681 10.4<br />
United-States 6,915 7,174 7,423 3.6<br />
Japan 4,173 4,337 4,501 3.9<br />
South-Korea 2,913 3,065 3,225 5.2<br />
Taiwan 2,799 2,909 3,026 4.0<br />
Source: ISL 2004 based on Global Insight World Trade Service<br />
Fig. 9: China - Foreign container traffic by major<br />
trading areas 2003 <strong>and</strong> 2006 (based on<br />
TEU)<br />
ISL based on Global Insight; World Trade Service<br />
TEUs from Northeast Asia dominate the container flow<br />
picture worldwide, in terms of both volume <strong>and</strong><br />
growth. Shipments from Northeast Asia to North<br />
America <strong>and</strong> North Europe will reach 13.5 million<br />
TEUs this year (2004), <strong>and</strong> will climb to 18.2 million<br />
in 2008. North America's container exports are<br />
dominated by flows to Northeast Asia (3.5 million
Container <strong>and</strong> general cargo fleet, supply/dem<strong>and</strong>, ports<br />
TEUs), followed by Latin America <strong>and</strong> then North<br />
Europe.<br />
Here, it is clear again that Northeast Asia (mainly<br />
China) was the fastest growing export region for<br />
containerised cargo, at 15.1 per cent, <strong>and</strong> that this<br />
growth is expected to remain the fastest through the<br />
2006 forecast, slipping to 7.4 per cent in the final<br />
year. By 2006, Northeast Asia's exports will top 30.1<br />
million TEUs.<br />
Total exports from Northeast <strong>and</strong> Southeast Asia<br />
together will reach 33.7 million TEUs this year, up 9.7<br />
per cent. Container exports from North America <strong>and</strong><br />
North Europe will be roughly equal in 2004, at 8.4<br />
million TEUs, with North America's growth at only 1.5<br />
per cent <strong>and</strong> Europe's at 2.4 per cent. However,<br />
Europe's main export trading partner is North<br />
America, <strong>and</strong> North America's is Notheast Asia,<br />
clearly implying that westbound trade across the North<br />
Atlantic <strong>and</strong> the Pacific will be the main container<br />
flows in the forecast.<br />
Northbound flows, from Latin America to North<br />
America <strong>and</strong> to North Europe will grow steadily,<br />
reaching 3.3 million TEUs this year <strong>and</strong> climbing to<br />
3.8 million in 2006. New free-trade agreements with<br />
Europe are part of the stimulus on this trade, with<br />
lower tariffs in the future for key Latin American<br />
exports, from refrigerated products to manufactured<br />
goods.<br />
Container trade between Asia <strong>and</strong> Europe will hit 9.8<br />
million TEUs this year, with 2.3 times more TEUs<br />
moving westbound to Asia than in the reverse<br />
direction. This disparity in container volumes comes<br />
about this year because of the high growth (11.2 per<br />
cent) expected in westbound shipments, compared<br />
with only 4.2 per cent from Europe to Asia.<br />
Tab. 12: World seaborne container trade by region 2001-2003 <strong>and</strong> outlook 2006 (in TEU)<br />
2001- 2002-<br />
Container trade in mill TEU<br />
2002 2003 av. annual growth % share of total trade<br />
Country/-group<br />
Export<br />
2001 2002 2003 (a) 2006 (b) %-change %-change '02-'06 '03-05 2002 2006<br />
World Total<br />
of which<br />
57.9 61.3 65.5 77.1 5.9 6.8 5.9 5.6 100.0 100.0<br />
Asia 28.2 30.8 34.2 42.6 9.5 11.0 8.4 7.6 50.3 55.2<br />
of which China 8.9 10.7 13.3 18.7 19.9 23.9 14.9 12.1 17.5 24.2<br />
Europe 12.9 13.2 13.3 14.6 2.8 0.9 2.5 3.0 21.6 18.9<br />
of which EU 15 10.8 11.0 11.1 12.1 2.6 0.5 2.2 2.8 18.0 15.6<br />
America 12.5 12.7 13.2 14.6 1.9 3.9 3.5 3.4 20.7 18.9<br />
of which US 6.7 6.6 6.8 7.4 -1.7 3.4 2.9 2.7 10.8 9.6<br />
Africa 2.0 2.2 2.3 2.6 7.2 5.6 4.9 4.6 3.6 3.4<br />
Oceania 1.4 1.4 1.4 1.5 -2.7 -0.9 1.9 2.9 2.3 2.0<br />
Others/unknown<br />
Import<br />
0.9 1.0 1.0 1.2 4.2 6.8 5.8 5.5 1.6 1.6<br />
World Total<br />
of which<br />
57.9 61.3 65.5 77.1 5.9 6.8 5.9 5.6 100.0 100.0<br />
Asia 21.8 22.9 24.1 28.2 5.1 5.3 5.3 5.3 37.4 36.5<br />
of which China 3.7 4.3 5.0 6.6 16.4 14.7 11.0 9.8 7.1 8.5<br />
America 16.8 18.2 20.0 24.1 8.5 10.0 7.3 29.6 31.3<br />
of which US 11.5 13.0 14.7 18.1 12.8 12.8 8.6 7.2 21.2 23.4<br />
Europe 13.8 14.6 15.7 18.8 5.9 8.0 6.6 6.1 23.8 24.4<br />
of which EU 15 11.7 12.5 13.6 16.4 6.4 8.6 7.0 6.5 20.4 21.2<br />
Africa 2.9 2.9 2.9 3.0 -0.8 -0.9 0.7 1.2 4.7 3.9<br />
Oceania 1.2 1.3 1.4 1.6 6.7 4.9 4.6 4.5 2.2 2.0<br />
Others/unknown 1.4 1.4 1.4 1.4 0.5 -3.1 -0.1 0.9 2.3 1.8<br />
(a): estimates as of May 17th 2004; (b): forecast as of May 17th 2004<br />
Note: Excluding transshipment <strong>and</strong> domestic trade <strong>and</strong> excluding empty containers<br />
ISL based on Global Insight World Trade Service 2004<br />
Global Insight assumes that the exceedingly high real<br />
economic growth in China will be managed into a<br />
soft-l<strong>and</strong>ing using the limited but potentially effective<br />
tools available to the Chinese government, such as<br />
slight modifications to the exchange rate.<br />
Global Insight expects eastbound flows this year to hit<br />
15.3 million TEUs, most of it l<strong>and</strong>ing on the U.S. West<br />
Coast of course. But over time, there has been a shift<br />
to allwater services to the U.S. East Coast, with<br />
several major U.S. consumer firms setting up<br />
distribution operations along the East Coast.<br />
The ratio of eastbound to westbound TEUs in this<br />
trade will be 2.7 this year. However, under the<br />
assumptions of continued Chinese manufacturing<br />
growth <strong>and</strong> high-growth exports, this ratio grows to<br />
4.6 by the end of the long-term forecast (2022). In<br />
SSMR June 2004 11
Container <strong>and</strong> general cargo fleet, supply/dem<strong>and</strong>, ports<br />
that year, eastbound TEUs will amount to 27.8<br />
million, implying that U.S. West Coast ports will have<br />
to exp<strong>and</strong> considerably to h<strong>and</strong>le the influx.<br />
For the transatlantic trades the total trade will be 2.9<br />
million TEUs this year, with westbound (to United<br />
States) volumes about 1.6 times greater than<br />
eastbound volumes. While U.S. imports from<br />
Northern Europe will slow next year to 2.5 per cent,<br />
from this year's 3.6 per cent, partly in response to the<br />
weaker dollar, exports will grow faster than imports<br />
next year, also in response to the weaker dollar, which<br />
will help reduce the imbalance slightly.<br />
The reader is encouraged to view the transatlantic<br />
trade through the Global Trade Navigator, which<br />
permits the identification of individual European<br />
nation's trade with the United States, <strong>and</strong> which also<br />
has forecasts of Europe's trade with separate U.S.<br />
coastal ranges. 10<br />
Monthly market indicators at a glance<br />
Cargo upturns in container trades are also reflected in<br />
traffic statistics of leading world container ports as<br />
well as container freight rates.<br />
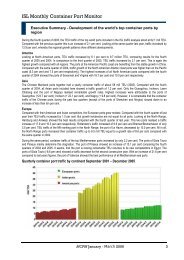
The new ISL “Monthly Container Port Monitor” shows<br />
the dynamic development of world container traffic.<br />
Monthly TEU figures up to April 2004 increased<br />
dramatically in the majority of hub ports in Asia,<br />
Europe <strong>and</strong> America.<br />
Container charter rates monitored by ISL recovered<br />
increasingly during 2003, but reaching a record high<br />
during the first half of 2004. Compare also the<br />
“Freight <strong>Market</strong>” section in this issue. After a decrease<br />
in the second half of 2003 also the German overall<br />
index of liner trade freight rates up to May 2004,<br />
reflects freight rate increases especially in Asian <strong>and</strong><br />
American trades11 . From January to April 2004 the<br />
overall index increased by 7 percent.<br />
The weighted Charter Rate Index from Howe Robinson<br />
increased more than 76 per cent during the year<br />
2003 <strong>and</strong> 38 per cent from the beginning of January<br />
to End of April 2004.<br />
The “Hamburg Index for Containership Time Charter<br />
Rates up to May 2004” showed ongoing rate<br />
improvements for the majority of size classes ranging<br />
from under 999 TEU up to 1999 TEU.<br />
10 The contribution is based on the World Trade Service published by Global<br />
Insight. Compare www.globalinsight.com<br />
11 Referring to the freight rates for seaborne trade to <strong>and</strong> from German<br />
North Sea ports as far as they are applicable to the conference<br />
regulated liner service.<br />
12 SSMR June 2004<br />
Fig. 10: Monthly port container traffic 2000-2004 of<br />
US ports (TEU - Index 2000=100) 12<br />
© ISL MCPM 2004<br />
Fig. 11: Monthly port container traffic 2000-2004 of<br />
European ports (TEU- Index 2000=100) 13<br />
© ISL MCPM 2004<br />
Fig. 12: Monthly port container traffic 2000-2004 of<br />
Asian ports (TEU- Index 2000=100) 14<br />
© ISL MCPM 2004<br />
12 US Pacific: Los Angeles, Long Beach, Oakl<strong>and</strong>, Seattle; US Atlantic: New<br />
York, Port of Virginia, Savannah <strong>and</strong> Charleston<br />
13 Northrange Ports: Rotterdam, Antwerp, Hamburg, <strong>and</strong> Bremen/Bremerhaven;<br />
Mediterranean: Gioia Tauro, Genoa, Valencia <strong>and</strong> Algeciras<br />
14 Far East ports: Hong Kong, Busan, Kaohsiung <strong>and</strong> Nagoya; Near <strong>and</strong><br />
Middle East ports: Dubai, Singapore <strong>and</strong> Laem Chabang
Container <strong>and</strong> general cargo fleet, supply/dem<strong>and</strong>, ports<br />
Fig. 13: Monthly charter rate development for<br />
selected size classes up to May 2004<br />
ISL based on Vereinigung Hamburger Schiffsmakler und<br />
Schiffsagenten e.V.<br />
Fig. 14: Monthly weighted charter rate index up to<br />
April 2004<br />
ISL based on Howe Robinson<br />
Future tonnage supply in container <strong>and</strong> general<br />
cargo shipping<br />
Decisive for the deployment in general cargo <strong>and</strong><br />
container shipping is moreover the development of<br />
future tonnage supply, namely the potential of<br />
demolitions <strong>and</strong> new orders.<br />
According to ISL findings, 49 container ships totalling<br />
1.0 mill dwt were broken-up during 2003. In terms of<br />
tonnage, this is equal to an increase of 11 per cent<br />
compared with results in 2002. Scrap c<strong>and</strong>idates in<br />
2003 were mainly container ships in size ranges up to<br />
999 TEU.<br />
Container ships were reported to be 25.5 years in<br />
service. The majority of these vessels were built in the<br />
seventies. The scrapping potential based on container<br />
fleet patterns as of January 1st, 2004 consists of 150<br />
container ships with 0.12 mill TEU.<br />
Fig. 15: Container fleet - quarterly development of<br />
new orders <strong>and</strong> broken-up tonnage 2000 –<br />
2004 (in dwt)<br />
ISL 2004<br />
During 2003, 445 container vessels with a capacity of<br />
1.9 mill TEU were contracted. This represents a new<br />
record high compared with previous years’ figures. At<br />
the beginning of 2004, the container ship order book<br />
(ships of 300 gt <strong>and</strong> over) stood at 588 ships with<br />
31.3 mill dwt <strong>and</strong> 6.4 mill TEU. At least 86 container<br />
ships on order have capacities of 8,000 TEU <strong>and</strong><br />
above. As in the previous years, the focus of the order<br />
activity has been on large ship units. In terms of<br />
tonnage, the order book of fully cellular container<br />
ships increased by 120 per cent compared with dwttonnage<br />
figures at the beginning of 2003. The order<br />
book represents a TEU-share of 43.1 per cent related<br />
to the existing container fleet (April 1 st , 2004).<br />
Fig. 16: General cargo fleet - quarterly development<br />
of new orders <strong>and</strong> broken-up tonnage 2000<br />
– 2004 (in dwt)<br />
ISL 2004<br />
Whereas the future tonnage supply <strong>and</strong> thus the<br />
supply/dem<strong>and</strong> balance will be determined by a large<br />
number of newbuildings, the situation is completely<br />
different in general cargo shipping. In 2003, 518<br />
general cargo ships with a total of 4.1 mill dwt were<br />
sold to breakers, which represents, in terms of<br />
SSMR June 2004 13
Container <strong>and</strong> general cargo fleet, supply/dem<strong>and</strong>, ports<br />
tonnage, an increase of 24.4 per cent compared with<br />
results in 2002. During 2003, 226 general cargo<br />
ships with 2.5 mill dwt were added to the order book<br />
(ships of 300 gt <strong>and</strong> over). Compared to the year<br />
2002, this represents, in terms of dwt, an increase of<br />
about 13 per cent. The total order book as of January<br />
1st , 2004 stood at 438 general cargo ships with 5.1<br />
mill dwt. Compared with last year's results, this<br />
represents an increase of 17.4 per cent.<br />
Looking at recent developments ISL records indicate<br />
that up to April 2004, 120 general cargo ships with a<br />
tonnage volume of 0.7 mill dwt <strong>and</strong> only six container<br />
ships with 0.1 mill dwt were reported to be broken-up.<br />
During the first quarter of 2004, new orders<br />
amounted to 85 general cargo ships with 0.7 mill dwt<br />
<strong>and</strong> 116 fully cellular container ships with 0.5 mill<br />
TEU <strong>and</strong> 6.3 mill dwt respectively.<br />
THE SHIPBUILDING INDUSTRY<br />
Order activities for general cargo <strong>and</strong> fully cellular<br />
container ships are an indicator for the “market<br />
climate”. As already pointed out, for both market<br />
segments ordering of new tonnage developed<br />
positively.<br />
Fig. 17: Container ships– Quarterly order book <strong>and</strong><br />
new orders 1998 - 2004<br />
ISL 2004<br />
At the beginning of 2004, the order book reached a<br />
level of of 18.8 mill cgt for container ships <strong>and</strong> 5.8<br />
mill cgt for general cargo ships. Compared with<br />
previous years' cgt figures, the order book for<br />
container ships strongly increased by 115 per cent,<br />
whereas the increase for general cargo ships stood at<br />
23.7 per cent. The order book at the beginning of<br />
2004 comprised 86 container ships in sizes of 8,000<br />
TEU <strong>and</strong> above totalling 5.1 mill cgt. These ships<br />
have a cgt share of 27.3 per cent on the total<br />
container order book.<br />
14 SSMR June 2004<br />
Fig. 18: General cargo ships– Quarterly order book<br />
<strong>and</strong> new orders 1998 - 2004<br />
ISL 2004<br />
As of January 1st , 2004, 58.0 per cent of the total<br />
general cargo tonnage, in terms of cgt, was<br />
attributable to Asian shipyards (January 1st, 2000:<br />
48.7 per cent). Their cgt market share for container<br />
ships stood at 86.7 per cent. Far Eastern yards<br />
increased their order book container tonnage by over<br />
200 per cent compared with figures at the beginning<br />
of 2000 which is equal to an average yearly growth of<br />
32.1 per cent. The order book ranking by country of<br />
build is led by Japan for general cargo ships <strong>and</strong> by<br />
South Korea for containerships. The latter is especially<br />
dominating the market for larger container ship units.<br />
Tab. 13: Container ships on order by country of<br />
build <strong>and</strong> TEU size class as of January 1st ,<br />
2004 (in 1,000 cgt)<br />
Country of build <br />
%-share<br />
4999 6999 7000 Total of total<br />
2,215 2,537 5,966 11,559 61.5<br />
174 1,205 679 2,297 12.2<br />
456 301 - 1,439 7.7<br />
- - - 1,065 5.7<br />
310 376 - 742 3.9<br />
550 - - 701 3.7<br />
198 - 274 980 5.2<br />
3,902 4,419 6,920 18,782 100.0<br />
682<br />
- 274<br />
2,296<br />
12.2<br />
The order book for AWES-yards stood at the<br />
beginning of 2004 at 1.9 mill cgt for container ships<br />
<strong>and</strong> 2.3 mill cgt for general cargo. AWES countries<br />
lost further market shares to Asian competitors. The<br />
cgt-shares for container ships fell from 17.7 per cent<br />
in 2000 to 12.2 per cent at the beginning of 2004,<br />
whereas market shares for general cargo ships<br />
climbed from 29.9 per cent (2000) to 32.9 per cent.
Container <strong>and</strong> general cargo fleet, supply/dem<strong>and</strong>, ports<br />
Looking at the first quarter 2004, order activities for<br />
container ships continued on a high level. 116 new<br />
orders with 3.7 mill cgt were placed. As of April 1st ,<br />
2004, the order book for container vessels stood at<br />
662 vessel with 21.5 mill cgt, an increase of over 14<br />
per cent compared with figures for January 2004.<br />
At the beginning of April 2004, the order book for<br />
general stood at 460 vessels with 5.8 mill cgt, all<br />
about the same level as in January 2004.<br />
WORLD PORT CONTAINER TRAFFIC<br />
The following analysis is focussing on the regional<br />
development patterns of world container ports15 Pages<br />
62-72<br />
.<br />
The total container traffic volume of the top container<br />
ports, with a container traffic of more than one mill<br />
TEU analysed here, reached 219.5 mill TEU in 2003<br />
<strong>and</strong> increased by 13 per cent compared with results in<br />
2002. Included in the 2003 analysis are 62 ports, of<br />
which 28 Asian ports, 17 European ports <strong>and</strong> 15<br />
American ports.<br />
In 2003, approx. 63 per cent of the world container<br />
traffic, in terms of TEU, were attributable to Asian<br />
ports, whereby the top 8 Chinese ports alone<br />
represent 25.9 per cent of the total container traffic.<br />
Europe had a share of 20.2 per cent of the world<br />
container port traffic <strong>and</strong> America 15.4 per cent.<br />
Tab. 14: Fastest growing <strong>and</strong> declining container<br />
ports 2002/2003<br />
Total TEU traffic annual % change<br />
2001 2002 2003 2001/2002 2002/2003<br />
Top growing ports<br />
Salalah 1.19 1.26 2.00 6.0 59.0<br />
Ningbo 1.21 1.86 2.75 53.3 47.8<br />
Shenzhen 5.08 7.61 10.65 50.0 39.9<br />
Tanjung Pelapas 2.05 2.66 3.49 29.8 31.1<br />
Shanghai<br />
Least growing ports<br />
6.34 8.62 11.28 36.0 30.9<br />
La Spezia 0.97 0.98 1.01 0.0 3.2<br />
Long Beach 4.46 4.53 4.66 1.4 2.9<br />
Kobe 2.01 2.01 2.06 0.1 2.5<br />
Tanjung Priok 2.48 2.70 2.76 9.0 2.1<br />
London 1.45 1.61 1.56 11.1 -3.6<br />
Source: ISL Port Data Base 2004<br />
© ISL Port Data Base 2004<br />
15 ISL provides detailed information on container traffic development of<br />
major world container ports. Information is based on the ISL port data<br />
base <strong>and</strong> a special inquiry. Comments on the presented tables <strong>and</strong><br />
completions of missing data <strong>and</strong> additional statistics will be much<br />
appreciated. A detailed description of the ISL port data base is included<br />
on the following pages. The 62 Ports presented in the statistical analysis<br />
represent, in terms of TEU, approx. two thirds of the total world container<br />
port traffic. Thus, figures are a basic indicator for maritime trade<br />
developments in 2002/2003. The monthly traffic figures are based on our<br />
new service, the ISL Monthly Container Port Monitor. See also:<br />
http://www.isl.org/products_services/<br />
The top Chinese mainl<strong>and</strong> container ports (with out<br />
Hong Kong) grew on average by more than 30 per<br />
cent yearly. Their annual container traffic summed up<br />
to 13.4 mill TEU in 1999 <strong>and</strong> 36.4 mill TEU in 2003<br />
respectively.<br />
Fig. 19: Major Chinese Container ports in 2003 (in<br />
1000 TEU)<br />
ISL 2004<br />
Based on information from Chinese port officials, the<br />
port of Shenzhen, vis-à-vis to Hong Kong at the<br />
mouth of the Pearl River, is expected to become the<br />
biggest Chinese mainl<strong>and</strong> port. The port reached a<br />
container traffic growth of nearly 40 per cent<br />
compared with 2002 <strong>and</strong> h<strong>and</strong>led more than 10 mill<br />
TEU in 2003 - just half a million TEU less than<br />
Shanghai. The average annual growth rate from<br />
1995 to 2003 of the port of Shenzhen is 37.4 per<br />
cent - the fastest growing Chinese port. As the<br />
following table shows, traffic figures for the first<br />
quarter of 2004 confirm this trend.<br />
Tab. 15: Traffic of top Far Eastern container ports<br />
during the 1st quarter of 2003 <strong>and</strong> 2004<br />
(in mill TEU, in %)<br />
Port Hong Kong Singapore Busan Shanghai Shenzhen<br />
1st q. 2003 4.69 4.25 2.54 2.42 2.10<br />
1st q. 2004 4.97 4.84 2.61 3.10 2.79<br />
% change 5.8 13.8 2.9 27.7 33.0<br />
ISL Monthly Container Port Monitor 2004; figures in mill TEU<br />
In 2003, container traffic of the two top ranking world<br />
ports increased 6.8 per cent (Hong Kong) <strong>and</strong> 8.7 per<br />
cent (Singapore). The third ranking port, now<br />
Shanghai, grew by 30.9 per cent up to a traffic<br />
volume of 11.3 mill TEU in 2003.<br />
Hong Kong asserted its top position for the fifth year<br />
in succession. With container traffic volumes of 20.5<br />
mill TEU <strong>and</strong> 18.4 mill TEU respectively. Hong Kong<br />
<strong>and</strong> Singapore are by far the largest container ports in<br />
the world. However, the smaller transhipment hubs in<br />
the region consistently increased traffic <strong>and</strong> thus their<br />
market shares. During the last year, e.g. Port Tanjung<br />
SSMR June 2004 15
Container <strong>and</strong> general cargo fleet, supply/dem<strong>and</strong>, ports<br />
Pelapas (3.5 mill TEU, up 31.1 per cent) as well as<br />
Laem Chabang (3.2 mill TEU, up 19.7 per cent) were<br />
the most dynamic Far Eastern ports outside of China.<br />
Fig. 20: Quarterly container traffic of Hong Kong,<br />
Busan <strong>and</strong> Kaohsiung from January 1999 to<br />
March 2004 (in 1000 TEU)<br />
© ISL MCPM 2004<br />
Hong Kong’s container traffic shows a relatively low<br />
increase compared with other regional ports. This<br />
results from competitive influences mainly of Chinese<br />
mainl<strong>and</strong> ports.<br />
Japanese container ports, except Tokyo (increase of<br />
14.9 per cent), show only moderate growth<br />
tendencies. The three top ranking Japanese ports,<br />
included in the ISL analysis, topped their last year’s<br />
result by almost 0.7 mill TEU, equal to an increase of<br />
9.9 per cent compared with 2003.<br />
The major transhipment ports in the Near East are<br />
Dubai Ports, Khor Fakkan in the UAE, Salalah in<br />
Oman <strong>and</strong> Jeddah in Saudi Arabia. According to the<br />
Dubai Ports Authority, the increase mainly results from<br />
the increasing Chinese traffic. Dubai showed a<br />
container traffic growth of 22.8 per cent compared<br />
with 2002 reaching a total traffic volume of 5.15 mill<br />
TEU <strong>and</strong> Salalah, the port with the largest service<br />
gantries in the world, showed an enormous plus of 59<br />
per cent now h<strong>and</strong>ling two mill TEU.<br />
All major container ports in the US, except Long<br />
Beach, showed substantial gains. This is true for<br />
Tacoma (plus 18.2 per cent, in 2003 1.74 mill TEU),<br />
Los Angeles (plus 17.6 per cent, 7.2 mill TEU in<br />
2003), Savannah (plus 14.6 per cent, in 2003, 1.52<br />
mill TEU), <strong>and</strong> the port of Virginia (plus 14.5 per cent<br />
1.65 mill TEU in 2003).<br />
In 2003, Rotterdam, the top European container port,<br />
increased it’s traffic by 8.9 per cent. The port now is<br />
ranked on position 8 in the world container port<br />
league. The port once again lost market shares to<br />
Antwerp <strong>and</strong> Hamburg, which increased their<br />
combined market share considerably. Once again the<br />
16 SSMR June 2004<br />
ports of Hamburg <strong>and</strong> Antwerp outperformed the<br />
other ports in the range. They achieved TEU increases<br />
of 14.2 per cent (Hamburg) <strong>and</strong> 13.3 per cent<br />
(Antwerp) respectively. Taken together, this represents<br />
an increase of 1.4 mill TEU, whereas Rotterdam alone<br />
gained only about 580,000 TEU.<br />
Fig. 21: Monthly container traffic of major North<br />
Range ports 1999-2004 (Quarterly averages<br />
of TEU - Index 2000=100)<br />
© ISL MCPM 2004<br />
Container traffic of the top Mediterranean ports<br />
increased by 9.2 per cent. This growth is mainly<br />
determined by Algeciras, Piraeus <strong>and</strong> Barcelona,<br />
showing an increase of 15 per cent (Algeciras up to<br />
2.6 mill TEU in 2003), 14.2 per cent (Piraeus up to<br />
1.6 mill TEU in 2003) <strong>and</strong> 13.4 per cent (Barcelona<br />
up to 1.6 mill TEU in 2003). Competition between the<br />
large transhipment hubs is extremely strong.<br />
Fig. 22: Container traffic at major European ports by<br />
loading/unloading regions 2003<br />
ISL 2004<br />
The analysis of container port traffic by continent<br />
shows differences of ports with view to their trade<br />
relations. This is especially true for European North<br />
Sea ports <strong>and</strong> Far Eastern ports.
Container <strong>and</strong> general cargo fleet, supply/dem<strong>and</strong>, ports<br />
Tab. 16: Average annual growth of selected<br />
container ports by geographical distribution<br />
1998-2003 (in %)<br />
Port Unit Africa America Asia Europe Oceania Total<br />
Total<br />
traffic<br />
Asia<br />
Hong Kong TEU 9.7 2.0 9.7 0.5 7.2 6.6 16532<br />
Busan TEU 7.3 11.8 15.6 8.3 13.7 12.9 10247<br />
Yokohama TEU 17.7 -0.3 5.7 -1.3 0.2 23.2 5006<br />
Keelung TEU 4.9 43.2 18.3 -13.3 3.8 16.8 1448<br />
Kaohsiung<br />
Europe<br />
MT 4.5 10.5 4.4 11.7 -3.0 6.8 28<br />
Rotterdam TEU 1.2 5.3 3.6 2.0 8.2 3.3 7107<br />
Hamburg TEU -2.1 11.8 13.7 25.7 15.1 13.1 6140<br />
Antwerp TEU 6.2 5.9 17.7 11.1 -3.6 10.8 5445<br />
Bremenhaven TEU 11.1 5.6 12.8 12.0 0.0 9.7 3190<br />
Le Havre TEU 12.0 6.5 10.3 11.2 16.2 9.5 1985<br />
Genoa TEU<br />
America<br />
-0.4 10.6 9.5 2.6 25.6 6.8 1606<br />
Oakl<strong>and</strong> TEU ... 11.6 1.9 -3.3 19.6 3.6 1920<br />
Vancouver MT 18.9 -51.0 9.5 5.6 -58.9 8.8 13<br />
Montreal MT 5.8 0.7 21.2 1.8 0.0 2.1 9<br />
Houston<br />
Oceania<br />
MT 4.8 63.1 27.3 -3.4 -12.5 -3.1 907<br />
Melbourne TEU -0.2 3.0 5.9 2.8 6.7 5.4 1596<br />
Sydney Ports TEU 2.8 10.5 4.0 1.7 26.2 8.8 1423<br />
Units in 1000, tonnage in mill.<br />
(a) Regional spreading of container traffic excludes empty containers, total<br />
traffic including empties stood at 20,350 mill TEU in 2003.<br />
© ISL Port Data Base 2004<br />
Bremen <strong>and</strong> Antwerp have strong links to the<br />
Americas, Hamburg <strong>and</strong> Rotterdam are more related<br />
to Asia. But the traffic analysis underlines that ports<br />
gained ground in trades which are not their core<br />
domain. For example Bremen Ports <strong>and</strong> Antwerp<br />
show highest growth rates in Asian trades <strong>and</strong><br />
Hamburg in American <strong>and</strong> intra-European trades.<br />
Rotterdam lost market shares of the European-wide<br />
traffic to Hamburg, Antwerp <strong>and</strong><br />
Bremen/Bremerhaven. This is especially true for<br />
transhipment potentials related to the Baltic sea.<br />
Fig. 23: Container traffic at major Asian ports by<br />
loading/unloading regions 2003<br />
ISL 2004<br />
Figures indicate that the share of intra-regional trade<br />
is very high in the large Far Eastern ports - a typical<br />
feature of major transhipment hubs.<br />
Fig. 24: Monthly container traffic of major North<br />
American Pacific ports 1999-2004<br />
(Quarterly averages of TEU - Index<br />
2000=100)<br />
© ISL MCPM 2004<br />
North American West coast ports have strong<br />
relationships to Far Eastern ports. Their traffic is to<br />
more than 90 per cent distributed to <strong>and</strong> from the Far<br />
East. This interrelation is underlined by the analysis of<br />
monthly container traffic of North American West<br />
coast ports.<br />
Fig. 25: Container traffic at major American ports by<br />
loading/unloading regions 2003<br />
© ISL Port Data Base 2004<br />
Christel Heideloff, Senior Economist/Editor<br />
Dieter Stockmann, Editorial Assistant<br />
Reinhard Monden, Economist<br />
SSMR June 2004 17
ISL – SEABASE – New literature on container market developments<br />
European Community Shipowners' Associations:<br />
The literature database ISL Seabase…<br />
…serves the public with more than 85,000 literature<br />
citations <strong>and</strong> is an important knowledge pool for the<br />
industry <strong>and</strong> market research.<br />
We inform fast, comprehensively, <strong>and</strong> professionally<br />
about markets, branches <strong>and</strong> companies in the areas<br />
shipping, shipbuilding, ports, traffic, transport <strong>and</strong><br />
logistics <strong>and</strong> trade as well. Sources are national in<br />
international journals, reference books, research reports<br />
<strong>and</strong> “grey literature”.<br />
Song, D.W.; Yeo, K.T.:<br />
A competitive analysis of Chinese container ports using the<br />
Analytic Hierarchy Process<br />
Maritime Economics <strong>and</strong> Logistics (6) 2004, issue 1, pages<br />
34-52<br />
Ref.: This article identifies the competitiveness of container ports in<br />
China, including Hong Kong, using the framework of the Analytic<br />
Hierarchy Process (AHP) <strong>and</strong> provides managerial <strong>and</strong> strategic<br />
implications. The findings of the empirical analysis confirm the<br />
general perception that Hong Kong is the most competitive port in<br />
China, followed by Shanghai <strong>and</strong> Yantian. The research results show<br />
that "location" still plays the most significant role in the evaluation<br />
process of a port's competitiveness.<br />
Tharakan, J.:<br />
Box sector awaits policy shift<br />
Fairplay (350) 2004, issue 17.06., pages 20-21<br />
Ref.: India's container sector is keeping busy while the country's new<br />
government is considering major changes in monopoly curbs at the<br />
nation's container terminals. The Directorate General-<strong>Shipping</strong> is<br />
weighing a proposal to allow a private operator to develop <strong>and</strong> run<br />
two container terminals at the same port. Operators are now limited<br />
to one terminal. P&O Ports India, which is wholly owned by<br />
international terminal giant P&O <strong>and</strong> operates India's largest<br />
container terminal, Nhava Sheva International Container Terminal<br />
(NSICT) at Jawharlal Nehru Port Trust (JNPT), is by far India's largest<br />
port company in the private sector. The bidding for the third terminal<br />
at JNPT attracted at least half a dozen international players <strong>and</strong> lines.<br />
Among them were Hamburg Port, CSX World Terminals, CMA CGM<br />
<strong>and</strong> Evergreen. The project was delayed on account of the general<br />
elections in India. A table lists India's port container traffic for 2003-<br />
2004.<br />
Wong Joon San:<br />
Container cultivation<br />
Asian Maritime Business 2004, issue 1.6, pages 28-32<br />
Ref.: This article considers the growth of container ports in the<br />
ASEAN. Since the 1997 Asian financial crisis, container traffic passing<br />
through the ASEAN ports has grown at an average of more than 8<br />
per cent a year. Since 1998, ASEAN has produced five new prime<br />
container ports, each h<strong>and</strong>ling more than 2 mill. TEU a year. These<br />
ports are: Port Klang, Malaysia; Tanjung Priok, Indonesia; Laem<br />
Chabang, Thail<strong>and</strong>; Manila, Philippines; <strong>and</strong> Tanjung Pelepas,<br />
Malaysia. This growth trend is expected to continue with secondary<br />
ports such as Surabaya in Indonesia, Cebu in the Philippines <strong>and</strong><br />
Penang in Malaysia, which are expected to h<strong>and</strong>le more than 1 mill.<br />
TEU annually. Container port developments in each of the ASEAN<br />
countries are reviewed in separate chapters. In the regional shipping<br />
scene, feeder container lines have also been exp<strong>and</strong>ing their<br />
business volumes. According to an ASEAN maritime transport<br />
development study of 2002, which covered the period 2003-08,<br />
unitisation services, such as containerisation <strong>and</strong> palletisation, have<br />
18 SSMR June 2004<br />
been steadily increased at ASEAN ports. Multimodal transport is still<br />
at an infant stage. But ASEAN has already started promoting<br />
multimodal transport <strong>and</strong> full development of regional multimodal<br />
transport operation can be expected in the next three to four years.<br />
Lowry, N.:<br />
Costamare 1974-2004. 30 years in shipping<br />
Lloyd's List 2004, issue SU Jun., pages 1-64<br />
Ref.: Company profile of Greece's container operator Costamare<br />
<strong>Shipping</strong>. This special supplement provides an in-depth look at<br />
Costamare's fleet, history <strong>and</strong> operations. Today, the Athens-based<br />
group has an all-cellular fleet of 55 ships in service <strong>and</strong> on order,<br />
which makes it arguably the largest independent company of its type<br />
worldwide, with more capacity than many of the well-known br<strong>and</strong>ed<br />
container services.<br />
Braam, T.B. (Ed.):<br />
Dynamar: Dyna liners trades review 2004 (1 January 2003<br />
to 31 December 2003)<br />
Alkmaar : Dynamar, 2004.- 52 pages<br />
Ref.: This annual publication reviews trends <strong>and</strong> events which<br />
dominated the liner-shipping scene in 2003 <strong>and</strong> presents overviews,<br />
statistics, summaries on container shipping, top 20 operators,<br />
ports/terminals, container ships, etc. Although liner shipping faced<br />
some severe setbacks in 2003, carriers saw their financial results<br />
substantially improve during the year. Main developments were: The<br />
outbreak of SARS affecting China especially; the Iraq conflict; a<br />
further rise of outsourcing; unprecedented increasing exports from<br />
the Far East, for China in particular; further rising imbalances; nearly<br />
doubling of charter rates; continued high bunker prices; a<br />
persevering depreciation of the US Dollar (versus the Euro); an<br />
avalanche of orders for 8,000+ container vessels; increasing<br />
discrepancy between the growth of the world trade <strong>and</strong> container<br />
carryings on some of the main trade routes.<br />
Hussain, T.:<br />
Emirates boxes tower over the Gulf<br />
Fairplay (350) 2004, issue 08.01., pages 18-27<br />
Ref.: This feature story reviews the year 2003 as well as current<br />
developments in the United Arab Emirates (UAE). Three years of<br />
sustained oil prives have driven dem<strong>and</strong> in the oil-rich Middle East<br />
Gulf to new highs, despite the conflict in Iraq. Container throughput<br />
at UAE's transhipment hubs is booming <strong>and</strong> has grown by more than<br />
20% in 2003. UAE's major transhipment hubs, Dubai <strong>and</strong> Sharjah,<br />
enjoy a steady growth in container trades. China is the largest source<br />
of containers discharged at Dubai, with 282,000 TEU of the 4.23M<br />
TEU h<strong>and</strong>led. The unpredictable surge in container volumes over the<br />
past three years has exposed an imminent capacity shortfall. That is<br />
in stark contrast to regional competitor Salalah, which already<br />
possesses ample berth space <strong>and</strong> the largest service gantries in the<br />
world, <strong>and</strong> is well placed to attract <strong>and</strong> service the next generation of<br />
container ships. Despite the Emirates' emergence as the hub for the<br />
Middle East, its judiciary remains an anathema for shipowners<br />
seeking to resolve disputes. A major reform is urgently needed if the<br />
legal system is to keep pace with rampant commercial development.<br />
UAE bulker operators see rising volumes <strong>and</strong> are investing heavily in<br />
new H<strong>and</strong>ymax <strong>and</strong> Panamax tonnage. The war in Iraq <strong>and</strong> strong<br />
oil prices meant that tanker owners were reluctant to drydock their<br />
vessels at UAE repair yards for most of 2003.<br />
Witthöft, H.J.:<br />
Großcontainerschiffe. Die Entwicklung aus der Sicht des<br />
Germanischen Lloyd<br />
Marine Forum (79) 2004, issue 5, pages 40-41<br />
Ref.: Im Jahr 2003 erfolgte der Durchbruch zum 8.000-TEU-<br />
Containerschiff, das sich zum neuen St<strong>and</strong>ard bei den<br />
Großcontainerschiffen entwickelt. Weltweit gab es zum Jahresende<br />
2003 Bauaufträge <strong>für</strong> 86 Einheiten dieser Größe, von denen mehr<br />
als die Hälfte durch den Germanischen Lloyd (GL) klassifiziert<br />
werden. Der GL unterstützt diese führende Klasse durch sein
ISL – SEABASE – New literature on container market developments<br />
spezifisches technischen Know-how und seine Erfahrungen aus dem<br />
Schiffsbetrieb. Die Entwicklung der Großcontainerschiffe wird im<br />
Beitrag aus der Sicht des GL dargestellt, u.a. optimierte<br />
Schiffsproportionen, Ladungssicherheit, neue Methoden der<br />
Festigkeitsbewertung, Motor und Propeller, Brückendesign.<br />
Haig-Brown, A.:<br />
Growing the ships <strong>and</strong> the fleet<br />
Motor Ship (85) 2004, issue Jun., pages 20-21<br />
Ref.: Vancouver-based Seaspan Container Lines (SCL) has placed<br />
orders for five 4,250 TEU ships for delivery in 2005, five 8,100 TEU<br />
ships for delivery in 2004, <strong>and</strong> eight 9,600 TEU ships for delivery in<br />
2006/2007. All of these ships will go under charter to China<br />
<strong>Shipping</strong> Lines. Seaspan also has on order nine 4,250 TEU ships for<br />
delivery in 2006/2007 with charter arrangements in place for CP<br />
Ships. When delivered, these ships will catapult SCL into the major<br />
league of container ship owners. Samsung Heavy Industries in Korea<br />
is recognised as world leaders in the building of container ships,<br />
there is little doubt that when ships with larger than 10,000 TEU<br />
capacity will be ordered, they will be built in Korea. But they will be<br />
built with significantly different technologies. The 9,600 TEU ships<br />
currently on order have grown within the same technological envelop<br />
as that developed for the 8,100 TEU ships. According to Seaspan<br />
Container Lines' Director, Graham Porter, the main limiting factors in<br />
building container ships over 10,000 TEU is the thickness of the steel<br />
plate <strong>and</strong> the existing welding techniques. The specifications of<br />
Seaspan's 10,000 TEU container vessel are outlined in this<br />
contribution. The growth in ship size involves two related factors, the<br />
hull form <strong>and</strong> the propulsion package. Some speculation on<br />
container ships larger than 10,000 TEUs predicts twin-engine<br />
configurations to drive the larger ship. While the container trade is<br />
growing marginally, the efficiencies of the larger ships will allow them<br />
to compete effectively on the heavier-volume cargo routes. With most<br />
major ports installing container cranes that will reach to 20 or even<br />
22 containers stowed across a ship, the beam stacking of containers<br />
is not an issue. Whether the market dem<strong>and</strong>s will be there for this<br />
larger tonnage as it comes into service over the next few years is less<br />
predictable.<br />
Gardiner, P.:<br />
Hamburg Süd: building in Asia<br />
Lloyd's <strong>Shipping</strong> Economist (26) 2004, issue 1, pages 28-31<br />
Ref.: German liner company Hamburg Sud has exp<strong>and</strong>ed its global<br />
network of liner services <strong>and</strong> has established itself as a leading<br />
player in a number of trades. In this article the author examines the<br />
path of expansion, how the company is currently positioned, its<br />
services <strong>and</strong> its probable strategy for the coming years. The group is<br />
involved in several areas of shipping, grouped in liner <strong>and</strong> tramp.<br />
The main areas of operation are the north-south markets. Despite its<br />
early-90s acquisitions, Hamburg Süd was still a relatively small<br />
player. In recent years, liner acquisitions have lifted the number of<br />
containerships operated by the Hamburg Süd group to 71, compared<br />
with 46 at the end of 2002. The containership fleet with brief details<br />
is presented in a table. The purchase of Kien Hung <strong>and</strong> Ellermann<br />
should lift the group's annual carryings to around 1.2m in 2004. The<br />
operational environment for Hamburg Süd is undeniable a difficult<br />
one, because of the ups <strong>and</strong> downs of the north-south markets. The<br />
most likely strategy of the group is to concentrate on growth in Asia,<br />
while retaining its long-held strategy of north-south specialisation.<br />
Wen Chang Huang, B.:<br />
Hinged containership design concept<br />
Motor Ship (85) 2004, issue Jun., pages 26-27<br />
Ref.: The concept of building a ship as two or more independent ship<br />
sections joined together by means of a hinge has never been fully<br />
explored or tried out. A ship's engineer from Taiwan, Bill Wen Chang<br />
Huang, claims to have solved the problem by incorporating<br />
improvements to existing US patents <strong>and</strong> has now patented his ideas<br />
with the United States Patent. This article outlines the hinged<br />
containership design concept, which could be the answer for the ultra<br />
large container ship. The principal objective of the invention is to<br />
provide a novel ship design where the ship is constructed in at least<br />
two separate ship bodies linked to each other by means of a huge<br />
horizontally installed hinge. Another objective of the invention is to<br />
enable the ship sections to be readily attached or detached from one<br />
another so that when approaching a small harbour or quay, the<br />
hinged ship can be tanken apart thus facilitating berthing. If<br />
compared with conventional vessels of the same structural strength,<br />
the hinged ship can be made larger which means ship holds become<br />
larger, less engine power <strong>and</strong> smaller propellers are needed<br />
consequently resulting in less fuel as well as material cost. Lloyd's<br />
Register (LR) has been asked for their expert comments <strong>and</strong>, based<br />
on a cursory examination, LR is of a general opinion that, on the<br />
whole, the hinged containership concept appears to be a feasible<br />
design. One of the crucial issues would be the strength <strong>and</strong><br />
construction of the hinge.<br />
Power, T.:<br />
How to manage liner costs<br />
Lloyd's <strong>Shipping</strong> Economist (26) 2004, issue 1, pages 22-24<br />
Ref.: Liner companies have had to place increasing emphasis on<br />
controlling costs to enhance profit margins. The author reports on the<br />
strategies lines have adopted to achieve this <strong>and</strong> how successful they<br />
have been. At present container costs are under pressure as never<br />
before. Approximately 40 per cent of costs relate to the positioning of<br />
the empty container. Liner operators can have a very significant<br />
impact on their costs by careful selection of cargo flows. A table<br />
presents costs for movement of a 40' container from Shanghai to<br />
Manchester. The development of the Internet offers cost savings for<br />
liner operators. Web portals like CargoSmart, GTN <strong>and</strong> INTTRA<br />
provide the customer with a single platform through which he can<br />
interact with the liner company.<br />
Gardiner, P.:<br />
North-south trades: cost pressures soar<br />
Lloyd's <strong>Shipping</strong> Economist (26) 2004, issue 5, pages 12-15<br />
Ref.: The north-south trades covers routes linking Europe, Asia <strong>and</strong><br />
North America to Australia <strong>and</strong> New Zeal<strong>and</strong>, sub-Saharan Africa,<br />
South America, Central America <strong>and</strong> the Caribbean. In general<br />
terms, north-south volumes have been growing. The expansion of<br />
north-south liner trades is being threatened by the soaring costs of<br />
chartering vessels <strong>and</strong> dealing with trade imbalance. The author<br />
analyses recent trends on the different routes <strong>and</strong> how operators are<br />
responding to the challenges. The most notable trend is the growing<br />
share of multi-trade operations, which link more than two trading<br />
areas <strong>and</strong> include many configurations. The main rationale behind<br />
the operational changes has been to reduce costs, <strong>and</strong> this has<br />
become a crucial problem as costs have spiralled. For operators<br />
rising charter <strong>and</strong> repositioning costs are causing some difficulties.<br />
The increase in the number of ships deployed on north-south routes<br />
in 2003 was very slow, crawling up from 616 to 625 ships. Charter<br />
rates are extremely important to this trade as 62 per cent of ships in<br />
north-south operation are charterd in. A table presents containership<br />
deployment by carrier group as of 1 January 2004.<br />
Koch, T.; Soergel, J.:<br />
The Container Terminal Altenwerder<br />
Ports <strong>and</strong> Harbors (49) 2004, issue 2, pages 18-21<br />
Ref.: In autumn 2002, the Container Terminal Altenwerder (CTA)<br />
started its operation. Owned <strong>and</strong> operated by HHLA, the new facility<br />
is regarded as one of the most modern <strong>and</strong> innovative container<br />
terminals in the world. 2003, in its first full year of operation, CTA<br />
has reached a throughput of nearly 900.000 TEU. Final annual<br />
capacity after completion of phase II will be 1.9 mill. TEU in 2004.<br />
The successful realisation of CTA has proven that by use of<br />
automation in combination with intelligent steering <strong>and</strong> terminal<br />
logistics systems, efficiency in h<strong>and</strong>ling <strong>and</strong> at the same time cost<br />
reduction can be achieved.<br />
SSMR June 2004 19
ISL – SEABASE – New literature on container market developments<br />
Drewry <strong>Shipping</strong> Consultants:<br />
Annual review of global container terminal operators<br />
London : Drewry <strong>Shipping</strong> Consultants, 2003.- 89 pages<br />
Ref.: Analysis of the global container terminal operators. Private<br />
sector participation has increased over the past decade as a result of<br />
the privatisation of existing facilities <strong>and</strong> the utilisation of private<br />
finance to construct new facilities. Over half of the world's container<br />
terminal capacity is now managed by a small number of companies<br />
that can be defined as global container terminal operators. These<br />
companies, which by definition have operations in more than one<br />
world region, h<strong>and</strong>led an estimated 160 mill. TEU in 2002, over 58<br />
per cent of total world container port throughput. The ten leading<br />
container terminal operators are Hutchinson Port Holdings (HPH),<br />
PSA Corporation, APM Terminals, P&O Ports, Eurogate, Evergreen<br />
Marine Corporation, Dubai Ports Authority (DPA), Cosco, Hanjin<br />
<strong>Shipping</strong>, <strong>and</strong> SSA Marine. Drewry's capacity forecasts show that the<br />
global operators' share of world container terminal capacity will<br />
increase at an average 5.6 per cent per year between 2002 <strong>and</strong><br />
2008. Contents of this study: 1) Global container terminal industry<br />
structure. 2) Leading operators' league tables (rankings). 3) Analysis<br />
of leading operators. 4) Operator analysis by region.<br />
Ocean <strong>Shipping</strong> Consultants:<br />
Containerisation in the Americas to 2015<br />
Chertsey/Surrey : Ocean <strong>Shipping</strong> Consultants, 2003.- 170<br />
pages<br />
Ref.: This study analyses the evolution of regional container h<strong>and</strong>ling<br />
dem<strong>and</strong> by port <strong>and</strong> assesses current developments in the Americas.<br />
The Americas have seen a 2.5-fold increase in containerport dem<strong>and</strong><br />
since 1990, <strong>and</strong> exp<strong>and</strong>ed even during the economic downturn in<br />
2002. Dem<strong>and</strong> has been boosted by both regionalisation, the<br />
integration of trading patterns within the Americas, <strong>and</strong> globalisation,<br />
which is progressively integrating all markets with Asia by means of<br />
deepsea links <strong>and</strong> transshipments. North American containerport<br />
dem<strong>and</strong> has more than doubled over the period, with particularly<br />
strong growth experienced in the Far East-North America trades,<br />
especially with regard to China. Growth has been even more rapid in<br />
the developing markets of Latin America <strong>and</strong> the wider Caribbean.<br />
Future dem<strong>and</strong> in the Americas is forecast to 2015 by region <strong>and</strong><br />
port range. Contents of this study: 1) Introduction. 2) Driving forces<br />
<strong>and</strong> strategic issues. 3) Overview of markets <strong>and</strong> forecasts. 4) The<br />
North American containerport market. 5) The Caribbean <strong>and</strong> Central<br />
American containerport market. 6) The South American containerport<br />
market. 7) Container shipping trends in the Americas. 8)<br />
Containerport productivity in the Americas. 9) North American<br />
intermodalism.<br />
Foxcroft, A. (Ed.); Boyes, J.R. (Ed.); Hennessey, M. (Ed.):<br />
Containerisation International:<br />
<strong>Market</strong> analysis. World container census 2003<br />
London : Containerisation International, 2003.- 56 pages<br />
Ref.: Annual analysis of world container fleet with regard to: fleet<br />
profile, ownership profile, leased fleet, maritime dry freight fleet<br />
profile, maritime reefer fleet profile, regional fleet profile, fleet growth<br />
For further information concerning ISL-Seabase <strong>and</strong><br />
ISL Information Centre/Library please contact<br />
Ms Ogiolda or Ms Fegbeitel<br />
by Phone: + 49-421 22096-44/-46<br />
or by E-mail: library@isl.org<br />
20 SSMR June 2004<br />
review. The census confirms that there were almost 16 mill. TEU<br />
owned <strong>and</strong> leased worldwide by mid-2002, comprising almost 15.2<br />
mill. TEU of maritime build <strong>and</strong> over 775,000 TEU of region-specific<br />
or domestic container types, despite achieving its slowest rate of<br />
annualised growth in almost a decade by just 4.5 per cent. Global<br />
box inventories numbered over 10.5 mill. units at mid-2002 <strong>and</strong> were<br />
valuated at around US$32.2 bill. The total leased container fleet<br />
amounted to 7.2 mill. TEU at mid-2002. Despite the recent changes<br />
affecting the global box building sector, annualised global production<br />
has remained remarkably stable, averaging 1.4-1.6 mill. TEU, since<br />
the mid-1990s. However, it is imminently forecast to increase,<br />
because of greater replacement <strong>and</strong> the need to service the<br />
expansion of an ever-larger fleet size.<br />
Marconsult:<br />
Performances of container terminals. Report 2003<br />
Genoa : Marconsult, 2003.- 66, annex pages<br />
Ref.: Report on container terminal productivity. Update of the<br />
previous report 2000. The objective is to establish some comparative<br />
assessment criteria for container terminals. This report examines <strong>and</strong><br />
evaluates the infrastructural, structural <strong>and</strong> organisational data <strong>and</strong><br />
the traffic volumes of 34 European container terminals. In addition, it<br />
also considers some non-European terminals that may be regarded<br />
as benchmarks. Annex 1 contains terminals' synthetic cards. Annex 2<br />
provides a detailed description of the various institutional set-ups of<br />
the ports. Annex 3 explains the methods used.<br />
Visser, D. (Ed.):<br />
Dynamar: Top 25 container liner operators<br />
Alkmaar : Dynamar, 2003.- 135 pages<br />
Ref.: This publication provides an extensive overview of the world's<br />
largest container shipping companies. Besides a ranking profile of<br />
the top 25 liner operators it provides details of their order book,<br />
container fleet size as well as full container carryings. The report is<br />
rounded off with a listing of alliances, consortia <strong>and</strong> joint services.<br />
Main findings of the study are: the top 25 liner operators control<br />
nearly 80 per cent of the world's total TEU capacity; have a share of<br />
more than 75 per cent of total chartered fleet; carry more than 80<br />
per cent of all full containers lifted worldwide; twelve of the top 25<br />
operators co-operate in the three large East-West Alliances; the three<br />
large East-West Alliances deploy 27 per cent of the world's total<br />
cellular capacity. The main body of this study provides corporate<br />
profiles of each carrier (<strong>and</strong> each of their operating subsidiaries) in<br />
alphabetical order.<br />
Dynamar: Top 31-60 liner operators trading profiles<br />
Alkmaar : Dynamar, 2003.- 103 pages<br />
Ref.: This publication provides an extensive overview of the world's<br />
container shipping companies. Besides a ranking profile of the 31-60<br />
liner operators in terms of TEU capacity as well as details of their<br />
order book, container fleet size <strong>and</strong> full container carryings it<br />
provides corporate profiles of each carrier in alphabetical order. The<br />
report is rounded off with a listing of alliances, consortia <strong>and</strong> joint<br />
services, port <strong>and</strong> trade statistics.<br />
The above is a small sample of literature concerning the<br />
topics of this issue. If you want to see the wide range of<br />
publications please use also our on-line search form at:<br />
http://www.isl.org/library<br />
You miss your publication in this? Please contact our<br />
team
ISL <strong>Market</strong> <strong>Review</strong> 2004 - merchant fleet data<br />
Fleet Data Date Unit % change over<br />
2003 2004 same<br />
Apr. July Oct. Jan. April prev. period<br />
period prev. year<br />
Total world merchant fleet<br />
- 300 gt <strong>and</strong> over -<br />
1st 1000 dwt<br />
Total 827483 836231 834505 840355 853804 1.6 3.2<br />
Oil tankers 312979 317101 314534 317827 324136 2.0 3.6<br />
Chemical tankers 8412 8544 8634 8791 8875 1.0 5.5<br />
Liquid gas tankers 19843 20065 20443 20835 21478 3.1 8.2<br />
Bulk carriers 286167 288427 288704 289510 294032 1.6 2.7<br />
OBO carriers 12504 12366 12168 12107 12031 -0.6 -3.8<br />
Container ships 85312 87685 88167 90214 91726 1.7 7.5<br />
General cargo ships<br />
of which<br />
96430 96164 95969 95187 95601 0.4 -0.9<br />
Single-deck ships 42736 42933 43144 42858 43264 0.9 1.2<br />
Multi-deck ships 28588 28139 27797 27326 27152 -0.6 -5.0<br />
Reefer ships 7071 6827 6788 6758 6844 1.3 -3.2<br />
Special ships 9859 10046 10004 10075 10070 -0.0 2.1<br />
Ro-Ro cargo ships 8176 8219 8237 8171 8271 1.2 1.2<br />
Passenger ships 5836 5879 5887 5884 5925 0.7 1.5<br />
Additions to fleet during 1000 dwt<br />
- 300 gt <strong>and</strong> over - the<br />
prev. quarter<br />
Total 16053 15661 9169 13605 17437 28.2 8.6<br />
Oil tankers 10050 8886 5003 8117 8842 8.9 -12.0<br />
Chemical tankers 174 197 179 181 209 15.2 19.8<br />
Liquid gas tankers 411 326 468 492 771 56.5 87.6<br />
Bulk carriers 3234 3138 2088 2343 5395 130.3 66.8<br />
OBO carriers - 121 - 120 - ... ...<br />
Container ships 1705 2472 1035 1943 1537 -20.9 -9.8<br />
General cargo ships<br />
of which<br />
451 408 370 371 624 68.3 38.5<br />
Single-deck ships 297 319 279 161 352 119.1 18.3<br />
Multi-deck ships 8 7 24 10 88 746.3 1021.2<br />
Reefer ships - 5 6 3 16 437.4 ...<br />
Special ships 63 21 1 85 26 - -57.7<br />
Ro-Ro cargo ships 83 56 61 112 141 26.2 70.7<br />
Passenger ships 29 111 26 38 59 56.7 104.0<br />
Note: Information on newbuildings entering the merchant fleet have in some cases time lacks. Thus, "additions to fleet" include ships completed during the last<br />
two years, but entering the fleet during the quarter under review.<br />
Broken-up tonnage during 1000 dwt<br />
- 300 gt <strong>and</strong> over - the<br />
prev. quarter<br />
Total<br />
Tankers<br />
7382<br />
4482<br />
8158<br />
4347<br />
10279<br />
7032<br />
6856<br />
4874<br />
6011<br />
4191<br />
-12.3<br />
-14.0<br />
-18.6<br />
-6.5<br />
Bulk carriers 1745 2045 1817 1033 977 -5.4 -44.0<br />
Container ships 317 288 395 11 99 799.9 -68.7<br />
General cargo ships<br />
of which<br />
816 1426 993 879 688 -21.7 -15.7<br />
Single-deck ships 130 507 207 281 262 -7.0 101.4<br />
Multi-deck ships 581 644 552 445 304 -31.7 -47.7<br />
Passenger ships 1000 dwt 23 53 40 58 56 -4.1 144.8<br />
Passenger ships 1000 gt 82 178 148 - 169 ... 106.9<br />
Note: For definition of ship types compare "Definitions".<br />
(Source: ISL based on data from LR/Fairplay)<br />
SSMR June 2004 21
ISL <strong>Market</strong> <strong>Review</strong> 2004 - merchant fleet data<br />
% change over<br />
Fleet Data<br />
2003 2004<br />
prev.<br />
same<br />
period<br />
Date Unit Nov. Dec. Jan. Feb. Mar. Apr. May period prev. year<br />
Laid-up tonnage mid1000 dwt<br />
- 300 gt <strong>and</strong> over - of month<br />
Total 1184 1152 1159 1046 1033 1002 1054 5.2 -51.9<br />
Tankers 220 206 216 217 217 217 216 -0.4 -80.5<br />
Bulk carriers 155 155 155 90 90 90 127 41.0 -31.6<br />
Container ships 96 96 100 32 32 32 32 - -66.2<br />
General cargo ships<br />
of which<br />
586 547 548 554 557 545 564 3.4 -14.3<br />
Single-deck ships 189 171 155 153 153 150 151 0.7 -20.4<br />
Multi-deck ships 182 169 175 180 183 179 198 10.8 -19.1<br />
Passenger ships 1000 dwt 127 149 141 153 137 118 115 -2.5 -21.4<br />
Passenger ships 1000 gt 393 475 442 479 440 370 354 -4.4 100.5<br />
Lay-up rate of total world fleet % 0.14 0.12<br />
Broken-up tonnage during1000 dwt<br />
- 300 gt <strong>and</strong> over - the month<br />
Total 2182 2536 2141 1929 1942 1249 -35.7 -26.8<br />
Tankers 1389 1746 1232 1425 1534 994 -35.2 82.0<br />
Bulk carriers 452 407 531 245 202 87 -57.1 -85.5<br />
Container ships - 11 45 54 - 50 - -23.0<br />
General cargo ships<br />
of which<br />
332 332 308 198 182 104 -42.7 -77.8<br />
Single-deck ships 77 131 99 109 54 16 -71.0 -93.7<br />
Multi-deck ships 195 157 190 48 66 56 -14.7 -57.5<br />
Passenger ships 1000 dwt 9 41 25 6 25 15 -39.2 -49.5<br />
Passenger ships 1000 gt 31 90 63 31 76 54 -28.3 -40.3<br />
Laid-up tonnage - dwt percent change over previous month 2002 - 2004<br />
60.0<br />
40.0<br />
20.0<br />
0.0<br />
-20.0<br />
-40.0<br />
-0.9 -2.9<br />
3.0<br />
Broken-up tonnage - dwt percent change over previous month 2002 - 2004<br />
600.0<br />
450.0<br />
300.0<br />
150.0<br />
0.0<br />
-150.0<br />
(Source: ISL based on LR/Fairplay)<br />
-2.9<br />
0.0 -2.8 -3.0<br />
1.0<br />
-8.0<br />
2.8<br />
43.6<br />
-4.3<br />
11.7<br />
-0.7 -1.4<br />
-28.9<br />
-20.0<br />
-3.0 -2.7<br />
0.6<br />
-9.8<br />
-1.3 -3.0<br />
M J J A S O N D J2003 F M A M J J A S O N D J2004 F M A M<br />
ISL2004<br />
582.1<br />
-46.1<br />
26.9 18.2 31.8 11.0<br />
-6.0 -8.6<br />
5.6<br />
-40.8 -52.0<br />
52.5<br />
152.7<br />
-53.0<br />
69.9<br />
11.3<br />
-21.7 -28.8 -27.3<br />
16.2<br />
-15.6 -9.9<br />
M J J A S O N D J2003 F M A M J J A S O N D J2004 F M A<br />
22 SSMR June 2004<br />
0.7<br />
5.2<br />
-35.7<br />
ISL2004
ISL <strong>Market</strong> <strong>Review</strong> 2004 - shipping prices <strong>and</strong> costs<br />
% change over<br />
<strong>Shipping</strong> Prices <strong>and</strong> Costs<br />
2003 2004<br />
prev.<br />
same<br />
period<br />
Date Unit Nov. Dec. Jan. Feb. Mar. Apr. period prev. year<br />
Second h<strong>and</strong> prices end mill US $<br />
Bulk carrier<br />
of<br />
28000 dwt, 1984 built month 6.0 6.2 8.0 8.5 9.0 9.0 - 87.5<br />
28000 dwt, 1989 built 8.8 9.5 11.0 12.0 14.0 14.0 - 102.9<br />
28000 dwt, 1995 built 13.0 13.0 14.5 15.8 17.5 17.5 - 66.7<br />
42000 dwt, 1984 built 7.2 8.0 10.0 13.0 14.0 14.0 - 133.3<br />
42000 dwt, 1989 built 11.0 12.0 14.0 17.0 18.0 17.0 -5.6 82.8<br />
45000 dwt, 1995 built 16.5 18.0 21.0 24.5 26.0 25.0 -3.8 78.6<br />
65000 dwt, 1982 built 7.3 8.0 11.5 13.5 15.0 12.0 -20.0 128.6<br />
68000 dwt, 1989 built 14.0 14.5 19.5 22.0 23.0 20.0 -13.0 94.2<br />
73000 dwt, 1995 built 21.5 23.5 30.0 32.0 33.5 30.0 -10.4 87.5<br />
135000 dwt, 1981 built 9.5 12.0 15.0 20.0 20.0 16.0 -20.0 204.8<br />
145000 dwt, 1989 built 24.0 25.0 32.5 34.5 34.5 30.0 -13.0 76.5<br />
165000 dwt, 1995 built<br />
Tanker<br />
37.0 39.0 47.0 48.5 48.5 43.0 -11.3 62.3<br />
VLCC M/T 300000 dwt, 1998 built, double hull 68.0 72.0 73.0 73.0 74.0 74.0 - 25.4<br />
VLCC M/T 285000 dwt, 1990 built - dely AG 31.0 34.0 34.0 34.0 35.0 35.0 - 29.6<br />
M/T 150000 dwt, 1998 built, double hull 46.0 48.0 49.0 49.0 50.0 50.0 - 16.3<br />
M/T 140000 dwt, 1990 built 23.0 23.0 24.0 24.0 24.0 24.0 - 9.1<br />
M/T 105000 dwt, 1998 built, double hull 36.0 38.0 42.0 42.0 43.0 43.0 - 34.4<br />
M/T 95000 dwt, 1993 built, double hull 28.0 29.0 31.0 31.0 31.0 31.0 - 24.0<br />
M/T 95000 dwt, 1990 built 16.0 17.0 18.0 18.0 18.0 18.0 - 12.5<br />
M/T 60/75000 dwt, 1986 built, coated 15.0 16.0 17.0 17.0 17.0 17.0 - 21.4<br />
M/T 45000 dwt, 1998 built, coated double hull 27.0 28.0 30.0 30.0 30.0 30.0 - 25.0<br />
M/T 40000 dwt, 1990 built, coated<br />
(Source: R.S. Platou A/S)<br />
13.0 13.0 14.0 14.0 14.0 14.0 - 7.7<br />
Demolition prices by area end US $/<br />
Far East Displ. t 270.0 307.5 325.0 380.0 365.0 305.0 -16.4 47.0<br />
Pakistan/India 260.0 282.5 325.0 365.0 385.0 396.3 2.9 88.7<br />
(Source: R.S. Platou A/S)<br />
Demolition prices by ship type end US $/<br />
Tanker Displ. t<br />
VLCC 265.0 310.0 330.0 400.0 400.0 410.0 2.5 105.0<br />
Aframax 270.0 310.0 330.0 400.0 400.0 410.0 2.5 95.2<br />
30´ Clean 270.0 310.0 330.0 400.0 400.0 410.0 2.5 95.2<br />
Capesize 255.0 280.0 295.0 370.0 375.0 380.0 1.3 90.0<br />
H<strong>and</strong>y 38´ 255.0 280.0 295.0 370.0 375.0 380.0 1.3 90.0<br />
General cargo<br />
(Source: Fearnleys)<br />
260.0 290.0 305.0 380.0 380.0 385.0 1.3 87.8<br />
Bunker market prices mid per m.t.<br />
Hamburg, Rotterdam, Le Havre of US $ fob<br />
Fuel 180 CST month 170.7 153.3 156.3 156.0 162.8 169.3 4.0 25.1<br />
Marine diesel oil 252.0 256.3 274.3 258.0 256.0 286.7 12.0 30.9<br />
US Ports ex wharf<br />
Fuel 180 CST 167.3 163.3 176.3 175.7 178.3 174.3 -2.2 14.4<br />
Marine diesel oil<br />
(Source: Lloyd's List, compiled by E. Björn-Hansen, Oslo)<br />
284.0 291.7 291.7 310.0 313.0 308.3 -1.5 -3.4<br />
Currency units, exchange rate average<br />
Euro / US $ of 1Euro/US$ 1.200 1.259 1.247 1.249 1.232 1.198 -2.8 7.1<br />
Euro / UK Pound month 1Euro/UK£ 0.697 0.705 0.683 0.670 0.688 0.676 -1.7 -3.2<br />
Euro / Yen 1Euro/¥ 130.48 133.74 131.67 131.67 132.59 131.96 -0.5 -0.9<br />
US $ / Yen (a) 1US$/¥ 109.45 107.13 106.44 109.62 109.99 110.35 0.3 -7.8<br />
US $ / Won (a)<br />
(a) Exchange rate as of end of month<br />
(Source: Deutsche Bundesbank)<br />
1US$/100Won 12.02 11.93 11.74 11.76 11.89 11.73 -1.3 -3.5<br />
SSMR June 2004 23
ISL <strong>Market</strong> <strong>Review</strong> 2004 - economic indicators<br />
World market prices<br />
Overall index (a)<br />
IMF non fuel<br />
commodities<br />
Moody´s HWWA (a)<br />
1995 = 100 1995 = 100 2000 = 100<br />
2003 February 81.2 107.5 110.9<br />
March 80.0 103.3 104.8<br />
April 79.5 107.1 94.1<br />
May 79.6 109.1 95.8<br />
June 79.4 108.1 99.3<br />
July 79.0 111.0 101.1<br />
August 80.5 111.1 104.0<br />
September 82.2 113.4 99.0<br />
October 85.5 117.5 105.4<br />
November 87.7 121.3 107.1<br />
December 46.0 125.3 110.7<br />
2004 January 94.0 130.2 117.1<br />
February 97.1 136.2 118.7<br />
March 98.9 136.4 126.5<br />
April 99.9 140.0 127.5<br />
May 97.7 138.9 134.6<br />
(Source: IMF, H<strong>and</strong>elsblatt <strong>and</strong> HWWA)<br />
World market prices<br />
Indices for selected Grain Oilseeds Luxuries Non Iron ore, Coal Agricult. Crude<br />
commodities (a) ferrous scrap raw oil<br />
2000=100 metals metals material<br />
2003 April 111.4 116.2 106.8 85.9 121.7 97.4 102.3 89.5<br />
May 115.3 122.5 104.2 89.8 118.9 96.5 103.5 91.3<br />
June 110.8 121.3 94.8 91.4 113.4 99.2 103.6 97.6<br />
July 103.7 113.9 97.5 93.1 114.0 102.2 102.3 100.7<br />
August 111.1 110.7 98.3 95.1 117.5 105.3 101.6 104.6<br />
September 113.0 120.8 100.6 94.9 120.9 111.1 104.3 94.7<br />
October 111.2 141.1 94.9 101.2 125.1 114.9 110.8 101.8<br />
November 117.6 147.4 93.6 105.6 124.7 124.5 112.1 102.5<br />
December 121.7 148.0 98.0 112.2 128.2 142.2 111.1 105.3<br />
2004 January 127.3 158.1 104.3 119.7 149.7 159.7 114.4 110.3<br />
February 129.8 165.0 103.9 128.2 163.6 165.2 115.0 109.8<br />
March 137.1 187.0 105.3 129.6 173.9 198.6 115.3 117.3<br />
April 141.4 190.3 102.6 129.9 164.5 207.8 114.1 118.8<br />
May 137.4 182.4 103.3 121.7 154.2 219.6 114.8 131.3<br />
(a) Price indices are rebased, based on US$<br />
(Source: HWWA)<br />
200.0<br />
175.0<br />
150.0<br />
125.0<br />
100.0<br />
75.0<br />
50.0<br />
Grain<br />
Oilseeds<br />
Agriculture<br />
2000 2001 2002 2003 2004<br />
140<br />
130<br />
120<br />
110<br />
100<br />
90<br />
80<br />
70<br />
HWWA Index<br />
2000 2001 2002 2003 2004<br />
200.0<br />
175.0<br />
150.0<br />
125.0<br />
100.0<br />
24 SSMR June 2004<br />
75.0<br />
50.0<br />
Coal<br />
Crude oil<br />
ISL 2004<br />
2000 2001 2002 2003 2004<br />
ISL 2004
ISL <strong>Market</strong> <strong>Review</strong> 2004 - economic indicators<br />
Production indices per working day for selected countries (2000=100)<br />
Total industry<br />
exclud. construction<br />
average 2003 2004 prev.<br />
same<br />
period<br />
2002 2003 Mar. Apr. May June July Aug. Sept. Oct. Nov. Dec. Jan. Feb. periodrev. year<br />
Selected countries<br />
Germany, FR of 96.0 100.2 100.2 100.6 99.4 98.6 101.4 98.1 97.8 100.6 101.3 100.9 102.1 101.5 -0.6 0.7<br />
France 98.8 99.7 99.9 99.2 97.9 98.6 98.8 99.2 100.1 101.0 100.4 100.1 99.7 102.0 2.3 1.3<br />
Italy 97.0 97.5 97.3 97.3 96.0 96.6 98.2 98.2 97.5 97.7 98.0 97.9 97.6 97.5 -0.1 -0.1<br />
Spain 100.6 100.9 100.3 101.8 99.8 100.5 101.0 100.5 100.4 101.3 101.1 101.3 100.4 102.0 1.5 1.6<br />
United Kingdom 97.2 95.1 95.0 95.0 95.1 95.8 95.6 94.8 95.0 95.6 94.9 95.0 95.0 94.6 -0.4 -0.9<br />
EU-15 97.1 99.5 99.1 99.5 98.6 98.9 99.5 99.3 99.2 100.2 99.9 100.2 100.0 100.1 0.1 0.2<br />
105<br />
100<br />
95<br />
90<br />
85<br />
Production indices per working day for EU-15, Japan <strong>and</strong><br />
the USA 1999 - 2004<br />
2000=100<br />
J1999 J2000 J2001 J2002 J2003 J2004<br />
Production indices per working day for EU-15, Japan <strong>and</strong> the USA (2000=100) by main industrial groups<br />
2003 2004 same<br />
Industrial group average Mar. Apr. May June July Aug. Sept. Oct. Nov. Dec. Jan. Feb. prev. period<br />
2002 2003 periodrev. year<br />
Total industries EU-15 111.7 99.4 99.1 99.5 98.6 98.9 99.5 99.3 99.2 100.2 99.9 100.2 100.0 100.1 0.1 0.6<br />
Japan 96.4 95.8 94.4 93.3 95.3 94.2 94.0 93.9 97.4 98.2 98.8 98.6 101.6 97.6 -3.9 3.5<br />
USA 123.5 96.3 96.0 95.4 95.3 95.3 96.0 96.0 96.6 97.0 97.9 98.0 98.7 99.4 0.8 2.9<br />
Intermediate goods EU-15 113.9 99.2 98.7 99.0 98.3 98.6 99.4 98.8 98.9 100.0 100.0 100.2 99.8 100.0 0.2 1.3<br />
industries Japan 100.6 95.4 93.8 92.5 94.7 93.6 94.1 93.4 96.9 97.9 98.6 98.4 101.3 97.3 -3.9 4.1<br />
USA 125.4 95.6 95.3 94.7 94.6 94.7 95.2 95.2 96.0 96.3 97.1 97.3 97.6 98.7 1.1 3.3<br />
Capital goods EU-15 124.8 99.2 98.1 99.8 98.3 97.7 99.7 98.2 98.7 100.6 100.8 100.4 100.0 99.8 -0.2 1.0<br />
industries Japan 84.5 80.5 82.0 77.2 81.7 82.9 80.4 80.1 80.4 80.1 80.3 ... ... ... ... ...<br />
USA 126.3 125.6 125.5 124.8 125.6 125.9 125.6 125.7 125.6 125.7 126.1 ... ... ... ... ...<br />
Durable consumer EU-15 107.0 89.7 89.0 89.5 88.5 89.0 91.2 89.1 89.6 90.6 90.1 90.7 91.1 90.9 -0.2 0.8<br />
goods industries Japan 101.6 104.2 103.3 104.1 107.2 105.1 103.9 103.3 103.9 103.3 103.3 ... ... ... ... ...<br />
USA 147.2 152.8 150.9 149.9 149.9 150.9 152.3 152.5 155.0 155.6 157.8 ... ... ... ... ...<br />
Non-durable consumer EU-15 107.0 101.4 100.9 101.6 100.3 101.3 102.1 101.7 101.2 101.7 101.7 101.9 101.8 101.9 0.1 0.8<br />
goods industries Japan 94.8 97.7 98.3 97.8 97.7 94.7 97.2 97.2 97.2 97.2 101.7 ... ... ... ... ...<br />
USA 103.4 100.6 101.4 100.8 100.6 100.1 100.5 100.3 100.3 100.4 100.8 ... ... ... ... ...<br />
(Source: EUROSTAT, Data Base New Cronos)<br />
US EU-15 Japan<br />
110<br />
105<br />
100<br />
95<br />
90<br />
85<br />
80<br />
2000=100<br />
% change over<br />
Production indices per working day for EU-15 by main<br />
industrial groups 1999 - 2004<br />
J1999 J2000 J2001 J2002 J2003 J2004<br />
Capital goods industries<br />
Durable consumer goods industries<br />
Intermediate goods industries<br />
ISL 2004<br />
% change over<br />
SSMR June 2004 25
ISL <strong>Market</strong> <strong>Review</strong> 2004 - freight market<br />
T o p i c<br />
(Source)<br />
% change % change<br />
2003 2004 of last over prev. over prev.<br />
Basis Nov. Dec. Jan. Feb. Mar. Apr. 12 months period year<br />
Dry cargo market<br />
Time charter `71=100 402 459 431 507 ... ... 394.5 ... ...<br />
Trip charter 65/66=100 244 244 244 244 ... ... 235.5 ... ...<br />
Tanker market ... ...<br />
VLCC/ULCC, 150000 dwt & over World- 57.9 125.5 125.0 145.9 122.9 ... 90.8 ... ...<br />
Medium crude, 70'-150000 dwt scale 120.4 278.9 268.1 179.0 176.1 ... 163.6 ... ...<br />
Small crude, 30'-70000 dwt 153.3 332.5 345.0 306.3 191.3 ... 228.4 ... ...<br />
H<strong>and</strong>y sized dirty - 35000 dwt 202.0 290.0 285.0 400.0 349.4 ... 255.3 ... ...<br />
Clean, all sizes 180.0 288.6 265.6 356.6 370.0 ... 267.6 ... ...<br />
(Source: Lloyd´s Ship Manager)<br />
Tramp tonnage<br />
Trip charter indices '85=100<br />
Combined index 309 360 563 613 451 558 362.3 23.7 122.2<br />
12000 -19999 dwt ... ... 341 349 ... 448 315.3 ... ...<br />
20000-34999 dwt 422 469 601 716 636 615 426.5 -3.3 125.5<br />
35000-49999 dwt 417 521 521 721 706 571 424.6 -19.1 174.7<br />
50000-84999 dwt 605 688 688 835 861 730 530.8 -15.2 164.9<br />
85000 dwt <strong>and</strong> over 662 722 722 881 735 604 506.6 -17.8 182.7<br />
(Source: Lloyd's <strong>Shipping</strong> Economist)<br />
Quarterly changes of selected freight rate averages 2002 - 2004 (in %)<br />
50.0<br />
40.0<br />
30.0<br />
20.0<br />
10.0<br />
-<br />
-10.0<br />
3.5<br />
-1.1<br />
Time charter<br />
30.9<br />
II/02<br />
III/02<br />
IV/02<br />
I/03<br />
6.9<br />
5.8<br />
3.7<br />
15.6<br />
9.4<br />
II/03<br />
III/03<br />
IV/03<br />
I/04<br />
15.0<br />
10.0<br />
5.0<br />
-<br />
-5.0<br />
-10.0<br />
4.1<br />
-0.3<br />
Trip charter<br />
4.6<br />
2.2<br />
average<br />
Liner trade index<br />
ISL2004<br />
Liner trade indices<br />
Overall index 95=100 100.5 96.0 93.2 93.1 96.4 100.0 100.0 3.7 -0.5<br />
Homeward-bound liner 95.7 91.7 88.1 88.0 91.9 96.3 94.5 4.8 3.0<br />
Outward-bound liner<br />
by trading area<br />
105.1 100.1 98.0 98.0 100.8 103.5 105.2 2.7 -3.4<br />
Europe 94.4 94.4 94.4 94.3 94.4 94.6 94.7 0.2 -2.5<br />
America 115.3 110.4 107.6 107.1 110.0 113.6 111.9 3.3 3.0<br />
Asia<br />
(Source: Statistisches Bundesamt, FRG)<br />
88.7 82.7 78.8 79.0 83.7 88.4 89.8 5.6 -2.1<br />
6.6<br />
0.4<br />
II/02<br />
III/02<br />
IV/02<br />
I/03<br />
II/03<br />
III/03<br />
26 SSMR June 2004<br />
3.3<br />
2.1<br />
IV/03<br />
I/04<br />
20.0<br />
10.0<br />
-<br />
-10.0<br />
-20.0<br />
-30.0<br />
-8.3<br />
-0.9<br />
4.9<br />
-0.9<br />
5.7<br />
0.5<br />
II/02<br />
III/02<br />
IV/02<br />
I/03<br />
II/03<br />
III/03<br />
IV/03<br />
-3.9<br />
-5.2<br />
I/04
ISL <strong>Market</strong> <strong>Review</strong> 2004 - freight market<br />
T o p i c<br />
(Source)<br />
2003 2004 % change % change<br />
Basis over over<br />
Sep. Oct. Nov. Dec. Jan. Feb. Mar. Apr. May prev. prev.<br />
period year<br />
Tanker freight rates<br />
Dirty<br />
AG-West World- 81.6 53.0 123.1 117.5 113.1 106.9 96.3 86.3 80.8 -6.4 -3.6<br />
AG-East scale 104.4 56.0 151.9 151.5 133.8 135.0 104.4 93.5 97.5 4.3 3.9<br />
Med-USAC<br />
Clean<br />
105.6 137.0 153.8 229.0 273.8 188.8 180.0 150.0 154.2 2.8 5.0<br />
Med-NW Europe 207.5 200.0 271.3 303.0 340.0 356.3 345.0 239.0 246.7 3.2 -30.0<br />
Med-USAC 235.0 218.0 263.8 313.0 352.5 403.8 390.0 257.0 242.5 -5.6 -18.8<br />
(Source: Petroleum Economist)<br />
2004<br />
T o p i c Basis<br />
(Source) Apr. Apr. Apr. Apr. May May May May May<br />
03. 10. 17. 24. 01. 08. 15. 22. 29.<br />
General freight index 1972 428.2 422.0 420.7 420.8 419.9 417.8 419.0 418.3 417.5<br />
Grain freight index =100 455.5 449.2 448.5 448.5 447.6 447.0 448.5 447.7 446.8<br />
Miscellaneous freight index<br />
Time charter indices<br />
368.1 362.1 359.4 359.7 358.9 353.5 354.1 353.8 353.0<br />
Time charter 548.2 516.7 503.5 541.3 482.6 449.6 459.9 433.8 411.7<br />
Time 1 to 2 months 618.8 585.7 591.3 611.2 582.0 510.4 514.0 457.9 432.0<br />
Time 2 to 3 months 551.8 512.4 490.3 542.6 462.6 436.1 450.5 427.9 409.2<br />
Time over 6 months 432.3 440.6 442.2 437.3 437.3 427.4 427.4 427.4 394.4<br />
Weekly - No. of fixtures<br />
reported<br />
340 346 236 369 368 271 358 390 373<br />
T o p i c Unit<br />
2003 2004<br />
%change<br />
over prev.<br />
% change<br />
over prev.<br />
(Source)<br />
Charter fixtures,<br />
worldwide<br />
4 resp. 5 weeks<br />
Sep. Oct. Nov. Dec. Jan. Feb. Mar. Apr. May period year<br />
Coal No 19 7 26 23 23 27 39 43 44 2.3 69.2<br />
1000 m.t. 1593 597 2345 2016 2066 2442 3491 4182 3784 -9.5 12.1<br />
Grain No 20 31 12 8 12 26 16 16 15 -6.3 -25.0<br />
1000 m.t. 676 716 282 193 251 364 296 419 258 -38.5 -57.5<br />
Coal <strong>and</strong> Grain - monthly charter fixtures 2003 - 2004 (ton-% change)<br />
200<br />
180<br />
160<br />
140<br />
120<br />
100<br />
80<br />
60<br />
40<br />
20<br />
0<br />
-20<br />
-40<br />
-60<br />
-80<br />
-100<br />
182.9<br />
17.5<br />
-38.9<br />
-65.9<br />
Grain<br />
Coal<br />
121.8<br />
100.9<br />
56.7<br />
-44.3<br />
-72.1<br />
(Source: ISL Bremen based on Information from Maritime Research Inc., Parlin, New Jersey)<br />
24.4<br />
260.6<br />
39.6<br />
-29.3<br />
39.6<br />
5.8<br />
-62.5 -60.7<br />
292.9<br />
-31.4 -14.0 -19.6<br />
-33.3<br />
44.8<br />
18.2<br />
-18.7<br />
43.0 41.5<br />
19.8<br />
% change over<br />
prev. period<br />
-0.2<br />
-0.2<br />
-0.2<br />
M A M J J A S O N D J2004 F M A M<br />
-38.5<br />
-5.1<br />
-5.7<br />
-4.4<br />
-7.7<br />
-4.4<br />
-9.5<br />
ISL2004<br />
SSMR June 2004 27
ISL <strong>Market</strong> <strong>Review</strong> 2004 - world shipbuilding<br />
ISL World Shipbuilding<br />
Date Unit 2004<br />
quarterly Apr. July Oct. Jan. Apr.<br />
Order book - by ship type<br />
- 300 gt <strong>and</strong> over - 1st<br />
Total No 2290 2383 2729 2984 3101 3.9 35.4<br />
1000 cgt 50427 53649 60603 67965 69559 2.3 37.9<br />
1000 gt 83214 88663 103208 112383 118079 5.1 41.9<br />
1000 dwt 121516 129015 150346 162480 171854 5.8 41.4<br />
Oil tankers No 755 777 879 925 945 2.2 25.2<br />
1000 cgt 17122 18287 19119 21339 20501 -3.9 19.7<br />
1000 gt 34179 35776 39565 40350 41466 2.8 21.3<br />
1000 dwt 60673 63668 70339 71335 73798 3.5 21.6<br />
Liquefied gas & chem. tankers No 197 200 199 206 186 -9.7 -5.6<br />
1000 cgt 6407 6645 6212 6766 6398 -5.4 -0.1<br />
1000 gt 7931 8212 7614 8426 8035 -4.6 1.3<br />
1000 dwt 6591 6829 6444 7125 6730 -5.5 2.1<br />
Bulk carriers No 456 475 582 647 680 5.1 49.1<br />
(incl. combined carriers) 1000 cgt 8022 8425 10357 11501 12086 5.1 50.7<br />
1000 gt 17998 18919 23180 25685 26906 4.8 49.5<br />
1000 dwt 33122 34886 42547 47205 49575 5.0 49.7<br />
Container ships No 333 372 489 588 662 12.6 98.8<br />
1000 cgt 9828 11098 15459 18782 21469 14.3 118.4<br />
1000 gt 14277 16202 22717 27622 31679 14.7 121.9<br />
1000 dwt 16351 18658 25823 31348 36214 15.5 121.5<br />
General cargo ships No 372 396 416 438 460 5.0 23.7<br />
1000 cgt 4556 5183 5640 5818 5872 0.9 28.9<br />
1000 gt 5323 6491 7193 7407 7527 1.6 41.4<br />
1000 dwt 4362 4655 4859 5126 5226 2.0 19.8<br />
of which No 97 123 132 129 129 - 33.0<br />
Reefer, special <strong>and</strong> 1000 cgt 2334 3034 3436 3417 3403 -0.4 45.8<br />
Ro-ro cargo ships 1000 gt 3100 4371 5069 5125 5210 1.7 68.1<br />
1000 dwt 1327 1765 1954 1997 2006 0.5 51.2<br />
Passenger ships No 177 163 164 180 168 -6.7 -5.1<br />
1000 cgt 4491 4010 3817 3758 3233 -14.0 -28.0<br />
1000 gt 3506 3063 2938 2892 2467 -14.7 -29.6<br />
1000 dwt 417 319 334 342 311 -9.2 -25.6<br />
Order book - by country<br />
group/countries<br />
- 300 gt <strong>and</strong> over - 1st<br />
OECD No 1611 1708 1965 2095 2204 5.2 36.8<br />
of which 1000 cgt 41062 43922 49459 54100 55597 2.8 35.4<br />
1000 gt 69074 73856 85850 90540 95624 5.6 38.4<br />
1000 dwt 99618 106205 123352 128332 136691 6.5 37.2<br />
Japan No 603 634 755 838 855 2.0 41.8<br />
1000 cgt 13768 14878 16969 19088 18771 -1.7 36.3<br />
1000 gt 25544 28156 33104 36309 37092 2.2 45.2<br />
1000 dwt 39821 43480 50911 56282 58554 4.0 47.0<br />
Korea, Rep. of No 569 632 762 780 857 9.9 50.6<br />
1000 cgt 18556 20555 24140 26397 28339 7.4 52.7<br />
1000 gt 34197 36625 43692 44812 49003 9.4 43.3<br />
1000 dwt 52266 55168 64641 63696 69211 8.7 32.4<br />
AWES No 415 402 427 453 456 0.7 9.9<br />
1000 cgt 8894 8638 8842 9106 8973 -1.5 0.9<br />
1000 gt 9763 9443 9867 10234 10372 1.3 6.2<br />
1000 dwt 8615 8450 9329 9831 10411 5.9 20.9<br />
Note: For definition of ship types compare "Definitions".<br />
(Source: ISL Bremen 2004 based on quarterly updates from LR/Fairplay)<br />
28 SSMR June 2004<br />
% change over<br />
prev.<br />
period<br />
same period<br />
prev. year
I - 1.1 Laid-up tonnage ISL<br />
1.1.1 By month 2003 <strong>and</strong> 2004<br />
Dry cargo vessels Tankers<br />
Ships of 300 gt <strong>and</strong> over<br />
Gr<strong>and</strong> Total<br />
Year/ dwt-%<br />
Mid month 1000 1000 1000 1000 1000 1000 change over<br />
No gt dwt No gt dwt No gt dwt prev. month<br />
2003<br />
April 225 1376.1 1210.2 45 433.8 840.7 270 1809.9 2050.9 0.3<br />
May 228 1331.5 1170.6 48 404.9 792.2 276 1736.4 1962.8 -1.8<br />
June 223 1638.6 632.7 48 554.3 1106.2 271 2192.9 1738.9 -9.7<br />
July 222 1616.6 592.6 51 560.3 1117.5 273 2176.9 1710.1 -3.7<br />
August 219 1584.1 542.4 52 563.2 1122.8 271 2147.3 1665.3 16.0<br />
September 209 995.7 973.2 49 271.0 552.6 258 1266.7 1525.8 -10.2<br />
October 216 1015.3 989.6 51 131.6 231.1 267 1146.9 1220.7 -20.0<br />
November 214 1013.3 964.0 52 131.2 220.0 266 1144.5 1184.0 -3.0<br />
December<br />
2004<br />
216 1061.2 946.7 50 123.4 205.7 266 1184.6 1152.4 -2.7<br />
January 217 1041.2 943.7 52 128.6 215.8 269 1169.8 1159.5 0.6<br />
February 228 995.8 829.5 52 129.2 216.8 280 1125.0 1046.3 -9.8<br />
March 224 957.1 816.2 52 129.2 216.8 276 1086.3 1033.0 -1.3<br />
April 213 894.9 804.8 52 129.2 216.8 265 1024.1 1021.6 -1.1<br />
May 212 897.7 838.4 51 128.5 215.8 263 1026.2 1054.3 3.2<br />
Average 2004<br />
Av. 12 months<br />
219 957.3 846.5 52 129.0 216.4 271 1086.3 1062.9<br />
June 2003 - May 2004 218 1142.6 822.8 51 248.3 469.8 269 1390.9 1292.7<br />
1.1.2 By year of build <strong>and</strong> ship type mid of May 2004<br />
Tankers Bulk Container General Passenger dwt-%<br />
Year (1) No carriers ships cargo of which ships share<br />
of (2) 1000 ships Single-deck Multi-deck of<br />
build dwt ships ships TOTAL total<br />
up to 1962 (1) 11 1 - 25 15 5 19 56<br />
(2) 64.4 0.7 - 61.2 38.0 18.0 63.2 189.5 18.0<br />
1963 - 1967 (1) 14 - - 23 13 5 17 54<br />
(2) 20.7 - - 68.9 18.1 25.6 15.1 104.7 9.9<br />
1968 - 1972 (1) 11 - 1 25 10 7 9 46<br />
(2) 65.7 - 3.5 175.1 43.2 24.6 13.3 257.6 24.4<br />
1973 - 1977 (1) 4 1 - 21 9 8 8 34<br />
(2) 7.8 0.4 - 93.3 25.4 62.2 5.9 107.5 10.2<br />
1978 - 1982 (1) 5 3 - 19 5 6 3 30<br />
(2) 14.5 79.3 - 86.0 15.4 43.8 8.7 188.4 17.9<br />
1983 - 1987 (1) 4 1 1 10 5 4 1 17<br />
(2) 40.8 47.0 29.0 33.8 6.1 23.8 0.2 150.8 14.3<br />
1988 - 1992 (1) 2 - - 9 2 - 6 17<br />
(2) 2.0 - - 21.9 4.1 - 6.6 30.5 2.9<br />
1993 - 1997 (1) - - - 5 1 - 3 8<br />
(2) - - - 24 0.4 - 0.8 24.5 2.3<br />
1998 - (1) - - - - - - 1 1<br />
(2) - - - - - - 0.8 0.8 0.1<br />
TOTAL No (1)<br />
51 6 2 137 60 35 67 263<br />
1000 dwt (2)<br />
215.8 127.5 32.5 563.7 150.6 198.0 114.8 1054.3 100.0<br />
Average age (Years) 35.1 27.2 25.8 32.8 36.0 32.5 36.8 34.1<br />
Continued<br />
SSMR June 2004 29
I - 1.1 Laid-up tonnage ISL<br />
1.1.3 By major flags <strong>and</strong> ship type mid of May 2004<br />
Ships of 300 gt <strong>and</strong> over<br />
Tankers Bulk Container General Passenger dwt-% Av.<br />
Flag (1) No carriers ships cargo of which ships share age<br />
(2) 1000 ships Single-deck Multi-deck of (years)<br />
dwt - rank dwt ships ships TOTAL total<br />
1 Brazil (1) 1 3 1 6 - 3 - 11 25.7<br />
(2) 2.2 89.3 29.0 45.2 - 25.7 - 165.6 15.7<br />
2 Panama (1) 5 1 - 13 7 3 5 24 36.0<br />
(2) 16.1 37.1 - 45.0 15.6 8.6 21.2 119.4 11.3<br />
3 Liberia (1) 1 - - 1 - - - 2 35.4<br />
(2) 2.1 - - 94.5 - - - 96.6 9.2<br />
4 US (1) 2 - - 2 - 1 4 8 56.3<br />
(2) 50.4 - - 10.6 - 10.4 28.6 89.6 8.5<br />
5 Egypt (1) 1 - - 4 1 1 - 5 35.2<br />
(2) 35.4 - - 7.2 3.1 2.1 - 42.7 4.0<br />
6 Bahamas (1) - - - 2 - 2 3 5 21.5<br />
(2) - - - 35.3 - 35.3 2.5 37.8 3.6<br />
7 Italy (1) 5 - - 2 1 - 12 19 37.4<br />
(2) 11.6 - - 9.3 4.3 - 12.2 33.1 3.1<br />
8 Libya (1) - - - 4 - 3 - 4 19.0<br />
(2) - - - 32.6 - 28.6 - 32.6 3.1<br />
9 Greece (1) 8 - - 1 - - 10 19 39.7<br />
(2) 9.9 - - 0.9 - - 18.5 29.3 2.8<br />
10 Argentina (1) 1 - - 5 2 - 1 7 37.2<br />
(2) 2.3 - - 24.3 15.1 - 0.5 27.0 2.6<br />
11 Cyprus (1) 1 - - 2 - - 2 5 27.9<br />
(2) 2.2 - - 16.4 - - 5.5 24.0 2.3<br />
12 Indonesia (1) 2 - - 3 2 1 - 5 30.5<br />
(2) 12.6 - - 10.3 9.5 0.8 - 22.8 2.2<br />
13 Mexico (1) 1 - - - - - - 1 35.9<br />
(2) 21.8 - - - - - - 21.8 2.1<br />
14 Denmark (1) 1 - - 7 2 4 - 8 32.7<br />
(2) 2.6 - - 18.6 1.4 7.8 - 21.2 2.0<br />
15 Russia (1) 3 - - 15 5 1 - 18 19.6<br />
(2) 5.4 - - 13.5 5.8 2.2 - 18.8 1.8<br />
Others/unknown (1) 19 2 1 70 40 16 30 122 34.9<br />
(2) 41.3 1.1 3.5 200.2 95.8 76.6 25.8 271.9 25.8<br />
TOTAL No (1) 51 6 2 137 60 35 67 263 34.1<br />
1000 dwt (2) 215.8 127.5 32.5 563.7 150.6 198.0 114.8 1054.3 100.0<br />
1.1.4 By country groups of registration <strong>and</strong> ship type mid of May 2004<br />
Ships of 300 gt <strong>and</strong> over<br />
Tankers Bulk Container General Passenger dwt-% Av.<br />
Country (1) No carriers ships cargo of which ships share age<br />
groups (2) 1000 ships Single-deck Multi-deck of (years)<br />
of registration dwt ships ships TOTAL total<br />
OECD (1) 21 1 - 26 12 5 35 83 38.1<br />
(2) 110.7 0.7 - 64.9 19.1 18.1 68.1 244.4 23.2<br />
of which EU (1) 15 1 - 16 7 4 27 59 36.3<br />
(2) 25.0 0.7 - 38.7 9.5 7.8 34.2 98.5 9.3<br />
Open Registry Flags (1) 9 1 - 23 9 7 14 47 30.8<br />
(2) 23.1 37.1 - 214.1 19.4 61.7 30.7 304.9 28.9<br />
Others (1) 21 4 2 88 39 23 18 133 32.7<br />
(2) 82.1 89.7 32.5 284.8 112.1 118.2 16.0 505.0 47.9<br />
TOTAL No (1) 51 6 2 137 60 35 67 263 34.1<br />
1000 dwt (2) 215.8 127.5 32.5 563.7 150.6 198.0 114.8 1054.3 100.0<br />
dwt-% share of total 20.5 12.1 3.1 53.5 14.3 18.8 10.9 100.0<br />
Note: Open registry flags include Bahamas, Bermuda, Cyprus, Liberia, Panama as "Majors" <strong>and</strong> Malta, Saint Vincent, Marshall Isl<strong>and</strong>s,<br />
Cayman Isl<strong>and</strong>s <strong>and</strong> Antigua & Barbuda.<br />
30 SSMR June 2004
I - 1.1 Laid-up tonnage ISL<br />
1.1.5 Reported monthly tonnage reduction <strong>and</strong> addition by ship type up to mid of May 2004<br />
Ships of 300 gt <strong>and</strong> over<br />
Year/<br />
General<br />
(1) No Bulk Container cargo of which<br />
Passenger<br />
mid month (2) 1000 Tankers carriers ships ships Single- Multi-deck ships<br />
dwt deck ships ships<br />
TOTAL<br />
TOTAL October 2003 (1) 51 6 2 146 68 34 62 267<br />
(2) 231.1 155.0 96.1 612.3 194.7 201.8 126.2 1220.7<br />
Addition November 2003 (1) 5 - - 7 4 - 4 16<br />
(2) 9.4 - - 17.4 10.2 - 2.6 29.4<br />
Reduction November 2003 (1) 4 - - 12 4 3 1 17<br />
(2) 20.3 - - 43.8 15.9 19.8 2.0 66.1<br />
TOTAL November 2003 (1) 52 6 2 141 68 31 65 266<br />
(2) 220.2 155.0 96.1 585.9 189.0 182.0 126.8 1184.0<br />
Addition December 2003 (1) 2 - - 7 1 2 14 23<br />
(2) 2.9 - - 16.3 1.6 3.6 28.5 47.7<br />
Reduction December 2003 (1) 4 - - 18 6 3 1 23<br />
(2) 17.0 - - 55.7 19.5 16.2 6.4 79.1<br />
TOTAL December 2003 (1) 50 6 2 130 63 30 78 266<br />
(2) 206.0 155.0 96.1 546.5 171.1 169.3 148.9 1152.6<br />
Addition January 2004 (1) 4 - 1 9 2 2 - 14<br />
(2) 12.9 - 3.5 26.8 1.0 14.4 - 43.2<br />
Reduction January 2004 (1) 2 - - 6 3 2 3 11<br />
(2) 2.9 - - 25.8 16.7 8.6 7.6 36.3<br />
TOTAL January 2004 (1) 52 6 3 133 62 30 75 269<br />
(2) 216.1 155.0 99.6 547.4 155.3 175.1 141.3 1159.5<br />
Addition February 2004 (1) 1 - - 12 1 4 8 21<br />
(2) 3.1 - - 9.9 0.4 4.4 14.7 27.7<br />
Reduction February 2004 (1) 1 1 1 3 2 - 4 10<br />
(2) 2.1 64.6 67.1 3.6 2.6 - 3.4 140.9<br />
TOTAL February 2004 (1) 52 5 2 142 61 34 79 280<br />
(2) 217.1 90.4 32.4 553.7 153.1 179.5 152.6 1046.3<br />
Addition March 2004 (1) - - - 4 2 1 1 5<br />
(2) - - - 6.7 2.5 3.8 0.9 7.6<br />
Reduction March 2004 (1) - - - 5 2 1 4 9<br />
(2) - - - 4.0 2.2 0.8 16.9 20.9<br />
TOTAL March 2004 (1) 52 5 2 141 61 34 76 276<br />
(2) 217.1 90.4 32.4 556.4 153.3 182.4 136.6 1033.0<br />
Addition April 2004 (1) - - - 2 - 2 - 2<br />
(2) - - - 19.2 - 19.2 - 19.2<br />
Reduction April 2004 (1) - - - 6 2 1 7 13<br />
(2) - - - 11.7 3.8 3.8 18.9 30.6<br />
TOTAL April 2004 (1) 52 5 2 137 59 35 69 265<br />
(2) 217.1 90.4 32.4 563.9 149.5 197.8 117.7 1021.6<br />
Addition May 2004 (1) - 1 - 2 1 - - 3<br />
(2) - 37.1 - 2.5 1.1 - - 39.5<br />
Reduction May 2004 (1) 1 - - 2 - - 2 5<br />
(2) 1 - - 3.0 - - 2.9 6.9<br />
TOTAL May 2004 (1) 51 6 2 137 60 35 67 263<br />
(2) 216.2 127.5 32.4 563.4 150.6 197.8 114.8 1054.3<br />
Addition (a) dwt-% share - 41.0 - 0.4 0.7 - - 3.9<br />
Reduction (a) dwt-% share<br />
Total Tonnage Laid-up<br />
0.4 - - 0.5 - - 2.5 0.7<br />
dwt-% change over<br />
previous month<br />
-0.4 41.0 - -0.1 0.7 - -2.5 3.2<br />
(a) Tonnage reduction & addition in dwt-% shares compared with previous total.<br />
Note: Figures as of mid of month. Reduction <strong>and</strong> addition figures include laid-up tonnage as reported for the relevant month. The date of entering or leaving<br />
lay-up may be different from the reporting period.<br />
(Source: ISL merchant fleet data bases, based on monthly LR/Fairplay updates)<br />
SSMR June 2004 31
I - 1.2 Broken-up tonnage ISL<br />
1.2.1 By month 2003 <strong>and</strong> 2004<br />
Tankers Dry cargo vessels Gr<strong>and</strong> Total<br />
Ships of 300 gt <strong>and</strong> over<br />
dwt-% change<br />
Year/ 1000 1000 1000 1000 1000 1000 over prev.<br />
Mid month No gt dwt No gt dwt No gt dwt<br />
month<br />
2003<br />
February 23 705.2 1326.3 60 690.8 1003.6 83 1395.9 2329.9 -40.8<br />
March 20 341.8 557.5 24 441.9 561.7 44 783.7 1119.2 -52.0<br />
April 18 306.3 546.0 125 883.3 1160.7 143 1189.6 1706.6 52.5<br />
May 44 1280.8 2435.6 125 1434.6 1988.5 169 2715.5 4424.2 159.2<br />
June 39 720.8 1365.7 74 465.6 661.9 113 1186.3 2027.6 -54.2<br />
July 38 1356.9 2526.7 58 703.5 917.1 96 2060.4 3443.8 69.9<br />
August 28 1035.0 1919.8 89 1382.3 1914.5 117 2417.3 3834.3 11.3<br />
September 17 1292.0 2585.7 38 279.8 414.9 55 1571.8 3000.6 -21.7<br />
October 23 929.0 1740.0 34 317.3 397.2 57 1246.3 2137.2 -28.8<br />
November 22 732.0 1388.7 60 560.7 793.7 82 1292.8 2182.4 2.1<br />
December<br />
2004<br />
28 987.2 1745.7 57 640.6 790.3 85 1627.7 2536.0 16.2<br />
January 32 704.9 1232.0 90 638.2 908.9 122 1343.1 2140.9 -15.6<br />
February 22 783.0 1425.3 49 381.6 503.2 71 1164.7 1928.5 -9.9<br />
March 25 794.8 1533.6 50 368.3 408.2 75 1163.1 1941.8 0.7<br />
April 23 585.0 993.7 35 264.8 255.7 58 849.8 1249.4 -35.7<br />
Average 2004<br />
Avearge last<br />
26 716.9 1296.2<br />
56 413.2 519.0<br />
82 1130.2 1815.2<br />
12 month 28 933.4 1741.1<br />
63 619.8 829.5<br />
92 1553.2 2570.6<br />
1.2.2 By year of build <strong>and</strong> ship type during April 2004<br />
Ships of 300 gt <strong>and</strong> over<br />
Tankers Bulk Container General Passenger<br />
Year (1) No carriers ships cargo of which ships dwt-%<br />
of (2) 1000 ships Single-deck Multi-deck share<br />
build dwt ships ships TOTAL of total<br />
up to 1962 (1) - - - 3 2 1 3 6<br />
(2) - - - 2.2 1.7 0.5 8.1 10.3 0.8<br />
1963 - 1967 (1) 2 - - 3 - 1 3 8<br />
(2) 1.6 - - 7.5 - 1.2 4.5 13.6 1.1<br />
1968 - 1972 (1) 2 - 2 3 2 1 - 7<br />
(2) 4.0 - 49.9 5.1 4.1 1.0 - 59.0 4.7<br />
1973 - 1977 (1) 12 3 - 7 1 4 - 22<br />
(2) 533.0 86.6 - 44.1 10.0 32.4 - 663.7 53.1<br />
1978 - 1982 (1) 6 - - 4 - 2 1 11<br />
(2) 324.4 - - 24.2 - 20.5 2.3 350.9 28.1<br />
1983 - 1987 (1) 1 - - 3 - 1 - 4<br />
(2) 130.7 - - 21.2 - 0.8 - 151.9 12.2<br />
1988 - 1992 (1) - - - - - - - -<br />
(2) - - - - - - - - -<br />
1993 - 1997 (1) - - - - - - - -<br />
(2) - - - - - - - - -<br />
1998 - 2003 (1) - - - - - - - -<br />
(2) - - - - - - - - -<br />
TOTAL No 23 3 2 23 5 10 7 58<br />
1000 dwt 993.7 86.6 49.9 104.3 15.8 56.4 14.9 1249.4 100.0<br />
Average age (Years) 28.6 28.8 - 32.4 39.6 32.2 42.4 32.0<br />
32 SSMR June 2004
I - 1.2 Broken-up tonnage ISL<br />
1.2.3 By major flags <strong>and</strong> ship type April 2004<br />
Ships of 300 gt <strong>and</strong> over<br />
Tankers Bulk Container General Passenger dwt-% Av.<br />
Flag (1) No carriers ships cargo of which ships share age<br />
(2) 1000 ships Single-deck Multi-deck of (years)<br />
dwt - rank dwt ships ships TOTAL total<br />
1 Panama (1) 4 1 - 3 - 1 - 8 25.8<br />
(2) 172.7 34.5 - 20.4 - 5.3 - 227.5 18.2<br />
2 Liberia (1) 3 - - - - - - 3 24.3<br />
(2) 226.4 - - - - - - 226.4 18.1<br />
3 Malta (1) 2 - - 2 - - 1 5 28.6<br />
(2) 119.6 - - 9.0 - - 0.3 129.0 10.3<br />
4 US (1) 1 - - - - - - 1 30.1<br />
(2) 122.8 - - - - - - 122.8 9.8<br />
5 Cyprus (1) 1 - - - - - 2 3 45.7<br />
(2) 90.8 - - - - - 7.8 98.7 7.9<br />
6 India (1) 1 - - - - - - 1 30.4<br />
(2) 89.5 - - - - - - 89.5 7.2<br />
7 China, PR of (1) - - 2 1 - 1 - 3 31.1<br />
(2) - - 49.9 15.2 - 15.2 - 65.2 5.2<br />
8 Comoro Isl<strong>and</strong>s (1) 3 - - - - - - 3 29.9<br />
(2) 60.0 - - - - - - 60.0 4.8<br />
9 Norway (1) 1 - - - - - - 1 29.2<br />
(2) 32.4 - - - - - - 32.4 2.6<br />
10 Indonesia (1) - 1 - 2 - 2 1 4 30.5<br />
(2) - 27.3 - 1.8 - 1.8 1.4 30.4 2.4<br />
11 Turkey (1) 1 - - - - - - 1 28.0<br />
(2) 30.0 - - - - - - 30.0 2.4<br />
12 Iran (1) 1 - - - - - - 1 31.3<br />
(2) 25.6 - - - - - - 25.6 2.1<br />
13 Romania (1) - 1 - - - - - 1 29.7<br />
(2) - 24.9 - - - - - 24.9 2.0<br />
14 Singapore (1) - - - 1 - 1 - 1 28.2<br />
(2) - - - 24.6 - 24.6 - 24.6 2.0<br />
15 Cambodia (1) 1 - - 2 2 - - 3 31.0<br />
(2) 16.3 - - 4.1 4.1 - - 20.4 1.6<br />
Others/ unk. (1) 4 - - 12 3 5 3 19 36.3<br />
(2) 7.7 - - 29.2 11.7 9.5 5.4 42.3 3.4<br />
TOTAL No (1) 23 3 2 23 5 10 7 58 32.0<br />
1000 dwt (2) 993.7 86.6 49.9 104.3 15.8 56.4 14.9 1249.4 100.0<br />
Note: Norway including NIS.<br />
1.2.4 By country groups of registration <strong>and</strong> ship type April 2004<br />
Ships of 300 gt <strong>and</strong> over<br />
Tankers Bulk Container General Passenger dwt-% Av.<br />
Country (1) No carriers ships cargo of which ships share age<br />
groups (2) 1000 ships Single-deck Multi-deck of (years)<br />
of registration dwt ships ships TOTAL total<br />
OECD (1) 4 - - 1 1 - - 5 32.5<br />
(2) 188.2 - - 0.8 0.8 - - 189.0 15.1<br />
of which EU (1) 1 - - 1 1 - - 2 37.7<br />
(2) 3.1 - - 0.8 0.8 - - 3.9 0.3<br />
Open registry flags (1) 10 1 - 6 - 2 4 21 29.0<br />
(2) 609.5 34.5 - 31.6 - 7.5 10.4 686.0 54.9<br />
Others (1) 9 2 2 16 4 8 3 32 33.8<br />
(2) 196.0 52.1 49.9 72 14.9 48.9 4.5 374.4 30.0<br />
TOTAL No (1) 23 3 2 23 5 10 7 58 32.0<br />
1000 dwt (2) 993.7 86.6 49.9 104.3 15.8 56.4 14.9 1249.4 100.0<br />
Dwt-% share of total 79.5 6.9 4.0 8.3 1.3 4.5 1.2 100.0<br />
Note: For definition of country groups compare "Definitions".<br />
(Source: ISL merchant fleet data bases, based on monthly updates from LR/Fairpaly)<br />
SSMR June 2004 33
I - 1.3 Special fleets - general cargo ships ISL<br />
1.3.1 Total general cargo fleet<br />
1.3.1.1 Fleet development by ship type as of January 1st, 2000 - 2004<br />
Ships of 300 gt <strong>and</strong> over<br />
% share % share % share % share dwt-% change<br />
Ship type No of of 1000 of 1000 of 1000 of over<br />
Year ships total gt total dwt total TEU total previous year<br />
SINGLE - DECK SHIPS<br />
2000 8634 50.1 28105 31.5 40828 40.8 697 38.8 5.1<br />
2001 8734 51.0 28868 32.0 41846 42.2 781 41.7 2.5<br />
2002 8712 51.9 29154 33.0 42137 43.8 812 43.4 0.7<br />
2003 8650 51.9 29579 32.9 42603 44.0 854 45.0 1.1<br />
2004<br />
Av. growth<br />
8663 52.5 29841 33.4 42858 45.0 889 46.5 0.6<br />
2000-2004<br />
MULTI - DECK SHIPS<br />
0.1 1.5 1.2 6.3<br />
2000 5018 29.0 25630 28.4 35307 34.9 713 37.9 -5.2<br />
2001 4794 28.0 23985 26.5 32967 33.1 697 36.6 -6.6<br />
2002 4512 27.0 21817 24.5 29852 30.9 659 34.5 -9.4<br />
2003 4411 26.4 21361 23.7 29112 30.0 638 33.0 -2.5<br />
2004<br />
Av. growth<br />
4232 25.7 20101 22.5 27326 28.7 615 32.2 -6.1<br />
2000-2004<br />
REEFER SHIPS<br />
-4.2 -5.9 -6.2 -3.6<br />
2000 1321 7.7 6960 7.9 7386 7.5 53 2.8 -1.2<br />
2001 1305 7.8 6857 7.8 7300 7.6 55 2.9 -1.2<br />
2002 1290 7.8 6780 7.7 7220 7.5 55 2.9 -1.1<br />
2003 1225 7.4 6626 7.5 7073 7.4 56 2.9 -2.0<br />
2004<br />
Av. growth<br />
1173 7.1 6283 7.0 6758 7.1 57 3.0 -4.5<br />
2000-2004 -2.9 -2.5 -2.2 2.0<br />
SPECIAL SHIPS<br />
2000 1121 6.6 18702 21.2 9388 9.5 45 2.4 4.2<br />
2001 1140 6.8 20101 22.8 9750 10.1 43 2.3 3.9<br />
2002 1128 6.8 20091 22.8 9554 10.0 43 2.3 -2.0<br />
2003 1200 7.3 20416 23.1 9829 10.4 43 2.2 2.9<br />
2004<br />
Av. growth<br />
1239 7.5 20926 23.4 10075 10.6 38 2.0 2.5<br />
2000-2004 2.5 2.8 1.8 -4.0<br />
RO-RO CARGO SHIPS<br />
2000 1134 6.6 9947 11.1 7152 7.2 289 15.5 3.8<br />
2001 1142 6.8 10394 11.8 7311 7.6 297 15.9 2.2<br />
2002 1128 6.8 10628 12.0 7365 7.7 301 15.9 0.7<br />
2003 1182 7.2 11799 13.3 8137 8.6 308 16.2 10.5<br />
2004<br />
Av. growth<br />
1180 7.2 12246 13.7 8171 8.6 311 16.3 0.4<br />
2000-2004<br />
TOTAL GENERAL<br />
CARGO FLEET<br />
1.0 5.3 3.4 1.9<br />
2000 17228 100.0 89345 100.0 100061 100.0 1796 100.0 1.8<br />
2001 17115 100.0 90205 100.0 99174 100.0 1874 100.0 -0.9<br />
2002 16770 100.0 88470 100.0 96128 100.0 1870 100.0 -3.1<br />
2003 16668 100.0 89781 100.0 96754 100.0 1899 100.0 0.7<br />
2004<br />
Av. growth<br />
16487 100.0 89398 100.0 95187 100.0 1910 100.0 -1.6<br />
2000-2004 -1.1 0.0 -1.2 1.6<br />
34 SSMR June 2004
I - 1.3 Special fleets - general cargo ships ISL<br />
1.3.1.2 Total general cargo fleet by ship type <strong>and</strong> registered flags<br />
according to regions as of January 1st, 2000 - 2004<br />
Ships of 1000 gt <strong>and</strong> over<br />
Ship Type Europe North America Latin <strong>and</strong> South America Asia <strong>and</strong> Oceania<br />
Africa<br />
TOTAL<br />
Year<br />
No<br />
1000<br />
dwt No<br />
1000<br />
dwt No<br />
1000<br />
dwt No<br />
1000<br />
dwt No<br />
1000<br />
dwt No<br />
SINGLE-DECK SHIPS<br />
2000 2260 12372 8 43 1499 11962 1752 11074 108 2256 5627 37706<br />
2001 2325 12919 9 48 1487 11981 1808 11694 125 2106 5754 38749<br />
2002 2243 12555 10 51 1457 11955 1970 12469 124 2095 5804 39125<br />
2003 2202 12373 13 89 1450 11836 2088 13440 114 1989 5867 39726<br />
2004 2148 11724 16 118 1475 11948 2126 14408 122 1793 5887 39993<br />
Av. growth<br />
2000-2004 -1.3 -1.3 18.9 28.9 -0.4 0.0 5.0 6.8 3.1 -5.6 1.1 1.5<br />
MULTI-DECK SHIPS<br />
2000 953 6149 33 416 1302 9510 1636 15985 199 2217 4123 34278<br />
2001 870 5517 20 259 1244 8629 1603 15516 191 2064 3928 31985<br />
2002 752 4582 19 252 1151 7667 1597 14531 179 1893 3698 28924<br />
2003 678 3998 115 1477 1097 7078 1602 13999 167 1704 3659 28256<br />
2004 636 3749 112 1437 1056 6677 1569 13246 142 1411 3515 26520<br />
Av. growth<br />
2000-2004 -9.6 -11.6 35.7 36.3 -5.1 -8.5 -1.0 -4.6 -8.1 -10.7 -3.9 -6.2<br />
SPECIAL SHIPS<br />
2000 258 1972 21 548 302 3737 244 2045 59 913 884 9215<br />
2001 240 1818 21 534 330 4219 244 2046 62 958 897 9575<br />
2002 221 1784 17 397 349 4331 234 1944 59 922 880 9377<br />
2003 224 1851 24 533 357 4517 245 1902 51 821 901 9625<br />
2004 243 2201 25 549 363 4441 250 2031 45 645 926 9867<br />
Av. growth<br />
2000-2004 -1.5 2.8 4.5 0.1 4.7 4.4 0.6 -0.2 -6.5 -8.3 1.2 1.7<br />
REEFER SHIPS<br />
2000 238 1300 2 3 596 4021 219 1104 98 838 1153 7266<br />
2001 233 1324 2 3 604 4068 199 954 97 830 1135 7180<br />
2002 228 1337 2 3 586 3987 217 1000 91 776 1124 7103<br />
2003 230 1385 2 3 580 3968 208 936 82 688 1102 6980<br />
2004 220 1381 2 3 559 3809 185 787 86 685 1052 6665<br />
Av. growth<br />
2000-2004 -1.9 1.5 0.0 0.0 -1.6 -1.3 -4.1 -8.1 -3.2 -4.9 -2.3 -2.1<br />
RO-RO CARGO SHIPS<br />
2000 406 3633 13 172 214 1572 194 1321 55 282 882 6980<br />
2001 398 3722 14 178 222 1624 196 1285 58 328 888 7138<br />
2002 392 3787 14 178 218 1618 202 1302 53 312 879 7197<br />
2003 395 3857 44 865 227 1702 210 1255 48 282 924 7960<br />
2004 374 3806 47 912 240 1727 209 1282 42 260 912 7986<br />
Av. growth<br />
2000-2004 -2.0 1.2 37.9 51.8 2.9 2.4 1.9 -0.7 -6.5 -2.0 0.8 3.4<br />
TOTAL GENERAL<br />
CARGO SHIPS<br />
2000 4115 25426 77 1181 3913 30802 4045 31529 519 6505 12669 95444<br />
2001 4066 25301 66 1021 3887 30522 4050 31495 533 6286 12602 94625<br />
2002 3836 24045 62 881 3761 29557 4220 31245 506 5999 12385 91727<br />
2003 3729 23463 198 2968 3711 29100 4353 31532 462 5484 12453 92547<br />
2004 3621 22861 202 3019 3693 28603 4339 31753 437 4794 12292 91030<br />
Av. growth<br />
2000-2004 -3.1 -2.6 27.3 26.4 -1.4 -1.8 1.8 0.2 -4.2 -7.3 -0.8 -1.2<br />
1000<br />
dwt<br />
Continued<br />
SSMR June 2004 35
I - 1.3 Special fleets - general cargo ships ISL<br />
1.3.1.3 Total general cargo fleet by ship type <strong>and</strong> countries of domicile<br />
according to regions as of January 1st, 2000 - 2004<br />
Ships of 1000 gt <strong>and</strong> over<br />
Ship Type Europe North America Latin <strong>and</strong> South Asia <strong>and</strong> Oceania Africa<br />
Unknown<br />
TOTAL<br />
Year<br />
America<br />
No 1000 No 1000 No 1000 No 1000 No 1000 No 1000 No 1000<br />
dwt<br />
dwt<br />
dwt<br />
dwt<br />
dwt<br />
dwt<br />
dwt<br />
SINGLE-DECK SHIPS<br />
2000 2765 19058 42 578 61 582 1729 13143 32 233 998 4113 5627 37706<br />
2001 2862 19685 43 549 55 503 1707 13040 31 233 1056 4738 5754 38749<br />
2002 2878 19823 39 402 57 679 1734 13194 32 244 1064 4783 5804 39125<br />
2003 2849 20145 52 491 56 656 1682 12588 33 252 1195 5594 5867 39726<br />
2004<br />
Av. growth<br />
2802 19918 49 456 63 635 1710 13360 30 206 1233 5417 5887 39993<br />
2000-2004 0.3 1.1 3.9 -5.8 0.8 2.2 -0.3 0.4 -1.6 -3.0 5.4 7.1 1.1 1.5<br />
MULTI-DECK SHIPS<br />
2000 1725 14176 61 560 86 763 1408 13270 117 1110 726 4398 4123 34278<br />
2001 1594 12450 53 501 83 670 1357 12708 111 983 730 4673 3928 31985<br />
2002 1437 10890 47 416 74 624 1277 11604 98 826 765 4566 3698 28924<br />
2003 1296 9720 138 1597 65 500 1231 11068 85 706 844 4665 3659 28256<br />
2004<br />
Av. growth<br />
1191 8676 133 1535 71 503 1238 10940 78 654 804 4212 3515 26520<br />
2000-2004 -8.8 -11.6 21.5 28.7 -4.7 -9.9 -3.2 -4.7 -9.6 -12.4 2.6 -1.1 -3.9 -6.2<br />
SPECIAL SHIPS<br />
2000 350 3704 30 795 15 164 421 4326 2 3 66 223 884 9215<br />
2001 347 3785 33 809 9 87 439 4562 3 5 66 326 897 9575<br />
2002 326 3655 26 628 10 89 442 4531 3 5 73 468 880 9377<br />
2003 329 3628 34 697 10 89 434 4580 4 7 90 624 901 9625<br />
2004 350 3858 34 730 9 78 442 4739 5 13 86 449 926 9867<br />
Av. growth<br />
2000-2004 0.0 1.0 3.2 -2.1 -12.0 -17.0 1.2 2.3 25.7 48.3 6.8 19.1 1.2 1.7<br />
REEFER SHIPS<br />
2000 598 4250 29 273 16 88 342 1946 19 78 149 631 1153 7266<br />
2001 565 4048 26 254 16 88 340 1951 15 52 173 787 1135 7180<br />
2002 600 4337 25 228 15 74 312 1735 13 46 159 684 1124 7103<br />
2003 593 4298 24 210 12 54 296 1626 10 33 167 758 1102 6980<br />
2004 585 4341 22 193 11 50 287 1511 7 21 140 550 1052 6665<br />
Av. growth<br />
2000-2004 -0.5 0.5 -6.7 -8.3 -8.9 -13.2 -4.3 -6.1 -22.1 -28.3 -1.5 -3.4 -2.3 -2.1<br />
RO-RO CARGO SHIPS<br />
2000 492 4511 44 397 15 166 180 1267 36 119 115 520 882 6980<br />
2001 490 4691 41 332 19 177 183 1306 36 118 119 514 888 7138<br />
2002 477 4767 45 334 15 161 188 1339 33 117 121 478 879 7197<br />
2003 472 4728 80 1065 14 162 200 1384 30 95 128 526 924 7960<br />
2004<br />
Av. growth<br />
442 4517 78 1085 11 164 210 1486 25 83 146 651 912 7986<br />
2000-2004 -2.6 0.0 15.4 28.5 -7.5 -0.2 3.9 4.1 -8.7 -8.6 6.1 5.8 0.8 3.4<br />
TOTAL GENERAL<br />
CARGO SHIPS<br />
2000 5930 45698 206 2603 193 1763 4080 33953 206 1542 2054 9885 12669 95444<br />
2001 5858 44658 196 2444 182 1525 4026 33568 196 1391 2144 11038 12602 94625<br />
2002 5718 43471 182 2008 171 1627 3953 32404 179 1239 2182 10979 12385 91727<br />
2003 5539 42519 328 4060 157 1461 3843 31245 162 1093 2424 12168 12453 92547<br />
2004 5370 41310 316 3999 165 1430 3887 32036 145 976 2409 11279 12292 91030<br />
Av. growth<br />
2000-2004 -2.4 -2.5 11.3 11.3 -3.8 -5.1 -1.2 -1.4 -8.4 -10.8 4.1 3.4 -0.8 -1.2<br />
36 SSMR June 2004
I - 1.3 Special fleets - general cargo ships ISL<br />
1.3.1.4 Total general cargo fleet by ship type <strong>and</strong> top ten countries of domicile<br />
as of January 1st, 2004<br />
Ships of 1000 gt <strong>and</strong> over<br />
Ship type No of 1000 1000 1000<br />
dwt-%<br />
share of<br />
Ship type No of 1000 1000 1000<br />
dwt-%<br />
share of<br />
Country ships gt dwt TEU total Country ships gt dwt TEU total<br />
SINGLE-DECK SHIPS MULTI-DECK SHIPS<br />
Norway 200 3579 5180 166 13.0 China, PR of 465 3187 4403 51 16.6<br />
Germany, FR of 632 3161 4370 241 10.9 Greece 200 1879 2590 67 9.8<br />
Russia 938 2840 3386 34 8.5 Germany, FR of 344 1281 1633 79 6.2<br />
China, PR of 395 2024 2903 35 7.3 US 128 1160 1465 16 5.5<br />
Japan 224 1733 2572 8 6.4 Netherl<strong>and</strong>s 93 444 654 32 2.5<br />
Greece 153 1273 1900 41 4.8 Norway 95 460 634 18 2.4<br />
Netherl<strong>and</strong>s 265 980 1357 65 3.4 Russia 81 502 627 19 2.4<br />
Turkey 182 727 1081 20 2.7 Hong Kong 45 425 612 12 2.3<br />
Hong Kong 51 645 982 16 2.5 Indonesia 133 452 588 15 2.2<br />
Korea, Rep. of 155 514 747 3 1.9 Japan 67 403 549 6 2.1<br />
Others 2692 10817 15514 257 38.8 Others 1864 9450 12765 297 48.1<br />
TOTAL 2004 5887 28293 39993 887 100.0 TOTAL 2004 3515 19644 26520 612 100.0<br />
TOTAL 2003 5867 28029 39726 852 TOTAL 2003 3659 20882 28256 635<br />
Change over Change over<br />
previous year 0.3 0.9 0.7 4.1 previous year -3.9 -5.9 -6.1 -3.6<br />
SPECIAL SHIPS REEFER SHIPS<br />
Japan 314 9352 3451 8 35.0 Greece 146 995 1056 5 15.8<br />
Norway 82 2534 1121 1 11.4 Japan 139 837 916 5 13.7<br />
US 33 1045 725 5 7.4 Netherl<strong>and</strong>s 77 535 574 6 8.6<br />
Greece 55 1193 629 0 6.4 UK 52 471 511 5 7.7<br />
Sweden 35 1475 629 - 6.4 Norway 64 445 494 7 7.4<br />
Netherl<strong>and</strong>s 46 628 534 12 5.4 Denmark 27 293 324 8 4.9<br />
Korea, Rep. of 34 1084 437 0 4.4 Germany, FR of 29 228 242 4 3.6<br />
Russia 50 372 298 1 3.0 US 22 189 193 2 2.9<br />
China, PR of 20 153 200 1 2.0 Latvia 23 198 186 2 2.8<br />
Denmark 25 441 153 0 1.6 Russia 50 204 185 1 2.8<br />
Others 232 2460 1689 9 17.1 Others 423 1809 1985 12 29.8<br />
TOTAL 2004 926 20737 9867 37 100.0 TOTAL 2004 1052 6203 6665 57 100.0<br />
TOTAL 2003 901 20238 9625 42 TOTAL 2003 1102 6545 6980 56<br />
Change over Change over<br />
previous year 2.8 2.5 2.5 -11.3 previous year -4.5 -5.2 -4.5 1.6<br />
RO-RO CARGO SHIPS TOTAL GENERAL CARGO SHIPS<br />
Italy 64 2032 1182 55 14.8 Norway 497 8245 8272 219 9.1<br />
US 69 1288 1002 47 12.6 Japan 833 13413 8146 29 8.9<br />
Norway 56 1227 843 27 10.6 China, PR of 935 5565 7717 89 8.5<br />
Japan 89 1088 657 2 8.2 Germany, FR of 1069 5346 6753 352 7.4<br />
Germany, FR of 52 539 412 24 5.2 Greece 585 5785 6394 118 7.0<br />
Sweden 30 419 273 9 3.4 Russia 1131 4007 4562 59 5.0<br />
UK 25 386 227 9 2.8 US 281 3947 3739 83 4.1<br />
Finl<strong>and</strong> 29 349 223 9 2.8 Netherl<strong>and</strong>s 495 2752 3216 117 3.5<br />
Greece 31 444 219 5 2.7 Italy 133 2672 2017 77 2.2<br />
France 16 249 193 9 2.4 Hong Kong 112 1242 1723 29 1.9<br />
Others 451 4075 2755 112 34.5 Others 6221 34000 38491 729 42.3<br />
TOTAL 2004 912 12097 7986 309 100.0 TOTAL 2004 12292 86974 91030 1902 100.0<br />
TOTAL 2003 924 11657 7960 307 TOTAL 2003 12453 87352 92547 1892<br />
Change over Change over<br />
previous year<br />
Note: Others incl. unknown<br />
-1.3 3.8 0.3 0.8 previous year -1.3 -0.4 -1.6 0.6<br />
Continued<br />
SSMR June 2004 37
180<br />
150<br />
120<br />
I - 1.3 Special fleets - general cargo ships ISL<br />
Fig. I- 1: Fleet development as of January 1st, 1988 - 2004 (Index 1988 = 100) (a)<br />
90<br />
60<br />
Deadweight tonnage<br />
30<br />
50<br />
88 90 92 94 96 98 00 02 04 88 90 92 94 96 98 00 02 04<br />
Single-deck ships Multi-deck ships Others Total<br />
No of ships<br />
Fig. I- 2: General cargo fleet - annual tonnage changes as of January 1st, 1996 - 2004<br />
%<br />
3.5 3.5 3.4<br />
5.9 5.1<br />
2.5<br />
0.7 1.1 0.6<br />
Number of ships<br />
Fig. I- 3: General cargo fleet - age structure by year of build as of January 1st, 2004 (a)<br />
1000<br />
-12.0<br />
750<br />
500<br />
250<br />
12.0<br />
-4.0<br />
-8.0<br />
0<br />
8.0<br />
4.0<br />
0.0<br />
175<br />
150<br />
125<br />
100<br />
75<br />
1.0<br />
-2.1<br />
-2.2<br />
-5.2<br />
175<br />
150<br />
125<br />
100<br />
-2.5 75<br />
-3.0<br />
50<br />
-6.191<br />
94 97<br />
-6.7 -6.6<br />
-7.2<br />
-9.4<br />
96 97 98 99 00 01 02 03 04 96 97 98 99 00 01 02 03 04 96 97 98 99 00 01 02 03 04<br />
Single-deck ships Multi-deck ships<br />
Other general cargo ships<br />
1966 1968 1970 1972 1974 1976 1978 1980 1982 1984 1986 1988 1990 1992 1994 1996 1998 2000 2002<br />
No of ships dwt<br />
(a) Only General cargo ships built after 1966 are included. General Cargo ships built before 1966 comprise 1475 ships with a tonnage of 3.64 mill dwt<br />
Note: Fig. I-1 - I-3: ships of 300 gt <strong>and</strong> over<br />
38 SSMR June 2004<br />
1.1<br />
7.6<br />
2.4<br />
1.8<br />
-0.9<br />
3.7<br />
0<br />
-0.1<br />
8000<br />
6000<br />
4000<br />
2000<br />
ISL 2004<br />
1000 dwt
I - 1.3 Special fleets - general cargo ships ISL<br />
1.3.1.5 Total general cargo fleet by registered flags according to country groups <strong>and</strong> division of age<br />
as of January 1st, 2004<br />
Ships of 1000 gt <strong>and</strong> over<br />
Av.<br />
Country group (1) No age<br />
(2) 1000 dwt up to 1978 1979-1983 1984-1988 1989-1993 1994-1998 1999-2003 TOTAL (years)<br />
OECD (1) 625 386 393 371 382 436 2593 17.4<br />
of which<br />
(2) 4670 3139 3560 2085 2780 3773 20007<br />
EU (1) 245 193 198 245 278 335 1494 14.2<br />
(2) 1137 1489 1659 1383 1832 2731 10230<br />
Open Registry (1) 951 877 732 570 640 417 4187 17.8<br />
(2) 7028 8409 7133 4162 6777 4821 38331<br />
Developing Countries (1) 1955 717 425 237 155 82 3571 25.8<br />
(2) 10940 4746 2744 1319 1138 797 21684<br />
Others (1) 836 359 333 196 150 67 1941 23.1<br />
(2) 3823 2092 1746 1089 1407 852 11009<br />
TOTAL (1) 4367 2339 1883 1374 1327 1002 12292 20.9<br />
(2) 26462 18386 15183 8655 12102 10243 91030<br />
dwt-% share of total 29.1 20.2 16.7 9.5 13.3 11.3 100.0<br />
1.3.1.6 Total general cargo fleet by countries of domicile according to country groups <strong>and</strong> division of age<br />
as of January 1st, 2004<br />
Ships of 1000 gt <strong>and</strong> over<br />
Country group (1) No<br />
Av.<br />
age<br />
(2) 1000 dwt up to 1978 1979-1983 1984-1988 1989-1993 1994-1998 1999-2003 TOTAL (years)<br />
OECD (1) 1027 944 965 796 933 779 5444 16.5<br />
of which<br />
(2) 8266 9340 9738 5280 8893 8177 49694<br />
EU (1) 517 548 512 499 531 528 3135 15.5<br />
(2) 3176 5314 4346 3235 3861 4603 24534<br />
Open Registry (1) 29 9 18 14 9 3 82 19.9<br />
(2) 506 116 115 105 175 36 1054<br />
Developing Countries (1) 1144 519 281 186 132 66 2328 24.5<br />
(2) 8278 4129 2293 1176 1082 806 17764<br />
Others (1) 805 429 360 241 134 60 2029 22.7<br />
(2) 3685 2493 1837 1398 1197 629 11240<br />
Unknown (1) 1362 438 259 137 119 94 2409 25.7<br />
(2) 5726 2310 1198 696 755 594 11279<br />
TOTAL (1) 4367 2339 1883 1374 1327 1002 12292 20.9<br />
(2) 26462 18386 15183 8655 12102 10243 91030<br />
dwt-% share of total 29.1 20.2 16.7 9.5 13.3 11.3 100.0<br />
Continued<br />
SSMR June 2004 39
I - 1.3 Special fleets - general cargo ships ISL<br />
1.3.2 General cargo single-deck fleet<br />
1.3.2.1 By major flags as of January 1st, 2003 <strong>and</strong> 2004<br />
Flag January 1st, 2003 January 1st, 2004<br />
Ships of 300 gt <strong>and</strong> over<br />
dwt-%<br />
change<br />
dwt-rank 1000 1000 1000 dwt-% 1000 1000 1000 dwt-% over<br />
'04 ('03) No gt dwt TEU share No gt dwt TEU share prev.year<br />
1 (1) Panama 655 3151 4595 39 10.8 628 3011 4404 38 10.3 -4.1<br />
2 (2) Bahamas 189 2819 4036 134 9.5 173 2706 3873 129 9.0 -4.1<br />
3 (3) Russia 955 2675 3155 26 7.4 931 2587 3054 27 7.1 -3.2<br />
4 (5) China, PR of 434 1450 2108 15 4.9 441 1482 2156 15 5.0 2.2<br />
5 (7) Netherl<strong>and</strong>s (Total) 398 1352 1901 89 4.5 402 1366 1909 89 4.5 0.4<br />
- Netherl<strong>and</strong>s Antilles 45 130 187 8 9.8 56 168 242 11 8.2 29.4<br />
6 (4) Malta 252 1571 2187 53 5.1 232 1333 1838 44 4.3 -16.0<br />
7 (6) Norway (Total) 114 1332 1980 66 4.6 104 1117 1686 54 3.9 -14.9<br />
- Norway (NIS) 73 1306 1948 66 4.6 64 1093 1656 54 3.9 -15.0<br />
- Norway (NOR) 41 26 32 0 0.1 40 24 30 0 0.1 -6.5<br />
8 (10) Antigua & Barbuda 314 1038 1406 80 3.3 339 1161 1575 92 3.7 12.0<br />
9 (8) Liberia 64 1084 1645 53 3.9 54 925 1409 46 3.3 -14.3<br />
10 (9) Cyprus 194 1054 1456 45 3.4 174 956 1318 44 3.1 -9.5<br />
11 (14) Singapore 64 757 1087 33 2.6 65 934 1304 42 3.0 20.0<br />
12 (13) Saint Vincent 233 828 1207 14 2.8 228 855 1238 19 2.9 2.6<br />
13 (12) Indonesia 422 785 1219 2 2.9 419 745 1152 2 2.7 -5.5<br />
14 (11) Cambodia 376 918 1268 4 3.0 333 826 1141 5 2.7 -10.0<br />
15 (17) Hong Kong (SAR) 45 551 844 13 2.0 55 722 1094 18 2.6 29.7<br />
16 (15) Japan 702 434 1071 1 2.5 676 418 1038 1 2.4 -3.1<br />
17 (16) Turkey 324 677 1063 11 2.5 319 643 1013 11 2.4 -4.8<br />
18 (23) Marshall Isl<strong>and</strong>s 19 335 498 19 1.2 31 591 835 39 1.9 67.9<br />
19 (20) Thail<strong>and</strong> 93 378 607 4 1.4 101 509 792 11 1.8 30.4<br />
20 (19) Korea, Rep. of 204 452 732 4 1.7 207 477 725 3 1.7 -0.9<br />
Others 2599 5940 8538 148 20.0 2751 6478 9305 161 21.7 9.0<br />
TOTAL 8650 29579 42603 854 100.0 8663 29841 42858 889 100.0 0.6<br />
1.3.2.2 By size class <strong>and</strong> division of age as of January 1st, 2004<br />
Dwt-size class<br />
(1) No<br />
(2) 1000 dwt up to<br />
1978<br />
Ships of 300 gt <strong>and</strong> over<br />
Division of age (year of build)<br />
1979 1984 1989 1994<br />
- 1983 - 1988 - 1993 - 1998<br />
1999<br />
- 2003<br />
Total<br />
dwt-%<br />
share of<br />
total<br />
average<br />
age (years)<br />
< = 2499 (1)<br />
1749 536 542 522 497 121 3967 24.8<br />
(2)<br />
2020 673 711 739 724 188 5055 11.8<br />
2500 - 4999 (1)<br />
827 317 226 366 359 234 2329 19.7<br />
(2)<br />
2820 1085 793 1304 1390 885 8276 19.3<br />
5000 - 7499 (1)<br />
416 176 140 148 185 122 1187 19.5<br />
(2)<br />
2466 1081 855 913 1137 737 7190 16.8<br />
7500 - 9999 (1)<br />
115 43 25 24 118 105 430 14.5<br />
(2)<br />
969 365 218 201 1026 916 3696 8.6<br />
10000 - 12499 (1)<br />
63 17 10 5 23 41 159 17.3<br />
(2)<br />
689 194 117 52 251 453 1756 4.1<br />
12500 - 14999 (1)<br />
9 4 10 9<br />
4 10 46 15.7<br />
(2)<br />
121 55 141 123 53 133 627 1.5<br />
15000 - 19999 (1)<br />
28 7 20 17 15 29 116 14.5<br />
(2)<br />
483 120 352 289 263 508 2017 4.7<br />
20000 - 24999 (1)<br />
12 34 20 5 26 27 124 14.4<br />
(2)<br />
275 780 462 113 598 576 2804 6.5<br />
25000 - 29999 (1)<br />
17 10 11 6 27 12 83 14.6<br />
(2)<br />
468 265 307 165 769 337 2312 5.4<br />
30000 - 34999 (1)<br />
5 6 12 - 6 17 46 12.2<br />
(2)<br />
160 192 380 - 195 524 1450 3.4<br />
35000 - 39999 (1)<br />
10 13 11 - 2 8 44 18.4<br />
(2)<br />
384 504 423 - 78 304 1693 3.9<br />
40000 - 44999 (1)<br />
9 8 25 3 19 4 68 15.8<br />
(2)<br />
394 342 1057 127 825 170 2914 6.8<br />
> = 45000 (1)<br />
4 1 7 5 33 14 64 8.9<br />
(2)<br />
185 49 320 235 1616 664 3069 7.2<br />
TOTAL (1)<br />
3264 1172 1059 1110 1314 744 8663 21.3<br />
(2)<br />
11435 5705 6137 4262 8925 6394 42858 100.0<br />
40 SSMR June 2004
I - 1.3 Special fleets - general cargo ships ISL<br />
1.3.3 General cargo multi-deck fleet<br />
1.3.3.1 By major flags as of January 1st, 2003 <strong>and</strong> 2004<br />
Flag January 1st, 2003 January 1st, 2004 (a)<br />
Ships of 300 gt <strong>and</strong> over<br />
dwt-%<br />
change<br />
dwt-rank 1000 1000 1000 dwt-% 1000 1000 1000 dwt-% over<br />
'04 ('03) No gt dwt TEU share No gt dwt TEU share prev.year<br />
1 (1) China, PR of 430 2675 3713 30 12.8 430 2689 3736 32 13.7 0.6<br />
2 (2) Panama 384 2150 2952 55 10.1 390 2175 2979 56 10.9 0.9<br />
3 (3) Cyprus 190 1727 2302 69 7.9 152 1388 1854 56 6.8 -19.5<br />
4 (5) US 112 1146 1443 14 5.0 109 1116 1402 14 5.1 -2.8<br />
5 (4) Saint Vincent 222 1151 1575 32 5.4 202 975 1342 29 4.9 -14.8<br />
6 (6) Malta 106 829 1087 31 3.7 100 773 1018 31 3.7 -6.3<br />
7 (7) Antigua & Barbuda 272 744 943 52 3.2 255 684 872 48 3.2 -7.5<br />
8 (9) Indonesia 255 658 887 18 3.0 254 642 864 18 3.2 -2.6<br />
9 (8) Bahamas 117 715 913 33 3.1 92 562 737 29 2.7 -19.3<br />
10 (10) Liberia 45 628 850 30 2.9 40 521 708 25 2.6 -16.7<br />
11 (15) Hong Kong (SAR) 33 406 580 13 2.0 40 476 661 15 2.4 14.0<br />
12 (13) Thail<strong>and</strong> 49 438 645 9 2.2 49 449 653 12 2.4 1.3<br />
13 (12) Netherl<strong>and</strong>s (Total) 91 456 658 34 2.3 90 444 638 34 2.3 -3.0<br />
- Netherl<strong>and</strong>s Antilles 17 78 96 4 0.3 20 85 105 5 0.4 9.1<br />
14 (11) Cambodia 143 529 726 11 2.5 123 406 554 10 2.0 -23.6<br />
15 (14) Iran 36 436 604 16 2.1 32 389 539 16 2.0 -10.9<br />
16 (18) Korea, DPR of 48 289 431 4 1.5 74 345 504 6 1.8 16.8<br />
17 (17) Turkey 92 297 462 6 1.6 86 276 431 5 1.6 -6.8<br />
18 (21) Viet Nam 51 234 349 3 1.2 51 233 350 3 1.3 0.3<br />
19 (28) UK (Total) 40 196 251 11 0.9 51 273 345 16 1.3 37.5<br />
-Isle of Man 30 172 221 10 0.8 32 192 248 12 0.9 12.3<br />
-UK 10 24 30 1 0.1 19 80 97 4 0.4 223.0<br />
20 (16) Singapore 35 331 467 14 1.6 26 244 341 11 1.2 -26.9<br />
Others 1660 5326 7275 151 25.0 1586 5040 6796 151 24.9 -6.6<br />
TOTAL 4411 21361 29112 638 100.0 4232 20101 27326 615 100.0 -6.1<br />
(a) Please note, that the strong increase of the US flleet is due to a reactivation of parts of the reserve fleet in May 2003.<br />
1.3.3.2 By size class <strong>and</strong> division of age as of January 1st, 2004<br />
Ships of 300 gt <strong>and</strong> over<br />
Dwt-size class<br />
(1) No<br />
(2) 1000 dwt up to<br />
1978<br />
Division of age (year of build)<br />
1979 1984 1989 1994<br />
- 1983 - 1988 - 1993 - 1998<br />
1999<br />
- 2003<br />
Total<br />
dwt-%<br />
share of<br />
total<br />
average<br />
age (years)<br />
< = 2499 (1)<br />
1020 193 211 78 25 2 1529 29.9<br />
(2)<br />
1368 306 344 118 40 3 2179 8.0<br />
2500 - 4999 (1)<br />
466 214 152 89 37 - 958 24.6<br />
(2)<br />
1626 772 533 315 145 - 3391 12.4<br />
5000 - 7499 (1)<br />
136 106 84 42 34 11 413 22.0<br />
(2)<br />
867 664 527 271 213 69 2611 9.6<br />
7500 - 9999 (1)<br />
110 73 64 31 20 23 321 21.1<br />
(2)<br />
919 613 558 274 167 200 2731 10.0<br />
10000 - 12499 (1)<br />
90 28 4 15 3 6 146 31.0<br />
(2)<br />
1006 323 44 177 34 68 1653 6.0<br />
12500 - 14999 (1)<br />
161 73 30 4 9 - 277 28.8<br />
(2)<br />
2222 1002 417 53 115 - 3809 13.9<br />
15000 - 19999 (1)<br />
158 158 76 17 3 2 414 23.3<br />
(2)<br />
2588 2669 1297 296 50 37 6938 25.4<br />
20000 - 24999 (1)<br />
48 47 26 15 13 5 154 20.5<br />
(2)<br />
1059 1056 559 335 299 115 3424 12.5<br />
25000 - 29999 (1)<br />
8 6 1 - - - 15 23.7<br />
(2)<br />
219 161 26 - - - 407 1.5<br />
30000 - 34999 (1)<br />
- 2 - - - - 2 24.5<br />
(2)<br />
- 63 - - - - 63 0.2<br />
35000 - 39999 (1)<br />
- - 1 - - - 1 19.9<br />
(2)<br />
- - 37 - - - 37 0.1<br />
> = 40000 (1)<br />
- - 2 - - - 2 19.7<br />
(2)<br />
- - 83 - - - 83 0.3<br />
TOTAL (1)<br />
2197 900 651 291 144 49 4232 26.2<br />
(2)<br />
11874 7630 4427 1839 1063 493 27325.74 100.0<br />
Continued<br />
SSMR June 2004 41
I 1.3 Special fleets - general cargo ships ISL<br />
1.3.4 Fleet of special general cargo ships<br />
1.3.4.1 By major flags as of January 1st, 2003 <strong>and</strong> 2004<br />
Flag January 1st, 2003 January 1st, 2004<br />
Ships of 300 gt <strong>and</strong> over<br />
dwt-%<br />
change<br />
dwt-rank 1000 1000 1000 dwt-% 1000 1000 1000 dwt-% over<br />
04 ('03) No gt dwt TEU share No gt dwt TEU share prev.year<br />
1 (1) Panama 294 9257 3824 11 38.9 297 9239 3766 8 37.4 -1.5<br />
2 (5) Norway (Total) 91 1244 487 1 5.0 103 1654 708 1 7.0 45.5<br />
- Norway (NIS) 44 1156 435 0 4.4 53 1565 655 0 6.5 50.6<br />
- Norway (NOR) 47 89 52 0 0.5 50 89 54 0 0.5 2.7<br />
3 (2) Liberia 47 1682 816 6 8.3 40 1439 639 3 6.3 -21.7<br />
4 (3) US 24 689 529 1 5.4 25 738 545 4 5.4 3.0<br />
5 (4) Singapore 43 1200 506 2 5.2 44 1218 530 2 5.3 4.6<br />
6 (6) Netherl<strong>and</strong>s (Total) 35 397 451 10 4.6 34 427 489 10 4.9 8.6<br />
- Netherl<strong>and</strong>s Antilles 19 191 241 3 2.4 17 202 227 3 2.3 -5.5<br />
7 (7) Japan 110 860 415 1 4.2 105 933 429 0 4.3 3.4<br />
8 (9) Sweden 23 961 374 1 3.8 24 1018 397 1 3.9 6.2<br />
9 (10) Russia 135 419 325 1 3.3 148 472 371 1 3.7 13.8<br />
10 (8) Bahamas 32 931 397 1 4.0 24 744 315 0 3.1 -20.6<br />
11 (11) Philippines 27 394 176 0 1.8 29 429 198 0 2.0 12.8<br />
12 (12) Saint Vincent 16 124 154 1 1.6 23 159 188 1 1.9 21.9<br />
13 (19) Marshall Isl<strong>and</strong>s 5 186 75 - 0.8 8 268 180 - 1.8 139.9<br />
14 (13) Kuwait 5 132 135 - 1.4 4 122 125 - 1.2 -7.6<br />
15 (14) Malta 20 294 126 0 1.3 17 283 116 0 1.2 -7.9<br />
16 (16) Cyprus 15 171 109 - 1.1 15 171 109 - 1.1 -<br />
17 (18) China, PR of 30 82 87 0 0.9 31 92 95 - 0.9 8.6<br />
18 (17) Vanuatu 6 262 91 1 0.9 6 262 91 1 0.9 -<br />
19 (15) Korea, Rep. of 18 273 124 0 1.3 12 175 87 - 0.9 -29.6<br />
20 (21) Belize 10 46 49 1 0.5 19 80 79 1 0.8 62.5<br />
Others 214 810 578 4 5.9 231 1003 617 5 6.1 6.8<br />
TOTAL 1200 20416 9829 43 100.0 1239 20926 10075 38 100.0 2.5<br />
1.3.4.2 By size class <strong>and</strong> division of age as of January 1st, 2004<br />
Dwt-size class<br />
(1) No<br />
(2) 1000 dwt up to<br />
1978<br />
Ships of 300 gt <strong>and</strong> over<br />
Division of age (year of build)<br />
1979 1984 1989 1994<br />
- 1983 - 1988 - 1993 - 1998<br />
1999<br />
- 2003<br />
Total<br />
dwt-%<br />
share of<br />
total<br />
average<br />
age (years)<br />
< = 2499 (1)<br />
220 65 54 52 34 43 468 23.6<br />
(2)<br />
217 73 45 47 30 29 441 4.4<br />
2500 - 4999 (1)<br />
43 32 29 27 22 17 170 18.6<br />
(2)<br />
137 114 107 92 82 58 589 5.8<br />
5000 - 7499 (1)<br />
13 17 5 8 10 12 65 16.6<br />
(2)<br />
73 104 33 43 65 77 395 3.9<br />
7500 - 9999 (1)<br />
20 18 27 14<br />
6 3 88 18.8<br />
(2)<br />
177 170 249 127 51 26 800 7.9<br />
10000 - 12499 (1)<br />
24 37 18 4<br />
5 9 97 20.9<br />
(2)<br />
271 415 206 46 60 97 1095 10.9<br />
12500 - 14999 (1)<br />
17 31 42 5 21 11 127 17.0<br />
(2)<br />
237 417 574 70 292 150 1740 17.3<br />
15000 - 19999 (1)<br />
7 26 40 9 16 30 128 13.9<br />
(2)<br />
126 444 660 151 262 514 2156 21.4<br />
20000 - 24999 (1)<br />
1 3 10 - 15 20 49 9.0<br />
(2)<br />
23 66 222 - 326 430 1067 10.6<br />
25000 - 29999 (1)<br />
3 4 6 2<br />
- - 15 20.8<br />
(2)<br />
80 113 165 58<br />
- - 416 4.1<br />
30000 - 34999 (1)<br />
4 4 3 - - - 11 24.5<br />
(2)<br />
128 124 100 - - - 352 3.5<br />
35000 - 39999 (1)<br />
5 - - -<br />
- - 5 34.5<br />
(2)<br />
195 - - -<br />
- - 195 1.9<br />
40000 - 44999 (1)<br />
3 1 3 1<br />
- - 8 23.4<br />
(2)<br />
128 41 132 41<br />
- - 341 3.4<br />
> = 45000 (1)<br />
5 - 1 -<br />
- 2 8 22.9<br />
(2)<br />
324 - 48 -<br />
- 114 486 4.8<br />
TOTAL (1)<br />
365 238 238 122 129 147 1239 19.7<br />
(2)<br />
2116 2080 2542 675 1168 1495 10075 100.0<br />
42 SSMR June 2004
I - 1.3 Special fleets - general cargo ships ISL<br />
1.3.5 General cargo reefer ships<br />
1.3.5.1 By major flags as of January 1st, 2003 <strong>and</strong> 2004<br />
Ships of 300 gt <strong>and</strong> over<br />
Flag January 1st, 2003 January 1st, 2004 dwt-%<br />
change<br />
dwt-rank 1000 1000 1000 dwt-% 1000 1000 1000 dwt-% over<br />
'04 ('03) No gt dwt TEU share No gt dwt TEU share prev.year<br />
1 (1) Panama 324 1674 1802 8 25.5 313 1569 1705 8 25.2 -5.4<br />
2 (2) Bahamas 131 1133 1206 14 17.1 127 1122 1195 14 17.7 -0.9<br />
3 (3) Liberia 63 603 621 10 8.8 67 595 621 9 9.2 -0.1<br />
4 (4) Netherl<strong>and</strong>s (Total) 55 390 409 5 5.8 58 426 442 6 6.5 7.9<br />
- Netherl<strong>and</strong>s Antilles 26 188 192 2 2.7 29 207 211 2 3.1 10.1<br />
5 (6) Malta 48 354 358 2 5.1 46 357 362 2 5.4 1.1<br />
6 (5) Cayman Isl<strong>and</strong>s 36 334 371 2 5.2 33 309 340 2 5.0 -8.4<br />
7 (8) Saint Vincent 46 251 264 1 3.7 46 277 295 1 4.4 11.8<br />
8 (7) Cyprus 49 294 334 1 4.7 30 177 199 1 3.0 -40.2<br />
9 (9) Russia 66 265 223 0 3.2 49 160 143 0 2.1 -36.0<br />
10 (28) UK (Total) 4 20 24 0 0.3 18 115 133 1 2.0 447.3<br />
- Isle of Man - - - - - 2 10 12 0 0.2 ...<br />
- UK 4 20 24 0 0.3 16 105 121 1 1.8 397.0<br />
11 (10) Bermuda 15 159 176 2 2.5 11 111 131 2 1.9 -25.9<br />
12 (11) Denmark (Total) 15 106 130 3 1.8 11 92 114 3 1.7 -12.0<br />
- Denmark (DIS) 12 102 126 3 1.8 10 91 114 3 1.7 -9.7<br />
- Denmark (DOR) 3 4 4 0 0.1 1 1 1 - 0.0 -83.2<br />
13 (12) China, PR of 69 96 107 0 1.5 65 93 105 0 1.6 -2.2<br />
14 (13) Philippines 27 84 97 0 1.4 27 82 96 0 1.4 -1.1<br />
15 (18) Antigua & Barbuda 7 50 53 1 0.8 8 58 61 1 0.9 14.5<br />
16 (34) Marshall Isl<strong>and</strong>s 1 12 11 - 0.2 5 50 56 1 0.8 392.9<br />
17 (15) Korea, Rep. of 18 45 58 - 0.8 18 43 53 - 0.8 -7.2<br />
18 (17) Lithuania 16 47 57 0 0.8 15 45 53 0 0.8 -6.0<br />
19 (19) Italy 4 53 52 2 0.7 4 53 52 2 0.8 -<br />
20 (16) Vanuatu 7 54 57 0 0.8 6 48 50 0 0.7 -12.6<br />
Others 224 602 662 4 9.4 216 499 552 3 8.2 -16.6<br />
TOTAL 1225 6626 7073 56 100.0 1173 6283 6758 57 100.0 -4.5<br />
1.3.5.2 By size class <strong>and</strong> division of age as of January 1st, 2004<br />
Dwt-size class<br />
(1) No<br />
(2) 1000 dwt up to<br />
1978<br />
Ships of 300 gt <strong>and</strong> over<br />
Division of age (year of build) dwt-%<br />
average<br />
1979 1984 1989 1994 1999 Total share of<br />
age (years)<br />
- 1983 - 1988 - 1993 - 1998 - 2003<br />
total<br />
< = 2499 (1)<br />
163 86 55 16 15 8 343 26.2<br />
(2)<br />
209 132 81 20 20 8 470 7.0<br />
2500 - 4999 (1)<br />
57 68 39 27 18 3 212 21.3<br />
(2)<br />
207 253 149 103 69 13 794 11.8<br />
5000 - 7499 (1)<br />
16 38 69 89 25 5 242 15.8<br />
(2)<br />
94 235 442 548 152 27 1497 22.2<br />
7500 - 9999 (1)<br />
13 44 26 38 16 12 149 16.4<br />
(2)<br />
115 395 226 327 138 106 1306 19.3<br />
10000 - 12499 (1)<br />
19 19 32 45 32 13 160 14.9<br />
(2)<br />
212 212 356 492 337 143 1751 25.9<br />
12500 - 14999 (1)<br />
3 4 14 22<br />
2 8 53 14.0<br />
(2)<br />
38 52 196 296 27 105 714 10.6<br />
> - 15000 (1)<br />
3 6 1 4<br />
- - 14 22.2<br />
(2)<br />
47 91 19 68<br />
- - 225 3.3<br />
TOTAL (1) 274 265 236 241 108 49 1173 19.8<br />
(2) 922 1371 1468 1852 742 402 6758 100.0<br />
Continued<br />
SSMR June 2004 43
I - 1.3 Special fleets - general cargo ships ISL<br />
1.3.6 Ro-Ro cargo fleet<br />
1.3.6.1 By major flags as of January 1st, 2003 <strong>and</strong> 2004<br />
Flag January 1st, 2003 January 1st, 2004<br />
Ships of 300 gt <strong>and</strong> over<br />
dwt-%<br />
change<br />
dwt-rank 1000 1000 1000 dwt-% 1000 1000 1000 dwt-% over<br />
'04 ('03) No gt dwt TEU share No gt dwt TEU share prev.year<br />
1 (2) Italy 60 1492 827 35 10.2 63 1674 906 39 11.1 9.5<br />
2 (1) US 39 1019 828 40 10.2 41 1150 873 40 10.7 5.4<br />
3 (4) Panama 112 998 650 15 8.0 128 1253 761 17 9.3 17.1<br />
4 (3) Norway (Total) 42 1017 755 18 9.3 45 949 679 21 8.3 -10.1<br />
- Norway (NIS) 35 989 738 18 9.1 35 920 659 21 8.1 -10.8<br />
- Norway (NOR) 7 27 17 0 0.2 10 29 20 0 0.2 16.3<br />
5 (5) Sweden 41 833 556 22 6.8 40 985 672 28 8.2 20.8<br />
6 (7) UK (Total) 45 670 414 18 5.1 45 622 391 17 4.8 -5.6<br />
- Isle of Man 14 179 126 9 1.6 13 117 88 7 1.1 -30.4<br />
- UK 31 491 287 8 3.5 32 505 303 9 3.7 5.4<br />
7 (6) Bahamas 45 688 438 19 5.4 37 628 327 10 4.0 -25.3<br />
8 (8) Japan 63 360 254 2 3.1 62 371 252 2 3.1 -1.0<br />
9 (12) Saudi Arabia 10 195 184 10 2.3 10 199 187 10 2.3 1.7<br />
10 (9) Finl<strong>and</strong> 31 320 225 10 2.8 27 259 185 8 2.3 -17.6<br />
11 (10) Malta 33 330 201 10 2.5 27 288 182 10 2.2 -9.5<br />
12 (14) Turkey 20 319 178 10 2.2 21 304 167 9 2.0 -5.9<br />
13 (13) Saint Vincent 34 231 178 8 2.2 33 223 166 8 2.0 -6.8<br />
14 (17) Brazil 12 157 153 10 1.9 13 158 153 10 1.9 0.2<br />
15 (11) Spain 37 309 190 7 2.3 31 249 153 5 1.9 -19.5<br />
16 (15) Liberia 12 229 161 9 2.0 10 202 147 8 1.8 -8.7<br />
17 (18) Netherl<strong>and</strong>s (Total) 23 249 147 2 1.8 20 211 124 2 1.5 -15.4<br />
- Netherl<strong>and</strong>s Antilles 7 21 17 1 0.2 7 21 17 1 0.2 -<br />
18 (16) Cyprus 22 228 161 8 2.0 16 163 117 5 1.4 -27.2<br />
19 (20) Philippines 45 118 113 0 1.4 45 116 112 0 1.4 -1.1<br />
20 (19) Antigua & Barbuda 27 160 131 9 1.6 22 131 109 7 1.3 -17.0<br />
Others 429 1876 1392 46 17.1 444 2114 1507 54 18.4 8.3<br />
TOTAL 1182 11799 8137 308 100.0 1180 12246 8171 311 100.0 0.4<br />
1.3.6.2 By size class <strong>and</strong> division of age as of January 1st, 2004<br />
Ships of 300 gt <strong>and</strong> over<br />
(1) No<br />
Division of age (year of build)<br />
dwt-% average<br />
Dwt-size class (2) 1000 dwt<br />
up to<br />
1978<br />
1979<br />
- 1983<br />
1984<br />
- 1988<br />
1989<br />
- 1993<br />
1994<br />
- 1998<br />
1999<br />
- 2003<br />
Total<br />
share of<br />
total<br />
age<br />
(years)<br />
< = 2499 (1)<br />
177 72 32 40 50 28 399 22.9<br />
(2)<br />
193 70 27 28 42 24 384 4.7<br />
2500 - 4999 (1)<br />
95 74 37 27 11 10 254 22.6<br />
(2)<br />
341 277 149 102 46 41 957 11.7<br />
5000 - 7499 (1)<br />
28 33 28 19 23 38 169 15.2<br />
(2)<br />
169 212 173 115 137 251 1057 12.9<br />
7500 - 9999 (1)<br />
24 17 14 9 24 22 110 14.8<br />
(2)<br />
218 147 126 75 208 199 974 11.9<br />
10000 - 12499 (1)<br />
9 13 6 4 11 11 54 15.2<br />
(2)<br />
97 143 66 45 127 127 607 7.4<br />
12500 - 14999 (1)<br />
13 12 5 4 6 18 58 14.7<br />
(2)<br />
179 166 69 54 81 241 790 9.7<br />
15000 - 19999 (1)<br />
16 4 3 6 2 17 48 14.2<br />
(2)<br />
270 69 54 105 37 300 835 10.2<br />
20000 - 24999 (1)<br />
18 12 2 - 2 6 40 21.4<br />
(2)<br />
399 268 43 - 48 133 891 10.9<br />
25000 - 29999 (1)<br />
2 6 2 - 2 5 17 14.6<br />
(2)<br />
57 168 55 - 52 131 463 5.7<br />
30000 - 34999 (1)<br />
4 8 - 2 - - 14 22.6<br />
(2)<br />
125 260 - 67 - - 453 6<br />
35000 - 39999 (1)<br />
- - - - - 4 4 3.3<br />
(2)<br />
- - - - - 156 156 1.9<br />
> = 40000 (1)<br />
- 7 5 - 1 - 13 19.7<br />
(2)<br />
- 297 258 - 49 - 604 7.4<br />
TOTAL (1)<br />
386 258 134 111 132 159 1180 19.6<br />
(2)<br />
2050 2078 1022 591 827 1603 8171 100<br />
Source: ISL merchant fleet data bases; based on quarterly updates from LR/Fairplay<br />
44 SSMR June 2004
I - 1.3 Special fleets - container ships ISL<br />
1.3.7 Fully cellular container fleet<br />
1.3.7.1 Fleet development as of January 1st, 1995-2004<br />
% share<br />
% share<br />
% share<br />
% share<br />
Year<br />
No of of world 1000 of world 1000 of world 1000 of world<br />
January 1st<br />
ships<br />
fleet<br />
gt fleet<br />
dwt fleet TEU fleet<br />
1995<br />
1590 4.4 34859 8.0 38851 5.7 2355 56.6<br />
1996<br />
1747 4.7 38519 8.4 43234 6.2 2679 58.8<br />
1997<br />
1930 5.1 42770 9.0 48205 6.7 3053 61.5<br />
1998<br />
2170 5.6 48479 9.9 55068 7.4 3557 64.8<br />
1999<br />
2363 8.1 52935 10.7 60709 8.1 4017 66.8<br />
2000<br />
2437 8.3 55101 10.7 63296 8.1 4273 67.6<br />
2001<br />
2564 6.6 59837 11.5 68715 8.8 4674 68.7<br />
2002<br />
2726 7.0 66402 12.4 76131 9.5 5288 71.4<br />
2003<br />
2905 7.4 72894 13.6 83744 10.5 5893 79.5<br />
2004<br />
Average yearly growth<br />
3036 7.8 78176 14.5 90214 11.3 6424 86.7<br />
1995 - 2004 7.5 9.4 9.8 11.8<br />
2000 - 2004 5.6 9.1 9.3 10.7<br />
1.3.7.2 By size class <strong>and</strong> division of age as of January 1st, 2004<br />
Ships of 300 gt <strong>and</strong> over<br />
TEU-% change<br />
over<br />
prev. period<br />
Ships of 300 gt <strong>and</strong> over<br />
Division of age (year of build) TEU-%<br />
Dwt - size class (1) No of ships up to 1979 1984 1989 1994 1999 Total share of average<br />
(2) 1000 TEU 1978 -1983 -1988 -1993 -1998 -2003<br />
total age<br />
< = 9999 (1) 95 73 52 64 217 107 608 13.2<br />
(2) 24 30 22 27 104 59 266 4.1<br />
10000 - 14999 (1) 15 37 31 55 129 69 336 10.5<br />
(2) 9 26 27 52 120 68 302 4.7<br />
15000 - 19999 (1) 28 18 27 27 98 77 275 10.4<br />
(2) 27 18 27 30 111 96 309 4.8<br />
20000 - 24999 (1) 27 29 18 62 175 71 382 10.5<br />
(2) 31 36 26 82 284 116 575 9.0<br />
25000 - 29999 (1) 13 38 20 17 28 31 147 14.4<br />
(2) 20 56 31 30 51 61 249 3.9<br />
30000 - 34999 (1) 8 47 30 24 79 120 308 9.3<br />
(2) 15 102 56 47 184 291 696 10.8<br />
35000 - 39999 (1) 15 19 24 8 33 36 135 12.4<br />
(2) 34 41 59 24 89 100 346 5.4<br />
40000 - 44999 (1) 5 6 66 31 41 27 176 12.2<br />
(2) 13 15 192 91 130 85 527 8.2<br />
45000 - 49999 (1) 6 5 8 44 50 5 118 11.1<br />
(2) 16 13 28 136 181 20 394 6.1<br />
50000 - 59999 (1) 1 5 33 28 47 69 183 8.3<br />
(2) 2 16 126 108 187 292 731 11.4<br />
60000 - 69999 (1) - - 2 29 93 130 254 5.4<br />
(2) - - 8 123 446 686 1262 19.6<br />
70000 - 79999 (1) - - - - - 27 27 1.9<br />
(2) - - - - - 165 165 2.6<br />
80000 - 99999 (1) - - - - 15 45 60 2.8<br />
(2) - - - - 96 298 394 6.1<br />
> = 100000 (1) - - - - 6 21 27 3.0<br />
(2) - - - - 43 165 208 3.2<br />
TOTAL (1) 213 277 311 389 1011 835 3036 10.5<br />
(2) 191 353 603 750 2026 2501 6424 100.0<br />
TEU-% share of total 3.0 5.5 9.4 11.7 31.5 38.9 100.0<br />
15.3<br />
13.8<br />
14.0<br />
16.5<br />
12.9<br />
6.4<br />
9.4<br />
13.1<br />
11.4<br />
9.0<br />
Continued<br />
SSMR June 2004 45
I - 1.3 Special fleets - container ships ISL<br />
1.3.7.3 By registered flags <strong>and</strong> countries of domicile according to country groups<br />
as of January 1st, 2003 <strong>and</strong> 2004<br />
Ships of 1000 gt <strong>and</strong> over<br />
January, 1 st 2003 January, 1 st 2004<br />
Country group %-share 1000 %-share 1000 %-share %-share 1000 %-share 1000 %-share<br />
No of total dwt of total TEU of total No of total dwt of total TEU of total<br />
Registered flag<br />
OECD<br />
of which<br />
762 26.3 26234 31.3 1888 32.0 775 25.6 27761 30.8 2013 31.3<br />
EU 568 19.6 20956 25.0 1513 25.7 584 19.3 22627 25.1 1647 25.6<br />
Open Registry Countries 1465 50.6 42177 50.4 2996 50.8 1553 51.3 46700 51.8 3355 52.2<br />
Developing countries 312 10.8 5338 6.4 323 5.5 321 10.6 5863 6.5 375 5.8<br />
Others 355 12.3 9980 11.9 685 11.6 376 12.4 9875 10.9 680 10.6<br />
TOTAL<br />
Country of domicile<br />
2894 100.0 83729 100.0 5892 100.0 3025 100.0 90199 100.0 6423 100.0<br />
OECD<br />
of which<br />
1807 62.4 55579 66.4 3963 67.3 2028 67.0 65586 72.7 4723 73.5<br />
EU 1242 42.9 37867 45.2 2710 46.0 1417 46.8 45572 50.5 3298 51.3<br />
Open Registry Countries 8 0.3 198 0.2 14 0.2 10 0.3 236 0.3 18 0.3<br />
Developing countries 359 12.4 6878 8.2 434 7.4 364 12.0 6928 7.7 453 7.0<br />
Others 466 16.1 14140 16.9 986 16.7 446 14.7 13480 14.9 945 14.7<br />
Unknown 254 8.8 6934 8.3 494 8.4 177 5.9 3969 4.4 284 4.4<br />
TOTAL 2894 100.0 83729 100.0 5892 100.0 3025 100.0 90199 100.0 6423 100.0<br />
1.3.7.4 By registered flags <strong>and</strong> countries of domicile according to regions as of January 1st, 2000 - 2004<br />
Ships of 1000 gt <strong>and</strong> over<br />
Region 2000 2001 2002 2003 2004<br />
Av. growth rate<br />
2000-2004<br />
No 1000 TEU No 1000 TEU No 1000 TEU No 1000 TEU No 1000 TEU No 1000 TEU<br />
Registered flag<br />
Europe 615 1210 633 1347 644 1434 673 1645 693 1779 3.0 10.1<br />
North America 86 222 86 224 88 229 89 239 85 239 -0.3 1.9<br />
Latin <strong>and</strong> South America 740 1262 782 1366 852 1586 897 1767 944 1997 6.3 12.1<br />
Asia <strong>and</strong> Oceania 766 1160 799 1198 822 1313 891 1419 918 1446 4.6 5.7<br />
Africa 222 418 254 539 310 724 344 822 385 962 14.8 23.2<br />
Total 2429 4272 2554 4674 2716 5287 2894 5892 3025 6423 5.6 10.7<br />
Country of domicile<br />
Europe 1123 2065 1262 2499 1331 2793 1401 3041 1591 3682 9.1 15.6<br />
North America 114 266 84 173 99 240 118 307 124 326 2.1 5.2<br />
Latin <strong>and</strong> South America 19 15 15 9 17 26 15 26 8 7 -19.4 -16.0<br />
Asia <strong>and</strong> Oceania 1018 1734 1037 1769 1070 1904 1100 2018 1120 2118 2.4 5.1<br />
Africa 13 19 8 7 7 6 6 6 5 6 -21.2 -25.6<br />
Unknown 142 174 148 216 192 319 254 494 177 284 5.7 13.1<br />
Total 2429 4272 2554 4674 2716 5287 2894 5892 3025 6423 5.6 10.7<br />
46 SSMR June 2004
I - 1.3 Special fleets - container ships ISL<br />
Fig. I - 4: Container ships - fleet development by TEU-size class as of January 1st, 1988 - 2004 (in TEU)<br />
1000 TEU<br />
2500<br />
2000<br />
1500<br />
1000<br />
Fig. I - 5: Container ships - by registered flags <strong>and</strong> countries of domicile according to regions<br />
as of January 1st, 1995 - 2004 (in TEU)<br />
1000 TEU<br />
500<br />
0<br />
Registered flags<br />
2000<br />
1600<br />
1200<br />
800<br />
400<br />
1988 1989 1990 1991 1992 1993 1994 1995 1996 1997 1998 1999 2000 2001 2002 2003 2004<br />
0<br />
Note: Ships of 1000 gt <strong>and</strong> over<br />
- 1999 TEU 2000 - 3999 TEU 4000-4999 TEU > 5000 TEU<br />
Note: ships of 300gt <strong>and</strong> over ISL 2004<br />
Countries of domicile<br />
1000 TEU<br />
3750<br />
3000<br />
2250<br />
1500<br />
750<br />
0<br />
1995 1996 1997 1998 1999 2000 2001 2002 2003 2004<br />
North America Europe Asia <strong>and</strong> Oceania Latin <strong>and</strong> South America Others<br />
1995 1996 1997 1998 1999 2000 2001 2002 2003 2004<br />
North America Europe Asia <strong>and</strong> Oceania Latin <strong>and</strong> South America Others (incl unknown)<br />
ISL 2004<br />
SSMR June 2004 47
I - 1.3 Special fleets - container ships ISL<br />
1.3.7.5 By major flags as of January 1st, 2003 <strong>and</strong> 2004<br />
Ships of 300 gt <strong>and</strong> over<br />
Flag January 1st, 2003 January 1st, 2004<br />
TEU-rank 1000 1000 1000 TEU-% 1000 1000 1000 TEU-% TEU-% change<br />
'04 ('03) No gt dwt TEU share No gt dwt TEU share over prev.year<br />
1 (1) Panama 555 16355 18160 1286 21.8 583 18598 20712 1477 23.0 14.8<br />
2 (2) Liberia 334 9450 11235 812 13.8 376 10905 12898 952 14.8 17.3<br />
3 (3) Germany, FR of 205 5640 6898 513 8.7 161 5139 6166 462 7.2 -9.8<br />
4 (7) UK (Total) 99 3268 3658 264 4.5 137 4548 5124 382 6.0 44.7<br />
- Isle of Man 19 321 416 28 0.5 13 214 266 19 0.3 -34.0<br />
- UK 80 2947 3242 236 4.0 124 4334 4858 364 5.7 54.1<br />
5 (5) Denmark (Total) 74 3868 4329 301 5.1 80 4261 4875 344 5.4 14.2<br />
- Denmark (DIS) 74 3868 4329 301 5.1 80 4261 4875 344 5.4 14.2<br />
- Denmark (DOR) - - -<br />
- - - - -<br />
- -<br />
-<br />
6 (6) Antigua & Barbuda 197 2739 3516 268 4.5 227 3304 4256 322 5.0 20.2<br />
7 (4) Singapore 175 3804 4536 309 5.2 185 3896 4658 316 4.9 2.3<br />
8 (8) US 87 3209 3308 238 4.0 84 3170 3306 239 3.7 0.4<br />
9 (9) Cyprus 131 2702 3205 221 3.8 124 2655 3236 227 3.5 2.6<br />
10 (10) Hong Kong (SAR) 77 2261 2563 182 3.1 87 2361 2656 192 3.0 5.0<br />
11 (15) China, PR of 119 1675 2044 108 1.8 132 2191 2605 161 2.5 49.0<br />
12 (12) Greece 44 1796 1991 144 2.4 47 1989 2235 160 2.5 11.2<br />
13 (11) Bahamas 81 2298 2347 158 2.7 72 1838 2007 139 2.2 -11.9<br />
14 (13) Netherl<strong>and</strong>s (Total) 71 1799 2024 143 2.4 74 1762 1992 139 2.2 -3.3<br />
- Netherl<strong>and</strong>s Antilles 21 388 477 30 0.5 22 402 496 31 0.5 3.6<br />
15 (14) Marshall Isl<strong>and</strong> 65 1509 1793 132 2.2 75 1379 1677 124 1.9 -6.3<br />
16 (17) Malta 57 1093 1298 82 1.4 51 1029 1221 72 1.1 -12.0<br />
17 (22) Israel 15 593 690 49 0.8 18 753 882 63 1.0 29.7<br />
18 (16) Taiwan 49 1384 1602 106 1.8 35 799 957 61 0.9 -42.8<br />
19 (18) Italy 29 961 1005 71 1.2 24 801 821 60 0.9 -15.0<br />
20 (20) Korea, Rep. of 47 715 831 57 1.0 53 688 800 55 0.8 -3.8<br />
21 (19) Malaysia 56 737 910 57 1.0 52 685 855 54 0.8 -5.3<br />
22 (21) France (Total) 15 658 723 55 0.9 13 566 629 50 0.8 -8.0<br />
- Kerguelen 15 658 723 55 0.9 13 566 629 50 0.8 -8.0<br />
23 (23) Japan 21 594 594 39 0.7 17 464 475 32 0.5 -19.6<br />
24 (25) Bermuda 15 393 420 25 0.4 17 465 486 31 0.5 21.1<br />
25 (24) Turkey 32 289 362 29 0.5 30 270 340 26 0.4 -7.2<br />
26 (29) Gibraltar 12 171 213 15 0.3 18 233 284 21 0.3 34.4<br />
27 (26) Russia 21 259 298 19 0.3 21 259 298 19 0.3 -<br />
28 (31) Iran 7 154 179 14 0.2 9 205 247 19 0.3 35.4<br />
29 - Belgium - - -<br />
- - 8 293 317 17 0.3 ...<br />
30 (27) Thail<strong>and</strong> 16 162 219 16 0.3 16 162 219 16 0.2 -<br />
31 (28) UAE 6 214 227 15 0.3 6 214 227 15 0.2 -<br />
32 (37) Spain 17 123 163 10 0.2 20 178 236 15 0.2 48.1<br />
33 (30) Kuwait 6 214 227 15 0.3 6 214 227 15 0.2 -<br />
34 (32) Qatar 6 170 184 13 0.2 8 184 202 14 0.2 8.0<br />
35 (33) Indonesia 32 171 223 12 0.2 32 174 228 13 0.2 2.5<br />
36 (34) Saint Vincent 30 164 204 12 0.2 28 170 208 12 0.2 4.6<br />
37 (39) Luxembourg 8 90 115<br />
9 0.2 10 127 162 12 0.2 37.4<br />
38 (36) Brazil 7 158 190 11 0.2 8 182 213 12 0.2 11.2<br />
39 (35) Saudi Arabia 4 149 156 11 0.2 4 149 156 11 0.2 -<br />
40 (38) India 8 116 152<br />
9 0.2 8 116 152<br />
9 0.1 -<br />
Total 40 flags 2830 72105 82791 5831 99.0 2956 77379 89243 6360 99.0 9.1<br />
Other flags 75 789 953 62 1.0 80 797 970 64 1.0 3.2<br />
WORLD TOTAL<br />
Country groups<br />
2905 72894 83744 5893 100.0 3036 78176 90214 6424 100.0 9.0<br />
OECD 766 23185 26239 1888 32.0 779 24472 27766 2013 31.3 6.6<br />
of which EU 569 18245 20958 1513 25.7 585 19724 22628 1647 25.6 8.8<br />
Open Registry (a) 1465 36703 42177 2996 50.8 1553 40343 46700 3355 52.2 12.0<br />
Developing countries 317 4468 5346 323 5.5 326 4934 5871 375 5.8 16.0<br />
Others 357 8538 9982 685 11.6 378 8427 9876 680 10.6 -0.8<br />
WORLD TOTAL 2905 72894 83744 5893 100.0 3036 78176 90214 6424 100.0 9.0<br />
(a) Open registry flags include Bahamas, Bermuda, Cyprus, Liberia, Panama as "Majors" <strong>and</strong> Malta, Saint Vincent, Marshall Isl<strong>and</strong>s, Cayman Isl<strong>and</strong>s <strong>and</strong><br />
Antigua & Barbuda<br />
Note: For definition compare "Definitions".<br />
48 SSMR June 2004
I 1.3 Special fleets - container ships ISL<br />
1.3.7.6 By size class <strong>and</strong> division of TEU-capacity as of January 1st, 2004<br />
Ships of 300 gt <strong>and</strong> over<br />
(1) No of<br />
Division of capacity (in TEU)<br />
dwt - ships TEU- % share<br />
size class (2) 1000 capacity < = 1000 1500 2000 2500 3000 3500 4000 4500 5000 5500 6000 > = of total<br />
TEU unknown 999 -1499 -1999 -2499 -2999 -3499 -3999 -4499 -4999 -5499 -5999 -6999 7000 TOTAL TEU<br />
< = 9999 (1)<br />
15 591 2 - - - - - - - - - - - 608<br />
(2)<br />
... 264 2 - - - - - - - - - - - 266 4.1<br />
10000 - 14999 (1)<br />
... 205 131 - - - - - - - - - - - 336<br />
(2)<br />
... 156 146 - - - - - - - - - - - 302 4.7<br />
15000 - 19999 (1)<br />
... 56 200 18 1 - - - - - - - - - 275<br />
(2)<br />
... 48 229 29 2 - - - - - - - - - 309 4.8<br />
20000 - 24999 (1)<br />
... 12 132 230 8 - - - - - - - - - 382<br />
(2)<br />
... 10 169 379 17 - - - - - - - - - 575 9.0<br />
25000 - 29999 (1)<br />
... 4 39 78 21 5 - - - - - - - - 147<br />
(2)<br />
... 4 52 135 44 14 - - - - - - - - 249 3.9<br />
30000 - 34999 (1)<br />
... - 4 59 181 61 3 - - - - - - - 308<br />
(2)<br />
... - 5 108 412 161 9 - - - - - - - 696 10.8<br />
35000 - 39999 (1)<br />
... - - 8 50 64 12 1 - - - - - - 135<br />
(2)<br />
... - - 15 114 176 38 4 - - - - - - 346 5.4<br />
40000 - 44999 (1)<br />
... - - 1 9 78 79 9 - - - - - - 176<br />
(2)<br />
... - - 2 22 215 257 33 - - - - - - 527 8.2<br />
45000 - 49999 (1)<br />
... - - - 4 21 45 44 4 - - - - - 118<br />
(2)<br />
... - - - 10 57 144 166 17 - - - - - 394 6.1<br />
50000 - 59999 (1)<br />
... - - - 2 3 21 38 106 11 - 2 - - 183<br />
(2)<br />
... - - - 5 8 70 142 445 51 - 11 - - 731 11.4<br />
60000 - 69999 (1)<br />
... - - - - - - 18 46 67 40 81 2 - 254<br />
(2)<br />
... - - - - - - 69 196 317 211 456 13 - 1262 19.6<br />
70000 - 79999 (1)<br />
... - - - - - - - - - - 7 20 - 27<br />
(2)<br />
... - - - - - - - - - - 39 126 - 165 2.6<br />
80000 - 99999 (1)<br />
... - - - - - - - - - - - 58 2 60<br />
(2)<br />
... - - - - - - - - - - - 378 16 394 6.1<br />
> =100000 (1)<br />
... - - - - - - - - - - - - 27 27<br />
(2)<br />
... - - - - - - - - - - - - 208 208 3.2<br />
TOTAL (1)<br />
15 868 508 394 276 232 160 110 156 78 40 90 80 29 3036<br />
(2)<br />
... 483 603 667 625 631 518 413 658 367 211 506 517 224 6424 100.0<br />
TEU - share of total ... 7.5 9.4 10.4 9.7 9.8 8.1 6.4 10.2 5.7 3.3 7.9 8.0 3.5 100.0<br />
1.3.7.7 By country groups <strong>and</strong> division of TEU-capacity as of January 1st, 2004<br />
Ships of 300 gt <strong>and</strong> over<br />
(1) No of<br />
Division of capacity (in TEU)<br />
ships TEU- % share<br />
Country group (2) 1000 capacity < = 1000 1500 2000 2500 3000 3500 4000 4500 5000 5500 6000 > = of total<br />
TEU unknown 999 -1499 -1999 -2499 -2999 -3499 -3999 -4499 -4999 -5499 -5999 -6999 7000 TOTAL TEU<br />
OECD (1)<br />
3 211 77 81 75 52 42 48 56 46 10 14 37 27 779<br />
(2)<br />
... 122 91 139 171 145 134 180 236 215 54 79 240 208 2013 31.3<br />
of which EU (1)<br />
1 138 54 63 62 31 34 41 46 32 7 12 37 27 585<br />
(2)<br />
... 89 63 107 143 87 108 154 193 150 38 68 240 208 1647 25.6<br />
Open Registry (1)<br />
1 341 295 248 165 145 92 36 87 18 20 62 43 - 1553<br />
Flags (a)<br />
(2)<br />
... 207 350 419 372 392 300 134 367 84 105 349 277 - 3355 52.2<br />
Developing (1)<br />
11 182 51 27 15 8 4 19 3 - - 6 - - 326<br />
Countries<br />
(2)<br />
... 80 62 46 33 22 13 72 13 - - 34 - - 375 5.8<br />
Others (1)<br />
- 134 85 38 21 27 22 7 10 14 10 8 - 2 378<br />
(2)<br />
... 74 100 64 49 72 71 26 43 68 51 45 - 16 680 10.6<br />
TOTAL (1)<br />
15 868 508 394 276 232 160 110 156 78 40 90 80 29 3036<br />
(2)<br />
... 483 603 667 625 631 518 413 658 367 211 506 517 224 6424 100.0<br />
(a) Open registry flags include Bahamas, Bermuda, Cyprus, Liberia, Panama as "Majors" <strong>and</strong> Malta, Saint Vincent, Marshall Isl<strong>and</strong>s, Cayman Isl<strong>and</strong>s <strong>and</strong><br />
Antigua & Barbuda<br />
(Source: ISL merchant fleet data bases; based on quarterly updates from LR/Fairplay)<br />
SSMR June 2004 49
I 1.3 Special fleet - container ships ISL<br />
1.3.7.7 Top 15 container operators as of February 2004<br />
Fully cellular container ships of 1000 TEU <strong>and</strong> over<br />
Owned ships Chartered ships<br />
Total % share of<br />
Operator No of ships 1000 TEU No of ships 1000 TEU No of ships 1000 TEU Total TEU % charter av TEU<br />
MAERSK SEALAND 115 445.3 135 332.9 250 778.2 13.0 42.8 3113<br />
MSC 90 272.7 75 202.9 165 475.6 8.0 42.7 2882<br />
EVERGREEN 98 327.2 42 102.0 140 429.2 7.2 23.8 3066<br />
PONL 50 190.3 76 195.4 126 385.7 6.5 50.6 3061<br />
HANJIN 20 89.4 56 202.2 76 291.6 4.9 69.3 3837<br />
APL 30 132.2 37 137.7 67 269.9 4.5 51.0 4029<br />
CMA-CGM 17 57.3 67 196.4 84 253.7 4.3 77.4 3020<br />
NYK 25 104.2 43 97.4 68 201.6 3.4 48.3 2964<br />
COSCO 58 181.9 5 14.6 63 196.5 3.3 7.4 3119<br />
K-LINE 16 61.6 42 132.9 58 194.4 3.3 68.3 3352<br />
MOL 26 103.4 26 70.5 52 173.9 2.9 40.6 3345<br />
OOCL 20 97.1 19 70.0 39 167.1 2.8 41.9 4285<br />
HAPAG-LLOYD 25 117.5 16 46.4 41 163.9 2.7 28.3 3997<br />
CSCL 8 41.8 33 110.0 41 151.8 2.5 72.5 3704<br />
YANGMING 24 73.6 28 66.6 52 140.2 2.3 47.5 2696<br />
OTHERS 299 644.8 406 775.9 705 1420.7 23.8 54.6 2015<br />
UNKNOWN ... ... ... ... 137 273.6 4.6 ... 1997<br />
Total<br />
Note: excl. unknown operators<br />
921 2940.4 1106 2753.8 2164 5967.8 100.0 46.1 2758<br />
1.3.7.8 The Global Players as of February 2004<br />
Containerships of 1000 TEU <strong>and</strong> over<br />
Fleet Capacity<br />
Employed in Alliances Total fleet of operator<br />
Av. ship size (in<br />
% of Av. ship size (in max. ship<br />
Alliance Operator No of ships 1000 TEU<br />
TEU) No of ships 1000 TEU total<br />
TEU) (in TEU)<br />
CHKY Alliance Total<br />
of which<br />
148 640.5 4328 249 822.7 13.8 3304<br />
Hanjin 50 234.3 4686 76 291.6 3837 5750<br />
K-Line 35 156.0 4457 58 194.4 3352 5600<br />
Cosco 34 145.5 4279 63 196.5 3119 5618<br />
Yangming 29 104.7 3610 52 140.2 2696 5618<br />
Gr<strong>and</strong> Alliance / Total 132 627.8 4756 354 1126.0 18.9 3181<br />
Gr<strong>and</strong> Americana of which<br />
PONL 38 178.7 4703 126 385.7 3061 6802<br />
NYK 29 134.2 4628 68 201.6 2965 6200<br />
Hapag Lloyd 28 141.2 5043 41 163.8 3995 7500<br />
OOCL 24 130.0 5417 39 167.1 4285 8060<br />
CP Ships 6 18.8 3133 52 136.2 2619 4112<br />
MISC 4 15.5 3885 14 31.1 2221 4469<br />
TMM 3 9.5 3166 14 40.5 2893 4050<br />
New World Alliance Total<br />
of which<br />
81 401.5 4957 150 566.0 9.5 3773<br />
APL 41 194.1 4734 67 270.0 4030 5762<br />
Hyundai 18 98.6 5478 31 122.1 3939 6400<br />
MOL 22 108.8 4945 52 173.9 3344 6400<br />
Maersk-Seal<strong>and</strong> 250 778.2 13.0 3113 7300<br />
MSC 165 475.6 8.0 2882 6750<br />
Evergreen 140 429.2 7.2 3066 6332<br />
CMA-CGM 84 253.7 4.3 3020 6620<br />
Others incl unknown 772 1516.4 25.4 1949 5750<br />
Total fleet 2164 5967.8 100.0 2758 8060<br />
APL incl. NOL; CMA-CGM incl. ANL-CL, Ybarra; Evergreen incl. Hatsu Marine, Lloyd Trestino; Hanjin incl. Senator; Maersk SeaL<strong>and</strong> incl. Safmarine; NYK incl.<br />
TSK; P&O Nedlloyd incl. Farrell, P&O Swire, CP Ships incl. ANZL, Canada Maritime, Contship, Italia, Lykes.<br />
Source: ISL based on MDS Transmodal<br />
50 SSMR June 2004
I - 2 Freight market ISL<br />
2.1 Hamburg Index for Containership Time-Charter-Rates 2003 <strong>and</strong> 2004<br />
Gearless<br />
200-299 TEU<br />
-min 14 kn<br />
300-500 TEU<br />
-min 15 kn<br />
2000/+TEU<br />
-min 22 kn<br />
Month 2003 2004 2003 2004 2003 2004<br />
Jan. 17.7 22.2 14.1 18.5 6.0 11.1<br />
Feb. 17.4 21.1 16.1 17.9 6.6 15.4<br />
March 19.3 22.2 17.6 19.4 8.1 15.4<br />
April 18.8 22.5 17.3 20.7 9.1 13.7<br />
May 20.3 22.0 17.4 20.7 10.1 13.7<br />
June 19.2 17.7 11.0<br />
July 17.9 18.6 11.4<br />
Aug. 19.6 17.6 10.9<br />
Sep. 20.0 17.8 10.7<br />
Oct. 21.2 17.8 11.2<br />
Nov. 21.0 19.3 10.8<br />
Dec. 22.5 18.3 11.0<br />
Average 19.6 22.0 17.5 19.4 9.8 13.9<br />
Geared<br />
200-299 TEU<br />
-min 14 kn<br />
300-500 TEU<br />
-min 15 kn<br />
600-799 TEU<br />
-min 17-17.9 kn*<br />
Month 2003 2004 2003 2004 2003 2004<br />
Jan. 17.3 21.5 13.8 19.5 9.9 14.3<br />
Feb. 17.7 22.9 14.5 18.3 10.4 14.8<br />
March 17.7 23.3 14.6 18.8 10.7 16.2<br />
April 18.1 25.2 14.5 21.9 11.9 19.0<br />
May 20.3 25.2 15.6 20.3 12.0 17.7<br />
June 19.5 15.5 12.7<br />
July 18.8 14.7 12.0<br />
Aug. 18.4 17.0 13.4<br />
Sep. 18.2 16.4 13.9<br />
Oct. 19.1 16.6 13.6<br />
Nov. 21.5 17.2 13.2<br />
Dec. 20.6 16.3 13.5<br />
Average 18.9 23.6 15.6 19.8 12.2 16.4<br />
700-999 TEU 1000-1299 TEU 1600-1999 TEU<br />
-over 18 kn* -min 19 kn -min 20 kn<br />
Month 2003 2004 2003 2004 2003 2004<br />
Jan. 9.3 14.1 7.7 13.7 6.4 12.5<br />
Feb. 9.9 15.0 8.4 15.5 7.0 13.2<br />
March 10.1 15.8 8.9 16.6 8.5 14.3<br />
April 11.2 16.8 9.8 17.6 9.7 13.9<br />
May 11.7 19.5 11.4 19.0 11.1 17.9<br />
June 12.2 12.2 10.0<br />
July 12.5 12.4 11.5<br />
Aug. 13.0 13.7 11.2<br />
Sep. 13.2 13.9 11.8<br />
Oct. 14.0 15.1 11.7<br />
Nov. 14.4 14.0 10.1<br />
Dec. 13.2 12.1 11.3<br />
Average 12.1 16.2 11.6 16.5 10.0 14.3<br />
(Source: ISL Bremen 2004; based on Vereinigung Hamburger Schiffsmakler und Schiffsagenten e.V.)<br />
24.0<br />
21.0<br />
18.0<br />
15.0<br />
12.0<br />
9.0<br />
6.0<br />
3.0<br />
28.0<br />
24.0<br />
20.0<br />
16.0<br />
12.0<br />
8.0<br />
4.0<br />
20.0<br />
16.0<br />
12.0<br />
8.0<br />
4.0<br />
Values in US$ per 14 t/ TEU per day<br />
200-299 TEU -min14kn-COMPACT-2 month or more<br />
300-500 TEU -min 15 kn-COMPACT<br />
2000/+ TEU -min 22 kn-CELLED<br />
2000 2001 2002 2003 2004<br />
200-299 TEU -min14kn-COMPACT-2 month or more<br />
300-500 TEU -min 15kn-COMPACT<br />
600-799 TEU -min 17-17.9 kn-CELLED*<br />
2000 2001 2002 2003 2004<br />
700-999 TEU -min 18 kn-CELLED*<br />
1000-1299 TEU -min 19 kn-CELLED<br />
1600-1999 TEU -min 20 kn-CELLED<br />
2000 2001 2002 2003 2004<br />
*Note: Since July 2002, Geared 600-799 TEUx14t hom - over 18kn - CELLED -3 mos or more has been displaced by 600-799 TEUx14t hom - min 17-17.9 kn -<br />
CELLED -3 mos or more <strong>and</strong> Geared 600-799 TEUx14t hom - over 18 kn - CELLED -3 mos or more has been displaced by 700-999 TEUx14t hom - min 18 kn -<br />
CELLED -3 mos or more<br />
The Hamburg Index for Containership Time-Charter-Rates is based on the broad database of approximately 20-30 Ship Brokers in Hamburg <strong>and</strong> therefore offers a<br />
profound information of the market for selected container ship types. If not otherwise mentioned the time charter period was determined on at least 3 months. For<br />
more information see: http://www.vhss.de/hax.html<br />
SSMR June 2004 51<br />
ISL<br />
ISL<br />
ISL
I - 2 Freight market ISL<br />
2.2 German sea freight indices<br />
2.2.1 Liner trade<br />
Overall index<br />
Month 1999 2000 2001 2002 2003 2004<br />
Jan. 77.3 103.6 119.1 92.8 96.0 93.2<br />
Feb. 78.9 102.8 120.6 92.6 95.5 93.1<br />
March 80.1 104.6 121.4 94.8 100.5 96.4<br />
April 82.5 112.6 122.2 95.2 107.0 100.0<br />
May 82.8 119.4 121.0 94.3 99.1 99.4<br />
June 84.4 115.6 119.1 94.1 100.5<br />
July 85.9 114.4 117.2 94.2 102.6<br />
Aug. 87.3 121.7 111.8 94.0 103.9<br />
Sep. 90.4 126.5 105.0 92.8 103.8<br />
Oct. 91.9 130.3 103.3 99.0 101.6<br />
Nov. 95.5 129.9 104.1 99.1 100.5<br />
Dec. 98.1 125.4 101.8 96.7 96.0<br />
Average 86.3 117.2 113.9 95.0 100.6 96.4<br />
by trading Area<br />
Africa<br />
America<br />
Month 2002 2003 2004 2002 2003 2004<br />
Jan. 134.4 117.5 109.7 113.1 105.7 107.6<br />
Feb. 134.6 118.6 109.4 114.4 105.0 107.1<br />
March 134.8 122.1 112.5 113.7 110.3 110.0<br />
April 135.8 121.5 114.1 111.8 119.8 113.6<br />
May 133.2 113.7 113.7 110.6 109.5 113.7<br />
June 130.7 113.2 106.9 108.5<br />
July 124.8 114.5 103.6 112.8<br />
Aug. 125.8 117.0 102.7 113.8<br />
Sep. 123.4 117.3 102.4 112.4<br />
Oct. 124.1 113.3 115.1 114.3<br />
Nov. 122.8 113.4 113.0 115.3<br />
Dec. 118.7 110.3 111.0 110.4<br />
Average 128.6 116.0 111.9 109.9 111.5 110.4<br />
Asia Europe<br />
Month 2002 2003 2004 2002 2003 2004<br />
Jan. 69.4 85.0 78.8 95.2 95.9 94.4<br />
Feb. 67.8 83.8 79.0 95.1 96.9 94.3<br />
March 73.3 90.3 83.7 95.3 97.0 94.4<br />
April 76.2 97.3 88.4 93.4 97.0 94.6<br />
May 75.5 89.6 87.0 93.4 95.0 94.7<br />
June 78.1 93.7 94.3 94.7<br />
July 81.8 94.8 94.7 94.6<br />
Aug. 81.8 96.6 94.8 94.5<br />
Sep. 79.9 97.5 94.7 94.5<br />
Oct. 83.4 91.6 95.0 94.4<br />
Nov. 85.4 88.5 95.4 94.4<br />
Dec. 82.1 82.7 95.4 94.4<br />
Average 77.9 91.0 83.4 94.7 95.3 94.5<br />
52 SSMR June 2004<br />
140<br />
120<br />
100<br />
80<br />
60<br />
160<br />
140<br />
120<br />
100<br />
80<br />
140<br />
120<br />
100<br />
80<br />
60<br />
Overall Index<br />
2000 2001 2002 2003 2004<br />
Africa<br />
America<br />
2000 2001 2002 2003 2004<br />
Europe<br />
Asia<br />
2000 2001 2002 2003 2004<br />
1995 = 100<br />
ISL<br />
ISL<br />
ISL<br />
Continued
I - 2 Freight market ISL<br />
2.2 German sea freight indices (continued)<br />
liner index<br />
Homeward-bound Outward-bound<br />
140.0<br />
Month 2003 2004 2003 2004<br />
Jan. 91.3 88.1 100.5 98.0 120.0<br />
Feb. 90.8 88.0 99.9 98.0<br />
March 93.5 91.9 107.1 100.8<br />
April<br />
May<br />
99.7<br />
92.4<br />
96.3<br />
95.6<br />
113.9<br />
105.3<br />
103.5<br />
102.9<br />
100.0<br />
June 89.9 110.5<br />
July 97.4 107.4<br />
Aug.<br />
Sep.<br />
99.0<br />
99.3<br />
108.5<br />
108.1<br />
80.0<br />
Homeward-bound Index<br />
Oct. 96.0 106.8<br />
Outward-bound Index<br />
Nov.<br />
Dec.<br />
Average<br />
95.7<br />
91.7<br />
94.7 92.0<br />
105.1<br />
100.1<br />
106.1 100.6<br />
60.0<br />
2000 2001 2002 2003 2004 ISL<br />
By trading a<br />
America<br />
Homeward-bound Outward-bound<br />
175<br />
Month<br />
Jan.<br />
2003<br />
74.1<br />
2004<br />
68.0<br />
2003<br />
129.4<br />
2004<br />
137.3<br />
150<br />
Feb. 74.0 67.7 128.3 136.7<br />
March<br />
April<br />
May<br />
June<br />
80.5<br />
83.1<br />
74.8<br />
74.0<br />
70.1<br />
73.6<br />
73.7<br />
132.7<br />
147.4<br />
135.5<br />
134.4<br />
139.9<br />
143.7<br />
143.8<br />
125<br />
100<br />
Homeward-bound Index<br />
Outward-bound Index<br />
July 76.3 140.1<br />
Aug.<br />
Sep.<br />
77.8<br />
77.0<br />
140.8<br />
138.9<br />
75<br />
Oct. 74.8 143.9<br />
Nov.<br />
Dec.<br />
Average<br />
74.7<br />
71.3<br />
76.0 70.6<br />
145.7<br />
139.8<br />
138.1 140.3<br />
50<br />
2000 2001 2002 2003 2004 ISL<br />
Asia<br />
Month 2003 2004 2003 2004<br />
Jan. 97.4 96.1 69.8 57.6<br />
Feb. 96.2 95.9 68.6 58.3<br />
March 97.4 101.9 81.6 61.4<br />
April 108.2 108.3 84.0 64.0<br />
May 100.1 106.9 76.7 62.5<br />
June 95.7 91.2<br />
July 109.0 77.5<br />
Aug. 111.0 79.0<br />
Sep. 112.0 79.7<br />
Oct. 107.3 72.4<br />
Nov. 106.8 66.0<br />
Dec. 101.2 60.1<br />
Average 103.5 101.8 75.6 60.8<br />
Month<br />
Europe<br />
2003 2004 2003 2004<br />
Jan. 97.7 96.3 93.8 92.3<br />
Feb. 98.7 96.2 94.9 92.2<br />
March 98.7 96.3 95.1 92.2<br />
April 98.7 96.3 95.1 92.6<br />
May 96.8 96.4 93.1 92.8<br />
June 96.4 92.9<br />
July 96.3 92.6<br />
Aug. 96.3 92.5<br />
Sep. 96.3 92.5<br />
Oct. 96.3 92.2<br />
Nov. 96.3 92.3<br />
Dec. 96.3 92.3<br />
Average 97.1 96.3 93.3 92.4<br />
(Source: ISL Bremen 2004, based on data from Federal Statistical Office Germany)<br />
150<br />
125<br />
100<br />
75<br />
50<br />
105<br />
100<br />
95<br />
90<br />
85<br />
Homeward-bound Index<br />
Outward-bound Index<br />
2000 2001 2002 2003 2004<br />
Homeward-bound Index<br />
Outward-bound Index<br />
2000 2001 2002 2003 2004<br />
1972=100<br />
SSMR June 2004 53<br />
ISL<br />
ISL
I - 2 Freight market ISL<br />
2.3 Lloyd's <strong>Shipping</strong> Economist tramp trip charter indices<br />
Combined index<br />
Month 2001 2002 2003 2004<br />
Jan. 193 89 185 553<br />
Feb. 214 73 156 613<br />
March 199 102 151 451<br />
April 178 104 203 558<br />
May 197 93 230<br />
June 198 95 304<br />
July 174 99 273<br />
Aug. 119 113 276<br />
Sep. 100 125 294<br />
Oct. 83 114 337<br />
Nov. 79 140 309<br />
Dec. 89 154 360<br />
Average 152 108 257 544<br />
12000-19999 dwt index<br />
Month 2001 2002 2003 2004<br />
Jan. 149 ... 723 341<br />
Feb. 244 ... 192 349<br />
March 148 ... ... ...<br />
April 137 187 349 448<br />
May 183 ... ...<br />
June 142 ... 267<br />
July 163 ... 221<br />
Aug. 148 ... ...<br />
Sep. 138 ... 266<br />
Oct. 130 ... ...<br />
Nov. 160 318 ...<br />
Dec. ... 308 ...<br />
Average 158 271 336 379<br />
20000-34999 dwt index<br />
Month 2001 2002 2003 2004<br />
Jan. 166 137 199 601<br />
Feb. 226 131 192 716<br />
March 165 160 212 636<br />
April 163 153 282 615<br />
May 176 131 283<br />
June 189 165 309<br />
July 171 156 314<br />
Aug. 160 172 295<br />
Sep. 157 181 307<br />
Oct. 151 173 342<br />
Nov. 121 200 422<br />
Dec. 137 173 469<br />
Average 165 161 302 642<br />
54 SSMR June 2004<br />
650<br />
575<br />
500<br />
425<br />
350<br />
275<br />
200<br />
125<br />
50<br />
450<br />
400<br />
350<br />
300<br />
250<br />
200<br />
150<br />
100<br />
50<br />
800<br />
700<br />
600<br />
500<br />
400<br />
300<br />
200<br />
100<br />
0<br />
Combined index<br />
1998 1999 2000 2001 2002 2003 2004<br />
Size class 12000-19999 dwt<br />
1998 1999 2000 2001 2002 2003 2004<br />
Size class 20000-34999 dwt<br />
1998 1999 2000 2001 2002 2003 2004<br />
1985=100<br />
ISL<br />
ISL<br />
ISL
I - 2 Freight market ISL<br />
2.3 Lloyd's <strong>Shipping</strong> Economist tramp trip charter indices (continued)<br />
35000-49999 dwt index<br />
Month 2001 2002 2003 2004<br />
Jan. 188 144 234 563<br />
Feb. 258 185 207 732<br />
March 180 161 244 706<br />
April 190 169 257 571<br />
May 187 193 285<br />
June 181 160 347<br />
July 178 158 278<br />
Aug. 178 121 280<br />
Sep. 163 135 294<br />
Oct. 134 171 381<br />
Nov. 149 196 417<br />
Dec. 144 207 521<br />
Average 178 167 312 643<br />
50000-84999 dwt index<br />
Month 2001 2002 2003 2004<br />
Jan. 196 139 295 851<br />
Feb. 216 84 243 835<br />
March 220 151 281 861<br />
April 229 158 325 730<br />
May 217 135 382<br />
June 218 140 343<br />
July 178 162 330<br />
Aug. 178 148 315<br />
Sep. 153 152 321<br />
Oct. 144 169 543<br />
Nov. 120 212 605<br />
Dec. 139 233 688<br />
Average 184 157 389 819<br />
85000 dwt <strong>and</strong> over index<br />
Month 2001 2002 2003 2004<br />
Jan. 223 91 235 875<br />
Feb. 135 112 229 881<br />
March 184 132 245 735<br />
April 181 130 260 604<br />
May 160 112 290<br />
June 170 125 297<br />
July 143 110 298<br />
Aug. 143 112 306<br />
Sep. 81 120 350<br />
Oct. 90 134 690<br />
Nov. 78 180 662<br />
Dec. 91 208 772<br />
Average 140 131 386 774<br />
Note: The number of fixtures for the smaller TTCI size ranges is too less to become meaningfull results<br />
800<br />
700<br />
600<br />
500<br />
400<br />
300<br />
200<br />
100<br />
0<br />
1000<br />
(Source: ISL Bremen 2004, based on data from Lloyd´s <strong>Shipping</strong> Economist)<br />
Size class 35000-49999 dwt<br />
1998 1999 2000 2001 2002 2003 2004<br />
875<br />
750<br />
625<br />
500<br />
375<br />
250<br />
125<br />
0<br />
1000<br />
875<br />
750<br />
625<br />
500<br />
375<br />
250<br />
125<br />
Size class 50000-84999 dwt<br />
1998 1999 2000 2001 2002 2003 2004<br />
0<br />
Size class 85000 dwt <strong>and</strong> over<br />
1998 1999 2000 2001 2002 2003 2004<br />
1985=100<br />
SSMR June 2004 55<br />
ISL<br />
ISL<br />
ISL
I - 2 Freight market ISL<br />
2.4 Maritime Research freight indices 2001 - 2004<br />
General freight index<br />
Month 2001 2002 2003 2004<br />
Jan. 249.4 209.1 258.2 392.3<br />
Feb. 244.4 211.3 261.4 415.1<br />
March 245.9 217.1 266.6 429.0<br />
April 244.6 220.8 271.6 422.3<br />
May 248.8 223.1 286.3 418.2<br />
June 248.4 220.0 286.6<br />
July 238.7 218.3 286.6<br />
Aug. 225.2 219.4 298.4<br />
Sep. 222.9 223.2 300.6<br />
Oct. 218.1 231.8 333.0<br />
Nov. 215.4 241.3 353.1<br />
Dec. 208.9 249.7 381.0<br />
Average 234.2 223.8 298.6 415.4<br />
Grain freight index<br />
Month 2001 2002 2003 2004<br />
Jan. 254.3 214.3 266.1 405.9<br />
Feb. 249.9 215.9 270.9 432.7<br />
March 252.8 221.9 275.4 454.8<br />
April 250.6 226.0 281.0 449.9<br />
May 254.5 230.5 296.0 447.5<br />
June 253.1 226.5 296.7<br />
July 243.6 224.1 295.3<br />
Aug. 229.9 226.8 311.0<br />
Sep. 227.4 229.2 312.2<br />
Oct. 222.7 236.4 347.4<br />
Nov. 220.5 247.9 366.7<br />
Dec. 211.1 256.9 400.3<br />
Average 239.2 229.7 309.9 438.1<br />
Miscellaneous freight index<br />
Month 2001 2002 2003 2004<br />
Jan. 238.6 200.1 240.8 362.4<br />
Feb. 232.0 201.1 240.3 376.2<br />
March 230.6 206.3 247.2 372.2<br />
April 231.1 209.2 250.7 361.6<br />
May 236.0 206.8 264.6 353.6<br />
June 237.6 205.7 264.2<br />
July 230.3 205.3 267.3<br />
Aug. 214.9 203.0 270.7<br />
Sep. 212.6 210.2 274.9<br />
Oct. 207.1 221.4 301.2<br />
Nov. 203.8 226.4 322.9<br />
Dec. 202.6 233.5 338.5<br />
Average 223.1 210.7 273.6 365.2<br />
56 SSMR June 2004<br />
450<br />
400<br />
350<br />
300<br />
250<br />
200<br />
150<br />
450<br />
400<br />
350<br />
300<br />
250<br />
200<br />
150<br />
General freight index<br />
1998 1999 2000 2001 2002 2003 2004<br />
450<br />
400<br />
350<br />
300<br />
250<br />
200<br />
150<br />
Grain freight index<br />
1998 1999 2000 2001 2002 2003 2004<br />
Miscellaneous freight index<br />
1998 1999 2000 2001 2002 2003 2004<br />
1972=100<br />
ISL<br />
ISL<br />
ISL
I - 2 Freight market ISL<br />
2.4 Maritime Research freight indices (continued)<br />
Time charter index<br />
Month 2001 2002 2003 2004<br />
Jan. 244.5 214.2 262.9 535.7<br />
Feb. 240.0 212.2 258.5 584.6<br />
March 248.0 220.4 272.3 579.2<br />
April 244.1 225.1 291.9 518.5<br />
May 250.7 224.6 310.0 438.8<br />
June 243.2 223.5 292.0<br />
July 232.9 225.7 307.4<br />
Aug. 220.6 226.5 306.9<br />
Sep. 218.6 237.8 317.3<br />
Oct. 215.9 244.4 408.6<br />
Nov. 211.1 248.0 448.3<br />
Dec. 209.8 258.6 489.6<br />
Average 231.6 230.1 330.5 531.3<br />
Time charter index ( 1 to 2 months)<br />
Month 2001 2002 2003 2004<br />
Jan. 256.6 214.1 274.5 583.9<br />
Feb. 242.2 209.5 268.8 649.8<br />
March 249.3 217.8 282.6 638.8<br />
April 250.7 219.1 300.9 597.8<br />
May 259.4 216.9 317.5 478.6<br />
June 244.0 218.8 296.7<br />
July 228.0 220.1 314.3<br />
Aug. 216.0 216.5 310.3<br />
Sep. 212.6 223.0 324.0<br />
Oct. 210.3 244.6 405.8<br />
Nov. 210.4 261.3 443.9<br />
Dec. 209.2 271.4 500.8<br />
Average 232.4 227.7 336.7 589.8<br />
Time charter index (2 to 3 months)<br />
Month 2001 2002 2003 2004<br />
Jan. 228.0 200.7 248.6 539.8<br />
Feb. 225.7 198.0 243.6 588.2<br />
March 234.7 206.3 256.1 587.8<br />
April 228.2 212.2 281.8 511.9<br />
May 236.2 212.6 302.3 430.9<br />
June 230.1 210.4 283.4<br />
July 219.9 213.6 300.7<br />
Aug. 206.5 216.2 301.0<br />
Sep. 206.6 230.8 311.9<br />
Oct. 203.8 234.2 411.3<br />
Nov. 197.5 234.3 455.4<br />
Dec. 195.9 243.7 498.6<br />
Average 217.8 217.7 324.5 531.7<br />
Time charter index (over 6 months)<br />
Month 2001 2002 2003 2004<br />
Jan. 304.2 276.8 313.0 465.8<br />
Feb. 302.7 281.1 313.1 476.1<br />
March 307.1 289.2 319.7 455.8<br />
April 308.3 292.5 326.2 437.9<br />
May 305.4 290.5 334.9 419.2<br />
June 302.2 290.0 324.9<br />
July 299.7 289.0 328.3<br />
Aug. 292.1 287.5 328.7<br />
Sep. 282.5 290.4 334.1<br />
Oct. 279.5 291.3 399.4<br />
Nov. 274.7 292.6 420.7<br />
Dec. 275.3 309.7 431.3<br />
Average 294.5 290.0 347.9 450.9<br />
(Source: ISL Bremen 2004, based on data from Maritime Research Inc., Parlin N.J.)<br />
600<br />
500<br />
400<br />
300<br />
200<br />
100<br />
650<br />
550<br />
450<br />
350<br />
250<br />
150<br />
600<br />
500<br />
400<br />
300<br />
200<br />
100<br />
600<br />
500<br />
400<br />
300<br />
200<br />
100<br />
Time charter index<br />
1998 1999 2000 2001 2002 2003 2004<br />
1 to 2 months<br />
1998 1999 2000 2001 2002 2003 2004<br />
2 to 3 months<br />
1998 1999 2000 2001 2002 2003 2004<br />
over 6 months<br />
1998 1999 2000 2001 2002 2003 2004<br />
1972=100<br />
SSMR June 2004 57<br />
ISL<br />
ISL<br />
ISL<br />
ISL
II - 1 World shipbuilding ISL<br />
1.1 Monthly shipbuilding contracts<br />
1.1.1 Number of contracts by ship type March 2003 - June 2004<br />
2003 Total 2004<br />
Ships of 100 gt <strong>and</strong> over<br />
Total<br />
Ship type Mar. Apr. May June July Aug. Sep. Oct. Nov. Dec. 2003 Jan. Feb. Mar. Apr. May June 2004<br />
Tanker 33 32 40 33 48 30 46 75 22 28 456 38 45 64 26 54 43 270<br />
Bulk carrier 30 6 3 2 18 18 23 22 11 22 193 9 16 28 11 14 22 100<br />
Container 19 32 17 19 44 21 29 27 39 29 325 53 48 23 26 50 40 240<br />
General cargo 16 2 12 1 5 3 6 4 1 21 91 3 18 10 12 7 3 53<br />
Cruise ferry - 2 3 - 3 - - - 1 - 14 3 1 3 2 - 5 14<br />
Ferry 6 2 6 13 5 12 9 - 2 2 80 2 4 9 9 3 5 32<br />
Total<br />
Non merchant vessels<br />
104 76 81 68 123 84 113 128 76 102 1159 108 132 137 86 128 118 709<br />
Fishing 18 15 15 14 6 11 10 11 7 5 159 7 5 1 10 - 2 25<br />
Naval 6 4 16 3 11 10 2 6 23 13 96 3 3 10 3 - - 19<br />
Offshore support - 4 7 3 2 7 9 1 3 1 66 5 10 8 13 - 6 42<br />
Rescue - 2 1 - - - - - - - 3 - - - - - - -<br />
Training/research - 1 3 - - - - - 2 1 8 - - - - 1 1 2<br />
Tug 4 3 3 - 1 20 - 2 - 3 38 5 1 4 19 10 6 45<br />
Work boat 3 37 4 33 - 1 1 2 2 6 145 3 5 3 11 - 10 32<br />
Barge 1 - - 16 - 3 - 4 31 5 63 1 1 7 1 - 1 11<br />
Yacht 4 2 11 15 8 12 6 3 3 5 89 1 1 11 2 - 2 17<br />
Other 2 1 2 - 1 2 2 - - - 15 - 1 - 2 1 - 4<br />
Total non merchant<br />
vessels<br />
38 69 62 84 29 66 30 29 71 39 682 25 27 44 61 12 28 197<br />
TOTAL 142 145 143 152 152 150 143 157 147 141 1841 135 159 181 147 140 146 908<br />
1.1.2 By country of build <strong>and</strong> ship type during May 2004<br />
Merchant Ships of 100 gt <strong>and</strong> over<br />
(1) No<br />
Source: ISL 2004; General based on cargo monthly data provided by Baird Publications dwt-% (Australia); share<br />
Country of build (2) 1000 gt Tankers Bulk carriers Container ships<br />
ships Passenger ships TOTAL of total<br />
Italy (1) - - - - 1 1<br />
(2) - - - - 85.0 85 1.4<br />
Germany (1) - - - - 2 2<br />
(2) - - - - 7.0 7.0 0.1<br />
Pol<strong>and</strong> (1) - - 7 - - 7<br />
(2) - - 199.0 - - 199.0 3.3<br />
Croatia (1) - - - - - -<br />
(2) - - - - - - -<br />
other Europe (1) 3 - - - 2 5<br />
(2) 24.0 - - - - 24.0 0.4<br />
Total Europe (1) 3 - 7 - 5 15<br />
(2) 24.0 - 199.0 - 92.0 315.0 5.2<br />
Korea, Rep. of (1) 27 - 13 - - 40<br />
(2) 1758.0 - 803.2 - - 2561.2 42.0<br />
Japan (1) 8 11 9 3 - 31<br />
(2) 556.1 582.0 755.0 29.7 - 1922.8 31.5<br />
China, PR of (1) 4 11 11 - - 26<br />
(2) 244.4 594.5 462.0 - - 1300.9 21.3<br />
other Asia (1) 1 - - - - 1<br />
(2) 2.5 - - - - 2.5 0.0<br />
Total Asia (1) 40 22 33 3 - 98<br />
(2) 2561 1177 2020 30 - 5787.4 94.8<br />
Others (1) - - - - 5 5<br />
(2) - - - - - - -<br />
TOTAL No<br />
(1) 43 22 40 3 10 118<br />
1000 gt (2) 2585.0 1176.5 2219.2 29.7 92.0 6102.4 100.0<br />
Source: ISL 2004; based on monthly data provided by Baird Publications (Australia); Ships <strong>and</strong> Boats on Order<br />
58 SSMR June 2004
II - 2 World shipbuilding - container ships ISL<br />
2.1 Existing world fully cellular container fleet according to yard, year of build <strong>and</strong> TEU-size class<br />
as of January 1st, 2004<br />
Year of build Total<br />
-1993 1994-1998 1999-2004<br />
Ships of 300 gt <strong>and</strong> over<br />
Shipbuilder No 1000 No 1000 No 1000 No 1000 =5000 No TEU<br />
TEU TEU TEU TEU 2999 3999 4999<br />
HYUNDAI (KRS) 50 121 63 231 111 532 224 884 - 2.7 0.9 1.9 1.8 7.4 13.8<br />
SAMSUNG (KRS) 26 86 36 131 72 331 134 548 - 1.0 1.0 1.5 1.0 4.4 8.5<br />
MITSUBISHI (JPN) 37 84 41 171 24 125 102 379 0.2 1.0 0.4 0.9 0.9 3.4 5.9<br />
DAEWOO (KRS) 25 90 42 121 29 137 96 349 0.1 1.3 0.6 0.7 0.5 3.2 5.4<br />
HANJIN (KRS) 17 38 33 91 56 211 106 339 0.4 1.2 - 1.0 0.8 3.5 5.3<br />
ODENSE (DEN) 29 85 15 86 23 157 67 328 - 0.4 0.8 - 1.0 2.2 5.1<br />
CHINA SB (TAIWAN) 51 132 42 80 42 106 135 318 0.1 3.1 1.1 - 0.1 4.4 5.0<br />
ISHIKAWAJIMA (JPN) 39 106 23 111 11 63 73 281 0.1 0.7 0.3 0.9 0.5 2.4 4.4<br />
HDW (GFR) 44 108 21 69 3 5 68 182 0.2 0.9 1.0 0.2 - 2.2 2.8<br />
SZCZECINSKA (POL) 18 19 76 109 25 51 119 179 0.2 3.5 0.2 - - 3.9 2.8<br />
KOYO (JPN) 11 39 4 18 20 103 35 160 - 0.1 0.4 0.1 0.5 1.2 2.5<br />
VULKAN (b) (GFR) 58 101 27 58 - - 85 159 0.2 2.0 0.5 0.1 - 2.8 2.5<br />
GDYNIA (POL) - - 37 68 25 66 62 134 - 1.9 0.1 0.1 - 2.0 2.1<br />
KVAERNER (NOR) 8 14 24 53 19 57 51 124 - 1.6 - - 0.1 1.7 1.9<br />
KAWASAKI (JPN) 13 34 12 54 5 26 30 114 - 0.4 0.3 - 0.4 1.0 1.8<br />
OTHERS 764 841 515 575 370 530 1649 1945 27.6 24.6 1.4 0.4 0.4 54.3 30.3<br />
TOTAL<br />
of which<br />
1190 1897 1011 2026 835 2501 3036 6424 29.1 46.4 8.9 7.7 7.9 100.0 100.0<br />
Asia 638 1123 619 1339 604 1947 1861 4409 17.6 23.6 6.1 7.4 6.8 61.3 68.6<br />
Europe 511 708 387 679 228 1936 1126 3323 11.2 21.7 2.7 0.3 1.1 37.1 51.7<br />
Others 41 67 5 7 3 79 49 152 0.3 1.2 0.1 - - 1.6 2.4<br />
(Source: ISL Bremen 2004, based on quarterly updates from LR/Fairplay)<br />
Size groups (TEU) as %-share of<br />
total No of ships (a)<br />
(a) Excluding 14 ships of which TEU-size is unknown.<br />
(b) Excluding Schichau (1986), Seebeck (1987), Flender Werft A.G. (1990), MTW Schiffswerft GmbH (1992),Volkswerft (1993). 17 vessels were delivered in 1996<br />
<strong>and</strong> 12 in 1997. The disintegration of the Vulkan Group started in 1996, therefore these 29 vessels were not included in the 'Vulkan Group'.<br />
Fig. II-1: Container <strong>and</strong> general cargo fleet - order book as of January 1st, 1995 - 2004 (in 1000 cgt)<br />
% - share of<br />
TOTAL<br />
ISL2004<br />
SSMR June 2004 59
II - 3 Ship type survey - general cargo ships ISL<br />
3.1 General cargo ships on order<br />
3.1.1 Order book development by type 2003 <strong>and</strong> 2004<br />
Ship type Order book<br />
Ships of 300 gt <strong>and</strong> over<br />
Additions to order book (per quarter)<br />
1000 1000 1000 cgt % change<br />
1000 1000 1000 cgt % change<br />
Period No dwt gt cgt over prev. period No dwt gt cgt over prev.<br />
SINGLE-DECK & MULTI-DECK SHIPS<br />
2003 January, 1st 281 2975 2184 2200 6.1 46 669 489 445 26.1<br />
April, 1st 275 3034 2223 2222 1.0 32 286 213 230 -48.2<br />
July, 1st 273 2891 2120 2150 -3.3 26 207 151 165 -28.3<br />
October, 1st 284 2905 2124 2204 2.5 44 529 365 354 114.1<br />
Average 2003 278 2951 2163 2194 5.8 37 423 304 299 54.2<br />
2004 January, 1st 309 3129 2282 2400 8.9 49 455 324 371 5.0<br />
April, 1st 331 3219 2316 2469 2.8 71 519 364 439 18.1<br />
Average 2004 320 3174 2299 2435 11.0 60 487 344 405 35.6<br />
SPECIAL SHIPS<br />
2003 January, 1st 33 446 1014 702 123.9 12 190 484 323 404.0<br />
April, 1st 34 502 1152 730 3.9 4 46 153 94 -70.9<br />
July, 1st 57 938 2454 1464 100.7 24 433 1302 744 690.7<br />
October, 1st 72 1196 3302 1994 36.2 17 267 864 542 -27.2<br />
Average 2003 49 771 1981 1222 356.1 14 234 701 426 997.7<br />
2004 January, 1st 70 1237 3444 2058 3.2 10 116 353 220 -59.3<br />
April, 1st 76 1367 3814 2265 10.1 10 160 438 261 18.2<br />
Average 2004 73 1302 3629 2162 76.8 10 138 396 240 -43.5<br />
REEFER SHIPS<br />
2003 January, 1st 8 78 89 116 - - - - - ...<br />
April, 1st 8 78 89 116 - - - - - ...<br />
July, 1st 8 78 89 116 -0.1 1 5 5 7 ...<br />
October, 1st 7 73 85 109 -5.9 - - - - ...<br />
Average 2003 8 77 88 114 17.0 0 1 1 2 -89.6<br />
2004 January, 1st 6 67 78 99 -8.9 - - - - ...<br />
April, 1st 7 62 66 87 -12.7 1 5 5 7 ...<br />
Average 2004 7 64 72 93 -18.6 1 2 2 3 97.8<br />
RO-RO CARGO SHIPS<br />
2003 January, 1st 61 869 2121 1684 4.1 12 170 428 336 -19.3<br />
April, 1st 55 747 1859 1488 -11.6 2 20 56 48 -85.7<br />
July, 1st 58 749 1828 1454 -2.3 7 50 111 92 91.6<br />
October, 1st 53 685 1682 1334 -8.3 - - - - -100.0<br />
Average 2003 57 762 1873 1490 3.4 5 60 149 119 -46.0<br />
2004 January, 1st 53 693 1603 1260 -5.5 10 130 231 179 ...<br />
April, 1st 46 578 1330 1051 -16.6 3 23 52 45 -74.8<br />
Average 2004 50 635 1466 1156 -22.4 7 76 142 112 -6.2<br />
TOTAL GENERAL CARGO SHIPS<br />
2003 January, 1st 383 4367 5408 4702 14.1 70 1029 1401 1104 23.5<br />
April, 1st 372 4362 5323 4556 -3.1 38 352 422 373 -66.3<br />
July, 1st 396 4655 6491 5183 13.8 58 696 1568 1008 170.6<br />
October, 1st 416 4859 7193 5640 8.8 61 796 1229 895 -11.2<br />
Average 2003 392 4561 6104 5020 29.4 57 718 1155 845 80.0<br />
2004 January, 1st 438 5126 7407 5818 3.1 69 701 909 770 -14.0<br />
April, 1st 460 5226 7527 5872 0.9 85 707 859 751 -2.5<br />
Average 2004 449 5176 7467 5845 16.4 77 704 884 761 -10.0<br />
60 SSMR June 2004
II - 3 Ship type survey - general cargo ships ISL<br />
3.1.2 By major types <strong>and</strong> countries of build as of January 1st, 2004<br />
Countries<br />
Single-deck & Multi- Special ships Reefer ships Ro-Ro cargo ships<br />
Ships of 300 gt <strong>and</strong> over<br />
TOTAL<br />
of build deck ships<br />
General cargo ships cgt-%<br />
share<br />
cgt-rank No 1000 1000 No 1000 1000 No 1000 1000 No 1000 1000 No 1000 1000 of<br />
cgt gt cgtgt cgtgt cgtgt cgtgttotal Japan 40 483 556 44 1479 2518 - - - 5 162 197 89 2124 3270 36.5<br />
China, PR of 65 565 558 8 225 345 - - - 4 45 53 77 836 956 14.4<br />
Pol<strong>and</strong> 19 281 354 - - - - - - 16 538 752 35 819 1106 14.1<br />
Romania (a) 29 231 196 2 19 19 - - - 2 25 24 33 276 239 4.7<br />
Korea, Rep. of 4 22 16 8 246 459 - - - - - - 12 269 475 4.6<br />
Netherl<strong>and</strong>s 44 215 165 2 30 30 - - - 1 2 1 47 247 196 4.2<br />
Italy - - - 2 41 55 - - - 8 152 204 10 193 259 3.3<br />
Germany, FR of 2 15 11 - - - - - - 6 177 182 8 192 193 3.3<br />
Russia 22 157 125 - - - - - - - - - 22 157 125 2.7<br />
Croatia 8 34 18 - - - - - - 3 101 126 11 134 144 2.3<br />
Ukraine 14 77 57 - - - 4 56 43 - - - 18 133 100 2.3<br />
Turkey 12 65 47 - - - - - - 1 8 7 13 72 54 1.2<br />
US 5 39 28 - - - - - - 1 32 40 6 71 68 1.2<br />
Slovakia 14 63 39 - - - - - - - - - 14 63 39 1.1<br />
Bulgaria 8 58 43 - - - - - - - - - 8 58 43 1.0<br />
Viet Nam 13 56 42 - - - - - - - - - 13 56 42 1.0<br />
Portugal - - - - - - 2 44 35 - - - 2 44 35 0.8<br />
Egypt - - - - - - - - - 2 14 14 2 14 14 0.2<br />
Yugoslavia 3 12 9 - - - - - - - - - 3 12 9 0.2<br />
Spain - - - 1 11 15 - - - - - - 1 11 15 0.2<br />
Others 7 26 18 3 6 3 - - - 4 5 3 14 36 24 0.6<br />
TOTAL<br />
%-share<br />
309 2400 2282 70 2058 3444 6 99 78 53 1260 1603 438 5818 7407 100.0<br />
of total<br />
of which<br />
70.5 41.3 30.8 16.0 35.4 46.5 1.4 1.7 1.1 12.1 21.7 21.6 100.0 100.0 100.0<br />
Europe 167 1156 1023 7 102 119 6 99 78 36 994 1289 216 2351 2510 40.4<br />
Asia 136 1197 1221 62 1955 3324 - - - 14 220 260 212 3371 4806 58.0<br />
Others 6 47 37 1 1 1 - - - 3 46 54 10 95 92 1.6<br />
(a) thereof 22 ships totalling 209,000 cgt by Daewoo-Mangalia<br />
3.1.3 By major types <strong>and</strong> yards as of January 1st, 2004<br />
Ships of 300 gt <strong>and</strong> over<br />
Yard Single-deck & Multi- Special ships Reefer ships Ro-Ro cargo ships<br />
TOTAL<br />
cgt-%<br />
deck ships<br />
General cargo ships share<br />
cgt-rank No 1000 1000 No 1000 1000 No 1000 1000 No 1000 1000 No 1000 1000 of<br />
cgt gt cgtgt cgtgt cgtgt cgtgttotal Kanasashi (Japan) - - - 21 773 1275 - - - 3 142 178 24 915 1417 15.7<br />
Gdynia (Pol<strong>and</strong>) 4 91 130 - - - - - - 12 458 652 16 550 589 9.4<br />
Daewoo (Korea) (a) 18 165 147 10 265 478 - - - 2 25 24 30 455 650 7.8<br />
Mitsubishi (Japan) - - - 10 339 586 - - - 1 11 11 11 350 598 6.0<br />
Imabari (Japan) - - - 6 207 377 - - - - - - 6 207 377 3.6<br />
Flensburger (Germany) - - - - - - - - - 6 177 182 6 177 177 3.0<br />
Damen (Netherl<strong>and</strong>s) 24 129 103 2 30 30 - - - - - - 26 159 133 2.7<br />
Xiamen (China, PR of) 2 39 46 4 117 180 - - - - - - 6 156 226 2.7<br />
Szczecinska (Pol<strong>and</strong>) 4 64 72 - - - - - - 4 79 99 8 143 151 2.5<br />
Fincantieri (Italy) - - - 2 41 55 - - - 2 82 117 4 123 137 2.1<br />
Others 257 1912 1784 15 285 463 6 99 78 23 285 339 301 2581 2664 44.4<br />
TOTAL 309 2400 2282 70 2058 3444 6 99 78 53 1260 1603 438 5818 7407 100.0<br />
(a) Incl. Daewoo-Mangalia (Romania).<br />
Continued<br />
SSMR June 2004 61
II - 3 Ship type survey - container ships ISL<br />
3.2 Fully cellular container ships on order<br />
3.2.1 Order book development 2003 <strong>and</strong> 2004 (quarterly)<br />
Quarter<br />
ships of<br />
No of which TEU<br />
ships available<br />
1000<br />
gt<br />
Ships of 300 gt <strong>and</strong> over<br />
2003<br />
January, 1st 316 ( 316 ) ( 1109 ) 14244 12578 8749 9.4 67 ( 50 ) ( 213 ) 3186 2744 1910 23.1<br />
April, 1st 333 ( 318 ) ( 1263 ) 16351 14277 9828 12.3 62 ( 60 ) ( 292 ) 3758 3222 2164 13.3<br />
July, 1st 372 ( 356 ) ( 1447 ) 18658 16202 11098 12.9 95 ( 86 ) ( 352 ) 4576 4050 2757 27.4<br />
October, 1st 489 ( 466 ) ( 1976 ) 25823 22717 15459 39.3 140 ( 135 ) ( 635 ) 8227 7332 4946 79.4<br />
Average 378 ( 364 ) ( 1449 ) 18769 16444 11284 38.6 91 ( 83 ) ( 373 ) 4937 4337 2944 64.2<br />
2004<br />
January, 1st 588 ( 574 ) ( 2487 ) 31348 27622 18782 21.5 148 ( 143 ) ( 592 ) 7511 6545 4501 -9.0<br />
April, 1st 662 ( 636 ) ( 2831 ) 36214 31679 21469 14.3 116 ( 101 ) ( 454 ) 6338 5456 3698 -17.8<br />
Average 625 ( 605 ) ( 2659 ) 33781 29651 20126 78.4 132 ( 122 ) ( 523 ) 6924 6000 4099 39.2<br />
3.2.2 By country of build as of January 1st, 2004<br />
Ships of 300 gt <strong>and</strong> over<br />
Country of build No of % share<br />
1000 % share 1000 % share 1000 % share 1000 % share<br />
cgt-rank ships of total<br />
cgt of total gt of total dwt of total TEU of total<br />
Korea, Rep.of 278 47.3 11559 61.5 17525 63.4 19720 62.9 1567 63.0<br />
Japan 65 11.1 2297 12.2 3415 12.4 3673 11.7 299 12.0<br />
China, PR of 83 14.1 1439 7.7 1899 6.9 2248 7.2 176 7.1<br />
Germany, FR of 64 10.9 1065 5.7 1359 4.9 1740 5.6 129 5.2<br />
Taiwan 24 4.1 742 3.9 1121 4.1 1260 4.0 101 4.1<br />
Pol<strong>and</strong> 26 4.4 701 3.7 983 3.6 1144 3.6 86 3.5<br />
Denmark 9 1.5 406 2.2 624 2.3 781 2.5 66 2.6<br />
Singapore 5 0.9 111 0.6 140 0.5 139 0.4 13 0.5<br />
Brazil 4 0.7 109 0.6 142 0.5 146 0.5 11 0.4<br />
Iran 5 0.9 90 0.5 120 0.4 150 0.5 11 0.4<br />
Romania 7 1.2 84 0.4 96 0.3 118 0.4 9 0.4<br />
US 4 0.7 79 0.4 101 0.4 99 0.3 10 0.4<br />
Netherl<strong>and</strong>s 5 0.9 40 0.2 38 0.1 51 0.2 4 0.2<br />
Ukrainia 2 0.3 18 0.1 15 0.1 19 0.1 1 0.0<br />
Turkey 3 0.5 18 0.1 17 0.1 28 0.1 2 0.1<br />
Viet Nam 2 0.3 17 0.1 19 0.1 25 0.1 2 0.1<br />
Indonesia 2 0.3 8 0.0 7 0.0 8 0.0 0 0.0<br />
TOTAL<br />
of which<br />
588 100.0 18782 100.0 27622 100.0 31348 100.0 2487 100.0<br />
Europe 113 19.2 2314 12.3 3116 11.3 3852 12.3 295 11.8<br />
Asia 467 79.4 16280 86.7 24264 87.8 27251 86.9 2172 87.3<br />
Others 8 1.4 188 1.0 243 0.9 245 0.8 21 0.8<br />
3.2.3 By yard of build as of January 1st, 2004<br />
Order book Additions to order book (per quarter)<br />
1000<br />
TEU<br />
1000<br />
dwt<br />
1000<br />
cgt<br />
cgt %<br />
change over<br />
prev. period<br />
ships of<br />
which TEU<br />
available<br />
cgt %<br />
change over<br />
prev. period<br />
Yard No-% cgt-% gt-% dwt-%<br />
Ships of 300 gt <strong>and</strong> over<br />
TEU-%<br />
No of<br />
share 1000 share 1000 share 1000 share 1000 share<br />
cgt-rank ships of total cgt of total gt of total dwt of total TEU of total<br />
Hyundai, (Korea, Rep. of) 144 24.5 5999 31.9 9090 32.9 9778 31.2 805 32.4<br />
Samsung, (Korea, Rep. of) 60 10.2 2943 15.7 4528 16.4 5171 16.5 409 16.4<br />
Hanjin Heavy Ind., (Korea, Rep. of) 37 6.3 1449 7.7 2198 8.0 2623 8.4 198 8.0<br />
Daewoo, (Korea, Rep. of) 22 3.7 898 4.8 1362 4.9 1694 5.4 121 4.9<br />
Ishikawajima-Harima Heavy Ind. (Japan) 16 2.7 818 4.4 1251 4.5 1395 4.5 117 4.7<br />
China SB Corp. (Taiwan) 24 4.1 742 3.9 1121 4.1 1260 4.0 101 4.1<br />
Koyo Dockyard (Japan) 14 2.4 621 3.3 955 3.5 967 3.1 81 3.2<br />
Mitsubishi Heavy Ind., (Japan) 15 2.6 620 3.3 929 3.4 967 3.1 81 3.3<br />
Aker MTW (Germany) 27 4.6 510 2.7 670 2.4 895 2.9 66 2.6<br />
Hudong Shipyard (China, PR of) 14 2.4 473 2.5 728 2.6 827 2.6 67 2.7<br />
Others 215 36.6 3710 19.8 4792 17.3 5770 18.4 442 17.8<br />
TOTAL 588 100.0 18782 100.0 27622 100.0 31348 100.0 2487 100.0<br />
No of<br />
ships<br />
62 SSMR June 2004<br />
1000<br />
TEU<br />
1000<br />
dwt<br />
1000<br />
gt<br />
1000<br />
cgt
II - 3 Ship type survey - container ships ISL<br />
3.2.4 By division of TEU-size class as of January 1st, 2003<br />
Ships of 300 gt <strong>and</strong> over<br />
No-% cgt-% gt-% TEU-%<br />
TEU No of share 1000 share 1000 share 1000 share<br />
size-class ships of total cgt of total gt of total TEU of total<br />
unknown 14 2.4 124 0.7 125 0.5 - -<br />
< = 1499 85 14.5 785 4.2 826 3.0 79 3.2<br />
1500 - 1999 33 5.6 501 2.7 593 2.1 56 2.2<br />
2000 - 2499 40 6.8 785 4.2 1035 3.7 96 3.9<br />
2500 - 2999 63 10.7 1347 7.2 1789 6.5 168 6.8<br />
3000 - 3499 29 4.9 765 4.1 1027 3.7 92 3.7<br />
3500 - 3999 7 1.2 225 1.2 320 1.2 26 1.1<br />
4000 - 4499 67 11.4 1923 10.2 2958 10.7 282 11.3<br />
4500 - 4999 28 4.8 989 5.3 1513 5.5 135 5.4<br />
5000 - 5499 34 5.8 1277 6.8 1956 7.1 171 6.9<br />
5500 - 5999 40 6.8 1732 9.2 2665 9.6 225 9.0<br />
6000 - 6499 11 1.9 536 2.9 825 3.0 70 2.8<br />
6500 - 6999 18 3.1 874 4.7 1344 4.9 120 4.8<br />
7000 - 7999 33 5.6 1799 9.6 2768 10.0 253 10.2<br />
> = 8000 86 14.6 5120 27.3 7878 28.5 714 28.7<br />
TOTAL 588 100.0 18782 100.0 27622 100.0 2487 100.0<br />
3.2.5 By yard of build <strong>and</strong> division of TEU-size as of January 1st, 2004<br />
(Source: ISL Bremen 2004, based on quarterly updates from LR/Fairplay)<br />
Ships of 300 gt <strong>and</strong> over<br />
(1) No TEU-size class<br />
Yard =8000<br />
Hyundai, (Korea, Rep. of) (1) - - - 22 6 13 18 21 5 6 6 25 22 144<br />
(2) - - - 472 168 394 633 814 223 291 291 1409 1304 5999<br />
Samsung, (Korea, Rep. of) (1) - - - - - 16 - - 8 - - - 36 60<br />
(2) - - - - - 415 - - 359 - - - 2169 2943<br />
Hanjin Heavy Ind., (Korea, Rep. of) (1) - 2 - - 5 - 8 13 - - - - 9 37<br />
(2) - 33 - - 144 - 281 463 - - - - 528 1449<br />
Daewoo, (Korea, Rep. of) (1) 2 2 1 - - 6 - - - - 2 - 9 22<br />
(2) 18 28 20 - - 179 - - - - 98 - 556 898<br />
Ishikawajima-Harima Heavy Ind. (Japan) (1) - - - - - - 1 - - 2 - 8 5 16<br />
(2) - - - - - - 40 - - 99 - 390 289 818<br />
China SB Corp. (Taiwan) (1) - 4 - - - 11 - - 9 - - - - 24<br />
(2) - 56 - - - 310 - - 376 - - - - 742<br />
Koyo Dockyard (Japan) (1) - - - - - - - - 11 3 - - - 14<br />
(2) - - - - - - - - 474 147 - - - 621<br />
Mitsubishi Heavy Ind., (Japan) (1) - - 4 - - - 1 - - - 10 - - 15<br />
(2) - - 100 - - - 35 - - - 486 - - 620<br />
Aker MTW (Germany) (1) 2 - 17 8 - - - - - - - - - 27<br />
(2) 19 - 323 168 - - - - - - - - - 510<br />
Hudong Shipyard (China, PR of) (1) - - - - - 8 - - 6 - - - - 14<br />
(2) - - - - - 215 - - 258 - - - - 473<br />
Others (1) 95 25 18 33 25 13 - - 1 - - - 5 215<br />
(2) 872 384 342 707 678 409 - - 43 - - - 274 3710<br />
TOTAL (1) 99 33 40 63 36 67 28 34 40 11 18 33 86 588<br />
(2) 909 501 785 1347 990 1923 989 1277 1732 536 874 1799 5120 18782<br />
% share of total (1) 16.8 5.6 6.8 10.7 6.1 11.4 4.8 5.8 6.8 1.9 3.1 5.6 14.6 100.0<br />
(2) 4.8 2.7 4.2 7.2 5.3 10.2 5.3 6.8 9.2 2.9 4.7 9.6 27.3 100.0<br />
(a) inclusive 14 Ships with 124.5 cgt of which TEU is unknown<br />
SSMR June 2004 63
III - 1 Port surveys - container ports ISL<br />
1.1 World container port traffic by country 1995 - 2002<br />
TEU-%<br />
in 1000 TEU<br />
average<br />
change growth<br />
2002 (2001) over rate in %<br />
rank (rank) Country 1995 1996 1997 1998 1999 2000 2001 2002 prev. year 1995-2002<br />
1 (1) China, PR of + 17232 18698 19929 24708 29392 40984 44726 55717 24.6 18.3<br />
(Hong Kong) + ... ... ... ... ... ... ... ... ... ...<br />
2 (2) US + 19104 21777 21766 24165 25165 27315 27308 29679 8.7 6.5<br />
3 (3) Singapore + 11846 12944 14135 15136 15999 17096 15573 16986 9.1 5.3<br />
4 (4) Japan + 10604 11033 10847 10523 12104 13130 12981 13501 4.0 3.5<br />
5 (5) Taiwan 7849 7866 8516 8858 9758 10511 10426 11605 11.3 5.7<br />
6 (6) South Korea + 4503 5078 5637 6460 7303 9030 9287 11543 24.3 14.4<br />
7 (7) Germany, FR of + 4451 4766 5916 6128 6662 7696 8427 9122 8.3 10.8<br />
8 (8) Italy + 2992 3768 4690 5857 6022 6919 7073 7918 11.9 14.9<br />
9 (10) Malaysia + 2075 2550 2843 3026 3978 4642 6225 7542 21.2 20.2<br />
10 (11) UK + 4726 5676 6111 6520 6120 6435 7058 7060 0.0 5.9<br />
11 (9) Netherl<strong>and</strong>s + 4880 5117 5638 6062 6529 6407 6227 6742 8.3 4.7<br />
12 (12) Spain 3165 3455 4102 4757 5171 5790 6156 6669 8.3 11.2<br />
13 (14) UAE + 3512 3750 3654 4448 4850 5056 5082 5872 15.6 7.6<br />
14 (13) Belgium 2863 3211 3616 4053 4475 5058 5110 5758 12.7 10.5<br />
15 (16) Indonesia + 2048 1764 2479 2000 3552 3798 3902 4540 16.4 12.0<br />
16 (15) Australia + 2280 2484 2668 2845 3092 3543 3775 4272 13.2 9.4<br />
17 (17) Thail<strong>and</strong> 1962 2052 2124 2639 2892 3179 3387 3801 12.2 9.9<br />
18 (20) Canada 1740 1996 2212 2355 2703 2928 2890 3300 14.2 9.6<br />
19 (19) France + 1693 1841 2166 2496 2663 2923 2998 3278 9.3 9.9<br />
20 (18) Philippines + 1892 2336 2492 2442 2966 3032 3091 3271 5.8 8.1<br />
21 (22) India + 1360 1506 1738 1989 2064 2451 2765 3243 17.3 13.2<br />
22 (21) Brazil + 1414 1424 1377 1437 2182 2413 2324 2923 25.8 10.9<br />
23 (28) Saudi Arabia + 1090 1148 1287 1367 1448 1503 1677 1930 15.1 8.5<br />
24 (23) Panama + 484 617 1581 1426 1262 1357 1590 1852 16.4 21.1<br />
25 (25) South Africa 1360 1431 1467 1658 1342 1847 2021 1802 -10.9 4.1<br />
26 (29) Turkey + 738 675 718 1262 1325 1592 1527 1777 16.4 13.4<br />
27 (26) Sri Lanka 1029 1356 1687 1714 1704 1733 1727 1765 2.2 8.0<br />
28 (30) Greece + 811 737 845 1120 1187 1391 1412 1660 17.6 10.8<br />
29 (32) Mexico + 557 683 832 669 1127 1162 1358 1562 15.0 15.9<br />
30 (31) Israel 888 990 1090 854 1254 1316 1378 1461 6.0 7.4<br />
31 (24) Puerto Rico 1626 1630 1972 2071 2150 1946 1886 1426 -24.4 -1.9<br />
32 (33) Oman 142 ... ... 139 774 1190 1332 1415 6.3 38.9<br />
33 (36) New Zeal<strong>and</strong> + 793 894 950 887 994 1067 1139 1414 24.1 8.6<br />
34 (35) Malta 554 632 704 1119 1091 1082 1206 1289 6.9 12.8<br />
35 (27) Egypt + 1063 911 994 805 1415 1626 1709 1223 -28.4 2.0<br />
36 (34) Chile + 540 633 711 759 1099 1253 1081 1147 6.2 11.4<br />
37 (39) Canary Isl<strong>and</strong>s + 536 577 843 739 1002 1029 1077 1158 7.5 11.6<br />
38 (40) Finl<strong>and</strong> + 548 650 767 712 657 928 1019 1092 7.2 10.4<br />
39 (41) Venezuela + 215 245 606 830 755 675 924 1078 16.7 25.9<br />
40 (42) Jamaica 395 478 497 671 608 766 983 1065 8.3 15.2<br />
41 (38) Hawaiian Isl<strong>and</strong>s + 577 731 875 844 545 1021 1047 ... ... ...<br />
42 (44) Portugal 444 510 522 596 611 670 734 970 32.2 11.8<br />
43 (45) Pakistan 551 555 505 701 697 775 879 966 9.9 8.4<br />
44 (43) Sweden + 734 770 797 780 849 884 851 915 7.5 3.2<br />
45 (37) Argentina + 254 530 720 807 1122 1145 1021 847 -17.0 18.8<br />
46 (56) Russia 167 239 292 215 249 316 609 796 30.6 25.0<br />
47 (46) Irel<strong>and</strong> 745 1050 1192 1289 663 721 722 775 7.4 0.6<br />
48 (47) Colombia ... ... ... 420 730 792 577 603 4.5 ...<br />
49 (49) Iran 174 244 260 326 331 428 602 ... ... ...<br />
50 (52) Ivory Coast 261 310 416 469 354 434 544 579 6.5 12.0<br />
51 (48) Bahamas ... ... ... ... 544 572 ... ... ... ...<br />
52 (50) Costa Rica + 195 212 227 ... 590 574 564 ... ... ...<br />
53 (53) Peru ... ... 322 378 376 461 538 ... ... ...<br />
54 (55) Ecuador 285 323 376 407 400 414 414 463 11.6 ...<br />
55 (51) Denmark + 467 476 477 446 497 569 457 457 0.0 -0.3<br />
56 (54) Dominican Rep. + ... ... ... ... ... 566 488 431 -11.7 ...<br />
57 (57) Morocco + 194 213 211 261 296 329 347 376 8.4 9.9<br />
58 (59) Lebanon 129 259 310 290 271 263 299 299 -0.2 12.8<br />
59 (58) Uruguay + 138 ... ... ... 250 287 302 293 -2.9 11.4<br />
60 (60) Cyprus + 374 564 403 214 239 259 243 234 -3.9 -6.5<br />
Others 4277 4387 3632 2347 5178 3946 5697 6877<br />
137239 150752 163744 178495 203207 231689 243815 266337 9.2 9.9<br />
+ compare footnotes <strong>and</strong> remarks on page 61<br />
64 SSMR June 2004
III - 1 Port surveys - container ports ISL<br />
1.1 World container port traffic by country 1995 - 2002 (continued)<br />
1997 Figures not available for Latvia, Uruguay, Russia <strong>and</strong> Guam.<br />
1998 Figures not available for Costa Rica <strong>and</strong> Ivory Coast.<br />
1999 Figures not available for: Angola, Antigua & Barbuda, Austria, Benin, Gambia, Guam, Haiti, Honduras, Madeira, Switzerl<strong>and</strong> <strong>and</strong> Ukraine.<br />
2000 Others include Bahrain, Bangladesh, Barbados, Fiji, Gibraltar, Guadeloupe, Guinea, Hungary, Martinique, New Caledonia, Saint Lucia,<br />
Tanzania, Trinidad & Tobago.<br />
2001 Others exclude Bahamas, Cameroon, Croatio, Kenya, Lebanon, Montenegro, Myanmar, Namibia, Nicaragua.<br />
2002 Others exclude Brunei, Costa Rica, Hawai, Honduras, Iran, Kuwait, Peru, Seychelles.<br />
Footnotes (+) in alphabetical order:<br />
Argentina 2000: excl. La Plata, Puerto Deseado, Rosario, Ushuaia, Zarate;<br />
Australia: 1996: excl.Gladstone;<br />
Brazil: 1994: excl. Manaus, Recife; 1995: estimate; 1996: excl. Belem, Fortaleza, Ilheus;1997: excl. Salvador; 1998: excl. Paranagua; 2001: excl.<br />
Rio de Janairo, excl. Suape;<br />
Canary Isl<strong>and</strong>s: 1995: excl. Arrecife, Rosario; 2001: excl. Santa Cruz de la Palma;<br />
Chile: 2000: excl. Chanaral, Talcahuano; 2001: excl. San Vincente;<br />
China PR of: 1995: excl. Huangpu; 1996: excl. Chiwan, Dalian, Foshan, Fuzhou, Nanjing, Ningbo, Qingdao, Qinhuangdao, San Shan; since 1995 incl.<br />
Hong Kong; 1997: excl. Gaolan, Tianjin, Xiamen; Separate figures for Hong Kong: TEU; TEU; 1995: 12550 TEU; 1996: 13460 TEU;<br />
average growth rate 1991-1996: 16.9%; TEU-% change over prev. year: 7.3%; 2000: excl. Zhanijang; 2001: excl. Gaolan, Jiangmen,<br />
Jiuzhou, San Shan, Shantou, Shekou; 2002 excl. Shantou<br />
Costa Rica: 1995 <strong>and</strong> 1996: units only; 1997: estimated units only;<br />
Cyprus: 1994: excl. Famagusta;<br />
Denmark 2000: excl. Esbjerg;<br />
Domenican Republic: 2001: excl. Boca Chica, Puerto Plata, Santo Domingo;<br />
Egypt: 1996: excl. Alex<strong>and</strong>ria; 2002: excl. Port Said;<br />
Finl<strong>and</strong>: 1994: excl. Hamina;<br />
France: 1997: excl. Bordeaux; 2000: excl. Sete;<br />
Germany: 1995: excl. Emden; 1998: excl. Germersheim; 2000: excl. Emmerich; 2001: excl. Lubeck; 2002 excl. Mnnheim;<br />
Greece 2000: excl. Heraklion;<br />
Hong Kong until 1994 Hong Kong is included in Others <strong>and</strong> from 1995 in China, PR of; see remark China, PR of.;<br />
Icel<strong>and</strong>: 1994: Reykjavik only;<br />
India: 1996: excl. Cochin; 1997: excl.Kochi; 2001: excl. Cochin, K<strong>and</strong>la;<br />
Indonesia: 1996: excl. Tanjung Perak;1997: excl. Tanjung Perak;<br />
Italy: 1997: excl. Salerno; 1998: excl. Naples; 2001: excl. Brindisi<br />
Japan: 1996: excl. Chiba, Hachinohe, Hitachi, Hoshohima, Imabari, Iwakuni, Kanazawa, Komatsu, Maizuru, Matsuyama, Naoetsu, Sakaiminato,<br />
Shibushi, Tokuyama, Toyama Shinko, Tsuruga, Wakayama; 1997: excl. Akita; 1998: excl. Kanazawa, Maizuru, Mitajiri, Toyama Shinko;<br />
1999: excl. Chiba, Hachinohe, Kawasaki, Shimonoseki, Yokkaichi; 2001: excl. Kanazawa; 2002: excl. Hitachi;<br />
Latvia: 1996: annualised part year figure;<br />
Malaysia: 1997: excl. S<strong>and</strong>akan; 2001: excl. Penang; 2002: excl. Kota Kinabalu;<br />
Mexico: 1995: excl. Acapulco, Mazatlun, Progreso, Salina Cruz; 1998: excl. Manzanillo;<br />
Morocco: 1996: excl. Tangier; 1997: excl. Tangier; 2001: excl. Tangier;<br />
Netherl<strong>and</strong>s 2000: excl. Flushing, Nijmegen;<br />
Netherl<strong>and</strong>s: 1998: excl. Born; 2002: excl. Flushing;<br />
New Zeal<strong>and</strong>: 1996: excl. Wellington;1997: excl. Onehunga; 1998: excl. Onehunga; 2001: excl. Onehunga;<br />
Panama: 1998: excl. Balboa, Cristobal, Las Minas Bay; 2002; excl. Cristobal;<br />
Philippines: 1997: excl. Subic Bay;<br />
Pol<strong>and</strong>: 1994: excl. Gdansk; 1996: excl. Gdansk; 1997: excl. Gdansk; 1998: excl. Gdansk; 1999: excl. Gdansk;<br />
Saudi Arabia: 1998: excl. Jubail; 2002: excl. Janbu;<br />
Singapore since 2000 incl.Jurong;<br />
South Korea: 1995: Busan only; 2002 excl. Inchon;<br />
Sweden: 2001: excl. Vasteras;<br />
Trinidad & Tobago: 1997: excl. Point Lisas;<br />
Turkey: 1996: excl. B<strong>and</strong>irma, Gemport, Iskenderun, Mersin, Samsun;1997: excl. Gemport, Haydarpasa, Iskenderun, Mersin; 1998: excl. Izmir;<br />
UAE: 1994: excl. Mina Saqr;1997: excl. Fujairah; 2001: excl. MinaZayed;<br />
UK: 1995: excl. Larne, Teesport; 1996: excl. Larne, Harrwich, Immingham; 1997: excl. Grimsby, Ipswich; 1998: excl. Bristol, Clideport,<br />
Grangemoutj, Swansea, Warrenpoint; 1999: excl. Boston, Cardiff, Dartford, Dover, Tyne; 2000: excl.Purfleet; 2001: excl. Belfast, Harwich;<br />
2002: excl.Datrford, Purfleet;<br />
Uruguay: 1996: estimate;<br />
US: Since 1994: excl. Hawaiian Isl<strong>and</strong>s; 1995: excl. Wilmington DE, Lake Charles, Anchorage; 1996 & 1997: excl. Beaumont, Brunswick,<br />
Lake Charles average growth rate 1991- 1996: incl. Hawaiian Is.: total value 1996: 21319 TEU, average growth rate: 6,5%; 2002 excl.<br />
Venzuela: 1994: Puerto Cabello only; 2000: excl. Maracaibo; 2002: excl. La Guaria;<br />
(Source: Compiled from Containerisation International Yearbook 2004 <strong>and</strong> various previous issues)<br />
SSMR June 2004 65
III - 1 Port surveys - container ports ISL<br />
1.2 Total container traffic of selected ports by region 1999-2003<br />
1.2.1 America<br />
Port Tare<br />
(1) Total containers h<strong>and</strong>led (in 1000)<br />
(2) Container tonnage (in 1000 t)<br />
% change<br />
over<br />
prev.<br />
Av.<br />
growth<br />
degree of<br />
containerisation<br />
(a)<br />
(Country) Period Unit weight 1999 2000 2001 2002 2003 Period rate<br />
2003<br />
Los Angeles (1) FY TEU 4354 4998 5634 6106 7179 17.6 13.3 ...<br />
(US) (2) ... ... ... ... ... ... ... ... ...<br />
Long Beach (1) CY TEU 4408 4601 4463 4526 4658 2.9 1.4 96.9<br />
(US) (2) RT excl. 81033 87193 83728 82133 81400 -0.9 0.1<br />
New York / New Jersey (1) CY TEU 2829 3050 3316 3749 4068 8.5 9.5 ...<br />
(US) (2) MT excl. ... ... ... ... ... ... ...<br />
Oakl<strong>and</strong> (c) (1) CY TEU 1664 1777 1644 1708 1923 12.6 3.7 99.8<br />
(US) (2) RT excl. 13 22814 21215 21667 24397 12.6 563.3<br />
Tacoma (d) (1) CY TEU 1271 1376 1324 1471 1738 18.2 8.1 96.8<br />
(US) (2) MT excl. 7202 7374 7374 9225 11148 20.8 11.5<br />
San Juan (b) (1) FY TEU 1884 1830 1740 1690 1666 -1.4 -3.0 82.4<br />
(Puerto Rico) (2) MT excl. 6627 6584 6189 6585 6590 0.1 -0.1<br />
Port of Virginia (1) CY TEU 1307 1348 1304 1438 1646 14.5 5.9 100.0<br />
(US) (2) MT excl. 10117 10857 10475 11642 12694 9.0 5.8<br />
Santos (1) CY TEU 775 945 1048 1224 1560 27.4 19.1 74.1<br />
(Brazil) (2) MT incl 8651 10469 11335 13456 16783 24.7 18.0<br />
Vancouver (1) CY TEU 1070 1163 1147 1458 1539 5.5 9.5 79.0<br />
(Canada) (2) MT excl. 9004 9978 10073 12031 12615 4.9 8.8<br />
Savannah (1) FY TEU 849 1018 1077 1328 1521 14.6 15.7 ...<br />
(US) (2) MT excl. 6303 6961 ... ... 10045 ... 12.4<br />
Seattle (1) CY TEU 1490 1488 1315 1439 1486 3.3 -0.1 98.2<br />
(US) (2) MT excl. 10718 11664 9942 9704 9791 0.9 -2.2<br />
Houston (1) CY TEU 1031 1074 1058 1147 1244 8.4 4.8 ...<br />
(US) (2) MT excl. 9006 9648 9181 9888 10813 9.4 4.7<br />
Kingston (c) (1) CY TEU 689 766 859 927 1140 23.0 13.4 88.4<br />
(Jamaica) (2) MT excl. 5239 6907 6683 7393 8115 9.8 11.6<br />
Montreal (1) CY TEU 993 1014 989 1055 1109 5.1 2.8 95.9<br />
(Canada) (2) MT excl. 9148 9205 8718 9446 9755 3.3 1.6<br />
Miami (1) FY TEU 778 868 956 981 1041 6.2 7.6 ...<br />
(US) (2) MT incl 6076 7800 7906 8113 7875 -2.9 6.7<br />
(a) Degree of containerisation calculated on the basis of total general cargo traffic.<br />
(b) Excluding transhipment. (c) Including transhipment counted incoming only. (d) Container tonnage includes weight of empty containers.<br />
Fig. III - 1: Container traffic at major American ports by region 1994-2003 (TEU index)<br />
Note: Based on number of containers h<strong>and</strong>led at the major ports which are presendet in table 1.2.1.<br />
Source: ISL Port Data Base 2004 ©<br />
66 SSMR June 2004<br />
ISL2004
III - 1 Port surveys - container ports ISL<br />
1.2.2 Asia<br />
(1) Total containers h<strong>and</strong>led (in 1000)<br />
Port Tare (2) Container tonnage (in 1000 t)<br />
(Country) Period Unit weight 1999 2000 2001 2002 2003<br />
Hong Kong (1) CY TEU 16211 18098 17826 19144 20449 6.8 6.0 86.8<br />
(China, PR of) (2) MT excl. 110097 120959 122008 133151 146916 10.3 7.5<br />
Singapore (1) CY TEU 15945 17087 15571 16941 18411 8.7 3.7 92.7<br />
(Singapore) (2) FT excl. 176711 185857 171209 183955 191688 4.2 2.1<br />
Shanghai (1) CY TEU 4206 5613 6340 8620 11280 30.9 28.0 ...<br />
(China, PR of) (2) MT excl. ... ... ... ... ... ... ...<br />
Shenzhen (1) CY TEU 2984 3794 5076 7614 10650 39.9 37.4 ...<br />
(China, PR of) (2) ... ... ... ... ... ... ... ... ...<br />
Busan (1) CY TEU 5527 7499 7954 9409 10247 8.9 16.7 ...<br />
(Korea, Rep. of) (2) RT excl. 81039 111702 122320 139919 ... 14.4 20.0<br />
Kaohsiung (1) CY TEU 6985 7426 7541 8493 8843 4.1 ... 61.4<br />
(Taiwan) (2) MT excl. 21641 24279 24242 26886 28120 ... ...<br />
Dubai Ports (1) CY TEU 2845 3059 3502 4194 5152 22.8 16.0 88.6<br />
(UAE) (2) MT excl. 23188 24351 27553 32683 ... 18.6 12.1<br />
Port Kelang (1) CY TEU 2550 3207 3760 4533 4841 6.8 17.4 92.0<br />
(Malaysia) (2) FT excl. 43853 48097 59861 63279 68539 8.3 11.8<br />
Qingdao (1) CY TEU 1542 2120 2639 3410 4240 24.3 28.8 ...<br />
(China, PR of) (2) ... ... ... ... ... ... ... ... ...<br />
Tanjung Pelapas (1) CY TEU ... 418 2050 2660 3487 31.1 ... ...<br />
(Malaysia) (2) ... ... ... ... ... ... ... ... ...<br />
Tianjin (1) CY TEU 1302 1708 2011 2408 3000 24.6 23.2 ...<br />
(China, PR of) (2) MT ?? ... ... ... ... ... ... ...<br />
Tokyo (1) CY TEU 2695 2899 2596 2784 2838 1.9 1.3 44.9 #<br />
(Japan) (2) FT excl. 36838 39148 34747 37112 ... 6.8 0.2<br />
Guangzhou (1) CY TEU 1179 1429 1738 2180 2770 27.1 23.8 ...<br />
(China, PR of) (2) ... ... ... ... ... ... ... ... ...<br />
Ningbo (1) CY TEU 601 902 1213 1860 2750 47.8 46.3 ...<br />
(China, PR of) (2) ... ... ... ... ... ... ... ... ...<br />
Laem Chabang (1) FY TEU 1756 2111 2307 2657 3181 19.7 16.0 ...<br />
(Thail<strong>and</strong>) (2) MT excl. 16568 19101 21364 25593 ... ... ...<br />
(a) Degree of containerisation calculated on the basis of total general cargo traffic. Figures marked with # are based on the year 2002.<br />
Fig. III-2: Container traffic at major Asian ports by region 1994-2003 (TEU index)<br />
Note: Based on number of containers h<strong>and</strong>led at the major ports which are presented in table 1.2.2.<br />
Source: ISL Port Data Base 2004 ©<br />
% change<br />
over prev.<br />
period<br />
Av. growth<br />
rate<br />
degree of<br />
containerisation<br />
(a)<br />
2003<br />
ISL 2004<br />
SSMR June 2004 67
III - 1 Port surveys - container ports ISL<br />
1.2.3 Europe<br />
Port Tare<br />
(1) Total containers h<strong>and</strong>led (in 1000)<br />
(2) Container tonnage (in 1000 t)<br />
% change<br />
over prev. Av. growth<br />
degree of<br />
containerisation<br />
(a)<br />
(Country) Period Unit weight 1999 2000 2001 2002 2003 Period rate 2003<br />
Rotterdam (1) CY TEU 6245 6268 6078 6526 7107 8.9 3.3 73.7<br />
(Netherl<strong>and</strong>s) (2) MT excl. 64065 64256 61193 65245 70607 8.2 2.5<br />
Hamburg (1) CY TEU 3750 4281 4684 5374 6138 14.2 13.1 93.4<br />
(Germany, FR of) (2) MT incl 40596 45888 49798 57187 64279 12.4 12.2<br />
Antwerp (1) CY TEU 3614 4082 4218 4777 5445 14.0 10.8 72.3<br />
(Belgium) (2) MT incl 39442 44525 46410 53017 61350 15.7 11.7<br />
Bremen/Bremerhaven (1) CY TEU 2201 2752 2974 3032 3195 5.4 9.8 81.5<br />
(Germany, FR of) (2) MT incl 21928 27722 29476 30287 31801 5.0 9.7<br />
Gioia Tauro (1) CY TEU 2253 2653 2488 2955 3149 6.6 8.7 ...<br />
(Italy) (2) ... ... ... ... ... ... ... ... ...<br />
Algeciras - La Linea (1) CY TEU 1835 2009 2152 2229 2563 15.0 8.7 88.3<br />
(Spain) (2) MT incl 18785 20334 24153 25403 29398 15.7 11.8<br />
Valencia (1) CY TEU 1161 1308 1507 1821 1993 9.4 14.5 77.8<br />
(Spain) (2) MT incl 12959 14135 16147 19758 22109 11.9 14.3<br />
Le Havre (1) CY TEU 1378 1465 1523 1720 1985 15.3 9.5 83.7<br />
(France) (2) MT incl 12816 13781 14569 16821 19133 13.7 10.5<br />
Felixstowe (b) (1) CY TEU 2697 2793 2800 2684 2700 0.6 0.0 80.0<br />
(United Kingdom) (2) MT incl 24704 24931 24270 ... ... -1.8 -0.9<br />
Barcelona (1) CY TEU 1235 1388 1411 1461 1652 13.1 7.6 71.7<br />
(Spain) (2) MT incl 11532 12989 13430 13842 15344 10.9 7.4<br />
Genoa (1) CY TEU 1234 1501 1527 1531 1606 4.9 6.8 62.4<br />
(Italy) (2) MT incl 11884 14272 14070 14151 15071 6.5 6.1<br />
Piraeus (1) CY TEU 965 1161 1166 1405 1605 14.2 13.6 77.0<br />
(Greece) (2) MT excl. 8683 10575 11283 13287 15398 15.9 15.4<br />
Dublin (1) CY TEU 1304 1380 1445 1503 1596 6.2 5.2 95.9<br />
(Irish Republic) (2) MT incl 14199 15202 15805 16712 17666 5.7 5.6<br />
London (1) CY TEU 1462 1463 1453 1615 1557 -3.6 1.6 81.1<br />
(United Kingdom) (2) MT excl. 10360 10711 10986 12015 12233 1.8 4.2<br />
Marsaxlokk (1) CY TEU 1045 1033 1165 1244 1300 4.5 5.6 ...<br />
(Malta) (2) ... ... ... ... ... ... ... ... ...<br />
(a) Degree of containerisation calculated on the basis of total general cargo traffic. (b) Figures for 2003 are prelimanary.<br />
(b) Figures include transhipment counted incoming only.<br />
Fig. III - 3: Container traffic at major European ports by region 1994-2003 (TEU index)<br />
Note: Based on number of containers h<strong>and</strong>led at the major ports which are presented in table 1.2.3.<br />
Source: ISL Port Data Base 2004 ©<br />
68 SSMR June 2004<br />
ISL2004
III - 1 Port surveys - container ports ISL<br />
1.3 Regional spreading of container traffic of selected ports 2003<br />
1.3.1 American ports<br />
Region<br />
(1) loaded,<br />
(2) discharged,<br />
Africa America Asia Europe Oceania unknown Total<br />
port<br />
America<br />
(3) total (1) + (2) in %<br />
Unit in 1000<br />
Halifax (a) (1) 2.6<br />
27.7<br />
34.7<br />
34.8<br />
0.2<br />
-<br />
2506 MT<br />
(2) 0.2<br />
13.5<br />
19.4<br />
66.9<br />
-<br />
-<br />
1908 MT<br />
(3) 1.5<br />
21.6<br />
28.1<br />
48.7<br />
0.1<br />
-<br />
4414 MT<br />
Houston (1) 8.5<br />
40.7<br />
7.6<br />
42.1<br />
1.1<br />
-<br />
522 TEU<br />
(2) 1.9<br />
15.0<br />
10.8<br />
71.3<br />
1.0<br />
-<br />
386 TEU<br />
(3) 5.7<br />
29.8<br />
9.0<br />
54.5<br />
1.0<br />
-<br />
907 TEU<br />
Los Angeles (b) (1) 0.1<br />
1.9<br />
84.6<br />
3.4<br />
10.0<br />
-<br />
853 TEU<br />
(2) 0.1<br />
1.7<br />
94.2<br />
2.3<br />
1.7<br />
-<br />
2863 TEU<br />
(3) 0.1<br />
1.7<br />
92.0<br />
2.6<br />
3.6<br />
-<br />
3716 TEU<br />
Montreal (b) (1) 2.2<br />
6.8<br />
2.7<br />
88.4<br />
-<br />
-<br />
4343 MT<br />
(2) 1.1<br />
0.4<br />
1.2<br />
97.3<br />
-<br />
-<br />
5103 MT<br />
New York / New<br />
(3)<br />
(1)<br />
1.6<br />
4.2<br />
3.3<br />
18.4<br />
1.9<br />
39.2<br />
93.2<br />
32.6<br />
-<br />
1.4<br />
-<br />
-<br />
9446 MT<br />
1449 TEU<br />
Jersey<br />
(2) 2.3<br />
8.5<br />
49.8<br />
41.0<br />
0.8<br />
-<br />
2619 TEU<br />
(3) 3.0<br />
12.0<br />
46.0<br />
38.0<br />
1.0<br />
-<br />
4068 TEU<br />
Oakl<strong>and</strong> (1) -<br />
26.2<br />
67.0<br />
5.9<br />
0.6<br />
0.2 733 TEU<br />
(2) -<br />
11.7<br />
74.7<br />
6.8<br />
6.7<br />
0.1 547 TEU<br />
(3) -<br />
20.0<br />
70.3<br />
6.3<br />
3.3<br />
0.1 1280 TEU<br />
Port of Virginia (b) (1) 11.7<br />
7.6<br />
35.6<br />
43.2<br />
1.5<br />
-<br />
705 TEU<br />
(2) 3.7<br />
13.8<br />
35.7<br />
46.1<br />
0.7<br />
-<br />
724 TEU<br />
(3) 7.7<br />
10.7<br />
35.6<br />
44.6<br />
1.1<br />
-<br />
1429 TEU<br />
Vancouver (1) 0.3<br />
0.1<br />
99.2<br />
0.1<br />
0.4<br />
-<br />
7642 MT<br />
(2) 0.0<br />
0.1<br />
98.8<br />
0.7<br />
0.4<br />
0.0 4973 MT<br />
(3) 0.1<br />
0.1<br />
99.0<br />
0.4<br />
0.4<br />
0.0 12615 MT<br />
Discrepancies due to rounding <strong>and</strong> exclusion of local traffic are possible; (a) figures for 2001; (b) figures for 2002.<br />
Units: TEU - Twenty feet equivalent unit ; MT - metric tons<br />
© ISL Port Data Base 2004<br />
Fig. III - 4 North American ports - container traffic according to loading/unloading regions<br />
ISL2004<br />
SSMR June 2004 69
III - 1 Port surveys - container ports ISL<br />
1.3 Regional spreading of container traffic (continued)<br />
1.3.2 Asian ports<br />
(1) loaded,<br />
Region (2) discharged,<br />
Africa America Asia Europe Oceania unknown Total<br />
port<br />
Asia<br />
(3) total (1) + (2) in %<br />
Unit in 1000<br />
Hong Kong (1) 1.9<br />
29.4<br />
50.5<br />
15.7<br />
2.5<br />
-<br />
8922 TEU<br />
(2) 0.6<br />
10.9<br />
80.0<br />
6.9<br />
1.6<br />
-<br />
7610 TEU<br />
(3) 1.3<br />
20.9<br />
64.1<br />
11.7<br />
2.1<br />
- 16532 TEU<br />
Kaohsiung (1) 2.0<br />
25.0<br />
57.9<br />
13.2<br />
1.9<br />
- 15344 MT<br />
(2) 2.7<br />
28.6<br />
42.3<br />
22.4<br />
4.1<br />
- 12776 MT<br />
(3) 2.3<br />
26.6<br />
50.8<br />
17.4<br />
2.9<br />
- 28120 MT<br />
Keelung (1) 2.3<br />
17.8<br />
74.6<br />
0.7<br />
4.6<br />
-<br />
569 TEU<br />
(2) 1.2<br />
16.2<br />
78.5<br />
1.2<br />
2.9<br />
-<br />
878 TEU<br />
(3) 1.6<br />
16.8<br />
77.0<br />
1.0<br />
3.5<br />
-<br />
1448 TEU<br />
Kobe (a) (1) 0.6<br />
21.5<br />
64.8<br />
12.6<br />
0.4<br />
- 13048 FT<br />
(2) 0.5<br />
28.1<br />
59.1<br />
11.6<br />
0.7<br />
- 14507 FT<br />
(3) 0.5<br />
25.0<br />
61.8<br />
12.1<br />
0.5<br />
0.0 27555 FT<br />
Osaka (a) (1) 0.2<br />
10.3<br />
83.2<br />
2.6<br />
3.8<br />
-<br />
696 TEU<br />
(2) 0.1<br />
9.2<br />
80.6<br />
5.5<br />
4.7<br />
-<br />
802 TEU<br />
(3) 0.1<br />
9.7<br />
81.8<br />
4.1<br />
4.3<br />
-<br />
1498 TEU<br />
Tokyo (a) (1) -<br />
34.2<br />
45.1<br />
20.2<br />
0.4<br />
0.0 15188 FT<br />
(2) -<br />
24.8<br />
54.4<br />
19.7<br />
0.9<br />
0.2 21924 FT<br />
(3) -<br />
28.7<br />
50.6<br />
19.9<br />
0.7<br />
0.1 37112 FT<br />
Yokohama (1) 3.3<br />
14.8<br />
74.8<br />
4.0<br />
3.2<br />
-<br />
1282 TEU<br />
(2) 1.3<br />
35.3<br />
51.1<br />
5.8<br />
6.5<br />
-<br />
1221 TEU<br />
(3) 2.3<br />
24.8<br />
63.2<br />
4.8<br />
4.8<br />
-<br />
2503 TEU<br />
Discrepancies due to rounding <strong>and</strong> exclusion of local traffic are possible; (a) figures are for the year 2002.<br />
Units: TEU - Twenty feet equivalent unit ; MT - metric tons; FT - Freight tons<br />
© ISL Port Data Base 2004<br />
Fig III - 5 Asian ports - container traffic according to loading/unloading regions<br />
70 SSMR June 2004<br />
ISL2004
III - 1 Port surveys - container ports ISL<br />
1.3 Regional spreading of container traffic (continued)<br />
1.3.3 European ports<br />
(1) loaded,<br />
Region (2) discharged,<br />
Africa America Asia Europe Oceania unknown Total<br />
port<br />
Europe<br />
(3) total (1) + (2) in %<br />
Unit in 1000<br />
Antwerp (1) 10.0<br />
26.0<br />
39.3<br />
23.3<br />
0.7<br />
0.7 2803 TEU<br />
(2) 11.3<br />
35.2<br />
36.2<br />
16.3<br />
0.9<br />
0.1 2642 TEU<br />
(3) 10.7<br />
30.4<br />
37.8<br />
19.9<br />
0.8<br />
0.4 5445 TEU<br />
Bremen/Bre-<br />
(1) 4.7<br />
39.1<br />
24.7<br />
31.5<br />
0.0<br />
- 1671 TEU<br />
merhaven<br />
(2)<br />
(3)<br />
3.3<br />
4.0<br />
29.3<br />
34.4<br />
21.3<br />
23.1<br />
46.1<br />
38.4<br />
0.0<br />
0.0<br />
-<br />
-<br />
1518 TEU<br />
3190 TEU<br />
Genoa (1) 15.2<br />
33.0<br />
29.1<br />
18.9<br />
0.1<br />
3.7 804 TEU<br />
(2) 13.4<br />
24.9<br />
35.3<br />
16.5<br />
0.0<br />
9.8 802 TEU<br />
(3) 14.3<br />
29.0<br />
32.2<br />
17.7<br />
0.1<br />
6.7 1606 TEU<br />
Hamburg (1) 2.1<br />
12.1<br />
49.6<br />
34.7<br />
1.5<br />
0.0 2982 TEU<br />
(2) 1.2<br />
10.0<br />
50.8<br />
37.1<br />
1.0<br />
0.0 3158 TEU<br />
(3) 1.6<br />
11.0<br />
50.2<br />
53.8<br />
1.2<br />
0.0 6140 TEU<br />
Le Havre (1) 10.5<br />
37.6<br />
33.8<br />
15.7<br />
2.4<br />
- 995 TEU<br />
(2) 5.2<br />
21.1<br />
36.0<br />
37.2<br />
0.4<br />
- 989 TEU<br />
(3) 7.8<br />
29.4<br />
34.9<br />
26.4<br />
1.4<br />
- 1985 TEU<br />
Piraeus (1) 5.5<br />
3.0<br />
43.9<br />
31.7<br />
-<br />
15.9 794 TEU<br />
(2) 3.8<br />
1.8<br />
41.6<br />
49.9<br />
0.0<br />
2.9 811 TEU<br />
(3) 4.6<br />
2.4<br />
42.7<br />
40.9<br />
0.0<br />
9.3 1605 TEU<br />
Rotterdam (1) 2.9<br />
18.3<br />
35.9<br />
41.0<br />
1.9<br />
- 3482 TEU<br />
(2) 4.2<br />
0.9<br />
34.5<br />
60.2<br />
0.2<br />
- 588 TEU<br />
(3) 4.5<br />
1.6<br />
40.8<br />
52.9<br />
0.2<br />
- 1166 TEU<br />
Valencia (1) 19.6<br />
17.7<br />
21.5<br />
30.0<br />
0.9<br />
10.2 993 TEU<br />
(2) 9.3<br />
18.6<br />
35.0<br />
17.5<br />
0.2<br />
19.4 1000 TEU<br />
(3) 14.4<br />
18.2<br />
28.3<br />
23.8<br />
0.6<br />
14.8 1993 TEU<br />
Zeebrugge (1) 1.4<br />
0.3<br />
25.6<br />
71.8<br />
0.8<br />
0.1 540 TEU<br />
(2) 0.1<br />
0.7<br />
17.9<br />
77.9<br />
3.3<br />
0.1 473 TEU<br />
(3) 0.8<br />
0.5<br />
22.0<br />
74.6<br />
2.0<br />
0.1 1013 TEU<br />
Units: TEU - Twenty feet equivalent unit ; MT - metric tons<br />
Discrepancies due to rounding <strong>and</strong> exclusion of local traffic are possible.<br />
© ISL Port Data Base 2004<br />
Fig III - 6 European ports - container traffic according to loading/unloading regions<br />
ISL2004<br />
SSMR June 2004 71
III - 2 Sea canals ISL<br />
2.1 Monthly traffic overview 2003 - 2004<br />
2.1.1 <strong>Shipping</strong> traffic<br />
Panama Canal Suez Canal Kiel Canal<br />
tonnage in 1000<br />
St. Lawrence Seaway<br />
Southbound Northbound Westbound Eastbound Montreal-L.Ontario Well<strong>and</strong> Canal<br />
Year/ No of Net No of Net No of Net No of Net No of Net No of Gross No of Gross<br />
Month trans. tonnage trans. tonnage trans. tonnage trans. tonnage trans. tonnage trans. tonnage trans. tonnage<br />
2003<br />
January 1045 21682 635 21215 590 20281 1098 1904 1075 1845 - - - -<br />
February 961 19851 649 21165 569 20906 1095 1875 1068 1955 - - - -<br />
March 1085 21572 669 23381 693 24598 1265 2298 1187 2185 - - - -<br />
April 1032 20421 663 23755 678 23691 1128 1970 1220 2208 209 2895 288 3809<br />
May 1011 20454 608 22525 693 23965 1140 2007 1130 2048 302 3405 310 3428<br />
June 950 19148 638 20552 626 21772 1101 1858 1108 2036 345 3195 372 3532<br />
July 955 20265 682 22845 660 23087 1074 1849 1105 1949 246 3300 257 3784<br />
August 938 19675 689 24000 647 22673 1064 1764 1101 2019 333 3539 357 3776<br />
September 860 18062 649 23679 618 22183 1113 1865 1038 1767 290 3359 319 3712<br />
October 958 21579 666 23996 672 24043 1156 1964 1193 2039 291 3594 377 4175<br />
November 994 20200 664 22006 647 24237 1290 2188 1227 2064 381 4641 404 5091<br />
December<br />
2004<br />
936 19087 683 23348 679 25478 1276 2209 1241 2250 182 2151 343 4047<br />
January 1072 22961 662 22840 707 26287 1248 2253 1201 2275 - - - -<br />
February 1050 21560 636 21630 643 24255 1249 2242 1202 2221 - - - -<br />
March 1165 23463 694 24394 705 26313 1238 2232 1221 2367 - - - -<br />
2.1.2 Goods traffic<br />
Panama Canal<br />
Suez Canal<br />
Kiel Canal<br />
in 1000 metric tons<br />
Year/ Montreal-<br />
Month East- West- Total South- North- Total West- East- Total Lake Well<strong>and</strong><br />
bound bound bound bound bound bound Ontario Canal<br />
2003<br />
January 7199 9340 16539 15498 19130 34628 3374 1828 5201 - -<br />
February 6247 9628 15875 15283 19533 34816 3442 1823 5265 - -<br />
March 7216 9308 16524 17491 20922 38413 4304 2042 6345 - -<br />
April 6799 8445 15244 17195 20279 37474 3690 2088 5778 2706 3312<br />
May 7258 8559 15817 15999 21233 37232 3437 1814 5251 3086 3203<br />
June 6597 8472 15069 16028 19941 35969 3220 1688 4908 2873 3372<br />
July 6908 9340 16248 17466 20902 38368 3080 1701 4781 3011 3481<br />
August 7168 9000 16168 17302 21256 38558 3008 1889 4896 3157 3482<br />
September 6439 7369 13808 16098 21152 37250 3081 1790 4871 3306 3517<br />
October 7019 9305 16324 18056 22968 41024 3481 1964 5445 3797 3828<br />
November 6779 9955 16734 16602 24973 41575 3897 2120 6018 3225 3693<br />
December<br />
2004<br />
6032 9079 15111 18692 23966 42658 4030 2083 6114 3717 3988<br />
January 7381 10290 17671 17019 25270 42289 4006 2027 6032 - -<br />
February 6496 10000 16496 16839 21140 37979 4248 1967 6216 - -<br />
March 7435 10711 18146 19442 24917 44359 4190 2059 6249 - -<br />
(Source: ISL Bremen, based on data from Panama Canal Commission; Suez Canal Authority; Wasser-u. Schiffahrtsdirektion Nord, Kiel; St. Lawrence<br />
Seaway Authority)<br />
St. Lawrence<br />
Seaway<br />
SSMR June 2004 72
III - 2 Sea canals - Kiel Canal ISL<br />
2.2.2 <strong>Shipping</strong> transit traffic by type of vessels 2003<br />
Type<br />
Westbound Eastbound TOTAL Westbound Eastbound TOTAL<br />
Dry cargo incl. combined carriers 7861 8073 15934 19273 22453 41727<br />
Ro/Ro vessels 784 892 1676 7602 8511 16113<br />
Container ships 2442 2114 4556 11734 10243 21978<br />
Oil tankers 1059 915 1974 4961 4270 9231<br />
Gas tankers 22 29 51 122 167 289<br />
Chemical tankers 619 509 1128 2803 2211 5014<br />
Other tankers 268 377 645 514 669 1183<br />
TOTAL 2003 13055 12909 25964 47010 48525 95535<br />
2002 12262 12279 24541 42901 44422 87323<br />
2001 12136 12333 24469 40656 43158 83814<br />
2000 12268 12047 24315 39595 38897 78492<br />
1999 10614 10498 21112 31757 32530 64287<br />
1998 11594 11354 22948 34568 32984 67552<br />
1997 11568 11411 22979 35929 34991 70920<br />
1996 12585 12189 24774 28604 28787 57391<br />
1995 15597 14845 30442 29826 28894 58719<br />
1994 16201 15203 31404 32410 30059 62469<br />
1993 15934 15002 30936 30935 28458 59393<br />
1992 16197 14831 31028 32005 28009 60014<br />
1991 17081 15911 32992 34150 31236 65386<br />
1990 17906 16773 34679 36796 33265 70061<br />
1989 17315 16445 33760 36109 32934 69042<br />
Average growth 1989 - 2003 -2.0 -1.7 -1.9 1.9 2.8 2.3<br />
2.2.3 Transit goods traffic by commodity 1998-2003<br />
Number of ships Gross tonnage (in 1000 gt)<br />
Commodity Westbound Eastbound<br />
in 1000 metric tons<br />
1998 1999 2000 2001 2002 2003 1998 1999 2000 2001 2001 2003<br />
Mineral oil <strong>and</strong> derivates 2422 2294 4233 6205 5673 8297 917 924 915 763 763 610<br />
Coal 790 544 968 671 488 535 227 192 296 347 347 358<br />
Wood 3256 2946 3568 3441 3464 3312 157 170 176 170 170 205<br />
Wood pulp 998 972 1326 1146 1195 1276 30 49 65 81 81 123<br />
Grains 915 690 780 1295 1235 1175 122 182 394 230 230 130<br />
Fertilizers 1602 1304 2180 2020 1739 2130 397 416 394 431 431 383<br />
Fodder 281 285 204 245 317 280 1262 1119 1304 1693 1693 1953<br />
Iron <strong>and</strong> steel 2192 2181 3393 2995 3019 3633 853 689 854 852 852 925<br />
Chemical products 1945 2136 2533 2287 2771 3259 1625 1548 1865 1707 1707 1902<br />
Other bulk goods 1187 961 1062 1137 1093 1177 1976 2272 2828 3301 3301 3097<br />
General cargo 10689 10789 13024 13652 15407 17053 6682 6362 8028 10547 10547 13226<br />
TOTAL 26277 25101 33272 35094 36402 42127 14248 13923 17119 20123 20123 22914<br />
Source: Wasser- und Schiffahrtsdirketion Nord, Jahresübersicht über den Schiffs- und Güterverkehr auf dem Nord-Ostsee-Kanal; various issues<br />
SSMR June 2004 73
III - 2 Sea canals - Kiel Canal ISL<br />
2.2 Kiel Canal<br />
2.2.1 <strong>Shipping</strong> <strong>and</strong> transit goods traffic 1993-2003<br />
Transit traffic<br />
1993 1994 1995 1996 1997 1998 1999 2000 2001 2002 2003<br />
No of ships 30936 31404 30442 24774 24819 24606 22909 26264 26303 26219 27551<br />
1000 gt 59392.9 62469.0 58719.3 57390.8 74045.6 70756.0 67653.9 81907.2 87549.6 90994.8 99880.5<br />
gt-% change over prev. year -1.0 5.2 -6.0 -2.3 29.0 -4.4 -4.4 21.1 6.9 11.1 9.8<br />
Average ship size in gt 1920 1989 1929 2317 2983 2876 2953 3119 3329 3471 3625<br />
Cargo in 1000 tonnes 50667.2 50499.5 48332.5 41046.6 42439.9 41309.0 39026.7 50394.9 55219.2 57300.9 65044.3<br />
Sectional traffic<br />
No of ships 12328 12323 12845 12281 12126 12983 12573 12113 12103 12343 12246<br />
1000 gt 10906.1 9894.7 10811.6 11091.2 12533.0 13495.0 12554.8 13176.4 13201.1 12583.5 12077.7<br />
gt-% change over prev. year -7.0 -9.3 9.3 2.6 13.0 7.7 -7.0 5.0 0.2 -4.5 -4.0<br />
Average ship size in gt 885 803 842 903 1034 1039 999 1088 1091 1019 986<br />
Cargo in 1000 tonnes 7060.0 6660.6 6849.7 6869.0 6817.5 7346.0 6961.9 7466.7 7252.0 7291.4 7252.5<br />
TOTAL TRAFFIC<br />
No of ships 43264 43727 43287 37055 36945 37589 35482 38377 38406 38562 39797<br />
1000 gt 70298.9 72363.7 69530.9 68482.0 86578.6 84251.0 80208.7 95083.7 100750.6 103578.4 111958.2<br />
gt-% change over prev. year -2.0 2.9 -3.9 -1.5 26.4 -2.7 -4.8 18.5 6.0 8.9 8.1<br />
Average ship size in gt 1625 1655 1606 1848 2343 2241 2261 2478 2623 2686 2813<br />
Cargo in 1000 tonnes 57727.2 57160.1 55182.2 47915.7 49257.4 48655.0 45988.6 57861.6 62471.3 64592.3 72296.8<br />
Fig. III - 8: Kiel Canal - transit <strong>and</strong> sectional goods traffic 1983 - 2003<br />
74 SSMR June 2004<br />
ISL2004<br />
Continued
Definitions ISL<br />
1. Abbreviations <strong>and</strong> Symbols<br />
ARA Antwerp/Rotterdam/<br />
Amsterdam range<br />
AWES Association of West<br />
European Shipbuilders<br />
b/d Barrels per day<br />
BHP Brake horsepower<br />
cgrt Compensated gross<br />
registered tonnage<br />
cgt Compensated gross tonnage<br />
cif Cost, insurance, freight<br />
CIS Commonwealth of<br />
Independent States<br />
CMEA Council of Mutual Economic Aid<br />
CPE Centrally-planned Economies<br />
CPI Consumer price index<br />
cST Centi Stokes<br />
cu.m Cubic metres (also m3 )<br />
DB Double Bottom<br />
DH Double Hull<br />
DIS Danish International<br />
Ship Register<br />
DS Double Sides<br />
dwt Deadweight tons<br />
d/y Day/year<br />
EEC European Economic Community<br />
EFTA European Free Trade<br />
Association<br />
EU European Union<br />
FIM Finmark<br />
FY Fiscal year<br />
FAO Food <strong>and</strong> Agriculture<br />
Organization of the<br />
United Nations<br />
fio Free in <strong>and</strong> out<br />
fob Free on board<br />
FT Freight tons<br />
ft Foot<br />
GATT General Agreement on<br />
Tariffs <strong>and</strong> Trade<br />
grt Gross register tonnage<br />
gt Gross tonnage<br />
HP Horsepower<br />
ibf Intermediate bunker fuel<br />
IMF International Monetary Fund<br />
IMO International Maritime<br />
Organization<br />
in. Inch<br />
ITF International Transport<br />
Workers Federation<br />
km Kilometre<br />
loa Length overall<br />
lbs Pounds<br />
LDT Light displacement tons<br />
LR/Fairplay Lloyd's Register / Fairplay<br />
LNG Liquefied Natural Gas<br />
LPG Liquefied Petroleum Gas<br />
LT Long ton<br />
m Metre<br />
mbd Million barrel per day<br />
mdo Marine diesel oil<br />
MED Mediterranean<br />
MfA Marine fishing area<br />
mill Million<br />
M/S Motor ship<br />
M/T Motor tanker<br />
MT Metric tons<br />
mtd per ton fob delivered<br />
mth Month<br />
mtw Per ton ex wharf<br />
NCW Non-Communist World<br />
NDRF National Defence<br />
Reserve Fleet<br />
n.e.c. Not elsewhere classified<br />
neg. Negligible<br />
NICs Newly Industrialised<br />
Countries<br />
NIS Norwegian International<br />
Ship Register<br />
no Number<br />
NODC Non-oil Producing<br />
Developing Countries<br />
nrt Net register tonnage<br />
nt Net tonnage<br />
NT $ Taiwan Dollar<br />
NWE,NW Northwest Europe<br />
o.a. Over all<br />
OBO Ore/bulk/oil carrier<br />
OECD Organization for Economic<br />
Cooperation <strong>and</strong> Development<br />
O/O Ore/oil carrier<br />
OPEC Organization of Petroleum<br />
Exporting Countries<br />
OR Ordinary Register<br />
P/C Products carrier<br />
Pr/OBO Product/ore-bulk- oil carrier<br />
r Revised<br />
Ro/ro Roll-on/roll-off<br />
RT Revenue ton<br />
SAR Special Administration Region<br />
SBT Ship segregated ballast tanks<br />
SDR Special drawing rights<br />
SEK Swedish Krona<br />
ST Short ton<br />
t Ton/tonne<br />
TB Tug/barge<br />
TEU Twenty feet equivalent unit<br />
TKB Tanker barge<br />
T/S Tanker/steam<br />
T/T Tanker/turbine<br />
ULCC Ultra large crude carrier<br />
USAC United States Atlantic Coast<br />
USD US Dollar<br />
VLCC Very large crude carrier<br />
WS Worldscale<br />
WTO World Trade Organization<br />
YR, YRS Year, Years<br />
... Data not available;<br />
illogical<br />
- Nil<br />
0/0.0 Less than half of<br />
unit employed<br />
1995-2004 From 1995 to 2004<br />
inclusive<br />
2003/04 Crop year, fiscal year<br />
etc., beginning in 2003<br />
<strong>and</strong> terminating in 2004<br />
* Estimate<br />
Billions means a thous<strong>and</strong> million<br />
Detailed items in tables do not necessarily add to<br />
totals because of rounding<br />
SSMR June 2004 75
Definitions ISL<br />
2. World Merchant Fleet, New Construction Data, Trade <strong>and</strong> Traffic <strong>Statistics</strong><br />
2.1 Fleet <strong>and</strong> New Construction Data<br />
Includes all self-propelled sea-going trading ships <strong>and</strong> passenger ships of 300 gt <strong>and</strong> over, i.e. all ships intended for the carriage of goods <strong>and</strong>/or passengers. Naval units<br />
are excluded. Merchant fleet tables include laid-up tonnage <strong>and</strong> exclude US <strong>and</strong> Canadian Laker Fleet. Data are based on quarterly updates from Lloyd's<br />
Register/Fairplay (LR/Fairplay). Tables on merchant fleet exclude ships for which flag is unknown, as of January 1st , 2004 1217 ships with 5.5 mill dwt, 3.6 mill gt <strong>and</strong><br />
includes ships with status "continued existence in doubt".<br />
Country of registration <strong>and</strong> country of domicile<br />
Country of registration indicates the country of the port of registry of a country (flag). The country of domicile indicates where the controlling interest of the fleet is located<br />
in terms of the parent company. This information is applicable to merchant fleet vessels of 1000 gt <strong>and</strong> above.<br />
Denmark includes Faeroes, Greenl<strong>and</strong>.<br />
France includes New Caledonia, French Polynesia, Martinique, Guadeloupe,<br />
St. Pierre et Miquelon, Mayotte, Réunion, Wallis <strong>and</strong> Futuna Isl<strong>and</strong>s, French<br />
Austral <strong>and</strong> Antarctic Territories (Kerguelen), French Guyana.<br />
Netherl<strong>and</strong>s include Netherl<strong>and</strong>s Antilles, Aruba.<br />
New Zeal<strong>and</strong> includes Cook Isl<strong>and</strong>s.<br />
Portugal includes Madeira.<br />
Spain includes Canary Isl<strong>and</strong>s.<br />
UAE includes Abu Dhabi, Dubai, Sharjah, Ras El Khaimah, Ajman, Fujairah,<br />
Umn al Qauiwain.<br />
Yemen, Rep. of, includes former Yemen, PDR of, <strong>and</strong> Yemen Arab. Rep.<br />
UK includes Isle of Man, Channel Isl<strong>and</strong>s, Br. Virgin Isl<strong>and</strong>s, Montserrat, St.<br />
Helena, Turks <strong>and</strong> Caicos Isl<strong>and</strong>s, Anquilla <strong>and</strong> Falkl<strong>and</strong> Isl<strong>and</strong>.<br />
US includes Puerto Rico, Pacific Isl<strong>and</strong>s, Northern Mariana Isl<strong>and</strong>s.<br />
Analytical Groups of Countries<br />
OECD Countries as per January 1st, 2004<br />
Australia, Austria, Belgium, Canada, Czech Republic, Denmark, Finl<strong>and</strong>,<br />
France, FR of Germany, Greece, Hungary, Rep. of Korea, Icel<strong>and</strong>, Italy,<br />
Irel<strong>and</strong>, Japan, Luxembourg, Mexico, Netherl<strong>and</strong>s, New Zeal<strong>and</strong>, Norway,<br />
Pol<strong>and</strong>, Portugal, Slovakia, Spain, Sweden, Switzerl<strong>and</strong>, Turkey, UK <strong>and</strong> US.<br />
2.2 Laid-up Tonnage, Broken-up Tonnage<br />
76 SSMR June 2004<br />
EU Countries<br />
Austria, Belgium, Denmark, Finl<strong>and</strong>, France, Germany FR of, Greece,<br />
Irel<strong>and</strong>, Italy, Luxembourg, Netherl<strong>and</strong>s, Portugal, Spain, Sweden <strong>and</strong> UK.<br />
Developing Countries including NICs as per January 1st , 2004<br />
Developing Countries include all flags except OECD Countries; 10 Major Open<br />
Registry Countries; Countries in Transition (former USSR, Albania, Estonia,<br />
Georgia, Hungary, Latvia, Lithuania, Mongolia, Pol<strong>and</strong>, Romania, Slovenia, ex-<br />
Yugoslavia); <strong>and</strong> except Gibraltar, Israel, Monaco, Taiwan, Singapore <strong>and</strong><br />
Hong Kong.<br />
From January 2001 onwards the developing country classified as NIC is the PR<br />
of China.<br />
Development status based on United Nations: World Economic Outlook<br />
September 2003.<br />
Major Open Registries<br />
Countries permitting the registration of ships owned by non-residents. In<br />
general, ISL figures on open registry flags are restricted to the five major flags<br />
Liberia, Panama, Cyprus, Bahamas <strong>and</strong> Bermuda. Due to the extended ISL<br />
fleet data base the evaluation of additional open registry flags is possible. Thus,<br />
parts of the statistical analysis include besides the five "majors" further flags like<br />
Malta, St. Vincent, Marshall Isl<strong>and</strong>s, Vanuatu, Antigua & Barbuda <strong>and</strong> Cayman<br />
Isl<strong>and</strong>s (01.01.2000). ISL records (April issue) includes a seperate survey<br />
including the top 10 open registry countries.<br />
Laid-up tonnage: excludes US Reserve Fleet.<br />
Broken-up tonnage: includes ships sold for breaking. Figures on broken-up tonnage are not revised if vessels reported for breaking are trading again.<br />
2.3 Merchant Ship Type Structures<br />
Basic Ship Types (a)<br />
Definition of terms used in merchant ship structures type classification.<br />
Tanker Single-deck vessel constructed <strong>and</strong> arranged for the carriage of liquid cargoes in tanks integral to the hull <strong>and</strong> include crude<br />
oil or non-hazardous (IMO code) refined products.<br />
Chemical tanker Vessel constructed <strong>and</strong> arranged for carrying hazardous (IMO code) cargoes in special tanks.<br />
Liquid gas tanker Vessel constructed <strong>and</strong> arranged for the carriage of liquefied gases either in integral tanks or independent tanks under<br />
pressure or refrigerated.<br />
Dry Bulk Dry cargo vessel. One deck, machinery aft with topside tanks capable of carrying a variety of self-trimming cargoes.<br />
Ore Carrier (Bulk Carrier) Dry cargo vessel, one deck, strengthening for ore cargoes.<br />
Ore/Bulk/Oil Carrier (OBO) Combination bulk carrier arranged for the carriage of either bulk dry cargoes or liquid cargoes in the same cargo spaces but<br />
not simultaneously.<br />
General Cargo Single or multi-deck general dry cargo vessel with facilities for loading/ discharging cargo.<br />
Specialised Carrier (Special Ship) Dry cargo vessel specially designed for the carriage of particular cargoes, incl. car-carriers.<br />
Reefer Specialised dry cargo vessel with 80 % or more insulated cargo space.<br />
RoRo Cargo Vessel arranged for Roll-on Roll-off loading / discharging of vehicles (road <strong>and</strong>/<br />
RoRo Passenger or rail) as cargo <strong>and</strong> / or passenger conveyances.<br />
Container Ship (Full Container) Vessel fitted throughout with fixed or portable cell guides for the carriage of containers above <strong>and</strong> below the weather deck.<br />
Passenger Vessel which carries more than 12 fare paying passengers whether berthed or unberthed (ferries).<br />
(a) Based on „An International Classification of Ships by Type“ (ICST (1994))
Definitions ISL<br />
Basic Ship Type Structure <strong>and</strong> ISL Ship Type Aggregates<br />
MERCHANT SHIP STRUCTURES ISL SHIP TYPES<br />
Special Fleet Report Broken-up/ Laid-up tonnage etc.<br />
LIQUID Oil tankers - Crude oil tankers<br />
Oil tankers<br />
Tankers<br />
- Crude/products tankers<br />
"<br />
"<br />
- Products tankers<br />
"<br />
"<br />
- Oil/chemical tankers<br />
"<br />
"<br />
- Other tankers<br />
"<br />
"<br />
Chemical tankers - Chemical tankers<br />
- other chemical tankers<br />
Liquid gas tankers - LNG carriers<br />
- LPG carriers<br />
- other liquid gas carriers<br />
DRY BULK Bulk carriers - Ore carriers<br />
- other bulk carriers<br />
OBO carriers - Ore/bulk/oil carriers<br />
- Ore/oil carriers<br />
- Bulk/oil carriers<br />
OHTER DRY CARGO General cargo ships of which<br />
- Single-deck ships<br />
- Multi-deck ships<br />
- Special ships<br />
- Reefer ships<br />
- RoRo cargo ships<br />
Chemical tankers<br />
"<br />
Liquid gas tankers<br />
"<br />
"<br />
Bulk carriers<br />
"<br />
OBO carriers<br />
"<br />
"<br />
Tankers<br />
"<br />
Tankers<br />
"<br />
"<br />
Bulk carriers<br />
"<br />
Bulk carriers<br />
"<br />
"<br />
General cargo ships, of which<br />
General cargo ships, of which<br />
Single-deck ships<br />
Single-deck ships<br />
Multi-deck ships<br />
Multi-deck ships<br />
Special ships<br />
(a)<br />
Reefer ships<br />
(a)<br />
RoRo cargo ships<br />
(a)<br />
Container ships - Full container ships Container ships Container ships<br />
Passenger <strong>and</strong> cargo<br />
passenger ships (b)<br />
of which<br />
- Passenger ships<br />
- Cargo/RoRo passenger ships<br />
Passenger <strong>and</strong> cargo passenger ships,<br />
of which<br />
Passenger ships<br />
Cargo/RoRo passenger ships<br />
Passenger ships<br />
(a) Included in general cargo ships. (b) Including ships (berthed <strong>and</strong> unberthed) for passenger transport <strong>and</strong> passenger carrying vessels like general cargo passenger ships <strong>and</strong> ferries.<br />
Tonnage Specification<br />
In case of double measurement statistics refer to the higher of two sets of tonnages in a twin-tonnage ship.<br />
Gross tonnage:<br />
(grt/gt)<br />
Net tonnage:<br />
(nrt/nt)<br />
Deadweight tonnage:<br />
(dwt)<br />
Compensated gross<br />
tonnage (cgt):<br />
grt indicates that the ship has been measured in accordance with tonnage regulations adopted prior to the coming into force of the<br />
International Convention on Tonnage Measurement of Ships 1969 on 18th July 1982. This Gross Tonnage is broadly, the capacity in cubic<br />
feet of the spaces within the hull, <strong>and</strong> of the enclosed spaces above the deck available for cargo, stores, fuel, passengers <strong>and</strong> crew, with<br />
certain exceptions, divided by 100. Thus, 100 cubic feet of capacity is equivalent to 1 gross ton.<br />
gt indicates that the ship has been measured in accordance with the requirements of the International Convention on Tonnage Measurement<br />
of Ships 1969 <strong>and</strong> is derived by formula in accordance with those requirements.<br />
nrt is derived from the corresponding Gross Tonnage by deducting spaces used for the accomodation of the master, officers, crew, navigation<br />
<strong>and</strong> propelling machinery.<br />
nt is derived by formula in accordance with the requirements of the International Convention on Tonnage Measurement of Ships 1969.<br />
Unit of measurement expressed in tonnes of the maximum permitted load of a ship (i.e. the weight of cargo, passengers, fuel, stores <strong>and</strong><br />
crew) when loaded down to its maximum summer load line.<br />
Calculated by multiplying the tonnage of a ship by a coefficient, which is determined according to type <strong>and</strong> size of a particular ship. Cgt is<br />
used as an indicator of volume of work that is necessary to build a given ship.<br />
2.4 Trade <strong>and</strong> Traffic <strong>Statistics</strong><br />
The definition used <strong>and</strong> the coverage of statistics presented vary considerably. In general, figures indicate metric units in all tables in which data are measured in<br />
weight, length or area.<br />
Cargo tonnage There are two bases for charging the carriage of cargo: weight <strong>and</strong> capacity (measurement). If 1 ton (20 cwt) of a cargo occupies more than 40<br />
cubic feet than capacity is usually the basis. Cargoes are selected to give the best combination of payable tons by weight or measurement.<br />
Containers are usually measured in terms of twenty-foot equivalent units (TEU), being total length of containers in feet divided by 20.<br />
Revenue ton (U.S.) A unit of cargo measurement found in all ports of the United States. It can not be defined in units either of weight or of space occupied by the<br />
cargo as it varies from port to port, from line to line, <strong>and</strong> from ship to ship, depending on the customs of the port <strong>and</strong> the nature of the cargo<br />
carried by the individual vessel. For any one port, however, <strong>and</strong> particularly for any one group of ships specializing in the same trade <strong>and</strong><br />
carrying approximately the same kind of commodities the revenue ton represents a tangible unit of cargo measurement <strong>and</strong> is frequently used<br />
as the only means of expressing the total cargo of the ships.<br />
All United States ships show on their manifests their total revenue tonnage, <strong>and</strong> very often they also indicate the total weight of the cargo in<br />
long tons.<br />
Freight ton A unit of volume or weight used for quoting freight rates, in which 40 cu.ft. or 2,240 lbs. are taken as the equivalent of one ton. Also called<br />
stevedore ton. The measurement or weight is generally at ship's option. For freight purposes the term ton may also be applied to a number of<br />
hundered weights to be the equivalent of one ton <strong>and</strong> varying according to the goods.<br />
Harbour ton 1000 kg or 1 cubic metre which ever yields the highest tonnage.<br />
SSMR June 2004 77<br />
"<br />
"
....the most comprehensive<br />
data base in port traffic for<br />
<strong>Market</strong> analyses<br />
Regional development trends<br />
Port profiles<br />
Benchmarking<br />
Traffic profiles of more than<br />
340 major world ports<br />
Cargo traffic<br />
… by loading categories<br />
… by commodities<br />
… by regions<br />
Container traffic<br />
… by regions<br />
<strong>Shipping</strong> traffic<br />
http:// www.isl.org<br />
Portbase@isl.org<br />
ISL Port Data Base ©
ISL Port Data Base<br />
4 Port profiles - Regional Trends - Benchmarking - <strong>Market</strong> Analyses<br />
Services<br />
The ISL is currently in the process of exp<strong>and</strong>ing its information services. In addition to our regular statistical publications, the <strong>Shipping</strong><br />
<strong>Statistics</strong> <strong>and</strong> <strong>Market</strong> <strong>Review</strong> <strong>and</strong> the <strong>Shipping</strong> <strong>Statistics</strong> Yearbook, we are increasingly providing individualised analytical data. To<br />
meet this end, we updated our hardware <strong>and</strong> software to enable us to quickly process your inquiries.<br />
With its large scope of information, the ISL Port Data Base is suited for extensive comparisons of major ports with regard to selected<br />
items as well as for a detailed analysis of a single port or a group of ports using tables <strong>and</strong> graphs as well as maps. However, not all<br />
figures are available for all ports, so contact us if you are interested in a specific extract.<br />
We can also do groundwork for market analyses, benchmarking <strong>and</strong> other related work.<br />
Data Structure<br />
The ISL Port Data Base includes data starting 1980 on a yearly basis on the following items:<br />
4<strong>Shipping</strong> traffic (no of ships, ship tonnage)<br />
4Cargo traffic (foreign, domestic <strong>and</strong> transit traffic)<br />
4Loading categories (general cargo, dry bulk <strong>and</strong> liquid bulk)<br />
4Major bulk goods (iron ore, coal, grain, crude oil <strong>and</strong> oil products)<br />
4Container traffic (TEU/no of full <strong>and</strong> empty containers, container tonnage)<br />
4Continental spreading of cargo traffic by loading categories for selected ports since 1996<br />
4Continental spreading of container traffic for selected ports since 1995<br />
Figures with the exception of shipping traffic are available by direction (loaded/discharged).<br />
Basis of calculation 2004<br />
Our basis of calculation for the total cost of a database extract is as follows:<br />
€ 50.- basic fee, plus € 0.50 per item,<br />
plus postage <strong>and</strong> packing <strong>and</strong> in case of inl<strong>and</strong> sale plus VAT (MWSt).<br />
The basic fee includes the setting up of a suited layout, the addition of the necessary explanatory remarks <strong>and</strong> footnotes as well as the<br />
transmission of the data by fax <strong>and</strong>/or by E-Mail. By subscribing to a specified analysis on a yearly basis, you will save the basic fee<br />
<strong>and</strong> get an additional 20 per cent off the other costs starting the second year.<br />
Our comprehensive st<strong>and</strong>ard port profiles including data on shipping, cargo <strong>and</strong> container traffic, loading categories <strong>and</strong> major bulk<br />
goods over a ten-year period (610 items altogether) as well as a number of graphs may be purchased at the price of € 160.- per port.<br />
When subscribing to these profiles, you will receive updates for each port at € 30.- per year as soon as the figures are available to us.<br />
Contact<br />
If you have any questions regarding our Port Data Base, or if you are interested in any of the above, please contact our specialists of<br />
the Port Data Base Team.<br />
<strong>Institut</strong>e of <strong>Shipping</strong> Economics <strong>and</strong> Logistics (ISL)<br />
Universitätsallee GW 1, Block A<br />
28359 Bremen<br />
Germany<br />
Fax:<br />
Phone:<br />
E-Mail:<br />
Internet:<br />
+49-421-22096-77<br />
+49-421-22096-32 (Mrs. Heideloff)<br />
+49-421-22096-33 (Mr. Stockmann)<br />
portbase@isl.org<br />
http://www.isl.org
ISL Port Data Base - Criteria<br />
as of January 1 st , 2003<br />
SHIPPING TRAFFIC by direction by region*<br />
Total shipping traffic<br />
No of ships (either arrivals, departures or arrivals plus departures) (total only)<br />
Ship tonnage (in gt, nt or dwt) (total only)<br />
of which ferry traffic<br />
No of ships (either arrivals, departures or arrivals plus departures) (total only)<br />
Ship tonnage (in gt, nt or dwt) (total only)<br />
PASSENGER TRAFFIC (no of passengers) by direction by region*<br />
Total passenger traffic<br />
of which ferry traffic<br />
CARGO TRAFFIC (in 1000 metric tonnes, revenue tonnes, freight tonnes or harbour tonnes) by direction by region*<br />
Total traffic<br />
of which<br />
X X<br />
Foreign traffic X<br />
Domestic traffic X<br />
Transit traffic<br />
of which<br />
(total only)<br />
Ferry traffic X<br />
COMMODITIES (in 1000 metric tonnes, revenue tonnes, freight tonnes or harbour tonnes) by direction by region*<br />
General cargo X X<br />
Dry bulk<br />
of which<br />
X X<br />
Iron ore X<br />
Coal X<br />
Grain X<br />
Others X<br />
Liquid bulk<br />
of which<br />
X X<br />
Crude oil X<br />
Oil products X<br />
Others X<br />
CONTAINER TRAFFIC by direction by region*<br />
Total no of containers<br />
of which<br />
(in TEU or no of units) X X<br />
Full containers (in TEU or no of units) X<br />
Total tonnage<br />
of which<br />
(in 1000 metric tonnes, revenue tonnes, freight tonnes or harbour tonnes) X X<br />
cargo weight (excl. tare weight) (in 1000 metric tonnes, revenue tonnes, freight tonnes or harbour tonnes) X<br />
Degree of containerization (in per cent of general cargo) (total only)<br />
* Africa, America, Asia, Europe, Oceania<br />
www.isl.org portbase@isl.org<br />
X<br />
X
<strong>Institut</strong>e of <strong>Shipping</strong> Economics <strong>and</strong> Logistics<br />
Legal form<br />
Founded in<br />
Capacity<br />
Directorate<br />
Board of Trustees<br />
Scientific Advisory Board<br />
Sponsoring Body<br />
Independent, private non-profit foundation<br />
1954<br />
55 permanent staff members working<br />
in interdisciplinary teams<br />
Prof. Dr. Hans-Dietrich Haasis<br />
Prof. Dr. Manfred Zachcial<br />
Dr. Frank Arendt<br />
Prof. Dr. Carsten Boll<br />
Decision-makers from trade, industry, science <strong>and</strong> politics<br />
Experts from trade, industry <strong>and</strong> science<br />
Companies <strong>and</strong> individual members from<br />
the maritime industry<br />
The <strong>Institut</strong>e for <strong>Shipping</strong> Economics <strong>and</strong> Logistics (ISL) is one of the leading maritime + logistical research <strong>and</strong> consulting<br />
institutes in Europe. In the four departments Logistics Systems, Maritime Economics <strong>and</strong> Transport, Informations Logistics<br />
<strong>and</strong> Planning <strong>and</strong> Simulation Systems, the staff members work together in interdisciplinary project teams, well equipped<br />
with modern infrastructure in practice-oriented research <strong>and</strong> development projects. In the following areas analyses <strong>and</strong><br />
consultancy are offered for companies of the maritime <strong>and</strong> transport industry as well as for Federal Ministries, German<br />
Länder, local authorities <strong>and</strong> the European Commission:<br />
Logistic Systems (Prof. Dr. Hans Dietrich Haasis):<br />
Strategic enterprise concepts; Supply Chain Management; cooperative net product systems; development <strong>and</strong><br />
moderation of macro logistical systems; operational <strong>and</strong> macro logistical system integration of intermodal<br />
transport; configuration of regional networks <strong>and</strong> freight villages.<br />
Maritime Economics <strong>and</strong> Transport (Prof. Dr. Manfred Zachcial):<br />
<strong>Market</strong> observation <strong>and</strong> market analyses for the maritime industry; scientific advice of politics <strong>and</strong> industry; traffic<br />
forecasts, modelling of l<strong>and</strong>/sea transport, transport planning; feasibility studies for ports <strong>and</strong> eCommerce<br />
developments, Economic Impact Studies.<br />
Information Logistics (Dr. Frank Arendt):<br />
Concepts <strong>and</strong> implementation of information <strong>and</strong> communication technologies in the transport industry; software<br />
applications for modal (truck, rail <strong>and</strong> vessel) <strong>and</strong> intermodal transport management covering order processing,<br />
resource management, accounting, <strong>and</strong> tracking <strong>and</strong> tracing; web-based applications, e.g. for intermodal<br />
tracking & tracing, <strong>and</strong> tariff enquiries; intra- <strong>and</strong> inter-company networking of information systems using EDI <strong>and</strong><br />
XML; eBusiness <strong>and</strong> eCommerce applications; set up <strong>and</strong> support of local networks <strong>and</strong> their secure connection to<br />
the internet.<br />
Planning <strong>and</strong> Simulation Systems (Prof. Dr. Carsten Boll):<br />
Development <strong>and</strong> application of simulation models for micro- <strong>and</strong> macro transport, turnover <strong>and</strong> logistic<br />
processes; national <strong>and</strong> international consultancy services for port planning <strong>and</strong> storage capacity projects,<br />
establishment of an R&D Centre for Software Development in Bremerhaven; simulation <strong>and</strong> optimisation of<br />
operational processes in the maritime industry.
http://www.isl.org