
You also want an ePaper? Increase the reach of your titles
YUMPU automatically turns print PDFs into web optimized ePapers that Google loves.
<strong>ISL</strong> <strong>Monthly</strong> <strong>Container</strong> <strong>Port</strong> <strong>Monitor</strong><br />
Executive Summary - Development of the world’s top container ports by<br />
region<br />
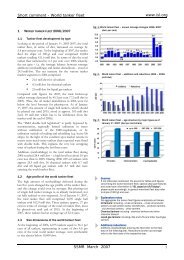
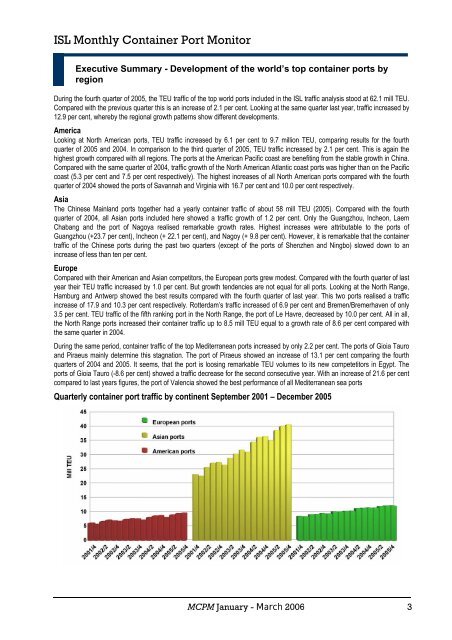
During the fourth quarter of 2005, the TEU traffic of the top world ports included in the <strong>ISL</strong> traffic analysis stood at 62.1 mill TEU.<br />
Compared with the previous quarter this is an increase of 2.1 per cent. Looking at the same quarter last year, traffic increased by<br />
12.9 per cent, whereby the regional growth patterns show different developments.<br />
America<br />
Looking at North American ports, TEU traffic increased by 6.1 per cent to 9.7 million TEU, comparing results for the fourth<br />
quarter of 2005 and 2004. In comparison to the third quarter of 2005, TEU traffic increased by 2.1 per cent. This is again the<br />
highest growth compared with all regions. The ports at the American Pacific coast are benefiting from the stable growth in China.<br />
Compared with the same quarter of 2004, traffic growth of the North American Atlantic coast ports was higher than on the Pacific<br />
coast (5.3 per cent and 7.5 per cent respectively). The highest increases of all North American ports compared with the fourth<br />
quarter of 2004 showed the ports of Savannah and Virginia with 16.7 per cent and 10.0 per cent respectively.<br />
Asia<br />
The Chinese Mainland ports together had a yearly container traffic of about 58 mill TEU (2005). Compared with the fourth<br />
quarter of 2004, all Asian ports included here showed a traffic growth of 1.2 per cent. Only the Guangzhou, Incheon, Laem<br />
Chabang and the port of Nagoya realised remarkable growth rates. Highest increases were attributable to the ports of<br />
Guangzhou (+23.7 per cent), Incheon (+ 22.1 per cent), and Nagoy (+ 9.8 per cent). However, it is remarkable that the container<br />
traffic of the Chinese ports during the past two quarters (except of the ports of Shenzhen and Ningbo) slowed down to an<br />
increase of less than ten per cent.<br />
Europe<br />
Compared with their American and Asian competitors, the European ports grew modest. Compared with the fourth quarter of last<br />
year their TEU traffic increased by 1.0 per cent. But growth tendencies are not equal for all ports. Looking at the North Range,<br />
Hamburg and Antwerp showed the best results compared with the fourth quarter of last year. This two ports realised a traffic<br />
increase of 17.9 and 10.3 per cent respectively. Rotterdam’s traffic increased of 6.9 per cent and Bremen/Bremerhaven of only<br />
3.5 per cent. TEU traffic of the fifth ranking port in the North Range, the port of Le Havre, decreased by 10.0 per cent. All in all,<br />
the North Range ports increased their container traffic up to 8.5 mill TEU equal to a growth rate of 8.6 per cent compared with<br />
the same quarter in 2004.<br />
During the same period, container traffic of the top Mediterranean ports increased by only 2.2 per cent. The ports of Gioia Tauro<br />
and Piraeus mainly determine this stagnation. The port of Piraeus showed an increase of 13.1 per cent comparing the fourth<br />
quarters of 2004 and 2005. It seems, that the port is loosing remarkable TEU volumes to its new competetitors in Egypt. The<br />
ports of Gioia Tauro (-8.6 per cent) showed a traffic decrease for the second consecutive year. With an increase of 21.6 per cent<br />
compared to last years figures, the port of Valencia showed the best performance of all Mediterranean sea ports<br />
Quarterly container port traffic by continent September 2001 – December 2005<br />
MCPM January - March 2006 3
<strong>ISL</strong> <strong>Monthly</strong> <strong>Container</strong> <strong>Port</strong> <strong>Monitor</strong><br />
Executive summary - Quarterly traffic results of the ports analysed in the<br />
"<strong>Monthly</strong> <strong>Container</strong> <strong>Port</strong> <strong>Monitor</strong>" up to December 2005<br />
ranking: ranking:<br />
change of TEU<br />
4q-2005<br />
% change of TEU over the same<br />
TEU TEU<br />
over last quarter<br />
quarter of previous year<br />
in 4q-2005 in 3q-2005 <strong>Port</strong> Country in 1000 in % 1q-`05 2q-`05 3q-`05 4q-`05<br />
10 10<br />
American ports<br />
Los Angeles US 6.5 0.3 -2.4 -0.4 3.5 7.9<br />
11 11 Long Beach US -41.6 -2.3 29.2 19.7 16.4 3.9<br />
19 20 New York/ New Jersey US 9.6 1.1 8.7 -2.4 5.2 6.5<br />
27 25 Santos Brazil -29.8 -4.9 26.6 17.6 20.1 18.9<br />
26 27 Oakland US -6.2 -1.0 20.0 14.5 9.5 3.4<br />
30 30 Tacoma US -25.1 -4.4 13.6 14.8 22.2 9.6<br />
31 31 Seattle US -29.3 -5.3 39.8 17.4 18.7 -2.4<br />
36 33 Charleston US -62.8 -11.7 11.7 13.4 10.6 -3.1<br />
32 35 <strong>Port</strong> of Virginia US 19.6 3.9 10.8 10.5 7.1 10.0<br />
34 36 Savannah US 7.4 1.5 11.5 11.6 16.1 16.7<br />
37 37 Vancouver Canada -2.1 -0.5 -4.6 19.6 2.8 6.6<br />
47 45 Montreal Canada -18.5 -5.6 12.2 1.1 0.0 -2.6<br />
50 50 Montevideo Uruguay -4.3 -4.2 16.0 24.2 -1.6 -4.8<br />
51 51 Sao Francisco Brazil 5.1 7.4 9.0 -11.6 -19.6 2.8<br />
Total<br />
Asian/Oceanian ports<br />
-172 -1.8 12.7 9.8 10.0 6.1<br />
2 1 Singapore Singapore -121 -2.0 14.2 9.3 6.4 5.8<br />
1 2 Hong Kong China -48 -0.8 3.4 -3.4 -0.3 5.4<br />
3 3 Shanghai China 25 0.5 29.1 26.6 21.0 21.4<br />
4 4 Shenzhen China -161 -3.7 26.8 20.4 16.2 11.2<br />
5 5 Busan South Korea 83 2.9 7.1 3.6 4.9 -1.2<br />
7 6 Kaohsiung Taiwan -30 -1.3 0.1 -1.7 -4.3 -4.0<br />
9 9 Dubai UAE -6 -0.3 26.5 18.6 18.6 12.2<br />
13 13 Qingdao China 2 0.1 28.8 20.4 22.9 19.6<br />
14 14 Ningbo China 2 0.1 25.9 29.4 33.2 28.8<br />
16 15 Tianjin China -3 -0.2 22.5 26.1 28.6 25.9<br />
15 16 Guangzhou China 274 23.7 38.6 51.1 38.4 42.7<br />
17 17 Laem Chabang Thailand 63 6.7 7.3 8.3 1.1 7.2<br />
20 19 Xiamen China -27 -3.0 16.5 14.6 16.3 18.9<br />
23 23 Yokohama Japan -15 -2.0 4.0 -0.3 12.3 7.2<br />
24 24 Nagoya Japan 61 9.8 5.5 21.0 7.5 9.5<br />
28 26 Kobe Japan -38 -6.2 -1.4 6.5 2.5 -5.6<br />
29 34 Keelung Taiwan 46 9.0 -1.7 -1.4 0.5 6.6<br />
39 40 Gwangyang South Korea -1 -0.2 -15.6 -9.4 31.5 29.6<br />
40 42 Sydney Australia 17 4.8 8.9 1.8 5.0 4.4<br />
42 44 Bangkok Thailand 8 2.2 1.4 -1.4 1.0 3.1<br />
45 46 Nhava Sheva India 0 0.0 5.9 6.1 6.4 10.9<br />
46 47 Taichung Taiwan 16 5.4 -2.8 0.6 -4.2 1.1<br />
44 48 Incheon South Korea 61 22.1 22.3 23.5 21.2 29.3<br />
Total 208 0.5 13.8 11.0 10.6 10.4<br />
6 7<br />
European ports<br />
Rotterdam Netherlands 16 0.7 19.6 13.0 10.6 6.9<br />
8 8 Hamburg Germany 83 4.0 12.9 12.0 16.1 17.9<br />
12 12 Antwerpen Belgium -13 -0.8 3.0 3.5 9.7 10.3<br />
18 18 Bremen/ Bremerhaven Germany 53 5.7 14.5 10.7 3.4 3.5<br />
22 21 Gioia Tauro Italy -51 -6.3 7.4 -6.2 -7.6 -8.6<br />
21 22 Algeciras-La Linea Spain -12 -1.5 13.2 8.1 4.4 0.3<br />
25 28 Valencia Spain 54 9.1 13.5 20.2 10.4 21.7<br />
35 29 Le Havre * France -69 -12.1 12.4 4.3 -0.8 -10.1<br />
33 32 Barcelona Spain -31 -5.7 12.3 10.4 10.9 6.8<br />
49 38 Dublin Ireland 14 3.0 4.5 7.3 5.2 5.2<br />
38 39 Genoa Italy 37 9.2 -1.0 -6.4 -7.4 16.1<br />
43 41 Piraeus Greece -43 -11.3 -6.4 -29.3 0.3 -13.1<br />
41 43 Zeebrugge Belgium 6 1.6 20.1 24.1 15.5 11.9<br />
48 49 Marseilles France -26 -10.9 -1.1 2.5 1.5 -3.9<br />
Total 16 0.1 10.6 6.8 7.1 1.0<br />
Total of all <strong>Port</strong>s listed in the MCPM (a) 53 0.1 12.9 10.0 9.8 7.8<br />
© <strong>ISL</strong> <strong>Port</strong> Data Base 2005 * figures for 4. Quarter are estimated<br />
MCPM January - March 2006 4