Aktsiaselts Tallink Grupp - NASDAQ OMX Baltic
Aktsiaselts Tallink Grupp - NASDAQ OMX Baltic
Aktsiaselts Tallink Grupp - NASDAQ OMX Baltic

You also want an ePaper? Increase the reach of your titles
YUMPU automatically turns print PDFs into web optimized ePapers that Google loves.
OFFERING MEMORANDUM<br />
<strong>Aktsiaselts</strong> <strong>Tallink</strong> <strong>Grupp</strong><br />
34,090,909 Ordinary Shares<br />
Offer Price Range EEK 73.50 (EUR 4.70) to<br />
EEK 92.00 (EUR 5.88) per Offer Share<br />
This is the initial offering of our shares. We are offering 26,500,000 newly issued shares and certain selling<br />
shareholders named in this offering memorandum are offering up to 7,590,909 existing shares. We will not<br />
receive any proceeds from the sale of the shares by the selling shareholders. This offering includes a public<br />
offering to retail investors in Estonia and Finland and an international offering to institutional investors in and<br />
outside of Estonia and Finland. This offering memorandum, including a summary translated into Estonian and<br />
Finnish, relates only to the Estonian and Finnish public offerings, respectively. The international offering is being<br />
made pursuant to a separate offering memorandum in the English language. Certain selling shareholders have<br />
granted the managers of the offering an option to purchase up to an aggregate of 3,409,091 additional shares at<br />
the offer price. The option is exercisable for 30 days from the commencement of trading in our shares on the<br />
Tallinn Stock Exchange solely to cover over-allotments, if any.<br />
The total number of shares offered and the offer price range may be changed.<br />
There is currently no public market for our shares. We have applied to have our shares listed on the main list<br />
of the Tallinn Stock Exchange. This offering memorandum has been prepared for purposes of the offering and<br />
the listing of our shares on the Tallinn Stock Exchange.<br />
Investing in the offer shares involves risks. See “Risk Factors” beginning on page 7.<br />
The shares have not been registered under the U.S. Securities Act of 1933, as amended. In the United States,<br />
the offering is being made only to qualified institutional buyers in accordance with Rule 144A under the<br />
Securities Act. Outside the United States, the offering is being made in accordance with Regulation S under the<br />
Securities Act. Prospective purchasers that are qualified institutional buyers are hereby notified that the issuer<br />
and the sellers of the shares may be relying on the exemption from the provisions of Section 5 of the Securities<br />
Act provided by Rule 144A. For a description of the selling restrictions and of certain restrictions on transfers of<br />
the shares, see “Plan of Distribution” and “Transfer Restrictions.”<br />
It is expected that the shares issued and sold in the offering will be ready for delivery through the facilities<br />
of the Estonian Central Securities Depository, Euroclear Bank S.A./N.V., as operator of the Euroclear System, or<br />
Clearstream Banking société anonyme, on or about December 8, 2005, against payment therefor in immediately<br />
available funds. Public trading in the shares is expected to commence on or about December 9, 2005.<br />
Global Co-ordinator and Sole Bookrunner<br />
Citigroup<br />
Co-lead Managers<br />
Nordea Suprema Securities SEB Eesti Ühispank<br />
November 18, 2005
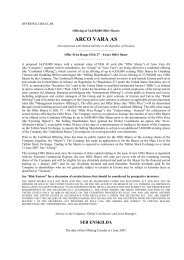
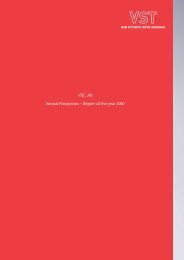
F I N L A N D<br />
N<br />
W O<br />
HELSINKI<br />
S<br />
Mariehamn<br />
Kapellskär<br />
S W E D E N<br />
TALLINN<br />
Paldiski<br />
STOCKHOLM<br />
E S T O N I A
TABLE OF CONTENTS<br />
Summary .............................................................................. 1<br />
Risk Factors ........................................................................... 7<br />
RisksRelatingtoOurBusiness .......................................................... 7<br />
Risks Relating to Our Industry ........................................................... 10<br />
Risks Relating to Doing Business in Estonia and in the <strong>Baltic</strong> Region ............................ 12<br />
RisksRelatingtotheOffering ........................................................... 13<br />
Terms and Conditions of the Retail Offering .................................................. 15<br />
InstructionstoInvestorsinEstonia ......................................................... 20<br />
InstructionstoInvestorsinFinland ......................................................... 22<br />
Use of Proceeds ........................................................................ 24<br />
Capitalization .......................................................................... 24<br />
Background and Reasons for the Offering .................................................... 25<br />
Dividends and Dividend Policy ............................................................ 26<br />
Exchange Rates ......................................................................... 27<br />
Selected Financial Information ............................................................. 28<br />
Operating and Financial Review and Prospects ................................................ 30<br />
Overview ............................................................................ 30<br />
Recent Developments and Outlook ....................................................... 31<br />
Factors Affecting Results of Operations ................................................... 32<br />
Results of Operations .................................................................. 33<br />
Financial Year Ended August 31, 2005 Compared to Financial Year Ended August 31, 2004 .......... 34<br />
Financial Year Ended August 31, 2004 Compared to Financial Year Ended August 31, 2003 .......... 36<br />
LiquidityandCapitalResources.......................................................... 37<br />
Off-Balance Sheet Guarantees ........................................................... 41<br />
Critical Accounting Policies ............................................................. 41<br />
ContractualObligations ................................................................ 42<br />
MarketRiskDisclosure ................................................................ 43<br />
Industry Overview ...................................................................... 44<br />
European Mini-Cruise and Transport Ferry Markets .......................................... 44<br />
Our Geographical Market Area .......................................................... 45<br />
Business .............................................................................. 48<br />
Overview ............................................................................ 48<br />
Key Strengths ........................................................................ 48<br />
Strategy............................................................................. 49<br />
History ............................................................................. 50<br />
Operational Segments .................................................................. 51<br />
Routes Operated ...................................................................... 51<br />
Products ............................................................................ 53<br />
SalesandMarketing ................................................................... 56<br />
Fleet ............................................................................... 58<br />
Competition ......................................................................... 60<br />
Regulation ........................................................................... 62<br />
Trademarks .......................................................................... 63<br />
MaterialContracts .................................................................... 64<br />
Insurance ............................................................................ 64<br />
Employees and Labor Relations .......................................................... 65<br />
Legal Proceedings ..................................................................... 65<br />
Real Estate and Premises ............................................................... 66<br />
Organization ......................................................................... 66<br />
RelatedPartyTransactions .............................................................. 68<br />
Management ........................................................................... 69<br />
Structure of Our Management ........................................................... 69<br />
Managements Holdings ................................................................ 72<br />
Management Remuneration and Benefits ................................................... 73<br />
Principal and Selling Shareholders .......................................................... 74<br />
Owner Structure ...................................................................... 74<br />
Infortar ............................................................................. 74<br />
i<br />
Page
Selling Shareholders ................................................................... 75<br />
Dilution............................................................................. 75<br />
Shareholders’ Agreements .............................................................. 75<br />
Description of Share Capital ............................................................... 76<br />
General Information ................................................................... 76<br />
Share Capital Information .............................................................. 76<br />
Shareholder Rights .................................................................... 77<br />
Estonian Securities Market ................................................................ 80<br />
Estonian Company Law Issues ........................................................... 80<br />
The Tallinn Stock Exchange and the Estonian Securities Market ................................ 81<br />
Enforcement of Civil Liabilities in Estonia ................................................. 84<br />
Taxation .............................................................................. 86<br />
EstonianTaxConsiderations ............................................................ 86<br />
FinnishTaxConsiderations ............................................................. 87<br />
Plan of Distribution ..................................................................... 89<br />
Notice to Prospective Investors in the European Economic Area ................................ 90<br />
Notice to Prospective Investors in the United Kingdom ....................................... 91<br />
Notice to Prospective Investors in France .................................................. 91<br />
Transfer Restrictions ..................................................................... 92<br />
Legal Matters .......................................................................... 94<br />
Independent Auditors .................................................................... 95<br />
Index to Financial Statements .............................................................. F-1<br />
ii<br />
Page
CERTAIN INFORMATION WITH RESPECT TO THE OFFERING<br />
We have furnished the information in this offering memorandum and accept responsibility for the<br />
completeness and accuracy of the information contained herein. To the best of the knowledge and belief of the<br />
members of the management board of <strong>Aktsiaselts</strong> <strong>Tallink</strong> <strong>Grupp</strong>, having taken all reasonable care to ensure that<br />
such is the case, the information contained in this offering memorandum is in accordance with the facts and<br />
contains no omission likely to affect its import. The Selling Shareholders (as defined herein) have furnished the<br />
information contained herein as regards their respective shareholdings in <strong>Tallink</strong>. To the best of their knowledge<br />
and belief, having taken all reasonable care to ensure that such is the case, the information as regards their<br />
respective shareholdings in <strong>Tallink</strong> contained in this offering memorandum is in accordance with the facts and<br />
contains no omission likely to affect its import.<br />
In Tallinn on November 18, 2005<br />
Management Board of <strong>Aktsiaselts</strong> <strong>Tallink</strong> <strong>Grupp</strong> The Selling Shareholders<br />
Enn Pant <strong>Aktsiaselts</strong> Infortar<br />
Keijo Mehtonen Eve Pant<br />
Kalev Järvelill Citibank Hong Kong / Citicorp International<br />
Finance Corporation<br />
Andres Hunt Alfred Rodrigues<br />
Attorney in Fact<br />
Amber Trust S.C.A.<br />
Kustaa Lauri Äimä<br />
DCF Fund (II) <strong>Baltic</strong> States<br />
Kustaa Lauri Äimä<br />
In this offering memorandum, “<strong>Tallink</strong>” refers to <strong>Aktsiaselts</strong> <strong>Tallink</strong> <strong>Grupp</strong> and “we,” “our,” “ours” and<br />
“us” or similar terms refer to either <strong>Tallink</strong> or <strong>Tallink</strong> together with its subsidiaries, as the context may require.<br />
You acknowledge and agree that the Managers (as defined herein) make no representation or warranty,<br />
express or implied, as to the accuracy or completeness of the information contained in this offering<br />
memorandum, and nothing contained in this offering memorandum is, or shall be relied upon as, a promise or<br />
representation by the Managers. You may not reproduce or distribute this offering memorandum, in whole or in<br />
part, and you may not disclose any of the contents of this offering memorandum or use any information<br />
contained herein for any purpose other than considering an investment in our shares. You agree to the foregoing<br />
by accepting delivery of this offering memorandum. We will update any information presented in this offering<br />
memorandum in accordance with the applicable provisions of the Estonian Securities Market Act.<br />
No person is authorized to give information or to make any representation in connection with the Offering<br />
or sale of our shares other than as contained in this offering memorandum. If any such information is given or<br />
made, it must not be relied upon as having been authorized by us or any of the Managers or any of their affiliates<br />
or advisers or selling agents. Neither the delivery of this offering memorandum nor any issue or sale made<br />
hereunder shall under any circumstances imply that there has been no change in our affairs or that the<br />
information set forth in this offering memorandum is correct as of any date subsequent to the date of this offering<br />
memorandum.<br />
In connection with the Offering, Citigroup Global Markets Limited may, on behalf of the Managers, overallot<br />
or effect transactions with a view to supporting the market price of the ordinary shares at levels above those<br />
that might otherwise prevail. Such transactions may be effected on the Tallinn Stock Exchange and shall be<br />
carried out in accordance with applicable rules and regulations. However, Citigroup is under no obligation to do<br />
so. Such stabilizing, if commenced, may be discontinued at any time and, in any event, will be discontinued 30<br />
days after the commencement of trading in our shares on the Tallinn Stock Exchange. Any trades made on the<br />
Tallinn Stock Exchange as part of the stabilizing will be effected by AS Suprema Securities upon instructions by<br />
Citigroup. See “Plan of Distribution.”<br />
iii
In making an investment decision, you must rely upon your own examination of us and the terms of<br />
this offering memorandum, including the risks involved.<br />
The distribution of this offering memorandum and the offering and sale of our shares in certain<br />
jurisdictions may be restricted by law. We and the Managers require persons into whose possession this<br />
offering memorandum comes to inform themselves about and to observe any such restrictions. For a<br />
description of certain restrictions on the offering and sale of our shares, see “Transfer Restrictions” and<br />
“Plan of Distribution.” This offering memorandum does not constitute an offer of, or an invitation to<br />
purchase, any of our shares in any jurisdiction in which such offer or sale would be unlawful. No one has<br />
taken any action that would permit a public offering to occur in any jurisdiction other than Estonia and<br />
Finland.<br />
NOTICE TO NEW HAMPSHIRE RESIDENTS ONLY<br />
NEITHER THE FACT THAT A REGISTRATION STATEMENT OR AN APPLICATION FOR A<br />
LICENSE HAS BEEN FILED UNDER CHAPTER 421-B OF THE NEW HAMPSHIRE REVISED<br />
STATUTES (“RSA”) WITH THE STATE OF NEW HAMPSHIRE NOR THE FACT THAT A<br />
SECURITY IS EFFECTIVELY REGISTERED OR A PERSON IS LICENSED IN THE STATE OF NEW<br />
HAMPSHIRE IMPLIES THAT ANY DOCUMENT FILED UNDER RSA 421-B IS TRUE, COMPLETE<br />
AND NOT MISLEADING. NEITHER ANY SUCH FACT NOR THE FACT THAT ANY EXEMPTION<br />
OR EXCEPTION IS AVAILABLE FOR A SECURITY OR A TRANSACTION MEANS THAT THE<br />
SECRETARY OF STATE HAS PASSED IN ANY WAY UPON THE MERITS OR QUALIFICATIONS<br />
OF, OR RECOMMENDED OR GIVEN APPROVAL TO, ANY PERSON, SECURITY OR<br />
TRANSACTION. IT IS UNLAWFUL TO MAKE, OR CAUSE TO BE MADE, TO ANY PROSPECTIVE<br />
PURCHASER, CUSTOMER OR CLIENT ANY REPRESENTATION INCONSISTENT WITH THE<br />
PROVISIONS OF THIS PARAGRAPH.<br />
NOTICE TO PROSPECTIVE INVESTORS IN THE UNITED KINGDOM<br />
Each Manager has represented and agreed that it has only communicated or caused to be communicated and<br />
will only communicate or cause to be communicated an invitation or inducement to engage in investment activity<br />
(within the meaning of Section 21 of the Financial Services and Markets Act 2000) in connection with the issue<br />
or sale of the shares in circumstances in which Section 21(1) of such Act does not apply to us and it has complied<br />
and will comply with all applicable provisions of such Act with respect to anything done by it in relation to any<br />
shares in, from or otherwise involving the United Kingdom.<br />
NOTICE TO PROSPECTIVE INVESTORS IN THE NETHERLANDS<br />
In The Netherlands, the ordinary shares described in this offering memorandum may not, are not and will<br />
not be offered, distributed, sold, transferred or delivered, directly or indirectly, to any person other than to<br />
individuals or legal entities who or which trade in securities in the conduct of their profession or trade within the<br />
meaning of Section 2 of the exemption regulation pursuant to The Netherlands Securities Market Supervision Act<br />
1995 (Vrijstellingsregeling Wet toezicht effectenverkeer 1995), which includes banks, securities intermediaries<br />
(including dealers and brokers), insurance companies, pension funds, other institutional investors and<br />
commercial enterprises that, as an ancillary activity, regularly invest in securities.<br />
PRESENTATION OF FINANCIAL AND OTHER INFORMATION<br />
Our consolidated financial statements since the financial year ended August 31, 2002, have been prepared in<br />
accordance with international financial reporting standards (“IFRS”). This offering memorandum contains the<br />
statutory audited consolidated financial statements of <strong>Tallink</strong> Group for the financial year ended August 31,<br />
2004, with comparative information for the financial year ended August 31, 2003, and for the financial year<br />
ended August 31, 2005, with comparative information for the financial year ended August 31, 2004, as well as<br />
the statutory audited unconsolidated financial statements of <strong>Tallink</strong> for the financial year ended August 31, 2004,<br />
with comparative information for the financial year ended August 31, 2003, and for the financial year ended<br />
iv
August 31, 2005, with comparative information for the financial year ended August 31, 2004.<br />
In this offering memorandum, references to “Estonian kroon” and “EEK” are to the currency of the<br />
Republic of Estonia (EEK 15.6466 = EUR 1), references to “euro” and “EUR” are to the currency of the member<br />
states of the European Union (“EU”) participating in the European Economic and Monetary Union, references to<br />
the “U.S. dollar” and “USD” are to the currency of the United States of America, and references to the “Swedish<br />
krona,” “Swedish kronor” and “SEK” are to the currency of the Kingdom of Sweden.<br />
Any estimates with respect to market statistics relating to us are based upon the reasonable estimates of<br />
<strong>Tallink</strong>’s management. Where certain information contained in this offering memorandum has been derived from<br />
third party sources, such sources have been identified herein. <strong>Tallink</strong> does not assume any responsibility for the<br />
accuracy or completeness of this third party information, except for its accurate reproduction and correct<br />
restatement herein such that no facts have been omitted which would render the information inaccurate or<br />
misleading.<br />
The financial information and certain other information set forth in a number of tables in this offering<br />
memorandum may have been rounded to the nearest whole number or the nearest decimal. Accordingly, in<br />
certain instances, the sum of the numbers in a column may not conform exactly to the total figure given for that<br />
column. In addition, certain percentages, including period-to-period percentage changes, reflect calculations<br />
based upon the underlying information prior to rounding, and accordingly may not conform exactly to the<br />
percentages that would be derived if the relevant calculations were based upon the rounded numbers.<br />
AVAILABLE INFORMATION<br />
We intend to publish our annual reports commencing from the financial year ended August 31, 2005,<br />
including our consolidated financial statements, and interim reports, including our interim consolidated financial<br />
statements, commencing from the quarter ending November 30, 2005. In accordance with Estonian law,<br />
including the Estonian Securities Market Act, and the Tallinn Stock Exchange Rules, our annual reports for the<br />
financial years ended August 31, 2002, 2003 and 2004, and our articles of association are available at our head<br />
office located at Tartu mnt 13, Tallinn, Estonia, and on our website (www.tallink.com). Any interested party may<br />
obtain a copy of these items from us without charge. References to our website in this offering memorandum<br />
should not be deemed to incorporate the information on our website by reference.<br />
We are not required to file periodic reports under Section 13 or 15(d) of the U.S. Securities Exchange Act of<br />
1934, as amended (the “Exchange Act”). We have, however, agreed to either (i) furnish certain public reports and<br />
documents to the SEC pursuant to Rule 12g3-2(b) under the Exchange Act, (ii) be subject to the periodic<br />
reporting and other requirements under the Exchange Act and, in accordance with the Exchange Act, file reports<br />
and other information with the SEC or (iii) furnish to investors upon request such information as may be required<br />
by Rule 144A(d)(4) of the Securities Act to facilitate resales of the shares pursuant to Rule 144A.<br />
FORWARD-LOOKING STATEMENTS<br />
Certain statements in this offering memorandum, including but not limited to certain statements set forth<br />
under the captions “Summary,” “Risk Factors,” “Dividends and Dividend Policy,” “Operating and Financial<br />
Review and Prospects,” “Industry Overview” and “Business” are based on the beliefs of management as well as<br />
assumptions made by and information currently available to management, and such statements may constitute<br />
forward-looking statements. The words “believe,” “expect,” “anticipate,” “intend” or “plan” and similar<br />
expressions identify certain of such forward-looking statements.<br />
Such forward-looking statements involve known and unknown risks, uncertainties and other important<br />
factors that could cause our actual results, performance or achievements, or industry results, to differ materially<br />
from any future results, performance or achievements expressed or implied by such forward-looking statements.<br />
Examples of these risks, uncertainties and other factors include, but are not limited to those discussed in the<br />
section entitled “Risk Factors” including the following: general economic and business conditions; competition<br />
in the cruise and cargo transportation industries; reduced demand for cruises and/or cargo transportation;<br />
regulatory, legislative and judicial developments; market acceptance of our planned introduction of new vessels<br />
and routes; delay in delivery of new vessels; our ability to obtain financing on terms that are favorable or<br />
v
consistent with our expectations; the impact of changes in operating and financing costs, including changes in<br />
interest rates, fuel, payroll, port fees and insurance; onboard trade and price development; changes in Estonian<br />
corporate taxation rates; emergency ship repairs; incidents and accidents at sea including those involving the<br />
health and safety of passengers; and weather. The above examples are not exhaustive and new risks emerge from<br />
time to time. Should one or more of these or other risks or uncertainties materialize, or should any underlying<br />
assumptions prove to be incorrect, our actual results of operations or our financial condition could differ<br />
materially from those described herein as anticipated, believed, estimated or expected.<br />
We do not intend and do not assume any obligation to update any forward-looking statements contained<br />
herein. For additional information that could affect our results, performance or achievements, see “Risk Factors.”<br />
vi
SUMMARY<br />
This summary should be read as an introduction to this offering memorandum. The summary should be read<br />
in conjunction with, and is qualified in its entirety by, the more detailed information appearing elsewhere in this<br />
offering memorandum, including our audited consolidated financial statements. Any consideration to invest in<br />
our shares should be based on consideration of this offering memorandum taken as a whole. Where a claim<br />
relating to the information contained in this offering memorandum is brought before a court, the plaintiff might,<br />
under applicable law, have to bear the costs of translating this offering memorandum before legal proceedings<br />
are initiated. We assume civil liability in respect of this summary only if it is misleading or inconsistent when<br />
read together with the other parts of this document.<br />
Overview<br />
We are a leading provider of high-quality mini-cruise and passenger transport services in the Northern<br />
<strong>Baltic</strong> Sea region as well as a leading provider of ro-ro cargo services on selected routes. We own and operate<br />
passenger ferries, including cruise ferries and high-speed ferries, and ro-ro cargo vessels on routes between<br />
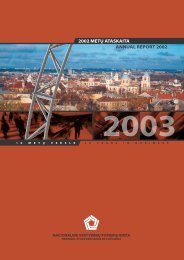
Finland and Estonia and between Sweden and Estonia. Our current routes are between Helsinki, the capital of<br />
Finland, and Tallinn, the capital of Estonia; between Stockholm, the capital of Sweden, and Tallinn; and between<br />
Kapellskär, a port city close to Stockholm, and Paldiski, a port city close to Tallinn. We are the current market<br />
leader on the Helsinki—Tallinn route and the only provider of daily passenger and ro-ro cargo traffic services on<br />
the routes between Sweden and Estonia. Altogether, we transported more than 3.2 million passengers and<br />
approximately 130,000 ro-ro cargo units in the financial year ended August 31, 2005, an increase of 16 percent<br />
and 27 percent, respectively, compared to the previous financial year. In May 2004, we broadened our product<br />
offering through the introduction of a 350-room Hotell <strong>Tallink</strong> that we operate in the principal tourist area of<br />
Tallinn. In addition, we have made a decision to start operating a new conference and spa hotel close to the<br />
center of Tallinn. This hotel is intended to commence operations in late 2006.<br />
Our principal sources of revenue are restaurant and shop sales onboard our vessels, ticket sales and sales of<br />
cargo transport. Our revenue for the financial year ended August 31, 2005 amounted to EEK 4,063 million, the<br />
majority of which was derived from revenue in passenger and cargo operations between Finland and Estonia. The<br />
table below sets forth the development and geographical breakdown of our revenue for the financial years ended<br />
August 31, 2003, 2004 and 2005:<br />
Financial year ended August 31,<br />
2003 2004<br />
(EEK in millions)<br />
2005<br />
Finland—Estonia ................................................ 2,053 2,083 2,442<br />
Sweden—Estonia ................................................ 943 1,232 1,392<br />
Mainland operations .............................................. — 40 88<br />
Other .......................................................... — 51 141<br />
Total .......................................................... 2,996 3,406 4,063<br />
We currently own a fleet consisting of six cruise ferries carrying both passengers and ro-ro cargo, four highspeed<br />
ferries operating between Helsinki and Tallinn and two ro-ro cargo vessels. In 1997, we changed our<br />
operating model from chartering into ship ownership and acquired our first three vessels. In 2000, we started to<br />
invest in new vessels, including the cruise ferries Romantika (introduced in 2002) and Victoria I (in 2004), and<br />
the 2,800 passenger new cruise ferry expected to be introduced in the spring of 2006 (the “New Cruise Ferry”).<br />
Our new cruise ferries provide improved accommodation facilities, larger onboard shopping areas and a broader<br />
offering of other services compared to our traditional ferries. We also plan to introduce new high-speed ro-pax<br />
ferries on the Helsinki—Tallinn route. The new high-speed ro-pax ferries are designed to combine the best<br />
features of a traditional cruise ferry and a high-speed ferry such that they can be operated year-round and can<br />
travel at almost the same speed as existing high-speed ferries but with increased passenger capacity, expanded<br />
shopping and dining facilities and other services.<br />
Group Structure<br />
<strong>Aktsiaselts</strong> <strong>Tallink</strong> <strong>Grupp</strong> is the operating parent company of our group of companies. The operational<br />
structure of our business is similar to the legal structure of our group of companies, and is divided into ship<br />
operations, marketing companies and service companies. Each ship is managed as a separate entity comprised of<br />
technical crew and service staff.<br />
1
Key Strengths<br />
We believe that our position as a leading provider of high-quality mini-cruise and passenger transport<br />
services in the Northern <strong>Baltic</strong> Sea region, as well as a leading provider of ro-ro cargo services on selected<br />
routes, is based on the following key strengths:<br />
• Strong market position;<br />
• High-quality, flexible fleet;<br />
• Broad product offering;<br />
• Strong brand;<br />
• Competitive cost base; and<br />
• Experienced management team with a proven track record.<br />
Strategy<br />
We aim to be the leading provider of high-quality mini-cruise and passenger transport services, as well as the<br />
leading provider of ro-ro cargo services on selected routes, in the Northern <strong>Baltic</strong> Sea region. Even though our<br />
business has grown rapidly for nearly ten years, we believe that there are additional growth opportunities in the<br />
region over the coming years. The cornerstones of our operating strategy are set out below:<br />
• Continue to invest in our fleet;<br />
• Build upon strong positions on existing routes;<br />
• Pursue new growth opportunities in the Northern <strong>Baltic</strong> Sea region; and<br />
• Maintain profitability through efficient and flexible management, while seeking revenue growth.<br />
Risk Factors<br />
Before making an investment decision with respect to our shares, prospective investors should, in addition<br />
to the other information contained herein, carefully review the risk factors described in this offering<br />
memorandum. Our business, financial condition and results from operations could be adversely affected by each<br />
of such risks, which may relate to us, our business environment and changes therein, our geographical market<br />
area, investing in our shares and other matters, and investors may lose the value of their investment in whole or<br />
in part. These risks are not the only ones we face. Additional risks and uncertainties not presently known to us, or<br />
that we currently believe to be immaterial, could also adversely affect our business. For a more detailed<br />
description of the risks relating to our business, see “Risk Factors.”<br />
Management<br />
Our corporate governance, management and administration are divided among our shareholders represented<br />
at the general meetings of shareholders, our supervisory council and our management board. The general meeting<br />
of shareholders approves, among other things, the annual report, the auditors’ report and the distribution of<br />
profits. Resolutions may be adopted at either annual or extraordinary general meetings of shareholders. The<br />
supervisory council is responsible for planning our business activities, organizing our management by electing<br />
members to the management board, approving our budget and supervising the activities of our management<br />
board. The management board manages our daily business affairs. The current members of our supervisory<br />
council are Toivo Ninnas, Andres Lipstok, Eve Pant, Ain Hanschmidt, Sunil Kumar Nair and Kustaa Lauri Äimä.<br />
Our current management board members are Enn Pant, Kalev Järvelill, Andres Hunt and Keijo Mehtonen.<br />
Shares and Shareholders<br />
As of the date of this offering memorandum, our registered share capital amounted to EEK 1,100,000,000<br />
consisting of 110,000,000 fully paid shares with a nominal value of EEK 10 each (each, a “Share” and, together,<br />
the “Shares”). Each Share entitles its holder to one vote at our general meetings of shareholders. We have one<br />
class of shares and all Shares rank pari passu in all respects.<br />
We had 252 shareholders as of November 18, 2005. The ten largest shareholders held in the aggregate more<br />
than 90 percent of all of our Shares and votes, while our largest shareholder, <strong>Aktsiaselts</strong> Infortar (“Infortar”),<br />
alone held more than 55 percent of the Shares and votes. Infortar is an Estonian investment company with<br />
interests in the shipping, real estate and printing industries. The principal shareholder of Infortar is an Estonian<br />
holding company, Linandell OÜ, which is controlled by Enn Pant, Chairman of our management board and our<br />
CEO; Kalev Järvelill, a member of our management board; and Ain Hanschmidt, a member of our supervisory<br />
council.<br />
2
The Offering<br />
Offering .......................... IntheOffering,upto34,090,909 Shares (the “Offer Shares”) are<br />
being offered by us and certain selling shareholders defined herein<br />
(the “Selling Shareholders”) to retail investors in Estonia and Finland<br />
and to institutional investors in and outside of Estonia and Finland. Of<br />
the Offer Shares, 26,500,000 Shares are new Shares to be issued by us<br />
(the “New Shares”) and a maximum of 7,590,909 shares are existing<br />
Shares to be sold by the Selling Shareholders (the “Sale Shares”). The<br />
total number of Offer Shares may be changed. Approval of the share<br />
capital increase relating to the New Shares is scheduled to be taken by<br />
our general meeting of shareholders to be convened on November 30,<br />
2005.<br />
The retail offering is structured as a public offering in Estonia and<br />
Finland. The institutional offering consists of (i) an offer of Offer<br />
Shares outside the United States to institutional investors in reliance<br />
on Regulation S under the Securities Act and (ii) an offer of Offer<br />
Shares in the United States to qualified institutional buyers in reliance<br />
on Rule 144A under the Securities Act.<br />
Shares ........................... Oursharecapital consists of 110,000,000 Shares. The Sale Shares<br />
and, once issued and registered with the Estonian Commercial<br />
Register, the New Shares rank pari passu with all the remaining<br />
Shares of <strong>Tallink</strong>.<br />
Selling Shareholders ................ <strong>Aktsiaselts</strong> Infortar, Citibank Hong Kong/Citicorp International<br />
Finance Corporation, Amber Trust S.C.A and DCF Fund (II) <strong>Baltic</strong><br />
States. A portion of the Sale Shares initially offered by the Selling<br />
Shareholders may be offered on behalf of other shareholders.<br />
Over-Allotment Option .............. CertainSelling Shareholders have granted to Citigroup, acting on<br />
behalf of the Managers, an option exercisable at any time within<br />
30 days from the commencement of trading in our Shares on the<br />
Tallinn Stock Exchange to purchase up to an aggregate of 3,409,091<br />
additional Shares at the Offer Price solely to cover over-allotments, if<br />
any (the “Over-Allotment Option”). See “Plan of Distribution.”<br />
OfferPeriod....................... Theofferperiodcommences on November 21, 2005 and ends on<br />
December 1, 2005.<br />
Offer Price Range .................. Theofferpricerange is EEK 73.50 (EUR 4.70) to EEK 92.00<br />
(EUR 5.88) per Offer Share. The offer price range may be changed<br />
during the bookbuilding process directed at institutional investors.<br />
The final offer price (“Offer Price”) will be based on the<br />
bookbuilding process. The Offer Price will be the same for all<br />
investors.<br />
Shares Issued and Outstanding after<br />
theOffering ..................... Immediately prior to the Offering, there were 110,000,000 Shares<br />
issued and outstanding. Upon completion of the Offering, and<br />
assuming that all New Shares are subscribed for, there will be<br />
136,500,000 Shares issued and outstanding.<br />
Percentage of the Total Issued Share<br />
Capital Being Offered in the<br />
Offering ........................ TheOfferShares represent approximately 27.5 percent of our share<br />
capital following the Offering and assuming that the Over-Allotment<br />
Option is exercised in full and that the number of Offer Shares is not<br />
changed.<br />
3
Listing ........................... Anapplication has been made for the Shares to be listed on the<br />
Tallinn Stock Exchange. Trading of the Shares on the main list of the<br />
Tallinn Stock Exchange is expected to commence on or about<br />
December 9, 2005.<br />
Settlement ........................ Itisexpected that delivery of the Offer Shares will be made on or<br />
about December 8, 2005 through the facilities of the Estonian Central<br />
Securities Depository, Euroclear Bank S.A./N.V., as operator of the<br />
Euroclear System, or Clearstream Banking société anonyme. To<br />
facilitate the settlement, Citigroup, on behalf of the Managers, will<br />
borrow a number of Shares, corresponding to the number of New<br />
Shares, from Infortar.<br />
Lock-up Agreements ................ Except for the Sale Shares to be offered by the Selling Shareholders<br />
(including any additional Shares sold pursuant to the Over-Allotment<br />
Option), <strong>Tallink</strong>, each of the Selling Shareholders, each of the<br />
members of our supervisory council and management board and each<br />
of our key executives have agreed that, without the prior written<br />
consent of Citigroup, each of us will not issue, offer, sell, contract to<br />
sell, or otherwise dispose of any Shares owned by us/it at any time or<br />
any securities convertible into or exercisable or exchangeable for<br />
Shares, or enter into any swap or other agreement or any transaction<br />
to transfer the economic consequence of ownership of the Shares, or<br />
publicly announce an intention to effect any such transaction, during<br />
the period commencing on the date of pricing and ending 180 days (in<br />
the case of <strong>Tallink</strong>), 270 days (in the case of Infortar), 180 days (in<br />
the case of the other Selling Shareholders) and 365 days (in the case<br />
of members of our supervisory council and management board and<br />
our key executives) after the commencement of trading in our Shares<br />
on the Tallinn Stock Exchange. However, the lock-up does not apply<br />
to any shares that we may issue or sell pursuant to any employee<br />
stock option plan, stock ownership plan or dividend reinvestment<br />
plan. See “Plan of Distribution.”<br />
VotingRights ..................... Each Sale Share carries and, upon registration with the Estonian<br />
Commercial Register, each New Share will carry one vote at our<br />
general meetings of shareholders.<br />
Dividend Rights .................... TheSaleShares entitle and, upon registration with the Estonian<br />
Commercial Register, the New Shares will entitle holders to any<br />
future dividends commencing with any dividend declared for the<br />
financial year commenced September 1, 2005 and ending August 31,<br />
2006. See “Dividends and Dividend Policy” and “Description of<br />
Share Capital.”<br />
Use of Proceeds .................... Ournetproceeds from the issuance of the New Shares in the Offering<br />
are estimated to be approximately of EEK 2,097 million, based on the<br />
mid-point of the Offer Price range. We will not receive any part of the<br />
proceeds from the sale of the Sale Shares sold by the Selling<br />
Shareholders. Our net proceeds from the Offering are expected to be<br />
used to repay indebtedness and to strengthen our financial resources<br />
as part of our growth strategy involving our investment and fleet<br />
renewal program. See “Use of Proceeds.”<br />
Stabilization....................... Citigroup, on behalf of the Managers, may effect transactions that<br />
stabilize or maintain the market price of our Shares, in accordance<br />
with applicable laws, during a 30-day period starting from the<br />
commencement of trading in our Shares on the Tallinn Stock<br />
Exchange. Any such stabilization activity will be decided by<br />
Citigroup at its sole discretion<br />
4
and there is no obligation on Citigroup to do this. Such stabilization<br />
transactions may result in a market price of the Shares that is higher<br />
than would otherwise prevail. Any trades made on the Tallinn Stock<br />
Exchange as part of the stabilization will be effected by Suprema<br />
Securities as instructed by Citigroup. The details of all stabilization<br />
transactions will be notified to the Estonian Financial Supervisory<br />
Authority (the “EFSA”) according to the Article 9(4) of the European<br />
Commission Regulation (EC) No. 2273/2003 implementing Directive<br />
2003/6/EC of the European Parliament and the Council.<br />
Stabilization activities will be conducted in accordance with the<br />
European Commission Regulation (EC) No 2273/2003 implementing<br />
Directive 2003/6/EC of the European Parliament and the Council as<br />
regards exemptions for buy-back programs and stabilization of<br />
financial instruments.<br />
See “Plan of Distribution.”<br />
Selling and Transfer Restrictions ...... SalesandtransfersoftheOfferShares will be subject to certain<br />
restrictions. See “Plan of Distribution” and “Transfer Restrictions.”<br />
ISIN ............................. EE3100004466<br />
Trading Code ...................... TAL1T<br />
Managers ......................... Citigroup Global Markets Limited, Nordea Bank Finland Plc., AS<br />
Suprema Securities and SEB Eesti Ühispank AS.<br />
Importantdates .................... November 21, 2005 Start of the Offer Period.<br />
November 30, 2005 Extraordinary General Meeting of our Shareholders.<br />
December 1, 2005 End of the Offer Period.<br />
December 2, 2005 Publication of the Offer Price.<br />
On or about<br />
December 8, 2005 Settlement and delivery of the Offer Shares.<br />
On or about<br />
December 9, 2005 Opening of trading in the Shares on the Tallinn<br />
Stock Exchange.<br />
5
Summary Financial Information<br />
The table below presents certain summary consolidated financial information as of and for the financial<br />
years ended August 31, 2003, 2004 and 2005. This information has been derived from our audited consolidated<br />
financial statements included elsewhere in this offering memorandum. This information should be read in<br />
conjunction with, and is qualified in its entirety by reference to, such financial statements and the related notes.<br />
Our financial statements are prepared in accordance with IFRS.<br />
As of and for the financial year ended August 31,<br />
2003 2004 2005<br />
(EEK in millions, unless otherwise indicated)<br />
Income Statement Information<br />
Revenue ................................................ 2,996 3,406 4,063<br />
Operating profit .......................................... 481 446 629<br />
Profit before income tax and minority interests .................. 382 313 474<br />
Net profit for the financial year ..............................<br />
Balance Sheet Information<br />
382 313 473<br />
Currentassets ............................................ 443 676 614<br />
Non-current assets ........................................ 4,107 6,232 6,313<br />
Cash and cash equivalents .................................. 232 367 327<br />
Totalassets .............................................. 4,549 6,908 6,927<br />
Total liabilities ........................................... 3,076 4,726 4,271<br />
Interest-bearing liabilities ................................... 2,794 4,234 3,836<br />
Equity ..................................................<br />
Cash Flow Information<br />
1,473 2,182 2,656<br />
Cash flow from operating activities ........................... 842 804 891<br />
Cash flow used in investing activities ......................... (620) (2,386) (352)<br />
Cash flow from (used in) financing activities ...................<br />
Per Share Information<br />
(144) 1,717 (579)<br />
Adjusted weighted average number of Shares (thousands) ......... 89,600 109,050 110,000<br />
Earnings per Share (EPS), EEK ..............................<br />
Ratios and Indicators<br />
4.3 2.9 4.3<br />
1<br />
EBITDA2 ............................................... 803 720 901<br />
EBITDA margin, % 3 ...................................... 27 21 22<br />
Operating profit margin, % 4 ................................. 16 13 15<br />
Return on investment (ROI), % 5 ............................. 12 9 10<br />
Return on assets (ROA), % 6 ................................ 11 8 9<br />
Return on equity (ROE), % 7 ................................ 30 17 20<br />
Equity ratio, % 8 .......................................... 32 32 38<br />
Number of passengers, persons .............................. 2,597,917 2,828,364 3,274,177<br />
Number of ro-ro cargo units ................................. 94,945 103,425 131,349<br />
Number of personnel, average ............................... 1,921 2,371 2,710<br />
1 See “Selected Financial Information” for further explanation of the use and purpose of the ratios and indicators. EBITDA is not a<br />
measure of operating performance calculated in accordance with IFRS. EBITDA should not be considered as a substitute for operating<br />
profit, net income, cash flow from operations or other profit or loss or cash flow data determined in accordance with IFRS. EBITDA is<br />
included herein as a supplemental item because we believe that EBITDA, when considered in connection with cash flows from<br />
operating, investing and financing activities, may provide useful information.<br />
2 EBITDA = Earnings before net financial items, share of profit of associates, taxes, depreciation and<br />
amortization<br />
3 EBITDA margin = EBITDA / Revenue<br />
4 Operating profit margin = Operating profit / Revenue<br />
5 Return on investment (ROI) = (Profit after net financial cost + Interest expense) / (Average total assets – Average interest free<br />
liabilities)<br />
6 Return on assets (ROA) = Operating profit / Average total assets<br />
7 Return on equity (ROE) = Net profit / Average equity<br />
8 Equity ratio = Equity / Total assets<br />
6
RISK FACTORS<br />
Before making an investment decision, you should carefully review the specific risk factors described below,<br />
in addition to the other information contained in this offering memorandum. Our business, financial condition<br />
and results from operations could be materially affected by each of these risks. The market price of the Shares<br />
following the Offering may decline as a result of each of these risks, and you may lose the value of your<br />
investment in whole or in part. These risks are not the only ones we face. Additional risks and uncertainties not<br />
presently known to us, or that we currently believe are immaterial, could also impair our business. Certain other<br />
matters regarding our operations that should be considered before making an investment in the Shares are set<br />
out in “Business” and “Operating and Financial Review and Prospects.” The order of presentation of the risk<br />
factors below is not intended to be an indication of the probability of their occurrence or of their potential effect<br />
on our business.<br />
Risks Relating to Our Business<br />
We operate in a highly competitive market.<br />
We face considerable competition in our operations, both from other ferry operators and from providers of<br />
other means of transport. In particular, many other ferry companies compete on the Helsinki—Tallinn route in<br />
both passenger and cargo traffic. The number of passengers on the Helsinki—Tallinn route has more or less<br />
stabilized over recent years at around six million passengers annually. Although we anticipate that these numbers<br />
will grow in the future, there can be no assurance that this will be the case. We have made significant<br />
investments to modernize our fleet and we believe that we have a strong customer base, an attractive fleet and<br />
product offering and a respectable brand which offer us a competitive advantage. However, we cannot guarantee<br />
that we will be successful in retaining or improving our current market position or in expanding our business<br />
through, for example, potential new routes. In the past, other ferry operators have on occasion entered the<br />
Northern <strong>Baltic</strong> Sea market through relocation of their existing vessels. Thus, there can be no assurance that new<br />
competitors will not enter the market and further increase competition. Future acquisitions by or consolidation<br />
among our competitors could also increase competition in our markets. Failure to adapt to the changes in the<br />
market, whether caused by political decision-making or otherwise, or to increased competition could have a<br />
material adverse effect on our business, results of operations and financial condition. See “Business—<br />
Competition.”<br />
The introduction of new vessels and routes and related capacity increases involves risks and uncertainties.<br />
We continuously evaluate possibilities to introduce new vessels, to expand into alternative routes and to<br />
expand our business generally. There are risks related to our current plans regarding capacity increases on the<br />
Finland—Estonia and Sweden—Estonia routes. We currently operate two cruise ferries on the Finland—Estonia<br />
route and three cruise ferries on the Sweden—Estonia route. We have ordered the New Cruise Ferry scheduled to<br />
be introduced in the spring of 2006 on the Helsinki—Tallinn route. We believe that traffic on the Sweden—<br />
Estonia routes has future growth potential and, thus, we expect to move the 2,500 passenger cruise ferry<br />
Romantika to operate alongside her sister vessel Victoria I on the Stockholm—Tallinn route. The Regina <strong>Baltic</strong>a<br />
would be removed from the Stockholm—Tallinn route and could be used for new business opportunities.<br />
Furthermore, we recently placed orders for two new high-speed ro-pax ferries to be used on the Helsinki—<br />
Tallinn route. We are also studying the potential to commence traffic between Sweden and Latvia and to<br />
recommence traffic to and from St. Petersburg.<br />
Although we believe that the restructuring of the vessels on the different routes will improve our revenue<br />
and profitability per passenger and facilitate growth in passenger numbers, the New Cruise Ferry and high-speed<br />
ro-pax ferries represent substantial investments for us and, thus, involve risks. In order to market the New Cruise<br />
Ferry to the Finnish public as well as the improved fleet to the Swedish public and to launch the new high-speed<br />
ro-pax concept, we will have to increase our marketing expenditures, which could affect the profitability of our<br />
operations. It is also possible that the interest of the public will not meet our expectations. For example, an<br />
economic downturn in the markets in which we operate could negatively affect disposable income and, as a<br />
result, leisure preferences. In addition, the introduction of new routes involves potential difficulties in obtaining<br />
necessary permits and dealing with local authorities. For example, after almost one year of operation, we<br />
suspended our services to St. Petersburg at the beginning of 2005 as a result of factors such as high port taxes,<br />
difficulties arising from the visa regime imposed upon both European Union and Russian citizens and an<br />
underdeveloped infrastructure. The materialization of any of these risks could have a material adverse effect on<br />
our business, results of operations and financial condition.<br />
7
Any failure or delay in the delivery of ordered ferries may have a material adverse effect on our business,<br />
results of operations and financial condition.<br />
We have entered into a shipbuilding contract with Aker Finnyards Oy, under which Aker Finnyards Oy shall<br />
design, construct, equip, complete and deliver the New Cruise Ferry. The New Cruise Ferry has been financed<br />
through cash flows from operations and external financing. Furthermore, we recently placed orders with Aker<br />
Finnyards Oy and Fincantieri Cantieri Navali Italiani S.p.A. to design, construct and deliver two new high-speed<br />
ro-pax ferries. Any failure or significant delay in construction, completion or delivery of the New Cruise Ferry or<br />
the high-speed ro-pax ferries in accordance with the contracts and by the agreed deadlines could have a material<br />
adverse effect on our business, results of operations and financial condition.<br />
A large proportion of our revenue is concentrated on two of our vessels.<br />
While we own a fleet of 12 vessels, a large proportion of our revenue for the financial year ended<br />
August 31, 2005 was derived from ticket, onboard and cargo sales relating to our two newest cruise ferries,<br />
Romantika and Victoria I. Although our investment and fleet renewal program contemplates the introduction of<br />
an additional cruise ferry and two high-speed ro-pax ferries with a similarly high-quality service offering, it is<br />
possible that our revenue and profits will remain concentrated among a relatively small number of ships. An<br />
accident or suspension of operations for Romantika or Victoria I, or future vessels whose operations are<br />
significant to us, could adversely affect our future sales and profitability. Furthermore, increased competition in<br />
the mini-cruise segment could adversely affect the sales derived from our key vessels and therefore adversely<br />
affect our overall revenue and profitability.<br />
We face uncertainties regarding onboard trade and price development.<br />
Our onboard shops compete with onshore shops. Since the consumer price level in Estonia is currently<br />
lower than in Finland and Sweden, the prices in our onboard shops must be comparable to the prices in onshore<br />
shops in Estonia in order to be competitive. Any reduction in the Estonian consumer price levels may reduce the<br />
demand for goods sold onboard and force us to reduce our onboard prices, which could have a material adverse<br />
effect on our business, results of operations and financial condition.<br />
The tax-free status of trade in goods sold in onboard shops on the Helsinki—Tallinn and Kapellskär—<br />
Paldiski routes was abolished when Estonia became a member of the European Union. We currently pay<br />
Estonian, Swedish and Finnish value added taxes and Estonian excise tax on the sale of certain goods that were<br />
previously sold free of such taxes. The Estonian excise tax rate is currently lower than the Finnish and Swedish<br />
tax rates, but no assurance can be given that the Estonian tax rate will remain comparatively lower in the future.<br />
Furthermore, as a result of the abolition of the tax-free status for onboard sales, our profit margins have<br />
decreased as Estonian onshore prices have not increased sufficiently to compensate for our increased costs.<br />
Due to the removal of the import restrictions upon Estonia’s membership of the European Union, the<br />
governments of Finland and Sweden have commenced discussions on the future of excise taxation in Finland and<br />
Sweden. Finland implemented a moderate reduction of the excise taxes on alcoholic beverages in early 2005.<br />
There is currently uncertainty about which other policies, if any, will be adopted by the Finnish government. If<br />
Sweden also were to reduce the excise tax levels on goods purchased domestically, the demand for goods sold<br />
onboard and for mini-cruises might decrease. This could have a material adverse effect on our business, results of<br />
operations and financial condition.<br />
We are highly leveraged, and if we or any of our ship-owning subsidiaries default under any of our respective<br />
loan agreements, we could forfeit the rights to our vessels.<br />
We operate our vessels through individual ship-owning subsidiaries, one for each vessel. In addition, the<br />
New Cruise Ferry is expected to be delivered in the spring of 2006, and two high-speed ro-pax vessels have been<br />
ordered for delivery in 2007 and 2008. We are highly leveraged due to the fact that all recent and future<br />
purchases of vessels have been and are expected to be financed mainly through loan financing and cash flows<br />
from operations. Our obligations under the loan agreements have been secured by different security<br />
arrangements, including mortgages, guarantees, assignments of earnings or insurances, charters, charter<br />
guarantees, pledges or options to pledge the shares of our ship-owning subsidiaries, pledges of bank accounts and<br />
other arrangements.<br />
The loan agreements include several negative undertakings, relating to, among other things, entering into<br />
other financial commitments, changes in our corporate structure or the nature of our business, and consolidating<br />
or merging with another corporation. The loan agreements also contain extensive requirements relating to the use<br />
8
of our vessels, compliance with environmental laws and our insurance policies. Several of our loan agreements<br />
prevent our subsidiaries from paying dividends without the prior approval of the lenders. Furthermore, as a result<br />
of our legal and operational structure and the terms of the loan agreements entered into by us and our shipowning<br />
subsidiaries, our ability to transmit certain funds among companies in the group and to pay dividends<br />
may be restricted.<br />
Since the interest rates under our loan agreements are mainly tied to EURIBOR with specific margins,<br />
interest rate fluctuations may affect the amounts payable under the loan agreements.<br />
All of our term loan agreements contain customary events of default, including cross-default provisions.<br />
Frequently, the cross-default provisions extend to <strong>Tallink</strong>, to certain group companies as guarantors and to<br />
Infortar. These cross-default clauses expose the companies of the group to default risks based on contract<br />
performance by other group companies. In addition, under certain agreements, it is an event of default if, without<br />
the prior consent of the relevant lender, a third party acquires in whole or in part the issued share capital of (or an<br />
equivalent to the controlling interest in) the borrower or the guarantor/shareholder or if there is a change in the<br />
ultimate beneficial ownership of the shares in the relevant borrower or guarantor or in the ultimate voting rights<br />
attaching to the shares. See also “Operating and Financial Review and Prospects—Liquidity and Capital<br />
Resources—Loan Agreements.”<br />
Any failure to comply with the loan agreements or any demand for repayment made by the banks could<br />
have a material adverse effect on our business, results of operations and financial condition.<br />
Fluctuations in the market value of our fleet may impair our ability to obtain additional funding and have a<br />
material adverse effect on our business, results of operations and financial condition.<br />
The market value of vessels in our fleet on the regional and global markets is subject to fluctuations. These<br />
depend in part on the general economic and market conditions affecting the ferry industry, competition from<br />
other ferry companies, the supply of similar vessels, the price of new vessels, government regulations, the<br />
development of other means of transportation, and technological advancements. It should be expected that the<br />
fair market value of our vessels will fluctuate. In addition, as vessels grow older, they generally decline in value.<br />
The design and specifications of the vessels in our fleet may limit the potential usage of the vessels in different<br />
regions and on different routes, which in turn may have an adverse effect on the potential value of the fleet. In<br />
part, the introduction of the new high-speed ro-pax ferries could adversely affect the market value of our<br />
traditional ferries, cargo vessels and high-speed ferries.<br />
A decrease in the value of our vessels could affect our ability to borrow funds. If we determine at any time<br />
that a vessel’s future useful life or earnings require us to impair its value on our financial statements, it could<br />
result in a charge against our earnings and a reduction in our shareholders’ equity. If we sell any of our vessels at<br />
a time when prices are low, the sale price may be less than the vessel’s carrying amount on our financial<br />
statements, with the result that we would also incur a loss and a reduction in earnings, which could have a<br />
material adverse effect on our business, results of operations and financial condition.<br />
We may be unable to retain key management personnel or other employees or to attract qualified new<br />
personnel, which may negatively impact our business.<br />
Our management and the planning of our operations are conducted by a small number of executives, and the<br />
loss of any of them or of certain other members of our operating personnel could adversely affect our business. If<br />
we are unsuccessful in retaining key management personnel or in attracting qualified new management<br />
personnel, it may have a material adverse effect on our business, results of operations and financial condition.<br />
Rising labor costs as the Estonian economy develops may have a material adverse effect on our business,<br />
results of operations and financial condition.<br />
One of our competitive advantages as compared to our Finnish and Swedish competitors is the relatively<br />
lower labor cost of Estonian crews and onshore staff. Labor laws of the country of a ship’s flag govern the<br />
employment of the ship’s crew and other onboard staff. All of our ferries operate under the Estonian flag. If our<br />
labor costs increase due to general economic developments, increased regulation or other reasons, it may have a<br />
material adverse effect on our business, results of operations and financial condition. See “Business—Employees<br />
and Labor Relations” for a description of the terms of a recently renewed three-year agreement with the trade<br />
union regarding salary levels of our onboard staff.<br />
9
Our principal shareholder Infortar and its controlling shareholders will continue to hold a significant interest<br />
in <strong>Tallink</strong> after the Offering, and, consequently, will be able to significantly influence the outcome of any<br />
shareholder vote.<br />
At the time of the commencement of this Offering, the Selling Shareholders have not finally determined whether<br />
and to what extent they may participate in the Offering. Furthermore, other shareholders may wish to participate<br />
in the Offering as Selling Shareholders. In the event that our principal shareholder, Infortar, does not sell any<br />
shares in the Offering, 44.8 percent of our Shares will be controlled by Infortar after the completion of the<br />
Offering assuming that we will issue all the New Shares in the Offering. In the event that Infortar will be the only<br />
Selling Shareholder and assuming that all the Sale Shares are sold and all the New Shares are issued in the<br />
Offering, 39.2 percent of our Shares will be controlled by Infortar after the completion of the Offering (36.7<br />
percent in the event that the Over-Allotment Option is exercised in full and Infortar sells all the Shares covered<br />
by the Over-Allotment Option). Consequently, regardless of whether and to what extent it may participate in the<br />
Offering, Infortar will be able to influence our management and our policies with respect to, among other things,<br />
any matters submitted to a vote of all of the shareholders. We have in the past and will in the future engage in<br />
transactions with Infortar or its affiliates. In particular, Infortar is the 50 percent shareholder in the company<br />
owning the property of Hotell <strong>Tallink</strong> and the sole owner of the company owning the Tallinn city conference and<br />
spa hotel currently under construction, both of which we either currently manage or expect to manage. Therefore,<br />
it can be expected that the role of Infortar will remain significant in our future development and operations.<br />
Furthermore, the recent announcement of a transfer by Enn Pant, Chairman of our management board and our<br />
CEO, of shares in a holding company that is Infortar’s controlling shareholder, to Ain Hanschmidt, a member of<br />
our supervisory council, has been subject to an internal investigation by one of our lenders with whom Mr.<br />
Hanschmidt was previously affiliated, as well as an investigation by the EFSA. While this event was not directly<br />
related to us or our operations, and while no allegations of misconduct resulted from any of the investigations,<br />
this event, and any similar events in the future, may affect our reputation and consequently the price of our<br />
Shares. See “Principal and Selling Shareholders—Infortar.”<br />
We have historically had a lean administrative, legal and accounting staff and, as a result, we may be unable<br />
to develop and maintain an effective internal control structure.<br />
As a private company we have historically had a small staff responsible for administrative, legal and<br />
accounting functions (some of which have been handled by Infortar or external service providers). We may have<br />
to hire and train new employees to enhance these functions in the future as a result of increased demands on us as<br />
a public company. These increased demands include accounting requirements applicable to public companies<br />
(including enhanced knowledge of IFRS), the need for a stronger internal audit function and the need for more<br />
robust information technology systems. We do not currently have an audit committee. We may in the future<br />
decide to establish an audit committee to be responsible for, among other things, the oversight of our internal<br />
control processes. The failure to develop and maintain an effective internal control structure or to hire necessary<br />
personnel could have a material adverse effect on our business, results of operations and financial condition, and<br />
the increased administrative costs necessary to manage a public company could adversely affect our profitability.<br />
Our operations could be affected by any actions taken by competition authorities.<br />
Our current strong position on the Stockholm—Tallinn route could at some point be subject to legal<br />
constraints that may have an impact on our ability to freely conduct our operations. Companies with a high<br />
market share are subject to specific competition laws and regulations, which set out stricter operational<br />
requirements for such companies. We operate in the transportation sector, which has traditionally been of special<br />
interest to the competition authorities, particularly at the European Union level, due to the need to secure free<br />
movement of goods and services between the European Union member states. For instance, any support planned<br />
by the state for the benefit of the industry in which we operate will be subject to the requirements under<br />
European Community law. Any alleged violations of competition laws and regulations or the outcome of any<br />
legal or administrative proceedings brought against us could have a material adverse effect on our business,<br />
results of operations and financial condition.<br />
Risks Relating to Our Industry<br />
Fuel costs and increases in port and regulatory fees are beyond our control and may have a material adverse<br />
effect on our business, results of operations and financial condition.<br />
The cost of fuel used by our vessels is subject to many global and regional economic and political factors<br />
that are beyond our control. The cost of fuel can be volatile and has recently been higher than in the past. At<br />
10
present, fuel represents approximately 12 percent of our operating costs as a result of recent increases in fuel<br />
prices. We currently pass a small portion of our fuel costs on to our customers as a fuel surcharge. However,<br />
further increases in the cost of fuel could decrease our profit margins as we may not be able to pass on the cost to<br />
our customers without a decrease in demand. In addition, port and other regulatory fees are subject to change. We<br />
may also not be able to pass on increases in these fees to our customers without reducing demand. A material<br />
increase in the cost of fuel or port and other regulatory fees may, thus, have a material adverse effect on our<br />
business, results of operations and financial condition.<br />
Marine transportation is inherently risky, and an incident involving passenger vessels could harm our<br />
reputation and have a material adverse effect on our business, results of operations and financial condition.<br />
The operation of ships involves the risk of accidents and incidents at sea which could bring into question<br />
passenger safety and adversely affect future industry performance. An accident similar to the sinking of the<br />
cruise ferry Estonia operated by Estline (a company which was declared bankrupt as a result of the accident and<br />
was not affiliated with <strong>Tallink</strong>) in the autumn of 1994 in the Northern <strong>Baltic</strong> Sea region could be detrimental to<br />
the ferry industry and result in a drastic reduction of passenger volumes. If a similar incident were to occur on<br />
one of our ships, the consequences for our reputation and business could be even more dramatic.<br />
Due to difficult weather conditions with narrow navigable routes and the possibility of technical or human<br />
errors, a number of ferries operating in the Northern <strong>Baltic</strong> Sea region have run aground in the past years,<br />
particularly in the Stockholm archipelago. On September 27, 2005, our cruise ferry Regina <strong>Baltic</strong>a ran aground<br />
due to a technical failure in the outer Stockholm archipelago outside of Kapellskär but was able to free herself.<br />
The vessel was out of service for a period of ten days while being repaired. We believe that this incident is not<br />
likely to have a significant effect on our business, results of operations or financial condition. While we make<br />
passenger safety our highest priority in the operation of our ships, incidents involving passenger ships operated<br />
by any passenger or cruise ferry operator anywhere in the world could adversely affect our future sales and<br />
profitability.<br />
Compliance with environmental, health and safety and other national and international laws and regulations<br />
may increase our operating costs, and failure to comply with such laws and regulations may have a material<br />
adverse effect on our business, results of operations and financial condition.<br />
The ferry industry is highly regulated and our operations are affected by extensive and evolving<br />
environmental, health and safety laws and regulations. Our vessels operate within the rules and regulations of the<br />
International Maritime Organization, the United Nations agency for maritime safety and the prevention of marine<br />
pollution by ships, the European Union and other jurisdictions in which our vessels operate or are registered. We<br />
have incurred, and may be required to incur in the future, considerable expenses in order to comply with these<br />
laws, regulations and customer requirements, including expenses relating to changes in operating procedures,<br />
additional maintenance, inspection and security requirements, contingency arrangements for emergency<br />
preparedness and insurance coverage. Environmental, health and safety laws and regulations change frequently<br />
and often become more stringent. Current and future environmental, health and safety laws and regulations may<br />
limit our ability to do business, increase our operating costs, require the implementation of expensive control<br />
systems, force the early phasing out of our vessels or decrease the resale value of our vessels, all of which could<br />
have a material adverse effect on the ferry industry and on our business, results of operations and financial<br />
condition.<br />
Our failure to comply with these laws and regulations could result in substantial costs and liabilities or<br />
temporary suspension of our business. International, national, regional and local laws and regulations can subject<br />
owners, operators or charterers of vessels to material liabilities arising out of the release of, or exposure to,<br />
hazardous substances or to vessel discharges. Certain of these laws and regulations impose joint, several and, in<br />
some cases, unlimited liability on owners, operators and charterers regardless of fault. We could be held liable<br />
under these laws and regulations and such liability could be material.<br />
Our insurance may be insufficient to cover losses that may occur to our property or result from our<br />
operations.<br />
We insure our vessels against risks, and in amounts, which we believe to be in line with standard industry<br />
practice and the covenants set out in our loan agreements. Insurance is subject to limits and limitations. There is a<br />
possibility that some risks may not be adequately covered by insurance and that any particular claim may not be<br />
paid. Any claims covered by insurance would be subject to deductibles, and since it is possible that a large<br />
11
number of claims may be brought, the aggregate amount of these deductibles could be material. Even if our<br />
insurance is adequate to cover our direct losses, we may be adversely affected by a loss of earnings during the<br />
period in which a damaged vessel is being repaired, or while we search for a replacement vessel in the event of a<br />
loss. In addition, if our vessels suffer damage, they may need to be repaired at a dry-docking facility. The costs of<br />
dry-dock repairs are unpredictable and can be substantial. We may have to pay dry-docking costs that our<br />
insurance does not cover. Moreover, we may be unable to procure adequate insurance coverage at commercially<br />
reasonable rates in the future. Our payment of uninsured losses or damages or increases in costs could result in<br />
significant expenses to us, which could have a material adverse effect our business, results of operations and<br />
financial condition.<br />
Poor weather conditions in the Northern <strong>Baltic</strong> Sea region may disturb the flow of our operations, reduce<br />
passenger volumes, and may have a material adverse effect on our business, results of operations and<br />
financial condition.<br />
Weather conditions in the Northern <strong>Baltic</strong> Sea region may affect both the ability of our vessels to operate<br />
and the willingness of passengers to travel on our vessels. Poor weather can result in cancelled or delayed<br />
transport or lower passenger numbers. As a major portion of the Northern <strong>Baltic</strong> Sea freezes during the winter<br />
months (typically from December / January to March / April), our high-speed ferries operating on the Helsinki—<br />
Tallinn route are removed from operation during that season. The decision regarding the operation of these ships<br />
is based on our assessment of weather conditions and, to some extent, corresponding decisions by competitors.<br />
The limitations on our operations caused by ice conditions will, to some extent, be reduced by the introduction of<br />
the new high-speed ro-pax ferries, which will be able to operate throughout the winter season. Nevertheless, poor<br />
weather conditions may have a material adverse effect on our business, results of operations and financial<br />
condition.<br />
Terrorist attacks and other acts of violence or war may affect trade and passenger flows, which could have a<br />
material adverse effect on our business, results of operations and financial condition.<br />
Terrorist attacks and the threat of future terrorist attacks, as well as other acts of violence and war, continue<br />
to cause uncertainty in the global economy and may lead to disruptions or changes in trade and passenger flows.<br />
Any future terrorist attacks may affect customer behavior and market demand, or may lead to anti-terrorism<br />
measures that impose costs or demands on our operations. Future terrorist attacks could result in increased<br />
volatility of financial markets and could result in regional or global economic recession. Any of these<br />
occurrences could have a material adverse effect on our business, results of operations and financial condition.<br />
Risks Relating to Doing Business in Estonia and in the <strong>Baltic</strong> Region<br />
Regulatory, legal, political or economic developments relating to Estonia and its integration into the European<br />
Union may have a material adverse effect on our business, results of operations and financial condition.<br />
Investors investing in emerging markets such as Estonia should recognize that these markets are subject to<br />
greater risks than more mature markets, including legal, economic and political risks. Estonia has experienced<br />
significant political, legal and economic changes and liberalization during the last two decades of transition from<br />
the Soviet rule and plan economy to independence and a market economy. In addition, for purposes of its<br />
membership of the European Union (effective as of May 1, 2004), Estonia implemented significant social and<br />
economic changes, as well as reforms of its legal and regulatory framework. As a result, the volume of Estonian<br />
legislation and other regulations has increased and is expected to increase further pursuant to the obligation to<br />
apply European Community law. Membership in the European Union has also caused significant changes to our<br />
operating environment, including changes to the status of tax-free trade and the application of the European<br />
Union’s competition and environmental law.<br />
Irrespective of the progress achieved by Estonia in its reforms, the country’s legal and regulatory framework<br />
is still at a stage of significant development and has not been tested over time to ensure consistency. Changes to<br />
Estonia’s political, economic, legal or regulatory framework may have a material adverse effect on our business,<br />
results of operations and financial condition.<br />
Changes in corporate taxation in Estonia could have a material adverse effect on our business, results of<br />
operations and financial condition.<br />
Estonia currently enjoys a corporate income tax regime under which income tax is deferred until profits are<br />
distributed. Estonian companies are currently subject to income tax of approximately 32 percent, which rate is<br />
12
due to decrease over the next three years on the amount of dividends and other distributions paid. In addition, an<br />
Estonian dividend withholding tax of 24 percent, which rate is due to decrease to 20 percent by 2009, is currently<br />
imposed on dividends paid by <strong>Tallink</strong> to non-resident legal persons. The European Union has granted Estonia a<br />
transition period expiring on December 31, 2008 following which time Estonia may be required to at least partly<br />
adjust its current tax regime. The possibility that Estonia may change its corporate taxation policy has<br />
periodically been subject to political discussion but we are not in a position to assess whether or, if so, when any<br />
such change may occur. Any change in Estonian corporate taxation policy could have a material adverse effect<br />
on our business, results of operations and financial condition. See “Taxation—Estonian Tax Considerations.”<br />
Fluctuations in exchange rates could have a material adverse effect on our business, results of operations and<br />
financial condition.<br />
Our books and accounts are denominated in Estonian kroons. Our revenue is primarily denominated in euro,<br />
Swedish kronor and Estonian kroons, while our expenses are primarily denominated in euro, Estonian kroons,<br />
U.S. dollars, and Swedish kronor. Therefore, we are exposed to currency risks. The Estonian kroon is pegged to<br />
the euro at an official exchange rate of EEK 15.6466 = EUR 1 and, accordingly, it fluctuates against the<br />
U.S. dollar and the Swedish krona at the same rate as the euro.<br />
Although the Bank of Estonia has expressed its intention to maintain the current fixed exchange rate and the<br />
currency board system, there can be no guarantee that the Estonian Parliament will not amend the relevant laws<br />
and that the fixed exchange rate will be maintained in the coming years. Currently, we do not hedge our foreign<br />
exchange exposures. Fluctuations in currency exchange rates, or new currency-related policies adopted by the<br />
Estonian authorities, could have a material adverse effect on our business, results of operations and financial<br />
condition.<br />
Risks Relating to the Offering<br />
An active market for the Shares may not develop, which may cause the Shares to trade at a discount and make<br />
the Shares difficult to sell.<br />
Prior to this Offering, there has been no public market for the Shares. We cannot assure you that an active<br />
trading market for the Shares will develop or be sustained after the Offering. The Offer Price for the Shares will<br />
be determined through negotiations among the Managers, the Selling Shareholders and us. This initial Offer<br />
Price may vary from the market price of the Shares after the Offering. If you purchase any Shares, you may not<br />
be able to resell those Shares at or above the Offer Price.<br />
The price of the Shares after this Offering may be volatile and may fluctuate significantly in response to<br />
numerous factors including:<br />
• actual or anticipated fluctuations in our quarterly and annual results and those of our publicly-held<br />
competitors;<br />
• industry and market conditions;<br />
• mergers and strategic alliances in the ferry industry;<br />
• changes in laws and regulations;<br />
• shortfalls in our and our competitors’ operating results from levels forecast by securities analysts;<br />
• announcements concerning us or our competitors;<br />
• global and regional economic conditions; and<br />
• the general state of securities markets.<br />
Many of these factors may be beyond our control.<br />
The Tallinn Stock Exchange has a relatively small market capitalization and is substantially less liquid than<br />
major European exchanges, which could adversely affect the ability of shareholders to sell the Shares.<br />
Application has been made to the Tallinn Stock Exchange for our Shares to be admitted to trading on the<br />
Tallinn Stock Exchange’s market for listed securities. However, we cannot provide any assurance that the Shares<br />
will be admitted to trading or that, following admission, an active trading market for the Shares will emerge,<br />
develop or be sustained after completion of the Offering. The average daily trading turnover on the Tallinn Stock<br />
Exchange from January 1, 2005 to October 31, 2005 was EEK 133.5 million. A total of 14 companies were listed<br />
on the Tallinn Stock Exchange as of October 31, 2005. As of October 31, 2005, the two largest companies in<br />
terms of market capitalization, Eesti Telekom and Merko Ehitus, represented approximately 60 percent of the<br />
Tallinn Stock Exchange’s aggregate market capitalization of approximately EEK 35.5 billion. Consequently, the<br />
Tallinn Stock Exchange is substantially less liquid and more volatile than established markets such as those in<br />
other countries with highly developed securities markets. The relatively small market capitalization and low<br />
liquidity of the Tallinn Stock Exchange may impair the ability of shareholders to sell the Shares on the Tallinn<br />
Stock Exchange, which could increase the volatility of the price of the Shares. The delisting of any of the large<br />
companies listed on the Tallinn Stock Exchange would be likely to have a negative effect on the market<br />
capitalization and liquidity of the Tallinn Stock Exchange.<br />
13
Future sales of the Shares could adversely affect the market price of the Shares.<br />
Immediately after the Offering, assuming that the Over-Allotment Option is not exercised in full,<br />
approximately 25.0 percent of the Shares will be held by investors in the Offering. If the Over-Allotment Option<br />
is exercised in full, approximately 27.5 percent of the Shares will be held by investors in the Offering. We may<br />
issue additional Shares at any time after the Offering, subject to the terms of the lock-up that we have agreed<br />
upon with the Managers. Sales of substantial amounts of Shares, or issuance of additional Shares after the expiry<br />
of the relevant lock-up periods, or the perception that such sales or issues could occur, could adversely affect<br />
prevailing market prices for the Shares. See “Plan of Distribution.”<br />
We cannot assure you that <strong>Tallink</strong> will pay any dividend on the Shares.<br />
There is no assurance that <strong>Tallink</strong> will pay dividends on the Shares, nor is there any assurance as to the<br />
amount of any dividend it might pay. The payment and the amount of any dividend will be subject to the<br />
discretion of <strong>Tallink</strong>’s management board, supervisory council and, ultimately, the general meeting of our<br />
shareholders and will depend on available cash balances, anticipated cash needs, our results of operations, our<br />
financial condition and any loan agreement restrictions binding us or our subsidiaries as well as other relevant<br />
factors. See “Dividends and Dividend Policy.”<br />
If securities or industry analysts do not continue to publish research or reports about our business, the price of<br />
the Shares and trading volume could decline.<br />
The trading market for the Shares will depend on the research and reports that industry or securities analysts<br />
may publish about us or our business. We do not have any control over these analysts. If one or more of the<br />
analysts who cover us downgrade their ratings of the Shares, the price of the Shares may decline. If one or more<br />
of these analysts cease coverage of our company or fail to publish regular reports on us, we could lose visibility<br />
in the financial markets, which in turn could cause the price of the Shares or trading volume to decline.<br />
It may not be possible for you to enforce U.S. judgments against us.<br />
<strong>Tallink</strong> is incorporated in Estonia. Council Regulation (EC) No 44/2001 on jurisdiction and the recognition<br />
and enforcement of judgments in civil and commercial matters sets forth a requirement that judgments of the<br />
courts of the member states of the European Union (except for Denmark) should be recognized and enforced in<br />
Estonia. However, Estonia is not a party to the Brussels Convention or the Lugano Convention on jurisdiction<br />
and the recognition and enforcement of judgments in civil and commercial matters. Therefore, recognition and<br />
enforcement in Estonia of judgments of all other foreign courts is regulated by the Estonian Code of Civil<br />
Procedure. Pursuant to Article 377(1) of the Code of Civil Procedure, judgments of foreign courts are recognized<br />
by Estonian courts in accordance with international treaties concluded by Estonia. Estonia has concluded<br />
international agreements on the recognition or enforcement of judgments of the relevant courts with the Russian<br />
Federation, Latvia, Lithuania, Poland and Ukraine. Currently, judgments of courts of jurisdictions not listed<br />
above are not enforceable in Estonia without re-litigation of the subject matter of such judgments on their merits.<br />
In addition, substantially all of our assets and the assets of our subsidiaries are located outside the United<br />
States. As a result, it may be difficult or impossible for you to serve process within the United States upon<br />
<strong>Tallink</strong>, or to enforce your judgment upon <strong>Tallink</strong> for civil liabilities in U.S. courts.<br />
14
The Offering<br />
TERMS AND CONDITIONS OF THE RETAIL OFFERING<br />
In the offering, a maximum of 34,090,909 ordinary shares of <strong>Tallink</strong> (“Shares”) are being offered to<br />
Estonian, Finnish and international institutional investors (“Institutional Offering”) and to the public in Estonia<br />
and Finland, including the employees and members of the supervisory council and management board of <strong>Tallink</strong><br />
and its subsidiaries (“Retail Offering” and, together with the Institutional Offering, “Offering”). The Offering is<br />
divided into an issue of 26,500,000 new Shares by <strong>Tallink</strong> (“New Shares”), and a sale of a maximum of<br />
7,590,909 existing Shares by certain existing shareholders of <strong>Tallink</strong> (“Selling Shareholders”) (“Sale Shares”<br />
and, together with the New Shares, “Offer Shares”). Certain Selling Shareholders have granted the managers of<br />
the Offering (“Managers”) an option to purchase up to an aggregate of 3,409,091 additional Shares at the Offer<br />
Price (as defined below) solely to cover over-allotments.<br />
The sizes of the Institutional Offering tranche and the Retail Offering tranche have not been pre-determined.<br />
The total amount of Offer Shares to be allocated as part of the Institutional Offering and the Retail Offering will<br />
be determined by <strong>Tallink</strong> in the allocation process after the Offer Period (as defined below) based on the demand<br />
for the Offer Shares by the different investor groups. Only New Shares will be offered in the Retail Offering.<br />
The issuance of New Shares will be decided by the general meeting of shareholders of <strong>Tallink</strong> on<br />
November 30, 2005. The notice calling the general meeting has been published on November 21, 2005 through<br />
Tallinn Stock Exchange and in the newspapers Eesti Päevaleht and Postimees. The management board of <strong>Tallink</strong><br />
will propose to the general meeting of shareholders to waive the pre-emptive right of shareholders to subscribe<br />
for the New Shares in order to extend the shareholder base of <strong>Tallink</strong>. The decisions of the general meeting will<br />
be published through Tallinn Stock Exchange not later than on December 1, 2005.<br />
These terms and conditions (“Terms”) relate only to the Retail Offering.<br />
<strong>Tallink</strong> expects to announce the Offer Price and the results of the Offering, including the total amount of<br />
Offer Shares allocated in the Institutional Offering and in the Retail Offering not later than on December 2, 2005<br />
through Tallinn Stock Exchange and on the website of <strong>Tallink</strong> and not later than December 5, 2005 in two daily<br />
newspapers, one circulated throughout Estonia and one circulated throughout Finland.<br />
Right to Participate in the Retail Offering<br />
The Retail Offering is directed to all natural and legal persons in Estonia and Finland who do not belong to<br />
the following categories of institutional or qualified investors:<br />
(a) credit institutions, investment firms, insurance companies, collective investment schemes and their<br />
management companies, pension funds and their management companies and other authorized or<br />
regulated financial institutions;<br />
(b) national, regional and local governments, central banks and international organisations;<br />
(c) natural persons and small and medium-sized enterprises who have been registered as qualified<br />
investors in the respective list maintained by the Estonian Financial Supervision Authority or in the list<br />
maintained by the Finnish Financial Supervision Authority; and<br />
(d) other persons who have confirmed to the Managers , in the course of the Institutional Offering, that<br />
they fall under the definition of a ”qualified investor” (“kutseline investor”) set forth in the Estonian<br />
Securities Market Act or the definition of a “qualified investor” (“kokenut sijoittaja”) set forth in the<br />
Finnish Securities Market Act.<br />
For the purpose of these Terms a person shall be deemed to be “in Estonia” if he has a securities account<br />
with Estonian Central Register of Securities (“ECRS”) and his address, according to the data in ECRS regarding<br />
his securities account, is in Estonia. A person shall be deemed to be “in Finland” if his permanent address is in<br />
Finland.<br />
Offer Period<br />
Investors may submit undertakings to subscribe for the Offer Shares (a “Subscription Undertaking”) starting<br />
at 9:00 a.m. on November 21, 2005 until 4:00 p.m. on December 1, 2005 (“Offer Period”).<br />
15
<strong>Tallink</strong> may at any time prior to the receipt by <strong>Tallink</strong> and Selling Shareholders of full payment for all Offer<br />
Shares cancel the Offering or any part thereof, if the underwriting agreement has not been entered into on or<br />
before December 2, 2005 or the obligations of the Underwriters under the underwriting agreement (a) have not<br />
become unconditional or (b) terminate prior to the settlement. In case of cancellation of the Offering, or any part<br />
thereof, <strong>Tallink</strong> shall make an announcement thereof through the Tallinn Stock Exchange. As of the moment of<br />
announcement all rights and obligations of the parties relating to the cancelled part of the Offering shall<br />
terminate.<br />
Offer Price<br />
The offer price shall be decided by the supervisory council of <strong>Tallink</strong> after the completion of the<br />
book-building process directed at institutional investors (“Offer Price”), in which the Offer Price shall be<br />
determined on the basis of tenders for the Offer Shares obtained from institutional investors, taking into<br />
consideration the total demand for the Offer Shares in the Institutional Offering, price sensitivity of the demand<br />
and quality of the demand. The Offer Price is expected to be between the price range of EEK 73.50 (EUR 4.70)<br />
and EEK 92.00 (EUR 5.88). The above price range may be amended until the end of the Offer Period on the basis<br />
of information obtained in the book-building process—see “Procedure for amending the price range.”<br />
The Offer Price in the Institutional Offering and the Retail Offering shall be the same.<br />
Subscription<br />
<strong>Tallink</strong> invites investors to submit Subscription Undertakings in accordance with these Terms. Subscription<br />
Undertakings may be submitted during the Offer Period. An investor may apply to subscribe for the Offer Shares<br />
only at the upper limit of the price range, i.e. at EEK 92.00 (EUR 5.88) per Share (“Subscription Price”).<br />
Possible multiple Subscription Undertakings submitted by the investor shall be merged for the purposes of<br />
allocation.<br />
An investor must ensure that the data in the Subscription Undertaking is correct, complete and readable. An<br />
uncompleted, incorrect or unclear Subscription Undertaking may be rejected.<br />
An investor may submit the Subscription Undertaking either personally or through a representative whom<br />
the investor has authorized (in the form required by law) to submit the Subscription Undertaking and make the<br />
relevant payments.<br />
By submitting a Subscription Undertaking an investor:<br />
• accepts these Terms and agrees with <strong>Tallink</strong> and Selling Shareholders on the application of them;<br />
• acknowledges that the Retail Offering does not constitute an offer (in Estonian: pakkumus) of Shares by<br />
<strong>Tallink</strong> or any Selling Shareholder and that the making of a Subscription Undertaking does not itself<br />
amount to subscription for the Offer Shares in legal terms nor entitle to subscribe for the Offer Shares<br />
nor result in the agreement for sale of Offer Shares, and that by submitting of a Subscription<br />
Undertaking an investor undertakes to acquire the Offer Shares to the maximum amount indicated in the<br />
Subscription Undertaking on these Terms;<br />
Investors in Estonia<br />
• authorizes and instructs the relevant custodian of the ECRS (“Custodian”) to forward the registered<br />
transaction instruction to the registrar of ECRS;<br />
• authorizes the Custodian and the registrar of ECRS (AS Eesti Väärtpaberikeskus) to amend the data in<br />
the investor’s transaction instruction regarding the amount of Offer Shares to be received, price per<br />
share and total transaction amount on the basis of the Offer Price and results of allocation.<br />
Investors in Finland<br />
• authorizes and instructs Nordea Bank Finland Plc (“Nordea Bank Finland”) to effect the allocation of<br />
the Offer Shares to the investor and to transfer them to the relevant nominee registered account at ECRS<br />
as instructed by the investor’s custodian.<br />
16
Payment<br />
Investors in Estonia<br />
By submitting a Subscription Undertaking, an investor authorizes and instructs the credit institution<br />
operating the investor’s cash account connected to his securities account (which may be also the Custodian itself)<br />
to block the transaction amount on such cash account until the completion of settlement on or about December 8,<br />
2005. The transaction amount shall equal the number of Shares covered by the Subscription Undertaking times<br />
the Subscription Price. An investor may submit a Subscription Undertaking only if there are sufficient funds on<br />
the cash account connected to his respective ECRS securities account to cover the transaction amount.<br />
Investors in Finland<br />
By submitting a Subscription Undertaking, an investor authorizes and instructs Nordea Bank Finland to<br />
debit the investors bank account by the transaction amount or undertakes to pay the transaction amount in cash.<br />
The payment of the transaction amount shall be effected when the Subscription Undertaking is submitted. The<br />
transaction amount shall equal the number of Shares covered by the Subscription Undertaking times the<br />
Subscription Price.<br />
Amendment or Cancellation of Subscription Undertakings<br />
An investor may amend or cancel a Subscription Undertaking until the end of the Offer Period. To do so the<br />
investor must contact the relevant custodian or subscription place through which the respective Subscription<br />
Undertaking has been made, and carry out the procedures required by the respective custodian or subscription<br />
place (the procedures for amending and annulling the Subscription Undertaking may differ between different<br />
custodians and subscription places). All fees payable as a result of an amendment and/or annulment of a<br />
Subscription Undertaking shall be payable by the investor according to the applicable price list of the custodian<br />
or the subscription place.<br />
Procedure for Amending the Offer Price Range<br />
If the offer price range is amended <strong>Tallink</strong> shall prepare a supplement to the offering memorandum which<br />
has to be approved by the competent authority. The supplement shall be published in the same way as the<br />
original offering memorandum was published. <strong>Tallink</strong> shall make an announcement thereof through the Tallinn<br />
Stock Exchange and on its website. Investors who have submitted Subscription Undertakings before the<br />
announcement may cancel their Subscription Undertakings within two working days after the announcement in<br />
accordance with the procedure described under previous caption. Should the offer price range be amended, also<br />
the total number of Offer Shares, the dates and other terms and conditions set forth herein may be changed. All<br />
such changes shall be announced together with the announcement of the amended price range. Investors who<br />
have not cancelled their Subscription Undertakings within the above-referred time period shall be deemed to<br />
have accepted all changes announced in accordance with above.<br />
Distribution and Allocation<br />
In the allocation, <strong>Tallink</strong> shall take into consideration only those Subscription Undertakings, which have<br />
been completed and submitted during the Offer Period in accordance with all the requirements set out in these<br />
Terms. All other Subscription Undertakings may be rejected.<br />
Offer Shares shall be allocated to investors using stepped allocation methodology. Under the stepped<br />
allocation methodology, <strong>Tallink</strong>, together with the Managers, will determine, after the Offer Period, one or more<br />
allocation levels (in number of Shares) and the allocation percentages applied to each level. The transaction<br />
amount in each Subscription Undertaking will be divided into different parts, e.g. part being below the first level<br />
(x percent of such part will be accepted), part being between the first and second level (y percent of such part will<br />
be accepted), part exceeding the second level (z percent of such part will be accepted) etc. The main criteria for<br />
the determination of the levels and allocation percentages are: (i) the total demand for the Offer Shares in the<br />
Retail Offering (ii) size of Subscription Undertakings in the Retail Offering and (iii) number of investors having<br />
submitted Subscription Undertakings in the Retail Offering.<br />
All Subscription Undertakings (made in accordance with the Terms) shall be fully accepted up to EEK<br />
23,469.90 (EUR 1,500) (which amount may be adjusted downwards to the closest amount which, if divided with<br />
the Offer Price, results in a whole number of Offer Shares).<br />
17
Each investor entitled to receive Offer Shares shall be allocated a whole number of Shares and, if necessary,<br />
the number of Shares to be allocated shall be rounded down to the closest whole number. Any remaining Offer<br />
Shares which cannot be allocated using the above-described process will be allocated to investors on random<br />
basis.<br />
<strong>Tallink</strong> shall decide on the allocation after the determination of the Offer Price after the Offer Period, no<br />
later than on December 2, 2005.<br />
Preferential Allocation to Employees<br />
The employees and members of the supervisory council and management board of <strong>Tallink</strong> and its<br />
subsidiaries (“Employee” or “Employees”) are granted a preferential allocation. The levels to be applied in<br />
allocation shall be higher than those to be applied to other investors. In all other respects the same terms and<br />
conditions shall apply to Employees as to the other investors in the Retail Offering.<br />
For the purposes of the above, an Employee means a person who, as at 8:00 a.m. on November 21, 2005,<br />
has a valid employment contract for an unspecified term with <strong>Tallink</strong> or any of its subsidiaries or is a member of<br />
the supervisory council or management board of <strong>Tallink</strong> or its subsidiary.<br />
Return of Funds<br />
Investors in Estonia<br />
If the Offer Price is lower than the Subscription Price, if the Offering is revoked, if the investor’s<br />
Subscription Undertaking is rejected or if the allocation deviates from the amount of Shares applied for, the funds<br />
blocked on the investor’s cash account, or the part thereof (the amount in excess of payment for the allocated<br />
Offer Shares) shall be released by the Custodian not later than on December 9, 2005. <strong>Tallink</strong> shall not be liable<br />
for the release of the respective amount and for the payment of interest on the released amount for the time it was<br />
blocked.<br />
Investors in Finland<br />
If the Offer Price is lower than the Subscription Price, if the Offering is revoked, if the investor’s<br />
Subscription Undertaking is rejected or if the allocation deviates from the amount of Shares applied for, the<br />
transaction amount paid upon submission of the Subscription Undertaking, or a part thereof (the amount in<br />
excess of payment for the allocated Offer Shares), shall be refunded to the investor who has given the<br />
Subscription Undertaking to his cash account in Finland not later than on December 7, 2005, or if the investor<br />
has his cash account with a Finnish credit institution other than Nordea Bank Finland, on or about December 9,<br />
2005. If a Subscription Undertaking is cancelled the amount paid upon submission of such Subscription<br />
Undertaking will be refunded no later than three banking days, or if the investor has his cash account with a<br />
Finnish credit institution other than Nordea Bank Finland, no later than five banking days after the cancellation.<br />
No interest shall be payable on the amount to be refunded.<br />
Settlement and Trading<br />
Offer Shares allocated to investors will be transferred to the securities accounts of Estonian investors on or<br />
about December 8, 2005 as described under the captions “Instructions to investors in Estonia” and to the bookentry<br />
accounts or custody accounts of Finnish investors on or about December 8, 2005 as described under the<br />
caption “Instructions to investors in Finland.”<br />
To facilitate the settlement, the Offer Shares to be transferred to investors (in the amount corresponding to<br />
the number of New Shares) will be temporarily borrowed from aktsiaselts Infortar.<br />
Trading in the Shares is expected to commence on the <strong>Tallink</strong> Stock Exchange on or about December 9,<br />
2005.<br />
Applicable Law and Dispute Resolution<br />
The Retail Offering shall be governed by the law of Estonia, except to the extent the rules of private<br />
international law applied by the competent court provide for the mandatory application of the laws of any other<br />
jurisdiction. Any disputes arising in connection with the Retail Offering shall be settled by Tallinn City Court,<br />
18
unless the exclusive jurisdiction of any other court is provided for by the provisions of law which can not be<br />
derogated from by an agreement of the parties.<br />
Share Acquisitions by the Members of Management Bodies<br />
See “Management—Management Holdings.”<br />
Over-Allotment and Over-Allotment Option<br />
See “Plan of Distribution.”<br />
Placing and Underwriting<br />
See “Plan of Distribution.”<br />
19
INSTRUCTIONS TO INVESTORS IN ESTONIA<br />
Submission of Subscription Undertakings<br />
In order to subscribe for the Offer Shares an investor must have a securities account with the ECRS. Such<br />
securities account may be opened through any Custodian of the ECRS. As at November 18, 2005, the following<br />
banks and investment firms operate as Custodians:<br />
• AS SEB Eesti Ühispank;<br />
• AS Hansapank;<br />
• Nordea Bank Finland Plc Estonian branch;<br />
• AS Sampo Pank;<br />
• AS Lõhmus Haavel & Viisemann;<br />
• AS Eesti Krediidipank;<br />
• AS SBM Pank;<br />
• Tallinna Äripanga AS; and<br />
• AS Parex banka (through its Estonian branch).<br />
An investor wishing to subscribe for the Offer Shares should contact the Custodian that operates his ECRS<br />
securities account and register a Subscription Undertaking for the purchase of securities in the form set out<br />
below. The Subscription Undertaking must be registered with the Custodian by the end of the Offer Period. The<br />
investor may use any method his Custodian offers to submit the Subscription Undertaking (e.g., through branch<br />
office, internet).<br />
Owner of the securities account: name of the investor<br />
Securities account: number of the investor’s securities account<br />
Custodian: name of the investor’s custodian<br />
Security: <strong>Tallink</strong> <strong>Grupp</strong> share<br />
ISIN code: EE3100004466<br />
Amount of securities: Transaction amount divided by the price (per share)<br />
Price (per share): Subscription Price<br />
Transaction amount: the amount (in money) for which the investor wishes<br />
to subscribe for the Offer Shares – must be divisible<br />
by the Subscription Price<br />
Counterparty: <strong>Aktsiaselts</strong> SEB Eesti Ühispank<br />
Securities account of counterparty: 99100675977<br />
Custodian of the counterparty: <strong>Aktsiaselts</strong> SEB Eesti Ühispank<br />
Value date of the transaction: December 8, 2005<br />
Type of transaction: “purchase”<br />
Type of settlement: “delivery against payment”<br />
An investor may submit a Subscription Undertaking through a nominee account only if he authorizes the<br />
owner of the nominee account to disclose his identity to the registrar of ECRS in writing.<br />
A Subscription Undertakings submitted through the nominee account shall be taken into consideration in the<br />
allocation only if the owner of the nominee account has actually disclosed the identity of the investor to the<br />
registrar of ECRS in writing.<br />
A Subscription Undertaking is deemed submitted from the moment the registrar of the ECRS receives a<br />
duly completed transaction instruction from the Custodian of the respective investor. The Subscription<br />
Undertaking is deemed annulled from the moment the transaction instruction of the respective investor has been<br />
annulled in the ECRS on the basis of the annulment order received from the Custodian of the investor.<br />
20
An investor shall be liable for the payment of all fees charged by the Custodian in connection with the<br />
submission of a Subscription Undertaking.<br />
An investor may obtain information about the amount of Offer Shares allocated to him as of December 8,<br />
2005 after the completion of settlement by submitting an inquiry to the Custodian operating his securities account<br />
in accordance with the terms and conditions established by the respective Custodian.<br />
Settlement Mechanism<br />
Offer Shares allocated to investors in Estonia will be transferred to their securities accounts on or about<br />
December 8, 2005 through the “delivery versus payment” method simultaneously with the transfer of payment<br />
for such Offer Shares.<br />
If an investor has submitted several Subscription Undertakings through several securities accounts<br />
belonging to him, the Offer Shares allocated to such investor are transferred to his securities accounts<br />
proportionally with the respective securities amounts set out in his Subscription Undertakings. The number of<br />
Offer Shares to be transferred to each securities account may be rounded up or down, as necessary, in order to<br />
ensure that a whole number of Offer Shares is transferred to each securities account. If the transfer cannot be<br />
completed due to lack of sufficient funds on the investor’s cash account, the Subscription Undertaking of the<br />
respective investor shall be rejected and the investor shall lose all rights to the Shares allocated to him.<br />
21
INSTRUCTIONS TO INVESTORS IN FINLAND<br />
Submission of Subscription Undertakings<br />
Investors in Finland wishing to subscribe for the Offer Shares can place their Subscription Undertakings<br />
through:<br />
• Nordea Bank Finland Plc’s asset management branches during their respective opening hours;<br />
• Nordea Private Banking;<br />
• Nordea Customer Service, Monday to Friday 8:00 a.m. to 8:00 p.m., tel. 0200 3000 in Finnish and tel.<br />
0200 5000 in Swedish (local network charge/ mobile call charge) with Solo codes; or<br />
• Nordea Netbank service on the Internet at www.nordea.fi (only Nordea clients with Solo codes).<br />
The submission of a Subscription Undertaking through Nordea Customer Service and Netbank requires a<br />
valid Solo agreement. Corporations cannot submit Subscription Undertakings through Nordea Customer Service<br />
or the Netbank. Calls with the Customer Service are recorded.<br />
When the Subscription Undertaking is being made at the asset management branches of Nordea Bank<br />
Finland, at the Nordea Private Bank units or at Private Wealth Management units, the payment is debited directly<br />
from the investor’s bank account at Nordea Bank Finland, or the investor makes the payment in cash. When<br />
making a Subscription Undertaking through Nordea Customer Service, or through Nordea Netbank the payment<br />
is made either by Solo codes or through the Nordea Netbank service.<br />
A Subscription Undertaking cannot be cancelled or amended through Nordea Bank Finland’s Netbank<br />
Service on the Internet.<br />
Nordea Bank Finland will on or about December 7, 2005 send confirmation notices to investors in Finland<br />
to whom Offer Shares have been allocated.<br />
An investor in Finland making a Subscription Undertaking shall have an agreement with a Finnish custodian<br />
or asset manager enabling the custody of foreign securities as nominee registered securities.<br />
No fees will be charged by Nordea Bank Finland from the investors in connection with the submission of a<br />
Subscription Undertaking. Account operators other than Nordea Bank Finland may charge fees from the<br />
investors for the receipt of foreign securities on the investors’ book-entry or custody account.<br />
Settlement and Custody of and Trading in the Offer Shares<br />
The Offer Shares allocated to investors in Finland will be transferred to the investor’s Finnish book-entry or<br />
custody account on or about December 8, 2005, unless otherwise instructed by a Finnish account operator other<br />
than Nordea Bank Finland. If an investor has submitted several Subscription Undertakings through several<br />
securities accounts belonging to him, the Offer Shares allocated to such investor are transferred to his book-entry<br />
or custody account through which he made a Subscription Undertaking with largest amount or to his book-entry<br />
or custody account at Managers’ choice if his Subscription Undertakings are of equal size.<br />
The Shares are registered in the Estonian book-entry system. The Offer Shares held by an investor in<br />
Finland are nominee registered and in custody at a foreign credit institution appointed by the investor’s Finnish<br />
custodian bank. Fees charged by Finnish custodians and asset managers for the custody of, trading in and receipt<br />
of foreign securities may differ from the fees payable for local securities. Investors in Finland are advised to<br />
consult their own custodian or asset managers as to the level of such fees.<br />
The Finnish custodian and asset manager will forward any information regarding the nominee registered<br />
securities received from the foreign custodian to the investor. The Finnish custodian or asset manager will<br />
assume no responsibility for the accuracy of such information or cannot assure that any information will be<br />
received on time.<br />
When trading in the Offer Shares the sale order shall be made through the Finnish custodian, asset manager<br />
or broker who effects the trades on the Tallinn Stock Exchange.<br />
22
Exercise of Shareholder Rights by Investors in Finland<br />
Dividends and Other Distributions<br />
The Finnish custodian or asset manager will arrange for the payment of dividends to the investor and will<br />
forward any information to the investor regarding the shareholding and requiring action by the investor when<br />
such information is received by the custodian or asset manager. The investor is responsible for giving<br />
instructions to the custodian or asset manager with regard to such required action. Under certain circumstances, if<br />
so agreed, the custodian or asset manager may, however, take action on behalf of the investor.<br />
All distributions and payments received by the Finnish custodian or asset manager on behalf of the investor<br />
will be credited to the investor’s cash account connected to his book-entry account, unless otherwise agreed. The<br />
payments will be recorded on the cash account no later than ten (10) banking days after the custodian or asset<br />
manager has received the notice of such payment and the funds are available at the bank account of the custodian<br />
or asset manager. All payments will be made in euros.<br />
Participation in Shareholders’ Meetings<br />
Finnish shareholders may not be able to exercise their right to participate in the general meetings of<br />
shareholders of <strong>Tallink</strong> either individually or through a Finnish custodian, unless such service is provided by the<br />
relevant custodian or asset manager. The custodian or asset manager may charge a fee for such services. When<br />
participating in the general meeting individually, Finnish shareholders must request their custodian to provide<br />
them with a written authorisation to represent the custodian in the general meeting. Although the shareholder acts<br />
in the general meetings as a representative of the custodian, the use of shareholder rights in the meeting is at the<br />
sole discretion of the shareholder. When participating in the general meetings through the Finnish custodian, the<br />
shareholder may give the custodian orders on the use of shareholder rights in the respective meeting.<br />
Taxation of Dividends<br />
See “Taxation—Finnish Tax Considerations.”<br />
23
USE OF PROCEEDS<br />
The aggregate net proceeds to us from the issuance of the New Shares in the Offering, after deduction of the<br />
fees and expenses payable by us, are estimated to amount to approximately EEK 2,097 million, based on the midpoint<br />
of the Offer Price range set forth on the cover of this offering memorandum. The fees and expenses,<br />
including underwriting commissions, incurred in connection with the Offering and payable by us are estimated to<br />
amount to approximately EEK 96 million (including applicable taxes). See “Plan of Distribution.”<br />
The aggregate net proceeds to be received by the Selling Shareholders, and any other shareholders whose<br />
Shares may be sold on their behalf by the Selling Shareholders, from the sale of the Sale Shares in the Offering,<br />
after deduction of the fees and expenses payable by the Selling Shareholders, are estimated to be approximately<br />
EEK 885 million, based on the mid-point of the Offer Price range and assuming that the Over-Allotment Option<br />
is exercised in full. The fees and expenses, including underwriting commissions, incurred in connection with the<br />
Offering and payable by the Selling Shareholders are estimated to amount to approximately EEK 25 million<br />
(including applicable taxes). We will not receive any portion of the proceeds from the sale of the Sale Shares by<br />
the Selling Shareholders.<br />
The net proceeds to be received by us from the Offering are expected to be used to repay indebtedness as it<br />
becomes payable in accordance with its terms and to strengthen our financial resources as part of our growth<br />
strategy involving our investment and fleet renewal program.<br />
CAPITALIZATION<br />
The table below sets forth our capitalization as of August 31, 2005 pursuant to IFRS, (i) on an actual basis,<br />
and (ii) as adjusted to give effect to the application of net proceeds to us of approximately EEK 2,097 million<br />
from the issuance of 26,500,000 New Shares as part of the Offering, based on the mid-point of the Offer Price<br />
range.<br />
This table should be read in conjunction with our consolidated financial statements contained in this<br />
offering memorandum.<br />
As of<br />
August 31, 2005<br />
Actual,<br />
audited<br />
As of<br />
August 31, 2005<br />
Adjusted,<br />
unaudited<br />
(EEK in millions)<br />
Cash and cash equivalents ...................................... 327 2,424<br />
Interest-bearing loans and borrowings payable in less than one year ..... 690 690<br />
Interest-bearing loans and borrowings payable in one year or more ...... 3,146 3,146<br />
Issuedcapital ................................................ 1,100 1,365<br />
Share premium ............................................... — 1,832<br />
Translation adjustment ........................................ — —<br />
Mandatory legal reserves ....................................... 28 28<br />
Retainedearnings............................................. 1,528 1,528<br />
Totalequity ................................................. 2,656 4,753<br />
Total capitalization1 ........................................... 5,802 7,899<br />
1 Excluding cash and cash equivalents as well as interest-bearing loans and borrowings payable in less than one year.<br />
24
BACKGROUND AND REASONS FOR THE OFFERING<br />
The purpose of the Offering is to obtain additional equity financing to implement our strategy, including our<br />
investment and fleet renewal program, to expand our shareholder base with both Estonian and Finnish retail<br />
investors and international institutional investors and to create an opportunity for the listing of our Shares on the<br />
Tallinn Stock Exchange. The public listing of the Shares will create a new source of capital to support our growth<br />
strategy and will enable their use as a means of payment in potential future acquisitions. By means of the<br />
offering, we further aim to increase our brand recognition among current and potential future customers.<br />
In the Offering, 26,500,000 New Shares will be offered by us. Approval of the Offering and the related<br />
share capital increase is scheduled to be taken by our general meeting of shareholders to be convened on<br />
November 30, 2005. Our management board will propose to the general meeting of shareholders to waive the<br />
pre-emptive rights of shareholders to subscribe for the new Shares. The decisions of the general meeting of<br />
shareholders will be published through the Tallinn Stock Exchange no later than on December 1, 2005.<br />
25
DIVIDENDS AND DIVIDEND POLICY<br />
The Offer Shares will be eligible for dividends and other distributions, if any, declared in respect of the<br />
financial year commenced September 1, 2005 and ending August 31, 2006, and for subsequent periods.<br />
We have not distributed any dividends for the financial years ended August 31, 2003, 2004 and 2005, but<br />
have invested all of our retained earnings in the growth of our business. We currently expect that this policy will<br />
also be applied in the foreseeable future. Thus, there can be no assurance that we will pay any dividends in the<br />
future.<br />
In addition, several of our loan agreements include a prohibition or restriction concerning the payment of<br />
dividends by us or by our subsidiaries without prior approval of the respective lenders. Several of our loan<br />
agreements also establish financial covenants that must be complied with throughout the term of such loan<br />
agreements. Our obligation to comply with such covenants may also hinder our ability to pay dividends. See also<br />
“Risk Factors—Risks Relating to Our Business—We are highly leveraged, and if we or any of our ship-owning<br />
subsidiaries default under any of our respective loan agreements, we could forfeit the rights to our vessels.”<br />
As to the tax considerations applicable to our dividends, see “Taxation—Estonian Tax Considerations—<br />
Dividends.” As to the procedure and regulatory restrictions relating to the payment of dividends, see<br />
“Description of Share Capital—Shareholder Rights—Dividends and Other Distributions.”<br />
26
EXCHANGE RATES<br />
The Estonian kroon has been pegged to the euro since January 1, 1999 at an official exchange rate of<br />
EEK 15.6466 per EUR 1.<br />
The tables below set forth, for the periods and dates indicated, the average, high, low and period-end<br />
reference rates as published by the Bank of Estonia (Estonian central bank) for U.S. dollar per euro and for<br />
U.S. dollar per Estonian kroon. The average rate has been calculated as an average of all daily rates.<br />
These rates are provided solely for the convenience of the reader and are not necessarily the rates used in the<br />
preparation of our financial statements. No representation is made that euro or Estonian kroons could have been<br />
converted into U.S. dollars at the rates shown or at any other rate for such periods or at such dates.<br />
Reference rates of U.S. dollars per euro<br />
Average High Low Period-End<br />
2000 .............................................. 0.924 1.036 0.830 0.930<br />
2001 .............................................. 0.896 0.954 0.839 0.884<br />
2002 .............................................. 0.945 1.048 0.860 1.048<br />
2003 .............................................. 1.131 1.261 1.036 1.261<br />
2004 .............................................. 1.244 1.364 1.180 1.364<br />
2005 (until October 31) ............................... 1.258 1.354 1.191 1.207<br />
Reference rates of U.S. dollars per Estonian kroon<br />
Average High Low Period-End<br />
2000 .............................................. 0.059 0.066 0.053 0.059<br />
2001 .............................................. 0.057 0.061 0.054 0.057<br />
2002 .............................................. 0.060 0.067 0.055 0.070<br />
2003 .............................................. 0.072 0.081 0.066 0.081<br />
2004 .............................................. 0.080 0.087 0.075 0.087<br />
2005 (until October 31) ............................... 0.080 0.087 0.076 0.077<br />
27
SELECTED FINANCIAL INFORMATION<br />
The tables below present certain selected consolidated financial information as of and for the financial<br />
years ended August 31, 2003, 2004 and 2005. This information has been derived from our audited consolidated<br />
financial statements included elsewhere in this offering memorandum. This information should be read in<br />
conjunction with, and is qualified in its entirety by reference to, such financial statements and the related notes.<br />
Our financial statements have been prepared in accordance with IFRS.<br />
The ratios and indicators set forth in the table below are provided to illustrate certain aspects of our<br />
business and financial performance. Certain of these ratios and indicators are used by our management to<br />
evaluate our performance, while others are provided for the benefit of investors considering an investment in the<br />
Offer Shares. Although certain of these ratios and indicators are not calculated in accordance with IFRS, we<br />
believe that the ratios and indicators set forth below are customary and often used by public companies to<br />
illustrate their business and financial performance.<br />
As of and for the financial year ended August 31,<br />
2003 2004 2005<br />
(EEK in millions, unless otherwise indicated)<br />
Income Statement<br />
Revenue ............................................ 2,996 3,406 4,063<br />
Costofsales ......................................... (2,133) (2,479) (2,980)<br />
Grossprofit ......................................... 863 928 1,083<br />
Marketing expenses ................................... (261) (351) (336)<br />
Administrative expenses ............................... (118) (128) (120)<br />
Other operating income ................................ 3 1 2<br />
Other operating expenses ............................... (6) (2) (1)<br />
Operating profit ...................................... 481 446 629<br />
Net financial items .................................... (100) (134) (159)<br />
Share of profit of associates ............................. 1 1 4<br />
Profit before income tax and minority interests .............. 382 313 474<br />
Income tax .......................................... 0.2 0.3 0.4<br />
Profit before minority interests .......................... 382 313 473<br />
Minority interests ..................................... — — 0.1<br />
Net profit for the financial year .......................... 382 313 473<br />
Balance Sheet<br />
Currentassets ........................................ 443 676 614<br />
Cash and cash equivalents .............................. 232 367 327<br />
Receivables and prepayments ........................... 152 219 198<br />
Non-current assets .................................... 4,107 6,232 6,313<br />
Totalassets.......................................... 4,549 6,908 6,927<br />
Current liabilities ..................................... 953 1,242 1,125<br />
Non-current liabilities ................................. 2,123 3,484 3,146<br />
Total liabilities ....................................... 3,076 4,726 4,271<br />
Equity ..............................................<br />
Cash Flow Statement<br />
1,473 2,182 2,656<br />
Cash flow from operating activities ....................... 842 804 891<br />
Cash flow used in investing activities ..................... (620) (2,386) (352)<br />
Cash flow from (used in) financing activities ...............<br />
Per Share Information<br />
(144) 1,717 (579)<br />
Adjusted weighted average number of shares (thousands) ..... 89,600 109,050 110,000<br />
Earnings per share (EPS), EEK ..........................<br />
Ratios and Indicators<br />
4.3 2.9 4.3<br />
EBITDA1 ...........................................<br />
EBITDA margin, %<br />
803 720 901<br />
2 ..................................<br />
Operating profit margin, %<br />
27 21 22<br />
3 ............................ 16 13 15<br />
Return on investment (ROI), % 4 .........................<br />
Return on assets (ROA), %<br />
12 9 10<br />
5 ............................<br />
Return on equity (ROE), %<br />
11 8 9<br />
6 ............................ 30 17 20<br />
Equity ratio, % 7 ...................................... 32 32 38<br />
Number of passengers, persons .......................... 2,597,917 2,828,364 3,274,177<br />
Number of ro-ro cargo units ............................. 94,945 103,425 131,349<br />
Number of personnel, average ........................... 1,921 2,371 2,710<br />
Footnotes on the following page.<br />
28
1 EBITDA = Earnings before net financial items, share of profit of associates, taxes, depreciation and amortization.<br />
EBITDA is here included as a supplemental item, because we believe that EBITDA, when considered<br />
in connection with cash flows from operating, investing and financing activities, may provide useful<br />
information. EBITDA is not a measure of operating performance calculated in accordance with IFRS<br />
and should not be considered as a substitute for operating profit, net income, cash flow from operations<br />
or other profit or loss or cash flow data determined in accordance with IFRS.<br />
2 EBITDA margin = EBITDA / Revenue. EBITDA margin measures the relationship between different measures of<br />
profitability and revenue providing information about a company’s profitability from the operations of<br />
its business and are independent of the company’s financing and tax position as well as depreciation<br />
related estimates.<br />
3 Operating profit margin = Operating profit / Revenue. Operating profit margin measures the relationship between different<br />
measures of profitability and revenue providing information about a company’s profitability from the<br />
operations of its business and are independent of both the company’s financing and tax position.<br />
4 Return on investment (ROI) = (Profit after net financial cost + Interest expense) / (Average total assets—Average interest free<br />
liabilities). Return on investment measures the relationship between profits and the investment required<br />
to generate them.<br />
5 Return on assets (ROA) = Operating profit / Average total assets. Return on assets compares income with total assets (i)<br />
measuring management’s ability and efficiency in using the firm’s assets to generate (operating) profits<br />
and (ii) reporting the total return accruing to all providers of capital (debt and equity), independent of<br />
the source of capital.<br />
6 Return on equity (ROE) = Net profit / Average equity. Return on equity excludes debt in the denominator and compares net<br />
income with total shareholders’ equity. It measures the rate of return on shareholders’ investment and<br />
is, therefore, useful in comparing the profitability of a company with its competitors.<br />
7 Equity ratio = Equity / Total assets. Equity ratio is a measure of financial leverage which highlights the ratio of<br />
shareholders’ equity to total assets. The analysis of a company’s financial leverage (or capital<br />
structure) is essential to evaluate its long-term risk and return prospects.<br />
29
OPERATING AND FINANCIAL REVIEW AND PROSPECTS<br />
The following discussion and analysis of our results of operations and financial condition should be read in<br />
conjunction with our audited consolidated financial statements included elsewhere in this offering memorandum.<br />
The discussion includes forward-looking statements which involve risks and uncertainties. You should review the<br />
“Risk Factors” and “Forward-Looking Statements” set forth elsewhere in this offering memorandum for a<br />
discussion of important factors that could cause actual results to differ materially from the results described in<br />
or implied by the forward-looking statements contained herein. Our audited consolidated financial statements<br />
have been prepared in accordance with IFRS.<br />
Overview<br />
We are a leading provider of high-quality mini-cruise and passenger transport services in the Northern<br />
<strong>Baltic</strong> Sea region as well as a leading provider of ro-ro cargo services on selected routes. We own and operate<br />
passenger ferries, including cruise ferries and high-speed ferries, and ro-ro cargo vessels on routes between<br />
Finland and Estonia and between Sweden and Estonia. Our current routes are between Helsinki and Tallinn,<br />
between Stockholm and Tallinn, and between Kapellskär and Paldiski. We are the current market leader on the<br />
Helsinki—Tallinn route and the only provider of daily passenger and ro-ro cargo traffic services on the routes<br />
between Sweden and Estonia. Altogether, we transported more than 3.2 million passengers and approximately<br />
130,000 ro-ro cargo units in the financial year ended August 31, 2005, an increase of 16 percent and 27 percent,<br />
respectively, compared to the previous financial year. In May 2004, we broadened our product offering through<br />
the introduction of the 350-room Hotell <strong>Tallink</strong> that we operate in the principal tourist area of Tallinn. In<br />
addition, we have entered into a letter of intent for the operation of a new conference and spa hotel close to the<br />
center of Tallinn. See “Business—Related Party Transactions.” This hotel is intended to commence operations in<br />
late 2006.<br />
Our current fleet consists of:<br />
• Six cruise ferries. Our cruise ferries currently serve on routes between Finland and Estonia and between<br />
Sweden and Estonia. In addition to providing passenger, car and ro-ro cargo transport, our newer cruise<br />
ferries provide a higher standard of accommodation and more extensive dining, shopping and<br />
entertainment offerings than other cruise or high-speed ferries on our routes, providing passengers with<br />
an enhanced mini-cruise experience.<br />
• Four high-speed ferries. Our current high-speed ferries provide a high-speed link between Helsinki and<br />
Tallinn, covering the journey of approximately 80 kilometers in just over one and a half hours, which is<br />
approximately half the time required by conventional ferries. The high-speed ferries transport both<br />
passengers and cars.<br />
• Two ro-ro cargo vessels. These vessels are used for ro-ro cargo transportation with only limited<br />
passenger capacity and currently serve on routes between Finland and Estonia and between Sweden and<br />
Estonia.<br />
Our primary business segments are geographical segments based on routes operated and our mainland<br />
business. During the financial year ended August 31, 2005, the composition of our revenue by geographic<br />
segment was as follows: Finland—Estonia traffic: 60 percent; Sweden—Estonia traffic: 34 percent; and other<br />
routes and mainland business: six percent. Our secondary segments are operational segments. During the<br />
financial year ended August 31, 2005, the composition of our revenue by operational segment was as follows:<br />
onboard and onshore restaurant and shop sales: 47 percent; ticket sales: 25 percent; sales of cargo transport: 18<br />
percent; accommodation sales: two percent; and other sales, such as charter fees and sales of travel packages:<br />
eight percent.<br />
The discussion below reflects our results of operations for the financial years ended August 31, 2003, 2004<br />
and 2005. Our results of operations for these periods reflect a number of important developments, including<br />
macroeconomic events relating to the strong development of the <strong>Baltic</strong> countries generally and Estonia’s<br />
accession to the European Union and, in particular, a number of changes to the composition of our fleet and our<br />
expansion into the mainland hotel business in Tallinn.<br />
Historically, the sale of tax-free goods was one of the principal drivers for our business. However, following<br />
the accession of Estonia to the European Union, our onboard shop sales are no longer exempt from tax, except<br />
for shop sales onboard vessels routed through the Finnish province of Åland, which has maintained its tax-free<br />
30
status under the EU regulatory framework. The onboard prices that we offer our customers, which follow<br />
Estonian mainland price developments, have been maintained at approximately the same level as former tax-free<br />
prices. The abolition of the tax-free status had an initial negative impact on passenger traffic and margins. On the<br />
other hand, the accession of the <strong>Baltic</strong> countries to the European Union and the positive development of all the<br />
<strong>Baltic</strong> economies have led to an increased level of passenger and cargo traffic throughout the region.<br />
Our results of operations for the periods discussed herein were also driven by our ongoing investment and<br />
fleet renewal program and changes in the routes operated. Our investment and fleet renewal program initiated in<br />
2000 has continued in recent financial years with the acquisitions of new high-speed ferries, the ro-ro cargo<br />
vessel Regal Star and, more importantly, with the deliveries of our modern cruise ferries Romantika in 2002 and<br />
Victoria I in 2004, representing the most significant investments in our history. We believe that Romantika and<br />
Victoria I have attracted a broader customer base as they offer new higher quality facilities. Both vessels have<br />
contributed to our increased profitability through a combination of increased sales and lower costs per passenger.<br />
We believe that continued investment in new vessels and upgrades to existing vessels are critical to our<br />
ability to maintain market leadership and further expand our business. Therefore, our investment and fleet<br />
renewal program is set to continue with the delivery of the New Cruise Ferry during the spring of 2006. In<br />
comparison with its predecessors Romantika and Victoria I, the New Cruise Ferry is larger and has more highclass<br />
cabin space, larger shopping and conference areas with the latest equipment as well as a wider selection of<br />
restaurants and bars. The New Cruise Ferry will replace Romantika on the Helsinki—Tallinn route. The<br />
subsequent redeployment of Romantika alongside Victoria I on the Stockholm—Tallinn route will improve our<br />
high-quality offering on that route, allowing us to provide a uniformly high-quality mini-cruise product, with<br />
daily departures, from Stockholm and Tallinn. As a result of the delivery of the New Cruise Ferry and the end of<br />
the nine-month chartering agreement with Algerie Ferries, the cruise ferries Regina <strong>Baltic</strong>a and Fantaasia will<br />
become available for traffic elsewhere. We are currently considering whether to introduce new routes or pursue<br />
other business opportunities in the near- to medium-term. See “Business—Routes Operated.”<br />
In addition, we have placed orders for two new high-speed ro-pax ferries intended to improve our highspeed<br />
service between Helsinki and Tallinn from 2007 and 2008. The new high-speed ro-pax ferries ordered in<br />
August 2005 are designed to combine the best features of a traditional cruise ferry and a high-speed ferry. Such<br />
features include high speed, ice-class for year-round operations, expanded facilities for onboard dining and<br />
shopping, and space for ro-ro cargo transport. The new high-speed ro-pax ferries are intended to increase highspeed<br />
capacity on the Helsinki—Tallinn route. We believe that the new high-speed ro-pax ferries will enable us<br />
to provide additional possibilities for quick transport of ro-ro cargo. In addition, we have made a decision to start<br />
operating a second hotel close to the center of Tallinn. The Tallinn city conference and spa hotel is expected to<br />
open in late 2006.<br />
Recent Developments and Outlook<br />
In the financial year ended August 31, 2005, we achieved increased efficiency in our operations. Despite the<br />
abolition of tax-free shop sales on the Helsinki—Tallinn route from May 2004, we have been able to operate<br />
profitably and were again successful in improving both our revenue and profitability compared to the previous<br />
financial year.<br />
Since August 31, 2005, there have been no significant changes to our financial position. In September and<br />
October 2005, passenger numbers on the Helsinki—Tallinn and the Sweden—Estonia routes decreased slightly<br />
compared to the same period in 2004. We believe that this development is temporary and primarily explained by<br />
the relatively high passenger numbers in September and October 2004 resulting from our successful 15 th<br />
anniversary marketing campaign. We nevertheless currently expect overall passenger numbers in the current<br />
financial year to increase from the previous financial year. We further believe that the expected launch of the<br />
New Cruise Ferry in the spring of 2006, and the consequent redeployment of Romantika alongside her sister<br />
vessel Victoria I on the Stockholm—Tallinn route, will assist us in reaching the targeted continued growth and<br />
improved efficiency particularly in the medium- to long-term. Accordingly, we expect both our passenger<br />
numbers and revenue to grow in the current financial year, irrespective of the moderate decrease in passenger<br />
numbers in September and October. However, there can be no assurance that our revenue will, in fact, increase.<br />
For a discussion of risks, including changes in passenger and cargo volumes, relating to our future performance,<br />
see “Risk Factors” and “Forward-Looking Statements.”<br />
The continued increase in oil prices during the past year has further increased our fuel costs. We expect that<br />
oil prices will continue to remain at their current high level during the first half of the current financial year. In<br />
31
addition, recent salary increases and certain start-up costs relating to the New Cruise Ferry are expected to<br />
increase our overall operating costs during the current financial year. We also expect to incur additional interest<br />
payments on the loan obtained to finance the New Cruise Ferry, which will decrease our net profits. As a result,<br />
while we do not currently expect any significant changes to our cost structure in the near term, we expect that our<br />
total costs for the current financial year will grow compared to the financial year ended August 31, 2005.<br />
Given that our current high-speed ferries use gasoil, a relatively expensive type of fuel, and only provide<br />
limited onboard shopping and dining facilities, they were not profitable at the segment result level in the financial<br />
year ended August 31, 2005. All of our profits from vessel operations on the Helsinki—Tallinn route for the<br />
financial year ended August 31, 2005 were derived from our cruise ferry and cargo operations. Revenue<br />
generated by our four high-speed ferries only accounted for approximately 19 percent of our total vessel revenue<br />
on that route. At the same time, our cruise ferries have demonstrated increased profitability and cost efficiency at<br />
operating profit level through lower costs and increased spend per passenger. Romantika, Meloodia I and Kapella<br />
accounted for 81 percent of our total vessel revenue and all of our operating profits from vessel operations on the<br />
Helsinki—Tallinn route in the financial year ended August 31, 2005. We expect that the planned introduction of<br />
our new high-speed ro-pax ferries ordered in August 2005 will improve the operating margin of our high-speed<br />
ferry operations.<br />
Factors Affecting Results of Operations<br />
Described below are certain factors that may be helpful in understanding our results of operations.<br />
Our main revenue sources are passenger ticket sales (including fees for cabins, private car transport and use<br />
of conference facilities), sales of cargo transport and onboard sales (including sales in onboard shops, bars and<br />
restaurants). Our level of revenue primarily depends upon (i) volumes of passenger and cargo traffic, (ii) onboard<br />
expenditure by passengers and (iii) pricing. Our revenue is also affected by seasonality.<br />
Passenger and Cargo Traffic Volumes. Passenger traffic is affected by a number of factors, including<br />
macroeconomic conditions, our ability to attract and maintain a loyal customer base and competition. We believe<br />
that our newer, improved vessels will be an important asset in expanding our customer base to include a broader<br />
range of customers and in increasing the popularity of our mini-cruises. The impact of macroeconomic factors<br />
may vary. For example, an increase in gross domestic product (“GDP”) in the region would be expected to<br />
increase customer spending in general. Furthermore, a reduction in GDP in the Nordic and <strong>Baltic</strong> economies<br />
could also result in an increase to our passenger traffic in circumstances where customers opt for a mini-cruise<br />
and aim to benefit from its lower price level instead of taking a more expensive vacation abroad.<br />
Cargo traffic in the Northern <strong>Baltic</strong> Sea region is strongly affected by macroeconomic developments and<br />
especially by the growth of the surrounding economies. In addition, the development of close business and<br />
governmental relations among the <strong>Baltic</strong> and Nordic countries as well as Russia has a significant effect on cargo<br />
traffic in the area. Estonia’s accession to the European Union, the consequent removal of customs and the<br />
increased use of the Via <strong>Baltic</strong>a highway connecting Central and Northern Europe have been the latest<br />
developments to have a positive impact on cargo volumes.<br />
Onboard Consumption. Our operating profit is influenced to a significant extent by the levels of onboard<br />
consumption. Onboard consumption is driven by consumer habits and preferences and macroeconomic<br />
conditions, such as the level of disposable income. Our newer vessels have expanded onboard space for<br />
shopping, dining and recreation, which provides for a wider range of services and which we believe encourages<br />
higher onboard consumption.<br />
Pricing. Competition for passengers in our markets is intense, and historically we have had a limited ability<br />
to increase revenue by raising ticket prices. While improved vessels with high-quality amenities may provide us<br />
with additional pricing power, overall market capacity and competitive service offerings will continue to affect<br />
our pricing policies. In addition, an important feature of our customer offering is the use of various campaigns<br />
with discounted prices on tickets and goods sold onboard. The relative level of excise taxes affects the relative<br />
attractiveness of the products we offer onboard as compared to prices available onshore.<br />
Cost Structure. A major component of our total cost base is the cost of sales, representing approximately<br />
83 percent of our total cost base in the financial year ended August 31, 2005. Other components of our total cost<br />
base are onshore costs, representing 12 percent of our total cost base, and financial expenses, representing five<br />
percent of our total cost base in the financial year ended August 31, 2005. The cost of sales can be sub-divided<br />
32
into the following principal components: cost of goods sold (representing 24 percent of our total cost base in the<br />
financial year ended August 31, 2005), port charges (15 percent), fuel costs (11 percent) and onboard staff costs<br />
(11 percent). In 2004, the cost of inventory increased and margins decreased as a result of Estonia’s accession to<br />
the European Union and the consequent removal of tax-free shop sales on the Helsinki—Tallinn route. Our<br />
onboard price levels currently follow the price development in onshore shops in Estonia. Our fuel costs are<br />
subject to volatility in oil prices, despite the fact that we purchase our fuel tax-free in Estonia. We currently pass<br />
a portion of the recent increase in oil price on to our customers through a specific fuel surcharge. Furthermore,<br />
our high-speed ro-pax ferries ordered in August 2005 will be more fuel efficient than our existing high-speed<br />
ferries.<br />
We generally benefit from lower Estonian salary levels compared to, for example, Finland or Sweden. In<br />
August 2005, we renewed our agreement with the Estonian Seamen’s Independent Union concerning salary<br />
increases for onboard staff for another three years. Pursuant to the agreement the annual employee salary<br />
increase is five percent. See “Business—Employees and Labor Relations.”<br />
As regards financial expenses, we incur significant interest costs associated with the financing of our<br />
vessels. Approximately 92 percent of our outstanding indebtedness is issued at floating rates and, accordingly,<br />
our results are affected by changes in interest rates payable under the loan agreements.<br />
Seasonality. Passenger traffic on our routes is seasonal, with peaks in passenger numbers typically in the<br />
summer months of June, July and August. Furthermore, our high-speed ferries are out of service during parts of<br />
the winter season, although we will be able to operate the new high-speed ro-pax ferries throughout the winter<br />
season starting from late 2007. As a result of the seasonal nature of our operations, our profitability and cash<br />
flows also fluctuate on a seasonal and, thus, quarterly basis.<br />
The table below illustrates the seasonality of our passenger and cargo traffic during the financial years<br />
ended August 31, 2003, 2004 and 2005.<br />
Financial<br />
year Passengers 1 Ro-ro cargo units<br />
Sep-Nov Dec-Feb Mar-May Jun-Aug Total Sep-Nov Dec-Feb Mar-May Jun-Aug Total<br />
2003 .... 624,211 458,464 635,642 879,600 2,597,917 26,367 19,870 24,395 24,313 94,945<br />
2004 .... 617,392 480,040 641,915 1,089,017 2,828,364 26,502 21,449 27,944 27,530 103,425<br />
2005 .... 840,340 627,537 775,934 1,030,366 3,274,177 32,752 29,199 34,574 34,824 131,349<br />
1 A single passenger taking a round-trip is accounted for as two passengers for the purpose of this table.<br />
Results of Operations<br />
Our main operational segments are passenger ticket sales, restaurant and shop sales and sales of cargo<br />
transport. The table below summarizes our historical results of operations for the past three financial years. The<br />
adjusted column for the financial year ended August 31, 2003 has been added to facilitate comparability between<br />
the financial year ended August 31, 2003 and the financial year ended August 31, 2004 due to changes in our<br />
operating segments during 2003.<br />
For the financial year ended August 31,<br />
2003 2003 (adj.) 1 2004 2005<br />
audited unaudited audited audited<br />
(EEK in millions)<br />
Revenue .................................................... 2,996 2,996 3,406 4,063<br />
Ticket sales .................................................. 827 733 880 1,019<br />
Restaurantandshopsales ....................................... 1,494 1,494 1,665 1,912<br />
Salesofcargotransport ........................................ 579 579 609 722<br />
Travel packages2 ............................................. — 146 169 163<br />
Other3 ...................................................... 95 44 83 247<br />
Costofsales ................................................. (2,133) (2,133) (2,479) (2,980)<br />
Gross profit ................................................. 863 863 928 1,083<br />
Marketing and administrative expenses ............................ (379) (379) (479) (456)<br />
Other operating income ........................................ 3 3 1 2<br />
Other operating expenses ....................................... (6) (6) (2) (1)<br />
Operating profit ............................................. 481 481 446 629<br />
1 The following adjustments have been made to the audited 2003 financial year figures: all sales relating to travel packages have been<br />
included in “Travel packages” instead of “Ticket sales” and “Other,” and onboard cabin sales have been included in “Ticket sales”<br />
instead of “Other.”<br />
2 The full price for travel packages is recorded as revenue rather than just the commissions received from customers.<br />
3 Includes hotel accommodation sales and charter fees.<br />
33
The table below summarizes the breakdown of our revenue and segment results distributed among our main<br />
geographical segments for the financial years ended August 31, 2003, 2004 and 2005:<br />
Revenue1 Gross profit / Segment result2 For the financial year ended August 31,<br />
2003 2004 2005 2003 2004 2005<br />
(EEK in millions)<br />
Finland—Estonia ................................... 2,0532,0832,442524 415 372<br />
Sweden—Estonia ................................... 943 1,2321,392 78 204 327<br />
Mainlandbusiness .................................. — 40 88 — 9 50<br />
Others............................................ — 51 141 — (52) (2)<br />
Total ............................................. 2,9963,4064,063602 576 747<br />
1 Revenue from external customers.<br />
2 Segment result is the segment gross profit less any segment related marketing expenses. Expenses not related to a specific segment are<br />
recorded as unallocated expenses.<br />
Financial Year Ended August 31, 2005 Compared to Financial Year Ended August 31, 2004<br />
Revenue. Our revenue consisted of ticket sales (25 percent of revenue in the 2005 financial year compared<br />
to 26 percent in the 2004 financial year), restaurant and shop sales onboard and on mainland (47 percent in the<br />
2005 financial year compared to 49 percent in the 2004 financial year), sales of cargo transport (18 percent in<br />
both the 2005 financial year and the 2004 financial year), sales of travel packages (four percent in the 2005<br />
financial year compared to five percent in the 2004 financial year) and other income, principally income derived<br />
from hotel accommodation sales and charter fees (six percent in the 2005 financial year compared to two percent<br />
in the 2004 financial year).<br />
Our revenue in the 2005 financial year totaled EEK 4,063 million, an increase of EEK 657 million, or 19<br />
percent, from EEK 3,406 million in the 2004 financial year. The growth was primarily due to increases in our<br />
passenger and cargo volumes, 16 and 27 percent, respectively. These increases were due to increased tourism to<br />
Estonia and the inclusion of Victoria I on the Stockholm—Tallinn route for its first full financial year as well as<br />
consequently increased onboard sales. In addition, <strong>Tallink</strong> AutoExpress 4 and Hotell <strong>Tallink</strong> were operative for<br />
their first full season and financial year, respectively.<br />
Our revenue from the Finland—Estonia route increased to EEK 2,442 million in the 2005 financial year<br />
from EEK 2,083 million in the 2004 financial year, reflecting in particular an overall growth in volumes. Our<br />
revenue from the Sweden—Estonia routes increased to EEK 1,392 million in the 2005 financial year from EEK<br />
1,232 million in the 2004 financial year. This increase was due to growth in passenger volumes and increased<br />
spend per passenger. Revenues from our mainland operations increased to EEK 88 million in the 2005 financial<br />
year from EEK 40 million in the 2004 financial year, reflecting in particular the revenue from the operation of<br />
Hotell <strong>Tallink</strong> for its first full financial year.<br />
Cost of Sales. Our cost of sales consisted of cost of goods sold (24 percent of total cost base in both the 2005<br />
financial year and the 2004 financial year), port charges (15 percent in the 2005 financial year compared to 16<br />
percent in the 2004 financial year), onboard staff costs (11 percent in the 2005 financial year compared to 12<br />
percent in the 2004 financial year), fuel costs (11 percent in the 2005 financial year compared to nine percent in<br />
the 2004 financial year), depreciation and other costs (consisting principally of maintenance and insurance cost,<br />
cost for servicing our vessels and cost relating to travel packages). The cost of sales in the 2005 financial year<br />
totaled EEK 2,980 million (73 percent of revenue) compared to EEK 2,479 million (73 percent of revenue) in the<br />
2004 financial year, representing an increase of EEK 501 million, or 20 percent. The increase was primarily due<br />
to the growth in sales volumes, increased costs for goods acquired as a result of the removal of their tax-free<br />
status, and an increase in fuel costs.<br />
Gross Profit and Segment Result. Our gross profit amounted to EEK 1,083 million (or approximately 27<br />
percent of revenue) in the 2005 financial year compared with EEK 928 million (or approximately 27 percent of<br />
revenue) in the 2004 financial year. The increase of EEK 155 million in the 2005 financial year is primarily<br />
explained by the increase in passenger volumes partly offset by the increase in cost of sales. Furthermore, the<br />
inclusion of Victoria I, which provides a relatively higher gross profit margin than Regina <strong>Baltic</strong>a operating on<br />
the Sweden—Estonia route, and the inclusion of the first full year of operations of our ro-ro cargo vessel Regal<br />
Star also contributed to the increase. In addition, the gross profit change reflected the profit derived from the<br />
operation of Hotell <strong>Tallink</strong> for its first full financial year. Our high-speed ferries were unprofitable and made a<br />
loss of EEK 55 million in the 2005 financial year.<br />
34
Following the planned introduction of our high-speed ro-pax ferries in 2007 and 2008, we expect that our<br />
high-speed ferry operations as a whole will become profitable. The segment result (i.e., gross profit of segment<br />
less any segment related marketing expenses) from our Finland—Estonia route shows a decrease to EEK<br />
372 million in the 2005 financial year from EEK 415 million in the 2004 financial year. The segment result from<br />
our Sweden—Estonia routes increased to EEK 327 million in the 2005 financial year from EEK 204 million in<br />
the 2004 financial year. The segment result breakdown is calculated on a group company basis and is not based<br />
solely on the vessels’ direct geographical operations. Therefore, the allocation of the expenses between the<br />
segments reported in our financial statements does not fully reflect the vessels’ geographical operations.<br />
The unaudited segment result based on revenue and the vessels’ direct geographical expenses on the<br />
Finland—Estonia route was EEK 422 million in the 2005 financial year compared to EEK 377 million in the<br />
2004 financial year. This 12 percent increase was due to growth in revenue from this route (17 percent) partly<br />
offset by increases in cost of goods sold and in fuel cost. The unaudited segment result based on revenue and the<br />
vessels’ direct geographical expenses on the Sweden—Estonia route was EEK 272 million in the 2005 financial<br />
year, an increase of 14 percent compared to EEK 238 million in the 2004 financial year. The main driver for this<br />
increase was the impact of the inclusion of the first full year of operation of Victoria I.<br />
Marketing and Administrative Expenses. Our marketing expenses consist of advertising expenses,<br />
depreciation, staff costs and other costs (principally administrative and overhead expenses). Marketing expenses<br />
in the 2005 financial year totaled EEK 336 million, or eight percent of revenue, compared to EEK 351 million, or<br />
ten percent of revenue, in the 2004 financial year. In the 2004 financial year, marketing expenses as a percentage<br />
of revenue were higher due to the extensive marketing campaign related to the launch of Victoria I, the<br />
introduction of the Helsinki—Tallinn—St. Petersburg route (discontinued at the beginning of 2005) and the<br />
opening of Hotell <strong>Tallink</strong>. We expect our marketing expenses to increase in the near term as a result of the<br />
planned introductions of the New Cruise Ferry and the two high-speed ro-pax ferries.<br />
Our administrative expenses consist of depreciation, staff costs and other costs (principally administrative<br />
and overhead expenses). Administrative expenses in the 2005 financial year totaled EEK 120 million, or<br />
approximately three percent of revenue, compared to EEK 128 million, or approximately four percent of revenue,<br />
in the 2004 financial year. Changes in applicable amortization rules of goodwill reduced depreciation in the 2005<br />
financial year by approximately EEK 21 million.<br />
Other Operating Income and Other Operating Expenses. Our other operating income consists of gain on<br />
disposal of property, plant and equipment, exchange rate differences and penalties received from suppliers. Other<br />
operating income increased to EEK 2 million in the 2005 financial year from EEK 1 million in the 2004 financial<br />
year. Our other operating expenses consisted of loss on disposal of property, plant and equipment, exchange rate<br />
differences and penalties paid to suppliers. Other operating expenses decreased to EEK 1 million in the 2005<br />
financial year from EEK 2 million in the 2004 financial year.<br />
Operating Profit. Our operating profit consists of the sum of our segment result net of unallocated expenses.<br />
Operating profit totaled EEK 629 million (15 percent of revenue) in the 2005 financial year, an increase of EEK<br />
183 million, or 41 percent, from EEK 446 million (13 percent of revenue) in the 2004 financial year. This<br />
increase primarily reflected the overall increase in passenger and cargo volumes and revenue mostly as a result of<br />
the introduction of our new vessel Victoria I and the commencement of the operations of Hotell <strong>Tallink</strong>.<br />
Net Financial Items. Our net financial expenses consist of interest and other financial expenses and our<br />
foreign exchange losses, net of interest and other financial income and foreign exchange gains. Net financial<br />
expenses increased to EEK 159 million (four percent of revenue) in the 2005 financial year, an increase of 18<br />
percent, from EEK 134 million (four percent of revenue) in the 2004 financial year. This increase was primarily<br />
due to interest payable on additional loan financing relating to our new investments, including loans relating to<br />
the acquisitions of Victoria I, Regal Star and <strong>Tallink</strong> AutoExpresses 3 and 4.<br />
Profit Before Income Taxes. Our profit before income taxes consists of our operating profit and the income<br />
from HT Valuuta (an associated company until August 30, 2005), net of financial expenses. Profit before income<br />
taxes in the 2005 financial year was EEK 474 million, an increase of EEK 161 million, or 51 percent, compared<br />
to EEK 313 million in the 2004 financial year. The increase was primarily due to an increase in passenger and<br />
cargo volumes, operating and marketing cost efficiency and decreases in interest rates on our loan facilities.<br />
35
Net Profit. Net profit in the 2005 financial year was EEK 473 million (12 percent of revenue), compared to<br />
EEK 313 million (nine percent of revenue) in the 2004 financial year. As a result of current Estonian tax laws,<br />
under which income tax is not charged on the profits when accrued but deferred until profits are distributed, we<br />
did not pay Estonian income tax on our profit for either the 2005 financial year or the 2004 financial year.<br />
Financial Year Ended August 31, 2004 Compared to Financial Year Ended August 31, 2003<br />
Revenue. Our revenue consisted of ticket sales (26 percent of revenue in the 2004 financial year compared<br />
to 24 percent (as adjusted) in the 2003 financial year), restaurant and shop sales onboard and on mainland<br />
(49 percent in the 2004 financial year and 50 percent in the 2003 financial year), sales of cargo transport<br />
(18 percent in the 2004 financial year compared to 19 percent in the 2003 financial year), sales of travel packages<br />
(five percent in both the 2004 financial year and the 2003 financial year) and other income (two percent in the<br />
2004 financial year compared to two percent (as adjusted) in the 2003 financial year).<br />
Our revenue in the 2004 financial year totaled EEK 3,406 million, an increase of EEK 410 million, or<br />
14 percent, from EEK 2,996 million in the 2003 financial year. This increase was primarily due to an increase in<br />
passenger volumes and consequent increases in both ticket sales and onboard consumption. The increase<br />
reflected in particular the inclusion of Victoria I during the last four months of the 2004 financial year, the launch<br />
of our Helsinki—Tallinn—St. Petersburg route (discontinued in the beginning of 2005) and the operation of<br />
Hotell <strong>Tallink</strong> during the last three months of the 2004 financial year. The results for our operational segments<br />
“Ticket sales” and “Other” for 2003 used above represent unaudited, adjusted financial information prepared to<br />
facilitate the comparison with the 2004 financial year. Based on the audited financial statements for the 2003<br />
financial year, ticket sales accounted for 28 percent of revenue, and other sales accounted for three percent of<br />
revenue.<br />
Our revenue from the Finland—Estonia route increased slightly to EEK 2,083 million in the 2004 financial<br />
year from EEK 2,053 million in the 2003 financial year, while our revenue from the Sweden—Estonia routes<br />
increased to EEK 1,232 million in the 2004 financial year from EEK 943 million in the 2003 financial year. This<br />
increase was supported in particular by the introduction of Victoria I on this route in the spring. Our revenue<br />
from mainland operations was EEK 40 million in the 2004 financial year, our first financial year with mainland<br />
operations. This change primarily reflected the introduction of our Hotell <strong>Tallink</strong> in May 2004. Revenue from<br />
our other routes, namely the Helsinki—Tallinn—St. Petersburg route, was EEK 51 million compared to none in<br />
the 2003 financial year. The Helsinki—Tallinn—St. Petersburg route was discontinued in the beginning of 2005.<br />
Cost of Sales. Our cost of sales in the 2004 financial year totaled EEK 2,479 million (73 percent of revenue)<br />
compared to EEK 2,133 million (71 percent of revenue) in the 2003 financial year. The main cost of sales items<br />
were cost of goods sold (24 percent of the total cost base in the 2004 financial year and 23 percent in the 2003<br />
financial year), port charges (16 percent in both the 2004 financial year and the 2003 financial year), onboard<br />
staff costs (12 percent in the 2004 financial year compared to 11 percent in the 2003 financial year), fuel costs<br />
(nine percent both in the 2004 financial year and the 2003 financial year) and depreciation and other costs. The<br />
increase was primarily due to the abolition of tax-free status for shop sales on the Helsinki-Tallinn route as a<br />
result of Estonia’s accession to the European Union, additional fuel costs and port fees for Mariehamn, Åland,<br />
resulting from our decision to route the Stockholm—Tallinn traffic through Åland to maintain tax-free status for<br />
shop sales on this route as well as the start-up costs relating to our vessel Victoria I, our St. Petersburg operation<br />
and Hotell <strong>Tallink</strong>.<br />
Gross Profit and Segment Result. Our gross profit amounted to EEK 928 million (or approximately<br />
27 percent of revenue) in the 2004 financial year compared with EEK 863 million (or approximately 29 percent<br />
of revenue) in the 2003 financial year. The increase of EEK 64 million in the 2004 financial year resulted<br />
primarily from the increase in passenger volumes particularly on the Sweden—Estonia routes partly offset by the<br />
increase in cost of sales. The segment result from our Finland—Estonia route decreased to EEK 415 million in<br />
the 2004 financial year from EEK 524 million in the 2003 financial year, while the segment result from our<br />
Sweden—Estonia routes increased to EEK 204 million in the 2004 financial year from EEK 78 million in the<br />
2003 financial year. The segment result from our mainland operations was EEK 9 million in the 2004 financial<br />
year, our first financial year with mainland operations. The segment result breakdown is calculated on a group<br />
company basis and is not based solely on the vessels’ direct geographical operations. Therefore, the allocation of<br />
the expenses between the segments reported in our financial statements does not fully reflect the vessels’<br />
geographical operations.<br />
The unaudited segment result based on the revenue and the vessels’ direct geographical expenses on the<br />
Finland—Estonia route was EEK 377 million in the 2004 financial year compared to EEK 475 million in the<br />
2003 financial year. This 21 percent decrease was primarily due to the initial negative effect of the abolition of<br />
tax-free sales on this route in May 2004. The unaudited segment result based on revenue and the vessel’s direct<br />
geographical expenses on the Sweden—Estonia route was EEK 238 million in the 2004 financial year, an<br />
36
increase of 87 percent compared to EEK 127 million in the 2003 financial year. The increase was mainly due to<br />
the replacement in March 2004 of Fantaasia by Victoria I.<br />
Marketing and Administrative Expenses. Our marketing and administrative expenses in the 2004 financial<br />
year totaled EEK 479 million (14 percent of revenue) compared to EEK 379 million (13 percent of revenue) in<br />
the 2003 financial year. This increase was primarily due to the increased marketing related to increased sales, the<br />
additional marketing campaigns relating to Victoria I, our Helsinki—Tallinn—St. Petersburg route, Hotell<br />
<strong>Tallink</strong> and Estonia’s accession to the European Union. In addition, there were additional administrative costs<br />
relating to our St. Petersburg operations, which were discontinued at the beginning of 2005.<br />
Other Operating Income and Other Operating Expenses. Our other operating income decreased to EEK 1<br />
million (0.03 percent of revenue) in the 2004 financial year from EEK 3 million (0.1 percent of revenue) in the<br />
2003 financial year. Other operating expenses decreased to EEK 2 million (0.06 percent of revenue) in the 2004<br />
financial year from EEK 6 million (0.2 percent of revenue) in the 2003 financial year.<br />
Operating Profit. Our operating profit decreased to EEK 446 million (13 percent of revenue) in the 2004<br />
financial year, a decrease of EEK 35 million, or seven percent, from EEK 481 million (16 percent of revenue) in<br />
the 2003 financial year. This decrease was primarily due to the initial negative effect of Estonia having joined the<br />
European Union and the consequent removal of tax-free onboard shop sales, our unprofitable St. Petersburg<br />
operation and our extensive marketing campaigns in connection with the introduction of Victoria I and Hotell<br />
<strong>Tallink</strong>.<br />
Net Financial Items. Our net financial expenses increased to EEK 134 million (four percent of revenue) in<br />
the 2004 financial year from EEK 100 million (approximately three percent of revenue) in the 2003 financial<br />
year. This increase was primarily due to the payment of interest incurred under our loan facility obtained to<br />
acquire Victoria I.<br />
Profit Before Income Taxes. Our profit before income taxes in the 2004 financial year was EEK 313 million<br />
(nine percent of revenue), a decrease of EEK 69 million, or 18 percent, compared to EEK 382 million (13 percent<br />
of revenue) in the 2003 financial year. The decrease was primarily due to the initial negative effect of Estonia<br />
having joined the European Union, our unprofitable St. Petersburg operation, and our extensive marketing<br />
campaigns in connection with the launches of Victoria I and Hotell <strong>Tallink</strong>.<br />
Net Profit. Our net profit in the 2004 financial year was EEK 313 million (nine percent of revenue),<br />
compared to EEK 382 million (13 percent of revenue) in the 2003 financial year. As a result of current Estonian<br />
tax laws, under which income tax is not charged on the profits when accrued but deferred until profits are<br />
distributed, we did not pay Estonian income tax on our profit for either the 2004 financial year or the 2003<br />
financial year.<br />
Liquidity and Capital Resources<br />
Cash Flows<br />
Our principal sources of cash flow are cash from our business operations and loan facilities. Net cash<br />
provided by operating activities was EEK 891 million, EEK 804 million and EEK 842 million for the financial<br />
years ended August 31, 2005, 2004 and 2003, respectively. Net cash provided by (used in) financing activities<br />
was EEK (579) million, EEK 1,717 million and EEK (144) million for the financial years ended August 31,<br />
2005, 2004 and 2003, respectively.<br />
The principal uses of funds, in addition to our ongoing business operations, in the financial year ended<br />
August 31, 2005 were EEK 266 million in down-payments for the New Cruise Ferry and one of our two highspeed<br />
ro-pax ferries ordered in August 2005, EEK 91 million in refurbishment payments made in respect of our<br />
existing vessels and purchases of other items of property, plant and equipment, EEK 885 million in repayment of<br />
existing indebtedness and EEK 170 million in interest payments. The principal uses of funds in addition to our<br />
ongoing business operations in the financial year ended August 31, 2004 related to the acquisitions of Victoria I,<br />
two high-speed ferries (one of which was refurbished) and the ro-ro cargo vessel Regal Star as well as the<br />
repayment of our existing indebtedness and interest payments. The principal uses of funds in the financial year<br />
ended August 31, 2003, in addition to our ongoing business operations, related to the repayment of existing<br />
loans, interest payments on our indebtedness and a down-payment on Victoria I.<br />
37
Pursuant to the letter of intent concerning our new Tallinn conference and spa hotel, we will, subject to a<br />
final agreement, be required to make fixed rental payments over a ten-year period in an annual amount equal to<br />
ten percent of the construction cost of the hotel. We expect to finance such rental payments from our existing<br />
cash balances and cash generated from our business operations. In addition to the fixed rent, we are also required<br />
to pay an annual amount equal to 25 percent of any profit from the operation of the hotel. See “Business—<br />
Related Party Transactions.”<br />
As of August 31, 2005, we had cash and cash equivalents of EEK 327 million compared to EEK 367 million<br />
as of August 31, 2004 and EEK 232 million as of August 31, 2003.<br />
Liquidity and Capital Resources<br />
We believe that, taking into account our existing assets and financial condition, our working capital is<br />
sufficient for our business activities for at least the 12-month period following the date of this offering<br />
memorandum. We believe that we can fund our cash needs for such period from the proceeds of this Offering,<br />
cash generated from business operations and our current loan facilities, including the loan facility obtained for<br />
the financing of the New Cruise Ferry. Our capitalization and indebtedness is discussed in more detail under<br />
“Capitalization.”<br />
Capital Expenditures<br />
Our budgeted capital expenditures for the financial year commenced September 1, 2005 and ending<br />
August 31, 2006, taking into account our current plans and ongoing projects, are estimated at approximately EEK<br />
2.7 billion, consisting primarily of the remaining payments of EEK 2.4 billion for the New Cruise Ferry as well<br />
as down-payments for the two new high-speed ro-pax ferries on order. In 2007 and 2008, we are scheduled to<br />
pay the remaining 80 percent of the contract prices of these high-speed ro-pax ferries.<br />
Loan Agreements<br />
We generally finance our business operations and fleet through a combination of operating cash flow and<br />
debt. A major component of our outstanding indebtedness relates to acquisition financing for our vessels. Since<br />
our specific ship-owning subsidiaries own all the ships that we operate, the loans for financing the ship<br />
acquisitions are generally taken out by such subsidiaries. <strong>Tallink</strong> as a parent company has three outstanding loan<br />
agreements with banks for general corporate and refinancing purposes: the facilities agreement with Nordea<br />
Bank Finland Plc for general corporate purposes and for the refinancing of certain loans of ship-owning<br />
subsidiaries, and two agreements with SEB Eesti Ühispank for the financing of the purchase of shares in<br />
Hansalink Ltd from Infortar. We also have three overdraft facilities. In addition, we have certain intra-group loan<br />
agreements, executed mainly for financing ship acquisitions.<br />
As of August 31, 2005, our interest-bearing debt totaled EEK 3.8 billion, of which the financing for the<br />
purchases of Romantika and Victoria I represented approximately 74 percent. Interest rates for the secured bank<br />
loans are mainly determined according to EURIBOR plus a margin, the maximum of which is 1.8 percent per<br />
annum. In the financial year ended August 31, 2005, the average variable interest rate on our bank loans was six<br />
month EURIBOR plus 1.38 percent per annum. Loan agreements with related parties are, as a general rule,<br />
executed at fixed interest rates, the average of which is seven percent per annum. Most of the bank loans are<br />
repayable in quarterly or semi-annual instalments, accompanied in some cases with a final balloon payment.<br />
38
Currently outstanding loan agreements executed by our ship-owning subsidiaries with banks are as follows:<br />
Borrower(s) Financing Purpose Lender(s)<br />
<strong>Tallink</strong> Fast Ltd. ......... Partofthepurchase price of <strong>Tallink</strong><br />
AutoExpress<br />
HSH Nordbank AG<br />
<strong>Tallink</strong> Ltd. ............. Partofthepurchase price of Romantika HSH Nordbank AG,<br />
Commerzbank AG, Dresdner Bank<br />
AG and Norddeutsche Landesbank<br />
Girozentrale<br />
<strong>Tallink</strong> Ltd. ............. Refurbishment of Fantaasia and<br />
repayment of certain previous loans<br />
HSH Nordbank AG<br />
Hansalink Ltd. ........... Partofthepurchase price of <strong>Tallink</strong><br />
AutoExpress 2<br />
Skandinaviska Enskilda Banken<br />
AB (Publ)<br />
<strong>Tallink</strong> Victory Line Ltd. . . Part of the purchase price of Victoria I HSH Nordbank AG,<br />
Commerzbank AG, Dresdner<br />
Bank AG and Norddeutsche<br />
Landesbank Girozentrale<br />
Tallinn-Helsinki Line<br />
Ltd. ................... Partofthepurchase price of Regal Star Skandinaviska Enskilda Banken<br />
AB (Publ)<br />
<strong>Tallink</strong> High Speed<br />
Line Ltd. and <strong>Tallink</strong><br />
Autoexpress Ltd. ....... Partofthepurchase price of <strong>Tallink</strong><br />
AutoExpress 3 and <strong>Tallink</strong> AutoExpress 4<br />
<strong>Tallink</strong> Sea Line Ltd. ...... Partofthepurchase price of the New<br />
Cruise Ferry<br />
Skandinaviska Enskilda Banken<br />
AB (Publ) and AS SEB Eesti<br />
Ühispank<br />
Skandinaviska Enskilda Banken<br />
AB (Publ), Danske Bank A/S,<br />
Nordea Bank Finland Plc and<br />
Dresdner Bank AG<br />
Currently outstanding bank loans (which are secured against our vessels), including the respective maturity<br />
and outstanding amounts of such loans, are presented in the table below:<br />
Lender(s)<br />
Outstanding amount<br />
as of August 31, 2005 1<br />
Final<br />
Maturity Collateral Vessel<br />
(EEK in millions)<br />
HSH Nordbank AG ............. 34 March2006 <strong>Tallink</strong> AutoExpress, Fantaasia<br />
HSH Nordbank AG, Commerzbank<br />
AG, Dresdner Bank AG,<br />
Norddeutsche Landesbank<br />
Girozentrale ................. 1,415 May2014 Romantika, Fantaasia<br />
HSH Nordbank AG, Commerzbank<br />
AG, Dresdner Bank AG,<br />
Norddeutsche Landesbank<br />
Girozentrale ................. 1,416 September 2010 Victoria I<br />
Skandinaviska Enskilda Banken AB<br />
(Publ) ...................... 63 June2007 <strong>Tallink</strong> AutoExpress 2<br />
Skandinaviska Enskilda Banken AB<br />
(Publ) ...................... 163 February 2011 Regal Star<br />
Skandinaviska Enskilda Banken AB<br />
(Publ), AS SEB Eesti<br />
Ühispank ................... 125 June2011<br />
<strong>Tallink</strong> AutoExpress 3, <strong>Tallink</strong><br />
AutoExpress 4<br />
Nordea Bank Finland Plc ......... 227 November 2009 Meloodia I, Regina <strong>Baltic</strong>a, Vana<br />
Tallinn<br />
AS SEB Eesti Ühispank .......... 81 August 2006 <strong>Tallink</strong> AutoExpress 2<br />
1 All the loans above bear interest at variable rates based on EURIBOR, and the margin varies from one percent to 1.8 percent.<br />
The project price of the New Cruise Ferry, EUR 165 million, will be financed as follows: EUR 132 million<br />
through an internationally syndicated loan facility and the remainder through cash from our business operations.<br />
The financing of the new high-speed ro-pax ferries ordered from Aker Finnyards Oy and Fincantieri-<br />
Cantieri Navali Italiani S.p.A. in August 2005 is expected to be arranged as a combination of equity and debt<br />
financing in a manner corresponding to the financing of previous new vessels.<br />
39
Our loan agreements with banks contain extensive restrictions for the borrower (either <strong>Tallink</strong> or another<br />
group company) that are targeted at maintaining the adequate level of security for the lender and/or at avoiding<br />
further increases in the debt level of the borrower. Such restrictions are in several instances also applicable to the<br />
guarantors and/or the charterer. We (and in some cases other group companies) have provided the lenders to the<br />
borrower companies with irrevocable principal obligor guarantee-style guarantees and undertakings of the<br />
relevant borrower’s obligations. The guarantees are not limited to the financial obligations of the relevant<br />
borrower, but extend to the performance of the relevant borrower’s obligations on demand.<br />
Loan agreements with banks include several different negative undertakings, including restrictions on<br />
payment of dividends by the borrower or entry into any other financial commitments and obligations. The loan<br />
agreements by <strong>Tallink</strong> Victory Line Ltd. with HSH Nordbank AG, Commerzbank AG, Dresdner Bank AG and<br />
Norddeutsche Landesbank Girozentrale, and by <strong>Tallink</strong> Ltd. with HSH Nordbank AG, Commerzbank AG,<br />
Dresdner Bank AG and Norddeutsche Landesbank Girozentrale also require the consent of the lenders for the<br />
payment of dividends by <strong>Tallink</strong>. These requirements may restrict our ability to pay dividends to our<br />
shareholders.<br />
Several of our loan agreements with banks contain covenants to the effect that the value of the relevant<br />
security assets must not be less than between 100 percent and 140 percent of all sums outstanding under the<br />
relevant loan, and, if less, the borrower must make up the deficiency by either granting additional security or prepaying<br />
the deficiency.<br />
In the case of most of the bank loans, our relevant ship-owning subsidiary, as the actual borrower, is<br />
required to pay the earnings of the relevant vessel (the earnings being all revenue relating to the vessel) into a<br />
specific account with the relevant lender although, as long as no default has occurred, it may be entitled to<br />
withdraw sums (for the particular vessel’s operation) from the account in excess of the next periodic principal<br />
and interest payment obligation. In the case of certain loan agreements, these requirements also apply in respect<br />
of the earnings of the charterer.<br />
In several of the loan agreements with banks and guarantees entered into by <strong>Tallink</strong> and its group companies<br />
in connection with such loan agreements, we have also agreed to comply with customary negative covenants<br />
including restrictions for and prohibitions of the following activities: disposal of all or a substantial part of our<br />
assets; substantial changes in the nature of our business; entry into other financial commitments and obligations;<br />
acquisitions of new vessels; establishment of further liens (except for permitted liens); merger, subdivision,<br />
amalgamation or certain reorganization transactions; granting of a preference to other creditors in fulfilling our<br />
obligations; and granting of loans to or securing the obligations of non-group companies without the relevant<br />
lender’s consent.<br />
Several of the loan agreements also include financial undertakings. For example, under certain of the loan<br />
agreements, the borrower must ensure that the aggregate amount of its indebtedness does not exceed a certain<br />
ratio of the value of the vessel plus its deposit with the relevant lender and its receivables. Other financial<br />
covenants include equity ratio requirements or asset liquidity requirements. The loan agreements also contain<br />
extensive provisions relating to the use of the vessels, compliance with environmental laws and insurance<br />
policies.<br />
All our loan agreements contain customary events of default, including cross-default provisions. Frequently,<br />
the cross-default provisions extend to the guarantors and in some cases to <strong>Tallink</strong>’s parent company, Infortar. In<br />
addition, in several agreements, it is an event of default if (without the prior consent of the relevant lender) a<br />
third party acquires in whole or in part the issued share capital of (or an equivalent to the controlling interest in)<br />
the borrower or the guarantor/shareholder or if there is a change in the ultimate beneficial ownership of the<br />
shares in the relevant borrower or guarantor or in the ultimate voting rights attaching to the shares. Should<br />
Infortar’s ownership in the Shares fall below a certain threshold, a matter over which we have no control, consent<br />
from certain of our lenders is required.<br />
Obligations of <strong>Tallink</strong> and our other group companies under the loan agreements have been secured by<br />
mortgages over vessels, commercial pledges over movable assets of <strong>Tallink</strong> or its group companies, guarantees,<br />
assignments of earnings and of insurance and requisition compensation of the vessels, charter, charter guarantee,<br />
pledge or option to pledge the shares of the subsidiaries, pledge of bank accounts and other security.<br />
Substantially all of our assets, including our vessels, have been pledged to secure the obligation of <strong>Tallink</strong> and its<br />
group companies under various loan agreements.<br />
As a result of our legal and operational structure and the terms of the loan agreements entered into by us and<br />
our ship-owning subsidiaries, our ability to transmit certain funds among companies in the group and to pay<br />
dividends may be restricted.<br />
40
Off-Balance Sheet Guarantees<br />
<strong>Tallink</strong> has provided the following outstanding off-balance sheet guarantees as security for the liabilities of<br />
its various subsidiaries.<br />
• As of October 31, 2005, a guarantee in the maximum amount of SEK 16,900,000 to SEB Eesti<br />
Ühispank related to our Swedish subsidiary. The amount of this guarantee is subject to review and<br />
revision several times annually. The current guarantee expires on October 14, 2006;<br />
• Guarantees to HSH Nordbank AG (formerly Hamburgische Landesbank) and Skandinaviska Enskilda<br />
Banken AB for the loans granted to our ship-owning subsidiaries amounting to EEK 3,216,093,000. The<br />
primary securities for these loans are pledges of shares of our ship-owning subsidiaries and mortgages<br />
on the ships owned by such subsidiaries. The guarantees expire upon fulfillment of all obligations under<br />
the related loan agreements;<br />
• Guarantee in the amount of 119,920 Slovenian tolars to SEB Eesti Ühispank related to Vaba Maa AS, a<br />
related party. The guarantee expires on June 30, 2006;<br />
• A guarantee in the amount of EEK 2,200,000 to SEB Eesti Ühispank related to our subsidiary TDF<br />
Kommerts OÜ. The guarantee expires on September 24, 2006; and<br />
• A guarantee in the amount of EEK 260,000 to SEB Eesti Ühispank related to our subsidiary <strong>Tallink</strong><br />
Travel Club OÜ. The guarantee expires on May 26, 2006.<br />
Critical Accounting Policies<br />
We have applied IFRS fully on a continuous basis since the financial year ended August 31, 2002 including<br />
comparative figures for the previous financial year. Preparation of financial statements under the IFRS requires<br />
our management to make estimates and judgments that affect reported amounts of revenue, expenses, assets and<br />
liabilities. Such estimates and judgments, when not apparent from readily available sources, are based on<br />
historical experience and various other assumptions that are believed to be reasonable in the circumstances in<br />
which they are made. We believe that the following are the critical estimates and judgments used in the<br />
preparation of our financial statements under the IFRS.<br />
Property, Plant and Equipment<br />
Property, plant and equipment are stated at cost less accumulated depreciation and any impairment in value.<br />
Land is not depreciated. Depreciation is calculated on a straight-line basis over the estimated useful life of the<br />
asset as follows:<br />
• Buildings—over 20 years<br />
• Plant and equipment—over five years<br />
• Ships—over five to 55 years<br />
• Other equipment—over three to five years<br />
According to the revised IAS 16, depreciation charge is, as of the financial year ended August 31, 2004,<br />
calculated separately for each significant part of a vessel on a straight-line basis over the estimated useful life of<br />
each part as follows (new useful lives used in the financial year ended August 31, 2005 have been presented in<br />
parentheses):<br />
• Hull—over 11 to 50 years (over 11 to 55 years)<br />
• Machinery—over 11 to 40 years (over 11 to 43 years)<br />
• Onboard equipment (short-term usage)—over five to six years (over five to ten years)<br />
• Onboard equipment (long-term usage)—over ten to 21 years (over ten to 25 years)<br />
Depreciation is discontinued when the carrying value of an asset equals with its residual value. The residual<br />
value of hull is based on the current prices of relevant metals and the probable quantity of scrap metals realizable<br />
at the end of a vessel’s useful life. We estimate that the residual value of other items of property, plant and<br />
equipment is zero.<br />
The residual value and the useful life of items of property, plant and equipment are reviewed at least each<br />
financial year and, if expectations differ from previous estimates, the changes are accounted for as a change of an<br />
accounting estimate.<br />
41
Due to changes in useful lives and residual value of hull, the depreciation charge decreased by EEK 26.1<br />
million and EEK 63.5 million, respectively, during the financial years ended August 31, 2005 and 2004<br />
(compared with the previous financial year).<br />
The carrying values of property, plant and equipment are reviewed for impairment when events or changes<br />
in circumstances indicate that the carrying value may not be recoverable. If any such indication exists and the<br />
carrying value exceeds the estimated recoverable amount, the individual assets or group of assets comprising<br />
cash-generating units are written down to their recoverable amount, which is specified as the higher of an asset’s<br />
market value and value in use. On an annual basis, at least two independent brokers determine the market value<br />
of our vessels and identify impairment indicators, if any.<br />
Dry-docking Costs<br />
Our vessels are dry-docked at intervals of two to five years. The major expenditures related to the drydocking<br />
are capitalized and recorded in the same line of the balance sheet as the vessels. The depreciation period<br />
applied to capitalized dry-docking costs coincides with the frequency of dry-docking (two to five years).<br />
Goodwill<br />
In accordance with standards IFRS 3 and IAS 36 (revised 2004), new standards were adopted for business<br />
combinations where the agreement date was on or after March 31, 2004 and goodwill and other intangible assets,<br />
which arose from such business combinations in the financial year ended August 31, 2004.<br />
In the financial year ended August 31, 2005, these standards were also adopted for the goodwill arising from<br />
the business combinations, the agreement date of which was before March 31, 2004 and other intangible assets.<br />
In accordance with IFRS 3 and IAS 36 (revised 2004), goodwill acquired in a business combination is<br />
initially measured at cost being the excess of the cost of the acquisition over the fair value of identifiable assets,<br />
liabilities and contingent liabilities of a subsidiary at the date of acquisition.<br />
After initial recognition, goodwill is measured at cost less any accumulated impairment losses. Goodwill is<br />
reviewed for impairment, annually or more frequently if events or changes in circumstances indicate that the<br />
carrying value may be impaired.<br />
Following adoption of IFRS 3 and IAS 36 (revised 2004), we discontinued annual goodwill amortization<br />
and impairment tests at the cash generating unit level (unless an event occurs during the year which requires the<br />
goodwill to be tested more frequently) from September 1, 2004. The transitional provisions of IFRS 3 require us<br />
to eliminate the amount of the accumulated amortization by EEK 30.6 million through recording a corresponding<br />
amount to gross carrying amount of goodwill.<br />
For the purpose of impairment testing, goodwill acquired in a business combination is allocated to each of<br />
the group’s cash-generating units, or groups of cash-generating units, that are expected to benefit from the<br />
synergies of the combination. Each unit or group of units to which the goodwill is allocated (i) represents the<br />
lowest level within the group at which the goodwill is monitored for internal management purposes; and (ii) is<br />
not larger than a segment based on the group primary reporting format.<br />
Impairment is determined by assessing the recoverable amount of the cash-generating unit to which the<br />
goodwill relates. If the recoverable amount of the cash-generating unit is less than the carrying amount, an<br />
impairment loss is recognized.<br />
Contractual Obligations<br />
The table below presents the length of our contractual obligations as of August 31, 2005.<br />
Total<br />
Payments due by period<br />
Less than<br />
1 year<br />
More than<br />
1 year<br />
(EEK in millions)<br />
Finance lease obligations .......................................... 1,916 981 935<br />
Other loans ..................................................... 3,641,115 630,745 3,010,370<br />
Bonds ......................................................... 193,306 58,747 134,559<br />
Total .......................................................... 3,836,337 690,473 3,145,864<br />
42
Market Risk Disclosure<br />
The management of financial risks is centralized in our financial department, which is responsible for all<br />
borrowings within the group as well as all exposure linked to the interest, currency, credit, liquidity and bunker<br />
price risks.<br />
Interest Rate Risk<br />
In our operations, we use a mixture of financial instruments, such as shareholders’ funds, bank borrowings,<br />
finance leases and cash. We borrow in desired currencies at both fixed and floating rates of interest having regard<br />
to current market rates and future trends. As of August 31, 2005, loans with fixed interest rate represented close<br />
to eight percent of our total interest-bearing liabilities. We use interest rate swaps to modify our exposure to<br />
interest rate movements and to manage our interest expenses. As of August 31, 2005, we had an agreement in<br />
effect which exchanged floating interest rates for fixed interest rates at a nominal amount of EEK 93 million<br />
maturing in 2007 (EEK 146 million as of August 31, 2004). As of August 31, 2005, the fair value of this<br />
derivative financial instrument amounted to EEK 913,000 (EEK 793,000 as of August 31, 2004), recorded as<br />
other payable in the balance sheet. In late October 2005, we entered into an interest rate swap agreement, through<br />
which approximately 25 percent of our interest rate exposure is fixed.<br />
The table below presents our borrowings as of August 31, 2005 divided into fixed and floating interest rate<br />
loans. The division of interest-bearing liabilities into categories of up to one year and one to five years is based<br />
on maturity date in the case of liabilities with fixed interest rates and re-pricing date in the case of floating<br />
interest rate.<br />
< 1 year 1-5 years Total<br />
(EEK in thousands)<br />
Finance lease liability ............................................. 981 935 1,916<br />
Other loans ..................................................... 73,648 24,882 98,530<br />
Bonds ......................................................... 58,747134,559 193,306<br />
Totalfixedrate .................................................. 133,376 160,376 293,752<br />
Floatingrate .................................................... 3,542,585 0 3,542,585<br />
Currency Risk<br />
Approximately 15 percent of our total revenue is denominated in Swedish kronor. We seek to minimize<br />
currency transaction risk through matching foreign currency inflows with outflows. Another transactional<br />
currency exposure is against the U.S. dollar arising from the purchase of ship fuel and insurance. Our net open<br />
position in the currency exposure was not hedged by any derivative financial instruments as of August 31, 2005.<br />
Credit Risk<br />
Our maximum credit risk exposure in respect of unsecured receivables as of August 31, 2005 was EEK 153<br />
million (EEK 185 million as of August 31, 2004). There is no significant concentration of credit risk within our<br />
group.<br />
Liquidity Risk<br />
Our objective for managing our liquidity risk is to maintain a balance between continuity of funding and<br />
flexibility through the use of bank overdrafts, bank loans, bonds and other debentures. Excess liquidity is<br />
invested in short-term money market instruments.<br />
Bunker Price Risk<br />
The total bunker cost for our fleet represents approximately 12 percent of our total operating expenses.<br />
Changes in bunker prices follow the changes in the oil price and the U.S. dollar price. To stabilize the bunker<br />
cost between June 1 and August 31, 2005, we had an agreement with our fuel supplier, NT Marine. There was no<br />
active hedging against bunker price development at the end of the 2005 financial year although we are<br />
considering possibilities to commence hedging bunker price risk together with the related U.S. dollar risk.<br />
Fair Values<br />
In the opinion of our management, there are no significant differences between the carrying value and the<br />
fair value of financial assets and liabilities of our group.<br />
43
European Mini-Cruise and Transport Ferry Markets<br />
INDUSTRY OVERVIEW<br />
The European mini-cruise and transport ferry industry has certain features in common with the global cruise<br />
industry, while also differing from that industry in certain important respects. The global cruise industry has been<br />
a high-growth segment of the leisure industry, dominated by global cruise companies, such as Royal Caribbean<br />
Cruises, Star Cruises, Carnival, and P&O Princess. Companies in this industry sell a cruise product, typically an<br />
onboard vacation lasting one or two weeks with a wide array of leisure activities and onboard entertainment.<br />
Such cruises often stop at several ports of call in tropical or exotic locations, depending on the itinerary, and<br />
middle-aged customers and older age groups have traditionally constituted a large part of the customer base.<br />
However, the European mini-cruise and transport ferry industry has primarily been driven by demand for<br />
passenger transportation from one destination to another.<br />
Mini-cruises are typically shorter one- or two-day cruises, often round trips between two destinations,<br />
allowing the passenger departing from the port to spend a day at a destination abroad before returning home on<br />
the same cruise ferry. The ferries often have car and cargo decks, allowing for the transport of cars, buses and<br />
ro-ro (roll-in / roll-out) cargo, such as trucks (ro-ro cargo), and providing a further source of revenue. Particularly<br />
on longer routes and cruises, cabins are sold to accommodate passengers. Another important source of revenue<br />
for mini-cruise and passenger ferry operators is onboard sales, including sales in restaurants, bars and shops.<br />
The largest European market areas for mini-cruise and passenger traffic include the Mediterranean area,<br />
with routes within and between Spain, France, Italy and Greece, the Atlantic area, with routes within and<br />
between the United Kingdom, Ireland, Continental Europe and Norway, as well as the <strong>Baltic</strong> Sea region. The<br />
Northern European mini-cruise and passenger traffic market can be divided broadly into the Northern <strong>Baltic</strong> Sea,<br />
with routes mainly between Finland, Sweden and Estonia, and the Southern <strong>Baltic</strong> Sea, with routes mainly within<br />
and between Denmark, Sweden, Norway, Germany and Poland. We only operate routes on the Northern <strong>Baltic</strong><br />
Sea.<br />
Traffic in the Northern <strong>Baltic</strong> Sea region has traditionally been more cruise-product oriented than traffic in<br />
other European markets. For example, although many passengers take the ferry between Helsinki and Stockholm<br />
or between Helsinki and Tallinn as a means of transport, many people also take the ferry solely for the minicruise<br />
experience. The mini-cruise ferry passenger typically departs from one port in the evening, spends the next<br />
day at the destination and then returns on the same cruise ferry in the evening to arrive at the home port either<br />
later that day or the following morning. The appeal of this concept is that it allows for a short holiday that can,<br />
for instance, be taken at the weekend, without using vacation time. While mini-cruises are targeted at passengers<br />
seeking both transportation and leisure, high-speed ferries focus on offering relatively quick transportation. For<br />
example, a high-speed ferry makes the trip between Helsinki and Tallinn in approximately one and a half hours<br />
compared to the minimum of three and a half hours with a conventional cruise ferry.<br />
The opportunity to make tax-free purchases has traditionally been an added feature of the mini-cruise leisure<br />
experience. Originally, both onboard and onshore tax-free sales were an important driver of passenger volumes in<br />
the Northern European mini-cruise and passenger ferry market. Despite the abolition of tax-free sales in onboard<br />
shops on ferries and generally between the European Union member states, customers have continued to benefit<br />
from the tax-free price levels as ferry operators have chosen to accept lower margins for competitive reasons. As<br />
a parallel development, customs restrictions within the European Union have been removed or substantially<br />
relaxed and traffic among the European Union member states has increased overall. Today, the strongest drivers<br />
for passenger traffic in the region include increased business and holiday travel as well as differences in onshore<br />
consumer price levels. For example, Estonian onshore price levels are generally lower than in Finland or Sweden.<br />
Furthermore, in order to attract more passengers, ferry operators are generally broadening their offering of<br />
services and leisure activities on cruises.<br />
Due to relatively high demand for overnight leisure mini-cruises on the Northern <strong>Baltic</strong> Sea routes<br />
compared to other European markets, the vessels employed tend to be substantially larger than ferries on routes<br />
of similar distance in other European markets, often resembling the luxury liners operated by the global cruise<br />
companies. Most cruise ferries on the various <strong>Baltic</strong> Sea routes are ro-pax ferries that carry both passengers and<br />
ro-ro cargo (ro-pax ferries).<br />
44
Our Geographic Market Area<br />
The area around the <strong>Baltic</strong> Sea constitutes a large economic area within the pan-European economy.<br />
Surrounded by Sweden and Finland to the north and west; Denmark, Northern Germany and Poland to the south;<br />
and the <strong>Baltic</strong> countries of Estonia, Latvia and Lithuania as well as the Russian city of St. Petersburg to the east,<br />
the <strong>Baltic</strong> Sea region is home to more than 80 million people. Travel by sea has always been a key means of<br />
transportation in the area, mainly due to considerably short distances by sea between the major cities and ports.<br />
Passengers often choose to travel by ferry instead of by airplane or other means of transport. For example, in<br />
2004, approximately 97 percent of Finnish passengers and more than 70 percent of Swedish passengers visiting<br />
Estonia arrived by ferry (15-20 percent of Swedish passengers arrived by airplane). Passenger ferry traffic on the<br />
Northern <strong>Baltic</strong> Sea dates back more than one hundred years. The countries surrounding the Northern <strong>Baltic</strong> Sea<br />
have historically been and continue to be active trading partners. The European Union membership of the <strong>Baltic</strong><br />
countries has been the most recent catalyst for trade.<br />
Recent Developments and Trends<br />
Ferry operators in the Northern <strong>Baltic</strong> Sea region transported approximately 16.4 million passengers and<br />
574,000 ro-ro units of cargo between Finland, Sweden and the <strong>Baltic</strong> countries in 2004, an increase of five<br />
percent and 17 percent, respectively, compared to 2003 (and 0.1 percent and two percent, respectively, compared<br />
to 2002). In line with global trends, tourism in this region and particularly in the <strong>Baltic</strong> countries has been<br />
growing in recent years, particularly in 2004. According to statistics of the Estonian Tourist Board, the number of<br />
overnight tourists visiting Estonia increased by 21 percent in 2004 compared to 2003 and by an annual average of<br />
15 percent from 2001 to 2004. We believe that this development demonstrates an increased growth potential for<br />
the tourism industry in this area, including the local ferry and hotel operators. As a result of the close distance<br />
and the high capacity of ferry transportation available between Helsinki and Tallinn, approximately one-half of<br />
all tourists visiting Estonia are Finnish. However, the proportion of Finnish tourists relative to the total number of<br />
tourists visiting Estonia has decreased moderately over the past few years as tourist flows from other European<br />
countries and especially from Sweden, have begun to grow. In 2004, the number of Swedish tourists visiting<br />
Estonia increased by 40 percent compared to 2003. In 2005, this positive trend has continued. In the first half of<br />
2005, 6.4 percent of all tourists visiting Estonia were Swedish, an increase of 1.4 percentage points compared to<br />
the same period in 2004.<br />
The drivers of increased tourism in the <strong>Baltic</strong> countries include the accession of Estonia, Latvia and<br />
Lithuania to the European Union, an improved supply of tourism services and accommodation and steady<br />
economic growth in the region as well as the improving standard of living in the <strong>Baltic</strong> countries. Improved<br />
living standards have further supported the increase in outbound leisure trips and tourism from the <strong>Baltic</strong><br />
countries, especially by Estonians. For example, the average GDP of the <strong>Baltic</strong> countries increased by 6.8 percent<br />
in 2004 (EU-25 average 2.5 percent) and by 7.4 percent in 2003 (EU-25 average 1.0 percent), resulting in<br />
increased disposable income.<br />
The key attractions for tourists visiting Estonia include Tallinn’s historic atmosphere, a rich national culture<br />
and appealing and safe leisure activities, such as well-known spas, considerably lower prices for consumer goods<br />
(including food, alcoholic beverages and tobacco) and beauty services, and high-quality service. Estonia also<br />
offers growing business opportunities. While the majority of cruise passengers stay in Tallinn (either onboard or<br />
onshore), Estonia also functions as a point of transit to other <strong>Baltic</strong> and even Central European destinations.<br />
Since the majority of travelers are tourists, passenger trends in the region are somewhat seasonal, with peaks in<br />
passenger numbers during the summer months of June, July and August. Cargo traffic volumes, on the other<br />
hand, are more dependent on general economic conditions and trade activity, which typically peaks in late fall<br />
and during spring each year, decreasing the impact of seasonality in passenger traffic.<br />
Sea Containers has recently announced its intention to conduct a controlled auction sale of its subsidiary<br />
Silja Line (and also separately pursue the sale of certain vessels operated by Silja Line). Silja Line is one of the<br />
major ferry operators in the Northern <strong>Baltic</strong> Sea region. The potential ownership change in Silja Line is expected<br />
to have an effect on the Northern <strong>Baltic</strong> Sea ferry market and we are currently analyzing the new situation. We<br />
are currently not negotiating with either Sea Contrainers or Silja Line regarding a potential acquisition of the<br />
shares, business or vessels of Silja Line. This does not, however, preclude us from entering into any such<br />
negotiations in the future.<br />
Main Routes in the Region<br />
The most widely traveled routes in the Northern <strong>Baltic</strong> Sea region are the routes between Finland and<br />
Sweden, which also have the longest post-Second World War history. Finnish and Swedish mini-cruise<br />
passengers have traveled the Northern <strong>Baltic</strong> Sea for more than 40 years. Close governmental relationships, a<br />
45
partially common language tradition, active business cooperation and cultural similarities have supported such<br />
traffic. The travel time on the route between Helsinki and Stockholm of some 350 kilometers is approximately 16<br />
hours (with a brief stop in Mariehamn, Åland), whereas the western Finnish city of Turku can be reached from<br />
Stockholm within 12 hours. On these routes, the mini-cruise experience has traditionally been the principal<br />
objective of the journey.<br />
Maritime traffic between Finland and Estonia also has a relatively long tradition dating back to the<br />
beginning of the 20 th century and is today well-established with several operators. Passenger traffic has<br />
accelerated following Estonia’s regained independence in 1991, from less than two million passengers annually<br />
during the early 1990s to approximately six million passengers annually today. Almost all of the passenger and<br />
cruise ferry traffic between Finland and Estonia is on the Helsinki—Tallinn route with a distance of only<br />
approximately 80 kilometers and travel times ranging from approximately one and a half hours with a high-speed<br />
ferry to three and a half hours with a conventional cruise ferry. Finnish passengers have traditionally constituted<br />
the vast majority of passengers. The proximity of Estonia offers a number of options for Finnish tourists, who<br />
can, for example, spend a day or two onshore, spend a day in Tallinn and a night onboard, go for a mini-cruise or<br />
simply dine at one of Tallinn’s restaurants and return with a high-speed ferry the same night. The variety of<br />
options makes Tallinn an attractive, easy and quick getaway destination. Traffic from Tallinn to Helsinki has also<br />
grown steadily, initially driven mainly by cargo and business traffic and subsequently supported by growing<br />
numbers of tourists. In 2004, close to 400,000 Estonians visited Finland, making Estonians the third largest<br />
tourist group visiting Finland.<br />
The table below shows the development of passenger ferry traffic through the ports of Helsinki to and from<br />
Estonia, Sweden and other destinations between 2002 and 2004:<br />
Passengers (million)<br />
Destination<br />
1<br />
Year ended December 31,<br />
2002 2003 2004<br />
Estonia ................................................................ 6.1 5.7 6.0<br />
Sweden ................................................................ 2.5 2.6 2.5<br />
Otherdestinations........................................................ 0.5 0.6 0.6<br />
Total2 ................................................................. 9.1 8.9 9.1<br />
Source: Finnish Maritime Association<br />
1 A single passenger taking a round-trip is accounted for as two passengers for the purpose of this table.<br />
2 Includes also international cruise ferries visiting Helsinki.<br />
Traffic between Sweden and Estonia commenced in 1990 and has historically had, and continues to have,<br />
fewer passengers than the Finland—Estonia route and the Finland—Sweden routes. Traffic volumes were<br />
heavily affected by the sinking in 1994 of the passenger ferry Estonia operated by the Estline company on the<br />
Stockholm—Tallinn route. However, in the past few years, passenger volumes have been increasing, most<br />
recently, as a result of the European Union accession of the <strong>Baltic</strong> countries. European Union membership has<br />
boosted both passenger and cargo volumes on routes between Finland and Estonia as well as Sweden and<br />
Estonia. For the approximately 11,000 Swedish passengers departing from the Stockholm ports daily, Estonia<br />
and the other <strong>Baltic</strong> countries are becoming an attractive alternative to the traditional Finnish destinations.<br />
Tallinn, which is a distance of some 350 kilometers from Stockholm, can be reached in the same time of<br />
approximately 16 hours (with a brief stopover in Mariehamn, Åland) as Helsinki but offers a very different<br />
experience with its medieval city center, spas, less expensive shopping and restaurants.<br />
The below table shows the development of passenger ferry traffic through the ports of Stockholm to and<br />
from Estonia, Finland and other destinations:<br />
Passengers (million)<br />
Destination<br />
1<br />
Year ended December 31,<br />
2002 2003 2004<br />
Estonia ................................................................ 0.4 0.5 0.7<br />
Finland ................................................................ 7.0 7.2 7.6<br />
Other destinations2 ....................................................... 2.3 2.5 2.6<br />
Total .................................................................. 9.7 10.2 10.9<br />
Source: Port of Stockholm<br />
1 A single passenger taking a round-trip is accounted for as two passengers for the purpose of this table.<br />
2 Includes also international cruise ferries visiting Stockholm.<br />
46
The passenger and ro-ro cargo volumes on the key routes between Finland and Estonia, Finland and Sweden<br />
and Sweden and Estonia between 2002 and 2004 are shown in the below table:<br />
Passengers (million) 1 Ro-ro cargo units (thousands)<br />
Year ended December 31,<br />
2002 2003 2004 2002 2003 2004<br />
Finland—Estonia ...................................... 6.0 5.8 6.2 116 127 164<br />
Finland—Sweden ...................................... 8.7 9.1 9.4 233 243 264<br />
Sweden—Estonia ...................................... 0.4 0.5 0.7 42 52 51<br />
Source: ShipPax statistics<br />
1 A single passenger taking a round-trip is accounted for as two passengers for the purpose of this table.<br />
Cargo transport to and from Estonia has also grown rapidly with the growth of the Estonian economy and,<br />
more recently, with the European Union membership of the <strong>Baltic</strong> countries. Another factor aiding growth in<br />
cargo volumes is the development of the ‘Via <strong>Baltic</strong>a,’ a 670 km highway running from Tallinn to Poland. The<br />
Via <strong>Baltic</strong>a is the shortest route connecting Finland and parts of Russia with Continental Europe through the<br />
three <strong>Baltic</strong> countries of Estonia, Latvia and Lithuania. Traffic from more central parts of Europe to Finland (and<br />
also to St. Petersburg and other areas in Northwestern Russia) has traditionally been routed through Denmark and<br />
Sweden or by vessels directly from Germany. We expect that the recent accession to the European Union of<br />
Poland and the <strong>Baltic</strong> countries, the consequent removal of customs and the ongoing upgrading of local roads<br />
will increase the importance of cargo traffic routed through the Via <strong>Baltic</strong>a in the future. Please refer to the table<br />
above for statistics showing the recent development of ro-ro cargo traffic from Finland and Sweden to Estonia.<br />
Current and Future Tax Status of Onboard Sales<br />
As in several other European mini-cruise and passenger ferry markets, tax-free sales have played an important<br />
economic role in traffic in the Northern <strong>Baltic</strong> Sea region. Due to regulatory developments within the European<br />
Union, onboard tax-free shop sales (excluding bar and restaurant sales and onboard consumption) on routes between<br />
the European Union member states have ceased. The Finnish province of Åland, however, is exempt from the<br />
relevant European Union regulations. As a result, it has been possible for ferry operators to route ferries between<br />
Sweden and Estonia and between Finland and Sweden through Åland and tax-free shop sales on these particular<br />
routes have accordingly been preserved. The stopover in Åland does not increase journey time significantly. Traffic<br />
on the Kapellskär—Paldiski route is not routed through Åland, and, as a result, tax-free shop sales are not available<br />
on this route. Compared to the Stockholm—Tallinn route, the demand for tax-free sales in shops on the<br />
Kapellskär—Paldiski route is lower and the value that customers place on faster transport between Sweden and<br />
Estonia is greater. As of the date of this offering memorandum, there is no time limitation on Åland’s special status<br />
and we believe that Åland will continue to enjoy such status for the foreseeable future.<br />
Alcohol and tobacco sales have traditionally been subject to a relatively high degree of regulation in Finland<br />
and Sweden. High taxation rates have elevated the price of alcoholic beverages and tobacco in Finland and<br />
Sweden compared to most other countries in the European Union (Swedish and Finnish excise taxes have been<br />
up to ten times higher than the European Union minimum excise tax level of EUR 5.50 per liter of pure alcohol).<br />
Estonia’s lower excise tax rates (Estonia currently has a moderate excise tax level of EUR 9.06 per liter of pure<br />
alcohol) and onboard prices, together with the relaxation of Finnish and Swedish private import quotas for<br />
alcoholic beverages and tobacco, have led to increased sales in onboard shops as well as for shops in Tallinn.<br />
Minor amendments in excise tax rates on alcohol are being considered by the Estonian Parliament in order to<br />
apply the same excise tax rates in respect of wine and fermented beverages (other than beer). It is not yet clear<br />
whether the excise tax on fermented beverages will be increased or the excise tax on wine will be decreased. As<br />
excise taxes on alcohol in Finland and Sweden constitute an important source of tax revenue for both countries,<br />
the Finnish and Swedish governments have, in order to maintain the competitiveness of local prices, engaged in<br />
discussions seeking to reduce unit-specific excise taxes on alcohol in the future. Finland has already implemented<br />
a moderate decrease of these excise taxes as of March 1, 2004.<br />
Competition<br />
In addition to us, the largest companies by revenue that provide mini-cruise and passenger transport services<br />
in the Northern <strong>Baltic</strong> Sea region are Viking Line, Silja Line, Eckerö Linjen and Birka Line. There are also a<br />
number of smaller ferry companies, such as Nordic Jet Line and Linda Line operating only with high-speed<br />
ferries between Helsinki and Tallinn. For both Viking Line and Silja Line, the majority of revenue originates<br />
from routes between Finland and Sweden on which we do not operate. Eckerö Linjen only operates regular<br />
passenger and cargo traffic between Finland and Estonia and Sweden and Finland, whereas Birka Line primarily<br />
concentrates on traffic to or via Åland. For further discussion concerning the competitive environment, see<br />
“Business—Competition.”<br />
47
Overview<br />
BUSINESS<br />
We are a leading provider of high-quality mini-cruise and passenger transport services in the Northern<br />
<strong>Baltic</strong> Sea region as well as a leading provider of ro-ro cargo services on selected routes. We own and operate<br />
passenger ferries, including cruise ferries and high-speed ferries, and ro-ro cargo vessels on routes between<br />
Finland and Estonia and between Sweden and Estonia. Our current routes are between Helsinki and Tallinn,<br />
between Stockholm and Tallinn, and between Kapellskär and Paldiski. We are the current market leader on the<br />
Helsinki—Tallinn route and the only provider of daily passenger and ro-ro cargo traffic services on the routes<br />
between Sweden and Estonia. Altogether, we transported more than 3.2 million passengers and approximately<br />
130,000 ro-ro cargo units in the financial year ended August 31, 2005, an increase of 16 percent and 27 percent,<br />
respectively, compared to the previous financial year. In May 2004, we broadened our product offering through<br />
the introduction of a 350-room Hotell <strong>Tallink</strong> that we operate in the principal tourist area of Tallinn. In addition,<br />
we have made a decision to start operating a new conference and spa hotel close to the center of Tallinn. This<br />
hotel is intended to commence operations in late 2006.<br />
Our principal sources of revenue are restaurant and shop sales onboard our vessels, ticket sales and sales of<br />
cargo transport. Our total revenue for the financial year ended August 31, 2005 amounted to EEK 4,063 million,<br />
the majority of which was derived from revenue in passenger and cargo operations between Finland and Estonia.<br />
The table below sets forth the development and geographical breakdown of our revenue for the financial years<br />
ended August 31, 2003, 2004 and 2005:<br />
Financial year ended August 31,<br />
2003 2004<br />
(EEK in millions)<br />
2005<br />
Finland—Estonia ................................................ 2,053 2,083 2,442<br />
Sweden—Estonia ................................................ 943 1,232 1,392<br />
Mainland operations .............................................. — 40 88<br />
Other .......................................................... — 51 141<br />
Total .......................................................... 2,996 3,406 4,063<br />
We currently own a fleet consisting of six cruise ferries carrying both passengers and ro-ro cargo, four highspeed<br />
ferries operating between Helsinki and Tallinn and two ro-ro cargo vessels. In 1997, we changed our<br />
operating model from chartering into ship ownership and acquired our first three vessels. In 2000, we started to<br />
invest in new vessels, including the cruise ferries Romantika (introduced in 2002) and Victoria I (in 2004), and<br />
the New Cruise Ferry expected to be introduced in the spring of 2006. Our new cruise ferries provide improved<br />
accommodation facilities, larger onboard shopping areas and a broader offering of other services compared to our<br />
traditional ferries. We also plan to introduce new high-speed ro-pax ferries on the Helsinki—Tallinn route. The<br />
new high-speed ro-pax ferries are designed to combine the best features of a traditional cruise ferry and a highspeed<br />
ferry such that they can be operated year-round and can travel at almost the same speed as existing highspeed<br />
ferries but with increased passenger capacity, expanded shopping and dining facilities and other services.<br />
Key Strengths<br />
We believe that our position as a leading provider of high-quality mini-cruise and passenger transport<br />
services in the Northern <strong>Baltic</strong> Sea region, as well as a leading provider of ro-ro cargo services on selected<br />
routes, is based on the following key strengths:<br />
• Strong market position. We are currently the leading operator on the Helsinki—Tallinn route, with a<br />
market share of approximately 43 percent of passengers during the financial year ended August 31,<br />
2005. On the routes between Sweden and Estonia, we had a market share of more than 90 percent of all<br />
passenger ferry traffic. We are currently the only company to provide regular daily service between<br />
Stockholm and Tallinn and between Kapellskär and Paldiski. Furthermore, during the financial year<br />
ended August 31, 2005, we had a market share of approximately 45 percent of the ro-ro cargo traffic<br />
between Finland and Estonia and approximately 95 percent between Sweden and Estonia.<br />
• High-quality, flexible fleet. As a result of our ongoing investment and fleet renewal program, we<br />
currently deploy some of the most advanced cruise ferries in the Northern <strong>Baltic</strong> Sea region. In<br />
particular, we believe that our cruise vessels Romantika and Victoria I, with their state-of-the-art<br />
48
Strategy<br />
facilities and quality onboard services, have set a new benchmark for travel standards in the Northern<br />
<strong>Baltic</strong> Sea region. The program is set to continue with the delivery of the New Cruise Ferry, scheduled<br />
for the spring of 2006, and the introduction of the two recently ordered high-speed ro-pax ferries,<br />
scheduled for delivery in 2007 and 2008. All of our passenger ferries are equipped with a car/cargo<br />
deck, where cars, buses, trucks and trailers can be loaded while passengers are boarding. Combining<br />
passenger traffic with cargo tonnage also allows for more frequent cargo departures and mitigates the<br />
effect of the seasonality of passenger traffic.<br />
• Broad product offering. We focus on offering our customers a wide range of transportation and leisure<br />
products and services varying from a one-way high-speed ferry trip to complete mini-cruises combined<br />
with overnight hotel and spa stays. A large proportion of our products are sold by means of various<br />
product and travel packages. Travel packages may be tailored to suit customer preferences in each<br />
market as to the type of vessel, length of trip, use of conference facilities and other services, hotel<br />
accommodation in Tallinn and other features, such as various onshore leisure experiences.<br />
• Strong brand. Our high market share, high-quality products and services and the regularity and<br />
flexible offering of our vessel departures have supported the creation of a strong brand and a<br />
competitive advantage. We are especially well-established and enjoy strong positive brand recognition<br />
in Estonia and Finland, while in Sweden we continue to focus on increasing our positive brand<br />
recognition. Our strong brand has helped us to create an increasingly loyal customer base. Our customer<br />
base has been strengthened through our rapidly growing loyalty club program, which has increased the<br />
number of repeat customers. We seek to reinforce customer loyalty and strengthen further our brand<br />
recognition by approaching our customers in a manner tailored specifically to each of our geographic<br />
markets through our wide sales network with dedicated marketing offices and agents in each market.<br />
• Competitive cost base. We actively manage and monitor our costs. Through our investment and fleet<br />
renewal program, we have introduced new vessels operating at a lower cost per passenger than our<br />
previous vessels, thereby increasing the profitability of our fleet. As the majority of our onshore and<br />
onboard employee and administrative costs derive from Estonia, we benefit from the generally lower<br />
cost levels in Estonia compared to Finland or Sweden, where most of our key competitors are based. We<br />
believe that we also have fewer onshore personnel than most of our competitors. In addition, due to the<br />
ongoing transitional period following Estonia’s accession to the European Union, we currently benefit<br />
from a corporate income tax regime under which income tax is not charged on profits when accrued but<br />
deferred until profits are distributed to shareholders, third parties or otherwise.<br />
• Experienced management team with a proven track record. We have a proven track record of<br />
investment and innovation. Since the late 1990s, our current management has successfully changed our<br />
operating model and launched and implemented our investment and growth plan to date. Our<br />
management has been instrumental in our transformation into a leading operator of mini-cruise and<br />
passenger transport and ro-ro cargo services in the Northern <strong>Baltic</strong> Sea region. We believe that our<br />
growth strategy, and particularly our investment and fleet renewal program, demonstrates our<br />
management’s understanding of the dynamics of our market and has resulted in considerable growth of<br />
our business operations, market shares and profitability.<br />
We aim to be the leading provider of high-quality mini-cruise and passenger transport services, as well as<br />
the leading provider of ro-ro cargo services on selected routes, in the Northern <strong>Baltic</strong> Sea region. Even though<br />
our business has grown rapidly for nearly ten years, we believe that there are additional growth opportunities in<br />
the region over the coming years. The cornerstones of our operating strategy are described below:<br />
• Continue to invest in our fleet. We believe that continued investment in new vessels and upgrades to<br />
existing vessels are critical to our ability to maintain market leadership and further expand our business.<br />
In addition to introducing the New Cruise Ferry in the spring of 2006, we plan to introduce next<br />
generation high-speed ro-pax ferries on the Helsinki—Tallinn route in 2007 and 2008. Our newer<br />
vessels are designed to increase our efficiency and profitability by increasing passenger traffic while<br />
reducing operating costs per passenger. We believe that the introduction of additional modern vessels<br />
equipped with improved onboard amenities will lead to increased per-passenger spend and will attract a<br />
broader customer base. In addition, the higher comfort, safety and environmental standards of our newer<br />
vessels will further strengthen the <strong>Tallink</strong> brand association with high-quality products and services.<br />
49
• Build upon strong positions on existing routes. We are the market leader on all of the routes that we<br />
currently operate. We will seek to maintain and strengthen our overall market share and volumes in both<br />
passenger and cargo traffic on our designated routes by continuously improving comfort and quality<br />
standards and providing convenient and reliable timetables for our service. On the well-developed<br />
Helsinki—Tallinn route, we aim to maintain and strengthen our market share by further increasing our<br />
strong brand recognition and by broadening our customer base. On the routes between Sweden and<br />
Estonia, we will focus on continuing to increase traffic volumes for both passengers and cargo, in<br />
particular by promoting the attractiveness of our mini-cruise experience and Tallinn as a new alternative<br />
destination for tourists. In both markets, we will seek to increase sales to business conference<br />
passengers, families and young professionals. We actively market our existing product offering<br />
throughout the Nordic and <strong>Baltic</strong> countries through our own sales agencies and through affiliations with<br />
travel agencies.<br />
• Pursue new growth opportunities in the Northern <strong>Baltic</strong> Sea region. We continuously evaluate<br />
potential growth opportunities presented by introducing new routes, products and services. We believe<br />
that the growth in tourism and commerce with and among the <strong>Baltic</strong> countries provides us with<br />
opportunities to introduce new routes, such as those between Sweden and Latvia or between Estonia or<br />
Finland and Russia. Following the delivery of the New Cruise Ferry, Regina <strong>Baltic</strong>a will become<br />
available for traffic elsewhere. In addition, our cruise ferry Fantaasia, which is currently in maintenance,<br />
will soon be available for operation. This will potentially allow us to operate these vessels on a new<br />
route as of spring 2006. We also seek growth opportunities in travel-related products and services that<br />
will support our cruise and passenger transport business. For example, the operation of Hotell <strong>Tallink</strong><br />
and the proposed conference and spa hotel close to the center of Tallinn support our cruise business by<br />
offering high-quality overnight accommodation in Tallinn that can easily be combined with our ferry<br />
products. We believe that travel services, such as innovative and varied travel packages, including<br />
cruises, hotel stays and cultural experiences, provide further opportunities to attract new groups of<br />
customers and improve our profitability.<br />
• Maintain profitability through efficient and flexible management, while seeking revenue growth. We<br />
aim to focus on growth opportunities that will allow us to maintain and improve our profitability. We<br />
have a tradition of efficient and flexible management of our assets, including the ability to introduce<br />
profitable new routes and to transfer and relocate our vessels to new routes or, for example, charter<br />
operations, in order to seek the highest available return from our assets. Our onshore and management<br />
organizations are lean, which enables us to operate efficiently and to make quick decisions in response<br />
to market developments and opportunities.<br />
History<br />
The origins of the <strong>Tallink</strong> brand date back to 1989, when a company named <strong>Tallink</strong> was founded as a<br />
Finnish-Soviet joint venture. The joint venture was primarily intended to transport tourist passengers on the<br />
approximately 80 kilometer route between Helsinki and Tallinn. In 1990, its first year of operation, the company<br />
operated only one chartered vessel, the <strong>Tallink</strong> ferry, and transported approximately 166,000 passengers on the<br />
Helsinki—Tallinn route. In 1991, Estonia gained independence, which rapidly increased the country’s appeal as a<br />
tourist destination, mostly among the Finnish public. To respond to the growing demand for trips from Finland to<br />
Estonia, the company chartered in 1993 the Georg Ots ferry, which had previously been in competition with the<br />
company’s own ferry. During 1993, when the state-owned Estonian Shipping Company (“ESCO”) acquired all of<br />
the shares in the company, we also achieved the milestone of transporting one million passengers annually.<br />
In 1994, an operating company named EMINRE was established to continue the use of the <strong>Tallink</strong> brand.<br />
By the mid-1990s, the market for transport between Helsinki and Tallinn had evolved as a growing group of<br />
passengers began to seek a quicker form of transport to the more leisurely cruise concept. As a result, so-called<br />
high-speed ferries were introduced on the Helsinki—Tallinn route. These were able to transport passengers<br />
between the two capitals in approximately one hour and 40 minutes, as opposed to the approximately three and a<br />
half hours required by the conventional cruise ferries.<br />
In 1996, a new operating company named AS Hansatee commenced operations under the <strong>Tallink</strong> brand. AS<br />
Hansatee was owned by ESCO, AS Eesti Ühispank and a second private investor, which sold its interest in<br />
AS Hansatee in 1996. In the same year, a new management team headed by the current Chairman of our<br />
management board and CEO Enn Pant, was brought in to improve performance. This was accompanied by a<br />
change in ownership and a fundraising of approximately EUR 13 million, whereby management and certain<br />
companies related to Eesti Ühispank became shareholders. Our principal shareholder, Infortar, was formed in<br />
connection with this management buy-out. See “Principal and Selling Shareholders—Infortar.”<br />
50
We initially chartered all of our vessels, but the new management team changed our operating model from<br />
chartering to ship ownership in 1997, during which we also acquired our first three vessels. In the same year, we<br />
were also subject to a management buy-out by our current management, the present group structure was<br />
introduced and AS Hansatee became <strong>Aktsiaselts</strong> Hansatee <strong>Grupp</strong> (subsequently, renamed <strong>Aktsiaselts</strong> <strong>Tallink</strong><br />
<strong>Grupp</strong>).<br />
In 1998, we achieved the milestone of two million passengers annually and introduced the first route<br />
between Sweden and Estonia (Kapellskär—Paldiski). The Stockholm—Tallinn route was introduced in January<br />
2001. We continued to implement our growth strategy by acquiring additional cruise and high-speed ferries and<br />
by starting to invest in new vessels. We ordered two high-class cruise ferries, the first of which, Romantika, was<br />
delivered in 2002.<br />
In 2003, a group of international institutional investors became shareholders of <strong>Tallink</strong> through an<br />
international private placement transaction. The private placement, which amounted to EUR 37 million in total,<br />
consisted of both an issue of new shares by <strong>Tallink</strong> and the sale of existing shares by <strong>Tallink</strong>’s largest<br />
shareholder, Infortar. The private placement transaction enabled us to continue to pursue our growth strategy. In<br />
2004, we acquired two additional high-speed ferries, our second ro-ro cargo vessel and introduced Romantika’s<br />
sister vessel, Victoria I.<br />
Operational Segments<br />
Our main revenue sources are passenger ticket sales, restaurant and shop sales and sales of cargo transport.<br />
Passenger tickets are sold through our own sales network and through travel agencies in Finland, Sweden,<br />
Estonia, Latvia, Lithuania and Russia. Ticket sales include the price of tickets sold, cabins rented to passengers<br />
as well as, for example, use of conference facilities and transport of private cars. Restaurant and shop sales<br />
include all sales made to passengers onboard the ferries, including sales of tax-free goods and sales in<br />
restaurants, bars and casinos. Sales of cargo transport include tonnage and unit-specific payments for ro-ro cargo<br />
and buses.<br />
Routes Operated<br />
Finland—Estonia Route<br />
We transport both passengers and cargo on the well-developed Finland—Estonia route between Helsinki<br />
and Tallinn, the origins of which date back to the Soviet Union era. Following a decade of strong growth in the<br />
1990s, passenger numbers between Finland and Estonia have been steady at approximately six million<br />
passengers annually over the last five years. Approximately 97 percent of Finnish passengers visiting Estonia<br />
arrive by ferry. We have a strong position on this route and currently operate the cruise ferries Romantika and<br />
Meloodia I, both of which carry passengers and ro-ro cargo units. In addition, we operate four high-speed ferries<br />
and the ro-ro cargo vessel Kapella on this route.<br />
The cruise ferry Romantika currently departs once a day from each port taking the evening departure from<br />
Helsinki and the voyage takes three and a half hours. Despite the short distance, Romantika offers a true minicruise<br />
experience during which passengers from Finland spend the evening and night on the cruise ferry and are<br />
able to spend a few hours in Tallinn in the morning before the ship returns to Helsinki. Meloodia I departs twice<br />
daily from each port, with the journey time being three hours and fifteen minutes. Meloodia I’s primary product<br />
is the day cruise where passengers leave for Tallinn in the morning, spending about four and a half hours in the<br />
city before returning in the evening. The second departure of Meloodia I from the respective port is a “night<br />
departure,” intended mainly for cargo and passengers with cars. Both of the cruise ferries also carry ro-ro cargo,<br />
buses and private cars on the car/cargo deck.<br />
We also operate four high-speed ferries on the Helsinki—Tallinn route, namely <strong>Tallink</strong> AutoExpress,<br />
<strong>Tallink</strong> AutoExpress 2, <strong>Tallink</strong> AutoExpress 3 and <strong>Tallink</strong> AutoExpress 4. These high-speed ferries offer<br />
frequent daily departures between the two destinations. The crossing is made in approximately one and a half<br />
hours and as such, the high-speed ferries are ideal for passengers who need to reach their destination quickly.<br />
Traffic on the high-speed ferries is seasonal, as the service is suspended during the winter months (typically<br />
December/January—March/April) due to the potentially difficult ice conditions on the Northern <strong>Baltic</strong> Sea.<br />
Passengers on these vessels include business travelers, day cruisers and passengers with overnight hotel<br />
packages. The high-speed ferries also carry a limited number of cars and buses but not heavier ro-ro cargo.<br />
51
Sweden—Estonia Routes<br />
Regular traffic between Sweden and Estonia commenced 15 years ago. After a promising start in 1990,<br />
traffic on this route was severely affected by the sinking in 1994 of the passenger cruise vessel Estonia operated<br />
by the now bankrupt Estline company in the Northern <strong>Baltic</strong> Sea region. Passenger, private car and heavier cargo<br />
unit traffic has, however, almost doubled since 1998 and the average annual growth of passenger numbers has<br />
been approximately 27 percent since 2001. Up to 70 percent of Swedish passengers visiting Estonia arrive by<br />
ferry.<br />
Currently, we are the only operator of passenger and cargo services with daily departures between Sweden<br />
and Estonia. We operate a total of four vessels from two different destinations in both Sweden and Estonia.<br />
Despite the two different ports at each end, we view both destinations effectively as one since Stockholm and<br />
Kapellskär on the one hand and Tallinn and Paldiski on the other are located close to each other. Regular bus<br />
services to and from three different locations in Sweden, provided especially for the use of our cruise passengers,<br />
allow us to serve Swedish customers located outside the Stockholm region.<br />
Stockholm—Tallinn Route. Following a positive start and development on the Kapellskär—Paldiski route<br />
since 1998, we started operating the Stockholm—Tallinn route in January 2001. On the Stockholm—Tallinn<br />
route (directed through Mariehamn, Åland, to obtain the tax-free status for onboard shop sales), we currently<br />
operate two cruise ferries, Victoria I and Regina <strong>Baltic</strong>a, with one daily departure by each cruise ferry at<br />
5:30 p.m. from each port. The duration of the voyage, including a short stop at Mariehamn, Åland, is<br />
approximately 16 hours and the ferry arrives at its destination the following morning. The main product is a<br />
mini-cruise with two nights onboard the vessel and a day at the destination, although one-way trips combined<br />
with a hotel package or a private car trip around the <strong>Baltic</strong> region are becoming increasingly popular. Ro-ro cargo<br />
is transported on the car and cargo decks of both Victoria I and Regina <strong>Baltic</strong>a. In response to the growing<br />
demand for capacity on the Helsinki—Tallinn route and particularly on the Stockholm—Tallinn route, we expect<br />
to introduce the New Cruise Ferry in the spring of 2006. This will allow us to operate the well-equipped highquality<br />
2,500 passenger sister vessels Victoria I and Romantika on the Stockholm—Tallinn route, and the 2,800<br />
passenger New Cruise Ferry on the Helsinki—Tallinn route. We see potential for growth in passenger numbers<br />
on the Stockholm—Tallinn route and expect that the transfer of Romantika to this route will attract additional<br />
passengers and, by means of a larger offering of high-quality cabins and services, generate growth in both<br />
passenger volumes and revenue.<br />
Kapellskär—Paldiski Route. We entered the Sweden—Estonia market in 1998 by commencing regular<br />
traffic on the Kapellskär—Paldiski route, where we currently operate one cruise ferry, Vana Tallinn. Vana<br />
Tallinn also has a car/cargo deck similar to our other cruise ferries. In addition, we operate the ro-ro cargo vessel<br />
Regal Star on this route. Vana Tallinn departs once daily from Paldiski at 10:00 a.m. and once daily at 9:00 p.m.<br />
from Kapellskär, effectively completing a one-way voyage in only 11 hours and a round trip every 24 hours.<br />
Traffic on the Kapellskär—Paldiski route is not directed through Åland, which means that tax-free onboard shop<br />
sales are not available on this route. Compared to the Stockholm—Tallinn route, the demand for tax-free sales in<br />
shops on the Kapellskär—Paldiski route is comparatively low and, in our view, the value that customers place on<br />
faster transport between Sweden and Estonia is comparatively higher.<br />
Future Potential Routes<br />
Following the delivery of the New Cruise Ferry, Regina <strong>Baltic</strong>a (currently operating on the Stockholm—<br />
Tallinn route) will become available for traffic elsewhere. In addition, the chartering agreement for our cruise<br />
ferry Fantaasia has ended and the vessel is currently in maintenance. We are at present considering whether to<br />
introduce any of the following new routes in the near- to medium-term.<br />
Sweden—Latvia Route. A new route between Sweden and Latvia would provide Swedish passengers with a<br />
new <strong>Baltic</strong> cruise destination, Riga, which is the largest city in the <strong>Baltic</strong> region. The route would also offer<br />
another easy access by sea from the Nordic countries to the <strong>Baltic</strong> countries and serve the increasing tourist flow<br />
to the region. At the same time, passengers and cargo could be transported to the north in an estimated travel time<br />
of approximately 15 hours. Both passenger and ro-ro cargo traffic volumes between Sweden and Latvia have<br />
increased significantly over the past few years. We therefore view this route as offering good potential for<br />
expansion and growth, and we could start operations in early 2006, subject to completion of necessary<br />
negotiations and regulatory issues. Following the recent cessation of operations on this route by Riga Sealine, no<br />
ferry operator is currently offering passenger transport on the Stockholm—Riga route.<br />
52
St. Petersburg—Estonia/Finland Route. The historic former Russian capital St. Petersburg is considered to<br />
be one of the most beautiful cities in the world, offering tourists numerous attractions and cultural experiences.<br />
At the same time, the rapidly increasing levels of wealth and disposable income in the St. Petersburg area, with a<br />
population of some six million have allowed Russian outbound tourism to increase significantly. On April 1,<br />
2004, we opened a route between Helsinki, Tallinn and St. Petersburg. Despite the great potential of the new line,<br />
the expected significant increases in port fees, the visa regime imposed on both the European Union and Russian<br />
citizens by the Russian authorities and the underdeveloped governmental infrastructure lead us to suspend traffic<br />
on this route in the beginning of 2005. We are currently monitoring the development of port fees and applicable<br />
visa regulations and would consider reopening this route in the future, should the current requirements be<br />
abolished or relaxed or the visa application process become more manageable. Silja Line has recently operated<br />
the route between Helsinki and St. Petersburg in the spring and autumn seasons with one cruise ferry.<br />
Products<br />
The table below shows the amount and percentage of our revenue derived from each of our operational<br />
segments between the financial years ended August 31, 2003, 2004 and 2005:<br />
2003<br />
Financial year ended August 31,<br />
1 2004 2005<br />
EEK in<br />
EEK in<br />
EEK in<br />
thousands % thousands % thousands %<br />
Ticket sales2 .......................... 827,091 28 879,684 26 1,018,683 25<br />
Restaurantandshopsales ............... 1,494,322 50 1,664,566 49 1,912,232 47<br />
Salesofcargotransport................. 579,014 19 609,383 18 721,690 18<br />
Other3 .............................. 95,171 3 252,622 7 410,356 10<br />
Total revenue ......................... 2,995,598 100 3,406,255 100 4,062,961 100<br />
1 Our operational segments were partly changed beginning with the 2004 financial year, which changes are not reflected in the figures for<br />
the 2003 financial year in this table. See “Operating and Financial Review and Prospects” for adjusted figures in respect of the 2003<br />
financial year.<br />
2 Includes cabins, private cars and conference facilities.<br />
3 Includes our operational segments “Revenue from packages,” “Accommodation sales,” “Other” and “Income from leases of vessels.”<br />
Ticket Sales<br />
We sell passenger tickets and package holidays through our own network of sales agencies as well as<br />
through a wide network of travel agencies. Products sold include passenger tickets, car tickets, cruises, travel and<br />
hotel packages (including accommodation, sightseeing, tours and golf), and conference packages. There is a wide<br />
selection of passenger tickets with a variety of different options and pricing for different ships, departure dates<br />
and times as well as cabin classes. Passenger tickets may also include pre-paid onboard meals as well as transport<br />
of a private car. While some sales are made well in advance, last-minute departures advertised through<br />
newspapers are also quite common. In Finland and Sweden, reservations for individuals, groups and conferences<br />
can also be made via the Internet and we have plans to introduce this service in Estonia.<br />
Our passenger numbers have grown steadily, although ticket prices may vary significantly depending on the<br />
route, competition, special offers and campaigns. In our experience, there is an increasing demand for more<br />
expensive high-quality cabins and better restaurants. Our ongoing fleet renewal program and the introduction of<br />
new vessels have improved the standard of our vessels and the service offering onboard and have enabled us to<br />
increase passenger ticket prices for trips on the new vessels. The table below sets forth the development of our<br />
passenger ticket sales and passenger numbers on the Finland—Estonia and Sweden—Estonia routes in the<br />
financial years ended August 31, 2003, 2004 and 2005:<br />
Finland—Estonia Sweden—Estonia<br />
Financial year ended August 31,<br />
Ticket sales<br />
20031 2004 2005 20031 2004 2005<br />
Ticket sales per passenger (EEK) ...................... 216 220 241 576 639 565<br />
Number of passengers (million) ....................... 2.1 2.2 2.5 0.5 0.6 0.7<br />
Total ticket sales (EEK million) ....................... 458 488 614 275 364 388<br />
1 The total ticket sales line item is unaudited and has been adjusted to facilitate comparability with the figures for the 2004 financial year<br />
and 2005 financial year. Total ticket sales in our audited financial statements for the 2003 financial year amounted to EEK 567 million<br />
on the Finland—Estonia route and EEK 260 million on the Sweden—Estonia route.<br />
53
Private Cars. All of our vessels transport private cars on the car/cargo deck. There is limited room for<br />
private cars on the high-speed ferries, whereas several hundred cars can be transported in the car decks of larger<br />
cruise ferries. We also sell tickets for private car transport as part of our passenger ticket sales. Private car<br />
transport sales are generally linked to sales of tailored travel packages often involving additional features, such as<br />
hotel or spa stays or <strong>Baltic</strong> roundtrips.<br />
Conference Facilities. Our cruise ferries also provide a variety of other offerings and facilities, such as<br />
conference facilities. We offer both standard packages that cover basic requirements and also tailor-made<br />
packages to accommodate the specific needs of clients. The use of conference facilities onboard our vessels has<br />
increased in the past few years and has been supported by the larger and better-equipped facilities on our newer<br />
vessels. Our aggregate conference-related sales amounted to EEK 113 million in the 2005 financial year, an<br />
increase of 13 percent from the previous financial year. Onboard conferences enable customers to hold a quick<br />
getaway conference and also offer onboard recreation facilities for participants. The 340 square meter conference<br />
area of Romantika located on its ninth deck offers a selection of ten well-equipped conference rooms, while the<br />
equally well-equipped conference facilities onboard Victoria I offer 11 conference rooms for a maximum of 400<br />
participants. The New Cruise Ferry will further increase our offering of conference facilities on the Helsinki—<br />
Tallinn route.<br />
Restaurant and Shop Sales<br />
Onboard sales consist of all sales in restaurants, bars, pubs, shops, conference halls, saunas and gaming<br />
areas.<br />
Restaurants and Bars. Our cruise and high-speed ferry passengers can dine at varying price levels, ranging<br />
from traditional à la carte and buffet restaurants to fast food dining areas and pubs. We have developed menus<br />
suited to Nordic tastes, accompanied by culinary inspiration from other ethnic cuisines. We focus strongly on the<br />
quality of our food and service, and our chefs and bartenders have won several awards. Onboard sales in<br />
restaurants and bars have retained their tax-free status on all of our routes following Estonia’s accession to the<br />
European Union.<br />
Shops. All of our vessels have onboard shops, where passengers can purchase consumer goods, such as<br />
alcoholic beverages, tobacco, cosmetics, sweets, clothing, toys and accessories (the shops on the ro-ro cargo<br />
vessels have a smaller product offering). Our onboard shops compete with onshore shops. Since consumer prices<br />
in Estonia are currently lower than in Finland and Sweden, the prices in our onboard shops must be comparable<br />
to Estonian consumer price levels to attract our passengers to purchase goods onboard. Previously, all items sold<br />
in onboard shops were tax-free, meaning that no excise or value added taxes were levied on any of the goods<br />
sold. Since May 2004, our only tax-free route for onboard shop sales is the Stockholm—Tallinn route operated<br />
through Åland. Despite the abolition of tax-free shop sales on traffic between Finland and Estonia, we continue<br />
to offer our customers products at price levels comparable to tax-free prices to attract passengers to shop onboard<br />
our vessels.<br />
We aim to provide a positive shopping experience onboard our vessels and we regularly improve the<br />
selection and display of goods sold in the shops. The customer base varies according to the season and the day of<br />
the week. For this reason, we must adapt our marketing campaigns in order to reach a wide range of customers.<br />
We intend to continue improving the efficiency of the retail space for sweets, spirits and tobacco products in our<br />
shops. Shop refurbishment on both the Finnish and Swedish routes will continue, including the introduction of<br />
self-service perfume shops on the Swedish routes.<br />
The table below shows the development of restaurant and shop revenue per passenger on the routes between<br />
Finland and Estonia and Sweden and Estonia in the financial years ended August 31, 2003, 2004 and 2005. In<br />
particular, the table below shows the effect of the abolition of tax-free shop sales on the Helsinki—Tallinn route<br />
in May 2004 as well as the introduction of Victoria I to the Stockholm—Tallinn route in March 2004.<br />
Finland—Estonia Sweden—Estonia<br />
Financial year ended August 31,<br />
Restaurant and shop sales<br />
2003 2004 2005 2003 2004 2005<br />
Sales per passenger (EEK) .................................. 562 528 488 633 814 861<br />
Number of passengers (million) .............................. 2.1 2.2 2.5 0.5 0.6 0.7<br />
Total sales (EEK million) ................................... 1,1921,1731,243302464 591<br />
54
Sales of Cargo Transport<br />
General. In the cargo business, we operate under the combination tonnage concept, meaning that our vessels<br />
generally carry both cargo and passengers. We do not transport container cargo on our vessels. The two main<br />
constituents of our cargo business are private car transport and ro-ro cargo transport. Our vessels are equipped<br />
with separate car and cargo decks onto which private cars, buses and ro-ro cargo can be driven while the<br />
passengers are embarking. Car transport sales often accompany the purchase of a passenger ticket. Cargo traffic<br />
is often related to business logistics and its development is closely linked to general economic conditions and<br />
trade activity.<br />
The recent increase in cargo transport is mainly due to the accession of the <strong>Baltic</strong> countries to the European<br />
Union and the consequent customs removals, which have increased traffic on the Via <strong>Baltic</strong>a. Our customer base<br />
for cargo services consists of a wide range of clientele, from large transport companies to small or medium-sized<br />
companies. We aim to work closely with our customers in order to continuously enhance our processes and<br />
service level, offering a flexible, efficient and affordable service.<br />
Finland—Estonia Route. We have been transporting goods between Finland and Estonia under the <strong>Tallink</strong><br />
brand for over ten years. During the financial year ended August 31, 2005, we carried 81,000 units of ro-ro cargo<br />
on the route between Helsinki and Tallinn, an increase of 60 percent from the financial year ended August 31,<br />
2004. We are currently the market leader on this route, with unparalleled cargo capacity and year-round service.<br />
We believe that our skilled and experienced crew and onshore staff, combined with long-standing customer<br />
relationships, have earned <strong>Tallink</strong> a reputation as a highly reliable provider of freight transport between Finland<br />
and Estonia.<br />
The development of ro-ro cargo and private car transport onboard our vessels and the vessels of our<br />
competitors Silja Line, Viking Line and Eckerö Linjen on the route between Helsinki and Tallinn during the<br />
years ended December 31, 2002, 2003 and 2004, respectively, is shown in the table below:<br />
2002<br />
Finland—Estonia<br />
Year ended December 31,<br />
2003 2004<br />
Ro-ro<br />
Ro-ro<br />
Ro-ro cargo Private cars cargo Private cars cargo Private cars<br />
(cargo units<br />
(cargo units<br />
(cargo units<br />
in thousands) (thousands) in thousands) (thousands) in thousands) (thousands)<br />
<strong>Tallink</strong> ..................... 56 119 51 108 67 150<br />
Silja Line ................... 16 56 34 97 32 132<br />
VikingLine ................. 26 1 25 5 29 48<br />
Eckerö Line ................. 18 39 17 43 27 60<br />
Other operators .............. 0 46 0 35 10 58<br />
Total ...................... 116 260 127 288 165 448<br />
Source: ShipPax statistics<br />
1 Data not available<br />
Sweden—Estonia Routes. In the financial year ended August 31, 2005, we carried 50,000 units of ro-ro<br />
cargo on the route between Sweden and Estonia, a decrease of five percent from the previous year. We have<br />
strengthened our market position with the commencement of operations on the Stockholm—Tallinn route. Four<br />
vessels are currently operating on the routes between Sweden and Estonia, where we are the only operator of<br />
daily passenger and ro-ro cargo transport services. We have been serving the Kapellskär—Paldiski route as a<br />
cargo operator since 1998. We believe that our service from Kapellskär to Paldiski in just 11 hours is one of the<br />
fastest ways to transport cargo between Sweden and Estonia. On the Stockholm—Tallinn route, we are currently<br />
the only provider of ro-ro cargo transport services. We expect that the transfer of Romantika to this route in early<br />
2006 will increase our cargo capacity on this route by approximately 35 percent compared to 2003.<br />
Other<br />
Hotel Operations. In response to increased tourist activity, we have engaged in hotel operations to support and<br />
supplement our passenger traffic business. In May 2004, <strong>Tallink</strong>’s wholly-owned subsidiary, Osaühing TLG Hotell,<br />
began operating the 350-room Hotell <strong>Tallink</strong> in the principal tourist center of Tallinn. Previously, we used the<br />
services of other hotels to accommodate passengers staying overnight in Tallinn. Hotell <strong>Tallink</strong>, which is a member<br />
of the Best Western hotel chain, now predominantly serves our passengers who stay in Tallinn overnight or for a<br />
longer period of time, but is also available to other visitors. Approximately 60 percent of our hotel customers<br />
55
are our passengers staying overnight in Tallinn. The number of overnight stays has been continuously increasing<br />
with respect to both our Finnish and Swedish customers as hotel packages have become more popular. We believe<br />
that our combined ship and hotel check-in and reservation system is an important advantage in attracting our ferry<br />
passengers to our hotel.<br />
The table below shows the average room occupancy rates for Hotell <strong>Tallink</strong> compared to other Tallinn<br />
hotels and Estonian hotels in general between May and December 2004 and from January 1 through June 30,<br />
2005.<br />
2004 2005<br />
%<br />
Hotell <strong>Tallink</strong>1 .................................................................. 54 61<br />
Tallinn hotels ................................................................... 63 55<br />
Estonian hotels in general .......................................................... 49 44<br />
Source: Estonian Tourist Board<br />
1 Hotell <strong>Tallink</strong> was leased from April 30, 2004 and opened in May 2004.<br />
We believe that our annual average occupancy rate of 54 percent from the opening of the hotel in May 2004<br />
through the end of the year 2004 and approximately 62 percent in the period from January to October 2005<br />
demonstrates the rapidly growing interest in Hotell <strong>Tallink</strong>. Currently, three-quarters of all reservations are made<br />
through our own sales network and mostly comprise our ferry passengers. An average stay in Hotell <strong>Tallink</strong> is<br />
approximately 1.26 nights compared to a Tallinn average of 1.77, which reflects our current customer base. We<br />
believe that growing interest in hotel packages, together with increased tourism to Tallinn in general, provides<br />
considerable potential for increased sales and will enable us to further increase Hotell <strong>Tallink</strong>’s occupancy rate,<br />
length of average stay and sales levels.<br />
We lease Hotell <strong>Tallink</strong> from a real estate company, Osaühing HTG Vara, jointly owned by <strong>Tallink</strong>’s largest<br />
shareholder Infortar and by E.L.L. Kinnisvara AS, a subsidiary of <strong>Aktsiaselts</strong> Merko <strong>Grupp</strong>, a leading Estonian<br />
construction and real estate group. The term of the lease and related operations agreement is ten years. See<br />
“Related Party Transactions.”<br />
In addition, we plan to operate a new 290-room conference and spa hotel close to the center of Tallinn near<br />
the port area. This hotel is scheduled to open in late 2006. In August 2005, we signed a letter of intent with OÜ<br />
Sunbeam (a wholly-owned subsidiary of Infortar) which is the owner of the relevant real property. Compared to<br />
our Hotell <strong>Tallink</strong>, the new conference and spa hotel will have a broader service offering, including a spa, sauna<br />
and wellness facilities.<br />
Hotel Packages. Our hotel packages typically consist of transport on our vessels together with an overnight<br />
stay in a Tallinn hotel, with Hotell <strong>Tallink</strong> as the primary, but not the exclusive, choice. The growing interest in<br />
hotel packages and overnight stays in Tallinn is a result of the increased tourist flow to the <strong>Baltic</strong> countries.<br />
Hotell <strong>Tallink</strong> provides an additional option for accommodation and has been well received by our customers.<br />
Gambling. We offer traditional gambling facilities on all of our cruise ferries. These include entertainment<br />
machines, slot machines and (on larger cruise ferries) gambling tables, such as roulette and black jack. The<br />
provision of gambling facilities and arranging of gambling activities are outsourced to AS Pafer and we only<br />
receive a percentage of the profits generated by such activities.<br />
Chartering. Effective fleet deployment is an important part of our strategy and business. We view<br />
chartering as a means of optimizing asset utilization from time to time. We recently chartered our cruise ferry<br />
Fantaasia to Algerie Ferries for a period of nine months from January to October 2005.<br />
Sales and Marketing<br />
Finland is our most important market in terms of revenue and the majority of our customers come from<br />
Finland. We offer our Finnish customers a broad range of services, including different vessel types and frequent<br />
departures as well as price options depending on customer preferences. We believe that we have strong and<br />
positive brand recognition in Finland and that our brand is readily associated with travel to Tallinn. Our minicruise<br />
and high-speed ferry products are well-known. Many of the travelers onboard our vessels are repeat<br />
customers. For example, the number of members in our <strong>Tallink</strong>Club loyalty program has grown rapidly. The<br />
delivery of Romantika, with high-quality cabins and services, has increased our customer base and per passenger<br />
spend. We expect this trend to continue with the introduction of the New Cruise Ferry.<br />
56
On the Sweden—Estonia routes, we are the only operator offering daily departures. Birka Line has one<br />
weekly departure and Silja Line operates the route via Helsinki. We transported approximately 700,000<br />
passengers in 2004, which is more than the number of passengers transported by our competitors but<br />
considerably less than the number of passengers on our well-developed Finland—Estonia route. Despite good<br />
progress shown by market surveys during the past few years, our brand, whilst well associated with the end<br />
destination Tallinn, is not equally well recognized in Sweden as in Finland. However, we believe that our brand<br />
will benefit from the operation of Victoria I, which was introduced in 2004, and the planned transfer of<br />
Romantika to the Stockholm—Tallinn route in the spring of 2006.<br />
Our network of sales agencies and a network of travel agencies selling tickets for our ferries constitute the<br />
most important components of our sales and marketing organization. All major travel agencies in Finland, most<br />
travel agencies in Estonia and the major travel agencies in Sweden, Latvia and Lithuania sell tickets for our<br />
ferries as well as travel packages in which transport and/or accommodation on our ferries form part of the<br />
package. All of these travel agencies support our sales and marketing function and use a direct online connection<br />
to our booking system. Our own network of sales agencies is divided into country organizations for Finland,<br />
Sweden and Estonia. The Finnish organization is responsible for Finnish customers, the Estonian organization is<br />
responsible for customers in Estonia, the other <strong>Baltic</strong> countries and Russia, and the Swedish organization is<br />
responsible for Swedish customers and customers in other Scandinavian countries. The Estonian organization is<br />
also responsible for onboard marketing. This decentralized marketing function allows greater flexibility to adapt<br />
our marketing activities in response to cultural differences in individual markets.<br />
Marketing Activities<br />
As our most important target segment is leisure travel, we market our services primarily through various<br />
types of consumer media, including newspapers and other publications, television, radio and billboards.<br />
Brochures and other marketing materials supplement the information offering. When planning our marketing<br />
activities, we utilize a variety of sources. These include third-party market research (brand awareness studies,<br />
studies on tourism trends, analysis of ferry traffic), competitive information (statistics on competitors, cruise and<br />
ferry information newsletter), our own real-time statistics, our own research (passenger interviews, feedback<br />
from travel agents), our own campaigns and our new booking system. Our marketing department uses a rolling<br />
marketing action plan that is prepared for the following 12 months but continuously updated to reflect market<br />
developments. While over one-half of our external advertising is based on annual contracts, a significant part of<br />
our marketing budget is flexible and used as deemed appropriate.<br />
In Finland, where we have a high market share on the highly competitive Helsinki—Tallinn route, we focus<br />
on frequent advertising in the main newspapers and selected magazines as well as outdoor advertising. Television<br />
and radio commercials are optional advertising channels. Traditionally, our main Finnish customer groups have<br />
included middle-aged and older tourists, for whom our more traditional service offering is well-suited. For<br />
marketing purposes and to maintain our competitive advantage, our main target groups currently include<br />
families, corporate groups and business travelers as well as young urban adults and professionals. We currently<br />
view these groups as offering the greatest potential. We focus primarily on selling a wider variety of experiences,<br />
such as individual and package tours of the <strong>Baltic</strong> countries by private car, spas, theater, opera and golfing.<br />
In Sweden, we focus mainly on increasing our positive brand recognition as well as on the attractiveness of<br />
our mini-cruise offering and Tallinn as a tourist destination. While the onboard mini-cruise experience is still the<br />
most important single attraction, the attractive and dynamic destination offered by Tallinn with its medieval<br />
center and its position as a gateway to the <strong>Baltic</strong> region is also an important feature in our marketing. We aim to<br />
capture a larger portion of both leisure and business travel to Estonia. Furthermore, our newest vessels provide a<br />
high safety standard, which is a particularly important feature for the Swedish public. We believe that growth<br />
will primarily be driven by onboard conferences, family passengers with private cars and high-end customers<br />
attracted by our high-quality vessels. We continuously measure market requirements and brand recognition<br />
through surveys and campaigns and use cross-promotions with well-known Swedish brands. Our public relations<br />
and marketing focus is mainly on daily newspapers, outdoor marketing and occasional television commercials.<br />
Booking System<br />
We have recently modernized our ticket booking and sales systems. Our new central online booking and<br />
check-in system, CarRes, was implemented in 2002 and provides improved statistics and information on line and<br />
cruise passengers as well as car and cargo traffic. The system connects our ticket offices in each country and also<br />
incorporates travel agencies and Internet customers. The system has improved customer service by facilitating<br />
57
ooking, boarding and registration. It is accessible from all of our offices and check-in locations at every port<br />
(Tallinn, Helsinki, Stockholm, Paldiski, Kapellskär). The online internet booking system that can currently be<br />
used in Finland and Sweden is an important addition to and improvement of our customer service. Currently,<br />
online sales represent up to ten percent of our total ticket sales. However, we aim to reach a level of 15 to 20<br />
percent in the future.<br />
Call Centre<br />
Due to increasing passenger numbers, we have implemented an IP-protocol based Call Centre in cooperation<br />
with Elion, the largest fixed-line telecommunication services provider in Estonia. The new system<br />
offers much greater flexibility to redirect calls, maintain and manage waiting lists and monitor the activity of call<br />
center personnel than regular phone systems. All calls from Finnish customers that are waiting to be connected to<br />
the Helsinki booking office can be redirected to Estonia, thus maximizing the number of calls answered.<br />
Similarly, calls waiting to be connected to our Swedish booking office can be redirected to Estonia, where we<br />
employ multi-lingual call center staff.<br />
Customer Loyalty Program—<strong>Tallink</strong>Club<br />
<strong>Tallink</strong>Club is a customer loyalty program connecting us with more than 50,000 customers. It is designed to<br />
offer versatile, high-quality travel services to meet the needs of our frequent passengers. <strong>Tallink</strong>Club members<br />
receive discounts on ticket prices, take advantage of our special service telephone line for convenient booking of<br />
their trips and receive the latest information on club activities. <strong>Tallink</strong>Club members also receive a newsletter<br />
containing information on the latest special trips and travel opportunities, events and member-only offers.<br />
Cooperation agreements with a multitude of shops and service providers make it possible to provide <strong>Tallink</strong>Club<br />
members with special offers and services. Onboard the vessels, <strong>Tallink</strong>Club benefits are available in restaurants,<br />
tax-free shops and certain other facilities.<br />
Fleet<br />
Current Fleet<br />
We currently own and operate a fleet of 12 vessels as shown in the table below.<br />
Vessel Route operated Built / Acquired<br />
Maximum passengers1 /<br />
Cargo lane meters or<br />
private cars2 Cruise ferries<br />
VictoriaI ................................. Stockholm—Tallinn 2004 2,500 / 1,000<br />
Romantika ................................ Helsinki—Tallinn 2002 2,500 / 1,000<br />
Meloodia I ................................ Helsinki—Tallinn 1979 / 2002 1,600 / 730<br />
Regina <strong>Baltic</strong>a ............................. Stockholm—Tallinn 1980 / 2002 1,500 / 780<br />
Vana Tallinn .............................. Kapellskär—Paldiski 1974 / 1997 800 / 650<br />
Fantaasia .................................<br />
High-speed ferries<br />
Inmaintenance 1979 / 1997 1,550 / 810<br />
<strong>Tallink</strong> AutoExpress 4 ....................... Helsinki—Tallinn 1996 / 2004 574 / 171<br />
<strong>Tallink</strong> AutoExpress 3 ....................... Helsinki—Tallinn 1997 / 2004 580 / 171<br />
<strong>Tallink</strong> AutoExpress 2 ....................... Helsinki—Tallinn 1997 / 2001 673 / 175<br />
<strong>Tallink</strong> AutoExpress ........................<br />
Ro-ro cargo vessels<br />
Helsinki—Tallinn 1995 / 1999 575 / 150<br />
Regal Star ................................ Kapellskär—Paldiski 1999 / 2004 80 / 2,087<br />
Kapella ................................... Helsinki—Tallinn 1974 / 1999 50 / 633<br />
1 Based on information obtained from the passenger ship certificates.<br />
2 For high-speed ferries, the figure represents the number of private cars.<br />
The vessels that we operate are registered with the register of ships in Cyprus or in the Bahamas and with<br />
the Register of Bareboat Chartered Ships in Estonia. We operate all of our vessels under the Estonian flag<br />
pursuant to bareboat-charter agreements entered into between the relevant ship-owning subsidiary and either<br />
<strong>Tallink</strong> (in the case of vessels on the Finland—Estonia route and Vana Tallinn) or Hansatee Cargo (in the case of<br />
vessels on the Sweden—Estonia routes, except Vana Tallinn) and as authorized by the Estonian Law of Ship<br />
Flag and Registers of Ships Act. Vana Tallinn is operated by Hansatee Cargo on the Kapellskär—Paldiski route<br />
based on a time-charter agreement with <strong>Tallink</strong>.<br />
58
New Vessels<br />
We have embarked on a substantial investment and fleet renewal program, the principal components of<br />
which have involved the purchase of Romantika and Victoria I and the order of the New Cruise Ferry for the<br />
Helsinki—Tallinn route. In 2000, we ordered Romantika from Aker Finnyards Oy. The cruise ferry was<br />
delivered and began to operate on the Helsinki—Tallinn route in May 2002. In 2002, we ordered Victoria I also<br />
from Aker Finnyards Oy. This cruise ferry was delivered and began to operate on the Stockholm—Tallinn route<br />
in April 2004. Romantika and Victoria I are currently the newest cruise ferries operating in the Northern <strong>Baltic</strong><br />
Sea region. We believe that Romantika and Victoria I have attracted a broader customer base because they offer<br />
new higher quality facilities.<br />
In addition to the higher standard of facilities, Romantika and Victoria I generate increased profitability and<br />
operate at lower costs per passenger than the previous <strong>Tallink</strong> ferries on these routes. For example, while<br />
between June and December 2002 Romantika carried 13 percent fewer passengers on the Helsinki—Tallinn route<br />
than Fantaasia and Meloodia I combined had carried on that route during the same period in the previous year,<br />
the gross revenue generated by Romantika was nine percent higher and the operating costs four percent lower<br />
compared to the combined result of operations of Fantaasia and Meloodia I. A similar development can be<br />
demonstrated on the Stockholm—Tallinn route, where Victoria I replaced Fantaasia in early 2004. In the<br />
financial year ended August 31, 2004, Victoria I, due to its increased capacity, carried 128 percent more<br />
passengers on the Stockholm—Tallinn route than its predecessor Fantaasia in the financial year ended August 31,<br />
2003, while the gross revenue generated by Victoria I was 138 percent higher compared to Fantaasia and the<br />
operating costs were only 93 percent higher.<br />
The project price (including construction, marketing and start-up costs) for each of Romantika and Victoria<br />
I amounted to approximately EUR 150 million, the majority of which was funded through loan facilities. The<br />
vessels are 193.8 meter passenger cruise ferries each with a capacity of 2,500 passengers. The technical<br />
specifications of the new vessels, especially ice-class and higher speed, will allow us to transfer them to new<br />
routes and markets if desired.<br />
Romantika and Victoria I each have up-to-date onboard equipment. The vessels have larger shopping areas,<br />
offering a wider range of goods, than previous vessels. The vessels also offer a variety of bars and dining options,<br />
with six restaurants in all offering over 1,500 seats for dining. Six different entertainment areas, including discos,<br />
bars, cabarets, pubs and Internet cafés, can host more than 2,000 passengers. The cabins, all of which are above<br />
the car deck, are equipped with a TV and furnished to a high standard. The vessels’ modern and well-equipped<br />
conference rooms, saunas, pools and onboard Internet connections mean a higher standard classification for the<br />
vessels, thus enabling us to maintain higher fares.<br />
We have ordered a third vessel, the New Cruise Ferry, which will be acquired by <strong>Tallink</strong> Sea Line Limited,<br />
a wholly-owned subsidiary of <strong>Tallink</strong>. Delivery of the New Cruise Ferry is expected to take place during the<br />
spring of 2006. The New Cruise Ferry will have a maximum capacity of 2,800 passengers, with accommodation<br />
provided by 927 cabins. In comparison to its predecessors Romantika and Victoria I, the New Cruise Ferry is<br />
larger, has more high-class cabin space, expanded shopping and conference areas with latest equipment as well<br />
as a wider selection of restaurants and bars. The project price for the New Cruise Ferry is EUR 165 million,<br />
mostly financed through a loan facility. Moreover, until December 22, 2005, we have an option to order another<br />
vessel similar to the New Cruise Ferry, which would be its sister vessel. We expect that the increased highquality<br />
offering of the New Cruise Ferry will broaden our customer base.<br />
We also have plans to introduce two new high-speed ro-pax ferries on the Helsinki—Tallinn route. The new<br />
high-speed ro-pax ferries are designed to combine the best features of a traditional cruise ferry and a high-speed<br />
ferry. These features include high speed, expanded facilities for dining and shopping onboard, and space for<br />
cargo transport. The new high-speed ro-pax ferries are intended to increase capacity on the Helsinki—Tallinn<br />
route. With the new high-speed ro-pax ferries we could provide additional possibilities for swift cargo transport.<br />
In August 2005, we agreed to order one high-speed ro-pax ferry from the Finnish company Aker Finnyards Oy<br />
and another from the Italian company Fincantieri Cantieri Navali Italiani S.p.A. The deliveries of these ferries<br />
are expected in the spring of 2007 and 2008, respectively. The estimated project prices for the high-speed ro-pax<br />
ferries are EUR 110 million and EUR 113 million, respectively. Both agreements include an option for a second<br />
similar high-speed ro-pax ferry from the same shipyard.<br />
59
The table below sets forth the vessels on order by all operators in the Northern <strong>Baltic</strong> Sea region based on<br />
publicly available information.<br />
Vessel type Expected time of delivery<br />
Maximum passengers /<br />
Cargo lane meters Operator / Manufacturer<br />
Cruise Ferry 2006 2,800 / 1,100 <strong>Tallink</strong> /Aker Finnyards<br />
High-speed ro-pax ferry 2007 1,900 / 2,000 <strong>Tallink</strong> /Aker Finnyards<br />
High-speed ro-pax ferry 2008 2,080 / 2,000 <strong>Tallink</strong> / Fincantieri<br />
Ro-pax ferry 2006 500 / 4,200 Finnlines / Fincantieri<br />
Ro-pax ferry 2006 500 / 4,200 Finnlines / Fincantieri<br />
Ro-pax ferry 2006 500 / 4,200 Finnlines / Fincantieri<br />
Ro-pax ferry 2006 500 / 4,200 Finnlines / Fincantieri<br />
Ro-pax ferry 2006 500 / 4,200 Finnlines / Fincantieri<br />
Competition<br />
Competitors<br />
<strong>Tallink</strong>’s largest competitors by revenue providing passenger transport, mini-cruise and ro-ro cargo services<br />
in the Northern <strong>Baltic</strong> Sea region are Silja Line, Viking Line, Eckerö Linjen and Birka Line.<br />
Silja Line, domiciled in Finland, is owned by the international Sea Containers Limited Group listed on the<br />
New York Stock Exchange. Sea Containers has recently announced its intention to conduct an auction sale of<br />
Silja Line and, separately, pursue the sale of certain vessels operated by Silja Line. See “Industry Overview—<br />
Our Geographic Market Area—Recent Developments and Trends.” Silja Line focuses on passenger and cargo<br />
traffic in the <strong>Baltic</strong> Sea region. Silja Line operates nine vessels built between 1977 and 1993, including two highspeed<br />
ferries, on different routes around the <strong>Baltic</strong> Sea, with its main focus on mini-cruise and ro-ro cargo traffic<br />
between Finland and Sweden, routed though Åland. Silja Line also has regular traffic to ports, such as Riga,<br />
Tallinn, Visby and St. Petersburg. Sea Wind Line is a subsidiary of Silja Line and operates ro-pax ferries on the<br />
Turku—Stockholm route.<br />
Viking Line is a Finnish company listed on the Helsinki Stock Exchange and based in Åland. It focuses<br />
mainly on passenger ferry and cargo traffic and mini-cruises between Finland and Sweden, routed through the<br />
home port of its vessels, Mariehamn, Åland. Viking Line has a long history of traffic between Finland and<br />
Sweden dating back to 1959. Viking Line operates seven cruise ferries (six of which are in service between<br />
Finland and Sweden and one between Helsinki and Tallinn) built between 1980 and 1992.<br />
Eckerö Linjen and Birka Line, both based in Mariehamn, Åland, are smaller ferry operators with only a few<br />
cruise ferries operating on certain specific routes. Eckerö Linjen, which is the largest shareholder of Birka Line,<br />
operates daily traffic on the Helsinki—Tallinn route. Eckerö Linjen also operates daily traffic between<br />
Grisslehamn, Sweden, and Eckerö, Åland. Birka Line’s business concept is to operate traffic to, from and via<br />
Åland, while also chartering out seven cargo vessels that operate in Northern Europe as well as in North and<br />
South America. Birka Line is listed on the Helsinki Stock Exchange.<br />
Superfast Ferries is a high-speed ro-pax ferry operator belonging to the international Attica Group based in<br />
Greece. In the Northern <strong>Baltic</strong> Sea region, Superfast Ferries operates two high-speed ro-pax ferries and offers<br />
regular daily passenger and ro-ro cargo services between Hanko, Finland, and Rostock, Germany.<br />
Nordic Jet Line and Linda Line are smaller high-speed ferry operators on the Helsinki—Tallinn route with<br />
two high-speed ferries each. Both companies operate regular passenger traffic during the spring, summer and<br />
autumn.<br />
60
The table below shows the operators of passenger and ro-ro cargo business on routes in the Northern <strong>Baltic</strong><br />
Sea region and the vessels currently in service:<br />
Operator Route operated Vessel / Type / Built<br />
Maximum passengers /<br />
Cargo lane meters1 or<br />
private cars2 <strong>Tallink</strong> Stockholm—Tallinn Victoria I / Cruise ferry / 2004 2,500 / 1,000<br />
Stockholm—Tallinn Regina <strong>Baltic</strong>a / Cruise ferry / 1980 1,500 / 780<br />
Stockholm—Tallinn Regal Star / Ro-ro cargo vessel / 1999 80 / 2,087<br />
Kapellskär—Paldiski Vana Tallinn / Cruise ferry / 1974 800 / 650<br />
Helsinki—Tallinn Romantika / Cruise ferry / 2002 2,500 / 1,000<br />
Helsinki—Tallinn Meloodia I / Cruise ferry / 1979 1,600 / 730<br />
Helsinki—Tallinn AutoExpress / High-speed ferry / 1995 575 / 150<br />
Helsinki—Tallinn AutoExpress 2 / High-speed ferry / 1997 673 / 175<br />
Helsinki—Tallinn AutoExpress 3 / High-speed ferry / 1997 580 / 171<br />
Helsinki—Tallinn AutoExpress 4 / High-speed ferry / 1996 574 / 171<br />
Helsinki—Tallinn Kapella / Ro-ro cargo vessel / 1974 50 / 633<br />
Silja Line / Helsinki—Stockholm Symphony / Cruise ferry / 1991 2,670 / 950<br />
Sea Wind Line Helsinki—Stockholm Serenade / Cruise ferry / 1990 2,670 / 950<br />
Turku—Stockholm Europa / Cruise ferry / 1993 3,123 / 932<br />
Turku—Stockholm Festival / Cruise ferry / 1986 2,000 / 1,080<br />
Helsinki—St. Petersburg Opera / Cruise ferry / 1992 1,409 / —<br />
Helsinki—Tallinn SuperSeaCat 3 / High-speed ferry / 1999 800 / 175<br />
Helsinki—Tallinn SuperSeaCat 4 / High-speed ferry / 1999 800 / 175<br />
Turku—Stockholm Sea Wind / Ro-pax ferry / 1971 260 / 1,200<br />
Turku—Stockholm Sky Wind / Ro-pax ferry / 1986 364 / 1,800<br />
Viking Line Helsinki—Stockholm Mariella / Cruise ferry / 1985 2,700 / 1,115<br />
Helsinki—Stockholm Gabriella / Cruise ferry / 1992 2,400 / 970<br />
Turku—Stockholm Amorella / Cruise ferry / 1988 2,420 / 970<br />
Turku—Stockholm Isabella / Cruise ferry / 1989 2,200 / 970<br />
Helsinki—Tallinn Rosella / Cruise ferry / 1980 1,700 / 720<br />
Stockholm—Mariehamn Cinderella / Cruise ferry / 1989 2,700 / 1,130<br />
Mariehamn—Kapellskär Ålandsfärjan / Cruise ferry / 1972 963 / 360<br />
Eckerö Linjen Helsinki—Tallinn Nordlandia / Cruise ferry / 1981 2,000 / 780<br />
Helsinki—Tallinn Translandia / Ro-ro cargo vessel / 1976 104 / 1549<br />
Grisslehamn—Eckerö Roslagen / Cruise ferry / 1972 1,320 / 390<br />
Grisslehamn—Eckerö Alandia / Cruise ferry / 1972 1,320 / 440<br />
Birka Line Stockholm—Helsinki<br />
Stockholm—Tallinn Princess / Cruise ferry / 1986 1,537 / —<br />
Stockholm—Mariehamn Paradise / Cruise ferry / 2004 1,800 / —<br />
Superfast Hanko—Rostock Superfast VIII 717 / 1,891<br />
Ferries Hanko—Rostock Superfast VII 717 / 1,891<br />
Nordic Jet<br />
Line<br />
Helsinki—Tallinn HSC Nordic Jet / High-speed ferry<br />
Helsinki—Tallinn HSC <strong>Baltic</strong> Jet / High-speed ferry<br />
486 / 52<br />
428 / 52<br />
Linda Line Helsinki—Tallinn Jaanika / High-speed ferry 200 / —<br />
Helsinki—Tallinn Laura / High-speed ferry 200 / —<br />
Source: ShipPax statistics (for <strong>Tallink</strong> based on passenger ship certificates).<br />
1 On average, trucks require 15-16 lane meters of space on the car and cargo deck.<br />
2 For high-speed ferries, the figure shows the number of private cars.<br />
Traffic Volumes and Market Shares<br />
The overall passenger and ro-ro cargo volumes in the Northern <strong>Baltic</strong> Sea region between Finland, Sweden and<br />
the <strong>Baltic</strong> countries, of which we believe our business accounted for approximately 19 percent in the financial year<br />
ended August 31, 2005, have been increasing at a moderate pace in the past few years. This increase has been due to a<br />
variety of reasons, primarily increased tourism to the <strong>Baltic</strong> countries as well as the increased use of the Via <strong>Baltic</strong>a<br />
61
y freight operators. The table below shows the growth of passenger and cargo traffic volumes at the ports of<br />
Tallinn, Helsinki and Stockholm in the years ended December 31, 2002, 2003 and 2004:<br />
Passengers1 Year ended December 31,<br />
Ro-ro cargo units<br />
2002 2003 2004 2002 2003 2004<br />
Tallinn ............................. 5,817,550 5,658,334 6,532,348 192,055 201,139 227,671<br />
Helsinki ............................ 8,841,427 8,515,078 8,700,000 201,924 203,208 240,000<br />
Stockholm ........................... 6,863,089 7,190,083 7,823,821 127,598 138,253 98,360<br />
Source: Port of Tallinn, port of Helsinki and port of Stockholm.<br />
1 A single passenger taking a round-trip counts as two passengers for the purpose of this table.<br />
In the Northern <strong>Baltic</strong> Sea region, passenger traffic and cargo volumes have traditionally been highest on the<br />
Helsinki—Stockholm route that we do not currently operate. The volumes on the Stockholm—Tallinn and<br />
Kapellskär—Paldiski routes have been considerably lower than those on the Helsinki—Stockholm, Turku—<br />
Stockholm and Helsinki—Tallinn routes. There are six companies operating on the Helsinki—Tallinn route. We<br />
believe that we are the market leader in both passenger and ro-ro cargo traffic on this route with market shares of<br />
approximately 43 percent in passenger traffic and 45 in cargo traffic in the financial year ended August 31, 2005.<br />
We believe that the passenger market shares of the different operators on the Helsinki—Tallinn route in the<br />
financial year ended August 31, 2005 were as follows:<br />
Company<br />
Passengers<br />
(%)<br />
<strong>Tallink</strong> ........................................................................... 43<br />
Silja Line ......................................................................... 18<br />
VikingLine........................................................................ 15<br />
Eckerö Linjen ...................................................................... 14<br />
NordicJetLine ..................................................................... 7<br />
LindaLine ........................................................................ 3<br />
Other operators ..................................................................... 0<br />
Total ............................................................................. 100<br />
Source: <strong>Tallink</strong>’s management accounts, publicly available information on competitors and Port of Tallinn.<br />
On the routes between Sweden and Estonia, we are currently the only company with daily passenger and roro<br />
cargo services between Stockholm and Tallinn and between Kapellskär and Paldiski. We expect the routes<br />
between Sweden and Estonia to be growth areas in terms of volume and revenue in the medium-term. This<br />
expectation is supported by our recent market studies and feedback from our onboard and onshore questionnaires<br />
as well as our positive experience with Victoria I. The planned transfer of her sister vessel Romantika to the<br />
Sweden—Estonia route in the spring of 2006 will increase high-quality capacity on that route, which we expect<br />
to increase overall passenger volumes.<br />
We have a significant share of the markets in which we operate. Companies with such a significant share are<br />
subject to specific competition regulations setting forth more stringent standards for market behaviour. To date<br />
no disputes or other issues have arisen from such regulation. See “Risk Factors—Risks Relating to Our<br />
Business—Our operations could be affected by any actions taken by competition authorities.”<br />
Regulation<br />
Safety<br />
Our subsidiary Osaühing HT Laevateenindus is responsible for technical management, safety, human<br />
resources and insurance of our fleet and it seeks to ensure that our fleet is operated in a safe and efficient way and<br />
in accordance with all international and national regulations. The first priority of the company is to seek to ensure<br />
compliance with the technical and operational aspects of the fleet with international conventions related to safety,<br />
such as the STCW (International Convention on Standards of Training, Certification and Watchkeeping for<br />
Seafarers) and the SOLAS (International Convention for Safety of Life at Sea). The <strong>Tallink</strong> Safety Management<br />
System is audited by Lloyds Register and Bureau Veritas in accordance with ISM Code (International Safety<br />
Management Code) requirements. During their respective navigation periods, all of our vessels hold safety<br />
management certificates, which certify that the vessels are operated in accordance with the approved Safety<br />
Management System. Furthermore, by the start of each respective navigation period, we obtain ship security<br />
62
certificates for all our vessels, which evidence that safety surveys have been carried out in respect of the vessels<br />
and that they have been deemed compliant with applicable safety requirements.<br />
In 2000 and 2001, HT Laevateenindus arranged for several major modifications to be made to our vessels in<br />
order to ensure the highest level of navigational and operational safety. HT Laevateenindus also renewed all<br />
lifesaving appliances onboard our vessels. As a result, all of our vessels are now fitted with modern, high-quality<br />
lifesaving appliances, life rafts and fast rescue boats.<br />
Currently, all of our vessels are fitted with VDRs (Voyage Data Recorder or “Black Box”) according to the<br />
IMO (International Maritime Organization) regulations in order to provide a useful tool for investigation, training<br />
and evaluation. AIS (Automatic Identification Systems), a useful navigational safety tool used during voyages,<br />
have already been installed on the vessels.<br />
HT Laevateenindus oversees the training and certification of crewmembers and ensures the compliance of<br />
crewmembers’ training with the STCW convention. All training and certification activities are carried out in<br />
cooperation with Estonian training centers and maritime academies. Vessel personnel undergo regular training<br />
according to applicable regulations to ensure readiness for possible emergency situations.<br />
We believe that all lifesaving equipment onboard our vessels meets the highest safety standards. We<br />
emphasize the establishment of good seamanship practices and nautical safety standards.<br />
Environment<br />
Environmental issues are one of the highest priorities of the <strong>Tallink</strong> Safety Management System. Vessels are<br />
maintained and operated in accordance with the MARPOL convention (International Convention for the<br />
Prevention of Pollution from Ships) in order to ensure that air and sea pollution is kept at the lowest practicable<br />
level. Our newest vessel Victoria I has, and the New Cruise Ferry will have, an operational exhaust gas catalyzer<br />
system installed and Romantika has been designed to allow for the installation of such system. The applicable air<br />
pollution level requirements are expected to be tightened and due to this the environmental systems in some of<br />
our older vessels will be modified during the vessels’ annual servicing. Our vessels may now begin to use fuel oil<br />
with lower sulphur content.<br />
All of our vessels have received all required international oil pollution prevention certificates. During their<br />
respective navigation periods, our vessels also hold valid sewage pollution prevention certificates to the extent<br />
required. Handling of garbage on the vessels is regularly recorded and several of our vessels also hold a special<br />
garbage pollution prevention attestation. As the certificates are issued for limited periods, we regularly apply for<br />
the renewal of the certificates before their expiry.<br />
We (as well as some of our competitors) operate high-speed ferries on the Helsinki-Tallinn route. According<br />
to a number of articles recently published in the Estonian press, there is a problem with stern waves of highspeed<br />
ferries, which may cause damage to the shores and port of an Estonian island, Aegna. To our knowledge,<br />
several investigations have been conducted regarding this matter, but it has not been proven that waves of the<br />
high-speed ferries cause damage to the shores and port. As a result, no material restrictions to the traffic of highspeed<br />
ferries have been adopted or proposed by the Estonian authorities.<br />
Trademarks<br />
We have registered the trademark “<strong>Tallink</strong>” in Estonia, Finland, Sweden and Germany. The registration<br />
process in Russia is pending. In Finland, the owner of the trademark is our Finnish subsidiary <strong>Tallink</strong> Finland<br />
Oy. We have also registered “<strong>Tallink</strong>” as a Community trademark (CTM). In addition, have several other<br />
registered trademarks, such as “Hansatee,” “Hansaway,” “Hansalink” and “Hansatee <strong>Baltic</strong> Service.”<br />
We do not own any patents, utility models or geographical indications, nor do we own, hold or use material<br />
proprietary industrial and/or intellectual property rights with respect to which we have not filed a patent,<br />
trademark or copyright application. For purposes of our business, we use various types of software programs<br />
under license agreements.<br />
We are currently using the following domain names: “tallink.ee,” “hansatee.ee” and “tallink.com.” The<br />
registered user of the domain name “tallink.se” is <strong>Tallink</strong> Sverige AB and, of the domain name “tallink.fi,”<br />
<strong>Tallink</strong> Finland Oy. Additionally, we have filed applications for the registration of the domain names “tallink.lv”<br />
and “tallinks.lv.”<br />
63
Material Contracts<br />
Shipbuilding Agreements<br />
On October 27, 2004, we entered into a shipbuilding agreement with Aker Finnyards Oy. According to the<br />
agreement, Aker Finnyards Oy will design, construct, equip, complete and deliver the New Cruise Ferry, which<br />
will have capacity for 2,800 passengers and will be a lengthened sister ship to the cruise ferry Victoria I delivered<br />
in 2004. The purchase price of EUR 165 million for the vessel is payable in several installments, four of which<br />
have already been made. The New Cruise Ferry is scheduled to be delivered in the spring of 2006.<br />
Pursuant to an option agreement with Aker Finnyards Rauma Oy dated April 21, 2005, as amended on<br />
August 1, 2005, we have an option to order another cruise ferry, a sister vessel to the New Cruise Ferry, for EUR<br />
161 million, to be delivered in May 2008, provided that we indicate our use of the option no later than<br />
December 22, 2005, or within 14 days of any notice by the builder of a potential order by a third party.<br />
On August 1, 2005, we and Aker Finnyards Oy entered into an agreement for the design, construction and<br />
delivery of a 1,900 passenger high-speed ro-pax ferry scheduled to be delivered in May 2007. The purchase price<br />
of EUR 110 million is payable in six instalments, one of which has already been made.<br />
Pursuant to an option agreement with Aker Finnyards Oy dated August 1, 2005, we have an option to order<br />
the construction of another high-speed ro-pax ferry, a sister vessel to the first high-speed ro-pax, for EUR 112.5<br />
million, to be delivered in January 2008, provided that we indicate our use of the option no later than January 31,<br />
2006, or within 14 days of any notice by the builder of a potential order by a third party.<br />
On October 13, 2005, <strong>Tallink</strong> Superfast Limited, our wholly-owned subsidiary, entered into an agreement<br />
with Fincantieri Cantieri Navali Italiani S.p.A. for the design, construction and delivery of a 2,080 passenger<br />
high-speed ro-pax ferry scheduled to be delivered in January 2008. The purchase price of EUR 113 million is<br />
payable in five instalments, one of which has already been made.<br />
Pursuant to a related option agreement with Fincantieri Cantieri Navali Italiani S.p.A., we have an option,<br />
exercisable on or prior to January 31, 2006, to order another high-speed ro-pax ferry, a sister vessel to the first<br />
high-speed ro-pax, for EUR 113 million, to be delivered within seven months of delivery of the first vessel.<br />
Charter Agreements<br />
All 12 vessels in our fleet are operated by either our parent company <strong>Tallink</strong> or by our wholly-owned<br />
subsidiary <strong>Aktsiaselts</strong> Hansatee Cargo. The vessels are owned by our ship-owning subsidiaries. Nine vessels<br />
have been bareboat-chartered by <strong>Tallink</strong> and three vessels by Hansatee Cargo. However, one of the vessels<br />
bareboat-chartered by <strong>Tallink</strong>, Vana Tallinn, has been time-chartered (i.e. with crew) to Hansatee Cargo.<br />
Therefore, vessels currently operating between Finland and Estonia are operated by <strong>Tallink</strong>, while vessels<br />
operating between Sweden and Estonia are operated by Hansatee Cargo. One of our cruise ferries, Fantaasia, was<br />
chartered to Algerie Ferries (Entreprise Nationale de Transport Maritimes de Voyageurs) for operation in the<br />
Mediterranean Sea (Algeria, France, Spain) between January and October 2005.<br />
Loan Agreements<br />
The loan agreements and guarantees entered into by us and our group companies are discussed in<br />
“Operating and Financial Review and Prospects—Liquidity and Capital Resources—Loan Agreements.”<br />
Insurance<br />
All 12 vessels in our fleet have been insured under insurance policies from Alandia Bolagen, Pohjola and<br />
Assuranceforeningen Gard-Gjensidig. The insurance policies cover the following risks (with certain exceptions<br />
and limitations with respect to each vessel): marine hull, increased value, loss of hire, freight interest, protection<br />
and indemnity. Several of our loan agreements contain covenants regarding the level of insurance (e.g. some of<br />
the loan agreements require the vessels to be insured at their fair market value or at 120 percent of the<br />
outstanding principal loan amount, whichever is higher).<br />
The aggregate fleet insurance coverage is EUR 505.8 million, including, for example, hull and machinery in<br />
the amount of EUR 357.8 million and increased value for the amount of EUR 90.0 million. The loss of hire<br />
maximum coverage for the total fleet is EUR 11.2 million. The fleet insurance policies are typically renewed for<br />
a period of one year, and the next renewal for marine hull insurance, increased value insurance, loss of hire<br />
insurance and freight interest insurance is scheduled for December 16, 2005.<br />
64
Protection and indemnity insurance is typically renewed annually, the next renewal date being February 20,<br />
2006. The limit of liability per incident under the protection and indemnity insurance is USD 4.25 billion, which<br />
is based on Insurance Club Statutes and Rules and determined by the International Group of P&I Clubs<br />
Reinsurance Arrangements.<br />
We believe that our insurance policies correspond to standard industry practices and meet the requirements<br />
of the covenants of our loan agreements.<br />
As a general rule, all rights and claims of ship-owning subsidiaries that arise from insurance agreements<br />
entered into by them in respect of the vessels that have been mortgaged as a security for loans taken by <strong>Tallink</strong><br />
and/or such ship-owning subsidiaries have been assigned to the respective lenders. Since all of our vessels have<br />
been bareboat-chartered to <strong>Tallink</strong> or Hansatee Cargo, their respective rights and claims under respective<br />
insurance agreements have also been assigned to the lenders. In some cases, loan agreements that are secured by<br />
such mortgage require that rights and claims of all assured parties under insurance contracts be assigned to the<br />
respective lender.<br />
All motor vehicles used by <strong>Tallink</strong> are covered by the mandatory third party liability insurance.<br />
Employees and Labor Relations<br />
The average number of our employees by type of activity for each of the financial years ended August 31,<br />
2003, 2004 and 2005 is set forth in the table below:<br />
Financial year ended August 31,<br />
2003 2004 2005<br />
Onshorestaff....................................................... 340 561 753<br />
Onboard staff ...................................................... 1,581 1,810 1,957<br />
Total ............................................................. 1,921 2,371 2,710<br />
The average number of our employees by country of employment for each of the financial years ended<br />
August 31, 2003, 2004 and 2005 is set forth in the table below:<br />
Financial year ended August 31,<br />
2003 2004 2005<br />
Estonia ........................................................... 1,711 2,150 2,461<br />
Finland ........................................................... 136 140 155<br />
Sweden ........................................................... 74 79 88<br />
Russia ............................................................ 0 3 6<br />
Total ............................................................. 1,921 2,372 2,710<br />
On August 30, 2005, we renewed our agreement with the Estonian Seamen’s Independent Union (Eesti<br />
Meremeeste Sõltumatu Ametiühing) regarding salary levels of our onboard staff. The agreement has a term of<br />
three years, which commenced on September 1, 2005. The annual increase in employees’ salaries under the<br />
agreement is five percent. Distribution of salary funds amongst work positions has been agreed in a supplemental<br />
agreement between <strong>Tallink</strong>, the Estonian Seamen’s Independent Union and our subsidiaries Hansaliin and HT<br />
Laevateenindus.<br />
Legal Proceedings<br />
Neither <strong>Tallink</strong> nor any of our subsidiaries have during the 12 months preceding the date of this offering<br />
memorandum been or are currently involved in any legal or arbitral proceedings or material disputes which may<br />
have or have had a material adverse effect on our business, results of operations or financial condition. Our<br />
management is not aware of any facts or circumstances that could reasonably be expected to lead to any material<br />
claims being made against us or any of our subsidiaries in the foreseeable future.<br />
On November 19, 2004, we filed a claim with the European Commission regarding the fees charged by the<br />
Port of Tallinn, which is pending. We have also filed claims against the Maritime Administration and the<br />
Ministry of Economic Affairs and Communications regarding the lighthouse and ice-breaking fees charged to<br />
them. These matters are also pending.<br />
65
Osaühing HT Meelelahutus, one of our subsidiaries, was previously involved in a dispute with the Estonian<br />
Tax Board regarding payment of income tax. On March 18, 2003, the Tax Board issued a formal notice of<br />
assessment according to which HT Meelelahutus was obliged to pay corporate income tax for the years 1998 and<br />
1999 in the amount of EEK 379,167 and income tax on expenses not related to business for the year 2000 in the<br />
amount of EEK 134,988 (plus interest in the amounts of EEK 234,119 and EEK 54,814, respectively). HT<br />
Meelelahutus challenged the formal notice of assessment. On June 5, 2003, the Tax Board approved the<br />
challenge and repealed in full the formal notice of assessment issued on March 18, 2003. The Tax Board<br />
indicated, however, that, in the event of additional evidence, a new formal notice of assessment might be issued<br />
which could increase the tax liability.<br />
Real Estate and Premises<br />
The table below describes our main business premises, all of which are leased by <strong>Tallink</strong>.<br />
Location Nature of lease Area (sq. m.)<br />
Tallinn,Tartumnt13 ......... Headquarters leased from SEB Eesti Ühispank 2,941<br />
Tallinn, Tallinn Old Port area . . . Several operational premises leased from the Port of Tallinn 1,630<br />
Paldiski,Raepõik10 ......... Leased by AS Hansatee Cargo from the Port of Tallinn 70<br />
Helsinki, Several locations ..... Leased from various lessors 1,190<br />
Helsinki, Länsisatama ......... Leased from the Port of Helsinki 350<br />
Stockholm, Terminal 2 ........ Leased 960<br />
In addition, we own 3,065 square meters of residential land at Käsmu village in Estonia. The site contains<br />
the historic building of Käsmu Marine School, an architectural and historic monument subject to restrictions<br />
arising from the Estonian Heritage Act, including a right of pre-emption in favour of the Republic of Estonia.<br />
This real estate is used for training purposes.<br />
Organization<br />
Operational Organization<br />
Our headquarters are located in Tallinn. The operational structure of our business is similar to the legal<br />
structure of our group of companies and is divided into ship operations, marketing companies and service<br />
companies. Each ship is managed as a separate entity comprised of technical crew and service staff. Sales<br />
companies in Finland and Sweden and <strong>Tallink</strong> in Estonia are responsible for ticket sales to passengers in their<br />
respective countries. Company level functions mainly administered out of Tallinn include finance, service and<br />
maintenance and purchasing.<br />
66
Legal Structure<br />
<strong>Aktsiaselts</strong> <strong>Tallink</strong> <strong>Grupp</strong> is the operating parent company of our group of companies. Set forth below is a<br />
structural chart showing the legal entities belonging to our group of companies.<br />
Note: All the companies are wholly-owned by <strong>Tallink</strong>, except for the following: (i) HT Hulgi Tolliladu and TDF Kommerts are both whollyowned<br />
by <strong>Tallink</strong> Duty Free, (ii) TLG Meedia is jointly-owned by <strong>Tallink</strong> (2/3) and Mr. Peter Roose (1/3), and (iii) <strong>Tallink</strong> Sverige AB is<br />
wholly-owned by Hansatee Cargo. All ship-owning subsidiaries are located and registered in Cyprus (with the exception of Kapella Shipping<br />
Ltd, which is located and registered in the Bahamas).<br />
67
Related Party Transactions<br />
We and certain of our other group companies have entered into certain agreements with companies affiliated<br />
with our group. The most relevant of these recent and ongoing agreements are the following:<br />
• TLG Hotell rents the Hotell <strong>Tallink</strong> building in Tallinn from a real estate company, Osaühing Vara<br />
HTG, jointly owned by our largest shareholder Infortar and by E.L.L. Kinnisvara <strong>Aktsiaselts</strong>. The rent<br />
period is ten years from April 30, 2004, subject to an automatic extension period of five years, unless<br />
either of the parties gives a notice of termination at least three months in advance of the expiry of the<br />
original term. The rent payment consists of an annual fixed payment of EUR 1,917,345, plus 11 percent<br />
of the turnover of TLG Hotell’s last financial year (subject to certain minimum and maximum amounts)<br />
from September 1, 2005;<br />
• TLG Hotell has entered into a letter of intent with OÜ Sunbeam (a wholly-owned subsidiary of<br />
Infortar), which is the owner of the relevant real estate upon which the new conference and spa hotel is<br />
being built. The letter of intent relates to the renting and operation of the new hotel by TLG Hotell and<br />
sets forth that the rental period will be ten years and that the rent shall consist of an annual fixed<br />
payment in the amount of ten percent of the investments in the construction of the hotel made by<br />
OÜ Sunbeam, plus 25 percent of the profit of TLG Hotell from the operation of this hotel;<br />
• <strong>Tallink</strong> and Infortar have entered into a service agreement for the provision by Infortar of management<br />
services, arrangement of meetings, provision of legal services and preparation of all necessary<br />
documents for our supervisory council. The annual fee for the services provided by Infortar is EEK<br />
720,000. The agreement has been entered into for an unspecified term;<br />
• <strong>Tallink</strong> and Infortar have entered into an authorization agreement for the execution of legal and other<br />
operations by <strong>Tallink</strong> in the interests of and in the name and account of Infortar;<br />
• <strong>Tallink</strong> and Hansatee Cargo have each concluded an agreement with H.T. Valuuta for the provision of<br />
currency exchange services on the vessels operated by the group companies;<br />
• <strong>Tallink</strong> leases premises of 93 square meters from OÜ Mersok, which is a company owned by Enn Pant,<br />
the Chairman of our management board and our CEO;<br />
• In 2003, <strong>Tallink</strong> obtained two loans from SEB Eesti Ühispank amounting to an aggregate of<br />
EEK 237,503,000. <strong>Tallink</strong> assumed such debt obligations in order to partially set-off <strong>Tallink</strong>’s<br />
obligation to pay to Infortar the purchase price for the shares of Hansalink Limited (the company which<br />
owns the vessel <strong>Tallink</strong> AutoExpress 2) that <strong>Tallink</strong> purchased from Infortar in 2003. The loans are<br />
secured, among other things, by a guarantee issued by Infortar for which we pay a certain fee;<br />
• In 2002, Infortar granted a loan to <strong>Tallink</strong> Stockholm Line Limited (the balance of which was<br />
approximately EUR 6.3 million as of August 31, 2005) to partly finance the purchase of the cruise ferry<br />
Regina <strong>Baltic</strong>a. The interest payable from the loan is seven percent annually. The maturity of the loan is<br />
five years and repayments are to be made in five equal annual installments.<br />
We have concluded several material agreements with our wholly-owned subsidiaries, such as charter<br />
agreements, management services agreements, agency agreements, ship management agreements, agreements for<br />
provision of security and entertainment services, loan agreements, and for other purposes. We have also issued<br />
various guarantees for securing the performance of obligations of our subsidiaries, associates and other related<br />
parties (e.g., AS Vaba Maa). For additional information, see Note 20 to the financial statements of each financial<br />
year. We believe that all of the above agreements have been entered into on an arm’s length basis.<br />
68
MANAGEMENT<br />
Structure of Our Management<br />
In accordance with the Estonian Commercial Code and our articles of association, corporate governance,<br />
management and administration are divided among our shareholders represented at the general meetings of<br />
shareholders, our supervisory council and our management board. See “Estonian Securities Market—Estonian<br />
Company Law Issues” for further information.<br />
Supervisory Council<br />
Our supervisory council is responsible for planning our business activities, organizing our management by<br />
electing members to our management board, approving our budget and supervising the activities of our<br />
management board. See “Estonian Securities Market—Estonian Company Law Issues” for further information on<br />
the tasks of the supervisory council.<br />
According to our articles of association the supervisory council consists of five to seven members that are<br />
elected for three financial years at a time. The members of the supervisory council elect the chairman from<br />
among themselves. The rules of the Tallinn Stock Exchange (the “TSE Rules”) provide that if any shareholder<br />
holds more than 30 percent of the votes represented by shares in the share capital of the issuer, the composition<br />
of the supervisory council of the issuer must include at least two members who are not connected with such<br />
shareholder. The current composition of our supervisory council is in compliance with this requirement.<br />
Pursuant to the shareholders’ agreement dated September 18, 2003, one member of the supervisory council<br />
is nominated and can be removed by Citicorp International Finance Corporation (CIFC) and another by other<br />
shareholders holding not less than 51 percent of the shares that were issued in connection with the 2003 private<br />
placement transaction. The shareholders’ agreement will be terminated upon completion of this Offering.<br />
The table below sets forth the members of our supervisory council, their positions, year of appointment and<br />
certain related information.<br />
Name Year of birth Member since Position Current term expires<br />
Toivo Ninnas ......................... 1940 1997 Chairman February 5, 2008<br />
Andres Lipstok ........................ 1957 2000 Member February 9, 2006<br />
Eve Pant ............................. 1968 1997 Member February 5, 2008<br />
Ain Hanschmidt ....................... 1961 2005 Member February 5, 2008<br />
Sunil Kumar Nair ...................... 1966 2003 Member December 4, 2006<br />
Kustaa Lauri Äimä ..................... 1971 2002 Member February 5, 2008<br />
The business address of all members of the supervisory council is: c/o <strong>Aktsiaselts</strong> <strong>Tallink</strong> <strong>Grupp</strong>, Tartu mnt.<br />
13, 10145 Tallinn, Estonia.<br />
Mr. Toivo Ninnas (born 1940) was elected as Chairman of the supervisory council in 1997 and was<br />
re-elected as Chairman in 2005. He graduated from the Far East Higher Sea Academy in Russia in 1966.<br />
Previously, he served at ESCO from 1972 to 1997 where he became Director General. He also acts as a<br />
supervisory council member of Transiidikeskuse AS and a member of the management boards of AS<br />
Taastusravikeskus Viiking, OÜ Sunbeam, OÜ Viiking Külalissadam and OÜ Tekali. He is the president of the<br />
non-profit association Estonian Ship-Owners’ Association (Eesti Laevaomanike Liit).<br />
Mr. Andres Lipstok (born 1957) was elected as a member of the supervisory council in 2000. He graduated<br />
from the Faculty of Economics, University of Tartu, Estonia, in 1980. He has also been the Governor of the Bank<br />
of Estonia since 2005. Previously, he was a member of the Estonian Parliament from 1995 to 2005, worked as<br />
the Minister of Economic Affairs of Estonia from 1995 to 1996 and was the Minister of Finance of Estonia from<br />
1994 to 1995. He acts as a member of the supervisory council of OÜ Haapsalu HMR and as a member of the<br />
management boards of AS Hami Invest and the non-profit association Eesti Olümpiakomitee (Estonian Olympic<br />
Committee).<br />
Ms. Eve Pant (born 1968) was elected as a member of the supervisory council in 1997. She graduated from<br />
the Tallinn School of Economics, Estonia, in 1992. She also acts as a member of the management boards of<br />
Infortar (since 1997), OÜ Vara HTG, OÜ Inforte, OÜ Mersok, AS Tailwind, OÜ Inf Invest, OÜ Inf Maja, OÜ<br />
Infor Invest, OÜ Abante and OÜ Villore and a supervisory council member of AS Vaba Maa. She is the sister of<br />
Enn Pant, our CEO and Chairman of our management board.<br />
69
Mr. Ain Hanschmidt (born 1961) was elected as a member of the supervisory council in 2005 (he was<br />
previously also a member of the supervisory council from 1997 to 2000). He graduated from the Tallinn<br />
Polytechnic Institute, Estonia, in 1984. He served as Chairman (CEO) of AS SEB Eesti Ühispank from 1992 to<br />
2005 and, in 2005, as Chairman of the supervisory council of AS SEB Eesti Ühispank. He is also a member of<br />
the management board (CEO) of Infortar and the management board of the non-profit association Eesti Golfi Liit<br />
(Estonian Golf Association) as well as a member of the supervisory councils of AS Vaba Maa, OÜ TopSpa<br />
Kinnisvara, AS Heal, OÜ Delegatsioon, AS KS Holding and OÜ Bolton Realestate. See “Principal and Selling<br />
Shareholders—Infortar” for information regarding Ain Hanschmidt’s ownership of <strong>Tallink</strong> through Infortar.<br />
Mr. Sunil Kumar Nair (born 1966) was elected as a member of the supervisory council in 2003. He<br />
graduated from Yale University, the United States, in 1995 (MBA in finance and strategy) and the University of<br />
Madras, India, in 1988 (Master’s degree in commerce). He has been a Managing Director of Citigroup Venture<br />
Capital International since 1999 and also acts as a director of Lupin Laboratories Limited (Mumbai, India),<br />
Hikma Pharmaceuticals (Jordan) and UAB Palink (Lithuania). He served as a Vice President of Salomon Smith<br />
Barney, Citigroup (New York) from 1997 to 1999 and worked as a consultant at McKinsey & Company from<br />
1995 to 1997.<br />
Mr. Kustaa Lauri Äimä (born 1971) was elected as a member of the supervisory council in 2002. He<br />
graduated from the University of Helsinki, Finland, with a Masters degree in Economics. He is a Fund Manager<br />
for Danske Capital Finland and a member of the board of directors of DCF Fund I SICAV and DCF Fund II<br />
SICAV (Luxembourg). He is also a General Manager of Amber Trust Management SA (Luxembourg) as well as<br />
a General Manager and a member of the board of directors of Amber Trust II Management SA (Luxembourg),<br />
both joint venture private equity funds with Firebird. He was appointed to the supervisory council as the<br />
representative of the investors involved in the private placement in April 2002. Before joining Danske Capital in<br />
2000, he worked at the Bank of Bruxelles Lambert Group and the ING Group’s investment management<br />
operations. Before BBL and ING, he worked for the Bank of Finland, where he concluded research on the<br />
transition economies of Central and Eastern Europe. He also acts as a member of the supervisory councils of<br />
Salva Kindlustuse AS and OÜ Vettel as well as the Lithuanian company UAB Litagra.<br />
Management Board<br />
The management board manages our daily business operations. According to our articles of association, the<br />
powers of the management board include, among other things, the right to execute the following transactions<br />
without the approval of the supervisory council:<br />
• Acquisition or disposal of shareholdings in other companies;<br />
• Acquisition, disposal or winding up of businesses;<br />
• Transfer or encumbrance of immovable property (land and buildings) or registered movable property<br />
(all other registered assets);<br />
• Establishment or closing of foreign branches;<br />
• Investing in excess of the budget for the respective financial year;<br />
• Borrowing or incurring debt in excess of the amounts budgeted for the respective financial year; and<br />
• Issuing loans or guarantees and securing debt, even if this is beyond the ordinary course of our business.<br />
According to our articles of association, the management board shall consist of three to five members that<br />
are elected for three years at a time. The Chairman of the management board is elected by the supervisory<br />
council. Our management structure, including the areas of responsibility and reporting, has been approved by the<br />
management board as of February 1, 2004. See “Estonian Securities Market—Estonian Company Law Issues”<br />
for further information on the tasks of the management board.<br />
The table below sets forth the members of our management board, their positions, year of appointment and<br />
certain related information.<br />
Name Year of birth Member<br />
since Position Current term expires<br />
Enn Pant ..................... 1965 1996 Chairman, CEO June 27, 2006<br />
Kalev Järvelill ................ 1965 1998 Member November 10, 2007<br />
Keijo Erkki Mehtonen .......... 1949 1998 Member, Sales and Marketing November 10, 2007<br />
Andres Hunt .................. 1966 2002 Member, CFO February 22, 2008<br />
The business address of all members of the management board is: c/o <strong>Aktsiaselts</strong> <strong>Tallink</strong> <strong>Grupp</strong>, Tartu mnt.<br />
13, 10145 Tallinn, Estonia.<br />
70
Mr. Enn Pant (born 1965) was elected as Chairman of our management board in 1996 and was re-elected<br />
as our Chairman in 2003. He is also our CEO. He graduated from the Faculty of Economics, University of Tartu,<br />
Estonia, in 1990. Mr. Pant also acts as a member of the supervisory councils of Infortar, OÜ Linandell, OÜ Vara<br />
HTG, AS Tailwind, OÜ Fastinvest and AS H.T. Valuuta. He was also the Chancellor of the Ministry of Finance<br />
of Estonia from 1992 to 1996. He is the brother of Eve Pant, a member of <strong>Tallink</strong>’s supervisory council. See also<br />
“Principal and Selling Shareholders—Infortar” for information regarding Enn Pant’s ownership of <strong>Tallink</strong><br />
through Infortar.<br />
Mr. Kalev Järvelill (born 1965) was elected as a member of the management board in 1998. He graduated<br />
from the Faculty of Economics, University of Tartu, Estonia, in 1993. Mr. Järvelill is also a member of the<br />
supervisory councils of Infortar, OÜ Linandell, OÜ Fastinvest and OÜ Vara HTG. He was the General Director<br />
of the Estonian Tax Board from 1995 to 1998 and the Vice Chancellor of the Ministry of Finance of Estonia from<br />
1994 to 1995. See “Principal and Selling Shareholders—Infortar” for information regarding Kalev Järvelill’s<br />
ownership of <strong>Tallink</strong> through Infortar.<br />
Mr. Keijo Erkki Mehtonen (born 1949) was elected as a member of the management board, with<br />
responsibility for sales and marketing in 1998. He has worked for <strong>Tallink</strong> Finland Oy since 1989. Mr. Mehtonen<br />
is also a member of the supervisory councils of Infortar and OÜ Fastinvest.<br />
Mr. Andres Hunt (born 1966) was elected as a member of the management board in 2002. He has also<br />
acted as the CFO of the <strong>Tallink</strong> group since 1998. He graduated from the Faculty of Economics, Academy of<br />
Agriculture, Estonia, in 1992. Mr. Hunt is also a member of the supervisory council of AS Tailwind and a<br />
member of the management board of OÜ Kümnis Konsultatsioonid. From 1995 to 1998, he worked as the<br />
director of the Tax Policy Department at the Ministry of Finance of Estonia.<br />
Other Key Executives<br />
In addition to the members of our supervisory council and the management board set out above, various<br />
other key positions in our group are currently held by the following members of our corporate management team.<br />
Name Year of birth Member since Position<br />
MeelisAsi .................................... 1964 1997 Chief Accountant<br />
ÜloKollo ..................................... 1937 1996 Technical Director<br />
AarnePikk .................................... 1964 2005 Marketing Director<br />
Ingrid Preeks .................................. 1949 1997 Personnel Director<br />
Mare Puusaag ................................. 1956 1997 Chief Legal Counsel<br />
Janek Stalmeister ............................... 1974 2005 Finance Director<br />
VeikoSuigussaar ............................... 1971 2005 Administrative Director<br />
Taavi Tiivel ................................... 1977 2005 Service Director<br />
The business address of all key executives is: c/o <strong>Aktsiaselts</strong> <strong>Tallink</strong> <strong>Grupp</strong>, Tartu mnt. 13, 10145 Tallinn,<br />
Estonia.<br />
Mr. Meelis Asi (born 1964) has worked as our Chief Accountant since 1997. He graduated from the Faculty<br />
of Economics, University of Tartu, Estonia, in 1992. He is a member of the management boards of AS Meelis<br />
Asi Konsultatsioonid, OÜ Fastinvest, OÜ Trigoner and Compo Investeeringud OÜ. He also currently serves as a<br />
member of the supervisory councils of OÜ Maleva Puit, AS HTG Partner, Vivarek Transpordi AS and AS H.T.<br />
Valuuta. From 1995 to 1996, he worked as the Chief Accountant of AS Tallinna Sadam, and from 1994 to 1995,<br />
he was Assistant Head of the Tax Policy Department of the Ministry of Finance of Estonia.<br />
Mr. Ülo Kollo (born 1937) has worked as our Technical Director since 1996. He graduated from the<br />
St. Petersburg Naval Academy, Russia, where he specialized in ship navigation, in 1972. From 1992 to 1996, he<br />
was the CEO of <strong>Aktsiaselts</strong> Hansatee and <strong>Aktsiaselts</strong> Inreko Laevad and, from 1979 to 1992, he worked as the<br />
captain of the vessel Georg Ots.<br />
Mr. Aarne Pikk (born 1964) has worked as our Marketing Director since 2005. He graduated from the<br />
Faculty of Physical Education, University of Tartu, Estonia, in 1989. Before joining the group in 2004, he<br />
worked at Ühisliisingu AS and SEB Eesti Ühispank from 1995 to 2004 as a Client Service Manager and Loan<br />
Manager. He is also a member of the supervisory council of Mihkel Restoranid AS.<br />
71
Ms. Ingrid Preeks (born 1949) has worked as our Personnel Director since 1997. She graduated from the<br />
University of Tartu, Estonia, with a B.A. in Social Psychology in 1974. From 1994 to 1996, she was the Head of<br />
the Administrative Development Department in the Ministry of Finance of Estonia. From 1990 to 1992, she was<br />
a Counsellor of the Government of Estonia.<br />
Ms. Mare Puusaag (born 1956) has worked as our Chief Legal Counsel since 1997. She graduated from the<br />
Faculty of Law, University of Tartu, Estonia, in 1982. From 1995 to 1997, she served as the Head of the Legal<br />
Department of the Ministry of Finance of Estonia and, from 1982 to 1995, she worked in the Department of<br />
Business Law in the Ministry of Justice of Estonia.<br />
Mr. Janek Stalmeister (born 1974) has worked as our Finance Director since 2005. He graduated from the<br />
International University of Social Sciences “LEX,” Estonia, in 1999. From 1999 to 2004, he worked at <strong>Tallink</strong> as<br />
a Financial Advisor/Controller and Deputy Finance Director, from 1997 to 1999, he worked as a stock broker,<br />
Deputy CEO and CEO at AS HT Finants and, from 1994 to 1997, he was the Head of the External Debt Division<br />
at the Estonian Ministry of Finance. He is also a member of the supervisory council of AS Tailwind.<br />
Mr. Veiko Suigussaar (born 1971) has worked as our Administrative Director since 2005. From 1991 to<br />
1993, he was an Inspector in the Labour Inspectorate Board. Since 1995, he has also been a member of the<br />
management board of OÜ Revehold and a member of the supervisory council of AS Gastrolink.<br />
Mr. Taavi Tiivel (born 1977) has worked as a Service Director since 2005. He graduated from the Faculty<br />
of Law of the University Nord, Estonia, in 2001 and is currently continuing his studies at the University of<br />
Audentes. Before joining us in 2004, he worked as a Specialist in the State Chancellery from 2001 to 2003.<br />
Management Holdings<br />
Prior to the Offering, the members of our supervisory council own, directly or indirectly, a total of<br />
20,275,133 Shares, corresponding to approximately 18.43 percent of the Shares and the votes attached to the<br />
Shares.<br />
Prior to the Offering, the members of our management board own, directly or indirectly, a total of<br />
40,954,709 Shares, corresponding to approximately 37.23 percent of the Shares and the votes attached to the<br />
Shares.<br />
The table below sets forth the shareholdings of the members of our supervisory council, the members of our<br />
management board and other key executives prior to the Offering:<br />
Name Position<br />
Direct<br />
shareholding<br />
(number of<br />
Shares)<br />
Direct<br />
shareholding<br />
(%)<br />
Indirect<br />
shareholding<br />
(%)<br />
Total<br />
shareholding<br />
(%)<br />
Toivo Ninnas ............ Chairman of the<br />
supervisory council 4,000 0.00 3.88 3.88<br />
Andres Lipstok ........... Member of the supervisory<br />
council 52,000 0.05 0.02 0.07<br />
Eve Pant ................ Member of the supervisory<br />
council 123,800 0.11 0.10 0.21<br />
Ain Hanschmidt .......... Member of the supervisory<br />
council 278,920 0.25 13.97 14.22<br />
Kustaa Lauri Äimä ........ Member of the supervisory<br />
council — — 0.04 0.04<br />
Enn Pant ................ Chairman of the<br />
management board 477,000 0.43 16.70 17.13<br />
Kalev Järvelill ............ Member of the<br />
management board 319,200 0.29 14.27 14.56<br />
Keijo E. Mehtonen ........ Member of the<br />
management board 957,600 0.87 4.35 5.22<br />
Andres Hunt ............. Member of the<br />
management board 84,000 0.08 0.24 0.32<br />
MeelisAsi............... ChiefAccountant — — 1.04 1.04<br />
ÜloKollo ............... Technical Director 284,000 0.26 — 0.26<br />
Ingrid Preeks ............. Personnel Director 80,000 0.07 0.19 0.26<br />
Mare Puusaag ............ ChiefLegal Counsel 15,000 0.01 — 0.01<br />
VeikoSuigussaar ......... Administrative Director 7,000 0.01 — 0.01<br />
As of the date of this offering memorandum, the members of our supervisory council and management<br />
board and our key executives do not have shareholdings, either direct or indirect, in any of our group companies<br />
other than <strong>Tallink</strong>.<br />
72
Some members of our supervisory council, management board or key executives have, during the past year,<br />
acquired Shares in OTC transactions on the secondary market at the then prevailing market prices, which may<br />
have been lower than the Offer Price.<br />
Management Remuneration and Benefits<br />
Supervisory Council<br />
Pursuant to the decision of our general meeting of shareholders held on February 5, 2005 the Chairman of<br />
our supervisory council shall receive EEK 15,000 per month and members of our supervisory council shall each<br />
receive EEK 12,000 per month. The salaries and other remuneration paid by our group companies to the<br />
members of our supervisory council for the financial year ended August 31, 2005, totaled EEK 1,053,000.<br />
We provide Mr. Ninnas with car and mobile phone benefits. No service agreements have been concluded by<br />
us with the members of our supervisory council providing for benefits upon termination of appointment as a<br />
member of the supervisory council.<br />
Management Board<br />
The salaries and other remuneration paid by our group companies to the members of our management board<br />
for the financial year ended August 31, 2005 totaled EEK 8.2 million. We provide car and mobile phone benefits<br />
for the members of our management board. We further undertake to provide the members of the management<br />
board with social benefits similar to those of employees working under employment contracts.<br />
Upon termination of the service agreement of a member of the management board, we shall pay<br />
compensation to such member in an amount corresponding to the member’s 12-month salary. In the event that<br />
the agreement is terminated prematurely by us without a significant reason, we shall pay additional compensation<br />
to such member in an amount corresponding to the member’s six-month salary. No compensation shall be paid in<br />
the event that such member resigns, except due to health reasons (in which case compensation in an amount<br />
corresponding to the member’s 12-month salary shall be paid). A member who has breached his duties by<br />
showing gross negligence and has thereby caused damage to us is entitled to compensation in an amount<br />
corresponding to the member’s three-month salary. The above terms and benefits are applied to all members,<br />
except for Mr. Mehtonen who will receive compensation according to his agreement as a member of the<br />
management board of <strong>Tallink</strong> Finland Oy. In the event that the agreement is terminated prematurely by <strong>Tallink</strong><br />
Finland Oy, Mr. Mehtonen will receive compensation in an amount equal to his 24-month salary. No<br />
compensation shall be paid in case he resigns or in the event that the agreement is terminated due to breach of his<br />
duties.<br />
Other Key Executives<br />
The salaries and other remuneration paid by our group companies to our key executives for the financial<br />
year ended August 31, 2005 totaled EEK 5.3 million.<br />
Incentive Schemes, Loans, Transactions with <strong>Tallink</strong>, Legal Issues<br />
On January 11, 2005, our supervisory council approved in principle a bonus scheme, including a share<br />
participation scheme, for our key management, pursuant to which our key management may be rewarded with<br />
Shares based on the approved net profit for the financial years ending August 31, 2005 and 2006. Other than<br />
based on their rights as shareholders, no member of our supervisory council or our management board has any<br />
options to purchase or sell Shares, or rights to subscribe for New Shares or shares in any other company within<br />
our group.<br />
We have not issued any loans or guarantees or provided any collateral for the benefit of any member of our<br />
supervisory council or management board.<br />
No member of our supervisory council or management board has had any interest in transactions effected by<br />
us, which are unusual in their nature or which contain unusual terms or conditions (such as purchases other than<br />
in the ordinary course, acquisition or disposal of fixed assets), during the financial year ended August 31, 2004<br />
and 2005 or the current financial year. See also “Business—Related Party Transactions.”<br />
We are not aware of any convictions in relation to fraudulent offences, bankruptcies, receiverships or<br />
liquidations or any official public incrimination and/or sanctions with respect to our supervisory council<br />
members, our management board members or other key executives. We are further not aware of any potential<br />
conflicts of interest between ourselves and their personal interests or other duties.<br />
73
PRINCIPAL AND SELLING SHAREHOLDERS<br />
Ownership Structure<br />
According to our shareholder register kept by the operator of the Estonian Central Registry of Securities<br />
(“ECRS”), we had 252 shareholders as of November 18, 2005. The table below sets forth details of our ten<br />
largest shareholders and their respective holdings prior to the Offering. Our current shareholders are permitted to<br />
acquire Offer Shares in the Offering.<br />
Prior to the Offering<br />
Number of<br />
Shareholder<br />
Shares %<br />
Infortar AS1 ............................................................... 61,084,808 55.53<br />
ING Luxembourg S.A. 2 ...................................................... 13,902,104 12.64<br />
Citibank Hong Kong/Citicorp International Finance Corporation ..................... 6,997,648 6.36<br />
Skandinaviska Enskilda Banken AB Clients ...................................... 5,543,992 5.04<br />
Keskinäinen Eläkevakuutusyhtiö Ilmarinen ...................................... 3,599,996 3.27<br />
Firebird Republics Fund Ltd .................................................. 2,984,304 2.71<br />
Danske Capital Finland Oy Clients Account ..................................... 2,372,501 2.16<br />
Nordea Bank Finland Plc Corporate Clients ...................................... 1,519,996 1.38<br />
Hansabank’s Clients ........................................................ 1,019,997 0.93<br />
Keijo Erkki Mehtonen ....................................................... 957,600 0.87<br />
Totaltenlargest ............................................................ 99,982,946 90.89<br />
Remaining shareholders ..................................................... 10,017,054 9.11<br />
Total..................................................................... 110,000,000 100.00<br />
1 Enn Pant (Chairman of our management board and our CEO), Kalev Järvelill (a member of our management board) and Ain Hanschmidt<br />
(a member of our supervisory council) beneficially own, directly or indirectly, 29.42 percent, 25.62 percent and 25.15 percent,<br />
respectively, of the shares in Infortar. For information regarding all direct and indirect holdings of Shares by our management, see also<br />
“Management—Management Holdings” and “—Infortar” below.<br />
2 According to information available to us, ING Luxembourg S.A. holds our Shares as nominee on behalf of a number of institutional<br />
investors including two of the Selling Shareholders, Amber Trust S.C.A and DCF Fund (II) <strong>Baltic</strong> States.<br />
Our major shareholders do not have any preferential voting rights compared to our remaining shareholders.<br />
Infortar<br />
As of the date of this offering memorandum, Infortar owned 55.53 percent of our outstanding Shares.<br />
Infortar is an Estonian investment company with interests in the shipping, real estate and printing industries.<br />
Infortar was originally formed as an investment company to acquire a significant portion of our shares in 1997 in<br />
connection with the restructuring of our company involving a management buy-out. The members of the new<br />
management team that were retained in connection with the restructuring, certain companies related to SEB Eesti<br />
Ühispank and a number of other entities and individuals became shareholders of Infortar.<br />
Today, the principal shareholder of Infortar is an Estonian holding company, Linandell OÜ, which, as of the<br />
date of this offering memorandum, held approximately 75 percent of Infortar’s shares according to the ECRS.<br />
Thus, Linandell is <strong>Tallink</strong>’s ultimate parent company. The remaining shares in Infortar are held by a number of<br />
smaller investors, none of which holds more than ten percent of such shares. Linandell is ultimately, directly or<br />
indirectly, controlled by Enn Pant, Chairman of our management board and our CEO, Kalev Järvelill, a member<br />
of our management board, and Ain Hanschmidt, a member of our supervisory council, each of whom also owns<br />
shares directly in Infortar. See also “Management—Management Holdings.”<br />
Originally, Mr. Pant owned, directly or indirectly, approximately two-thirds of the shares in Linandell and<br />
Mr. Järvelill owned, directly or indirectly, the remaining shares. We have been informed that, in April 2004, a<br />
holding company, OÜ Abante, became the owner of approximately one-third of the total shares in Linandell. In<br />
August 2005, Mr. Hanschmidt became the Chairman of the management board of Infortar, a position which was<br />
previously held by Eve Pant, the sister of Mr. Pant and a member of our supervisory council. In connection<br />
therewith, the entire shareholding in Abante was transferred to Mr. Hanschmidt. The terms of the transaction<br />
have not been disclosed by the parties.<br />
As Mr. Hanschmidt was from 1992 to 2005 the Chairman of the management board (CEO) and, from<br />
January to August 2005, the Chairman of the supervisory council, of one of our lenders, SEB Eesti Ühispank, at<br />
least two investigations were initiated in Estonia: one by SEB Eesti Ühispank and one by the EFSA. In<br />
74
September 2005, SEB Eesti Ühispank published a summary of the findings of its internal investigation. There<br />
were no findings of any wrongdoing by either Mr. Hanschmidt or SEB Eesti Ühispank in respect of the loans<br />
granted to us. The EFSA’s investigation focused on clarifying circumstances pertaining to the internal<br />
investigation by SEB Eesti Ühispank as well as other circumstances not forming part of such investigation. The<br />
EFSA stated following its investigation that it had not found any evidence of wrongdoing as of the date of the<br />
EFSA’s statement of September 23, 2005.<br />
Selling Shareholders<br />
The Sale Shares offered for sale in the Offering are being offered by Infortar, Citibank Hong Kong/Citicorp<br />
International Finance Corporation, Amber Trust S.C.A and DCF Fund (II) <strong>Baltic</strong> States.<br />
Pursuant to a shareholders’ agreement dated September 18, 2003 (as described below, the “shareholders’<br />
agreement”), certain of our shareholders may have rights to participate in the portion of the Offering relating to<br />
offers and sales by selling shareholders, and, accordingly, a portion of the Shares to be sold by the Selling<br />
Shareholders may be sold by any of them on behalf of such shareholders. The participation in the Offering of the<br />
parties to the shareholders’ agreement will be decided solely by agreement among the parties to the shareholders’<br />
agreement.<br />
The registered office of Infortar is at Tartu mnt 13, 10145, Tallinn. Prior to the Offering, Infortar held<br />
61,084,808 Shares constituting 55.53 percent of the votes attached to the Shares. For a more detailed description<br />
of Infortar, see “Principal and Selling Shareholders—Infortar.”<br />
The registered office of Citibank Hong Kong/Citicorp International Finance Corporation is New Castle<br />
Corporate Commons, One Penn’s Way, New Castle, Delaware 19720, the United States. Prior to the Offering,<br />
Citicorp International Finance Corporation held 6,997,648 Shares constituting 6.36 percent of the votes attached<br />
to the Shares. Citicorp International Finance Corporation is a wholly-owned subsidiary of Citigroup Inc., the<br />
parent company of an international financial services group.<br />
The registered office of Amber Trust S.C.A. is 52, route d’Esch, L-1470 Luxembourg. Prior to the Offering,<br />
Amber Trust S.C.A. held 6,962,256 Shares constituting 6.33 percent of the votes attached to the Shares. Amber<br />
Trust S.C.A. is a nominee registered private equity fund registered in our shareholder register under ING<br />
Luxembourg S.A.<br />
The registered office of DCF (II) <strong>Baltic</strong> States is 52, route d’Esch, L-1470 Luxembourg. Prior to the<br />
Offering, DCF (II) <strong>Baltic</strong> States held 6,614,648 Shares constituting 6.01 percent of the votes attached to the<br />
Shares. DCF (II) <strong>Baltic</strong> States is a nominee registered private equity fund registered in our shareholder register<br />
under ING Luxembourg S.A.<br />
Dilution<br />
The Offer Shares represent approximately 34.1 percent of our share capital immediately prior to the<br />
Offering and approximately 27.5 percent of our share capital following the completion of the Offering assuming<br />
that the Over-Allotment Option is exercised in full and that the number of Offer Shares does not change from<br />
that indicted on the cover of this offering memorandum.<br />
Shareholders’ Agreements<br />
We are not aware of any agreements relating to our shareholdings and use of voting rights that will be in<br />
effect following the completion of the Offering. The shareholders’ agreement dated September 18, 2003 by and<br />
between Infortar, Enn Pant, Keijo Mehtonen, Kalev Järvelill, Amber Trust S.C.A., DCF Fund (II) <strong>Baltic</strong> States,<br />
Firebird Republics Fund, Ltd., Ilmarinen Mutual Pension Insurance Co., Citicorp International Finance Corp.,<br />
Firstnordic<strong>Baltic</strong> Equity, Firebird New Russia Fund Ltd., Snavesta UAB, Vinvesta UAB, East Capital Baltikum<br />
Fonden, FIM Forte, FIM Rento and FIM Visio will be terminated upon completion of the Offering. We are not a<br />
party to this agreement.<br />
75
DESCRIPTION OF SHARE CAPITAL<br />
General Information<br />
Our legal name is <strong>Aktsiaselts</strong> <strong>Tallink</strong> <strong>Grupp</strong>. We are a public limited company (aktsiaselts) registered in the<br />
Estonian Commercial Register (Äriregister) under registration code 10238429. The ISIN code of the Shares is<br />
EE3100004466. Our registered office is in the city of Tallinn, Estonia, at the address Tartu mnt 13, 10145<br />
Tallinn. Our telephone number is +372 6 409 800.<br />
<strong>Tallink</strong> was registered in the Estonian Registry of Enterprises under the name Hansatee <strong>Aktsiaselts</strong><br />
on September 21, 1994, which is the date of our incorporation. On August 21, 1997, <strong>Tallink</strong> was re-registered in<br />
the Estonian Commercial Register under the name <strong>Aktsiaselts</strong> Hansatee <strong>Grupp</strong>. The re-registration was made in<br />
order to comply with requirements of the Commercial Code of Estonia. On January 23, 2002, the name of <strong>Tallink</strong><br />
was changed and, since that date, we have operated under the name <strong>Aktsiaselts</strong> <strong>Tallink</strong> <strong>Grupp</strong>.<br />
Our financial year runs from September 1 to August 31. Pursuant to Article 1.5 of our articles of association,<br />
<strong>Tallink</strong> has been created for an indefinite term.<br />
Pursuant to Article 1.3 of our articles of association, our business activities are as follows: (i) the<br />
arrangement of maritime transport and acting as ships’ agent; (ii) the transportation of passengers, vehicles and<br />
goods by sea and the arrangement of related services; (iii) the arrangement of transit operations; (iv) the<br />
arrangement of storehouse services; and (v) carrying out representing and agent functions and trading activities,<br />
including the retail sale of alcohol and tobacco products on the ships.<br />
Share Capital Information<br />
General<br />
Pursuant to our articles of association, our issued share capital cannot be less than EEK 400,000,000 or<br />
more than EEK 1,600,000,000. At the date of this offering memorandum, our registered share capital amounted<br />
to EEK 1,100,000,000 consisting of 110,000,000 fully paid Shares with a nominal value of EEK 10 per Share.<br />
Each Share entitles its holder to one vote at our general meetings of shareholders. We have one class of shares<br />
and all Shares rank pari passu in all respects.<br />
Our shares have been registered in the ECRS since 1997. The Shares may be freely transferred according to<br />
our articles of association.<br />
According to the articles of association, our supervisory council has, within two years from March 5, 2005,<br />
the right to increase our share capital by EEK 20,000,000. At the date of this offering memorandum, there are no<br />
other valid authorizations granted to the management board or the supervisory council to increase our share<br />
capital or to issue any instruments convertible into Shares.<br />
Option Rights, Bond Loans with Warrants, Convertible Bonds and Capital Loans<br />
The general meeting of shareholders shall pass any decisions which would alter the share capital or number<br />
of shares in an Estonian company. According to Estonian law, convertible bonds are the only debt instruments<br />
granting a conversion right into a company’s shares. The general meeting of shareholders is entitled to decide on<br />
the issuance of any convertible bonds, if such right has been provided for in the articles of association. Our<br />
articles of association do not provide for the right to issue convertible bonds. We have not issued any option<br />
rights, convertible bonds, bonds with warrants, capital loans or other instruments convertible into our Shares.<br />
In April 2005, Hansapank arranged the private offering of bonds of <strong>Tallink</strong> maturing April 28, 2006 and<br />
October 27, 2006 pursuant to which bonds with a total nominal value of EEK 200,000,000 were issued. The<br />
bonds were issued at a discount and do not provide their holders any rights to convert the bond loan into our<br />
Shares.<br />
76
Changes in the Share Capital<br />
The table below shows all changes in our issued share capital since August 21, 1997.<br />
Date 1 Description of the measure<br />
Change in the<br />
number of Shares<br />
Total number<br />
of Shares Share capital (EEK)<br />
September 5, 1997 ........... Share capital increase 2,600,000 4,600,000 46,000,000<br />
January 21, 1998 ............ Share capital increase 1,000,000 5,600,000 56,000,000<br />
June 10, 1998 ............... Share capital increase 16,800,000 22,400,000 224,000,000<br />
October 8, 2003 ............. Share capital increase—<br />
directed issue 5,100,000 27,500,000 275,000,000<br />
February 18, 2005 ........... Share capital increase—<br />
bonus issue 82,500,000 110,000,000 1,100,000,000<br />
1 Date refers to date of registration in the Estonian Commercial Register.<br />
As of the date of this offering memorandum, we do not own any of our own Shares.<br />
Shareholder Rights<br />
General Meetings of Shareholders<br />
Under the Estonian Commercial Code, shareholders exercise their power to decide on corporate matters at<br />
general meetings of shareholders. The general meeting of shareholders shall consider, among other things, the<br />
annual report, the auditors’ report and the distribution of profits. Resolutions may be adopted at either annual or<br />
extraordinary general meetings of shareholders.<br />
In accordance with the Commercial Code, an annual general meeting of shareholders must be held within<br />
six months after the end of a financial year. An extraordinary general meeting of shareholders may be held<br />
whenever the management board deems it appropriate (including circumstances when an extraordinary general<br />
meeting of shareholders is required by the Commercial Code, e.g., in the event that the equity capital decreases<br />
below the legally required minimum equity), or if the supervisory council, shareholders representing at least<br />
one-tenth of the share capital of the company or the auditor of the company make such request to the<br />
management board. If the management board does not convene an extraordinary general meeting within one<br />
month following receipt of such a request, the shareholders, the supervisory council or the auditor are entitled to<br />
convene an extraordinary general meeting themselves.<br />
Notices to annual general meetings of shareholders must be given at least three weeks prior to the meeting,<br />
and notices to extraordinary general meetings of shareholders must be given at least one week in advance.<br />
Notices to convene a general meeting of shareholders must be sent to shareholders by registered mail to their<br />
registered addresses (being the address of the shareholder entered in the share register of the company as<br />
maintained by the ECRS). However, if the company has more than 100 shareholders, notices need not be sent by<br />
registered mail, but may be published in at least one national daily newspaper in Estonia.<br />
The supervisory council of the company usually determines the agenda of the general meeting of<br />
shareholders. If, however, the shareholders or the auditor convene a general meeting, they must also determine<br />
the agenda of that meeting. The management board or one or more shareholders holding at least one-tenth of the<br />
share capital of the company may require that other items be included on the agenda of a general meeting. If,<br />
upon convening a general meeting, the requirements of law or the articles of association have been breached, no<br />
decision may be adopted at the meeting unless all the votes represented by the company’s shares are represented<br />
at the meeting.<br />
In the case of listed companies, in order to have the right to attend and vote at a general meeting of<br />
shareholders, a shareholder must be registered in the register of shareholders kept by the operator of the ECRS at<br />
8:00 a.m. on the day that is determined for that purpose by the company. The company must publish such a day<br />
at least nine trading days in advance. Voting rights may not be exercised by a shareholder if such shareholder’s<br />
shares are registered in the name of a nominee unless a power of attorney has been executed by the nominee<br />
account holder.<br />
A general meeting of shareholders is capable of passing resolutions if more than one-half of the votes<br />
represented by shares held by shareholders are present at the general meeting of shareholders. If the quorum<br />
requirement has not been fulfilled, the management board shall call a new general meeting of shareholders for a<br />
date not more than three weeks but not less than seven days after the date of the prior meeting. There are no<br />
quorum requirements for the newly called general meetings of shareholders.<br />
77
Voting Rights<br />
We have one class of shares of EEK 10 nominal value each. Each share entitles the holder to one vote. A<br />
shareholder may attend and vote at a meeting of shareholders in person or by proxy. At a general meeting of<br />
shareholders, resolutions generally require the approval of a majority of the votes represented at the general<br />
meeting of shareholders. However, certain resolutions, such as amending the articles of association, increasing or<br />
decreasing the share capital and, in certain cases, resolutions relating to a merger or liquidation of the company,<br />
require a majority of two-thirds of the votes represented at the general meeting of shareholders. Any issuance of<br />
new shares on terms other than in accordance with the existing shareholders’ pre-emptive subscription rights<br />
requires a majority of at least 75 percent of the votes represented at the general meeting of shareholders. Issuing a<br />
different class of shares requires amendment of the articles of association (by a two-thirds majority of votes<br />
represented at the general meeting of shareholders). According to Estonian law, rights attached to a class of<br />
shares may be amended by the general meeting through a decision supported by a qualified majority of fourfifths<br />
of all votes and nine-tenths of the votes of the shareholders whose rights are proposed to be amended.<br />
Dividends and Other Distributions<br />
Pursuant to the Estonian Commercial Code, a general meeting of shareholders may authorize the payment of<br />
dividends on the terms and conditions set out in the profit distribution proposal presented by the management<br />
board. The supervisory council has the right to make changes to the proposal of the management board before<br />
submission to the general meeting of shareholders.<br />
Dividends, if any, should be paid in cash or, with the consent of the shareholders, in other property. The<br />
dividend amount and procedure of payment is decided by the shareholders once annually on the basis of the<br />
annual report, as set out in the articles of association (the decision may, however, stipulate that the dividends are<br />
paid out in several installments). Under Estonian law, no interim dividends may be paid in respect of a financial<br />
period for which an annual report (together with the audited financial statements) has not yet been approved by<br />
the general meeting of shareholders. Dividends may only be paid out from net profit or undistributed profit for<br />
previous financial years, and from which uncovered losses from previous years have been deducted. Dividends<br />
may not be paid if the net assets of the company, as recorded in the annual report approved at the end of the<br />
previous financial year, are less than or would be less than the total of share capital and reserves, which, pursuant<br />
to applicable law or articles of association, shall not be paid out to shareholders.<br />
Dividends of companies listed on the Tallinn Stock Exchange are paid only to those shareholders (or their<br />
nominees) who have been entered on the list of shareholders (such list is maintained by the ECRS through the<br />
relevant book-entry registrar) as finalized in accordance with the TSE Rules. The TSE Rules provide that a listed<br />
company is required to disclose details of the list of shareholders at least nine trading days before the date of<br />
finalizing the list. If a general meeting of shareholders adopts a resolution that relates to rights attached to the<br />
shares (e.g., the declaration of payment of dividends), the list of shareholders may not be finalized at an earlier<br />
date than ten trading days after the date of the relevant general meeting of shareholders.<br />
All our Shares, including the Offer Shares, rank pari passu with regard to dividends and other distributions<br />
of <strong>Tallink</strong> (including distribution of our assets in the event of dissolution).<br />
For a description of restrictions on payment of dividends, see “Dividends and Dividend Policy,” and for<br />
taxation of dividends, see “Taxation—Estonian Tax Considerations—Dividends.”<br />
Pre-emptive Subscription Rights<br />
Under Estonian law, existing shareholders of Estonian companies have preferential rights to subscribe for<br />
new shares in the company, in proportion to their existing shareholding, provided that the new shares are paid for<br />
in cash. Under the Commercial Code, a resolution waiving pre-emptive rights must be approved by at least 75<br />
percent of all votes represented at the general meeting of shareholders.<br />
Right to Acquire Own Shares<br />
A public limited company is entitled to acquire its own shares only if the following conditions are met:<br />
(i) the acquisition occurs within one year after the adoption of a resolution of the general meeting which specifies<br />
the conditions and term for the acquisition and the price to be paid for the shares; (ii) the sum of the nominal<br />
value of the shares held by the company does not exceed one-tenth of its share capital; and (iii) the shares are<br />
78
paid for from assets excluding the share capital, reserve capital and premium. However, a public limited<br />
company may acquire its shares by inheritance or by a resolution of the supervisory council without requiring a<br />
resolution of the general meeting if the acquisition of the shares is necessary to prevent significant damage to the<br />
company. The shareholders must be informed of the circumstances of the acquisition of the company’s own<br />
shares at the next general meeting of shareholders. In any event, a public limited company, which has acquired<br />
its own shares, must transfer those shares within one year from the date on which they were acquired. In the<br />
event that the public limited company acquires its own shares in violation of the law, such shares must be<br />
disposed of or cancelled (by decreasing the share capital) within three months of acquisition. In the event that the<br />
shares acquired contribute to more than one-tenth of the share capital, such excess shares must be disposed of<br />
within six months of their acquisition.<br />
The rules regarding acquisition of a company’s own shares are also applied to the acquisition of a parent<br />
company’s shares by the subsidiaries. In the event that a subsidiary acquires the shares of its parent company, the<br />
parent company shall be regarded as the acquiring party.<br />
Disclosure of Shareholdings<br />
Pursuant to the Estonian Commercial Code, the management board is required to submit to the Estonian<br />
Commercial Register, together with the approved annual report and auditors’ report, a list of shareholders<br />
holding ten percent or more of the votes as of the date of the approval of the annual report by the general meeting<br />
of shareholders. See “Estonian Securities Market—Estonian Company Law Issues—Introduction” for a<br />
description of other instances when information concerning the shareholders is accessible to the public.<br />
79
ESTONIAN SECURITIES MARKET<br />
Estonian Company Law Issues<br />
The following describes certain of the provisions of Estonian legislation regulating the legal status and<br />
management of public limited companies. The following description does not constitute an exhaustive<br />
description of the subject matter, is based on the laws of Estonia as in force on the date of this offering<br />
memorandum, and is subject to changes as a result of any future amendments to Estonian legislation.<br />
Introduction<br />
Under Estonian law, limited liability companies are divided into two categories—private limited companies<br />
(osaühing, abbreviated as OÜ) and public limited companies (aktsiaselts, abbreviated as AS). Public limited<br />
companies are characterized by greater capital requirements and the ability to issue more numerous classes of<br />
shares than private limited companies, and are required to register with the ECRS. See “—The Tallinn Stock<br />
Exchange and the Estonian Securities Market” below for details regarding the activities of the ECRS. Pursuant to<br />
Estonian law, the legal capacity of a company is effective upon its entry in the Commercial Register. Therefore, a<br />
public limited company organized under Estonian law must be registered with the Commercial Register. The<br />
Commercial Register is a record maintained by the registration departments of the various courts of first instance.<br />
Public limited companies must have a minimum share capital of EEK 400,000. A public limited company’s<br />
share capital must be fully paid-up as a condition of registration in the Commercial Register.<br />
The shares of public limited companies must have a nominal value of EEK 10 each or a full multiple<br />
thereof. Shares are freely transferable, but the company’s articles of association may confer a pre-emptive right<br />
on other shareholders. Dividends must be distributed to shareholders pro rata, based upon the nominal value of<br />
the shares held by each shareholder. Where a public limited company has different classes of shares, owners may<br />
enjoy different rights, such as the right of preferred shareholders to receive dividends in a pre-determined<br />
amount.<br />
Corporate Governance<br />
The general meeting of shareholders is the highest decision-making forum of a public limited company. See<br />
“Description of Share Capital—Shareholder Rights—General Meetings of Shareholders” for further information<br />
on the tasks and procedures related to the general meeting of shareholders. A public limited company<br />
incorporated in Estonia must also have a two-tier management structure, comprising a management board and a<br />
supervisory council.<br />
The management board is an executive body charged with the day-to-day management of the relevant<br />
company, as well as with representing the company in its relations with third parties, for example, by entering<br />
into contracts on behalf of the company. The management board must adhere to the lawful orders of the<br />
supervisory council. At least one-half of the management board members of a public limited company must be<br />
residents of member states of the European Economic Area or Switzerland. Members of the management board<br />
may not simultaneously serve on the supervisory council.<br />
The supervisory council engages in oversight and longer-term management activities, such as supervising<br />
the management board and devising business plans. No residency requirements apply to the members of the<br />
supervisory council. The supervisory council reports to the general meeting of shareholders.<br />
Members of the management board and supervisory council must fulfill various general duties to the<br />
company, including upholding a fiduciary duty of loyalty, acting with due diligence, performing their duties with<br />
sufficient skill and in a manner commensurate with their knowledge and abilities, and acting to maximize<br />
benefits to the company and to prevent any losses.<br />
The TSE Rules provide that should any shareholder hold more than 30 percent of the votes represented by<br />
shares in the share capital of an issuer, there shall be at least two members of the supervisory council that are not<br />
connected with such shareholder. The current composition of our supervisory council is in compliance with the<br />
above independency requirements.<br />
Members of governing bodies must also keep the company informed of all material facts related to the<br />
performance of their obligations, such as any conflicts of interest which may arise. A strict confidentiality<br />
80
equirement also applies where members of governing bodies learn of facts that the company has a legitimate<br />
interest in keeping confidential. For example, the company is presumed to have a legitimate interest in<br />
maintaining the confidentiality of its production and business secrets. The confidentiality obligation continues<br />
after the board or council member’s term of service expires, to the extent necessary to protect the company’s<br />
interests. Exceptions to the confidentiality obligation arise where the company authorizes disclosure, or where<br />
the law requires disclosure. Unauthorized disclosure of business secrets may result in criminal sanctions.<br />
Pursuant to the Commercial Code, a public limited company is required to engage an auditor who must be<br />
appointed by the general meeting of shareholders. The general meeting of shareholders shall also determine the<br />
principles of remuneration of the company’s auditors. The auditors may be appointed for a specified term or for a<br />
single audit.<br />
The Commercial Code provides that a shareholder whose shares, together with the shares of its parent<br />
undertaking and its subsidiaries, represent at least 90 percent of the share capital of a public limited company, is<br />
entitled to acquire the remaining outstanding shares of the company for fair monetary compensation. A resolution<br />
on the acquisition of these shares shall be adopted, and shall bind all shareholders, if at least 95 percent of the<br />
votes represented by shares are in favor.<br />
Various additional restrictions and limitations on the activities of a company listed on the Tallinn Stock<br />
Exchange and its managing bodies are imposed by the TSE Rules, which to a large extent have been applicable<br />
to <strong>Tallink</strong> with effect from the submission by <strong>Tallink</strong> of its application for listing of the Shares on the Tallinn<br />
Stock Exchange.<br />
Furthermore, the EFSA has approved the Corporate Governance Recommendations, which will enter into<br />
force as of January 1, 2006. As of such date, all companies whose shares are admitted to trading on the Tallinn<br />
Stock Exchange are required to either comply with the Recommendations or explain reasons for their<br />
non-compliance (comply or explain). The recommendations regulate, among others matters, the calling and<br />
procedure of general meetings of shareholders, requirements for the composition, duties and activities of the<br />
management board and supervisory board, requirements for the disclosure of information and financial reporting.<br />
As regards the composition of the supervisory council, the recommendations provide stricter requirements than<br />
TSE Rules requiring that at least one-half of the members of the supervisory council must be independent.<br />
<strong>Tallink</strong> is in compliance with said requirements.<br />
The Tallinn Stock Exchange and the Estonian Securities Market<br />
Set out below is a summary of certain information concerning the Estonian regulated securities market and<br />
certain provisions of Estonian law and Estonian securities market regulations in effect on the date of this offering<br />
memorandum. The summary is based on Estonian laws and securities market regulations and publicly available<br />
information on <strong>OMX</strong> AB group, the principal shareholder of the company operating the Tallinn Stock Exchange,<br />
and on NOREX.<br />
The Tallinn Stock Exchange<br />
The Tallinn Stock Exchange is the only stock exchange operating in Estonia. It is operated by AS Tallinna<br />
Börs, a public limited company whose principal shareholder is the Swedish company <strong>OMX</strong> AB, through its<br />
Finnish subsidiary. <strong>OMX</strong> AB group companies also operate the Copenhagen Stock Exchange, the Stockholm<br />
Stock Exchange, the Helsinki Stock Exchange, the Riga Stock Exchange and the Vilnius Stock Exchange. The<br />
Tallinn Stock Exchange is also a member of NOREX, an alliance of Nordic and <strong>Baltic</strong> stock exchanges.<br />
The activities of, and trading on, the Tallinn Stock Exchange are subject to two tiers of regulation. Laws and<br />
government regulations comprise the basic regulatory framework, which is supplemented by the TSE Rules. The<br />
principal laws governing the activities of, and trading on, the Tallinn Stock Exchange are the Estonian Securities<br />
Market Act and the Estonian Central Registry of Securities Act. The TSE Rules are established by the operator of<br />
the Tallinn Stock Exchange (AS Tallinna Börs) to ensure the regular and lawful operation of the stock exchange.<br />
The operator may unilaterally amend the TSE Rules, though the EFSA must approve such amendments. The TSE<br />
Rules are binding on the members of the Tallinn Stock Exchange and the issuers whose securities are listed on<br />
the Tallinn Stock Exchange or admitted to trading on the separate Free Market regulated by the Tallinn Stock<br />
Exchange.<br />
The Estonian Central Registry of Securities and Registration of Shares<br />
The ECRS is a public register established, among other matters, for the registration of shares and other<br />
securities stipulated in the Estonian Central Registry of Securities Act (Eesti väärtpaberite keskregistri seadus)<br />
81
and transactions executed with such securities (including pledges). The ECRS is administered by the Estonian<br />
Central Securities Depository (Eesti Väärtpaberikeskus, the “ECSD”). The ECSD is organized as a public limited<br />
company, and its shares are fully owned by AS Tallinna Börs. The ECSD’s primary functions include clearing<br />
and settling securities transactions, maintaining records of share ownership and pledges, and providing securitiesrelated<br />
services to issuers and investors.<br />
All shares listed and traded on the Tallinn Stock Exchange must be registered in the ECRS. No share<br />
certificates are issued with respect to shares registered in the ECRS. Shares are registered in the ECRS in bookentry<br />
form and are held in dematerialized form in the respective shareholders’ securities accounts opened in the<br />
ECRS. Consequently, all transactions involving shares listed on the Tallinn Stock Exchange must be recorded on<br />
the ECRS’ electronic database by account operators and are cleared and settled through the ECSD. The rights<br />
attached to the shares belong to the persons who are registered as the shareholders in the share register of the<br />
issuer maintained by the ECSD.<br />
The public has access to certain information, and has the right to obtain extracts and transcripts of<br />
documents from the ECRS, concerning the issuer (its name, seat and registry code) and the securities (the type,<br />
nominal value and amount of securities) registered with the ECRS. If shares are quoted on the stock exchange,<br />
the information concerning the shareholders is also accessible to the public. The Estonian Central Registry of<br />
Securities Act stipulates further circumstances when additional information registered with the ECRS is<br />
accessible to third parties.<br />
A securities account can be opened in the ECRS by any Estonian or foreign person. The opening of the<br />
account takes place through an account operator (custodian). Account operators are institutions that qualify under<br />
Estonian law as professional participants in the securities market, such as investment firms, credit institutions and<br />
other persons specified by law. In certain cases, foreign persons may act as account operators. Under certain<br />
conditions, a nominee account can be opened in the ECRS, in which case a notation is made in the ECRS<br />
indicating the nominee status of the relevant account. Shares held in the nominee account are deemed to be the<br />
client’s shares, and not the shares of the account owner. The person who is entitled to exercise the rights arising<br />
from shares held in the nominee account is the account owner. In the exercise of voting rights and other rights<br />
arising from a share, the owner of a nominee account must follow the instructions of the client. At the request of<br />
the client, the owner of a nominee account must grant authorization in the required format to the client for the<br />
client to represent the owner in the exercise of rights arising from the shares.<br />
Listing on the Tallinn Stock Exchange<br />
There are two different lists available for trading of shares on the Tallinn Stock Exchange: (i) the main list<br />
and (ii) the investor list. In addition to securities listed on the Tallinn Stock Exchange, securities admitted to the<br />
Free Market of the Tallinn Stock Exchange can be traded through the exchange’s trading system. The principal<br />
differences between admission to the main list and the investor list are the minimum required length of operating<br />
history of an issuer (three and two years, respectively) and the minimum required market value of the issuer’s<br />
shares (EUR 4 million and EUR 1 million, respectively). Currently, the shares of 14 companies are listed for<br />
trading on the Tallinn Stock Exchange, of which eight companies are listed on the main list. Application has been<br />
made to list the Shares on the main list. In order to list shares on the main list of the Tallinn Stock Exchange,<br />
among other requirements, a sufficient number of such shares must be held by the public. As a general rule, this<br />
condition is fulfilled if at least 25 percent of the share capital to be listed is held by the public, or such level of<br />
distribution is expected to be achieved shortly after listing. The TSE Rules set out certain specific requirements<br />
when the shares are not deemed to be held by the public.<br />
Trading on the Tallinn Stock Exchange<br />
The trading system of the Tallinn Stock Exchange is open for trading to its members. Stock exchange<br />
membership is open to investment firms and credit institutions. Foreign investment firms and branches of foreign<br />
credit institutions are also eligible for membership, provided that they have fulfilled the necessary legal<br />
requirements for operating in Estonia. Membership by NOREX exchange members is subject to certain limited<br />
documentary requirements of the TSE Rules. Trading on the Tallinn Stock Exchange takes place on each<br />
business day from 10:00 a.m. to 2:00 p.m. (Estonian time). The Tallinn Stock Exchange uses the Nordic-<strong>Baltic</strong><br />
trading system SAXESS, which in addition to Estonia is used by exchanges in Sweden, Finland, Denmark,<br />
Norway, Iceland, Latvia and Lithuania. The official trading currency of the Tallinn Stock Exchange trading<br />
system is the euro. Transactions can be concluded on the Tallinn Stock Exchange either through automatic<br />
matching or through negotiated deals. In the case of automatic matching, the buy and sell orders are matched by<br />
82
the trading system automatically according to price and time priorities. Automatically matched transactions are<br />
settled on the third day after the transaction (T+3), unless agreed otherwise. Negotiated trades can be concluded<br />
during the Tallinn Stock Exchange trading period at a price between the best bid and offer prices quoted at the<br />
time of concluding the transaction. Negotiated deals concluded after the Tallinn Stock Exchange’s trading period<br />
must be concluded at a price at or between the best bid and offer prices quoted during trading on that day.<br />
Negotiated deals are negotiated between stock exchange members outside the system and brokers must enter the<br />
deal in the trading system as soon as possible, and in any event not later than five minutes, after its conclusion.<br />
Negotiated deals may have a settlement day between T+1 (inclusive) and T+6 (inclusive) if agreed between the<br />
relevant stock exchange members. The operator of the Tallinn Stock Exchange is required to ensure constant<br />
access on its website to information on the securities traded on the market, including the acquisition and transfer<br />
prices of the securities, recent prices, price changes, the highest and lowest prices and the volume and number of<br />
transactions. The Tallinn Stock Exchange operates an electronic trading system that provides real-time stock<br />
quotes, distributes issuer announcements and displays information regarding executed transactions, statistics and<br />
other such data.<br />
The operator of the Tallinn Stock Exchange must record at least the following regarding transactions<br />
concluded on the exchange: (i) the time at which the transaction is concluded; (ii) information regarding the<br />
market participant who concluded the transaction; (iii) the securities which served as the object of the<br />
transaction; and (iv) their number, nominal value and price. In accordance with the TSE Rules, the operator of<br />
the Tallinn Stock Exchange has the right to request additional information regarding a transaction for the<br />
purposes of recording the transaction. The Listing and Supervisory Committee of the Tallinn Stock Exchange has<br />
the right, for the purpose of ensuring sufficient liquidity of a security, to demand from the issuer applying for<br />
listing the conclusion of a market-making agreement with a member of the Tallinn Stock Exchange in respect of<br />
the securities to be listed. <strong>Tallink</strong> and Suprema Securities intend to enter into a market-making agreement in<br />
connection with the listing of the Shares on the Tallinn Stock Exchange.<br />
Supervision over the Tallinn Stock Exchange and Trading on the Tallinn Stock Exchange<br />
Activities of the Tallinn Stock Exchange are supervised by the EFSA. Compliance with the TSE Rules by<br />
its members is monitored by the Listing and Surveillance Committee of the Tallinn Stock Exchange. The<br />
operator of the Tallinn Stock Exchange exercises supervision over the exchange with respect to the prices of<br />
securities traded on the exchange and the conducting and execution of transactions for the purpose of detecting<br />
and reducing transactions conducted on the basis of inside information, market manipulation and other violations<br />
of law. The operator is under an obligation to notify the EFSA immediately of any violation of law. The EFSA<br />
also has specific supervisory obligations for monitoring transactions concluded on the exchange.<br />
Disclosure of Transactions and Ownership<br />
A person who has acquired in an issuer, either directly or indirectly, individually or together with persons<br />
operating in concert, a qualifying holding and in connection therewith or thereafter acquired or increased the<br />
number of votes owned by such person over ten percent, 20 percent, one-third, 50 percent or two-thirds of all<br />
votes represented by the shares of the issuer, must immediately, and in any event by no later than four business<br />
days thereafter, notify the issuer and the EFSA of the number of votes owned by such person. The same<br />
notification requirements also apply in case the holding falls below the prescribed levels. The EFSA has the right<br />
to make exemptions from such notification requirements in certain circumstances. In the case of a company<br />
whose shares are listed on the Tallinn Stock Exchange, the disclosure obligations described above also apply in<br />
the case of the acquisition or reduction of a holding by five percent or more. The issuer is also required to ensure<br />
that shareholders holding more than five percent of the shares of the issuer disclose, through the issuer, all the<br />
significant provisions of all the agreements made with other shareholders or third parties which are aimed at<br />
restricting the free transferability of the shares or which may have a significant effect on the price of the shares.<br />
In order to ensure that disclosure obligations established by law are also fulfilled in respect of shareholdings held<br />
by nominee accounts, the operator of a nominee account is required to enter into written agreements with the<br />
clients on whose behalf the operator holds securities. These agreements must, among other requirements, require<br />
the client to notify the issuer and/or the competent supervisory body (the exact person to whom the notification<br />
must be submitted may vary depending on a particular transaction) if a holding in a company exceeds the<br />
threshold established by law or to obtain the permission of the competent supervisory body for the holding to<br />
exceed the threshold established by law (such permission is required, for example, in the case of the acquisition<br />
of a holding above a certain level in financial institutions, or in the case of an acquisition subject to concentration<br />
control by competition authorities). The TSE Rules also regulate the disclosure of the issuer’s dealings in its own<br />
shares.<br />
83
Market Abuse<br />
Estonian law prohibits market abuse, which (within the meaning of the Estonian Securities Market Act) is<br />
misuse of inside information and market manipulation. Restrictions established for the misuse of inside<br />
information also apply to financial instruments that are not admitted to trading in Estonia or in a member state of<br />
the European Economic Area (the “EEA”) but the value of which depends on a financial instrument that is<br />
admitted to trading in Estonia or in an EEA member state.<br />
Inside information is information the precise nature of which has not been made public, relating, directly or<br />
indirectly, to the financial instrument or its issuer and which, if it were made public, would be likely to have a<br />
significant effect on the price of the financial instrument or on the price of related derivative financial<br />
instruments. The law establishes additional conditions under which information may qualify as inside<br />
information.<br />
An insider is a person who possesses inside information by virtue of being a partner in the issuer, or by<br />
virtue of his membership of the management or supervisory bodies of the issuer, or by virtue of his shareholding<br />
in the issuer, or by virtue of having access to the information through the exercise of his employment, profession<br />
or duties, or by virtue of his criminal activities. Third parties who possess inside information are also treated as<br />
insiders if they knew or should have known that the information is inside information. The TSE Rules stipulate<br />
that, among other persons, persons who hold or control at least ten percent of shares in an issuer, the subsidiaries<br />
of the issuer and certain officials of such shareholders and subsidiaries and persons associated with them are<br />
deemed to be insiders for the purpose of the TSE Rules.<br />
Misuse of inside information comprises, among other actions, the trading on the basis of inside information,<br />
unauthorized disclosure of inside information, and the making of recommendations on the basis of inside<br />
information for the acquisition or disposal of financial instruments to which that information relates.<br />
Misuse of inside information is a criminal offence, and may result in fines or imprisonment. Issuers of<br />
publicly-traded securities and other individuals or entities that have regular access to inside information are<br />
required to establish internal rules and procedures to prevent the disclosure of such information. The Estonian<br />
Securities Market Act contains a non-exhaustive list of actions that are deemed to constitute market<br />
manipulation. Under the Estonian Securities Market Act, market manipulation may be punishable by a fine. In<br />
order to monitor compliance with the prohibition on insider trading, the operator of the Tallinn Stock Exchange<br />
has the right to receive from the ECSD information on transactions involving an issuer’s securities. In addition,<br />
the EFSA is obliged to monitor transactions involving an issuer’s shares.<br />
The TSE Rules also restrict transactions involving an issuer’s securities by certain officials of the issuer and<br />
by persons connected with such officials, to avoid profiting from short-term price fluctuations of the issuer’s<br />
securities and during restricted periods (in particular, after the end of a financial period but when the financial<br />
results of the issuer have not yet been made public). The Listing and Supervisory Committee of the Tallinn Stock<br />
Exchange has the right to make exemptions from the requirement to abstain from trading during a restricted<br />
period if the Committee is of the opinion that the transaction will not be executed on the basis of confidential<br />
information.<br />
Mandatory Takeover Bid<br />
A person who has gained, either directly or together with other persons acting in concert, a dominant<br />
influence over a company whose shares (of all or some classes) are listed on the Tallinn Stock Exchange, is<br />
required to make within 20 days a takeover bid for all the outstanding shares of such issuer. Exemptions from the<br />
obligation to make the mandatory takeover bid may be granted by the EFSA in case of certain specific<br />
circumstances provided by law. For these purposes, a “dominant influence” is a situation where a person:<br />
(i) owns the majority of votes represented by the issuer’s shares; or (ii) being a shareholder of the company, has<br />
the right to appoint or remove a majority of the members of the supervisory council or management board of the<br />
company; or (iii) being a shareholder of the company, controls a simple majority of the votes represented by the<br />
company’s shares on the basis of an agreement entered into with other shareholders.<br />
Enforcement of Civil Liabilities in Estonia<br />
European Council Regulation (EC) No 44/2001 on jurisdiction and the recognition and enforcement of<br />
judgments in civil and commercial matters sets forth a requirement that judgments of the courts of the member<br />
states of the European Union (except for Denmark) should be recognized and enforced in Estonia.<br />
84
Recognition and enforcement of judgments of all other foreign courts in Estonia is regulated by the Code of<br />
Civil Procedure. Pursuant to Article 377(1) of the Code of Civil Procedure, judgments of foreign courts are<br />
recognized by Estonian courts in accordance with international treaties concluded by Estonia. Therefore,<br />
Estonian courts are legally bound to enforce decisions of such foreign courts only if the relevant obligation is<br />
contained in an international treaty or agreement that is binding on Estonia. In the absence of specific treaty<br />
provisions, Estonian courts are not obliged to recognize or enforce decisions of foreign courts without<br />
re-litigating the subject matter. Estonia has concluded international agreements on the recognition or enforcement<br />
of judgments of the relevant courts with the Russian Federation, Latvia, Lithuania, Poland and Ukraine.<br />
Currently, judgments of courts of other states not listed above are not enforceable in Estonia without re-litigation<br />
of the subject matter on its merits.<br />
Estonia is a party to the 1958 New York Convention on recognition and enforcement of foreign arbitral<br />
awards. Therefore, Estonian courts are legally bound to enforce decisions of foreign arbitration courts<br />
notwithstanding in which country such award has been adopted (i.e., whether a convention member state or not).<br />
85
TAXATION<br />
The following summary is based on the tax laws of Estonia and Finland as in effect on the date of this<br />
offering memorandum, and is subject to changes in such laws, including changes that could have a retroactive<br />
effect. The following summary is not exhaustive and does not take into account or discuss the tax laws of any<br />
country other than Estonia or Finland. You are advised to consult your own professional tax advisors as to the<br />
Estonian, Finnish or other tax consequences of the Offering and the purchase, ownership and disposition of<br />
Offer Shares. Prospective investors who may be affected by the tax laws of other jurisdictions should consult<br />
their own tax advisors with respect to the tax consequences applicable to their particular circumstances.<br />
Estonian Tax Considerations<br />
The statements relating to Estonian tax issues set out below are based upon the laws and regulations as in<br />
effect on the date of this offering memorandum. There can be no assurance that there will be no changes to the<br />
applicable laws and regulations in the future, including changes that could have a retroactive effect.<br />
Corporate Income Tax<br />
The Estonian Income Tax Act (Tulumaksuseadus) provides that the accrued profit of a legal entity resident<br />
in Estonia, such as <strong>Tallink</strong>, is not subject to tax, but that an equivalent tax, payable by such legal entity, is<br />
charged on dividend distributions or other profit distributions and other payments considered as not related to the<br />
business of the legal entity by law.<br />
In particular, pursuant to the Income Tax Act, corporate income tax is charged on:<br />
• dividends and other profit distributions;<br />
• expenses and payments not related to the business of <strong>Tallink</strong>;<br />
• fringe benefits granted to employees;<br />
• loans and advances to natural persons related to <strong>Tallink</strong>, exceeding 50 percent of the expenses of <strong>Tallink</strong><br />
which are subject to Estonian social tax;<br />
• costs of entertaining, catering, accommodation and transportation of guests of <strong>Tallink</strong>, which exceed<br />
two percent of the expenses of <strong>Tallink</strong> which are subject to Estonian social tax; and<br />
• gifts and donations.<br />
The rate of income tax is 24 percent of the gross amount distributed, although the income tax is calculated<br />
on the amount of the distributed dividends or other profit distributions by applying the tax rate of 24/76 meaning<br />
that the effective rate is approximately 31.6 percent of the net amount of the distribution. The relevant amount of<br />
income tax due is required to be paid by the tenth day of the month following the month in which the payment<br />
was made. Estonian taxation regulations provide that this currently applicable rate of income tax will be reduced<br />
to 23 percent (23/77) on January 1, 2006, to 22 percent (22/78) on January 1, 2007, to 21 percent (21/79) on<br />
January 1, 2008 and to 20 percent (20/80) on January 1, 2009.<br />
The Income Tax Act provides exemptions from the corporate income tax. An Estonian resident company<br />
receiving dividends does not have to pay corporate income tax upon redistributing the part of dividends from<br />
which the tax has been paid either in Estonia or abroad, if it owned at least 20 percent of the shares of the<br />
distributing company at the time of distribution. Further exemptions apply to the taxation of Estonian resident<br />
companies upon the distribution of profits earned from interest payments, license fees and royalties received<br />
from resident companies of certain European Union member states, if the payer and the recipient are associated<br />
companies, i.e., at the time of payment and during the period of at least two years immediately preceding the<br />
payment one company has a holding of at least 25 percent in the capital of the other company or a company<br />
resident in a member state of the European Union owns at least 25 percent of the share capital of both the payer<br />
company and the recipient company.<br />
Dividends<br />
No Estonian dividend withholding tax is imposed on dividends paid to Estonian residents (whether legal<br />
persons or individuals) or to non-resident individuals.<br />
However, an Estonian dividend withholding tax of 24 percent is currently imposed on dividends paid by<br />
<strong>Tallink</strong> to non-resident legal persons. A limited exemption from this dividend withholding tax applies where the<br />
non-resident legal person owns at least 20 percent of the share capital or votes of <strong>Tallink</strong>. However, the<br />
86
exemption does not apply where the relevant non-resident legal person is located in a “low tax rate territory” for<br />
the purposes of Estonian taxation regulations. Additional exemptions or more favorable tax rates available to<br />
non-resident legal persons may be enjoyed under international treaties in effect between Estonia and certain other<br />
states, including European Union member states. For applying the more favorable tax rates under the treaties, the<br />
non-resident legal person subject to Estonian withholding tax has to provide <strong>Tallink</strong> with a document claiming<br />
the benefits of the applicable tax treaty from the non-resident’s competent taxing authority confirming that the<br />
non-resident is a resident of the applicable jurisdiction for treaty purposes. Such document should correspond to<br />
the form provided by the Estonian Ministry of Finance.<br />
Estonian taxation regulations provide that the currently applicable rate of dividend withholding tax of 24<br />
percent referred to above will be reduced to 23 percent on January 1, 2006, to 22 percent on January 1, 2007, to<br />
21 percent on January 1, 2008 and to 20 percent on January 1, 2009.<br />
Capital Gains<br />
Income tax is not charged on gains realized by non-residents (whether legal persons or individuals) from the<br />
sale or exchange of shares of Estonian companies, except in the case of a sale or exchange of more than ten<br />
percent of the shares of an Estonian “real estate company.” A real estate company is a company with more than<br />
75 percent of its property comprising immovables or structures as movables located in Estonia (calculated by<br />
reference to the company’s balance sheet on the last day of the financial year preceding the relevant sale or<br />
exchange). <strong>Tallink</strong> is currently not a real estate company for this purpose.<br />
In addition, as the current income tax system applicable in Estonia provides that the profits of Estonian legal<br />
persons are not taxed upon their generation but are only taxed upon their distribution to shareholders, income tax<br />
is not charged on capital gains realized by Estonian legal persons from the sale or exchange of Shares.<br />
Income tax is, however, charged on gains realized by Estonian individuals from the sale or exchange of<br />
Shares.<br />
If income tax is due to be paid as described in the previous paragraphs, it is charged on the gains realized<br />
from the sale or exchange of a shareholding, with the gains being deemed to be equal to the difference between<br />
the acquisition costs and the sale/exchange price of the relevant shareholding. Capital gains realized are currently<br />
subject to income tax of 24 percent, and are required to be declared annually by the relevant person by March 31<br />
in each year.<br />
Payments made by <strong>Tallink</strong> as a result of any redemption of its Shares or any repurchase of its Shares or the<br />
proceeds of any liquidations of <strong>Tallink</strong> which are paid to Estonian individuals or non-residents (whether legal<br />
persons or individuals) are also treated as capital gains which are chargeable as described above (even if such<br />
non-residents’ capital gains are not chargeable upon a sale or exchange of the Shares).<br />
Estonian taxation regulations provide that the currently applicable income tax rate of 24 percent chargeable<br />
on capital gains and referred to above will be reduced to 23 percent on January 1, 2006, to 22 percent on<br />
January 1, 2007, to 21 percent on January 1, 2008 and to 20 percent on January 1, 2009.<br />
Stamp Duty and Other Transfer Taxes<br />
There are currently no stamp duties or other transfer taxes payable on the transfer of Shares. However, fees<br />
and charges are generally levied by the operators of securities accounts in the ECRS on transactions in the Shares<br />
which are cleared and settled through the ECSD.<br />
Finnish Tax Considerations<br />
The following summary is not intended to be exhaustive. You are advised to consult your own professional<br />
tax advisors as to Finnish tax consequences of the Offering and the purchase, ownership and disposition of Offer<br />
Shares.<br />
Taxation of Dividends<br />
According to the double tax treaty entered into between Estonia and Finland, no tax is payable on dividends<br />
paid by <strong>Tallink</strong> to shareholders that are private persons resident in Finland for tax purposes (providing a<br />
87
esidency certificate). A tax at the rate of 15 percent is withheld in Estonia only on the dividends distributed to<br />
companies resident in Finland for tax purposes (providing a residency certificate) and holding less than 20<br />
percent of the share capital and votes in <strong>Tallink</strong>.<br />
Irrespective of the above, an additional tax may be withheld by custodians in Estonia from dividends<br />
distributed to Finnish shareholders whose holdings are nominee registered. Any such Finnish shareholder may<br />
claim for a tax refund with the Estonian tax authority of such tax withheld in Estonia.<br />
In Finland, 30 percent of the dividends received by private persons are tax exempt with the remaining 70<br />
percent being taxed as capital income at the rate of 28 percent. Further, if the shareholder is a non-listed<br />
company, the dividend will be tax exempt in Finland only if the recipient owns at least ten percent of the share<br />
capital or votes in <strong>Tallink</strong>. Where a non-listed company owns less than ten percent of the share capital and votes<br />
in <strong>Tallink</strong>, 25 percent of the dividends received are tax exempt with the remaining 75 percent being taxable<br />
income at the rate of 26 percent in Finland. Dividends received by a Finnish listed company are generally tax<br />
exempt in Finland.<br />
If dividends received are not taxable income in Finland, no withholding taxes paid in Estonia can be<br />
credited in Finland. The tax treatment and rates discussed above are applicable for the tax year 2006 based on the<br />
laws in effect as of the date of this offering memorandum.<br />
Capital Gains Taxation<br />
Finnish resident investors for tax purposes may under the Finnish rules be liable to pay capital gains tax or<br />
alternatively capital loss may occur in Finland when the investors transfer their Shares.<br />
Wealth Tax<br />
The Shares are included in the taxable net wealth of Finnish resident individuals, Finnish estates and Finnish<br />
legal entities that are subject to net wealth tax. Most Finnish legal entities are, however, exempted from net<br />
wealth taxation. The net wealth tax is proposed to be abolished as of 2006.<br />
Transfer Tax<br />
No Finnish transfer tax is payable on the transfers of the Shares as the Shares are not Finnish securities.<br />
88
PLAN OF DISTRIBUTION<br />
Citigroup Global Markets Limited, Nordea Bank Finland Plc., AS Suprema Securities and SEB Eesti<br />
Ühispank AS are acting as managers and, further, as the underwriters of the Offering (the “Managers”). Subject<br />
to the terms and conditions stated in the underwriting agreement expected to be dated December 1, 2005, we and<br />
the Selling Shareholders have agreed to issue and sell the Offer Shares to the Managers or purchasers procured<br />
by the Managers.<br />
The underwriting agreement provides that the obligations of the Managers to purchase or procure purchasers<br />
for the Offer Shares are subject to review of legal matters by counsel and to other conditions.<br />
We estimate that our portion of the total expenses of this Offering will be approximately EEK 29 million. In<br />
addition, we have agreed to pay to the Managers a commission equal to 2.75 percent of the Offer Price per Offer<br />
Share. Therefore, in connection with this Offering, the Managers will receive total commissions of<br />
approximately EEK 60 million based on the mid-point of the Offer Price range and assuming that the number of<br />
Offer Shares is not changed. In addition, we and the Selling Shareholders may pay the Managers a discretionary<br />
commission based upon the overall execution of the Offering. We have also agreed to reimburse the Managers<br />
for certain expenses up to the maximum amount of approximately EEK 9 million and indemnify them against<br />
certain losses and liabilities arising out of or in connection with the Offering.<br />
The Managers propose to market the Offer Shares at the Offer Price outside the United States in reliance on<br />
Regulation S and to resell the Offer Shares at the Offer Price within the United States to qualified institutional<br />
buyers (as defined in Rule 144A) in reliance on Rule 144A. In addition to institutional investors internationally,<br />
Offer Shares will be marketed in a public offering in Estonia and in Finland. The members of our supervisory<br />
board and management board and our employees may receive preferential allocation of Offer Shares in<br />
connection with the public offering.<br />
The Offer Shares have not been and will not be registered under the Securities Act or any state securities<br />
laws and may not be offered or sold within the United States except in transactions exempt from, or not subject<br />
to, the registration requirements of the Securities Act.<br />
In addition, until 40 days after the commencement of this Offering, an offer or sale of Shares within the<br />
United States by a dealer that is not participating in this Offering may violate the registration requirements of the<br />
Securities Act if that offer or sale is made otherwise than in accordance with Rule 144A.<br />
The Selling Shareholders have granted to Citigroup, acting on behalf of the Managers, an option,<br />
exercisable at any time within 30 days from the commencement of trading in our Shares on the Tallinn Stock<br />
Exchange, to purchase up to 3,409,091 additional Shares at the Offer Price solely to cover over-allotments, if<br />
any. To the extent the option is exercised, each Manager must purchase an additional principal amount of Shares<br />
proportionate to that Manager’s initial underwriting commitment.<br />
Citigroup, acting on behalf of the Managers, may effect transactions that stabilize or maintain the market<br />
price of our Shares, in accordance with applicable laws, during a 30-day period starting from the commencement<br />
of trading in our Shares on the Tallinn Stock Exchange. Any such stabilization activity will be decided by<br />
Citigroup at its sole discretion and there is no obligation on Citigroup to do this. Such stabilization transactions<br />
may result in a market price of the Shares that is higher than would otherwise prevail. Any trades made on the<br />
Tallinn Stock Exchange as part of the stabilization will be effected by Suprema Securities as instructed by<br />
Citigroup. The details of all stabilization transactions will be notified to the EFSA according to the Article 9(4)<br />
of the European Commission Regulation (EC) No. 2273/2003 implementing Directive 2003/6/EC of the<br />
European Parliament and the Council.<br />
In connection with this Offering, the Managers may purchase and sell Shares in the open market. These<br />
transactions may include over-allotment, syndicate covering transactions and stabilizing transactions. Overallotment<br />
involves sales of Shares in excess of the principal amount of Shares to be purchased by the Managers<br />
in this Offering, which creates a short position for the initial purchasers. Covering transactions involve purchases<br />
of the Shares in the open market after the distribution has been completed in order to cover short positions.<br />
Stabilizing transactions consist of certain bids or purchases of Shares made for the purpose of preventing or<br />
retarding a decline in the market price of the Shares while the Offering is in progress. Any of these activities may<br />
have the effect of preventing or retarding a decline in the market price of the Shares. They may also cause the<br />
price of the Shares to be higher than the price that otherwise would exist in the open market in the absence of<br />
these transactions. The Managers may conduct these transactions in the over-the-counter market or otherwise. If<br />
the Managers commence any of these transactions, they may discontinue them at any time.<br />
89
Other than as stated above or as required by law, Citigroup does not intend to disclose publicly the extent of<br />
any over-allotment made or stabilization transactions entered into in connection with the Offering, although<br />
individual investors may be required to disclose interests in Shares acquired in the Offering or arrangements<br />
connected with it in accordance with the disclosure requirements of applicable Estonian law.<br />
Any stabilization activities will be conducted in accordance with the European Commission Regulation<br />
(EC) No 2273/2003 implementing Directive 2003/6/EC of the European Parliament and the Council as regards<br />
exemptions for buy-back programs and stabilization of financial instruments.<br />
In connection with settlement and stabilization, Citicorp, on behalf of the Managers, has entered into a share<br />
lending arrangement with Infortar as part of the underwriting agreement. In accordance with the share lending<br />
provisions of the underwriting agreement, Citicorp may borrow a number of Shares equal to the number of<br />
additional Shares subject to the Over-Allotment Option that will allow it to settle over-allotments made, if any, in<br />
connection with the Offering. In addition, Citicorp will borrow from Infortar a number of Shares corresponding<br />
to the number of New Shares in order to facilitate the settlement. To the extent Citicorp borrows Shares under<br />
these provisions, it will be required to return an equivalent number of Shares or rights representing such number<br />
of Shares to Infortar in accordance with the provisions of the underwriting agreement.<br />
Except for the Sale Shares to be offered by the Selling Shareholders (including any additional Shares sold<br />
pursuant to the Over-Allotment Option), <strong>Tallink</strong>, each of the Selling Shareholders, each of the members of our<br />
supervisory council and management board and each of our key executives have agreed that, without the prior<br />
written consent of Citigroup, each of us will not issue, offer, sell, contract to sell, or otherwise dispose of any<br />
Shares owned by us/it at any time or any securities convertible into or exercisable or exchangeable for Shares, or<br />
enter into any swap or other agreement or any transaction to transfer the economic consequence of ownership of<br />
the Shares, or publicly announce an intention to effect any such transaction, during the period commencing on<br />
the date of this offering memorandum and ending 180 days (in the case of <strong>Tallink</strong>), 270 days (in the case of<br />
Infortar), 180 days (in the case of the other Selling Shareholders) and 365 days (in the case of members of our<br />
supervisory council and management board and our key executives) after the commencement of trading in our<br />
Shares on the Tallinn Stock Exchange. However, the lock-up does not apply to any Shares that we may issue and<br />
sell pursuant to any employee stock option plan, stock ownership plan or dividend reinvestment plan.<br />
Prior to this Offering, there has been no public market for our Shares. Consequently, the Offer Price for the<br />
Offer Shares will be determined by negotiations between us, the Selling Shareholders and the Managers. Factors<br />
relevant to the determination of the Offer Price include the results of operations, our current financial conditions,<br />
our future prospects, our markets, the economic conditions in and future prospects for the industry in which we<br />
compete, our management, and currently prevailing general conditions in the equity securities markets, including<br />
current market valuations of publicly-traded companies considered comparable to our company.<br />
The Managers have performed investment banking and advisory services for us from time to time for which<br />
they have received customary fees and expenses. Nordea and SEB Eesti Ühispank are lenders to <strong>Tallink</strong>, while<br />
certain affiliates of Citigroup are shareholders of <strong>Tallink</strong> and plan to sell Shares in the Offering. The Managers<br />
may, from time to time, engage in transactions with and perform services for us in the ordinary course of their<br />
business.<br />
Notice to Prospective Investors in the European Economic Area<br />
In relation to each member state of the European Economic Area that has implemented the Prospectus<br />
Directive (each, a relevant member state), with effect from and including the date on which the Prospectus<br />
Directive is implemented in that relevant member state (the relevant implementation date), an offer of the Offer<br />
Shares described in this offering memorandum may not be made to the public in that relevant member state prior<br />
to the publication of a prospectus in relation to the Offer Shares that has been approved by the competent<br />
authority in that relevant member state or, where appropriate, approved in another relevant member state and<br />
notified to the competent authority in that relevant member state, all in accordance with the Prospectus Directive,<br />
except that, with effect from and including the relevant implementation date, an offer of securities may be<br />
offered to the public in that relevant member state at any time:<br />
• to any legal entity that is authorized or regulated to operate in the financial markets or, if not so<br />
authorized or regulated, whose corporate purpose is solely to invest in securities or<br />
• to any legal entity that has two or more of (1) an average of at least 250 employees during the last<br />
financial year; (2) a total balance sheet of more than EUR 43,000,000 and (3) an annual net turnover of<br />
more than EUR 50,000,000, as shown in its last annual or consolidated accounts or<br />
90
• in any other circumstances that do not require the publication of a prospectus pursuant to Article 3 of the<br />
Prospectus Directive.<br />
Each purchaser of the Offer Shares located within a relevant member state (other than Estonia or Finland)<br />
will be deemed to have represented, acknowledged and agreed that it is a “qualified investor” within the meaning<br />
of Article 2(1)(e) of the Prospectus Directive. For purposes of this provision, the expression an “offer to the<br />
public” in any relevant member state means the communication in any form and by any means of sufficient<br />
information on the terms of the offer and the securities to be offered so as to enable an investor to decide to<br />
purchase or subscribe the securities, as the expression may be varied in that member state by any measure<br />
implementing the Prospectus Directive in that member state, and the expression “Prospectus Directive” means<br />
Directive 2003/71/EC and includes any relevant implementing measure in each relevant member state.<br />
The sellers of the Offer Shares have not authorized and do not authorize the making of any offer of the Offer<br />
Shares through any financial intermediary on their behalf, other than offers made by the Managers with a view to<br />
the final placement of the Offer Shares as contemplated in this offering memorandum. Accordingly, no purchaser<br />
of the Offer Shares, other than the Managers, is authorized to make any further offer of the Offer Shares on<br />
behalf of the sellers or the Managers.<br />
Notice to Prospective Investors in the United Kingdom<br />
This offering memorandum is only being distributed to, and is only directed at, persons in the United<br />
Kingdom that are qualified investors within the meaning of Article 2(1)(e) of the Prospectus Directive<br />
(“Qualified Investors”) that are also (i) investment professionals falling within Article 19(5) of the Financial<br />
Services and Markets Act 2000 (Financial Promotion) Order 2005 (the “Order”) or (ii) high net worth entities,<br />
and other persons to whom it may lawfully be communicated, falling within Article 49(2)(a) to (d) of the Order<br />
(all such persons together being referred to as “relevant persons”). This offering memorandum and its contents<br />
are confidential and should not be distributed, published or reproduced (in whole or in part) or disclosed by<br />
recipients to any other persons in the United Kingdom. Any person in the United Kingdom that is not a relevant<br />
persons should not act or rely on this document or any of its contents.<br />
Notice to Prospective Investors in France<br />
Neither this offering memorandum nor any other offering material relating to the Offer Shares described in<br />
this offering memorandum has been submitted to the clearance procedures of the Autorité des Marchés<br />
Financiers or by the competent authority of another member state of the European Economic Area and notified to<br />
the Autorité des Marchés Financiers. The Offer Shares have not been offered or sold and will not be offered or<br />
sold, directly or indirectly, to the public in France. Neither this offering memorandum nor any other offering<br />
material relating to the Offer Shares has been or will be<br />
• released, issued, distributed or caused to be released, issued or distributed to the public in France; or<br />
• used in connection with any offer for subscription or sale of the Offer Shares to the public in France.<br />
Such offers, sales and distributions will be made in France only<br />
• to qualified investors (investisseurs qualifiés) and/or to a restricted circle of investors (cercle restreint<br />
d’investisseurs), in each case investing for their own account, all as defined in, and in accordance with,<br />
Article L.411-2, D.411-1, D.411-2, D.734-1, D.744-1, D.754-1 and D.764-1 of the French Code<br />
monétaire et financier or<br />
• to investment services providers authorized to engage in portfolio management on behalf of third parties<br />
or<br />
• in a transaction that, in accordance with article L.411-2-II-1°-or-2°-or 3° of the French Code monétaire<br />
et financier and article 211-2 of the General Regulations (Règlement Général) of the Autorité des<br />
Marchés Financiers, does not constitute a public offer (appel public à l’épargne).<br />
The Offer Shares may be resold directly or indirectly, only in compliance with Articles L.411-1, L.411-2,<br />
L.412-1 and L.621-8 through L.621-8-3 of the French Code monétaire et financier.<br />
91
TRANSFER RESTRICTIONS<br />
The Offer Shares have not been and will not be registered under the Securities Act and may not, unless so<br />
registered, be offered or sold within the United States, except pursuant to an exemption from, or in a transaction<br />
not subject to, the registration requirements of the Securities Act and applicable state securities laws.<br />
Each purchaser of the Offer Shares outside the United States pursuant to Regulation S will be deemed to<br />
have acknowledged, represented and agreed with <strong>Tallink</strong> and the Managers that it has received a copy of this<br />
offering memorandum and such other information as it deems necessary to make an informed investment<br />
decision and that (terms defined in Rule 144A or Regulation S shall have the same meanings when used in this<br />
section):<br />
(1) The purchaser acknowledges that the Offer Shares have not been and will not be registered under the<br />
Securities Act, or with any securities regulatory authority of any state of the United States;<br />
(2) The purchaser is, and the person, if any, for whose account or benefit the purchaser is acquiring the<br />
Offer Shares, acquiring the Offer Shares in an “offshore transaction” meeting the requirements of<br />
Regulation S, and was located outside the United States at the time the buy order for the Offer Shares<br />
was originated and continues to be located outside the United States and has not purchased the Offer<br />
Shares for the benefit of any person in the United Sates or entered into any arrangement for the transfer<br />
of the Offer Shares to any person in the United States;<br />
(3) The purchaser is aware of the restrictions on the offer and sale of the Offer Shares pursuant to<br />
Regulation S described in this offering memorandum and agrees to give any subsequent purchaser of<br />
such Offer Shares notice of any restrictions on the transfer thereof;<br />
(4) The purchaser is not an affiliate of <strong>Tallink</strong> or a person acting on behalf of such affiliate; and it is not in<br />
the business of buying and selling securities or, if it is in such business, it did not acquire the Offer<br />
Shares from <strong>Tallink</strong> or an affiliate thereof in the initial distribution of the Offer Shares;<br />
(5) <strong>Tallink</strong> shall not recognize any offer, sale, pledge or other transfer of the Offer Shares made other than<br />
in compliance with the above-stated restrictions; and<br />
(6) The Offer Shares have not been offered to it by means of any “directed selling efforts” as defined in<br />
Regulation S under the Securities Act.<br />
Each purchaser of the Offer Shares within the United States will be deemed to have acknowledged,<br />
represented and agreed that it has received a copy of this offering memorandum and such other information as it<br />
deems necessary to make an informed investment decision and that (terms defined in Rule 144A or Regulation S<br />
shall have the same meanings when used in this section):<br />
(1) The purchaser acknowledges that the Offer Shares have not been and will not be registered under the<br />
Securities Act or with any securities regulatory authority of any state of the United States and are<br />
subject to significant restrictions on transfer;<br />
(2) The purchaser (i) is a qualified institutional buyer (as defined in Rule 144A under the Securities Act),<br />
(ii) is aware that the sale to it is being made in reliance on Rule 144A, and (iii) is acquiring such Offer<br />
Shares for its own account or for the account of a qualified institutional buyer, in each case for<br />
investment and not with a view to any resale or distribution of the Offer Shares;<br />
(3) The purchaser is aware the Offer Shares are being offered in the United States in a transaction not<br />
involving any public offering in the United States within the meaning of the Securities Act;<br />
(4) If in the future, the purchaser decides to offer, resell, pledge or otherwise transfer such Offer Shares,<br />
such Offer Shares may be offered, sold, pledged or otherwise transferred only (i) to a person whom the<br />
beneficial owner and/or any person acting on its behalf reasonably believes is a qualified institutional<br />
buyer in a transaction meeting the requirements of Rule 144A, (ii) outside the United States in<br />
accordance with Regulation S under the Securities Act, (iii) in accordance with Rule 144 under the<br />
Securities Act (if available) or (iv) in accordance with an effective registration statement under the<br />
Securities Act, in each case in accordance with any applicable securities laws of any state of the United<br />
States or any other jurisdiction and agrees to give any subsequent purchaser of such Offer Shares notice<br />
of any restrictions on the transfer thereof;<br />
(5) The Offer Shares are “restricted securities” within the meaning of Rule 144(a)(3) and no representation<br />
is made as to the availability of the exemption provided by Rule 144 for resales of any Shares;<br />
92
(6) The purchaser will not deposit or cause to be deposited such Offer Shares into any depositary receipt<br />
facility established or maintained by a depositary bank other than a Rule 144A restricted depositary<br />
receipt facility, so long as such Offer Shares are “restricted securities” within the meaning of Rule<br />
144(a)(3); and<br />
(7) <strong>Tallink</strong> shall not recognize any offer, sale pledge or other transfer of the Offer Shares made other than<br />
in compliance with the above-stated restrictions.<br />
93
LEGAL MATTERS<br />
Certain legal matters in connection with the Offering will be passed upon for us by Raidla & Partners,<br />
Attorneys at Law with respect to Estonian law, by Roschier Holmberg, Attorneys Ltd. with respect to Finnish<br />
law and by Davis Polk & Wardwell with respect to U.S. law.<br />
Certain legal matters in connection with the Offering will be passed upon for the Managers by<br />
Advokaadibüroo Tark & Co with respect to Estonian law and by White & Case LLP with respect to Finnish and<br />
U.S. law.<br />
94
INDEPENDENT AUDITORS<br />
Pursuant to the Estonian Commercial Code, our general meeting of shareholders shall approve the number<br />
of auditors and elect our auditors. Pursuant to a resolution dated February 5, 2005, the general meeting of<br />
shareholders elected Marju Põldniit and Hanno Lindpere, certified auditors from Ernst & Young <strong>Baltic</strong><br />
<strong>Aktsiaselts</strong>, as our auditors for the financial year ended August 31, 2005. Ernst & Young <strong>Baltic</strong> <strong>Aktsiaselts</strong> have<br />
acted as our auditors since 2002.<br />
The statutory audited consolidated financial statements of <strong>Tallink</strong> Group for the financial year ended<br />
August 31, 2004, with comparative information for the financial year ended August 31, 2003, and for the<br />
financial year ended August 31, 2005, with comparative information for the financial year ended August 31,<br />
2004, as well as the statutory audited unconsolidated financial statements of <strong>Tallink</strong> for the financial year ended<br />
August 31, 2004, with comparative information for the financial year ended August 31, 2003, and for the<br />
financial year ended August 31, 2005, with comparative information for the financial year ended August 31,<br />
2004, have been audited by Ernst & Young <strong>Baltic</strong> <strong>Aktsiaselts</strong>. Certain financial information presented by us in<br />
this offering memorandum has been obtained directly from our audited financial statements, while certain other<br />
financial information presented herein has been recomputed by us from amounts contained in the audited<br />
financial statements. This financial information is presented in the following sections: Summary, Capitalization,<br />
Selected Financial Information, Operating and Financial Review and Prospects, Business and Management. All<br />
remaining financial information presented herein, including certain information in the aforementioned sections,<br />
has been derived by us from our unaudited records.<br />
95
[THIS PAGE INTENTIONALLY LEFT BLANK]
INDEX TO FINANCIAL STATEMENTS<br />
Consolidated Financial Statements for AS <strong>Tallink</strong> <strong>Grupp</strong> for the financial year ended August 31,<br />
2005 with comparative information for the financial year ended August 31, 2004<br />
Consolidated and Parent Company Income Statement .......................................... F-2<br />
Consolidated and Parent Company Balance Sheet ............................................. F-3<br />
Consolidated and Parent Company Cash Flow Statement ....................................... F-4<br />
Statement of Changes in Equity ........................................................... F-5<br />
Notes to the Financial Statements .......................................................... F-6<br />
Management Board’s Approval of the Financial Statements ..................................... F-32<br />
Auditors’ Report .......................................................................<br />
Consolidated Financial Statements for AS <strong>Tallink</strong> <strong>Grupp</strong> for the financial year ended August 31,<br />
2004 with comparative information for the financial year ended August 31, 2003<br />
F-33<br />
Consolidated and Parent Company Income Statement .......................................... F-34<br />
Consolidated and Parent Company Balance Sheet ............................................. F-35<br />
Consolidated and Parent Company Cash Flow Statement ....................................... F-36<br />
Statement of Changes in Equity ........................................................... F-37<br />
Notes to the Financial Statements .......................................................... F-38<br />
Management Board’s Approval of the Financial Statements ..................................... F-63<br />
Auditors’ Report ....................................................................... F-64<br />
F-1<br />
Page
FINANCIAL STATEMENTS FOR THE FINANCIAL YEAR ENDED AUGUST 31, 2005<br />
INCOME STATEMENT<br />
for the financial year ended August 31, in thousands of EEK<br />
The Group The Parent<br />
2005 2004 2005 2004 Notes<br />
Revenue ................................... 4,062,961 3,406,255 2,543,015 2,210,754 3<br />
Costofsales ................................ (2,979,506) (2,478,745) (2,426,289) (1,971,368) 4<br />
Gross profit ................................ 1,083,455 927,510 116,726 239,386<br />
Marketing expenses .......................... (336,203) (351,427) (191,337) (170,996) 4<br />
Administrative expenses ...................... (119,944) (128,283) (83,596) (71,265) 4<br />
Other operating income ....................... 2,039 799 1,303 242<br />
Other operating expenses ...................... (573) (2,331) (278) (1,398)<br />
Operating profit ............................ 628,774 446,268 (157,182) (4,031) 3<br />
Net financial items ........................... (158,706) (134,300) (152,425) (133,257) 4<br />
Share of profit of subsidiaries .................. 0 0 779,135 448,951 10<br />
Share of profit of associates .................... 3,643 1,360 3,643 1,360 11<br />
Profit before income tax and minority interests .. 473,711 313,328 473,171 313,023 3<br />
Income tax ................................. (356) (305) 0 0 5<br />
Profit before minority interests ................ 473,355 313,023 473,171 313,023<br />
Minority interests ............................ (184) 0 0 0<br />
Net profit for the financial year ............... 473,171 313,023 473,171 313,023 3<br />
Basic and diluted earnings per share (in EEK per<br />
share) ................................... 4.30 2.87 6<br />
F-2
FINANCIAL STATEMENTS FOR THE FINANCIAL YEAR ENDED AUGUST 31, 2005<br />
BALANCE SHEET<br />
as of August 31, in thousands of EEK<br />
The Group The Parent<br />
2005 2004 2005 2004 Notes<br />
ASSETS<br />
Current assets<br />
Cash and cash equivalents ........................ 326,786 366,668 148,340 171,220 7<br />
Receivables and prepayments ..................... 198,028 219,141 438,919 312,841 8<br />
Taxassets..................................... 4,512 5,512 51 4,099 5<br />
Inventories .................................... 84,900 84,553 40,103 39,287 9<br />
614,226 675,874 627,413 527,447<br />
Non-current assets<br />
Investments in subsidiaries ....................... 0 0 3,104,308 2,072,910 10<br />
Investments in associates ......................... 0 2,557 0 2,557 11<br />
Other financial assets and prepayments ............. 72 2,113 734,354 619,668 12<br />
Property, plant and equipment ..................... 6,136,720 6,050,938 2,316,118 2,656,290 13<br />
Intangible assets ................................ 176,153 176,443 1,692 2,517 14<br />
6,312,945 6,232,051 6,156,472 5,353,942<br />
TOTAL ASSETS .............................. 6,927,171 6,907,925 6,783,885 5,881,389 3<br />
LIABILITIES AND EQUITY<br />
Current liabilities<br />
Interest-bearing loans and borrowings .............. 690,473 750,717 668,373 617,725 15<br />
Payables and deferred income ..................... 363,878 420,402 1,105,420 754,805 16<br />
Tax liabilities .................................. 70,805 70,779 22,794 21,048 5<br />
1,125,156 1,241,898 1,796,587 1,393,578<br />
Non-current liabilities<br />
Interest-bearing loans and borrowings .............. 3,145,864 3,483,375 2,281,309 2,254,993 15<br />
Other non-current liabilities ...................... 0 0 50,441 50,441 16<br />
Deferred income tax liability ...................... 329 275 0 0 5<br />
3,146,193 3,483,650 2,331,750 2,305,434<br />
Total liabilities ................................ 4,271,349 4,725,548 4,128,337 3,699,012 3<br />
Minority interests ............................. 274 0 0 0<br />
Equity<br />
Share capital .................................. 1,100,000 275,000 1,100,000 275,000 17<br />
Share premium ................................. 0 414,870 0 414,870 17<br />
Reserves...................................... 27,500 27,500 27,500 27,500 2<br />
Retainedearnings .............................. 1,528,048 1,465,007 1,528,048 1,465,007<br />
2,655,548 2,182,377 2,655,548 2,182,377<br />
TOTAL LIABILITIES AND EQUITY ............ 6,927,171 6,907,925 6,783,885 5,881,389<br />
F-3
FINANCIAL STATEMENTS FOR THE FINANCIAL YEAR ENDED AUGUST 31, 2005<br />
CASH FLOW STATEMENT<br />
for the year ended August 31, in thousands of EEK<br />
The Group The Parent<br />
2005 2004 2005 2004 Notes<br />
Cash flow from operating activities<br />
Profit before minority interests ..................... 473,355 313,023 473,171 313,023<br />
Adjustments .................................... 427,213 404,604 66,434 123,536 18<br />
Changes in assets related to operating activities ........ 38,154 (99,933) (51,803) (100,173)<br />
Changes in liabilities related to operating activities ..... (47,803) 187,071 352,368 174,992<br />
Income tax paid ................................. (117) (338) 0 0<br />
Cash flow (used for) investing activities<br />
Purchase of property, plant, equipment and intangible<br />
890,802 804,427 840,170 511,378<br />
assets ....................................... (357,238) (2,396,561) (4,589) (20,316)<br />
13,<br />
14,18<br />
Proceeds from disposals of property, plant, equipment . . . 1,372 382 0 0<br />
Repayments of granted loans ....................... 0 0 138,766 395,779<br />
Loans granted ................................... 0 0 (266,357) (457,596) 12<br />
Acquisition of subsidiaries ......................... 90 (46) (300,666) (105) 10<br />
Dividends received ............................... 1,200 800 1,200 800 11<br />
Interest received ................................. 2,974 9,269 4,202 30,021<br />
(351,602) (2,386,156) (427,444) (51,417)<br />
Cash flow from (used for) financing activities<br />
Proceeds from loans and bonds ..................... 458,028 2,251,129 458,028 97,046<br />
Redemption of loans and bonds ..................... (884,685) (820,022) (209,792) (310,411)<br />
Change in overdraft .............................. 18,249 0 18,249 0 15<br />
Repayment of finance lease liabilities ................ (967) (597) (544,696) (459,610)<br />
Interestpaid .................................... (169,707) (110,584) (157,395) (154,853)<br />
Proceeds from issue of shares ...................... 0 396,647 0 396,647 17<br />
(579,082) 1,716,573 (435,606) (431,181)<br />
TOTAL NET CASH FLOW ...................... (39,882) 134,844 (22,880) 28,780<br />
Cash and cash equivalents:<br />
—at the beginning of period ....................... 366,668 231,824 171,220 142,440<br />
—increase (decrease) ............................. (39,882) 134,844 (22,880) 28,780<br />
—at the end of period ........................... 326,786 366,668 148,340 171,220 7<br />
F-4
FINANCIAL STATEMENTS FOR THE FINANCIAL YEAR ENDED AUGUST 31, 2005<br />
STATEMENT OF CHANGES IN EQUITY<br />
for the year ended August 31, in thousands of EEK<br />
Share<br />
capital<br />
Share<br />
premium Reserves<br />
Retained<br />
earnings<br />
Total<br />
Equity<br />
As of August 31, 2003 ......................... 224,000 69,223 22,400 1,157,084 1,472,707<br />
Issue of shares ................................ 51,000 345,647 0 0 396,647<br />
Transferfromretainedearningstoreserves ......... 0 0 5,100 (5,100) 0<br />
Net profit for the financial year 2003/2004 ......... 0 0 0 313,023 313,023<br />
As of August 31, 2004 ......................... 275,000 414,870 27,500 1,465,007 2,182,377<br />
Issue of shares ................................ 825,000 (414,870) 0 (410,130) 0<br />
Net profit for the financial year 2004/2005 ......... 0 0 0 473,171 473,171<br />
As of August 31, 2005 ......................... 1,100,000 0 27,500 1,528,048 2,655,548<br />
There are no differences in the Group’s and the Parent’s statements of changes in equity. For additional<br />
information on the equity see Note 17.<br />
F-5
FINANCIAL STATEMENTS FOR THE FINANCIAL YEAR ENDED AUGUST 31, 2005<br />
NOTES TO THE FINANCIAL STATEMENTS<br />
Note 1 CORPORATE INFORMATION<br />
The financial statements of <strong>Tallink</strong> <strong>Grupp</strong> AS (both as the Group and the Parent) for the year ended<br />
August 31, 2005 were authorized for issue in accordance with a resolution of the Management Board on<br />
October 10, 2005. According to the Estonian Business Code, the annual report, including the financial<br />
statements, is authorized by the shareholders’ general meeting. The shareholders hold the power not to approve<br />
the annual report prepared and presented by the management and the right to request a new annual report to be<br />
prepared.<br />
<strong>Tallink</strong> <strong>Grupp</strong> AS is a limited company incorporated and domiciled in Estonia that employed 2,694 people<br />
at August 31, 2005 (2,820 at August 31, 2004). The principal activities of the Group are described in Note 3<br />
Segment Information. <strong>Tallink</strong> <strong>Grupp</strong> AS is controlled by Infortar AS, which owns 55.53% of the shares of<br />
<strong>Tallink</strong> <strong>Grupp</strong> AS as of October 10, 2005. The ultimate parent of the Group is Linandell OÜ.<br />
Note 2 SUMMARY OF SIGNIFICANT ACCOUNTING POLICIES<br />
Basis of preparation<br />
The financial statements of <strong>Tallink</strong> <strong>Grupp</strong> AS have been prepared in accordance with International Financial<br />
Reporting Standards (IFRS), which comprise standards and interpretations approved by the IASB, and<br />
International Accounting Standards and Standing Interpretations Committee interpretations approved by the<br />
IASC that remain in effect as of August 31, 2005, except for IAS 16 (revised 2004), which was adopted before its<br />
effective date, i.e., financial years beginning on or after January 1, 2005. IAS 16 (revised 2004) was adopted<br />
already in the financial year ended August 31, 2004.<br />
The financial statements have been prepared in thousands of Estonian kroons (EEK) and based on a<br />
historical cost basis, unless indicated otherwise in the accounting principles below (e.g., derivative financial<br />
instruments have been measured at fair value).<br />
Basis of consolidation<br />
The consolidated financial statements comprise the financial statements of <strong>Tallink</strong> <strong>Grupp</strong> AS and its<br />
subsidiaries drawn up to August 31, each year. The financial statements of the subsidiaries are prepared for the<br />
same reporting year as the Parent, using consistent accounting policies. Subsidiaries are consolidated from the<br />
date on which control has been transferred to the Group and cease to be consolidated from the date on which<br />
control has been transferred out of the Group.<br />
All intra-group transactions, balances and unrealized profits on transactions between Group companies have<br />
been eliminated in the consolidated financial statements. Unrealized losses are eliminated unless costs cannot be<br />
recovered.<br />
Minority interests represent the portion of profit or loss and net assets in subsidiaries not held by the Group<br />
and are presented separately in the consolidated income statement and balance sheet.<br />
New subsidiaries (business combinations) have been included in the consolidated financials statements<br />
using the purchase method of accounting. Accordingly, the consolidated income statement and consolidated cash<br />
flow statement include the results and cash flows of new subsidiaries for the period from their acquisition date.<br />
The purchase consideration is allocated to the fair value of the assets acquired and liabilities and contingent<br />
liabilities assumed on the date of acquisition.<br />
In the Parent’s financial statements, investments in its subsidiaries are accounted for under the equity<br />
method of accounting. Investment in subsidiaries is carried in the balance sheet at cost plus post-acquisition<br />
changes in the Parent’s share of net assets of the subsidiaries, less any impairment in value.<br />
Changes in accounting polices<br />
The accounting policies adopted are consistent with those of the previous financial year except that the<br />
Group has adopted those standards designed to form the “stable platform” to be mandatory for the financial years<br />
beginning on or after March 31, 2004.<br />
F-6
FINANCIAL STATEMENTS FOR THE FINANCIAL YEAR ENDED AUGUST 31, 2005<br />
NOTES TO THE FINANCIAL STATEMENTS—(Continued)<br />
Note 2 SUMMARY OF SIGNIFICANT ACCOUNTING POLICIES (Continued)<br />
IFRS 3 “Business combinations”, IAS 36 “Impairment of Assets” and IAS 38 “Intangible assets”<br />
Standards IFRS 3, IAS 36 (revised 2004) and IAS 38 (revised 2004), were applied to business combinations<br />
for which the agreement date was on or after March 31, 2004 and goodwill and other intangible assets, which<br />
arose from such business combinations, already in the previous financial year.<br />
In the current financial year, these standards were also applied to goodwill arising from business<br />
combinations, the agreement date of which was before March 31, 2004, and to other intangible assets.<br />
The adoption of IFRS 3 and IAS 36 (revised 2004) has resulted in the Group ceasing annual goodwill<br />
amortization and to test for impairments annually at the cash generating unit level (unless an event occurs during<br />
the year which requires the goodwill to be tested more frequently) from September 1, 2004. The transitional<br />
provisions of IFRS 3 have required the Group to eliminate the amount of the accumulated amortization by EEK<br />
30,558,000 with a corresponding entry to gross carrying amount of goodwill.<br />
Moreover, the useful life of intangible assets are now assessed at the individual asset level as having either a<br />
finite or indefinite life. Where an intangible asset has a finite life, it has been amortized over its useful life, which<br />
together with the amortization method are reviewed at the earlier of annually or where an indicator of impairment<br />
exists. Intangibles assessed as having indefinite useful lives are not amortized, as there is no foreseeable limit to<br />
the year over which the asset is expected to generate net cash inflows for the Group. However, intangibles with<br />
indefinite useful lives are reviewed annually to ensure that their carrying value does not exceed the recoverable<br />
amount irrespective of whether an indicator of impairment is present.<br />
Investment in associates<br />
The Group’s investment in its associates is accounted for under the equity method of accounting. An<br />
associate is an entity in which the Group has significant influence, but which is not a subsidiary of the Group.<br />
The investment in an associate is carried in the balance sheet at cost plus post-acquisition changes in the Group’s<br />
share of net assets of the associate, less any impairment in value.<br />
The reporting dates of the associate and the Group are identical and both use consistent accounting policies.<br />
The income statement reflects the shares of the results of operations of the associate. Where there has been a<br />
change recognized directly in the associate’s equity, the Group recognizes its share of any changes and discloses<br />
this, when applicable, in the statement of changes in equity.<br />
Foreign exchange transactions<br />
The financial statements of the Group companies have been prepared using the currency (measurement<br />
currency), which reflects the company’s economic environment the best. The consolidated financial statements<br />
of the Group and the separate financial statements of the Parent have been prepared in Estonian kroon, which is<br />
the measurement currency of the Parent.<br />
Transactions in foreign currencies are recorded at the exchange rate of the transaction date. Monetary assets<br />
and liabilities denominated in foreign currencies are retranslated at the exchange rate of the balance sheet date.<br />
All differences are recognized in the income statement as financial items.<br />
The foreign subsidiaries are considered as “foreign operations that are integral to the operations of the<br />
Parent”, which means that the individual items in the financial statements of the foreign subsidiaries are<br />
translated as if all its transactions had been entered into by the Parent itself. The cost and depreciation of<br />
property, plant and equipment is translated using the exchange rate at the date of purchase of the asset. Monetary<br />
assets and liabilities denominated in foreign currencies are translated at the exchange rate at the date of the<br />
balance sheet. All differences are taken to the income statement.<br />
Goodwill and fair value adjustments arising out of the acquisition of a foreign entity are treated as assets of<br />
the acquiring company and are recorded at the exchange rate as of the acquisition date.<br />
F-7
FINANCIAL STATEMENTS FOR THE FINANCIAL YEAR ENDED AUGUST 31, 2005<br />
NOTES TO THE FINANCIAL STATEMENTS—(Continued)<br />
Note 2 SUMMARY OF SIGNIFICANT ACCOUNTING POLICIES (Continued)<br />
Property, plant and equipment<br />
Property, plant and equipment are stated at cost, excluding the cost of day-to-day servicing, less<br />
accumulated depreciation and any impairment in value.<br />
Subsequent expenditure relating to an item of property, plant and equipment that has already been<br />
recognized (e.g. replacements of part of some items) are added to the carrying amount of the assets, if the<br />
recognition criteria are met, i.e., (a) it is probable that future economic benefits associated with the item will flow<br />
to the Group, and (b) the cost of the item can be measured reliably. The replaced items are derecognized. All<br />
other expenditures are recognized as an expense in the period in which it is incurred.<br />
Depreciation is calculated on a straight-line basis over the estimated useful life of the asset as follows:<br />
Buildings ...................................................................... 20years;<br />
Plant and equipment ............................................................. 5years;<br />
Ships ......................................................................... 5to55years;<br />
Other equipment ................................................................ 3to5years.<br />
Land is not depreciated.<br />
Depreciation charge is calculated separately for each significant part of the ships on a straight-line basis<br />
over the estimated useful life of each part as follows:<br />
—Hull ....................................................................... 11to55years;<br />
—Machinery .................................................................. 11to43years;<br />
—On-board equipment (short-term usage) ........................................... 5to10years;<br />
—On-board equipment (long-term usage) ........................................... 10to25years.<br />
Depreciation is stopped when the carrying value of an asset equals its residual value. The residual value of<br />
hull is based on the current prices of relevant metals and the probable quantity of scrap metals realizable at the<br />
end of ships’ useful life. The Group estimates that the residual value of other items of property, plant and<br />
equipment is nil.<br />
The residual value and the useful life of items of property, plant and equipment are reviewed at least at each<br />
financial year and, if expectations differ from previous estimates, the changes are accounted for as a change in an<br />
accounting estimate.<br />
The carrying value of property, plant and equipment are reviewed for impairment when events or changes in<br />
circumstances indicate that the carrying value may not be recoverable. If any such indication exists, the Group<br />
makes an estimate of the asset’s recoverable amount. Where the carrying amount of an asset exceeds the<br />
estimated recoverable amount, which is specified as the higher of an asset’s fair value less cost to sell and value<br />
in use, the individual assets or group of assets comprising cash-generating units are written down to their<br />
recoverable amount. At least two independent brokers are used annually to determine market value of the ships<br />
and identify impairment indicators, if any.<br />
An item of property, plant and equipment is derecognized upon disposal or when no future economic<br />
benefits are expected from its use or disposal. Any gain or loss arising on derecognition of the asset is included in<br />
the income statement (under “other operating income” or “other operating expenses”) in the financial year the<br />
asset is derecognized.<br />
Dry-docking costs<br />
The ships are dry-docked in intervals of two or five years. The major expenditures related to the drydocking<br />
are capitalized and recorded in the same line of the balance sheet as the ships. The depreciation period<br />
applied to capitalized dry-docking costs coincides with the frequency of dry-docking (2-5 years).<br />
F-8
FINANCIAL STATEMENTS FOR THE FINANCIAL YEAR ENDED AUGUST 31, 2005<br />
NOTES TO THE FINANCIAL STATEMENTS—(Continued)<br />
Note 2 SUMMARY OF SIGNIFICANT ACCOUNTING POLICIES (Continued)<br />
Goodwill<br />
Goodwill acquired in a business combination is initially measured at cost, which equals the excess of the<br />
cost of the acquisition over the fair value of identifiable assets, liabilities and contingent liabilities of a subsidiary<br />
at the date of acquisition.<br />
After initial recognition, the goodwill is measured at cost less any accumulated impairment losses. Goodwill<br />
is reviewed for impairment, annually or more frequently if events or changes in circumstances indicate that the<br />
carrying value may be impaired.<br />
For the purpose of impairment testing, goodwill acquired in a business combination is allocated to each of<br />
the Group’s cash-generating units, or groups of cash-generating units, that are expected to benefit from the<br />
synergies of the combination. Each unit or group of units to which the goodwill is allocated (1) represents the<br />
lowest level within the Group at which the goodwill is monitored for internal management purposes; and (2) is<br />
not larger than a segment based on the Group’s primary reporting format.<br />
Impairment is determined by assessing the recoverable amount of the cash-generating unit to which the<br />
goodwill relates. Where the recoverable amount of the cash-generating unit is less than the carrying amount, an<br />
impairment loss is recognized. Impairment losses of goodwill are recorded as “administrative expenses” in the<br />
income statement.<br />
Intangible assets<br />
Intangible assets acquired separately from a business are initially recognized at cost. Intangible assets<br />
acquired as part of an acquisition of a business are capitalized at fair value as at the date of acquisition.<br />
Following initial recognition, other intangible assets are stated at cost less accumulated amortization and any<br />
accumulated impairment in losses.<br />
Internally generated intangible assets, excluding capitalized development costs, are not capitalized and<br />
expenditure is charged against profits in the year in which the expenditure is incurred.<br />
The useful lives of intangible assets are assessed to be either a finite or indefinite life. Intangible assets with<br />
finite lives are amortized over the useful economic life on a straight-line basis (maximum of five years) and<br />
assessed for impairment whenever there is an indication that the intangible asset may be impaired. The<br />
amortisation period and the amortization method for an intangible asset with finite life are reviewed at each<br />
financial year-end. Changes in the expected useful life or the expected pattern of consumption of future<br />
economic benefits embodied in the asset is accounted for by changing the amortization period or method, as<br />
appropriate, and treated as changes in accounting estimates. The amortization expense on intangible assets with<br />
finite lives is recognized in the income statement in the expense category consistent with the function of the<br />
intangible asset.<br />
Intangible assets with indefinite useful lives are tested for impairment annually either individually or at the<br />
cash-generating unit level. Such intangibles are not amortized. The useful life of an intangible asset with an<br />
indefinite life is reviewed annually to determine whether indefinite life assessment continues to be supportable. If<br />
not, the change in the useful life assessment from indefinite is made on a prospective basis.<br />
Research and development costs<br />
Research costs are expensed as incurred. An intangible asset arising from development expenditure on an<br />
individual project is capitalized only when the Group can demonstrate (1) the technical feasibility of completing<br />
the intangible asset so that it will be available for use or sale; (2) its intention to complete and its ability to use or<br />
sell the asset; (3) how the asset will generate future economic benefits; (4) the ability of resources to complete;<br />
and (5) the availability to measure reliably the expenditure during the development.<br />
Following the initial recognition of the development expenditure, the cost model is applied which require<br />
the asset to be carried at cost less any accumulated amortization and accumulated impairment losses. Any<br />
expenditure capitalized is amortized over the period of expected future sales from the related project.<br />
F-9
FINANCIAL STATEMENTS FOR THE FINANCIAL YEAR ENDED AUGUST 31, 2005<br />
NOTES TO THE FINANCIAL STATEMENTS—(Continued)<br />
Note 2 SUMMARY OF SIGNIFICANT ACCOUNTING POLICIES (Continued)<br />
The carrying value of development costs is reviewed for impairment annually when the asset is not yet in<br />
use or more frequently when an indication of impairment arises during the reporting year.<br />
Financial assets<br />
All investments are initially recognized at cost, being the fair value of the consideration given and including<br />
acquisition charges associated with the investment.<br />
All regular way purchases and sales of financial assets are recognized on the settlement date, i.e., the date<br />
that an asset is delivered to or by the Group. Regular way purchases or sales are purchases or sales of financial<br />
assets that require delivery of assets within the period generally established by regulation or convention in the<br />
marketplace.<br />
After initial recognition, investments, which are classified as held for trading and available-for-sale, are<br />
measured at fair value. Non-current receivables are measured at amortized cost using the effective interest rate<br />
method. Amortized cost is calculated by taking into account a discount or a premium on acquisition over the<br />
period to maturity. If there is objective evidence that an impairment loss on non-current receivables carried at<br />
amortized cost has been incurred, the amount of the loss is measured as the difference between the asset’s<br />
carrying amount and the present value of estimated future cash flows discounted at the financial asset’s original<br />
effective interest rate. The carrying amount of the asset is reduced through use of an allowance account.<br />
Increases/decreases in the carrying amount of investments and any gains and losses on the disposal of<br />
investments are charged or credited to the income statement within “net financial items”.<br />
The derecognition of a financial asset takes place when the Group no longer controls the contractual rights<br />
that comprise the financial instrument, which is normally the case when the instrument is sold, or all the cash<br />
flows attributable to the instrument are passed through to an independent third party.<br />
Derivative financial instruments<br />
The Group uses derivative financial instruments such as interest rate swaps to hedge its risks associated with<br />
interest rate. Such derivative financial instruments are initially recognized at fair value on the date on which a<br />
derivative contract is entered into and are subsequently remeasured at fair value. Derivatives are carried as assets<br />
when the fair value is positive and as liabilities when the fair value is negative.<br />
Any gain or losses arising from changes in fair value on derivatives that do not qualify for hedge accounting<br />
are taken directly to net profit or loss for the financial year.<br />
The fair value of interest rate swap contracts is determined using the discounted net cash flow method based<br />
on estimation on the 3-month EURIBOR (from Bloomberg system).<br />
Inventories<br />
Inventories are valued at the lower of cost and net realizable value. Cost of both raw materials, consisting<br />
mostly of fuel, and merchandise purchased for resale is assigned by using the weighted average cost method.<br />
Trade and other current receivables<br />
Trade receivables, which generally have payment terms of 7-30 days, are recognized and carried at original<br />
invoice amount less an allowance for any uncollectible amounts. An estimate for doubtful debts is made when<br />
collection of the full amount is no longer probable. Bad debts are written off from the balance sheet when<br />
identified.<br />
Cash and cash equivalents<br />
Cash equivalents are short-term highly liquid investments that are readily convertible to known amounts of<br />
cash and which are subject to insignificant risk of changes in value.<br />
F-10
FINANCIAL STATEMENTS FOR THE FINANCIAL YEAR ENDED AUGUST 31, 2005<br />
NOTES TO THE FINANCIAL STATEMENTS—(Continued)<br />
Note 2 SUMMARY OF SIGNIFICANT ACCOUNTING POLICIES (Continued)<br />
Borrowings<br />
Borrowings are recognized initially at the fair value of proceeds received, net of directly attributable<br />
transaction costs. In subsequent periods, borrowings are stated at amortized cost using the effective interest<br />
method; any difference between proceeds (net of transaction costs) and the redemption value is recognized in the<br />
income statement over the period of the borrowings. Borrowings are derecognized when the obligation under the<br />
liability is discharged, cancelled or expired.<br />
Borrowing costs are recognized as an expense when incurred, except those which are directly attributable to<br />
the acquisition, construction or production of the assets that necessarily take a substantial period of time to get<br />
ready for its intended use or sale (e.g., new ships). Borrowing costs related to the building of new ships are<br />
capitalized as a part of the acquisition cost of an asset (incurred up to the delivery date).<br />
Leases<br />
Group as a lessee. Finance leases, which transfer to the Group substantially all the risks and benefits<br />
incidental to ownership of the leased item, are capitalized at the inception of the lease at the fair value of the<br />
leased assets or, if lower, at the present value of the minimum lease payments. Lease payments are apportioned<br />
between the finance charges and reduction of the lease liability to achieve a constant rate of interest on the<br />
remaining balance of the liability. Finance charges are charged directly in income statement. Capitalized leased<br />
assets are depreciated over the shorter of the estimated useful life of the asset or the lease term.<br />
Leases, where the lessor retains substantially all the risks and benefits of ownership of the asset, are<br />
classified as operating leases and lease payments are recognized as operating expenses on a straight-line basis<br />
over the lease term.<br />
Group as a lessor. Leases, where the Group retains substantially all the risks and benefits of ownership of<br />
the assets, are classified as operating leases. Lease income from operating leases is recognized in income on a<br />
straight-line basis over the lease term. The Group presents the lease income and lease expense arising from the<br />
same ship on a net basis if the leases are different type charters (i.e., bare-boat charter and time charter).<br />
Provisions and contingent liabilities<br />
Provisions are recognized when the Group has a present obligation (legal or constructive) as a result of past<br />
events, it is probable that an outflow of resources embodying economic benefits will be required to settle the<br />
obligation and a reliable estimate of the amount of the obligation can be made. If the effect of the time value of<br />
money is material, provisions are discounted using a current pre-tax rate that reflects, where appropriate, the risk<br />
specific to the liability.<br />
Promises, guarantees and other commitments that in certain circumstances may become liabilities, but in the<br />
opinion of the Group’s management the probability of an outflow to settle these liabilities is lower than 50%, are<br />
disclosed in the notes to the financial statements as contingent liabilities.<br />
Reserves in equity<br />
Reserves in equity include a mandatory legal reserve formed according to the Estonian Commercial Code.<br />
At least 5% of the net profit must be transferred to the mandatory legal reserve each financial year, until the<br />
mandatory legal reserve amounts to at least 10% of the share capital. The mandatory legal reserve cannot be paid<br />
out as dividends. Still, it can be used for covering a loss, if the loss cannot be covered from the distributable<br />
shareholder’s equity. The mandatory legal reserve can also be used for increasing the share capital of the<br />
company.<br />
Segment reporting<br />
The primary segments of the Group are geographical segments (by the routes and mainland) and the<br />
secondary segments are operational segments (tickets sales, sales of cargo transport, restaurant and shops sales<br />
onboard and on mainland, hotel (accommodation) sales and other). Expenses not related to a specific segment are<br />
recorded as unallocated expenses of the Group.<br />
F-11
FINANCIAL STATEMENTS FOR THE FINANCIAL YEAR ENDED AUGUST 31, 2005<br />
NOTES TO THE FINANCIAL STATEMENTS—(Continued)<br />
Note 2 SUMMARY OF SIGNIFICANT ACCOUNTING POLICIES (Continued)<br />
All assets directly related to the segments are recorded as assets of the segments and all liabilities directly<br />
related to the segments are recorded as liabilities of the segments. Unallocated assets and liabilities are recorded<br />
as assets and liabilities of the Group.<br />
Revenue<br />
Revenue is recognized to the extent that it is probable that the economic benefits will flow to the Group and<br />
the revenue can be reliably measured. The following specific recognition criteria must also be met before<br />
revenue is recognised:<br />
Sale of goods<br />
Revenue is recognized when the significant risks and rewards of ownership of the goods have passed to the<br />
buyer.<br />
Ticket sale and sale of cargo transport<br />
Revenue from tickets and cargo transport are recognized in the income statement at the time of departure. At<br />
financial year-end, if material, a revenue deferral is recorded for the part of the revenue that has not yet been<br />
earned in relation to the tickets sold.<br />
Sales of hotel rooms<br />
Revenue from sales of hotel rooms is recognized in the income statement when the rooms are used by the<br />
clients. At financial year-end, if material, a revenue deferral is recorded for the part of the revenue that has not<br />
yet been earned in relation to the room days sold.<br />
Revenue from package deals<br />
The Group also sells packages, which consist of the ship ticket, accommodation in a hotel not operated by<br />
the Group and tours in different cities not provided by the Group. The Group recognizes the sales of package in<br />
its revenue in full instead of recognizing only the commission fee for accommodations, tours and entertainment<br />
events, as the Group (1) is able to determine the price of the content of package; (2) has discretion in selecting<br />
the suppliers for the service offer; and (3) bears any credit risks.<br />
Interest<br />
Revenue is recognized as the interest accrues (taking into account the effective yield on the asset).<br />
Dividends<br />
Revenue is recognized when the Group’s right to receive the payment is established.<br />
Income tax<br />
Income tax contains current income tax and deferred income tax.<br />
The Parent and its Estonian subsidiaries:<br />
According to the Estonian Income Tax Law, the company’s net profit is not subject to income tax but all<br />
dividends paid by the company are subject to income tax (26/74 of net dividend paid out before December 31,<br />
2004; 24/76 of net dividend paid out during the calendar year 2005 and after that the rate will decrease every year<br />
by one point until 20/80 of net dividends paid out after January 1, 2009). Therefore, there are no temporary<br />
differences between the tax bases and carrying values of assets and liabilities that may cause the deferred income<br />
tax.<br />
F-12
FINANCIAL STATEMENTS FOR THE FINANCIAL YEAR ENDED AUGUST 31, 2005<br />
NOTES TO THE FINANCIAL STATEMENTS—(Continued)<br />
Note 2 SUMMARY OF SIGNIFICANT ACCOUNTING POLICIES (Continued)<br />
The company’s potential tax liability related to the distribution of its retained earnings as dividends is not<br />
recorded in the balance sheet. The amount of potential tax liability related to the distribution of dividends<br />
depends on when, how much and from which sources the dividends are paid out.<br />
Income tax from the payment of dividends is recorded as income tax expense at the time of declaring the<br />
dividends.<br />
Swedish, Finnish and Russian subsidiaries:<br />
In accordance with income tax acts, the company’s net profit adjusted by temporary and permanent<br />
differences determined in income tax acts is subject to income tax in Finland, Sweden and Russia (in Finland the<br />
tax rate was 29% until December 31, 2004 and currently is 26%, in Sweden 28% and in Russia 22%).<br />
Deferred income tax is provided, using the liability method, on all temporary differences at the balance<br />
sheet date between the tax bases of assets and liabilities and their carrying amounts for financial reporting<br />
purposes. Deferred tax assets are recognized only when it is probable that profit will be available against which<br />
the deferred tax assets can be utilized.<br />
Tax to be paid is reported under current liabilities and deferred tax under non-current liabilities.<br />
Other subsidiaries:<br />
The net profit of shipping companies registered in Cyprus and Bahamas and dividends paid by these<br />
companies are treated without income tax. Thus there are no temporary differences between the tax bases and<br />
carrying values of assets and liabilities that may cause the deferred income tax.<br />
Note 3 SEGMENT INFORMATION<br />
The Group’s operating businesses are organized and managed separately according to the nature of the<br />
different markets. The Group operates (1) seven ships between Estonia and Finland, (2) four ships between<br />
Estonia and Sweden, (3) one ship first between Estonia and Russia until the end of year 2004, after which the<br />
vessel was leased under a time charter agreement and (4) one hotel and one shop in Estonia, which represent<br />
different business segments.<br />
The Group’s market share on the Estonia—Finland route is approximately 43% in passenger transportation<br />
and approximately 45% in cargo transportation, while the market share on the Estonia—Sweden route is<br />
approximately 100% in passenger transportation and approximately 100% in cargo transportation (according to<br />
the Port of Tallinn).<br />
In previous years financial statements there was separate segment of the Estonia—Russia route. As this<br />
route was closed (the total operating period was nine months: five in the previous financial year and four months<br />
this financial year) and its revenue was below 1.5% of the Group’s total revenue in each of these financial years,<br />
then in the current year financial statements the revenue and result of Estonia—Russia route have been presented<br />
under “Other”. Comparative information has also been restated in the current financial year.<br />
In financial statements of previous years, the ship leases were reported as inter-segment sales. This year the<br />
management re-considered the classification of the lease of ships and decided that it is more appropriate to report<br />
the revenue from lease of ships as a revenue within one segment, which is eliminated already at a segment level.<br />
Comparative information has been also restated in the current financial year. As the result of lease of ships<br />
amounted to zero, there is no effect of the restatement on the result of reported segments.<br />
In the opinion of the Group’s management the prices used in inter-segment transactions do not significantly<br />
differ from the prices used in transactions with external customers.<br />
F-13
FINANCIAL STATEMENTS FOR THE FINANCIAL YEAR ENDED AUGUST 31, 2005<br />
NOTES TO THE FINANCIAL STATEMENTS—(Continued)<br />
Note 3 SEGMENT INFORMATION (Continued)<br />
The following tables present the Group’s revenue and profit as well as certain asset and liability information<br />
regarding business segments for the years ended August 31, 2005 and 2004.<br />
Geographical segments—assets’ location<br />
for the year ended August 31, and as of August 31, respectively<br />
2005<br />
Estonia-<br />
Finland<br />
routes<br />
Estonia-<br />
Sweden<br />
route<br />
Estonia<br />
mainland<br />
business Other<br />
Elimination of<br />
inter-segment<br />
sales Total<br />
Revenue<br />
Sales to external customers .......... 2,442,325 1,391,979 87,808 140,849 4,062,961<br />
Inter-segment sales ................ 0 21,905 59,206 0 (81,111) 0<br />
2,442,325 1,413,884 147,014 140,849 (81,111) 4,062,961<br />
Result<br />
Segment result .................... 371,780 327,386 50,401 (2,315) 0 747,252<br />
Unallocated expenses .............. (118,478)<br />
Operating profit .................. 628,774<br />
Net financial items ................. (158,706)<br />
Share of profit of associates .......... 3,643<br />
Profit before income tax and<br />
minority interests ............... 473,711<br />
Income tax ....................... (356)<br />
Minority interests .................. (184)<br />
Net profit ........................ 473,171<br />
Assets and liabilities<br />
Segment assets .................... 3,047,100 2,982,700 17,662 281,129 (4,129) 6,324,462<br />
Unallocated assets ................. 602,709<br />
6,927,171<br />
Segment liabilities ................. 224,475 139,491 15,440 4,827 (4,129) 380,104<br />
Unallocated liabilities .............. 3,891,245<br />
4,271,349<br />
Other segment information<br />
Capital expenditures:<br />
—segment’s property, plant and<br />
equipment (“PP&E”) ............. 69,802 14,246 1,708 1,259 0 87,015<br />
—unallocated PP&E ............... 270,254<br />
—segment’s intangible assets (“IA”) . . 1,076 0 0 0 0 1,076<br />
Depreciation ...................... 131,777 106,473 1,935 24,197 0 264,382<br />
Unallocated depreciation ............ 6,130<br />
Amortization ..................... 1,015 351 0 0 0 1,366<br />
F-14
FINANCIAL STATEMENTS FOR THE FINANCIAL YEAR ENDED AUGUST 31, 2005<br />
NOTES TO THE FINANCIAL STATEMENTS—(Continued)<br />
Note 3 SEGMENT INFORMATION (Continued)<br />
2004<br />
Estonia-<br />
Finland<br />
routes<br />
Estonia-<br />
Sweden<br />
route<br />
Estonia<br />
mainland<br />
business Other<br />
Elimination of<br />
inter-segment<br />
sales Total<br />
Revenue<br />
Sales to external customers .......... 2,083,346 1,231,690 40,277 50,942 0 3,406,255<br />
Inter-segment sales ................ 0 6,999 22,007 0 (29,006) 0<br />
2,083,346 1,238,689 62,284 50,942 (29,006) 3,406,255<br />
Result<br />
Segment result .................... 414,783 203,895 9,488 (52,083) 0 576,083<br />
Unallocated expenses ............... (129,815)<br />
Operating profit .................. 446,268<br />
Net financial items ................. (134,300)<br />
Share of profit of associates .......... 1,360<br />
Profit before income tax ........... 313,328<br />
Income tax ....................... (305)<br />
Net profit ........................ 313,023<br />
Assets and liabilities<br />
Segment assets .................... 3,151,563 3,083,467 18,233 319,283 (8,774) 6,563,772<br />
Unallocated assets ................. 344,153<br />
6,907,925<br />
Segment liabilities ................. 265,323 143,163 18,876 10,525 (8,774) 429,113<br />
Unallocated liabilities .............. 4,296,435<br />
4,725,548<br />
Other segment information<br />
Capital expenditures:<br />
—segment’s property, plant and<br />
equipment (“PP&E”) ............. 218,490 2,146,280 4,141 9,306 0 2,378,217<br />
—unallocated PP&E ............... 16,247<br />
—segment’s intangible assets (“IA”) . . 620 437 0 109 0 1,166<br />
—unallocated IA .................. 2,036<br />
Depreciation ...................... 131,102 90,198 433 13,565 0 235,298<br />
Unallocated depreciation ............ 9,681<br />
Amortization ..................... 20,622 7,929 0 3 0 28,554<br />
Unallocated amortization ............ 227<br />
As of August 31, 2005 unallocated liabilities include the loans for financing the ships operating between<br />
Estonia and Finland in the amount of EEK 1,636,978,000 (2004: EEK 2,002,310,000) and for financing the ships<br />
operating between Estonia and Sweden in the amount of EEK 1,677,645,000 (2004: EEK 1,979,972,000).<br />
Corresponding interest expenses amounted to EEK 68,714,000 and EEK 74,655,000 (2004: EEK 67,987,000 and<br />
EEK 49,073,000).<br />
Net sales by geographical segments—customers’ location<br />
As it is not possible to record revenue by customer group (especially regarding onboard sales) this<br />
information has not been disclosed in the notes to the financial statements.<br />
F-15
FINANCIAL STATEMENTS FOR THE FINANCIAL YEAR ENDED AUGUST 31, 2005<br />
NOTES TO THE FINANCIAL STATEMENTS—(Continued)<br />
Note 3 SEGMENT INFORMATION (Continued)<br />
Information by operational segments<br />
for the year ended August 31<br />
2005 2004<br />
Ticket sales ............................................................. 1,018,683 879,684<br />
Revenue from packages ................................................... 163,175 169,197<br />
Salesofcargotransport.................................................... 721,690 609,383<br />
Accommodation sales1 .................................................... 86,876 31,546<br />
Restaurant and shops sales onboard and on mainland ............................ 1,912,232 1,664,566<br />
Income from leases of vessels ............................................... 95,416 0<br />
Other .................................................................. 64,889 51,879<br />
Total revenue of the Group ............................................... 4,062,961 3,406,255<br />
1 includes also accommodation in the hotel operated by the Group, but which is a part of package sold together with ship tickets. The<br />
accommodations in hotels operated by third parties, which is a part of package sales have been presented in the line “revenue from<br />
packages”.<br />
Most of the Group’s assets (including property, plant and equipment) are related to sea transportation. As it<br />
is not practicable to divide the assets related to sea transportation by the different operational segments of sea<br />
transportation, then the information about assets and purchases of property, plant and equipment by operational<br />
segments has not been disclosed in the notes to the financial statements.<br />
Note 4 INCOME AND EXPENSES<br />
for the year ended August 31<br />
The Group The Parent<br />
Cost of sales<br />
2005 2004 2005 2004<br />
Cost of goods ..................................... (878,311) (746,858) (593,996) (526,086)<br />
Port charges ...................................... (530,175) (494,274) (335,883) (303,996)<br />
Bunker cost ...................................... (401,593) (274,429) (234,199) (145,649)<br />
Charter hire (operating leases of ships) ................. 0 0 (92,739) (100,150)<br />
Staffcosts........................................ (413,369) (368,293) (243,669) (277,085)<br />
Depreciation and amortization ........................ (260,281) (236,540) (694,674) (441,425)<br />
Spare parts and maintenance expenses ................. (146,618) (89,635) (126,053) (74,423)<br />
Cost of package sales, excluding ship tickets ............ (134,862) (104,284) (7,563) (3,148)<br />
Othercosts ....................................... (214,297) (164,432) (97,513) (99,406)<br />
Total cost of sales ................................. (2,979,506) (2,478,745) (2,426,289) (1,971,368)<br />
The Group The Parent<br />
Marketing expenses 2005 2004 2005 2004<br />
Advertising expenses ............................... (97,104) (122,121) (13,016) (20,394)<br />
Agency fees paid to subsidiaries ...................... 0 0 (138,908) (118,257)<br />
Staffcosts........................................ (152,469) (131,135) (24,968) (19,225)<br />
Depreciation and amortization ........................ (5,267) (4,622) (679) (226)<br />
Othercosts ....................................... (81,363) (93,549) (13,766) (12,894)<br />
Total marketing expenses .......................... (336,203) (351,427) (191,337) (170,996)<br />
The Group The Parent<br />
Administrative expenses 2005 2004 2005 2004<br />
Staffcosts........................................ (44,029) (44,594) (30,530) (34,236)<br />
Depreciation and amortization ........................ (6,330) (32,598) (2,130) (1,205)<br />
Othercosts ....................................... (69,585) (51,091) (50,936) (35,824)<br />
Total administrative expenses ....................... (119,944) (128,283) (83,596) (71,265)<br />
F-16
FINANCIAL STATEMENTS FOR THE FINANCIAL YEAR ENDED AUGUST 31, 2005<br />
NOTES TO THE FINANCIAL STATEMENTS—(Continued)<br />
Note 4 INCOME AND EXPENSES (Continued)<br />
Specification of staff costs included in cost of sales, marketing expenses and administrative expenses:<br />
The Group The Parent<br />
2005 2004 2005 2004<br />
Wages and salaries ....................................... (447,845) (399,015) (40,690) (46,013)<br />
Social security costs ...................................... (147,521) (128,648) (14,244) (16,279)<br />
Costoftrainingofstaff ................................... (4,969) (4,042) (1,676) (692)<br />
Otherstaffcosts ......................................... (9,532) (12,317) (242,557) (267,562)<br />
Total staff costs ......................................... (609,867) (544,022) (299,167) (330,546)<br />
The other staff costs of the Parent include personnel services purchased from its subsidiaries.<br />
Finance income and finance expenses<br />
The Group The Parent<br />
2005 2004 2005 2004<br />
Financial income<br />
Net foreign exchange gains ................................ 454 0 0 0<br />
Other interest and financial income .......................... 2,963 9,475 8,935 29,239<br />
3,417 9,475 8,935 29,239<br />
Financial expenses<br />
Net foreign exchange losses ............................... 0 (2,528) (693) (2,283)<br />
Interest expenses ........................................ (161,983) (141,108) (160,665) (160,212)<br />
Other financial expenses .................................. (140) (139) (2) (1)<br />
(162,123) (143,775) (161,360) (162,496)<br />
Total net financial items ................................. (158,706) (134,300) (152,425) (133,257)<br />
Note 5 TAXES<br />
Income tax<br />
Major components of the Group’s income tax expense for the years ended 31 August are:<br />
2005 2004<br />
Income tax on profit of Swedish subsidiary ....................................... (365) (296)<br />
Income tax on profit of Russian subsidiary ........................................ 9 (9)<br />
Total income tax expense .................................................... (356) (305)<br />
According to Russian, Finnish and Swedish law it is permissible for accounting and taxation purposes to<br />
charge the profit and loss account with depreciation in excess of plan and thereby accomplish a postponement of<br />
tax payments. These postponements are shown as deferred tax liability. The Finnish subsidiary also has carryforwards<br />
of tax losses, which are considered in calculation of the deferred tax assets.<br />
As of August 31, 2005 and 2004 the Swedish subsidiary <strong>Tallink</strong> Sverige AB has a deferred tax liability, the<br />
Finnish subsidiary <strong>Tallink</strong> Finland OY has an unrecorded deferred tax asset (it is not probable that future taxable<br />
profit will be available against which the unused tax losses can be utilized) and the Russian subsidiary <strong>Tallink</strong>-<br />
Ru OOO does not have a significant deferred tax liability or asset.<br />
August 31, 2005 August 31, 2004<br />
Deferred tax liability (non-current liability) .............................. 329 275<br />
Unrecorded deferred tax asset (related to Finnish subsidiary) ................ 2,430 2,313<br />
F-17
FINANCIAL STATEMENTS FOR THE FINANCIAL YEAR ENDED AUGUST 31, 2005<br />
Note 5 TAXES (Continued)<br />
NOTES TO THE FINANCIAL STATEMENTS—(Continued)<br />
Tax balances<br />
As of August 31 tax assets and liabilities recorded as current assets and liabilities are broken down as<br />
follows:<br />
The Group The Parent<br />
2005 2004 2005 2004<br />
Tax assets<br />
VAT......................................................... 4,360 5,179 24 4,099<br />
Income tax .................................................... 125 319 0 0<br />
Other taxes .................................................... 27 14 27 0<br />
4,512 5,512 51 4,099<br />
Tax liabilities<br />
Salary related taxes ............................................. 37,244 39,038 3,797 3,401<br />
Exciseduties .................................................. 5,724 2,496 0 0<br />
VAT......................................................... 27,828 29,203 18,997 17,626<br />
Other taxes .................................................... 9 42 0 21<br />
Note 6 EARNINGS PER SHARE<br />
for the year ended August 31<br />
70,805 70,779 22,794 21,048<br />
Basic earnings per share are calculated by dividing the net profit for the year attributable to ordinary<br />
shareholders by the weighted average number of ordinary shares outstanding during the year. As the Group does<br />
not have any potential ordinary shares, then the diluted earnings per share are equal to basic earnings per share.<br />
2005<br />
2004<br />
adjusted<br />
2004<br />
reported before<br />
Weighted average number of ordinary shares (thousands pcs) ............ 110,000 109,050 27,262<br />
Net profit attributable to ordinary shareholders ........................ 473,171 313,023 313,023<br />
Earningspershare(inEEKpershare)............................... 4.30 2.87 11.5<br />
On September 18, 2003 <strong>Tallink</strong> <strong>Grupp</strong> issued 5,100,000 new shares for cash. The total number of ordinary<br />
shares after this share issue amounted to 27,500,000. The calculation of weighted average number of ordinary<br />
shares for the year ended August 31, 2004 was as follows:<br />
• period from September 1 to September 17 (17 days): 22,400,000 shares;<br />
• period from September 18 to August 31 (348 days): 27,500,000 shares.<br />
On February 5, 2005, the share capital was increased from 27,500,000 to 110,000,000 shares. Since the<br />
second increase of share capital was a bonus issue, the average number of ordinary shares for comparative period<br />
has been adjusted (multiplied by four) and 110,000,000 has been used as the number for the average number of<br />
ordinary shares for the calculation of earning per share for the current period.<br />
For additional information on issues of shares see also Note 17.<br />
Note 7 CASH AND CASH EQUIVALENTS<br />
as of August 31<br />
The Group The Parent<br />
2005 2004 2005 2004<br />
Cash at bank and in hand ..................................... 82,048226,135 31,903 162,616<br />
Short-term deposits ......................................... 244,738 140,533 116,437 8,604<br />
Total cash and cash equivalents .............................. 326,786 366,668 148,340 171,220<br />
F-18
FINANCIAL STATEMENTS FOR THE FINANCIAL YEAR ENDED AUGUST 31, 2005<br />
NOTES TO THE FINANCIAL STATEMENTS—(Continued)<br />
Note 7 CASH AND CASH EQUIVALENTS (Continued)<br />
Cash at bank and in hand earns interest at floating rates based on the daily bank deposit rates (rates in<br />
2004/2005 were in the range of 0.25-2.37% and in 2003/2004 in the range of 0.25-2.95%).<br />
Short-term deposits are made for periods that can range from over-night to three months depending on bank<br />
loan repayments. As of August 31, 2005 short-term deposits in a total amount of EEK 128,301,000 (2004: EEK<br />
131,929,000) can be used for bank loan repayments only.<br />
For purposes of the Cash Flow Statement, the amount of cash and cash equivalents is equal to the amount of<br />
cash and cash equivalents recorded in the Balance Sheet.<br />
Note 8 RECEIVABLES AND PREPAYMENTS<br />
as of August 31<br />
The Group The Parent<br />
2005 2004 2005 2004<br />
Trade receivables ........................................... 117,510 141,535 55,636 52,896<br />
Allowance for trade receivables ............................... (3,337) (1,911) (394) (340)<br />
Receivables from subsidiaries ................................. 0 0 344,625 260,500<br />
Allowance for receivables from subsidiaries ..................... 0 0 (77) (48,481)<br />
Receivables from associates (Note 20) .......................... 0 1,846 0 1,538<br />
Other receivables ........................................... 34,275 37,921 24,231 28,053<br />
Accrued interest income ..................................... 413 413 0 0<br />
Prepaid expenses ........................................... 49,167 39,337 14,898 18,675<br />
Total receivables and prepayments ........................... 198,028 219,141 438,919 312,841<br />
During the reporting period EEK 15,514,000 was expensed as doubtful and uncollectible trade receivables<br />
(2004: EEK 4,808,000).<br />
As of August 31, 2005 the amounts owned by subsidiaries consist of EEK 168,888,000 (2004:<br />
EEK 89,893,000) of prepayments for services, EEK 10,108,000 (2004: EEK 20,586,000) of receivables for<br />
services, EEK 158,685,000 (2004: EEK 147,821,000) of loans (see Note 12) and EEK 6,944,000 (2004: EEK<br />
2,200,000) of interests receivable.<br />
As of August 31, 2005 and 2004 the balance of Other receivables of the Group includes the sold goods’<br />
commission receivable for the last eight (2004: five) months in the amount of EEK 18,502,000 and<br />
EEK 17,224,000, respectively, (for the Parent: EEK 10,989,000 and EEK 10,761,000) and the receivable from<br />
the Port of Tallinn for a landing-stage organized by the Parent in the amount of EEK 7,972,000 and EEK<br />
15,636,000, respectively.<br />
The balance of prepaid expenses of the Group and the Parent predominantly includes prepayments for<br />
insurance and fairway dues.<br />
Note 9 INVENTORIES<br />
as of August 31<br />
The Group The Parent<br />
2005 2004 2005 2004<br />
Raw materials (primarily fuel) .................................... 14,13513,1186,3846,191 Goods for sale ................................................. 70,57570,99633,55032,689 Prepayments for inventories ...................................... 190 439 169 407<br />
Total inventories .............................................. 84,900 84,553 40,103 39,287<br />
F-19
FINANCIAL STATEMENTS FOR THE FINANCIAL YEAR ENDED AUGUST 31, 2005<br />
NOTES TO THE FINANCIAL STATEMENTS—(Continued)<br />
Note 10 INVESTMENTS IN SUBSIDIARIES<br />
as of August 31<br />
Country of<br />
Acquisition cost Equity<br />
Name of subsidiary<br />
incorporation<br />
3<br />
2005 2004 2005 2004<br />
Hansaliin OÜ .................................. Estonia 40 40 91 88<br />
Hansatee Kinnisvara OÜ ......................... Estonia 400 400 3,811 2,270<br />
<strong>Tallink</strong> Duty Free AS ............................ Estonia 400 400 5,707 3,155<br />
HT Laevateenindus OÜ .......................... Estonia 400 400 4,122 2,545<br />
HT Meelelahutus OÜ ............................ Estonia 400 400 4,662 4,585<br />
<strong>Tallink</strong> AS .................................... Estonia 96,401 400 377 (50,728)<br />
Hansatee Cargo AS .............................. Estonia204,401 400 61,088 1,637<br />
TLGHotellOÜ................................. Estonia 40 40 50,908 9,147<br />
<strong>Tallink</strong> Travel Club OÜ .......................... Estonia 800 800 560 766<br />
V.S&IAS ..................................... Estonia 400 0 399 0<br />
TLG Meedia OÜ ................................ Estonia 210 0 912 0<br />
<strong>Tallink</strong> Finland OY .............................. Finland 24,010 24,010 8,870 9,270<br />
Kapella Shipping Ltd ............................ Bahamas 66 66 46,334 40,979<br />
<strong>Tallink</strong> Line Ltd ................................ Cyprus 48,014 48,014 385,813 316,915<br />
Tallinn-HelsinkiLineLtd......................... Cyprus 12,000 12,000 68,247 45,850<br />
Vana Tallinn Line Ltd ........................... Cyprus 46,014 46,014 407,231 345,866<br />
<strong>Tallink</strong> Fast Ltd ................................ Cyprus 26 26 346,495 297,005<br />
<strong>Tallink</strong> Ltd .................................... Cyprus 28 28 375,294 280,929<br />
Tallinn Swedish Line Ltd ......................... Cyprus 27 27 258,028 120,929<br />
Tallinn Stockholm Line Ltd ....................... Cyprus 27 27 167,432 111,006<br />
<strong>Tallink</strong> Victory Line Ltd ......................... Cyprus 27 27 271,169 81,445<br />
Hansalink Ltd .................................. Cyprus 367,636 367,636 165,660 144,087<br />
<strong>Tallink</strong> Autoexpress Ltd .......................... Cyprus 27 27 92,408 22,384<br />
<strong>Tallink</strong> High Speed Ltd .......................... Cyprus 27 27 16,096 (731)<br />
<strong>Tallink</strong> Sea Line Ltd ............................. Cyprus 27 0 (22) 0<br />
<strong>Tallink</strong> Superfast Ltd ............................ Cyprus 27 0 (6) 0<br />
<strong>Tallink</strong>-RuOOO................................ Russia 5 5 (49) 37<br />
801,880 501,214<br />
HT Hulgi Tolliladu OÜ 1 .......................... Estonia 400 400 312 317<br />
TDF Kommerts OÜ 1 ............................. Estonia 40 0 (11) 0<br />
<strong>Tallink</strong> Sverige AB 2 ............................. Sweden 184 184 3,337 2,542<br />
624 584<br />
1 HT Hulgi Tolliladu OÜ and TDF Kommerts OÜ are subsidiaries of <strong>Tallink</strong> Duty Free AS<br />
2 <strong>Tallink</strong> Sverige AB is a subsidiary of Hansatee Cargo AS<br />
3 The Parent wholly owns all its subsidiaries, with the exception of TLG Meedia OÜ, of which the Parent owns 70%.<br />
The following changes have been made to the Parent’s investments in subsidiaries:<br />
Year ended<br />
August 31, 2005<br />
Year ended<br />
August 31, 2004<br />
Investments at the beginning of financial year ............................ 2,072,910 1,574,646<br />
New investments in subsidiaries ....................................... 664 859<br />
Increaseofsharecapitalofsubsidiaries ................................. 300,002 0<br />
Share of profit of subsidiaries accounted for under equity method ............. 779,135 448,951<br />
including change in allowance for receivables from subsidiaries (Note 8) . . . (48,404) 48,454<br />
Investments at the end of year ....................................... 3,104,308 2,072,910<br />
Some of subsidiaries have a negative equity. Due to negative equity of certain subsidiaries the Parent has<br />
considered the receivables from these subsidiaries to be doubtful receivables and has expensed them in the total<br />
amount of EEK 77,000 as of August 31, 2005 (2004: EEK 48,481,000). These allowances and their reversals are<br />
also treated as an equity method gain/loss.<br />
F-20
FINANCIAL STATEMENTS FOR THE FINANCIAL YEAR ENDED AUGUST 31, 2005<br />
NOTES TO THE FINANCIAL STATEMENTS—(Continued)<br />
Note 10 INVESTMENTS IN SUBSIDIARIES (Continued)<br />
During the reporting period, the Group established five new subsidiaries (four with 100% ownership and one<br />
with 70% ownership). The payments into the share capital of these subsidiaries in the total amount of EEK 794,000<br />
including EEK 90,000 paid in by minority interests and EEK 40,000 paid in by a subsidiary of the Parent were made<br />
in cash.<br />
In August 2005 the Parent increased the share capital of Hansatee Cargo AS and <strong>Tallink</strong> AS both by<br />
EEK 1,000 and share premiums of EEK 204,000,000 and EEK 96,000,000, respectively. The investments into<br />
share capital of the subsidiaries were made in cash.<br />
During the previous reporting period the Group established three new subsidiaries (all with 100% ownership).<br />
The payments into the share capital of the subsidiaries in the total amount of EEK 59,000 were made in cash.<br />
Additionally, in December 2003 the Group acquired 100% of the shares of Downtown Travel Club OÜ (renamed to<br />
<strong>Tallink</strong> Travel Club OÜ) from Infortar AS (the parent company of the Group) for EEK 800,000, EEK 754,000 of<br />
the purchase price was offset between the Parent, Infortar and Downtown Travel Club OÜ and the remaining<br />
(EEK 46,000) was paid in cash. The new subsidiary operates as a travel agent company.<br />
The fair value of the identifiable assets and liabilities of <strong>Tallink</strong> Travel Club OÜ at the date of acquisition<br />
are as follows:<br />
Current receivables ...................................................................... 754<br />
Equipments ............................................................................ 13<br />
Payables to the Parent .................................................................... (14)<br />
Other current payables ................................................................... (2)<br />
Fair value of net assets .................................................................. 751<br />
Goodwill 1 ............................................................................. 49<br />
Consideration .......................................................................... 800<br />
1 Goodwill arising from the purchase of the new subsidiary was immediately expensed as an immaterial item.<br />
Assets and liabilities of <strong>Tallink</strong> Travel Club OÜ as of August 31, 2004 and its income and expenses for the<br />
period of January 2004 to August 2004 do neither affect the financial position of the Group at the reporting date<br />
nor the results of the Group for the reporting period significantly.<br />
Note 11 INVESTMENTS IN ASSOCIATES<br />
The Group had one associate HT Valuuta AS with 25% ownership and EEK 100,000 of acquisition cost<br />
during 2004/2005. HT Valuuta has been registered in Estonia. On August 30, 2005 HT Valuuta was sold to<br />
Infortar AS. The receivable from the sale of the shares of HT Valuuta was settled in September 2005. The<br />
following changes have been made in the Group’s investments into associates:<br />
Year ended<br />
August 31, 2005<br />
Year ended<br />
August 31, 2004<br />
Investments at the beginning of financial year ............................ 2,557 1,997<br />
Dividends received ................................................. (1,200) (800)<br />
Share of profit of associates accounted for under equity method .............. 645 1,360<br />
Salespriceofshares................................................. (5,000) 0<br />
Gainfromsaleofshares ............................................. 2,998 0<br />
Investments at the end of year ....................................... 0 2,557<br />
Note 12 OTHER FINANCIAL ASSETS AND PREPAYMENTS<br />
as of August 31<br />
The Group The Parent<br />
2005 2004 2005 2004<br />
Receivables from subsidiaries ................................. 0 0 467,997 617,627<br />
Other receivables and prepaid expenses ......................... 72 2,113 266,357 2,041<br />
Total other financial assets and prepayments ................... 72 2,113 734,354 619,668<br />
F-21
FINANCIAL STATEMENTS FOR THE FINANCIAL YEAR ENDED AUGUST 31, 2005<br />
NOTES TO THE FINANCIAL STATEMENTS—(Continued)<br />
Note 12 OTHER FINANCIAL ASSETS AND PREPAYMENTS (Continued)<br />
As of August 31, 2005 the receivables from subsidiaries consists of the following loans granted to<br />
subsidiaries:<br />
(1) to <strong>Tallink</strong> Ltd in the amount of EEK 120,997,000 (2004: EEK 120,997,000) with 2014 as the maturity<br />
date and interest rate of 6%;<br />
(2) to Victory Line Ltd in the amount of EEK 347,000,000 (2004: EEK 496,630,000) with a non-agreed<br />
maturity date and an interest rate of 0%. In the opinion of the Parent’s management there is not a<br />
material impact on the financial statements from not using the effective interest rate, as<br />
Victory Line Ltd is a fully-owned subsidiary of the Parent. Therefore, the specified loan carrying<br />
amount has not been adjusted with the effective interest rate in either company’s financial statements.<br />
The split between current and non-current assets has been made based on the estimate of the Parent’s<br />
management of the actual payments in the next financial year.<br />
The short-term portion of the loans specified above in the total amount of EEK 158,685,000 (2004:<br />
EEK 147,821,000) has been recorded under current receivables (see Note 8).<br />
As of August 31,2005 and 2004 other receivables and prepaid expenses of the Group included long-term<br />
prepayment (term-less).<br />
As of August 31,2005 the balance of other receivables and prepaid expenses of the Parent includes the<br />
additional prepayments made for the new ships of <strong>Tallink</strong> Sea Line Ltd and <strong>Tallink</strong> Hansaway Ltd (subsidiaries).<br />
The specified prepayments have been recorded as a prepayment for property, plant and equipment in the balance<br />
sheet of the Group—see also Note 13.<br />
Note 13 PROPERTY, PLANT AND EQUIPMENT<br />
for the year ended August 31<br />
Land and<br />
Plant and<br />
Construction in<br />
progress &<br />
The Group<br />
buildings Ships equipment prepayments Total<br />
Book value as of August 31, 2003 ........... 8,291 3,523,802 24,246 345,745 3,902,084<br />
Additions ............................... 4,333 2,626,260 27,268 (263,397) 1 2,394,464<br />
Disposals ............................... 0 0 (631) 0 (631)<br />
Depreciation for the year ................... (1,246) (230,040) (13,693) 0 (244,979)<br />
Book value as of August 31, 2004 ........... 11,378 5,920,022 37,190 82,348 6,050,938<br />
Additions ............................... 1,667 149,244 12,954 193,404 1 357,269<br />
Disposals ............................... 0 0 (975) 0 (975)<br />
Depreciation for the year ................... (1,458) (251,184) (17,870) 0 (270,512)<br />
Book value as of August 31, 2005 ........... 11,587 5,818,082 31,299 275,752 6,136,720<br />
As of August 31, 2004<br />
—cost .................................. 17,516 6,801,988 91,558 82,348 6,993,410<br />
—accumulated depreciation ................<br />
As of August 31, 2005<br />
(6,138) (881,966) (54,368) 0 (942,472)<br />
—cost .................................. 19,183 6,933,884 95,764 275,752 7,324,583<br />
—accumulated depreciation ................ (7,596) (1,115,802) (64,465) 0 (1,187,863)<br />
1 The amount of additions of construction in process and prepayments includes also transfers from construction in process and<br />
prepayments to ships in the total amount of EEK 345,745,000 and EEK 82,128,000 in the financial year ended August 31, 2005 and<br />
2004, respectively.<br />
For more information about the leased assets see also Note 15.<br />
During the financial year the Group has capitalised borrowing costs as a part of the ship cost in the amount<br />
of EEK 0 (2004: EEK 672,000)—100% of borrowing expenses related to the loans received to finance the<br />
building of ships.<br />
F-22
FINANCIAL STATEMENTS FOR THE FINANCIAL YEAR ENDED AUGUST 31, 2005<br />
NOTES TO THE FINANCIAL STATEMENTS—(Continued)<br />
Note 13 PROPERTY, PLANT AND EQUIPMENT (Continued)<br />
As of August 31, 2005 the Group’s ships with book value of EEK 5,808,722,000 (2004: EEK<br />
5,991,839,000) and market value of EEK 6,563,749,000 (2004: EEK 6,626,352,000) are subject to a first or<br />
second mortgage to secure the Group’s bank loans (see also Note 15). Market value of pledged ships is an<br />
average of values quoted by two shipbrokers as of August 31, 2005 and August 31, 2004.<br />
In the current financial year the Group has changed its estimates of the useful lives of the components of<br />
two new cruise ships. The new estimate is based on the experiences received from the first year of operations<br />
with totally new cruise ships. In the opinion of the management of the Group, these new useful lives are effective<br />
as of the beginning of the current financial year. In the interim reports for the 3-, 6- and 9-month periods ended<br />
on November 30, 2004, February 28, 2005 and May 31, 2005, respectively, the previous estimates of useful lives<br />
were used for calculating and recording depreciation charge. The total annual effect of the change amounts to<br />
EEK 26,051,000 (including the effect of correction of error made in the prior interim financial statements in the<br />
amount of EEK 19,538,000).<br />
Land and<br />
Plant and Other<br />
The Parent<br />
buildings Ships machinery equipment Total<br />
Book value as of August 31, 2003 .............. 2,883 2,832,210 10,073 2,405 2,847,571<br />
Additions .................................. 4,234 235,995 1,108 9,991 251,328<br />
Depreciation for the year ...................... (284) (436,285) (4,074) (1,966) (442,609)<br />
Book value as of August 31, 2004 .............. 6,833 2,631,920 7,107 10,430 2,656,290<br />
Additions .................................. 0 351,896 353 4,236 356,485<br />
Depreciation for the year ...................... (415) (688,064) (4,359) (3,820) (696,658)<br />
Book value as of August 31, 2005 .............. 6,418 2,295,752 3,101 10,846 2,316,118<br />
As of August 31, 2004<br />
—cost ..................................... 7,868 4,067,236 29,048 16,443 4,120,595<br />
—accumulated depreciation ....................<br />
As of August 31, 2005<br />
(1,035) (1,435,316) (21,941) (6,013) (1,464,305)<br />
—cost ..................................... 7,868 4,409,800 29,247 20,060 4,466,975<br />
—accumulated depreciation .................... (1,450) (2,114,048) (26,146) (9,214) (2,150,858)<br />
The Parent has only leased ships from its subsidiaries. For more information about the leased assets see also<br />
Note 15.<br />
Note 14 INTANGIBLE ASSETS<br />
for the year ended August 31,<br />
The Group Goodwill1 Patents and<br />
licenses2 Development<br />
costs Total<br />
Book value as of August 31, 2003 ........................ 194,056 587 7,379 202,022<br />
Additions............................................. 0 3,202 0 3,202<br />
Amortization for the year ................................ (20,908) (811) (7,062) (28,781)<br />
Book value as of August 31, 2004 ........................ 173,148 2,978 317 176,443<br />
Additions............................................. 0 1,076 0 1,076<br />
Amortization for the year ................................ 0 (1,049) (317) (1,366)<br />
Book value as of August 31, 2005 ........................ 173,148 3,005 0 176,153<br />
1 Goodwill is entirely related to the segment of Estonia—Finland routes. For the impairment test the value in use is used for determining<br />
the recoverable amount. Management has calculated the value in use based on the discounted 5-years cash flow projections using the<br />
average gross margins achieved in the current year, the growth rate in revenue of 1-2% per annum and the discount rate of 12% (the<br />
group’s weighted average cost of capital).<br />
2 The useful life of patents and licenses is finite with a maximum of five years.<br />
F-23
FINANCIAL STATEMENTS FOR THE FINANCIAL YEAR ENDED AUGUST 31, 2005<br />
NOTES TO THE FINANCIAL STATEMENTS—(Continued)<br />
Note 14 INTANGIBLE ASSETS (Continued)<br />
Goodwill<br />
Patents and<br />
licenses<br />
Development<br />
costs Total<br />
As of August 31, 2004<br />
—cost ............................................... 203,706 5,314 7,379 216,399<br />
—accumulated amortization ..............................<br />
As of August 31, 2005<br />
(30,558) (2,336) (7,062) (39,956)<br />
—cost ............................................... 173,148 6,390 0 179,538<br />
—accumulated amortization .............................. 0 (3,385) 0 (3,385)<br />
The Parent—patents and licenses<br />
Year ended<br />
31 August 2005<br />
Year ended<br />
31 August 2004<br />
Book value at the beginning of period .................................. 2,517 0<br />
Additions .......................................................... 0 2,768<br />
Amortization for the year ............................................. (825) (251)<br />
Book value at the end of period, incl.: .................................. 1,692 2,517<br />
—costs............................................................ 2,768 2,768<br />
—accumulated amortization ........................................... (1,076) (251)<br />
Note 15 INTEREST BEARING LOANS AND BORROWINGS<br />
as of August 31<br />
The Group<br />
2005 Maturity<br />
Current<br />
portion<br />
Non-current<br />
portion<br />
Total<br />
borrowings<br />
Obligation under finance lease .......................... 2008 981 935 1,916<br />
Bank overdraft ....................................... 2007 18,249 0 18,249<br />
Long-term bank loans ................................. 2005-2014 538,848 2,985,488 3,524,336<br />
Other long-term loans ................................. 2007 73,648 24,882 98,530<br />
Bonds .............................................. 2006 58,747 134,559 193,306<br />
Total borrowings .................................... 690,473 3,145,864 3,836,337<br />
2004 Maturity<br />
Current<br />
portion<br />
Non-current<br />
portion<br />
Total<br />
borrowings<br />
Obligation under finance lease .......................... 2008 380 1,397 1,777<br />
Long-term bank loans ................................. 2004-2014 602,261 3,432,214 4,034,475<br />
Other long-term loans ................................. 2007 48,766 49,764 98,530<br />
Bonds .............................................. 2004 99,310 0 99,310<br />
Total borrowings .................................... 750,717 3,483,375 4,234,092<br />
The Parent<br />
2005 Maturity<br />
Current<br />
portion<br />
Non-current<br />
portion<br />
Total<br />
borrowings<br />
Obligation under finance lease .......................... 2005-2014 456,680 1,973,205 2,429,885<br />
Bank overdraft ....................................... 2007 18,249 0 18,249<br />
Long-term bank loans ................................. 2005-2009 134,697 173,546 308,243<br />
Bonds .............................................. 2006 58,747 134,559 193,306<br />
Total borrowings .................................... 668,373 2,281,309 2,949,682<br />
F-24
FINANCIAL STATEMENTS FOR THE FINANCIAL YEAR ENDED AUGUST 31, 2005<br />
NOTES TO THE FINANCIAL STATEMENTS—(Continued)<br />
Note 15 INTEREST BEARING LOANS AND BORROWINGS (Continued)<br />
2004 Maturity<br />
Current<br />
portion<br />
Non-current<br />
portion<br />
Total<br />
borrowings<br />
Obligation under finance lease .......................... 2005-2014 448,991 2,173,694 2,622,685<br />
Long-term bank loans ................................. 2006-2008 69,424 81,299 150,723<br />
Bonds .............................................. 2004 99,310 0 99,310<br />
Total borrowings .................................... 617,725 2,254,993 2,872,718<br />
As of August 31, 2005 the Group is allowed to use bank overdrafts up to an amount of EEK 200,000,000<br />
(including EEK 150,000,000 granted to the Parent) and EUR 7,000,000 (2004: EEK 200,000,000, EEK<br />
150,000,000 and EUR 1,009,000, respectively). Bank overdrafts are secured with commercial pledges in the total<br />
amount of EEK 183,250,000 (2004: EEK 151,250,000) and ship mortgages (see Note 13). In the year ended<br />
August 31, 2005 the average effective interest rate of the bank overdrafts is EURIBOR+1.85% (2004: +2.17%)<br />
for overdrafts from Estonian commercial banks and EURIBOR+1.25% (2004: +1.25%) from the Finnish<br />
commercial bank. As of August 31, 2005 the balance of overdraft in use amounted to EEK 18,249,000. As of<br />
August 31 2004 there were no outstanding overdraft balances.<br />
In the year ended August 31, 2005 the weighted average interest rate of bank loans of the Group and the<br />
Parent were EURIBOR+1.38% and EURIBOR+1.14% (2004: +1.44% and +1.34%).<br />
Interest rate of other loans, which is a loan from the parent company of the Group—Infortar, is a fixed<br />
interest rate of 7%.<br />
Bonds with the book value of EEK 193,306,000 as of August 31, 2005 (2004: EEK 99,310,000) are zerocoupon<br />
bonds. The total nominal value of these bonds is EEK 200,000,000 (2004: EEK 100,000,000). The<br />
difference between the nominal value and the received amount is expensed during the loan period which means<br />
that the average effective interest rate is approximately 3.4% (2004: 3.0%).<br />
Lease liability of the Group as of August 31, 2005 is related to the office equipment in Sweden. Lease<br />
liability of the Parent is related to the ship leases from its subsidiaries. The future minimum lease payments under<br />
finance lease and the present value (PV) of the net minimum lease payments have been presented below.<br />
The Group<br />
For additional information about the currency structure of the borrowings see Note 21.<br />
August 31, 2005 August 31, 2004<br />
Minimum<br />
lease<br />
payments<br />
PV of lease<br />
payments<br />
Minimum<br />
lease<br />
payments<br />
PV of lease<br />
payments<br />
Within one year ......................................... 1,040 981 406 380<br />
After 1 year, but not more than 5 years ....................... 1,051 935 1,492 1,397<br />
Total minimum lease payments ........................... 2,091 1,898<br />
Future financial charges ................................... (175) (121)<br />
PV of minimum lease payments ........................... 1,916 1,916 1,777 1,777<br />
The Parent<br />
August 31, 2005 August 31, 2004<br />
Minimum<br />
lease<br />
payments<br />
PV of lease<br />
payments<br />
Minimum<br />
lease<br />
payments<br />
PV of lease<br />
payments<br />
Within one year ...................................... 573,075 456,680 569,870 448,991<br />
After 1 year, but not more than 5 years .................... 1,383,961 1,108,188 1,392,513 1,069,585<br />
More than 5 years .................................... 949,125 865,017 1,237,805 1,104,109<br />
Total minimum lease payments ........................ 2,906,161 3,200,188<br />
Future financial charges ............................... (476,276) (577,503)<br />
PV of minimum lease payments ........................ 2,429,885 2,429,885 2,622,685 2,622,685<br />
F-25
FINANCIAL STATEMENTS FOR THE FINANCIAL YEAR ENDED AUGUST 31, 2005<br />
NOTES TO THE FINANCIAL STATEMENTS—(Continued)<br />
Note 15 INTEREST BEARING LOANS AND BORROWINGS (Continued)<br />
Movements in assets purchased under finance lease terms are as follows for the year ended August 31:<br />
The Group The Parent<br />
2005 2004 2005 2004<br />
Book value at the beginning of the year ...................... 1,678 1,909 2,628,276 2,815,303<br />
Additions ............................................... 1,107 451 351,896 233,794<br />
Depreciation for the year ................................... (955) (682) (685,439) (420,821)<br />
Book value at the end of the year, incl. ...................... 1,830 1,678 2,294,734 2,628,276<br />
—cost .................................................. 4,078 3,024 4,406,349 4,054,452<br />
—accumulated depreciation ................................ (2,248) (1,346) (2,111,615) (1,426,176)<br />
Note 16 PAYABLES AND DEFERRED INCOME<br />
as of August 31<br />
The Group The Parent<br />
Current payables<br />
2005 2004 2005 2004<br />
Trade payables ........................................... 229,729 280,431 115,674 163,736<br />
Payables to subsidiaries .................................... 0 0 972,032 579,063<br />
Payables to associates (Note 20) ............................. 0 147 0 147<br />
Other payables ........................................... 2,955 2,865 919 843<br />
Payables to employees ..................................... 54,857 53,848 8,170 7,210<br />
Interests payable .......................................... 41,542 50,228 596 726<br />
Other accruals ............................................ 2,978 7,298 16 0<br />
Deferred income .......................................... 31,817 25,585 8,013 3,080<br />
Total current payables and deferred income .................. 363,878 420,402 1,105,420 754,805<br />
As of August 31, 2005 other non-current payables of the Parent include a loan in the amount of<br />
EEK 50,441,000 (2004: EEK 50,441,000) granted by its subsidiary—Vana Tallinn Line Ltd. The loan has an<br />
interest rate of 0% and a maturity date of 2010. In the opinion of the Parent’s management there is not a material<br />
impact on the financial statements from not using the effective interest rate, as Vana Tallinn Line Ltd is a<br />
fully-owned subsidiary of the Parent. Therefore, the specified loan carrying amount has not been adjusted with<br />
the effective interest rate in both companies’ financial statements.<br />
Note 17 SHARE CAPITAL<br />
As of August 31<br />
2005 2004<br />
Ordinary shares of EEK 10 each (thousand pcs.) .................................. 110,000 27,500<br />
The number of shares issued and fully paid (thousand pcs.) ......................... 110,000 27,500<br />
Share capital .............................................................. 1,100,000 275,000<br />
Share premium per share in EEK .............................................. 0 15.09<br />
Totalsharepremium........................................................ 0 414,870<br />
According to the Parent’s Articles of Association effective as of August 31, 2005 the maximum number of<br />
authorized common shares is 160,000,000 (2004: 89,600,000).<br />
At AS <strong>Tallink</strong> <strong>Grupp</strong> Shareholders’ Extraordinary General Meeting on September 15, 2003 AS <strong>Tallink</strong><br />
<strong>Grupp</strong> increased the share capital from EEK 224,000,000 to EEK 275,000,000 by issuing 5,100,000 new shares<br />
with a par value of EEK 10 each. The new shares were issued at a premium of EEK 72.14 per share. The<br />
payment for the new shares was made on 18 September 2003. The share premium has been reduced by the<br />
expenses related to the issue of shares in the total amount of EEK 22,267,000.<br />
F-26
FINANCIAL STATEMENTS FOR THE FINANCIAL YEAR ENDED AUGUST 31, 2005<br />
Note 17 SHARE CAPITAL (Continued)<br />
NOTES TO THE FINANCIAL STATEMENTS—(Continued)<br />
At AS <strong>Tallink</strong> <strong>Grupp</strong> Shareholders’ General Meeting on February 5, 2005 AS <strong>Tallink</strong> <strong>Grupp</strong> increased the share<br />
capital from EEK 275,000,000 to EEK 1,100,000,000 by issuing 82,500,000 new shares with a par value of EEK 10<br />
each. This increase was a bonus issue, i.e. new shares were issued on account of share premium in the amount of<br />
EEK 414,870,000 and retained earnings in the amount of EEK 410,130,000. Therefore, the Parent’s shareholders<br />
received three new shares for each share they owned before the issue.<br />
Note 18 NOTE TO CASH FLOW STATEMENT<br />
for the year ended August 31<br />
The Group The Parent<br />
2005 2004 2005 2004<br />
Depreciation and amortization ............................... 271,878 273,760 697,483 442,856<br />
Net (gain) / loss on disposals of property, plant and equipment ..... (354) 249 0 18<br />
Net interest expenses ...................................... 159,020 131,633 151,730 130,973<br />
Share of profit of subsidiaries and associates ....................<br />
Net foreign exchange (gain) / loss related to investing and financing<br />
(3,643) (1,360) (782,779) (450,311)<br />
activities .............................................. (44) 17 0 0<br />
Income tax expense ....................................... 356 305 0 0<br />
Total adjustments of profit ................................ 427,213 404,604 66,434 123,536<br />
Non-monetary transactions:<br />
(1) Property, plant and equipment purchased under finance lease terms—see movements in lease assets<br />
disclosed in Note 15;<br />
(2) Bonus issue of shares—see Note 17.<br />
Note 19 CONTINGENCIES AND COMMITMENTS<br />
Legal claim<br />
On 30 June 2005 <strong>Tallink</strong> <strong>Grupp</strong> AS submitted an action complaint to the Tallinn Administrative Court<br />
against Estonian Maritime Administration and the Ministry of Economic Affairs and Communications for<br />
unlawfully levying and receiving payment for icebreaker services and lighthouse dues. A court date has not yet<br />
been scheduled.<br />
Previously the invoices for these disputed icebreaker and lighthouse fees were recorded as expenses and<br />
accounts payable in the total amount of EEK 33,554,000. According to the submitted complaint and considering<br />
the results of similar court cases and the decision of the Ministry of Economic Affairs and Communications to<br />
expense the receivables from the Group, the management of the Group has changed its estimate on the<br />
probability of outflow of resources regarding these fees and reversed the related expense. The effect of the<br />
reversal has been recorded as a reduction of current year (in the fourth quarter, i.e. the effect of the changes in<br />
estimate has not been recorded and disclosed in the prior interim consolidated condensed financial statements of<br />
the Group) port expenses under cost of sales.<br />
Income tax on dividends<br />
The Group’s retained earnings as of August 31, 2005 were EEK 1,528,048,000 (2004: EEK 1,465,007,000).<br />
The maximum possible income tax liability as of August 31, 2005, which would become payable if retained<br />
earnings were fully distributed is EEK 366,732,000 (2004: EEK 351,602,000). Income tax rate effective for<br />
dividends paid out before January 1, 2006 was used for the calculation of the maximum income tax liability and<br />
on the assumption of distributable dividends and related income tax together cannot exceed the amount of<br />
retained earnings as of August 31, 2005 and 2004, respectively.<br />
F-27
FINANCIAL STATEMENTS FOR THE FINANCIAL YEAR ENDED AUGUST 31, 2005<br />
NOTES TO THE FINANCIAL STATEMENTS—(Continued)<br />
Note 19 CONTINGENCIES AND COMMITMENTS (Continued)<br />
Off-balance sheet guarantees<br />
• <strong>Tallink</strong> <strong>Grupp</strong> AS has given a guarantee in the maximum amount of SEK 10,010,000 to SEB Eesti<br />
Ühispank related to its Swedish subsidiary with a due date of October 14, 2005.<br />
• <strong>Tallink</strong> <strong>Grupp</strong> AS has given guarantees to HSH Nordbank AG (formerly Hamburgische Landesbank)<br />
and Skandinaviska Enskilda Banken AB for the loans granted to its ship-owning subsidiaries amounting<br />
to EEK 3,216,093,000. The primary securities for these loans are the pledge of shares of the shipowning<br />
subsidiaries and mortgages on the ships belonging to these subsidiaries.<br />
• <strong>Tallink</strong> <strong>Grupp</strong> AS has given guarantees in the amount of SIT 119,920 and EUR 5,000 to SEB Eesti<br />
Ühispank related to Vaba Maa AS with dates are June 30, 2006 and November 01, 2005, respectively.<br />
• <strong>Tallink</strong> <strong>Grupp</strong> AS has given guarantees in the amount of EEK 2,200,000 to SEB Eesti Ühispank related<br />
to TDF Kommerts OÜ with a due date of September 24, 2006.<br />
• <strong>Tallink</strong> <strong>Grupp</strong> AS has given a guarantee in the amount of EEK 260,000 to SEB Eesti Ühispank related<br />
to <strong>Tallink</strong> Travel Club OÜ with a due date of May 26, 2006.<br />
Non-cancellable operating leases<br />
On 01 October 2003 the Group concluded a non-cancellable lease agreement for the hotel building. The<br />
lease period of 10 years started on May 2004. The Group also has the option to renew the agreement for further<br />
five years. The annual non-cancellable lease payments will be in the range of EEK 36,000,000 to<br />
EEK 45,000,000 depending on the result of hotel’s operations.<br />
Capital investment commitments<br />
On October 27, 2004 Aker Finnyard and <strong>Tallink</strong> <strong>Grupp</strong> AS signed a shipbuilding contract to construct a new<br />
passenger cruise ship. The new ship will be delivered in May 2006. The construction value of the new ship is<br />
EUR 165,000,000. 20% will be paid during construction and 80% at, its delivery of the ship. By August 31, 2005<br />
the Group has made the prepayments for the ship in the total amounts of EUR 15,000,000. On August 1, 2005<br />
Aker Finnyard and <strong>Tallink</strong> <strong>Grupp</strong> AS signed another shipbuilding contract to construct a new fast passenger ship.<br />
The construction value of this new ship is EUR 110,000,000, of which 20% will be paid during construction and<br />
80% at delivery. By August 31, 2005 the Group has made the prepayments for the ship in the total amounts of<br />
EUR 2,000,000.<br />
F-28
FINANCIAL STATEMENTS FOR THE FINANCIAL YEAR ENDED AUGUST 31, 2005<br />
NOTES TO THE FINANCIAL STATEMENTS—(Continued)<br />
Note 20 RELATED PARTY DISCLOSURES<br />
The Group has entered into the following transactions with related parties and has the following balances<br />
with related parties (for the year ended August 31, and as of August 31, respectively). Prices used in sales to and<br />
purchases from related parties of the Group do not significantly differ from normal market prices.<br />
2005<br />
Sales to related<br />
parties<br />
Purchase from<br />
related parties<br />
Receivables from<br />
related parties<br />
Payables to<br />
related parties<br />
Infortar AS—services ....................... 99 6,430 0 0<br />
Infortar AS—loans ......................... 0 0 0 98,530<br />
Infortar AS—guarantee fee ................... 0 537 0 0<br />
Infortar AS—interests ....................... 0 6,993 0 0<br />
Infortar AS—sale of HT Valuuta AS ........... 5,000 0 5,000 0<br />
HTValuuta—services....................... 2,247 0 3 0<br />
HTG Vara AS—leases ...................... 0 30,000 0 0<br />
Mersok OÜ—leases ........................ 0 144 0 14<br />
Vaba Maa AS—services ..................... 0 2,916 0 75<br />
2004<br />
Infortar AS—services ....................... 37 6,424 0 1,475<br />
Infortar AS—loans ......................... 0 0 0 98,530<br />
Infortar AS—guarantee fee ................... 0 1,159 0 0<br />
Infortar AS—interests ....................... 0 7,422 0 1,188<br />
Vaba Maa AS—services ..................... 0 1,620 0 565<br />
HTG Vara AS—leases ...................... 0 9,274 0 0<br />
Mersok OÜ—leases ........................ 0 144 0 14<br />
HTValuuta—services....................... 12,186 0 1,835 147<br />
HTValuuta—interests* ..................... 57 0 11 0<br />
* a loan in the amount of EEK 4,000,000 was granted and received back during the financial year ended August 31, 2004.<br />
Related parties are:<br />
The ultimate parent<br />
Linandell OÜ—there are no transactions between the Group and Linandell OÜ during the financial year<br />
(2004: zero).<br />
The parent<br />
Infotar AS has 55.53% interest in <strong>Tallink</strong> <strong>Grupp</strong> AS.<br />
The companies controlled by the parent or ultimate parent<br />
See above for transactions with Vaba Maa AS, HT Valuuta and HTG Vara AS. There are no transactions<br />
with other companies controlled by the parent or ultimate parent, i.e. Tailwind AS, Fastinvest OÜ, Sunbeam OÜ,<br />
Inforte OÜ, Inf Invest OÜ, Inf Maja OÜ and Infor Invest.<br />
The management and companies controlled by them<br />
There are no transactions with key management personnel (i.e. members of the management board and the<br />
supervisory board of the Parent and its subsidiaries), except the remuneration paid to them (see related<br />
information below) and with the companies controlled by them, except with Mersok OÜ. Other companies<br />
controlled by management are Tekali OÜ, Kümnis Konsultatsioonid OÜ, Meelis Asi Konsultatsioonid OÜ,<br />
Compo Investeeringud OÜ and Trigoner OÜ.<br />
Directors’ remuneration and termination benefits<br />
The executive members of the Management Board received a remuneration totalling EEK 13,017,000<br />
(2004: EEK 16,131,000). The executive members of the Management Board do not receive pension entitlements<br />
from the Group. Some members of Management Board have a right to termination benefits. The maximum<br />
amount of such benefits as of August 31, 2005 is EEK 6,480,000 (2004: EEK 6,480,000).<br />
F-29
FINANCIAL STATEMENTS FOR THE FINANCIAL YEAR ENDED AUGUST 31, 2005<br />
NOTES TO THE FINANCIAL STATEMENTS—(Continued)<br />
Note 21 FINANCIAL RISK MANAGEMENT<br />
The management of financial risks is centralized in the Group’s financial department, which is responsible<br />
for all borrowings within the Group as well as all exposure linked to currency, interest, liquidity and bunker price<br />
risks.<br />
Currency risk<br />
Approximately 15% of the Group’s total revenues are in SEK. The Group seeks to minimize its currency<br />
transactions risk through matching foreign currency inflows with outflows. The Group’s other transactional<br />
currency exposure is related to the US dollar for the purchase of ship fuel and insurance. The net position in the<br />
currency exposure is not hedged by derivative financial instruments at the end of this financial year.<br />
The following tables present the Group’s net currency exposure as of 31 August.<br />
As the exchange rate between EEK and EUR has been fixed, monetary assets and liabilities nominated in<br />
EEK and in EUR have been presented together. This column includes also immaterial RUR denominated<br />
financial assets and liabilities.<br />
2005 EEK, EUR USD SEK Total<br />
Cash and cash equivalents ................................. 183,955 0 142,831 326,786<br />
Trade receivables ........................................ 98,338 0 15,835 114,173<br />
Other financial assets .................................... 38,180 0 608 38,788<br />
320,473 0 159,274 479,747<br />
Current portion of borrowings ............................. (689,492) 0 (981) (690,473)<br />
Trade payables .......................................... (204,524) (2,364) (22,841) (229,729)<br />
Other current payables ................................... (159,933) 0 (13,204) (173,137)<br />
Non-current portion of borrowings .......................... (3,144,929) 0 (935) (3,145,864)<br />
(4,198,878) (2,364) (37,961) (4,239,203)<br />
Currency net position ................................... (3,878,405) (2,364) 121,313 (3,759,456)<br />
2004 EEK, EUR USD SEK Total<br />
Cash and cash equivalents ................................. 336,713 0 29,955 366,668<br />
Trade receivables ........................................ 100,455 0 39,169 139,624<br />
Other financial assets ..................................... 29,574 0 18,231 47,805<br />
466,742 0 87,355 554,097<br />
Current portion of borrowings .............................. (750,337) 0 (380) (750,717)<br />
Trade payables .......................................... (260,090) (2,313) (18,028) (280,431)<br />
Other current payables .................................... (171,723) 0 (13,442) (185,165)<br />
Non-current portion of borrowings .......................... (3,481,978) 0 (1,397) (3,483,375)<br />
(4,664,128) (2,313) (33,247) (4,699,688)<br />
Currency net position ................................... (4,197,386) (2,313) 54,108 (4,145,591)<br />
Interest rate risk<br />
In its operations, the Group uses a mixture of financial instruments such as shareholders’ funds, bank<br />
borrowings, finance leases, bonds as well as cash. The Group borrows in desired currencies at both fixed and<br />
floating interest rates depending on its assessment of current market rates and future trends. At year-end, loans<br />
with fixed interest rate represented close to 7.7% of the Group’s total interest-bearing liabilities. The Group uses<br />
an interest rate swap to modify its exposure to interest rate movements and to manage its interest expense. As of<br />
August 31, 2005 the Group has an agreement in effect, which exchanges floating interest rate for fixed interest<br />
rate and which has a notional amount of EUR 5,938,000 (2004: EUR 9,331,000) and matures in 2007. As of<br />
August 31, 2005 the fair value of this derivative amounts to EEK 913,000 (2004: EEK 793,000) which is<br />
recorded as an other payable in the balance sheet.<br />
F-30
FINANCIAL STATEMENTS FOR THE FINANCIAL YEAR ENDED AUGUST 31, 2005<br />
NOTES TO THE FINANCIAL STATEMENTS—(Continued)<br />
Note 21 FINANCIAL RISK MANAGEMENT (Continued)<br />
The following tables present the analysis of the Group’s borrowings as of August 31, 2005 and 2004 by<br />
fixed and floating interest rates. The division of interest-bearing liabilities between the groups of up to 1 year,<br />
1-5 years and longer than five years is based on the maturity date in the case of liabilities with fixed interest rates<br />
and the repricing date in the case of floating interest rate.<br />
2005<br />
Fixed rate<br />
< 1 year 1-5 years > 5 years Total<br />
Finance lease liability .................................... 981 935 0 1,916<br />
Other loans ............................................. 73,648 24,882 0 98,530<br />
Bonds .................................................<br />
Floating rate<br />
58,747134,559 0 193,306<br />
Bank overdraft .......................................... 18,249 0 0 18,249<br />
Secured bank loans ...................................... 3,524,336 0 0 3,524,336<br />
2004 < 1 year 1-5 years > 5 years Total<br />
Fixed rate<br />
Finance lease liability ..................................... 380 1,397 0 1,777<br />
Other loans ............................................. 48,766 49,764 0 98,530<br />
Bonds ................................................. 99,310 0 0 99,310<br />
Floating rate<br />
Secured bank loans ....................................... 4,034,475 0 0 4,034,475<br />
Credit risk<br />
The maximum credit risk exposure of unsecured receivables of the Group at the balance sheet date is<br />
EEK 153,373,000 (2004: EEK 185,316,000). There is no significant concentration of credit risk within the<br />
Group.<br />
Bunker price risk<br />
The total bunker cost for the fleet represents approximately 12% of the total operating expenses. Changes in<br />
the bunker prices follow the changes in the oil price and the USD price. In order to fix the cost of gasoil between<br />
June 1 and August 31, 2005 the Group executed a fuel-related agreement with fuel supplier NT Marine in<br />
May 2005. There is no active hedge at the end of the financial year.<br />
Liquidity risk<br />
The Group’s objective is to maintain a balance between continuity of funding and flexibility through the use<br />
of bank overdrafts, bank loans, bonds and other debentures. Excess liquidity is invested in short-term money<br />
market instruments.<br />
Fair values<br />
In the opinion of the Group’s management there are no significant differences between the carrying value<br />
and the fair value of financial assets and liabilities of the Group as of August 31, 2005 and 2004.<br />
Note 22 EVENTS AFTER THE BALANCE SHEET DATE<br />
In September 2005 <strong>Tallink</strong> <strong>Grupp</strong> AS established its subsidiary <strong>Tallink</strong> Hansaway Limited in which it holds<br />
100% of the shares. The payment into the share capital in the amount of EEK 27,000 has not been made by<br />
October 10, 2005. The new subsidiary has been registered in Cyprus and was established and its purpose is to<br />
own ships.<br />
F-31
FINANCIAL STATEMENTS FOR THE FINANCIAL YEAR ENDED AUGUST 31, 2005<br />
MANAGEMENT BOARD’S APPROVAL OF THE FINANCIAL STATEMENTS<br />
We hereby take responsibility for the preparation of the consolidated financial statements of <strong>Tallink</strong> <strong>Grupp</strong> AS<br />
(referred to as “the Parent”) and its subsidiaries (together referred to as “the Group) and the financial statements of<br />
the Parent set out on pages F-2 to F-32 and confirm that:<br />
• accounting principles used in preparing the financial statements mentioned above are in compliance<br />
with International Financial Reporting Standards (IFRS);<br />
• the financial statements give a true and fair view of the financial position of the Group and the Parent<br />
and the results of their operations and cash flows;<br />
• <strong>Tallink</strong> <strong>Grupp</strong> AS and its subsidiaries are able to continue as a going concern for a period of at least one<br />
year of the date of approving these financial statements.<br />
Chairman of the Board Member of the Board<br />
Enn Pant Kalev Järvelill<br />
Member of the Board Member of the Board<br />
Andres Hunt Keijo Mehtonen<br />
Tallinn<br />
October 10, 2005<br />
F-32
FINANCIAL STATEMENTS FOR THE FINANCIAL YEAR ENDED AUGUST 31, 2005<br />
AUDITORS’ REPORT TO THE AS TALLINK GRUPP SHAREHOLDERS<br />
We have audited the financial statements of AS <strong>Tallink</strong> <strong>Grupp</strong> (hereafter “the Company”) and the<br />
consolidated financial statements of AS <strong>Tallink</strong> <strong>Grupp</strong> and its subsidiaries (hereafter “the Group”) for the<br />
financial year ended August 31, 2005, which are set out on pages F-2 through F-32 of the Offering<br />
Memorandum. These financial statements are the responsibility of the Company’s management. Our<br />
responsibility is to express an opinion on these financial statements based on our audit.<br />
We conducted our audit in accordance with International Standards on Auditing. Those Standards require<br />
that we plan and perform the audit to obtain reasonable assurance about whether the financial statements are free<br />
of material misstatement. An audit includes examining, on a test basis, evidence supporting the amounts and<br />
disclosures in the financial statements. An audit also includes assessing the accounting principles used and<br />
significant estimates made by management, as well as evaluating the overall financial statement presentation. We<br />
believe that our audit provides a reasonable basis for our opinion.<br />
In our opinion, the financial statements referred to above present fairly, in all material respects, the financial<br />
position of the Company and the Group as of August 31, 2005, and the results of their operations and their cash<br />
flows for the financial year then ended in accordance with International Financial Reporting Standards.<br />
Hanno Lindpere<br />
Ernst & Young <strong>Baltic</strong> AS<br />
Marju Põldniit<br />
Authorised Auditor<br />
The audit of the financial statements for the financial year ended August 31, 2005 was completed on<br />
October 25, 2005, except for the minor financial statements style presentation amendments, as to which the date<br />
is November 18, 2005.<br />
F-33
FINANCIAL STATEMENTS FOR THE FINANCIAL YEAR ENDED AUGUST 31, 2004<br />
INCOME STATEMENT<br />
for the financial year ended August 31, in thousands of EEK<br />
Consolidated Group Parent Company<br />
2004 2003 2004 2003 Notes<br />
Netsales ................................... 3,406,255 2,995,598 2,210,754 2,200,187 3<br />
Costofsales ................................ (2,478,745) (2,132,865) (1,971,368) (1,863,094) 4<br />
Gross profit ................................ 927,510 862,733 239,386 337,093<br />
Marketing expenses .......................... (351,427) (260,951) (170,996) (127,762) 4<br />
Administrative and general expenses ............. (128,283) (118,061) (71,265) (67,311) 4<br />
Other operating income ....................... 799 2,663 242 1,862 4<br />
Other operating expenses ...................... (2,331) (5,609) (1,398) (5,117) 4<br />
Operating profit ............................ 446,268 480,775 (4,031) 138,765 3<br />
Net financial (expense) income ................. (134,300) (99,542) (133,257) (89,219) 4<br />
Income from subsidiaries ...................... 0 0 448,951 331,494 11<br />
Income from associates ....................... 1,360 891 1,360 891 12<br />
Profit from normal operation before income<br />
tax ...................................... 313,328 382,124 313,023 381,931 3<br />
Income tax ................................. (305) (193) 0 0 5<br />
Net profit for the financial year ............... 313,023 381,931 313,023 381,931 3<br />
Earnings per share (in EEK per share) 6<br />
—basic ................................ 11.5 17.1 11.5 17.1<br />
—diluted............................... 11.5 17.1 11.5 17.1<br />
F-34
FINANCIAL STATEMENTS FOR THE FINANCIAL YEAR ENDED AUGUST 31, 2004<br />
BALANCE SHEET<br />
As of August 31, in thousands of EEK<br />
Consolidated Group Parent Company<br />
31.8.2004 31.8.2003 31.8.2004 31.8.2003 Notes<br />
ASSETS<br />
CURRENT ASSETS<br />
Cash and cash equivalents ........................ 366,668 231,824 171,220 142,440 7<br />
Trade receivables ............................... 139,624 107,649 52,556 43,554 8<br />
Taxassets..................................... 5,512 7,405 4,099 941 5<br />
Other receivables and prepaid expenses ............. 79,517 44,307 260,285 195,695 9<br />
Inventories .................................... 84,553 51,468 39,287 28,99210 TOTAL CURRENT ASSETS .................... 675,874 442,653 527,447 411,622<br />
NON-CURRENT ASSETS<br />
Investments in subsidiaries ....................... 0 0 2,072,910 1,574,646 11<br />
Investments in associates ......................... 2,557 1,997 2,557 1,997 12<br />
Other financial assets ............................ 2,113 412 619,668 594,713 13<br />
Property, plant and equipment ..................... 6,050,938 3,902,084 2,656,290 2,847,571 14<br />
Intangible assets ................................ 176,443 202,022 2,517 0 15<br />
TOTAL NON-CURRENT ASSETS .............. 6,232,051 4,106,515 5,353,942 5,018,927<br />
TOTAL ASSETS .............................. 6,907,925 4,549,168 5,881,389 5,430,549<br />
LIABILITIES AND OWNERS’ EQUITY<br />
CURRENT LIABILITIES<br />
Current portion of interest-bearing liabilities ......... 750,717 670,711 617,725 573,667 16<br />
Trade payables ................................. 280,431 176,113 163,736 58,181<br />
Tax liabilities .................................. 70,779 25,846 21,048 2,326 5<br />
Other payables and deferred income ................ 139,971 80,294 591,069 541,163 17<br />
TOTAL CURRENT LIABILITIES ............... 1,241,898 952,964 1,393,578 1,175,337<br />
NON-CURRENT LIABILITIES<br />
Interest bearing loans and borrowings ............... 3,483,375 2,123,300 2,254,993 2,727,933 16<br />
Other noncurrent liabilities ....................... 0 0 50,441 54,572 16<br />
Deferred income tax ............................ 275 197 0 0 5<br />
TOTAL NON-CURRENT LIABILITIES .......... 3,483,650 2,123,497 2,305,434 2,782,505<br />
TOTAL LIABILITIES ......................... 4,725,548 3,076,461 3,699,012 3,957,842<br />
OWNERS’ EQUITY<br />
Issuedcapital .................................. 275,000 224,000 275,000 224,000 18<br />
Share premium ................................. 414,870 69,223 414,870 69,223 18<br />
Reserves...................................... 27,500 22,400 27,500 22,400 2<br />
Retainedearnings .............................. 1,151,984 775,153 1,151,984 775,153<br />
Net profit for the financial year .................... 313,023 381,931 313,023 381,931<br />
TOTAL OWNERS’ EQUITY ................... 2,182,377 1,472,707 2,182,377 1,472,707<br />
TOTAL OWNERS’ EQUITY AND<br />
LIABILITIES ............................... 6,907,925 4,549,168 5,881,389 5,430,549<br />
F-35
FINANCIAL STATEMENTS FOR THE FINANCIAL YEAR ENDED AUGUST 31, 2004<br />
CASH FLOW STATEMENT<br />
for the financial year ended August 31, in thousands of EEK<br />
Consolidated Group Parent Company<br />
2004 2003 2004 2003 Notes<br />
Cash flows from operating activities<br />
Netprofit................................... 313,023 381,931 313,023 381,931<br />
Adjustments of profit .......................... 404,604 418,241 123,536 203,009<br />
Depreciation and amortisation ..............<br />
Net (gains) / losses on disposals of tangible and<br />
273,760 322,116 442,860 436,014 14, 15<br />
intangible assets ....................... 249 (54) 14 (17) 4<br />
Net interest expenses ...................... 131,633 136,438 130,973 137,520 4<br />
Income from subsidiaries .................. 0 0 (448,951) (331,494) 11<br />
Income from associates ....................<br />
Net foreign exchange gain related to investing<br />
(1,360) (891) (1,360) (891) 12<br />
and financing activities .................. 17 (39,561) 0 (38,123)<br />
Income tax .............................. 305 193 0 0 5<br />
Income tax paid / refunded .....................<br />
Change in receivables related to operating<br />
(338) (19) 0 0<br />
activities ................................. (66,848) 83,858 (89,878) 161,664<br />
Change in inventories ......................... (33,085) 8,062 (10,295) 7,947<br />
Change in liabilities related to operating activities . . . 187,071 (49,825) 174,992 75,029<br />
Net cash from operating activities .............. 804,427 842,248 511,378 829,580<br />
Cash flows from investing activities<br />
Purchase of tangible and intangible assets .........<br />
Proceeds from disposals of tangible and intangible<br />
(2,396,561) (382,844) (20,316) (10,549) 14, 15, 16<br />
assets .................................... 382 57 0 17 4,14<br />
Repayments of granted loans ................... 0 5,120 395,779 54,269<br />
Loans granted ............................... 0 0 (457,597) (186,828)<br />
Acquisition of subsidiary ...................... (46) (248,140) (104) (249,690) 11<br />
Proceeds from disposals of shares of associates ..... 0 1,564 0 1,564<br />
Dividends received ........................... 800 1,400 800 1,400 12<br />
Interest received ............................. 9,269 3,236 30,021 45,734<br />
Net cash from investing activities .............. (2,386,156) (619,607) (51,417) (344,083)<br />
Cash flows from financing activities<br />
Loans received .............................. 2,251,129 550,025 97,046 363,974<br />
Loans repaid ................................ (820,022) (515,298) (310,411) (162,506)<br />
Interestpaid................................. (110,584) (139,898) (154,853) (167,551)<br />
Purchases of treasury shares .................... 0 (4,599) 0 (4,599) 18<br />
Proceeds from disposal of treasury shares ......... 0 4,599 0 4,599 18<br />
Issue of shares ............................... 396,647 0 396,647 0 18<br />
Payments of finance lease liability ............... (597) (38,367) (459,610) (420,882)<br />
Net cash from financing activities .............. 1,716,573 (143,538) (431,181) (386,965)<br />
Total net cash flow .......................... 134,844 79,103 28,780 98,532<br />
Cash and cash equivalents at beginning of<br />
period ................................... 231,824 152,721 142,440 43,908<br />
Totalnetcashflow ........................... 134,844 79,103 28,780 98,532<br />
Cash and cash equivalents at end of period ...... 366,668 231,824 171,220 142,440 7<br />
F-36
FINANCIAL STATEMENTS FOR THE FINANCIAL YEAR ENDED AUGUST 31, 2004<br />
STATEMENT OF CHANGES IN EQUITY<br />
for the financial year ended August 31, in thousands of EEK<br />
Issued<br />
capital<br />
Share<br />
premium Treasury<br />
shares Reserves<br />
Retained<br />
earnings Total<br />
At September 1, 2002 ................... 224,000 69,223 0 22,400 775,153 1,090,776<br />
Purchase of treasury shares ............... 0 0 (4,599) 0 0 (4,599)<br />
Saleoftreasuryshares ................... 0 0 4,599 0 0 4,599<br />
Netprofit.............................. 0 0 0 0 381,931 381,931<br />
At August 31, 2003 ..................... 224,000 69,223 0 22,400 1,157,084 1,472,707<br />
Share issue ............................ 51,000 345,647 0 0 0 396,647<br />
Transfer from retained earnings to reserves . . . 0 0 0 5,100 (5,100) 0<br />
Netprofit.............................. 0 0 0 0 313,023 313,023<br />
At August 31, 2004 ..................... 275,000 414,870 0 27,500 1,465,007 2,182,377<br />
For additional information about shares and movements in equity see Note 18.<br />
F-37
FINANCIAL STATEMENTS FOR THE FINANCIAL YEAR ENDED AUGUST 31, 2004<br />
Note 1 CORPORATE INFORMATION<br />
NOTES TO THE FINANCIAL STATEMENTS<br />
The financial statements of <strong>Tallink</strong> <strong>Grupp</strong> AS (both as a group and a parent company) for the year ended<br />
August 31, 2004 were authorised for issue in accordance with a resolution of the Management Board on<br />
December 17, 2004. <strong>Tallink</strong> <strong>Grupp</strong> AS is a limited company incorporated in Estonia that employed 2,820 people<br />
at August 31, 2004 (2,040 at August 31, 2003). The principal activities of the group are described in Note 3.<br />
<strong>Tallink</strong> <strong>Grupp</strong> AS is controlled by Infortar AS, which owned 55.53% of the shares of <strong>Tallink</strong> <strong>Grupp</strong> AS as of<br />
December 17, 2004.<br />
Note 2 SUMMARY OF SIGNIFICANT ACCOUNTING POLICIES<br />
Basis of preparation<br />
The financial statements of <strong>Tallink</strong> <strong>Grupp</strong> AS have been prepared in accordance with International Financial<br />
Reporting Standards (IFRS), which comprise standards and interpretations approved by the IASB, and<br />
International Accounting Standards and Standing Interpretations Committee interpretations approved by the<br />
IASC that remain in effect as of August 31, 2004, except IAS 16 (revised 2004), which was adopted before its<br />
effective date, i.e., financial years beginning on or after January 1, 2005.<br />
The financial statements have been prepared in thousand Estonian kroons (EEK) and based on historical<br />
cost, unless indicated otherwise in the accounting principles below.<br />
Basis of consolidation<br />
The consolidated financial statements comprise the financial statements of <strong>Tallink</strong> <strong>Grupp</strong> AS and its<br />
subsidiaries drawn up to August 31 each year. Subsidiaries are consolidated from the date on which control is<br />
transferred to the group and cease to be consolidated from the date on which control is transferred out of the<br />
group. All inter-company transactions, balances and unrealized profits and losses on transactions between group<br />
companies have been eliminated in the financial statements.<br />
New subsidiaries (business combinations) have been included in the consolidated financials statements<br />
using the purchase method of accounting. Accordingly, the consolidated income statement and consolidated cash<br />
flow statement include the results and cash flows of new subsidiaries for the period starting from their acquisition<br />
date. The purchase consideration is allocated to the assets and liabilities on the basis of fair value at the date of<br />
acquisition.<br />
In the parent company’s financial statements investments in its subsidiaries are accounted for under the<br />
equity method of accounting. The investment in subsidiary is carried in the balance sheet at cost plus postacquisition<br />
changes in the parent company’s share of net assets of the subsidiary, less any impairment in value.<br />
Investment in associates<br />
The group’s investment in its associates is accounted for under the equity method of accounting. An<br />
associate is an entity in which the group has significant influence, but which is not a subsidiary of the group. The<br />
investment in associate is carried in the balance sheet at cost plus post-acquisition changes in the group’s share of<br />
net assets of the associate, less any impairment in value.<br />
Foreign exchange transactions<br />
Transactions in foreign currencies are recorded at the transaction date exchange rate. Monetary assets and<br />
liabilities denominated in foreign currencies are retranslated at the rate of exchange ruling at the balance sheet<br />
date. All differences are recognized in the income statement as financial items.<br />
The overseas subsidiaries are considered as “foreign operations that are integral to the operations of the<br />
parent company”. It means that the individual items in the financial statements of the overseas subsidiaries are<br />
translated as if all its transactions had been entered into by the parent company itself. The cost and depreciation<br />
of tangible fixed assets is translated using the exchange rate at the date of purchase of the asset. Monetary assets<br />
and liabilities denominated in foreign currencies are translated at the rate of exchange ruling at the balance sheet<br />
date. All differences are taken to the income statement.<br />
F-38
FINANCIAL STATEMENTS FOR THE FINANCIAL YEAR ENDED AUGUST 31, 2004<br />
NOTES TO THE FINANCIAL STATEMENTS—(Continued)<br />
Note 2 SUMMARY OF SIGNIFICANT ACCOUNTING POLICIES (Continued)<br />
Goodwill and fair value adjustments arising on the acquisition of a foreign entity are treated as assets of the<br />
acquiring company and are recorded at the exchange rate as of the date of the acquisition.<br />
Property, plant and equipment<br />
Property, plant and equipment are stated at cost less accumulated depreciation and any impairment in value.<br />
Land is not depreciated. Depreciation is calculated on a straight-line basis over the estimated useful life of the<br />
asset as follows:<br />
Buildings—................................................................. over 20 years<br />
Plant and equipment— ........................................................ over5years<br />
Ships— .................................................................... over 6 to 50 years<br />
Other equipment— ........................................................... over 3 to 5 years.<br />
From September 1, 2003 according to the revised IAS 16 depreciation charge is calculated separately for<br />
each significant part of ships on a straight-line basis over estimated useful life of each part as follows:<br />
Hull*— ................................................................... over 11 to 50 years<br />
Machinery— ............................................................... over11to40years<br />
On-board equipment (short-term)— ............................................. over 5 to 6 years<br />
On-board equipment (long-term)— ............................................. over 10 to 21 years<br />
* From September 1, 2003 the residual value other than zero is used for hull, i.e. depreciation is stopped when the carrying value of the<br />
hull equals with its residual value. The residual value is based on the current prices of relevant metals and the probable quantity of scrap<br />
metals realizable at the end of ships’ useful life.<br />
The residual value and the useful life of items of property, plant and equipment are reviewed at least at each<br />
financial year and, if expectations differ from previous estimates, the changes are accounted for as a change in a<br />
accounting estimation.<br />
Due to changes in useful lifes and residual value of hull the depreciation charge decreased by EEK 63,480<br />
thousands during the year 2003/2004 (compared with previous year). In the interim consolidated condensed<br />
financial statements for the 3- and 6-months periods ended respectively November 30, 2003 and February 29,<br />
2004 the previous estimates were used in calculation of depreciation charges.<br />
The carrying values of property, plant and equipment are reviewed for impairment when events or changes<br />
in circumstances indicate that the carrying value may not be recoverable. If any such indication exists and where<br />
the carrying values exceed the estimated recoverable amount, the individual assets or group of assets comprising<br />
cash-generating units are written down to their recoverable amount, which is specified as the higher of an asset’s<br />
market value and value in use. At least two independent brokers are used annually to determine the market value<br />
of ships and identify impairment indicators, if any.<br />
The costs related to the building of ships are capitalized. Capitalized costs are as follows:<br />
• payments to the ship builder;<br />
• payments for organising the survey related to the building of new ships;<br />
• borrowing costs (up to the delivery date) related to loans set up for the building of new ships;<br />
• equipment purchased for new ships;<br />
• start-up costs for new ships.<br />
Subsequent expenditure relating to an item of property, plant and equipment that has already been<br />
recognized (e.g., replacements of part of some items) are added to the carrying amount of the assets, if the<br />
recognition criteria are met, i.e., (a) it is probable that future economic benefits associated with the item will flow<br />
to the enterprise, and (b) the cost of the item can be measured reliably. The replaced items are derecognized. All<br />
other expenditures are recognised as an expense in the period in which it is incurred.<br />
F-39
FINANCIAL STATEMENTS FOR THE FINANCIAL YEAR ENDED AUGUST 31, 2004<br />
NOTES TO THE FINANCIAL STATEMENTS—(Continued)<br />
Note 2 SUMMARY OF SIGNIFICANT ACCOUNTING POLICIES (Continued)<br />
Dry-docking costs<br />
The ships are dry-docked in intervals of two or three years. The major expenditures related to the<br />
dry-docking are capitalized and recorded in the same line of balance sheet as ships. The depreciation period<br />
applied to capitalized dry-docking costs coincides with the frequency of dry-docking (2-5 years).<br />
Goodwill<br />
Goodwill represents the excess of the cost of the acquisition over the fair value of identifiable net assets of a<br />
subsidiary at the date of acquisition.<br />
Goodwill arising from business combinations for which the agreement date is before March 31, 2004<br />
Goodwill is amortized on a straight-line basis maximum of 10 years. The amortization period is based on<br />
the best estimate of the period during which future economic benefits are expected to flow to the company.<br />
Goodwill is stated at cost less accumulated amortization and any impairment in value. Amortization of goodwill<br />
is recorded as “administrative and general expenses” in the income statement.<br />
Goodwill arising from business combinations for which the agreement date is on or after March 31, 2004<br />
After initial recognition, the goodwill is measured at cost less any accumulated impairment losses. Goodwill<br />
is reviewed for impairment, annually or more frequently if events or changes in circumstances indicate that the<br />
carrying value may be impaired. Impairment is determined by assessing the recoverable amount of the cashgenerating<br />
unit, to which the goodwill relates. Where recoverable amount of the cash-generating unit is less than<br />
the carrying amount, an impairment loss is recognized. Impairment losses of goodwill are recorded as<br />
“administrative and general expenses” in the income statement”.<br />
Research and development costs<br />
Research and development expenditure is expensed except that costs incurred on development projects are<br />
recognized as development assets to the extent that such expenditure is reasonably expected to have future<br />
economic benefits. However, development costs initially recognized as an expense are not recognized as an asset<br />
in a subsequent period if an economic benefit becomes probable.<br />
Other intangible assets<br />
Intangible assets acquired separately from a business are initially recognized at cost. Intangible assets<br />
acquired as part of an acquisition of a business are capitalised separately from goodwill if the fair value can be<br />
measured reliably on initial recognition, subject to the constraint that, unless the asset has a readily ascertainable<br />
market value, the fair value is limited to an amount that does not create or increase any negative goodwill arising<br />
on the acquisition. The carrying values of intangible assets are reviewed for impairment when events or changes<br />
in circumstances indicate that the carrying value may not be recoverable. Intangible assets are amortized on a<br />
straight-line basis maximum of 5 years. Amortization of intangible assets is recorded as “administrative and<br />
general expenses” in the income statement.<br />
Financial instruments<br />
All investments are initially recognized at cost, being the fair value of the consideration given and including<br />
acquisition charges associated with the investment. After initial recognition, investments, which are classified as<br />
held for trading (including derivatives) and available-for-sale, are measured at fair value. Other long-term<br />
receivables are measured at amortized cost using the effective interest rate method. Amortized cost is calculated<br />
by taking into account a discount or a premium on acquisition, over the period to maturity. Increases/decreases in<br />
the carrying amount of investments and any gains and losses on the disposal of investments are charged or<br />
credited to the income statement within “Net financial expense / income”.<br />
F-40
FINANCIAL STATEMENTS FOR THE FINANCIAL YEAR ENDED AUGUST 31, 2004<br />
NOTES TO THE FINANCIAL STATEMENTS—(Continued)<br />
Note 2 SUMMARY OF SIGNIFICANT ACCOUNTING POLICIES (Continued)<br />
Inventories<br />
Inventories are valued at the lower of cost and net realisable value. Both raw materials and merchandise<br />
purchased for resale are written off using the weighted average cost method.<br />
Trade and other receivables<br />
Trade receivables, which generally have 7-30 day payment terms, are recognised and carried at original<br />
invoice amount less an allowance for any uncollectible amounts. An estimate for doubtful debts is made when<br />
collection of the full amount is no longer probable. Bad debts are written off from the balance sheet when<br />
identified.<br />
Cash and cash equivalents<br />
Cash equivalents are short-term highly liquid investments that are readily convertible to known amount of<br />
cash and which are subject to insignificant risk of changes in value.<br />
Borrowings<br />
Borrowings are recognised initially at the fair value of proceeds received, net of transaction costs incurred.<br />
In subsequent periods, borrowings are stated at amortised cost using the effective yield method; any difference<br />
between proceeds (net of transaction costs) and the redemption value is recognised in the income statement over<br />
the period of the borrowings. Borrowing costs related to the building of new ships are capitalised as a part of the<br />
acquisition cost of an asset (incurred up to the delivery date).<br />
Leases<br />
Finance leases, which transfer to the group substantially all the risks and benefits incidental to the<br />
ownership of the leased items, are capitalised at the present value of the minimum lease payments. Capitalised<br />
leased assets are depreciated over the shorter of the estimated useful life of the asset or the lease term.<br />
Leases, where the lesser retains substantially all the risks and benefits of ownership of the asset, are<br />
classified as operating leases and lease payments are recognised as operating expenses.<br />
Provisions, contingent liabilities and contingent assets<br />
Provisions are recognised when the group has a present obligation (legal or constructive) as a result of past<br />
events, it is probable that an outflow of resources embodying economic benefits will be required to settle the<br />
obligation and a reliable estimate of the amount of the obligation can be made. Promises, guarantees and other<br />
commitments that in certain circumstances may become liabilities, but in the opinion of the group’s management<br />
the probability of an outflow to settle these liabilities is lower than 50%, are disclosed in the Notes to the<br />
financial statements as contingent liabilities.<br />
Contingent assets are never recognised. They are disclosed in the Note if their realisability is probable.<br />
Reserves in owners’ equity<br />
Reserves in owners’ equity include a mandatory legal reserve formed according to the Commercial Code<br />
amounting to 10% of the share capital. This is transferred from the net profit upon a resolution of the general<br />
meeting of shareholders. The mandatory legal reserve cannot be distributed to shareholders as dividends, but it<br />
can be used to cover losses.<br />
Segment reporting<br />
All assets directly related to the segments are recorded as the assets of the segment and all liabilities directly<br />
related to the segments are recorded as the liabilities of the segments. Unallocated assets and liabilities are<br />
F-41
FINANCIAL STATEMENTS FOR THE FINANCIAL YEAR ENDED AUGUST 31, 2004<br />
NOTES TO THE FINANCIAL STATEMENTS—(Continued)<br />
Note 2 SUMMARY OF SIGNIFICANT ACCOUNTING POLICIES (Continued)<br />
recorded as the assets and liabilities of the group. The primary segments of the group are geographical segments<br />
(by the routes and mainland) and the secondary segments are operational segments (tickets sales, sales of cargo<br />
transport, restaurant and shops sales onboard and on mainland, hotel (accommodation) sales and others).<br />
Expenses not related to a specific segment are recorded as unallocated expenses of the group.<br />
Revenue<br />
Revenue is recognised to the extent that it is probable that the economic benefits will flow to the group and<br />
the revenue can be reliably measured. The following specific recognition criteria must also be met before<br />
revenue is recognised:<br />
Sale of goods<br />
Revenue is recognised when the significant risks and rewards of ownership of the goods have passed to the<br />
buyer and the amount of revenue can be measured reliably.<br />
Ticket sale and sale of cargo transport<br />
Revenue from tickets and cargo transport are recognised in the income statement at the time of departure. At<br />
financial year-end, if material, a revenue deferral is recorded for the part of the revenue that has not yet been<br />
earned in relation to the tickets sold.<br />
Sales of hotel rooms<br />
Revenue from sales of hotel rooms is recognised in the income statement when the rooms are used by the<br />
clients. At financial year-end, if material a revenue deferral is recorded for the part of the revenue that has not yet<br />
been earned in relations to the room days sold.<br />
Interest<br />
Revenue is recognised as the interest accrues (taking into account the effective yield on the asset).<br />
Income tax<br />
Income tax contains current income tax and deferred income tax.<br />
The parent company and its Estonian subsidiaries:<br />
According to the Estonian Income Tax Law, the company’s net profit is not subject to income tax but all<br />
dividends paid by the company are subject to income tax (26/74 of net dividend paid out before December 31,<br />
2004 and 24/76 of net dividend paid out after December 31, 2004). Thus there are no temporary differences<br />
between the tax bases and carrying values of assets and liabilities that may cause the deferred income tax.<br />
The company’s potential tax liability related to the distribution of its retained earnings as dividends is not<br />
recorded in the balance sheet. The amount of potential tax liability related to the distribution of dividends<br />
depends on when and how much dividends the company pays out.<br />
Income tax from the payment of dividends is recorded as income tax expense at the moment of declaring the<br />
dividends.<br />
Swedish, Finnish and Russian subsidiaries:<br />
In accordance with income tax acts, the company’s net profit adjusted by temporary and permanent<br />
differences determined in income tax acts is subject to income tax in Finland, Sweden and Russia (the tax rate is<br />
29% in Finland, 28% in Sweden and 22% in Russia).<br />
F-42
FINANCIAL STATEMENTS FOR THE FINANCIAL YEAR ENDED AUGUST 31, 2004<br />
NOTES TO THE FINANCIAL STATEMENTS—(Continued)<br />
Note 2 SUMMARY OF SIGNIFICANT ACCOUNTING POLICIES (Continued)<br />
Deferred income tax is provided, using the liability method, for all temporary differences at the balance<br />
sheet date between the tax bases of assets and liabilities and their carrying amounts for financial reporting<br />
purposes. Deferred tax assets are recognised only when it is probable that profit will be available against which<br />
the deferred tax assets can be utilised.<br />
Tax to be paid is reported under current liabilities and deferred tax under non-current liabilities.<br />
Other subsidiaries:<br />
The net profit of shipping companies registered in Cyprus and Bahamas and dividends paid by these<br />
companies are treated without income tax. Thus there are no temporary differences between the tax bases and<br />
carrying values of assets and liabilities that may cause the deferred income tax.<br />
Note 3 SEGMENT INFORMATION<br />
(in thousand EEK)<br />
The Group<br />
The group’s operating businesses are organised and managed separately according to the nature of the<br />
different markets. The group operates six ships between Estonia-Finland, four ships between Estonia-Sweden,<br />
one ship between Estonia-Russia and one hotel in Estonia, which represent different business segments. The<br />
group’s market share on Estonia-Finland route is about 41% passenger transportation and about 45 cargo<br />
transportation, Estonia-Sweden route is about 100% passenger transportation and about 100% cargo<br />
transportation and Estonia-Russia route is about 60% passenger transportation and about 80% cargo<br />
transportation (according to the Port of Tallinn).<br />
The following tables present revenue and profit as well as certain asset and liability information regarding<br />
business segments for the years ended August 31, 2004 and 2003.<br />
Geographical segments—assets’ location<br />
2003/2004<br />
Estonia-<br />
Finland<br />
routes<br />
Estonia-<br />
Sweden<br />
routes<br />
Estonia-<br />
Russia<br />
routes<br />
Estonia<br />
mainland<br />
business<br />
Elimination of<br />
inter-segment<br />
sales Total<br />
Revenue<br />
Ticket sales ....................... 533,600 349,080 26,877 171 909,728<br />
Accomodation sales ................ 0 0 0 31,486 31,486<br />
Sales of cargo transport ............. 227,433 378,893 3,057 0 609,383<br />
Restaurant and shops sales onboard and<br />
on mainland .................... 1,173,249 463,516 20,175 8,620 1,665,560<br />
Other ............................ 149,064 40,201 833 0 190,098<br />
Totalexternalsales................. 2,083,346 1,231,690 50,942 40,277 0 3,406,255<br />
Inter-segment sales ................. 285,100 6,999 106 60 (292,265) 0<br />
Total revenue .................... 2,368,446 1,238,689 51,048 40,337 (292,265) 3,406,255<br />
Result<br />
Segment result .................... 414,783 203,895 (52,083) 9,488 576,083<br />
Unallocated expenses ............... (129,815)<br />
Operating profit .................. 446,268<br />
Net financial expenses* ............. (134,300)<br />
Income from associate .............. 1,360<br />
Profit before income tax ............ 313,328<br />
Income tax ....................... (305)<br />
Net profit ........................ 313,023<br />
F-43
FINANCIAL STATEMENTS FOR THE FINANCIAL YEAR ENDED AUGUST 31, 2004<br />
NOTES TO THE FINANCIAL STATEMENTS—(Continued)<br />
Note 3 SEGMENT INFORMATION (Continued)<br />
31.08.2004<br />
Estonia-<br />
Finland<br />
routes<br />
Estonia-<br />
Sweden<br />
routes<br />
Estonia-<br />
Russia<br />
routes<br />
Estonia<br />
mainland<br />
business<br />
Elimination of<br />
inter-segment<br />
sales Total<br />
Assets and liabilities<br />
Segment assets .................... 3,225,470 3,243,915 328,280 10,961 (106,957) 6,701,669<br />
Unallocated assets ................. 206,256<br />
Total assets ...................... 6,907,925<br />
Segment liabilities ................. 233,209 143,032 66,931 11,089 (106,957) 347,304<br />
Unallocated liabilities* ............. 4,378,244<br />
Total liabilities ................... 4,725,548<br />
Other segment information<br />
Tangible assets capital expenditure .... 218,490 2,146,280 9,306 4,141 2,378,217<br />
Unallocated tangible assets capital<br />
expenditure .................... 16,247<br />
Intangible assets capital expenditure . . . 620 437 109 0 1,166<br />
Unallocated intangible assets capital<br />
expenditure .................... 2,036<br />
Depreciation ...................... 131,102 90,198 13,565 433 235,298<br />
Unallocated depreciation ............ 9,681<br />
Amortisation ..................... 20,622 7,929 3 0 28,554<br />
Unallocated amortisation ............ 226<br />
* Unallocated liabilities include the loans received to finance the ships operating between Estonia and Finland in the amount of EEK<br />
2,002,310 thousands and to finance the ships operating between Estonia and Sweden in the amount of EEK 1,979,972 thousands.<br />
Corresponding interest expenses amounted to EEK 67,987 thousands and EEK 49,073 thousands.<br />
2002/2003<br />
Estonia<br />
Finland<br />
Estonia<br />
Sweden<br />
Elimination of<br />
inter-segment sales Total<br />
Revenue<br />
Ticket sales ...................................... 566,773 260,318 827,091<br />
Sales of cargo transport ............................ 226,683 352,331 579,014<br />
On-board sales ................................... 1,192,438 301,884 1,494,322<br />
Other ........................................... 66,961 28,210 95,171<br />
Totalexternalsales................................ 2,052,855 942,743 0 2,995,598<br />
Inter-segment sales ................................ 280,639 715 (281,354) 0<br />
Total revenue ................................... 2,333,494 943,458 (281,354) 2,995,598<br />
Result<br />
Segment result ................................... 524,002 77,780 601,782<br />
Unallocated expenses .............................. (121,007)<br />
Operating profit ................................. 480,775<br />
Net financial expenses* ............................ (99,542)<br />
Income from associate ............................. 891<br />
Profit before income tax .......................... 382,124<br />
Income tax ...................................... (193)<br />
Net profit ....................................... 381,931<br />
F-44
FINANCIAL STATEMENTS FOR THE FINANCIAL YEAR ENDED AUGUST 31, 2004<br />
NOTES TO THE FINANCIAL STATEMENTS—(Continued)<br />
Note 3 SEGMENT INFORMATION (Continued)<br />
31.08.2003<br />
Estonia<br />
Finland<br />
Estonia<br />
Sweden<br />
Intersegment<br />
Total<br />
Assets and liabilities<br />
Segment assets ....................................... 3,135,695 1,411,920 (144,091) 4,403,524<br />
Unallocated assets ..................................... 145,644<br />
Total assets .......................................... 4,549,168<br />
Segment liabilities ..................................... 292,794 82,128 (144,091) 230,831<br />
Unallocated liabilities* ................................. 2,845,630<br />
Total liabilities ....................................... 3,076,461<br />
Other segment information<br />
Tangible assets capital expenditure ....................... 15,705 368,210 383,915<br />
Unallocated tangible assets capital expenditure .............. 3,993<br />
Intangible assets capital expenditure ...................... 203,987 0 203,987<br />
Depreciation ......................................... 191,168 103,200 294,368<br />
Unallocated depreciation ............................... 3,134<br />
Amortisation ......................................... 10,413 12,787 23,200<br />
Unallocated amortisation ............................... 1,414<br />
* Unallocated liabilities include the loans received to finance the ships operating between Estonia and Finland in the amount of EEK<br />
1,955,673 thousands and to finance the ships operating between Estonia and Sweden in the amount of EKK 539,780 thousands.<br />
Corresponding interest expenses amounted to EEK 92,340 thousands and EEK 24,024 thousands.<br />
Net sales by geographical segments—customers’ location<br />
As it is not possible to record revenue by customer group (especially onboard sales), this information has<br />
not been disclosed in the notes to the financial statements.<br />
Information by operational segments<br />
As most of the group’s and company’s assets (incl. tangible fixed assets) are related to sea transportation,<br />
then the information about assets and purchases of tangible non-current assets by operational segments has not<br />
been additionally disclosed.<br />
Note 4 INCOME AND EXPENSES<br />
(in thousand EEK)<br />
Cost of sales<br />
The Group Parent Company<br />
2003/2004 2002/2003 2003/2004 2002/2003<br />
Cost of inventories ................................... 746,858 616,718 526,086 483,456<br />
Port charges ......................................... 494,274 409,605 303,996 278,836<br />
Bunker cost ......................................... 274,429 240,210 145,649 111,325<br />
Charterhire ......................................... 0 3,095 100,150 134,481<br />
Staffcosts .......................................... 368,293 286,548 277,085 252,118<br />
Depreciation ........................................ 236,540 293,176 441,425 434,987<br />
Othercosts.......................................... 358,351 283,513 176,977 167,891<br />
TOTAL ............................................ 2,478,745 2,132,865 1,971,368 1,863,094<br />
F-45
FINANCIAL STATEMENTS FOR THE FINANCIAL YEAR ENDED AUGUST 31, 2004<br />
NOTES TO THE FINANCIAL STATEMENTS—(Continued)<br />
Note 4 INCOME AND EXPENSES (Continued)<br />
Marketing expenses<br />
The Group Parent Company<br />
2003/2004 2002/2003 2003/2004 2002/2003<br />
Advertising expenses ...................................... 122,121 82,887 20,394 10,847<br />
Agency fees paid to subsidiaries ............................. 0 0 118,257 93,880<br />
Depreciation ............................................. 4,622 5,078 226 0<br />
Staffcosts ............................................... 131,135 109,686 19,225 12,345<br />
Othercosts .............................................. 93,549 63,300 12,894 10,690<br />
TOTAL ................................................ 351,427 260,951 170,996 127,762<br />
Administrative and general expenses<br />
The Group Parent Company<br />
2003/2004 2002/2003 2003/2004 2002/2003<br />
Depreciation ............................................. 32,598 23,862 1,205 1,027<br />
Staffcosts ............................................... 44,594 42,28834,236 34,186<br />
Othercosts .............................................. 51,091 51,91135,824 32,098<br />
TOTAL ................................................ 128,283 118,061 71,265 67,311<br />
Specification of staff costs included in cost of sales, marketing expenses and administrative expenses:<br />
The Group Parent Company<br />
2003/2004 2002/2003 2003/2004 2002/2003<br />
Wages and salaries ........................................ 399,015 323,405 46,013 42,242<br />
Social security costs ....................................... 128,648 106,533 16,279 13,384<br />
Costoftrainingofstaff..................................... 4,042 2,802 692 506<br />
Otherstaffcosts .......................................... 12,322 5,782 267,562 242,517<br />
TOTAL ................................................ 544,027 438,522 330,546 298,649<br />
Other operating income<br />
The Group Parent Company<br />
2003/2004 2002/2003 2003/2004 2002/2003<br />
Gain on disposal of property, plant and equipment ............... 116 57 0 17<br />
Insurance benefits ......................................... 117 317 4 199<br />
Other ................................................... 566 2,289 238 1,646<br />
TOTAL ................................................ 799 2,663 242 1,862<br />
Other operating expenses<br />
The Group Parent Company<br />
2003/2004 2002/2003 2003/2004 2002/2003<br />
Loss on disposal of property, plant and equipment ............... 365 3 14 0<br />
Other ................................................... 1,966 5,606 1,384 5,117<br />
TOTAL ................................................ 2,331 5,609 1,398 5,117<br />
F-46
FINANCIAL STATEMENTS FOR THE FINANCIAL YEAR ENDED AUGUST 31, 2004<br />
NOTES TO THE FINANCIAL STATEMENTS—(Continued)<br />
Note 4 INCOME AND EXPENSES (Continued)<br />
Finance income and finance expenses<br />
The Group Parent Company<br />
2003/2004 2002/2003 2003/2004 2002/2003<br />
Net foreign exchange gains ................................ 0 37,054 0 48,306<br />
Other interest and financial income .......................... 9,475 3,047 29,239 38,816<br />
Total financial income ................................... 9,475 40,101 29,239 87,122<br />
Net foreign exchange losses ............................... (2,528) 0 (2,283) 0<br />
Interest expenses ........................................ (141,108) (139,485) (160,212) (176,336)<br />
Other financial expenses .................................. (139) (158) (1) (5)<br />
Total financial expenses .................................. (143,775) (139,643) (162,496) (176,341)<br />
Net financial (expenses) income ........................... (134,300) (99,542) (133,257) (89,219)<br />
Note 5 TAXES<br />
(in thousand EEK)<br />
Major components of income tax expense for the years ended August 31 are:<br />
The Group<br />
2003/2004 2002/2003<br />
Income tax from profit of Swedish subsidiary ..................................... 296 193<br />
Income tax from profit of Russian subsidiary ..................................... 9 0<br />
Total .................................................................... 305 193<br />
According to Russian, Finnish and Swedish legislation it is permissible for accounting and taxation purposes<br />
to charge the profit and loss account with depreciation in excess of plan and thereby accomplish a postponement<br />
of tax payments. These postponements are shown as deferred tax liability. The Finnish subsidiary has also carryforwards<br />
of tax losses, which are considered in calculation of the deferred tax asset.<br />
As of August 31, 2004 and 2003 the Swedish subsidiary—<strong>Tallink</strong> Sverige AB—has a deferred tax liability,<br />
the Finnish subsidiary—<strong>Tallink</strong> Finland OY—has an unrecorded deferred tax asset (it is not probable that future<br />
taxable profit will be available against which the unused tax losses can be utilized) and the Russian subsidiary—<br />
<strong>Tallink</strong>-Ru OOO—has no significant deferred tax liability or asset:<br />
31.08.04 31.08.03<br />
Deferred tax liability (non-current liability) ......................................... 275 197<br />
Unrecorded deferred tax asset .................................................... 2,313 3,699<br />
Refundable taxes and tax liabilities recorded as current assets and liabilities are divided as follows:<br />
The Group Parent Company<br />
Tax assets 31.08.2004 31.08.2003 31.08.2004 31.08.2003<br />
VAT .................................................. 5,179 7,017 4,099 941<br />
Income tax ............................................. 319 381 0 0<br />
Other taxes ............................................. 14 7 0 0<br />
Total ................................................. 5,512 7,405 4,099 941<br />
The Group Parent Company<br />
Tax liabilities 31.08.2004 31.08.2003 31.08.2004 31.08.2003<br />
Salary related taxes ...................................... 39,038 25,734 3,401 2,300<br />
Exciseduties ........................................... 2,496 0 0 0<br />
VAT .................................................. 29,203 0 17,626 0<br />
Income tax ............................................. 9 86 0 0<br />
Other taxes ............................................. 33 26 21 26<br />
Total ................................................. 70,779 25,846 21,048 2,326<br />
F-47
FINANCIAL STATEMENTS FOR THE FINANCIAL YEAR ENDED AUGUST 31, 2004<br />
Note 6 EARNINGS PER SHARE<br />
(in thousand EEK)<br />
NOTES TO THE FINANCIAL STATEMENTS—(Continued)<br />
Basic earnings per share are calculated by dividing the net profit for the year attributable to ordinary<br />
shareholders by the weighted average number of ordinary shares outstanding during the year. As the company<br />
does not have any potential ordinary shares, then the diluted earnings per share are equal to basic earnings per<br />
share.<br />
The Group Parent Company<br />
2003/2004 2002/2003 2003/2004 2002/2003<br />
Weighted average number of ordinary shares (pcs) [1] ..... 27,262,466 22,400,000 27,262,466 22,400,000<br />
Net profit attributable to ordinary shareholders ......... 313,023 381,931 313,023 381,931<br />
Earningspershare(inEEKpershare) ................ 11.5 17.1 11.5 17.1<br />
AS <strong>Tallink</strong> <strong>Grupp</strong> issued 5,100,000 new shares for cash on September 18, 2003. The total number of ordinary shares after the share issue<br />
is 27,500,000. See also Note 18.<br />
[1] As a result of the new share issue, the share capital increased from 22,400,000 shares to 27,500,000 shares on September 18, 2003 (see<br />
also Note 18). The calculation of weighted average number of ordinary shares is as follows:<br />
—period from September 1 to September 17 (17 days) —22,400,000 shares;<br />
—period from September 18 to August 31 (348 days) —27,500,000 shares.<br />
Note 7 CASH AND CASH EQUIVALENTS<br />
(in thousand EEK)<br />
The Group Parent Company<br />
31.08.2004 31.08.2003 31.08.2004 31.08.2003<br />
Cash at bank and in hand .................................. 226,135 73,076 162,616 47,751<br />
Short-term deposits ...................................... 140,533 158,748 8,604 94,689<br />
TOTAL ............................................... 366,668 231,824 171,220 142,440<br />
Cash at bank and in hand earns interest at floating rates based on daily bank deposit rates (rates in<br />
2003/2004 were in the range of 0.25-2.95% and in 2002/2003 in the range of 0.25-4.10%). Short-term deposits<br />
are made for varying periods of between one month and six months depending on bank loan repayments.<br />
For the purpose of the Cash Flow Statement, the amount of cash and cash equivalents is equal to the amount<br />
of cash and cash equivalents recorded in the Balance Sheet.<br />
Note 8 TRADE RECEIVABLES<br />
(in thousand EEK)<br />
The Group Parent Company<br />
31.08.2004 31.08.2003 31.08.2004 31.08.2003<br />
Trade receivable ........................................ 141,535 108,356 52,896 44,119<br />
Allowance for uncollectible receivables ...................... (1,911) (707) (340) (565)<br />
TOTAL ............................................... 139,624 107,649 52,556 43,554<br />
F-48
FINANCIAL STATEMENTS FOR THE FINANCIAL YEAR ENDED AUGUST 31, 2004<br />
NOTES TO THE FINANCIAL STATEMENTS—(Continued)<br />
Note 9 OTHER RECEIVABLES AND PREPAID EXPENSES<br />
(in thousand EEK)<br />
The Group Parent Company<br />
31.08.2004 31.08.2003 31.08.2004 31.08.2003<br />
Amount owed by subsidiaries .............................. 0 0 212,019 161,996<br />
Amount owed by associate ................................ 1,846 112 1,538 95<br />
Other receivables ........................................ 37,921 18,078 28,053 12,479<br />
Accrued interest income .................................. 413 218 0 0<br />
Prepaid expenses ........................................ 39,337 25,899 18,675 21,125<br />
TOTAL ............................................... 79,517 44,307 260,285 195,695<br />
See information about the amounts owed by subsidiaries and associates in Note 20.<br />
As of August 31, 2004 and 2003 the balance of other receivables consists mostly of sold goods’ commission<br />
receivable for last 5 months and the balance of prepaid expenses mostly includes prepayments for insurance and<br />
port fees.<br />
As of August 31, 2004 the balance of other receivables includes also a receivable from the Port of Tallinn<br />
for a landing-stage organised by the Group in the amount of EEK 15,636 thousands.<br />
As of August 31, 2003 the balance of prepaid expenses includes also expenses related to issuing new shares<br />
in the amount of EEK 7,184 thousands, which were recorded as a reduction of share premium in September<br />
2003. See more information about issuing new shares in Note 18.<br />
Note 10 INVENTORIES<br />
(in thousand EEK)<br />
The Group Parent Company<br />
31.08.2004 31.08.2003 31.08.2004 31.08.2003<br />
Rawmaterials(atcost) ................................... 13,118 4,653 6,191 2,293<br />
Goods for sale (at cost) ................................... 70,996 45,845 32,689 25,994<br />
Prepayments to suppliers .................................. 439 970 407 705<br />
TOTAL ............................................... 84,553 51,468 39,287 28,992<br />
F-49
FINANCIAL STATEMENTS FOR THE FINANCIAL YEAR ENDED AUGUST 31, 2004<br />
NOTES TO THE FINANCIAL STATEMENTS—(Continued)<br />
Note 11 INVESTMENTS IN SUBSIDIARIES<br />
(in thousand EEK)<br />
Name of subsidiary<br />
Country of<br />
incorporation<br />
% equity interest<br />
Aug 31, 2004 Aug 31, 2003<br />
Equity in thousands EEK<br />
Aug 31, 2004 Aug 31, 2003<br />
Hansaliin OÜ ............................. Estonia 100 100 88 42<br />
HT Kinnisvara OÜ ......................... Estonia 100 100 2,270 1,237<br />
<strong>Tallink</strong> Duty Free AS ....................... Estonia 100 100 3,155 2,830<br />
HT Hulgi Tolliladu AS ................... Estonia 100 100 317 322<br />
HT Laevateenindus OÜ ..................... Estonia 100 100 2,545 1,563<br />
HT Meelelahutus OÜ ....................... Estonia 100 100 4,585 1,586<br />
<strong>Tallink</strong> AS ............................... Estonia 100 100 (50,728) 410<br />
Hansatee Cargo AS ........................ Estonia 100 100 1,637 49,997<br />
TLGHotellOÜ ........................... Estonia 100 100 9,147 40<br />
<strong>Tallink</strong> Sverige AB ...................... Sweden 100 100 2,542 1,763<br />
<strong>Tallink</strong> Finland OY ........................ Finland 100 100 9,270 8,439<br />
Kapella Shipping Ltd. ...................... Bahama 100 100 40,979 35,593<br />
<strong>Tallink</strong> Line Ltd. .......................... Cyprus 100 100 316,915 250,270<br />
Tallinn—HelsinkiLineLtd. ................. Cyprus 100 100 45,850 34,579<br />
Vana Tallinn Line Ltd. ..................... Cyprus 100 100 345,866 288,378<br />
<strong>Tallink</strong> Fast Ltd. ........................... Cyprus 100 100 297,005 242,975<br />
<strong>Tallink</strong> Ltd. .............................. Cyprus 100 100 280,929 154,946<br />
Tallinn Swedish Line Ltd. ................... Cyprus 100 100 120,929 69,525<br />
Tallinn Stockholm Line Ltd. ................. Cyprus 100 100 111,006 58,113<br />
<strong>Tallink</strong> Victory Line Ltd. .................... Cyprus 100 100 81,445 (28)<br />
Hansalink Ltd ............................. Cyprus 100 100 144,087 111,482<br />
<strong>Tallink</strong>-Ru OOO ........................ Russia 100 0 37 0<br />
<strong>Tallink</strong> Autoexpress Ltd. .................. Cyprus 100 0 22,384 0<br />
<strong>Tallink</strong> High Speed Ltd ................... Cyprus 100 0 (731) 0<br />
<strong>Tallink</strong> Travel Club OÜ .................. Estonia 100 0 766 0<br />
HT Hulgi Tolliladu AS is a subsidiary of <strong>Tallink</strong> Duty Free AS<br />
<strong>Tallink</strong> Sverige AB is a subsidiary of Hansatee Cargo AS<br />
Acquisitions of subsidiaries<br />
In April 2004 <strong>Tallink</strong> <strong>Grupp</strong> AS established a new subsidiary OOO <strong>Tallink</strong>-Ru with 100% of the ownership. The payment into the share<br />
capital in the amount of EEK 5 thousand was made in May 2004. The new subsidiary has been registered in Russia and was established<br />
as a ticket sales agent.<br />
In January 2004 <strong>Tallink</strong> <strong>Grupp</strong> AS established a new subsidiary <strong>Tallink</strong> Autoexpress Limited with 100% of the ownership. The payment<br />
into the share capital in the amount of EEK 27 thousand was made in August 2004. The new subsidiary has been registered in Cyprus<br />
and was established for future ship owning purpose.<br />
In February 2004 <strong>Tallink</strong> <strong>Grupp</strong> AS established a new subsidiary <strong>Tallink</strong> High Speed Limited with 100% of the ownership. The payment<br />
into the share capital in the amount of EEK 27 thousand was made in August 2004. The new subsidiary has been registered in Cyprus<br />
and was established for future ship owning purpose.<br />
In December 2003 <strong>Tallink</strong> <strong>Grupp</strong> AS purchased 100% of shares of Downtown Travel Club OÜ (renamed to <strong>Tallink</strong> Travel Club OÜ on<br />
March 1, 2004) from Infortar AS (the parent company of the group). The purchase price was EEK 800 thousand . EEK 754 thousand of<br />
the purchase price was offset between <strong>Tallink</strong> <strong>Grupp</strong>, Infortar and Downtown Travel Club OÜ and the remaining part<br />
(EEK 46 thousand) was paid in cash. The new subsidiary operates as a travel agent company.<br />
The fair values of the identifiable assets and liabilities of <strong>Tallink</strong> Travel Club OÜ at the date of acquisition<br />
are as follows:<br />
Short-term receivables ..................... 754 Payables to <strong>Tallink</strong> <strong>Grupp</strong> ............... (14)<br />
Equipment ............................... 13 Short-term payables .................... (2)<br />
767 (16)<br />
Fair value of net assets .................... 751<br />
Goodwill 1 ............................... 49<br />
Consideration ........................... 800<br />
1 Goodwill arising from the purchase of the new subsidiary was expensed immediately as an immaterial item.<br />
Assets and liabilities of <strong>Tallink</strong> Travel Club OÜ as of August 31, 2004 and its income and expenses for the<br />
period of January 2004 to August 2004 do not influence the financial position of the group at the reporting date<br />
and results of the group for the reporting period significantly.<br />
F-50
FINANCIAL STATEMENTS FOR THE FINANCIAL YEAR ENDED AUGUST 31, 2004<br />
NOTES TO THE FINANCIAL STATEMENTS—(Continued)<br />
Note 11 INVESTMENTS IN SUBSIDIARIES (Continued)<br />
Book<br />
value<br />
31.08.2004<br />
Gain/loss<br />
under equity<br />
Book<br />
value<br />
Acquisition<br />
cost<br />
method<br />
Additions<br />
during<br />
2003/2004<br />
31.08.2003<br />
31.08.2003<br />
Number of<br />
shares<br />
31.08.2004<br />
Additions<br />
during<br />
2003/2004<br />
Number of<br />
shares<br />
31.08.2003<br />
Subsidiary<br />
Hansaliin OÜ ................................................... 1 0 1 40 42 0 46 88<br />
HT Kinnisvara OÜ ............................................... 1 0 1 400 1,237 0 1,033 2,270<br />
<strong>Tallink</strong> Duty Free AS* ............................................ 400 0 400 400 2,830 0 (1,016) 1,814<br />
HT Laevateenindus OÜ ........................................... 1 0 1 400 1,563 0 982 2,545<br />
HT Meelelahutus OÜ ............................................. 1 0 1 400 1,586 0 2,999 4,585<br />
<strong>Tallink</strong> AS* ..................................................... 400 0 400 400 410 0 (48,160) 0<br />
Hansatee Cargo AS* .............................................. 400 0 400 400 49,997 0 (49,997) 0<br />
<strong>Tallink</strong> Finland OY ............................................... 1,500 0 1,500 24,010 8,439 0 831 9,270<br />
Kapella Shipping Ltd ............................................. 5,000 0 5,000 66 35,593 0 5,386 40,979<br />
<strong>Tallink</strong> Line Ltd ................................................. 1,000 0 1,000 48,014 250,270 0 66,645 316,915<br />
Tallinn Helsinki Line Ltd .......................................... 1,000 0 1,000 12,000 34,579 0 11,271 45,850<br />
Vana Tallinn Line Ltd ............................................ 1,000 0 1,000 46,014 288,378 0 57,488 345,866<br />
<strong>Tallink</strong> Fast Ltd .................................................. 1,000 0 1,000 26 242,975 0 54,030 297,005<br />
<strong>Tallink</strong> Ltd ..................................................... 1,000 0 1,000 28 154,946 0 125,983 280,929<br />
Tallinn Swedish Line Ltd .......................................... 1,000 0 1,000 27 69,525 0 51,404 120,929<br />
Tallinn Stockholm Line Ltd ........................................ 1,000 0 1,000 27 58,113 0 52,893 111,006<br />
TLGHotellOÜ.................................................. 1 0 1 40 40 0 9,107 9,147<br />
<strong>Tallink</strong> Victory Line Ltd. ** ........................................ 1,000 0 1,000 27 0 0 81,473 81,445<br />
Hansalink Ltd ................................................... 1,000 0 1,000 367,636 374,123 0 4,957 379,080<br />
<strong>Tallink</strong>-RuOOO ................................................. 0 1 1 0 0 5 32 37<br />
<strong>Tallink</strong> Autoexpress Ltd ........................................... 0 1,000 1,000 0 0 27 22,357 22,384<br />
<strong>Tallink</strong> High Speed Ltd *** ........................................ 0 1,000 1,000 0 0 27 (759) 0<br />
<strong>Tallink</strong> Travel Club OÜ ........................................... 0 1 1 0 0 800 (34) 766<br />
F-51<br />
Total .......................................................... 500,355 1,574,646 859 448,951 2,072,910<br />
* In the parent company’s financial statements receivables from <strong>Tallink</strong> AS in the amount of EEK 47,750 thousands, investment to <strong>Tallink</strong> Duty Free AS (owns a receivable from <strong>Tallink</strong> AS) in the amount of EEK 1,341<br />
thousands and investment to Hansatee Cargo AS (owns receivables from <strong>Tallink</strong> AS) in the amount of EEK 1,637 thousands have been reduced by the negative equity of <strong>Tallink</strong> AS (totalling EEK 50,728 thousands).<br />
** Gain under equity method includes also the reversal of allowance for receivables from <strong>Tallink</strong> Victory Line Ltd in the amount of EEK 28 thousands (negative equity of <strong>Tallink</strong> Victory Line Ltd as of August 31, 2003).<br />
*** The receivable from <strong>Tallink</strong> High Speed Ltd has been reduced by the negative equity of the subsidiary in the amount of EEK 731 thousands.
FINANCIAL STATEMENTS FOR THE FINANCIAL YEAR ENDED AUGUST 31, 2004<br />
Note 12 INVESTMENT IN ASSOCIATE<br />
(in thousand EEK)<br />
NOTES TO THE FINANCIAL STATEMENTS—(Continued)<br />
% equity interest at the beginning of the financial year ..................................<br />
HT Valuuta AS<br />
25<br />
% equity interest at the end of the financial year ........................................ 25<br />
Acquisition cost—Aug 31, 2003 .................................................... 100<br />
Book value—Aug 31, 2003 ....................................................... 1,997<br />
Dividends received ............................................................... (800)<br />
Income under the equity method .................................................... 1,360<br />
Acquisition value—Aug 31, 2004 ................................................... 100<br />
Book value—Aug 31, 2004 ....................................................... 2,557<br />
HT Valuuta AS has been registered in Estonia and its shares are not listed.<br />
Note 13 OTHER LONG TERM FINANCIAL ASSETS<br />
(in thousand EEK)<br />
The Group Parent Company<br />
31.08.2004 31.08.2003 31.08.2004 31.08.2003<br />
Amounts owed by subsidiaries ............................. 0 0 617,627 428,181<br />
Other receivables and prepaid expenses ...................... 2,113 412 2,041 166,532<br />
TOTAL ............................................... 2,113 412 619,668 594,713<br />
As of August 31, 2004 and 2003 other receivables and prepaid expenses of the group included long-term<br />
prepayment (term-less).<br />
For additional information regarding the amounts owed by subsidiaries see Note 20.<br />
As of August 31, 2003 the balance of other receivables and prepaid expenses of the parent company consists<br />
of prepayment made for a new vessel of <strong>Tallink</strong> Victory Line Ltd (subsidiary). In the balance sheet of the group<br />
the specified prepayment has been recorded as a prepayment for tangible fixed assets—see also Note 14.<br />
Note 14 PROPERTY, PLANT AND EQUIPMENT<br />
(in thousand EEK)<br />
The Group<br />
Land and<br />
building Ships<br />
Plant and<br />
equipment<br />
Construction<br />
in<br />
progress Pre-payments Total<br />
Book value at Aug 31, 2003 ......... 8,291 3,523,802 24,246 0 345,745 3,902,084<br />
Additions......................... 4,333 2,626,260 27,268 82,128 (345,525) 2,394,464<br />
Disposals......................... 0 0 (631) 0 0 (631)<br />
Depreciation for the year ............ (1,246) (230,040) (13,693) 0 0 (244,979)<br />
Book value at Aug 31, 2004 ......... 11,378 5,920,022 37,190 82,128 220 6,050,938<br />
At August 31, 2003<br />
—Cost ....................... 13,453 4,195,115 73,143 0 345,745 4,627,456<br />
—Accumulated depreciation ..... (5,162) (671,313) (48,897) 0 0 (725,372)<br />
At August 31, 2004<br />
—Cost ....................... 17,516 6,801,988 91,558 82,128 220 6,993,410<br />
—Accumulated depreciation ..... (6,138) (881,966) (54,368) 0 0 (942,472)<br />
F-52
FINANCIAL STATEMENTS FOR THE FINANCIAL YEAR ENDED AUGUST 31, 2004<br />
NOTES TO THE FINANCIAL STATEMENTS—(Continued)<br />
Note 14 PROPERTY, PLANT AND EQUIPMENT—(Continued)<br />
For more information about the leased assets see also Note 16.<br />
During the financial year the company has capitalised borrowing costs as a part of the cost of ships in the<br />
amount of EEK 672 thousands (2002/2003: EEK 12,194 thousands)—100% of interest related to the loans<br />
received to finance the building of vessels (up to the delivery date).<br />
From September 1, 2003 <strong>Tallink</strong> <strong>Grupp</strong> AS changed the accounting estimates related to the depreciation<br />
calculation for each significant part of ships in terms of the estimated useful lives as well as the residual values of<br />
ships’ hulls (Note 2).<br />
Due to changes in useful life and residual value of hull the depreciation charge decreased by EEK 63,480<br />
thousands during the year 2003/2004 (compared with previous year). In the interim consolidated condensed<br />
financial statements for the 3- and 6-months periods ended respectively November 30, 2003 and February 29,<br />
2004 the previous estimates were used in calculation of depreciation charges.<br />
Pledged property, plant and equipment<br />
Most of group’s ships are subject to a first or second mortgage to secure group’s bank loans.<br />
Book value of Market value* of<br />
As of August 31, 2004 Loan balance collateral** collateral<br />
Ships .................................................. 4,034,475 5,991,839 6,626,352<br />
* Average of 2 shipbrokers quotes as of August 31, 2004<br />
Parent Company<br />
Land and<br />
building<br />
Plant and<br />
equipment<br />
Other<br />
equipment Ships Total<br />
Book value at Aug 31, 2003 ................... 2,883 10,073 2,405 2,832,210 2,847,571<br />
Additions .................................. 4,234 1,108 9,991 235,995 251,328<br />
Depreciation for the year ...................... (284) (4,074) (1,966) (436,285) (442,609)<br />
Book value at Aug 31, 2004 ................... 6,833 7,107 10,430 2,631,920 2,656,290<br />
At August 31, 2003<br />
—Cost ................................. 3,634 28,108 7,802 3,850,629 3,890,173<br />
—Accumulated depreciation ............... (751) (18,035) (5,397) (1,018,419) (1,042,602)<br />
At August 31, 2004<br />
—Cost ................................. 7,868 29,048 16,443 4,067,236 4,120,595<br />
—Accumulated depreciation ............... (1,035) (21,941) (6,013) (1,435,316) (1,464,305)<br />
The parent company has only leased ships (from its subsidiaries). For more information about the leased<br />
assets see also Note 16.<br />
Note 15 INTANGIBLE ASSETS<br />
(in thousand EEK)<br />
The Group<br />
Goodwill<br />
Patents and<br />
licences<br />
Development<br />
costs Total<br />
Book value at Aug 31, 2003 ............................. 194,056 587 7,379 202,022<br />
Additions ............................................. 0 3,202 0 3,202<br />
Amortization for the year ................................ (20,908) (811) (7,062) (28,781)<br />
Book value at Aug 31, 2004 ............................. 173,148 2,978 317 176,443<br />
At August 31, 2003<br />
Cost ............................................. 208,821 2,112 33,206 244,139<br />
Accumulated amortization ........................... (14,765) (1,525) (25,827) (42,117)<br />
At August 31, 2004<br />
Cost ............................................. 203,706 5,314 7,379 216,399<br />
Accumulated amortization ........................... (30,558) (2,336) (7,062) (39,956)<br />
F-53
FINANCIAL STATEMENTS FOR THE FINANCIAL YEAR ENDED AUGUST 31, 2004<br />
NOTES TO THE FINANCIAL STATEMENTS—(Continued)<br />
Note 15 INTANGIBLE ASSETS (Continued)<br />
Parent Company<br />
Patents and<br />
licences Total<br />
Book value at Aug 31, 2003 ................................................... 0 0<br />
Additions .................................................................. 2,768 2,768<br />
Amortization for the year ...................................................... (251) (251)<br />
Book value at Aug 31, 2004 ................................................... 2,517 2,517<br />
At August 31, 2004<br />
Cost .................................................................. 2,768 2,768<br />
Accumulated amortization ................................................. (251) (251)<br />
Note 16 INTEREST BEARING LOANS AND BORROWINGS<br />
(in thousand EEK)<br />
The Group<br />
At August 31, 2004 Maturity<br />
Short-term<br />
portion<br />
Long-term<br />
portion<br />
Total<br />
borrowings<br />
Obligation under finance lease .......................... 2008 380 1,397 1,777<br />
Long-term secured bank loans** ........................ 2004-2014 602,261 3,432,214 4,034,475<br />
Other long-term secured loans .......................... 2007 48,766 49,764 98,530<br />
Bonds ............................................. 2004 99,310 0 99,310<br />
Total .............................................. 750,717 3,483,375 4,234,092<br />
At August 31, 2003 Maturity<br />
Short-term<br />
portion<br />
Long-term<br />
portion<br />
Total<br />
borrowings<br />
Obligation under finance lease .......................... 2008 253 1,671 1,924<br />
Long-term secured bank loans** ........................ 2003-2014 396,621 2,046,983 2,443,604<br />
Other long-term secured loans .......................... 2007-2011 197,350 74,646 271,996<br />
Bonds ............................................. 2004 76,487 0 76,487<br />
Total .............................................. 670,711 2,123,300 2,794,011<br />
Parent Company<br />
At August 31, 2004 Maturity<br />
Short-term<br />
portion<br />
Long-term<br />
portion<br />
Total<br />
borrowings<br />
Obligation under finance lease .......................... 2005-2014 448,991 2,173,694 2,622,685<br />
Long-term secured bank loans .......................... 2006-2008 69,424 81,299 150,723<br />
Bonds ............................................. 2004 99,310 0 99,310<br />
Long-term loan Vana Tallinn Ltd ........................ 2005 0 50,441 50,441<br />
Total .............................................. 617,725 2,305,434 2,923,159<br />
At August 31, 2003 Maturity<br />
Short-term<br />
portion<br />
Long-term<br />
portion<br />
Total<br />
borrowings<br />
Obligation under finance lease .......................... 2005-2014 427,756 2,420,744 2,848,500<br />
Long-term secured bank loans .......................... 2003-2006 69,424 307,189 376,613<br />
Bonds ............................................. 2004 76,487 0 76,487<br />
Long-term loan from Vana Tallinn Line Ltd. ............... 2005 0 54,572 54,572<br />
Total .............................................. 573,667 2,782,505 3,356,172<br />
F-54
FINANCIAL STATEMENTS FOR THE FINANCIAL YEAR ENDED AUGUST 31, 2004<br />
NOTES TO THE FINANCIAL STATEMENTS—(Continued)<br />
Note 16 INTEREST BEARING LOANS AND BORROWINGS (Continued)<br />
* The group is allowed to use bank overdraft with limitation of EEK 200,000 thousand (including EEK 150,000 thousand granted to the<br />
parent company) and EUR 1,009 thousand . Bank overdrafts are secured with commercial pledge (in the total amount of<br />
EEK 151,250 thousand) and ship mortgages. In 2003/2004 the average effective interest rate of bank overdrafts is EURIBOR+2.17% for<br />
overdrafts from Estonian commercial banks and EURIBOR+1.25% from Finnish commercial bank. As of August 31, 2004 and 2003<br />
there were no outstanding overdraft balances.<br />
* In 2003/2004 the weighted average interest rate of secured bank loan was EURIBOR +1.44% (EURIBOR + 1.34% for the parent company).<br />
* Interest rates of other secured loans, which is a loan from the parent company of the group—Infortar—in the amount of EEK 98,530<br />
thousands at August 31, 2004, has a fixed interest rate 7%.<br />
* As of August 31, 2004 bonds with the book value of EEK 99,310 thousands (as at Aug 31, 2003: EEK 76,487 thousands) have the fixed<br />
interest rate of 0%. The total nominal value of these bonds is EEK 100,000 thousands (2003: EEK 80,390 thousands). The difference<br />
between the nominal value and the received amount is expensed during the loan period—it means that average effective interest rate is<br />
approx. 3.0% (2003: 6.6%).<br />
* Interest rate of long-term loan from Vana Tallinn Line Ltd is 0%. In the opinion of the management of <strong>Tallink</strong> <strong>Grupp</strong> there is not a<br />
material impact on the financial statements from not using the effective interest rate, as Vana Tallinn Line Ltd is a subsidiary of <strong>Tallink</strong><br />
<strong>Grupp</strong> AS. Therefore, the specified loan carrying amount has not been corrected based on the effective interest rate in the both<br />
companies’ financial statements.<br />
* Lease liability of the group as of August 31, 2004 is related to office equipment in Sweden. Lease liability of the parent company is<br />
related to the charters of ships from its subsidiaries. The future minimum lease payments under finance lease and the present value (PV)<br />
of the net minimum lease payments are as follows:<br />
The Group<br />
minimum<br />
payments<br />
2003/2004 2002/2003<br />
PV of<br />
payments minimum<br />
payments<br />
PV of<br />
payments<br />
Within one year ........................................... 406 380 270 253<br />
After 1 year, but not more than 5 years ......................... 1,492 1,397 1,785 1,671<br />
Total minimum lease payments ............................... 1,898 2,055<br />
Future financial charges ..................................... (121) (131)<br />
PV of minimum lease payments ............................... 1,777 1,777 1,924 1,924<br />
Book value of leased assets as at August 31, 2003 ......................................... 1,909<br />
Additions, incl. exchange rate difference ................................................. 451<br />
Depreciation for the financial year ...................................................... (682)<br />
Book value of leased assets as at August 31, 2004 ......................................... 1,678<br />
—atcosts ...................................................................... 3,024<br />
—accumulated depreciation ....................................................... (1,346)<br />
Parent Company<br />
minimum<br />
payments<br />
2003/2004 2002/2003<br />
PV of<br />
payments<br />
minimum<br />
payments<br />
PV of<br />
payments<br />
Within one year ...................................... 569,870 448,991 597,812 427,756<br />
After 1 year, but not more than 5 years .................... 1,392,513 1,069,585 1,443,419 1,078,529<br />
More than 5 years .................................... 1,237,805 1,104,109 1,537,635 1,342,216<br />
Total minimum lease payments ......................... 3,200,188 3,578,866<br />
Future financial charges ............................... (577,503) (730,365)<br />
PV of minimum lease payments ......................... 2,622,685 2,622,685 2,848,501 2,848,501<br />
Book value of leased assets as at August 31, 2003 ....................................... 2,815,303<br />
Additions......................................................................... 233,794<br />
Depreciation for the financial year ..................................................... (420,821)<br />
Book value of leased assets as at August 31, 2004 ....................................... 2,628,276<br />
—atcosts .................................................................... 4,054,452<br />
—accumulated depreciation ...................................................... (1,426,176)<br />
For additional information about currency structure of borrowings see Note 21.<br />
F-55
FINANCIAL STATEMENTS FOR THE FINANCIAL YEAR ENDED AUGUST 31, 2004<br />
NOTES TO THE FINANCIAL STATEMENTS—(Continued)<br />
Note 17 OTHER PAYABLES AND DEFERRED INCOME<br />
(in thousand EEK)<br />
The Group Parent Company<br />
31.08.2004 31.08.2003 31.08.2004 31.08.2003<br />
Customers’ prepayments .................................. 25,585 14,229 3,080 1,533<br />
Payables to subsidiaries ................................... 0 0 579,063 531,852<br />
Payables to associates .................................... 147 0 147 0<br />
Other payables .......................................... 2,865 386 843 94<br />
Payables to employees .................................... 53,848 36,162 7,210 6,087<br />
Interests payable ........................................ 50,228 28,153 726 1,535<br />
Other accruals .......................................... 7,298 1,364 0 62<br />
TOTAL ............................................... 139,971 80,294 591,069 541,163<br />
* See Note 20 for more information about payables to subsidiaries.<br />
Note 18 SHARE CAPITAL<br />
(in thousand EEK)<br />
31.08.2004 31.08.2003<br />
Ordinary shares of EEK 10 each (thousands pcs) ................................. 27,500 22,400<br />
The number of shares issued and fully paid (thousands pcs) ......................... 27,500 22,400<br />
Share capital .............................................................. 275,500 224,000<br />
Share premium per share in EEK .............................................. 15.09 3.09<br />
Totalsharepremium........................................................ 414,870 69,223<br />
According to the Articles of Association the maximum number of authorized common shares is 89,600,000.<br />
According to AS <strong>Tallink</strong> <strong>Grupp</strong> Shareholders’ Extraordinary General Meeting on September 15, 2003 AS<br />
<strong>Tallink</strong> <strong>Grupp</strong> increased the share capital from EEK 224,000 th to EEK 275,000 th by issuing 5,100,000 new<br />
shares with the par value of 10 kroons each. The new shares were issued at a premium of EEK 72.14 per share.<br />
The payment for new shares was made on September 18, 2003. The share premium has been reduced by the<br />
expenses related to the issuing of shares in the total amount of EEK 22,267 thousands.<br />
During the financial year 2002/2003 AS <strong>Tallink</strong> Group repurchased its shares for EEK 4,599 thousand and<br />
sold these with the same price.<br />
Note 19 COMMITMENTS AND CONTINGENCIES<br />
(in thousand EEK)<br />
Legal claim<br />
Tallinna Sadam AS has filed a claim to Tallinn City Court against Hansatee Cargo AS to claim cargo fees<br />
payable in the port of Paldiski in the amount of EEK 4,943 thousands. In the opinion of the management of<br />
Hansatee Cargo AS the claim was unfounded. The parties settled the dispute at court and it was accepted by<br />
Tallinn City Court with the ruling issued on February 13, 2004. According to the settlement AS Hansatee Cargo<br />
paid a one-time compensation to AS Tallinna Sadam in the amount of EEK 3,900 thousands, which was already<br />
expensed in 2002/2003.<br />
Income tax on dividends<br />
The group’s retained earnings as at August 31, 2004 were 1,465,007 (as at August 31, 2003—<br />
EEK 1,157,084 thousand). The maximum possible income tax liability as at August 31, 2004, which would<br />
become payable if retained earnings were fully distributed and all shareholders belonged to the taxable category,<br />
is 351,062 (as at August 31, 2003 — EEK 300,842) thousand . Accordingly, it would be possible to pay out to<br />
the shareholders 1,113,945 (2003: EEK 856,242 thousand), net of tax.<br />
F-56
FINANCIAL STATEMENTS FOR THE FINANCIAL YEAR ENDED AUGUST 31, 2004<br />
NOTES TO THE FINANCIAL STATEMENTS—(Continued)<br />
Note 19 COMMITMENTS AND CONTINGENCIES (Continued)<br />
Off-balance sheet guarantees<br />
• <strong>Tallink</strong> <strong>Grupp</strong> AS has given a guarantee in the maximum amount of 10,010,000 SEK to Eesti Ühispank<br />
related to Swedish subsidiary. Due date is October 14, 2005.<br />
• <strong>Tallink</strong> <strong>Grupp</strong> AS has given guarantees to HSH Nordbank AG (ex Hamburgische Landesbank) and<br />
Nordea Bank Plc for the loans granted to its overseas subsidiaries amounting to EEK 3,883,752<br />
thousands. The primary securities for these loans are the pledge of shares of the overseas subsidiaries<br />
and mortgages on the ships belonging to the above-mentioned subsidiaries.<br />
• <strong>Tallink</strong> <strong>Grupp</strong> AS has given a guarantee to Nordea Bank for the overdraft granted to its Finnish<br />
subsidiary. At August 31, 2004 the overdraft amounted to zero.<br />
• <strong>Tallink</strong> <strong>Grupp</strong> AS has given a guarantee in the amount of EEK 1,000 thousands and EUR 5 thousands to<br />
Eesti Ühispank related to Vaba Maa AS. Due date is July 1, 2005.<br />
• <strong>Tallink</strong> <strong>Grupp</strong> AS has given a guarantee in the amount of EUR 145 thousands to Eesti Ühispank related<br />
to Hakan Wilhelm Nordström. Due date is December 12, 2005.<br />
Non-cancellable operating leases<br />
On October 1, 2003 the group concluded a non-cancellable lease agreement for the hotel building. The lease<br />
period of 10 years started on May 2004. The group also has the option to renew the agreement for a further 5<br />
years. The annual non-cancellable lease payments will be in the range of EEK 36,000 thousands to EEK 45,000<br />
thousands (depends on the result of the hotel’s operations).<br />
Note 20 RELATED PARTY DISCLOSURES<br />
(in thousand EEK)<br />
The following transactions have been entered into with related parties.<br />
The Group<br />
2003/2004 or 31.08.2004<br />
Sales to related<br />
party<br />
Purchases from<br />
related parties<br />
Amounts owed<br />
by related parties<br />
Amounts owed<br />
to related parties<br />
ASInfortar ............................. 37 6,424 0 100,005<br />
AS Infortar, guarantee payments ............ 0 1,159 0 0<br />
AS Infortar, interest expense ............... 0 7,422 0 1,188<br />
AS Vaba Maa ........................... 0 1,620 0 565<br />
ASHTValuuta ......................... 12,186 0 1,835 147<br />
AS HT Valuuta, interest revenue ............ 0 57 11 0<br />
2002/2003 or 31.08.2003<br />
ASInfortar ............................. 0 6,489 0 118,520<br />
AS Infortar, purchase of shares* ............ 0 298,000 0 0<br />
AS Infortar, interest expense ............... 0 8,559 0 3,212<br />
ASHTValuuta ......................... 281 0 112 0<br />
AS HT Valuuta, interest revenue ............ 57 0 12 0<br />
Compo Investeeringud OÜ** .............. 1,564 0 0 0<br />
Hansalink Ltd, payments of lease*** ........ 0 37,895 0 0<br />
* the shares of HTG Partner AS (associated company) were sold in February 2003 to Compo Investeeringud OÜ.<br />
** before the acquisition of the shares of Hansalink Ltd.<br />
AS Infortar<br />
AS Infortar owns 55.53% of the shares of AS <strong>Tallink</strong> <strong>Grupp</strong><br />
F-57
FINANCIAL STATEMENTS FOR THE FINANCIAL YEAR ENDED AUGUST 31, 2004<br />
NOTES TO THE FINANCIAL STATEMENTS—(Continued)<br />
Note 20 RELATED PARTY DISCLOSURES (Continued)<br />
AS HT Valuuta<br />
AS <strong>Tallink</strong> Group owns 25% of the shares of AS HT Valuuta<br />
AS Vaba Maa<br />
AS Vaba Maa is a subsidiary of Infortar AS<br />
Hansalink Ltd.<br />
AS Infortar owned 100% of the shares in Hansalink Ltd. In February 2003 <strong>Tallink</strong> <strong>Grupp</strong> AS purchased<br />
100% of the voting shares of Hansalink Ltd from Infortar AS.<br />
Prices used in sales to and purchases from related parties of the group do not significantly differ from<br />
normal market prices.<br />
Parent Company<br />
Sales 2003/04.a. 2002/03.a.<br />
ASInfortar(parent) ......................................................... 0 298,000<br />
AS Hansatee Cargo (subsidiary) ............................................... 224,633 280,639<br />
AS <strong>Tallink</strong> (subsidiary) ...................................................... 52,667 0<br />
AS Hansaliin (subsidiary) .................................................... 5,583 5,441<br />
AS HT Laevateenindus (subsidiary) ............................................ 2,175 1,884<br />
AS HT Meelelahutus (subsidiary) .............................................. 0 5<br />
AS <strong>Tallink</strong> Duty Free (subsidiary) .............................................. 8 1,375<br />
<strong>Tallink</strong> Finland OY (subsidiary) ............................................... 189 251<br />
ASHTValuuta(associate) ................................................... 1,035 55<br />
Compo Investeeringud OÜ (see Note 20/group) ................................... 0 1,564<br />
Purchases 2003/04.a. 2002/03.a.<br />
ASInfortar(parent) ......................................................... 720 720<br />
AS Vaba Maa (subsidiary of AS Infortar) ........................................ 1,335 0<br />
AS Hansatee Cargo (subsidiary) ............................................... 330 715<br />
AS Hansaliin (subsidiary) .................................................... 126,013 118,427<br />
AS HT Laevateenindus (subsidiary) ............................................ 143,196 126,340<br />
AS HT Meelelahutus (subsidiary) .............................................. 30,917 32,030<br />
ASHTKinnisvara(subsidiary) ................................................ 4,172 2,903<br />
AS <strong>Tallink</strong> Duty Free (subsidiary) .............................................. 348,685 516,180<br />
OÜ <strong>Tallink</strong> Travel Club (subsidiary) ............................................ 1,377 0<br />
OÜTLGHotell(subsidiary) .................................................. 60 0<br />
<strong>Tallink</strong> Finland OY (subsidiary) ............................................... 118,132 93,880<br />
<strong>Tallink</strong>-RuOOO(subsidiary) ................................................. 125 0<br />
<strong>Tallink</strong> Ltd (subsidiary) ...................................................... 257,700 256,996<br />
Tallinn Swedish Line Ltd (subsidiary) .......................................... 101,007 100,731<br />
Vana Tallinn Line Ltd (subsidiary) ............................................. 79,115 79,037<br />
<strong>Tallink</strong> Line Ltd (subsidiary) .................................................. 94,424 94,200<br />
<strong>Tallink</strong> Autoexpress Ltd (subsidiary) ........................................... 38,303 0<br />
<strong>Tallink</strong> Fast Ltd (subsidiary) .................................................. 80,039 80,039<br />
Kapella Shipping Ltd (subsidiary) .............................................. 5,727 17,331<br />
Hansalink Ltd (subsidiary)* ................................................... 42,950 84,454<br />
* including lease payments and interest expenses until 28.02.2003 and charter hire from 01.03.2003-31.08.2003<br />
F-58
FINANCIAL STATEMENTS FOR THE FINANCIAL YEAR ENDED AUGUST 31, 2004<br />
NOTES TO THE FINANCIAL STATEMENTS—(Continued)<br />
Note 20 RELATED PARTY DISCLOSURES (Continued)<br />
Balances between subsidiaries and associates<br />
31.08.2004 31.08.2003<br />
Short-term receivables from subsidiaries<br />
Tallinn Stockholm Line Ltd (subsidiary)—prepayment ............................. 12,936 23,233<br />
Tallinn Swedish Line Ltd (subsidiary)—prepayment ............................... 0 8,504<br />
<strong>Tallink</strong> Finland OY (subsidiary)—for services ................................... 15,978 14,866<br />
AS HT Kinnisvara (subsidiary)—for services .................................... 3,808 3,548<br />
OÜ TLG Hotell (subsidiary)—for services ...................................... 300 0<br />
<strong>Tallink</strong> Ltd (subsidiary)—loan (6%, maturity—2014) .............................. 501 20,000<br />
<strong>Tallink</strong> Ltd (subsidiary)—interest ............................................. 2,200 2,284<br />
<strong>Tallink</strong> Line Ltd (subsidiary)—loan (12%, maturity—2005) ......................... 0 68,595<br />
<strong>Tallink</strong> Line Ltd (subsidiary)—interest ......................................... 0 699<br />
<strong>Tallink</strong> Victory line Ltd (subsidiary)* .......................................... 147,320 20,268<br />
<strong>Tallink</strong> High Speed Line Ltd (subsidiary)—prepayment ............................ 3,787 0<br />
<strong>Tallink</strong> Autoexpress Line Ltd (subsidiary)—prepayment ............................ 5,056 0<br />
Tallinn—Helsinki Line Ltd (subsidiary)—prepayment ............................. 19,633 0<br />
<strong>Tallink</strong>-Ru OOO (subsidiary)—for services ...................................... 500 0<br />
Totalsubsidiaries .......................................................... 212,019 161,996<br />
Short-term receivables from associates<br />
AS HT Valuuta—for services ................................................. 1,527 85<br />
AS HT Valuuta—interest .................................................... 11 10<br />
Totalassociates............................................................ 1,538 95<br />
Long-term receivables from subsidiaries<br />
Victory Line Ltd (subsidiary)* ............................................... 496,630 0<br />
<strong>Tallink</strong> Ltd (subsidiary)—loan (6%, maturity—2014) .............................. 120,997 428,181<br />
Totalsubsidiaries .......................................................... 617,627 428,181<br />
Short-term liabilities to subsidiaries<br />
AS Infortar (parent)—for services ............................................. 71 71<br />
AS Vaba Maa (subsidiary of AS Infortar)—for services ............................ 565 0<br />
Totalparent............................................................... 636 71<br />
OÜ <strong>Tallink</strong> Travel Club (subsidiary)—for services ................................ 544 0<br />
AS Hansatee Cargo (subsidiary)—for services ................................... 50,035 118,339<br />
<strong>Tallink</strong> Fast Ltd (subsidiary)—for services ...................................... 152,605 112,801<br />
Kapella Shipping Ltd (subsidiary)—for services .................................. 31,588 26,021<br />
Vana Tallinn Line Ltd (subsidiary)—for services ................................. 205,035 159,346<br />
Tallinn Helsinki Line Ltd (subsidiary)—for services ............................... 0 34,579<br />
Hansalink Ltd (subsidiary)—for services ........................................ 90,491 80,766<br />
<strong>Tallink</strong> Line Ltd (subsidiary)—for services ...................................... 16,334 0<br />
Tallinn Swedish Line Ltd (subsidiary)—for services ............................... 32,431 0<br />
Totalsubsidiaries .......................................................... 579,063 531,852<br />
Long-term liabilities to subsidiaries<br />
Vana Tallinn Line Ltd (subsidiary)—loan (see Note 16) ............................ 50,441 54,572<br />
Totalsubsidiaries .......................................................... 50,441 54,572<br />
* Receivable from <strong>Tallink</strong> Victory Line Ltd arose due to payments regarding a new vessel made by the parent company. Interest rate of<br />
this receivable is 0%. In the opinion of the management of <strong>Tallink</strong> <strong>Grupp</strong> there is not a material impact on the financial statements from<br />
not using the effective interest rate, as <strong>Tallink</strong> Victory Line Ltd is a subsidiary of <strong>Tallink</strong> <strong>Grupp</strong> AS. Therefore, the specified loan<br />
carrying amount has not been corrected based on the effective interest rate in either company’s financial statements. The payment<br />
schedule for this receivable is not agreed. The split between current and non-current assets has been made based on the estimation of the<br />
group’s management on the actual payments in 2004/2005.<br />
F-59
FINANCIAL STATEMENTS FOR THE FINANCIAL YEAR ENDED AUGUST 31, 2004<br />
NOTES TO THE FINANCIAL STATEMENTS—(Continued)<br />
Note 20 RELATED PARTY DISCLOSURES (Continued)<br />
Directors’ remuneration<br />
The executive members of the Management Board received a remuneration totalling EEK 10,147 thousand<br />
(2003—EEK 10,551 thousand ). The executive members of the Management Board do not receive pension<br />
entitlements from the group.<br />
Termination benefits<br />
Some members of Management Board have right to termination benefits. The maximum amount is<br />
EEK 6,480 thousands.<br />
Note 21 FINANCIAL INSTRUMENTS<br />
(in thousand EEK)<br />
The management of financial risks is centralised in the group’s financial department, which is responsible<br />
for all borrowings within the group as well as all exposure linked to the currency, interest, liquidity and bunker<br />
price risks.<br />
Currency risk<br />
About 18% of the group’s total revenues are in SEK. The group seeks to minimise currency transactions risk<br />
through matching foreign currency inflows with outflows. The group’s other transactional currency exposure is<br />
to the US dollar for the purchase of ship fuel and insurance. The net open position in the currency exposure is not<br />
hedged by derivative financial instruments at the end of financial year.<br />
August 31, 2004 EEK, EUR* USD SEK Total<br />
Cash and cash equivalents .................................. 336,713 0 29,955 366,668<br />
Trade receivables ......................................... 100,455 0 39,169 139,624<br />
Other financial assets ..................................... 29,574 0 18,231 47,805<br />
Total financial assets ...................................... 466,742 0 87,355 554,097<br />
Current portion of borrowings .............................. 750,337 0 380 750,717<br />
Trade payables ........................................... 260,090 2,313 18,028 280,431<br />
Other current financial liabilities ............................ 171,723 0 13,442 185,165<br />
Non-current borrowings ................................... 3,481,978 0 1,397 3,483,375<br />
Total financial liabilities ................................... 4,664,128 2,313 33,247 4,699,688<br />
Currency net position ..................................... (4,197,386) (2,313) 54,108 (4,145,591)<br />
August 31, 2003 EEK, EUR* USD SEK Total<br />
Cash and cash equivalents .................................. 221,147 0 10,677 231,824<br />
Trade receivables ......................................... 79,830 0 27,819 107,649<br />
Other financial assets ..................................... 10,224 0 16,001 26,225<br />
Total financial assets ...................................... 311,201 0 54,497 365,698<br />
Current portion of borrowings .............................. 670,458 0 253 670,711<br />
Trade payables ........................................... 148,887 1,465 25,761 176,113<br />
Other current financial liabilities ............................ 85,103 0 6,808 91,911<br />
Non-current borrowings ................................... 2,121,629 0 1,671 2,123,300<br />
Total financial liabilities ................................... 3,026,077 1,465 34,493 3,062,035<br />
Currency net position ..................................... (2,714,876) (1,465) 20,004 (2,696,337)<br />
* as the exchange rate between EEK and EUR has been fixed, monetary assets and liabilities nominated in EEK and in EUR have been<br />
presented together. This column includes also RUR denominated financial assets and liabilities, as these amounts are very immaterial.<br />
F-60
FINANCIAL STATEMENTS FOR THE FINANCIAL YEAR ENDED AUGUST 31, 2004<br />
NOTES TO THE FINANCIAL STATEMENTS—(Continued)<br />
Note 21 FINANCIAL INSTRUMENTS (Continued)<br />
Interest rate risk<br />
In its operations, the group uses a mixture of financial instruments such as shareholders’ funds, bank<br />
borrowings, finance leases as well as cash. The group borrows in desired currencies at both fixed and floating<br />
rates of interest having regarding to current market rates and future trends. At year-end loans with fixed interest<br />
rate represented close to 4.7% of the group’s total interest-bearing liabilities. The company uses interest rate<br />
swaps to modify its exposure to interest rate movements and to manage its interest expense. As of August 31,<br />
2004, the company had an agreement in effect which exchanged floating interest rate for fixed interest rate in a<br />
notional amount of EUR 9,33 million maturing in 2007. As of August 31, 2004 the fair value of this derivative<br />
amounted to EEK 793 th (recorded as an interest expense in the income statement and as an other payable in the<br />
balance sheet).<br />
Analysis of borrowings by fixed and floating interest rates<br />
August 31 , 2004<br />
Fixed rate 5 years Total<br />
Obligation under finance lease ............................ 380 1,397 0 1,777<br />
Other loans ........................................... 48,766 49,764 0 98,530<br />
Bonds ............................................... 99,310 0 0 99,310<br />
Floating rate 5 years Total<br />
Secured bank loans ..................................... 602,261 1,695,077 1,737,137 4,034,475<br />
August 31, 2003<br />
Fixed rate 5 years Total<br />
Obligation under finance lease ............................. 253 1,671 0 1,924<br />
Other loans ............................................ 40,884 74,646 0 115,530<br />
Bonds ................................................. 76,487 0 0 76,487<br />
Floating rate 5 years Total<br />
Secured bank loans ...................................... 396,621 1,232,419 814,564 2,443,604<br />
Other loans ............................................ 156,466 0 0 156,466<br />
Credit risk<br />
The maximum credit risk exposure of unsecured receivables of the group at the balance sheet date is EEK<br />
185,316 thousands (2003: EEK 133,462 thousands). There is no significant concentration of credit risk within the<br />
group.<br />
Bunker price risk<br />
The total bunker cost for the fleet represents about 9% of the total operating expenses. Changes in bunker<br />
prices follow the changes in the oil price and the USD price. The group’s policy for the financial year ended was<br />
not to hedge the risk related to the bunker cost although the group is considering possibilities to start hedging<br />
bunker price risk along with the relating US dollar risk.<br />
Fair values<br />
In the opinion of the company’s management there are no significant differences between the carrying value<br />
and the fair value of financial assets and liabilities of the group.<br />
F-61
FINANCIAL STATEMENTS FOR THE FINANCIAL YEAR ENDED AUGUST 31, 2004<br />
NOTES TO THE FINANCIAL STATEMENTS—(Continued)<br />
Note 22 EVENTS AFTER THE BALANCE SHEET DATE<br />
(in thousand EEK)<br />
In September 2004 the group established a new subsidiary TDF Kommerts OÜ with 100% of the ownership.<br />
The payment into the share capital in the amount of EEK 40 thousand was made in cash. The new subsidiary has<br />
been registered in Estonia and was established for later retail business on mainland purpose.<br />
On October 27, 2004 Aker Finnyard and <strong>Tallink</strong> <strong>Grupp</strong> AS signed a shipbuilding contract to construct a new<br />
passenger cruise ship. The new ship should be delivered in May 2006. The shipbuilding contract price of new<br />
ship is EUR 165,000,000 of which 20% will be paid during construction and 80% will be paid at delivery of the<br />
ship. On November 18, 2004 <strong>Tallink</strong> <strong>Grupp</strong> AS made the first prepayment of EUR 2,000,000 to Aker Finnyard.<br />
In November 2004 <strong>Tallink</strong> <strong>Grupp</strong> AS established a new subsidiary <strong>Tallink</strong> Sea Line Limited with 100% of<br />
the ownership. The payment into the share capital in the amount of EEK 27 thousand was made also in<br />
November 2004. The new subsidiary has been registered in Cyprus and was established for future ship owning<br />
purpose.<br />
In November 2004 bank loans of three subsidiaries were refinanced with a bank loan granted to the parent<br />
company. The refinanced loans’ amount was EEK 262,073 thousands and the amount of the new loan is EEK<br />
269,122 thousands.<br />
F-62
FINANCIAL STATEMENTS FOR THE FINANCIAL YEAR ENDED AUGUST 31, 2004<br />
NOTES TO THE FINANCIAL STATEMENTS—(Continued)<br />
MANAGEMENT BOARD’S APPROVAL OF THE FINANCIAL STATEMENTS<br />
We hereby declare our responsibility for the Financial Statements and confirm that <strong>Tallink</strong> Group AS’s<br />
Financial Statements for the year ended August 31, 2004 are prepared in accordance with International Financial<br />
Reporting Standards and the Financial Statements set out on pages F-34 to F-63 give a true and fair view of the<br />
financial position of the group and the parent company and of the result of their operations and cash flows:<br />
Chairman of the Board<br />
Enn Pant<br />
Member of the Board Member of the Board<br />
Kalev Järvelill Keijo Mehtonen<br />
Member of the Board<br />
Andres Hunt<br />
Tallinn<br />
December 17, 2004<br />
F-63
FINANCIAL STATEMENTS FOR THE FINANCIAL YEAR ENDED AUGUST 31, 2005<br />
AUDITORS’ REPORT TO THE AS TALLINK GRUPP SHAREHOLDERS<br />
We have audited the financial statements of AS <strong>Tallink</strong> <strong>Grupp</strong> (hereafter “the Company”) and the<br />
consolidated financial statements of AS <strong>Tallink</strong> <strong>Grupp</strong> and its subsidiaries (hereafter “the Group”) for the<br />
financial year ended August 31, 2004 (that also include the corresponding figures for the financial year ended<br />
August 31, 2003), which are set out on pages F-34 through F-63 of the Offering Memorandum. These financial<br />
statements are the responsibility of the Company’s management. Our responsibility is to express an opinion on<br />
these financial statements based on our audit.<br />
We conducted our audit in accordance with International Standards on Auditing. Those Standards require<br />
that we plan and perform the audit to obtain reasonable assurance about whether the financial statements are free<br />
of material misstatement. An audit includes examining, on a test basis, evidence supporting the amounts and<br />
disclosures in the financial statements. An audit also includes assessing the accounting principles used and<br />
significant estimates made by management, as well as evaluating the overall financial statement presentation. We<br />
believe that our audit provides a reasonable basis for our opinion.<br />
In our opinion, the financial statements for the financial year ended August 31, 2004 (including the<br />
corresponding figures for the financial year ended August 31, 2003) present fairly, in all material respects, the<br />
financial position of the Company and the Group as of August 31, 2004, and the results of their operations and<br />
their cash flows for the financial year then ended in accordance with International Financial Reporting Standards.<br />
Hanno Lindpere<br />
Ernst & Young <strong>Baltic</strong> AS<br />
Marju Põldniit<br />
Authorised Auditor<br />
The audit of the financial statements for the financial year ended August 31, 2004 was completed on<br />
December 21, 2004, except for the minor financial statements style presentation amendments done in 2005, as to<br />
which the date is November 18, 2005.<br />
F-64
[THIS PAGE INTENTIONALLY LEFT BLANK]
Nordea Bank Finland Plc.<br />
Pohjoisesplanadi 33 A<br />
00100 Helsinki<br />
Finland<br />
As to Estonian law<br />
Raidla & Partners,<br />
Attorneys at Law<br />
Roosikrantsi 2<br />
10119 Tallinn<br />
Estonia<br />
HEAD OFFICE OF THE COMPANY<br />
<strong>Aktsiaselts</strong> <strong>Tallink</strong> <strong>Grupp</strong><br />
Tartu mnt. 13<br />
10145 Tallinn<br />
Estonia<br />
MANAGERS<br />
Global Co-ordinator and Sole Bookrunner<br />
Citigroup Global Markets Limited<br />
Citigroup Centre<br />
Canada Square<br />
Canary Wharf<br />
London E14 5LB<br />
United Kingdom<br />
Co-lead Managers<br />
AS Suprema Securities<br />
Tartu mnt. 2<br />
10145 Tallinn<br />
Estonia<br />
LEGAL ADVISORS TO THE COMPANY<br />
As to Finnish law<br />
Roschier Holmberg,<br />
Attorneys Ltd.<br />
Keskuskatu 7 A<br />
00100 Helsinki<br />
Finland<br />
LEGAL ADVISORS TO THE MANAGERS<br />
As to Estonian law As to Finnish and U.S. law<br />
Advokaadibüroo Tark & Co White & Case LLP<br />
Roosikrantsi 2<br />
10119 Tallinn<br />
Estonia<br />
Eteläranta 14<br />
FI-00130 Helsinki<br />
Finland<br />
INDEPENDENT AUDITORS<br />
Ernst & Young <strong>Baltic</strong> <strong>Aktsiaselts</strong><br />
Authorized Public Accountants<br />
Harju Str. 6<br />
10130 Tallinn<br />
Estonia<br />
REGISTRAR<br />
Estonian Central Securities Depository<br />
Tartu mnt. 2<br />
10145 Tallinn<br />
Estonia<br />
SEB Eesti Ühispank AS<br />
Tornimäe 2<br />
15010 Tallinn<br />
Estonia<br />
As to U.S. law<br />
Davis Polk & Wardwell<br />
99 Gresham Street<br />
London EC2V 7NG<br />
United Kingdom<br />
1155 Avenue of the Americas<br />
New York, New York 10036-2787<br />
United States
ROMANTIKA<br />
FANTAASIA<br />
REGINA BALTICA<br />
VICTORIA I<br />
MELOODIA<br />
VANA TALLINN<br />
REGAL STAR<br />
KAPELLA<br />
AUTOEXPRESS<br />
AUTOEXPRESS 2<br />
AUTOEXPRESS 3<br />
AUTOEXPRESS 4