DRAFT Australian Dietary Guidelines - Eat For Health
DRAFT Australian Dietary Guidelines - Eat For Health
DRAFT Australian Dietary Guidelines - Eat For Health

You also want an ePaper? Increase the reach of your titles
YUMPU automatically turns print PDFs into web optimized ePapers that Google loves.
<strong>Australian</strong> <strong>Dietary</strong> <strong>Guidelines</strong><br />
Incorporating the<br />
<strong>Australian</strong> Guide to <strong>Health</strong>y <strong>Eat</strong>ing<br />
Providing the scientific evidence for healthier <strong>Australian</strong> diets<br />
<strong>DRAFT</strong> FOR PUBLIC CONSULTATION<br />
National <strong>Health</strong> and Medical Research Council<br />
December 2011
Preface<br />
Never in our nation’s history have <strong>Australian</strong>s had such a wide variety of dietary options. Yet the<br />
rising incidence of obesity and diabetes in our population is evidence of the need for <strong>Australian</strong>s to<br />
improve their health by making better dietary decisions.<br />
There are many ways for <strong>Australian</strong>s to choose foods that promote their health and wellbeing<br />
while reducing their risk of chronic disease. NHMRC‘s <strong>Australian</strong> <strong>Dietary</strong> <strong>Guidelines</strong> provide<br />
recommendations for healthy eating that are realistic, practical, and - most importantly - based on<br />
the best available scientific evidence.<br />
These <strong>Guidelines</strong> are an evolution of the 2003 <strong>Dietary</strong> <strong>Guidelines</strong>, integrating updates of the <strong>Dietary</strong><br />
<strong>Guidelines</strong> for Older <strong>Australian</strong>s (1999), the <strong>Dietary</strong> <strong>Guidelines</strong> for Adults (2003) and the <strong>Dietary</strong><br />
<strong>Guidelines</strong> for Children and Adolescents in Australia (2003). They also include an update of the<br />
<strong>Australian</strong> Guide to <strong>Health</strong>y <strong>Eat</strong>ing (1998).<br />
Providing the recommendations and the evidence that underpins them in a single volume, the<br />
<strong>Guidelines</strong> will help health professionals, policy makers and the <strong>Australian</strong> public cut through the<br />
background noise of ubiquitous dietary advice that is often based on scant scientific evidence. They<br />
form a bridge between research and evidence based advice to address the major health challenge<br />
of improving <strong>Australian</strong>s’ eating patterns.<br />
The evidence for public health advice should be the best available. NHMRC is confident that the<br />
available evidence underpinning these guidelines meets that criterion and is stronger than for any<br />
previous NHMRC dietary guideline.<br />
NHMRC acknowledges that population growth, economic issues and environmental pressures<br />
affect food availability and affordability on global, national and regional scales. The interaction<br />
between dietary advice, the environment and food production raise cross-sectoral issues including<br />
the impact of food choices and future food security. The NHMRC and other Commonwealth<br />
agencies are jointly considering these.<br />
<strong>For</strong> more than 75 years the <strong>Australian</strong> Government, primarily through NHMRC and <strong>Australian</strong><br />
Government health departments, has provided nutrition advice to the public through food and<br />
nutrition policies, dietary guidelines and national food selection guides.<br />
NHMRC and all involved in developing these <strong>Guidelines</strong> are proud and privileged to have the<br />
responsibility to continue this important public service.<br />
Professor Warwick Anderson<br />
Chief Executive Officer<br />
National <strong>Health</strong> & Medical Research Council<br />
<strong>DRAFT</strong> <strong>Australian</strong> <strong>Dietary</strong> <strong>Guidelines</strong>- December 2011 2
<strong>Australian</strong> <strong>Dietary</strong> <strong>Guidelines</strong><br />
<strong>Australian</strong> <strong>Dietary</strong> <strong>Guidelines</strong><br />
Guideline 1<br />
Guideline 2<br />
Guideline 3<br />
Guideline 4<br />
Guideline 5<br />
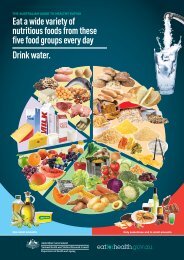
<strong>Eat</strong> a wide variety of nutritious foods from these five groups every day:<br />
plenty of vegetables, including different types and colours, and<br />
legumes/beans<br />
fruit<br />
grain (cereal) foods, mostly wholegrain, such as breads, cereals, rice, pasta,<br />
noodles, polenta, couscous, oats, quinoa and barley<br />
lean meat and poultry, fish, eggs, nuts and seeds, and legumes/beans<br />
milk, yoghurt, cheese and/or their alternatives, mostly reduced fat (reduced<br />
fat milks are not suitable for children under the age of 2 years).<br />
And drink water.<br />
Limit intake of foods and drinks containing saturated and trans fats, added salt,<br />
added sugars and alcohol.<br />
a. Limit intake of foods and drinks containing saturated and trans fats<br />
Include small amounts of foods that contain unsaturated fats<br />
Low-fat diets are not suitable for infants.<br />
b. Limit intake of foods and drinks containing added salt<br />
Read labels to choose lower sodium options among similar foods.<br />
Do not add salt to foods.<br />
c. Limit intake of foods and drinks containing added sugars. In particular, limit<br />
sugar-sweetened drinks.<br />
d. If you choose to drink alcohol, limit intake.<br />
To achieve and maintain a healthy weight you should be physically active and<br />
choose amounts of nutritious food and drinks to meet your energy needs.<br />
Children and adolescents should eat sufficient nutritious foods to grow and<br />
develop normally. They should be physically active every day and their<br />
growth should be checked regularly.<br />
Older people should eat nutritious foods and keep physically active to help<br />
maintain muscle strength and a healthy weight.<br />
Encourage and support breastfeeding.<br />
Care for your food; prepare and store it safely.<br />
<strong>DRAFT</strong> <strong>Australian</strong> <strong>Dietary</strong> <strong>Guidelines</strong>- December 2011 3
Contents<br />
1. Introduction ...................................................................................................................................... 7<br />
1.1 Why the <strong>Guidelines</strong> matter .......................................................................................................................7<br />
1.2 Social determinants of food choices and health..................................................................................8<br />
1.3 Scope and target audience .......................................................................................................................9<br />
1.4 How the <strong>Guidelines</strong> were developed ................................................................................................... 13<br />
1.5 Adherence to dietary advice in Australia .......................................................................................... 18<br />
1.6 <strong>Dietary</strong> choices and the environment ................................................................................................ 20<br />
1.7 How to use the <strong>Guidelines</strong> ..................................................................................................................... 21<br />
1.8 The <strong>Australian</strong> Guide to <strong>Health</strong>y <strong>Eat</strong>ing ................................................................................................. 22<br />
2. <strong>Eat</strong> a wide variety of nutritious foods ...................................................................................... 24<br />
2.1 <strong>Eat</strong> a wide variety of nutritious foods ................................................................................................ 26<br />
2.1.1 Setting the scene ........................................................................................................ 26<br />
2.1.2 The evidence for ‘eat a wide variety of nutritious foods’ ....................................... 27<br />
2.1.3 How eating a wide variety of foods may improve health outcomes .................. 28<br />
2.1.4 Practical considerations: <strong>Eat</strong> a wide variety of nutritious foods ........................... 28<br />
2.2 Plenty of vegetables, including different types and colours, and legumes/beans, and eat fruit32<br />
2.2.1 Setting the scene ........................................................................................................ 32<br />
2.2.2 The evidence for ‘plenty of vegetables’ ................................................................... 32<br />
2.2.3 The evidence for ‘plenty of legumes/beans’ ............................................................ 36<br />
2.2.4 The evidence for ‘eat fruit’ ........................................................................................ 37<br />
2.2.5 How plenty of vegetables, including different types and colours, and legumes/beans, and eating fruit<br />
may improve health outcomes .......................................................................................... 39<br />
2.2.6 Practical considerations: <strong>Eat</strong> plenty of vegetables, including different types and colours,<br />
legumes/beans, and fruit ........................................................................................................ 42<br />
2.3 Grain (cereal) foods (mostly wholegrain) ......................................................................................... 45<br />
2.3.1 Setting the scene ........................................................................................................ 45<br />
2.3.2 The evidence for ‘grain (cereal) foods’ .................................................................... 46<br />
2.3.3 How eating cereal (mostly wholegrain) foods may improve health outcomes . 47<br />
2.3.4 Practical considerations: <strong>Eat</strong> grain (cereal) foods, mostly wholegrain ................. 48<br />
2.4 Lean meat and poultry, fish, eggs, nuts and seeds, and legumes/beans ...................................... 51<br />
2.4.1 Setting the scene ........................................................................................................ 51<br />
2.4.2 The evidence for ‘lean meat and poultry, fish, eggs, nuts and seeds, and legumes/beans’ 52<br />
2.4.3 How eating lean meat and poultry, fish, eggs, nuts and seeds, and legumes/beans may improve<br />
health outcomes ................................................................................................................... 56<br />
<strong>DRAFT</strong> <strong>Australian</strong> <strong>Dietary</strong> <strong>Guidelines</strong>- December 2011 4
2.4.4 Practical considerations: Lean meat and poultry, fish, eggs, legumes/beans and nuts/seeds 57<br />
2.5 Milk, yoghurt, cheese and/or alternatives (mostly reduced fat) ................................................... 61<br />
2.5.1 Setting the scene ........................................................................................................ 61<br />
2.5.2 The evidence for ‘milk, yoghurt, cheese and/or alternatives’ ................................ 62<br />
2.5.3 How drinking milk and eating yoghurt, cheese and/or alternatives may improve health outcomes<br />
.................................................................................................................................................. 65<br />
2.5.4 Practical considerations: Milk, yoghurt, cheese and/or alternatives .................... 65<br />
2.6 Water ......................................................................................................................................................... 68<br />
2.6.1 Setting the scene ........................................................................................................ 68<br />
2.6.2 The evidence for ‘drink water’ .................................................................................. 68<br />
2.6.3 How drinking water may improve health outcomes ........................................... 71<br />
2.6.4 Practical considerations: Drink water ..................................................................... 72<br />
3. Limit intake of foods and drinks containing saturated and trans fats, added salt, added sugars and<br />
alcohol ...................................................................................................................................... 74<br />
3.1 Limiting intake of foods and drinks containing saturated and trans fat ...................................... 76<br />
3.1.1 Setting the scene ........................................................................................................ 76<br />
3.1.2 The evidence for ‘limiting intake of foods and drinks containing saturated and trans fat’ 77<br />
3.1.3 How limiting intake of foods and drinks containing saturated and trans fat may improve health<br />
outcomes ................................................................................................................................ 79<br />
3.1.4 Practical considerations: Limiting intake of foods and drinks containing saturated and trans fat 80<br />
3.2 Limit intake of foods and drinks containing added salt .................................................................. 82<br />
3.2.1 Setting the scene ........................................................................................................ 82<br />
3.2.2 The evidence for ‘limiting intake of foods and drinks containing added salt’ ..... 83<br />
3.2.3 How limiting intake of foods and drinks containing added salt may improve health outcomes 85<br />
3.2.4 Practical considerations: Limiting intake of foods and drinks containing added salt85<br />
3.3 Limit intake of foods and drinks containing added sugars ............................................................. 87<br />
3.3.1 Setting the scene ........................................................................................................ 87<br />
3.3.2 The evidence for ‘limiting intake of foods and drinks containing added sugars’ 88<br />
3.3.3 How limiting intake of foods and drinks containing added sugars may improve health outcomes<br />
.................................................................................................................................................. 90<br />
3.3.4 Practical considerations: Limiting intake of foods and drinks containing added sugars 91<br />
3.4 Alcoholic drinks ....................................................................................................................................... 92<br />
3.4.1 Setting the scene ........................................................................................................ 92<br />
3.4.2 The evidence for ‘limiting alcohol’ ............................................................................ 94<br />
3.4.3 How limiting alcohol may improve health outcomes ........................................... 97<br />
3.4.4 Practical considerations: Limiting alcohol ............................................................... 98<br />
<strong>DRAFT</strong> <strong>Australian</strong> <strong>Dietary</strong> <strong>Guidelines</strong>- December 2011 5
4. Achieve and maintain a healthy weight ................................................................................ 1027<br />
5.1 Setting the scene ................................................................................................................................... 109<br />
4.2 The evidence for ‘achieving and maintaining a healthy weight’ ...................................................... 113<br />
4.3 How dietary patterns can affect energy intake and balance and weight outcomes ................. 119<br />
4.4 Practical considerations: Achieving and maintaining a healthy weight ........................................... 120<br />
5. Encourage and support breastfeeding ................................................................................... 131<br />
5.1 Setting the scene ................................................................................................................................... 133<br />
5.2 The evidence for ‘Encouraging and supporting breastfeeding’ ........................................................ 134<br />
5.3 Practical considerations: Encourage and support breastfeeding..................................................... 140<br />
6. Food safety ................................................................................................................................... 144<br />
6.1 Setting the scene ................................................................................................................................... 146<br />
6.2 The evidence for ‘caring for your food; prepare and store it safely’ ........................................ 146<br />
6.3 Why it is important to prepare and store food safely ................................................................. 147<br />
6.4 Practical considerations: Food safety ............................................................................................... 148<br />
Appendix 1. History and timeline of <strong>Australian</strong> nutrition documents ............................... 150<br />
Appendix 2. Process report ......................................................................................................... 156<br />
Appendix 3. Assessing growth and healthy weight in infants, children and adolescents, and healthy weight<br />
in adults .................................................................................................................................. 163<br />
Appendix 4. Physical activity guidelines ..................................................................................... 169<br />
Appendix 5. Studies examining the health effects of intake of fruit and vegetables together 173<br />
Appendix 6. Alcohol and energy intake ..................................................................................... 176<br />
Appendix 7. Equity and the social determinants of health and nutrition status ............... 178<br />
Appendix 8: Glossary ..................................................................................................................... 191<br />
References ........................................................................................................................................ 209<br />
<strong>DRAFT</strong> <strong>Australian</strong> <strong>Dietary</strong> <strong>Guidelines</strong>- December 2011 6
1. Introduction<br />
1.1 Why the <strong>Guidelines</strong> matter<br />
There are many ways for <strong>Australian</strong>s to achieve dietary patterns that promote health and<br />
wellbeing and reduce the risk of chronic disease. Diet is arguably the single most important<br />
behavioural risk factor that can be improved to have a significant impact on health [1, 2]. As the<br />
quality and quantity of foods and drinks consumed has a significant impact on the health and<br />
wellbeing of individuals, society and the environment, better nutrition has a huge potential to<br />
improve individual and public health and decrease healthcare costs. Optimum nutrition is essential<br />
for the normal growth and physical and cognitive development of infants and children. In all<br />
<strong>Australian</strong>s, nutrition contributes significantly to healthy weight, quality of life and wellbeing,<br />
resistance to infection, and protection against chronic disease and premature death.<br />
Sub-optimal nutrition can be associated with ill-health. Many diet-related chronic diseases such as<br />
cardiovascular disease, type 2 diabetes and some forms of cancer are the major cause of death and<br />
disability among <strong>Australian</strong>s [3]. More than one-third of all premature deaths in Australia are the<br />
result of chronic diseases that could have been prevented [3]. Many of these are mediated by<br />
overweight and obesity.<br />
Poor nutrition is responsible for around 16% of the total burden of disease [1, 4] and is implicated<br />
in more than 56% of all deaths in Australia [5]. The most recent available estimates for the total<br />
cost of poor nutrition were more than $5 billion per year, based on 1990 costings [5]. Given that<br />
the cost of obesity alone was estimated to be $8.283 billion per year in 2008 [6], the current cost<br />
of poor nutrition in Australia is now likely to greatly exceed the 1990 estimates.<br />
Most of the burden of disease due to poor nutrition in Australia is associated with excessive<br />
intake of energy-dense and relatively nutrient-poor foods high in energy (kilojoules), saturated fat,<br />
added or refined sugars or salt, and/or inadequate intake of nutrient-dense foods, including<br />
vegetables, fruit and wholegrain cereals [2, 7]. Deficiency in some nutrients such as iodine, folate<br />
[8], iron and vitamin D is also of concern for some <strong>Australian</strong>s [9, 10].<br />
Overconsumption of some foods and drinks, leading to excess energy intake and consequent<br />
overweight and obesity, is now a key public health problem for Australia [7, 11]. The prevalence of<br />
overweight and obesity has increased dramatically in Australia over the past 30 years and is now<br />
62% in adults [12] and around 25% in children and adolescents [12, 13].<br />
These <strong>Guidelines</strong> summarise the evidence underlying food, diet and health relationships that<br />
improve public health outcomes.<br />
<strong>DRAFT</strong> <strong>Australian</strong> <strong>Dietary</strong> <strong>Guidelines</strong>- December 2011 7
<strong>Dietary</strong> patterns consistent with the <strong>Guidelines</strong> improve health<br />
Recent reviews of the evidence on food and health confirm that dietary patterns consistent with<br />
the <strong>Guidelines</strong> are positively associated with indicators of health and wellbeing.<br />
Two systematic reviews found that higher dietary quality was consistently associated with a 10–<br />
20% reduction in morbidity. <strong>For</strong> example, there is evidence of a probable association between<br />
consumption of a Mediterranean dietary pattern and reduced mortality (Grade B, Section 20.1 in<br />
Evidence Report [14]) [15-17]. Previous studies have also indicated inverse associations between<br />
plant-based diets and all-cause and cardiovascular mortality, particularly among older adults [18-<br />
20]. The effects of dietary quality tended to be greater for men than women, with common<br />
determinants being age, education and socioeconomic status [21, 22].<br />
There is likely to be great variation in the interpretation and implementation of dietary guidelines.<br />
Nevertheless, when a wide range of eating patterns was assessed for compliance with different<br />
guidelines using a variety of qualitative tools, the assessment suggested an association between<br />
adherence to national dietary guidelines and recommendations, and reduced morbidity and<br />
mortality (Grade C, Section 20.3 in Evidence Report [14]) [21, 22].<br />
More recent evidence from Western societies confirms that dietary patterns consistent with<br />
current guidelines recommending relatively high amounts of vegetables, fruit, whole grains, poultry,<br />
fish, and reduced fat milk, yoghurt and cheese products may be associated with superior<br />
nutritional status, quality of life and survival in older adults [23, 24]. Robust modelling of dietary<br />
patterns in accordance with dietary guidelines has demonstrated achievable reductions in<br />
predicted cardiovascular and cancer disease mortality in the population, particularly with increased<br />
consumption of fruit and vegetables [25].<br />
In relation to obesity, actual dietary recommendations and measures of compliance and weight<br />
outcomes vary greatly in published studies. Overall energy intake is the key dietary factor affecting<br />
weight status (see Chapter 4).<br />
1.2 Social determinants of food choices and<br />
health<br />
Life expectancy and health status are relatively high overall in Australia [12, 26]. Nonetheless,<br />
there are differences in the health and wellbeing between <strong>Australian</strong>s, including in rates of death<br />
and disease, life expectancy, self-perceived health, health behaviours, health risk factors, and use of<br />
health services [27-29].<br />
The causes of health inequities are largely outside the health system and relate to the inequitable<br />
distribution of social, economic and cultural resources and opportunities [27-29]. Employment,<br />
<strong>DRAFT</strong> <strong>Australian</strong> <strong>Dietary</strong> <strong>Guidelines</strong>- December 2011 8
income, education, cultural influences and lifestyle, language, sex and other genetic differences,<br />
isolation (geographic, social or cultural), age and disability, the security and standard of<br />
accommodation, and the availability of facilities and services all interact with diet, health and<br />
nutritional status[27, 28]. Conversely, a person’s poor health status can contribute to social<br />
isolation and limit their ability to gain employment or education and earn an income, which can in<br />
turn impact negatively on health determinants such as quality and stability of housing.<br />
<strong>Australian</strong>s who are at greater risk of diet-mediated poor health include the very young, the very<br />
old, Aboriginal and Torres Strait Islander peoples and those in lower socioeconomic groups [27-<br />
32]. The <strong>Guidelines</strong> address some of the issues these population groups face under ‘Practical<br />
considerations for health professionals’ in each guideline. Further discussion of the social<br />
determinants of health and food choices is provided in Appendix 7.<br />
1.3 Scope and target audience<br />
The <strong>Guidelines</strong>, together with the underlying evidence base, provide guidance on foods, food<br />
groups and dietary patterns that protect against chronic disease and provide the nutrients<br />
required for optimal health and wellbeing. They are important tools which support broader<br />
strategies to improve nutrition outcomes in Australia, as highlighted in <strong>Eat</strong> Well Australia: an agenda<br />
for action in public health nutrition, 2000-2010 [2]. They are consistent with the most recent<br />
<strong>Australian</strong> Food and Nutrition Policy 1992 [33] in considering health and wellbeing, equity and the<br />
environment.<br />
The <strong>Guidelines</strong> apply to all healthy <strong>Australian</strong>s<br />
The <strong>Guidelines</strong> aim to promote the benefits of healthy eating, not only to reduce the risk of dietrelated<br />
disease but also to improve community health and wellbeing. The <strong>Guidelines</strong> are intended<br />
for people of all ages and backgrounds in the general healthy population, including people with<br />
common diet-related risk factors such as being overweight.<br />
They do not apply to people with medical conditions requiring specialised dietary advice, nor to<br />
the frail elderly who are at risk of malnutrition.<br />
The <strong>Guidelines</strong> are based on whole foods<br />
<strong>Dietary</strong> recommendations are often couched in terms of individual nutrients (such as vitamins and<br />
minerals). People chose to eat whole foods not single nutrients, so such recommendations can be<br />
difficult to put into practice. <strong>For</strong> this reason, these <strong>Guidelines</strong> make recommendations based only<br />
on whole foods, such as vegetables and meats, rather than recommendations related to specific<br />
food components and individual nutrients.<br />
<strong>DRAFT</strong> <strong>Australian</strong> <strong>Dietary</strong> <strong>Guidelines</strong>- December 2011 9
This practical approach makes the recommendations easier to apply. <strong>Dietary</strong> patterns consistent<br />
with the <strong>Guidelines</strong> will allow the general population to meet nutrient requirements, although some<br />
subpopulations (for example, pregnant and breastfeeding women) may have some increased<br />
nutrient requirements that are more difficult to meet through diet alone. This is noted for each<br />
Guideline under ‘Practical considerations for health professionals’.<br />
<strong>For</strong> information on specific micro- and macro-nutrients, refer to the Nutrient Reference Values for<br />
Australia and New Zealand [9].<br />
Issues related to food composition and food supply, such as fortification, use of food additives or<br />
special dietary products are dealt with by Food Standards Australia New Zealand (see<br />
http://www.foodstandards.gov.au).<br />
Target audience for the <strong>Guidelines</strong><br />
The target audience for the <strong>Guidelines</strong> comprises health professionals (including dietitians,<br />
nutritionists, general practitioners, nurses and lactation consultants), educators, government policy<br />
makers, the food industry and other interested parties. A suite of resources for the general public,<br />
including the revised <strong>Australian</strong> Guide to <strong>Health</strong>y <strong>Eat</strong>ing has also been produced (see<br />
www.eatforhealth.gov.au).<br />
Companion documents<br />
The <strong>Guidelines</strong> form part of a suite of documents on nutrition and dietary guidance (see Figure 1.1).<br />
Other documents in this suite include:<br />
Nutrient Reference Values for Australia and New Zealand<br />
This details quantitative nutrient reference values (NRVs) for <strong>Australian</strong>s of difference ages and<br />
gender. These reference values detail the recommended amounts of nutrients (vitamins, minerals,<br />
protein, carbohydrate etc.) required to avoid deficiency, toxicity and chronic disease. As an<br />
example, you would refer to the NRVs document to know how much iron is needed by women<br />
aged between 19 and 30.<br />
The Food Modelling Document<br />
(A modelling system to inform the revision of the <strong>Australian</strong> Guide to <strong>Health</strong>y <strong>Eat</strong>ing)<br />
This describes a range of computer-generated diets that translate the NRVs into dietary patterns<br />
to describe the types, combinations and amounts of foods that deliver nutrient requirements for<br />
each age and gender group of different physical activity level in the <strong>Australian</strong> population.<br />
A range of models including omnivore, lacto-ovo vegetarian, pasta and rice-based dietary patterns<br />
were developed, and dietary patterns were used to inform the <strong>Australian</strong> Guide to <strong>Health</strong>y <strong>Eat</strong>ing.<br />
<strong>DRAFT</strong> <strong>Australian</strong> <strong>Dietary</strong> <strong>Guidelines</strong>- December 2011 10
The Evidence Report<br />
(A review of the evidence to address targeted questions to inform the revision of the<br />
<strong>Australian</strong> dietary guidelines)<br />
This is a systematic literature review relevant to targeted questions published in the peerreviewed<br />
nutrition literature from 2003-2009. This document is described further in Section 1.4.<br />
As an example, if you would like to look at the evidence for a particular Evidence Statement, you<br />
would refer to the Evidence Report.<br />
The <strong>Australian</strong> Guide to <strong>Health</strong>y <strong>Eat</strong>ing<br />
This package of resources includes:<br />
the ‘plate’ graphic divided into portions of fruit, vegetables, grains, milk, yoghurt and cheese<br />
products and lean meat and alternatives, representing the number of serves of each type of food<br />
required per day<br />
the recommended number of serves of each of the food groups, and discretionary foods,<br />
for different sub-population groups<br />
examples of what a serve size is for each food group<br />
As an example, if you are would like to know how many serves of vegetables men aged between<br />
19 and 50 should eat each day you would refer to the <strong>Australian</strong> Guide to <strong>Health</strong>y <strong>Eat</strong>ing. This<br />
information is also included in the <strong>Guidelines</strong> under ‘Practical considerations for health<br />
professionals’ for each food group.<br />
Related brochures and posters for health professionals and consumers<br />
All these documents are available on the web at www.eatforhealth.gov.au.<br />
<strong>DRAFT</strong> <strong>Australian</strong> <strong>Dietary</strong> <strong>Guidelines</strong>- December 2011 11
Figure 1.1: Relationship between the documents related to the <strong>Australian</strong> <strong>Dietary</strong> <strong>Guidelines</strong><br />
Supporting Documents<br />
Evidence Report to<br />
inform the review of the<br />
<strong>Australian</strong> <strong>Dietary</strong><br />
<strong>Guidelines</strong><br />
Food Modelling System to<br />
inform the <strong>Australian</strong> Guide<br />
to <strong>Health</strong>y <strong>Eat</strong>ing (2010)<br />
Pregnant and<br />
breastfeeding women<br />
literature review (2011)<br />
The previous <strong>Dietary</strong><br />
<strong>Guidelines</strong> for all<br />
<strong>Australian</strong> (2003)<br />
Authoritative reports &<br />
additional literature<br />
Nutrient Reference<br />
Values for Australia and<br />
New Zealand Including<br />
the Recommended<br />
<strong>Dietary</strong> Intakes (2005)<br />
<strong>Australian</strong> <strong>Dietary</strong><br />
<strong>Guidelines</strong><br />
incorporating the<br />
<strong>Australian</strong> Guide to <strong>Health</strong>y<br />
<strong>Eat</strong>ing<br />
The <strong>Australian</strong> <strong>Dietary</strong> <strong>Guidelines</strong> are evidence-based<br />
dietary advice for healthy <strong>Australian</strong>s. The guidelines<br />
incorporate the <strong>Australian</strong> Guide to <strong>Health</strong>y <strong>Eat</strong>ing,<br />
which is a practical guide on the types and amounts<br />
of foods to eat each day.<br />
<strong>DRAFT</strong> <strong>Australian</strong> <strong>Dietary</strong> <strong>Guidelines</strong>- December 2011 12<br />
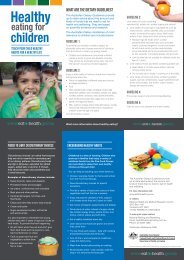
Additional Resources<br />
Brochures and posters<br />
- <strong>Eat</strong> for health: Enjoy life<br />
- <strong>Health</strong>y eating: How to give<br />
your children the best start<br />
in life<br />
- <strong>Eat</strong> for a healthy<br />
pregnancy: Advice on eating<br />
for you and your baby<br />
- Giving your baby the best<br />
start: The best foods for<br />
infants<br />
Summary Booklet<br />
- <strong>Eat</strong> for health: <strong>Dietary</strong><br />
<strong>Guidelines</strong> for <strong>Australian</strong>s<br />
www.eatforhealth.gov.au<br />
Nutrient Reference Values<br />
publications and website<br />
www.nrv.gov.au
1.4 How the <strong>Guidelines</strong> were developed<br />
These <strong>Guidelines</strong> are an evolution of the 2003 <strong>Dietary</strong> <strong>Guidelines</strong>, building upon their evidence and<br />
science base. New evidence was assessed to determine whether associations between food,<br />
dietary patterns and health outcomes had strengthened, weakened, or remained unchanged.<br />
Where the evidence base was unlikely to have changed substantially (for example, the relationship<br />
between intake of foods high in saturated fat and increased risk of high serum cholesterol),<br />
additional review was not conducted.<br />
The methods used to analyse the evidence were in accordance with international best practice<br />
[14, 34]. They are summarised below, and provided in more detail in Appendix 2.<br />
The <strong>Guidelines</strong> are further informed by substantial advances in the methodology for guideline<br />
development and usability in the eight years since publication of the previous dietary guidelines.<br />
Human feeding studies and clinical trials provide direct evidence of the impact of food<br />
consumption on physiological responses and disease biomarkers. Although the breadth and depth<br />
of knowledge generated from these kinds of studies is uneven, a consistent alignment of results<br />
with plausible mechanisms adds confidence in the analysis of all studies combined.<br />
1.4.1 Sources of information<br />
Five key evidence streams<br />
In developing the <strong>Guidelines</strong>, NHMRC drew upon the following key sources of evidence (see figure<br />
1.1):<br />
the previous <strong>Dietary</strong> <strong>Guidelines</strong> for <strong>Australian</strong>s series and their supporting documentation<br />
[35-37]<br />
a commissioned literature review: A review of the evidence to address targeted questions<br />
to inform the revision of the <strong>Australian</strong> dietary guidelines (referred to as ‘the Evidence<br />
Report’) [14]<br />
NHMRC and the New Zealand Ministry of <strong>Health</strong> 2006: Nutrient reference values for<br />
Australia and New Zealand including recommended dietary intakes (referred to as ‘the<br />
NRV document’) [9]<br />
a commissioned report: A modelling system to inform the revision of the <strong>Australian</strong> Guide<br />
to <strong>Health</strong>y <strong>Eat</strong>ing (referred to as ‘the Food Modelling’ document) [10]<br />
key authoritative government reports and additional literature<br />
<strong>DRAFT</strong> <strong>Australian</strong> <strong>Dietary</strong> <strong>Guidelines</strong>- December 2011 13
The Evidence Report – answers to key questions in the research<br />
literature<br />
NHMRC commissioned a literature review (A review of the evidence to address targeted questions to<br />
inform the revision of the <strong>Australian</strong> dietary guidelines—the Evidence Report) on food, diet and<br />
disease/health relationships, covering the period 2003–2009. This addressed specific questions<br />
developed by the expert <strong>Dietary</strong> <strong>Guidelines</strong> Working Committee (the Working Committee) on<br />
food, diet and disease/health relationships where evidence might have changed since the previous<br />
dietary guidelines were developed.<br />
NHMRC followed critical appraisal processes to ensure rigorous application of the review<br />
methodology [34, 38]. Data were extracted from included studies and assessed for strength of<br />
evidence, size of effect and relevance of evidence according to standardised NHMRC processes<br />
[34, 39-41]. The components of the body of evidence—evidence base (quantity, level and quality of<br />
evidence); consistency of the study results; clinical impact; generalisability; and applicability to the<br />
<strong>Australian</strong> context—were rated as excellent, good, satisfactory or poor according to standard<br />
NHMRC protocols [41].<br />
The reviewers then summarised the evidence into draft body of evidence statements. The<br />
Working Committee advised that a minimum of five high quality studies was required before a<br />
graded draft evidence statement could be made. The individual studies in meta-analyses were<br />
considered as separate studies. The draft Evidence Statements were graded A to D according to<br />
standard NHMRC protocols [41].<br />
Grade A (convincing association) indicates that the body of evidence can be trusted to<br />
guide practice<br />
Grade B (probable association) indicates that the body of evidence can be trusted to guide<br />
practice in most situations<br />
Grade C (suggestive association) indicates that the body of evidence provides some<br />
support for the recommendations but care should be taken in its application<br />
Grade D indicates that the body of evidence is weak and any recommendation must be<br />
applied with caution.<br />
Once the evidence statements and grades had been drafted, NHMRC commissioned an external<br />
methodologist to ensure that the review activities had been undertaken in a transparent, accurate,<br />
consistent and unbiased manner. This ensures that the work can be easily double-checked by<br />
other experts in nutrition research.<br />
In this way, the Evidence Report was used to develop the graded Evidence Statements included in<br />
the <strong>Guidelines</strong>. It is important to note that these grades relate to individual diet-disease<br />
relationships only—the <strong>Guidelines</strong> summarise evidence from a number of sources and across a<br />
number of health/disease outcomes.<br />
<strong>DRAFT</strong> <strong>Australian</strong> <strong>Dietary</strong> <strong>Guidelines</strong>- December 2011 14
Levels of evidence in public health nutrition<br />
Randomised controlled trials provide the highest level of evidence regarding the effects of dietary<br />
intake on health. However, as with many public health interventions, changing individuals’ diets<br />
raises ethical, logistical and economic challenges. This is particularly the case in conducting<br />
randomised controlled trials to test the effects of exposure to various types of foods and dietary<br />
patterns on the development of lifestyle-related disease.<br />
Lifestyle-related diseases generally do not develop in response to short-term dietary changes;<br />
however short-term studies enable biomarkers of disease to be used to evaluate the effects of<br />
particular dietary patterns. The question of how long dietary exposure should occur to<br />
demonstrate effect on disease prevention is subject to much debate. While it may be possible to<br />
conduct a dietary intervention study for 12 months or more to examine intermediate effects,<br />
there would be many ethical and practical barriers to conducting much longer, or indeed, life-long,<br />
randomised controlled trials with dietary manipulation to examine disease prevention.<br />
As a result, the nature of the evidence in the nutrition literature tends to be based on longer term<br />
observational studies, leading to a majority of grade C evidence statements and some which reach<br />
grade B where several quality studies with minimal risk of bias have been conducted. <strong>For</strong> shorter<br />
term and intermediary effects, particularly when studying exposure to nutrients and food<br />
components rather than dietary patterns, grade A is possible.<br />
The relatively high proportion of evidence statements assessed as grade C should not be<br />
interpreted as suggesting lack of evidence to help guide practice. However, care should still be<br />
applied in the application of this evidence for specific diet-disease relationships, particularly at the<br />
level of the individual [34, 38].<br />
<strong>Health</strong> professionals and the public can be assured that the process of assessing the scientific<br />
evidence provides for the best possible advice. Only evidence statements graded A, B, or C<br />
influenced the development of the <strong>Guidelines</strong>.<br />
Grade D evidence statements<br />
Grade D evidence statements occur when the evidence for a food-diet-health relationship is<br />
limited, inconclusive or contradictory. These D-grade relationships were not used to inform the<br />
development of <strong>Guidelines</strong> statements, however can be useful to inform health professionals about<br />
the strength of evidence from recent research. The full set of D-grade evidence statements can be<br />
found in the Evidence Report [14].<br />
<strong>DRAFT</strong> <strong>Australian</strong> <strong>Dietary</strong> <strong>Guidelines</strong>- December 2011 15
The Food Modelling Report – translating nutrient requirements into<br />
dietary patterns<br />
The report A modelling system to inform the revision of the <strong>Australian</strong> Guide to <strong>Health</strong>y <strong>Eat</strong>ing (the<br />
Food Modelling Report) was commissioned by the NHMRC between 2008 and 2010. It<br />
determined a range of combinations of amounts and types of foods that could be consumed to<br />
meet nutritional needs with the least amount of energy for the smallest and least active people<br />
within an age and sex group. This report applies the Nutrient reference values for Australia and New<br />
Zealand including recommended dietary intakes [9] and provides information on the serve sizes and<br />
minimum number of daily serves required for each population group to achieve the required<br />
intake of vitamins, minerals and macronutrients.<br />
There were several inputs in the development of this report including consultation processes<br />
arranged by NHMRC and a public consultation of the draft report in April/May 2010 after which<br />
the models were finalised.<br />
The Food Modelling Report informed the revision of the <strong>Australian</strong> Guide to <strong>Health</strong>y <strong>Eat</strong>ing (see<br />
Section 1.7) and was considered together with other sources of evidence to determine the<br />
recommendations in the <strong>Guidelines</strong>.<br />
Capturing new evidence<br />
Nutrition is a continuously evolving area and research studies are published on a regular basis.<br />
Relevant results from high quality studies (primarily systematic reviews) assessing food, diet and<br />
health relationships published after the literature review for the Evidence Report (after 2009)<br />
were also considered in the development of the <strong>Guidelines</strong>. While results from these studies were<br />
not graded, and did not influence the Evidence Statements, they were included in the <strong>Guidelines</strong><br />
and were deemed warranted to ensure currency.<br />
As the Evidence Report only included studies investigating food, diet and health relationships, the<br />
results of other high quality studies published since 2002 were used to update the sections in the<br />
<strong>Guidelines</strong> which provided other information (‘Setting the scene’, ‘How eating a particular food may<br />
improve health outcomes’, and ‘Practical considerations for health professionals’ sections) if they<br />
met the following criteria:<br />
the study was a high quality randomised controlled trial, intervention, cohort, or<br />
observational study, but not an editorial or opinion piece (meta-analyses were<br />
considered)<br />
the outcome of the study related to some aspect of health or chronic disease<br />
<strong>DRAFT</strong> <strong>Australian</strong> <strong>Dietary</strong> <strong>Guidelines</strong>- December 2011 16
the study results were generalisable to the <strong>Australian</strong> population<br />
the study was related to foods or the total diet rather than nutrients.<br />
While they did not influence the Evidence Statements or grading’s, these sources were used to<br />
assist in refining translation of the evidence.<br />
1.4.2 How the evidence was used<br />
Getting the guideline wording right<br />
The final wording of each recommendation was developed by a Working Committee consensus<br />
approach, based on the information gained from the five key sources listed Section 1.4.1.<br />
<strong>For</strong> example, to translate all available evidence regarding consumption of vegetables and health<br />
outcomes to develop dietary guideline recommendations the following evidence was considered:<br />
the graded Evidence Statements (from Grade A through to C) about the relationship<br />
between consumption of vegetables and various health outcomes [14]<br />
the importance of vegetables as a source of key nutrients in the <strong>Australian</strong> diet from the<br />
Food Modelling document [10] and the NRV document [9]<br />
the relatively low energy content of vegetables [9, 10]<br />
findings of international authoritative reports including the World Cancer Research Fund<br />
report [42]<br />
information provided in the 2003 <strong>Dietary</strong> <strong>Guidelines</strong> [37].<br />
Assessment of all available sources of evidence confirmed the importance of consumption of<br />
vegetables for promoting health and wellbeing. The Working Committee translated this evidence<br />
into the recommendation to ‘eat plenty of vegetables’.<br />
Using Evidence Statements<br />
The manner in which Evidence Statements were developed is described in Section 1.4.1. In the<br />
sections titled ‘Evidence’, all the graded evidence statements are underpinned by evidence from<br />
the Evidence Report, and referred to clearly in the text in these sections. This section also<br />
includes relevant ungraded referenced evidence from the other four key sources (see Section<br />
1.4.1) to ensure comprehensiveness and currency. These Evidence sections provide the basis of<br />
the scientific information that was translated to form each guideline recommendation at the<br />
beginning of each chapter.<br />
To ensure the <strong>Guidelines</strong> are realistic, practical and achievable, the scientific and social context for<br />
each Guideline was considered. This information is included for each Guideline under the heading<br />
‘Setting the Scene’.<br />
<strong>DRAFT</strong> <strong>Australian</strong> <strong>Dietary</strong> <strong>Guidelines</strong>- December 2011 17
Potential mechanisms through which particular dietary patterns may influence health were<br />
considered to help assess the plausibility of the associations described in the Evidence sections.<br />
This information is included for each Guideline under the heading ‘How a particular food/dietary<br />
pattern may improve health outcomes’.<br />
This information has originated predominantly from previous dietary guidelines series, updated by<br />
narrative reviews of additional literature sourced from authoritative reports, from the Food<br />
Modelling Report, from the NRV document [9] and from high quality studies published since the<br />
last <strong>Dietary</strong> <strong>Guidelines</strong> in 2003.<br />
1.5 Adherence to dietary advice in Australia<br />
Adherence to dietary recommendations in Australia is poor [43]. Most children’s intake of<br />
vegetables, fruit, grain (cereal) foods and milk, yoghurt and cheese products and alternatives is<br />
below recommended levels, while their intake of saturated fat and sugar exceed recommendations<br />
[13]. Analysis of Australia’s 1995 National Nutrition Survey [44] found that energy-dense, nutrientpoor<br />
‘extra foods’ [45] contributed 41% of the total daily energy intake of 2–18 year olds [46].<br />
The most recent dietary data available for <strong>Australian</strong> adults (collected in the 1995 National<br />
Nutrition Survey) also showed a poor dietary pattern with inadequate intakes of vegetables, fruit,<br />
wholegrain cereals and milk, yoghurt and cheese products and alternatives, with higher than<br />
recommended proportions of fat intake derived from saturated fat [44, 47]. More than 35% of<br />
daily energy intake was derived from energy-dense nutrient-poor ‘extra foods’ [46].<br />
There have been changes in the intakes of macro-nutrients over the past three decades, generally<br />
in the direction encouraged by previous dietary guidelines (see Table 1.1) [48].<br />
<strong>DRAFT</strong> <strong>Australian</strong> <strong>Dietary</strong> <strong>Guidelines</strong>- December 2011 18
Table 1.1: Changes in macronutrient intake in Australia for adults and children/adolescents<br />
between 1983 and 1995<br />
Nutrient /<br />
indicator<br />
Adults (25–64 years) 1983 to<br />
1995<br />
Direction (a)<br />
Energy Increased Men 3%<br />
Women 4%<br />
Extent of<br />
change Direction (a)<br />
Adolescents (10–15 years) 1985<br />
to 1995<br />
Extent of<br />
change<br />
Increased Boys 15%<br />
Girls 11%<br />
Protein Unchanged - Increased Boys 14%<br />
Girls 13%<br />
Carbohydrate Increased Men 17%<br />
Women 16%<br />
Fat Decreased Men 6%<br />
Women 4%<br />
<strong>Dietary</strong> fibre Increased Men 13%<br />
Women 10%<br />
Note: (a) Where there is a trend in mean intake it is significant at 1% level.<br />
Source: Cook et al. 2001 [48]<br />
Barriers to compliance<br />
Increased Boys 22%<br />
Girls 18%<br />
Unchanged<br />
Increased Boys 13%<br />
Girls 8%<br />
Influences on dietary choices throughout life are complex, ranging from individual, physical and<br />
social factors through to societal and environmental factors [49-87].<br />
Possible barriers to compliance with recommendations may include poor communication of<br />
advice, low levels of understanding of the information, low levels of food literacy and high levels of<br />
food insecurity (this may include the inability to access adequate amounts of nutritious, culturally<br />
acceptable foods), conflicting messages (including advertising and promotion of energy-dense<br />
nutrient-poor foods and drinks), and particular dietary preferences [88, 89].<br />
There appear to be complex relationships between dietary patterns established in childhood and<br />
dietary quality over time. Studies suggest that frequency of takeaway food consumption increases<br />
during childhood, adolescence and young adulthood [90] and, together with consumption of lowquality<br />
snacks, is associated with higher intakes of energy, total fat, saturated fat and sodium [75-<br />
77, 90]. The frequency of eating breakfast decreases with age and is associated with reduced<br />
intake of calcium and dietary fibre [91]. There is some evidence that family meal patterns during<br />
<strong>DRAFT</strong> <strong>Australian</strong> <strong>Dietary</strong> <strong>Guidelines</strong>- December 2011 19
adolescence predict diet quality and meal patterns during early young adulthood [92]. Childhood<br />
smoking is also associated with poor dietary habits [78, 83] as is stressful family life [86, 87].<br />
Challenges for adoption of the <strong>Guidelines</strong><br />
An improved understanding of what <strong>Australian</strong>s are eating will assist the implementation and<br />
uptake of the <strong>Guidelines</strong> which provide the evidence for what <strong>Australian</strong>s should be eating. Much of<br />
our current knowledge of adult <strong>Australian</strong> dietary patterns comes from the National Nutrition<br />
Survey 1995, however the <strong>Australian</strong> <strong>Health</strong> Survey 2011 – 2013 [93] will provide a better<br />
understanding of the current diet and nutrition of <strong>Australian</strong>s, or what <strong>Australian</strong>s are eating.<br />
Although the key messages of the <strong>Guidelines</strong> may not have changed significantly since 2003, the<br />
evidence base supporting them has strengthened considerably. The challenge now is to ensure that<br />
these <strong>Guidelines</strong> – particularly with renewed emphasis on achieving and maintaining a healthy<br />
weight – are strongly promoted in a context that encourages and supports more nutritious food<br />
choices, dietary patterns and healthy lifestyles within the community.<br />
1.6 <strong>Dietary</strong> choices and the environment<br />
Increasingly, <strong>Australian</strong>s are seeking advice from health and medical practitioners about food<br />
choices and their possible impact on the environment. These concerns, coupled with a growing<br />
population, means rethinking matters of food security, what is available to eat, and more<br />
importantly what people are recommended to eat [94-97].<br />
<strong>Dietary</strong> guidelines evolve as knowledge grows. Preliminary work indicates that dietary patterns<br />
consistent with the <strong>Dietary</strong> <strong>Guidelines</strong> are likely to have a lower environmental impact than other<br />
dietary patterns. Available <strong>Australian</strong> and international evidence is insufficient to be able to provide<br />
advice on the environmental impact of specific food items or brands, however there may be some<br />
practical steps that people can take. <strong>For</strong> example:<br />
Buy and consume foods and drinks that are consistent with the <strong>Dietary</strong> <strong>Guidelines</strong><br />
Avoid overconsumption<br />
Minimise food wastage<br />
Consider your food buying, storage, preparation and disposal practices, and<br />
Minimise and recycle the packaging of food<br />
NHMRC aims to work with other agencies to provide guidance for health professionals as they<br />
work with clients and patients. Many complex interactions exist as food is grown, transported,<br />
sold and consumed. As a health agency, NHMRC will need partners to achieve this aim of<br />
providing useful, practical and well informed advice to both health professionals and the general<br />
<strong>DRAFT</strong> <strong>Australian</strong> <strong>Dietary</strong> <strong>Guidelines</strong>- December 2011 20
population. NHMRC intends to work with other Commonwealth government agencies to develop<br />
this guidance. 1<br />
As public health professionals throughout the world increasingly provide advice on the interaction<br />
between food choices and the environment, they will need expert advice on how the food system,<br />
including the production, processing, retail and distribution, preparation, consumption and disposal<br />
of waste all have implications for the environment. The <strong>Australian</strong> <strong>Dietary</strong> <strong>Guidelines</strong> must consider<br />
the <strong>Australian</strong> context, as some food production and subsequent handling differs considerably to<br />
that which occurs in North America and Europe, where much of the literature originates.<br />
NHMRC acknowledges and understands the need to develop <strong>Australian</strong> guidance, taking into<br />
account these factors, and the <strong>Australian</strong> food regulatory framework.<br />
Environmental issues in the production, processing and sale of food are hotly debated areas, but<br />
increasingly, numbers of international bodies charged with dietary advice are beginning to consider<br />
this issue, as NHMRC intends to as discussed above. However, despite the complexities<br />
surrounding food choices, it is clear that the general principles of these <strong>Dietary</strong> <strong>Guidelines</strong> are<br />
compatible with reducing environmental impacts as well as promoting good health.<br />
1.7 How to use the <strong>Guidelines</strong><br />
This edition of the <strong>Australian</strong> <strong>Dietary</strong> <strong>Guidelines</strong> has been developed as a single comprehensive<br />
report covering all healthy <strong>Australian</strong>s. The <strong>Guidelines</strong> will be supported by a number of brochures<br />
and booklets for parents of infants, children and adolescents, the general population, pregnant and<br />
breastfeeding women and Aboriginal and Torres Strait Islanders, which can be found at<br />
www.eatforhealth.gov.au. The Infant Feeding <strong>Guidelines</strong> for <strong>Health</strong> Workers has also been updated as<br />
part of a separate process (see www.eatforhealth.gov.au).<br />
The chapters in the <strong>Guidelines</strong> use a consistent approach with three main subheadings for each<br />
guideline.<br />
Setting the Scene, which provides a brief background to the topic.<br />
Evidence, which outlines the scientific evidence base since 2002 from studies of associations<br />
between human consumption patterns and health outcomes, and the effects of dietary<br />
interventions on health outcomes relating to foods, food groups and whole dietary<br />
patterns.<br />
How eating a particular food (or particular dietary pattern) may improve health outcomes,<br />
describes the mechanisms of action that may underlie the evidence presented.<br />
1 These agencies have a distinct role in this field, and more information on environmental sustainability and food<br />
security is available at their websites www.daff.gov.au and www.environment.gov.au.<br />
<strong>DRAFT</strong> <strong>Australian</strong> <strong>Dietary</strong> <strong>Guidelines</strong>- December 2011 21
Practical considerations for health professionals, which identifies practical issues and health<br />
impacts for subgroups within the population including at different life stages.<br />
<strong>Dietary</strong> guidelines can be effective in directing attention to the types of food people should<br />
consume, but there remains a need to focus on the amount of food consumed. Overconsumption,<br />
even of nutritious foods, can lead to excessive energy intake compared to need and thereby an<br />
increase in body weight.<br />
1.8 The <strong>Australian</strong> Guide to <strong>Health</strong>y <strong>Eat</strong>ing<br />
While the <strong>Australian</strong> <strong>Dietary</strong> <strong>Guidelines</strong> provide broad dietary advice, with the underpinning<br />
evidence, the <strong>Australian</strong> Guide to <strong>Health</strong>y <strong>Eat</strong>ing is a practical, pictorial guide to recommended types<br />
and serves of foods to consume every day[10, 14]. It also includes information on standard serve<br />
sizes for different food types.<br />
The recommended foods and number of daily serves for different population groups have been<br />
included in each of the Guideline chapters under ‘Practical Considerations’, and are also available at<br />
www.eatforhealth.gov.au.<br />
<strong>DRAFT</strong> <strong>Australian</strong> <strong>Dietary</strong> <strong>Guidelines</strong>- December 2011 22
Figure 1.2: <strong>Australian</strong> Guide to <strong>Health</strong>y <strong>Eat</strong>ing<br />
<strong>DRAFT</strong> <strong>Australian</strong> <strong>Dietary</strong> <strong>Guidelines</strong>- December 2011 23
2. <strong>Eat</strong> a wide variety of nutritious foods<br />
Guideline 1<br />
<strong>Eat</strong> a wide variety of nutritious foods from these five groups every day:<br />
plenty of vegetables, including different types and colours, and<br />
legumes/beans<br />
fruit<br />
grain (cereal) foods, mostly wholegrain, such as bread, cereals, rice, pasta,<br />
noodles, polenta, couscous, oats, quinoa and barley<br />
lean meat and poultry, fish, eggs, nuts and seeds, and legumes/beans<br />
milk, yoghurt, cheese and/or their alternatives, mostly reduced fat (reduced<br />
fat milks are not suitable for children under 2 years).<br />
And drink water.<br />
<strong>DRAFT</strong> <strong>Australian</strong> <strong>Dietary</strong> <strong>Guidelines</strong>- December 2011 24
Executive Summary<br />
<strong>Dietary</strong> patterns which include a wide variety of nutritious foods are more likely<br />
to meet nutrient requirements, promote health and wellbeing and confer health<br />
benefits than restricted diets.<br />
A variety of foods should be consumed from each of the five food groups:<br />
vegetables and legumes/beans; fruit; grain (cereal) foods mostly wholegrain; lean<br />
meat and poultry, fish, eggs, nuts and seeds, and/or legumes/beans; and milk,<br />
yoghurt, cheese and/or alternatives. Mostly reduced-fat milk, yoghurt and cheese<br />
products are recommended for adults, but reduced fat milks are not suitable as<br />
the main milk drink for children under the age of two years.<br />
There are many different ways to combine these nutrient-dense foods to produce<br />
nutritious dietary patterns that suit cultural, economic, social and culinary<br />
preferences, as well as delivering health benefits.<br />
There is increasing evidence that current consumption patterns are associated with<br />
reduced risk of chronic disease including cardiovascular disease, type 2 diabetes,<br />
and several cancers.<br />
Together with adherence to Guideline 2 (on limiting intake of specific foods high in<br />
saturated fat, sugar and/or salt) and Guideline 3 (on achieving and maintaining a<br />
healthy weight), consumption of a wide variety of nutritious foods and choosing<br />
water as a drink will substantially reduce the risk of diet-related chronic disease<br />
and promote health and wellbeing in Australia.<br />
This chapter provides information on why the consumption of a wide variety of<br />
nutritious foods is beneficial to health, the evidence for the recommended<br />
approach, and includes practical advice for the general population and specific<br />
subpopulation groups.<br />
<strong>DRAFT</strong> <strong>Australian</strong> <strong>Dietary</strong> <strong>Guidelines</strong>- December 2011 25
2.1 <strong>Eat</strong> a wide variety of nutritious foods<br />
2.1.1 Setting the scene<br />
No single food - with the exception of breastmilk for about the first six months of life - can<br />
provide all the nutrients in the amounts needed for good health. <strong>Dietary</strong> patterns which include a<br />
wide variety of nutritious foods and water are more likely than restricted diets to meet nutrient<br />
requirements [9] and confer health benefits. A dietary pattern needs to include a variety of choices<br />
from each of the five food groups – vegetables, fruit, grain (cereal) foods, lean meat and poultry,<br />
fish, eggs, nuts and seed and legumes/beans, and milk, yoghurt, cheese and/or alternatives.<br />
Most <strong>Australian</strong>s today eat a wide variety of foods from different cuisines. The available food<br />
supply generally meets the nutritional needs of the population, but appropriate choices must be<br />
made to ensure that all nutrient requirements are met, so that diet-related chronic disease can be<br />
prevented or delayed, and so that optimum health and wellbeing can be achieved [10]. Australia is<br />
also fortunate in having a safe food supply with low levels of contaminants and pollutants[98].<br />
The most recent dietary survey data available for <strong>Australian</strong> adults – the National Nutrition Survey<br />
1995 – showed an increasing number of foods being consumed by adults in that year compared<br />
with 1983 [44]. It is expected that the variety of foods consumed has continued to increase since<br />
1995. This is largely as a result of cultural diversity in the population arising from waves of<br />
immigration from European countries after World War II and Asian and African countries since<br />
the 1970s [99, 100]. Initially, new varieties of fresh fruit and vegetables, grain (cereal) foods and<br />
different types of meat and legume/beans became available. Increasing demand for convenience<br />
and/or fast foods - also as a result of changes in social and economic conditions - has led to the<br />
availability of approximately 30,000 different types of foods and drinks [101]. However, many of<br />
these - particularly snack and fast foods and drinks - are energy-dense and nutrient-poor, so care<br />
is required to choose diets consistent with the <strong>Guidelines</strong> [102].<br />
Despite the variety of foods available in Australia, comparison of actual intakes with recommended<br />
nutrient intakes [9] shows that some people are still at risk for deficiencies of particular nutrients.<br />
<strong>For</strong> example, intakes of iron and calcium continue to be low in relation to recommendations for<br />
some girls and women of reproductive age [10] and iodine intake is inadequate in some pregnant<br />
and breastfeeding women [103].<br />
Consuming a dietary pattern consistent with the evidence presented in this chapter will help to<br />
promote health, protect against disease and reduce the prevalence of nutrient deficiencies.<br />
Together with adherence to Guideline 2 and Guideline 3, adherence to this guideline will help to<br />
reduce the risk of diet-related chronic disease such as cardiovascular disease, type 2 diabetes and<br />
some cancers [9, 10, 14], and promote health and wellbeing.<br />
<strong>DRAFT</strong> <strong>Australian</strong> <strong>Dietary</strong> <strong>Guidelines</strong>- December 2011 26
Consuming a wide variety of foods may also help to ensure that an adequate variety of foods<br />
remains available into the future. Food choices to reduce the impact on the environment are<br />
consistent with those to improve health.<br />
2.1.2 The evidence for ‘<strong>Eat</strong> a wide variety of nutritious<br />
foods’<br />
Evidence of the health benefits of a dietary pattern consisting of a variety of nutritious foods in<br />
appropriate amounts has strengthened over the past decade. The evidence suggests that high diet<br />
quality is associated with a reduced risk of chronic disease and improved health outcomes (Grade<br />
C, Section 20.3 in Evidence Report [14]) [22, 104-107]. Reviews of studies of a range of eating<br />
patterns suggest that:<br />
higher quality diet is associated with reduced morbidity<br />
the health effects tend to be greater in those with lower quality diets, such as men, young<br />
people and people with lower educational and socioeconomic status<br />
consuming a dietary intake pattern consistent with national dietary guidelines or other<br />
scientifically informed recommendations is associated with reduced morbidity and mortality<br />
(Grade C, Section 20.3 in Evidence Report [14]) [21, 22].<br />
Recent evidence also confirms that a dietary pattern consistent with current guidelines to<br />
consume a wide variety of foods including vegetables, fruit, wholegrains, lean meat, poultry, fish<br />
and reduced-fat milk, yoghurt and cheese products may be associated with superior nutritional<br />
status, quality of life and survival in older adults [23, 24].<br />
The evidence statements and gradings (A- convincing association, B- probable association, C-<br />
suggestive association) related to ‘eat a wide variety’ from the Evidence Report (literature from<br />
years 2002 – 2009) are presented in the table below. This does not include evidence from other<br />
sources, such as the 2003 <strong>Dietary</strong> <strong>Guidelines</strong> (where evidence was classified as level I, II or III in<br />
which individual studies were classified according to their design but overall grades for<br />
relationships were not derived), although these sources have been used to inform the <strong>Guidelines</strong>.<br />
Evidence Statement Grade<br />
The evidence suggests that high quality diet is associated with a reduced risk of<br />
chronic disease and improved health outcomes.<br />
The evidence suggests the consumption of a dietary intake pattern aligned with<br />
national dietary guidelines or recommendations is associated with reduced morbidity<br />
and mortality.<br />
<strong>DRAFT</strong> <strong>Australian</strong> <strong>Dietary</strong> <strong>Guidelines</strong>- December 2011 27<br />
C<br />
C
2.1.3 How eating a wide variety of nutritious foods may<br />
improve health outcomes<br />
Nutritional science has traditionally characterised foods according to their macro- and micronutrient<br />
values, but there is increasing evidence of the role that whole foods play in promoting<br />
health and wellbeing, and of the role of food components other than nutrients in protecting<br />
against some communicable and non-communicable chronic diseases when consumed as part of a<br />
varied nutritious diet [108, 109]. These non-nutrient components include phytochemicals, which<br />
are obtained from plants and are biologically active but not directly associated with deficiency<br />
syndromes. They include carotenoids, flavonoids, isoflavonoids, polyphenols, isothiocyanates,<br />
indoles, sulphoraphanes, monoterpenes, xanthins and non-digestible oligosaccharides. It is not<br />
always known which food constituents are responsible for the protective effects of specific foods<br />
against specific chronic diseases, and it is likely that many other active constituents will be<br />
discovered in the future. Interactions between these compounds are likely to be complex, either<br />
causing or masking effects, or acting synergistically with other compounds [10].<br />
<strong>Dietary</strong> variety has the benefit of diluting potential toxicants found naturally in foods [110].<br />
Enjoying diversity in food intake can reduce an individual’s exposure to any one group of toxicants.<br />
Other ways of minimising this risk include appropriate and careful processing, cooking and storage<br />
of food (see Chapter 7).<br />
Another potential benefit of food variety comes from maximising the bioavailability of nutrients<br />
[111]. The many complex relationships between foods, nutrients and food components (such as<br />
phytates) can influence the absorption, metabolism and retention of nutrients. When dietary<br />
patterns are varied and nutrients are in adequate supply, these interactions pose fewer problems<br />
than in restricted, monotonous dietary patterns.<br />
Clinical problems associated with excessive intake of nutrients are nearly always associated with<br />
intakes of supplements [9]. It is also possible to develop symptoms of toxicity when dietary<br />
patterns concentrate on particular foods, or if the same nutrient is consumed in different chemical<br />
forms [9, 112]. Examples include excessive consumption of carrot juice or regularly eating very<br />
large quantities of liver, which may cause vitamin A toxicity [113].<br />
2.1.4 Practical considerations: <strong>Eat</strong> a wide variety of<br />
nutritious foods<br />
It is important to consider this guideline together with other guidelines, particularly Guideline 2 on<br />
limiting intakes of specific foods high in saturated fats, added sugars and/or added salt and<br />
Guideline 3 on healthy weight. The word ‘plenty’ is used judiciously to encourage increased<br />
consumption of vegetables (particularly non-starchy varieties). <strong>For</strong> the other food groups, the<br />
guidelines do not advocate plenty, but rather focus on an adequate amount of the preferred<br />
<strong>DRAFT</strong> <strong>Australian</strong> <strong>Dietary</strong> <strong>Guidelines</strong>- December 2011 28
varieties within each food group, for example wholegrain, or lean, or lower fat and plain water,<br />
preferably from the tap. This serves to distinguish between eating a variety and over-consumption as<br />
there is some evidence that there may be a link between eating a variety of energy-dense food and<br />
drinks and excessive food intakes (see Chapter 4). Variety refers to nutritious food, not<br />
discretionary foods.<br />
Different quantities of different types of foods from the five food groups are recommended for<br />
different ages, sexes, and those with different energy (kilojoule) intake requirements. These are<br />
based on dietary modelling to inform the revised <strong>Australian</strong> Guide to <strong>Health</strong>y <strong>Eat</strong>ing [10]. <strong>For</strong><br />
example, men aged 19-50 need to eat around 19.5 – 22.5 serves of food from the five food groups<br />
each day while 19-50 year old women need to eat 18 – 20.5 serves from these five food groups.<br />
Detailed information on the number and types of serves of food for different population groups is<br />
in the <strong>Australian</strong> Guide to <strong>Health</strong>y <strong>Eat</strong>ing [114].<br />
2.1.4.1 Pregnant and breastfeeding women<br />
Consuming a variety of nutritious foods is particularly important during pregnancy and while<br />
breastfeeding. Quality nutritious dietary patterns during pregnancy may reduce the risk of babies<br />
being small for their gestational age or exhibiting restricted intrauterine foetal growth [115-117],<br />
being large for their gestational age [118], and may also help reduce the risk of pregnant women<br />
developing pre-eclampsia [119, 120]. Quality nutritious dietary patterns before and during<br />
pregnancy may help reduce the risk of women developing gestational diabetes mellitus [120-123].<br />
Maternal diet during pregnancy and while breastfeeding does not appear to affect the risk of<br />
asthma, eczema or other allergy symptoms in infants [124-128]. Some health outcomes (such as<br />
allergies) in children will be affected more by their diet through infancy and childhood than their<br />
mother’s diet during pregnancy, with in-utero influences likely to be minimal. However, a cohort<br />
study found that mothers who adopt high quality dietary patterns are more likely to have children<br />
who also consume nutritious diets [129].<br />
Foods that should be avoided during pregnancy include those associated with increased risk of<br />
Listeria bacteria, such as soft cheeses, cold seafood, sandwich meats, bean sprouts and packaged or<br />
pre-prepared salads [130]. Intake of certain species of fish should be limited, due to the potential<br />
risk of excessive mercury intake. Pregnant women are advised to consume no more than one<br />
serve per fortnight of shark, marlin or broadbill/swordfish, and no other fish that fortnight, or one<br />
serve per week of orange roughy (deep sea perch) and no other fish that week [130, 131].<br />
Constipation is a common symptom during pregnancy [132]. Clinical treatment of constipation<br />
generally includes advice to consume a high fibre diet, including wholegrain cereals, fruit, and<br />
vegetables, and to drink water, which is consistent with these <strong>Guidelines</strong>.<br />
<strong>DRAFT</strong> <strong>Australian</strong> <strong>Dietary</strong> <strong>Guidelines</strong>- December 2011 29
2.1.4.2 Infants<br />
Exclusive breastfeeding is recommended for around the first six months of age, after which solid<br />
(pureed or spoon) foods of suitable texture can be introduced. There is no particular order or<br />
rate for the introduction of new foods, other than the first foods should be rich in iron.<br />
Breastfeeding should continue until 12 months and beyond for as long as the mother and child<br />
desire (for more information, see the Infant Feeding <strong>Guidelines</strong> for <strong>Health</strong> Workers [133]), Food<br />
choices should be varied to ensure adequate energy (kilojoule) and nutrient supply.<br />
When introducing solids (spoon foods) to infants, parents and carers should ensure that a wide<br />
variety of nutritious foods of different colours, suitable textures and types is offered. This will<br />
provide the additional nutrients required as infants grow and the variety will help to increase<br />
acceptance of different nutritious foods. It is also more likely to improve the acceptance of a<br />
varied diet during childhood. Hard foods, such as nuts, should not be offered to children until they<br />
are over three years of age and they are sufficiently mature to reduce the risk of choking.<br />
2.1.4.3 Adults<br />
Males living alone are at particular risk of not eating a wide variety of nutritious foods. Analysis of<br />
the 1995 National Nutrition Survey [37] showed that in nearly all age groups adult males consumed<br />
significantly fewer types of foods than other groups.<br />
2.1.4.4 Older people<br />
The diet of older people is generally more varied than that of younger groups [44]. However the<br />
frail elderly are at increased risk of consuming monotonous, limited diets due to factors such as<br />
reduced mobility, poor dentition and poverty which may reduce access to a range of fresh foods.<br />
2.1.4.5 Aboriginal and Torres Strait Islanders<br />
Limited data on Aboriginal and Torres Strait Islander dietary intake are available. Very restricted<br />
dietary patterns - in which over 50% of energy (kilojoule) intake was derived by meat, flour and<br />
sugar - have been described in remote Aboriginal communities [134] with relatively little change<br />
observed recently [135]. However the majority of Aboriginal and Torres Strait Islander people live<br />
in urban areas and their most significant dietary issues tend to be also experienced by all people in<br />
lower socioeconomic groups.<br />
<strong>DRAFT</strong> <strong>Australian</strong> <strong>Dietary</strong> <strong>Guidelines</strong>- December 2011 30
2.1.4.6 People in lower socioeconomic groups<br />
In some urban centres, people in lower socioeconomic groups have less access to supermarkets<br />
and greater access to fast food outlets than more advantaged groups [136, 137]. Supermarkets<br />
generally offer a wider variety of food products, as well as fresh raw food.<br />
In Australia, the cost of a nutritious diet has been estimated to account for about 40% of the<br />
disposable income of welfare-dependent families, compared to only 20% of an average families’<br />
disposable income. <strong>Health</strong> professionals should be aware of the budget challenges which healthy<br />
food habits may pose for people who are welfare dependent and should note that substituting<br />
generic brands for market brands can reduce the weekly food cost by about 13% [138]. Further<br />
details regarding the association of equity issues and consumption of varied and nutritious diets<br />
are included in Appendix 7.<br />
2.1.4.7 People living in remote areas<br />
The decreased availability of nutritious foods (such as fresh fruit and vegetables, wholegrain bread<br />
and low-fat milk products) in remote and regional areas in Australia has been described frequently.<br />
The cost of nutritious foods in these areas is also over 30% higher than in major cities and may<br />
impact on food security [30, 139-141].<br />
2.1.4.8 Vegetarians<br />
About 4% of respondents in the National Nutrition Survey 1995 described themselves as vegetarian<br />
or vegan [44]. The food frequency questionnaire data recorded only 2% as consuming no animal<br />
products, and a further 2% as restricting consumption of animal foods to fish or white meat [44].<br />
Many more people eat vegetarian meals regularly or occasionally. Those following a strict<br />
vegetarian or vegan diet need to choose a variety of protein sources throughout the day to get an<br />
adequate mix of amino acids. <strong>Health</strong> professionals should encourage vegetarians to choose foods<br />
carefully to ensure adequate intake of iron, zinc and vitamin B12 and to optimise the absorption<br />
and bioavailability of iron, zinc and calcium [142].<br />
<strong>DRAFT</strong> <strong>Australian</strong> <strong>Dietary</strong> <strong>Guidelines</strong>- December 2011 31
2.2 Plenty of vegetables, including different<br />
types and colours, and legumes/beans, and eat<br />
fruit<br />
2.2.1 Setting the scene<br />
There are many nutritional, societal, culinary and environmental reasons to ensure that vegetables,<br />
including legumes/beans, and fruit are a major component of <strong>Australian</strong> dietary patterns. As a<br />
group, these foods are nutrient dense, relatively low in energy (kilojoules) and are good sources of<br />
minerals and vitamins (such as magnesium, vitamin C and folate), dietary fibre and a range of<br />
phytochemicals including carotenoids. Many of the sub-components of foods and their<br />
relationships have not been studied in detail, and it is expected that other sub-components, and<br />
their biological effects, are still to be discovered.<br />
The inclusion of a variety of vegetables, including legumes/beans, and fruit provides a diversity of<br />
colours, textures and flavours, adding to the enjoyment of eating. Vegetables, including<br />
legumes/beans, and fruit should be eaten in their whole food forms to maximise the impact on a<br />
range of health benefits. Fruit should mostly be eaten fresh and raw because of the low fibre<br />
content of fruit juice and the high energy density and ‘stickiness’ (which may have implications for<br />
dental caries) of dried fruit [10]. Some vegetables are suitable to eat raw, while it is best to cook<br />
others to make them more palatable and digestible. Legumes should always be cooked. Some<br />
processed fruits and vegetables are nutritious alternatives as long as they are produced without<br />
added salt, sugar (including concentrated fruit juice) or fat.<br />
Different fruits and vegetables are rich in different nutrients. <strong>For</strong> example, green leafy and Brassica<br />
(or cruciferous) vegetables are generally high in folate, and starchy vegetables are a good source of<br />
complex carbohydrates. Legumes/beans provide a valuable and cost efficient source of protein,<br />
iron, some essential fatty acids, soluble and insoluble dietary fibre and micronutrients for all<br />
<strong>Australian</strong>s, but particularly for those consuming vegetarian meals [10].<br />
The health benefits of consuming diets high in vegetables, including legumes/beans, and fruit have<br />
been reported for decades and are consistently recognised in international dietary guidelines [36,<br />
37, 143, 144].<br />
2.2.2 The evidence for ‘plenty of vegetables’<br />
The scientific evidence of the health benefits of consuming vegetables (including legumes/beans)<br />
has been strong for several decades and has generally continued to strengthen over recent years,<br />
particularly the evidence for a protective effect against cardiovascular disease. Recent research on<br />
<strong>DRAFT</strong> <strong>Australian</strong> <strong>Dietary</strong> <strong>Guidelines</strong>- December 2011 32
vegetable intake and cancer has focused more on investigating the health effects of consuming<br />
different subgroups of vegetables on site-specific cancers than the effect of total vegetable intake.<br />
There is strengthened evidence of the beneficial effects of intake of various non-starchy vegetables<br />
in reducing risk of some site-specific cancers. High dietary intakes of starchy vegetables may help<br />
explain the weaker association between total vegetable intake and many site-specific cancers.<br />
There is also greater clarity on the quantity of vegetables to produce beneficial health effects, plus<br />
increasing evidence of a protective effect against a number of chronic diseases for consumption of<br />
vegetables and fruit when considered together (see Appendix 5).<br />
The evidence statements and gradings (A- convincing association, B- probable association, C-<br />
suggestive association) from the Evidence Report (literature from years 2002 – 2009) are<br />
presented in the table below. This does not include evidence from other sources, such as the 2003<br />
<strong>Dietary</strong> <strong>Guidelines</strong> (where evidence was classified as level I, II or III in which individual studies<br />
were classified according to their design but overall grades for relationships were not derived),<br />
although these sources have been used to inform the <strong>Guidelines</strong>.<br />
Evidence Statement Grade<br />
Consumption of each additional daily serve of vegetables is associated with a reduced<br />
risk of coronary heart disease.<br />
Consumption of vegetables is associated with reduced risk of stroke.<br />
Consumption of vegetables is associated with reduced risk of weight gain<br />
Consumption of vegetables is associated with a reduced risk of oral and nasopharyngeal<br />
cancers.<br />
Consumption of preserved vegetables is associated with increased risk of oral and<br />
nasopharyngeal cancer.<br />
Consumption of 1-2 serves per day of tomato is associated with a reduced risk of<br />
prostate cancer.<br />
Consumption of more than 1 serving per week of spinach is associated with reduced<br />
risk of colorectal cancer.<br />
Consumption of cruciferous vegetables is associated with reduced risk of lung cancer.<br />
Although serving sizes of vegetables differed between studies considered in the Evidence Report<br />
[14], Evidence Statements presented below are based on the <strong>Australian</strong> standard serve size of 75g.<br />
<strong>DRAFT</strong> <strong>Australian</strong> <strong>Dietary</strong> <strong>Guidelines</strong>- December 2011 33<br />
B<br />
B<br />
C<br />
C<br />
C<br />
C<br />
C<br />
C
2.2.2.1 Cardiovascular disease, type 2 diabetes and excess weight<br />
Cardiovascular disease: It is probable that each additional daily serve of vegetables is associated<br />
with a reduced risk of coronary heart disease (Grade B, Section 2.1 in Evidence Report [14]) [145-<br />
150].<br />
It is probable that consumption of vegetables is associated with a reduced risk of stroke (Grade B,<br />
Section 2.4 in Evidence Report [14]) [151, 152]. The protective effect is stronger at higher intakes.<br />
Type 2 diabetes: Recent evidence suggests that consumption of vegetables does not appear to be<br />
directly associated with the risk of type 2 diabetes (Grade C, Section 2.3 in Evidence Report [14])<br />
[153-155]. This supports the inconsistent findings described in other studies for fruit and<br />
vegetables considered together and for fruit alone [154, 155]. However, as there is a strong<br />
relationship between type 2 diabetes and body weight (see Chapter 4), the association between<br />
consumption of vegetables and reduced risk of excessive weight gain (see below) suggests longerterm<br />
studies may be required to further investigate potential effects.<br />
Excess weight: Recent evidence suggests that consuming vegetables is associated with a reduced<br />
risk of weight gain (Grade C, Section 2.2 in Evidence Report [14]) [156-160].<br />
2.2.2.2 Cancer<br />
Oral, nasopharyngeal and oesophageal: Evidence suggests that consuming vegetables is<br />
associated with a reduced risk of oral and nasopharyngeal cancers (Grade C, Section 2.10 in<br />
Evidence Report [14]) [161-165]. This is consistent with the findings described by the WCRF<br />
report [42]. However the evidence also suggests that consumption of preserved vegetables<br />
(salted, dried, fermented or pickled) is associated with increased risk of these cancers (Grade C,<br />
Section 2.10 in Evidence Report [14]) [161-165].<br />
It is unclear from recent studies whether there is an association between total vegetable<br />
consumption and risk of other alimentary cancers, however relationships found previously [36, 37]<br />
still tend to be present when a longer time frame and different types of vegetables are considered<br />
(Section 2 in Evidence Report). Although recent evidence suggests that total consumption of<br />
vegetables is not associated with reduced risk of oesophageal cancer (Grade C, Section 2.9 in<br />
Evidence Report [14]) [166-169], evidence from the WCRF report suggests that consumption of<br />
non-starchy vegetables probably reduces risk of cancer of the oesophagus [42].<br />
Prostate cancer: The evidence suggests that consumption of 1–2 serves of tomatoes a day is<br />
associated with reduced risk of prostate cancer (Grade C, Section 2.13 in Evidence Report [14])<br />
[170, 171]. This is consistent with the probable relationship between intake of lycopene-containing<br />
foods and reduced risk of prostate cancer described by the WCRF report [42].<br />
<strong>DRAFT</strong> <strong>Australian</strong> <strong>Dietary</strong> <strong>Guidelines</strong>- December 2011 34
Endometrial, Ovarian and pancreatic cancer: Previous dietary guidelines reported a possible<br />
reduction in risk of endometrial and pancreatic cancer with vegetable consumption [37]. However,<br />
in more recent studies there is no evidence to suggest an association between total vegetable<br />
consumption and ovarian (Grade C, Section 2.11 in Evidence Report [14]) [172, 173] or<br />
endometrial cancer (Grade C, Section 2.12 in Evidence Report [14]) [174-176]. However findings<br />
from the WCRF report suggest decreased risk of both ovarian and endometrial cancer with<br />
consumption of non-starchy vegetables specifically [42].<br />
Colorectal cancer: The evidence suggests no association between consumption of green leafy,<br />
cruciferous vegetables, or carrots, potatoes, beans or lentils and risk of colorectal cancer (Grade<br />
C, Section 2.15 in Evidence Report [14]) [177]. More specific studies suggest that consumption of<br />
more than one serving per week of spinach is associated with reduced risk of colorectal cancer<br />
(Grade C, Section 2.15 in Evidence Report [14]) [177] and evidence of a suggestive protective<br />
effect of intake of non-starchy vegetables on colorectal cancer has been described by the WCRF<br />
report [42].<br />
Lung cancer: Recent evidence [178] suggests consuming cruciferous vegetables is associated with<br />
reduced risk of lung cancer (Grade C, Section 2.14 in Evidence Report [14]). The World Cancer<br />
Research Fund report found evidence of a probable association with the reduced risk of lung<br />
cancer with consumption of vegetables containing carotenoids and also found evidence suggesting<br />
that non-starchy vegetables were protective of lung cancer [42]. This supports the notion that<br />
different types of vegetables may have different effects which may help to explain conflicting results<br />
seen when all vegetables are grouped together in varying proportions in different studies.<br />
Other cancers: Recent evidence is limited and/or inconclusive for the association regarding<br />
vegetable consumption and gastric, breast, lung and colorectal cancers (Section 2.5, 2.6, 2.7 & 2.8<br />
in Evidence Report [14]).<br />
2.2.2.3 Other conditions<br />
The previous dietary guidelines included evidence of associations between the consumption of<br />
vegetables and some aspects of eye health, including cataracts and macular degeneration of the eye<br />
[37]. Further evidence was not available from more recent studies [179].<br />
<strong>DRAFT</strong> <strong>Australian</strong> <strong>Dietary</strong> <strong>Guidelines</strong>- December 2011 35
2.2.3 The evidence for ‘plenty of legumes/beans’<br />
While evidence of the health benefits of consumption of legumes/beans appears to have<br />
strengthened since the 2003 <strong>Dietary</strong> <strong>Guidelines</strong>, the recent research is dominated by studies into<br />
the health benefits of soy foods and products rather than investigations into legumes per se 2 .<br />
The evidence statements and gradings (A- convincing association, B- probable association, C-<br />
suggestive association) from the Evidence Report (literature from years 2002 – 2009) are<br />
presented in the table below. This does not include evidence from other sources, such as the 2003<br />
<strong>Dietary</strong> <strong>Guidelines</strong> (where evidence was classified as level I, II or III in which individual studies<br />
were classified according to their design but overall grades for relationships were not derived),<br />
although these sources have been used to inform the <strong>Guidelines</strong>.<br />
Evidence Statement Grade<br />
Consumption of soy foods is associated with reduced total cholesterol and LDLcholesterol.<br />
Consumption of legume foods is associated with reduced risk of colorectal cancer. C<br />
Recent evidence confirms a protective effect for consumption of legumes, and particularly soy<br />
foods, against several risk factors and diseases. However more research is needed to determine<br />
the quantities of legume/beans required to produce health benefits, long-term efficacy, and the<br />
relative effect of legume foods, including of soy-based foods themselves, as opposed to food<br />
components such as isoflavones.<br />
2.2.3.1 Cardiovascular disease, type 2 diabetes and excess weight<br />
Cardiovascular disease: Recent evidence suggests that consumption of soy foods is associated<br />
with reduced total cholesterol and LDL cholesterol levels, as markers for coronary heart disease<br />
risk (Grade C, Section 7.4 in Evidence Report [14]) [180].<br />
Type 2 diabetes: No recent studies of the relationship between legumes/beans and type 2<br />
diabetes were identified [14].<br />
Excess weight: No recent studies of the relationship between legumes/beans and weight loss<br />
were identified [181-183].<br />
2 The evidence presented here was reviewed with a focus on whole foods, and for this reason studies of soy isolates<br />
are not reported.<br />
<strong>DRAFT</strong> <strong>Australian</strong> <strong>Dietary</strong> <strong>Guidelines</strong>- December 2011 36<br />
C
2.2.3.2 Cancer<br />
Colorectal cancer: Evidence suggests that consuming legumes is associated with reduced risk of<br />
colorectal cancer (Grade C, Section 7.3 in Evidence Report [14]) [184-188]. However, in one<br />
study the effect was only significant for women [187], as also seen in the recent analysis of the<br />
European Prospective Investigation into Cancer and Nutrition (EPIC) database [189]. However no<br />
evidence of an association between consumption of legumes and colorectal cancer was described<br />
in the WCRF report [42].<br />
Other cancers: Recent evidence is limited and/or inconclusive for an association regarding<br />
legume/bean consumption and breast or prostate cancer (Section 7.1 & 7.2 in Evidence Report<br />
[14]). An insufficient number of studies were available to form an evidence statement on<br />
legume/bean consumption and gastric cancer. However the WCRF report found limited evidence<br />
of a relationship between the consumption of legumes and a decreased risk of gastric cancer [42].<br />
2.2.3.3 Other conditions<br />
Recent evidence is limited and/or inconclusive regarding an association between consumption of<br />
soy foods and bone fracture in post-menopausal women, cerebral and myocardial infarct, and<br />
mortality due to cardiovascular disease and high blood pressure.<br />
2.2.4 The evidence for ‘eat fruit’<br />
Evidence for the health advantages of including fruit in the diet has been strong for decades, but<br />
has strengthened considerably recently, particularly for cardiovascular disease. There is also<br />
increasing evidence of a protective effect against a number of chronic diseases for consumption of<br />
vegetables and fruit when considered together (see Appendix 5). Protective effects are increasingly<br />
described in quantitative terms, although different serve sizes have been used in different studies,<br />
which make comparison difficult, while findings about dose response are not always consistent<br />
across studies.<br />
The evidence statements and gradings (A- convincing association, B- probable association, C-<br />
suggestive association) from the Evidence Report (literature from years 2002 – 2009) are<br />
presented in the table below. This does not include evidence from other sources, such as the 2003<br />
<strong>Dietary</strong> <strong>Guidelines</strong> (where evidence was classified as level I, II or III in which individual studies<br />
were classified according to their design but overall grades for relationships were not derived),<br />
although these sources have been used to inform the <strong>Guidelines</strong>.<br />
<strong>DRAFT</strong> <strong>Australian</strong> <strong>Dietary</strong> <strong>Guidelines</strong>- December 2011 37
Evidence Statement Grade<br />
Consumption of each additional daily serve of fruit is associated with a reduced<br />
risk of coronary heart disease.<br />
Consumption of at least 1.5 serves of fruit a day, ideally 2.5 or more is associated<br />
with reduced risk of stroke.<br />
Consumption of fruit is associated with a reduced risk of obesity and weight gain.<br />
Consumption of fruit is associated with a reduced risk of oral and nasopharyngeal<br />
cancer<br />
The following studies relate primarily to whole fruit, although some included dried fruit and/or<br />
fruit juice in their definitions of fruit intake. The evidence regarding fruit juice and excess weight is<br />
included under drinks in Section 3.3.2.1. Although serving sizes differed between studies, the<br />
evidence statements presented below are based on standard serve sizes of 150g.<br />
2.2.4.1 Cardiovascular disease, type 2 diabetes and excess weight<br />
Cardiovascular disease: It is probable that consumption of each additional daily serve of fruit is<br />
associated with a reduced risk of coronary heart disease (Grade B, Section 1.1 in Evidence Report<br />
[14]) [145-147]. Increased protection of at least 7% was gained from each additional serve of fruit<br />
consumed per day.<br />
It is probable that consuming at least one and a half serves of fruit a day, ideally two and a half or<br />
more, is associated with a reduced risk of stroke (Grade B, Section 1.2 in Evidence Report [14])<br />
[151, 152].<br />
Type 2 diabetes: The recent evidence suggests that consumption of fruit is not associated with<br />
risk of type 2 diabetes (Grade C, Section 1.4 in Evidence Report [14]). However, as there is a<br />
strong relationship between type 2 diabetes and body weight (see Chapter 4), the association<br />
between consumption of fruit and reduced risk of excessive weight gain (see below) suggests<br />
longer-term studies may be required to investigate potential effects.<br />
Excess weight: The recent body of evidence suggests that consumption of fruit is associated with<br />
a reduced risk of obesity and weight gain (Grade C, Section 1.3 in Evidence Report [14]) [156-160,<br />
190-193].<br />
<strong>DRAFT</strong> <strong>Australian</strong> <strong>Dietary</strong> <strong>Guidelines</strong>- December 2011 38<br />
B<br />
B<br />
C<br />
C
2.2.4.2 Cancer<br />
Alimentary tract cancer: There is emerging evidence that fruit consumption is associated with<br />
reduced risk of several types of cancer along the alimentary tract. The recent body of evidence<br />
suggests that consumption of fruit is associated with a reduced risk of oral and nasopharyngeal<br />
cancer (Grade C, Section 1.10 in Evidence Report [14]) [161, 162, 164, 165, 194], consistent with<br />
findings of a convincing effect on reduced risk of cancers of the mouth, pharynx and larynx and a<br />
suggestive effect on nasopharyngeal cancers described in the WCRF report [42].<br />
Breast cancer, ovarian cancer and endometrial cancer: Expanding on previous reports [37],<br />
recent evidence now suggests that consumption of fruit is not associated with risk of breast<br />
cancer (Grade C, Section 1.6 in Evidence Report [14]) [166, 195-199], ovarian cancer (Grade C,<br />
Section 1.11 in Evidence Report [14]) [172, 173] or endometrial cancer (Grade C, Section 1.12 in<br />
Evidence Report [14]) [174-176, 200].<br />
Colorectal cancer: Recent evidence suggests that consumption of fruit is not associated with risk<br />
of colorectal cancer (Grade C, Section 1.8 in Evidence Report [14]) [166, 177, 194, 199, 201-203].<br />
Further, there is limited evidence to suggest an association between the consumption of most<br />
fruits by specific type and colorectal cancer (Section 1.14 in Evidence Report [14]) [177, 203],<br />
which expands on earlier studies by the WCRF [42].<br />
Other cancers: Recent evidence is limited and/or inconclusive for an association regarding fruit<br />
consumption and gastric, lung, oespohageal and pancreatic cancers (Section 1.5, 1.7, 1.9 & 1.13 in<br />
Evidence Report [14]).<br />
2.2.5 How plenty of vegetables, including different types<br />
and colours, and legumes/beans, and eating fruit may<br />
improve health outcomes<br />
Various mechanisms may explain the different health benefits of diets high in vegetables,<br />
legumes/beans and fruit. These include potential synergies between the foods as well as the action<br />
of specific components found at high levels in these foods, including vitamins and minerals, various<br />
phytochemicals including carotenoids and bioflavonoids (such as anthocyanins and flavonols), as<br />
well as dietary fibre and other specific characteristics of these foods such as low energy<br />
(kilojoules) density.<br />
<strong>DRAFT</strong> <strong>Australian</strong> <strong>Dietary</strong> <strong>Guidelines</strong>- December 2011 39
2.2.5.1 Cardiovascular disease, type 2 diabetes and excess weight<br />
mechanisms<br />
Food components with anti-oxidant activity including vitamins (vitamin C and E) and<br />
phytochemicals in these foods may reduce the risk of inflammation and haemostasis, and of<br />
cholesterol becoming oxidised and deposited in blood vessels to form the atherogenous plaques<br />
that underlie many cardiovascular conditions [180, 204-206]. Several studies have shown that<br />
consumption of vitamin C is associated with reduced risk of cardiovascular disease and stroke,<br />
however, other studies have shown no protective effect [207] [9]. Vegetables and fruit are low in<br />
sodium and saturated fat [10]. Plant foods including vegetables and fruit provide potassium and<br />
magnesium, both of which have been linked to lower blood pressure [9]. Importantly, reviews of<br />
the effect of beta-carotene on coronary heart disease suggest that benefits may be related to the<br />
components of the foods, various antioxidants and micronutrients in these foods or other<br />
confounding factors, rather than to the beta-carotene alone [208].<br />
Most fruit, vegetables and legumes have a low energy (kilojoule) density and high dietary fibre and<br />
water content, providing a plausible mechanism for the association of consumption of these foods<br />
with reduced risk of weight gain. Any effect is likely to be mediated through potentially increasing<br />
satiety, and also through taking longer to chew, which leads to reducing total energy (kilojoule)<br />
intake [9, 10]. High dietary fibre intakes have been linked to lower rates of obesity, type 2 diabetes<br />
and cardiovascular disease, mainly through an effect on plasma cholesterol [9]. The majority of<br />
vegetables are nutrient-dense and low in kilojoules - in particular, green, Brassica and other ‘salad’<br />
vegetables are relatively low in energy (kilojoules) [10]. However, starchy vegetables are less<br />
nutrient-dense and are higher in kilojoules, but provide a rich source of complex carbohydrates<br />
[10].<br />
Diets high in fibre and specific complex carbohydrates such as non-starch polysaccharides have<br />
been used with modest success by people with type 2 diabetes attempting to lose weight. The<br />
small effects seen in these experimental situations might relate to a satiating effect due to the<br />
prolongation of food absorption and a smoothing of the blood glucose response after meals [9].<br />
In the prevention and dietary control of type 2 diabetes, some vegetables are likely to be of<br />
particular value because of their low energy density and relatively high content of dietary fibre,<br />
although longer term studies may be required to demonstrate effects.<br />
Legumes are also believed to confer cardiovascular health benefits because they provide a valuable<br />
low saturated fat source of protein as an alternative to meats, and because of their glycaemic<br />
properties and phytoestrogen and isoflavone content [209, 210]. These reviews suggest the<br />
isoflavone in soy foods may have a role in cholesterol reduction, improved vascular health,<br />
preservation of bone-mineral density [209] and anti-oestrogenic, anti-proliferative, pro-apoptotic,<br />
anti-oxidative and anti-inflammatory processes [210]. However more research is needed to<br />
determine the relative effect of legumes/beans and soy foods themselves as opposed to isoflavones<br />
specifically.<br />
<strong>DRAFT</strong> <strong>Australian</strong> <strong>Dietary</strong> <strong>Guidelines</strong>- December 2011 40
2.2.5.2 Cancer mechanisms<br />
There is no dominant mechanism to explain the protective effect of vegetables, legumes/beans and<br />
fruit for some cancers, and this is complicated by the range of site-specific cancer mechanisms.<br />
Some risk factors for cancer, such as oxidising radiation, can operate primarily from childhood or<br />
early adult life and antioxidants or other protective constituents of vegetables, including<br />
legumes/beans, and fruit may need to be consumed regularly from early life to be effective [211].<br />
Phytochemicals and several vitamins and minerals found in vegetables and fruit are thought to<br />
protect against some cancers by a range of mechanisms. Vegtables in the green leafy and Brassica<br />
subgroup are particularly high in folate [10] and inadequate amounts of folate are thought to<br />
increase the risk of cancer by leading to a rise in homocysteine and megaloblastic changes in bone<br />
marrow and other rapidly dividing tissues [9]. Poor folate status is thought to affect the induction<br />
of DNA hypomethylation, increasing chromosomal fragility or diminishing DNA repair, as well as<br />
increasing secondary choline deficiency, reducing killer cell surveillance, and increasing risk of<br />
faulty DNA synthesis and metabolism of cancer-causing viruses [9]. Some studies have suggested<br />
that folate, primarily from fruit and vegetables, may be more effective in reducing cancer risk<br />
among those with habitual high alcohol intake [212, 213].<br />
Several studies have indicated that vitamin C (found in most fruit and vegetables but particularly in<br />
citrus fruit, capsicum and tomatoes) is protective against cancer, whereas others have not found<br />
convincing evidence of this [9]. Lycopenes found in tomatoes are thought to be protective of<br />
prostate cancer, particularly when tomatoes are cooked in olive oil [42]. Carotenes found<br />
predominantly in orange, red and yellow fruit and vegetables are also thought to be associated<br />
with maintenance of immune function [9]. Dithiolthiones and isothiocyanates (found in Brassica or<br />
cruciferous vegetables) and allyl sulphides (found in Allium vegetables) have been shown to<br />
stimulate detoxification processes [37]. The anti-inflammatory action of other phytochemicals,<br />
such as flavonoids, is also thought to be important in reducing cancer risk [214]. Potatoes are not<br />
as rich in phytochemicals as other types of vegetables, and this may help explain the weaker<br />
association with decreased cancer risk and consumption of starchy vegetables compared with<br />
other vegetables [42]. There is increasing evidence that whole foods are more effective in reducing<br />
risk of cancer than specific vitamin and mineral supplements, and that some supplements may<br />
actually increase risk of cancer [215, 216].<br />
Localised contact with phytochemicals may be an important factor in the aetiology of epithelial<br />
cancers of the alimentary system (oral, oesophagus, stomach and bowel). Proposed protective<br />
mechanisms include:<br />
the reduced formation of cancer-promoting substances in the gastrointestinal tract due to<br />
antioxidant activity<br />
the part played by phytochemicals and micronutrients in the detoxification of carcinogenic<br />
substances<br />
functions relating to the containment and destruction of existing cancer cells by means of a<br />
variety of physiological processes and improved immunological activity against cancer cells<br />
[9, 217].<br />
<strong>DRAFT</strong> <strong>Australian</strong> <strong>Dietary</strong> <strong>Guidelines</strong>- December 2011 41
Vegetables and fruit also provide dietary fibre, the intake of which is thought to reduce the risk of<br />
some cancers [9]. However, although a probable decreased risk of colorectal cancer with intake of<br />
foods containing dietary fibre has been described in the WCRF report [42], only one [218] of the<br />
human trials has shown any benefits of high fibre intakes per se on colon cancer or on markers of<br />
the risk of colon cancer. It may be that the dietary fibre component of these foods is not solely<br />
responsible for any apparent protective effect [9].<br />
2.2.6 Practical considerations: <strong>Eat</strong> plenty of vegetables,<br />
including different types and colours, legumes/beans,<br />
and fruit<br />
Consuming at least five serves of vegetables per day (75g per serve) is recommended for<br />
<strong>Australian</strong> adults, while amounts recommended for children and adolescents depend on their age<br />
and sex. The most recent dietary surveys [13, 44] show that consumption of vegetable and<br />
legumes/beans in Australia is generally less than half that recommended for adults and children,<br />
and the mix of vegetables consumed also needs to be addressed. To meet the recommended food<br />
group intakes, most adults should increase their total consumption of vegetables by more than<br />
30% [10]. A 30% increase in intake of green and Brassica vegetables, 140% in red- and orangecoloured<br />
vegetables and 90% in other vegetables would be optimal, while consumption of starchy<br />
vegetables needs to decrease by 40% [10]. Replacing potatoes with other vegetables would<br />
increase the variety of vegetables consumed and provide additional health benefits.<br />
Consuming at least two serves of fruit per day (150g per serve) is recommended for adults, while<br />
amounts recommended for children and adolescents depend on age and sex (see Table 2.1 and<br />
2.2). The most recent dietary surveys [13, 44] show that fruit consumption should approximately<br />
double to meet recommended intakes [10].<br />
The <strong>Australian</strong> Guide to <strong>Health</strong>y <strong>Eat</strong>ing provides detailed information on the number of serves and<br />
serve sizes of vegetables, legumes/beans and fruit required for different population groups (see<br />
tables 2.1 & 2.2).<br />
<strong>DRAFT</strong> <strong>Australian</strong> <strong>Dietary</strong> <strong>Guidelines</strong>- December 2011 42
Table 2.1: Recommended number of serves of vegetables, legumes/beans and fruit per day *<br />
* Additional portions of the five food groups or discretionary choices are needed only by people who are taller or more active to meet additional energy requirements.<br />
Source; <strong>Australian</strong> Guide to <strong>Health</strong>y <strong>Eat</strong>ing [114]<br />
Table 2.2: Standard serve size equivalents for vegetables, legumes/beans and fruit<br />
* No added sugar<br />
^ Only to be used occasionally as a substitute for other foods in the group<br />
Source; <strong>Australian</strong> Guide to <strong>Health</strong>y <strong>Eat</strong>ing [114]<br />
Vegetables and fruit should be stored and prepared properly to maintain nutrient status. Avoid<br />
overcooking and wash vegetables to remove microbes and surface debris. Peel or scrub root<br />
vegetables (see Chapter 7). Tinned and/or frozen varieties, preferably without added sugar, salt or<br />
fat, are nutritious alternatives to raw produce.<br />
<strong>DRAFT</strong> <strong>Australian</strong> <strong>Dietary</strong> <strong>Guidelines</strong>- December 2011 43
2.2.6.1 Pregnant and breastfeeding women<br />
Fruit and vegetable consumption before and during pregnancy makes an important contribution to<br />
health outcomes for women and their children. Many women may need to increase their current<br />
consumption of these valuable foods as a prospective cohort study found that only about half of<br />
pregnant women may be consuming the recommended amounts of fruits and vegetables [219].<br />
Pre-prepared or pre-packaged cut fruit and vegetables should be avoided due to risk of listeriosis<br />
[130, 220].<br />
2.2.6.2 Infants<br />
Pureed and mashed vegetables, including legumes/beans, and fruit are important in the diets of<br />
infants from around six months of age. Choices should be varied to ensure adequate energy<br />
(kilojoule) and nutrient intake.<br />
By 12 months of age, infants should be consuming a wide variety of foods consumed by the rest of<br />
the family, having progressed from pureed or mashed foods to foods that are chopped into small<br />
pieces. Care should be taken early on to choose foods of a suitable texture. Hard pieces of foods,<br />
such as some raw vegetables and nuts, should be avoided as they can cause choking. A variety of<br />
tastes and textures may be more appealing. As with all foods, some vegetables may need to be<br />
introduced more than 10 times before being accepted [221]. Whole fruit is preferable to fruit<br />
juice due to its higher fibre content. Fruit juice is not suitable for infants under six months and like<br />
any acidic drink, consumption requires care to avoid dental erosion [133, 222].<br />
2.2.6.3 Children and adolescents<br />
The recommended quantities of vegetables and fruit intakes for children and adolescents vary<br />
depending on their age and sex [10]. To meet the dietary recommendations, children and<br />
adolescents need to approximately double their overall vegetable consumption [10] and decrease<br />
by one third their intake of potatoes. Current fruit intakes by 2-3 year olds are close to the<br />
recommended levels but need to increase proportionately with age.<br />
A wide variety of different coloured, textured and tasting vegetables and fruit, both fresh and<br />
cooked, should be offered frequently to toddlers and pre-schoolers. Parents and carers can<br />
provide model behaviour by consuming a wide range of vegetables and fruit.<br />
Children and adolescents should be encouraged to select a wide variety of vegetables and fruit, at<br />
meal times and between meals. In recent years, most <strong>Australian</strong> states have improved the<br />
nutritional quality of food supplied at schools through strategies incorporating a colour-coded<br />
system in which vegetables, including legumes/beans, and fruit are classified ‘green’ with the<br />
recommendation that children eat plenty [223-230]. Fruit can be ‘fast food’ to help satisfy<br />
<strong>DRAFT</strong> <strong>Australian</strong> <strong>Dietary</strong> <strong>Guidelines</strong>- December 2011 44
increasing appetites. Unless prescribed by a dietitian, special diets which restrict intake of any fruit<br />
or vegetables should be avoided for children and adolescents. The intake of energy (kilojoule)dense<br />
hot fried potato chips as a snack or with meals should be limited.<br />
2.2.6.4 Older people<br />
Although most of the emphasis is on the value of dietary patterns rich in vegetables and fruit<br />
throughout life, there is still benefit in adopting such habits later in life. In general, older adults<br />
tend to consumer higher intakes of fruit and vegetables than younger adults. Due to poor<br />
dentition, softer textured or cooked vegetables and fruit may be preferable for some older<br />
people. Tinned and/or frozen varieties, preferably without added sugar, salt or fat, are nutritious<br />
alternatives to raw produce.<br />
2.2.6.5 Aboriginal and Torres Strait Islanders<br />
Very low intakes of vegetables and fruit have been described among Aboriginal and Torres Strait<br />
Islander groups in urban and rural communities [32, 135, 231, 232]. Availability of quality fresh<br />
produce can be a particular problem in many remote areas [10, 30]. Frozen and canned vegetables<br />
and fruit, plus available traditional plant foods, can be useful in these areas.<br />
2.2.6.6 Vegetarians<br />
Advice regarding vegetables and legumes/beans applies to everyone, including vegetarians. Legumes<br />
(and also nuts and seeds) provide valuable sources of iron and other nutrients, including protein.<br />
In all vegetarian and plant-based diets and meals, legumes/beans play an important role. Some<br />
more restrictive vegetarian diets can be adequate for adults, but may not be suitable for children.<br />
2.3 Grain (cereal) foods (mostly wholegrain)<br />
2.3.1 Setting the scene<br />
Foods originating from grains (cereals) include those from wheat, oats, rice, barley, millet and<br />
corn. They range from highly nutrient-dense wholegrain breads and grain (cereal) foods such as<br />
oats, to lower-nutrient dense white rice, white bread, pasta and noodles. Excluded are refined<br />
grain (cereal) food products with high levels of added sugar, fat and/or salt/sodium, such as cakes.<br />
Key nutrients in wholegrain foods include carbohydrate (starch), protein, dietary fibre, B group<br />
vitamins, vitamin E, iron, zinc, magnesium and phosphorus. Other protective components are<br />
<strong>DRAFT</strong> <strong>Australian</strong> <strong>Dietary</strong> <strong>Guidelines</strong>- December 2011 45
fermentable carbohydrates, oligosaccharides, flavonoids, phenolics, phytoestrogens, lignans,<br />
protease inhibitors, saponins and selenium [36, 37]. In Australia it is mandatory for wheat flour<br />
used in bread making to be fortified with folic acid and thiamin, and for the salt used to be iodised<br />
[233].<br />
2.3.2 The evidence for ‘grain (cereal) foods’<br />
The evidence for the association of grain (cereal) foods (mostly wholegrain) with reduced risk of<br />
cardiovascular disease, type 2 diabetes and excess weight gain has strengthened since the previous<br />
dietary guidelines.<br />
The literature is difficult to interpret because studies use varied definitions of ‘wholegrain’. FSANZ<br />
applies the term to products which uses every part of the grain including the outer layers, bran<br />
and germ even if these parts are separated during processing and regardless of whether the grain<br />
is in one piece or milled into smaller pieces [234]. In this review, the most commonly used<br />
definition was found to be that of Jacobs et al. (1998) [235] who defined wholegrain foods as those<br />
containing 25% or more of wholegrains, whereas some studies included bran cereals as part of the<br />
definition of wholegrain and others only examined certain types of grain (cereal) food such as oats.<br />
The evidence statements and gradings (A- convincing association, B- probable association, C-<br />
suggestive association) from the Evidence Report (literature from years 2002 – 2009) are<br />
presented in the table below. This does not include evidence from other sources, such as the 2003<br />
<strong>Dietary</strong> <strong>Guidelines</strong> (where evidence was classified as level I, II or III in which individual studies<br />
were classified according to their design but overall grades for relationships were not derived),<br />
although these sources have been used to inform the <strong>Guidelines</strong>.<br />
Evidence Statement Grade<br />
Consumption of cereal foods (especially wholegrains and those with fibre from oats<br />
or barley) is associated with a reduced risk of cardiovascular disease in adults.<br />
Consumption of 1-3 serves per day of wholegrain cereals is associated with a<br />
reduced risk of cardiovascular disease<br />
Consumption of cereal foods (especially 3 serves a day of wholegrains) is associated<br />
with reduced risk of type 2 diabetes<br />
Consumption of 3-5 serves per day of cereal foods (mainly wholegrain) is<br />
associated with a reduced risk of weight gain<br />
Consumption of 1-3 serves per day of cereals high in fibre is associated with<br />
reduced risk of colorectal cancer in adults.<br />
<strong>DRAFT</strong> <strong>Australian</strong> <strong>Dietary</strong> <strong>Guidelines</strong>- December 2011 46<br />
B<br />
B<br />
B<br />
B<br />
C
2.3.2.1 Cardiovascular disease, type 2 diabetes and excess weight<br />
Cardiovascular disease: There is evidence of a probable association between the consumption of<br />
grain (cereal) foods (especially wholegrains and those with fibre from oats or barley) and a<br />
reduced risk of cardiovascular disease in adults (Grade B, Section 6.3 in Evidence Report [14])<br />
[236-252]. Almost all the high level trials were conducted with oats, with the evidence of beneficial<br />
lowering of levels of LDL and total cholesterol levels. The protective effect was noted with<br />
between 1–3 serves per day of wholegrain foods (predominantly oats).<br />
Type 2 diabetes: There is evidence of a probable association between the consumption of grain<br />
(cereal) foods (especially wholegrains) and reduced risk of type 2 diabetes (Grade B, Section 6.7 in<br />
Evidence Report [14]) [238, 251, 253-260]. The evidence supports three serves per day of<br />
wholegrain foods conferring between 21-42% reduction in risk of type 2 diabetes.<br />
Excess weight: There is evidence of a probable association between consumption of 3–5 serves<br />
per day of grain (cereal) foods (mainly wholegrain) and reduced risk of weight gain (Grade B,<br />
Section 6.6 in Evidence Report [14]) [249, 261-270].<br />
2.3.2.2 Cancer<br />
Colorectal cancer: There is recent evidence suggesting that consumption of 1-3 serves of cereals<br />
high in dietary fibre per day is associated with reduced risk of colorectal cancer in adults (Grade<br />
C, Section 6.2 in Evidence Report [14]) [185, 271-275]. Although previously the WCRF report<br />
noted that the evidence was too limited to draw conclusions, it recently reviewed the evidence<br />
and found it convincing that fibre-rich foods offer protection against colorectal cancer [42].<br />
Other cancers: Recent evidence is inconclusive for an association regarding the consumption of<br />
grain (cereal) foods and risk of other cancers in adults (Section 6.1 in Evidence Report [14]).<br />
2.3.3 How eating cereal (mostly wholegrain) foods may<br />
improve health outcomes<br />
Much depends on which wholegrain is being considered [276]. <strong>For</strong> example, oat β-glucan binds<br />
with bile acids, so the liver breaks down more cholesterol to maintain a supply of bile acids.<br />
Wheat does not contain these soluble fibres. Also, the slow rate of glucose delivery of oats<br />
reduces the requirement for insulin [277]. The slower rate of absorption created by the presence<br />
of dietary fibre from some grain (cereal) foods can also influence appetite. <strong>For</strong> example, oat βglucan<br />
has been shown to have effects on postprandial cholecystokinin levels, decreased insulin<br />
response and extended subjective satiety in overweight adults [278]. Other sources of dietary<br />
fibre, such as psyllium may act in a similar fashion. Grain (cereal) foods also contain starch that may<br />
be resistant to digestion in the small intestine (resistant starch) and may help to provide a more<br />
<strong>DRAFT</strong> <strong>Australian</strong> <strong>Dietary</strong> <strong>Guidelines</strong>- December 2011 47
protective environment in the colon, particularly in the context of meals [279]. Note that as some<br />
degree of processing is applied to most grains (cereals) to aid digestion, the effects can be<br />
significantly influenced by the technology applied in processing and cooking [280].<br />
Because wholegrains contain more nutrients and phytochemicals, concentrated in the bran and<br />
germ [281], they are likely to have greater effects than refined grains (cereals). Wholegrains<br />
contain phenolic compounds with strong anti-oxidant capacity which may be protective against<br />
processes involved in the pathology of diabetes, cardiovascular disease and cancer [282]. Choosing<br />
wholegrain options may also assist with satiety and help in not over consuming food beyond<br />
energy (kilojoule) requirements.<br />
The previous dietary guidelines discussed the glycaemic index (GI) of a food as a physiologically<br />
based classification of carbohydrate-containing foods according to their potential to raise blood<br />
glucose. Various factors may affect the GI value of a food, among them the particle size of milled<br />
grains, the ratio of amylose to amylopectin, the degree of starch gelatinisation and the presence of<br />
other food components such as viscous soluble fibres, fat, protein and organic acids which may<br />
limit practical application. Lower GI diets may assist in the management of diabetes [37]. Further<br />
research on GI and health outcomes may be required to investigate other potential associations.<br />
The previous guidelines also noted that consumption of dietary fibre assists in maintaining the<br />
health and function of the digestive system, for example in preventing constipation [36, 37].<br />
2.3.4 Practical considerations: <strong>Eat</strong> grain (cereal) foods,<br />
mostly wholegrain<br />
Consuming at least 4–6 serves of grain (cereal) foods per day is recommended for <strong>Australian</strong><br />
adults, while the amount recommended for children and adolescents depends on their age and sex<br />
(see table 2.3 below), ranging from four serves a day for 2–8 year olds to seven a day for older<br />
adolescents. The amount of different grain (cereal) foods which comprise a serve is outlined in the<br />
<strong>Australian</strong> Guide to <strong>Health</strong>y <strong>Eat</strong>ing. One slice of bread, or half a medium roll or flat bread (about<br />
40g), is equivalent to 1/2 cup of cooked rice, pasta, noodles, 2/3 cup of breakfast cereal flakes<br />
(30g) or one quarter of a cup of muesli (30g).<br />
The <strong>Australian</strong> Guide to <strong>Health</strong>y <strong>Eat</strong>ing provides detailed information on the number of serves and<br />
serve sizes of grain (cereal) mostly wholegrain foods required for different population groups (see<br />
tables 2.3 and 2.4).<br />
<strong>DRAFT</strong> <strong>Australian</strong> <strong>Dietary</strong> <strong>Guidelines</strong>- December 2011 48
Table 2.3: Recommended number of serves of grain (cereal) mostly wholegrain foods per day *<br />
* Additional portions of the five food groups or discretionary choices are needed only by people who are taller or more active to meet additional energy requirements.<br />
Source; <strong>Australian</strong> Guide to <strong>Health</strong>y <strong>Eat</strong>ing [114]<br />
Table 2.4: Standard serve size equivalents for grain (cereal) mostly wholegrain foods<br />
Source; <strong>Australian</strong> Guide to <strong>Health</strong>y <strong>Eat</strong>ing [114]<br />
To meet recommended food group intakes [10] adults would require a 30% increase in grain<br />
(cereal) foods, comprising a 160% increase in current wholegrain consumption and a 30% decrease<br />
in refined grain (cereal) food consumption. <strong>For</strong> children over the age of 4 years, 20–60% more<br />
wholegrain foods and 10–30% less refined cereal foods would be required to meet recommended<br />
intakes [10]. Refined grain (cereal) food products with high levels of added sugar, fat and/or salt,<br />
such as cakes and biscuits, are classified as discretionary foods and are not included in the grain<br />
recommendation. While these can be included in small amounts in Total Diets with higher energy<br />
(kilojoules) allowances, for the <strong>Australian</strong> population as a whole their intake would need to be<br />
reduced substantially.<br />
The suite of models which informed the update of the <strong>Australian</strong> Guide to <strong>Health</strong>y <strong>Eat</strong>ing [10] allows<br />
for variation in choice and amount of grain (cereal) foods to accommodate a range of cuisines. A<br />
<strong>DRAFT</strong> <strong>Australian</strong> <strong>Dietary</strong> <strong>Guidelines</strong>- December 2011 49
variety of grain (cereal) food choices allow for different forms of dietary fibre and complex<br />
carbohydrates. Reading the labels on processed grain (cereal) foods such as rice and pasta is<br />
important to check that added sodium, sugar and/or fat (in particular saturated fat) are kept to a<br />
minimum.<br />
2.3.4.1 Pregnant and breastfeeding women<br />
As periconceptional folic acid intake helps protect against neural tube defects in the developing<br />
foetus [283], the mandatory fortification of flour used for breadmaking in Australia with folic acid<br />
[284] provides an additional reason for women of reproductive age to consume bread. However,<br />
for women planning a pregnancy and during the first three months of pregnancy, a daily folic acid<br />
supplement (0.4 mg) is recommended in addition to eating foods which are naturally rich in folate<br />
or are fortified with folic acid [285, 286].<br />
Pregnant and breastfeeding women have increased iodine requirements. As most leavened bread<br />
in Australia is made with iodised salt, this contributes to total iodine intake. However, this does<br />
not replace the need for iodine supplements (150 mcg/day) for women planning a pregnancy,<br />
throughout pregnancy and while breastfeeding [103].<br />
2.3.4.2 Infants<br />
Cereal should be one of the first foods offered to infants at around six months of age. Ironenriched<br />
infant cereals are recommended at this stage.<br />
2.3.4.3 Older people<br />
A high intake of wholegrain forms of grain (cereal) foods may not be well tolerated if there is a<br />
problem with dentition. Softer varieties such as finely milled wholemeal bread and/or other fibreenriched<br />
foods may be suitable.<br />
2.3.4.4 Vegetarians<br />
Wholegrain foods are particularly important in vegetarian diets as a source of iron and zinc.<br />
<strong>DRAFT</strong> <strong>Australian</strong> <strong>Dietary</strong> <strong>Guidelines</strong>- December 2011 50
2.4 Lean meat and poultry, fish, eggs, nuts and<br />
seeds, and legumes/beans<br />
2.4.1 Setting the scene<br />
Lean meats and poultry, fish, eggs and plant-based alternatives such as legumes/beans, nuts and<br />
seeds are an important component of <strong>Australian</strong> cuisine, culture and lifestyle. The ‘lean meat and<br />
alternatives’ food group is diverse, both nutritionally and biologically. The foods in this group have<br />
traditionally been seen as ‘protein-rich’, but they also provide a wide variety of other nutrients<br />
which may be more important in the typical high-protein <strong>Australian</strong> diet. Important nutrients<br />
include iodine, iron, zinc, vitamins, especially B12, and essential fatty acids including long chain<br />
omega-3 fatty acids. All seafood contains long chain omega-3s. Grass-fed meats, poultry and some<br />
eggs are also sources of these essential fatty acids. Evidence of the health benefits of lean meats<br />
and alternatives is consistently recognised in international dietary guidelines [36, 37, 143, 144].<br />
Processed and cured meats can be high in added salt and saturated fat and are not recommended<br />
as substitutes for unprocessed meat. Moderate amounts of lean poultry and eggs can be included<br />
in the diet within the overall recommended quantities for this whole food group. Eggs are an<br />
alternative to meat, a relatively inexpensive source of protein and are versatile foods. Note that<br />
although pork is not considered red meat for marketing purposes in Australia, it is classified as red<br />
meat in the international literature, and so has been considered as red meat for the purpose of the<br />
<strong>Guidelines</strong> [10].<br />
Fish and other seafood are central foods in the cuisines of many traditional cultural and religious<br />
groups, and are popular foods in <strong>Australian</strong> society. Fish is nutritious, providing energy (kilojoules),<br />
protein, selenium, zinc, iodine, vitamins A and D (some species only), and long-chain omega-3 fatty<br />
acids. Evidence of the health benefits of fish consumption is consistently recognised in international<br />
dietary guidelines [36, 37, 143, 144].<br />
Nuts and seeds are rich in energy (kilojoules) and nutrients, reflective of their biological role in<br />
nourishing plant embryos to develop into plants. In addition to protein and dietary fibre, they<br />
contain significant levels of unsaturated fat, although this varies within the category. Nuts are also<br />
rich in polyphenols and micronutrients, including folate, several valuable forms of vitamin E,<br />
selenium, magnesium and other minerals. They are useful alternatives to meat, fish and eggs, and<br />
are particularly important in plant-based, vegetarian and vegan meals and diets.<br />
Legumes/beans, including lentils, tofu and tempe, provide a valuable and cost efficient source of<br />
protein, iron, some essential fatty acids, soluble and insoluble dietary fibre and micronutrients.<br />
They are valuable inclusions in the diet, and are especially useful for people who consume plantbased<br />
or vegetarian diets or meals [10].<br />
<strong>DRAFT</strong> <strong>Australian</strong> <strong>Dietary</strong> <strong>Guidelines</strong>- December 2011 51
2.4.2 The evidence for ‘lean meat and poultry, fish, eggs,<br />
nuts and seeds, and legumes/beans’<br />
In the following studies, serve sizes of the different foods are as included in the <strong>Australian</strong> Guide to<br />
<strong>Health</strong>y <strong>Eat</strong>ing (see also Section 2.4.4, table 2.5).<br />
The evidence statements and gradings (A- convincing association, B- probable association, C-<br />
suggestive association) from the Evidence Report (literature from years 2002 – 2009) are<br />
presented in the table below. This does not include evidence from other sources, such as the 2003<br />
<strong>Dietary</strong> <strong>Guidelines</strong> (where evidence was classified as level I, II or III in which individual studies<br />
were classified according to their design but overall grades for relationships were not derived),<br />
although these sources have been used to inform the <strong>Guidelines</strong>.<br />
Evidence Statement Grade<br />
Consumption of greater than100-120g/d red meat is associated with an increased<br />
risk of colorectal cancer.<br />
Consumption of fish more than once per week is associated with a reduced risk of<br />
developing dementia in older adults.<br />
Consumption of red meat is associated with risk of renal cancer. C<br />
Consumption of at least 2 serves a week of fish is associated with reduced risk of<br />
mortality from cardiovascular disease, and with reduced incidence of cardiovascular<br />
disease.<br />
Consumption of fish at least twice a week is associated with a reduced risk of<br />
stroke.<br />
Consumption of fish 2 or more times per week is associated with reduced risk of<br />
age-related macular degeneration.<br />
Consumption of nuts (65-110 g per day) reduces cholesterol levels. C<br />
2.4.2.1 Lean meat<br />
Past literature reporting on the health benefits and/or risks of consuming meat has been<br />
predominantly based on studies investigating the nutrient effects related to (for example) iron,<br />
protein or zinc in isolation [37] or the ability of the body to absorb nutrients rather than looking<br />
at the whole food. Since 2003, the evidence linking meat consumption and increased risk of<br />
disease has strengthened in some areas and remains unclear in others. The evidence is difficult to<br />
<strong>DRAFT</strong> <strong>Australian</strong> <strong>Dietary</strong> <strong>Guidelines</strong>- December 2011 52<br />
B<br />
B<br />
C<br />
C<br />
C
interpret because of widely varying definitions of ‘meat’. Some studies include only unprocessed<br />
red meat. Others may include some or all of a variety of processed meats, including smoked,<br />
salted and chemically preserved foods, with meat within dishes such as pizza, lasagna or casseroles<br />
variously included or excluded. The poor definitions partly explain the often inconsistent findings<br />
in relation to health effects, with several large cohort studies and some Asian studies failing to<br />
adequately disaggregate possibly different effects of unprocessed red meat and processed meats. In<br />
particular, the definition of red meat varies greatly between studies.<br />
2.4.2.1.1 Lean meat: Cardiovascular disease, type 2 diabetes and excess weight<br />
An insufficient number of recent studies investigating the relationships between consumption of<br />
meat and cardiovascular disease, type 2 diabetes and excess weight were identified in the<br />
literature review to develop evidence statements [14]. A large cohort trial that found modest<br />
increases in total mortality, cardiovascular mortality and cancer mortality with red and processed<br />
meat intakes [287] was not included due to lack of clarity over the inclusion of processed meats,<br />
liver and sausages with unprocessed red meat.<br />
2.4.2.1.2 Lean meat: Cancer<br />
Colorectal cancer: There is evidence of a probable association between consumption of red meat<br />
and increased risk of colorectal cancer (Grade B, Section 4.7 in Evidence Report [14]) [42, 288-<br />
296]. The WCRF reported a convincing relationship between red and processed meat and<br />
increased risk of colorectal cancer [42]. Several studies from Asian countries showed no increased<br />
risk of colorectal cancer associated with low intakes of red meat such as 27g per day [294] and<br />
42g per day [292].<br />
Renal cancer: The evidence suggests that consumption of red meat is associated with an increased<br />
risk of renal cancer (Grade C, Section 4.6 in Evidence Report [14]).<br />
Bladder and prostate cancer: The evidence suggests that consumption of red meat one to six<br />
times per week is not associated with risk of bladder cancer (Grade C, Section 4.1 in Evidence<br />
Report [14]) [42, 297, 298]. The evidence suggests that consumption of red meat is not associated<br />
with risk of prostate cancer (Grade C, Section 4.3 in Evidence Report [14]) [42, 299, 300].<br />
Pancreatic cancer: A review of the current evidence suggests that consumption of 30-200 grams<br />
of red meat per day is not associated with risk of pancreatic cancer (Grade C, Section 4.2 in<br />
Evidence Report [14]) [42, 301].<br />
Other cancers: Recent evidence is inconclusive for an association regarding the consumption of<br />
red meat and breast and lung cancer (Section 4.4, & 4.5 in Evidence Report [14]).<br />
<strong>DRAFT</strong> <strong>Australian</strong> <strong>Dietary</strong> <strong>Guidelines</strong>- December 2011 53
Given these risks, advice is provided on how much meat can be eaten to maximize the health<br />
benefits of consuming meat, while minimizing the health risks- see Section 2.4.4.<br />
2.4.2.2 Lean poultry<br />
2.4.2.2.1 Lean poultry: Cardiovascular disease, type 2 diabetes and excess weight<br />
An insufficient number of recent studies investigating the relationships between consumption of<br />
poultry and cardiovascular disease, type 2 diabetes and excess weight were identified in the<br />
literature review to develop evidence statements [14].<br />
2.4.2.2.2 Lean poultry: Cancer<br />
Recent evidence examining an association between poultry consumption and breast or colorectal<br />
cancer is inconclusive (Section 10.1 & 10.2 in Evidence Report [14]).<br />
2.4.2.3 Fish<br />
The evidence regarding the health benefits of fish has strengthened since 2002. People who<br />
regularly consume diets high in fish tend to have lower risks of a range of conditions, including<br />
cardiovascular disease, stroke, and macular degeneration, and dementia in older adults.<br />
Early literature focused on evidence indicating that fish oils (and in particular long chain omega-3<br />
fatty acids) provided specific health benefits for brain development and function and cardiovascular<br />
health, and extrapolated this to fish as the predominant food containing these fatty acids [37].<br />
Recent research continues to be dominated by pharmacological studies of the effects of nutrients<br />
derived from fish, particularly delivered in fish oils. The evidence obtained from the literature<br />
considers relationships with the consumption of fish per se, so studies of fish oil or omega-3<br />
supplements are not reported in the evidence statements below. However, the overall chapter<br />
examines evidence relating to omega-3 fats, bearing in mind that these fats can also be delivered in<br />
foods other than fish.<br />
The evidence provided below for health benefits relates consistently to fish in the form of finfish<br />
from marine or freshwater sources, either farmed or wild. Few studies have investigated the<br />
effects of other types of seafood. As for red meat, the distinction between different preparation<br />
methods and different fish types is not always well addressed in the literature and may contribute<br />
to a lack of consistency in some instances.<br />
<strong>DRAFT</strong> <strong>Australian</strong> <strong>Dietary</strong> <strong>Guidelines</strong>- December 2011 54
2.4.2.3.1 Fish: Cardiovascular disease, type 2 diabetes and excess weight<br />
Cardiovascular disease: Evidence suggests that consuming at least two serves of fish per week is<br />
associated with reduced incidence of cardiovascular disease (particularly myocardial infarction)<br />
(Grade C, Section 9.1 in Evidence Report [14]) [302-305] and with reduced risk of mortality from<br />
cardiovascular disease (Grade C, Section 9.1 in Evidence Report [14]) [302, 304, 306-313].<br />
The evidence suggests that consumption of fish at least twice a week is associated with a reduced<br />
risk of stroke (Grade C, Section 9.5 in Evidence Report [14]) [305, 314-316].<br />
Only a small number of case-control and cohort studies are available, with inconsistent results, to<br />
examine the relationship between fish consumption and the incidence of cardiac arrest, heart<br />
failure, atrial fibrillation and high blood lipids.<br />
2.4.2.3.2 Fish: Cancer<br />
Evidence of an association between fish consumption and breast, colorectal, prostate and renal<br />
cancer was examined however no conclusive associations could be drawn (Section 9.6, 9.7, 9.8 &<br />
9.9 in Evidence Report).<br />
2.4.2.3.3 Fish: Other conditions<br />
Dementia: The recent body of evidence demonstrates that it is probable that the consumption of<br />
fish more than once per week is associated with a reduced risk of developing dementia in older<br />
adults (Grade B, Section 9.2 in Evidence Report [14]) [303, 317-324].<br />
Depression: The recent evidence suggests that consumption of at least one serve of fish per week<br />
is not associated with reduced risk of depression (Grade C, Section 9.3 in Evidence Report [14])<br />
[325-329].<br />
Macular degeneration: The recent evidence suggests that eating fish two or more times a week is<br />
associated with reduced risk of age-related macular degeneration (Grade C, Section 9.4 in<br />
Evidence Report [14]) [330].<br />
2.4.2.4 Eggs<br />
Since 2003 the evidence associating egg consumption with health outcomes has not changed<br />
greatly (Section 11 in Evidence Report [14]). There do not appear to be any increased health risks<br />
associated with consumption of eggs [331-333]. There is recent evidence which suggests that<br />
consumption of eggs every day is not associated with increased risk of coronary heart disease<br />
(Grade C, Section 11.1 in Evidence Report [14]) [248, 334-351].<br />
<strong>DRAFT</strong> <strong>Australian</strong> <strong>Dietary</strong> <strong>Guidelines</strong>- December 2011 55
2.4.2.5 Nuts and seeds<br />
Consumption of nuts and seeds may help reduce the risk of heart disease and is not associated<br />
with weight gain if total energy (kilojoule) intake is controlled. Since the previous dietary<br />
guidelines, the evidence for the benefits of consumption of nuts and seeds on heart disease has<br />
been shown to be related to favourable effects on serum cholesterol. The evidence on lack of<br />
association with weight gain is a new development.<br />
2.4.2.5.1 Nuts and Seeds: Cardiovascular disease, type 2 diabetes and excess<br />
weight<br />
Cardiovascular disease: Evidence suggests that consumption of nuts (65–110g per day) is<br />
associated with a reduction in serum cholesterol, a surrogate marker for cardiovascular disease<br />
(Grade C, Section 8.2 in Evidence Report [14]) [352-356].<br />
Excess weight: Evidence suggests that the consumption of nuts (65–110g per day) does not lead<br />
to weight gain, at least in the short term (Grade C, Section 8.1 in Evidence Report [14]) [353-<br />
358].<br />
2.4.2.5.2 Nuts and Seeds: Cancer<br />
No recent studies investigating the association of consumption of nuts and seeds were identified<br />
[14].<br />
2.4.2.6 Legumes/beans<br />
Few studies on legumes/bean foods, other than soy foods, were identified in the literature review<br />
to inform the review of these dietary guidelines. <strong>For</strong> the evidence regarding legumes/beans, see<br />
Section 7 in the Evidence Report [14].<br />
2.4.3 How eating lean meat and poultry, fish, eggs, nuts<br />
and seeds, and legumes/beans may improve health<br />
outcomes<br />
This is such a broad and diverse group of foods that a variety of possible mechanisms may<br />
influence the effects of their consumption.<br />
<strong>DRAFT</strong> <strong>Australian</strong> <strong>Dietary</strong> <strong>Guidelines</strong>- December 2011 56
Smoked, salted and chemically preserved foods have properties that may be responsible for<br />
increased health risks. Endogenous formation of nitrous compounds has been suggested as a<br />
possible link between red meat and colorectal cancer [359], but this remains a hypothesis. As with<br />
other areas of diet and disease risk, an individual’s dietary pattern may be more relevant than a<br />
direct effect from a single component [360, 361].<br />
It has been suggested that haem iron or other components of meat such as saturated fats, or<br />
other dietary and lifestyle factors associated with meat intake, may be relevant factors for further<br />
study [362]. Previous evidence related to saturated fat in red meat and increased risk of<br />
cardiovascular disease may not be relevant for lean <strong>Australian</strong> meats.<br />
The protective effect of fish consumption on cardiovascular disease is thought to be mediated<br />
through the influence of specific nutrients such as long-chain n-3 fatty acids. These essential fatty<br />
acids exert their physiological effect by altering cell membrane composition, fluidity, receptors and<br />
membrane-bound enzymes, gene expression and eicosanoid production (see Chapter 3).<br />
Nut consumption provides benefits by enhancing anti-inflammatory processes [363] and lowering<br />
serum cholesterol possibly due to the presence of phytosterols, which reduce cholesterol reabsorption<br />
[364], and/or the effects of shifting dietary fat quality, notably replacing saturated with<br />
unsaturated fat. Nut consumption is also associated with increased levels of adiponectin which has<br />
anti-inflammatory and anti-atherogenic properties [365]. Early work suggests that the delivery of<br />
components such as tocopherols and phenolic acids may help to reduce lipid peroxidation and<br />
oxidative DNA damage, and there is some indication that walnuts with a relatively high content of<br />
the amino acid L-arginine may have an effect on vasodilation through nitrous oxide pathways<br />
[363]. Proposed mechanisms for effects on weight control include increased satiety, increased<br />
faecal fat excretion, increased thermogenesis [366] and increased fat oxidation [367].<br />
2.4.4 Practical considerations: Lean meat and poultry,<br />
fish, eggs, legumes/beans and nuts/seeds<br />
The most recent dietary survey data for adults in Australia showed that daily mean consumption<br />
of meat, poultry and game was 200g for men and 120g for women [44]. Adult men and women<br />
daily consume 99g and 54g of red meat respectively [44].<br />
The recommended consumption of lean meat and poultry, fish, eggs and/or alternatives for both<br />
children and adults is 1–3 serves a day depending on age. During pregnancy, 3–4 serves a day are<br />
recommended to provide additional iron and zinc.<br />
To enhance dietary variety and reduce some of the health risks associated with consuming meat,<br />
up to a maximum of 455g per week (1 serve or 65g per day) of lean meat is recommended for<br />
<strong>Australian</strong> adults.<br />
<strong>DRAFT</strong> <strong>Australian</strong> <strong>Dietary</strong> <strong>Guidelines</strong>- December 2011 57
The <strong>Australian</strong> Guide to <strong>Health</strong>y <strong>Eat</strong>ing provides detailed information on the number of serves and<br />
serve sizes of lean meat, poultry, fish, eggs, legumes/beans and nuts/seeds required for different<br />
population groups (see tables 4.5 & 4.6).<br />
Table 2.5: Recommended number of serves of lean meat, poultry, fish, eggs, legumes/beans<br />
and nuts/seeds per day *<br />
* Additional portions of the five food groups or discretionary choices are needed only by people who are taller or more active to meet additional energy requirements.<br />
Source; <strong>Australian</strong> Guide to <strong>Health</strong>y <strong>Eat</strong>ing [114]<br />
Table 2.6: Standard serve size equivalents for lean meat, poultry, fish, eggs, legumes/beans<br />
and nuts/seeds<br />
^ Only to be used occasionally as a substitute for other foods in the group<br />
Source; <strong>Australian</strong> Guide to <strong>Health</strong>y <strong>Eat</strong>ing [114]<br />
To meet recommended intakes, omnivorous adults in Australia would need to consume 40% more<br />
‘poultry, fish, seafood and eggs or legumes/beans, nuts or seeds’ but omnivorous men would need<br />
to consume around 20% less red meat than currently [10]. <strong>For</strong> children 2–16 years of age, around<br />
30–85% more ‘poultry, fish, seafood and eggs or legumes/beans, nuts or seeds’ and around 25–70%<br />
more red meat would be required above current intakes to meet recommendations. Exact<br />
quantities depend on age and sex [10].<br />
<strong>DRAFT</strong> <strong>Australian</strong> <strong>Dietary</strong> <strong>Guidelines</strong>- December 2011 58
Depending on age and sex, health benefits may be seen with consumption of 1.4–2.8 serves of fish<br />
per week (140–280g per week) for adults, with proportionately less for adolescents and children.<br />
The most recent dietary survey data available for adults showed that mean weekly consumption of<br />
fish and seafood was 168g for men and 119g per week for women (ABS 1999 [44] cited in<br />
NHMRC 2011 [10]). To meet recommended food group intakes, fish consumption will need to<br />
increase by more than 40%, particularly for men [10]. The extent to which <strong>Australian</strong> fish<br />
populations are sufficient to meet the guideline advice needs consideration. The previous dietary<br />
guidelines note that inclusion of around 2-3 serves of fish per week may not be attainable or<br />
sustainable depending on population levels [37]. Information from the Department of Agriculture,<br />
Fisheries and <strong>For</strong>estry shows that Australia has become a net importer of fish products over the<br />
past decade, and several industry initiatives have now been developed to address the sustainability<br />
of fish stocks in Australia [368].<br />
Previous reported intakes of nuts and seeds in Australia have been very low (only around 4g per<br />
day for adults) [44]. Consumption may have risen since. The dietary models developed for these<br />
guidelines include modest amounts of nuts and seeds. However, because intakes have been low,<br />
this would require tripling the intake for children over 8 years of age and increasing adult intakes<br />
substantially, even in omnivore Foundation Diet models [10].<br />
Nuts and seeds can be included in the diet in a variety of ways, including as snacks, in dishes (for<br />
example, added to salads, vegetables, various main course dishes and breakfast cereals) and in food<br />
products such as breads and spreads.<br />
2.4.4.1 Pregnant and breastfeeding women<br />
Lean red meat is a good source of protein, iron and zinc for pregnant and breastfeeding women,<br />
although raw or undercooked meat, chilled pre-cooked meats, and pate and meat spreads are best<br />
avoided due to risk of listeriosis (see Chapter 7) [130, 220]. While meat is a good source of iron,<br />
iron deficiency in pregnancy is common in Australia and iron supplements may be needed.<br />
Pregnant women should check with their doctor.<br />
Maternal consumption of fish during pregnancy is likely to have a number of health benefits for<br />
women and their children. However the fish should be low in mercury. FSANZ provides guidance<br />
for pregnant women on suggested amounts and frequency of consumption of particular fish<br />
species [131, 284]. Pregnant women are advised to consume no more than one serve (150g) per<br />
fortnight of shark, marlin or broadbill/swordfish, and no other fish that fortnight, or one serve<br />
(150g) per week of orange roughy (deep sea perch) and no other fish that week [130, 131].<br />
Pregnant women should avoid eating foods containing raw eggs, because of risk of salmonella<br />
[220].<br />
<strong>DRAFT</strong> <strong>Australian</strong> <strong>Dietary</strong> <strong>Guidelines</strong>- December 2011 59
Pregnant and breastfeeding women do not need to avoid consuming nuts for fear of causing an<br />
allergic reaction in their babies. Only women who are allergic to these foods themselves need to<br />
avoid them [362, 369-372].<br />
2.4.4.2 Infants<br />
Foods from the meats and alternatives group are important in the diets of infants over the age of<br />
around six months. In particular, this group of foods helps meet infants’ increased needs for iron,<br />
zinc and protein. The food should be initially pureed before serving. <strong>For</strong> all infants, special care is<br />
required to adequately de-bone fish.<br />
Previously nuts were often restricted for infants and children because of the risk of inducing<br />
allergy. However this has not been proven in nutrition studies. The texture should be suitable (for<br />
example, peanut butter/paste). Only children over three years should be offered whole nuts due<br />
to the risk of choking.<br />
2.4.4.3 Children and adolescents<br />
The demands of growth increase the need for iron, protein and many nutrients found in this food<br />
group.<br />
2.4.4.4 Women of child-bearing age<br />
Menstrual loss doubles the iron requirements of young women compared to young men [37],<br />
although that increased requirement is lessened for women taking the oral contraceptive pill. Lean<br />
meat and some types of seafood are excellent sources of iron [10].<br />
2.4.4.5 Older people<br />
Lean meat and poultry, fish, eggs, legumes/beans and nuts and seeds are nourishing foods for older<br />
adults and should be included in the diet as a ready source of protein to help maintain muscle<br />
mass [10]. People with poor dentition should be advised to choose forms of food that are easier<br />
to eat, such as softer foods, soups and casseroles.<br />
Whole nuts may not be well tolerated where there is a problem with dentition. In these cases, the<br />
inclusion of ground nuts, nut pastes or nut meal in dishes may be more appropriate.<br />
<strong>DRAFT</strong> <strong>Australian</strong> <strong>Dietary</strong> <strong>Guidelines</strong>- December 2011 60
2.4.4.6 Vegetarians<br />
<strong>For</strong> several nutrients, including iron, calcium and vitamin B12, animal foods are highly bioavailable<br />
sources and care needs to be taken if these foods are excluded. Eggs and milk, yoghurt and cheese<br />
products can supply calcium and vitamin B 12 in lacto-ovo vegetarian diets.<br />
<strong>For</strong> lacto-ovo vegetarian diets, the Modelling System used a ratio of a 5:1:1 ‘legume: egg:<br />
nuts/seeds’ mixed food group. As comparable data was not available for Australia, this was based<br />
on the United States Department of Agriculture (USDA) recommendations for proportions of<br />
these foods that would provide an adequate amino acid balance [10]. As no <strong>Australian</strong> national<br />
data were available about choices within food categories for lacto-ovo vegetarians, the same<br />
proportions within food groups (for example, for vegetables, fruit, cereals) were used as for the<br />
equivalent omnivore group. <strong>For</strong> children consuming vegetarian diets, it should be noted that iron<br />
was limiting in the diets as modelled [10].<br />
Nuts and seeds (and legumes/beans) are important foods in vegetarian dietary patterns and meals<br />
without meat as they can help provide an alternative source of nutrients. <strong>For</strong> lacto-ovo vegetarian<br />
diets, refer to the Food Modelling document [10].<br />
2.4.4.7 Food safety<br />
Fish that have been exposed to heavy metals, dioxins and dioxin-like polychlorinated biphenyls<br />
(PCBs) from industrial pollution of marine and freshwater environments can present a<br />
toxicological food safety risk to human biological systems if consumed in sufficiently large amounts.<br />
Although fish caught in specific locations could lead to high human exposure - for example, west of<br />
the Sydney Harbour Bridge [373] - exposure in Australia generally is low [374]. The FAO and<br />
WHO held an expert consultation on this issue and concluded in general that the disadvantages of<br />
foregone health benefits from fish consumption outweigh the risks of increased exposure to heavy<br />
metals, dioxins and PCBs, although it was acknowledged that close monitoring and evaluation of<br />
the fish supply and dietary exposure is needed [375].<br />
2.5 Milk, yoghurt, cheese and/or alternatives<br />
(mostly reduced fat)<br />
2.5.1 Setting the scene<br />
In past dietary guidelines these foods have been referred to as dairy foods, but greater specificity is<br />
required to reflect definitions in the relevant literature (for example butter, cream and ice-cream<br />
are not included). Milks, cheeses and yoghurts are most frequently produced from cow’s milk in<br />
<strong>DRAFT</strong> <strong>Australian</strong> <strong>Dietary</strong> <strong>Guidelines</strong>- December 2011 61
Australia, but other sources include milk and products from goats, sheep and soy and various<br />
cereals. Milk substitutes that are not fortified with calcium and other nutrients are not included in<br />
this food group.<br />
Milk, cheese and yoghurt are a good source of many nutrients, including calcium, protein, iodine,<br />
vitamin A, vitamin D, riboflavin, vitamin B12 and zinc. These foods provide calcium in a readily<br />
absorbable and convenient form. The proportion of total fat and saturated fat content in some<br />
milk, cheese and yoghurts has led to the recommendation that reduced fat varieties should be<br />
chosen on most occasions [10]. However reduced fat varieties of milks are not suitable as a milk<br />
drink for children under the age of two due to energy requirements for growth.<br />
Alternatives to milk, cheese and yoghurt include calcium-enriched legume/bean milk products such<br />
as calcium enriched soy drinks. Information about legumes/beans is included with vegetables and<br />
meat and alternative groups above.<br />
2.5.2 The evidence for ‘milk, yoghurt, cheese and/or<br />
alternatives’<br />
The evidence for the health benefits of consumption of these dairy foods (mainly reduced fat<br />
varieties) has strengthened since the previous <strong>Dietary</strong> <strong>Guidelines</strong> [37], however the evidence base<br />
primarily comprises small, short term studies with varied definitions of dairy foods. The evidence<br />
for the relationship between foods containing calcium and increased bone density in postmenopausal<br />
women was not re-examined because it was regarded as an accepted relationship<br />
[37].<br />
The evidence statements and gradings (A- convincing association, B- probable association, C-<br />
suggestive association) from the Evidence Report (literature from years 2002 – 2009) are<br />
presented in the table below. This does not include evidence from other sources, such as the 2003<br />
<strong>Dietary</strong> <strong>Guidelines</strong> (where evidence was classified as level I, II or III in which individual studies<br />
were classified according to their design but overall grades for relationships were not derived),<br />
although these sources have been used to inform the <strong>Guidelines</strong>.<br />
Evidence Statement Grade<br />
Consumption of at least 2 servings per day dairy foods (milk, yoghurt, and cheese) is<br />
associated with reduced risk of ischemic heart disease and myocardial infarction.<br />
Consumption of 2 or more servings of dairy foods per day is associated with<br />
reduced risk of stroke.<br />
Consumption of 3 servings of low fat dairy foods is associated with reduced risk of<br />
hypertension<br />
<strong>DRAFT</strong> <strong>Australian</strong> <strong>Dietary</strong> <strong>Guidelines</strong>- December 2011 62<br />
B<br />
B<br />
B
Evidence Statement Grade<br />
Consumption of more than 1 serving of dairy per day, especially milk, is associated<br />
with a reduced risk of colorectal cancer.<br />
Consumption of 3 or more servings of milk per day is not associated with risk of<br />
renal cell cancer.<br />
Consumption of 3 servings of any milk, cheese or yoghurt products a day is<br />
associated with reduced risk of hypertension<br />
Consumption of 2-4 serves of dairy foods per day is associated with reduced risk of<br />
metabolic syndrome<br />
Consumption of at least 1.5 servings of dairy foods (milk, yoghurt, cheese) per day is<br />
associated with reduced risk of type 2 diabetes.<br />
Consumption of more than 1 serving of milk per day is associated with reduced risk<br />
of rectal cancer.<br />
Consumption of dairy products (particularly milk) is associated with improved bone<br />
mineral density<br />
2.5.2.1 Cardiovascular disease, type 2 diabetes and excess weight<br />
Cardiovascular disease: It is probable that the consumption of at least two servings per day of<br />
dairy foods (milk, cheese and yoghurt) is associated with reduced risk of ischemic heart disease<br />
and myocardial infarction (Grade B, Section 5.3 in Evidence Report [14]) [376].<br />
It is probable that the consumption of two or more servings of dairy foods per day (milk, cheese<br />
and yoghurt) is associated with reduced risk of stroke (Grade B, Section 5.4 in Evidence Report<br />
[14]) [376, 377] particularly reduced fat varieties.<br />
It is also probable that consumption of three servings of low-fat dairy foods (milk, cheese and<br />
yoghurt) is associated with reduced risk of hypertension (Grade B, Section 5.5 in Evidence Report<br />
[14]). The evidence also suggests that consumption of three servings of any milk, cheese or<br />
yoghurt products per day is associated with reduced risk of hypertension (Grade C, Section 5.5 in<br />
Evidence Report [14]) [378-382].<br />
Type 2 diabetes: The evidence suggests that consumption of 2-4 serves of dairy foods (milk,<br />
cheese, yoghurt) per day is associated with reduced risk of metabolic syndrome (Grade C, Section<br />
5.7 in Evidence Report [14]) [376, 383] and that consumption of at least 1.5 serves of milk, cheese<br />
and yoghurt per day is associated with reduced risk of type 2 diabetes (Grade C, Section 5.6 in<br />
Evidence Report [14]) [376, 382, 384].<br />
<strong>DRAFT</strong> <strong>Australian</strong> <strong>Dietary</strong> <strong>Guidelines</strong>- December 2011 63<br />
B<br />
B<br />
C<br />
C<br />
C<br />
C<br />
C
Excess weight: The evidence suggests that consumption of milk is not associated with weight<br />
change or risk of obesity in adults (Grade C, Section 5.8 in Evidence Report [14]) [382, 385-389]<br />
or with BMI or change in BMI in childhood (Grade C, Section 5.9 in Evidence Report [14]) [265,<br />
390-394].<br />
2.5.2.2 Cancer<br />
Rectal and colorectal cancer: Recent evidence suggests it is probable that consumption of more<br />
than one serving of dairy foods per day (especially milk) is associated with reduced risk of<br />
colorectal cancer (Grade B, Section 5.11 in Evidence Report [14]) [292, 395, 396]. The evidence<br />
suggests that consumption of more than one serving of milk per day is associated with reduced<br />
risk of rectal cancer (Grade C, Section 5.12 in Evidence Report [14]) [395-397].<br />
Renal cell, breast and endometrial cancer: It is probable that consumption of three or more<br />
servings of milk per day is not associated with risk of renal cell cancer (Grade B, Section 5.13 in<br />
Evidence Report [14]) [398]. There is evidence to suggest that mean consumption of one serving<br />
of dairy food (milk cheese, yoghurt) per day is not associated with the risk of breast cancer<br />
(Grade C, Section 5.15 in Evidence Report [14]) (from assessment of studies in Alvarez-Leon et al.<br />
2006 [399]; Missmer et al. 2002 [400]) and that consumption of dairy food (milk, cheese, yoghurt)<br />
is not associated with risk of endometrial cancer (Grade C, Section 5.16 in Evidence Report [14])<br />
[401].<br />
Prostate cancer: Recent evidence suggesting an association regarding milk and prostate cancer is<br />
inconclusive (Section 5.14 in Evidence Report [14]).<br />
2.5.2.3 Other conditions<br />
The traditional nutritional rationale for the inclusion of dairy foods such as milk, cheese and<br />
yoghurt is their high calcium content and the positive relationship between calcium and bone mass<br />
[9].<br />
Bone mineral density: Recent evidence suggests that consumption of dairy foods (particularly<br />
milk) is associated with improved bone mineral density (Grade C, Section 5.1<br />
in Evidence Report [14]) [399, 402-407] but this is contradicted by evidence suggesting that less<br />
than one serving of milk per day during adult life is not associated with risk of osteoporotic or hip<br />
fracture (Grade C, Section 5.2 in Evidence Report [14]) [408, 409].<br />
<strong>DRAFT</strong> <strong>Australian</strong> <strong>Dietary</strong> <strong>Guidelines</strong>- December 2011 64
2.5.3 How drinking milk and eating yoghurt, cheese<br />
and/or alternatives may improve health outcomes<br />
Two proposed mechanisms link the consumption of milk, yoghurt and cheese products with a<br />
reduction in cardiovascular risk. Firstly, the consumption of milk, yoghurt and cheese products has<br />
been linked to an increase in the levels of high density lipoprotein (HDL) cholesterol [410, 411].<br />
Secondly, there is evidence of an inverse relationship between milk, yoghurt and cheese<br />
consumption (especially milk) and blood pressure [412] which might be mediated by calcium<br />
modulation of endothelial function [413]. Calcium from foods may be preferable to calcium from<br />
some supplements. A recent meta-analysis of the effect of calcium supplementation on myocardial<br />
infarction and cardiovascular events [414] suggested that calcium supplements, without coadministered<br />
vitamin D, were associated with an increased risk of myocardial infarction. The same<br />
group have more recently reported a similar effect from calcium supplements with vitamin D<br />
[415]. However, the effect of an equivalent dose of calcium from milk, yoghurt and cheese<br />
products has a much smaller effect than calcium supplements on the proposed risk factor, namely<br />
raised serum calcium levels [416].<br />
There may be a negative association between calcium and blood pressure although this is variable,<br />
depending on other dietary factors, and it has been suggested that calcium supplementation may<br />
lower blood pressure only in people with a relatively high salt intake [417].<br />
Several reasons have been suggested for the lack of an association between a low consumption of<br />
milk and increased risk of osteoporotic fracture of the hip. <strong>For</strong> example it has been suggested that<br />
women who consumed higher quantities of milk chose to do so because they were known to be<br />
at an elevated risk of osteoporosis or that milk intake during childhood was more important [418].<br />
A randomized control trial of overweight children found that 200mL of milk per day combined<br />
with nutrition education reduced consumption of sugar-sweetened drinks and increased lean body<br />
mass [419].<br />
2.5.4 Practical considerations: Milk, yoghurt, cheese<br />
and/or alternatives<br />
Consuming at least two and a half serves of milk, cheese, yoghurt and/or alternatives (mostly<br />
reduced fat) is recommended for <strong>Australian</strong> adults, while the recommended food group intakes<br />
for children and adolescents depend on age and sex [10]. Varieties of cheese which are lower in<br />
salt are also preferable (see Section 4.4).<br />
The <strong>Australian</strong> Guide to <strong>Health</strong>y <strong>Eat</strong>ing provides detailed information on number of serves and serve<br />
sizes of milk, yoghurt, cheese and/or alternatives required for different population groups (see<br />
tables 2.7 and 2.8 below).<br />
<strong>DRAFT</strong> <strong>Australian</strong> <strong>Dietary</strong> <strong>Guidelines</strong>- December 2011 65
Table 2.7: Recommended number of serves of number of serves of milk, yoghurt, cheese<br />
and/or alternatives (mostly reduced fat) per day *<br />
* Additional portions of the five food groups or discretionary choices are needed only by people who are taller or more active to meet additional energy requirements.<br />
Source; <strong>Australian</strong> Guide to <strong>Health</strong>y <strong>Eat</strong>ing [114]<br />
Table 2.8: Standard serve size equivalents for milk, yoghurt, cheese and/or alternatives (mostly<br />
reduced fat)<br />
Source; <strong>Australian</strong> Guide to <strong>Health</strong>y <strong>Eat</strong>ing [114]<br />
Analysis of the 1995 National Nutrition Survey [44] included a category called ‘milk products and<br />
dishes’ which included items such as milks, yoghurts, cheese, cream, ice-cream and milk-based<br />
custards, as well as milk substitutes such as soy drinks and soy cheeses. On the day of the survey,<br />
93% of subjects consumed foods from this category, the average intake being 322g for adult males<br />
and 258g for adult women. Older men consumed less of these foods than younger men, but<br />
consumption remained relatively stable in women across age groups.<br />
To meet recommended food group intakes for adults [10] consumption of milk, yoghurt and<br />
cheese products would need to approximately double overall, with a halving of higher fat varieties<br />
and a four-fold increase in reduced fat varieties of milk, cheese and yoghurt. Alternatives, such as<br />
calcium-enriched soy drinks could be substituted for these dairy foods.<br />
<strong>DRAFT</strong> <strong>Australian</strong> <strong>Dietary</strong> <strong>Guidelines</strong>- December 2011 66
2.5.4.1 Pregnant and breastfeeding women<br />
Milk, yoghurt and cheese product intake during pregnancy has clear benefits for both women and<br />
their babies. Reduced-fat milk, yoghurt and cheese products are recommended during pregnancy<br />
and while breastfeeding [220, 362].<br />
Pregnant women are advised to avoid consuming unpasteurised dairy products and soft, semi-soft<br />
and surface-ripened cheeses (for example, brie, camembert, ricotta, fetta and blue cheeses) due to<br />
risk of listeriosis [130, 420].<br />
2.5.4.2 Infants<br />
Cow’s milk should not be given as a drink to infants under 12 months of age. However cow’s milk<br />
may be served in small quantities as custards and desserts. All milk given to infants over 12 months<br />
should be pasteurised. Any milk given to infants under 12 months should be specially prepared<br />
infant formula.<br />
Children under two years are growing rapidly and have relatively high energy (kilojoule) needs.<br />
Reduced fat milks are not recommended as a main milk food for this age, but can be used after<br />
two years.<br />
2.5.4.3 Children and adolescents<br />
Milk is an important source of calcium and protein for growing children and adolescents. The<br />
decreased intake of milk and milk products among adolescent girls is of concern, and can lead to<br />
low calcium intake in this group. Diets restricting intake of milk and milk products are not<br />
generally suitable for growing children and adolescents. Suspected lactose intolerance in children<br />
and adolescents should be confirmed by a medical practitioner.<br />
2.5.4.4 Older people<br />
<strong>For</strong> older <strong>Australian</strong>s, milk is a good source of protein, calcium and energy (kilojoules). All milks,<br />
including full cream milk, are good choices for older people whose appetite is reduced or who<br />
have lost weight, unless medically advised otherwise.<br />
2.5.4.5 People with lactose intolerance<br />
The rate of lactose intolerance is relatively high in many Asian communities compared with<br />
Caucasians. High rates of lactose intolerance have been described among Aboriginal and Torres<br />
Strait Islander groups [421, 422]. Lactose-intolerant adults and children often avoid milk and milk<br />
products, however up to 250mL of milk may be well tolerated [423]. Cheese contains little lactose<br />
<strong>DRAFT</strong> <strong>Australian</strong> <strong>Dietary</strong> <strong>Guidelines</strong>- December 2011 67
and the lactose in yoghurt is partially broken down by bacteria that thicken the yoghurt. Lactosefree<br />
dairy products, such as specialised milks, are also available.<br />
2.5.4.6 Vegetarians<br />
The previous dietary guidelines addressed vegetarian diets and their influence on calcium needs<br />
because of the relatively high oxalate and phytate content. On balance, lacto-ovo-vegetarians<br />
appear to have calcium intakes similar to those of omnivores. Vegetarians who avoid milk and<br />
calcium-fortified soy products should seek advice about whether they need to take calcium<br />
supplements [37].<br />
2.6 Water<br />
2.6.1 Setting the scene<br />
Water is essential for life. It is required for digestion, absorption and transportation, as a solvent<br />
for nutrients, for elimination of waste products and to regulate body temperature. All biochemical<br />
reactions occur in water.<br />
Water is lost from the body in sweating (from 100mL to several 1000mL/day), insensible losses<br />
from the lungs and skin (approximately 800mL/day), faecal losses (200mL/day) and urine. A<br />
minimal urine volume to excrete solute load is estimated at 500mL/day but may need to be much<br />
greater in older people due to declining kidney function [424]. Excluding obvious sweating, the<br />
normal turnover of water has been estimated at approximately 4% of total body weight in adults.<br />
In a 70kg adult, this is equivalent to 2,500-3,000mL/day. Some of this turnover will come from the<br />
water contained in foods. Ambient temperature, physical activity and body size all influence<br />
requirements, creating wide variations in daily needs for water. Losses from the lungs and skin<br />
increase at high temperatures, high altitude and low humidity. During summer, when heat stress<br />
may be high, water depletion can lead to heat exhaustion, loss of consciousness and heat stroke<br />
[425, 426].<br />
The body can compensate in the short term for over- or under-hydration [9], there are no data<br />
on specified hazards from usual consumption. Excess water intake can cause hyponatraemia, but<br />
this is rare in the general population. In general, self-regulation of excess water consumption<br />
occurs in healthy people in temperate climates.<br />
2.6.2 The evidence for ‘drink water’<br />
Consumption of adequate water is essential for human life. Given this, no recent studies<br />
investigating the relationship between water consumption and health outcomes were identified in<br />
<strong>DRAFT</strong> <strong>Australian</strong> <strong>Dietary</strong> <strong>Guidelines</strong>- December 2011 68
the recent review [14]. Many commonly consumed fluids provide water, however they may also<br />
be acidic e.g. tea and coffee or contain added sugar, alcohol or caffeine. Recent studies which<br />
investigated intake of these fluids and health outcomes are reviewed below.<br />
The evidence statements and gradings (A- convincing association, B- probable association, C-<br />
suggestive association) from the Evidence Report (literature from years 2002 – 2009) are<br />
presented in the table below. This does not include evidence from other sources, such as the 2003<br />
<strong>Dietary</strong> <strong>Guidelines</strong> (where evidence was classified as level I, II or III in which individual studies<br />
were classified according to their design but overall grades for relationships were not derived),<br />
although these sources have been used to inform the <strong>Guidelines</strong>.<br />
Evidence Statement Grade<br />
Consumption of sugar sweetened beverages is associated with increased risk of<br />
weight gain in adults and children.<br />
Consumption of coffee of 4 or more cups per day is associated with reduced risk of<br />
type 2 diabetes.<br />
Consumption of green and black tea is associated with reduced risk of stroke.<br />
Consumption of coffee is associated with increased risk of bladder cancer.<br />
Consumption of coffee is associated with increased risk of lung cancer.<br />
Consumption of coffee is associated with reduced risk of endometrial cancer.<br />
Consumption of coffee is associated with reduced risk of hepatocellular cancer<br />
Consumption of soft drink is associated with increased risk of dental caries in<br />
children.<br />
Consumption of soft drinks is associated with increased risk of reduced bone<br />
strength.<br />
2.6.2.1 Cardiovascular disease, type 2 diabetes and excess weight<br />
Cardiovascular disease: The evidence suggests that consumption of black tea is not associated<br />
with risk of cardiovascular disease (Grade C, Section 15.21 in Evidence Report [14]) [427-431].<br />
The evidence suggests that consumption of green and black tea is associated with reduced risk of<br />
stroke (Grade C, Section 15.20 in Evidence Report [14]) [429, 432-435].<br />
<strong>DRAFT</strong> <strong>Australian</strong> <strong>Dietary</strong> <strong>Guidelines</strong>- December 2011 69<br />
B<br />
B<br />
C<br />
C<br />
C<br />
C<br />
C<br />
C<br />
C
The evidence suggests that consumption of coffee is not associated with risk of coronary heart<br />
disease (Grade C, Section 15.13 in Evidence Report [14]) [436-439], although this was not the<br />
case for cigarette smokers.<br />
Type 2 diabetes: There is evidence of a probable association between consumption of more than<br />
four cups of coffee a day and a reduced risk of type 2 diabetes (Grade B, Section 15.15 in Evidence<br />
Report [14]) [440-447]<br />
Excess weight: It is probable that consumption of sugar-sweetened beverages is associated with<br />
weight gain in children and adults (Grade B, Section 15.1 in Evidence Report [14]) [448-459] (see<br />
Chapters 2 and 4).<br />
2.6.2.2 Cancer<br />
2.6.2.2.1 Cancer: Coffee<br />
Bladder and lung cancer: The evidence suggests that consumption of coffee is associated with<br />
increased risk of bladder cancer (Grade C, Section 15.10 in Evidence Report [14]) [460-462] and<br />
lung cancer (Grade C, Section 15.12 in Evidence Report [14]) [463].<br />
Breast, colorectal and ovarian cancer: The evidence suggests that consumption of coffee is not<br />
associated with risk of breast cancer [464], colorectal cancer [294, 465-467] or ovarian cancer<br />
[468-470] (Grade C, Section 15.7, 15.9, 15.11 in Evidence Report [14]).<br />
Endometrial and hepatocellular cancer: The evidence suggests that consumption of coffee is<br />
associated with decreased risk of hepatocellular cancer [471] and endometrial cancer [472, 473]<br />
(Grade C, Section 15.6, 15.8 in Evidence Report [14]).<br />
Gastric cancers: The evidence is inconclusive regarding an association between coffee<br />
consumption and risk of gastric cancer (Section 15.5 in Evidence Report [14]).<br />
2.6.2.2.2 Cancer: Tea<br />
Ovarian and colorectal cancer: The evidence suggests that consumption of green or black tea is<br />
not associated with ovarian cancer (Grade C, Section 15.18 in Evidence Report [14]) [468-470] or<br />
colorectal cancer (Grade C, Section 15.19 in Evidence Report [14]) [465-467, 474, 475].<br />
Other cancers: Recent evidence is inconclusive regarding an association between consumption of<br />
green and black tea and breast, gastric or lung cancer (Section 15.16, 15.17 and 15.22 in Evidence<br />
Report [14]).<br />
<strong>DRAFT</strong> <strong>Australian</strong> <strong>Dietary</strong> <strong>Guidelines</strong>- December 2011 70
2.6.2.3 Other conditions<br />
Dental caries and bone strength: The evidence suggests that consumption of soft drinks is<br />
associated with increased risk of dental caries in children (Grade C, Section 15.14 in Evidence<br />
Report [14]) and increased risk of reduced bone strength (Grade C, Section 15.3 in Evidence<br />
Report [14]) [458, 476-479] (see Chapter 4).<br />
Oral health is also affected by fluids. Fluoride added to tap water provides protection against<br />
dental caries [480]. The mildly alkaline nature of saliva is the key protective element against<br />
corrosion of teeth by acids. If dehydration occurs after exercise or from particular medications, an<br />
adequate intake of water is essential for maximising the protective effect of saliva on oral health<br />
[481]. Dehydration also causes loss of salivary protection against attrition, erosion and abrasion.<br />
The <strong>Australian</strong> Dental Association reports that 68% of <strong>Australian</strong> school students have at least<br />
one tooth eroded [482]. Erosion is related to the acidity of drinks, whether sweetened with sugar<br />
or artificial sweeteners, as well as the bacterial fermentation that can occur with consumption of<br />
sugar (see Section 4.3). The relationship between the acidity of sweetened drinks and dental<br />
erosion is also supported by the American Academy of Pediatrics Committee on School <strong>Health</strong><br />
[483].<br />
Blood pressure: Recent evidence is inconclusive in regards to an association between coffee<br />
consumption and systolic blood pressure (Section 15.14 in Evidence Report [14]).<br />
2.6.3 How drinking water may improve health outcomes<br />
<strong>For</strong> oral health, water has an advantage over many commercially available drinks, including sugarsweetened<br />
or low-kilojoule soft drinks, ‘sports’ and ‘energy’ drinks. As well as the potentially<br />
adverse direct effects of sugar (see Section 3.3) the carbonation process creates an acidic<br />
environment that contributes to the erosion of tooth enamel [481].<br />
The mechanism by which coffee consumption may protect against type 2 diabetes is not clear. It<br />
has been reported that insulin resistance is increased in peripheral tissues after exposure to<br />
caffeine [484] and conversely, the effect of caffeine on thermoregulation has been suggested as a<br />
mechanism by which glucose homeostasis is improved [485]. Other components of coffee,<br />
possibly magnesium, may also assist by benefiting insulin sensitivity and reducing risk of type 2<br />
diabetes [486]. Tea contains polyphenols known as catechins which have been reported to reduce<br />
hypertension, atherosclerosis and thrombogenesis [487]. Polyphenols also play a part in nitric<br />
oxide production from the vascular endothelium, enhancing endothelial health and reducing the<br />
risk of cardiovascular diseases and stroke [487].<br />
<strong>DRAFT</strong> <strong>Australian</strong> <strong>Dietary</strong> <strong>Guidelines</strong>- December 2011 71
2.6.4 Practical considerations: Drink water<br />
The National <strong>Health</strong> and Medical Research Council has developed comprehensive guidelines on<br />
tap water standards for drinking. <strong>Australian</strong> tap water is an ideal option because it is inexpensive<br />
and meets high palatability and hygiene standards. Most tapwater in Australia is fluoridated, which<br />
has been shown to be a safe and effective public health measure. Fluoridation of tapwater provides<br />
an additional benefit for development of strong teeth and bones, making it a very good choice to<br />
ensure adequate hydration. Tank water and bottled waters are a useful alternative when access to<br />
tapwater is limited. Not all bottled waters contain fluoride.<br />
However, access to and availability of clean and safe water may not be available among some<br />
population groups, particularly in remote regions of Australia.<br />
2.6.4.1 Pregnant and breastfeeding women<br />
As stated in the previous dietary guidelines, pregnant and breastfeeding women have a slightly<br />
increased water requirement because of expanding extracellular fluid space and the needs of the<br />
foetus and the amniotic fluid. The fluid need is therefore 750–1000mL a day above basic needs<br />
[37].<br />
Many authoritative bodies advise pregnant and breastfeeding women to limit their caffeine intake –<br />
for example the New Zealand Ministry of <strong>Health</strong> advises that intake be restricted to a maximum<br />
of 300mg of caffeine per day (about three cups of coffee or six cups of tea) [220].<br />
2.6.4.2 Infants<br />
Water turnover is higher in infants and young children than in adults. Adequate levels of hydration<br />
are important, especially during times of potential heat stress (for example, due to hot weather or<br />
fever). Breastmilk supplies adequate water up to around 6 months of age, but cooled boiled water<br />
may need to be provided for formula fed infant [133].<br />
2.6.4.3 Older people<br />
Older people can experience dehydration due to inadequate intake of water or other drinks. The<br />
normal decline in kidney function with age, plus hormonal changes, decreased thirst perception,<br />
medication, cognitive changes, limited mobility and increased use of diuretics and laxatives may<br />
create concern for older people [35]. These changes may be normal adaptations of the ageing<br />
process but the outcomes of dehydration in the elderly are serious and include cognitive<br />
impairment, functional decline, falls or stroke.<br />
<strong>DRAFT</strong> <strong>Australian</strong> <strong>Dietary</strong> <strong>Guidelines</strong>- December 2011 72
Where to next<br />
Both the quality and quantity of foods and drinks consumed can significantly impact<br />
on health and wellbeing. Overconsumption of some foods and drinks containing<br />
some fats, added sugar and salt, and alcohol and relatively poor in nutrients, is<br />
associated with increased risk of some health conditions, and are discussed in the<br />
following chapter.<br />
<strong>DRAFT</strong> <strong>Australian</strong> <strong>Dietary</strong> <strong>Guidelines</strong>- December 2011 73
3. Limit intake of foods and drinks<br />
containing saturated and trans fats,<br />
added salt, added sugars and alcohol<br />
Guideline 2<br />
Limit intake of foods and drinks containing saturated and trans fats, added salt,<br />
added sugars and alcohol.<br />
a. Limit intake of foods and drinks containing saturated and trans fats<br />
Include small amounts of foods that contain unsaturated fats.<br />
Low-fat diets are not suitable for infants.<br />
b. Limit intake of foods and drinks containing added salt<br />
Read labels to choose lower sodium options among similar foods.<br />
Do not add salt to foods.<br />
c. Limit intake of foods and drinks containing added sugars<br />
In particular, limit sugar-sweetened drinks.<br />
d. If you choose to drink alcohol, limit intake<br />
<strong>DRAFT</strong> <strong>Australian</strong> <strong>Dietary</strong> <strong>Guidelines</strong>- December 2011 74
Executive summary<br />
This Guideline emphasises the importance of limiting intake of foods and drinks<br />
high in saturated and trans fats, added salt, added sugars and alcohol, due to<br />
evidence that these foods are associated with increased risk of obesity and/or<br />
chronic disease, including cardiovascular disease, type 2 diabetes and/or some<br />
cancers.<br />
The link between dietary saturated fat, cholesterol and cardiovascular disease is<br />
well established. Replacing dietary saturated fat or trans fat with monounsaturated<br />
and polyunsaturated fats is associated with improved blood lipid profiles and<br />
reduced risk of cardiovascular disease.<br />
Fat-rich foods are energy-dense, and it is prudent to choose low-fat and low<br />
energy-density foods in a total dietary pattern that seeks to control overall energy<br />
intake. Low-fat diets are not suitable for children under two years of age. Reducedfat<br />
milk may be used from the age of two.<br />
Reducing intake of sodium decreases blood pressure in both normotensive and<br />
hypertensive adults, while the evidence has strengthened that reducing sodium<br />
intake might decrease risk of mortality, stroke and heart disease in people with<br />
hypertension. Processed foods are the major source of sodium in western diets.<br />
Frequent consumption of foods and drinks high in added sugars is a major risk<br />
factor in dental caries. There is strengthened evidence of association between<br />
intake of sugar-sweetened drinks and risk of excess weight gain.<br />
The health, social and economic costs associated with excessive alcohol<br />
consumption are well-documented. Limiting alcohol intake is also an important<br />
strategy for achieving appropriate energy intake.<br />
This chapter provides information on why consumption of these food types should<br />
be limited. It includes practical considerations for meeting the guideline, for<br />
example, by choosing a variety of nutritious foods (Guideline 1), using only small<br />
amounts of unsaturated spreads and oils, and avoiding or limiting discretionary<br />
foods and drinks.<br />
<strong>DRAFT</strong> <strong>Australian</strong> <strong>Dietary</strong> <strong>Guidelines</strong>- December 2011 75
3.1 Limiting intake of foods and drinks<br />
containing saturated and trans fat<br />
3.1.1 Setting the scene<br />
Like protein and carbohydrate, fat is a macronutrient which contributes to dietary energy intake.<br />
‘Fat’ is a broad term which can apply to foods such as butter, margarine and oils, and to fatty acids<br />
which are food components. Fats add palatability and texture to the diet, can be a vehicle for<br />
essential nutrients, and have high energy value (fat delivers about 37 kJ/g, compared to around 17<br />
kJ/g for protein and carbohydrate). The proportion of fat in a diet influences its energy density,<br />
which is important for weight management (see Chapter 4). Different fats have different health<br />
effects, so both the amounts and types of fat need to be carefully considered in a diet.<br />
Most fats in foods are in the form of triglycerides, which are made up of a unit of glycerol<br />
combined with three fatty acids which may be the same or different. The differences between one<br />
triglyceride and another are largely due to the fatty acids attached to the glycerol unit. Other<br />
dietary fats include phospholipids, phytosterols and cholesterol [9].<br />
Fatty acids can be saturated (SFA), monounsaturated (MUFA) or polyunsaturated (PUFA). The<br />
type of fatty acid depends on the chemical bonding within the fatty acid molecule, specifically the<br />
number of double bonds between the carbon atoms. This gives them different chemical properties<br />
that cause different biological effects. MUFA and PUFA with one or more double bonds in the<br />
trans configuration are known as trans-fatty acids (TFA) [488]. Omega fatty acids (omega-3 and<br />
omega-6 PUFAs) are sub-classes of PUFA. The most common omega-9 is the MUFA called oleic<br />
acid. Staple foods with a relatively higher fat content, such as nuts, seeds, some grains (for<br />
example, oats), dairy foods and meats have various combinations of fatty acids. Fish is the<br />
predominant source of omega-3 fatty acids, eicosapentaenoic (EPA) (20:5) and docosahexaenoic<br />
(DHA) (22:6). Grass-fed meat, kangaroo and offal also contain these fatty acids as well as the<br />
omega-3 fat docosapentaenoic acid (DPA) (22:5). EPA, DHA and DPA (and some other minor<br />
fatty acids) are referred to as long chain polyunsaturated fatty acids, omega-3 LCPUFA.<br />
The Nutrient Reference Values for Australia and New Zealand recommend total fat should account for<br />
no more than 20–35% of energy (kilojoule) intake. Total SFA and trans-fats should comprise no<br />
more than 10% of energy intake [9]. As humans do not make essential fatty acids, 4–10% of energy<br />
should come from linoleic acid(omega-6 PUFA) and 0.4–1% from α-linolenic acid (omega-3 PUFA)<br />
[9]. Given that total energy intake reflects the sum of the energy value of all foods consumed,<br />
these fatty acid targets can only be met through careful dietary selection, so food choices and<br />
culinary practices can have a substantial impact on the ability to meet these targets [10].<br />
<strong>DRAFT</strong> <strong>Australian</strong> <strong>Dietary</strong> <strong>Guidelines</strong>- December 2011 76
3.1.2 The evidence for ‘limiting intake of foods and<br />
drinks containing saturated and trans fat’<br />
The evidence for associations between dietary fat and the development of type 2 diabetes,<br />
hypertension, cancer and poor mental health was reviewed. The link between dietary saturated<br />
fat, cholesterol levels, atherosclerosis and other components of cardiovascular disease has been<br />
well established in previous guidelines, and was not reviewed here.<br />
The <strong>Guidelines</strong> recommend caution in choosing foods high in fat because of the implications for<br />
weight gain and cardiovascular disease risk. Fat-rich foods are energy (kilojoule) dense, heightening<br />
the risk of excess energy intake [489]. The evidence base for the effects of dietary fat has grown<br />
substantially and increased in specificity with respect to different fatty acids.<br />
Scientific evidence on the effect of dietary fat on health can come from studies that address dietary<br />
variables in a number of ways. These include whole-of-diet studies examining the proportion of fat<br />
in the diet (relative to protein and carbohydrate), the type of fat in the diet (relative to other<br />
types of fat), the effects of specific fatty acids in the diet, and the effects of individual foods in<br />
which fat is a significant component. <strong>For</strong> example, studies could examine the effects of:<br />
a low-fat diet<br />
a diet with a modified dietary fat ratio, for example, a high polyunsaturated:saturated fat<br />
ratio (P:S or PUFA:SFA)<br />
a diet enriched with specific fatty acids (for example, omega-3 fatty acids)<br />
oils and fats (for example, olive oil, spreads) in a defined dietary pattern.<br />
Examining the evidence for the effects of fats and oils on health found a full range of these types of<br />
studies.<br />
Methodological issues arise when considering the effects of fats and of dietary fat in the total diet.<br />
The difficulty in designing studies that address the question of the effect of dietary fat on disease<br />
risk is reflected in several recent reviews on the topic. It is important to note that inconsistency in<br />
results affects the strength of the evidence statements below.<br />
There is ample evidence of the relationships between dietary patterns and disease risk at the<br />
population level [490]. Fat content is an important component of diet quality and it may be that<br />
the evidence for limiting fat in the diet is best considered from the food and whole-of-diet<br />
perspective with additional reference to overall nutritional quality.<br />
The evidence statements and gradings (A- convincing association, B- probable association, C-<br />
suggestive association) related to ‘limit fat’ from the Evidence Report (literature from years 2002 –<br />
2009) are presented in the table below. This does not include evidence from other sources, such<br />
as the 2003 <strong>Dietary</strong> <strong>Guidelines</strong> (where evidence was classified as level I, II or III in which individual<br />
<strong>DRAFT</strong> <strong>Australian</strong> <strong>Dietary</strong> <strong>Guidelines</strong>- December 2011 77
studies were classified according to their design but overall grades for relationships were not<br />
derived), although these sources have been used to inform the <strong>Guidelines</strong>.<br />
Evidence Statement Grade<br />
Consumption of higher LCPUFA fat (intakes amount not specified) is associated<br />
with a reduced risk of dementia<br />
3.1.2.1. Cardiovascular disease, type 2 diabetes and excess weight<br />
Cardiovascular disease: Of the systematic reviews addressing the risk of cardiovascular disease<br />
and consumption of fats and oils [410, 491-499], only one review [410] focused on the<br />
proportions of dietary fatty acids in the overall diet rather than the effects of omega-3 fatty acids<br />
on markers of cardiovascular health. This review confirmed that replacing SFA with unsaturated<br />
fatty acids may reduce the risk of coronary heart disease, and that replacing trans fats with<br />
unsaturated fats improves blood cholesterol levels. From a whole-of-diet perspective, this review<br />
found that reducing the risk of cardiovascular disease by replacing SFA with carbohydrate (as is the<br />
case in some low-fat diets) depends on effects on body weight [410].<br />
The FAO Expert consultation on fats and fatty acids in human nutrition 2010 [500] reports<br />
convincing evidence that replacing SFA with PUFA decreases the risk of coronary heart disease.<br />
The <strong>Dietary</strong> <strong>Guidelines</strong> for Americans, 2010 [143] have come to similar conclusions. They<br />
acknowledge strong evidence that dietary SFA is positively associated with increased serum<br />
cholesterol and LDL cholesterol, with increased risk of cardiovascular disease, while replacing<br />
dietary SFA or trans fats with PUFA is associated with improved blood lipid profile and reductions<br />
in levels of numerous markers of inflammation. The review of the <strong>Dietary</strong> <strong>Guidelines</strong> for Americans,<br />
2010 also noted strong evidence that replacing dietary SFA with MUFA and/or PUFA is associated<br />
with improved blood lipids related to cardiovascular disease, and moderate evidence that 250mg<br />
of LCPUFA delivered with 2 servings of seafood per week is associated with reduced cardiac<br />
mortality from coronary heart disease and reduced risk of sudden death from cardiovascular<br />
disease [143].<br />
Hypertension: The evidence suggests that consumption of fat, irrespective of amount or type, is<br />
not associated with hypertension in the short term (Grade C, Section 12.4 in Evidence Report<br />
[14]) [501-509].<br />
Type 2 diabetes: While overweight and obesity increase the risk of type 2 diabetes [88], recent<br />
short-term interventions are inconclusive and may not adequately reflect the nature of the effect<br />
of dietary fat on type 2 diabetes. The evidence suggests that consumption of LCPUFA (from 0.4 to<br />
6g/day) and diets of varying fat content are not associated with fasting plasma glucose or insulin<br />
concentrations (Grade C, Section 12.3 in Evidence Report [14]) [492, 499, 509-519].<br />
<strong>DRAFT</strong> <strong>Australian</strong> <strong>Dietary</strong> <strong>Guidelines</strong>- December 2011 78<br />
C
In the longer term, the review conducted for the <strong>Dietary</strong> <strong>Guidelines</strong> for Americans 2010 found<br />
strong evidence that dietary SFA was positively associated with increased markers of insulin<br />
resistance and increased risk of type 2 diabetes. In addition, it found decreasing dietary SFA and<br />
replacing it with PUFA or MUFA decreases the risk of type 2 diabetes in healthy adults and<br />
improves insulin responsiveness in insulin resistant and type 2 diabetes subjects. PUFA intake was<br />
associated with a significant decrease in the risk of type 2 diabetes [143].<br />
Excess weight: <strong>Dietary</strong> fat provides a substantial amount of energy (kilojoules) per gram but total<br />
dietary energy is the variable that affects weight. Reducing the amount of dietary fat will not<br />
necessarily reduce dietary energy, but it is prudent to choose low-fat and low energy-density<br />
foods in a total dietary pattern that seeks to control overall energy intake. Because of this total<br />
energy effect, there are difficulties in appraising research on the effect of dietary fat alone on<br />
weight gain [489] (see Chapter 4).<br />
3.1.2.2. Cancer<br />
The evidence suggests there is no association between consumption of LCPUFA with total allcause<br />
cancer incidence or mortality (Grade C, Section 12.5 in Evidence Report [14]) [495, 520].<br />
Other cancers: Evidence of an association between total fat consumption across a range of intakes<br />
and breast or endometrial cancer is inconclusive (Section 12.6 & 12.7, Evidence Report [14])<br />
3.1.2.3. Other conditions<br />
Dementia: The evidence suggests that consumption of higher LCPUFA is associated with a<br />
reduced risk of dementia (Grade C, Section 12.8 in Evidence Report [14]) [317, 329, 521-524].<br />
3.1.3 How limiting intake of foods and drinks containing<br />
saturated and trans fat may improve health outcomes<br />
Fat is an energy-dense macronutrient, so consumption of excess fat may lead to excess energy<br />
(kilojoule) intake and weight gain [489], but an individual’s genetic makeup, physical activity and<br />
other dietary factors also play a part [525]. Fat cells secrete compounds that influence appetite,<br />
inflammation and possibly also cancer development [526-528]. Insulin resistance, reflected in high<br />
insulin and glucose levels, is linked to obesity, and leads to type 2 diabetes. Other cardiovascular<br />
disease risk factors such as high cholesterol levels and hypertension tend to co-exist with insulin<br />
resistance, a phenomenon often referred to as the metabolic syndrome [529].<br />
Fatty acids do not only contribute to body fat. Different fatty acids influence disease risk factors.<br />
<strong>Dietary</strong> SFA and dietary TFA have been associated with raised plasma LDL-cholesterol, and<br />
<strong>DRAFT</strong> <strong>Australian</strong> <strong>Dietary</strong> <strong>Guidelines</strong>- December 2011 79
dietary TFA has been associated with a reduced plasma HDL-cholesterol [88]. These changes in<br />
plasma cholesterol fractions are established risk factors for coronary heart disease that can be<br />
influenced by diet. Raised LDL-cholesterol has been found to be a significant risk factor in at least<br />
50 prospective cohort studies involving more than 600,000 subjects in 18 countries [530]. Several<br />
large cohort studies have also demonstrated that reduced HDL-cholesterol is a significant risk<br />
factor for coronary heart disease [531, 532].<br />
PUFA intake appears to reduce coronary heart disease risk [490], but the balance between<br />
omega-6 and omega-3 PUFA may be important [533]. In addition to effects on lipid metabolism,<br />
PUFA may exert a positive influence on insulin action, appetite regulation, inflammatory responses,<br />
and muscle function [534]. Among the LCPUFA fatty acids, EPA is the precursor of the 3 series of<br />
prostaglandins and the 5 series of leukotrienes [535]. This suggests anti-inflammatory and anticoagulant<br />
effects which may explain the protective influences on cardiovascular disease. DHA is<br />
found in high concentrations in the photoreceptors of the retina and the membranes of the brain,<br />
with implications for cognitive development and mental health [536].<br />
3.1.4 Practical considerations: Limiting intake of foods<br />
and drinks containing saturated and trans fat<br />
The most recent dietary data available in Australia show adults consume 73–101g/day of fat, with<br />
higher intakes among men and younger age groups [44]. Children consume 51–87g/day of fat, with<br />
intake being higher in older age groups [13]. The total fat intake of the population has not<br />
decreased in recent years, but now constitutes a lower proportion of overall energy intake due to<br />
a relative increase in the consumption of carbohydrates, especially refined carbohydrates [48].<br />
Intakes of total fat, in particular saturated fat, are higher than recommended [114]. However, the<br />
mean total population trans-fat intake for Australia is estimated to be 0.5-0.6% of total dietary<br />
energy, which is well below the WHO population goal of less than 1% of total dietary energy from<br />
TFA [234].<br />
<strong>Dietary</strong> fat included in the <strong>Australian</strong> Guide to <strong>Health</strong>y <strong>Eat</strong>ing’s Foundation Diets mainly comes from<br />
fish, lean meat, poultry and milk, yoghurt and cheese products. Where more energy is required in<br />
moving from Foundation to Total Diets, additional serves of these and/or other foods containing fats<br />
can be included as additional nuts and seeds, unsaturated spreads and oils, and/or discretionary<br />
foods.<br />
Limiting the amount and type of fat in the diet can be achieved by choosing vegetables, fruit, lean<br />
meats and low-fat milk, yoghurt and cheese products, and using only small amounts of unsaturated<br />
spreads and oils. Limiting intake of fried foods (including chips) and baked cereal products<br />
(including snack foods, biscuits and cakes) helps to reduce ‘invisible fat’ in the diet. LCPUFA intake<br />
can be increased by eating according to the Foundation Diets and Total Diets, which includes fish<br />
around twice a week. When eating meals outside the home, lower-fat menu choices are<br />
preferable.<br />
<strong>DRAFT</strong> <strong>Australian</strong> <strong>Dietary</strong> <strong>Guidelines</strong>- December 2011 80
The P:M:S ratio is a useful tool in assessing the type and amount of fat consumed and its relative<br />
impact on chronic disease risk. The foods included in the <strong>Australian</strong> Guide to <strong>Health</strong>y <strong>Eat</strong>ing<br />
generally contain low levels of saturated fat and include PUFA and MUFA in proportions that<br />
appear to be protective against heart disease risk and support the maintenance of cognitive<br />
function [9].<br />
<strong>For</strong> quantitative population recommendations see the Nutrient Reference Values for Australia and<br />
New Zealand [9].<br />
3.1.4.1 Infants<br />
<strong>For</strong> infants under the age of around six months, breastmilk provides an ideal amount and type of<br />
fat. The <strong>Guidelines</strong> on fat intake for the adult population are not applicable to young children,<br />
particularly those under two years. The amount and type of fats required for infants are related to<br />
physiological and health outcomes [9]. Even a small energy deficit during this period of rapid<br />
development may affect growth [9]. Neurological development is particularly rapid in the first two<br />
years of life and restriction of the fat intake during that time may interfere with optimal energy<br />
intake and reduce the supply of essential fatty acids, particularly long chain omega-3 PUFA needed<br />
by developing nervous tissue, adversely affecting growth and development.<br />
3.1.4.2 Children and adolescents<br />
Reduced fat milk may be used from the age of two years, when milk plays a less dominant role in<br />
the diet (see Chapter 2). A high-fat diet is likely to be energy-dense, contributing to excess energy<br />
intake and the development of obesity (see Chapter 4). Even at a young age, a diet high in<br />
saturated fats may predispose children and adolescents to the development of cardiovascular<br />
disease later in life and the evidence supports this advice on fat intake for children from two years<br />
of age [537]. Introducing healthy eating patterns in early childhood influences dietary patterns in<br />
later childhood [538, 539].<br />
3.1.4.3 Older people<br />
Low-fat diets are not suitable for convalescent older people and frail aged people (to whom these<br />
guidelines do not apply) because of the possible adverse effects of energy restriction in these<br />
groups. However, for those aged 65–75 who are well, the type and amount of fat in the diet<br />
deserves consideration. Although the increased relative risk of raised plasma cholesterol for<br />
coronary heart disease tends to be lower in older people than in younger adults, lowering of lipid<br />
levels can reduce risk of ischemic heart disease regardless of age [540].<br />
<strong>DRAFT</strong> <strong>Australian</strong> <strong>Dietary</strong> <strong>Guidelines</strong>- December 2011 81
3.1.4.4 Aboriginal and Torres Strait Islanders<br />
Limiting intake of excess energy from any source, including total fat, is particularly important given<br />
the higher prevalence of obesity in Aboriginal and Torres Strait Islander groups compared to non-<br />
Indigenous <strong>Australian</strong>s [30, 32]. Limiting saturated and trans fat are important given the high<br />
prevalence of coronary heart disease, and decreased saturated fat intake may also improve insulin<br />
sensitivity.<br />
3.1.4.5 Culturally and linguistically diverse groups<br />
The profile of dietary fat will vary depending on traditional culinary use. Food product labels may<br />
assist people in learning about the amounts and types of fats in unfamiliar or newly introduced<br />
manufactured foods.<br />
3.2 Limit intake of foods and drinks containing<br />
added salt<br />
3.2.1 Setting the scene<br />
<strong>Dietary</strong> guidelines have recognised the role of sodium in elevating blood pressure since the draft<br />
United States Surgeon General’s report released in 1979 [541]. Initial advice to the public was<br />
framed to reduce consumption of discretionary salt, such as salt added at the table or during<br />
cooking. More recently it has been recognised that processed foods are the major source of<br />
sodium in Western diets, so advice needs to include processed food. Sodium occurs naturally in<br />
food, and a range of sodium-containing additives are also added to manufactured and processed<br />
foods. In these <strong>Guidelines</strong>, salt always refers to sodium chloride and is never used as a synonym for<br />
the total amount of sodium in foods.<br />
Since the previous edition of the <strong>Dietary</strong> <strong>Guidelines</strong> in 2003, the evidence for a relationship<br />
between reducing sodium intake and reducing blood pressure has strengthened, particularly in<br />
those classified as normotensive. In addition there is now some evidence indicating that reducing<br />
sodium may result in a reduction in outcomes such as mortality, stroke and heart disease for<br />
those with hypertension, but not, as yet, for those with normal blood pressure.<br />
<strong>DRAFT</strong> <strong>Australian</strong> <strong>Dietary</strong> <strong>Guidelines</strong>- December 2011 82
3.2.2 The evidence for ‘limiting intake of foods and<br />
drinks containing added salt’<br />
The evidence for the <strong>Guidelines</strong> focuses on dietary sodium intake, rather than salt intake, because<br />
most studies forming the body of evidence statements measured total sodium intake or urinary<br />
sodium excretion (which is a marker of sodium intake from all sources including salt, other<br />
additives containing sodium, and naturally occurring sodium).<br />
The evidence statements and gradings (A- convincing association, B- probable association, C-<br />
suggestive association) related to ‘limit added salt’ from the Evidence Report (literature from years<br />
2002 – 2009) are presented in the table below. This does not include evidence from other<br />
sources, such as the 2003 <strong>Dietary</strong> <strong>Guidelines</strong> (where evidence was classified as level I, II or III in<br />
which individual studies were classified according to their design but overall grades for<br />
relationships were not derived), although these sources have been used to inform the <strong>Guidelines</strong>.<br />
Evidence Statement Grade<br />
Decreasing consumption of sodium decreases blood pressure (BP) in<br />
normotensive adults; a reduction of 1,800mg reduces systolic BP by about<br />
2mmHg and diastolic BP by about 1mmHg<br />
Decreasing consumption of sodium decrease blood pressure (BP) in hypertensive<br />
adults; a reduction of 1800mg reduces systolic BP by about 5mmHg and diastolic<br />
by about 3mmHg<br />
Consuming a diet low in sodium reduces blood pressure in children up to 18<br />
years of age<br />
Reducing sodium intake by about 1000mg/day is associated with reduced risk of<br />
cardiovascular events<br />
3.2.2.1 Cardiovascular disease, type 2 diabetes and excess weight<br />
Blood pressure: The evidence is convincing that decreasing consumption of sodium decreases<br />
blood pressure in normotensive adults; a reduction of 1,800mg per day reduces systolic BP by<br />
about 2 mmHg and diastolic blood pressure by about 1mmHg (Grade A, Section 13.1 in Evidence<br />
Report [14]). The evidence is also convincing that decreasing consumption of sodium decreases<br />
blood pressure in hypertensive adults - a reduction of 1,800mg per day reduces systolic BP by<br />
about 5mmHg and diastolic blood pressure by about 3mmHg (Grade A, Section 13.1 in Evidence<br />
Report [14]) [542-557]. Reducing sodium intake reduces both systolic and diastolic blood<br />
<strong>DRAFT</strong> <strong>Australian</strong> <strong>Dietary</strong> <strong>Guidelines</strong>- December 2011 83<br />
A<br />
A<br />
B<br />
C
pressure, and the effect is greater in those with hypertension than in those with normal blood<br />
pressure [551-554].<br />
There is evidence of a probable association between a diet low in sodium and a reduction in blood<br />
pressure in children up to 18 years of age (Grade B, Section 13.2 in Evidence Report [14]) [553,<br />
557, 558].<br />
The <strong>Dietary</strong> <strong>Guidelines</strong> for Americans, 2010 draw similar conclusions regarding the relationship<br />
between sodium and blood pressure. They state ‘a strong body of evidence has documented that<br />
in adults, as sodium intake decreases, so does blood pressure. A moderate body of evidence has<br />
documented that as sodium intake decreases, so does blood pressure in children, from birth to 18<br />
years of age’ [143]. They also note that people with hypertension, diabetes and chronic kidney<br />
disease are more sensitive to sodium than healthier younger people, and that sensitivity to sodium<br />
increases with age.<br />
Cardiovascular disease: Despite extensive research on the relationship between sodium and<br />
blood pressure, few long term studies have examined changes in sodium intake and changes in<br />
cardiovascular morbidity and mortality. Past studies have mainly included subjects with<br />
hypertension. The evidence suggests that reducing sodium intake by about 1,000mg/day is<br />
associated with reduced risk of cardiovascular events (Grade C, Section 13.4 in Evidence Report<br />
[14]) [552, 559-564]. The results are consistent with results from drug trials that have shown that<br />
reductions in high blood pressure also lead to reductions in adverse cardiovascular outcomes<br />
[565, 566].<br />
3.2.2.2 Cancer<br />
Evidence of a probable association between consumption of salt and salt-preserved foods with<br />
gastric cancer was found in the systematic review prepared as the background paper for the Joint<br />
WHO/FAO Expert Consultation on diet, nutrition and prevention of chronic diseases [567]. This<br />
association was described as convincing by the WCRF [42]. The WCRF also reported convincing<br />
evidence of an association between processed meats (meat preserved by smoking, curing, salting<br />
or addition of chemical preservatives such as nitrites) and increased risk of colorectal cancer [42]<br />
but it is unclear whether the responsible factor in the food is the salt, other components such as<br />
nitrites, or a combination of these factors.<br />
3.2.2.3 Other conditions<br />
Bone health: Evidence suggesting an association between a low sodium diet and markers of bone<br />
health in postmenopausal women is inconclusive (Section 13.3, Evidence Report [14]).<br />
<strong>DRAFT</strong> <strong>Australian</strong> <strong>Dietary</strong> <strong>Guidelines</strong>- December 2011 84
3.2.3 How limiting intake of foods and drinks containing<br />
added salt may improve health outcomes<br />
Sodium and other electrolytes are needed to maintain extracellular volume and serum osmolality.<br />
There are various systems and hormones that influence sodium balance including the reninangiotensin-aldosterone<br />
hormone system, the sympathetic nervous system, atrial natriuretic<br />
peptide, the kallikrein-kinin system, various intrarenal mechanisms, and other factors that regulate<br />
renal and medullary blood flow [9].<br />
Future data may lead to some refinement in understanding the underlying mechanisms. <strong>For</strong><br />
example, the ratio of sodium to potassium may influence blood pressure more strongly than the<br />
amount of sodium alone [560-562] and reducing sodium intakes may be particularly important for<br />
overweight people with certain conditions [563]. The <strong>Dietary</strong> <strong>Guidelines</strong> for Americans, 2010<br />
comment that the effects of higher sodium intake can be countered if potassium intake is also<br />
higher and note that potassium intakes in the US are lower than desirable [143].<br />
3.2.4 Practical considerations: Limiting intake of foods<br />
and drinks containing added salt<br />
There has been a shift in the language on this issue. The first edition of the <strong>Dietary</strong> <strong>Guidelines</strong><br />
included the guideline ‘<strong>Eat</strong> less salt’ [568]. The second edition revised this to ‘Choose low salt<br />
foods and use salt sparingly’ [569]. The third edition advised <strong>Australian</strong>s to ‘Choose foods low in<br />
salt’ [37]. In these <strong>Guidelines</strong>, it is recognised that any reduction in dietary sodium would reduce<br />
blood pressure in both hypertensive and normotensive people.<br />
The Nutrient Reference Values for Australia and New Zealand recommend an intake of sodium in the<br />
range 460–920mg/day for adults to cover the essential requirement. Current advice in Australia is<br />
for dietary sodium intake to be preferably less than 1,600mg/day for adults or no higher than the<br />
set Upper Level (UL) of 2,300mg/day (approximately equal to 6g of table salt) ([9]). Among those<br />
with high sodium intakes, reduction in sodium intake would reduce blood pressure even if specific<br />
targets are not achieved.<br />
Diets that are consistent with the <strong>Guidelines</strong> will help to limit sodium intake. Fresh, unprocessed or<br />
minimally processed foods such as fresh vegetables, including legumes/beans, and fruit, frozen or<br />
tinned vegetables, including legumes/beans, and fruit with no added salt, meats, fish and milk are<br />
generally lower in sodium. Some breads and cereal products and cheese are high in salt and make<br />
a significant contribution to sodium intake, although there is considerable variation between<br />
products and brands. However, these foods provide other important health benefits outlined in<br />
the relevant sections of the <strong>Guidelines</strong>. The public should not avoid these foods, but should be<br />
encouraged to check food labels and select lower-sodium products in these categories. Some<br />
foods are labelled ‘low sodium/salt’ because they contain less than 120mg of sodium per 100g. Not<br />
<strong>DRAFT</strong> <strong>Australian</strong> <strong>Dietary</strong> <strong>Guidelines</strong>- December 2011 85
all foods which meet this criterion carry a ‘low sodium’ claim, and some higher sodium foods such<br />
as bread and cheese also contain important nutrients.<br />
Because salt is 40% sodium, avoiding discretionary salt in cooking or at the dinner table will also<br />
reduce sodium intake. In the 1995 National Nutrition Survey, 62% of the population aged two years<br />
and older reported always or usually adding salt at the table or during cooking [570]. Since 1995,<br />
Asian-style cooking is increasingly popular in Australia and many Asian-style sauces such as soy,<br />
oyster and fish sauces are high in sodium. Lower sodium options of these foods should be chosen,<br />
recognising that they may still have high sodium content. Salt substitutes or ‘lite’ salts which<br />
replace some sodium chloride with potassium chloride can provide a salt taste with lower levels of<br />
sodium. Herbs, spices, garlic, lemon juice and vinegar can also be used to season foods without<br />
adding salt.<br />
Iodine deficiency previously existed in Australia and has re-emerged in recent years. Iodised salt is<br />
one way to increase iodine intake. Since 2009, it has been mandatory for any salt used in<br />
commercial bread baking to be iodised (organic bread is exempt from this requirement) [570].<br />
Consequently it would unnecessary for most individuals to use discretionary iodised salt for the<br />
purpose of obtaining iodine. Milk and dairy foods are an important source of iodine in Australia.<br />
3.2.4.1 Pregnant and breastfeeding women<br />
Advice to limit the intake of sodium for the general population is also applicable to pregnant and<br />
breastfeeding women [571].<br />
3.2.4.2 Infants<br />
The Australia New Zealand Food Standard Code sets maximum limits for the sodium content of<br />
commercially prepared infant foods such as rusks, biscuits and other ready-to-eat foods, and<br />
prohibits the addition of salt to fruit-based foods, fruit drinks and vegetable juices [234]. These<br />
restrictions are needed because infants have a lower renal capacity than older children and adults.<br />
Parents and carers who are introducing infants to solid foods should be advised to minimise<br />
sodium intake. This means preparing home-made infant foods without salt or ingredients that are<br />
high in salt or sodium, and minimising infants’ intake of other processed foods that are high in<br />
sodium.<br />
3.2.4.3 Children<br />
<strong>For</strong> children with average energy needs, the dietary patterns in the Modelling System [10]<br />
contained up to 50% less sodium than the average sodium intakes reported in the 2007 <strong>Australian</strong><br />
National Children’s Nutrition and Physical Activity Survey [13].<br />
<strong>DRAFT</strong> <strong>Australian</strong> <strong>Dietary</strong> <strong>Guidelines</strong>- December 2011 86
3.2.4.4 Older people<br />
Taste perception decreases with age and can be a factor in decreased food intake and<br />
malnutrition. <strong>For</strong> a chronically ill older person who has high blood pressure, clinicians need to<br />
weigh up the benefit of the addition of salt to food to improve flavour (with improved intake and<br />
quality of life, and reduced risk of malnutrition) against the risks of hypertension and its<br />
management. <strong>For</strong> chronically ill older people who do not have high blood pressure, there is no<br />
reason to reduce salt as there are no additional health benefits to be gained and maintaining food<br />
intake is a priority.<br />
3.3 Limit intake of foods and drinks containing<br />
added sugars<br />
3.3.1 Setting the scene<br />
Sugars are carbohydrates, for example fructose, glucose, lactose or sucrose. When sugars occur<br />
naturally in foods such as fruit, vegetables and dairy products they are referred to as intrinsic<br />
sugars. However, the major source of sugar in the <strong>Australian</strong> diet is sucrose from sugar cane<br />
which is added to foods and is termed an extrinsic sugar. Sucrose is widely used in processed<br />
foods and drinks as a sweetener and also plays a role as a flavour enhancer and preservative.<br />
Sugars provide a readily absorbed source of energy, but added sugars can increase the energy<br />
content of the diet while diluting its nutrient density. Sugars are a major factor in dental caries and<br />
diets high in added sugars are also associated with some adverse health outcomes. Sugarsweetened<br />
drinks (fruit juice drinks, soft drinks, flavoured mineral waters and sports drinks) are<br />
the largest source of sugars in the <strong>Australian</strong> diet, with consumption highest in adolescents and<br />
children [44]. New evidence emphasises the relevance of sugar-sweetened drinks to the<br />
development of excess weight (see below).<br />
Dental caries remains a significant public health problem in Australia. In 2007–8, $6.1 billion was<br />
spent on dental services in Australia, representing 6.2% of all health expenditure [572]. In severe<br />
cases, dental caries can cause loss of teeth and pain that may reduce dietary intake and<br />
compromise nutritional status.<br />
There are particular concerns about the recent increase in consumption of added sugars from<br />
sweetened drinks (see Chapter 4).<br />
<strong>DRAFT</strong> <strong>Australian</strong> <strong>Dietary</strong> <strong>Guidelines</strong>- December 2011 87
3.3.2 The evidence for ‘limiting intake of foods and<br />
drinks containing added sugars’<br />
All previous <strong>Australian</strong> dietary guidelines have recommended restricting added sugars. There has<br />
been little change in the evidence linking added sugars with dental caries, but the targeted<br />
literature review found strengthened evidence for a relationship between sugar-sweetened drinks<br />
and excess weight gain.<br />
The evidence statements and gradings (A- convincing association, B- probable association, C-<br />
suggestive association) from the Evidence Report (literature from years 2002 – 2009) are<br />
presented in the table below. This does not include evidence from other sources, such as the 2003<br />
<strong>Dietary</strong> <strong>Guidelines</strong> (where evidence was classified as level I, II or III in which individual studies<br />
were classified according to their design but overall grades for relationships were not derived),<br />
although these sources have been used to inform the <strong>Guidelines</strong>.<br />
Evidence Statement Grade<br />
Consumption of sugar-sweetened beverages is associated with increased risk of<br />
weight gain in adults and children<br />
High or frequent consumption of added sugars, particularly for infants and young<br />
children, is associated with increased risk of dental caries<br />
Consumption of soft drink is associated with increased risk of dental caries in<br />
children<br />
Consumption of soft drinks is associated with increased risk of reduced bone<br />
strength.<br />
3.3.2.1 Cardiovascular disease, type 2 diabetes and excess weight<br />
Excess weight: Recent studies show evidence of a probable association between sugar-sweetened<br />
drinks and weight gain in adults and children (Grade B, Section 15.1 in Evidence Report [14]) [448-<br />
459]. A more recent longitudinal study also strengthens the evidence associating sugar-sweetened<br />
drinks with weight gain [573].<br />
There is insufficient consistent evidence available to form an evidence statement about fruit juices<br />
and weight gain. Some studies found no association in children [392-394, 456] while two studies in<br />
children [449, 574] and one in adults [575] did find an association. Children drinking less fruit juice<br />
[192] and those who consume more fruit [457] had lower BMI Z-scores, and children at risk of<br />
becoming overweight had a higher risk of gaining fat if they consumed fruit juice [449].<br />
<strong>DRAFT</strong> <strong>Australian</strong> <strong>Dietary</strong> <strong>Guidelines</strong>- December 2011 88<br />
B<br />
C<br />
C<br />
C
No large studies have measured the long-term development of overweight and obesity specifically<br />
related to consumption of sugars, although one retrospective cohort study reported that adults<br />
who consumed less sugar-sweetened foods had less increase in skinfold fat and waist<br />
circumference over a five-year period (Section 14.3, Evidence Report [14]; [192].<br />
Type 2 diabetes: Insufficient studies were identified to develop an evidence statement for intake of<br />
sugars and type 2 diabetes [576, 577]. However, more recent studies indicate that sugarsweetened<br />
drinks may increase the risk of developing type 2 diabetes [578]. A recent metaanalysis<br />
also supports an increased risk for type 2 diabetes and the metabolic syndrome from<br />
consumption of sugar-sweetened drinks [579].<br />
Cardiovascular disease: There is no new evidence that sugars play a causal role in the<br />
development or moderation of the risk factors for cardiovascular disease. Early studies suggested<br />
that a reduction in dietary sucrose could lower elevated triglyceride levels, but it is likely that the<br />
effects seen were the result of a reduction in energy intake and body weight [580].<br />
3.3.2.2 Cancer<br />
There is evidence suggesting that consumption of sucrose is not associated with the risk of cancer<br />
(Grade C, Section 14.1 in Evidence Report [14]) [581-585]. The World Cancer Research Fund<br />
found no convincing or probable evidence of increased risk of all cancers with the intake of sugars,<br />
but some limited evidence of an association between a high intake of sugars and increased risk of<br />
colorectal cancer [586]. The most recent WCRF statements urge caution with energy-dense foods<br />
and sugar-sweetened drinks because of their association with obesity and its link with some<br />
cancers [42].<br />
3.3.2.3 Other conditions<br />
Dental caries: The relationship between sucrose and dental caries was first documented more<br />
than a century ago [587] and has been confirmed in numerous studies since [588]. Historically, the<br />
prevalence of dental caries has increased when dietary patterns have changed to include more<br />
added sugars and foods containing refined starches. New evidence supports past findings and<br />
suggests that high or frequent consumption of added sugars, particularly for infants and young<br />
children, is associated with increased risk of dental caries (Grade C, Section 14.2 in Evidence<br />
Report [14]) [589-593]. The evidence also suggests that dental caries are related to sugarsweetened<br />
drinks (Grade C, Section 15.4 in Evidence Report [14]) [589, 591].<br />
Caries are associated with national per capita yearly sucrose consumption, with very little caries in<br />
children at 10 kg/year (about 30 g/day) or less. A steep increase may occur from 15 kg/year<br />
upwards [88].<br />
<strong>DRAFT</strong> <strong>Australian</strong> <strong>Dietary</strong> <strong>Guidelines</strong>- December 2011 89
The sugars contained in the cellular structure of foods, such as the intrinsic sugars of fresh fruit<br />
and vegetables, have been found to have little cariogenic potential, whereas foods high in extrinsic<br />
sugars are most damaging to teeth [594].<br />
Bone strength: Evidence suggests an association between consumption of soft drinks and<br />
increased risk of reduced bone strength (Grade C, Section 15.3 in Evidence Report [14]) [476-<br />
479]. Cola drinks (sugar-sweetened and diet varieties), but not other carbonated drinks, are<br />
associated with significantly lower bone mineral density in women, but not in men [479]. In young<br />
men, significant adverse changes in indices of bone remodelling and bone resorption markers<br />
occurred when cola drinks were added to a low-calcium diet compared with adding milk [476]. A<br />
systematic review reported an inverse relationship between soft drink consumption and milk<br />
intake [458].<br />
It appears that soft drink consumption is associated with some problems related to bone health,<br />
but, with the exception of some limited evidence related to cola drinks, it remains unclear<br />
whether soft drinks exert a direct effect or reflect their inverse relationship with milk<br />
consumption.<br />
ADHD: There is no evidence that added sugars are involved in the aetiology of attention<br />
deficit/hyperactivity disorder (ADHD) [595].<br />
3.3.3 How limiting intake of foods and drinks containing<br />
added sugars may improve health outcomes<br />
Dental caries: Important factors for development of caries include the bacterium Streptococcus<br />
mutans, dietary sugars and a susceptible tooth surface. Fermentable carbohydrates (both sugars<br />
and starches) are a substrate for bacteria such as S. mutans and S. sobrinus, which increase the acidproducing<br />
potential of dental plaque [596]. <strong>Dietary</strong> sugars other than sucrose - for example,<br />
glucose and lactose - can also induce caries, although these sugars are less cariogenic than sucrose<br />
because, in addition to being converted to acid metabolites, sucrose is uniquely used for<br />
extracellular polysaccharide synthesis.<br />
Oral hygiene, dental care, fluoridated water supplies, the type of food and salivary function are<br />
also important. The more frequently foods containing added sugars are consumed, the greater the<br />
risk of caries since frequent consumption does not allow remineralisation of the teeth [597]. The<br />
duration of exposure depends on how long sugary foods stay in the mouth and the number of<br />
eating occasions. On the basis of the scientific evidence, advice on sugar intake for the prevention<br />
of dental caries should include frequency of intake as well as the amount. The acidity of sweetened<br />
drinks is also relevant to dental erosion, a major factor in dental decay [483]. This applies equally<br />
to sugar-sweetened or diet soft drinks, since their acidity is comparable.<br />
<strong>DRAFT</strong> <strong>Australian</strong> <strong>Dietary</strong> <strong>Guidelines</strong>- December 2011 90
Excess weight: Many foods containing added sugars, including soft drinks, confectionery, cakes<br />
and biscuits, are energy-dense but nutrient-poor. The association between sugar-sweetened drinks<br />
and weight gain appears to be related to the reduced effect on satiety with sugars in a liquid<br />
medium. Past studies found that compensation for energy from sugar-sweetened drinks is less<br />
complete than that for energy in solid form [598]. Newer evidence backs this failure to<br />
compensate by reducing energy intake from other foods or drinks [578]. Sugar-sweetened drinks<br />
therefore add to total energy intake [599].<br />
Nutrient density may also be compromised by a high intake of added sugars. At any given level of<br />
energy intake, as the proportion of added sugars in the diet increases, the nutrient density will fall<br />
[600]. This was quantified in a recent analysis of NHANES data (2003–2006) which noted that<br />
intake of essential nutrients was less with each 5% increase in added sugars above 5–10% of energy<br />
[601].<br />
3.3.4 Practical considerations: Limiting intake of foods<br />
and drinks containing added sugars<br />
In light of the current prevalence of overweight and obesity (see Chapter 4), the dietary guidelines<br />
of many countries recommend significant reductions in foods that contribute to energy while<br />
providing few, if any, nutrients [143]. Many foods and drinks containing some fats, added sugars<br />
and some starches, and alcohol fit into this category. Sugars provide approximately a quarter of<br />
children’s energy intake, with 4.6–7.6% of energy coming from sugar-sweetened drinks other than<br />
milk [13].<br />
There is insufficient evidence to recommend an exact intake of added sugars suitable for the<br />
whole population. From a nutritional perspective, good health can be achieved without the<br />
addition of sugars in any form to the diet. <strong>For</strong> those who are not overweight and are already<br />
consuming an adequate diet (a minority of the population), added sugars relate mainly to the<br />
problem of dental caries. <strong>For</strong> the majority of the population, however, overweight and obesity are<br />
major problems and require a reduction in energy intake. Limiting added sugars, particularly from<br />
sugar-sweetened drinks, is one strategy for adults and children. The World <strong>Health</strong> Organization<br />
recommends that no more than 10% of energy should come from added sugars [88]. Recent data<br />
from the US suggests a level of 5–10% of energy from added sugars may be appropriate [601]. This<br />
is much less than current <strong>Australian</strong> consumption, reinforcing the continued need for this<br />
Guideline.<br />
3.3.4.1 Infants<br />
Baby-bottle caries is a recognised problem in infants who are pacified by sucking on a bottle for<br />
long periods. Babies who fall asleep while continuing to feed from a bottle containing infant<br />
formula, fruit juice or other sugar-containing liquid can develop a severe form of tooth decay<br />
[602]. Infants do not need added sugars and the Australia New Zealand Food Standards Code<br />
<strong>DRAFT</strong> <strong>Australian</strong> <strong>Dietary</strong> <strong>Guidelines</strong>- December 2011 91
stipulates that ready-prepared infant foods with more than 4g of added sugars per 100g must be<br />
labelled as ‘sweetened’ [234].<br />
3.3.4.2 Children<br />
Milk and water are the recommended drinks for children. Children and adolescents should limit<br />
intake of sugar-sweetened drinks. Common sugar-sweetened drinks include soft drink, ‘sports<br />
drinks’, ‘vitamin waters’, cordials and energy drinks. Energy drinks may also be high in caffeine (see<br />
Chapter 2) and are not suitable for children. Sweetened flavoured milk provides nutrients but can<br />
be high in energy-density; plain milk is preferable.<br />
3.3.4.3 Older people<br />
Including a moderate amount of added sugars as a flavour enhancer can increase variety and<br />
palatability for older people and will not compromise nutrient intake if added to nutritious foods.<br />
Sugars are also a readily-absorbed source of energy for the frail aged.<br />
3.3.4.4 Aboriginal and Torres Strait Islanders<br />
In remote Aboriginal communities, apparent consumption of sugars is much higher than the<br />
<strong>Australian</strong> average while consumption of fruit and vegetables is well below the <strong>Australian</strong> average<br />
[134]. In remote communities where apparent consumption was measured, refined sugars<br />
contributed approximately 30% of total energy intake, with 60% of the sugars in the form of white<br />
sugar added to foods and drinks. No data are available for urban Indigenous communities.<br />
Historically, Aboriginal <strong>Australian</strong>s had substantially fewer dental caries than non-Indigenous<br />
people, but this trend has been reversed with the oral health of non-Indigenous children improving<br />
and that of Aboriginal children deteriorating [603]. Aboriginal children and other <strong>Australian</strong><br />
children from the lowest socioeconomic groups have not had the improvement in dental health<br />
seen in other children.<br />
3.4 Alcoholic drinks<br />
3.4.1 Setting the scene<br />
<strong>For</strong> many people, an alcoholic drink is a regular and enjoyable part of meals. In terms of nutrition,<br />
alcohol is uniquely the only substance that is both a food providing energy and a drug affecting<br />
brain function. <strong>For</strong> these reasons advice on alcohol is included in these <strong>Guidelines</strong>.<br />
Drinking alcohol has health, social and economic costs and benefits for both individuals and<br />
populations. It was previously believed that people who drink small quantities of alcohol may have<br />
<strong>DRAFT</strong> <strong>Australian</strong> <strong>Dietary</strong> <strong>Guidelines</strong>- December 2011 92
etter health outcomes than those who do not drink, but this finding is being increasingly<br />
challenged [604]. Most studies have found that abstainers have better health outcomes than heavy<br />
drinkers.<br />
In the <strong>Australian</strong> population, alcohol is responsible for 3.3% of the total disease burden while it<br />
prevents 1% of the total disease burden. This equates to a net effect of 2.3%, equivalent to 61,091<br />
DALYS (Disability Adjusted Life Years) and 0.8% (1,084) of all deaths [11]. In Indigenous<br />
<strong>Australian</strong>s, alcohol is responsible for a net 5.4% of the total disease burden and 6.7% of all deaths<br />
[605]. Alcohol is second only to tobacco as a preventable cause of drug-related death and<br />
hospitalization [606].<br />
The total social costs of alcohol were $15.3 billion in 2004/05, the majority (71%) being for<br />
tangible costs such as reduction of the workforce, absenteeism, health care, law enforcement,<br />
alcohol education campaigns and research [607, 608].<br />
This chapter utilises the recent NHRMC publication <strong>Australian</strong> <strong>Guidelines</strong> to Reduce <strong>Health</strong> Risks<br />
from Drinking Alcohol [609] with additional evidence sourced from the Evidence Report to inform<br />
the revision of the <strong>Guidelines</strong> [14].<br />
The alcohol guidelines are as follows.<br />
1. <strong>For</strong> healthy men and women, drinking no more than two standard drinks on any one day<br />
reduces the lifetime risk of harm from alcohol-related disease or injury.<br />
2. <strong>For</strong> healthy men and women, drinking no more than four standard drinks on a single<br />
occasion reduces the risk of alcohol-related injury arising from that occasion.<br />
3. a. Parents and carers should be advised that children under 15 years of age are at the<br />
greatest risk of harm from drinking and that for this age group, not drinking alcohol is<br />
especially important.<br />
b. <strong>For</strong> young people aged 15-17 years, the safest option is to delay the initiation of drinking<br />
for as long as possible.<br />
4. a. <strong>For</strong> women who are pregnant or planning a pregnancy, not drinking is the safest option.<br />
b. <strong>For</strong> women who are breastfeeding, not drinking is the safest option.<br />
Most recommendations on alcohol consumption are made on the basis of ‘standard’ drinks<br />
consumed. A standard drink in Australia contains 10g of alcohol (equivalent to 12.5mL of alcohol)<br />
[609]. The alcohol concentration of drinks is printed on the label in terms of percentage by<br />
<strong>DRAFT</strong> <strong>Australian</strong> <strong>Dietary</strong> <strong>Guidelines</strong>- December 2011 93
volume. However in social situations serving sizes are greater than standard drinks – for example a<br />
typical glass of wine in Australia is 170mL [610] which contains close to two ‘standard’ drinks.<br />
<strong>For</strong> some groups, the contribution of alcohol to energy intake is significant. Median percentages of<br />
contribution of alcohol to energy intake for age and sex groups and the energy content of<br />
common alcoholic drinks is included at Appendix 6. <strong>For</strong> example, if a man with average energy<br />
intake consumed four standard drinks of beer, this would account for 13–15% of his energy intake.<br />
The proportion of energy obtained from alcohol for those who consume it peaks at age 19–24 for<br />
women and 25–44 for men, and declines thereafter.<br />
If the consumption of other foods or drinks is reduced to adjust for the extra energy intake from<br />
alcohol, over time this could lead to a deficiency of key nutrients. In view of the increasing<br />
prevalence of overweight and obesity, limiting alcohol intake is an important strategy for achieving<br />
energy balance.<br />
3.4.2 The evidence for ‘limiting alcohol’<br />
The evidence statements and gradings (A- convincing association, B- probable association, C-<br />
suggestive association) from the Evidence Report (literature from years 2002 – 2009) are<br />
presented in the table below. This does not include evidence from other sources, such as the 2003<br />
<strong>Dietary</strong> <strong>Guidelines</strong> (where evidence was classified as level I, II or III in which individual studies<br />
were classified according to their design but overall grades for relationships were not derived),<br />
although these sources have been used to inform the <strong>Guidelines</strong>.<br />
Evidence Statement Grade<br />
Consumption of alcohol regularly at an intake of 1 standard drink per day for<br />
women and 1.5-2 per day for men is associated with a reduced risk of CVD<br />
morbidity and mortality.<br />
Consumption of alcohol regularly at an intake of 1 standard drink per day for<br />
women and 1.5-2 per day for men increases HDL cholesterol.<br />
Consumption of alcohol, even at low levels (10-15 g/d), is associated with<br />
increased risk of breast cancer.<br />
Consumption of alcohol is associated with increased risk of cancer of the<br />
oesophagus.<br />
Consumption of alcohol, even at low levels (10g/day) of consumption, is<br />
associated with an increased risk of colon cancer and rectal cancer.<br />
<strong>DRAFT</strong> <strong>Australian</strong> <strong>Dietary</strong> <strong>Guidelines</strong>- December 2011 94<br />
B<br />
B<br />
B<br />
B<br />
C
Evidence Statement Grade<br />
Consumption of alcohol, even at low levels (10 g/d) is associated with increased<br />
risk of liver cancer in some populations.<br />
Consumption of alcohol is associated with an increased risk of cancer of the oral<br />
cavity, pharynx and larynx.<br />
Consumption of alcohol at the level of 1 standard drink per day for women and<br />
1.5-2 per day for men, with a maximum intake of 4 standard drinks per day, is<br />
associated with reduced risk of dementia in older adults.<br />
3.4.2.1 Cardiovascular disease, type 2 diabetes and excess weight<br />
Cardiovascular disease: There is evidence of a probable association between consumption of one<br />
standard drink per day for women and 1.5–2 per day for men with a reduced risk of<br />
cardiovascular disease morbidity and mortality (Grade B, Section 16.1 in Evidence Report [14])<br />
[611-613]. A meta-analysis evaluating the relationship between alcohol intake and cardiovascular<br />
mortality in patients with a history of cardiovascular disease showed a J-shaped dose effect curve,<br />
with an alcohol intake of approximately 26g/day having maximal protection. The authors<br />
concluded that light to moderate alcohol consumption, defined as 5–25g/day, is significantly<br />
associated with a lower incidence of cardiovascular and total mortality [614]. However the<br />
evidence is not yet conclusive, particularly for Asian populations [615];[604];[616];[617].<br />
There is evidence of a probable association between consumption of one standard drink per day<br />
for women and 1.5–2 per day for men with an increase in HDL cholesterol (Grade B, Section 16.1<br />
in Evidence Report [14]) [618-625]. Recent reviews of population-based studies [614, 626, 627]<br />
support these statements.<br />
Although an insufficient number of studies were identified to formulate an evidence statement,<br />
excess alcohol consumption has been found to increase the risk of high blood pressure [628, 629].<br />
A more recent review supports these findings, suggesting a synergistic effect between alcohol,<br />
hypertension and cerebrovascular events [630].<br />
The Canadian and <strong>Australian</strong> guidelines on the management of hypertension include the<br />
moderation of alcohol intake as an important intervention [631]. High blood pressure is a major<br />
risk factor for both ischaemic and haemorrhagic stroke [632].<br />
Type 2 diabetes: Evidence regarding an association between alcohol intake and risk of type 2<br />
diabetes is inconclusive (Section 16.2, Evidence Report [14]).<br />
<strong>DRAFT</strong> <strong>Australian</strong> <strong>Dietary</strong> <strong>Guidelines</strong>- December 2011 95<br />
C<br />
C<br />
C
3.4.2.2 Cancer<br />
There is increasing evidence of an association between alcohol consumption and heightened risk<br />
of specific cancers. In general, the evidence suggests that different types of alcoholic drink have<br />
similar effects [42]. The WCRF concludes that the number of cancers for which alcohol is a<br />
known risk factor is increasing. It appears unlikely that there is a threshold of alcohol intake below<br />
which there is no effect on cancer risk.<br />
Breast cancer: There is evidence of a probable association between consumption of alcohol, even<br />
at low levels (10 g/day), and an increased risk of breast cancer (Grade B, Section 16.4 in Evidence<br />
Report [14]) [633-639].<br />
Oesophageal cancer: There is evidence of a probable association between consumption of alcohol<br />
and an increased risk of cancer of the oesophagus (Grade B, Section 16.6 in Evidence Report [14])<br />
[42, 633].<br />
Colon and rectal cancer: The evidence suggests that consumption of alcohol, even at low levels<br />
(10 g/day), is associated with an increased risk of colon cancer and rectal cancer (Grade C, Section<br />
16.5 in Evidence Report [14]) [42, 633, 640, 641].<br />
Liver cancer: The evidence suggests that consumption of alcohol, even at low levels (10 g/day), is<br />
associated with increased risk of liver cancer in some populations (Grade C, Section 16.9 in<br />
Evidence Report [14]) [42, 633].<br />
Oral cavity, pharynx and larynx: The evidence suggests that consumption of alcohol is associated<br />
with an increased risk of cancer of the oral cavity, pharynx and larynx (Grade C, Section 16.7 in<br />
Evidence Report [14]) [42, 633, 642].<br />
Non-Hodgkins lymphoma: Evidence that the consumption of alcohol is associated with Non-<br />
Hodgkins lymphoma is inconclusive (Section 16.11, Evidence Report [14]).<br />
Other cancers: The evidence that consumption of alcohol is associated with renal, pancreatic and<br />
ovarian cancer is inconclusive (Section 16.8, 16.10, 16.12 Evidence Report [14]).<br />
3.4.2.3 Other conditions<br />
Alcohol-related liver disease: As discussed in the previous dietary guidelines, there is continuing<br />
evidence that excess alcohol consumption is associated with an increased risk of alcohol-related<br />
liver disease (fatty liver, cirrhosis of the liver, alcohol hepatitis) [643]. The same level of average<br />
consumption is related to a higher risk of liver cirrhosis in women than in men [644].<br />
<strong>DRAFT</strong> <strong>Australian</strong> <strong>Dietary</strong> <strong>Guidelines</strong>- December 2011 96
Dementia: The evidence suggests an association between the consumption of one standard drink<br />
per day for women and 1.5-2 per day for men, with a maximum intake of four standard drinks per<br />
day, and a reduced risk of dementia in older adults (Grade C, Section 16.3 in Evidence Report<br />
[14]) [645-651].<br />
Alcohol use is associated with an increased risk of a number of mental health and social problems<br />
in young adults [652]. The existence of psychiatric comorbidities in young people who drink<br />
heavily is common, especially for conditions such as depression, anxiety, bipolar disorder, conduct<br />
disorder and attention-deficit/hyperactivity disorder [652-656].<br />
Nutrition-related conditions: Alcohol consumption is linked to malnutrition, Wernicke-Korsakoff<br />
syndrome, folate deficiency, Vitamin A depletion and pellagra [657]. Excessive consumption of<br />
alcohol (severe alcoholism) leads to malnutrition if normal diet is neglected. The financial<br />
resources of the patient can be diverted away from purchase of food to acquiring and consuming<br />
alcohol. In Australia the fortification of bread with thiamin has contributed to a 40% reduction in<br />
the incidence of Wernicke-Korsakoff syndrome [658, 659].<br />
Other conditions associated with harmful levels of alcohol consumption include:<br />
dependence and addiction<br />
endocrine conditions, for example, hypercortisonism and sexual dysfunction<br />
alcoholic related brain damage including alcoholic dementia<br />
gastritis and gastric ulcers<br />
aspiration pneumonia<br />
cardiomyopathy<br />
interactions with pharmaceuticals and illegal recreational drugs [609].<br />
3.4.3 How limiting alcohol may improve health<br />
outcomes<br />
Alcohol begins to affect the brain within five minutes of consumption, with blood alcohol<br />
concentration peaking after 30–45 minutes. It takes approximately one hour for the liver to clear<br />
the alcohol from one standard drink from the body, although this time varies depending upon liver<br />
size, lean body mass, individual alcohol tolerance and genes controlling the expression of alcoholmetabolising<br />
enzymes in the liver [660-662]. Because the rate of metabolism is fixed, rapid<br />
consumption of multiple drinks results in a higher blood alcohol concentration.<br />
Young adults who drink heavily tend to have smaller prefrontal cortices and white matter,<br />
structural abnormalities of white matter and reduced hippocampal volumes [663, 664]. These<br />
structural changes lead to a diminished ability to retrieve verbal and non-verbal material and<br />
poorer performance in attention-based tests [652].<br />
<strong>DRAFT</strong> <strong>Australian</strong> <strong>Dietary</strong> <strong>Guidelines</strong>- December 2011 97
The loss of brain tissue that occurs in people with chronic alcoholism seems to occur<br />
independently of Wernicke’s encephalopathy and may be related to ethanol toxicity and poor<br />
nutrition.<br />
Cardiovascular effects: The effect of alcohol on the cardiovascular system is complex. Alcohol can<br />
raise blood pressure and increase the risk of arrhythmias, shortness of breath, some types of<br />
cardiac failure, haemorrhagic stroke and other circulatory problems. However, low levels of<br />
alcohol raise high-density lipoprotein cholesterol and reduce plaque accumulations in arteries<br />
[626, 665]. Alcohol can also have a mild anticoagulant effect.<br />
Diabetes: Alcohol affects the management of diabetes through its effects on diet and control of<br />
blood glucose levels. Alcohol interferes with the action of insulin, insulin secretagogues and<br />
glucagon, thereby increasing the risk of hypoglycaemia in people with Type I or 2 diabetes who<br />
take these medications [666, 667].<br />
Dementia: If alcohol has a protective effect against dementia, this may relate to the effect of<br />
alcohol on blood lipids as one of the causal factors of dementia is microvascular changes within the<br />
brain [668, 669].<br />
3.4.4 Practical considerations: Limiting alcohol<br />
Of <strong>Australian</strong>s aged over 14 years, 83% reported having consumed alcohol at least once in the 12<br />
months preceding the 2007 National Drug Strategy Household Survey, with 8% drinking alcohol<br />
on a daily basis and about 47% consuming alcohol at least weekly [670]. The majority of<br />
<strong>Australian</strong>s who reported consuming alcohol also reported moderating their intake, primarily to<br />
reduce the risk to their health. Methods included counting and limiting the number of drinks,<br />
eating food while consuming alcohol, alternating between alcoholic and non-alcoholic drinks and<br />
drinking low-alcohol drinks [670].<br />
Nearly all alcohol is consumed as drinks, principally beers and wines. Alcoholic drinks contain few<br />
other nutrients except for the bioactive flavonoids found in wine, mainly in red wine. Alcoholic<br />
drinks are usually consumed with foods, either as part of a meal or accompanied by snack foods,<br />
increasing the associated energy intake.<br />
The apparent average consumption of alcohol is estimated at 10.08L per person over 15 years old<br />
per year [671], and declines with age [672]. Consumption is 45% higher in the Northern Territory<br />
than in the rest of Australia. The average consumption equates to an additional 650 kJ/day for<br />
every person over 15 years of age from alcohol. Alcoholic drinks that contain added sugar have<br />
additional energy. Clearly if alcohol is consumed in addition to the normal diet, leading to excess<br />
energy intake compared to requirements, weight will increase.<br />
A full stomach will reduce the rate of absorption of alcohol into the bloodstream. Drinking alcohol<br />
in combination with eating therefore reduces the rate at which blood alcohol content increases.<br />
<strong>DRAFT</strong> <strong>Australian</strong> <strong>Dietary</strong> <strong>Guidelines</strong>- December 2011 98
Drinking coffee, having a cold shower, vomiting or exercise do not reduce blood alcohol content<br />
[609].<br />
3.4.4.1 Pregnant and breastfeeding women<br />
Alcohol consumption by pregnant women may harm the unborn baby. Heavy daily drinking or<br />
heavy episodes of drinking have the most risk, and the risk from low-level drinking (one or two<br />
drinks per week) is likely to be small. However there is no lower limit that can be guaranteed to<br />
be completely safe, so avoiding alcohol while pregnant or breastfeeding is the safest option [609].<br />
There is limited research on the effects of maternal alcohol consumption during lactation and<br />
infant development. Mothers who consume alcohol are more likely to stop breastfeeding before<br />
six months than mothers who do not drink [673, 674]. Animal and observational studies suggest<br />
that the consumption of two standard drinks or more per day during lactation is associated with<br />
deficits in infant psychomotor development and disrupted infant sleep-wake behavioural patterns<br />
[673]. A baby’s intake of alcohol from breastmilk is not harmless. Alcohol levels in breastmilk<br />
parallel blood alcohol levels and therefore the longer the time between drinking alcohol and<br />
breastfeeding, the safer for the baby. The safest option for women who are breastfeeding is to<br />
abstain from alcohol (see Section 3.4) [609]. <strong>For</strong> those who drink, expressing milk before<br />
consuming alcohol is the next best option [609].<br />
3.4.4.2 Children and adolescents<br />
Alcohol use by younger people is associated with harmful effects on brain development. The<br />
NHMRC recommends that parents and carers should be advised that children under 15 years of<br />
age are at the greatest risk of harm from drinking. <strong>For</strong> this age group, not drinking alcohol is<br />
especially important. <strong>For</strong> people aged 15−17 years, the safest option is to delay drinking for as long<br />
as possible [609].<br />
3.4.4.3 Older people<br />
Older people are more susceptible than others to the toxic effects of alcohol due to changes in<br />
their body composition, decreased metabolic capacity, the presence of co-morbid conditions and<br />
medications that regulate these conditions [675].<br />
Many older people take medications that may interact with alcohol. A combination of alcohol and<br />
medication increases the risk of falls and injury [676-678].<br />
The NHMRC Alcohol <strong>Guidelines</strong> state that ‘cumulative alcohol-related harm is more evident<br />
among older people. <strong>For</strong> some older adults, drinking alcohol increases the risk of falls and injuries,<br />
<strong>DRAFT</strong> <strong>Australian</strong> <strong>Dietary</strong> <strong>Guidelines</strong>- December 2011 99
as well as some chronic conditions. Older people are advised to consult their health professionals<br />
about the most appropriate level of drinking for their health’ [609].<br />
3.4.4.4 Aboriginal and Torres Strait Islanders<br />
Aboriginal or Torres Strait Islander peoples are more likely than other <strong>Australian</strong>s to abstain from<br />
drinking alcohol (23% compared to about 15%). However, those who do consume alcohol are<br />
more likely to do so at risky or high-risk levels for short-term harm [670]. In response to severe<br />
problems related to excess alcohol consumption in many Indigenous communities, initiatives have<br />
been introduced to encourage non-harmful alcohol use, limit access to alcohol, and establish ‘dry’<br />
areas and communities. As with the general population, Aboriginal and Torres Strait Islander<br />
people should follow the alcohol guidelines described above [609].<br />
3.4.4.5 Culturally and linguistically diverse groups<br />
People from culturally diverse groups are more likely than the general adult population in Australia<br />
to abstain from alcohol (43% compared to 15%) [670]. The possible protective health effect of<br />
moderate drinking has not been demonstrated in Asian groups. Alcohol drinking customs vary in<br />
different cultures and typically immigrant groups bring their drinking patterns from their country<br />
of origin.<br />
3.4.4.6 People with diabetes<br />
As alcohol and hypoglycaemia have independent but additive effects on cognitive function and<br />
behaviour, it is recommended that people with diabetes abstain from alcohol if they plan to drive<br />
[679]. Alcohol worsens medical conditions associated with diabetes, such as liver disease,<br />
hypertension and advanced neuropathy [666, 680]. People with diabetes may need to take special<br />
precautions when drinking and should discuss alcohol use with a health professional.<br />
3.4.4.7 Interaction of alcohol and energy drinks<br />
A new category of alcoholic drinks is now being marketed in Australia with added caffeine and<br />
sometimes other stimulants. The effects of alcohol and other components in these energy drinks<br />
appear to be synergistic, resulting in increased intoxication. In comparison to alcohol alone, the<br />
combination of alcohol and energy drink significantly reduces the intensity of subjective<br />
perceptions of headache, dry mouth, weakness and impairment of motor coordination [681]. The<br />
concern is that consuming caffeine, a central nervous system stimulant, and alcohol, a depressant,<br />
at the same time will reduce subjective perceptions of alcohol-induced impairment in comparison<br />
to alcohol alone [682, 683]. Reduced ability in recognising alcohol impairment may enhance risktaking<br />
behaviour and possibly lead to greater alcohol intake [684].<br />
<strong>DRAFT</strong> <strong>Australian</strong> <strong>Dietary</strong> <strong>Guidelines</strong>- December 2011 100
In the absence of any research to quantify safe levels of concurrent consumption of energy drinks<br />
and alcohol, this combination should be avoided.<br />
Where to next<br />
The next chapter provides information on the importance of quantity, as well as<br />
quality and overall energy balance, when choosing foods to promote healthy<br />
weight, to promote health and wellbeing and to prevent chronic disease.<br />
<strong>DRAFT</strong> <strong>Australian</strong> <strong>Dietary</strong> <strong>Guidelines</strong>- December 2011 101
4. Achieve and maintain a healthy<br />
weight<br />
Guideline 3<br />
To achieve and maintain a healthy weight you should be physically active and<br />
choose amounts of nutritious foods and drinks to meet your energy needs.<br />
Children and adolescents should eat sufficient nutritious foods to grow and<br />
develop normally. They should be physically active every day and their<br />
growth should be checked regularly.<br />
Older people should eat nutritious foods and keep physically active to help<br />
maintain muscle strength and a healthy weight.<br />
<strong>DRAFT</strong> <strong>Australian</strong> <strong>Dietary</strong> <strong>Guidelines</strong>- December 2011 102
Executive summary<br />
<strong>Health</strong>y weight is associated with reduced risk of chronic disease, including<br />
cardiovascular disease, type 2 diabetes and some cancers. Unhealthy weight refers<br />
to being underweight, overweight or obese.<br />
An optimum dietary pattern for adults to achieve and maintain healthy weight is<br />
one in which nutrient requirements are met and total energy intake does not often<br />
exceed total energy expenditure.<br />
Physical activity is an important part of a healthy, active life.<br />
The high and increasing prevalence of overweight and obesity in Australia highlights<br />
the need to provide guidance for achieving and maintaining a healthy weight. Small,<br />
persistent excess energy intake will cause excess weight gain in people of any age.<br />
Recent evidence highlights the importance of achieving an appropriate energy<br />
intake, rather than targeting specific macronutrients (protein, fat or<br />
carbohydrates). In general the quantities of foods outlined in the <strong>Australian</strong> Guide to<br />
<strong>Health</strong>y <strong>Eat</strong>ing should not be exceeded and consumption of energy-dense, nutrientpoor<br />
discretionary foods and drinks should be limited.<br />
Weight should be measured regularly in adults and the amount and/or quality of<br />
food, drinks and physical activity adjusted accordingly. Children and adolescents<br />
need sufficient nutritious foods to grow and develop normally and their growth<br />
should be checked regularly to ensure appropriate development is occurring.<br />
As most <strong>Australian</strong> adults are now of unhealthy weight, this chapter offers<br />
population level advice on managing weight gain and reduction while discouraging<br />
inappropriate food restriction, particularly among high risk groups.<br />
This chapter provides information on the importance of quantity, as well as quality,<br />
when choosing foods to achieve healthy weight, to promote health and wellbeing<br />
and prevent chronic disease.<br />
<strong>DRAFT</strong> <strong>Australian</strong> <strong>Dietary</strong> <strong>Guidelines</strong>- December 2011 103
4.1 Setting the scene<br />
A healthy weight is a body weight associated with normal growth and development in children,<br />
and a reduced risk of short- and long-term morbidity and mortality among people of all ages [685-<br />
689]. While it is unhealthy to be underweight, overweight or obese [88, 685], ideal weight varies<br />
from one person to another and at different stages of life. A small or large persistent excess<br />
energy intake can cause unwanted weight gain in people of any age.<br />
There is widespread recognition of a global epidemic of overweight and obesity which requires<br />
urgent attention [89, 685, 690, 691]. Overweight and obesity contributed 7.5% of the burden of<br />
premature death and disability in Australia in 2003[11]. In Western Australia and Queensland,<br />
where more recent data are available, at 8.3–8.6% it has now overtaken cigarette smoking as the<br />
single greatest contributor of the biomedical risk factors assessed [692, 693].<br />
A focus on healthy weight is a more positive way to address weight issues than focusing on obesity<br />
and overweight. It encourages those who are a healthy weight to maintain that weight. It also helps<br />
reduce the risk of any unintended negative consequences, such as disordered eating. Promotion of<br />
healthy weight incorporates prevention and management of underweight, overweight and obesity<br />
in children and adults and promotes healthy growth in children.<br />
4.1.1 Weight status and trends in Australia<br />
4.1.1.1 Adults<br />
Measured height and weight data in 2007-08 showed that 2% of <strong>Australian</strong> adults were<br />
underweight, 37% were of healthy weight, 37% were overweight and 25% were obese [694].<br />
Overweight and obesity was more common in men than women (68% v 55%) and in people aged<br />
65–74 years (75%) than in other age groups.<br />
The prevalence of overweight and obesity has increased significantly in Australia and most<br />
developed countries since the 1970s [685, 691, 695], although there is some evidence of a<br />
reduction in the rate of increase in children and adolescents in Australia over the past decade<br />
[696].<br />
4.1.1.2 Children and adolescents<br />
A number of national and state-based surveys of children and adolescents using measured height<br />
and weight data have found that between 21–25% of children and adolescents are overweight<br />
and/or obese. Between 5–8% are obese and 2–5% are underweight [12, 13, 697-700]. The<br />
<strong>DRAFT</strong> <strong>Australian</strong> <strong>Dietary</strong> <strong>Guidelines</strong>- December 2011 104
prevalence of obesity alone is higher for boys than girls (10% compared with 6%) [12], although<br />
the prevalence of combined overweight and obesity is similar (26% for boys and 24% for girls)<br />
[12]. The prevalence of overweight and obesity has increased significantly over the past two<br />
decades. Although the rate of increase appears to be slowing in children [701], the high prevalence<br />
remains of concern [702].<br />
Childhood obesity has been identified as one of the most serious public health challenges of the<br />
21st century [703]. In the United States it has been predicted that - due to premature mortality<br />
associated with obesity developing at a younger age - the current generation of children will be the<br />
first in that country’s history to have a life expectancy lower than their parents[704]. As obesity is<br />
an important determinant of a range of health disorders, unless the increasing prevalence of<br />
overweight and obesity is arrested the burden of chronic disease in future generations will be<br />
pandemic [6, 695], causing a crisis in health and economic systems across the world [88, 685, 688].<br />
4.1.1.3 Predicted trends<br />
If current trends continue in Australia, it is estimated that by 2025, 83% of men and 75% of<br />
women aged 20 years or more will be overweight or obese [705].<br />
The predicted increases would significantly affect disease burden and health care costs, mostly due<br />
to an increased incidence of type 2 diabetes. <strong>For</strong> example, without intervention, type 2 diabetes<br />
will account for around 9% of the total disease burden in Australia in 2023, up from around 5% in<br />
2003 [11].<br />
<strong>DRAFT</strong> <strong>Australian</strong> <strong>Dietary</strong> <strong>Guidelines</strong>- December 2011 105
How is healthy weight assessed?<br />
The most common approach is the use of the body mass index (BMI) calculated as weight (in<br />
kilograms)/height (in metres) 2 (kg/m 2 ).<br />
BMI is a measure of body size that is widely used as an index of relative risk of mortality and<br />
morbidity at the population level [687, 691]. The association of mortality with BMI is a U-shaped<br />
curve with the lowest risk within the healthy weight range [687, 706].<br />
An adult with a BMI < 18.5 kg/m 2 is categorized as underweight. An adult with a BMI from 18.5 to<br />
25.0 is a healthy weight, while an adult with a BMI ≥ 25.0 kg/m 2 is overweight and an adult with a<br />
BMI ≥ 30.0 kg/m 2 is obese [691, 707].<br />
However, this classification may not be suitable for all ethnic groups. Some groups may have<br />
equivalent levels of risk at lower BMI (e.g. people of Asian origin) or higher BMI (e.g. people of<br />
Polynesian origin) [708]. A BMI range of 23–28kg/m 2 may be desirable for people aged over 70<br />
[709]. BMI ranges have not been developed for Aboriginal and Torres Strait Islander people.<br />
Waist circumference is also used as a proxy for health risk in adults. A waist circumference above<br />
80 centimetres in women or above 94 centimetres in men signifies being overweight. A waist<br />
circumference above 88 centimetres in women or above 102 centimetres in men signifies being<br />
obese [13, 710].<br />
Growth during childhood means it is not possible to have a single set of numerical values for BMI<br />
cut-offs that apply to all ages and both sexes. Therefore, among children and adolescents, weight<br />
appropriateness is commonly categorised using Z-scores (or SD Scores) [711] or age-related cutoff<br />
values [712, 713]. <strong>For</strong> more information, see Appendix 3.<br />
4.1.2 <strong>Health</strong> effects associated with weight status<br />
4.1.2.1 Adults<br />
Overweight and obesity are associated with increased risk of type 2 diabetes, cardiovascular<br />
disease, some cancers, hypertension, musculoskeletal conditions, respiratory conditions, social<br />
isolation, depression and other psychological disorders, sleep apnoea, cholecystitis, insulin<br />
resistance and metabolic syndrome, hernia, reproductive disorders, urinary incontinence and skin<br />
conditions [88, 89, 685]. About 70% of people who are obese have at least one established comorbidity,<br />
resulting in medical costs about 30% greater than their healthy-weight peers [714].<br />
<strong>DRAFT</strong> <strong>Australian</strong> <strong>Dietary</strong> <strong>Guidelines</strong>- December 2011 106
Compared to having a BMI between 18.5 and 25, at a BMI of 30–35kg/m 2 , median survival is<br />
reduced by 2–4 years, at BMI 40–45kg/m 2 it is reduced by 8–10 years [706]. The relative increase<br />
in mortality rate attributable to obesity tends to decline with age [715]. Mortality and morbidity<br />
are also associated with the amount of weight gained in adult life [89, 685, 688].<br />
Many obesity-related conditions are preventable, and several are at least partially reversible<br />
through weight loss achieved by adopting a nutritious dietary pattern and active lifestyle [89, 685,<br />
688].<br />
While the greatest risk to health on a population basis is associated with being overweight, being<br />
underweight can also have adverse health consequences including decreased immunity (leading to<br />
increased susceptibility to some infectious diseases), osteoporosis, decreased muscle strength, and<br />
hypothermia[37]. Among older people, being underweight may be more deleterious to health than<br />
being overweight [716].<br />
4.1.2.2 Children and adolescents<br />
The most immediate consequences of overweight/obesity in childhood is social discrimination<br />
associated with poor self-esteem and depression, increased risk of development of negative body<br />
image issues, and eating disorders [688]. Overweight children and adolescents are more likely to<br />
develop sleep apnoea, heat intolerance, breathlessness on exertion and reduced exercise<br />
tolerance, tiredness, some orthopaedic and gastrointestinal problems, steatohepatitis and early<br />
signs of metabolic and clinical consequences, such as hypertension, hyperinsulinaemia,<br />
hypertriglyceridaemia and type 2 diabetes [688, 717].<br />
A major long-term consequence is that overweight children are more likely to become overweight<br />
adults with an increased risk of chronic diseases and early mortality [688, 717-719]. The risk of<br />
chronic disease is increased with rapid weight gain in infancy and early childhood [88, 89].<br />
In infancy and early childhood, underweight and failure to thrive can be more prevalent than<br />
overweight and obesity in some communities. Failure to thrive is most commonly a result of<br />
socioeconomic factors, including poor living conditions [720] but can also occur among affluent<br />
sections of the community due to inappropriate dietary restrictions, for example based on fears<br />
about ‘unhealthy’ dietary habits leading to the development of atherosclerosis [721]. Specialist<br />
advice should be sought on underweight and failure to thrive in infants and children.<br />
Inappropriate dietary restriction and eating disorders occur in some adolescents [722].<br />
<strong>DRAFT</strong> <strong>Australian</strong> <strong>Dietary</strong> <strong>Guidelines</strong>- December 2011 107
4.1.3 Causes of overweight and obesity in the population<br />
<strong>Health</strong>y body weight results from an appropriate balance between energy intake and expenditure<br />
(of which physical activity is a component) [89, 688, 723]. At the population level, there is<br />
increasing evidence that excess energy intake is a major contributor to current energy imbalances<br />
[88, 723-728].<br />
4.1.3.1 The obesogenic environment<br />
Obesity is a complex condition mediated by an individual’s metabolism and behaviour as well as<br />
societal and environmental factors.<br />
Although some genetic factors may increase an individual’s susceptibility to being overweight or<br />
obese, the dramatic increases in prevalence of overweight and obesity over the past three to four<br />
decades without any major change in the gene pool suggests that socio-environmental factors are<br />
primarily responsible for the current epidemic [88, 89, 685, 688, 726, 727, 729]. Significant socioenvironmental<br />
changes during this period include, but are not limited to:<br />
changes in the food supply, particularly increased availability and decreased relative cost of<br />
foods which tend to be higher in energy density and relatively nutrient-poor [730]<br />
increased availability and marketing of energy-dense, nutrient-poor foods and drinks<br />
urban design which reduces energy expenditure during daily activities and increased<br />
reliance on car and labour-saving devices [726, 731]<br />
reduced perceptions of safety leading to fewer opportunities for physical activity [732, 733]<br />
economic and consumer changes, such as a greater number of females in the paid<br />
workforce, decreased food literacy and cooking skills, and greater reliance on convenience<br />
and takeaway foods [728, 729, 734].<br />
These changes all promote excess weight gain by fostering consumption of energy-dense and<br />
relatively nutrient-poor foods and/or reduced physical activity [726, 735-738].<br />
Against such social and physical environments, overweight and obese individuals need support,<br />
rather than criticism and discrimination. <strong>Health</strong>y weight initiatives must achieve a balance between<br />
individual and societal responsibility and be culturally appropriate, widely available and accessible,<br />
particularly to disadvantaged and vulnerable groups [89, 739].<br />
<strong>DRAFT</strong> <strong>Australian</strong> <strong>Dietary</strong> <strong>Guidelines</strong>- December 2011 108
4.1.3.2 Energy intake and trend data<br />
Energy intake increased in the decade or so to 1995 by 3–4% in adults (see Figure 4.1) [740-743],<br />
This increase equates to an additional 900kJ to1400kJ per day across all groups. Without<br />
compensatory increases in energy expenditure, these changes are enough to result in the<br />
significant observed increase in mean body weight [48].<br />
More recent data will be available soon as dietary intakes of people aged two years and over are<br />
being collected in the <strong>Australian</strong> <strong>Health</strong> Survey in 2011-2012 [93].<br />
Figure 4.1 Mean energy intakes of adults: 1983 and 1995*<br />
Kilojoules<br />
14000<br />
12000<br />
10000<br />
8000<br />
6000<br />
4000<br />
2000<br />
0<br />
* Figure adapted from Cook et al (2001)[48]<br />
Mean energy intakes of adults: 1983 and 1995<br />
Males Females<br />
Energy intake in the decade or so from 1983 to 1995 increased by 11% for 10–15 year-olds girls<br />
and by 15% for 10–15 year-olds boys [48]. Accounting for seasonal differences in the data<br />
collections, the results of the 2007 <strong>Australian</strong> National Children’s Nutrition and Physical Activity Survey<br />
show that mean energy intakes have since decreased in boys aged 10-15 years and slightly<br />
increased in girls aged 10-15 years from 1995 to 2007 (see Figure 4.2).<br />
<strong>DRAFT</strong> <strong>Australian</strong> <strong>Dietary</strong> <strong>Guidelines</strong>- December 2011 109<br />
1983<br />
1995
Figure 4.2 Mean energy intakes of children aged 10-15 years: 1995 and 2007**<br />
Kilojoules<br />
12000<br />
10000<br />
8000<br />
6000<br />
4000<br />
2000<br />
Mean energy intakes of children aged 10-15 years: 1995 and 2007<br />
0<br />
** Unpublished FSANZ analysis; 1995 data restricted to February to August to match the time frame of the 2007<br />
survey; 2007 survey analysis used the first day of food data only.<br />
4.1.3.3 Energy from macronutrients<br />
Macronutrients (proteins, fats and carbohydrates) all contribute to dietary energy intake [9].<br />
Alcohol also contributes to dietary energy, and it is recommended that alcohol intakes should<br />
contribute less than 5% of dietary energy because of the negative association between intake of<br />
alcohol and health outcomes (see Chapter 3).<br />
There is a growing body of evidence that the relative proportions of macronutrients consumed<br />
can affect the risk of chronic disease and may also affect micronutrient intake [9]. Optimal<br />
proportions of the type of fat (for example, saturated, polyunsaturated or monounsaturated or<br />
specific fatty acids within one or more of these categories) and carbohydrate (for example,<br />
complex or simple, starches or sugars) may also be important to reduce chronic disease risk [9].<br />
The estimated Acceptable Macronutrient Distribution Ranges related to reduced risk of chronic<br />
disease, are:<br />
20-35% of total energy intake from fat<br />
45-65% from carbohydrate<br />
15–25% from protein [9].<br />
Boys Girls<br />
The risk of chronic disease, overweight and obesity, and inadequate micronutrient intake may<br />
increase outside these ranges, but there are insufficient data available at extremes of population<br />
intake [9].<br />
<strong>DRAFT</strong> <strong>Australian</strong> <strong>Dietary</strong> <strong>Guidelines</strong>- December 2011 110<br />
1995<br />
2007
4.1.3.4 Energy intake from specific food groups<br />
The increased energy consumption in the decade or so to 1995 was largely driven by an increase<br />
in the consumption of cereal-based foods (including cakes, biscuits, pies, pizza and some desserts),<br />
confectionery and sugar-sweetened drinks [48]. In 1995, <strong>Australian</strong>s consumed two to four times<br />
the recommended limits of energy-dense and nutrient-poor foods, classified as extra foods,<br />
contributing almost 36% and 41% of total energy intake and 41% and 47% of total fat intake in<br />
adults and children, respectively [46, 744].<br />
As an example, changes in food group consumption for boys are illustrated in Figure 4.3. Among<br />
these was a significant decrease in intake of fats and oils from oils and spreads, but an increase in<br />
intake of fats from other sources, such as cereal-based foods and confectionery [48], most of<br />
which were extra foods in the <strong>Australian</strong> Guide to <strong>Health</strong>y <strong>Eat</strong>ing [45]. No subsequent reliable,<br />
comparable national data are available.<br />
Figure 4.3 Mean consumption of selected food groups by boys aged 10–15 years: 1985 and<br />
1995*<br />
* Figure adapted from Cook et al (2001)[48]<br />
4.1.3.5 Energy expenditure<br />
Total daily energy expenditure includes resting energy expenditure (basal metabolic rate plus<br />
necessary tissue repair and the thermic effect of food), and energy expended in physical activity<br />
[9]. Resting energy expenditure makes up 60-80% of total energy expenditure, and is mainly<br />
related to lean body mass [9]. Active energy expenditure, which accounts for up 20-40% of total<br />
<strong>DRAFT</strong> <strong>Australian</strong> <strong>Dietary</strong> <strong>Guidelines</strong>- December 2011 111
energy expenditure, depends on both the amount of physical activity and the body mass to be<br />
moved during the process. Active energy expenditure is the only aspect of energy expenditure<br />
which is under conscious control through physical activity [9, 745].<br />
Resting energy expenditure, active energy expenditure and total energy expenditure are all<br />
substantially increased in obesity, [746] which contradicts the view that obesity is due to ‘low<br />
metabolism’ and is maintained despite a low level of food intake [723]. However energy<br />
expenditure per kilogram of body mass does decline with increasing BMI, even at the same<br />
physical activity level [745].<br />
4.1.4 Physical activity<br />
Physical activity includes both structured activities such as sport or organised recreation and<br />
unstructured activities such as incidental daily activities at work or home such as gardening or<br />
walking/cycling for leisure or transport [747].<br />
<strong>For</strong> the current <strong>Australian</strong> recommendations for physical activity, see Appendix 4.<br />
4.1.4.1 Physical activity levels of specific groups<br />
The proportion of <strong>Australian</strong> adults reporting recommended levels of physical activity declined<br />
from 62% in 1997 to 57% in 2000 [748], with no subsequent reliable national data available for<br />
comparison. The 2007–08 National <strong>Health</strong> Survey results cannot directly assess compliance with<br />
physical activity recommendations due to different methodology. However, state-based survey<br />
results suggest small increases in physical activity participation at levels providing health benefits<br />
since around 2004 [4, 749, 750]<br />
The National Children’s and Adolescent’s Nutrition and Physical Activity Survey found that 69% of<br />
<strong>Australian</strong> children were likely to meet the physical activity guidelines on any given day [13].<br />
Adolescent girls were less active than boys, particularly in the older age groups. Underweight and<br />
obese children tended to have lower physical activity levels than children of a healthy weight [13].<br />
Available state data were generally consistent with these findings [697, 751, 752].<br />
In 2007, <strong>Australian</strong> children aged 9–16 years spent more than 3.5 hours/day on average in<br />
sedentary behaviour such as watching television, playing video/computer games and/or using<br />
computers more generally [13]. On any given day, 67% of children spend more than the<br />
recommended maximum of 120 minutes of recreational screen time.<br />
<strong>DRAFT</strong> <strong>Australian</strong> <strong>Dietary</strong> <strong>Guidelines</strong>- December 2011 112
4.1.4.2 Benefits of physical activity<br />
Physical inactivity accounted for 6.6% of the burden of disease in Australia in 2003. Substantial<br />
population health gains are possible if the community adopts more regular moderate physical<br />
activity [11]. Being physically active:<br />
reduces the risk of all-cause mortality [753, 754]<br />
is an important factor in the prevention and management of a range of chronic diseases,<br />
including heart disease, stroke, high blood pressure, type 2 diabetes and some cancers<br />
[755, 756]<br />
is associated with reduced risk of injury [755, 756]<br />
offers other health benefits, including building and maintaining healthy bones, muscles and<br />
joints [755, 756]<br />
improves self-esteem, self-image and quality of life [755-758].<br />
The greatest health benefit is found in moving from no activity to low levels of activity, but even at<br />
higher levels of activity, benefits accrue from additional activity [753, 754]. Benefits have been<br />
described for all age groups and physically active children are more likely to remain physically<br />
active throughout adolescence and into adulthood [759, 760].<br />
4.2 The evidence for ‘achieving and<br />
maintaining a healthy weight’<br />
The evidence statements and gradings (A- convincing association, B- probable association, C-<br />
suggestive association) related to ‘healthy weight’ from the Evidence Report (literature from years<br />
2002 – 2009) are presented in the table below. This does not include evidence from other<br />
sources, such as the 2003 <strong>Dietary</strong> <strong>Guidelines</strong> (where evidence was classified as level I, II or III in<br />
which individual studies were classified according to their design but overall grades for<br />
relationships were not derived), although these sources have been used to inform the <strong>Guidelines</strong>.<br />
Evidence Statement Grade<br />
Compared to infants who are formula fed, being breastfed is associated<br />
with reduced risk of becoming obese in childhood, adolescence, and early<br />
adulthood.<br />
Increased birth weight, especially above 4,000g, is associated with<br />
increased risk of overweight or obesity in childhood, adolescence, and<br />
later in life.<br />
Excessive weight gain relative to height during childhood is associated with A<br />
<strong>DRAFT</strong> <strong>Australian</strong> <strong>Dietary</strong> <strong>Guidelines</strong>- December 2011 113<br />
A<br />
A
an increased risk of overweight later in life.<br />
Parental overweight or obesity is associated with increased risk of child<br />
overweight or obesity. The risk is greater when both rather than one<br />
parent is overweight or obese.<br />
Behavioural interventions including diet and exercise reduce the risk of<br />
overweight or obesity in overweight children. These interventions are<br />
more effective when they are family-based.<br />
Lifestyle interventions combining diet and physical activity interventions<br />
are associated with reduced risk of developing type 2 diabetes in adults.<br />
Consumption of sugar-sweetened beverages is associated with increased<br />
risk of weight gain in adults and children<br />
Consumption of 3-5 serves per day of cereal foods (mainly wholegrain) is<br />
associated with a reduced risk of weight gain<br />
Babies born to mothers who smoke during pregnancy are at an increased<br />
risk of development of overweight or obesity in adolescence and<br />
adulthood.<br />
Combined diet and physical activity interventions is associated with<br />
reduced risk of overweight and obesity in children<br />
Combined diet and physical activity interventions is associated with<br />
reduced risk of overweight and obesity in adults.<br />
Consumption of vegetables is associated with reduced risk of weight gain C<br />
Consumption of fruit is associated with a reduced risk of obesity and<br />
weight gain.<br />
Hours spent watching television by children is associated with increased<br />
risk of development of overweight or obesity.<br />
In developed countries, a low family income or socioeconomic status is<br />
associated with increased risk of overweight or obesity during childhood,<br />
adolescence, and young adulthood.<br />
Low socio-economic status is associated with an increased risk of<br />
overweight or obesity.<br />
Interventions delivered in the school environment that are focused on<br />
eating and physical activity improve weight outcomes in children.<br />
<strong>DRAFT</strong> <strong>Australian</strong> <strong>Dietary</strong> <strong>Guidelines</strong>- December 2011 114<br />
A<br />
A<br />
B<br />
B<br />
B<br />
B<br />
C<br />
C<br />
C<br />
C<br />
C<br />
C<br />
C
4.2.1 Primary prevention<br />
Diet and physical activity: The evidence from recent reviews of combined diet and physical<br />
activity interventions for children suggests that these can prevent overweight and obesity (Grade<br />
C, Section 22.1 in Evidence Report [14]) [761-765].<br />
The evidence from primary prevention diet and physical activity interventions in adults also<br />
suggests that these can prevent overweight and obesity (Grade C, Section 22.2 in Evidence Report<br />
[14]) [766]. Lifestyle interventions combining diet and physical activity interventions are probably<br />
associated with reduced risk of developing type 2 diabetes in adults (Grade B, Section 22.3 in<br />
Evidence Report [14]) [761-765].<br />
Favourable outcomes were consistently observed in interventions focusing on both reduced<br />
energy intake and increased physical activity, supporting the previous evidence statements that<br />
combined interventions assist weight loss and weight control in both children and adults [767].<br />
4.2.1.1 <strong>Dietary</strong> patterns and specific foods and drinks<br />
Fat: The previous dietary guidelines and many international public health organisations, including<br />
the World <strong>Health</strong> Organization [685], emphasised the major role of fat consumption in the<br />
development of obesity and of reducing fat intake in the dietary management of obesity or<br />
overweight. More recently, WHO has shifted its emphasis, saying there is convincing evidence that<br />
energy balance is critical to maintaining healthy weight and ensuring optimal nutrient intakes,<br />
regardless of macronutrient distribution and percentage of total fat [768].<br />
Sugar: No large long-term studies have measured the long-term development of overweight or<br />
obesity specifically related to sugar consumption (Section 14.3, Evidence Report [14]). However,<br />
recent evidence shows it is probable that consumption of sugar-sweetened drinks (soft-drinks) is<br />
associated with increased risk of weight gain in adults and children (Grade B, Section 15.1 in<br />
Evidence Report [14]) [448-459]. A later longitudinal study adds confirmation [769].<br />
The literature review to inform the revision of the <strong>Dietary</strong> <strong>Guidelines</strong> for Americans, 2010 found<br />
strong evidence that greater intake of sugar-sweetened drinks is associated with increased<br />
adiposity in children and moderate evidence that consumption of sugar-sweetened drinks is<br />
associated with increased body weight in adults [143]. Most of the relevant research (see Chapter<br />
3) was conducted in the United States where, unlike Australia, fructose/high fructose corn syrup is<br />
commonly used to sweeten soft drinks. Although these sweeteners differ only slightly from those<br />
used commonly in Australia, this was taken into consideration in the grading of the Evidence<br />
Statement for this guideline.<br />
The review for the US guidelines also found strong and consistent evidence that glycaemic index<br />
and/or glycaemic load are not associated with body weight and do not lead to greater weight loss<br />
<strong>DRAFT</strong> <strong>Australian</strong> <strong>Dietary</strong> <strong>Guidelines</strong>- December 2011 115
or better weight management [143]. These factors were not included in the literature review to<br />
inform the revision of these <strong>Guidelines</strong>. There is also considerable variability in these indices<br />
depending on inter-and intra-individual factors and the form of food (including the degree of<br />
processing, stage of ripeness, cooking and cooling times), which may limit practical application<br />
[770].<br />
Specific foods and drinks: There is increasing evidence that consumption of specific foods and<br />
food groups is associated with risk of excess weight gain. There is evidence suggesting that<br />
consumption of vegetables is associated with a reduced risk of weight gain (Grade C, Section 2.2<br />
in Evidence Report [14]) [156, 158-160]. The evidence also suggests that consumption of fruit is<br />
associated with a reduced risk of obesity and weight gain (Grade C, Section 1.3 in Evidence Report<br />
[14]) [156-160, 190-193]. The literature review to inform the revision of the <strong>Dietary</strong> <strong>Guidelines</strong> for<br />
Americans, 2010 found that the evidence for an association between increased fruit and vegetable<br />
intake and lower body weight is modest, but may be important in the long term [143].<br />
The US literature review also found strong evidence of a positive relationship between portion<br />
size and body weight [143].<br />
Recent evidence suggests that consumption of dairy foods is not associated with weight change or<br />
risk of obesity (Grade C, Section 5.8 in Evidence Report [14]) [382, 385-389] and that<br />
consumption of milk is not associated with BMI or BMI change in childhood (Grade C, Section 5.9<br />
in Evidence Report [14]) [265, 385, 391, 393, 394, 771]. These findings are consistent with those<br />
of the literature review to inform the revision of the <strong>Dietary</strong> <strong>Guidelines</strong> for Americans, 2010 which<br />
found strong evidence that intake of milk and milk products provide no unique role in weight<br />
control [143].<br />
There is evidence of a probable association between consumption of 3–5 serves per day of grain<br />
(cereal) foods (mainly wholegrain) and a reduced risk of weight gain (Grade B, Section 6.5 in<br />
Evidence Report [14]) [249, 261-270].<br />
There is evidence to suggest that consumption of nuts (between 65–110gm per day) is not related<br />
to risk of weight gain in the short term (Grade C, Section 8.1 in Evidence Report [14]) [353-358].<br />
The literature review to inform the revision of the <strong>Dietary</strong> <strong>Guidelines</strong> for Americans, 2010 also found<br />
that, for most children, there was limited evidence that intake of 100% fruit juice is associated with<br />
increased adiposity when consumed in amounts that are appropriate for the age and energy needs<br />
of the child. However, increased intake of 100% fruit juice was found to be associated with<br />
increased adiposity in children who were already overweight or obese [143].<br />
In seeking to achieve and maintain a healthy weight it is prudent to choose nutrient-dense foods of<br />
lower energy density (that is, those low in total fat, particularly saturated fat, and added sugars<br />
(see Chapter 3) in a total dietary pattern that seeks to control overall energy intake [772]. The<br />
literature review to inform the revision of the <strong>Dietary</strong> <strong>Guidelines</strong> for Americans, 2010 found strong<br />
<strong>DRAFT</strong> <strong>Australian</strong> <strong>Dietary</strong> <strong>Guidelines</strong>- December 2011 116
and consistent evidence that dietary patterns that are relatively low in energy density improve<br />
weight loss and weight maintenance in young adults [143].<br />
4.2.1.2 Factors associated with risk of overweight and obesity<br />
Breastfeeding: There is convincing evidence that breastfeeding infants, compared with formula<br />
feeding, is associated with a reduced risk of becoming obese in childhood, adolescence and early<br />
adulthood (Grade A, Section 17.2 in Evidence Report ([14])[773].<br />
Birthweight: Increased birthweight, especially above 4,000g, is associated with increased risk of<br />
overweight or obesity in childhood, adolescence, and later in life (Grade A, Section 17.1 in<br />
Evidence Report [14]) [54, 58, 61, 62, 79, 774, 775]. There is a J- or U-shaped relationship<br />
between birthweight and increased risk of child or adult obesity, with both low birthweight and<br />
high birthweight babies being at increased risk [776].<br />
Childhood weight gain: There is convincing evidence that excessive weight gain relative to height<br />
during childhood is associated with increased risk of being overweight later in life (Grade A,<br />
Section 17.4 in Evidence Report [14]) [58, 777, 778].<br />
There is convincing evidence that parental overweight or obesity is associated with increased risk<br />
of child overweight or obesity. The risk is greater when both rather than one parent is overweight<br />
or obese (Grade A, Section 17.7 in Evidence Report [14]) [49-62].<br />
Maternal smoking: There is evidence that babies born to mothers who smoke during pregnancy,<br />
as an independent risk factor, probably have a higher risk of becoming overweight or obese in<br />
adolescence and adulthood (Grade B, Section 17.5 in Evidence Report [14]) [52, 54, 59-61, 779].<br />
Television: Recent evidence suggests that hours spent watching television by children is associated<br />
with increased risk of overweight or obesity (Grade C, Section 17.3 in Evidence Report [14]) [49,<br />
60, 64-71, 780-782]. Media use, including television viewing, may displace time children spend in<br />
physical activities [782, 783] and eating meals and snacks in front of television may also be<br />
associated with increased energy intake [784].<br />
Socioeconomic status: There is evidence from developed countries to suggest that a low family<br />
income or socioeconomic status is associated with increased risk of overweight or obesity during<br />
childhood, adolescence and young adulthood (Grade C, Section 17.9 in Evidence Report [14]) [49,<br />
52, 55, 64, 65, 68, 72-74]. Similarly the evidence suggests that low socio-economic status is<br />
associated with an increased risk of overweight or obesity (Grade C, Section 17.10 in Evidence<br />
Report [14]) [59, 62, 775, 785-788].<br />
<strong>DRAFT</strong> <strong>Australian</strong> <strong>Dietary</strong> <strong>Guidelines</strong>- December 2011 117
Other factors: Although there were insufficient studies to make an evidence statement, other<br />
factors associated with increased risk of overweight and obesity throughout life included:<br />
being overweight in adolescence [78]<br />
consumption of any take away food and low quality snacks [75-77]<br />
childhood smoking [78, 83]<br />
increased price of fruit and vegetables [68, 79]<br />
low self esteem and/or depression [80-82]<br />
low locus of control score [84, 85]<br />
stressful family life [86, 87]<br />
food insecurity [65, 81, 789]<br />
self-reported dieting [76, 82, 790], particularly in girls [791]<br />
inadequate sleep [60, 780, 792, 793]<br />
low rates of breakfast consumption [794].<br />
The literature review to inform the revision of the <strong>Dietary</strong> <strong>Guidelines</strong> for Americans, 2010 found<br />
strong and consistent evidence indicating that children and adults who eat fast food, particularly<br />
those eating at least one fast food meal per week, are at increased risk of weight gain, overweight<br />
and obesity. There was not enough evidence at this time to similarly evaluate eating at other types<br />
of restaurants and risk of weight gain, overweight and obesity [143]. The US literature review also<br />
found moderate evidence suggesting that children who do not eat breakfast are at increased risk<br />
of overweight and obesity, with the evidence being stronger for adolescents [143].<br />
There appear to be complex relationships between dietary patterns as a child and dietary quality<br />
over time. Studies in the US suggest that frequency of consuming take away food increases with<br />
age and is associated with higher intakes of energy, total fat, saturated fat and sodium [90], while<br />
frequency of breakfast consumption decreases with age and skipping breakfast is associated with<br />
reduced intake of calcium and dietary fibre [91]. There is some evidence that family meal patterns<br />
during adolescence predict diet quality and meal patterns during early young adulthood [92].<br />
The literature review to inform the revision of the <strong>Dietary</strong> <strong>Guidelines</strong> for Americans, 2010 also found<br />
a limited body of evidence showing conflicting results about whether liquid and solid foods differ in<br />
their effects on energy intake and body weight, except that soup at a meal may lead to decreased<br />
energy intake and body weight [143].<br />
Finally, an emerging body of evidence documents the impact of the food environment on body<br />
weight in children and adults. Moderately strong evidence now indicates that the food<br />
environment is associated with dietary intake, especially lower consumption of vegetables and<br />
fruits and intakes resulting in higher body weight [143]. This is discussed further in Appendix 7.<br />
<strong>DRAFT</strong> <strong>Australian</strong> <strong>Dietary</strong> <strong>Guidelines</strong>- December 2011 118
4.2.2 Secondary prevention<br />
Behavioural interventions: There is convincing evidence that behavioural interventions including<br />
diet and physical activity reduce the risk of obesity in overweight children. These interventions are<br />
more effective when they are family-based (Grade A, Section 17.12 in Evidence Report [14]) [795-<br />
798].<br />
Recent evidence suggests that interventions delivered in the school environment that are focused<br />
on healthy eating and physical activity improve weight outcomes in children (Grade C, Section<br />
17.11 in Evidence Report [14]) [799, 800].<br />
4.3 How dietary patterns can affect energy<br />
intake and balance and weight outcomes<br />
From a population perspective, the dramatic increase in the prevalence of obesity in Australia and<br />
other developed countries over the past 30 years cannot be explained by genetic factors.<br />
Environmental and lifestyle factors resulting in a decrease in physical activity and overconsumption<br />
of energy in the diet provide the most reasonable explanation. Only a small, persistent energy<br />
imbalance is required to cause excessive weight gain in both children and adults, which over time<br />
progressively increases BMI [723, 727]. Available data from developed countries, including<br />
Australia, confirm an increase in energy intake concurrent with the dramatic increase in the<br />
prevalence of overweight and obesity in children and adults since 1980 [727].<br />
There has been much debate about the role of energy, carbohydrate and fat intake in the obesity<br />
epidemic [772, 801, 802]. While reducing fat intake has been recognised as an important strategy<br />
to reduce energy intake in successful weight loss interventions [801], there is little evidence that<br />
population fat intake is associated with the obesity epidemic independently of total energy intake<br />
[802].<br />
Foods with a higher energy density encourage energy intake above requirements [143, 803].<br />
However, foods that are high in energy density tend to be more palatable, and high palatability is<br />
associated with increased food intake in single-meal studies [730, 804]. Fat and sugar are positively<br />
associated with energy density while water and dietary fibre are negatively associated. Fat plays a<br />
role because of its high energy density compared to protein and carbohydrates. Water and dietary<br />
fibre play a role through a dilution effect, although this is less for dietary fibre because of the much<br />
smaller range of fibre concentration in food compared with both water and fat.<br />
It is plausible that the proportions of macronutrients (fat, carbohydrate, protein and alcohol) and<br />
types of macronutrients comprising total energy intake may affect an individual’s propensity to<br />
habitually overconsume. In this regard, dietary patterns which tend to be relatively low in total fat<br />
<strong>DRAFT</strong> <strong>Australian</strong> <strong>Dietary</strong> <strong>Guidelines</strong>- December 2011 119
and moderate (not high) in carbohydrate are consistent with reduced risk of excessive weight gain.<br />
Energy from drinks, in particular, may add to total energy intake without displacing energy<br />
consumed in the form of solid food, and it is plausible that energy-dense drinks may contribute to<br />
excessive energy intake through lack of impact on satiety [771]. The satiety value of foods may<br />
also be important in managing appetite and hunger. Evidence suggests that protein-rich foods and<br />
dietary patterns have a greater effect on satiety than foods and dietary patterns high in fat and<br />
carbohydrate [805].<br />
Energy-dense dietary patterns are associated with higher consumption of grain-based foods, fats<br />
and sweets and lower consumption of vegetables and fruit [806]. International data suggest that<br />
the major foods contributing to increased energy intake include sweetened drinks, snack foods<br />
and fast food [803, 807, 808] and that increasing portion size is also an important contributor<br />
[143, 809, 810]. The low cost of energy-dense nutrient-poor food relative to nutrient-dense food<br />
is also a major contributor to the obesity epidemic [803, 806].<br />
Positive outcomes have been described, at least in the short term, in clinical weight loss regimes<br />
that include both dietary and physical activity interventions [811, 812].<br />
4.4 Practical considerations: Achieving and<br />
maintaining a healthy weight<br />
As is the case internationally [714], overweight, obesity and associated health problems place a<br />
significant economic burden on the <strong>Australian</strong> health care system. The total direct, indirect and<br />
social cost has been estimated at $37.7–$58.6 billion [6, 813] with direct costs estimated at $8–<br />
$21 billion [6, 814]. It is predicted that by 2023, the projected health expenditure for diabetes will<br />
have risen $1.4 billion to $7 billion per year, due mostly to increasing weight gain [11].<br />
Intentional weight loss in overweight and obese individuals reduces the risk factors for mortality<br />
and morbidity, and alleviates the symptoms of many chronic conditions [811, 812]. It is not<br />
necessary to lose large amounts of weight to achieve substantial health gains. <strong>For</strong> example, a<br />
weight loss of 5kg in all people who are overweight or obese is estimated to reduce the national<br />
prevalence of type 2 diabetes by 15% [815]. Improving nutrition and/or increasing physical activity<br />
also benefits health in a number of areas beyond weight control, such as bone strength, mental<br />
health and immune function [2, 816].<br />
There is a need to provide guidance for the population on promotion of healthy weight, primary<br />
prevention of overweight and obesity, weight maintenance, weight loss, and management of<br />
weight-related conditions, disorders and diseases. A stepped approach to obesity prevention and<br />
management is recommended (see Table 4.4) [710].<br />
<strong>DRAFT</strong> <strong>Australian</strong> <strong>Dietary</strong> <strong>Guidelines</strong>- December 2011 120
Table 4.4 A stepped model for the management of overweight and obesity<br />
Target population Intervention<br />
General population Population education, awareness raising and<br />
environmental interventions<br />
Overweight/obese Above + healthy lifestyle education<br />
and skills training<br />
Overweight/obese with<br />
disordered eating or cognition<br />
Overweight/obese with risk<br />
factors (BMI > 30 or BMI > 27 +<br />
risk factors)<br />
Above + behaviour<br />
modification<br />
Above +<br />
medical/surgical<br />
intervention<br />
(drugs, very low<br />
energy diets,<br />
surgery)<br />
Given the scope of the <strong>Guidelines</strong>, the guidance here focuses on promotion of healthy weight<br />
through primary prevention of overweight and obesity, weight maintenance and achieving healthy<br />
weight (through weight loss) in overweight groups without serious co-morbidities. Clinical<br />
guidance for treatment and management of obesity and its complications for individuals is being<br />
reviewed under a separate process and will lead to the production of NHMRC’s Clinical Practice<br />
<strong>Guidelines</strong> for the Management of Overweight and Obesity [710].<br />
Prevention of overweight and obesity is important because:<br />
weight loss is difficult to achieve and even more difficult to maintain<br />
for most people who are classified as obese, and for many who are overweight, a return to<br />
a healthy-range BMI may not be a realistic target<br />
the health consequences of obesity tend to be cumulative and may not be fully reversible<br />
once classified as overweight<br />
it is more efficient and cost effective to prevent weight gain rather than treat overweight<br />
and obesity [88, 685, 688].<br />
All available evidence suggests that the current epidemic of obesity is a normal response to an<br />
abnormal ‘obesogenic’ environment. The community as a whole has a social responsibility to<br />
address the problem. It is especially important that supportive social, economic and physical<br />
environments are created to make it easier for individuals, families, groups and communities to<br />
choose healthy dietary and physical activity patterns to achieve and maintain a healthy weight.<br />
<strong>DRAFT</strong> <strong>Australian</strong> <strong>Dietary</strong> <strong>Guidelines</strong>- December 2011 121
All initiatives and approaches which promote physical activity, healthy eating, access to nutritious<br />
food, and the healthy growth of children contribute to promoting healthy weight at the population<br />
level.<br />
4.4.1 Achieving and maintaining a healthy weight<br />
4.4.1.1 Physical activity (see Appendix 4)<br />
Previously it was thought that if energy intake was controlled, 30 minutes of moderate-intensity<br />
daily physical activity would be sufficient to prevent weight gain in adults, providing sitting time was<br />
less than 4.5 hours/day [817-819]. However, in the current environment of abundant availability,<br />
promotion and consumption of energy-dense food, there is now international consensus that 45–<br />
60 minutes of moderate-intensity daily physical activity is the minimum required for the general<br />
population to prevent the transition to overweight and obesity without reduction in current<br />
energy intake [88, 820-823]. At least 60–90 minutes of moderate-intensity activity or lesser<br />
amounts of vigorous activity may be required to prevent weight regain in formerly obese people<br />
[820].<br />
The current physical activity guidelines for <strong>Australian</strong> infants, children and adolescents may be<br />
adequate to support optimum growth and development and – together with consuming a<br />
nutritious diet and appropriate energy intake - weight control [36, 710]. This is supported by<br />
recent evidence from Europe [824].<br />
4.4.1.2 <strong>Dietary</strong> patterns<br />
Foundation Diets developed by the Modelling System [10] represent the basis of optimum diets to<br />
achieve and maintain a healthy weight as they provide nutrient requirements within minimum<br />
energy intake.<br />
Compared to the most recent available adult intakes, Foundation Diets include higher quantities of<br />
vegetables, fruit, wholegrain cereals, poultry, fish, eggs and low-fat milk, yoghurt and cheese<br />
products, and lower quantities of starchy vegetables, refined cereals, higher and medium fat milk,<br />
yoghurt and cheese products and red meats (latter for men only) [10]. Decreased consumption of<br />
discretionary foods would be needed to achieve the dietary patterns within energy constraints.<br />
Changes from higher fat to lower fat milk, yoghurt and cheese products and from refined to<br />
wholegrain cereals would also be necessary [10].<br />
To prevent excessive or inappropriate weight gain and therefore prevent development of<br />
overweight and obesity, the smallest, least active adults in each age and sex group should adopt<br />
dietary patterns consistent with the Foundation Diets. Additional foods and drinks can only be<br />
included without leading to weight gain if physical activity levels are increased [10].<br />
<strong>DRAFT</strong> <strong>Australian</strong> <strong>Dietary</strong> <strong>Guidelines</strong>- December 2011 122
Taller or larger and more active adults in each age and sex group can choose additional serves of<br />
foods from the food groups and/or occasionally some discretionary foods to increase energy<br />
intake to meet energy requirements (that is, to comprise Total Diets) [10], but they need to ensure<br />
energy intake does not exceed expenditure. If energy requirements are exceeded by energy intake<br />
on a regular basis, weight gain will occur.<br />
There is wide variation in individual energy needs, so to prevent weight gain (or inappropriate<br />
weight loss) at an individual level, weight (and waist circumference) should be measured regularly<br />
(for example, every two or three months) and the amount and/or quality of dietary intake and<br />
physical activity levels adjusted accordingly [10].<br />
As a basic principle when adjusting dietary patterns, the first steps are to choose nutritious foods<br />
from the five food groups in amounts consistent with Foundation Diets and to limit discretionary<br />
(energy-dense, nutrient-poor) choices. If further restrictions are required, rather than eliminating<br />
one category of food from the five food groups, smaller serves should be chosen [114].<br />
Recommended quantities of specific food groups to suit those preferring an omnivorous, lacto-ovo<br />
vegetarian diet or a dietary pattern that favours pasta or rice are included in the Foundation Diets<br />
for adults set out in the Food Modelling System [10].<br />
4.4.2 Weight loss in adults who are already overweight<br />
These <strong>Guidelines</strong> do not encourage inappropriate food restriction. However, they do discourage<br />
consumption of energy-dense, nutrient-poor discretionary foods and drinks.<br />
In dietary patterns to achieve a healthy weight and assist weight loss, the recommendations of<br />
types and quantities of foods outlined in the Foundation Diets in the <strong>Australian</strong> Guide to <strong>Health</strong>y<br />
<strong>Eat</strong>ing should not be exceeded. Adhering to Foundation Diets only, without discretionary foods,<br />
could represent a daily reduction in energy intake of up to 2,000 kJ for the average size person in<br />
each age and sex group. This could result in a satisfactory rate of weight loss, even if physical<br />
activity levels are not increased.<br />
A combination of increased physical activity and energy restriction is more effective than energy<br />
restriction alone for weight loss and maintenance of weight loss. Physical activity can affect body<br />
composition favourably during weight loss by preserving or increasing lean mass while promoting<br />
fat loss. Physical activity affects the rate of weight loss in a dose-response manner based on its<br />
frequency, intensity and duration.<br />
Weight loss will not be achieved unless energy intake is less than total energy expenditure.<br />
Lifestyle improvements, through cognitive and behaviour change, to increase physical activity and<br />
improve dietary intake is fundamental to weight management. Such education, training and support<br />
may be provided to individuals or groups [710]. Weight loss is most likely to be maintained where<br />
<strong>DRAFT</strong> <strong>Australian</strong> <strong>Dietary</strong> <strong>Guidelines</strong>- December 2011 123
dietary and physical activity habits are acceptable and sustainable. In this regard, regular weight loss<br />
of initially around 1.0 to 4.0kg per month, reaching 10% loss of initial weight in the medium term<br />
and 10–20% loss of initial weight over 1–5 years is likely to be most effective and sustained [710,<br />
825].<br />
Individuals who are overweight or obese and have associated cardiovascular disease or diabetes<br />
risk factors should seek clinical advice about the range of available treatment options [826].<br />
4.4.3 Pregnant and breastfeeding women<br />
Obesity in pregnancy is one of the most common, and potentially modifiable, risk factors for<br />
adverse pregnancy outcomes [827] and longer term adverse outcomes for mothers [828] and<br />
children [829]. Since about one-third of pregnant women in Australia are overweight or obese<br />
[830], preventing excessive gestational weight gain is an urgent health priority.<br />
Appropriate maternal weight gain during pregnancy (see table 4.5) is important for the health of<br />
the infant. Evidence supports recommendations to manage pregnancy to reduce the risk of<br />
excessive weight gain and gestational diabetes [831, 832]. Too little weight gain during pregnancy<br />
increases the risk of a low birthweight infant. Excessive weight gain during pregnancy increases the<br />
risk of macrosomia and gestational diabetes. Excessive gestational weight gain is also associated<br />
with increased risk of obesity and metabolic syndrome in infants later in life [833, 834].<br />
Appropriate steady weight gain during pregnancy is important to optimise the health outcomes<br />
(short term and long term) for the infant and the mother [831, 832]. Weight gain should be steady<br />
throughout pregnancy to avoid adverse effects on specific foetal organ systems during critical<br />
periods (for example, neural tube 6-8 weeks, kidney development 28–30 weeks). Weight loss diets<br />
are not recommended at any time during pregnancy [832].<br />
Mothers who gain excessive amounts of weight during pregnancy are unlikely to lose it later [835],<br />
although dietary patterns which comprise regular meals, plenty of fruit and vegetables, high-fibre<br />
bread and restricted sugar [836] may help mothers reach a healthy weight after giving birth.<br />
Evidence of a probable association between babies born to mothers who smoke during pregnancy<br />
and a higher risk of overweight or obesity in adolescence and adulthood supports<br />
recommendations that pregnant women should not smoke cigarettes (Grade B, Section 17.5 in<br />
Evidence Report [14]) [52, 54, 59-61, 779].<br />
<strong>DRAFT</strong> <strong>Australian</strong> <strong>Dietary</strong> <strong>Guidelines</strong>- December 2011 124
Table 4.5 2010 Institute of Medicine recommendations for total and rate of weight gain during<br />
pregnancy, by pre-pregnancy BMI [832]<br />
Pre-pregnancy BMI Total weight<br />
gain in kg<br />
Rates of weight gain*<br />
2nd and 3rd<br />
trimester in<br />
kg/week<br />
Underweight (< 18.5 kg/m 2) 12.5 – 18.0 0.51 (0.44 – 0.58)<br />
Normal weight (18.5 – 24.9<br />
kg/m 2)<br />
Overweight (25.0 – 29.9<br />
kg/m 2)<br />
11.5 – 16.0 0.42 (0.35 – 0.50)<br />
7.0 – 11.5 0.28 (0.23 – 0.33)<br />
Obese (≥ 30.0 kg/m 2) 5.0 – 9.0 0.22 (0.17 – 0.27)<br />
* Calculations assume a 0.5-2kg weight gain in the first trimester [832]<br />
Table 4.6 Weight gain during pregnancy: recommendations for Asian women, by prepregnancy<br />
BMI *<br />
Pre-pregnancy BMI Total weight gain in<br />
kg (during<br />
pregnancy)<br />
27.5 ≤ 7.0<br />
Others<br />
Twin pregnancy 15.9 – 20.4 0.7<br />
Triplet pregnancy 22.7<br />
* Adapted from IOM guidelines and matched with Asian BMI cut-offs<br />
4.4.4 Infants, children and adolescents<br />
Weight gain per<br />
week in kg<br />
(after 12 weeks)<br />
Infants, children and adolescents need sufficient nutritious food to grow and develop normally. The<br />
focus should be on maintaining a rate of growth consistent with the norms for age, sex and stage<br />
of physiological maturity. Physical growth is best assessed by the conventional measures of weight,<br />
length or height, and head circumference (see Appendix 3). Maintenance of a positive energy<br />
balance and adequate nutrient intake is critical in achieving and sustaining normal growth and<br />
<strong>DRAFT</strong> <strong>Australian</strong> <strong>Dietary</strong> <strong>Guidelines</strong>- December 2011 125
development. During periods of rapid growth, intentional restriction of weight gain - through<br />
dieting, for example - is usually inappropriate.<br />
In recent years there has been increasing awareness of the importance of perinatal nutrition in<br />
terms of the development of disease in adulthood, known as foetal origins of disease or Barker<br />
hypothesis [837]. There is also increasing evidence of the importance of growth and optimum<br />
nutrition in relation to cognitive development [838] and future bone mass [839].<br />
4.4.4.1 Growth<br />
Relative to their body weight, children’s nutrient and energy requirements are greater than those<br />
of adults [9]. Children are nutritionally vulnerable up to around five years of age, after which their<br />
growth rate slows and their nutritional needs reduce relative to their body size. As a child’s rate<br />
of growth is a fundamental indicator of nutritional status and health and wellbeing, parents and<br />
carers and health professionals must be responsive to the developmental and nutritional needs of<br />
children.<br />
Between birth and 18 years of age, body weight increases about twenty-fold. During infancy and<br />
adolescence the rate of growth can change rapidly, while from 12 months of age the rate of<br />
increase in weight and length is essentially linear. Growth decelerates rapidly during the first year<br />
of life. During adolescence it accelerates over one to three years and then decelerates rapidly until<br />
growth in height ceases at about 16 years in girls and 18 years in boys.<br />
Childhood is a period of education about eating and good nutrition, so appropriate use of food is<br />
important in establishing lifetime nutrition practices. Food intake may drop off during the second<br />
year of life, when parents’ skills of encouragement and example will be needed. After starting<br />
school, children are subject to an increasing array of influences from outside the home, particularly<br />
peer pressure which peaks in adolescence.<br />
4.4.4.2 <strong>Dietary</strong> patterns for achieving and maintaining a healthy weight in infants,<br />
children and adolescents<br />
Foundation Diets represent the basis of optimum diets for infants, children and adolescents.<br />
However sufficient nutritious foods must be provided to support optimum growth and<br />
development in all children.<br />
<strong>For</strong> the youngest, shortest or least active in each age and sex group, dietary modelling suggests<br />
that there is no opportunity for additional energy intake beyond Foundation Diets unless increased<br />
physical activity increases energy expenditure and requirement. <strong>For</strong> these children Foundation Diets<br />
are equivalent to Total Diets.<br />
<strong>DRAFT</strong> <strong>Australian</strong> <strong>Dietary</strong> <strong>Guidelines</strong>- December 2011 126
<strong>For</strong> older, taller or more active children in each age and sex group, additional serves of foods from<br />
the five food groups (preferably) and/or discretionary food choices may be made to increase<br />
energy intake until energy requirements are met [10]. Growth and weight of children should be<br />
checked regularly (as outlined in Appendix 3) and the amount and/or quality of diet and physical<br />
activity levels adjusted accordingly [10].<br />
Compared to current intakes, Foundation Diets for infants, children and adolescents include higher<br />
quantities of vegetables, fruit, wholegrain cereals, poultry, fish, eggs and low-fat milk, yoghurt and<br />
cheese products, and include lower quantities of starchy vegetables, refined cereals, higher and<br />
medium fat milk, yoghurt and cheese products. <strong>For</strong> children, as for adults, decreased consumption<br />
of discretionary food choices is needed to achieve the dietary patterns in the <strong>Australian</strong> Guide to<br />
<strong>Health</strong>y <strong>Eat</strong>ing, together with a change from refined grain (cereal) foods to wholegrain cereals and<br />
from higher fat to lower fat milk, yoghurt and cheese products for children over 2 years of age.<br />
Recommended quantities of specific food groups to suit those preferring an omnivorous, lacto-ovo<br />
vegetarian diet or a dietary pattern that favours rice or pasta are included in the Foundation Diets<br />
for infants, children and adolescents set out in the Food Modelling document [10].<br />
4.4.4.3 <strong>Dietary</strong> patterns for weight loss in children and adolescents who are<br />
already overweight and obese<br />
Management of overweight and obesity in childhood is recommended to reduce risk of being<br />
overweight in later life (see evidence above). Individual assessment and clinical supervision is<br />
recommended to ensure appropriate growth and development, for weight management of all<br />
overweight and obese infants, children and adolescents.<br />
Parental overweight or obesity is associated with increased risk of overweight or obesity in<br />
children, with even greater risk when both parents are overweight or obese. A family-focused<br />
approach to weight management has been found to be beneficial [795-798].<br />
<strong>Dietary</strong> restriction beyond prudent adherence to the Foundation Diets and limited intake of<br />
discretionary foods and drinks is not recommended for infants, children or adolescents, as this<br />
may result in nutrient deficiencies and sub-optimal growth and development. Adherence to<br />
Foundation Diets should assist maintenance of body weight during growth for overweight children -<br />
with the aim to maintain weight while the child grows in height thus ‘normalising’ BMI for age.<br />
To help achieve a healthy weight, most <strong>Australian</strong> infants, children and adolescents should also<br />
follow the recommendations of the <strong>Australian</strong> physical activity guidelines (see Appendix 4).<br />
<strong>DRAFT</strong> <strong>Australian</strong> <strong>Dietary</strong> <strong>Guidelines</strong>- December 2011 127
4.4.5 Older people<br />
Older people should eat nutritious foods and keep physically active to help maintain muscle<br />
strength and a healthy weight.<br />
Daily energy expenditure declines throughout adult life, as does physical activity [44]. Energy<br />
expenditure is dependent on fat-free mass, which decreases by about 15% between the third and<br />
eighth decades of life, contributing to lowered metabolic rate in older people [840]. The decrease<br />
in energy expenditure is generally accompanied by decreased appetite and diminished food intake,<br />
so may account for the undernutrition seen in some older people [841]. While overweight and<br />
obesity are still prevalent in older adults [842], consideration of overall morbidity and mortality<br />
suggests that for obese older people a substantial reduction of the BMI may not provide the<br />
healthiest long-term option [843]. Although weight loss achieved by following a nutrient-dense diet<br />
and increasing physical activity may confer benefits, this is still to be tested in good quality trials<br />
[842]. Lowering blood pressure and normalising blood lipids rather than reducing weight may be<br />
more appropriate for elderly overweight people [844].<br />
Older people commonly have a decrease in skeletal muscle mass and strength, which is the result<br />
of a decline in the production of muscle tissue [844]. Height may also decrease with age as a result<br />
of changing spinal shape and intervertebral thickness, making it difficult to determine height and<br />
therefore BMI.<br />
While most of the elderly population live independently, it has been estimated that 25–40% of<br />
those over 80 years of age could be considered frail [845]. Malnutrition in the elderly is often<br />
associated with one or more illnesses such as chronic obstructive lung disease and heart failure,<br />
dementia, dysphagia, poor dentition, depression, social isolation, use of drugs, alcohol and other<br />
substance abuse, poverty, and despair [845, 846]. In Australia 5–11% of people eligible for Home<br />
and Community Care services are malnourished [847]. In acute care, 20–30% of people are<br />
admitted with malnutrition, the prevalence increasing with age and the number of health problems<br />
[847, 848]. Older people can develop sarcopenia, a form of muscle wasting, and some older<br />
people also experience sarcopenic obesity, where there is a combination of reduced muscle mass<br />
and/or strength and excessive body fat [842].<br />
Recent studies suggest that, for an older person, being underweight may be more deleterious for<br />
health than being overweight [716]. A BMI range of 23–28 is considered desirable for people over<br />
70 years of age [709].<br />
The decline in energy expenditure with ageing must be balanced by adjusting energy intake to<br />
maintain body weight within the healthy range and to prevent an increase in body fat [9]. <strong>Dietary</strong><br />
patterns and quantities consistent with the Foundation and Total Diets are for older people who are<br />
generally fit and well [10]. However low-fat diets are not appropriate for the frail elderly or those<br />
with complex health conditions [35, 844].<br />
<strong>DRAFT</strong> <strong>Australian</strong> <strong>Dietary</strong> <strong>Guidelines</strong>- December 2011 128
Most older people will benefit from increased physical activity [725, 849] including reduced<br />
sedentary behaviour, increased moderate-intensity aerobic activity [850]and particularly activities<br />
promoting bone and muscle strength, flexibility and balance [851]. In addition to assisting with<br />
weight management, these can help reduce the risk of falls [851, 852] and may increase<br />
opportunities for social engagement [853].<br />
4.4.6 Aboriginal and Torres Strait Islanders<br />
The last national survey measuring height and weight in Aboriginal and Torres Strait Islanders was<br />
conducted in 1994 [854]. Although recent measured data are lacking, prevalence of overweight<br />
and obesity calculated from self-reported height and weight data (at around 60%) is higher among<br />
Aboriginal and Torres Strait Islander people than self-reported data from non-Indigenous<br />
<strong>Australian</strong>s [855-857]. Among Aboriginal and Torres Strait Islander groups living in rural and<br />
remote areas, disparities in the cost of nutritious foods are potential barriers to the adoption of<br />
nutrient-dense, low energy-dense diets [138, 140, 686, 728, 806, 858, 859].<br />
4.4.7 <strong>Australian</strong>s of Asian origin<br />
There is little evidence that <strong>Australian</strong>s of Asian origin are at increased risk of overweight,<br />
although special consideration might need to be given to this group in assessing body fatness. The<br />
WHO levels of BMI that correspond to increasing degrees of risk of chronic morbidity and of<br />
mortality were primarily derived for populations of European origin [708] so may not apply to<br />
<strong>Australian</strong>s of Asian origin.<br />
<strong>Australian</strong>s of Asian origin have a higher proportion of body fat for the same BMI than Caucasians.<br />
This suggests that the application of the current WHO BMI cut-off points may underestimate body<br />
fatness and comorbidity risk in this population [708].<br />
4.4.8 People with eating disorders<br />
When promoting healthy weight, optimum nutrition and physical activity, it is essential to avoid<br />
inadvertently encouraging disturbed body image and disordered eating or exercise behaviour<br />
[722]. Characteristics of disordered eating, such as restrained eating, binge eating, fear of fatness,<br />
purging and distorted body image, are commonly reported in adolescents, particularly in early<br />
adolescence and late teens, but eating disorders may occur at any age [722]. Estimates of lifetime<br />
prevalence of anorexia nervosa, bulimia nervosa, and binge eating among women range from<br />
between 0.3-1.5%, 0.9-2.1% and 2.5-4.5% respectively, with estimated rates among men<br />
considerably lower[722]. People with suspected eating disorders need to be referred for specialist<br />
assistance from a health professional.<br />
<strong>DRAFT</strong> <strong>Australian</strong> <strong>Dietary</strong> <strong>Guidelines</strong>- December 2011 129
Effective interventions to reduce the risk of eating disorders include:<br />
promotion of nutritious dietary patterns rather than negative focus on specific foods<br />
avoiding stigmatisation of those of various body shapes and weight<br />
promotion of media literacy, such as critical evaluation of presented body ideals<br />
and promotion of good mental health [722].<br />
Where to next<br />
The next chapter provides information on why breastfeeding is beneficial to the<br />
health of the infant and the mother, and practical considerations for encouraging<br />
and supporting breastfeeding.<br />
<strong>DRAFT</strong> <strong>Australian</strong> <strong>Dietary</strong> <strong>Guidelines</strong>- December 2011 130
5. Encourage and support breastfeeding<br />
Guideline 4<br />
Encourage and support breastfeeding.<br />
<strong>DRAFT</strong> <strong>Australian</strong> <strong>Dietary</strong> <strong>Guidelines</strong>- December 2011 131
Executive summary<br />
The World <strong>Health</strong> Organization states that “breastfeeding is an unequalled way of<br />
providing ideal food for the healthy growth and development of infants”.<br />
Breastmilk contains many unique compounds, including live cells, which provide all the<br />
nutritional requirements to support growth and development of infants to around six<br />
months of age.<br />
Breastfeeding provides health benefits to infants including reduced risk of infection,<br />
asthma and atopic disease and Sudden Infant Death Syndrome. It contributes to<br />
improved cognitive development while protecting against obesity, hypertension and<br />
some chronic diseases in later life.<br />
Benefits to mothers from breastfeeding include improved bonding with their infant,<br />
accelerated recovery from childbirth and progress to a healthy body weight.<br />
Breastfeeding is also associated with reduced risk of some cancers and of postmenopausal<br />
hip fracture in mothers.<br />
As many infants as possible should be exclusively breastfed until around six months of<br />
age when solid foods are introduced. Breastfeeding should be continued until 12<br />
months of age and beyond, for as long as the mother and child desire.<br />
Breastfeeding prevalence, including initiation rates and duration, are improved where<br />
the mother has support and encouragement from the infant’s father, other family<br />
members, the health system and the community.<br />
This chapter provides information on why breastfeeding is beneficial to the health of<br />
the infant and the mother, plus practical considerations for encouraging and<br />
supporting breastfeeding.<br />
<strong>DRAFT</strong> <strong>Australian</strong> <strong>Dietary</strong> <strong>Guidelines</strong>- December 2011 132
5.1 Setting the scene<br />
The World <strong>Health</strong> Organization states that “breastfeeding is an unequalled way of providing ideal<br />
food for the healthy growth and development of infants”. Breastmilk is a living tissue that includes<br />
many unique compounds. Breastfeeding has short-term and long-term health and other benefits<br />
for infants and mothers. Maximising the benefits of breastfeeding to the infant and mother requires<br />
the support of the other family members and a supportive community environment.<br />
Australia has a long history of promoting and supporting breastfeeding in its public health policy. In<br />
1981 Australia became a signatory to WHO’s International Code of Marketing of Breast-milk<br />
Substitutes [860], the stated aim of which was to protect and promote breastfeeding. The<br />
importance of breastfeeding led to its inclusion in the <strong>Australian</strong> <strong>Dietary</strong> <strong>Guidelines</strong> endorsed by the<br />
NHMRC in 1983 [568].<br />
In Australia, part of the WHO code is implemented by the Marketing in Australia of Infant <strong>For</strong>mulas<br />
(MAIF) Agreement, a voluntary agreement by infant formula manufacturers and importers. The<br />
Infant Feeding <strong>Guidelines</strong> for <strong>Health</strong> Workers [133] provide more information on the WHO code,<br />
the MAIF Agreement and the obligations of all health workers. They also provide<br />
recommendations on the appropriate foods for infants from birth to about two years of age,<br />
including detailed information on the benefits of breastfeeding for the infant and mother.<br />
Breastmilk contains many unique compounds, including antibodies and immune cells. In the first<br />
few days after giving birth a mother’s breasts produce colostrum which provides all the nutrients<br />
and water required by their newborn infant. Colostrum contains higher levels of protein, vitamin<br />
A and vitamin B 12 and less fat than breastmilk. It also contains lactoferrin, immunoglobulin A,<br />
enzymes, maternal antibodies, living cells (leukocytes, neutrophils and macrophages) and<br />
prebiotics, which limit the growth of pathogenic bacteria and viruses, stimulate the growth of an<br />
appropriate human microbiome and protect against illness [483, 861, 862]. Colostrum feeding is<br />
important for the infant and also stimulates the mother’s breastmilk production. The composition<br />
of colostrum gradually changes as lactation is established and milk production begins 48–72 hours<br />
after birth.<br />
The nutrient composition of mature human milk varies between individuals and across the stages<br />
of lactation. The energy content varies between 270 and 315 kJ per 100 mL, largely due to<br />
variation in the fat content [863, 864]. Fat content typically increases through each breastfeed. It<br />
provides much of the energy and omega-3 and omega-6 long-chain polyunsaturated fatty acids, plus<br />
the fat-soluble vitamins A, D, E and K, as well as prostaglandins. The fat in breastmilk is typically<br />
better absorbed by an infant’s gastrointestinal tract than the fat in cow’s milk. Mature milk<br />
continues to provide immune factors and enzymes to the infant [36, 865].<br />
Breastmilk provides all the vitamins, major minerals and trace elements known to be essential for<br />
healthy full-term infants for around the first six months [731, 866]. These are more bioavailable<br />
<strong>DRAFT</strong> <strong>Australian</strong> <strong>Dietary</strong> <strong>Guidelines</strong>- December 2011 133
than nutrients found in infant formula. Because the composition of breastmilk constantly changes<br />
throughout lactation and during a single breastfeed, no infant formula can exactly mimic the<br />
composition of breastmilk. Breastmilk is a convenient, hygienic and inexpensive food source posing<br />
no environmental costs [867].<br />
Breastmilk continues to be an important source of vitamins, minerals and trace elements when<br />
other foods are introduced at around six months (complementary feeding).<br />
Consuming a variety of nutritious foods is particularly important for breastfeeding women.<br />
5.2 The evidence for ‘Encouraging and<br />
supporting breastfeeding’<br />
The evidence statements and gradings (A- convincing association, B- probable association, C-<br />
suggestive association) from the Evidence Report (literature from 2002 – 2009) are presented in<br />
the table below. This does not include evidence from other sources, such as the 2003 <strong>Dietary</strong><br />
<strong>Guidelines</strong> (where evidence was classified as level I, II or III), although these sources have been<br />
used to inform the <strong>Guidelines</strong>.<br />
Evidence Statement Grade<br />
Compared to infants who are formula fed, being breastfed is associated with<br />
reduced risk of becoming obese in childhood, adolescence, and early adulthood.<br />
Pre-natal and perinatal support for breastfeeding can increase the proportion of<br />
women breastfeeding (both exclusive and non-exclusive) up to age six months.<br />
Being breastfed in infancy is associated with lower systolic and diastolic blood<br />
pressure up to adolescence.<br />
Infants who are exclusively breastfed for six months experience less morbidity from<br />
gastrointestinal infection than those who are mixed breastfed as of three or four<br />
months.<br />
Infants, from either developing or developed countries, who are exclusively<br />
breastfed for six months or longer do not have deficits in growth compared to<br />
those who are not exclusively breastfed.<br />
There are no apparent risks in a general recommendation for exclusive<br />
breastfeeding for the first six months of life, in both developing and developedcountries.<br />
However, infants should still be managed individually in order to achieve<br />
sufficient growth and minimise adverse outcomes.<br />
<strong>DRAFT</strong> <strong>Australian</strong> <strong>Dietary</strong> <strong>Guidelines</strong>- December 2011 134<br />
A<br />
A<br />
B<br />
B<br />
B<br />
B
Evidence Statement Grade<br />
Exclusive breastfeeding for 6 months or more prolongs lactational amenorrhea for<br />
mothers.<br />
Breastfeeding support (any type) increases duration of both exclusive and nonexclusive<br />
breastfeeding both in the immediate post-natal period and at six months of<br />
age.<br />
Being breastfed initially, particularly exclusively breastfed is associated with lower<br />
total and LDL concentrations in adult life.<br />
Breastfeeding is associated with a reduced risk of asthma and atopic disease. C<br />
Breastfeeding is associated with a reduced risk of atopic disease. C<br />
Not breastfeeding is associated with an increased risk of Sudden Infant Death<br />
Syndrome.<br />
Maternal perceived insufficient milk (PIM) supply is associated with increased risk of<br />
early cessation of lactation.<br />
5.2.1 Breastfeeding incidence and duration<br />
Exclusive breastfeeding: Systematic reviews from developed and developing countries provide<br />
evidence of a probable association that exclusive breastfeeding for around six months of life 3 is the<br />
best method of feeding for full-term infants (Grade B, Section 23.2 in Evidence Report [14]).<br />
Breastfeeding can then continue while appropriate solid (spoon) foods are introduced.WHO and<br />
almost all national and international paediatric and public health organisations make similar<br />
recommendations. NHMRC’s Infant Feeding <strong>Guidelines</strong> for <strong>Health</strong> Workers (public consultation<br />
draft 2011) recommend that exclusive breastfeeding be encouraged, supported and promoted to<br />
around six months of age. —see Infant Feeding <strong>Guidelines</strong> for <strong>Health</strong> Workers – Literature Review for<br />
a full list [868-871].<br />
Adding other foods: The introduction of complementary feeding (adding solid foods and liquids<br />
other than breastmilk or infant formula) at around six months is consistent with introduction of<br />
solid foods during the probable ‘window of tolerance’ between 4–7 months [872]. The majority of<br />
<strong>Australian</strong> infants have solids introduced during this period [873].<br />
3 In Australia, ‘around six months’ for exclusive breastfeeding is used to acknowledge that different infants develop at<br />
different rates. 22 – 26 weeks is considered to be “around six months”.<br />
<strong>DRAFT</strong> <strong>Australian</strong> <strong>Dietary</strong> <strong>Guidelines</strong>- December 2011 135<br />
B<br />
B<br />
C<br />
C<br />
C
No apparent risks have been reported in recommending, as a general policy, exclusive<br />
breastfeeding for around the first six months of life, in both developing and developed countries<br />
(Grade B, Section 23.2 in Evidence Report [14]). It is important, however, that health professionals<br />
manage infants individually so that faltering growth or other adverse outcomes do not go<br />
unnoticed.<br />
Early cessation of lactation: Recent evidence suggests an association between maternal perceived<br />
insufficient milk (PIM) supply and an increased risk of early cessation of lactation (Grade C, Section<br />
25.3 in Evidence Report [14]).<br />
Supportive environments: There is convincing evidence that pre-natal and perinatal support for<br />
breastfeeding can increase the proportion of women breastfeeding (both exclusive and nonexclusive)<br />
up to age 6 months (Grade A, Section 25.3 in Evidence Report [14]).<br />
Recent evidence also suggests a probable association between breastfeeding support (any type)<br />
and an increased duration of both exclusive and non-exclusive breastfeeding, both in the<br />
Immediate post-natal period and at 6 months of age (Grade B, Section 25.3 in Evidence Report<br />
[14]).<br />
<strong>DRAFT</strong> <strong>Australian</strong> <strong>Dietary</strong> <strong>Guidelines</strong>- December 2011 136
Table 5.1 Factors associated with duration of exclusive breastfeeding<br />
Association with longer duration of exclusive breastfeeding<br />
Consistently positive Consistently negative Effect varies in<br />
different cultures<br />
Higher level of maternal<br />
education<br />
Support of midwives and<br />
community health professionals<br />
Father’s preference for<br />
breastfeeding<br />
Doctors’ support of<br />
breastfeeding<br />
Lower socioeconomic<br />
backgrounds<br />
<strong>For</strong>mula supplementation in the<br />
maternity ward<br />
Mother's intention to use<br />
supplementation<br />
Previous breastfeeding<br />
experience short-term (
5.2.2 Infant growth<br />
<strong>For</strong> ethical reasons, randomised control trials (RCTs) of breastfeeding are not possible. The best<br />
research alternative is the use of RCTs of health promotion interventions to increase<br />
breastfeeding rates. <strong>For</strong> this reason, most evidence is based on prospective cohort studies and one<br />
large health promotion RCT, the Promotion of Breastfeeding Intervention Trial (PROBIT) study<br />
[883].<br />
Breastfed infants grow more slowly than formula-fed infants [861]. A systematic review of 19<br />
observational studies in developed countries concluded that the cumulative difference in body<br />
weight at 12 months of age was 600–650g less in infants breastfed for 12 months than formula-fed<br />
infants [884]. Differences in feeding behavior and mother–child interaction between breastfed and<br />
formula-fed infants may account for some of the differences reported. <strong>For</strong> instance, breastfed<br />
infants showed a different suckling pattern, and appeared to have greater degree of control on<br />
meal sizes and feeding intervals than infants who were formula-fed [885].<br />
5.2.3 Cardiovascular disease, type 2 diabetes and excess<br />
weight<br />
Excess weight: There is convincing evidence that breastfeeding , compared with formula<br />
feeding, is associated with reduced risk of infants becoming obese in childhood, adolescence and<br />
early adulthood (Grade A, Section 17.2 in Evidence Report [14]). The protection offered by<br />
breastfeeding appears to increase with duration of breastfeeding until it plateaus at nine months<br />
[886, 887].<br />
Evidence of an association between the age of introduction of solid foods and excess weight in<br />
children is inconclusive (Section 19.1 in Evidence Report [14]).<br />
Blood pressure: There is probable evidence that infants who are breastfed exclusively in the first<br />
few months of life have a lower adult systolic and diastolic blood pressure (approximately 1.5/0.5<br />
mmHg) compared with those who are formula-fed (Grade B, Section 23.1 in Evidence Report<br />
[14]).<br />
Total and LDL cholesterol: Recent evidence suggests being breastfed initially, and particularly<br />
exclusively breastfed, is associated with lower total and LDL concentrations in adult life when<br />
compared with those who were formula-fed (Grade C, Section 23.1 in Evidence Report [14]).<br />
<strong>DRAFT</strong> <strong>Australian</strong> <strong>Dietary</strong> <strong>Guidelines</strong>- December 2011 138
5.2.4 Other benefits<br />
Sudden Infant Death Syndrome (SIDS): There is evidence to suggest that breastfeeding reduces<br />
the risk of SIDS (Grade C, Section 23.4 in Evidence Report [14]).<br />
Gastrointestinal infection: There is probable evidence that children who are exclusively breastfed<br />
for six months have lower morbidity from gastrointestinal infection than those who are given both<br />
breastmilk and formula at the age of 3-4 months (Grade B, Section 23.2 in Evidence Report [14]).<br />
Factors in breastmilk such as secretory IgA, oligosaccharides and lactoferrin may protect the infant<br />
from various infections through passive immunity [483].<br />
Asthma: Recent evidence suggests an association between breastfeeding and lower incidences of<br />
asthma (Grade C, Section 23.3 in Evidence Report [14]). Data from the Longitudinal Study of<br />
<strong>Australian</strong> Children suggest a strong and significant protective effect of breastfeeding on wheezing<br />
and asthma in infancy, which increases with increasing breastfeeding duration (see<br />
http://www.asthmamonitoring.org).<br />
Atopic dermatitis: Recent evidence also suggests an association between breastfeeding and<br />
protection against atopic dermatitis in children with a family history of this condition, but not in<br />
those without a family history (Grade C, Section 23.3 in Evidence Report [14]).<br />
Lactational amenorrhea: Exclusive breastfeeding for six months or more prolongs lactational<br />
amenorrhea for mothers and delays the return of fertility (Grade B, Section 23.2 in Evidence<br />
Report [14]), which may be a benefit for some women as the lactational amenorrhoea method is a<br />
commonly used form of contraception [888-890].<br />
Allergy: The evidence for an association between a delay in the introduction of solid foods until<br />
after the age of 6 months and risk of developing allergic syndromes is inconclusive (Section 19.2 in<br />
Evidence Report [14]).<br />
Other factors: Additional benefits for infants who are exclusively breastfed compared with those<br />
who are formula fed in both developed and developing countries [861, 891] may include:<br />
protection against respiratory infection and reduced prevalence of asthma [892]<br />
reduced occurrence and recurrence of otitis media [891]<br />
protection against neonatal necrotising enterocolitits, bacteraemia, meningitis, botulism and<br />
urinary tract infection [861, 893]<br />
reduced risk of autoimmune disease, such as type 1 diabetes [891]<br />
lower rates of coeliac disease, Crohn’s disease and ulcerative colitis [894]<br />
improved visual acuity and psychomotor development [867]<br />
higher IQ scores, which may be the result of factors present in the milk or of greater<br />
stimulation [867, 895]<br />
reduced malocclusion as a result of better jaw shape and development [896]<br />
<strong>DRAFT</strong> <strong>Australian</strong> <strong>Dietary</strong> <strong>Guidelines</strong>- December 2011 139
improved mother and infant bonding and attachment [897].<br />
Additional health benefits to women who breastfeed may include:<br />
promotion of maternal recovery from childbirth through accelerated uterine involution and<br />
reduced risk of haemorrhage [898]<br />
accelerated weight loss and return to pre-pregnancy body weight [866, 882]<br />
reduced risk of pre-menopausal breast cancer [891]<br />
reduced risk of ovarian cancer [891]<br />
improved bone mineralisation and thereby decreased risk of post-menopausal hip fracture<br />
[899, 900].<br />
5.3 Practical considerations: Encourage and<br />
support breastfeeding<br />
Further information is included in the Infant Feeding <strong>Guidelines</strong> for <strong>Health</strong> Workers [133].<br />
5.3.1 Breastfeeding initiation and duration<br />
It is estimated that in Australia 90–92% of mothers initiate breastfeeding and approximately 50%<br />
are still breastfeeding at six months. Few infants are exclusively breastfed until six months in<br />
Australia [901]. However reliable national data on breastfeeding rates is difficult to obtain for<br />
several reasons, including inconsistent use of definitions of breastfeeding [902] [864].<br />
5.3.1.1 Early interaction<br />
Mothers should have contact with their babies as soon after birth and for as long as they wish<br />
[874]. Interventions aimed at either delaying or speeding up the length of the first feed should be<br />
avoided. Hospitals can encourage ‘rooming-in’ to facilitate frequent mother and child contact<br />
[903].<br />
5.3.1.2 Adolescent mothers<br />
Breastfeeding initiation and duration rates are below recommended levels among adolescent<br />
mothers [14]. Specific breastfeeding education programs in USA, UK and Australia targeted at<br />
pregnant adolescents have been somewhat effective in increasing breastfeeding initiation in<br />
adolescent mothers [904, 905]. Adolescent mothers identify emotional and network support as<br />
well as self-esteem as being crucial to breastfeeding success [904].<br />
<strong>DRAFT</strong> <strong>Australian</strong> <strong>Dietary</strong> <strong>Guidelines</strong>- December 2011 140
5.3.1.3 Mothers in the workplace<br />
Evidence is emerging that a mother’s employment status and number of hours worked outside the<br />
home influences the initiation and duration of breastfeeding. Women who are not employed fulltime<br />
[906], are self-employed or have flexible working hours are more likely to breastfeed for six<br />
months. Using only parental childcare has a positive association with continuation of breastfeeding<br />
[907].<br />
5.3.1.4 Low socioeconomic status mothers<br />
Women from the lowest socioeconomic quintile in Australia have lower breastfeeding rates than<br />
those from the most affluent quintile [908-910].<br />
5.3.1.5 Culturally and linguistically diverse mothers<br />
Limited available data suggest that, in general, the rates of breastfeeding among CALD women in<br />
Australia reflect trends in their countries of origin [911-915].<br />
5.3.1.6 Aboriginal and Torres Strait Islander mothers<br />
Indigenous mothers tend to breastfeed for longer than non-Indigenous mothers, especially in rural<br />
areas [30]. In the Perth Aboriginal Breastfeeding Study, Aboriginal <strong>Australian</strong>s had higher<br />
breastfeeding rates than non-Aboriginal women [916].<br />
5.3.1.7 Mothers who use illicit drugs<br />
WHO recommends that mothers who use illicit drugs while breastfeeding should be evaluated on<br />
an individual basis. Breastfeeding may need to be discontinued [917], but each case needs detailed<br />
medical assessment [906].<br />
5.3.2 Support for breastfeeding<br />
5.3.2.1 Promoting breastfeeding in prospective parents<br />
Overall, reviews of interventions to support breastfeeding have found that education before birth<br />
and continuing support after birth for breastfeeding mothers were effective in breastfeeding<br />
continuation.<br />
The US Preventive Services Task <strong>For</strong>ce found that any intervention to promote breastfeeding<br />
significantly increased rates of exclusive breastfeeding in the short term [875].<br />
<strong>DRAFT</strong> <strong>Australian</strong> <strong>Dietary</strong> <strong>Guidelines</strong>- December 2011 141
Effective education programs include information about the benefits of breastfeeding, principles of<br />
lactation, myths, common problems and solutions, and skills training [918]. Peer support was<br />
particularly useful for socioeconomically disadvantaged women, and peer counsellors were most<br />
effective if they were of similar cultural and social status to the women they were counselling. The<br />
optimal mix of interventions to improve breastfeeding practices includes education of mothers,<br />
peer support, hospital practices such as ‘rooming-in’ and ‘early skin-to-skin contact’, staff training,<br />
development and implementation of hospital policy, media campaigns, and paid maternity leave<br />
[876].<br />
A more recent Cochrane review agrees that there is a protective effect of provision of support on<br />
increasing duration of breastfeeding [874].<br />
5.3.2.2 Promoting breastfeeding in hospitals<br />
The Baby Friendly Hospital Initiative (UNICEF and WHO) has been shown to increase<br />
breastfeeding rates in accredited hospitals [919]. The steps include:<br />
Have a written breastfeeding policy that is routinely communicated to all health care staff<br />
Train all health care staff in skills necessary to implement this policy<br />
Inform all pregnant women about the benefits and management of breastfeeding<br />
Place babies in skin-to-skin contact with their mothers immediately following birth for at<br />
least an hour and encourage mothers to recognise when their babies are ready to<br />
breastfeed, offering help if needed.<br />
Show mothers how to breastfeed and how to maintain lactation even if they should be<br />
separated from their infants<br />
Give newborn infants no food or drink other than breastmilk, unless medically indicated<br />
Practice rooming-in, allow mothers and infants to remain together-24 hours a day<br />
Encourage breastfeeding on demand<br />
Give no artificial teats or dummies to breastfeeding infants<br />
Foster the establishment of breastfeeding support and refer mothers on discharge from the<br />
facility.<br />
Early contact improves breastfeeding outcomes [14]. Interventions aimed at either delaying or<br />
speeding up the length of the first feed should be avoided. Hospital practices at the time of birth<br />
can be the first line of support for a new mother. Difficulties encountered can be quickly resolved<br />
by staff with appropriate experience, and hospitals can encourage ‘rooming-in’ to facilitate<br />
frequent mother and child contact [903]. The use of prelacteal feeds or other liquids while in<br />
hospital interferes with the establishment of lactation and is contrary to the BFHI principles.<br />
Mothers should have contact with their babies as soon after birth and for as long as they wish as<br />
this improves breastfeeding outcomes [874].<br />
<strong>DRAFT</strong> <strong>Australian</strong> <strong>Dietary</strong> <strong>Guidelines</strong>- December 2011 142
5.3.1.3 Community support<br />
The successful management of breastfeeding problems in the first weeks after birth has a major<br />
impact on breastfeeding duration [920]. Sources of support for mothers in the first few weeks<br />
include family members, community health nurses, voluntary organisations and general<br />
practitioners. Preparation and education before birth are very important in achieving successful<br />
breastfeeding. Efforts to improve community acceptance of breastfeeding are also critical.<br />
5.3.3 Safe storage of breastmilk<br />
Many mothers find it convenient to express breastmilk so that others can feed their baby if<br />
required. Appropriate hygiene is essential for the expression and storage of breastmilk.<br />
When expressing breastmilk, mothers should:<br />
wash hands thoroughly with soap and water<br />
if using a breastpump, sterilise it according to the manufacturer’s instructions and ensure<br />
the storage bottle is sterile<br />
refrigerate or freeze milk immediately after expressing<br />
discard any breastmilk that has been thawed but not used<br />
freeze milk that will not be used within two days. NHMRC draft Infant Feeding <strong>Guidelines</strong> for<br />
<strong>Health</strong> Workers(2011) refer to a maximum refrigerated storage time of 96 hours.<br />
date containers at the time of collection and use the oldest milk first.<br />
The use of a breast pump to express and measure breastmilk production is not recommended as a<br />
way to assess the adequacy of breastfeeding because expression from the breast may not be as<br />
effective as an infant suckling. Serial measurements of growth are the best way of assessing<br />
nutritional adequacy.<br />
5.3.4 Alcohol and breastfeeding<br />
See Section 3.4.<br />
Where to next<br />
Everyone should prepare and store food safely; however particular care should be<br />
taken when handling food intended for consumption by those who have increased<br />
risk of foodborne illness, such as pregnant women, infants, older people and people<br />
with certain medical conditions. The next chapter discusses how incorrect handling<br />
of food or storing of food can contribute to food poisoning and poor health<br />
outcomes.<br />
<strong>DRAFT</strong> <strong>Australian</strong> <strong>Dietary</strong> <strong>Guidelines</strong>- December 2011 143
6. Food safety<br />
Guideline 5<br />
Care for your food; prepare and store it safely.<br />
<strong>DRAFT</strong> <strong>Australian</strong> <strong>Dietary</strong> <strong>Guidelines</strong>- December 2011 144
Executive summary<br />
More than five million cases of foodborne illness are estimated to occur every year in<br />
Australia.<br />
Bacterial and viral food poisoning is a result of pathogenic organisms reaching harmful<br />
levels or the production of pathogenic toxins.<br />
Incorrect handling of food and storing food at inappropriate temperatures are major<br />
causes of food poisoning. Particular care should be taken when handling food to be<br />
consumed by people who have an increased risk of foodborne illness, such as<br />
pregnant women, infants, older people and people with certain medical conditions.<br />
This chapter provides information on the prevention of foodborne illness and why it<br />
is important to store and prepare food safely.<br />
<strong>DRAFT</strong> <strong>Australian</strong> <strong>Dietary</strong> <strong>Guidelines</strong>- December 2011 145
6.1 Setting the scene<br />
Foodborne illnesses are caused by contaminated foods. Contaminants include pathogens,<br />
environmental contaminants and adulterants [921]. These guidelines focus on bacterial and viral<br />
contaminants.<br />
Bacterial and viral food poisoning generally occurs when pathogenic organisms multiply to harmful<br />
levels as a result of incorrect handling of food, particularly when temperature control is<br />
inadequate. Some foodborne pathogens can cause illness even when present in low numbers (for<br />
example, hepatitis A virus, Norovirus, some strains of E. coli, Campylobacter jejuni and shigella spp.).<br />
Other pathogens produce toxins when allowed to multiply to high levels in food (for example,<br />
Clostridium botulinum, Staphylococcus aureus, Bacillus cereus and shigella spp) [922].<br />
Prevention of contamination is the key to avoiding foodborne illness. Once pathogens contaminate<br />
food they can multiply and/or produce toxins if not handled correctly [923]. As heat can kill many<br />
bacteria and viruses it is the basis for many strategies for making food safe. However, even<br />
reheating food to high temperatures will not destroy all toxins.<br />
The increasing age of human populations, migration, mass production of food due to population<br />
growth, and changed food habits pose threats to food safety [924]. Lack of access to quality food,<br />
lack of refrigeration and suitable storage pose threats to vulnerable groups. Isolated and poorer<br />
communities can be at higher risk as a result of inadequate storage facilities or limited access to<br />
regular food supplies.<br />
Foodborne illnesses appear to be increasing in incidence in Australia and worldwide, posing a<br />
significant public health problem [925, 926]. The most recent estimates are that there are 5.4<br />
million cases per year of foodborne illness in Australia, leading to 1.2 million visits to medical<br />
practitioners and 2.1 million days of work lost each year [927]. Multiple episodes increase the risk<br />
of long-term consequences such as reactive arthritis, irritable bowel syndrome and, rarely,<br />
Guillain-Barre Syndrome.<br />
6.2 The evidence for ‘caring for your food;<br />
prepare and store it safely’<br />
The true incidence of foodborne illnesses is consistently underestimated because cases are<br />
underreported, most cases are sporadic, and full diagnostic testing is usually done only in more<br />
severe cases or when there are extensive common-source outbreaks [928-930]. The majority of<br />
reported episodes are caused by foods prepared outside the home, regardless of where they are<br />
consumed. Foods prepared in the home account for 20–40% of foodborne illnesses in Australia<br />
<strong>DRAFT</strong> <strong>Australian</strong> <strong>Dietary</strong> <strong>Guidelines</strong>- December 2011 146
[929]. Fresh fruit and vegetables can also be contaminated, depending on soils and farming<br />
practices. The main causes of foodborne illness in Australia are:<br />
inadequate cooking [928, 931]<br />
improper holding temperatures [928, 931]<br />
contaminated equipment (such as knives, cutting boards and dishcloths) [931]<br />
contaminated food storage and preparation areas<br />
unsafe raw food [931]<br />
allowing raw foods to make direct contact with ready-to-eat foods [928]<br />
poor personal hygiene of food handlers (such as not washing hands adequately,<br />
particularly after handling raw food and immediately after using the toilet) [931]<br />
6.2.1 Foods which may cause problems if not handled<br />
correctly<br />
The following are examples of foods that are normally considered potentially hazardous if not<br />
stored and prepared safely:<br />
raw and cooked meat or foods containing raw or cooked meat<br />
dairy products and foods containing dairy products<br />
seafood and foods containing seafood<br />
cooked rice and pasta<br />
processed fruit and vegetables such as salads<br />
processed foods containing eggs or other protein-rich food<br />
foods that contain any of the foods above, for example, sandwiches [932].<br />
The foods most commonly implicated in foodborne illness in Australia are meat and seafood [928].<br />
Some foodborne pathogens, such as viruses and enterohaemorrhagic strains of E. coli, do not need<br />
to grow in foods to produce illness. Contamination of any ready-to-eat food with such a pathogen<br />
can result in foodborne illness.<br />
6.3 Why it is important to prepare and store<br />
food safely<br />
The ability of micro-organisms to grow in a food depends on external factors (such as<br />
temperature) as well as characteristics of the food itself, such as protein content [933, 934], water<br />
content and pH. <strong>For</strong> example, bacteria are least active in very acidic foods (pH less than 4.5).<br />
Most bacteria can multiply at temperatures between 5°C and 60°C but a few pathogenic bacteria<br />
multiply at temperatures at or below 5ºC [932]. Exposure to high temperatures destroys the<br />
<strong>DRAFT</strong> <strong>Australian</strong> <strong>Dietary</strong> <strong>Guidelines</strong>- December 2011 147
vegetative cells of most bacteria, although some have heat-resistant spores or produce histamines<br />
and toxins that survive the cooking process [923].<br />
Some bacteria multiply within 2 hours and can reach an infective dose in 4–6 hours [933-935].<br />
Refrigeration at or below 5°C slows the growth of bacteria [923].<br />
6.4 Practical considerations: Food safety<br />
6.4.1 Pregnant and breastfeeding women<br />
As the immune system in pregnancy is suppressed, pregnant women are more susceptible to<br />
foodborne illnesses. Pregnant women have a higher risk of listeriosis, caused by the bacterium<br />
Listeria monocytogenes. Listeriosis can be transmitted to the unborn child and possibly cause a<br />
miscarriage, premature birth or stillbirth [936]. As a precaution, pregnant women are advised to<br />
avoid specific foods which are more likely to contain Listeria. Pregnant women are also advised to<br />
be careful with foods more likely to contain mercury [131].<br />
6.4.2 Infants<br />
The immune system of infants is not fully developed and so they are more susceptible to<br />
foodborne illnesses. Particular care should therefore be taken when preparing infant formula (if<br />
this is being used), including the sterilisation of bottles and dummies and other equipment used to<br />
prepare formula [931]. Prepared foods should be handled with care and not reused or reheated,<br />
as outlined in the Infant Feeding <strong>Guidelines</strong> for <strong>Health</strong> Workers [133].<br />
6.4.3 Adults with illness<br />
Adults with illnesses that reduce immune function such as HIV/AIDS, cancer, diabetes, kidney or<br />
liver disease, haemochromatosis, stomach problems (including previous stomach surgery) and low<br />
stomach acid (for example, from antacid use) are more susceptible to foodborne illness. Also at<br />
risk are people taking immunosuppressants, undergoing bone marrow or stem cell transplantation,<br />
or who have a history of long-term steroid use. Prepared foods should be handled with care.<br />
6.4.4 Older people<br />
Older adults are at higher risk of foodborne illness than other adult groups due to their weakened<br />
immune systems, decreased intestinal motility, decreased acid in the stomach, loss of sense of<br />
smell and taste, and dementia and malnutrition especially in frail older people [937, 938]. High-risk<br />
foods should be cooked, dairy products should be pasteurised, and specific foods at risk of listeria<br />
<strong>DRAFT</strong> <strong>Australian</strong> <strong>Dietary</strong> <strong>Guidelines</strong>- December 2011 148
contamination (see above) avoided. See<br />
http://www.foodstandards.gov.au/consumerinformation/listeria/.<br />
People of any age, but especially older people receiving pre-prepared meals, need to ensure that<br />
they are safely stored if not consumed immediately.<br />
<strong>DRAFT</strong> <strong>Australian</strong> <strong>Dietary</strong> <strong>Guidelines</strong>- December 2011 149
Appendix 1. History and timeline of<br />
<strong>Australian</strong> nutrition documents<br />
The Commonwealth Advisory Council on Nutrition was formed in 1936 and became the<br />
Nutrition Committee of the NHMRC in 1939, at the same time as a Nutrition Unit was<br />
established in the then Commonwealth Department of <strong>Health</strong>. Soon after, state and territory<br />
health departments set up similar nutrition committees and have since had a role in providing<br />
nutrition information and education programs in Australia.<br />
From the 1940s through to the 1970s the Commonwealth and the states and territories published<br />
pamphlets and booklets to guide food selection and provide education tools, including the Five<br />
Food Group plan, which listed the food groups ‘bread and other cereals’, ‘vegetables and fruit’,<br />
‘meat and meat alternatives’, ‘milk and milk products’, and ‘butter/table margarine’.<br />
1938 Tables of composition of <strong>Australian</strong> foods<br />
First set of tables of composition of <strong>Australian</strong> foods, including data from both local and overseas<br />
sources for over 1100 foods. It was revised and reprinted many times over the next decades.<br />
1979-83 <strong>Dietary</strong> <strong>Guidelines</strong> for <strong>Australian</strong>s<br />
In response to an increase in nutritional problems related to overconsumption of food, in 1979<br />
the Department of <strong>Health</strong> developed eight <strong>Dietary</strong> Goals for <strong>Australian</strong>s. These were modified to<br />
provide direct advice to members of the community as <strong>Dietary</strong> <strong>Guidelines</strong> for <strong>Australian</strong>s, which<br />
were endorsed by the NHMRC in 1983. It was noted that these guidelines should be reviewed as<br />
further data became available on the nutritional status of <strong>Australian</strong> and the relationships between<br />
diet and disease [939].<br />
1989 Nutrient Data Table (NUTTAB)<br />
The first electronic food composition data release (on diskette), as the first edition of the Nutrient<br />
Data Table for use in Australia (NUTTAB), containing a combination of <strong>Australian</strong> and British data<br />
[940].<br />
<strong>DRAFT</strong> <strong>Australian</strong> <strong>Dietary</strong> <strong>Guidelines</strong>- December 2011 150
1989 - 1995 Composition of Foods, Australia (COFA)<br />
The Composition of Foods, Australia (COFA) series was released in seven volumes, containing the<br />
first compilation of new <strong>Australian</strong>-sourced data for <strong>Australian</strong> foods from the analytical work of<br />
Greenfield and colleagues.<br />
1991 Recommended <strong>Dietary</strong> Intakes for use in Australia<br />
The development of the Recommended <strong>Dietary</strong> Intakes (RDIs) began in 1980 and the report was<br />
published in 1991 [941]. The RDIs are derived from estimates of requirements for each age/sex<br />
category and incorporate generous factors to accommodate variations in absorption and<br />
metabolism. They therefore apply to group needs. RDIs exceed the actual nutrient requirements<br />
of practically all healthy persons and are not synonymous with requirements.<br />
1992 Food and Nutrition Policy<br />
The <strong>Australian</strong> Food and Nutrition Policy, endorsed in 1992 [33], aims to improve the health of<br />
<strong>Australian</strong>s and reduce the burden of preventable diet-related death, illness and disability. The<br />
policy strategies were developed in alignment with dietary guidelines and based on principles of<br />
good nutrition, ecological sustainability and equity.<br />
1992 <strong>Dietary</strong> <strong>Guidelines</strong> for <strong>Australian</strong>s<br />
An expert panel was set up in 1989 by the Public <strong>Health</strong> Committee to review the existing dietary<br />
guidelines. In 1992, the <strong>Dietary</strong> <strong>Guidelines</strong> for <strong>Australian</strong>s were published by the NHMRC for use by<br />
healthy adults. They represented the best consensus of scientific knowledge and public health<br />
advice available. A guideline to encourage and support breastfeeding was included, as were specific<br />
guidelines on calcium and iron.<br />
1995 The Core Food Groups<br />
The Core Food Groups [942] was the modeling document that underpinned the development of the<br />
food guide- the <strong>Australian</strong> Guide to <strong>Health</strong>y <strong>Eat</strong>ing (see below). The purpose of The Core Food Groups<br />
[942] was to discuss the basis for a core food group system that reflects advances in nutrition<br />
knowledge and to complement existing nutrition references at the time (for example, <strong>Dietary</strong><br />
<strong>Guidelines</strong> for <strong>Australian</strong>s, 1992). The need for a core food group system arose because existing<br />
food selection guides in Australia at the time differed in the advice offered. The Core Food Groups<br />
document was developed to provide an approach that was objective, scientifically rigorous and<br />
updateable as new evidence on nutrition became available. It provided advice on core food<br />
<strong>DRAFT</strong> <strong>Australian</strong> <strong>Dietary</strong> <strong>Guidelines</strong>- December 2011 151
quantities consistent with national nutrition recommendations and targets, creating a platform for<br />
the interpretation of food and nutrition research into recommendations regarding food choices.<br />
1998 The <strong>Australian</strong> Guide to <strong>Health</strong>y <strong>Eat</strong>ing<br />
The <strong>Australian</strong> Guide to <strong>Health</strong>y <strong>Eat</strong>ing [45] is a food guide for Australia that reflects the<br />
multicultural nature of the population. Based on the modeling of the Core Food Groups, it is<br />
designed for all sectors of the food system to use as a nutrition education and information tool.<br />
1999 <strong>Dietary</strong> <strong>Guidelines</strong> for Older <strong>Australian</strong>s<br />
The <strong>Dietary</strong> <strong>Guidelines</strong> for Older <strong>Australian</strong>s [35] were based on the <strong>Dietary</strong> <strong>Guidelines</strong> for <strong>Australian</strong>s,<br />
1992 [569] and were designed to take account of the changes in nutritional needs that occur with<br />
ageing. The <strong>Guidelines</strong> are aimed at healthy, independent <strong>Australian</strong>s aged 65 and over, but<br />
additional advice was provided on how the <strong>Guidelines</strong> apply to older <strong>Australian</strong>s who receive<br />
assistance with meals or live in residential aged care facilities. The <strong>Guidelines</strong> were also useful for<br />
health professionals who wished to develop suitable diets for older people in a range of health<br />
circumstances.<br />
1999 <strong>Australian</strong> Food and Nutrient Database (AUSNUT)<br />
The first in the AUSNUT (<strong>Australian</strong> Food and Nutrient Database) series was first released, an<br />
electronic file of nutrient data based on the technical support file for the 1995 National Nutrition<br />
Survey. The AUSNUT series of databases are derived from the NUTTAB series for the purpose of<br />
coding the food intake data collected in national nutrition surveys [943]. A second edition, used<br />
to code the 2007 <strong>Australian</strong> Children’s Nutrition and Physical Activity Survey (insert ref), was<br />
released in 2008 (available at http://www.foodstandards.gov.au/consumerinformation/ausnut2007/)<br />
[944]. The third edition, developed to code the 2011 <strong>Australian</strong> <strong>Health</strong> Survey data, is planned for<br />
release in 2013.<br />
2000 Nutrition in Aboriginal and Torres Strait Islander Peoples:<br />
An Information Paper<br />
This information paper, endorsed by NHMRC, presented information about nutrition and<br />
nutrition-related disease in Aboriginal and Torres Strait Islander peoples. This information was<br />
specifically targeted to practitioners working to improve the nutritional health of Aboriginal and<br />
Torres Strait Islander peoples, and provided a reference material for practice and teaching.<br />
<strong>DRAFT</strong> <strong>Australian</strong> <strong>Dietary</strong> <strong>Guidelines</strong>- December 2011 152
2001 <strong>Eat</strong> Well Australia: An Agenda for Action in Public <strong>Health</strong><br />
Nutrition and the National Aboriginal and Torres Strait Islander<br />
Nutrition Strategy and Action Plan<br />
<strong>Eat</strong> Well Australia: An agenda for action in public health [2] was designed to provide government and<br />
other sectors with a strategic framework and an agenda for action on public health nutrition for<br />
the first decade of the 21st century. This document provides the detailed <strong>Eat</strong> Well Australia Agenda<br />
for Action, as outlined in the summary <strong>Eat</strong> Well Australia Strategic Framework document. <strong>Eat</strong> Well<br />
Australia is a coherent national approach to the underlying causes of the preventable burden of<br />
diet-related disease and early death, providing a set of interlinked initiatives for the prevention and<br />
management of these diseases.<br />
The National Aboriginal and Torres Strait Islander Nutrition Strategy and Action Plan (NATSINSAP) [945]<br />
set out a framework for action to improve Aboriginal and Torres Strait Islander nutritional health<br />
under seven priority areas:<br />
food supply in rural and remote communities<br />
food security and socioeconomic status<br />
family-focused nutrition promotion<br />
nutrition issues in urban areas<br />
the environment and household infrastructure<br />
the Aboriginal and Torres Strait Islander nutrition workforce, and<br />
national food and nutrition information systems.<br />
An evaluation of the NATSINSAP was completed in 2010, and is expected to contribute to<br />
informing future national policy development aimed at improving nutrition in Aboriginal and<br />
Torres Strait Islander peoples.<br />
<strong>DRAFT</strong> <strong>Australian</strong> <strong>Dietary</strong> <strong>Guidelines</strong>- December 2011 153
2003 <strong>Dietary</strong> <strong>Guidelines</strong> for Adults<br />
<strong>Dietary</strong> <strong>Guidelines</strong> for Children and Adolescents<br />
incorporating the Infant Feeding <strong>Guidelines</strong> for <strong>Health</strong><br />
Workers<br />
The <strong>Dietary</strong> <strong>Guidelines</strong> for <strong>Australian</strong> Adults [37] and <strong>Dietary</strong> <strong>Guidelines</strong> for Children and Adolescents in<br />
Australia [36], incorporating the Infant Feeding <strong>Guidelines</strong> for <strong>Health</strong> Workers, were based on the<br />
best available scientific evidence and provided information for health professionals and the general<br />
population about healthy food choices. The use of the <strong>Guidelines</strong> was intended to encourage<br />
healthy lifestyles to minimise the risk of developing diet-related diseases in the <strong>Australian</strong><br />
population.<br />
The <strong>Guidelines</strong> highlighted the groups of foods and lifestyle patterns that promote good nutrition<br />
and health. As with all previous dietary guidelines, recommendations were presented as an integral<br />
whole and no specific guideline was considered more important than any another.<br />
2006 Nutrient Reference Values for Australia and New Zealand<br />
Including Recommended <strong>Dietary</strong> Intakes<br />
In 2002, the NHMRC was commissioned by the <strong>Australian</strong> Department of <strong>Health</strong> and Ageing<br />
(DoHA) in collaboration with the New Zealand Ministry of <strong>Health</strong> to manage the revision process<br />
for the Recommended <strong>Dietary</strong> Intakes document. This resulted in the publication of the Nutrient<br />
Reference Values for Australia and New Zealand Including Recommended <strong>Dietary</strong> Intakes (NRVs) in<br />
2006 [9]. The NRVs identified a number of reference values that address nutrient needs and<br />
excess intake for various age/sex groups.<br />
2006 NUTTAB Online<br />
The first online release of nutrient data, with the 6 th edition of NUTTAB released by FSANZ. The<br />
7 th edition of NUTTAB was released in 2011 and is available at<br />
http://www.foodstandards.gov.au/consumerinformation/nuttab2010/ [946]. Most of NUTTAB’s<br />
data is now <strong>Australian</strong> analytical data and covers more than 2500 foods available in Australia and<br />
up to 245 nutrients per food.<br />
<strong>DRAFT</strong> <strong>Australian</strong> <strong>Dietary</strong> <strong>Guidelines</strong>- December 2011 154
2011 A Review of the Evidence to Address Targeted Questions to<br />
Inform the Revision of the <strong>Australian</strong> <strong>Dietary</strong> <strong>Guidelines</strong><br />
The primary aim of the ‘Evidence Report’ [14] was to undertake a series of targeted systematic<br />
reviews of the literature published since 2002 on the interrelationship between food, diet, health<br />
and disease for different population subgroups.<br />
2011 A Modelling System to Inform the Revision of the <strong>Australian</strong><br />
Guide to <strong>Health</strong>y <strong>Eat</strong>ing<br />
In 2009 and 2010, the nutrient recommendations from the NRV 2006 document were translated<br />
(informed by A Review of the Evidence to Address Targeted Questions to Inform the Revision of the<br />
<strong>Australian</strong> <strong>Dietary</strong> <strong>Guidelines</strong>) into recommended amounts and types of foods which constitute a<br />
healthy diet that prevents nutrient deficiency, reduces risk of chronic disease, and is culturally<br />
acceptable, socially equitable and environmentally sustainable. This document updates the Core<br />
Food Groups 1995.<br />
The Modelling document [10] also informs the development of these guidelines, which is an update<br />
of the previously separate reports: the <strong>Dietary</strong> <strong>Guidelines</strong> for Adults (2003), <strong>Dietary</strong> <strong>Guidelines</strong> for<br />
Older <strong>Australian</strong>s (1999) and <strong>Dietary</strong> <strong>Guidelines</strong> for Children and Adolescents (2003).<br />
<strong>DRAFT</strong> <strong>Australian</strong> <strong>Dietary</strong> <strong>Guidelines</strong>- December 2011 155
Appendix 2. Process report<br />
In 2003, NHMRC issued the <strong>Dietary</strong> <strong>Guidelines</strong> for <strong>Australian</strong> Adults and <strong>Dietary</strong> <strong>Guidelines</strong> for Children<br />
and Adolescents in Australia, having already issued <strong>Dietary</strong> <strong>Guidelines</strong> for Older <strong>Australian</strong>s in 1999.<br />
With a policy of reviewing guidelines every five years, NHMRC in collaboration with the <strong>Health</strong>y<br />
Living Branch of the Department of <strong>Health</strong> and Ageing (DoHA) commenced a review of the suite<br />
of <strong>Dietary</strong> <strong>Guidelines</strong> in 2008. The above three reports have now been combined into one set of<br />
<strong>Australian</strong> <strong>Dietary</strong> <strong>Guidelines</strong>.<br />
The <strong>Australian</strong> <strong>Dietary</strong> <strong>Guidelines</strong> provide a resource that promotes the benefits of healthy eating to<br />
improve community health and wellbeing and to reduce the risk of diet-related disease. The<br />
<strong>Guidelines</strong> are intended for healthy members of the general population of any age, including people<br />
with common diet-related risk factors such as being overweight. They are not intended for people<br />
with medical conditions who require specialised dietary advice, or for the frail elderly who are at<br />
risk of malnutrition. The target audience of the <strong>Guidelines</strong> includes health professionals (including<br />
dietitians, nutritionists, general practitioners and nurses/lactation consultants), educators,<br />
government policy makers (for example, the government departments of health), the food<br />
industry and other interested parties. Other resources are being developed from the <strong>Guidelines</strong> for<br />
other target audiences.<br />
RaggAhmed was commissioned in October 2010 by NHMRC through a Request for Quote<br />
process through the NHMRC technical writing panel to edit the draft chapters and collate them<br />
into one succinct report.<br />
A2.1 Contributors<br />
An expert working committee (the Working Committee), chaired by<br />
Dr Amanda Lee and deputy-chaired by Professor Colin Binns, was appointed in April 2008 to<br />
guide, advise and author the redevelopment of the <strong>Australian</strong> <strong>Dietary</strong> <strong>Guidelines</strong>. Representatives<br />
from DoHA attended working committee meetings as observers.<br />
A2.1.1 Members of the Working Committee<br />
Dr Amanda Lee (Chair)<br />
Professor Colin Binns (Deputy Chair)<br />
Dr Geoffrey Annison (from August 2010)<br />
Professor Sandra Capra, AM<br />
Professor Peter Davies<br />
A/Professor Sharon Friel<br />
Ms Clare Hughes<br />
A/Professor Mark Lawrence<br />
<strong>DRAFT</strong> <strong>Australian</strong> <strong>Dietary</strong> <strong>Guidelines</strong>- December 2011 156
Professor Dorothy Mackerras<br />
Dr David Roberts (until May 2010)<br />
Dr Rosemary Stanton, OAM<br />
Professor Linda Tapsell<br />
A2.1.2 NHMRC project team<br />
Ms Cathy Connor<br />
Ms Bronwyn Battisson<br />
Ms Marisa Bialowas<br />
Mrs Marion Carey<br />
Ms Cheryl Cooke<br />
Ms Vesna Cvjeticanin<br />
Ms Emma Milde<br />
Ms Tess Winslade<br />
A2.1.3 Department of <strong>Health</strong> and Ageing project team<br />
Ms Erica Nixon<br />
Ms Caroline Arthur<br />
Ms Marina Dron<br />
Ms Erica Kneipp<br />
Ms Jacinta McDonald<br />
Ms Bronia Rowe<br />
Ms Leticia White<br />
A2.1.4 Contractors<br />
Sky Newton, Adelaide <strong>Health</strong> Technology<br />
Philippa Middleton, methodologist, University of Adelaide<br />
Dr Katrine Baghurst (<strong>Australian</strong> Guide to <strong>Health</strong>y <strong>Eat</strong>ing)<br />
RaggAhmed, technical writers<br />
Simon Grose, editor<br />
Dr Rachel Nowak, consultant in science policy, analysis and communication<br />
Quantum Market Research, health professional and consumer focus group testing<br />
A2.2 Literature review<br />
In the past, the <strong>Dietary</strong> <strong>Guidelines</strong> have provided recommendations based on evidence including that<br />
of nutrients and associations with health outcomes. However, as people eat foods rather than<br />
isolated nutrients, the Working Committee determined that the literature review should primarily<br />
<strong>DRAFT</strong> <strong>Australian</strong> <strong>Dietary</strong> <strong>Guidelines</strong>- December 2011 157
seek evidence on the relationship between foods, dietary patterns and health outcomes. The<br />
Working Committee determined that the revised guidelines would be an evolution from the<br />
previous versions and build upon their evidence and science base.<br />
In 2009, the Dietitians Association of Australia was commissioned through an open Request for<br />
Tender process to systematically review the literature.<br />
The Working Committee, with the assistance of a NHMRC Guideline Assessment Register Panel<br />
Consultant, Ms Skye Newton of Adelaide <strong>Health</strong> Technology Assessment, developed 27 complex<br />
search questions for the literature review in areas emerging in the literature and areas included in<br />
the 2003 <strong>Dietary</strong> <strong>Guidelines</strong> where the evidence base may have changed. A number of established<br />
food, diet and health relationships covered in the 2003 <strong>Dietary</strong> <strong>Guidelines</strong>, where the evidence<br />
base was unlikely to have changed substantially, were identified as not needing specific search<br />
questions to be asked. <strong>For</strong> example, the relationship between diets high in saturated fat and<br />
increased risk of high cholesterol.<br />
The 27 search questions for the literature review were prioritised to 12 complex questions in<br />
consideration of time and financial constraints. These formed the basis of questions for three types<br />
of review: systematic literature review (the systematic review of the primary literature); umbrella<br />
review (the systematic review of systematic reviews); and narrative reviews (the comprehensive<br />
review of the literature to answer more qualitative questions, for example, such as that concerning<br />
nature and scope of international food guides and practices promoting food safety).<br />
The final questions for systematic and umbrella reviews were transcribed into PICO format.<br />
Detailed definitions and search terms were developed for each component of the final complex<br />
search questions and a number of specific search questions for each variable arising from various<br />
permutations were formulated for each complex question.<br />
Standardised processes were used to review the literature [34, 39-41]. Databases searched<br />
included CINAHL, MEDLINE, DARE, Cochrane, ScienceDirect, PsychLit and ERIC. <strong>For</strong> each<br />
specific search question, the identified articles were retrieved and reviewed for relevance by a<br />
team of reviewers. Papers published before 2002 were excluded. Duplicates, papers not within the<br />
scope of the search questions and papers that were already included in meta-analyses, described<br />
cross-sectional studies or were not research studies (for example, letters and editorials) were also<br />
excluded.<br />
The evidence was assessed according to NHMRC levels and grades for recommendations for<br />
developers of guidelines [41] which allowed each article to be critically appraised and assigned a level<br />
of evidence based on a hierarchy according to the type of research question. As this review<br />
looked at causality and intervention research questions the following hierarchy was used:<br />
Level I - A systematic review of level II studies<br />
Level II - A randomised controlled trial<br />
Level III-1 - A pseudorandomised controlled trial<br />
<strong>DRAFT</strong> <strong>Australian</strong> <strong>Dietary</strong> <strong>Guidelines</strong>- December 2011 158
Level III-2 - A comparative study with concurrent controls:<br />
Non-randomised experimental trial<br />
Cohort study<br />
Case-control study<br />
Interrupted time series with a control group<br />
Level III-3 - A comparative study without concurrent controls:<br />
Historical control study<br />
Two or more single arm study<br />
Interrupted time series without a parallel control group<br />
Level IV - Case series with either post-test or pre-test/post-test outcomes<br />
Data was extracted from included studies and assessed for strength of evidence, size of<br />
effect and relevance of evidence according to standardised NHMRC processes [34, 39-41]. The<br />
components of the body of evidence - evidence base (quantity, level and quality of evidence);<br />
consistency of the study results; clinical impact; generalisability; and applicability to the <strong>Australian</strong><br />
context) - were rated as excellent, good, satisfactory or poor according to standard NHMRC<br />
protocols [41]. The reviewers then translated the evidence into a draft body of evidence<br />
statement. The draft Evidence Statements were graded A to D according to standard NHMRC<br />
protocols [41] where:<br />
Grade A indicates that the body of evidence can be trusted to guide practice<br />
Grade B indicates that the body of evidence can be trusted to guide practice in most<br />
situations<br />
Grade C indicates that the body of evidence provides some support for the<br />
recommendations but care should be taken in its application<br />
Grade D indicates that the body of evidence is weak and any recommendation must be<br />
applied with caution.<br />
In order to reduce potential risks associated with advice being based on findings of single or only a<br />
few studies, the Working Committee and DAA Contractors advised that a minimum of five quality<br />
studies were required before a graded draft evidence statement could be made. The individual<br />
studies in included meta-analysis studies were considered as separate studies.<br />
Once the Evidence Statements and Grades had been drafted the NHMRC commissioned a<br />
methodologist through the NHMRC methodologist panel, Ms Phillippa Middleton from the<br />
University of Adelaide, to assist the Working Committee to ensure that the review activities had<br />
been undertaken in a transparent, accurate and unbiased manner. The methodologist and the<br />
Working Committee scrutinised each step of the review process by accessing the original papers<br />
and reviewing the rating of evidence components, and the wording and grading of each draft<br />
Evidence Statement. As a result, some Evidence Statements and Grades were amended using a<br />
Working Committee consensus approach, and the final Evidence Statements and Grades were<br />
agreed.<br />
<strong>DRAFT</strong> <strong>Australian</strong> <strong>Dietary</strong> <strong>Guidelines</strong>- December 2011 159
As nutrition is a continuously evolving area and research studies are published on a regular basis,<br />
the Working Committee also considered results from high quality studies (primarily systematic<br />
reviews) published after the literature review, and where deemed warranted, included the findings<br />
and references in the relevant evidence sections in each Chapter. However, only the Evidence<br />
Statements from systematic review of the literature until 2009 were graded.<br />
The results of this literature review, including the questions that were asked, are included in the<br />
report of the commissioned literature review: A Review of the Evidence to Address Targeted Questions<br />
to Inform the Revision of the <strong>Australian</strong> <strong>Dietary</strong> <strong>Guidelines</strong> (referred to as ‘the Evidence Report’) [14].<br />
The original literature search did not locate a sufficient number of food-based studies - rather than<br />
nutrient-based studies - to be able to draft evidence statements regarding food intake and dietary<br />
patterns for pregnant and breastfeeding women and health outcomes of infants and/or mothers.<br />
Therefore, a team from the University of Adelaide and the Women’s and Children’s <strong>Health</strong><br />
Research Institute was commissioned through a Request for Quote process from the NHMRC<br />
multi-use panel to conduct a more extensive search of the literature to locate and summarise<br />
studies meeting specified eligibility criteria. This team, led by Philippa Middleton and comprising<br />
Professor Maria Makrides, Dr Carmel Collins, Dr Alice Rumbold, Dr Jo Zhou, Professor Caroline<br />
Crowther and Associate Professory Vicki Flenady reviewed the literature for health outcomes for<br />
infants and mothers from food-based studies on pregnant and breastfeeding women.<br />
Parts of this review were used to inform the ‘practical considerations’ for pregnant and<br />
breastfeeding women that have been included in these guidelines.<br />
The Working Committee also determined that there was an evolving and increasing body of<br />
literature on the environmental impacts of the production and consumption of food and viceversa.<br />
Therefore, in addition to the original narrative review, a review of the relevant literature,<br />
particularly that pertaining to Australia, was conducted by A/Professor Friel and a team at the<br />
<strong>Australian</strong> National University. Following this work, it became clear that the inter-relationship<br />
between diet and the environment is a cross-sectoral matter and should be considered as such.<br />
NHMRC will work further with other relevant <strong>Australian</strong> government agencies to develop this<br />
work.<br />
A2.3 Modelling system<br />
In 2008 to 2010, NHMRC undertook an extensive review of the Core Food Groups (1994) and<br />
released A modelling system to inform the revision of the <strong>Australian</strong> Guide to <strong>Health</strong>y <strong>Eat</strong>ing (the<br />
Modelling System) in 2011 [10, 942]. The modelling system determined a range of combinations of<br />
the amounts and types of foods that could be consumed to meet the nutritional needs within the<br />
least amount of energy for the smallest and least active people within an age and sex group. These<br />
are called Foundation Diets. <strong>For</strong> those that are more physically active or taller (and older, in the<br />
case of infants, children and adolescents) within each age/sex group, the models provide additional<br />
<strong>DRAFT</strong> <strong>Australian</strong> <strong>Dietary</strong> <strong>Guidelines</strong>- December 2011 160
food options to meet additional energy needs. These are called Total Diets. (Note that the Total<br />
Diet for the smallest, least active people in each age/sex groups is equivalent to the Foundation<br />
Diet.)<br />
The number of serves and serve sizes modelled in the Modelling System were considered together<br />
with other sources of evidence to determine the recommendations in these guidelines (see<br />
Section A2.3 below).<br />
The Modelling System is located at www.eatforhealth.gov.au.<br />
A2.3 Development of the <strong>Australian</strong> <strong>Dietary</strong><br />
Guideline recommendations<br />
In translating the evidence to formulate the <strong>Dietary</strong> Guideline recommendations the Working<br />
Committee considered the following sources of evidence.<br />
The commissioned literature review: A Review of the Evidence to Address Targeted Questions<br />
to Inform the Revision of the <strong>Australian</strong> <strong>Dietary</strong> <strong>Guidelines</strong> (referred to as ‘the Evidence<br />
Report’) [14].<br />
The commissioned report: A Modelling System for Australia to Inform the Revision of the<br />
<strong>Australian</strong> Guide to <strong>Health</strong>y <strong>Eat</strong>ing (referred to as ‘the Food Modelling’ document) [10].<br />
NHMRC and NZ Ministry of <strong>Health</strong> 2006 Nutrient Reference Values for Australia and New<br />
Zealand Including Recommended <strong>Dietary</strong> Intakes (referred to as ‘the NRV document’) [9].<br />
Key authoritative government reports and documents provided by the Working<br />
Committee and the NHMRC, including evidence in material provided by stakeholders<br />
during consultation processes and findings of relevant large, quality, peer-reviewed studies<br />
published after 2009.<br />
The previous <strong>Dietary</strong> <strong>Guidelines</strong> for <strong>Australian</strong>s series and their supporting documentation<br />
[35-37].<br />
The information in the previous guidelines was used as the basis. New evidence was assessed to<br />
determine whether associations between food, dietary patterns and health outcomes had<br />
strengthened, weakened, or stayed the same since the last review of the evidence.<br />
The final wording of the <strong>Dietary</strong> Guideline recommendations was developed by a Working<br />
Committee consensus approach and focus tested.<br />
<strong>DRAFT</strong> <strong>Australian</strong> <strong>Dietary</strong> <strong>Guidelines</strong>- December 2011 161
A2.3.1 Public consultation<br />
The Council of NMHRC considered the draft guidelines on 1 April 2011, on 16 June 2001, and<br />
again on 2 November 2011. On 2 November 2011the Council agreed to recommend the Chief<br />
Executive Officer (CEO) of NHMRC release the <strong>Guidelines</strong> for public consultation.<br />
Public consultation on the draft guidelines was undertaken from xxxxx to xxxx. The public<br />
consultation was advertised in the major <strong>Australian</strong> newspapers and on the NHMRC website.<br />
Invitations were also sent to a large number of key stakeholders and those with a known interest<br />
in nutrition. XXX submissions were received from a variety of stakeholders including …..<br />
The Working Committee met on xxx to consider the submissions. Specific concerns included:<br />
A2.3.2 Peer review<br />
Text to come …<br />
A2.3.3 Independent review<br />
Text to come …<br />
A2.3.4 Endorsement<br />
The <strong>Guidelines</strong> were considered by the Council on xxx for recommendation to the CEO for<br />
issuing. The CEO was pleased to accept the Council’s advice and agreed to issue to guidelines<br />
under Section 7(1a) of the National <strong>Health</strong> and Medical Research Council Act 1992.<br />
A2.3.5 Dissemination and implementation<br />
Text to come …<br />
A2.3.6 Review<br />
In line with NHMRC policy, the <strong>Guidelines</strong> will be reviewed within five years of publication.<br />
<strong>DRAFT</strong> <strong>Australian</strong> <strong>Dietary</strong> <strong>Guidelines</strong>- December 2011 162
Appendix 3. Assessing growth and<br />
healthy weight in infants, children and<br />
adolescents, and healthy weight in<br />
adults<br />
A3.1 Assessing growth and healthy weight in<br />
infants, children and adolescents<br />
Measuring height and weight regularly is important. The most practical measures of growth status<br />
in childhood are comparisons with reference growth charts that show the normal ranges of height<br />
for age, weight for age and BMI, by sex. As growth is a dynamic process, several measurements are<br />
preferable when assessing children. When only a single measurement of weight and/or height is<br />
available, care is need in interpretation. <strong>For</strong> adults an assessment of obesity is usually made on the<br />
basis of one measurement.<br />
There are several widely accepted and practical tools available for assessment. The options are:<br />
BMI using international reference standards (The International Obesity Task <strong>For</strong>ce<br />
[IOTF] criteria) [712]<br />
CDC BMI curves (also recommended by WHO before 2006) [947]<br />
The new WHO growth reference (2006) BMI charts [948-950]<br />
The IOTF table uses cutoff points based on WHO adult BMI but extrapolated for use in children<br />
based on six international data sets. The differences between these options have been reviewed by<br />
Monasata [951]. It is important to note that the use of different methods of assessing overweight<br />
or obesity will give different results. The results cannot be directly compared. <strong>For</strong> that reason it is<br />
essential to state the criteria used when stating the overweight or obesity level of an individual or<br />
population.<br />
Measurement and recording of weight and height at regular intervals remains the best method to<br />
monitor growth. Generally, irrespective of the reference standard used, if a child is growing<br />
normally, the lines connecting the plotted values will proceed along - or parallel to - one of the<br />
percentile lines on the charts. However at adolescence the growth trajectory may increase or<br />
decrease dependent upon timing of the adolescent growth spurt. Care should always be taken<br />
when both measuring and plotting growth patterns to minimize error associated with poor<br />
measurement technique or error in plotting.<br />
<strong>DRAFT</strong> <strong>Australian</strong> <strong>Dietary</strong> <strong>Guidelines</strong>- December 2011 163
A3.1.1 Growth monitoring in the first few years of life<br />
Measurement and recording of the growth of infants and young children has been standard<br />
practice in Australia for decades. Growth monitoring remains the best method of assessing<br />
nutritional status and overall health at the community and primary care level. Commonly ‘Weight<br />
for Age’ and ‘Length/Height for Age’ growth reference charts are used. The most common growth<br />
reference in use in Australia was derived from US data (CDC 2000 [952]). The rate of growth is<br />
the most important factor, although if growth is above the 95th percentile or below the 5th, or<br />
crosses these percentiles, further assessment is required. In the first months of life monitoring an<br />
infant’s weight and using growth reference charts is one of the ways in which the adequacy of<br />
breastfeeding is assessed.<br />
The new WHO growth reference (2006) [950] is heavier than the older growth reference<br />
currently in use in Australia in the first six months of life. Care should be taken to adjust for this<br />
difference when assessing the growth of infants. The 2nd percentile of the new WHO chart<br />
equivalent to the 5th percentile on the old chart. It is important when using growth charts to<br />
remember that they are a tool, not a diagnostic instrument. The pattern of the infant’s growth,<br />
and in particular whether babies are crossing the centile channels as well as the position on the<br />
growth chart, are used in conjunction with clinical assessment in determining if there is a problem.<br />
A3.1.2 BMI using international reference standards<br />
An international reference (International Obesity Task <strong>For</strong>ce) for defining overweight and obesity<br />
in children and adolescents were developed with data from six countries, and provide age and sexspecific<br />
BMI cut-off points for children and adolescents aged 2–18 years that correspond to adult<br />
BMI values of 25 kg/m 2 for overweight and 30 kg/m2 for obesity [712]. This method was<br />
recommended for use in the 2003 NHMRC <strong>Dietary</strong> <strong>Guidelines</strong> for Children and Adolescents. BMI has<br />
become increasingly accepted as a useful tool for identifying and monitoring obesity in children<br />
[947, 953-955].<br />
<strong>DRAFT</strong> <strong>Australian</strong> <strong>Dietary</strong> <strong>Guidelines</strong>- December 2011 164
Table A3.1 International BMI cut-off points for overweight and obesity: males and<br />
females aged 2-18 years<br />
A3.1.3 CDC BMI curves<br />
The Centers for Disease Control (CDC) age and sex-specific BMI curves [947] are commonly<br />
used. In Australia, NHMRC and DoHA had recommended use of the US CDC growth charts<br />
[952] for children and adolescents aged 2–18 years [36, 956]. This reference was also used by<br />
WHO before 2006. NHMRC defined overweight as above the 85th percentile for BMI-for-age and<br />
obese as above the 95th percentile for BMI-for-age.<br />
<strong>DRAFT</strong> <strong>Australian</strong> <strong>Dietary</strong> <strong>Guidelines</strong>- December 2011 165
However, use of the CDC Charts has been criticised as they are based on US data only, from five<br />
national surveys undertaken between 1963 and 1994, the most recent being NHANES 111. The<br />
age and sex-specific CDC growth charts were last updated in 2000, and do not include weight data<br />
(and thus BMI data) from NHANES 111 from children over six years of age.<br />
A3.1.4 WHO growth charts<br />
The World <strong>Health</strong> Organization (WHO) has developed and uses two sets of growth reference<br />
charts, one for children from birth to age five years [949], and one for children and adolescents<br />
from age 5 to 19 years [948]. <strong>For</strong> children younger than five years, tables and charts showing<br />
percentiles and Z-scores for BMI-for-age, weight-for-age, and weight-for-length were published in<br />
2006. Overweight is defined as two standard deviations above normal on the weight-for-height<br />
chart and underweight is defined as weight-for-age two standard deviations below normal [949].<br />
<strong>For</strong> children and adolescents aged five to 19 years, tables and charts showing percentiles and Zscores<br />
for BMI-for-age, height-for-age, and weight-for-age were published in 2007. The BMI Zscore-for-age<br />
chart defines overweight as greater than one standard deviation above normal,<br />
obesity as greater than two standard deviations above normal, thinness as less than two standard<br />
deviations below normal, and severe thinness as less than three standard deviations below normal<br />
[948]. Recently the US has adopted the WHO growth charts [952] for children below 2 years of<br />
age. However, these WHO growth charts are not commonly used in Australia at present.<br />
A3.1.5 Others<br />
Waist circumference and waist/height ratio are becoming more common measures of child and<br />
adolescent central adiposity, but there is little consensus regarding standard cut-off values to<br />
define overweight and obesity [717, 957-962]. Waist circumference is widely used in adults<br />
because of its relationship to morbidity and mortality.<br />
Skinfold measurement – an index of subcutaneous adipose tissue – is another method of defining<br />
of under- or over-nutrition [963]. Reliable and accurate measurements depend to a large extent<br />
on the use of trained operators and properly calibrated instruments.<br />
Other methods of body composition assessment, for example DEXA (dual energy X-ray<br />
absorptiometry), can provide accurate measurements, but cost limits their application to<br />
experimental use and to clinical settings where more accurate diagnosis is required for<br />
management [964]. The most accurate measure of body composition is provided by using doubly<br />
labelled water, but cost limits its use to research.<br />
<strong>DRAFT</strong> <strong>Australian</strong> <strong>Dietary</strong> <strong>Guidelines</strong>- December 2011 166
A3.1.6 Z-scores and percentiles: Converting between<br />
measures<br />
While percentiles are most commonly used in Australia, in some situations, particularly for<br />
research, it is more appropriate to use the Z-scores (standard deviations above or below the<br />
mean). The conversion of percentiles to Z-scores requires a table of normal distributions. The<br />
50th percentile is a Z score of 0, the 90th percentile is +1.28, and 10th percentile is –1.28.<br />
Growth reference charts are available in both formats and a calculator is available on the internet<br />
(http://www.cdc.gov/growthcharts/ [952]). BMI can be converted into a BMI Z-score using a BMIfor-age<br />
growth chart and the formula: Z-score = ((BMI/M)L-1)/(LS), where M, L, and S are values<br />
selected from reference tables corresponding to the age of the child in months [36].<br />
A3.1.7 Differences between IOTF criteria and the new<br />
WHO growth reference<br />
There are major differences in the percentage of children classified as obese or overwight<br />
according to the reference used, ranging from 5% to 25% in a study of 3 year old children [951].<br />
These authors concluded that ‘the IOTF reference and cut-offs could be preferable for the<br />
identification of overweight and obesity both at individual and population levels because they are at<br />
least based on a crude association with ill health later in life, namely the definition of overweight<br />
and obesity at age 18 years’ [951].<br />
A3.2 How is healthy weight measured in<br />
adults?<br />
<strong>For</strong> adults the standard WHO BMI cutoff points are most commonly used for assessment of<br />
obesity, and separate cutoffs are available for Asian populations.<br />
Body mass index (BMI) is a measure of body size that is widely used as an index of relative risk of<br />
mortality and morbidity at the population level [687, 691]. The association of mortality with BMI is<br />
a J-shaped curve with the lowest risk – normal healthy weight – within the range 18.5 to 25 [687,<br />
691]. The cutoff point is 28 for older <strong>Australian</strong>s.<br />
BMI = weight (in kilograms)/height (in metres) 2 can be used to define weight status in adults<br />
(except older adults) as follows:<br />
Underweight
Obesity ≥30.0 [112, 126].<br />
People of Asian origin have the equivalent risk at a lower BMI and people of Polynesian origin have<br />
the equivalent risk at a higher BMI [708].<br />
It is important to measure weight and height accurately to assess overweight and obesity, as selfreported<br />
data is usually inaccurate.<br />
Waist circumference is increasingly being used as an alternative measure of body size for risk<br />
assessment in adults, and provides a better estimate of risk in adults than BMI [965, 966]. Above<br />
80 centimetres in women or 94 centimetres in men is regarded as being overweight and over 88<br />
centimetres in women or above 102 centimetres in men is classified as obese [710, 759].<br />
<strong>DRAFT</strong> <strong>Australian</strong> <strong>Dietary</strong> <strong>Guidelines</strong>- December 2011 168
Appendix 4. Physical activity guidelines<br />
Australia’s physical activity guidelines outline the minimum levels of physical activity required to<br />
gain a health benefit and identify ways to incorporate physical activity into everyday life. Below are<br />
excerpts from physical activity guidelines developed and published by Australia’s Commonwealth<br />
Department of <strong>Health</strong> and Ageing:<br />
http://www.health.gov.au/internet/main/publishing.nsf/content/health-pubhlth-strateg-phys-actguidelines.<br />
A4.1 Physical activity recommendations for children 0–5 years<br />
The Physical Activity Recommendations for Children 0–5 years state that being physically<br />
active every day is important for the healthy growth and development of infants, toddlers<br />
and preschoolers [850].<br />
<strong>For</strong> infants (birth to 1 year) physical activity—particularly supervised floor-based play in safe<br />
environments should be encouraged from birth.<br />
Before infants begin to crawl, encourage them to be physically active by reaching and<br />
grasping, pulling and pushing, moving their head, body and limbs during daily<br />
routines and supervised floor play, including tummy time. Once infants are mobile,<br />
encourage them to be as active as possible in a safe, supervised and nurturing play<br />
environment.<br />
Toddlers (1 to 3 years) and preschoolers (3 to 5 years) should be physically active every day<br />
for at least three hours, spread throughout the day.<br />
Young children don’t need to do their three hours of physical activity all at once. It<br />
can be accumulated throughout the day and can include light activity like standing up,<br />
moving around and playing as well as more vigorous activity like running and<br />
jumping. Active play is the best way for young children to be physically active.<br />
Children younger than 2 years of age should not spend any time watching television or<br />
using other electronic media (DVDs, computer and other electronic games). <strong>For</strong> children 2<br />
to 5 years of age, these activities should be limited to less than one hour per day.<br />
Television, DVDs and playing computer games usually involve sitting for long<br />
periods—time which could be spent playing active games or interacting with others.<br />
<strong>DRAFT</strong> <strong>Australian</strong> <strong>Dietary</strong> <strong>Guidelines</strong>- December 2011 169
Infants, toddlers and preschoolers should not be sedentary, restrained, or kept inactive, for<br />
more than one hour at a time, with the exception of sleeping.<br />
All children need some ‘down time’ but they are not naturally inactive for long<br />
periods of time. Sitting in strollers, highchairs and car seats (restrained) for long<br />
periods isn’t good for children’s health and development. Try to take regular breaks<br />
on long car trips and walk or pedal for short trips when you can.<br />
While meeting these recommendations may seem like a challenge at times, a brochure that<br />
includes tips and ideas to help you include more activity in your child’s day and further<br />
information on the recommendations can be found at National Physical Activity<br />
Recommendations for Children 0–5 years.<br />
A4.2 Physical activity recommendations for 5–12 year olds<br />
The Physical Activity Recommendations for Children 5–12 years [850] recommend that<br />
children need at least 60 minutes (and up to several hours) of moderate to vigorous<br />
physical activity every day.<br />
Examples of moderate activities are a brisk walk, a bike ride or any sort of active play.<br />
More vigorous activities to make kids ‘huff and puff’ include organised sports such as<br />
football and netball, as well as ballet, running and swimming laps. Children typically<br />
accumulate activity in intermittent bursts ranging from a few seconds to several minutes, so<br />
any sort of active play will usually include some vigorous activity. Most importantly, kids<br />
need the opportunity to participate in a variety of fun activities that suit their interests, skills<br />
and abilities. Variety will also offer your child a range of health benefits, experiences and<br />
challenges.<br />
Children shouldn't spend more than two hours a day using electronic media for<br />
entertainment (for example, computer games, TV, internet), particularly during daylight<br />
hours.<br />
A4.3 Physical activity recommendations for 12–18 year olds<br />
The Physical Activity Recommendations for Children 12–18 years [850] state that:<br />
at least 60 minutes of physical activity every day is recommended. This can build up<br />
throughout the day with a variety of activities<br />
physical activity should be done at moderate to vigorous intensity<br />
for additional health benefits, try to include 20 minutes or more of vigorous activity<br />
that causes young people to ‘huff and puff at least three to four days a week<br />
children shouldn't spend more than two hours a day using electronic media for<br />
entertainment (computer games, TV, internet), particularly during daylight hours.<br />
<strong>DRAFT</strong> <strong>Australian</strong> <strong>Dietary</strong> <strong>Guidelines</strong>- December 2011 170
Suggested activities include:<br />
moderate activities like brisk walking, bike riding with friends skateboarding and<br />
dancing, walking the dog, replacing short car trips with a walk or bike ride<br />
vigorous activities such as football, netball, soccer, running, swimming laps or<br />
training for sport<br />
trying to be active in as many ways as possible – variety is important in providing a<br />
range of fun experiences and challenges and provides an opportunity to learn new<br />
skills.<br />
A4.4 Physical activity guidelines for <strong>Australian</strong> adults<br />
The Physical Activity <strong>Guidelines</strong> for <strong>Australian</strong> Adults [850] make the following<br />
recommendations.<br />
Think of movement as an opportunity, not an inconvenience.<br />
Be active every day in as many ways as possible.<br />
Put together at least 30 minutes of moderate-intensity physical activity on most,<br />
preferably all, days.<br />
If possible, also enjoy some regular vigorous exercise for extra health and fitness.<br />
Moderate-intensity activity will cause a slight, but noticeable, increase in your breathing and<br />
heart rate. A good example of moderate-intensity activity is brisk walking, that is at a pace<br />
where you are able to comfortably talk but not sing. Other examples include mowing the<br />
lawn, digging in the garden, or medium paced swimming or cycling. The guidelines note<br />
that accumulated short bouts of moderate-intensity activity of around 10–15 minutes<br />
without stopping is just as effective as continuous activity of at least 30 minutes per day on<br />
most days of the week, which is the minimum level of activity required for preventing or<br />
improving specific health indicators such as hypertension, heart disease and diabetes in<br />
adults [967]. However, this level of activity appears to be insufficient for preventing weight<br />
gain or weight loss or weight regain in most people [820, 968].<br />
A4.5 Physical activity recommendations for older <strong>Australian</strong>s<br />
The Physical Activity Recommendations for Older <strong>Australian</strong>s [850] indicate that it is never<br />
too late to become physically active and to feel the associated benefits. Most physical<br />
activities can be adjusted to accommodate older people with a range of abilities and health<br />
problems, including those living in residential care facilities.<br />
There are five physical activity recommendations for older <strong>Australian</strong>s.<br />
Older people should do some form of physical activity, no matter what their age,<br />
weight, health problems or abilities.<br />
Older people should be active every day in as many ways as possible, doing a range<br />
of physical activities that incorporate fitness, strength, balance and flexibility.<br />
<strong>DRAFT</strong> <strong>Australian</strong> <strong>Dietary</strong> <strong>Guidelines</strong>- December 2011 171
Older people should accumulate at least 30 minutes of moderate-intensity physical<br />
activity on most - preferably all - days.<br />
Older people who have stopped physical activity, or who are starting a new physical<br />
activity, should start at a level that is easily manageable and gradually build up the<br />
recommended amount, type and frequency of activity.<br />
Older people who have enjoyed a lifetime of vigorous physical activity should carry<br />
on doing so in a manner suited to their capability into later life, provided<br />
recommended safety procedures and guidelines are adhered to.<br />
<strong>DRAFT</strong> <strong>Australian</strong> <strong>Dietary</strong> <strong>Guidelines</strong>- December 2011 172
Appendix 5. Studies examining the<br />
health effects of intake of fruit and<br />
vegetables together<br />
The literature includes studies which have investigated the effect of consumption of fruit and<br />
vegetables together. This evidence clearly confirms the positive health effects of consuming<br />
vegetables and fruits, particularly in reducing the risk of cardiovascular disease, but also in reducing<br />
risk of obesity and some cancers. It is compiled as an Appendix to aid the conciseness of Chapter<br />
2.<br />
A5.1 Cardiovascular disease, type 2 diabetes<br />
and excess weight<br />
There is evidence regarding a probable association between the consumption of each additional<br />
daily serve of fruit and vegetables and reduced risk of coronary heart disease (Grade B, Section 3.1<br />
in the Evidence Report [14]) [145-147, 150, 969].<br />
Similarly, recent evidence supports a probable association between consumption of each additional<br />
daily serve of fruit and vegetables and a reduced risk of stroke (Grade B, Section 3.2 in the<br />
Evidence Report [14]) [145, 146]. Consuming more than five serves of fruit and vegetables a day<br />
was found to reduce the risk of stroke by 26% (fruit serve was 80g and vegetables 77g) [146], and<br />
consuming each additional serve of fruit and vegetables (of average serve size 106g) reduced the<br />
risk of stroke by 5% [145]. These results are consistent with those presented in the literature<br />
reviews to inform the recent review of the <strong>Dietary</strong> <strong>Guidelines</strong> for Americans, 2010 which found that<br />
‘consistent evidence suggests at least a moderate inverse relationship between vegetable and fruit<br />
consumption with myocardial infarction and stroke, with significantly larger, positive effects noted<br />
above five servings of vegetables and fruits per day’ [143].<br />
In the literature reviews to inform the revision of the <strong>Dietary</strong> <strong>Guidelines</strong> for Americans, 2010, the<br />
evidence for an association between increased fruit and vegetable intake and reduced risk of<br />
excess body weight was found to be modest, with a trend towards decreased weight gain over five<br />
or more years in middle adulthood associated with increased fruit and vegetable intake. However<br />
no conclusions could be drawn from the evidence of efficacy of increased fruit and vegetable<br />
consumption in weight loss diets [143]. However, in children and adolescents, the limited body of<br />
evidence from longitudinal studies suggested that greater intakes of fruits and/or vegetables may<br />
protect against increased adiposity [143].<br />
<strong>DRAFT</strong> <strong>Australian</strong> <strong>Dietary</strong> <strong>Guidelines</strong>- December 2011 173
A5.2 Cancer<br />
Lung cancer: The recent body of evidence suggests that consumption of fruit and vegetables is<br />
associated with reduced risk of lung cancer (Grade C, Section 3.5 in the Evidence Report [14])<br />
[970-972].<br />
Colorectal cancer: Recent evidence suggests that there is no association between consumption of<br />
fruit and vegetables together and risk of colorectal cancer (Grade C, Section 3.4 in the Evidence<br />
Report [14]) [177, 202]. In its 2008 report, the International Agency for Research on Cancer<br />
(IARC) also concluded that intakes of fruit and vegetables were either not associated or only<br />
slightly associated with risk of colorectal, breast and prostate cancer [973]. However, recently<br />
published findings from the European Prospective Investigation into Cancer and Nutrition (EPIC)<br />
study suggest that a high consumption of fruit and vegetables is associated with reduced risk of<br />
colorectal cancer, especially of colon cancer, but that the effect may also depend on smoking<br />
status [974].<br />
Ovarian cancer: It is probable that there is no association between consumption of fruit and<br />
vegetables and risk of ovarian cancer (Grade B, Section 3.6 in Evidence Report [14]) [172, 173]. A<br />
more recent meta-analysis has described evidence of a probable inverse relationship between<br />
consumption of vegetables and fruit, and bladder cancer [975]. An insufficient number of studies<br />
were found to produce an evidence statement for an association between the consumption of fruit<br />
and vegetables and renal cancer [976-978].<br />
Epithelial cancer: In general, comparison of the results of systematic reviews of the evidence on<br />
diet and cancer sponsored by the World Cancer Research Fund in 1997 [586] and 2007 [42]<br />
suggests weaker evidence of a protective effect of high intakes of fruits and vegetables against<br />
several common epithelial cancers, with a downgrading of the association from ‘convincing’ to<br />
‘probable.’ This is also consistent with the evidence presented in the International Agency for<br />
Research on Cancer report [979].<br />
Overall cancer: Analyses of prospective studies have generally failed to demonstrate consistent<br />
evidence of a convincing association between the intake of fruits and vegetables and overall risk of<br />
cancers [973]. However the more recent EPIC cohort study found a weak but statistically<br />
significant inverse association between consumption of fruit and vegetables and risk of overall<br />
cancers —a 4% lower incidence of all cancers combined for an increment of 200g total fruit and<br />
vegetable intake per day [980].<br />
It should also be noted that a very weak association between the consumption of fruit and<br />
vegetables as a whole and overall cancer rates is not inconsistent with the evidence of the effects<br />
of fruit and vegetable consumption on site-specific cancers, or the evidence that specific types of<br />
fruit or vegetables may have an effect, particularly on the risk of site-specific cancers, and suggests<br />
<strong>DRAFT</strong> <strong>Australian</strong> <strong>Dietary</strong> <strong>Guidelines</strong>- December 2011 174
that further specific studies are required, particularly those which attempt to account for potential<br />
interactions between tobacco [981] and alcohol [211].<br />
A5.3 Other conditions<br />
Although not sufficient to develop evidence statements, individual studies found an association<br />
between other health conditions and consumption of fruit and vegetables. These include:<br />
decreased risk of high blood pressure [982]<br />
decreased risk of dementia [317]<br />
decreased risk of head and neck cancer [983]<br />
decreased risk of various upper digestive tract cancers [44, 864, 984-986]<br />
decreased risk of prostate cancer [229, 987]<br />
obesity [988, 989].<br />
Although not sufficient to develop evidence statements, individual studies found no evidence an<br />
association between consumption of fruit and vegetables and pancreatic cancer [585, 990, 991].<br />
<strong>DRAFT</strong> <strong>Australian</strong> <strong>Dietary</strong> <strong>Guidelines</strong>- December 2011 175
Appendix 6. Alcohol and energy intake<br />
Table A6.1 Median percentage of contribution of alcohol to energy intake per consumer<br />
Age groups<br />
16-18 y 19-24 y 25-44 y 45-64 y ≥65 y<br />
Male (%) 4.2 7.7 9.2 9.5 9.0 9.1<br />
Female (%) 4.9 9.0 8.4 7.5 7.4 8.1<br />
Source: National Nutrition Survey 1995 [47]<br />
≥19y and<br />
over<br />
<strong>DRAFT</strong> <strong>Australian</strong> <strong>Dietary</strong> <strong>Guidelines</strong>- December 2011 176
Table A6.2 Energy and alcohol content of common alcoholic drink serves<br />
Drink type Serve size<br />
Beer, regular (4.5–<br />
4.9% alcohol)<br />
Beer, medium–light<br />
(3.7% alcohol)<br />
Beer, light (2.1%<br />
alcohol)<br />
Wine (average of dry<br />
white and red)<br />
1 can/stubby<br />
(375mL)<br />
1 can/stubby<br />
(375mL)<br />
1 can/stubby<br />
(375mL)<br />
Energy<br />
(kJ/serve)<br />
Alcohol<br />
(g/serve)a<br />
568 15.4 1½<br />
546 14.0 1<br />
395 8.0 ½<br />
1 glass (100mL b) 340 – 395 9.5 1<br />
Spirits 1 nip (30mL) 255 8.8 1<br />
Pre-mixed spirits 1 can (375mL) 1182 13.9 1½<br />
a. Using 1995 National Nutrition Survey data [44]<br />
Standard<br />
drink<br />
equivalent<br />
b. Note a glass of wine is usually more than 100mL, i.e. more than one standard drink.<br />
<strong>DRAFT</strong> <strong>Australian</strong> <strong>Dietary</strong> <strong>Guidelines</strong>- December 2011 177
Appendix 7. Equity and the social<br />
determinants of health and nutrition<br />
status<br />
A7.1 Introduction<br />
The World Declaration on Nutrition (1992) states that ‘access to nutritionally adequate and safe<br />
food is a basic individual right’ [992]. Australia is fortunate to have an abundant and safe food<br />
supply. Life expectancy and health status are relatively high [12, 26, 44]. <strong>Australian</strong>s are generally<br />
literate and have good access to health and nutrition information and sufficient education to make<br />
informed food choices [993].<br />
However, there are differences in health and wellbeing between groups of <strong>Australian</strong>s. People in<br />
lower socioeconomic groups have shorter life spans and poorer health. They have higher rates of<br />
death and disease, are more likely to be hospitalised and are less likely to use specialist and<br />
preventative health services [994]. As in other countries, there is a socioeconomic gradient<br />
whereby health status generally improves the higher a person is up the socioeconomic ladder [26].<br />
The determinants of health inequities are largely outside the health system and reflect the<br />
distribution of social, economic and cultural resources and opportunities [27, 28, 992, 994].<br />
Employment, income, education, cultural influences, lifestyle, language, sex and other genetic<br />
differences, geographic, social or cultural isolation, age and disability, the security and standard of<br />
accommodation, and the availability of facilities and services, all influence diet, health and<br />
nutritional status [27, 28].<br />
The relationship between these factors and health status is complex and it is often difficult to<br />
determine the nature and direction of causal relationships [27, 28]. <strong>For</strong> example, those on higher<br />
incomes tend to have greater opportunity to attain higher levels of education and afford housing in<br />
higher socioeconomic areas with better access to goods and services (for example, health<br />
services, transport, shops including food outlets) that support healthy lifestyles. Lower levels of<br />
education and/or an individual’s poor health status can limit opportunities for employment and<br />
therefore income and access to other goods and services, including nutritious food [27, 28].<br />
While higher education can improve health literacy, just because a person can understand healthy<br />
lifestyle and nutrition information does not mean they can or will act on it. <strong>For</strong> example, one<br />
<strong>Australian</strong> study of people 16 years and older found that, although 80% and 35% of people knew<br />
the recommended daily intake of fruit and vegetables respectively, only 56% and under 10% met<br />
these respective recommendations [26].<br />
<strong>DRAFT</strong> <strong>Australian</strong> <strong>Dietary</strong> <strong>Guidelines</strong>- December 2011 178
The economic, social and cultural factors that influence health inequities also influence the ability<br />
of an individual to choose nutritious foods consistent with dietary guidelines [14]. The ability of<br />
parents and carers to make nutritious food choices is likely to affect their family’s nutrition status<br />
too.<br />
Factors associated with complying with dietary guidelines include being female, older age, higher<br />
socioeconomic status, with higher education and having nutrition knowledge [43, 138, 858, 995-<br />
1011].<br />
Conversely, lower socioeconomic status and lower educational attainment are barriers to<br />
complying with dietary guidelines, and lower socioeconomic groups perceive cost as a barrier to<br />
healthy food purchase [43, 138, 858, 995-1011].<br />
In a Melbourne study it was found that areas of greater socio-economic advantage had closer<br />
access to supermarkets, whereas areas of less socio-economic advantage had closer access to fast<br />
food outlets [137].<br />
A greater understanding of the barriers to consuming a nutritious diet will help ensure that<br />
appropriate messages, education and public health strategies are developed for groups who<br />
experience a greater burden of diet-related disease. It was essential that the social determinants of<br />
health and nutrition status were considered in the <strong>Guidelines</strong> so as to reduce the risk of adding to<br />
health inequities, for example, by promoting consumption of expensive or hard to access foods.<br />
A7.2 Social distribution of diet-related health<br />
outcomes<br />
In 2002–06 the death rate for people between 15 and 64 years was 70% higher in the lowest SES<br />
group than the highest SES group [26]. These rates reflect the higher prevalence of type 2 diabetes<br />
and cardiovascular disease among people living in the lowest SES group [12, 26].<br />
Gradients in risk factor prevalence are also apparent across quintiles of social disadvantage as<br />
defined by socio-economic indexes for areas (SEIFA). The SEIFA assesses the relative social<br />
disadvantage of respondents by the economic resources, education and occupation patterns of<br />
their area of residence [26]. Overweight and obesity rates are also highest among the lower SES<br />
areas, although there was not a clear gradation across SEIFA quintiles [26]. Some of the factors<br />
that contribute to the development of overweight are also related to equity, particularly the social,<br />
cultural and economic barriers and enablers to healthy food choices (see Chapter 2). There is also<br />
a social gradient in physical activity levels; self-reported ‘sedentary’ behaviour rises from 25% of<br />
people in the highest SES areas to 44% in the lowest SES areas [26].<br />
<strong>DRAFT</strong> <strong>Australian</strong> <strong>Dietary</strong> <strong>Guidelines</strong>- December 2011 179
A7.3 Social distribution of food intake and<br />
nutrition status<br />
Socioeconomic factors have a large impact on food and nutrient intakes and food purchasing<br />
decisions and patterns [858], and there is clear evidence of a social gradient for the distribution of<br />
diet-related chronic disease. Yet evidence for a social gradient related to specific foods - rather<br />
than overall dietary patterns - is less clear.<br />
Two recent systematic reviews assessed the impact of dietary interventions relative to social<br />
disadvantage [1012] and determinants of healthy eating for those with low income [1013]. They<br />
found that economic and cultural influences impact on consumption of specific foods or food<br />
groups. While nutrition interventions can have greater impact in higher socioeconomic areas and<br />
non-ethnic groups, they do not have a detrimental impact in low socioeconomic groups [1012,<br />
1013].<br />
Those with the least disposable income are at the greatest risk of poor nutrition as households<br />
vulnerable to poverty spend less per person on food but a greater proportion of their total<br />
expenditure on food [1014]. Analysis of <strong>Australian</strong> household food expenditure data suggests that<br />
a substantial proportion of the population is severely restricted in its capacity to make nutritious<br />
food choices and to achieve a healthy diet [1015].<br />
A7.3.1 Economics of food choice<br />
There is a growing body of research which indicates that food groups with more favourable<br />
nutrient profiles are more expensive. The ‘economics of food choice’ theory states that people’s<br />
dietary decisions, when made within the context of sustained budgetary constraints, are driven by<br />
maximising energy value for money (dollars per megajoule [$/MJ]), resulting in energy-dense,<br />
nutrient-poor diets [730, 806]. <strong>For</strong> instance, meat, fruit and vegetables food groups have the<br />
highest nutritional quality however are usually associated with highest costs, while sweets and<br />
salted snacks have the lowest nutritional quality but are an inexpensive source of dietary energy<br />
[730, 806, 859, 1016]. Although high-quality nutrition is known to protect against chronic diseases,<br />
energy-dense, nutrient-poor foods costs considerably less than nutrient-rich foods [728].<br />
The costs of healthy (low energy-density, high nutrient density) foods are reported to be<br />
increasing in Australia in comparison with higher energy density, lower nutrient density food. Over<br />
six years from 2000 to 2006 the Consumer Price Index for food in Brisbane increased by 32.5%<br />
while the cost of a standard basket of healthy food increased approximately 50% across<br />
Queensland [140].<br />
<strong>DRAFT</strong> <strong>Australian</strong> <strong>Dietary</strong> <strong>Guidelines</strong>- December 2011 180
A diet consistent with the <strong>Guidelines</strong> is expensive for welfare-dependent families. An <strong>Australian</strong><br />
study found it cost around 40% of their disposable income compared with 20% for families on the<br />
average income [138].<br />
A7.3.2 Food security<br />
Food security refers to the ability to access nutritious, affordable foods and the capacity to obtain<br />
them. At an individual or family level, food insecurity can be characterised by running out of food<br />
and being unable to afford to buy more. About 5% of the <strong>Australian</strong> population suffer food<br />
insecurity in a year [1017-1019]. It is more common among:<br />
the unemployed [1019]<br />
Indigenous <strong>Australian</strong>s [1020]<br />
those living in single parent households [1019]<br />
those in the second lowest income quintile [1019]<br />
those living in rental households [1019]<br />
younger than older people [1019]<br />
women than men (in some surveys but not others) [1017, 1018].<br />
Issues of food security in the face of rising food costs are of concern in Australia [140] (see<br />
Section A7.3.1). <strong>For</strong> example, national Consumer Price Index data for the March 2011 quarter<br />
indicates that the cost of food had increased by 2.9% and that, primarily due to impacts of flooding<br />
in Queensland and Victoria and Cyclone Yasi in Queensland, the cost of fruit increased by 14.5%<br />
and the cost of vegetables increased by 16.2% [1021].<br />
There is an urgent need to nationally monitor and sustainably address the factors affecting the<br />
price of nutritious foods, particularly for vulnerable groups who suffer a disproportionate burden<br />
of poor health [140].<br />
A7.3.3 Social distribution of intake of foods and nutrients<br />
A7.3.3.1 Foods<br />
The 1995 National Nutrition Survey [37] showed few systematic differences in food and nutrient<br />
intake across quintiles of social disadvantage, as defined by SEIFA based on the 1991 census. Table<br />
A7.1 shows the intake of various food groups across SEIFA quintiles from the NNS 1995.<br />
<strong>DRAFT</strong> <strong>Australian</strong> <strong>Dietary</strong> <strong>Guidelines</strong>- December 2011 181
Table A7.1 Mean daily intakes (g/day)from various food groups: people aged 19 years<br />
and over, by SEIFA quintile 2<br />
(grams per day)<br />
First quintile Fifth quintile<br />
(most Second Third Fourth (least<br />
Food group disadvantaged) quintile quintile quintile disadvantaged)<br />
Cereal & cereal products 196 222 203 217 232<br />
Cereal-based products & dishes 113 115 130 135 136<br />
Fruit products & dishes 126 147 141 143 156<br />
Vegetable products & dishes 264 258 260 262 251<br />
Legumes & pulses 9.8 7.9 10.8 9.5 10.7<br />
Milk products & dishes 281 284 285 292 301<br />
Meat, poultry, game 149 163 164 155 158<br />
Fish & seafood 22 24.5 26.3 25.8 28.8<br />
Egg products & dishes 16 15 16 13 19<br />
Snack foods 3.2 3.0 4.2 3.3 3.9<br />
Sugar products & dishes 20 21 20 18 17<br />
Confectionery 7.8 9.2 8.3 9.3 9.1<br />
Seeds & nuts 3.6 4.1 5.2 4.0 4.8<br />
Fats & oils 12 13 13 12 11<br />
Soup 53 62 55 48 57<br />
Savoury sauces & condiments 30 30 28 30 29<br />
Non-alcoholic beverages 2001 2005 1978 2007 1938<br />
Alcoholic beverages 239 254 273 270 234<br />
The key findings were as follows.<br />
Consumption of fruit and fruit products was lower (10–20%) in the most disadvantaged<br />
group compared with the other four groups, but vegetable and legume consumption<br />
showed no consistent trend across the groups. This may be difficult to interpret as potato<br />
chips were included within this category.<br />
Consumption of milk and milk products increased slightly with social advantage—about a<br />
10% increase across the groups.<br />
Consumption of meat, poultry and game was slightly higher in the middle quintiles.<br />
Fish and seafood consumption increased with social advantage – this was thought to be due<br />
to better access to seafood in coastal areas where cities are located, and the higher price<br />
of seafood products compared to other foods [37]).<br />
Consumption of sugar products and dishes tended to decrease with social advantage.<br />
Consumption of cereals and cereal-based foods (for example, rice, pasta and breads) was<br />
lower in the most disadvantaged group and the middle group compared with all other<br />
groups. Consumption of cereal-based products and dishes (for example, cakes and biscuits)<br />
was about 20% lower in the two most disadvantaged groups compared with the other<br />
three [1022].<br />
<strong>DRAFT</strong> <strong>Australian</strong> <strong>Dietary</strong> <strong>Guidelines</strong>- December 2011 182
In other more recent studies, higher occupation level is associated with consumption of cheese<br />
and skim milk and higher education level is associated with consumption of cheese. There is also a<br />
significant positive relationship between skim milk consumption and occupation level based on<br />
four individual studies [1023].<br />
A7.3.3.2 Nutrients<br />
An assessment of energy and nutrient intakes across the SEIFA quintiles showed that energy intake<br />
increased with social advantage, as did intakes of most nutrients [1022]. However, when<br />
correcting for energy differences across groups, few differences were apparent in dietary quality,<br />
defined as nutrient intake per unit energy. Social advantage as indicated by SEIFA was positively<br />
associated with higher nutrient densities for iron, zinc, magnesium and potassium and with intake<br />
of intrinsic sugars but inversely associated with energy from fat [37].<br />
It is unclear from the published data whether other factors, such as the age profile, differed<br />
across the quintiles of disadvantage and how much variation in factors such as age (which are<br />
known to influence total food intake) might account for the differences that were apparent (for<br />
example, in total energy intake). Physical activity may also vary across quintiles.<br />
Neither is it clear whether these relatively small differences in nutrient profiles could explain a<br />
significant proportion of the variation in the health profiles across the groups. In interpreting<br />
the data set, however, it should be borne in mind that a relatively crude, area-based measure of<br />
social disadvantage was used. It is also possible that many of the most disadvantaged individuals<br />
in the community did not take part in the survey.<br />
<strong>DRAFT</strong> <strong>Australian</strong> <strong>Dietary</strong> <strong>Guidelines</strong>- December 2011 183
Table A7.2 Mean daily intakes of energy and nutrient densities: people aged 19 years<br />
and over, by SEIFA quintile 1<br />
First quintile Fifth quintile<br />
(most Second Third Fourth (least<br />
Food group disadvantaged) quintile quintile quintile disadvantaged)<br />
Energy (MJ) 8.82 9.18 9.37 9.31 9.45<br />
Nutrient density<br />
(per 10MJ energy)<br />
Protein (g) 98.2 98.4 98.5 98.6 99.4<br />
Fat (g) 89.8 90.7 91.1 88.9 88.8<br />
Saturated (g) 35.7 35.5 36.0 35.2 35.0<br />
Mono-unsaturated (g) 32.5 32.8 33.4 32.4 32.3<br />
Polyunsaturated (g) 13.5 13.5 13.9 13.4 13.4<br />
Cholesterol (mg) 332 331 332 319 305<br />
Total carbohydrate (g) 276 277 272 276 277<br />
Sugars (g) 128 125 123 124. 123<br />
Starch (g) 147 150 148 151 152<br />
Fibre (g) 24.4 24.4 24.9 25.2 25.6<br />
Alcohol (g) 13.4 13.3 14.3 14.6 13.8<br />
Vitamin A (g) 1280 1299 1236 1218 1329<br />
Thiamin (mg) 1.81 1.74 1.81 1.83 1.80<br />
Riboflavin (mg) 2.27 2.18 2.24 2.25 2.22<br />
Niacin (mg) 45.8 45.9 45.6 45.5 45.9<br />
Folate (g) 289 286 299 272 292<br />
Vitamin C (mg) 132 131 130 135 142<br />
Calcium (mg) 907 888 900 926 945<br />
Phosphorus (mg) 1626 1631 1630 1654 1673<br />
Magnesium (mg) 353 356 354 361 366<br />
Iron (mg) 15.1 15.0 15.3 15.4 15.6<br />
Zinc (mg) 12.9 13.07 12.8 13.0 13.3<br />
Potassium (mg) 3541 3495 3507 3528 3551<br />
Because inadequate nutritional status is part of the vicious cycle of malnutrition and infection,<br />
higher prevalence of under-nutrition in lower socio-economic groups further contributes to the<br />
incidence, severity and case fatality of childhood illnesses [871] and incidence of chronic disease in<br />
later life.<br />
<strong>DRAFT</strong> <strong>Australian</strong> <strong>Dietary</strong> <strong>Guidelines</strong>- December 2011 184
A7.4 Aboriginal and Torres Strait Islander<br />
peoples<br />
A7.4.1. Diet-related health outcomes<br />
Aboriginal and Torres Strait Islander people in Australia suffer significant health inequities<br />
compared with the broader community. Aboriginal and Torres Strait Islander people typically die<br />
at much younger ages and are more likely to experience ill health, disability and reduced quality of<br />
life [1020]. Poor nutrition is a major risk factor for many of the diseases with higher prevalence<br />
among Aboriginal and Torres Strait Islander groups and it has been estimated that 19% of the<br />
national Indigenous burden of disease is attributable to poor diet [1024].<br />
Socioeconomic disadvantage underlies many of these health statistics [1025]. Compared with non-<br />
Indigenous <strong>Australian</strong>s, Aboriginal and Torres Strait Islanders report lower incomes, higher rates<br />
of unemployment, lower educational attainment, more overcrowded and inadequate housing<br />
[1026], higher rates of incarceration and limited access to transport [26]. Disrupted family and<br />
community cohesion, social marginalisation, stress, lack of control over circumstances, and<br />
discrimination and racism are also apparent [30, 1025].<br />
Overweight and obesity are common [30, 855]. Measured anthropometric data for Aboriginal and<br />
Torres Strait Islanders are unavailable, however less reliable self-reported data indicated that more<br />
than half of Aboriginal and Torres Strait Islander people aged 15 years and over were overweight<br />
or obese [1027].<br />
Under-nutrition among young children and relatively poor growth from around six months of age<br />
persists in some parts of Australia [1028-1031].<br />
Vitamin and mineral status has been measured infrequently in Aboriginal and Torres Strait Islander<br />
populations [30]. Multiple deficiencies have frequently been described in the same subject,<br />
suggesting the generally poor nutritional status of such individuals, rather than a specific micronutrient<br />
problem. In particular, vitamin status (in relation to folate, ascorbic acid and betacarotene)<br />
consistent with low intakes of fruit and vegetables have often been described [8, 134].<br />
More recently iodine deficiency in an Aboriginal birth cohort in the Northern Territory [1032]<br />
and low vitamin D status in a South <strong>Australian</strong> Aboriginal population [1033] have been found.<br />
A7.4.2 Food intake, diet and nutritional status<br />
All the available evidence suggests that, traditionally, Aboriginal and Torres Strait Islanders were fit<br />
and healthy. The traditional diet appears to have been low in energy density but high in nutrient<br />
density—high in protein, low in sugars, high in complex carbohydrate, and high in micro-nutrients.<br />
Energy expenditure appears to have been high [30, 1034-1038].<br />
<strong>DRAFT</strong> <strong>Australian</strong> <strong>Dietary</strong> <strong>Guidelines</strong>- December 2011 185
With the transition from a traditional hunter-gather lifestyle to a settled Westernised existence,<br />
Aboriginal and Torres Strait Islander people’s diet has generally changed to an energy-dense diet<br />
that is high in fat and added sugars [855, 1037, 1038]. The diet is also poor in fibre and certain<br />
nutrients including folate, retinol, vitamin E and other vitamins [134].<br />
In 2004-2005, 24% of Aboriginal and Torres Strait Islander people aged 15 years and over<br />
reported they ran out of food in the last 12 months, compared to 5% of non-Indigenous<br />
<strong>Australian</strong>s [1020]. While Aboriginal and Torres Strait Islander people living in remote areas were<br />
more likely to report having run out of food in the last 12 months (36%), this figure was also high<br />
for those in non-remote areas (20%) and ranged from 18% in NSW to 45% in the Northern<br />
Territory[1020]. Women are at extra risk, partly because there is a cultural predisposition for<br />
women to feed men and children before themselves [993]. Psychological suffering due to food<br />
insecurity can exacerbate feelings of exclusion, social disruption to family life and in some cases,<br />
anxiety about possible loss of custody of children [1039].<br />
There is very little recent dietary and nutrition data available for Aboriginal and Torres Strait<br />
Islander communities. Self-reported intakes of fruit and vegetables described in the 2004–05<br />
NATSIHS are much higher than would be expected from more reliable, objective data [8, 134,<br />
135, 232].<br />
A7.4.3.1 Aboriginal people living in remote communities<br />
<strong>Dietary</strong> intakes in remote Aboriginal communities have been consistently measured to be high in<br />
refined carbohydrates and low in fresh fruit and vegetables [134, 135, 232]. Foods with high<br />
energy density were associated with lower costs, contributing disproportionately to energy<br />
availability and limiting the capacity of people living in these communities to attain a healthy diet<br />
[135, 1040]. Food supply is an ongoing issue [1040] with people in rural and remote areas paying<br />
at least 30% more for basic nutritious foods than people living in urban and metropolitan areas<br />
[140, 1041-1046]. Basic food items are less available in the more remote stores, as are fresh<br />
vegetables and fruits and better nutritional choices [140]. The quality of dietary intake has been<br />
shown to vary in close association with the income cycle in remote Aboriginal communities [1047,<br />
1048].<br />
In some communities purchased food intake is supplemented by procurement of traditional foods.<br />
In the 1994 National Aboriginal and Torres Strait Islander Survey - the last time these questions<br />
were asked - 10% of respondents aged over 14 years reported spending more than one hour a<br />
week hunting or foraging for traditional foods and, of these, more than half reported spending<br />
more than five hours a week doing so [1015]. Even though the actual intake of traditional foods<br />
may be low in some areas, traditional foods are still popular and culturally important for Aboriginal<br />
and Torres Strait Islander peoples [8, 1041, 1049-1051].<br />
<strong>DRAFT</strong> <strong>Australian</strong> <strong>Dietary</strong> <strong>Guidelines</strong>- December 2011 186
A7.4.3.2. Aboriginal people living in urban areas<br />
Only limited dietary data are available for Aboriginal and Torres Strait Islander groups in urban<br />
areas. High food costs, poor access to nutritious foods, convenience of take-away foods, budgeting<br />
issues, overcrowding, and poor knowledge and skills have been identified as barriers to healthy<br />
eating in these areas and can lead to food insecurity and overconsumption of energy-dense<br />
nutrient-poor foods and drinks [1039, 1052-1054].<br />
A7.4.3.3 Recommendations specific to Aboriginal and Torres Strait<br />
Islander <strong>Australian</strong>s<br />
The general <strong>Australian</strong> dietary guidelines are relevant to Aboriginal and Torres Strait Islander<br />
peoples [135, 232, 1055-1058]. In particular, increased consumption of vegetables and fruits could<br />
be expected to improve the health and nutritional status of Aboriginal and Torres Strait Islander<br />
people.<br />
Lactose intolerance after the age of three to five years may, however, be problematic in some<br />
areas or for some individuals [421, 422]. Alternative calcium sources such as chewing meat and<br />
fish bones, and consumption of small, soft fish bones (for example, in tinned salmon), and lowlactose<br />
dairy foods (such as matured cheese and yoghurt) are recommended in these cases.<br />
Consumption of traditional bush foods should be supported wherever possible, although intake of<br />
some high saturated fat marine animal foods, such as dugong, should be limited, as was the case<br />
traditionally[1059]. In addition, there may be a problem with high levels of heavy metals in the<br />
organ meat of turtle and dugong [1060].<br />
As with other population groups, it is important to encourage and support breastfeeding, to<br />
ensure that children and adolescents receive sufficient nutritious food to grow and develop<br />
normally, and to ensure that the growth of young children is checked regularly.<br />
Aboriginal and Torres Strait Islander people would benefit from:<br />
eating traditional foods whenever possible<br />
when choosing store foods, choosing those most like traditional bush foods, such as fresh<br />
plant foods, wholegrain cereal foods, seafoods, and lean meat and poultry.<br />
A7.5 Women<br />
Where women are household heads in less advantaged urban and rural areas, there is increased<br />
risk of poverty, illiteracy and ill health [27, 28, 871].<br />
Women are particularly subject to anaemia between puberty and menopause because of folate or<br />
iron deficiency, and after menopause to osteoporosis and breast cancer. Pregnancy and lactation<br />
<strong>DRAFT</strong> <strong>Australian</strong> <strong>Dietary</strong> <strong>Guidelines</strong>- December 2011 187
have an associated nutrition risk due to increased nutrient requirements. Maternal nutritional<br />
status is a major determinant of foetal and infant nutritional status.<br />
A7.6 Infants and children<br />
Children, particularly those under five, are particularly susceptible to socioeconomic inequalities<br />
that lead to marked differentials in health and nutrition. There is a clear association between the<br />
wealth of the environment the child grows up in, including socioeconomic indicators such as<br />
maternal education, and family income [871]. According to the 2005–06 NSW Population <strong>Health</strong><br />
Survey, exclusive breastfeeding of children at six months of age was significantly lower for infants<br />
with mothers without tertiary qualifications (13%) compared with for those with tertiary<br />
qualifications (25%); mothers living in the lowest socioeconomic status (SES) areas (11%)<br />
compared with those in the highest SES areas (26%); and mothers aged younger than 25 years<br />
(9%) compared with mothers aged 25 years and over (17%) [864]. Further information is also<br />
available in the revised Infant Feeding <strong>Guidelines</strong> for <strong>Health</strong> Workers [133].<br />
A7.7 Older people<br />
The <strong>Dietary</strong> <strong>Guidelines</strong> are not for the frail elderly and reducing food components such as fat, salt<br />
and sugar which may make food more palatable are not always applicable to this population. Living<br />
alone, as many older adults do, has been associated with a poorer, less varied diet. 4 Older people<br />
often rely on pensions and have increasing difficulty with transport and communication, access to<br />
facilities, and preparation of food. Ill health and poor dentition can also compromise nutritional<br />
status. As the population continues to age, the demand for residential, respite and day-care<br />
services for the elderly has increased.<br />
A7.8 People born overseas<br />
Many migrants enjoy health that is as good as, if not better than, that of the <strong>Australian</strong>-born<br />
population [26]. This could be partly because migrants are selected for their health status, or<br />
because, in some cases, they are less likely to be exposed to risk factors for non-communicable<br />
disease before they arrive in Australia. However there is a small proportion of the migrant<br />
population, such as refugees, who experience poorer health than other <strong>Australian</strong>s due to<br />
socioeconomic and political factors [26].<br />
4 Note that the <strong>Guidelines</strong> do not apply for the frail elderly or for residents of aged care institutions.<br />
<strong>DRAFT</strong> <strong>Australian</strong> <strong>Dietary</strong> <strong>Guidelines</strong>- December 2011 188
Mortality rates for people born overseas are generally lower than for people born in Australia, but<br />
the causes of mortality differ depending on country of birth, with some migrants experiencing<br />
higher mortality rates for particular conditions than <strong>Australian</strong>-born people. The prevalence of<br />
diet-related diseases also varies in different migrant groups. <strong>For</strong> example, diabetes is more<br />
prevalent among those born in Germany, Greece, India, Italy, Lebanon and Poland, and coronary<br />
heart disease is more prevalent among those born in Poland [26].<br />
The prevalence of health risk factors also varies depending on country of birth. People from<br />
South-East Asia are less likely than <strong>Australian</strong>-born people to smoke, drink alcohol at risky or<br />
high-risk levels and be overweight or obese. In contrast, people from Oceania, United Kingdom<br />
and southern and eastern Europe are more likely to be overweight or obese than those born in<br />
Australia [26].<br />
The health of migrants approaches the health of the local population over time, as migrants’ habits<br />
and lifestyles move towards those of the wider <strong>Australian</strong> community. Food habits may change out<br />
of choice, because of the limited availability of traditional and familiar foods, or because of change<br />
in economic circumstances in Australia. Similarly, financial and language difficulties may affect<br />
access to education and employment opportunities which then affects income, health and nutrition<br />
literacy, and access to nutritious foods. Some migrants experience disadvantages such as social<br />
isolation and poor housing, which can affect access to safe food and safe preparation of food, and<br />
are generally in a relatively vulnerable position in their new environments, regardless of the type of<br />
migration [871].<br />
A7.9 Rural and remote <strong>Australian</strong>s<br />
Mortality rates increase as remoteness increases [26]. People living outside major cities are more<br />
likely to have high blood pressure, high cholesterol and report drinking at risky or high-risk levels.<br />
They were also more likely to be classified as overweight or obese. However rates of some<br />
cancers decrease slightly with remoteness [26].<br />
Underlying factors contributing to increased health risk include the lower levels of education,<br />
income and employment of many rural communities, occupation risks from farm or mining work,<br />
greater levels of smoking and alcohol abuse, less access to health services and staff, and the<br />
hazards of driving over long road distances. Among specific dietary factors, people living outside<br />
major cities were less likely to eat too few vegetables but more likely to have insufficient fruit<br />
intake [26].<br />
In Australia, the cost of a basket of nutritious foods has been consistently found to be at least 30%<br />
higher in remote areas compared to capital cities [140, 1031, 1041, 1043-1046]. Among the most<br />
remote communities, costs are highest in those areas greater than 2000km from capital cities,<br />
suggesting prices are influenced markedly by transport costs [140].<br />
<strong>DRAFT</strong> <strong>Australian</strong> <strong>Dietary</strong> <strong>Guidelines</strong>- December 2011 189
The availability of nutritious foods is limited in regional and remote areas in northern Australia<br />
[140, 1031, 1041, 1043-1046]. But even in south west Victoria, people living in more remote<br />
towns without a major supermarket faced limited availability of healthy food basket items [1019].<br />
In NSW, the variety of fruit and vegetables available also decreases with remoteness and also with<br />
decreasing socioeconomic status of the community [1061].<br />
<strong>DRAFT</strong> <strong>Australian</strong> <strong>Dietary</strong> <strong>Guidelines</strong>- December 2011 190
Appendix 8: Glossary<br />
Adequate Intake (AI)<br />
The average daily nutrient intake level based on observed or experimentally-determined<br />
approximations or estimates of nutrient intake by a group (or groups) of apparently healthy<br />
people that are assumed to be adequate. An AI is set when there is inadequate evidence to<br />
support setting an RDI.<br />
Adolescents<br />
<strong>For</strong> the purposes of these <strong>Guidelines</strong>, an adolescent is someone aged 12 to 18 years. A marked<br />
increase in the rate of growth and development during adolescence increases the need for most<br />
nutritents including energy, protein, vitamins and minerals.<br />
Allium vegetables<br />
Vegetables derived from a bulbous plant having an onion odour, including garlic, leeks, shallots,<br />
chives and onion.<br />
Anaemia<br />
There are several forms of anaemia. Microcytic anaemia (referring to small red blood cells) is a<br />
deficiency of red blood cells or their haemoglobin, often, but not always, related to iron deficiency.<br />
Macrocytic anaemia (referring to large red blood cells) is prevalent in some groups (such as<br />
Aboriginal and Torres Strait Islander people) and may in some cases be associated with<br />
deficiencies of other nutrients, especially folate and vitamin B12.<br />
Body mass<br />
Body mass and body weight are often used interchangeably to describe the weight of a person’s<br />
body.<br />
Body mass index (BMI)<br />
An index calculated by dividing the weight of an individual (in kilograms) by the square of their<br />
height (in metres), BMI is a simple estimate of the body fatness of a human being who does not<br />
have abnormal physical characteristics. The World <strong>Health</strong> Organization and the US National<br />
<strong>DRAFT</strong> <strong>Australian</strong> <strong>Dietary</strong> <strong>Guidelines</strong>- December 2011 191
Institutes of <strong>Health</strong> have recommended that an operational definition of overweight be a BMI of at<br />
least 25kg/m 2 and obesity as a BMI of at least 30kg/m 2 .<br />
A large number of anthropometric measurements and indices have been proposed for assessing<br />
and monitoring levels of obesity. Methods used in research studies to measure the percentage of<br />
body fat are not practical for regular clinical and community use.<br />
Table A8.1 Body mass index classification (WHO)<br />
Classification (WHO) BMI (kg/m 2 )<br />
Underweight < 18.5<br />
Normal range 18.5 – 24.9<br />
Pre-obese (overweight) 25.0 – 29.9<br />
Obese class I 30.0 – 34.9<br />
Obese class II 35.0 – 39.9<br />
Obese class III > 40.0<br />
Body weight<br />
See body mass.<br />
Brassica vegetables<br />
Vegetables from the brassica or crucifer family, collectively known as cabbages or mustards and<br />
including broccoli, cabbage and brussel sprouts.<br />
Breads<br />
Refers to leavened and unleavened wholemeal, white, mixed-grain, rye and fruit breads, as well as<br />
rolls, bagels, English muffins, crispbreads, crumpets and low-fat crackers.<br />
<strong>DRAFT</strong> <strong>Australian</strong> <strong>Dietary</strong> <strong>Guidelines</strong>- December 2011 192
Carbohydrates<br />
Carbohydrates are polyhydroxy aldehydes, ketones, alcohols, acids, their simple derivatives, and<br />
their polymers with linkages of the acetal type. They can be classified according to their degree of<br />
polymerisation and can be divided initially into three principal groups—sugars, oligosaccharides<br />
and polysaccharides. Carbohydrates are the least concentrated form of energy providing 16<br />
kilojoules per gram.<br />
Cereals<br />
Refers to the entire class of cereal/grain foods, including whole or partially processed cereal grains<br />
(for example, rice, oats, corn and barley), breads, cereals, rice, pasta, noodles, polenta, couscous,<br />
oats, quinoa and barley. It excludes cereal or grain-based products with a significant amount of<br />
added fat and sugar, such as cakes, pastries, and biscuits.<br />
Children<br />
<strong>For</strong> the purposes of these <strong>Guidelines</strong>, children are defined as toddlers aged 1 to 2 years,<br />
preschoolers aged 3 to 5 years and primary school age 6 to 11 years.<br />
It is important for children to receive a nutritious diet which includes all the nutrients they need<br />
to grow and develop normally.<br />
Cholesterol<br />
Cholesterol, chemically a sterol, occurs in all the cell membranes of land animals. Brains and egg<br />
yolks are very rich in it, oils and fats from plants never contain it. <strong>Eat</strong>ing cholesterol does not<br />
necessarily increase cholesterol in human blood plasma because when it is absorbed the liver<br />
tends to reduce its own endogenous cholesterol synthesis. About half the body’s cholesterol is<br />
made in the body from acetate.<br />
Complementary foods<br />
Any food—manufactured or locally prepared—that is suitable as a complement to breastmilk or<br />
infant formula when either becomes insufficient to satisfy an infant’s nutritional requirements.<br />
<strong>DRAFT</strong> <strong>Australian</strong> <strong>Dietary</strong> <strong>Guidelines</strong>- December 2011 193
Core food groups<br />
This was a concept of the previous modeling system and included foods that formed the basis of a<br />
healthy diet, based on or developed with reference to Recommended Daily Intakes (RDIs) and the<br />
<strong>Guidelines</strong>.<br />
Cruciferous vegetables<br />
See brassica vegetables.<br />
Dairy Food<br />
See milks, yoghurts and cheeses.<br />
Discretionary foods<br />
This includes foods and drinks not necessary to provide the nutrients the body needs, but may add<br />
variety. However, many of these are high in saturated fats, sugars, salt and/or alcohol, and are<br />
therefore described as energy dense. They can be included sometimes in small amounts by those<br />
who are physically active, but are not a necessary part of the diet.<br />
Foods in this category include cakes, biscuits; confectionary, chocolate; pastries, pies; ice<br />
confections, butter, cream, and spreads which contain predominantly saturated fats; potato chips,<br />
crisps and other fatty or salty snack foods; sugar-sweetened soft drinks and cordials, sports and<br />
energy drinks and alcoholic drinks.<br />
Estimated Average Requirement (EAR)<br />
A daily nutrient level estimated to meet the requirements of half the healthy individuals in a<br />
particular life stage and gender group.<br />
Energy Expenditure<br />
Total daily energy expenditure includes energy expended in physical activity and resting energy<br />
expenditure (basal metabolic rate plus necessary tissue repair and the thermic effect of food) over<br />
a 24-hour period.<br />
<strong>DRAFT</strong> <strong>Australian</strong> <strong>Dietary</strong> <strong>Guidelines</strong>- December 2011 194
Exclusive breastfeeding<br />
Means an infant is receiving only breastmilk, which includes expressed breastmilk and milk from a<br />
wet nurse. The infant might also receive medications and vitamins or minerals as required.<br />
Fats<br />
Most of the fats in foods are triglycerides, made up of a unit of glycerol (glycerine) combined with<br />
three fatty acids, which may be the same or different. Differences between fats are largely a<br />
consequence of the fatty acids they contain, which together make up 90% of the weight of the<br />
molecule. Fats in the diet can be ‘visible’ or ‘invisible’. Among visible fats are butter, margarine,<br />
cooking oils, and the fat on meat. Invisible fats occur in foods such as cheese, sauces, mayonnaise,<br />
biscuits, cakes, pastries and nuts. In most diets, about half the fats are visible and half invisible.<br />
Fats are the most concentrated form of energy, providing 37 kilojoules per gram. They are the<br />
chemical form in which most of the energy reserve of animals and some seeds is stored.<br />
Cholesterol, a lipid, has important functions in the body as part of all cell membranes, part of the<br />
myelin in the brain and nervous system, and the starting material for synthesis in the body of bile<br />
acids and adrenocortical and sex hormones. Cholesterol can, however, accumulate in blood and in<br />
the inner walls of arteries, leading to disease.<br />
Food variety<br />
Refers to foods that are biologically diverse or nutritionally distinct from each other. <strong>Eat</strong>ing a<br />
variety of nutritious foods means consuming different food types in appropriate amounts to attain<br />
all the required nutrients without excess energy intake. Variety further refers to choosing a range<br />
of items from within each food group, particularly within the plant-based groups (vegetables, fruits<br />
and cereals). Variety is an important nutritional principle which, in modern sedentary society,<br />
requires a reduction in serving sizes, particularly of more energy-dense foods with limited nutrient<br />
content.<br />
Foundation Diet<br />
The Foundation Diet was informed by current scientific evidence derived from the literature, the<br />
most current national intake data and the NHMRC’s 2006 Nutrient Reference Values. The diets<br />
were modelled to provide as close to 100% of the RDIs of 10 key nutrients as was feasible and to<br />
provide the estimated energy requirements of the smallest and very sedentary category (PAL 1.4)<br />
for each age and gender group. These Foundation Diets based on low energy requirements were<br />
then tested using 100 7-day simulations with the aim that all of the simulations would meet the<br />
EARs of the 10 key nutrients.<br />
<strong>DRAFT</strong> <strong>Australian</strong> <strong>Dietary</strong> <strong>Guidelines</strong>- December 2011 195
Fruit<br />
Generally applies to the sweet, fleshy, edible portion of a plant that arises from the base of the<br />
flower and surrounds the seeds. Examples include pome fruit such as apples and pears, citrus fruit<br />
such as oranges and lemons, stone fruit such as apricots and plums, and berries.<br />
Fruit juice<br />
100% fruit juice, including pulp, is a good source of vitamins such as vitamin C and folate and also<br />
provides fibre and carbohydrates, particularly natural sugars. Whole fruit is preferable to fruit juice<br />
however the occasional use of fruit juice may assist with nutrient intake when fresh, frozen or<br />
tinned fruit supply is sub-optimal. Fruit juice is energy-dense and if consumed in excess, it can<br />
displace other nutritious foods from the diet and may lead to problems such as obesity.<br />
Frail elderly<br />
<strong>For</strong> the purposes of these <strong>Guidelines</strong>, the frail elderly are defined as older persons (usually over<br />
the age of 75 years) with a physical or mental disability that may interfere with their ability to<br />
perform activities of daily living independently.<br />
Grain foods<br />
See cereals.<br />
Infant<br />
<strong>For</strong> the purposes of these <strong>Guidelines</strong>, infants are defined as children under the age of 12 months.<br />
Iron deficiency<br />
Refers to a condition of low body iron, which may manifest itself as low serum iron, low serum<br />
ferritin, high serum iron–binding capacity, a reduced transferrin saturation index and/or high–free<br />
erythrocyte protoporphyrin. It can cause fatigue, listlessness and pallor and may progress to<br />
anaemia. It can also have widespread non-haematological effects on behaviour, cognition and<br />
motor development, physical work performance, and body temperature regulation. In Australia,<br />
iron deficiency appears to be a condition predominantly seen in young women.<br />
<strong>DRAFT</strong> <strong>Australian</strong> <strong>Dietary</strong> <strong>Guidelines</strong>- December 2011 196
Legume/Beans<br />
Refers to all forms of edible beans and peas and preparations made from them—dried legumes,<br />
legume flour, bean curd, canned legumes, cooked legumes. Amongst the better known legumes<br />
include butter beans, haricot (navy) beans, red kidney beans, soybeans, mung beans, lentils, chick<br />
peas, snow peas and various other types of fresh green peas and beans. Legumes are usually<br />
cooked because this increases their nutritional value and improves their taste, but are occasionally<br />
eaten raw (for example, snow peas). Legumes are technically a specialised form of fruit (the pod<br />
surrounds the seeds and arises from the base of the flower) but because the main food material in<br />
legumes is generally the seeds rather than the flesh surrounding the seeds they are categorised<br />
separately.<br />
Limit<br />
Limit is used to emphasise the importance of limiting intake of foods and drinks high in saturated<br />
and trans fats, added salt, added sugars and alcohol, due to evidence that these foods are<br />
associated with increased risk of obesity and/or chronic disease, including cardiovascular disease,<br />
type 2 diabetes and/or some cancers.<br />
Low fat food<br />
<strong>For</strong> labelling purposes, foods which claim to be ‘low fat’ must meet criteria before a manufacturer<br />
is allowed to print this on the food label. A ‘low fat’ or ‘low in fat’ product must contain no more<br />
than 3g of fat per 100g of food. A liquid must contain no more than 1.5g of fat per 100g of liquid.<br />
Low salt food<br />
<strong>For</strong> labelling purposes, a low salt food as one with a sodium concentration of up to 120 milligrams<br />
per 100 grams (Australia New Zealand Food Standards Code, clause 17 of Standard 1.2.8). The<br />
following are the conversion factors for the units used to express the sodium content of food:<br />
1 mmol = 23 milligrams<br />
1 gram = 43 mmol<br />
One gram of sodium chloride (NaCl) contains 17 mmol, or 391 milligrams, of sodium.<br />
Meat<br />
Refers to all or part of the carcass of any cattle, sheep, goat, buffalo, kangaroo, camel, deer, goat,<br />
pig or rabbit. <strong>For</strong> the purpose of the <strong>Guidelines</strong> refers to the muscle component only, excluding<br />
<strong>DRAFT</strong> <strong>Australian</strong> <strong>Dietary</strong> <strong>Guidelines</strong>- December 2011 197
offal such as liver and kidney.<br />
Meat alternatives<br />
Refers to other protein-rich foods, such as eggs, fish, shellfish, legumes, nuts and nut pastes, and<br />
certain seeds, such as sunflower and sesame seeds.<br />
Milks, yoghurts and cheeses<br />
Generally refers to cow’s milk and the yoghurt and cheese produced from it but can also include<br />
milks, yoghurts and cheeses from goat and sheep milks.<br />
Milk, yoghurt and cheese alternatives<br />
Inclusion in this ‘alternative’ category is based primarily on calcium content, although most of the<br />
alternatives also provide substantial amounts of protein. Calcium fortified grain-based beverages,<br />
fish whose bones are eaten (such as sardines), and some nuts (such as almonds), contain moderate<br />
to good amounts of calcium and protein and in this respect can be considered as alternatives.<br />
Monounsaturated fatty acids<br />
In chemical terms, monounsaturated fatty acids (MUFA) contain one unsaturated bond. MUFA<br />
occurs in considerable amounts in olive oil, canola oil and many kinds of nuts.<br />
Nutrient Reference Values (NRVs)<br />
Amounts of nutrients required on an average daily basis for adequate physiological function and<br />
prevention of deficiency disease (EAR, AI or RDI) or chronic disease prevention (Acceptable<br />
Macronutrient Distribution Range (AMDR) or Suggested <strong>Dietary</strong> Target (SDT)). <strong>For</strong> each nutrient,<br />
an Upper Level of Intake (UL) was also set to specify the highest average daily nutrient intake likely<br />
to pose no adverse health effects to almost all individuals in the general population.<br />
Nutritious foods<br />
Refers to foods that make a substantial contribution towards providing a range of nutrients, have<br />
an appropriate nutrient density, and are compatible with the overall aims of the <strong>Guidelines</strong>.<br />
<strong>DRAFT</strong> <strong>Australian</strong> <strong>Dietary</strong> <strong>Guidelines</strong>- December 2011 198
Older adults<br />
<strong>For</strong> the purposes of these <strong>Guidelines</strong>, older adults are defined as healthy people aged 65 years and<br />
over, not including the frail elderly.<br />
Osteoporosis<br />
Osteoporosis, a condition of low bone mass, can lead to bone fragility and increased risk of<br />
fractures. Most fractures in older adults are related to osteoporosis whereas trauma is the<br />
primary cause of fractures in young adults. Clinically, individuals are considered osteoporotic if<br />
their bone mineral density is 2.5 SD or more below the young adult mean. This criterion identifies<br />
about 30% of all post-menopausal women as having osteoporosis. Of these, more than 50% will<br />
have suffered a previous fracture. Osteoporosis is also of growing importance in men.<br />
Pasta and noodles<br />
Includes a wide range of Italian and Asian products based on sheets of dough made from flours—<br />
usually wheat or rice flour—and water, sometimes with egg added. Examples are plain spaghetti,<br />
lasagne, fettuccine, udon and Hokkien noodles, rice paper and wonton wrappers. The term<br />
excludes some instant noodles and flavoured pasta mixes with significant amounts of added fat and<br />
salt.<br />
Physical activity<br />
Any structured or incidental body movement (light, moderate or vigorous) which causes your<br />
muscles to work and uses more energy than you would use if you where resting (see Chapter 4).<br />
Physical inactivity<br />
Physical inactivity (or sedentary behaviour) is defined as a state in which body movement is<br />
minimal, such as sitting time while watching television, reading, working at a computer, talking on<br />
the telephone, driving a car, or meditating.<br />
Phytochemicals<br />
Substances found in plant materials which may confer some health benefits and which include a<br />
number of chemical categories such as carotenoids, flavonoids and isoflavonoids, polyphenols,<br />
isothiocyanates, indoles, sulphoraphane, monoterpenes, xanthin, and non-digestible<br />
oligosaccharides.<br />
<strong>DRAFT</strong> <strong>Australian</strong> <strong>Dietary</strong> <strong>Guidelines</strong>- December 2011 199
Plenty<br />
Plenty is used judiciously to encourage increased consumption of vegetables (particularly nonstarchy<br />
varieties).<br />
Polyunsaturated fatty acids<br />
Polyunsaturated fatty acids (PUFA) contain two or more (poly) double (unsaturated) bonds. Foods<br />
with a high PUFA content are liquid at room temperature that is, they tend to be oils’. The most<br />
common polyunsaturated fatty acid is linoleic acid (18:2) whose double bonds are in the n-6<br />
position. It occurs in seed oils including sunflower oil, safflower oil and corn oil. Smaller amounts<br />
of polyunsaturated fatty acids with double bonds in the n-3 position also occur in the diet. The<br />
best known are those in fatty fish, their names abbreviated to EPA (20:5 eicosapentaenoic) and<br />
DHA (22:6 docosahexaenoic). Another n-3 polyunsaturated fatty acid, ALA (18:3 alpha linolenic),<br />
occurs in considerable amounts in canola and flaxseed oils and in walnuts.<br />
Poultry<br />
Refers to chicken, duck, turkey and all other avian foods except eggs.<br />
Quinoa<br />
See cereals or grain foods.<br />
Recommended <strong>Dietary</strong> Intake (RDI)<br />
The average daily dietary intake level that is sufficient to meet the nutrient requirements of nearly<br />
all (97–98 per cent) healthy individuals in a particular life stage and gender group.<br />
Red meat<br />
The muscle meat from cattle, sheep, pig, goat and kangaroo . Note that although pork is not<br />
considered red meat for marketing purposes in Australia, it is classified as red meat in the<br />
international literature, and has been treated as red meat for the purpose of the <strong>Guidelines</strong>.<br />
<strong>DRAFT</strong> <strong>Australian</strong> <strong>Dietary</strong> <strong>Guidelines</strong>- December 2011 200
Reduced fat products<br />
<strong>For</strong> a food to be labelled ‘reduced fat’, it must contain at least 25% less fat than is present in the<br />
equivalent full-fat product, and at least 3g less fat per 100g of food.<br />
Salt<br />
<strong>Dietary</strong> salt is an inorganic compound consisting of sodium and chloride ions. It is found naturally<br />
in many foods, but it is also added to many foods because of its preservative and flavouring<br />
characteristics. Research has shown that both the sodium and the chloride can be detrimental to<br />
health when consumed in excess. About 90% of all the sodium added to food is sodium chloride,<br />
so dietary intake of sodium approximates intake of sodium chloride for practical purposes. Sodium<br />
in the diet of <strong>Australian</strong> adults comes mostly from processed foods, although sodium added in<br />
cooking, at the table, in medications and naturally present in foods can contribute to the total<br />
dietary intake.<br />
<strong>Australian</strong> adults are recommended to limit their intake of sodium to less than 2300 mg per day.<br />
This is equivalent to about six grams of salt, or one and a half teaspoons.<br />
Saturated fatty acids<br />
In chemical terms, saturated fatty acids (SFA) contain no double bond - that is, they are fully<br />
saturated with hydrogen. Foods which predominantly comprise SFA are usually solid at room (e.g.<br />
butter, fat on meat). SFA are the main type of fatty acid in milk, cream, butter and cheese, in some<br />
meats (most of the land animal fats), and can also be found in considerable amounts in some oils<br />
such as in palm and coconut oil. When the saturated fatty acids palmitic (16:0), myristic (14:0) and<br />
lauric (12:0) predominate in the diet they tend to raise plasma cholesterol.<br />
Sodium<br />
See salt.<br />
Standard drink<br />
A standard drink contains 10 grams of alcohol—equivalent to 12.5 millilitres of alcohol.<br />
<strong>DRAFT</strong> <strong>Australian</strong> <strong>Dietary</strong> <strong>Guidelines</strong>- December 2011 201
Sugars<br />
Conventionally used to describe monosaccharides and disaccharides such as sucrose, glucose and<br />
fructose which can be found naturally in foods or can be added to in processing. Sugars is the term<br />
used in the analysis of the 1995 National Nutrition Survey. Sugar, by contrast, is commonly used to<br />
describe purified sucrose, as are the terms refined sugar and added sugar. Added sugars may also<br />
include other sugars such as glucose, fructose and corn syrup.<br />
Total Diet<br />
Progression from Foundation Diets to Total Diets can occur when total energy needs are greater<br />
than the energy provided by a Foundation Diet for a particular age and sex group. General<br />
principles were determined to ensure that diets remained within acceptable limits for percentage<br />
of energy from fat and the various fat components, protein and carbohydrate (AMDRs), the Upper<br />
Levels (ULs) and Suggested <strong>Dietary</strong> Targets (SDTs) for chronic disease prevention. The principles<br />
allow free addition of vegetables (including legumes), fruits, nuts and seeds, and cereal foods. The<br />
principles also encourage a variety of choice of additional foods while defining the choices allowed<br />
in the modelling for the meat, milk, yoghurt and cheese products and unsaturated margarines and<br />
oils categories. ‘Discretionary choices’ can be included but it is important to note that they do not<br />
need to be included in the diet, and Total Diets without inclusion of any ‘Discretionary choices’<br />
were also modelled for all age and sex groups.<br />
Trans-fatty acids<br />
Trans-fatty acids are a form of unsaturated fatty acid that is straight at a double bond rather than<br />
bent, as in the usual cis form. They are not common in nature but are formed during some<br />
manufacturing processes, such as when edible oils are hydrogenated to make hard margarines.<br />
Small amounts of trans-fatty acids occur naturally in meats and dairy foods.<br />
Upper level of intake (UL)<br />
The highest average daily nutrient intake level likely to pose no adverse health effects to almost all<br />
individuals in the general population. As intake increases above the ULUpper level of intake, the<br />
potential risk of adverse effects increases.<br />
Vegetables<br />
Applies to leafy green vegetables (for example, spinach, lettuce, silverbeet and bok choi), members<br />
of the crucifer or brassica family (for example, broccoli, cabbage, and brussels sprouts), starchy<br />
root and tuber vegetables (for example, yams and potatoes), edible plant stems (for example,<br />
<strong>DRAFT</strong> <strong>Australian</strong> <strong>Dietary</strong> <strong>Guidelines</strong>- December 2011 202
celery and asparagus), gourd vegetables (for example, pumpkin and cucumber), allium vegetables<br />
(for example, onions, garlic and shallots), and sweet corn.<br />
Wholegrain<br />
This term applies to products which uses every part of the grain including the outer layers, bran<br />
and germ even if these parts are separated during processing and regardless of whether the grain<br />
is in one piece or milled into smaller pieces.<br />
The term wholegrain may apply to whole and intact grains as found in some bread and crisp<br />
breads, puffed or flaked grains in some breakfast cereals, coarsely milled or kibbled wheat found in<br />
breads such as pumpernickel and ground grains such whole wheat flour used to make wholemeal<br />
bread.<br />
<strong>DRAFT</strong> <strong>Australian</strong> <strong>Dietary</strong> <strong>Guidelines</strong>- December 2011 203
Appendix 9: Summary of omitted<br />
evidence statements<br />
A number of relationships between food consumption and disease outcomes have not been<br />
considered or presented in the <strong>Australian</strong> <strong>Dietary</strong> <strong>Guidelines</strong>, even though these relationships<br />
were investigated as part of the systematic literature review process. However, these relationships<br />
and the reviewed evidence can still be found in the Evidence Report. A summary of the<br />
relationships that have been omitted, with reasoning, are provided below.<br />
A9.1 Grade C Evidence Statements: Food<br />
consumption with no association with a health<br />
outcome<br />
To avoid unnecessary confusion for the reader, Grade C evidence statements suggesting no<br />
association between a food and specific health outcome were not included in the evidence<br />
summary tables at the beginning of each section within the document. These evidence statements<br />
have been provided in Table A9.1.<br />
Please note that these evidence statements are discussed in further detail within the body of the<br />
document.<br />
Table A9.1: Grade C ‘no association’ relationships that informed the <strong>Australian</strong> <strong>Dietary</strong><br />
<strong>Guidelines</strong><br />
Evidence Statement Grade<br />
Vegetables<br />
Consumption of vegetables is not associated with reduced risk of type 2 diabetes.<br />
Consumption of vegetables is not associated with reduced risk of oesophageal cancer.<br />
Consumption of vegetables is not associated with reduced risk of ovarian cancer.<br />
Consumption of vegetables is not associated with reduced risk of endometrial cancer<br />
Consumption of cruciferous vegetables, carrots, potatoes and beans and lentils is not<br />
associated with risk of colorectal cancer.<br />
<strong>DRAFT</strong> <strong>Australian</strong> <strong>Dietary</strong> <strong>Guidelines</strong>- December 2011 204<br />
C<br />
C<br />
C<br />
C<br />
C
Evidence Statement Grade<br />
Fruit<br />
Consumption of fruit is not associated with risk of type 2 diabetes.<br />
Consumption of fruit is not associated with risk of breast cancer.<br />
Consumption of fruit is not associated with risk of ovarian cancer.<br />
Consumption of fruit is not associated with risk of endometrial cancer.<br />
Consumption of fruit is not associated with risk of colorectal cancer.<br />
Consumption of fresh red meat 1 to 6 times per week (or an intake range of 14-70<br />
g/1000 Calories/d) is not associated with risk of bladder cancer.<br />
Lean meat and poultry, fish, eggs, legumes/beans and nuts/seeds<br />
Consumption of fresh red meat, irrespective of frequency or serving size, is not<br />
associated with risk of prostate cancer<br />
Consumption of 30-200grams of fresh red meat per day is not associated with risk of<br />
pancreatic cancer.<br />
Consumption of at least 1 serve of fish a week is not associated with reduced risk of<br />
depression.<br />
Consumption of eggs daily is not associated with increased risk of coronary heart<br />
disease.<br />
Consumption of nuts (65-110 g / day) does not lead to weight gain in the short-term.<br />
Milk, yoghurt, cheese and/or alternatives<br />
Consuming dairy food is not associated with risk of endometrial cancer<br />
Consumption of dairy foods is not associated with weight change or risk of obesity.<br />
Consumption of milk is not associated with BMI or BMI change in childhood.<br />
Mean consumption of 1 serving of dairy food per day is not associated with the risk of<br />
breast cancer.<br />
Consumption of less than 1 serving of milk per day during adult life is not associated<br />
with risk of osteoporotic or hip fracture<br />
<strong>DRAFT</strong> <strong>Australian</strong> <strong>Dietary</strong> <strong>Guidelines</strong>- December 2011 205<br />
C<br />
C<br />
C<br />
C<br />
C<br />
C<br />
C<br />
C<br />
C<br />
C<br />
C<br />
C<br />
C<br />
C<br />
C<br />
C
Evidence Statement Grade<br />
Water<br />
Consumption of black tea is not associated with risk of cardiovascular disease.<br />
Consumption of coffee is not associated with risk of coronary heart disease.<br />
Consumption of coffee is not associated with risk of breast cancer.<br />
Consumption of coffee is not associated with risk of colorectal cancer.<br />
Consumption of coffee is not associated with risk of ovarian cancer.<br />
Consumption of green or black tea is not associated with risk of ovarian cancer.<br />
Consumption of green or black tea is not associated with risk of colorectal cancer.<br />
A9.2 Grade D Evidence Statements that did not<br />
inform the <strong>Australian</strong> <strong>Dietary</strong> <strong>Guidelines</strong><br />
In the systematic literature review (the Evidence Report), a number of food, diet, and health<br />
relationships were examined for which the evidence of an association was D-grade level. This was<br />
because the evidence was limited, inconclusive or contradictory. These D-grade relationships were<br />
not used to inform the development of the <strong>Australian</strong> <strong>Dietary</strong> <strong>Guidelines</strong>. Table A9.2 provides a list<br />
of the evidence statements for these relationships.<br />
Grade D evidence can inform health professionals about the strength of evidence from recent<br />
research, particularly in emerging areas, and help identify areas where further research on dietary<br />
patterns and health outcomes may be required. D-grade evidence can also assist health<br />
professionals correct diet related misconceptions among the general population. <strong>For</strong> example,<br />
members of the general population may be inclined to alter their dietary patterns when the results<br />
of a new study are widely publicised in the media.<br />
This evidence, while useful as mentioned above, was not used in the development of Guideline<br />
statements.<br />
<strong>DRAFT</strong> <strong>Australian</strong> <strong>Dietary</strong> <strong>Guidelines</strong>- December 2011 206<br />
C<br />
C<br />
C<br />
C<br />
C<br />
C<br />
C
Table A9.2: Evidence statements (Grade D) that did not inform the <strong>Australian</strong> <strong>Dietary</strong><br />
<strong>Guidelines</strong><br />
Evidence Statement Grade<br />
Vegetables<br />
The effect of total vegetable consumption on gastric (stomach) cancer is<br />
inconclusive (Section 2.5 in Evidence Report)<br />
The effect of total vegetable consumption on the risk of breast cancer is<br />
inconclusive (Section 2.6 in Evidence Report)<br />
The effect of total vegetable consumption on the risk of colorectal cancer is<br />
inconclusive (Section 2.8 in Evidence Report)<br />
The effect of total vegetable consumption on the risk of lung cancer is<br />
inconclusive (Grade D, Section 2.7 in Evidence Report<br />
Fruit<br />
The effect of fruit consumption on the risk of oesophageal cancer is inconclusive<br />
(Section 1.9 in Evidence Report)<br />
The effect of fruit consumption on the risk of gastric cancer is inconclusive<br />
(Section 1.5 in Evidence Report)<br />
There is limited evidence that fruit consumption reduces the risk of lung cancer<br />
(Section 1.7 in Evidence Report)<br />
The effect of citrus fruit consumption on the risk of pancreatic cancer is<br />
inconclusive (Section 1.13 in Evidence Report)<br />
Grain (cereal) foods<br />
The effect of grain (cereal) consumption on the risk of cancer is inconclusive<br />
(Section 6.1 in Evidence Report)<br />
Lean meat and poultry, fish, eggs, legumes/beans and nuts/seeds<br />
The consumption of unprocessed red meat is associated with an increased risk<br />
of lung cancer (Section 4.5 in Evidence Report)<br />
There is limited evidence showing no association between the consumption of<br />
red meat and the risk of breast cancer (Section 4.4 in Evidence Report)<br />
The effect of consuming poultry at least once a week on the risk of breast<br />
<strong>DRAFT</strong> <strong>Australian</strong> <strong>Dietary</strong> <strong>Guidelines</strong>- December 2011 207<br />
D<br />
D<br />
D<br />
D<br />
D<br />
D<br />
D<br />
D<br />
D<br />
D<br />
D<br />
D
Evidence Statement Grade<br />
cancer is inconclusive (Section 10.1 in Evidence Report)<br />
The effect of consuming poultry at least once a week on the risk of colorectal<br />
cancer is inconclusive (Section 10.2 in Evidence Report)<br />
The effect of fish consumption on the risk of breast cancer is inconclusive<br />
(Section 9.6 in Evidence Report)<br />
The effect of fish consumption on the risk of colorectal cancer is inconclusive<br />
(Section 9.7 in Evidence Report)<br />
The effect of fish consumption on the risk of prostate cancer is inconclusive<br />
(Section 9.8 in Evidence Report)<br />
The effect of fish consumption on the risk of renal cell cancer is inconclusive<br />
(Section 9.9 in Evidence Report)<br />
The effect of egg consumption on the risk of cancer is inconclusive (Section 11.2<br />
in Evidence Report)<br />
Consumption of legumes (especially soy foods) is associated with a reduced risk<br />
of breast cancer (Section 7.1 in Evidence Report)<br />
There unlikely to be a significant protective effect against prostate cancer from<br />
consuming soy foods (Section 7.2 in Evidence Report)<br />
Milk, yoghurt, cheese and/or alternatives<br />
The effect of milk consumption on the risk of prostate cancer is inconclusive<br />
(Section 5.14 in Evidence Report)<br />
Water<br />
The effect of coffee consumption on the risk of increased systolic blood<br />
pressure is inconclusive (Section 15.14 in Evidence Report)<br />
The effect of consuming four cups of coffee a day on the risk of gastric cancer is<br />
inconclusive (Section 15.5 in Evidence Report)<br />
Green and black tea consumption is not associated with an increased risk of<br />
breast cancer (Sections 15.16, 15.17, 15.22 in Evidence Report)<br />
<strong>DRAFT</strong> <strong>Australian</strong> <strong>Dietary</strong> <strong>Guidelines</strong>- December 2011 208<br />
D<br />
D<br />
D<br />
D<br />
D<br />
D<br />
D<br />
D<br />
D<br />
D<br />
D<br />
D
References<br />
1. Rayner, M. and P. Scarborough, The burden of food related ill health in the UK. J Epidemiol<br />
Community <strong>Health</strong>, 2005. 59(12): p. 1054-7.<br />
2. National Public <strong>Health</strong> Partnership, <strong>Eat</strong> Well Australia: an agenda for action for public health<br />
nutrition, 2000-2010, 2001, National Public <strong>Health</strong> Partnership: Canberra.<br />
3. <strong>Australian</strong> Institute of <strong>Health</strong> and Welfare, Premature mortality from chronic disease. AIHW<br />
Bulletin no. 84. Cat. no. AUS 133, 2010, <strong>Australian</strong> Institute of <strong>Health</strong> and Welfare: Canberra.<br />
4. Queensland <strong>Health</strong>, The health of Queenslanders 2006. Report of the Chief <strong>Health</strong> Officer,<br />
Queensland, 2006, Queensland <strong>Health</strong>: Brisbane<br />
5. Crowley, S., et al., eds. The cost of diet-related disease in Australia: a discussion paper. 1992,<br />
<strong>Australian</strong> Institute of <strong>Health</strong> and Welfare: Canberra.<br />
6. Access Economics, The growing cost of obesity in 2008: three years on, 2008, Diabetes<br />
Australia, Access Economics: Canberra.<br />
7. National Preventative <strong>Health</strong> Taskforce, Australia: the healthiest country by 2020 – National<br />
Preventative <strong>Health</strong> Strategy – the roadmap for action, 2009a, Commonwealth of Australia:<br />
Canberra.<br />
8. Lee, A.J., et al., Survival tucker: improved diet and health indicators in an aboriginal community.<br />
Aust J Public <strong>Health</strong>, 1994. 18(3): p. 277-85.<br />
9. National <strong>Health</strong> and Medical Research Council, <strong>Australian</strong> Government Department of<br />
<strong>Health</strong> and Ageing, and New Zealand Ministry of <strong>Health</strong>, Nutrient reference values for<br />
Australia and New Zealand including recommended dietary intakes, 2006, Commonwealth of<br />
Australia: Canberra.<br />
10. National <strong>Health</strong> and Medical Research Council, A modelling system to inform the revision of<br />
the <strong>Australian</strong> Guide to <strong>Health</strong>y <strong>Eat</strong>ing, 2011a, Commonwealth of Australia: Canberra.<br />
11. Begg, S., et al., The burden of disease and injury in Australia 2003, 2007, <strong>Australian</strong> Institute of<br />
<strong>Health</strong> and Welfare: Canberra.<br />
12. <strong>Australian</strong> Bureau of Statistics, National <strong>Health</strong> Survey: Summary of Results, 2007-2008. Cat.<br />
no. 4364.0, 2009, <strong>Australian</strong> Bureau of Statistics: Canberra.<br />
13. Commonwealth Scientific and Industrial Research Organisation, Preventative <strong>Health</strong><br />
National Research Flagship, and University of South Australia, 2007 <strong>Australian</strong> National<br />
<strong>DRAFT</strong> <strong>Australian</strong> <strong>Dietary</strong> <strong>Guidelines</strong>- December 2011 209
Children’s Nutrition and Physical Activity Survey - Main Findings, 2008, Commonwealth of<br />
Australia: Canberra.<br />
14. National <strong>Health</strong> and Medical Research Council, A review of the evidence to address targeted<br />
questions to inform the revision of the <strong>Australian</strong> dietary guidelines, 2011b, Commonwealth of<br />
Australia: Canberra.<br />
15. Buckland, G., A. Bach, and L. Serra-Majem, Obesity and the Mediterranean diet: a systematic<br />
review of observational and intervention studies. Obes Rev, 2008. 9(6): p. 582-93.<br />
16. Roman, B., et al., Effectiveness of the Mediterranean diet in the elderly. Clin Interv Aging, 2008.<br />
3(1): p. 97-109.<br />
17. Serra-Majem, L., B. Roman, and R. Estruch, Scientific evidence of interventions using the<br />
Mediterranean diet: a systematic review. Nutr Rev, 2006. 64(2): p. S27.<br />
18. Bamia, C., et al., <strong>Dietary</strong> patterns and survival of older Europeans: the EPIC-Elderly Study<br />
(European Prospective Investigation into Cancer and Nutrition). Public <strong>Health</strong> Nutr, 2007. 10(6):<br />
p. 590-8.<br />
19. Diehr, P., et al., The effect of different public health interventions on longevity, morbidity, and<br />
years of healthy life. BMC Public <strong>Health</strong>, 2007. 7: p. 52.<br />
20. Kant, A.K., B.I. Graubard, and A. Schatzkin, <strong>Dietary</strong> patterns predict mortality in a national<br />
cohort: the National <strong>Health</strong> Interview Surveys, 1987 and 1992. J Nutr, 2004. 134(7): p. 1793-9.<br />
21. Togo, P., et al., Food intake patterns and body mass index in observational studies. Int J Obes<br />
Relat Metab Disord, 2001. 25(12): p. 1741-51.<br />
22. Wirt, A. and C.E. Collins, Diet quality--what is it and does it matter? Public <strong>Health</strong> Nutr, 2009.<br />
12(12): p. 2473-92.<br />
23. Anderson, A.L., et al., <strong>Dietary</strong> patterns and survival of older adults. J Am Diet Assoc, 2011.<br />
111(1): p. 84-91.<br />
24. de Groot, C.P. and W.A. van Staveren, Nutritional concerns, health and survival in old age.<br />
Biogerontology, 2010. 11(5): p. 597-602.<br />
25. Scarborough, P., et al., Modelling the impact of a healthy diet on cardiovascular disease and<br />
cancer mortality. J Epidemiol Community <strong>Health</strong>, 2010.<br />
26. <strong>Australian</strong> Institute of <strong>Health</strong> and Welfare, Australia's health 2010. Australia’s health series no.<br />
12. Cat. no. AUS 122, 2010, <strong>Australian</strong> Institute of <strong>Health</strong> and Welfare: Canberra.<br />
<strong>DRAFT</strong> <strong>Australian</strong> <strong>Dietary</strong> <strong>Guidelines</strong>- December 2011 210
27. Wilkinson, R. and M. Marmot, Social determinants of health: the solid facts, 2003, World<br />
<strong>Health</strong> Organization: Copenhagen.<br />
28. Marmot, M.G., The status syndrome: how social standing affects our health and longevity 2004,<br />
New York: Henry Holt.<br />
29. Friel, S. and P.I. Baker, Equity, food security and health equity in the Asia Pacific region. Asia Pac<br />
J Clin Nutr, 2009. 18(4): p. 620-32.<br />
30. National <strong>Health</strong> and Medical Research Council, Nutrition in Aboriginal and Torres Strait<br />
Islander peoples: an information paper, 2000, Commonwealth of Australia: Canberra.<br />
31. <strong>Australian</strong> Bureau of Statistics and <strong>Australian</strong> Institute of <strong>Health</strong> and Welfare, The health<br />
and welfare of Australia's Aboriginal and Torres Strait Islander peoples. ABS Cat. no. 4704.0.<br />
AIHW Cat. no. IHW14, 2005, Commonwealth of Australia: Canberra.<br />
32. <strong>Australian</strong> Bureau of Statistics, National Aboriginal and Torres Strait Islander <strong>Health</strong> Survey<br />
2004-2005, 2006, <strong>Australian</strong> Bureau of Statistics: Canberra.<br />
33. Commonwealth Department of <strong>Health</strong> and Family Services. Food and nutrition policy. 1992;<br />
Available from: http://www.health.gov.au/internet/main/publishing.nsf/content/phd-nutritionfnp-1992.<br />
34. National <strong>Health</strong> and Medical Research Council, How to review the evidence: systematic<br />
identification and review of the scientific literature, 2000a, Commonwealth of Australia:<br />
Canberra.<br />
35. National <strong>Health</strong> and Medical Research Council, <strong>Dietary</strong> <strong>Guidelines</strong> for Older <strong>Australian</strong>s, 1999,<br />
Commonwealth of Australia: Canberra.<br />
36. National <strong>Health</strong> and Medical Research Council, <strong>Dietary</strong> <strong>Guidelines</strong> for Children and<br />
Adolescents in Australia, 2003, Commonwealth of Australia: Canberra.<br />
37. National <strong>Health</strong> and Medical Research Council, <strong>Dietary</strong> <strong>Guidelines</strong> for <strong>Australian</strong> Adults, 2003,<br />
Commonwealth of Australia: Canberra.<br />
38. National <strong>Health</strong> and Medical Research Council, NHMRC additional levels of evidence and<br />
grades for recommendations for developers of guidelines, 2007, Commonwealth of Australia:<br />
Canberra.<br />
39. National <strong>Health</strong> and Medical Research Council, How to use the evidence: assessment and<br />
application of scientific evidence, 2000b, Commonwealth of Australia: Canberra.<br />
<strong>DRAFT</strong> <strong>Australian</strong> <strong>Dietary</strong> <strong>Guidelines</strong>- December 2011 211
40. National <strong>Health</strong> and Medical Research Council, NHMRC standards and procedures for<br />
externally developed guidelines, 2007, Commonwealth of Australia: Canberra.<br />
41. National <strong>Health</strong> and Medical Research Council, NHMRC levels of evidence and grades for<br />
recommendations for developers of guidelines, 2009, Commonwealth of Australia: Canberra.<br />
42. World Cancer Research Fund and American Institute for Cancer Research, Food, nutrition,<br />
physical activity, and the prevention of cancer: a global perspective., 2007: Washington DC.<br />
43. Ball, K., et al., How well do <strong>Australian</strong> women comply with dietary guidelines? Public <strong>Health</strong><br />
Nutr, 2004. 7(3): p. 443-52.<br />
44. <strong>Australian</strong> Bureau of Statistics, National Nutrition Survey: Foods <strong>Eat</strong>en, Australia 1995., 1999,<br />
<strong>Australian</strong> Bureau of Statistics: Canberra.<br />
45. Commonwealth Department of <strong>Health</strong> and Family Services, The <strong>Australian</strong> Guide to <strong>Health</strong>y<br />
<strong>Eat</strong>ing, 1998, Commonwealth of Australia: Canberra.<br />
46. Rangan, A.M., et al., Consumption of 'extra' foods by <strong>Australian</strong> children: types, quantities and<br />
contribution to energy and nutrient intakes. Eur J Clin Nutr, 2008. 62(3): p. 356-64.<br />
47. <strong>Australian</strong> Bureau of Statistics, National Nutrition Survey: Nutrient intakes and physical<br />
measurements, Australia 1995, 1998, <strong>Australian</strong> Bureau of Statistics: Canberra.<br />
48. Cook, T., I. Rutishauser, and M. Seelig, Comparable data on food and nutrient intake and<br />
physical measurements from the 1983, 1985 and 1995 national nutrition surveys, 2001,<br />
Commonwealth of Australia: Canberra.<br />
49. Burke, V., et al., Predictors of body mass index and associations with cardiovascular risk factors in<br />
<strong>Australian</strong> children: a prospective cohort study. Int J Obes (Lond), 2005. 29(1): p. 15-23.<br />
50. Classen, T. and C. Hokayem, Childhood influences on youth obesity. Econ Hum Biol, 2005.<br />
3(2): p. 165-87.<br />
51. Dubois, L., et al., Family food insufficiency is related to overweight among preschoolers. Soc Sci<br />
Med, 2006. 63(6): p. 1503-16.<br />
52. Dubois, L. and M. Girard, Early determinants of overweight at 4.5 years in a population-based<br />
longitudinal study. Int J Obesity, 2006. 30(4): p. 610-7.<br />
53. Field, A.E., et al., Snack food intake does not predict weight change among children and<br />
adolescents. Int J Obes Relat Metab Disord, 2004. 28(10): p. 1210-6.<br />
<strong>DRAFT</strong> <strong>Australian</strong> <strong>Dietary</strong> <strong>Guidelines</strong>- December 2011 212
54. Hawkins, S.S., T.J. Cole, and C. Law, An ecological systems approach to examining risk factors<br />
for early childhood overweight: findings from the UK Millennium Cohort Study. J Epidemiol<br />
Community <strong>Health</strong>, 2009. 63(2): p. 147-55.<br />
55. Hesketh, K., et al., Predictors of body mass index change in <strong>Australian</strong> primary school children.<br />
Int J Pediatr Obes, 2009. 4(1): p. 45-53.<br />
56. Hesketh, K., et al., Stability of body mass index in <strong>Australian</strong> children: a prospective cohort study<br />
across the middle childhood years. Public <strong>Health</strong> Nutr, 2004. 7(2): p. 303-9.<br />
57. Li, L., et al., Intergenerational influences on childhood body mass index: the effect of parental body<br />
mass index trajectories. Am J Clin Nutr, 2009. 89(2): p. 551-7.<br />
58. Mamun, A.A., et al., Family and early life factors associated with changes in overweight status<br />
between ages 5 and 14 years: findings from the Mater University Study of Pregnancy and its<br />
outcomes. Int J Obes (Lond), 2005. 29(5): p. 475-82.<br />
59. Power, C., et al., Combination of low birth weight and high adult body mass index: at what age is<br />
it established and what are its determinants? J Epidemiol Community <strong>Health</strong>, 2003. 57(12): p.<br />
969-73.<br />
60. Reilly, J.J., et al., Early life risk factors for obesity in childhood: cohort study. Br Med J, 2005.<br />
330(7504): p. 1357.<br />
61. Salsberry, P.J. and P.B. Reagan, Taking the long view: the prenatal environment and early<br />
adolescent overweight. Res Nurs <strong>Health</strong>, 2007. 30(3): p. 297-307.<br />
62. Yang, S., et al., Emergence of socioeconomic inequalities in smoking and overweight and obesity in<br />
early adulthood: the national longitudinal study of adolescent health. Am J Public <strong>Health</strong>, 2008.<br />
98(3): p. 468-77.<br />
63. Erik Landhuis, C., et al., Programming obesity and poor fitness: the long-term impact of childhood<br />
television. Obesity (Silver Spring), 2008. 16(6): p. 1457-9.<br />
64. Danner, F.W., A national longitudinal study of the association between hours of TV viewing and<br />
the trajectory of BMI growth among US children. J Pediatr Psychol, 2008. 33(10): p. 1100-7.<br />
65. Bhargava, A., D. Jolliffe, and L.L. Howard, Socio-economic, behavioural and environmental<br />
factors predicted body weights and household food insecurity scores in the Early Childhood<br />
Longitudinal Study-Kindergarten. Br J Nutr, 2008. 100(2): p. 438-44.<br />
66. Henderson, V.R., Longitudinal associations between television viewing and body mass index<br />
among white and black girls. J Adolesc <strong>Health</strong>, 2007. 41(6): p. 544-50.<br />
<strong>DRAFT</strong> <strong>Australian</strong> <strong>Dietary</strong> <strong>Guidelines</strong>- December 2011 213
67. Viner, R.M. and T.J. Cole, Television viewing in early childhood predicts adult body mass index. J<br />
Pediatr, 2005. 147(4): p. 429-35.<br />
68. Sturm, R. and A. Datar, Body mass index in elementary school children, metropolitan area food<br />
prices and food outlet density. Public <strong>Health</strong>, 2005. 119(12): p. 1059-68.<br />
69. Baker, E., K.S. Balistreri, and J. Van Hook, Maternal employment and overweight among<br />
Hispanic children of immigrants and children of natives. J Immigr Minor <strong>Health</strong>, 2009. 11(3): p.<br />
158-67.<br />
70. Gorely, T., S.J. Marshall, and S.J. Biddle, Couch kids: correlates of television viewing among<br />
youth. Int J Behav Med, 2004. 11(3): p. 152-63.<br />
71. Epstein, L.H., et al., A randomized trial of the effects of reducing television viewing and computer<br />
use on body mass index in young children. Arch Pediatr Adolesc Med, 2008. 162(3): p. 239-45.<br />
72. Matijasevich, A., et al., Socioeconomic position and overweight among adolescents: data from<br />
birth cohort studies in Brazil and the UK. BMC Public <strong>Health</strong>, 2009. 9: p. 105.<br />
73. Oliver, L.N. and M.V. Hayes, Effects of neighbourhood income on reported body mass index: an<br />
eight year longitudinal study of Canadian children. BMC Public <strong>Health</strong>, 2008. 8: p. 16.<br />
74. Poulton, R., et al., Association between children's experience of socioeconomic disadvantage and<br />
adult health: a life-course study. Lancet, 2002. 360(9346): p. 1640-5.<br />
75. Taveras, E.M., et al., Association of consumption of fried food away from home with body mass<br />
index and diet quality in older children and adolescents. Pediatrics, 2005. 116(4): p. e518-24.<br />
76. Viner, R.M. and T.J. Cole, Who changes body mass between adolescence and adulthood? Factors<br />
predicting change in BMI between 16 year and 30 years in the 1970 British Birth Cohort. Int J<br />
Obesity, 2006. 30(9): p. 1368-74.<br />
77. Bisset, S., et al., Association of body mass index and dietary restraint with changes in eating<br />
behaviour throughout late childhood and early adolescence: a 5-year study. Public <strong>Health</strong> Nutr,<br />
2007. 10(8): p. 780-9.<br />
78. Laitinen, J., et al., Predictors of abdominal obesity among 31-y-old men and women born in<br />
Northern Finland in 1966. Eur J Clin Nutr, 2004. 58(1): p. 180-90.<br />
79. Sturm, R. and A. Datar, Food prices and weight gain during elementary school: 5-year update.<br />
Public <strong>Health</strong>, 2008. 122(11): p. 1140-3.<br />
80. Goodman, E. and R.C. Whitaker, A prospective study of the role of depression in the<br />
development and persistence of adolescent obesity. Pediatrics, 2002. 110(3): p. 497-504.<br />
<strong>DRAFT</strong> <strong>Australian</strong> <strong>Dietary</strong> <strong>Guidelines</strong>- December 2011 214
81. Hesketh, K., M. Wake, and E. Waters, Body mass index and parent-reported self-esteem in<br />
elementary school children: evidence for a causal relationship. Int J Obes Relat Metab Disord,<br />
2004. 28(10): p. 1233-7.<br />
82. Klein, E.G., L.A. Lytle, and V. Chen, Social ecological predictors of the transition to overweight in<br />
youth: results from the Teens <strong>Eat</strong>ing for Energy and Nutrition at Schools (TEENS) study. J Am<br />
Diet Assoc, 2008. 108(7): p. 1163-9.<br />
83. Fidler, J.A., et al., Does smoking in adolescence affect body mass index, waist or height? Findings<br />
from a longitudinal study. Addiction, 2007. 102(9): p. 1493-501.<br />
84. Gale, C.R., G.D. Batty, and I.J. Deary, Locus of control at age 10 years and health outcomes<br />
and behaviors at age 30 years: the 1970 British Cohort Study. Psychosom Med, 2008. 70(4): p.<br />
397-403.<br />
85. Francis, L.A. and E.J. Susman, Self-regulation and rapid weight gain in children from age 3 to 12<br />
years. Arch Pediatr Adolesc Med, 2009. 163(4): p. 297-302.<br />
86. Koch, F.S., A. Sepa, and J. Ludvigsson, Psychological stress and obesity. J Pediatr, 2008. 153(6):<br />
p. 839-44.<br />
87. Thomas, C., E. Hypponen, and C. Power, Obesity and type 2 diabetes risk in midadult life: the<br />
role of childhood adversity. Pediatrics, 2008. 121(5): p. e1240-9.<br />
88. Joint WHO/FAO Expert Consultation on Diet Nutrition and the Prevention of Chronic<br />
Diseases, Diet, nutrition and the prevention of chronic diseases: report of a joint WHO/FAO<br />
expert consultation, in World <strong>Health</strong> Organ Tech Rep Ser2003: Geneva. p. i-viii, 1-149,.<br />
89. National Preventative <strong>Health</strong> Taskforce, Australia: the healthiest country by 2020. Technical<br />
report no. 1 Obesity in Australia: a need for urgent action Including addendum for October 2008<br />
to June 2009 2009b, Commonwealth of Australia: Canberra.<br />
90. Schmidt, M., et al., Fast-food intake and diet quality in black and white girls: the National Heart,<br />
Lung, and Blood Institute Growth and <strong>Health</strong> Study. Arch Pediatr Adolesc Med, 2005. 159(7):<br />
p. 626-31.<br />
91. Affenito, S.G., et al., Breakfast consumption by African-American and white adolescent girls<br />
correlates positively with calcium and fiber intake and negatively with body mass index. J Am Diet<br />
Assoc, 2005. 105(6): p. 938-45.<br />
92. Larson, N.I., et al., Family meals during adolescence are associated with higher diet quality and<br />
healthful meal patterns during young adulthood. J Am Diet Assoc, 2007. 107(9): p. 1502-10.<br />
<strong>DRAFT</strong> <strong>Australian</strong> <strong>Dietary</strong> <strong>Guidelines</strong>- December 2011 215
93. <strong>Australian</strong> Bureau of Statistics. <strong>Australian</strong> <strong>Health</strong> Survey. 2011 [cited 31 May 2011]; Available<br />
from:<br />
http://www.abs.gov.au/websitedbs/D3310114.nsf/Home/<strong>Australian</strong>+<strong>Health</strong>+Survey?OpenD<br />
ocument<br />
94. Mozaffarian, D. and D.S. Ludwig, <strong>Dietary</strong> <strong>Guidelines</strong> in the 21st Century: a Time for Food.<br />
Journal of the American Medical Association, 2010. 304(6): p. 681-682.<br />
95. Yngve, A. and M. Tseng, <strong>Dietary</strong> guidelines and goal-setting. Public <strong>Health</strong> Nutrition, 2010.<br />
13(8): p. 1149-1150.<br />
96. Holdsworth, M., Sustainability should be integral to nutrition and dietetics. Human Nutrition<br />
and Dietetics, 2010. 23: p. 467-468.<br />
97. Kickbusch, I., The Food System: a prism of present and future challenges for health promotion<br />
and sustainable development, 2010, <strong>Health</strong> Promotion Switzerland: Geneva.<br />
98. Food Standards Australia New Zealand, The 22nd <strong>Australian</strong> Total Diet Study, 2008, Food<br />
Standards Australia New Zealand: Canberra, Australia and Wellington, NZ.<br />
99. Commonwealth Department of <strong>For</strong>eign Affairs and Trade. Australia in brief: a diverse people.<br />
2010 [cited 2011 29 March]; Available from: http://www.dfat.gov.au/aib/society.html.<br />
100. Symons, M., One continuous picnic : a gastronomic history of Australia. 2nd ed2007, Carlton,<br />
Vic.: Melbourne University Press. xviii, 366 p.<br />
101. Stanton, R.A., Nutrition problems in an obesogenic environment. Med J Aust, 2006. 184(2): p.<br />
76-9.<br />
102. Walker, K.Z., et al., Product variety in <strong>Australian</strong> snacks and drinks: how can the consumer make<br />
a healthy choice? Public <strong>Health</strong> Nutr, 2008. 11(10): p. 1046-53.<br />
103. National <strong>Health</strong> and Medical Research Council, Iodine supplementation for pregnant and<br />
breastfeeding women, 2010, Commonwealth of Australia: Canberra.<br />
104. Harriss, L.R., et al., <strong>Dietary</strong> patterns and cardiovascular mortality in the Melbourne Collaborative<br />
Cohort Study. Am J Clin Nutr, 2007. 86(1): p. 221-9.<br />
105. Jacques, P.F. and K.L. Tucker, Are dietary patterns useful for understanding the role of diet in<br />
chronic disease? Am J Clin Nutr, 2001. 73(1): p. 1-2.<br />
106. Kant, A.K., et al., A prospective study of diet quality and mortality in women. J Am Med Assoc,<br />
2000. 283(16): p. 2109-15.<br />
<strong>DRAFT</strong> <strong>Australian</strong> <strong>Dietary</strong> <strong>Guidelines</strong>- December 2011 216
107. McCullough, M.L., et al., Diet quality and major chronic disease risk in men and women: moving<br />
toward improved dietary guidance. Am J Clin Nutr, 2002. 76(6): p. 1261-71.<br />
108. Wahlqvist, M.L., et al., Phytochemical deficiency disorders: inadequate intake of protective foods.<br />
Current therapeutics, 1998. 39(7): p. 53-60.<br />
109. Van Dokkum, W., et al., The health effects of bioactive plant components in food: results and<br />
opinions of the EU COST 926 action. Nutrition Bulletin, 2008. 33(2): p. 133-139.<br />
110. Dolan, L.C., R.A. Matulka, and G.A. Burdock, Naturally occurring food toxins. Toxins, 2010.<br />
2(9): p. 2289-2332.<br />
111. Gibson, R.S., The role of diet- and host-related factors in nutrient bioavailability and thus in<br />
nutrient-based dietary requirement estimates. Food Nutr Bull, 2007. 28(1 Suppl International):<br />
p. S77-100.<br />
112. Lopez, M.A. and F.C. Martos, Iron availability: an updated review. Int J Food Sci Nutr, 2004.<br />
55(8): p. 597-606.<br />
113. Russell, R.M., The vitamin A spectrum: from deficiency to toxicity. Am J Clin Nutr, 2000. 71(4):<br />
p. 878-84.<br />
114. National <strong>Health</strong> and Medical Research Council, The <strong>Australian</strong> Guide to <strong>Health</strong>y <strong>Eat</strong>ing, 2011,<br />
National <strong>Health</strong> and Medical Research Council: Canberra.<br />
115. Knudsen, V.K., et al., Major dietary patterns in pregnancy and fetal growth. Eur J Clin Nutr,<br />
2008. 62(4): p. 463-70.<br />
116. Rodriguez-Bernal, C.L., et al., Diet quality in early pregnancy and its effects on fetal growth<br />
outcomes: the Infancia y Medio Ambiente (Childhood and Environment) Mother and Child Cohort<br />
Study in Spain. Am J Clin Nutr, 2010. 91(6): p. 1659-66.<br />
117. Thompson, J.M., et al., Maternal dietary patterns in pregnancy and the association with small-forgestational-age<br />
infants. Br J Nutr, 2010. 103(11): p. 1665-73.<br />
118. Kinnunen, T.I., et al., Preventing excessive weight gain during pregnancy - a controlled trial in<br />
primary health care. Eur J Clin Nutr, 2007. 61(7): p. 884-91.<br />
119. Brantsæter, A.L., et al., A dietary pattern characterized by high intake of vegetables, fruits, and<br />
vegetable oils is associated with reduced risk of preeclampsia in nulliparous pregnant Norwegian<br />
women. J Nutr, 2009. 139(6): p. 1162.<br />
120. Rifas-Shiman, S.L., et al., <strong>Dietary</strong> quality during pregnancy varies by maternal characteristics in<br />
Project Viva: a US cohort. J Am Diet Assoc, 2009. 109(6): p. 1004-1011.<br />
<strong>DRAFT</strong> <strong>Australian</strong> <strong>Dietary</strong> <strong>Guidelines</strong>- December 2011 217
121. Radesky, J.S., et al., Diet during early pregnancy and development of gestational diabetes.<br />
Paediatr Perinat Epidemiol, 2008. 22(1): p. 47-59.<br />
122. Tieu, J., C.A. Crowther, and P. Middleton, <strong>Dietary</strong> advice in pregnancy for preventing<br />
gestational diabetes mellitus. Cochrane Database Syst Rev, 2008(2): p. CD006674.<br />
123. Zhang, C., et al., <strong>Dietary</strong> fiber intake, dietary glycemic load, and the risk for gestational diabetes<br />
mellitus. Diabetes Care, 2006. 29(10): p. 2223-30.<br />
124. Chatzi, L., et al., Mediterranean diet in pregnancy is protective for wheeze and atopy in<br />
childhood. Thorax, 2008. 63(6): p. 507.<br />
125. De Batlle, J., et al., Mediterranean diet is associated with reduced asthma and rhinitis in Mexican<br />
children. Allergy, 2008. 63(10): p. 1310-1316.<br />
126. Hattevig, G., et al., Effect of maternal avoidance of eggs, cow's milk and fish during lactation<br />
upon allergic manifestations in infants. Clinical & Experimental Allergy, 1989. 19(1): p. 27-32.<br />
127. Lange, N.E., et al., Maternal dietary pattern during pregnancy is not associated with recurrent<br />
wheeze in children. J Allergy Clin Immunol, 2010. 126(2): p. 250-255.<br />
128. Shaheen, S.O., et al., <strong>Dietary</strong> patterns in pregnancy and respiratory and atopic outcomes in<br />
childhood. Thorax, 2009. 64(5): p. 411-7.<br />
129. Robinson, S., et al., <strong>Dietary</strong> patterns in infancy: the importance of maternal and family influences<br />
on feeding practice. Br J Nutr, 2007. 98(5): p. 1029-37.<br />
130. Food Standards Australia New Zealand. Listeria. 2011 [cited 2011 29 March]; Available<br />
from: http://www.foodstandards.gov.au/consumerinformation/listeria/.<br />
131. Food Standards Australia New Zealand. Mercury in fish. 2011 [cited 2011 29 March];<br />
Available from:<br />
http://www.foodstandards.gov.au/consumerinformation/adviceforpregnantwomen/mercuryi<br />
nfish.cfm.<br />
132. Cullen, G. and D. O'Donoghue, Constipation and pregnancy. Best practice & research.<br />
Clinical gastroenterology, 2007. 21(5): p. 807-18.<br />
133. National <strong>Health</strong> and Medical Research Council, * Title to be confirmed - Infant Feeding<br />
<strong>Guidelines</strong> for <strong>Health</strong> Workers 2011, Commonwealth of Australia: Canberra.<br />
134. Lee, A.J., K. O'Dea, and J.D. Mathews, Apparent dietary intake in remote Aboriginal<br />
communities. Aust J Public <strong>Health</strong>, 1994. 18(2): p. 190-7.<br />
<strong>DRAFT</strong> <strong>Australian</strong> <strong>Dietary</strong> <strong>Guidelines</strong>- December 2011 218
135. Brimblecombe, J.K. and K. O’Dea, The role of energy cost in food choices for an Aboriginal<br />
population in northern Australia. Med J Aust, 2009. 190(10): p. 549-51.<br />
136. Ball, K., A. Timperio, and D. Crawford, Neighbourhood socioeconomic inequalities in food<br />
access and affordability. <strong>Health</strong> & place, 2009. 15(2): p. 578-585.<br />
137. Burns, C. and A. Inglis, Measuring food access in Melbourne: access to healthy and fast foods by<br />
car, bus and foot in an urban municipality in Melbourne. <strong>Health</strong> & place, 2007. 13(4): p. 877-<br />
885.<br />
138. Kettings, C., A.J. Sinclair, and M. Voevodin, A healthy diet consistent with <strong>Australian</strong> health<br />
recommendations is too expensive for welfare dependent families. Aust N Z J Public <strong>Health</strong>,<br />
2009. 33(6): p. 566-572.<br />
139. Landrigan, T. and C. Pollard, Food Access and Cost Survey (FACS), Western Australia, 2010, W.<br />
Department of <strong>Health</strong>, Editor 2011, Department of <strong>Health</strong>, WA: Perth, WA.<br />
140. Harrison, M., et al., The increasing cost of healthy food. Aust N Z J Public <strong>Health</strong>, 2010. 34(2):<br />
p. 179-186.<br />
141. NT Department of <strong>Health</strong> and Community Services, NT Market basket survey, 2006, 2007,<br />
NT Department of <strong>Health</strong> and Community Services.<br />
142. Marsh, K., et al., Meeting nutritional needs on a vegetarian diet. Aust Fam Physician, 2009.<br />
38(8): p. 600-2.<br />
143. U.S. Department of Agriculture and U.S. Department of <strong>Health</strong> and Human Services,<br />
<strong>Dietary</strong> <strong>Guidelines</strong> for Americans, 2010, 2010, U.S. Government Printing Office: Washington,<br />
DC.<br />
144. U.S. Department of <strong>Health</strong> and Human Services and U.S. Department of Agriculture,<br />
<strong>Dietary</strong> <strong>Guidelines</strong> for Americans 2005, 2005, U.S. Government Printing Office: Washington<br />
DC.<br />
145. Dauchet, L., et al., Fruit and vegetable consumption and risk of coronary heart disease: a metaanalysis<br />
of cohort studies. J Nutr, 2006. 136(10): p. 2588-93.<br />
146. He, F.J., et al., Increased consumption of fruit and vegetables is related to a reduced risk of<br />
coronary heart disease: meta-analysis of cohort studies. J Hum Hypertens, 2007. 21(9): p. 717-<br />
28.<br />
147. Joshipura, K.J., et al., Intakes of fruits, vegetables and carbohydrate and the risk of CVD. Public<br />
<strong>Health</strong> Nutr, 2009. 12(1): p. 115-21.<br />
<strong>DRAFT</strong> <strong>Australian</strong> <strong>Dietary</strong> <strong>Guidelines</strong>- December 2011 219
148. Rastogi, T., et al., Diet and risk of ischemic heart disease in India. Am J Clin Nutr, 2004. 79(4):<br />
p. 582-92.<br />
149. Rodríguez-Rodríguez, E., et al., Restricted-energy diets rich in vegetables or cereals improve<br />
cardiovascular risk factors in overweight/obese women. Nutr Res, 2007. 27(6): p. 313-320.<br />
150. Takachi, R., et al., Fruit and vegetable intake and risk of total cancer and cardiovascular disease:<br />
Japan Public <strong>Health</strong> Center-Based Prospective Study. Am J Epidemiol, 2008. 167(1): p. 59-70.<br />
151. Dauchet, L., P. Amouyel, and J. Dallongeville, Fruit and vegetable consumption and risk of<br />
stroke: a meta-analysis of cohort studies. Neurology, 2005. 65(8): p. 1193-7.<br />
152. He, F.J., C.A. Nowson, and G.A. MacGregor, Fruit and vegetable consumption and stroke:<br />
meta-analysis of cohort studies. Lancet, 2006. 367(9507): p. 320-6.<br />
153. Villegas, R., et al., Vegetable but not fruit consumption reduces the risk of type 2 diabetes in<br />
Chinese women. J Nutr, 2008. 138(3): p. 574-80.<br />
154. Harding, A.H., et al., Plasma vitamin C level, fruit and vegetable consumption, and the risk of<br />
new-onset type 2 diabetes mellitus: the European prospective investigation of cancer--Norfolk<br />
prospective study. Arch Intern Med, 2008. 168(14): p. 1493-9.<br />
155. Hamer, M. and Y. Chida, Intake of fruit, vegetables, and antioxidants and risk of type 2 diabetes:<br />
systematic review and meta-analysis. J Hypertens, 2007. 25(12): p. 2361-9.<br />
156. Field, A.E., et al., Association between fruit and vegetable intake and change in body mass index<br />
among a large sample of children and adolescents in the United States. Int J Obes Relat Metab<br />
Disord, 2003. 27(7): p. 821-6.<br />
157. He, K., et al., Changes in intake of fruits and vegetables in relation to risk of obesity and weight<br />
gain among middle-aged women. Int J Obes Relat Metab Disord, 2004. 28(12): p. 1569-74.<br />
158. Sartorelli, D.S., et al., High intake of fruits and vegetables predicts weight loss in Brazilian<br />
overweight adults. Nutr Res, 2008. 28(4): p. 233-8.<br />
159. te Velde, S.J., et al., Tracking of fruit and vegetable consumption from adolescence into adulthood<br />
and its longitudinal association with overweight Br J Nutr, 2007. 98(2): p. 431-8.<br />
160. Vioque, J., et al., Intake of fruits and vegetables in relation to 10-year weight gain among Spanish<br />
adults. Obesity (Silver Spring), 2008. 16(3): p. 664-670.<br />
161. Heck, J.E., et al., <strong>Dietary</strong> risk factors for hypopharyngeal cancer in India. Cancer Causes<br />
Control, 2008. 19(10): p. 1329-37.<br />
<strong>DRAFT</strong> <strong>Australian</strong> <strong>Dietary</strong> <strong>Guidelines</strong>- December 2011 220
162. Kreimer, A.R., et al., Diet and body mass, and oral and oropharyngeal squamous cell carcinomas:<br />
analysis from the IARC multinational case-control study. Int J Cancer, 2006. 118(9): p. 2293-7.<br />
163. Gallicchio, L., et al., Adulthood consumption of preserved and nonpreserved vegetables and the<br />
risk of nasopharyngeal carcinoma: a systematic review. Int J Cancer, 2006. 119(5): p. 1125-35.<br />
164. Guneri, P., et al., Primary oral cancer in a Turkish population sample: association with<br />
sociodemographic features, smoking, alcohol, diet and dentition. Oral Oncol, 2005. 41(10): p.<br />
1005-12.<br />
165. Escribano Uzcudun, A., et al., Pharyngeal cancer prevention: evidence from a case--control study<br />
involving 232 consecutive patients. J Laryngol Otol, 2002. 116(7): p. 523-31.<br />
166. George, S.M., et al., Fruit and vegetable intake and risk of cancer: a prospective cohort study. Am<br />
J Clin Nutr, 2009. 89(1): p. 347.<br />
167. Freedman, N.D., et al., Fruit and vegetable intake and esophageal cancer in a large prospective<br />
cohort study. Int J Cancer, 2007. 121(12): p. 2753-60.<br />
168. Anderson, L.A., et al., Risk factors for Barrett's oesophagus and oesophageal adenocarcinoma:<br />
results from the FINBAR study. World J Gastroenterol, 2007. 13(10): p. 1585-94.<br />
169. González, C.A., et al., Fruit and vegetable intake and the risk of stomach and oesophagus<br />
adenocarcinoma in the European Prospective Investigation into Cancer and Nutrition (EPIC–<br />
EURGAST). Int J Cancer, 2006. 118(10): p. 2559-2566.<br />
170. Etminan, M., B. Takkouche, and F. Caamano-Isorna, The role of tomato products and lycopene<br />
in the prevention of prostate cancer: a meta-analysis of observational studies. Cancer Epidemiol<br />
Biomarkers Prev, 2004. 13(3): p. 340-5.<br />
171. Stram, D.O., et al., Prostate cancer incidence and intake of fruits, vegetables and related<br />
micronutrients: the multiethnic cohort study (United States). Cancer Causes Control, 2006.<br />
17(9): p. 1193-207.<br />
172. Koushik, A., et al., Fruits and vegetables and ovarian cancer risk in a pooled analysis of 12 cohort<br />
studies. Cancer Epidemiol Biomarkers Prev, 2005. 14(9): p. 2160-7.<br />
173. Schulz, M., et al., Fruit and vegetable consumption and risk of epithelial ovarian cancer: the<br />
European Prospective Investigation into Cancer and Nutrition. Cancer Epidemiol Biomarkers<br />
Prev, 2005. 14(11): p. 2531.<br />
174. Bandera, E.V., et al., Fruits and vegetables and endometrial cancer risk: a systematic literature<br />
review and meta-analysis. Nutr Cancer, 2007. 58(1): p. 6-21.<br />
<strong>DRAFT</strong> <strong>Australian</strong> <strong>Dietary</strong> <strong>Guidelines</strong>- December 2011 221
175. Bravi, F., et al., Food groups and endometrial cancer risk: a case-control study from Italy. Am J<br />
Obstet Gynecol, 2009. 200(3): p. 293 e1-7.<br />
176. Yeh, M., et al., Higher intakes of vegetables and vegetable-related nutrients are associated with<br />
lower endometrial cancer risks. J Nutr, 2009. 139(2): p. 317-22.<br />
177. Koushik, A., et al., Fruits, vegetables, and colon cancer risk in a pooled analysis of 14 cohort<br />
studies. J Natl Cancer Inst, 2007. 99(19): p. 1471-83.<br />
178. Lam, T.K., et al., Cruciferous vegetable consumption and lung cancer risk: a systematic review.<br />
Cancer Epidemiol Biomarkers Prev, 2009. 18(1): p. 184-95.<br />
179. Cho, E., et al., Prospective study of intake of fruits, vegetables, vitamins, and carotenoids and risk<br />
of age-related maculopathy. Arch Ophthalmol, 2004. 122(6): p. 883-92.<br />
180. Harland, J.I. and T.A. Haffner, Systematic review, meta-analysis and regression of randomised<br />
controlled trials reporting an association between an intake of circa 25g soya protein per day and<br />
blood cholesterol. Atherosclerosis, 2008. 200(1): p. 13-27.<br />
181. Deibert, P., et al., Weight loss without losing muscle mass in pre-obese and obese subjects<br />
induced by a high-soy-protein diet. International Journal of Obesity, 2004. 28(10): p. 1349-<br />
1352.<br />
182. Liao, F.H., et al., Effectiveness of a soy-based compared with a traditional low-calorie diet on<br />
weight loss and lipid levels in overweight adults. Nutrition, 2007. 23(7-8): p. 551-6.<br />
183. St-Onge, M.P., et al., Supplementation with soy-protein-rich foods does not enhance weight loss. J<br />
Am Diet Assoc, 2007. 107(3): p. 500-505.<br />
184. Akhter, M., et al., <strong>Dietary</strong> soy and isoflavone intake and risk of colorectal cancer in the Japan<br />
public health center-based prospective study. Cancer Epidemiol Biomarkers Prev, 2008. 17(8):<br />
p. 2128-35.<br />
185. Deneo-Pellegrini, H., et al., Plant foods and differences between colon and rectal cancers. Eur J<br />
Cancer Prev, 2002. 11(4): p. 369.<br />
186. Michels, K.B., et al., Fruit and vegetable consumption and colorectal adenomas in the Nurses'<br />
<strong>Health</strong> Study. Cancer Res, 2006. 66(7): p. 3942-53.<br />
187. Oba, S., et al., Soy product consumption and the risk of colon cancer: a prospective study in<br />
Takayama, Japan. Nutr Cancer, 2007. 57(2): p. 151-7.<br />
188. Yang, G., et al., Prospective cohort study of soy food intake and colorectal cancer risk in women.<br />
Am J Clin Nutr, 2009. 89(2): p. 577-83.<br />
<strong>DRAFT</strong> <strong>Australian</strong> <strong>Dietary</strong> <strong>Guidelines</strong>- December 2011 222
189. Ward, H.A., et al., Breast, colorectal, and prostate cancer risk in the European Prospective<br />
Investigation into Cancer and Nutrition–Norfolk in relation to phytoestrogen intake derived from an<br />
improved database. Am J Clin Nutr, 2010. 91(2): p. 440.<br />
190. Booth, A., et al., <strong>Dietary</strong> approaches for weight loss with increased intakes of fruit, vegetables<br />
and dairy products. Nutr Diet, 2008. 65(2): p. 115-120.<br />
191. Conceição de Oliveira, M., R. Sichieri, and A. Sanchez Moura, Weight loss associated with a<br />
daily intake of three apples or three pears among overweight women. Nutrition, 2003. 19(3): p.<br />
253-256.<br />
192. Drapeau, V., et al., Modifications in food-group consumption are related to long-term body-weight<br />
changes. Am J Clin Nutr, 2004. 80(1): p. 29-37.<br />
193. Rodriguez, M.C., et al., Effects of two energy-restricted diets containing different fruit amounts on<br />
body weight loss and macronutrient oxidation. Plant Foods Hum Nutr, 2005. 60(4): p. 219-24.<br />
194. Riboli, E. and T. Norat, Epidemiologic evidence of the protective effect of fruit and vegetables on<br />
cancer risk. Am J Clin Nutr, 2003. 78(3 Suppl): p. 559S-569S.<br />
195. Gaudet, M.M., et al., Fruits, vegetables, and micronutrients in relation to breast cancer modified<br />
by menopause and hormone receptor status. Cancer Epidemiol Biomarkers Prev, 2004. 13(9):<br />
p. 1485-94.<br />
196. Hermann, S., J. Linseisen, and J. Chang-Claude, Nutrition and breast cancer risk by age 50: a<br />
population-based case-control study in Germany. Nutr Cancer, 2002. 44(1): p. 23-34.<br />
197. Kruk, J., Association of lifestyle and other risk factors with breast cancer according to menopausal<br />
status: a case-control study in the Region of Western Pomerania (Poland). Asian Pac J Cancer<br />
Prev, 2007. 8(4): p. 513-24.<br />
198. Malin, A.S., et al., Intake of fruits, vegetables and selected micronutrients in relation to the risk of<br />
breast cancer. International journal of cancer. Journal international du cancer, 2003. 105(3):<br />
p. 413-8.<br />
199. van Gils, C.H., et al., Consumption of vegetables and fruits and risk of breast cancer. J Am Med<br />
Assoc, 2005. 293(2): p. 183-93.<br />
200. McCullough, M.L., et al., A prospective study of fruits, vegetables, and risk of endometrial cancer.<br />
Am J Epidemiol, 2007. 166(8): p. 902-11.<br />
201. Oh, S.-Y., et al., Relationship of nutrients and food to colorectal cancer risk in Koreans. Nutr Res,<br />
2005. 25(9): p. 805-813.<br />
<strong>DRAFT</strong> <strong>Australian</strong> <strong>Dietary</strong> <strong>Guidelines</strong>- December 2011 223
202. Sato, Y., et al., Fruit and vegetable consumption and risk of colorectal cancer in Japan: The Miyagi<br />
Cohort Study. Public <strong>Health</strong> Nutr, 2005. 8(3): p. 309-14.<br />
203. Wu, H., et al., Fruit and vegetable intakes are associated with lower risk of colorectal adenomas. J<br />
Nutr, 2009. 139(2): p. 340-4.<br />
204. Hamilton, C.A., Low-density lipoprotein and oxidised low-density lipoprotein: their role in the<br />
development of atherosclerosis. Pharmacol Ther, 1997. 74(1): p. 55-72.<br />
205. Thompson, H.J., et al., <strong>Dietary</strong> botanical diversity affects the reduction of oxidative biomarkers in<br />
women due to high vegetable and fruit intake. J Nutr, 2006. 136(8): p. 2207.<br />
206. Wannamethee, S.G., et al., Associations of vitamin C status, fruit and vegetable intakes, and<br />
markers of inflammation and hemostasis. Am J Clin Nutr, 2006. 83(3): p. 567-74; quiz 726-7.<br />
207. Jialal, I. and U. Singh, Is vitamin C an antiinflammatory agent? Am J Clin Nutr, 2006. 83(3): p.<br />
525.<br />
208. Tavani, A. and C. La Vecchia, [beta]-Carotene and risk of coronary heart disease. A review of<br />
observational and intervention studies. Biomedecine & Pharmacotherapy, 1999. 53(9): p. 409-<br />
416.<br />
209. Messina, M.J., Legumes and soybeans: overview of their nutritional profiles and health effects. Am<br />
J Clin Nutr, 1999. 70(3): p. 439S.<br />
210. Nagata, C., Factors to consider in the association between soy isoflavone intake and breast cancer<br />
risk. Journal of Epidemiology, 2010(0): p. 1002160133.<br />
211. Willett, W.C., Fruits, vegetables, and cancer prevention: turmoil in the produce section. J Natl<br />
Cancer Inst, 2010. 102(8): p. 510-1.<br />
212. Giovannucci, E., Alcohol, one-carbon metabolism, and colorectal cancer: recent insights from<br />
molecular studies. J Nutr, 2004. 134(9): p. 2475S-2481S.<br />
213. Zhang, S.M., et al., Plasma folate, vitamin B6, vitamin B12, homocysteine, and risk of breast<br />
cancer. J Natl Cancer Inst, 2003. 95(5): p. 373-80.<br />
214. García-Lafuente, A., et al., Flavonoids as anti-inflammatory agents: implications in cancer and<br />
cardiovascular disease. Inflammation Research, 2009. 58(9): p. 537-552.<br />
215. Lippman, S.M., et al., Effect of selenium and vitamin E on risk of prostate cancer and other<br />
cancers: the Selenium and Vitamin E Cancer Prevention Trial (SELECT). J Am Med Assoc, 2009.<br />
301(1): p. 39-51.<br />
<strong>DRAFT</strong> <strong>Australian</strong> <strong>Dietary</strong> <strong>Guidelines</strong>- December 2011 224
216. Paolini, M., et al., Beta-carotene: a cancer chemopreventive agent or a co-carcinogen? Mutat Res,<br />
2003. 543(3): p. 195-200.<br />
217. Khan, N., F. Afaq, and H. Mukhtar, Cancer chemoprevention through dietary antioxidants:<br />
progress and promise. Antioxidants & Redox Signaling, 2008. 10(3): p. 475-510.<br />
218. Bingham, S.A., et al., <strong>Dietary</strong> fibre in food and protection against colorectal cancer in the<br />
European Prospective Investigation into Cancer and Nutrition (EPIC): an observational study.<br />
Lancet, 2003. 361(9368): p. 1496-1501.<br />
219. Inskip, H.M., et al., Women’s compliance with nutrition and lifestyle recommendations before<br />
pregnancy: general population cohort study. Br Med J, 2009. 338.<br />
220. New Zealand Ministry of <strong>Health</strong>, Food and nutrition guidelines for healthy pregnant and<br />
breastfeeding women: a background paper, 2006 (revised 2008), New Zealand Ministry of<br />
<strong>Health</strong>: Wellington.<br />
221. Birch L, Development of food preferences. Annual Review of Nutrition, 1999. 19: p. 41-62.<br />
222. Lussi A, M.B., Peter Shellis R, Wang X., Analysis of the erosive effect of different dietary<br />
substances and medications. Br J Nutr, 2011. 30: p. 1-11.<br />
223. Tasmanian School Canteen Association Inc. The Cool Canteen Accreditation Program. 2011<br />
[cited 2011 30 June]; Available from: http://www.tascanteenassn.org.au/coolcap.<br />
224. Office of Learning and Teaching, Go for your life school canteens and other school food services<br />
policy, 2006, Department of Education: Melbourne.<br />
225. Northern Territory Government, Canteen, nutrition and health eating policy, D.o.E.a.<br />
Training, Editor 2009: Darwin.<br />
226. New South Wales Department of <strong>Health</strong> and New South Wales Department of Education<br />
and Training, Fresh tastes @ school NSW healthy school canteen strategy, 2006, NSW<br />
Department of <strong>Health</strong> & NSW Department of Education and Training,: Sydney.<br />
227. Government of Western Australia, <strong>Health</strong>y food and drink, Department of Education, Editor<br />
2008.<br />
228. Government of South Australia, Right bite, healthy food and drink supply strategy for south<br />
<strong>Australian</strong> schools and preschools, Government of South Australia, Editor 2008: Adelaide<br />
229. Dick, M., et al., Smart choices – healthy food and drink supply strategy for queensland schools:<br />
evaluation report, Queensland health and department of education and training, Editor 2009:<br />
Brisbane<br />
<strong>DRAFT</strong> <strong>Australian</strong> <strong>Dietary</strong> <strong>Guidelines</strong>- December 2011 225
230. Commonwealth Department of <strong>Health</strong> and Ageing, <strong>Guidelines</strong> for healthy foods and drinks<br />
supplied in school canteens, 2010, Commonwealth of Australia: Canberra.<br />
231. AIHW, Australia's <strong>Health</strong> 2010, AIHW, Editor 2010, AIHW: Canberra.<br />
232. McDermott, R., et al., The health and nutrition of young indigenous women in north<br />
Queensland–intergenerational implications of poor food quality, obesity, diabetes, tobacco smoking<br />
and alcohol use. Public <strong>Health</strong> Nutr, 2009. 12(11): p. 2143-2149.<br />
233. Food Standards Australia New Zealand, Australia New Zealand Food Standards Code, 2011.<br />
234. Food Standards Australia and New Zealand, Standard 2.9.2 Foods for Infants, 2009.<br />
235. Jacobs et al, Whole-grain intake may reduce the risk of ischemic heart disease death in<br />
postmenopausal women: the Iowa Women's <strong>Health</strong> Study. American Journal of Clinical<br />
Nutrition, 1998. 68(2): p. 248-57.<br />
236. Anderson, J.W., Whole grains protect against atherosclerotic cardiovascular disease. Proc Nutr<br />
Soc, 2003. 62(1): p. 135-42.<br />
237. Berg, A., et al., Effect of an oat bran enriched diet on the atherogenic lipid profile in patients with<br />
an increased coronary heart disease risk. A controlled randomized lifestyle intervention study. Ann<br />
Nutr Metab, 2003. 47(6): p. 306-11.<br />
238. De Moura, F., Whole grain intake and cardiovascular disease and whole grain intake and<br />
diabetes: A review. Life Sciences Research Organization: Bethesda, MD, 2008.<br />
239. Djousse, L. and J.M. Gaziano, Breakfast cereals and risk of heart failure in the physicians' health<br />
study I. Arch Intern Med, 2007. 167(19): p. 2080-5.<br />
240. Erkkila, A.T., et al., Cereal fiber and whole-grain intake are associated with reduced progression<br />
of coronary-artery atherosclerosis in postmenopausal women with coronary artery disease. Am<br />
Heart J, 2005. 150(1): p. 94-101.<br />
241. Flight, I. and P. Clifton, Cereal grains and legumes in the prevention of coronary heart disease<br />
and stroke: a review of the literature. Eur J Clin Nutr, 2006. 60(10): p. 1145-59.<br />
242. Jacobs, D.R., Jr. and D.D. Gallaher, Whole grain intake and cardiovascular disease: a review.<br />
Curr Atheroscler Rep, 2004. 6(6): p. 415-23.<br />
243. Katcher, H.I., et al., The effects of a whole grain-enriched hypocaloric diet on cardiovascular<br />
disease risk factors in men and women with metabolic syndrome. Am J Clin Nutr, 2008. 87(1):<br />
p. 79-90.<br />
<strong>DRAFT</strong> <strong>Australian</strong> <strong>Dietary</strong> <strong>Guidelines</strong>- December 2011 226
244. Kelly, S.A., et al., Wholegrain cereals for coronary heart disease. Cochrane Database Syst Rev,<br />
2007(2): p. CD005051.<br />
245. Liu, S., et al., A prospective study of dietary fiber intake and risk of cardiovascular disease among<br />
women. J Am Coll Cardiol, 2002. 39(1): p. 49-56.<br />
246. Liu, S., et al., Is intake of breakfast cereals related to total and cause-specific mortality in men?<br />
Am J Clin Nutr, 2003. 77(3): p. 594.<br />
247. Negri, E., et al., Fiber intake and risk of nonfatal acute myocardial infarction. Eur J Clin Nutr,<br />
2003. 57(3): p. 464-70.<br />
248. Nettleton, J.A., et al., Incident heart failure is associated with lower whole-grain intake and<br />
greater high-fat dairy and egg intake in the Atherosclerosis Risk in Communities (ARIC) study. J Am<br />
Diet Assoc, 2008. 108(11): p. 1881-1887.<br />
249. Ortega, R.M., et al., Responses to two weight-loss programs based on approximating the diet to<br />
the ideal: differences associated with increased cereal or vegetable consumption. International<br />
Journal for Vitamin & Nutrition Research, 2006. 76(6): p. 367-76.<br />
250. Pereira, M.A., et al., <strong>Dietary</strong> fiber and risk of coronary heart disease: a pooled analysis of cohort<br />
studies. Arch Intern Med, 2004. 164(4): p. 370-6.<br />
251. Rave, K., et al., Improvement of insulin resistance after diet with a whole-grain based dietary<br />
product: results of a randomized, controlled cross-over study in obese subjects with elevated fasting<br />
blood glucose. Br J Nutr, 2007. 98(5): p. 929-36.<br />
252. Truswell, A.S., Cereal grains and coronary heart disease. Eur J Clin Nutr, 2002. 56(1): p. 1-14.<br />
253. de Munter, J.S., et al., Whole grain, bran, and germ intake and risk of type 2 diabetes: a<br />
prospective cohort study and systematic review. PLoS Med, 2007. 4(8): p. e261.<br />
254. Henry, C.J.K., et al., Use of low-glycaemic index bread to reduce 24-h blood glucose: implications<br />
for dietary advice to non-diabetic and diabetic subjects. International journal of food sciences<br />
and nutrition, 2006. 57(3-4): p. 273-278.<br />
255. Hodge, A.M., et al., Glycemic index and dietary fiber and the risk of type 2 diabetes. Diabetes<br />
Care, 2004. 27(11): p. 2701-6.<br />
256. Krishnan, S., et al., Glycemic index, glycemic load, and cereal fiber intake and risk of type 2<br />
diabetes in US black women. Arch Intern Med, 2007. 167(21): p. 2304-9.<br />
257. Pereira, M.A., et al., Effect of whole grains on insulin sensitivity in overweight hyperinsulinemic<br />
adults. Am J Clin Nutr, 2002. 75(5): p. 848-55.<br />
<strong>DRAFT</strong> <strong>Australian</strong> <strong>Dietary</strong> <strong>Guidelines</strong>- December 2011 227
258. Priebe, M.G., et al., Whole grain foods for the prevention of type 2 diabetes mellitus. Cochrane<br />
Database Syst Rev, 2008(1): p. CD006061.<br />
259. Venn, B.J. and J.I. Mann, Cereal grains, legumes and diabetes. Eur J Clin Nutr, 2004. 58(11): p.<br />
1443-61.<br />
260. Andersson, A., et al., Whole-grain foods do not affect insulin sensitivity or markers of lipid<br />
peroxidation and inflammation in healthy, moderately overweight subjects. J Nutr, 2007. 137(6):<br />
p. 1401-7.<br />
261. De La Hunty, A. and M. Ashwell, Are people who regularly eat breakfast cereals slimmer than<br />
those who don't? A systematic review of the evidence. Nutrition Bulletin, 2007. 32(2): p. 118-<br />
128.<br />
262. Gilhooly, C.H., et al., Use of cereal fiber to facilitate adherence to a human caloric restriction<br />
program. Aging Clin Exp Res, 2008. 20(6): p. 513-20.<br />
263. Hallfrisch, J., D.J. Scholfield, and K.M. Behall, Blood pressure reduced by whole grain diet<br />
containing barley or whole wheat and brown rice in moderately hypercholesterolemic men. Nutr<br />
Res, 2003. 23(12): p. 1631-1642.<br />
264. Hamedani, A., et al., Reduced energy intake at breakfast is not compensated for at lunch if a<br />
high-insoluble-fiber cereal replaces a low-fiber cereal. Am J Clin Nutr, 2009. 89(5): p. 1343-<br />
1349.<br />
265. Huus, K., et al., Relationship of food frequencies as reported by parents to overweight and obesity<br />
at 5 years. Acta Paediatr, 2009. 98(1): p. 139-43.<br />
266. Lightowler, H.J. and C.J.K. Henry, An investigation of the effectiveness of ready-to-eat breakfast<br />
cereals in weight loss: comparison between single and mixed varieties. Nutrition Bulletin, 2009.<br />
34(1): p. 48-53.<br />
267. Ortega, R.M., et al., Changes in thiamin intake and blood levels in young, overweight/obese<br />
women following hypocaloric diets based on the increased relative consumption of cereals or<br />
vegetables. Eur J Clin Nutr, 2007. 61(1): p. 77-82.<br />
268. Rodriguez-Rodriguez, E., et al., Changes in the sensation of hunger and well-being before and<br />
after meals in overweight/obese women following two types of hypoenergetic diet. Public <strong>Health</strong><br />
Nutr, 2009. 12(1): p. 44-50.<br />
269. Waller, S.M., et al., Evening ready-to-eat cereal consumption contributes to weight management. J<br />
Am Coll Nutr, 2004. 23(4): p. 316-21.<br />
<strong>DRAFT</strong> <strong>Australian</strong> <strong>Dietary</strong> <strong>Guidelines</strong>- December 2011 228
270. Williams, P.G., et al., Cereal grains, legumes, and weight management: a comprehensive review<br />
of the scientific evidence. Nutr Rev, 2008. 66(4): p. 171-82.<br />
271. Asano, T. and R.S. McLeod, <strong>Dietary</strong> fibre for the prevention of colorectal adenomas and<br />
carcinomas. Cochrane Database Syst Rev, 2002(2): p. CD003430.<br />
272. Jacobs, E.T., et al., Fiber, sex, and colorectal adenoma: results of a pooled analysis. Am J Clin<br />
Nutr, 2006. 83(2): p. 343-9.<br />
273. La Vecchia, C., et al., Session: whole cereal grains, fibre and human cancer wholegrain cereals<br />
and cancer in Italy. Proc Nutr Soc, 2003. 62(1): p. 45-9.<br />
274. Peters, U., et al., <strong>Dietary</strong> fibre and colorectal adenoma in a colorectal cancer early detection<br />
programme. Lancet, 2003. 361(9368): p. 1491-1495.<br />
275. Schatzkin, A., et al., <strong>Dietary</strong> fiber and whole-grain consumption in relation to colorectal cancer in<br />
the NIH-AARP Diet and <strong>Health</strong> Study. Am J Clin Nutr, 2007. 85(5): p. 1353-60.<br />
276. Theuwissen, E. and R.P. Mensink, Water-soluble dietary fibers and cardiovascular disease.<br />
Physiol Behav, 2008. 94(2): p. 285-92.<br />
277. Kerckhoffs, D.A., et al., Effects on the human serum lipoprotein profile of beta-glucan, soy<br />
protein and isoflavones, plant sterols and stanols, garlic and tocotrienols. J Nutr, 2002. 132(9): p.<br />
2494-505.<br />
278. Beck, E.J., et al., Oat beta-glucan increases postprandial cholecystokinin levels, decreases insulin<br />
response and extends subjective satiety in overweight subjects. Mol Nutr Food Res, 2009.<br />
53(10): p. 1343-51.<br />
279. Toden, S., et al., Effects of dietary beef and chicken with and without high amylose maize starch<br />
on blood malondialdehyde, interleukins, IGF-I, insulin, leptin, MMP-2, and TIMP-2 concentrations in<br />
rats. Nutr Cancer, 2010. 62(4): p. 454.<br />
280. Lazaridou, A. and C. Biliaderis, Molecular aspects of cereal [beta]-glucan functionality: physical<br />
properties, technological applications and physiological effects. Journal of Cereal Science, 2007.<br />
46(2): p. 101-118.<br />
281. Liu, R.H., Whole grain phytochemicals and health. Journal of Cereal Science, 2007. 46(3): p.<br />
207-219.<br />
282. Slavin, J., Why whole grains are protective: biological mechanisms. Proc Nutr Soc, 2003. 62(1):<br />
p. 129-34.<br />
<strong>DRAFT</strong> <strong>Australian</strong> <strong>Dietary</strong> <strong>Guidelines</strong>- December 2011 229
283. De-Regil, L.M., et al. Effects and safety of periconceptional folate supplementation for preventing<br />
birth defects. 2010. DOI: 10.1002/14651858.CD007950.pub2.<br />
284. Food Standards Australia New Zealand, Thinking about having a baby?, 2010, Food Standards<br />
Australia New Zealand.<br />
285. Food Standards Australia and New Zealand. Folic acid / Folate. 2011 [cited 2011 12 May ];<br />
Available from:<br />
http://www.foodstandards.gov.au/consumerinformation/adviceforpregnantwomen/folicacidf<br />
olateandpr4598.cfm.<br />
286. National Institute for Clinical Studies, Encouraging periconceptional use of folic acid<br />
supplements, in Evidence–practice gaps report, volume 2.2005, National Institute for Clinical<br />
Studies: Melbourne.<br />
287. Sinha, R., et al., Meat intake and mortality: a prospective study of over half a million people. Arch<br />
Intern Med, 2009. 169(6): p. 562-71.<br />
288. Brink, M., et al., Meat consumption and K-ras mutations in sporadic colon and rectal cancer in<br />
The Netherlands Cohort Study. Br J Cancer, 2005. 92(7): p. 1310-20.<br />
289. Chan, A.T., et al., Prospective study of N-acetyltransferase-2 genotypes, meat intake, smoking<br />
and risk of colorectal cancer. Int J Cancer, 2005. 115(4): p. 648-52.<br />
290. Kabat, G.C., et al., A cohort study of dietary iron and heme iron intake and risk of colorectal<br />
cancer in women. Br J Cancer, 2007. 97(1): p. 118-22.<br />
291. Larsson, S.C. and A. Wolk, Meat consumption and risk of colorectal cancer: a meta-analysis of<br />
prospective studies. Int J Cancer, 2006. 119(11): p. 2657-64.<br />
292. Lee, S.A., et al., Animal origin foods and colorectal cancer risk: a report from the Shanghai<br />
Women's <strong>Health</strong> Study. Nutr Cancer, 2009. 61(2): p. 194-205.<br />
293. Norat, T., et al., Meat consumption and colorectal cancer risk: dose-response meta-analysis of<br />
epidemiological studies. Int J Cancer, 2002. 98(2): p. 241-56.<br />
294. Oba, S., et al., The relationship between the consumption of meat, fat, and coffee and the risk of<br />
colon cancer: a prospective study in Japan. Cancer Lett, 2006. 244(2): p. 260-267.<br />
295. Sato, Y., et al., Meat consumption and risk of colorectal cancer in Japan: the Miyagi Cohort Study.<br />
Eur J Cancer Prev, 2006. 15(3): p. 211.<br />
296. Seow, A., et al., Food groups and the risk of colorectal carcinoma in an Asian population. Cancer,<br />
2002. 95(11): p. 2390-2396.<br />
<strong>DRAFT</strong> <strong>Australian</strong> <strong>Dietary</strong> <strong>Guidelines</strong>- December 2011 230
297. Garcia-Closas, R., et al., Food, nutrient and heterocyclic amine intake and the risk of bladder<br />
cancer. Eur J Cancer, 2007. 43(11): p. 1731-40.<br />
298. Larsson, S.C., et al., Meat intake and bladder cancer risk in a Swedish prospective cohort.<br />
Cancer Causes Control, 2009. 20(1): p. 35-40.<br />
299. Koutros, S., et al., Meat and meat mutagens and risk of prostate cancer in the Agricultural<br />
<strong>Health</strong> Study. Cancer Epidemiol Biomarkers Prev, 2008. 17(1): p. 80-7.<br />
300. Mori, M., et al., Traditional Japanese diet and prostate cancer. Mol Nutr Food Res, 2009.<br />
53(2): p. 191-200.<br />
301. Chan, J.M., F. Wang, and E.A. Holly, Pancreatic cancer, animal protein and dietary fat in a<br />
population-based study, San Francisco Bay Area, California. Cancer Causes Control, 2007.<br />
18(10): p. 1153-67.<br />
302. Iso, H., et al., Intake of fish and n3 fatty acids and risk of coronary heart disease among<br />
Japanese: the Japan Public <strong>Health</strong> Center-Based (JPHC) Study Cohort I. Circulation, 2006.<br />
113(2): p. 195.<br />
303. Virtanen, J.K., et al., Fish consumption and risk of major chronic disease in men. Am J Clin Nutr,<br />
2008. 88(6): p. 1618-25.<br />
304. Whelton, S.P., et al., Meta-analysis of observational studies on fish intake and coronary heart<br />
disease. Am J Cardiol, 2004. 93(9): p. 1119-23.<br />
305. Yamagishi, K., et al., Fish, omega-3 polyunsaturated fatty acids, and mortality from cardiovascular<br />
diseases in a nationwide community-based cohort of Japanese men and women the JACC (Japan<br />
Collaborative Cohort Study for Evaluation of Cancer Risk) Study. J Am Coll Cardiol, 2008.<br />
52(12): p. 988-96.<br />
306. Folsom, A.R. and Z. Demissie, Fish intake, marine omega-3 fatty acids, and mortality in a cohort<br />
of postmenopausal women. Am J Epidemiol, 2004. 160(10): p. 1005-10.<br />
307. He, K., et al., Accumulated evidence on fish consumption and coronary heart disease mortality: a<br />
meta-analysis of cohort studies. Circulation, 2004. 109(22): p. 2705-11.<br />
308. Jarvinen, R., et al., Intake of fish and long-chain n-3 fatty acids and the risk of coronary heart<br />
mortality in men and women. Br J Nutr, 2006. 95(4): p. 824-9.<br />
309. Kaushik, S., et al., Frequency of fish consumption, retinal microvascular signs and vascular<br />
mortality. Microcirculation, 2008. 15(1): p. 27-36.<br />
<strong>DRAFT</strong> <strong>Australian</strong> <strong>Dietary</strong> <strong>Guidelines</strong>- December 2011 231
310. Konig, A., et al., A quantitative analysis of fish consumption and coronary heart disease mortality.<br />
Am J Prev Med, 2005. 29(4): p. 335-46.<br />
311. Nakamura, Y., et al., Association between fish consumption and all-cause and cause-specific<br />
mortality in Japan: NIPPON DATA80, 1980-99. Am J Med, 2005. 118(3): p. 239-245.<br />
312. Ness, A., et al., Diet in childhood and adult cardiovascular and all cause mortality: the Boyd Orr<br />
cohort. Heart, 2005. 91(7): p. 894.<br />
313. Streppel, M.T., et al., Long-term fish consumption and n-3 fatty acid intake in relation to (sudden)<br />
coronary heart disease death: the Zutphen study. Eur Heart J, 2008. 29(16): p. 2024-30.<br />
314. Bouzan, C., et al., A quantitative analysis of fish consumption and stroke risk. Am J Prev Med,<br />
2005. 29(4): p. 347-52.<br />
315. Ding, E.L. and D. Mozaffarian, Optimal dietary habits for the prevention of stroke. Semin<br />
Neurol, 2006. 26(1): p. 11-23.<br />
316. Gochfeld, M. and J. Burger, Good fish/bad fish: a composite benefit-risk by dose curve.<br />
Neurotoxicology, 2005. 26(4): p. 511-20.<br />
317. Barberger-Gateau, P., et al., <strong>Dietary</strong> patterns and risk of dementia: the three-city cohort study.<br />
Neurology, 2007. 69(20): p. 1921-30.<br />
318. Huang, T., et al., Benefits of fatty fish on dementia risk are stronger for those without APOE 4.<br />
Neurology, 2005. 65(9): p. 1409.<br />
319. Kalmijn, S., et al., <strong>Dietary</strong> intake of fatty acids and fish in relation to cognitive performance at<br />
middle age. Neurology, 2004. 62(2): p. 275.<br />
320. Morris, M.C., et al., Fish consumption and cognitive decline with age in a large community study.<br />
Arch Neurol, 2005. 62(12): p. 1849-53.<br />
321. van Gelder, B.M., et al., Fish consumption, n-3 fatty acids, and subsequent 5-y cognitive decline in<br />
elderly men: the Zutphen Elderly Study. Am J Clin Nutr, 2007. 85(4): p. 1142-7.<br />
322. Weih, M., J. Wiltfang, and J. Kornhuber, Non-pharmacologic prevention of Alzheimer's disease:<br />
nutritional and life-style risk factors. J Neural Transm, 2007. 114(9): p. 1187-97.<br />
323. Larrieu, S., et al., Nutritional factors and risk of incident dementia in the PAQUID longitudinal<br />
cohort. Journal of Nutrition, <strong>Health</strong> & Aging, 2004. 8(3): p. 150-154.<br />
<strong>DRAFT</strong> <strong>Australian</strong> <strong>Dietary</strong> <strong>Guidelines</strong>- December 2011 232
324. Maclean, C.H., et al., Effects of omega-3 fatty acids on cognitive function with aging, dementia,<br />
and neurological diseases. Evidence Report: Technology Assessment (Summary), 2005(114):<br />
p. 1-3.<br />
325. Schiepers, O.J., et al., Plasma phospholipid fatty acid status and depressive symptoms: association<br />
only present in the clinical range. J Affect Disord, 2009. 118(1-3): p. 209-14.<br />
326. Sontrop, J. and M.K. Campbell, Omega-3 polyunsaturated fatty acids and depression: a review of<br />
the evidence and a methodological critique. Prev Med, 2006. 42(1): p. 4-13.<br />
327. Sanchez-Villegas, A., et al., Long chain omega-3 fatty acids intake, fish consumption and mental<br />
disorders in the SUN cohort study. European journal of nutrition, 2007. 46(6): p. 337-46.<br />
328. Colangelo, L.A., et al., Higher dietary intake of long-chain omega-3 polyunsaturated fatty acids is<br />
inversely associated with depressive symptoms in women. Nutrition, 2009. 25(10): p. 1011-9.<br />
329. Kyrozis, A., et al., <strong>Dietary</strong> lipids and geriatric depression scale score among elders: The EPIC-<br />
Greece cohort. J Psychiatr Res, 2009. 43(8): p. 763-769.<br />
330. Chong, E.W., et al., <strong>Dietary</strong> omega-3 fatty acid and fish intake in the primary prevention of agerelated<br />
macular degeneration: a systematic review and meta-analysis. Arch Ophthalmol, 2008.<br />
126(6): p. 826-33.<br />
331. Djousse, L., et al., Egg consumption and risk of type 2 diabetes in men and women. Diabetes<br />
Care, 2009. 32(2): p. 295-300.<br />
332. Sauvaget, C., et al., Intake of animal products and stroke mortality in the Hiroshima/Nagasaki<br />
Life Span Study. Int J Epidemiol, 2003. 32(4): p. 536-43.<br />
333. Kramer Michael, S. and R. Kakuma, Maternal dietary antigen avoidance during pregnancy or<br />
lactation, or both, for preventing or treating atopic disease in the child. Cochrane Database Syst<br />
Rev, 2006(3).<br />
334. Chakrabarty, G., et al., The effect of ingestion of egg on serum lipid profile in healthy young freeliving<br />
subjects. Indian J Physiol Pharmacol, 2002. 46(4): p. 492-8.<br />
335. Chakrabarty, G., et al., The effect of ingestion of egg on the serum lipid profile of healthy young<br />
Indians. Indian J Physiol Pharmacol, 2004. 48(3): p. 286-92.<br />
336. Djousse, L. and J.M. Gaziano, Egg consumption in relation to cardiovascular disease and<br />
mortality: the Physicians' <strong>Health</strong> Study. Am J Clin Nutr, 2008. 87(4): p. 964-9.<br />
<strong>DRAFT</strong> <strong>Australian</strong> <strong>Dietary</strong> <strong>Guidelines</strong>- December 2011 233
337. Gillingham, L.G., et al., The effects of consuming docosahexaenoic acid (DHA)-enriched eggs on<br />
serum lipids and fatty acid compositions in statin-treated hypercholesterolemic male patients. Food<br />
research international, 2005. 38(10): p. 1117-1123.<br />
338. Goodrow, E.F., et al., Consumption of one egg per day increases serum lutein and zeaxanthin<br />
concentrations in older adults without altering serum lipid and lipoprotein cholesterol<br />
concentrations. J Nutr, 2006. 136(10): p. 2519.<br />
339. Harman, N.L., A.R. Leeds, and B.A. Griffin, Increased dietary cholesterol does not increase<br />
plasma low density lipoprotein when accompanied by an energy-restricted diet and weight loss.<br />
European journal of nutrition, 2008. 47(6): p. 287-293.<br />
340. Katz, D.L., et al., Egg consumption and endothelial function: a randomized controlled crossover<br />
trial. Int J Cardiol, 2005. 99(1): p. 65-70.<br />
341. Lee, J.Y., et al., Consumption of omega-3 fatty acid-enriched eggs and serum lipids in humans.<br />
Journal of nutraceuticals, functional & medical foods, 2003. 4(1): p. 3-13.<br />
342. Maki, K.C., et al., Lipid responses in mildly hypertriglyceridemic men and women to consumption<br />
of docosahexaenoic acid-enriched eggs. Int J Vitam Nutr Res, 2003. 73(5): p. 357-68.<br />
343. Makrides, M., et al., Nutritional effect of including egg yolk in the weaning diet of breast-fed and<br />
formula-fed infants: a randomized controlled trial. Am J Clin Nutr, 2002. 75(6): p. 1084-92.<br />
344. Nakamura, Y., et al., Egg consumption, serum total cholesterol concentrations and coronary heart<br />
disease incidence: Japan Public <strong>Health</strong> Center-based prospective study. Br J Nutr, 2006. 96(5): p.<br />
921-8.<br />
345. Nakamura, Y., et al., Egg consumption, serum cholesterol, and cause-specific and all-cause<br />
mortality: the National Integrated Project for Prospective Observation of Non-communicable<br />
Disease and Its Trends in the Aged, 1980 (NIPPON DATA80). Am J Clin Nutr, 2004. 80(1): p.<br />
58.<br />
346. Ohman, M., et al., Biochemical effects of consumption of eggs containing omega-3<br />
polyunsaturated fatty acids. Ups J Med Sci, 2008. 113(3): p. 315-23.<br />
347. Rose, E.L. and B.J. Holub, Effects of a liquid egg product containing fish oil on selected<br />
cardiovascular disease risk factors: A randomized crossover trial. Food research international,<br />
2006. 39(8): p. 910-916.<br />
348. Sindelar, C.A., et al., Serum lipids of physically active adults consuming omega-3 fatty acidenriched<br />
eggs or conventional eggs. Nutr Res, 2004. 24(9): p. 731-739.<br />
<strong>DRAFT</strong> <strong>Australian</strong> <strong>Dietary</strong> <strong>Guidelines</strong>- December 2011 234
349. Vander Wal, J.S., et al., Egg breakfast enhances weight loss. Int J Obes (Lond), 2008. 32(10):<br />
p. 1545-51.<br />
350. Vislocky, L.M., et al., Habitual consumption of eggs does not alter the beneficial effects of<br />
endurance training on plasma lipids and lipoprotein metabolism in untrained men and women.<br />
The Journal of Nutritional Biochemistry, 2009. 20(1): p. 26-34.<br />
351. Wenzel, A.J., et al., A 12-wk egg intervention increases serum zeaxanthin and macular pigment<br />
optical density in women. J Nutr, 2006. 136(10): p. 2568-73.<br />
352. Alper, C.M. and R.D. Mattes, Peanut consumption improves indices of cardiovascular disease risk<br />
in healthy adults. J Am Coll Nutr, 2003. 22(2): p. 133-41.<br />
353. Hyson, D.A., B.O. Schneeman, and P.A. Davis, Almonds and almond oil have similar effects on<br />
plasma lipids and LDL oxidation in healthy men and women. J Nutr, 2002. 132(4): p. 703.<br />
354. Kocyigit, A., A.A. Koylu, and H. Keles, Effects of pistachio nuts consumption on plasma lipid<br />
profile and oxidative status in healthy volunteers. Nutr Metab Cardiovasc Dis, 2006. 16(3): p.<br />
202-209.<br />
355. Sabate, J., et al., Serum lipid response to the graduated enrichment of a Step I diet with almonds:<br />
a randomized feeding trial. Am J Clin Nutr, 2003. 77(6): p. 1379-84.<br />
356. Spaccarotella, K.J., et al., The effect of walnut intake on factors related to prostate and vascular<br />
health in older men. Nutr J, 2008. 7: p. 13.<br />
357. Fraser, G.E., et al., Effect on body weight of a free 76 kilojoule (320 calorie) daily supplement of<br />
almonds for six months. J Am Coll Nutr, 2002. 21(3): p. 275.<br />
358. Sabate, J., Nut consumption and change in weight: the weight of the evidence. Br J Nutr, 2007.<br />
98(3): p. 456-7.<br />
359. Kuhnle, G.G.C., et al., Diet-induced endogenous formation of nitroso compounds in the GI tract.<br />
Free Radical Biology and Medicine, 2007. 43(7): p. 1040-1047.<br />
360. Ma, R.W. and K. Chapman, A systematic review of the effect of diet in prostate cancer<br />
prevention and treatment. J Hum Nutr Diet, 2009. 22(3): p. 187-99; quiz 200-2.<br />
361. Sofi, F., et al., Adherence to Mediterranean diet and health status: meta-analysis. Br Med J, 2008.<br />
337: p. a1344.<br />
362. UK Royal College of Obstericians and Gynaecologists, Nutrition in pregnancy (SAC opinion<br />
paper 18), 2010.<br />
<strong>DRAFT</strong> <strong>Australian</strong> <strong>Dietary</strong> <strong>Guidelines</strong>- December 2011 235
363. Ros, E., L.C. Tapsell, and J. Sabaté, Nuts and berries for heart health. Curr Atheroscler Rep,<br />
2010: p. 1-10.<br />
364. Segura, R., et al., Other relevant components of nuts: phytosterols, folate and minerals. Br J Nutr,<br />
2006. 96(Suppl 2): p. S36-44.<br />
365. Ziemke, F. and C.S. Mantzoros, Adiponectin in insulin resistance: lessons from translational<br />
research. Am J Clin Nutr, 2010. 91(1): p. 258S-261S.<br />
366. Mattes, R.D. and M.L. Dreher, Nuts and healthy body weight maintenance mechanisms. Asia<br />
Pac J Clin Nutr, 2010. 19(1): p. 137-41.<br />
367. Tapsell, L., et al., The effect of a calorie controlled diet containing walnuts on substrate oxidation<br />
during 8-hours in a room calorimeter. J Am Coll Nutr, 2009. 28(5): p. 611.<br />
368. Commonwealth Department of Agriculture Fisheries and <strong>For</strong>estry, Australia’s agriculture,<br />
fisheries and forestry at a glance 2010, 2010, Commonwealth Department of Agriculture,<br />
Fisheries and <strong>For</strong>estry: Canberra.<br />
369. Greer, F.R., S.H. Sicherer, and A. Burks, Effects of early nutritional interventions on the<br />
development of atopic disease in infants and children: the role of maternal dietary restriction,<br />
breastfeeding, timing of introduction of complementary foods, and hydrolyzed formulas. Pediatrics,<br />
2008. 121(1): p. 183.<br />
370. Host, A., et al., <strong>Dietary</strong> prevention of allergic diseases in infants and small children. Pediatr<br />
Allergy Immunol, 2008. 19(1): p. 1-4.<br />
371. Sicherer, S.H. and A.W. Burks, Maternal and infant diets for prevention of allergic diseases:<br />
understanding menu changes in 2008. J Allergy Clin Immunol, 2008. 122(1): p. 29-33.<br />
372. Prescott, S.L. and M.L. Tang, The Australasian Society of Clinical Immunology and Allergy position<br />
statement: Summary of allergy prevention in children. Med J Aust, 2005. 182(9): p. 464-7.<br />
373. Food Authority NSW. Sydney Harbour seafood and dioxins. 2010 [cited 2011 29 March];<br />
Available from: http://www.foodauthority.nsw.gov.au/consumers/keeping-food-safe/specialcare-foods/sydney-harbour-seafood/.<br />
374. Food Standards Australia New Zealand, Dioxins in food: dietary exposure assessment and risk<br />
characterisation, in Technical Report Series No. 272004: Canberra.<br />
375. Food and Agriculture Organization of the United Nations and the World <strong>Health</strong><br />
Organization, Joint FAO/WHO Expert Consultation on the risks and benefits of fish consumption,<br />
2010, Food and Agriculture Organization of the United Nations and the World <strong>Health</strong><br />
Organization: Rome.<br />
<strong>DRAFT</strong> <strong>Australian</strong> <strong>Dietary</strong> <strong>Guidelines</strong>- December 2011 236
376. Elwood, P.C., et al., The survival advantage of milk and dairy consumption: an overview of<br />
evidence from cohort studies of vascular diseases, diabetes and cancer. J Am Coll Nutr, 2008.<br />
27(6): p. 723S-34S.<br />
377. He, K., et al., <strong>Dietary</strong> fat intake and risk of stroke in male US healthcare professionals: 14 year<br />
prospective cohort study. Br Med J, 2003. 327(7418): p. 777-82.<br />
378. Alonso, A., et al., Low-fat dairy consumption and reduced risk of hypertension: the Seguimiento<br />
Universidad de Navarra (SUN) cohort. Am J Clin Nutr, 2005. 82(5): p. 972-9.<br />
379. Engberink, M.F., et al., Dairy intake, blood pressure, and incident hypertension in a general Dutch<br />
population. J Nutr, 2009. 139(3): p. 582-7.<br />
380. Toledo, E., et al., Low-fat dairy products and blood pressure: follow-up of 2290 older persons at<br />
high cardiovascular risk participating in the PREDIMED study. Br J Nutr, 2009. 101(01): p. 59-<br />
67.<br />
381. Wang, L., et al., <strong>Dietary</strong> intake of dairy products, calcium, and vitamin D and the risk of<br />
hypertension in middle-aged and older women. Hypertension, 2008. 51(4): p. 1073.<br />
382. Pereira, M.A., et al., Dairy consumption, obesity, and the insulin resistance syndrome in young<br />
adults: the CARDIA Study. J Am Med Assoc, 2002. 287(16): p. 2081-9.<br />
383. Lutsey, P.L., L.M. Steffen, and J. Stevens, <strong>Dietary</strong> intake and the development of the metabolic<br />
syndrome: the Atherosclerosis Risk in Communities study. Circulation, 2008. 117(6): p. 754-61.<br />
384. Pittas, A.G., et al., The role of vitamin D and calcium in type 2 diabetes. A systematic review and<br />
meta-analysis. J Clin Endocrinol Metab, 2007. 92(6): p. 2017-29.<br />
385. Barr, S.I., Increased dairy product or calcium intake: is body weight or composition affected in<br />
humans? J Nutr, 2003. 133(1): p. 245S-248S.<br />
386. Lanou, A.J. and N.D. Barnard, Dairy and weight loss hypothesis: an evaluation of the clinical<br />
trials. Nutr Rev, 2008. 66(5): p. 272-279.<br />
387. Rajpathak, S.N., et al., Calcium and dairy intakes in relation to long-term weight gain in US men.<br />
Am J Clin Nutr, 2006. 83(3): p. 559-66.<br />
388. Rosell, M., N.N. Hakansson, and A. Wolk, Association between dairy food consumption and<br />
weight change over 9 y in 19,352 perimenopausal women. Am J Clin Nutr, 2006. 84(6): p.<br />
1481-8.<br />
389. Wagner, G., et al., Effects of various forms of calcium on body weight and bone turnover markers<br />
in women participating in a weight loss program. J Am Coll Nutr, 2007. 26(5): p. 456-61.<br />
<strong>DRAFT</strong> <strong>Australian</strong> <strong>Dietary</strong> <strong>Guidelines</strong>- December 2011 237
390. Berkey, C.S., et al., Sugar-added beverages and adolescent weight change. Obes Res, 2004.<br />
12(5): p. 778-88.<br />
391. Berkey, C.S., et al., Milk, dairy fat, dietary calcium, and weight gain: a longitudinal study of<br />
adolescents. Arch Pediatr Adolesc Med, 2005. 159(6): p. 543-50.<br />
392. Johnson, L., et al., Is sugar-sweetened beverage consumption associated with increased fatness in<br />
children? Nutrition, 2007. 23(7-8): p. 557-563.<br />
393. Newby, P.K., et al., Beverage consumption is not associated with changes in weight and body<br />
mass index among low-income preschool children in North Dakota. J Am Diet Assoc, 2004.<br />
104(7): p. 1086-1094.<br />
394. Striegel-Moore, R.H., et al., Correlates of beverage intake in adolescent girls: the National Heart,<br />
Lung, and Blood Institute Growth and <strong>Health</strong> Study. J Pediatr, 2006. 148(2): p. 183-7.<br />
395. Cho, E., et al., Dairy foods, calcium, and colorectal cancer: a pooled analysis of 10 cohort studies.<br />
J Natl Cancer Inst, 2004. 96(13): p. 1015-22.<br />
396. Huncharek, M., J. Muscat, and B. Kupelnick, Colorectal cancer risk and dietary intake of<br />
calcium, vitamin D, and dairy products: a meta-analysis of 26,335 cases from 60 observational<br />
studies. Nutr Cancer, 2009. 61(1): p. 47-69.<br />
397. Sellers, T.A., et al., Unpasteurized milk consumption and subsequent risk of cancer. Cancer<br />
Causes Control, 2008. 19(8): p. 805-11.<br />
398. Lee, J.E., et al., Intakes of coffee, tea, milk, soda and juice and renal cell cancer in a pooled<br />
analysis of 13 prospective studies. Int J Cancer, 2007. 121(10): p. 2246-53.<br />
399. Alvarez-Leon, E.E., B. Roman-Vinas, and L. Serra-Majem, Dairy products and health: a review<br />
of the epidemiological evidence. Br J Nutr, 2006. 96(Suppl 1): p. S94-9.<br />
400. Missmer, S.A., et al., Meat and dairy food consumption and breast cancer: a pooled analysis of<br />
cohort studies. Int J Epidemiol, 2002. 31(1): p. 78-85.<br />
401. Bandera, E.V., et al., Consumption of animal foods and endometrial cancer risk: a systematic<br />
literature review and meta-analysis. Cancer Causes Control, 2007. 18(9): p. 967-88.<br />
402. Bonjour, J.P., et al., Inhibition of bone turnover by milk intake in postmenopausal women. Br J<br />
Nutr, 2008. 100(4): p. 866-74.<br />
403. Hartman, J.W., et al., Consumption of fat-free fluid milk after resistance exercise promotes<br />
greater lean mass accretion than does consumption of soy or carbohydrate in young, novice, male<br />
weightlifters. Am J Clin Nutr, 2007. 86(2): p. 373.<br />
<strong>DRAFT</strong> <strong>Australian</strong> <strong>Dietary</strong> <strong>Guidelines</strong>- December 2011 238
404. Javaid, M.K., et al., Maternal and seasonal predictors of change in calcaneal quantitative<br />
ultrasound during pregnancy. J Clin Endocrinol Metab, 2005. 90(9): p. 5182-7.<br />
405. Lanou, A.J., S.E. Berkow, and N.D. Barnard, Calcium, dairy products, and bone health in<br />
children and young adults: a reevaluation of the evidence. Pediatrics, 2005. 115(3): p. 736-43.<br />
406. Teegarden, D., et al., <strong>Dietary</strong> calcium intake protects women consuming oral contraceptives from<br />
spine and hip bone loss. J Clin Endocrinol Metab, 2005. 90(9): p. 5127-33.<br />
407. Volek, J.S., et al., Increasing fluid milk favorably affects bone mineral density responses to<br />
resistance training in adolescent boys. J Am Diet Assoc, 2003. 103(10): p. 1353-6.<br />
408. Feskanich, D., W.C. Willett, and G.A. Colditz, Calcium, vitamin D, milk consumption, and hip<br />
fractures: a prospective study among postmenopausal women. Am J Clin Nutr, 2003. 77(2): p.<br />
504.<br />
409. Kanis, J.A., et al., A meta-analysis of milk intake and fracture risk: low utility for case finding.<br />
Osteoporos Int, 2005. 16(7): p. 799-804.<br />
410. Mensink, R.P., et al., Effects of dietary fatty acids and carbohydrates on the ratio of serum total to<br />
HDL cholesterol and on serum lipids and apolipoproteins: a meta-analysis of 60 controlled trials.<br />
Am J Clin Nutr, 2003. 77(5): p. 1146-55.<br />
411. Temme, E., R.P. Mensink, and G. Hornstra, Comparison of the effects of diets enriched in<br />
lauric, palmitic, or oleic acids on serum lipids and lipoproteins in healthy women and men. Am J<br />
Clin Nutr, 1996. 63(6): p. 897.<br />
412. Griffith, L.E., et al., The influence of dietary and nondietary calcium supplementation on blood<br />
pressure: an updated metaanalysis of randomized controlled trials. Am J Hypertens, 1999. 12(1<br />
Pt 1): p. 84-92.<br />
413. Clare, D.A. and H.E. Swaisgood, Bioactive milk peptides: a prospectus. J Dairy Sci, 2000.<br />
83(6): p. 1187-95.<br />
414. Bolland, M.J., et al., Effect of calcium supplements on risk of myocardial infarction and<br />
cardiovascular events: meta-analysis. Br Med J, 2010. 341: p. c3691.<br />
415. Bolland, M.J., et al., Calcium supplements with or without vitamin D and risk of cardiovascular<br />
events: reanalysis of the Women's <strong>Health</strong> Initiative limited access dataset and meta-analysis. BMJ,<br />
2011. 342: p. d2040.<br />
416. Green, J.H., C. Booth, and R. Bunning, Postprandial metabolic responses to milk enriched with<br />
milk calcium are different from responses to milk enriched with calcium carbonate. Asia Pac J Clin<br />
Nutr, 2003. 12(1): p. 109-19.<br />
<strong>DRAFT</strong> <strong>Australian</strong> <strong>Dietary</strong> <strong>Guidelines</strong>- December 2011 239
417. Resnick, L., et al., <strong>Dietary</strong> calcium modifies the pressor effects of dietary salt intake in essential<br />
hypertension. J Hypertens, 1986. 4(suppl 6): p. S679-S681.<br />
418. Kalkwarf, H.J., J.C. Khoury, and B.P. Lanphear, Milk intake during childhood and adolescence,<br />
adult bone density, and osteoporotic fractures in US women. Am J Clin Nutr, 2003. 77(1): p.<br />
257-65.<br />
419. Albala, C., et al., Effects of replacing the habitual consumption of sugar-sweetened beverages with<br />
milk in Chilean children. Am J Clin Nutr, 2008. 88(3): p. 605-611.<br />
420. Einarson, A., et al., Food-borne illnesses during pregnancy. Can Fam Physician, 2010. 56(9): p.<br />
869-70.<br />
421. Brand, J.C., et al., Lactose malabsorption in <strong>Australian</strong> Aboriginal children. Am J Clin Nutr, 1985.<br />
41(3): p. 620-2.<br />
422. Buttenshaw, R., et al. Lactose malabsorption and its temporal stability in Aboriginal children. in<br />
Proc Nutr Soc Aust. 1990.<br />
423. Shaukat, A., et al., Systematic review: effective management strategies for lactose intolerance.<br />
Ann Intern Med, 2010. 152(12): p. 797-803.<br />
424. Pfeil, L.A., P.R. Katz, and P.J. Davis, Water metabolism, in Geriatric nutrition: a comprehensive<br />
view, J.E. Morley, Z. Glick, and L.Z. Rubenstein, Editors. 1995, Raven Press: New York.<br />
425. Cheung, S.S. and T.M. McLellan, Influence of hydration status and fluid replacement on heat<br />
tolerance while wearing NBC protective clothing. European journal of applied physiology and<br />
occupational physiology, 1998. 77(1): p. 139-148.<br />
426. Hubbard, R.W. and L.E. Armstrong, The heat illnesses: biochemical, ultrastructural, and fluidelectrolyte<br />
considerations, in Human performance physiology and environmental medicine at<br />
terrestrial extremes, K.B. Pandolf, M.N. Sawka, and R.R. Gonzalez, Editors. 1988,<br />
Indianapolis: Benchmark Press, Inc. p. 305-360.<br />
427. Gardner, E., C. Ruxton, and A. Leeds, Black tea–helpful or harmful? A review of the evidence.<br />
Eur J Clin Nutr, 2006. 61(1): p. 3-18.<br />
428. Greenberg, J.A., G. Chow, and R.C. Ziegelstein, Caffeinated coffee consumption,<br />
cardiovascular disease, and heart valve disease in the elderly (from the Framingham Study). Am J<br />
Cardiol, 2008. 102(11): p. 1502-8.<br />
429. Kuriyama, S., The relation between green tea consumption and cardiovascular disease as<br />
evidenced by epidemiological studies. J Nutr, 2008. 138(8): p. 1548S.<br />
<strong>DRAFT</strong> <strong>Australian</strong> <strong>Dietary</strong> <strong>Guidelines</strong>- December 2011 240
430. Lagiou, P., et al., Intake of specific flavonoid classes and coronary heart disease--a case-control<br />
study in Greece. Eur J Clin Nutr, 2004. 58(12): p. 1643-8.<br />
431. Sesso, H.D., et al., Lack of association between tea and cardiovascular disease in college alumni.<br />
Int J Epidemiol, 2003. 32(4): p. 527.<br />
432. Fraser, M.L., G.S. Mok, and A.H. Lee, Green tea and stroke prevention: emerging evidence.<br />
Complement Ther Med, 2007. 15(1): p. 46-53.<br />
433. Okamoto, K., Habitual green tea consumption and risk of an aneurysmal rupture subarachnoid<br />
hemorrhage: a case-control study in Nagoya, Japan. Eur J Epidemiol, 2006. 21(5): p. 367-71.<br />
434. Tanabe, N., et al., Consumption of green and roasted teas and the risk of stroke incidence: results<br />
from the Tokamachi-Nakasato cohort study in Japan. Int J Epidemiol, 2008. 37(5): p. 1030-40.<br />
435. Arab, L., W. Liu, and D. Elashoff, Green and black tea consumption and risk of stroke: a metaanalysis.<br />
Stroke, 2009. 40(5): p. 1786-92.<br />
436. Hammar, N., et al., Association of boiled and filtered coffee with incidence of first nonfatal<br />
myocardial infarction: the SHEEP and the VHEEP study. J Intern Med, 2003. 253(6): p. 653-9.<br />
437. Klatsky, A.L., et al., The confounded relation of coffee drinking to coronary artery disease. Am J<br />
Cardiol, 2008. 101(6): p. 825-7.<br />
438. Rosner, S.A., et al., Coffee consumption and risk of myocardial infarction among older Swedish<br />
women. Am J Epidemiol, 2007. 165(3): p. 288.<br />
439. Sofi, F., et al., Coffee consumption and risk of coronary heart disease: a meta-analysis. Nutr<br />
Metab Cardiovasc Dis, 2007. 17(3): p. 209-23.<br />
440. Greenberg, J.A., et al., Coffee, tea and diabetes: the role of weight loss and caffeine. Int J Obes<br />
(Lond), 2005. 29(9): p. 1121-9.<br />
441. Hamer, M., et al., Prospective study of coffee and tea consumption in relation to risk of type 2<br />
diabetes mellitus among men and women: The Whitehall II study. Br J Nutr, 2008. 100(05): p.<br />
1046-1053.<br />
442. Hu, G., et al., Joint association of coffee consumption and other factors to the risk of type 2<br />
diabetes: a prospective study in Finland. Int J Obes (Lond), 2006. 30(12): p. 1742-9.<br />
443. Odegaard, A.O., et al., Coffee, tea, and incident type 2 diabetes: the Singapore Chinese <strong>Health</strong><br />
Study. Am J Clin Nutr, 2008. 88(4): p. 979-85.<br />
<strong>DRAFT</strong> <strong>Australian</strong> <strong>Dietary</strong> <strong>Guidelines</strong>- December 2011 241
444. Paynter, N.P., et al., Coffee and sweetened beverage consumption and the risk of type 2 diabetes<br />
mellitus: the atherosclerosis risk in communities study. Am J Epidemiol, 2006. 164(11): p. 1075-<br />
84.<br />
445. Smith, B., et al., Does coffee consumption reduce the risk of type 2 diabetes in individuals with<br />
impaired glucose? Diabetes Care, 2006. 29(11): p. 2385.<br />
446. van Dam, R.M. and F.B. Hu, Coffee consumption and risk of type 2 diabetes: a systematic review.<br />
J Am Med Assoc, 2005. 294(1): p. 97-104.<br />
447. van Dam, R.M., et al., Coffee, caffeine, and risk of type 2 diabetes: a prospective cohort study in<br />
younger and middle-aged U.S. women. Diabetes Care, 2006. 29(2): p. 398-403.<br />
448. Dubois, L., et al., Regular sugar-sweetened beverage consumption between meals increases risk<br />
of overweight among preschool-aged children. J Am Diet Assoc, 2007. 107(6): p. 924-934.<br />
449. Faith, M.S., et al., Fruit juice intake predicts increased adiposity gain in children from low-income<br />
families: weight status-by-environment interaction. Pediatrics, 2006. 118(5): p. 2066-75.<br />
450. <strong>For</strong>shee, R.A., P.A. Anderson, and M.L. Storey, Sugar-sweetened beverages and body mass<br />
index in children and adolescents: a meta-analysis. Am J Clin Nutr, 2008. 87(6): p. 1662-1671.<br />
451. Gibson, S., Sugar-sweetened soft drinks and obesity: a systematic review of the evidence from<br />
observational studies and interventions. Nutr Res Rev, 2008. 21(2): p. 134-147.<br />
452. Malik, V.S., M.B. Schulze, and F.B. Hu, Intake of sugar-sweetened beverages and weight gain: a<br />
systematic review. Am J Clin Nutr, 2006. 84(2): p. 274-288.<br />
453. Phillips, S.M., et al., Energy-dense snack food intake in adolescence: longitudinal relationship to<br />
weight and fatness. Obes Res, 2004. 12(3): p. 461-72.<br />
454. Sichieri, R., et al., School randomised trial on prevention of excessive weight gain by discouraging<br />
students from drinking sodas. Public <strong>Health</strong> Nutr, 2009. 12(2): p. 197-202.<br />
455. Stookey, J.D., et al., Replacing sweetened caloric beverages with drinking water is associated with<br />
lower energy intake. Obesity (Silver Spring), 2007. 15(12): p. 3013-22.<br />
456. Tam, C.S., et al., Soft drink consumption and excess weight gain in <strong>Australian</strong> school students:<br />
results from the Nepean study. Int J Obesity, 2006. 30(7): p. 1091-3.<br />
457. Taylor, R.W., et al., APPLE Project: 2-y findings of a community-based obesity prevention program<br />
in primary school age children. Am J Clin Nutr, 2007. 86(3): p. 735-42.<br />
<strong>DRAFT</strong> <strong>Australian</strong> <strong>Dietary</strong> <strong>Guidelines</strong>- December 2011 242
458. Vartanian, L.R., M.B. Schwartz, and K.D. Brownell, Effects of soft drink consumption on<br />
nutrition and health: a systematic review and meta-analysis. Am J Public <strong>Health</strong>, 2007. 97(4): p.<br />
667-75.<br />
459. Wolff, E. and M.L. Dansinger, Soft drinks and weight gain: how strong is the link? Medscape J<br />
Med, 2008. 10(8): p. 189.<br />
460. Pelucchi, C. and C. La Vecchia, Alcohol, coffee, and bladder cancer risk: a review of<br />
epidemiological studies. Eur J Cancer Prev, 2009. 18(1): p. 62-8.<br />
461. Villanueva, C.M., et al., Total and specific fluid consumption as determinants of bladder cancer<br />
risk. Int J Cancer, 2006. 118(8): p. 2040-2047.<br />
462. Zeegers, M.P.A., et al., The association between smoking, beverage consumption, diet and<br />
bladder cancer: a systematic literature review. World J Urol, 2004. 21(6): p. 392-401.<br />
463. Tang N, W.Y., Ma J, Mang B & Yu R., Coffee consumption and risk of lung cancer: A metaanalysis.<br />
Lung Cancer, 2009. (In Press at time of review).<br />
464. Tang, N., et al., Coffee consumption and risk of breast cancer: a metaanalysis. Am J Obstet<br />
Gynecol, 2009. 200(3): p. 290 e1-9.<br />
465. Michels, K.B., et al., Coffee, tea, and caffeine consumption and incidence of colon and rectal<br />
cancer. J Natl Cancer Inst, 2005. 97(4): p. 282-92.<br />
466. Lee, K.J., et al., Coffee consumption and risk of colorectal cancer in a population-based<br />
prospective cohort of Japanese men and women. Int J Cancer, 2007. 121(6): p. 1312-8.<br />
467. Tavani, A. and C. La Vecchia, Coffee, decaffeinated coffee, tea and cancer of the colon and<br />
rectum: a review of epidemiological studies, 1990-2003. Cancer Causes Control, 2004. 15(8):<br />
p. 743-57.<br />
468. Steevens, J., et al., Tea and coffee drinking and ovarian cancer risk: results from the Netherlands<br />
Cohort Study and a meta-analysis. Br J Cancer, 2007. 97(9): p. 1291-4.<br />
469. Song, Y.J., et al., Coffee, tea, colas, and risk of epithelial ovarian cancer. Cancer Epidemiol<br />
Biomarkers Prev, 2008. 17(3): p. 712-6.<br />
470. Silvera, S.A., et al., Intake of coffee and tea and risk of ovarian cancer: a prospective cohort<br />
study. Nutr Cancer, 2007. 58(1): p. 22-7.<br />
471. Bravi, F., et al., Coffee drinking and endometrial cancer risk: a metaanalysis of observational<br />
studies. Am J Obstet Gynecol, 2009. 200(2): p. 130-135.<br />
<strong>DRAFT</strong> <strong>Australian</strong> <strong>Dietary</strong> <strong>Guidelines</strong>- December 2011 243
472. Larsson, S.C., E. Giovannucci, and A. Wolk, Coffee consumption and stomach cancer risk in a<br />
cohort of Swedish women. Int J Cancer, 2006. 119(9): p. 2186-9.<br />
473. Bravi, F., et al., Coffee drinking and hepatocellular carcinoma risk: a meta-analysis. Hepatology,<br />
2007. 46(2): p. 430-5.<br />
474. Su, L.J. and L. Arab, Tea consumption and the reduced risk of colon cancer -- results from a<br />
national prospective cohort study. Public <strong>Health</strong> Nutr, 2002. 5(3): p. 419-25.<br />
475. Dora, I., et al., Black tea consumption and risk of rectal cancer in Moscow population. Ann<br />
Epidemiol, 2003. 13(6): p. 405-11.<br />
476. Kristensen, M., et al., Short-term effects on bone turnover of replacing milk with cola beverages:<br />
a 10-day interventional study in young men. Osteoporos Int, 2005. 16(12): p. 1803-8.<br />
477. Libuda, L., et al., Association between long-term consumption of soft drinks and variables of bone<br />
modeling and remodeling in a sample of healthy German children and adolescents. Am J Clin<br />
Nutr, 2008. 88(6): p. 1670.<br />
478. Manias, K., D. McCabe, and N. Bishop, Fractures and recurrent fractures in children; varying<br />
effects of environmental factors as well as bone size and mass. Bone, 2006. 39(3): p. 652-7.<br />
479. Tucker, K.L., et al., Colas, but not other carbonated beverages, are associated with low bone<br />
mineral density in older women: The Framingham Osteoporosis Study. Am J Clin Nutr, 2006.<br />
84(4): p. 936.<br />
480. Ahokas, J.T., et al., Review of water fluoridation and fluoride intake from discretionary fluoride<br />
supplements, 1999, National <strong>Health</strong> and Medical Research Council: Melbourne.<br />
481. Young, W.G., Tooth wear: diet analysis and advice. Int Dent J, 2005. 55(2): p. 68-72.<br />
482. Kazoullis, S., et al., Common dental conditions associated with dental erosion in schoolchildren in<br />
Australia. Pediatr Dent, 2007. 29(1): p. 33-9.<br />
483. American Academy of Pediatrics, Soft drinks in schools. Pediatrics, 2004. 113(1 Pt 1): p. 152-<br />
4.<br />
484. Keijzers, G.B., et al., Caffeine can decrease insulin sensitivity in humans. Diabetes Care, 2002.<br />
25(2): p. 364.<br />
485. Yoshioka, K., et al., Coffee consumption and risk of type 2 diabetes mellitus. Lancet, 2003.<br />
361(9358): p. 703.<br />
<strong>DRAFT</strong> <strong>Australian</strong> <strong>Dietary</strong> <strong>Guidelines</strong>- December 2011 244
486. Lopez-Ridaura, R., et al., Magnesium intake and risk of type 2 diabetes in men and women.<br />
Diabetes Care, 2004. 27(1): p. 134.<br />
487. Curin, Y. and R. Andriantsitohaina, Polyphenols as potential therapeutical agents against<br />
cardiovascular diseases. Pharmacological reports, 2005. 57: p. 97.<br />
488. Ratnayake, W.M. and C. Galli, Fat and fatty acid terminology, methods of analysis and fat<br />
digestion and metabolism: a background review paper. Ann Nutr Metab, 2009. 55(1-3): p. 8-43.<br />
489. Melanson, E.L., A. Astrup, and W.T. Donahoo, The relationship between dietary fat and fatty<br />
acid intake and body weight, diabetes, and the metabolic syndrome. Ann Nutr Metab, 2009.<br />
55(1-3): p. 229-243.<br />
490. Mozaffarian, D., R. Micha, and S. Wallace, Effects on coronary heart disease of increasing<br />
polyunsaturated fat in place of saturated fat: a systematic review and meta-analysis of randomized<br />
controlled trials. PLoS Med, 2010. 7(3): p. e1000252.<br />
491. Balk, E.M., et al., Effects of omega-3 fatty acids on coronary restenosis, intima-media thickness,<br />
and exercise tolerance: A systematic review. Atherosclerosis, 2006. 184(2): p. 237-246.<br />
492. Balk, E.M., et al., Effects of omega-3 fatty acids on serum markers of cardiovascular disease risk:<br />
a systematic review. Atherosclerosis, 2006. 189(1): p. 19-30.<br />
493. Castro, I.A., L.P. Barroso, and P. Sinnecker, Functional foods for coronary heart disease risk<br />
reduction: a meta-analysis using a multivariate approach. Am J Clin Nutr, 2005. 82(1): p. 32-40.<br />
494. Eslick, G.D., et al., Benefits of fish oil supplementation in hyperlipidemia: a systematic review and<br />
meta-analysis. Int J Cardiol, 2009. 136(1): p. 4-16.<br />
495. Hooper, L., et al., Omega 3 fatty acids for prevention and treatment of cardiovascular disease.<br />
Cochrane Database Syst Rev, 2004(4): p. CD003177.<br />
496. Lee, K.W. and G.Y.H. Lip, Effects of lifestyle on hemostasis, fibrinolysis, and platelet reactivity: a<br />
systematic review. Arch Intern Med, 2003. 163(19): p. 2368-2392.<br />
497. Studer, M., et al., Effect of different antilipidemic agents and diets on mortality: a systematic<br />
review. Arch Intern Med, 2005. 165(7): p. 725.<br />
498. Wang, C., et al., n-3 fatty acids from fish or fish-oil supplements, but not alpha-linolenic acid,<br />
benefit cardiovascular disease outcomes in primary- and secondary-prevention studies: a systematic<br />
review. Am J Clin Nutr, 2006. 84(1): p. 5-17.<br />
499. Wendland, E., et al., Effect of alpha linolenic acid on cardiovascular risk markers: a systematic<br />
review. Heart, 2006. 92(2): p. 166-169.<br />
<strong>DRAFT</strong> <strong>Australian</strong> <strong>Dietary</strong> <strong>Guidelines</strong>- December 2011 245
500. Food and Agriculture Organization of the United Nations and the World <strong>Health</strong><br />
Organization, Fats and fatty acids in human nutrition. Report of an expert consultation, 2010,<br />
Food and Agriculture Organization of the United Nations and the World <strong>Health</strong><br />
Organization: Rome.<br />
501. Ulbak, J., et al., Diet and blood pressure in 2.5-y-old Danish children. Am J Clin Nutr, 2004.<br />
79(6): p. 1095-1102.<br />
502. Schack-Nielsen, L., et al., Arterial stiffness in 10-year-old children: current and early<br />
determinants. Br J Nutr, 2005. 94(6): p. 1004-1011.<br />
503. Sanders, T.A.B., et al., Influence of an algal triacylglycerol containing docosahexaenoic acid<br />
(22:6n-3) and docosahentaenoic acid (22:5n-6) on cardiovascular risk factors in healthy men and<br />
women. Br J Nutr, 2006. 95(3): p. 525-531.<br />
504. Raitakari, O.T., et al., Endothelial function in healthy 11-year-old children after dietary<br />
intervention with onset in infancy: the Special Turku Coronary Risk Factor Intervention Project for<br />
children (STRIP). Circulation, 2005. 112(24): p. 3786-3794.<br />
505. Psaltopoulou, T., et al., Olive oil, the Mediterranean diet, and arterial blood pressure: the Greek<br />
European Prospective Investigation into Cancer and Nutrition (EPIC) study [corrected] [published<br />
erratum appears in AM J CLIN NUTR 2005 May;81(5):1181]. Am J Clin Nutr, 2004. 80(4): p.<br />
1012-1018.<br />
506. Perona, J.S., et al., Plasma lipid modifications in elderly people after administration of two virgin<br />
olive oils of the same variety (Olea europaea var. hojiblanca) with different triacylglycerol<br />
composition. Br J Nutr, 2003. 89(6): p. 819-26.<br />
507. Bondia-Pons, I., et al., Moderate consumption of olive oil by healthy European men reduces<br />
systolic blood pressure in non-Mediterranean participants. J Nutr, 2007. 137(1): p. 84-7.<br />
508. Alonso, A., et al., Olive oil consumption and reduced incidence of hypertension: the SUN study.<br />
Lipids, 2004. 39(12): p. 1233-8.<br />
509. Damsgaard, C.T., et al., Fish oil in combination with high or low intakes of linoleic acid lowers<br />
plasma triacylglycerols but does not affect other cardiovascular risk markers in healthy men. J<br />
Nutr, 2008. 138(6): p. 1061-1066.<br />
510. Berry, S.E., et al., The solid fat content of stearic acid-rich fats determines their postprandial<br />
effects. Am J Clin Nutr, 2007. 85(6): p. 1486-94.<br />
511. Eckel, R.H., et al., Carbohydrate balance predicts weight and fat gain in adults. Am J Clin Nutr,<br />
2006. 83(4): p. 803-808.<br />
<strong>DRAFT</strong> <strong>Australian</strong> <strong>Dietary</strong> <strong>Guidelines</strong>- December 2011 246
512. Kratz, M., et al., The impact of dietary fat composition on serum leptin concentrations in healthy<br />
nonobese men and women. Journal of Clinical Endocrinology & Metabolism, 2002. 87(11): p.<br />
5008-14.<br />
513. Lovegrove, J.A., et al., Moderate fish-oil supplementation reverses low-platelet, long-chain n-3<br />
polyunsaturated fatty acid status and reduces plasma triacylglycerol concentrations in British Indo-<br />
Asians. Am J Clin Nutr, 2004. 79(6): p. 974-982.<br />
514. Nicholls, S.J., et al., Consumption of saturated fat impairs the anti-inflammatory properties of<br />
high-density lipoproteins and endothelial function. J Am Coll Cardiol, 2006. 48(4): p. 715-720.<br />
515. Nosaka, N., et al., Effects of dietary medium-chain triacylglycerols on serum lipoproteins and<br />
biochemical parameters in healthy men. Bioscience, Biotechnology & Biochemistry, 2002.<br />
66(8): p. 1713-8.<br />
516. Owen, B. and T.M.S. Wolever, Effect of fat on glycaemic responses in normal subjects: a doseresponse<br />
study. Nutr Res, 2003. 23(10): p. 1341-1347.<br />
517. Rueda-Clausen, C.F., et al., Olive, soybean and palm oils intake have a similar acute detrimental<br />
effect over the endothelial function in healthy young subjects. Nutr Metab Cardiovasc Dis, 2007.<br />
17(1): p. 50-57.<br />
518. Tahvonen, R.L., et al., Black currant seed oil and fish oil supplements differ in their effects on<br />
fatty acid profiles of plasma lipids, and concentrations of serum total and lipoprotein lipids, plasma<br />
glucose and insulin. The Journal of Nutritional Biochemistry, 2005. 16(6): p. 353-359.<br />
519. Tholstrup, T., et al., Effects of butter high in ruminant trans and monounsaturated fatty acids on<br />
lipoproteins, incorporation of fatty acids into lipid classes, plasma C-reactive protein, oxidative<br />
stress, hemostatic variables, and insulin in healthy young men. Am J Clin Nutr, 2006. 83(2): p.<br />
237-243.<br />
520. MacLean, C.H., et al., Effects of omega-3 fatty acids on cancer risk: a systematic review. J Am<br />
Med Assoc, 2006. 295(4): p. 403-15.<br />
521. van de Rest, O., et al., Effect of fish-oil supplementation on mental well-being in older subjects: a<br />
randomized, double-blind, placebo-controlled trial. Am J Clin Nutr, 2008. 88(3): p. 706-13.<br />
522. Laitinen, M., et al., Fat intake at midlife and risk of dementia and Alzheimer's disease: a<br />
population-based study. Dementia and Geriatric Cognitive Disorders, 2006. 22(1): p. 99-107.<br />
523. Mamalakis, G., et al., Depression and serum adiponectin and adipose omega-3 and omega-6 fatty<br />
acids in adolescents. Pharmacology Biochemistry and Behavior, 2006. 85(2): p. 474-479.<br />
<strong>DRAFT</strong> <strong>Australian</strong> <strong>Dietary</strong> <strong>Guidelines</strong>- December 2011 247
524. Morris, M.C., et al., Consumption of fish and n-3 fatty acids and risk of incident Alzheimer<br />
disease. Arch Neurol, 2003. 60(7): p. 940-946.<br />
525. Hiroi, M., et al., The combination of genetic variations in the PRDX3 gene and dietary fat intake<br />
contribute to obesity risk. Obesity (Silver Spring), 2010.<br />
526. Fantuzzi, G., Adipose tissue, adipokines, and inflammation. J Allergy Clin Immunol, 2005.<br />
115(5): p. 911-919.<br />
527. Jain, S.S. and R.P. Bird, Elevated expression of tumor necrosis factor-alpha signaling molecules in<br />
colonic tumors of Zucker obese (fa/fa) rats. Int J Cancer, 2010. 127(9): p. 2042-50.<br />
528. Renehan, A.G., et al., Incident cancer burden attributable to excess body mass index in 30<br />
European countries. Int J Cancer, 2010. 126(3): p. 692-702.<br />
529. Alberti, K.G., et al., Harmonizing the metabolic syndrome: a joint interim statement of the<br />
International Diabetes Federation Task <strong>For</strong>ce on Epidemiology and Prevention; National Heart,<br />
Lung, and Blood Institute; American Heart Association; World Heart Federation; International<br />
Atherosclerosis Society; and International Association for the Study of Obesity. Circulation, 2009.<br />
120(16): p. 1640-5.<br />
530. Baghurst K, <strong>Dietary</strong> fats, marbling and human health. <strong>Australian</strong> Journal of Experimental<br />
Agriculture, 2004. 44: p. 635-644.<br />
531. National Heart Foundation of Australia (National Blood Pressure and Vascular Disease<br />
Advisory Committee), Guide to management of hypertension, 2008, National Heart<br />
Foundation of Australia.<br />
532. Sacks, F.M., et al., The effect of pravastatin on coronary events after myocardial infarction in<br />
patients with average cholesterol levels. N Engl J Med, 1996. 335(14): p. 1001-9.<br />
533. Ramsden, C.E., et al., n-6 fatty acid-specific and mixed polyunsaturate dietary interventions have<br />
different effects on CHD risk: a meta-analysis of randomised controlled trials. Br J Nutr, 2010.<br />
104(11): p. 1586-600.<br />
534. Brown, M.A., et al., <strong>Dietary</strong> fat and carbohydrate composition: Metabolic Disease. In, Fat<br />
Detection: taste, texture and post ingestive effects, F.i.N. Montmayeur J-P and leCoutre, Editor<br />
2010, CRC Press Florida.<br />
535. Galli, C. and P.C. Calder, Effects of fat and fatty acid intake on inflammatory and immune<br />
responses: a critical review. Ann Nutr Metab, 2009. 55(1-3): p. 123-39.<br />
536. Crawford, M.A., R.P. Bazinet, and A.J. Sinclair, Fat intake and CNS functioning: ageing and<br />
disease. Ann Nutr Metab, 2009. 55(1-3): p. 202-28.<br />
<strong>DRAFT</strong> <strong>Australian</strong> <strong>Dietary</strong> <strong>Guidelines</strong>- December 2011 248
537. Daniels, S.R. and F.R. Greer, Lipid screening and cardiovascular health in childhood. Pediatrics,<br />
2008. 122(1): p. 198-208.<br />
538. McGill, H.C., C.A. McMahan, and S.S. Gidding, Are pediatricians responsible for prevention of<br />
adult cardiovascular disease? Nat Clin Pract Cardiovasc Med, 2009. 6(1): p. 10-1.<br />
539. Niinikoski, H., et al., Impact of repeated dietary counseling between infancy and 14 years of age<br />
on dietary intakes and serum lipids and lipoproteins: the STRIP study. Circulation, 2007. 116(9):<br />
p. 1032.<br />
540. Clarke, R., et al., Cholesterol fractions and apolipoproteins as risk factors for heart disease<br />
mortality in older men. Arch Intern Med, 2007. 167(13): p. 1373-8.<br />
541. U.S. Department of <strong>Health</strong>, Education, and Welfare, <strong>Health</strong>y People - The Surgeon General's<br />
report on health promotion and disease prevention 1979, Washington D.C.: U.S. Department<br />
of <strong>Health</strong>, Education and Welfare.<br />
542. Chen, J., et al., Metabolic syndrome and salt sensitivity of blood pressure in non-diabetic people in<br />
China: a dietary intervention study.[see comment]. Lancet, 2009. 373(9666): p. 829-35.<br />
543. Charlton, K.E., et al., A food-based dietary strategy lowers blood pressure in a low socio-economic<br />
setting: a randomised study in South Africa. Public <strong>Health</strong> Nutr, 2008. 11(12): p. 1397-406.<br />
544. China Salt Substitute Study Collaborative, G., Salt substitution: a low-cost strategy for blood<br />
pressure control among rural Chinese. A randomized, controlled trial.[see comment]. J Hypertens,<br />
2007. 25(10): p. 2011-8.<br />
545. Takahashi, Y., et al., Blood pressure change in a free-living population-based dietary modification<br />
study in Japan. J Hypertens, 2006. 24(3): p. 451-458.<br />
546. Robertson, J.I. and J.I.S. Robertson, <strong>Dietary</strong> salt and hypertension: a scientific issue or a matter<br />
of faith? Journal of Evaluation in Clinical Practice, 2003. 9(1): p. 1-22.<br />
547. Obarzanek, E., et al., Individual blood pressure responses to changes in salt intake: results from<br />
the DASH-Sodium trial.[see comment]. Hypertension, 2003. 42(4): p. 459-67.<br />
548. Nowson, C.A., et al., Low-sodium dietary approaches to stop hypertension-type diet including<br />
lean red meat lowers blood pressure in postmenopausal women. Nutr Res, 2009. 29(1): p. 8-18.<br />
549. Melander, O., et al., Moderate salt restriction effectively lowers blood pressure and degree of salt<br />
sensitivity is related to baseline concentration of renin and N-terminal atrial natriuretic peptide in<br />
plasma. J Hypertens, 2007. 25(3): p. 619-627.<br />
<strong>DRAFT</strong> <strong>Australian</strong> <strong>Dietary</strong> <strong>Guidelines</strong>- December 2011 249
550. Kawano, Y., et al., Report of the working group for dietary salt reduction of the Japanese Society<br />
of Hypertension: (1) Rationale for salt restriction and salt-restriction target level for the<br />
management of hypertension. Hypertension Research - Clinical & Experimental, 2007.<br />
30(10): p. 879-86.<br />
551. Jürgens, G. and A. Graudal Niels, Effects of low sodium diet versus high sodium diet on blood<br />
pressure, renin, aldosterone, catecholamines, cholesterols, and triglyceride. Cochrane Database<br />
Syst Rev, 2004(1).<br />
552. Hooper, L., et al., Advice to reduce dietary salt for prevention of cardiovascular disease.[update of<br />
Cochrane Database Syst Rev. 2003;(3):CD003656; PMID: 12917977]. Cochrane Database<br />
Syst Rev, 2004(1): p. CD003656.<br />
553. He, F.J. and G.A. MacGregor, Effect of longer-term modest salt reduction on blood pressure.<br />
Cochrane Database Syst Rev, 2004(3): p. CD004937.<br />
554. Geleijnse, J.M., F.J. Kok, and D.E. Grobbee, Impact of dietary and lifestyle factors on the<br />
prevalence of hypertension in Western populations. European Journal of Public <strong>Health</strong>, 2004.<br />
14(3): p. 235-239.<br />
555. Geleijnse, J.M., F.J. Kok, and D.E. Grobbee, Blood pressure response to changes in sodium and<br />
potassium intake: a metaregression analysis of randomised trials. J Hum Hypertens, 2003. 17(7):<br />
p. 471-80.<br />
556. Dickinson, K.M., J.B. Keogh, and P.M. Clifton, Effects of a low-salt diet on flow-mediated<br />
dilatation in humans. Am J Clin Nutr, 2009. 89(2): p. 485-490.<br />
557. Dickinson, B.D. and S. Havas, Reducing the population burden of cardiovascular disease by<br />
reducing sodium intake: a report of the council on science and public health. Arch Intern Med,<br />
2007. 167(14): p. 1460-1468.<br />
558. Geleijnse, J.M. and D.E. Grobbee, High salt intake early in life: does it increase the risk of<br />
hypertension? J Hypertens, 2002. 20(11): p. 2121-2124.<br />
559. Beevers, D.G., The epidemiology of salt and hypertension. Clinical Autonomic Research, 2002.<br />
12(5): p. 353-7.<br />
560. Chang, H.Y., et al., Effect of potassium-enriched salt on cardiovascular mortality and medical<br />
expenses of elderly men. Am J Clin Nutr, 2006. 83(6): p. 1289-96.<br />
561. Cook, N.R., et al., Long term effects of dietary sodium reduction on cardiovascular disease<br />
outcomes: observational follow-up of the trials of hypertension prevention (TOHP). Br Med J,<br />
2007. 334(7599): p. 885-888.<br />
<strong>DRAFT</strong> <strong>Australian</strong> <strong>Dietary</strong> <strong>Guidelines</strong>- December 2011 250
562. Cook, N.R., et al., Joint effects of sodium and potassium intake on subsequent cardiovascular<br />
disease: the Trials of Hypertension Prevention follow-up study. Arch Intern Med, 2009. 169(1):<br />
p. 32-40.<br />
563. He, J., et al., <strong>Dietary</strong> sodium intake and incidence of congestive heart failure in overweight US<br />
men and women: first National <strong>Health</strong> and Nutrition Examination Survey Epidemiologic Follow-up<br />
Study. Arch Intern Med, 2002. 162(14): p. 1619-1624.<br />
564. Reddy, K.S. and M.B. Katan, Diet, nutrition and the prevention of hypertension and<br />
cardiovascular diseases... Diet, Nutrition and the Prevention of Chronic Diseases: scientific<br />
background papers of the Joint WHO/FAO Expert Consultation (Geneva, 28 January-1 February<br />
2002). Public <strong>Health</strong> Nutr, 2004. 7(1A): p. 167-186.<br />
565. Lawes, C.M., S. Vander Hoorn, and A. Rodgers, Global burden of blood-pressure-related<br />
disease, 2001. Lancet, 2008. 371(9623): p. 1513-8.<br />
566. Law, M.R., J.K. Morris, and N.J. Wald, Use of blood pressure lowering drugs in the prevention of<br />
cardiovascular disease: meta-analysis of 147 randomised trials in the context of expectations from<br />
prospective epidemiological studies. Br Med J, 2009. 338: p. b1665.<br />
567. Key, T.J., et al., Diet, nutrition and the prevention of cancer. Public <strong>Health</strong> Nutr, 2004. 7(1A):<br />
p. 187-200.<br />
568. Commonwealth Department of <strong>Health</strong>, <strong>Dietary</strong> guidelines for <strong>Australian</strong>s, 1982: Canberra,<br />
ACT.<br />
569. National <strong>Health</strong> and Medical Research Council, <strong>Dietary</strong> <strong>Guidelines</strong> for <strong>Australian</strong>s, 1992,<br />
Commonwealth of Australia: Canberra.<br />
570. Food Standards Australia and New Zealand, Final assessment report - Proposal P230 -<br />
Consideration of mandatory fortification with iodine for New Zeland, 2008, Food Standards<br />
Australia New Zealand.<br />
571. Duley, L. and D. Henderson-Smart, Reduced salt intake compared to normal dietary salt, or<br />
high intake, in pregnancy. Cochrane Database Syst Rev, 1999(2): p. CD001687.<br />
572. <strong>Australian</strong> Institute of <strong>Health</strong> and Welfare, <strong>Health</strong> expenditure Australia 2007-08, cat. no.<br />
HWE 46, 2009: Canberra, ACT.<br />
573. Fiorito, L.M., et al., Girls' early sweetened carbonated beverage intake predicts different patterns<br />
of beverage and nutrient intake across childhood and adolescence. J Am Diet Assoc, 2010.<br />
110(4): p. 543-550.<br />
<strong>DRAFT</strong> <strong>Australian</strong> <strong>Dietary</strong> <strong>Guidelines</strong>- December 2011 251
574. Libuda, L., et al., Pattern of beverage consumption and long-term association with body-weight<br />
status in German adolescents--results from the DONALD study. Br J Nutr, 2008. 99(6): p. 1370-<br />
9.<br />
575. Bes-Rastrollo, M., et al., Predictors of weight gain in a Mediterranean cohort: the Seguimiento<br />
Universidad de Navarra Study 1. Am J Clin Nutr, 2006. 83(2): p. 362-70; quiz 394-5.<br />
576. Palmer, J.R., et al., Sugar-sweetened beverages and incidence of type 2 diabetes mellitus in<br />
African American women. Arch Intern Med, 2008. 168(14): p. 1487-92.<br />
577. Laville, M. and J.A. Nazare, Diabetes, insulin resistance and sugars. Obes Rev, 2009. 10(Suppl<br />
1): p. 24-33.<br />
578. Esposito, K., et al., Prevention of type 2 diabetes by dietary patterns: a systematic review of<br />
prospective studies and meta-analysis. Metab Syndr Relat Disord, 2010. 8(6): p. 471-6.<br />
579. Malik, V.S., et al., Sugar-sweetened beverages and risk of metabolic syndrome and type 2<br />
diabetes: a meta-analysis. Diabetes Care, 2010. 33(11): p. 2477-83.<br />
580. Mann, J.I., A.S. Truswell, and E.B. Manning, Effects on serum lipids of reducing dietary sucrose or<br />
starch for 22 weeks in normal men. S Afr Med J, 1972. 46(25): p. 827-34.<br />
581. Silvera, S.A., et al., <strong>Dietary</strong> carbohydrates and breast cancer risk: a prospective study of the roles<br />
of overall glycemic index and glycemic load.[erratum appears in Int J Cancer. 2006 May<br />
1;118(9):2372]. Int J Cancer 2005. 114(4): p. 653-8.<br />
582. Michaud, D.S., et al., <strong>Dietary</strong> sugar, glycemic load, and pancreatic cancer risk in a prospective<br />
study. Journal of the National Cancer Institute, 2002. 94(17): p. 1293-300.<br />
583. Michaud, D.S., et al., <strong>Dietary</strong> glycemic load, carbohydrate, sugar, and colorectal cancer risk in<br />
men and women. Cancer Epidemiol Biomarkers Prev, 2005. 14(1): p. 138-47.<br />
584. De Stefani, E., et al., <strong>Dietary</strong> patterns and risk of bladder cancer: a factor analysis in Uruguay.<br />
Cancer Causes Control, 2008. 19(10): p. 1243-9.<br />
585. Nothlings, U., et al., <strong>Dietary</strong> glycemic load, added sugars, and carbohydrates as risk factors for<br />
pancreatic cancer: the Multiethnic Cohort Study. Am J Clin Nutr, 2007. 86(5): p. 1495-501.<br />
586. World Cancer Research Fund and American Institute for Cancer Research, Food, nutrition,<br />
and the prevention of cancer: a global perspective, 1997, American Institute for Cancer<br />
Research: Washington DC.<br />
587. Miller, W.D., Dental caries. Am J Dent Sci, 1883. 17: p. 77-130.<br />
<strong>DRAFT</strong> <strong>Australian</strong> <strong>Dietary</strong> <strong>Guidelines</strong>- December 2011 252
588. Burt, B.A., et al., The effects of sugars intake and frequency of ingestion on dental caries<br />
increment in a three-year longitudinal study. J Dent Res, 1988. 67(11): p. 1422-9.<br />
589. Warren, J.J., et al., A longitudinal study of dental caries risk among very young low SES children.<br />
Community Dent Oral Epidemiol, 2009. 37(2): p. 116-122.<br />
590. Ruottinen, S., et al., Sucrose intake since infancy and dental health in 10-year-old children.<br />
Caries research, 2000. 38(2): p. 142-148.<br />
591. Marshall, T.A., et al., Comparison of the intakes of sugars by young children with and without<br />
dental caries experience. J Am Dent Assoc, 2007. 138(1): p. 39.<br />
592. Levy, S.M., et al., Fluoride, beverages and dental caries in the primary dentition. Caries Res,<br />
2003. 37(3): p. 157-65.<br />
593. Anderson, C.A., et al., Sucrose and dental caries: a review of the evidence. Obes Rev, 2009.<br />
10(Suppl 1): p. 41-54.<br />
594. Gibson, S. and S. Williams, Dental caries in pre-school children: associations with social class,<br />
toothbrushing habit and consumption of sugars and sugar-containing foods. Further analysis of<br />
data from the National Diet and Nutrition Survey of children aged 1.5-4.5 years. Caries research,<br />
1999. 33(2): p. 101.<br />
595. American Academy of Pediatrics, Clinical Practice Guideline: Diagnosis and Evaluation of the<br />
Child With Attention-Deficit/Hyperactivity Disorder. Pediatrics, 2000. 105(5).<br />
596. Walsh, L.J., Preventive dentistry for the general dental practitioner. Aust Dent J, 2000. 45(2): p.<br />
76-82.<br />
597. Balakrishnan, M., R.S. Simmonds, and J.R. Tagg, Dental caries is a preventable infectious<br />
disease. Aust Dent J, 2000. 45(4): p. 235-245.<br />
598. Mattes, R.D., <strong>Dietary</strong> compensation by humans for supplemental energy provided as ethanol or<br />
carbohydrate in fluids. Physiol Behav, 1996. 59(1): p. 179-187.<br />
599. Raben, A., et al., Sucrose compared with artificial sweeteners: different effects on ad libitum food<br />
intake and body weight after 10 wk of supplementation in overweight subjects. Am J Clin Nutr,<br />
2002. 76(4): p. 721-9.<br />
600. Krebs-Smith, S.M., Choose beverages and foods to moderate your intake of sugars: measurement<br />
requires quantification. J Nutr, 2001. 131(2S-1): p. 527S-535S.<br />
<strong>DRAFT</strong> <strong>Australian</strong> <strong>Dietary</strong> <strong>Guidelines</strong>- December 2011 253
601. Marriott, B.P., et al., Intake of added sugars and selected nutrients in the United States, National<br />
<strong>Health</strong> and Nutrition Examination Survey (NHANES) 2003-2006. Crit Rev Food Sci Nutr,<br />
2010. 50(3): p. 228-58.<br />
602. Lam, M., et al., Children's acceptance of xylitol-based foods. Community Dent Oral Epidemiol,<br />
2000. 28(2): p. 97-101.<br />
603. Davies, M.J., et al., Dental caries among <strong>Australian</strong> Aboriginal, non-Aboriginal <strong>Australian</strong>-born, and<br />
overseas-born children. Bull World <strong>Health</strong> Organ, 1997. 75(3): p. 197.<br />
604. Chikritzhs, T., K. Fillmore, and T. Stockwell, A healthy dose of scepticism: Four good reasons to<br />
think again about protective effects of alcohol on coronary heart disease. Drug and Alcohol<br />
Review, 2009. 28(4): p. 441-444.<br />
605. Calabria, B., et al., Epidemiology of alcohol related burden of disease among Indigenous<br />
<strong>Australian</strong>s. Aust N Z J Public <strong>Health</strong>, 2010. 34: p. S47-S51.<br />
606. Chikritzhs, T.N., et al., Mortality and life-years lost due to alcohol: a comparison of acute and<br />
chronic causes. Med J Aust, 2001. 174(6): p. 281-284.<br />
607. Collins, D.J. and H.M. Lapsley, The costs of tobacco, alcohol and illicit drug abuse to <strong>Australian</strong><br />
society in 2004/05, 2008, Commonwealth Department of <strong>Health</strong> and Ageing: Canberra.<br />
608. Xiao, J., et al., Impact of Alcohol on the Population of Western Australia, D.o.H.W.<br />
Epidemiology Branch, Editor 2008.<br />
609. National <strong>Health</strong> and Medical Research Council, <strong>Australian</strong> <strong>Guidelines</strong> to Reduce <strong>Health</strong> Risks<br />
from Drinking Alcohol, 2009, Commonwealth of Australia: Canberra.<br />
610. Banwell, C., How many standard drinks are there in a glass of wine? Drug Alcohol Rev, 1999.<br />
18(1): p. 99-101.<br />
611. Arriola, L., et al., Alcohol intake and the risk of coronary heart disease in the Spanish EPIC cohort<br />
study. Heart, 2010. 96(2): p. 124-30.<br />
612. Simons, L.A., et al., Alcohol intake and survival in the elderly: a 77 month follow-up in the Dubbo<br />
study. Aust N Z J Med, 1996. 26(5): p. 662-70.<br />
613. Cullen, K.J., M.W. Knuiman, and N.J. Ward, Alcohol and mortality in Busselton, Western<br />
Australia. Am J Epidemiol, 1993. 137(2): p. 242-8.<br />
614. Costanzo, S., et al., Alcohol consumption and mortality in patients with cardiovascular disease: a<br />
meta-analysis. J Am Coll Cardiol, 2010. 55(13): p. 1339-47.<br />
<strong>DRAFT</strong> <strong>Australian</strong> <strong>Dietary</strong> <strong>Guidelines</strong>- December 2011 254
615. Ronksley, P.E., et al., Association of alcohol consumption with selected cardiovascular disease<br />
outcomes: a systematic review and meta-analysis. BMJ, 2011. 342: p. d671.<br />
616. Roerecke, M. and J. Rehm, Ischemic heart disease mortality and morbidity rates in former<br />
drinkers: a meta-analysis. Am J Epidemiol, 2011. 173(3): p. 245-258.<br />
617. Schooling, C.M., et al., Moderate alcohol use and mortality from ischaemic heart disease: a<br />
prospective study in older Chinese people. PLoS One, 2008. 3(6).<br />
618. Sierksma, A., et al., Moderate alcohol consumption reduces plasma C-reactive protein and<br />
fibrinogen levels; a randomized, diet-controlled intervention study. Eur J Clin Nutr, 2002. 56(11):<br />
p. 1130-6.<br />
619. Badia, E., et al., Decreased tumor necrosis factor-induced adhesion of human monocytes to<br />
endothelial cells after moderate alcohol consumption. Am J Clin Nutr, 2004. 80(1): p. 225-30.<br />
620. Hansen, A.S., et al., Effect of red wine and red grape extract on blood lipids, haemostatic factors,<br />
and other risk factors for cardiovascular disease. Eur J Clin Nutr, 2005. 59(3): p. 449-55.<br />
621. Tsang, C., et al., The influence of moderate red wine consumption on antioxidant status and<br />
indices of oxidative stress associated with CHD in healthy volunteers. Br J Nutr, 2005. 93(2): p.<br />
233-240.<br />
622. Avellone, G., et al., Effects of moderate Sicilian red wine consumption on inflammatory<br />
biomarkers of atherosclerosis. Eur J Clin Nutr, 2006. 60(1): p. 41-7.<br />
623. Addolorato, G., et al., Effects of short-term moderate alcohol administration on oxidative stress<br />
and nutritional status in healthy males. Appetite, 2008. 50(1): p. 50-56.<br />
624. Beulens, J.W.J., et al., Moderate alcohol consumption and lipoprotein-associated phospholipase<br />
A2 activity. Nutr Metab Cardiovasc Dis, 2008. 18(8): p. 539-544.<br />
625. Tousoulis, D., et al., Acute effects of different alcoholic beverages on vascular endothelium,<br />
inflammatory markers and thrombosis fibrinolysis system. Clinical Nutrition, 2008. 27(4): p.<br />
594-600.<br />
626. Costanzo, S., et al., Cardiovascular and overall mortality risk in relation to alcohol consumption in<br />
patients with cardiovascular disease. Circulation, 2010. 121(17): p. 1951.<br />
627. Bagnardi, V., et al., Does drinking pattern modify the effect of alcohol on the risk of coronary<br />
heart disease? Evidence from a meta-analysis. Journal of epidemiology and community health,<br />
2008. 62(7): p. 615.<br />
<strong>DRAFT</strong> <strong>Australian</strong> <strong>Dietary</strong> <strong>Guidelines</strong>- December 2011 255
628. Ma, X.J., et al., [Genetic characteristics of familial type 2 diabetes pedigrees: a preliminary analysis<br />
of 4468 persons from 715 pedigrees]. Zhonghua Yi Xue Za Zhi, 2008. 88(36): p. 2541-3.<br />
629. Taylor, B., et al., Alcohol and hypertension: gender differences in dose–response relationships<br />
determined through systematic review and meta analysis. Addiction, 2009. 104(12): p. 1981-<br />
1990.<br />
630. Savica, V., G. Bellinghieri, and J.D. Kopple, The effect of nutrition on blood pressure. Annu Rev<br />
Nutr, 2010. 30: p. 365-401.<br />
631. Hackam, D.G., et al., The 2010 Canadian Hypertension Education Program recommendations for<br />
the management of hypertension: part 2 - therapy. Can J Cardiol, 2010. 26(5): p. 249-58.<br />
632. National Stroke Foundation, Clinical <strong>Guidelines</strong> for Acute Stroke Management2007,<br />
Melbourne: National Stroke Foundation.<br />
633. Allen, N.E., et al., Moderate alcohol intake and cancer incidence in women. J Natl Cancer Inst,<br />
2009. 101(5): p. 296-305.<br />
634. Terry, M.B., et al., Lifetime alcohol intake and breast cancer risk. Ann Epidemiol, 2006. 16(3):<br />
p. 230-40.<br />
635. Petri, A.L., et al., Alcohol intake, type of beverage, and risk of breast cancer in pre- and<br />
postmenopausal women. Alcoholism: Clinical and Experimental Research, 2004. 28(7): p.<br />
1084-1090.<br />
636. Newcomb, P.A., et al., No difference between red wine or white wine consumption and breast<br />
cancer risk. Cancer Epidemiol Biomarkers Prev, 2009. 18(3): p. 1007-10.<br />
637. Li, Y., et al., Wine, liquor, beer and risk of breast cancer in a large population. European Journal<br />
of Cancer, 2009. 45(5): p. 843-50.<br />
638. Deandrea, S., et al., Alcohol and breast cancer risk defined by estrogen and progesterone receptor<br />
status: a case-control study. Cancer Epidemiol Biomarkers Prev, 2008. 17(8): p. 2025-8.<br />
639. Bessaoud, F. and J.P. Daurès, Patterns of alcohol (especially wine) consumption and breast<br />
cancer risk: a case-control study among a population in Southern France. Annals of<br />
Epidemiology, 2008. 18(6): p. 467-475.<br />
640. Fuchs, C.S., et al., The influence of folate and multivitamin use on the familial risk of colon cancer<br />
in women. Cancer Epidemiol Biomarkers Prev, 2002. 11(3): p. 227.<br />
641. Bongaerts, B.W., et al., Alcohol and the risk of colon and rectal cancer with mutations in the Kras<br />
gene. Alcohol, 2006. 38(3): p. 147-54.<br />
<strong>DRAFT</strong> <strong>Australian</strong> <strong>Dietary</strong> <strong>Guidelines</strong>- December 2011 256
642. Purdue, M.P., et al., Type of alcoholic beverage and risk of head and neck cancer--a pooled<br />
analysis within the INHANCE Consortium. Am J Epidemiol, 2009. 169(2): p. 132-42.<br />
643. Liang, W., et al., Mortality rate of alcoholic liver disease and risk of hospitalization for alcoholic<br />
liver cirrhosis, alcoholic hepatitis and alcoholic liver failure in Australia between 1993 and 2005.<br />
Internal Medicine Journal, 2011. 41(1a): p. 34-41.<br />
644. Rehm, J., et al., Alcohol as a risk factor for liver cirrhosis: a systematic review and meta analysis.<br />
Drug and Alcohol Review, 2010. 29(4): p. 437-445.<br />
645. Stampfer, M.J., et al., Effects of moderate alcohol consumption on cognitive function in women. N<br />
Engl J Med, 2005. 352(3): p. 245-53.<br />
646. Solfrizzi, V., et al., Alcohol consumption, mild cognitive impairment, and progression to dementia.<br />
Neurology, 2007. 68(21): p. 1790-9.<br />
647. Ruitenberg, A., et al., Alcohol consumption and risk of dementia: the Rotterdam Study. Lancet,<br />
2002. 359(9303): p. 281-6.<br />
648. Luchsinger, J.A., et al., Alcohol intake and risk of dementia. J Am Geriatr Soc, 2004. 52(4): p.<br />
540-6.<br />
649. Letenneur, L., S. Larrieu, and P. Barberger-Gateau, Alcohol and tobacco consumption as risk<br />
factors of dementia: a review of epidemiological studies. Biomedecine & Pharmacotherapy,<br />
2004. 58(2): p. 95-99.<br />
650. Harper, C., The neuropathology of alcohol-specific brain damage, or does alcohol damage the<br />
brain? Journal of Neuropathology & Experimental Neurology, 1998. 57(2): p. 101.<br />
651. Deng, J., et al., A 2-year follow-up study of alcohol consumption and risk of dementia. Clin<br />
Neurol Neurosurg, 2006. 108(4): p. 378-83.<br />
652. Brown, S.A. and S.F. Tapert, Adolescence and the trajectory of alcohol use: basic to clinical<br />
studies. Annals of the New York Academy of Sciences, 2004. 1021(1): p. 234-244.<br />
653. Cargiulo, T., Understanding the health impact of alcohol dependence. Am J <strong>Health</strong> Syst Pharm,<br />
2007. 64(5 Suppl 3): p. S5-11.<br />
654. Chen, C.Y. and C.L. Storr, Alcohol use and health-related quality of life among youth in Taiwan.<br />
Journal of Adolescent <strong>Health</strong>, 2006. 39(5): p. 752. e9-752. e16.<br />
655. Deas, D. and E.S. Brown, Adolescent substance abuse and psychiatric comorbidities. J Clin<br />
Psychiatry, 2006. 67(7): p. e02.<br />
<strong>DRAFT</strong> <strong>Australian</strong> <strong>Dietary</strong> <strong>Guidelines</strong>- December 2011 257
656. Turner, R.J. and A.G. Gil, Psychiatric and substance use disorders in South Florida: racial/ethnic<br />
and gender contrasts in a young adult cohort. Archives of General Psychiatry, 2002. 59(1): p.<br />
43.<br />
657. National <strong>Health</strong> and Medical Research Council, <strong>Australian</strong> Alcohol <strong>Guidelines</strong>: health risks and<br />
benefits, 2001, Commonwealth of Australia: Canberra.<br />
658. Truswell, A.S., <strong>Australian</strong> experience with the Wernicke-Korsakoff syndrome. Addiction, 2000.<br />
95(6): p. 829-32.<br />
659. Rolland, S. and A.S. Truswell, Wernicke-Korsakoff syndrome in Sydney hospitals after 6 years of<br />
thiamin enrichment of bread. Public <strong>Health</strong> Nutr, 1998. 1(2): p. 117-22.<br />
660. Edenberg, H.J., The genetics of alcohol metabolism: role of alcohol dehydrogenase and aldehyde<br />
dehydrogenase variants. Alcohol Res <strong>Health</strong>, 2007. 30(1): p. 5-13.<br />
661. Whitfield, J.B. and N.G. Martin, Alcohol consumption and alcohol pharmacokinetics: interactions<br />
within the normal population. Alcoholism: Clinical and Experimental Research, 1994. 18(2): p.<br />
238-243.<br />
662. Li, T.-K., et al., Gender and ethnic differences in alcohol metabolism. Alcoholism: Clinical and<br />
Experimental Research, 1998. 22(3): p. 771-772.<br />
663. Bellis, M.D., et al., Prefrontal cortex, thalamus, and cerebellar volumes in adolescents and young<br />
adults with adolescent onset alcohol use disorders and comorbid mental disorders. Alcohol Clin<br />
Exp Res, 2005. 29(9): p. 1590-1600.<br />
664. White, A.M. and H.S. Swartzwelder, Hippocampal function during adolescence: a unique target<br />
of ethanol effects. Annals of the New York Academy of Sciences, 2004. 1021(1): p. 206-220.<br />
665. Brinton, E.A., Effects of ethanol intake on lipoproteins and atherosclerosis. Curr Opin Lipidol,<br />
2010. 21(4): p. 346-51.<br />
666. American Diabetes Association, Nutrition recommendations and interventions for diabetes: a<br />
position statement of the American Diabetes Association. Diabetes Care, 2007. 30(Suppl 1): p.<br />
S48-65.<br />
667. CMP Medica, MIMS Annual 2007, 2007, CMP Medica: St Leonards, NSW.<br />
668. Lee, Y., et al., Systematic review of health behavioral risks and cognitive health in older adults. Int<br />
Psychogeriatr, 2010. 22(2): p. 174-87.<br />
<strong>DRAFT</strong> <strong>Australian</strong> <strong>Dietary</strong> <strong>Guidelines</strong>- December 2011 258
669. Arntzen, K., et al., Moderate wine consumption is associated with better cognitive test results: a 7<br />
year follow up of 5033 subjects in the Tromsø Study. Acta Neurologica Scandinavica, 2010.<br />
122: p. 23-29.<br />
670. <strong>Australian</strong> Institute of <strong>Health</strong> and Welfare, 2007 National Drug Strategy Household Survey:<br />
detailed findings. Cat. no. PHE 107, 2008, <strong>Australian</strong> Institute of <strong>Health</strong> and Welfare:<br />
Canberra.<br />
671. <strong>Australian</strong> Bureau of Statistics, Apparent Consumption of Alcohol, Australia, 2008-09. Cat. no.<br />
4307.0.55.001, 2010, <strong>Australian</strong> Bureau of Statistics: Canberra.<br />
672. National Preventative <strong>Health</strong> Taskforce, Australia: the healthiest country by 2020. A discussion<br />
paper, 2008, Commonwealth of Australia: Canberra.<br />
673. Giglia, R. and C. Binns, Alcohol and lactation: a systematic review. Nutr Diet, 2006. 63(2): p.<br />
103-116.<br />
674. Giglia, R.C., et al., The effect of alcohol intake on breastfeeding duration in <strong>Australian</strong> women.<br />
Acta Paediatr, 2008. 97(5): p. 624-9.<br />
675. Aira, M., S. Hartikainen, and R. Sulkava, Community prevalence of alcohol use and concomitant<br />
use of medication—a source of possible risk in the elderly aged 75 and older? Int J Geriatr<br />
Psychiatry, 2005. 20(7): p. 680-685.<br />
676. Fletcher, P.C. and J.P. Hirdes, Risk factors for accidental injuries within senior citizens' homes:<br />
analysis of the Canadian survey on ageing and independence. Journal of Gerontological<br />
Nursing, 2005. 31(2): p. 49.<br />
677. Mukamal, K., et al., Alcohol consumption, bone density, and hip fracture among older adults: the<br />
cardiovascular health study. Osteoporosis international, 2007. 18(5): p. 593-602.<br />
678. <strong>Australian</strong> Institute of <strong>Health</strong> and Welfare, The problem of osteoporotic hip fracture in<br />
Australia., 2010.<br />
679. Cheyne, E.H., et al., Influence of alcohol on cognitive performance during mild hypoglycaemia;<br />
implications for Type 1 diabetes. Diabet Med, 2004. 21(3): p. 230-7.<br />
680. Tolman, K.G. and A.S. Dalpiaz, Treatment of non-alcoholic fatty liver disease. Ther Clin Risk<br />
Manag, 2007. 3(6): p. 1153-63.<br />
681. Ferreira, S.E., et al., Effects of energy drink ingestion on alcohol intoxication. Alcohol Clin Exp<br />
Res, 2006. 30(4): p. 598-605.<br />
<strong>DRAFT</strong> <strong>Australian</strong> <strong>Dietary</strong> <strong>Guidelines</strong>- December 2011 259
682. Price, S.R., et al., Energy drink co administration is associated with increased reported alcohol<br />
ingestion. Drug and Alcohol Review, 2010. 29(3): p. 331-333.<br />
683. Thombs, D.L., et al., Event-level analyses of energy drink consumption and alcohol intoxication in<br />
bar patrons. Addict Behav, 2010. 35(4): p. 325-30.<br />
684. Weldy, D.L., Risks of alcoholic energy drinks for youth. J Am Board Fam Med, 2010. 23(4): p.<br />
555-8.<br />
685. World <strong>Health</strong> Organization, Obesity: preventing and managing the global epidemic. Report of a<br />
WHO consultation (WHO Technical Report Series No. 894), in World <strong>Health</strong> Organ Tech Rep<br />
Ser2000, World <strong>Health</strong> Organization: Geneva. p. i-xii, 1-253.<br />
686. Caballero, B., The global epidemic of obesity: an overview. Epidemiol Rev, 2007. 29: p. 1-5.<br />
687. World <strong>Health</strong> Organization Expert Committee on Physical Status, Physical status: the use<br />
and interpretation of anthropometry, 1995, World <strong>Health</strong> Organization: Geneva.<br />
688. World <strong>Health</strong> Organization, Global strategy on diet, physical activity and health, 2004, World<br />
<strong>Health</strong> Organization: Geneva.<br />
689. Willett, W.C., W.H. Dietz, and G.A. Colditz, <strong>Guidelines</strong> for healthy weight. N Engl J Med,<br />
1999. 341(6): p. 427-34.<br />
690. National <strong>Health</strong> and Medical Research Council, Acting on Australia’s weight: A strategic plan<br />
for the prevention of overweight and obesity, 1997, Commonwealth of Australia: Canberra.<br />
691. World <strong>Health</strong> Organization. Global database on Body Mass Index: an interactive surveillance<br />
tool for monitoring nutrition transition 2011 [cited 2011 18 May]; Available from:<br />
http://apps.who.int/bmi/index.jsp.<br />
692. Hocking, S., et al., The Western <strong>Australian</strong> Chief <strong>Health</strong> Officer’s Report 2010, 2010,<br />
Department of <strong>Health</strong>, WA: Perth.<br />
693. Queensland <strong>Health</strong>, Risk factor impact on the burden of disease and injury in Queensland, 2007,<br />
2010, Queensland <strong>Health</strong>.<br />
694. <strong>Australian</strong> Bureau of Statistics, National <strong>Health</strong> Survey: Summary of Results, 2007-2008, 2010,<br />
<strong>Australian</strong> Bureau of Statistics: Canberra.<br />
695. Institute of Medicine, Bridging the evidence gap in obesity prevention:a framework to inform<br />
decision making, 2010, Institute of Medicine: Washington DC.<br />
<strong>DRAFT</strong> <strong>Australian</strong> <strong>Dietary</strong> <strong>Guidelines</strong>- December 2011 260
696. Rokholm, B., J.L. Baker, and T.I. Sorensen, The levelling off of the obesity epidemic since the<br />
year 1999--a review of evidence and perspectives. Obes Rev, 2010. 11(12): p. 835-46.<br />
697. Abbott, R.A., et al., <strong>Health</strong>y Kids Queensland Survey 2006 — Summary Report, Queensland<br />
<strong>Health</strong>, Editor 2007: Brisbane.<br />
698. Hands, B., et al., Physical activity and nutrition levels in Western <strong>Australian</strong> children and<br />
adolescents: report, 2004, Western <strong>Australian</strong> Government: Perth.<br />
699. Hardy, L., SPANS 2010 - NSW Schools Physical Activity and Nutrition Survey - Executive<br />
Summary, 2011, NSW Department of <strong>Health</strong>: Sydney.<br />
700. Martin, K., et al., Child and Adolescent Physical Activity and Nutrition Survey 2008: key findings,<br />
2008, Physical Activity Taskforce (Western Australia): Perth.<br />
701. Olds, T.S., et al., Trends in the prevalence of childhood overweight and obesity in Australia<br />
between 1985 and 2008. Int J Obesity, 2010. 34(1): p. 57-66.<br />
702. Gill, T.P., et al., Childhood obesity in Australia remains a widespread health concern that warrants<br />
population-wide prevention programs. Med J Aust, 2009. 190(3): p. 146-8.<br />
703. Lobstein, T., L. Baur, and R. Uauy, Obesity in children and young people: a crisis in public health.<br />
Obes Rev, 2004. 5(Suppl 1): p. 4-104.<br />
704. Olshansky, S.J., et al., A potential decline in life expectancy in the United States in the 21st<br />
century. N Engl J Med, 2005. 352(11): p. 1138-45.<br />
705. Haby, M. and A. Markwick, Future prevalence of overweight and obesity in <strong>Australian</strong> children<br />
and adolescents, 2005-2025, 2008, Department of Human Services: Melbourne.<br />
706. Prospective Studies Collaboration, et al., Body-mass index and cause-specific mortality in 900<br />
000 adults: collaborative analyses of 57 prospective studies. Lancet, 2009. 373(9669): p. 1083-<br />
96.<br />
707. <strong>Australian</strong> Institute of <strong>Health</strong> and Welfare, Australia's health 2008. Cat. no. AUS 99, 2008,<br />
<strong>Australian</strong> Institute of <strong>Health</strong> and Welfare: Canberra.<br />
708. Barba, C., et al., Appropriate body-mass index for Asian populations and its implications for policy<br />
and intervention strategies. Lancet, 2004. 363(9403).<br />
709. Flicker, L., et al., Body mass index and survival in men and women aged 70 to 75. J Am Geriatr<br />
Soc, 2010. 58(2): p. 234-41.<br />
<strong>DRAFT</strong> <strong>Australian</strong> <strong>Dietary</strong> <strong>Guidelines</strong>- December 2011 261
710. National <strong>Health</strong> and Medical Research Council, Clinical Practice <strong>Guidelines</strong> for the<br />
Management of Overweight and Obesity in Adults, 2003, Commonwealth of Australia:<br />
Canberra.<br />
711. de Onis, M., et al., Development of a WHO growth reference for school-aged children and<br />
adolescents. Bull World <strong>Health</strong> Organ, 2007. 85(9): p. 660-7.<br />
712. Cole, T.J., et al., Establishing a standard definition for child overweight and obesity worldwide:<br />
international survey. Br Med J, 2000. 320(7244): p. 1240-3.<br />
713. Cole, T.J., et al., Body mass index cut offs to define thinness in children and adolescents:<br />
international survey. Br Med J, 2007. 335(7612): p. 194.<br />
714. Withrow, D. and D.A. Alter, The economic burden of obesity worldwide: a systematic review of<br />
the direct costs of obesity. Obes Rev, 2011. 12(2): p. 131-41.<br />
715. Stevens, J., et al., The effect of age on the association between body-mass index and mortality. N<br />
Engl J Med, 1998. 338(1): p. 1-7.<br />
716. Diehr, P., et al., Weight, mortality, years of healthy life, and active life expectancy in older adults.<br />
J Am Geriatr Soc, 2008. 56(1): p. 76-83.<br />
717. Denney-Wilson, E., et al., Body mass index, waist circumference, and chronic disease risk factors<br />
in <strong>Australian</strong> adolescents. Arch Pediatr Adolesc Med, 2008. 162(6): p. 566-73.<br />
718. Clarke, P.J., et al., Midlife health and socioeconomic consequences of persistent overweight across<br />
early adulthood: findings from a national survey of American adults (1986-2008). Am J<br />
Epidemiol, 2010. 172(5): p. 540-8.<br />
719. Biro, F.M. and M. Wien, Childhood obesity and adult morbidities. Am J Clin Nutr, 2010. 91(5):<br />
p. 1499S-1505S.<br />
720. Oates, R.K., Non-organic failure to thrive. Aust Paediatr J, 1984. 20(2): p. 95-100.<br />
721. Pugliese, M.T., et al., Parental health beliefs as a cause of nonorganic failure to thrive. Pediatrics,<br />
1987. 80(2): p. 175-82.<br />
722. National <strong>Eat</strong>ing Disorders Collaborative, <strong>Eat</strong>ing disorders- prevention, treatment and<br />
management: an evidence review, 2010, National <strong>Eat</strong>ing Disorders Collaborative 2010.<br />
723. Stubbs, C.O. and A.J. Lee, The obesity epidemic: both energy intake and physical activity<br />
contribute. Med J Aust, 2004. 181(9): p. 489-91.<br />
<strong>DRAFT</strong> <strong>Australian</strong> <strong>Dietary</strong> <strong>Guidelines</strong>- December 2011 262
724. Bensimhon, D.R., W.E. Kraus, and M.P. Donahue, Obesity and physical activity: a review. Am<br />
Heart J, 2006. 151(3): p. 598-603.<br />
725. Haskell, W.L., et al., Physical activity and public health: updated recommendation for adults from<br />
the American College of Sports Medicine and the American Heart Association. Circulation, 2007.<br />
116(9): p. 1081-93.<br />
726. Swinburn, B. and G. Egger, The runaway weight gain train: too many accelerators, not enough<br />
brakes. Br Med J, 2004. 329(7468): p. 736-9.<br />
727. Swinburn, B., G. Sacks, and E. Ravussin, Increased food energy supply is more than sufficient to<br />
explain the US epidemic of obesity. Am J Clin Nutr, 2009. 90(6): p. 1453-6.<br />
728. Swinburn, B.A., et al., Diet, nutrition and the prevention of excess weight gain and obesity. Public<br />
<strong>Health</strong> Nutr, 2004. 7(1A): p. 123-46.<br />
729. Sacks, G., B.A. Swinburn, and M.A. Lawrence, A systematic policy approach to changing the<br />
food system and physical activity environments to prevent obesity. Aust New Zealand <strong>Health</strong><br />
Policy, 2008. 5: p. 13.<br />
730. Drewnowski, A. and S.E. Specter, Poverty and obesity: the role of energy density and energy<br />
costs. Am J Clin Nutr, 2004. 79(1): p. 6-16.<br />
731. Badland, H. and G. Schofield, Transport, urban design, and physical activity: an evidence-based<br />
update. Transportation Research Part D: Transport and Environment, 2005. 10(3): p. 177-<br />
196.<br />
732. Jackson, R.J. and C. Kochtitzky, Creating a healthy environment: the impact of the built<br />
environment on public health, 2001, Sprawl Watch: Washington DC.<br />
733. Oliver, L.N. and M.V. Hayes, Neighbourhood socio-economic status and the prevalence of<br />
overweight Canadian children and youth. Can J Public <strong>Health</strong>, 2005. 96(6): p. 415-20.<br />
734. Gill, T., L. King, and K. Webb, Best options for promoting healthy weight and preventing weight<br />
gain in NSW, 2005, NSW Centre for Public <strong>Health</strong> Nutrition: Sydney.<br />
735. Kumanyika, S.K., The obesity epidemic: looking in the mirror. Am J Epidemiol, 2007. 166(3): p.<br />
243-5.<br />
736. Ebbeling, C.B., D.B. Pawlak, and D.S. Ludwig, Childhood obesity: public-health crisis, common<br />
sense cure. Lancet, 2002. 360(9331): p. 473-82.<br />
737. McLaren, L., Socioeconomic status and obesity. Epidemiol Rev, 2007. 29: p. 29-48.<br />
<strong>DRAFT</strong> <strong>Australian</strong> <strong>Dietary</strong> <strong>Guidelines</strong>- December 2011 263
738. Papas, M.A., et al., The built environment and obesity. Epidemiol Rev, 2007. 29: p. 129-43.<br />
739. National Obesity Taskforce, <strong>Health</strong>y Weight 2008 - Australia's future - The national action<br />
agenda for children and young people and their families, 2003, Commonwealth of Australia:<br />
Canberra.<br />
740. Commonwealth Department of Community Services and <strong>Health</strong>, National dietary survey of<br />
schoolchildren (10-15 years), 1985. Report no. 1. Foods consumed, 1988, <strong>Australian</strong><br />
Government Publishing Service: Canberra.<br />
741. Commonwealth Department of Community Services and <strong>Health</strong>, National dietary survey of<br />
schoolchildren (10-15 years), 1985. Report no. 2. Nutrient intakes 1989, <strong>Australian</strong><br />
Government Publishing Service: Canberra.<br />
742. Commonwealth Department of Community Services and <strong>Health</strong> in collaboration with the<br />
National Heart Foundation, National dietary survey of adults: 1983. No. 2. Nutrient intakes,<br />
1987, <strong>Australian</strong> Government Printing Service: Canberra.<br />
743. Commonwealth Department of <strong>Health</strong> in collaboration with the National Heart<br />
Foundation, National dietary survey of adults: 1983 : No. 1. Foods consumed 1986, <strong>Australian</strong><br />
Government Publishing Service: Canberra.<br />
744. Rangan AM, S.S., Hector DJ, Gill TP, Webb KL., Consumption of 'extra' foods by <strong>Australian</strong><br />
adults: types, quantities and contribution to energy and nutrient intake. Eur J Clin Nutr, 2009.<br />
63(Oct 29): p. 865-871.<br />
745. Stubbs, C.O., Determinants of the Global Obesity Epidemic: Contributions of Early Life, Nutrition,<br />
Physical Activity, Television, Smoking and Economic and Social Change, in New Developments in<br />
Obesity Research, L.A. Melrose, Editor 2006, Nova Publishers: New York. p. 121-152.<br />
746. Prentice, A.M., et al., Energy expenditure in overweight and obese adults in affluent societies: an<br />
analysis of 319 doubly-labelled water measurements. Eur J Clin Nutr, 1996. 50(2): p. 93-7.<br />
747. Gebel, K., et al., Creating healthy environments: A review of links between the physical<br />
environment, physical activity and obesity, NSW <strong>Health</strong> Department and NSW Centre for<br />
Overweight and Obesity, Editor 2005: Sydney<br />
748. Armstrong, T., A. Bauman, and J. Davies, Physical activity patterns of <strong>Australian</strong> adults. Results<br />
of the 1999 National Physical Activity Survey, 2000, <strong>Australian</strong> Institute of <strong>Health</strong> and Welfare:<br />
Canberra.<br />
749. Queensland <strong>Health</strong>, The <strong>Health</strong> of Queenslanders 2010; third report of the Chief <strong>Health</strong> Officer<br />
Queensland, Queensland <strong>Health</strong>, Editor 2010: Brisband, Queensland. p. 115.<br />
<strong>DRAFT</strong> <strong>Australian</strong> <strong>Dietary</strong> <strong>Guidelines</strong>- December 2011 264
750. Centre for Epidemiology and Research, The health of the people of New South Wales - Report<br />
of the Chief <strong>Health</strong> Officer. Summary Report, 2010, NSW Department of <strong>Health</strong>, Editor 2010,<br />
NSW Department of <strong>Health</strong>: Sydney, NSW.<br />
751. Booth, M.L., et al., Change in the prevalence of overweight and obesity among young <strong>Australian</strong>s,<br />
1969-1997. Am J Clin Nutr, 2003. 77(1): p. 29-36.<br />
752. Booth, M.L., et al., Methods of the NSW Schools Physical Activity and Nutrition Survey (SPANS). J<br />
Sci Med Sport, 2005. 8(3): p. 284-93.<br />
753. Bauman, A., et al., Getting Australia active: towards better practice for the promotion of physical<br />
activity, 2002, National Public <strong>Health</strong> Partnership: Melbourne.<br />
754. Woodcock, J., et al., Non-vigorous physical activity and all-cause mortality: systematic review and<br />
meta-analysis of cohort studies. Int J Epidemiol, 2011. 40(1): p. 121-38.<br />
755. Janssen, I. and A.G. Leblanc, Systematic review of the health benefits of physical activity and<br />
fitness in school-aged children and youth. Int J Behav Nutr Phys Act, 2010. 7: p. 40.<br />
756. Warburton, D.E., C.W. Nicol, and S.S. Bredin, <strong>Health</strong> benefits of physical activity: the evidence.<br />
Can Med Assoc J, 2006. 174(6): p. 801-9.<br />
757. Brown, W.J., et al., Leisure time physical activity in <strong>Australian</strong> women: relationship with well being<br />
and symptoms. Res Q Exerc Sport, 2000. 71(3): p. 206-16.<br />
758. Nelson, M.C. and P. Gordon-Larsen, Physical activity and sedentary behavior patterns are<br />
associated with selected adolescent health risk behaviors. Pediatrics, 2006. 117(4): p. 1281-90.<br />
759. Commonwealth Department of <strong>Health</strong> and Ageing. Measure up - weight and waist<br />
measurements. 2010 [cited 2011 27 March]; Available from:<br />
http://www.health.gov.au/internet/abhi/publishing.nsf/Content/Weight,+waist+circumferenc<br />
e+and+BMI-lp.<br />
760. Dunstan, D., et al., Diabesity & Associated Disorders in Australia - 2000, 2001, International<br />
Diabetes Institute: Melbourne.<br />
761. Bautista-Castana, I., J. Doreste, and L. Serra-Majem, Effectiveness of interventions in the<br />
prevention of childhood obesity (Structured abstract). Eur J Epidemiol, 2004(7): p. 617-622.<br />
762. Campbell, K.J. and K.D. Hesketh, Strategies which aim to positively impact on weight, physical<br />
activity, diet and sedentary behaviours in children from zero to five years. A systematic review of<br />
the literature. Obes Rev, 2007. 8(4): p. 327-38.<br />
<strong>DRAFT</strong> <strong>Australian</strong> <strong>Dietary</strong> <strong>Guidelines</strong>- December 2011 265
763. Kamath, C.C., et al., Clinical review: behavioral interventions to prevent childhood obesity: a<br />
systematic review and metaanalyses of randomized trials. J Clin Endocrinol Metab, 2008.<br />
93(12): p. 4606-15.<br />
764. Stice, E., H. Shaw, and C.N. Marti, A meta-analytic review of obesity prevention programs for<br />
children and adolescents: the skinny on interventions that work. Psychol Bull, 2006(5): p. 667-<br />
691.<br />
765. Summerbell, C.D., et al., Interventions for preventing obesity in children. Cochrane Database<br />
Syst Rev, 2005(3).<br />
766. Lemmens, V.E., et al., A systematic review of the evidence regarding efficacy of obesity prevention<br />
interventions among adults. Obes Rev, 2008. 9(5): p. 446-55.<br />
767. Orozco Leonardo, J., et al., Exercise or exercise and diet for preventing type 2 diabetes mellitus.<br />
Cochrane Database Syst Rev, 2008(3).<br />
768. Food and Agriculture Organization of the United Nations and the World <strong>Health</strong><br />
Organization, FAO/WHO Expert Consultation on Fats and Fatty Acids in Human Nutrition, 2008,<br />
Food and Agriculture Organization of the United Nations and the World <strong>Health</strong><br />
Organization,.<br />
769. Fiorito, L.M., et al., Beverage intake of girls at age 5 y predicts adiposity and weight status in<br />
childhood and adolescence. Am J Clin Nutr, 2009. 90(4): p. 935-42.<br />
770. Vrolix R, M.R., Variability of the glycemic response to single food products in healthy subjects.<br />
Contemporary Clinical Trials, 2010. 31(1): p. 5-11.<br />
771. Johnson, L., et al., Reflections from a systematic review of dietary energy density and weight gain:<br />
is the inclusion of drinks valid?. [Review] [62 refs]. Obesity Reviews, 2009. 10(6): p. 681-92.<br />
772. Hite, A.H., et al., In the face of contradictory evidence: report of the <strong>Dietary</strong> <strong>Guidelines</strong> for<br />
Americans Committee. Nutrition, 2010. 26(10): p. 915-24.<br />
773. Owen, C.G., et al., Effect of infant feeding on the risk of obesity across the life course: a<br />
quantitative review of published evidence. Pediatrics, 2005. 115(5): p. 1367-77.<br />
774. Araujo, C.L., et al., Effect of birth size and proportionality on BMI and skinfold thickness in early<br />
adolescence: prospective birth cohort study. Eur J Clin Nutr, 2009. 63(5): p. 634-9.<br />
775. Kuh, D., et al., Birth weight, childhood growth and abdominal obesity in adult life. Int J Obes<br />
Relat Metab Disord, 2002. 26(1): p. 40-7.<br />
<strong>DRAFT</strong> <strong>Australian</strong> <strong>Dietary</strong> <strong>Guidelines</strong>- December 2011 266
776. Monasta, L., et al., Early-life determinants of overweight and obesity: a review of systematic<br />
reviews. Obes Rev, 2010. 11(10): p. 695-708.<br />
777. Monteiro, P.O. and C.G. Victora, Rapid growth in infancy and childhood and obesity in later life-<br />
-a systematic review. Obes Rev, 2005. 6(2): p. 143-54.<br />
778. Nader, P.R., et al., Identifying risk for obesity in early childhood. Pediatrics, 2006. 118(3): p.<br />
e594-601.<br />
779. Mamun, A.A., et al., Does maternal smoking during pregnancy have a direct effect on future<br />
offspring obesity? Evidence from a prospective birth cohort study. Am J Epidemiol, 2006. 164(4):<br />
p. 317-25.<br />
780. Landhuis, C.E., et al., Childhood sleep time and long-term risk for obesity: a 32-year prospective<br />
birth cohort study. Pediatrics, 2008. 122(5): p. 955-60.<br />
781. Marshall, S.J., et al., Relationships between media use, body fatness and physical activity in<br />
children and youth: a meta-analysis. [Review] [76 refs]. International Journal of Obesity &<br />
Related Metabolic Disorders: Journal of the International Association for the Study of<br />
Obesity, 2004. 28(10): p. 1238-46.<br />
782. Rey-Lopez, J.P., et al., Sedentary behaviour and obesity development in children and adolescents.<br />
Nutr Metab Cardiovasc Dis, 2008. 18(3): p. 242-51.<br />
783. Biddle, S.J., et al., Physical activity and sedentary behaviours in youth: issues and controversies. J R<br />
Soc Promot <strong>Health</strong>, 2004. 124(1): p. 29-33.<br />
784. Coon, K.A. and K.L. Tucker, Television and children's consumption patterns: a review of the<br />
literature. Minerva Pediatr, 2002. 54(5): p. 423-36.<br />
785. Goldani, M.Z., et al., Do early life factors influence body mass index in adolescents? Braz J Med<br />
Biol Res, 2007. 40(9): p. 1231-6.<br />
786. Langenberg, C., et al., Central and total obesity in middle aged men and women in relation to<br />
lifetime socioeconomic status: evidence from a national birth cohort. J Epidemiol Community<br />
<strong>Health</strong>, 2003. 57(10): p. 816-22.<br />
787. Power, C., et al., Life-course influences on health in British adults: effects of socio-economic<br />
position in childhood and adulthood. Int J Epidemiol, 2007. 36(3): p. 532-9.<br />
788. Wright, C.M. and L. Parker, <strong>For</strong>ty years on: the effect of deprivation on growth in two Newcastle<br />
birth cohorts. Int J Epidemiol, 2004. 33(1): p. 147-52.<br />
<strong>DRAFT</strong> <strong>Australian</strong> <strong>Dietary</strong> <strong>Guidelines</strong>- December 2011 267
789. Jyoti, D.F., E.A. Frongillo, and S.J. Jones, Food insecurity affects school children's academic<br />
performance, weight gain, and social skills. J Nutr, 2005. 135(12): p. 2831-9.<br />
790. Senf, J.H., C.M. Shisslak, and M.A. Crago, Does dieting lead to weight gain? A four-year<br />
longitudinal study of middle school girls. Obesity, 2006. 14(12): p. 2236-41.<br />
791. Field, A.E., et al., Relation between dieting and weight change among preadolescents and<br />
adolescents. Pediatrics, 2003. 112(4): p. 900-6.<br />
792. Mamun, A.A., et al., Do childhood sleeping problems predict obesity in young adulthood? Evidence<br />
from a prospective birth cohort study. Am J Epidemiol, 2007. 166(12): p. 1368-73.<br />
793. Taveras, E.M., et al., Short sleep duration in infancy and risk of childhood overweight. Arch<br />
Pediatr Adolesc Med, 2008. 162(4): p. 305-11.<br />
794. Timlin, M.T., et al., Breakfast eating and weight change in a 5-year prospective analysis of<br />
adolescents: Project EAT (<strong>Eat</strong>ing Among Teens). Pediatrics, 2008. 121(3): p. e638-45.<br />
795. Gilles, A., et al., Comparing active pediatric obesity treatments using meta-analysis. J Clin Child<br />
Adolesc Psychol, 2008. 37(4): p. 886-92.<br />
796. Young, K.M., et al., A meta-analysis of family-behavioral weight-loss treatments for children. Clin<br />
Psychol Rev, 2007. 27(2): p. 240-9.<br />
797. Berry, D., et al., Family-based interventions for childhood obesity: a review. Journal of family<br />
nursing, 2004. 10(4): p. 429.<br />
798. Kelly, S.A. and B.M. Melnyk, Systematic review of multicomponent interventions with overweight<br />
middle adolescents: implications for clinical practice and research. Worldviews Evid Based Nurs,<br />
2008. 5(3): p. 113-35.<br />
799. Doak, C.M., et al., The prevention of overweight and obesity in children and adolescents: a review<br />
of interventions and programmes. Obes Rev, 2006. 7(1): p. 111-36.<br />
800. Cole, K., et al., An integrative research review: effective school-based childhood overweight<br />
interventions. J Spec Pediatr Nurs, 2006. 11(3): p. 166-77.<br />
801. Astrup, A., et al., The role of low-fat diets in body weight control: a meta-analysis of ad libitum<br />
dietary intervention studies. Int J Obes Relat Metab Disord, 2000. 24(12): p. 1545-52.<br />
802. Willett, W.C. and R.L. Leibel, <strong>Dietary</strong> fat is not a major determinant of body fat. Am J Med,<br />
2002. 113(Suppl 9B): p. 47S-59S.<br />
<strong>DRAFT</strong> <strong>Australian</strong> <strong>Dietary</strong> <strong>Guidelines</strong>- December 2011 268
803. Prentice, A.M. and S.A. Jebb, Fast foods, energy density and obesity: a possible mechanistic link.<br />
Obes Rev, 2003. 4(4): p. 187-94.<br />
804. McCrory, M.A., et al., A twin study of the effects of energy density and palatability on energy<br />
intake of individual foods. Physiol Behav, 2006. 87(3): p. 451-9.<br />
805. Paddon-Jones, D., et al., Protein, weight management, and satiety. Am J Clin Nutr, 2008.<br />
87(5): p. 1558S-1561S.<br />
806. Drewnowski, A. and N. Darmon, The economics of obesity: dietary energy density and energy<br />
cost. Am J Clin Nutr, 2005. 82(1 Suppl): p. 265S-273S.<br />
807. Bowman, S.A., et al., Effects of fast-food consumption on energy intake and diet quality among<br />
children in a national household survey. Pediatrics, 2004. 113(1 Pt 1): p. 112-8.<br />
808. Pereira, M.A., et al., Fast-food habits, weight gain, and insulin resistance (the CARDIA study): 15year<br />
prospective analysis. Lancet, 2005. 365(9453): p. 36-42.<br />
809. Ledikwe, J.H., J.A. Ello-Martin, and B.J. Rolls, Portion sizes and the obesity epidemic. J Nutr,<br />
2005. 135(4): p. 905-9.<br />
810. Cameron-Smith, D., S.A. Bilsborough, and T.C. Crowe, Upsizing Australia's waistline: the<br />
dangers of "meal deals". Med J Aust, 2002. 177(11-12): p. 2-16.<br />
811. Franz, M.J., et al., Weight-loss outcomes: a systematic review and meta-analysis of weight-loss<br />
clinical trials with a minimum 1-year follow-up. J Am Diet Assoc, 2007. 107(10): p. 1755-67.<br />
812. Goodpaster, B.H., et al., Effects of diet and physical activity interventions on weight loss and<br />
cardiometabolic risk factors in severely obese adults: a randomized trial. J Am Med Assoc, 2010.<br />
304(16): p. 1795-802.<br />
813. Medibank Private Ltd, Obesity in Australia: financial impacts and cost benefits of intervention,<br />
2010, Medibank Private Ltd.<br />
814. Colagiuri, S., et al., The cost of overweight and obesity in Australia. Med J Aust, 2010. 192(5): p.<br />
260-4.<br />
815. Marks, G.C., C. Coyne, and G. Pang, Type 2 diabetes costs in Australia - the potential impact of<br />
changes in diet, physical activity and levels of obesity, 2001, <strong>Australian</strong> Food and Nutrition<br />
Modelling Unit: Brisbane.<br />
816. National Public <strong>Health</strong> Partnership, Be Active Australia: A Framework for <strong>Health</strong> Sector Action<br />
for Physical Activity 2005–2010, V. Department of Human Services, Editor 2005, National<br />
Public <strong>Health</strong> Partnership: Melbourne.<br />
<strong>DRAFT</strong> <strong>Australian</strong> <strong>Dietary</strong> <strong>Guidelines</strong>- December 2011 269
817. Hu, F.B., et al., Television watching and other sedentary behaviors in relation to risk of obesity and<br />
type 2 diabetes mellitus in women. J Am Med Assoc, 2003. 289(14): p. 1785-91.<br />
818. Martinez-Gonzalez, M.A., et al., Physical inactivity, sedentary lifestyle and obesity in the<br />
European Union. Int J Obes Relat Metab Disord, 1999. 23(11): p. 1192-201.<br />
819. Brown, W.J., Y.D. Miller, and R. Miller, Sitting time and work patterns as indicators of<br />
overweight and obesity in <strong>Australian</strong> adults. International Journal of Obesity & Related<br />
Metabolic Disorders: Journal of the International Association for the Study of Obesity,<br />
2003. 27(11): p. 1340-6.<br />
820. Saris, W.H., et al., How much physical activity is enough to prevent unhealthy weight gain?<br />
Outcome of the IASO 1st Stock Conference and consensus statement. Obes Rev, 2003. 4(2): p.<br />
101-14.<br />
821. Blair, S.N., M.J. LaMonte, and M.Z. Nichaman, The evolution of physical activity<br />
recommendations: how much is enough? Am J Clin Nutr, 2004. 79(5).<br />
822. Petersen, L., P. Schnohr, and T. Sørensen, Longitudinal study of the long-term relation between<br />
physical activity and obesity in adults. International Journal of Obesity, 2003. 28(1): p. 105-<br />
112.<br />
823. Schoeller, D.A., But how much physical activity? Am J Clin Nutr, 2003. 78(4): p. 669-70.<br />
824. Martinez-Gomez, D., et al., Recommended levels of physical activity to avoid an excess of body<br />
fat in European adolescents: the HELENA Study. Am J Prev Med, 2010. 39(3): p. 203-11.<br />
825. Caterson, I.D. and N. Finer, Emerging pharmacotherapy for treating obesity and associated<br />
cardiometabolic risk. Asia Pacific, 2006. 15: p. 55-62.<br />
826. National <strong>Health</strong> and Medical Research Council, * Title to be confirmed once published -<br />
Obesity treatment guidelines, 2011, National <strong>Health</strong> and Medical Research Council: Canberra.<br />
827. Callaway, L.K., M.J. O'Callaghan, and H.D. McIntyre, Barriers to addressing overweight and<br />
obesity before conception. Med J Aust, 2009. 191(8): p. 425-428.<br />
828. Mamun, A.A., et al., Associations of excess weight gain during pregnancy with long-term maternal<br />
overweight and obesity: evidence from 21 y postpartum follow-up. Am J Clin Nutr, 2010. 91(5):<br />
p. 1336-41.<br />
829. Dodd, J.M., et al., Antenatal interventions for overweight or obese pregnant women: a systematic<br />
review of randomised trials: a systematic review of randomised trials. BJOG: An International<br />
Journal of Obstetrics & Gynaecology, 2010. 117(11): p. 1316-1326.<br />
<strong>DRAFT</strong> <strong>Australian</strong> <strong>Dietary</strong> <strong>Guidelines</strong>- December 2011 270
830. Callaway, L.K., et al., The prevalence and impact of overweight and obesity in an <strong>Australian</strong><br />
obstetric population. Med J Aust, 2006. 184(2): p. 56-9.<br />
831. Institute of Medicine, Preventing Childhood Obesity: <strong>Health</strong> in the Balance, 2005, Institute of<br />
Medicine of the National Academies: Washington DC.<br />
832. Institute of Medicine, N.R.C., Weight Gain During Pregnancy: Reexamining the <strong>Guidelines</strong>. ,<br />
2009, The National Academies Press.: Washington, DC.<br />
833. Budge, H., et al., Maternal nutritional programming of fetal adipose tissue development: longterm<br />
consequences for later obesity. Birth defects research. Part C, Embryo today: reviews,<br />
2005. 75(3): p. 193-9.<br />
834. Boney, C.M., et al., Metabolic syndrome in childhood: association with birth weight, maternal<br />
obesity, and gestational diabetes mellitus. Pediatrics, 2005. 115(3): p. e290-6.<br />
835. Fraser, A., et al., Associations of gestational weight gain with maternal body mass index, waist<br />
circumference, and blood pressure measured 16 y after pregnancy: the Avon Longitudinal Study of<br />
Parents and Children. Am J Clin Nutr, 2011.<br />
836. Kinnunen, T.I., et al., Reducing postpartum weight retention--a pilot trial in primary health care.<br />
Nutr J, 2007. 6: p. 21.<br />
837. Harding, J.E., The nutritional basis of the fetal origins of adult disease. Int J Epidemiol, 2001.<br />
30(1): p. 15.<br />
838. Makrides, M., Early childhood nutrition and cognitive outcome. Proc Nutr Soc Aust., 1998. 22:<br />
p. 216-222.<br />
839. Cooper, C., et al., Growth in infancy and bone mass in later life. Ann Rheum Dis, 1997. 56(1):<br />
p. 17-21.<br />
840. Evans, W.J., Effects of aging and exercise on nutrition needs of the elderly. Nutr Rev, 1996. 54(1<br />
Pt 2): p. S35-9.<br />
841. Morley, J.E. and W.A. van Staveren, Undernutrition: diagnosis, causes, consequences and<br />
treatment, in Food for the ageing population, M. Raats, L. de Groot, and W.A. van Staveren,<br />
Editors. 2009, Woodhead Publishing Limited: Cambridge.<br />
842. Nowson, C., Nutritional challenges in the elderly. <strong>Australian</strong> Doctor, 2009(27 March): p. 25-<br />
30.<br />
843. Corrada, M.M., et al., Association of body mass index and weight change with all-cause mortality<br />
in the elderly. Am J Epidemiol, 2006. 163(10): p. 938-49.<br />
<strong>DRAFT</strong> <strong>Australian</strong> <strong>Dietary</strong> <strong>Guidelines</strong>- December 2011 271
844. Truswell, A.S., <strong>Dietary</strong> guidance for older <strong>Australian</strong>s. Nutr Diet, 2009. 66(4): p. 243-248.<br />
845. Strandberg, T.E. and K.H. Pitkala, Frailty in elderly people. Lancet, 2007. 369(9570): p. 1328-<br />
9.<br />
846. Wahlqvist ML, K.-B.A., Ross K, Setter T, Tienboon T., Growth and Ageing. In: Nutritrion and<br />
metabolism, ed. M.I. Gibney M, Roche HM (eds)2001, London: The Nutrition Society.<br />
847. Leggo, M., et al., A quality improvement nutrition screening and intervention program available to<br />
Home and Community Care eligible clients. Nutr Diet, 2008. 65(2): p. 162-167.<br />
848. Banks, M., et al., Prevalence of malnutrition in adults in Queensland public hospitals and<br />
residential aged care facilities. Nutr Diet, 2007. 64(3): p. 172-178.<br />
849. Nelson, M.E., et al., Physical activity and public health in older adults: recommendation from the<br />
American College of Sports Medicine and the American Heart Association. Circulation, 2007.<br />
116(9): p. 1094-105.<br />
850. Commonwealth Department of <strong>Health</strong> and Ageing. Physical Activity <strong>Guidelines</strong>. 2010 [cited<br />
2011 30 March]; Available from:<br />
http://www.health.gov.au/internet/main/publishing.nsf/content/health-pubhlth-strateg-physact-guidelines.<br />
851. Gregg, E.W., M.A. Pereira, and C.J. Caspersen, Physical activity, falls, and fractures among<br />
older adults: a review of the epidemiologic evidence. J Am Geriatr Soc, 2000. 48(8): p. 883-893.<br />
852. Kujala, U.M., et al., Physical activity and osteoporotic hip fracture risk in men. Arch Intern Med,<br />
2000. 160(5): p. 705-8.<br />
853. Glass, T.A., et al., Population based study of social and productive activities as predictors of<br />
survival among elderly Americans. Br Med J, 1999. 319(7208): p. 478.<br />
854. Cunningham, J. and D. Mackerras, Occasional Paper - Overweight and Obesity Indigenous<br />
<strong>Australian</strong>s 1994, 1998, <strong>Australian</strong> Bureau of Statistics: Canberra.<br />
855. O’Dea, K., Body fat distribution and health outcome in <strong>Australian</strong> Aborigines. Proc Nutr Soc<br />
Aust, 1987. 12: p. 56-65.<br />
856. Cunningham, J., et al., Perceived weight versus Body Mass Index among urban Aboriginal<br />
<strong>Australian</strong>s: do perceptions and measurements match? Aust N Z J Public <strong>Health</strong>, 2008. 32(2):<br />
p. 135-138.<br />
<strong>DRAFT</strong> <strong>Australian</strong> <strong>Dietary</strong> <strong>Guidelines</strong>- December 2011 272
857. <strong>Australian</strong> Institute of <strong>Health</strong> and Welfare, Aboriginal and Torres Strait Islander <strong>Health</strong><br />
Performance Framework, 2008 report: Detailed analyses., 2008, <strong>Australian</strong> Institute of <strong>Health</strong><br />
and Welfare: Canberra.<br />
858. Turrell, G., et al., Socioeconomic differences in food purchasing behaviour and suggested<br />
implications for diet-related health promotion. J Hum Nutr Diet, 2002. 15(5): p. 355-64.<br />
859. Maillot, M., et al., Nutrient-dense food groups have high energy costs: an econometric approach<br />
to nutrient profiling. J Nutr, 2007. 137(7): p. 1815.<br />
860. World <strong>Health</strong> Organization, International Code of Marketing of Breast-milk Substitutes, 1981,<br />
World <strong>Health</strong> Organization: Geneva.<br />
861. Ip, S., et al., Breastfeeding and maternal and infant health outcomes in developed countries. Evid<br />
Rep Technol Assess (Full Rep), 2007(153): p. 1-186.<br />
862. American Academy of Pediatrics, Pediatric Nutrition Handbook. Fifth ed, ed. R.E.<br />
Kleinman2004, Washington DC: American Academy of Pediatrics. 1178.<br />
863. Prentice, A., Constituents of human milk. Food Nutr Bull, 1996. 17: p. 305-312.<br />
864. Centre for Epidemiology and Research, 2005-2006 Report on child health from the New South<br />
Wales Population <strong>Health</strong>y Survey, N.D.o. <strong>Health</strong>, Editor 2008a, NSW Department of <strong>Health</strong>:<br />
Sydney.<br />
865. Akre, J., Infant feeding. The physiological basis. Bull World <strong>Health</strong> Organ, 1989(67 Suppl): p.<br />
1-108.<br />
866. Kramer, M. and R. Kakuma, Optimal duration of exclusive breastfeeding. Cochrane Database<br />
Syst Rev, 2002(1): p. CD003517.<br />
867. Horta, B.L., et al., Evidence on the long-term effects of breastfeeding. Geneva: World <strong>Health</strong><br />
Organization, 2007.<br />
868. Anderson, J., K. Malley, and R. Snell, Is 6 months still the best for exclusive breastfeeding and<br />
introduction of solids? A literature review with consideration to the risk of the development of<br />
allergies. Breastfeeding review: professional publication of the Nursing Mothers' Association<br />
of Australia, 2009. 17(2): p. 23.<br />
869. Kramer, M.S., et al., Effects of prolonged and exclusive breastfeeding on child height, weight,<br />
adiposity, and blood pressure at age 6.5 y: evidence from a large randomized trial. Am J Clin<br />
Nutr, 2007. 86(6): p. 1717.<br />
<strong>DRAFT</strong> <strong>Australian</strong> <strong>Dietary</strong> <strong>Guidelines</strong>- December 2011 273
870. Agostoni, C., et al., Complementary feeding: a commentary by the ESPGHAN Committee on<br />
Nutrition. J Pediatr Gastroenterol Nutr, 2008. 46(1): p. 99.<br />
871. World <strong>Health</strong> Organization, Equity, social determinant and public health programmes, E. Blas<br />
and A.S. Kurup, Editors. 2010, World <strong>Health</strong> Organization: Geneva.<br />
872. Prescott, S.L., et al., The importance of early complementary feeding in the development of oral<br />
tolerance: concerns and controversies. Pediatr Allergy Immunol, 2008. 19(5): p. 375-80.<br />
873. Scott, J.A., et al., Predictors of the early introduction of solid foods in infants: results of a cohort<br />
study. BMC Pediatr, 2009. 9: p. 60.<br />
874. Britton, C., et al., Support for breastfeeding mothers. Cochrane Database Syst Rev, 2007(1):<br />
p. CD001141.<br />
875. Chung, M., et al., Interventions in primary care to promote breastfeeding: an evidence review for<br />
the U.S. Preventive Services Task <strong>For</strong>ce. Ann Intern Med, 2008. 149(8): p. 565-82.<br />
876. Hector, D. and L. King, Interventions to encourage and support breastfeeding. NSW Public<br />
<strong>Health</strong> Bull, 2005. 16(3-4): p. 56-61.<br />
877. Landers, M., R. Hughes, and K. Graham, The Darling Downs Breastfeeding Study1998,<br />
Toowoomba: Darling Downs Public <strong>Health</strong> Unit.<br />
878. Scott, J. and C. Binns, Breastfeeding: are boys missing out? Birth (Berkeley, Calif.), 1999.<br />
26(4): p. 276.<br />
879. Scott, J.A., et al., Factors associated with the duration of breastfeeding amongst women in Perth,<br />
Australia. Acta Paediatr, 1999. 88(4): p. 416-21.<br />
880. Scott, J.A., et al., Psychosocial factors associated with the abandonment of breastfeeding prior to<br />
hospital discharge. Journal of Human Lactation, 2001. 17(1): p. 24.<br />
881. Simopoulos, A.P., J. Oliveira, and I.D. Desai, Behavioral and metabolic aspects of breastfeeding:<br />
international trends1995: S Karger AG.<br />
882. Kramer, M.S., et al., Breastfeeding and infant growth: biology or bias? Pediatrics, 2002. 110(2<br />
Pt 1): p. 343-7.<br />
883. Kramer, M.S., et al., Promotion of Breastfeeding Intervention Trial (PROBIT): a randomized trial in<br />
the Republic of Belarus. J Am Med Assoc, 2001. 285(4): p. 413-20.<br />
884. Dewey, K.G., Growth characteristics of breast-fed compared to formula-fed infants. Biol<br />
Neonate, 1998. 74(2): p. 94-105.<br />
<strong>DRAFT</strong> <strong>Australian</strong> <strong>Dietary</strong> <strong>Guidelines</strong>- December 2011 274
885. Demmelmair, H., J. von Rosen, and B. Koletzko, Long-term consequences of early nutrition.<br />
Early Hum Dev, 2006. 82(8): p. 567-74.<br />
886. Harder, T., et al., Duration of breastfeeding and risk of overweight: a meta-analysis. Am J<br />
Epidemiol, 2005. 162(5): p. 397-403.<br />
887. White House Task <strong>For</strong>ce on Childhood Obesity, Solving the problem of childhood obesity<br />
within a generation: report to the President, 2010: Washington, DC.<br />
888. Kuti, O., A.B. Adeyemi, and A.T. Owolabi, Breast-feeding pattern and onset of menstruation<br />
among Yoruba mothers of South-west Nigeria. European J. of Contraception and Reproductive<br />
<strong>Health</strong>care, 2007. 12(4): p. 335-339.<br />
889. Romero-Gutiérrez, G., et al., Actual use of the lactational amenorrhoea method. European J. of<br />
Contraception and Reproductive <strong>Health</strong>care, 2007. 12(4): p. 340-344.<br />
890. Türk, R., F. Terzio lu, and K. Ero lu, The Use of Lactational Amenorrhea as A Method of Family<br />
Planning in Eastern Turkey and Influential Factors. The Journal of Midwifery & Women’s<br />
<strong>Health</strong>, 2010. 55(1): p. e1-e7.<br />
891. Ip, S., et al., A summary of the Agency for <strong>Health</strong>care Research and Quality's evidence report on<br />
breastfeeding in developed countries. Breastfeed Med, 2009. 4 Suppl 1: p. S17-30.<br />
892. Oddy, W.H., The long-term effects of breastfeeding on asthma and atopic disease. Adv Exp Med<br />
Biol, 2009. 639: p. 237-51.<br />
893. McGuire, W. and M. Anthony, Donor human milk versus formula for preventing necrotising<br />
enterocolitis in preterm infants: systematic review. Archives of Disease in Childhood Fetal and<br />
Neonatal Edition, 2003. 88(1): p. F11.<br />
894. Barclay, A.R., et al., Systematic review: the role of breastfeeding in the development of pediatric<br />
inflammatory bowel disease. J Pediatr, 2009. 155(3): p. 421-6.<br />
895. Quigley, M., et al., Breastfeeding is associated with improved child cognitive development:<br />
evidence from the UK Millennium Cohort Study. Journal of epidemiology and community<br />
health, 2009. 63(Suppl 2): p. 8.<br />
896. Medeiros, A.P.M., J.T.L. Ferreira, and C.M. Felício, Correlation between feeding methods, nonnutritive<br />
sucking and orofacial behaviors. Pró-Fono Revista de Atualização Científica, 2009.<br />
21(4): p. 315-319.<br />
897. Allen, J. and D. Hector, Benefits of breastfeeding. N S W Public <strong>Health</strong> Bull, 2005. 16(3-4): p.<br />
42-6.<br />
<strong>DRAFT</strong> <strong>Australian</strong> <strong>Dietary</strong> <strong>Guidelines</strong>- December 2011 275
898. Sobhy, S.I. and N.A. Mohame, The effect of early initiation of breast feeding on the amount of<br />
vaginal blood loss during the fourth stage of labor. J Egypt Public <strong>Health</strong> Assoc, 2004. 79(1-2):<br />
p. 1-12.<br />
899. Chantry, C.J., P. Auinger, and R.S. Byrd, Lactation among adolescent mothers and subsequent<br />
bone mineral density. Arch Pediatr Adolesc Med, 2004. 158(7): p. 650.<br />
900. Dursun, N., et al., Influence of duration of total breast-feeding on bone mineral density in a<br />
Turkish population: does the priority of risk factors differ from society to society? Osteoporosis<br />
international, 2006. 17(5): p. 651-655.<br />
901. National <strong>Health</strong> and Medical Research Council, * Title to be confirmed - Infant Feeding<br />
Literature Review, 2011, Commonwealth of Australia: Canberra.<br />
902. House of Representatives Standing Committee on <strong>Health</strong> and Ageing, The Best Start -<br />
Report on the inquiry into the health benefits of breastfeeding, 2007, Commonwealth of<br />
Australia: Canberra.<br />
903. Kuan, L.W., et al., <strong>Health</strong> system factors contributing to breastfeeding success. Pediatrics, 1999.<br />
104(3): p. e28.<br />
904. Hall Moran, V., et al., A systematic review of the nature of support for breast-feeding adolescent<br />
mothers. Midwifery, 2007. 23(2): p. 157-71.<br />
905. Volpe, E.M. and M. Bear, Enhancing breastfeeding initiation in adolescent mothers through the<br />
Breastfeeding Educated and Supported Teen (BEST) Club. Journal of Human Lactation, 2000.<br />
16(3): p. 196.<br />
906. Cooklin, A.R., S.M. Donath, and L.H. Amir, Maternal employment and breastfeeding: results<br />
from the longitudinal study of <strong>Australian</strong> children. Acta Paediatr, 2008. 97(5): p. 620-3.<br />
907. Baxter, J., A.R. Cooklin, and J. Smith, Which mothers wean their babies prematurely from full<br />
breastfeeding? An <strong>Australian</strong> cohort study. Acta Paediatr, 2009. 98(8): p. 1274-1277.<br />
908. Amir, L.H. and S.M. Donath, Socioeconomic status and rates of breastfeeding in Australia:<br />
evidence from three recent national health surveys. Med J Aust, 2008. 189(5): p. 254-6.<br />
909. Labbok, M.H., D. Clark, and A.S. Goldman, Breastfeeding: maintaining an irreplaceable<br />
immunological resource. Nat Rev Immunol, 2004. 4(7): p. 565-572.<br />
910. Scott, J., et al., Factors associated with breastfeeding at discharge and duration of breastfeeding.<br />
Journal of paediatrics and child health, 2001. 37(3): p. 254-261.<br />
<strong>DRAFT</strong> <strong>Australian</strong> <strong>Dietary</strong> <strong>Guidelines</strong>- December 2011 276
911. Duong, D.V., C.W. Binns, and A.H. Lee, Breast-feeding initiation and exclusive breast-feeding in<br />
rural Vietnam. Public <strong>Health</strong> Nutr, 2004. 7(6): p. 795-9.<br />
912. Kaewsarn, P. and W. Moyle, Breastfeeding duration of Thai women. Aust Coll Midwives Inc J,<br />
2000. 13(1): p. 21-6.<br />
913. Li, L., et al., Factors associated with the initiation and duration of breastfeeding by Chinese<br />
mothers in Perth, Western Australia. J Hum Lact, 2004. 20(2): p. 188-95.<br />
914. Utaka, H., et al., Breastfeeding experiences of Japanese women living in Perth, Australia.<br />
Breastfeed Rev, 2005. 13(2): p. 5-11.<br />
915. Xu, F., et al., Breastfeeding in China: a review. Int Breastfeed J, 2009. 4: p. 6.<br />
916. Binns, C.W., et al., Breastfeeding by Aboriginal mothers in Perth. Nutr Diet, 2006. 63(1): p. 8-<br />
14.<br />
917. World <strong>Health</strong> Organization, Acceptable medical reasons for use of breastmilk substitutes, 2009,<br />
World <strong>Health</strong> Organization,: Geneva.<br />
918. Guise, J.M., et al., The effectiveness of primary care-based interventions to promote breastfeeding:<br />
systematic evidence review and meta-analysis for the US Preventive Services Task <strong>For</strong>ce. Ann Fam<br />
Med, 2003. 1(2): p. 70-8.<br />
919. Baby Friendly <strong>Health</strong> Initiative. The Ten Steps to Successful Breastfeeding. 2011 [cited 2011<br />
29 March]; Available from: http://www.bfhi.org.au/text/bfhi_ten_steps.html.<br />
920. Binns, C. and J. Scott, Breastfeeding: reasons for starting, reasons for stopping and problems<br />
along the way. Breastfeed Rev, 2002. 10(2): p. 13–19.<br />
921. Australia New Zealand Food Authority, Food safety standards: costs and benefits. An analysis<br />
of the regulatory impact of the proposed national food safety reforms 1999, Canberra: Australia<br />
New Zealand Food Authority.<br />
922. Fraser, A., Bacterial toxins, 2001, National Food Safety database<br />
.<br />
923. Australia New Zealand Food Authority, Date marking: user guide to Standard 1.2. 5, Date<br />
Marking of Packaged Food, 2001, Australia New Zealand Food Authority: Canberra.<br />
924. Käferstein, F. and M. Abdussalam, Food safety in the 21st century. Bull World <strong>Health</strong> Organ,<br />
1999. 77(4): p. 347.<br />
<strong>DRAFT</strong> <strong>Australian</strong> <strong>Dietary</strong> <strong>Guidelines</strong>- December 2011 277
925. Desmarchelier, P.M., Foodborne disease: emerging problems and solutions. Med J Aust, 1996.<br />
165(11-12): p. 668-71.<br />
926. Nyachuba, D.G., Foodborne illness: is it on the rise? Nutr Rev, 2010. 68(5): p. 257-269.<br />
927. Abelson, P., et al., The annual cost of foodborne illness in Australia2006: Department of <strong>Health</strong><br />
and Ageing.<br />
928. Crerar, S.K., et al., Foodborne disease: current trends and future surveillance needs in Australia.<br />
Med J Aust, 1996. 165: p. 672-5.<br />
929. Redmond, E.C. and C.J. Griffith, Consumer food handling in the home: a review of food safety<br />
studies. J Food Prot, 2003. 66(1): p. 130-61.<br />
930. Australia New Zealand Communicable Diseases Network, <strong>For</strong>tnightly notifiable diseases<br />
tables, 1999, Communicable Diseases Intelligence,.<br />
931. Redmond, E.C. and C.J. Griffith, The importance of hygiene in the domestic kitchen: implications<br />
for preparation and storage of food and infant formula. Perspectives in Public <strong>Health</strong>, 2009.<br />
129(2): p. 69-76.<br />
932. State Government of Victoria, Food safety at home., Department of <strong>Health</strong> Victoria, Editor<br />
2011: Melbourne, Victoria.<br />
933. Merry, G., Food poisoning prevention1997: Palgrave Macmillan Australia.<br />
934. Sprenger, R.A., Hygiene for management: a text for food hygiene courses1998, South Yorkshire<br />
UK Highfield.<br />
935. US Department of Agriculture, Kitchen companion: your safe food guide, 2008, US<br />
Department of Agriculture: Washington, DC. .<br />
936. Cates, S.C., et al., Pregnant women and listeriosis: preferred educational messages and delivery<br />
mechanisms. J Nutr Educ Behav, 2004. 36(3): p. 121-7.<br />
937. Almanza, B.A., et al., Clients' safe food-handling knowledge and risk behavior in a home-delivered<br />
meal program. J Am Diet Assoc, 2007. 107(5): p. 816-21.<br />
938. Kendall, P.A., V.V. Hillers, and L.C. Medeiros, Food safety guidance for older adults. Clin Infect<br />
Dis, 2006. 42(9): p. 1298-304.<br />
939. National <strong>Health</strong> and Medical Research Council, Implementing the dietary guidelines for<br />
<strong>Australian</strong>s. Report on the subcommittee on nutrition education., 1989: Canberra.<br />
<strong>DRAFT</strong> <strong>Australian</strong> <strong>Dietary</strong> <strong>Guidelines</strong>- December 2011 278
940. Cashel K, L.J., NUTTAB89-Nutrient Data Table for Use in Australia [Floppy Disc], Department<br />
of Community Services and <strong>Health</strong>, Editor 1989: Canberra.<br />
941. National <strong>Health</strong> and Medical Research Council, Recommended <strong>Dietary</strong> Intakes for use in<br />
Australia, 1991, Commonwealth of Australia: Canberra.<br />
942. National <strong>Health</strong> and Medical Research Council, The Core Food Groups: the scientific basis for<br />
developing nutrition education tools, 1995, Commonwealth of Australia: Canberra.<br />
943. Sobolewski R, C.J., Mackerras D., Which <strong>Australian</strong> food composition database should I use?<br />
Nutr Dietetics, 2010. 67: p. 37-40.<br />
944. Food Standards Australia and New Zealand. AUSNUT 2007. 2007 September 2011<br />
September 2011]; Available from:<br />
http://www.foodstandards.gov.au/consumerinformation/ausnut2007/.<br />
945. National Public <strong>Health</strong> Partnership, National Aboriginal and Torres Strait Islander Nutrition<br />
Strategy and Action Plan 2000-2010, 2001.<br />
946. Food Standards Australia and New Zealand. NUTTAB 2010. 2010 September 2011<br />
September 2011]; Available from:<br />
http://www.foodstandards.gov.au/consumerinformation/nuttab2010/.<br />
947. Denney-Wilson, E., M. Booth, and L. Baur, Development of the <strong>Australian</strong> standard definition of<br />
child/adolescent overweight and obesity. Nutr Diet, 2003. 60(2): p. 74-77.<br />
948. World <strong>Health</strong> Organization. Growth reference data for 5-19 years. 2007 [cited 2011 30<br />
March]; Available from: http://www.who.int/growthref/en/.<br />
949. WHO Statistical Information System. Children aged
954. Beyerlein, A., A.M. Toschke, and R. von Kries, Risk factors for childhood overweight: shift of<br />
the mean body mass index and shift of the upper percentiles: results from a cross-sectional study.<br />
Int J Obes (Lond), 2010. 34(4): p. 642-8.<br />
955. Lee, J.M., et al., Getting heavier, younger: trajectories of obesity over the life course. Int J Obes<br />
(Lond), 2010. 34(4): p. 614-23.<br />
956. McLennan, J., Obesity in children. Tackling a growing problem. Aust Fam Physician, 2004. 33(1-<br />
2): p. 33-6.<br />
957. Nambiar, S., et al., Validating the waist height ratio and developing centiles for use amongst<br />
children and adolescents. Acta Paediatr, 2009. 98(1): p. 148-152.<br />
958. Sanigorski, A., et al., Reducing unhealthy weight gain in children through community capacitybuilding:<br />
results of a quasi-experimental intervention program, Be Active <strong>Eat</strong> Well. Int J Obesity,<br />
2008. 32(7): p. 1060-1067.<br />
959. Rasmussen-Torvik, L.J., et al., Influence of waist on adiponectin and insulin sensitivity in<br />
adolescence. Obesity (Silver Spring), 2009. 17(1): p. 156-61.<br />
960. Valery, P.C., et al., Prevalence of obesity and metabolic syndrome in Indigenous <strong>Australian</strong> youths.<br />
Obes Rev, 2009. 10(3): p. 255-61.<br />
961. McCarthy, H.D., Body fat measurements in children as predictors for the metabolic syndrome:<br />
focus on waist circumference. Proc Nutr Soc, 2006. 65(04): p. 385-392.<br />
962. Watts, K., et al., Waist circumference predicts cardiovascular risk in young <strong>Australian</strong> children. J<br />
Paediatr Child <strong>Health</strong>, 2008. 44(12): p. 709-15.<br />
963. Eisenmann, J.C., et al., Fatness, fitness, and cardiovascular disease risk factors in children and<br />
adolescents. Med Sci Sports Exerc, 2007. 39(8): p. 1251.<br />
964. Telford, R.D., et al., Discordance of international adiposity classifications in <strong>Australian</strong> boys and<br />
girls - the LOOK study. Ann Hum Biol, 2008. 35(3): p. 334-41.<br />
965. Dhaliwal, S.S. and T.A. Welborn, Central obesity and multivariable cardiovascular risk as<br />
assessed by the Framingham prediction scores. Am J Cardiol, 2009. 103(10): p. 1403-7.<br />
966. Welborn, T.A. and S.S. Dhaliwal, Preferred clinical measures of central obesity for predicting<br />
mortality. Eur J Clin Nutr, 2007. 61(12): p. 1373-9.<br />
967. <strong>Australian</strong> Government Department of <strong>Health</strong> and Ageing. National Physical Activity<br />
<strong>Guidelines</strong> for Adults. . 2005; Available from:<br />
<strong>DRAFT</strong> <strong>Australian</strong> <strong>Dietary</strong> <strong>Guidelines</strong>- December 2011 280
http://www.health.gov.au/internet/main/publishing.nsf/content/phd-physical-activity-adultspdf-cnt.htm<br />
968. Miller, Y.D. and D.W. Dunstan, The effectiveness of physical activity interventions for the<br />
treatment of overweight and obesity and type 2 diabetes. J Sci Med Sport, 2004. 7(1 Suppl): p.<br />
52-9.<br />
969. Genkinger, J.M., et al., Fruit, vegetable, and antioxidant intake and all-cause, cancer, and<br />
cardiovascular disease mortality in a community-dwelling population in Washington County,<br />
Maryland. Am J Epidemiol, 2004. 160(12): p. 1223.<br />
970. Liu, Y., et al., Vegetables, fruit consumption and risk of lung cancer among middle-aged Japanese<br />
men and women: JPHC study. Cancer Causes Control, 2004. 15(4): p. 349-357.<br />
971. Smith-Warner, S.A., et al., Fruits, vegetables and lung cancer: a pooled analysis of cohort studies.<br />
Int J Cancer, 2003. 107(6): p. 1001-11.<br />
972. Wright, M.E., et al., Intakes of fruit, vegetables, and specific botanical groups in relation to lung<br />
cancer risk in the NIH-AARP Diet and <strong>Health</strong> Study. Am J Epidemiol, 2008. 168(9): p. 1024-34.<br />
973. Boyle, P. and B. Levin, World Cancer Report 2008. World Cancer Report 2008, 2008.<br />
974. van Duijnhoven, F.J.B., et al., Fruit, vegetables, and colorectal cancer risk: the European<br />
Prospective Investigation into Cancer and Nutrition. Am J Clin Nutr, 2009. 89(5): p. 1441.<br />
975. Lee, J.E., et al., Intakes of fruit, vegetables, and carotenoids and renal cell cancer risk: a pooled<br />
analysis of 13 prospective studies. Cancer Epidemiol Biomarkers Prev, 2009. 18(6): p. 1730-9.<br />
976. Dolwick Grieb, S.M., et al., Food groups and renal cell carcinoma: results from a case-control<br />
study. J Am Diet Assoc, 2009. 109(4): p. 656-67.<br />
977. Weikert, S., et al., Fruits and vegetables and renal cell carcinoma: findings from the European<br />
prospective investigation into cancer and nutrition (EPIC). Int J Cancer 2006. 118(12): p. 3133-<br />
3139.<br />
978. Rashidkhani, B., et al., Fruits, vegetables and risk of renal cell carcinoma: a prospective study of<br />
Swedish women. Int J Cancer 2005. 113(3): p. 451-5.<br />
979. Stewart, B.W. and P. Kleihues, eds. World Cancer Research Report. 2003, International<br />
Agency for Research on Cancer: Lyon.<br />
980. Boffetta, P., et al., Fruit and vegetable intake and overall cancer risk in the European Prospective<br />
Investigation into Cancer and Nutrition (EPIC). J Natl Cancer Inst, 2010. 102(8): p. 529.<br />
<strong>DRAFT</strong> <strong>Australian</strong> <strong>Dietary</strong> <strong>Guidelines</strong>- December 2011 281
981. Liang, W. and C.W. Binns, Fruit, vegetables, and colorectal cancer risk: the European Prospective<br />
Investigation into Cancer and Nutrition. Am J Clin Nutr, 2009. 90(4): p. 1112.<br />
982. Miura, K., et al., Relation of vegetable, fruit, and meat intake to 7-year blood pressure change in<br />
middle-aged men: the Chicago Western Electric Study. Am J Epidemiol, 2004. 159(6): p. 572-<br />
80.<br />
983. Freedman, N.D., et al., Fruit and vegetable intake and head and neck cancer risk in a large<br />
United States prospective cohort study. Int J Cancer, 2008. 122(10): p. 2330-6.<br />
984. Ahn, Y.S., et al., Increased platelet calcium in thrombosis and related disorders and its correction<br />
by nifedipine. Thromb Res, 1987. 45(2): p. 135-43.<br />
985. Alberola, A., et al., Crystal structures and magnetic properties of a sterically encumbered<br />
dithiadiazolyl radical, 2,4,6-(F3C)3C6H2CNSSN. Chem Commun (Camb), 2005(37): p. 4726-8.<br />
986. Atkins, G.J., et al., Human osteoblasts are resistant to Apo2L/TRAIL-mediated apoptosis. Bone,<br />
2002. 31(4): p. 448-56.<br />
987. Sunny, L. and L. Sunny, A low fat diet rich in fruits and vegetables may reduce the risk of<br />
developing prostate cancer. Asian Pac J Cancer Prev, 2005. 6(4): p. 490-6.<br />
988. Ello-Martin, J.A., et al., <strong>Dietary</strong> energy density in the treatment of obesity: a year-long trial<br />
comparing 2 weight-loss diets. Am J Clin Nutr, 2007. 85(6): p. 1465-1477.<br />
989. Whybrow, S., et al., Effects of added fruits and vegetables on dietary intakes and body weight in<br />
Scottish adults. Br J Nutr, 2006. 95(3): p. 496-503.<br />
990. Vrieling, A., et al., Fruit and vegetable consumption and pancreatic cancer risk in the European<br />
Prospective Investigation into Cancer and Nutrition. Int J Cancer, 2009. 124(8): p. 1926-1934.<br />
991. Larsson, S.C., L. Bergkvist, and A. Wolk, Fruit and vegetable consumption and incidence of<br />
gastric cancer: a prospective study. Cancer Epidemiol Biomarkers Prev, 2006. 15(10): p. 1998-<br />
2001.<br />
992. Food And Agriculture Organization of the United Nations and the World <strong>Health</strong><br />
Organization, International Conference on Nutrition: World Declaration and Plan of Action for<br />
Nutrition., 1992, Food And Agriculture Organization of the United Nations and the World<br />
<strong>Health</strong> Organization: Geneva.<br />
993. Lester, I.H., Australia's food and nutrition, 1994, <strong>Australian</strong> Government Publishing Service:<br />
Canberra.<br />
994. PHAA, <strong>Health</strong> inequities policy, 2009, Public <strong>Health</strong> Association of Australia: Canberra.<br />
<strong>DRAFT</strong> <strong>Australian</strong> <strong>Dietary</strong> <strong>Guidelines</strong>- December 2011 282
995. Atlantis, E., E.H. Barnes, and K. Ball, Weight status and perception barriers to healthy physical<br />
activity and diet behavior. Int J Obes (Lond), 2008. 32(2): p. 343-52.<br />
996. Baker, E.A., et al., The role of race and poverty in access to foods that enable individuals to<br />
adhere to dietary guidelines. Prev Chronic Dis, 2006. 3(3): p. A76.<br />
997. Bodnar, L.M. and A.M. Siega-Riz, A diet quality index for pregnancy detects variation in diet and<br />
differences by sociodemographic factors. Public <strong>Health</strong> Nutr, 2002. 5(6): p. 801-9.<br />
998. Cassady, D., K.M. Jetter, and J. Culp, Is price a barrier to eating more fruits and vegetables for<br />
low-income families? J Am Diet Assoc, 2007. 107(11): p. 1909-15.<br />
999. Giskes, K., et al., A multilevel study of socio-economic inequalities in food choice behaviour and<br />
dietary intake among the Dutch population: the GLOBE study. Public <strong>Health</strong> Nutr, 2006. 9(1): p.<br />
75-83.<br />
1000. Giskes, K., et al., Socioeconomic inequalities in food purchasing: the contribution of respondentperceived<br />
and actual (objectively measured) price and availability of foods. Prev Med, 2007.<br />
45(1): p. 41-8.<br />
1001. Kolodinsky, J., et al., Knowledge of current dietary guidelines and food choice by college students:<br />
better eaters have higher knowledge of dietary guidance. Journal of the American Dietetic<br />
Association, 2007. 107(8): p. 1409-13.<br />
1002. Inglis, V., K. Ball, and D. Crawford, Why do women of low socioeconomic status have poorer<br />
dietary behaviours than women of higher socioeconomic status? A qualitative exploration.<br />
Appetite, 2005. 45(3): p. 334-43.<br />
1003. McNaughton, S.A., et al., An index of diet and eating patterns is a valid measure of diet quality in<br />
an <strong>Australian</strong> population. J Nutr, 2008. 138(1): p. 86-93.<br />
1004. Nelson, M., K. Dick, and B. Holmes, Food budget standards and dietary adequacy in low-income<br />
families. Proc Nutr Soc, 2002. 61(4): p. 569-77.<br />
1005. Sanchez, A., et al., Patterns and correlates of physical activity and nutrition behaviors in<br />
adolescents. Am J Prev Med, 2007. 32(2): p. 124-30.<br />
1006. Story, M., D. Neumark-Sztainer, and S. French, Individual and environmental influences on<br />
adolescent eating behaviors. J Am Diet Assoc, 2002. 102(3 Suppl): p. S40-51.<br />
1007. Turrell, G. and A.M. Kavanagh, Socio-economic pathways to diet: modelling the association<br />
between socio-economic position and food purchasing behaviour. Public <strong>Health</strong> Nutr, 2006. 9(3):<br />
p. 375-83.<br />
<strong>DRAFT</strong> <strong>Australian</strong> <strong>Dietary</strong> <strong>Guidelines</strong>- December 2011 283
1008. Turrell, G., et al., Measuring socio-economic position in dietary research: is choice of socioeconomic<br />
indicator important? Public <strong>Health</strong> Nutr, 2003. 6(2): p. 191-200.<br />
1009. Collins, C.E., A.F. Young, and A. Hodge, Diet quality is associated with higher nutrient intake<br />
and self-rated health in mid-aged women. J Am Coll Nutr, 2008. 27(1): p. 146-57.<br />
1010. Dynesen, A.W., et al., Sociodemographic differences in dietary habits described by food<br />
frequency questions--results from Denmark. Eur J Clin Nutr, 2003. 57(12): p. 1586-97.<br />
1011. Hearty, A.P., et al., Relationship between attitudes towards healthy eating and dietary behaviour,<br />
lifestyle and demographic factors in a representative sample of Irish adults. Appetite, 2007.<br />
48(1): p. 1-11.<br />
1012. Oldroyd, J., et al., The effectiveness of nutrition interventions on dietary outcomes by relative<br />
social disadvantage: a systematic review. J Epidemiol Community <strong>Health</strong>, 2008. 62(7): p. 573-<br />
9.<br />
1013. Power, E.M., Determinants of healthy eating among low-income Canadians. Can J Public <strong>Health</strong>,<br />
2005. 96 Suppl 3: p. S37-42, S42-8.<br />
1014. Wong, K.C., et al., Availability, affordability and quality of a healthy food basket in Adelaide,<br />
South Australia. Nutr Diet, 2011. 68(1): p. 8-14.<br />
1015. Statistics, A.B.o., National Aboriginal and Torres Strait Islander Survey 1994, ABS, Editor 1994,<br />
Commonwealth of Australia: Canberra.<br />
1016. Andrieu, E., N. Darmon, and A. Drewnowski, Low-cost diets: more energy, fewer nutrients. Eur<br />
J Clin Nutr, 2006. 60(3): p. 434-6.<br />
1017. Centre for Epidemiology and Research, 2007 report on adult health from the New South<br />
Wales Population <strong>Health</strong> Survey, 2008b, NSW Department of <strong>Health</strong>: Sydney, NSW.<br />
1018. Department of Human Services, Victorian Population <strong>Health</strong> Survey 2007, D.o.H. Services,<br />
Editor 2008: Melbourne.<br />
1019. Burns, C., A review of the literature describing the link between poverty, food insecurity and<br />
obesity with specific reference to Australia, P.A. Unit, Editor 2004, Victorian <strong>Health</strong> Promotion<br />
Foundation: Melbourne.<br />
1020. <strong>Australian</strong> Institute of <strong>Health</strong> and Welfare, Aboriginal and Torres Strait Islander <strong>Health</strong><br />
Performance Framework, 2006 report: detailed analyses. , AIHW, Editor 2007, AIHW:<br />
Canberra.<br />
<strong>DRAFT</strong> <strong>Australian</strong> <strong>Dietary</strong> <strong>Guidelines</strong>- December 2011 284
1021. <strong>Australian</strong> Bureau of Statistics. Consumer Price Index, Australia, March 2011 - Cat. no. 6401.0.<br />
2011 [cited 1 June 2011]; Available from:<br />
http://www.abs.gov.au/AUSSTATS/abs@.nsf/DetailsPage/6401.0Mar%202011?OpenDocume<br />
nt.<br />
1022. Baghurst, K.I., Social status, nutrition and the cost of healthy eating, in <strong>Dietary</strong> <strong>Guidelines</strong> for<br />
<strong>Australian</strong> Adults, K.I. Baghurst and C. Binns, Editors. 2003, National <strong>Health</strong> and Medical<br />
Research Council: Canberra.<br />
1023. Sanchez-Villegas, A., et al., A systematic review of socioeconomic differences in food habits in<br />
Europe: consumption of cheese and milk. Eur J Clin Nutr, 2003. 57(8): p. 917-29.<br />
1024. Vos, T., The burden of disease and injury in Aboriginal and Torres Strait Islander peoples 2003.<br />
2007: University of Queensland Centre for Burden of Disease and Cost-Effectiveness.<br />
1025. Carson, B., T. Dunbar, and R.D. Chenhall, Social determinants of Indigenous health2007: Allen<br />
& Unwin Academic.<br />
1026. Torzillo, P.J., et al., The state of health hardware in Aboriginal communities in rural and remote<br />
Australia. Aust N Z J Public <strong>Health</strong>, 2008. 32(1): p. 7-11.<br />
1027. <strong>Australian</strong> Bureau of Statistics and <strong>Australian</strong> Institute of <strong>Health</strong> and Welfare, The health<br />
and welfare of Australia's Aboriginal and Torres Strait Islander peoples 2008, <strong>Australian</strong> Institute<br />
of <strong>Health</strong> and Welfare: Canberra.<br />
1028. Ruben, A.R. and A.C. Walker, Malnutrition among rural aboriginal children in the Top End of<br />
the Northern Territory. Med J Aust, 1995. 162(8): p. 400.<br />
1029. Sayers, S.M., et al., An <strong>Australian</strong> Aboriginal birth cohort: a unique resource for a life course study<br />
of an Indigenous population. A study protocol. BMC Int <strong>Health</strong> Hum Rights, 2003. 3(1): p. 1.<br />
1030. Northern Territory Government, Department of <strong>Health</strong> and Community Services: Annual<br />
Report 2006-2007, 2007, Department of <strong>Health</strong> and Community Services: Casuarina.<br />
1031. Northern Territory Government, Northern Territory Market Basket Survey 2008, 2008,<br />
Northern Territory Department of <strong>Health</strong> and Families: Darwin.<br />
1032. Mackerras, D.E., et al., Growth and morbidity in children in the Aboriginal birth cohort study: the<br />
urban-remote differential. Med J Aust, 2003. 178(2): p. 56-60.<br />
1033. Vanlint, S.J., et al., Vitamin D insufficiency in Aboriginal <strong>Australian</strong>s. Women, 2011. 100: p. 120.<br />
1034. Coyne, T. and I. Darnton-Hill, <strong>Australian</strong> Aborigines’ nutrition and changing disease patterns.<br />
New Doctor, 1979. 12: p. 32-7.<br />
<strong>DRAFT</strong> <strong>Australian</strong> <strong>Dietary</strong> <strong>Guidelines</strong>- December 2011 285
1035. Naughton, J.M., K. O'Dea, and A.J. Sinclair, Animal foods in traditional <strong>Australian</strong> aboriginal<br />
diets: polyunsaturated and low in fat. Lipids, 1986. 21(11): p. 684-90.<br />
1036. O'Dea, K., Traditional diet and food preferences of <strong>Australian</strong> Aboriginal hunter-gatherers. Philos<br />
Trans R Soc Lond B Biol Sci, 1991. 334(1270): p. 233-40; discussion 240-1.<br />
1037. Shannon, C., Acculturation: Aboriginal and Torres Strait Islander nutrition. Asia Pac J Clin Nutr,<br />
2002. 11 Suppl 3: p. S576-8.<br />
1038. Lee, A., Transition of <strong>Australian</strong> Aboriginal diet and nutritional health. . Wld Rev Nutr Diet,<br />
1996. 79: p. 1-52.<br />
1039. Booth, S. and A. Smith, Food security and poverty in Australia-challenges for dietitians. <strong>Australian</strong><br />
Journal of Nutrition and Dietetics, 2001. 58(3): p. 150-156.<br />
1040. House of Representatives Standing Committee on Aboriginal and Torres Strait Islander<br />
affairs, Everybody's business: remote Aboriginal and Torres Strait community stores, 2009,<br />
Commonwealth of Australia: Canberra.<br />
1041. Leonard, D., R. Beilin, and M. Moran, Which way kaikai blo umi? Food and nutrition in the<br />
Torres Strait. Aust J Public <strong>Health</strong>, 1995. 19(6): p. 589-595.<br />
1042. Meedeniya, J., A. Smith, and P. Carter, Food supply in rural South Australia: a survey on food<br />
cost, quality and variety. 2000.<br />
1043. Beaumont, S., Tasmanian food price, availability, and quality survey1998, Hobart: Tasmania<br />
Department of Community and <strong>Health</strong> Services.<br />
1044. Bowcock, R., Kimberley Market Basket Survey. Derby: Kimberley Public <strong>Health</strong>, 1999.<br />
1045. Price, R., et al., Surveys of food availability, quality and price in rural and remote communities of<br />
the Alice Springs and Barkly district: April and May 1998. Darwin: Territory <strong>Health</strong> Service,<br />
1998.<br />
1046. Sullivan, H., M. Gracey, and V. Hevron, Food costs and nutrition of Aborigines in remote areas<br />
of northern Australia. Med J Aust, 1987. 147(7): p. 334-7.<br />
1047. Cutter, T., Nutrition and food habits of the central <strong>Australian</strong> Aboriginal. The nutrition of<br />
Aborigines in relation to the ecosystem of central Australia. Melbourne: CSIRO, 1978: p.<br />
63-70.<br />
1048. House of Representatives, Inquiry into community stores in remote Aboriginal and Torres Strait<br />
Islander communities 2009., 2009, Commonwealth of Australia: Canberra.<br />
<strong>DRAFT</strong> <strong>Australian</strong> <strong>Dietary</strong> <strong>Guidelines</strong>- December 2011 286
1049. Altman, J., Hunter-gatherers today: An Aboriginal economy in north Australia1987, Canberra:<br />
<strong>Australian</strong> Institute of Aboriginal Studies.<br />
1050. Devitt, J., Traditional Aboriginal preferences in a changed context. Central <strong>Australian</strong> Rural<br />
Practitioners’ Association Newsletter, 1991. 14: p. 38-41.<br />
1051. Rae, C., et al., The role of bushfoods in contemporary Aboriginal diets. Proc Nut Soc Aus, 1982.<br />
7: p. 45-9.<br />
1052. Browne, J., S. Laurence, and S. Thorpe, Acting on food insecurity in urban Aboriginal and Torres<br />
Strait Islander communities: Policy and practice interventions to improve local access and supply of<br />
nutritious food, 2009, Victorian Aboriginal Community Controlled <strong>Health</strong> Organisation:<br />
Melbourne.<br />
1053. Guest, C.S. and K. O'Dea, Diabetes in aborigines and other <strong>Australian</strong> populations. Aust J Public<br />
<strong>Health</strong>, 1992. 16(4): p. 340-9.<br />
1054. Doyle, J., et al., Developing nutrition and physical activity guidelines and interventions for<br />
Aboriginal and Torres Strait Islander communities, 2007, Onemda Vic <strong>Health</strong> Koori <strong>Health</strong><br />
Research Unit and Department of Human Services.: Shepparton.<br />
1055. Clough, A.R., K. Rowley, and K. O'Dea, Kava use, dyslipidaemia and biomarkers of dietary<br />
quality in Aboriginal people in Arnhem Land in the Northern Territory (NT), Australia. Eur J Clin<br />
Nutr, 2004. 58(7): p. 1090-1093.<br />
1056. Chan, L.C.K., et al., Association between anthropometric measures of obesity and cardiovascular<br />
risk markers in a self-selected group of indigenous <strong>Australian</strong>s. Journal of Cardiovascular Risk,<br />
2007. 14(4): p. 515.<br />
1057. Lee, A., Bonson (Bailey), APV., Yarmirr, D., Mathews, J., O'Dea, K. , Sustainability of a<br />
successful Aboriginal community-based nutrition project. Med J Aust 1995. 162: p. 632-635.<br />
1058. Rowley, K.G., et al., Effectiveness of a community directed ‘healthy lifestyle’program in a remote<br />
<strong>Australian</strong> Aboriginal community. Aust N Z J Public <strong>Health</strong>, 2000. 24(2): p. 136-144.<br />
1059. Johannes, R.E. and J.W. MacFarlane, Traditional fishing in the Torres Strait islands1991: CSIRO<br />
Division of Fisheries, Marine Laboratories.<br />
1060. Haynes D, M.-W.K., Kwan D., Trace metal concentrations in Torres Strait green turtle (Chelonia<br />
mydas) tissues, 1997–1998. , 2001, Report prepared for the Torres Strait Regional<br />
Authority.<br />
1061. Cancer Council NSW, NSW healthy food basket cost, availability and quality survey, 2007,<br />
Cancer Council NSW: Sydney.<br />
<strong>DRAFT</strong> <strong>Australian</strong> <strong>Dietary</strong> <strong>Guidelines</strong>- December 2011 287
<strong>DRAFT</strong> <strong>Australian</strong> <strong>Dietary</strong> <strong>Guidelines</strong>- December 2011 288