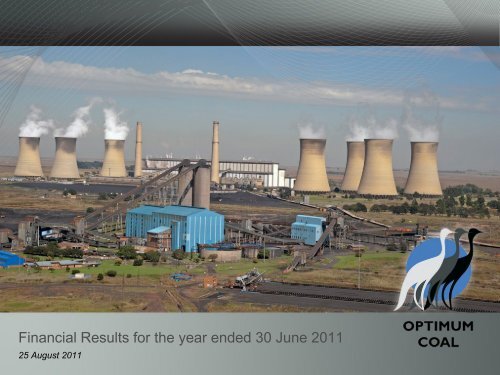
Financial Results for the year ended 30 June 2011 - Optimum Coal
Financial Results for the year ended 30 June 2011 - Optimum Coal
Financial Results for the year ended 30 June 2011 - Optimum Coal

Create successful ePaper yourself
Turn your PDF publications into a flip-book with our unique Google optimized e-Paper software.
<strong>Financial</strong> <strong>Results</strong> <strong>for</strong> <strong>the</strong> <strong>year</strong> <strong>ended</strong> <strong>30</strong> <strong>June</strong> <strong>2011</strong><br />
25 August <strong>2011</strong>
2<br />
“<strong>Optimum</strong> <strong>Coal</strong> has had a good operational <strong>year</strong>. Our coal mines are maturing and our life of mine extension<br />
projects have gained positive momentum during <strong>the</strong> <strong>year</strong>. Our overall safety per<strong>for</strong>mance has been<br />
commendable and we remain focussed on achieving zero harm targets.<br />
Although <strong>Optimum</strong> Collieries has had various production challenges during <strong>the</strong> <strong>year</strong>, we have restructured <strong>the</strong><br />
management team and have commenced various exposure, extraction and yield initiatives. Production at <strong>the</strong><br />
Boschmanspoort underground section has now stabilised and <strong>the</strong> critical Kwagga North life extension project<br />
is progressing well.<br />
<strong>Coal</strong> production at Koornfontein Mines has exceeded our expectations and we are delighted with its<br />
operational per<strong>for</strong>mance during <strong>the</strong> <strong>year</strong>. Additionally, <strong>the</strong> acquisition of <strong>the</strong> TNC reserves will ensure that<br />
Koornfontein Mines returns to being a long life, high quality export coal operation, <strong>the</strong>reby enabling us to<br />
optimise our overall coal portfolio.<br />
Export railing logistics remain challenging, however with TFR‟s expansion program approved and underway,<br />
and with increased TFR rail rates now implemented, an improvement in TFR‟s railings per<strong>for</strong>mance is<br />
reasonably expected in <strong>the</strong> coming <strong>year</strong>.<br />
We remain well placed to benefit from strong international coal prices and from an increasing local demand <strong>for</strong><br />
<strong>the</strong>rmal coal”<br />
Mike Teke<br />
<strong>Optimum</strong> <strong>Coal</strong> CEO
3<br />
AGENDA<br />
Overview – Mike Teke<br />
FY<strong>2011</strong> results – Doug Gain, Riaan du Plooy<br />
– <strong>Financial</strong> review<br />
– Operational review<br />
Outlook <strong>for</strong> FY2012 – Mike Teke<br />
– Market review<br />
– Group outlook <strong>for</strong> FY2012<br />
– Eskom<br />
– Transnet Freight Rail<br />
Delivering on our group strategy – Mike Teke<br />
Discussion / Q&A – Mike Teke
Overview<br />
Mike Teke
5<br />
Our achievements during <strong>the</strong> <strong>year</strong> to <strong>June</strong> <strong>2011</strong><br />
Improvement in safety statistics. No fatal accidents during <strong>the</strong> past 18 months<br />
Revenue increased by 57% to R5 289 million<br />
EBITDA generated of R1 200 million<br />
Profit generated of R460 million<br />
Group run-of-mine coal production up 21% to 17.1 million tons<br />
Group saleable coal production up 26% to 13.6 million tons. Export coal production up 28% to 6.8<br />
million tons<br />
<strong>Optimum</strong> Collieries management team restructured. Kwagga North opencast extension project on track<br />
Acquisitions agreed <strong>for</strong> <strong>the</strong> TNC and Remhoogte (1) prospecting rights<br />
Cash on hand of R567 million and net debt of R77 million as at <strong>30</strong> <strong>June</strong> <strong>2011</strong><br />
Special dividend of R75.5 million declared (<strong>30</strong> cps)<br />
(1) Remhoogte agreement signed in August <strong>2011</strong>
6<br />
HSEC per<strong>for</strong>mance<br />
Safety<br />
‒ No fatalities<br />
‒ Reducing CIFR (1) (5%) and TRIFR (2) (11%)<br />
Health<br />
‒ Voluntary HIV testing ongoing<br />
‒ Continuous monitoring of occupational and non-<br />
occupational illnesses<br />
‒ Continued compliance to Mine Health and Safety<br />
Council Milestones<br />
Environment<br />
‒ Reduction in rehabilitation liability (additional ground<br />
levelling and water management initiatives)<br />
‒ Water supply from Water Reclamation Plant to<br />
STLM (3) commenced at up to 5 Ml per day<br />
(1) Classified injury frequency rate<br />
(2) Total recordable injury frequency rate<br />
(3) Steve Tshwete Local Municipality<br />
CIFR<br />
2.5<br />
2.0<br />
1.5<br />
1.0<br />
0.5<br />
0.0<br />
TRIFR<br />
6.0<br />
5.0<br />
4.0<br />
3.0<br />
2.0<br />
1.0<br />
0.0<br />
2.03<br />
4.81<br />
32%<br />
5%<br />
1.38 1.31<br />
FY2009 FY2010 FY<strong>2011</strong><br />
25%<br />
11%<br />
3.60 3.19<br />
FY2009 FY2010 FY<strong>2011</strong>
<strong>Financial</strong> Per<strong>for</strong>mance<br />
Doug Gain
8<br />
Group financial overview<br />
(Rm, unless o<strong>the</strong>rwise indicated)<br />
Revenue<br />
Mining and related cash costs<br />
- Mining costs<br />
- Logistics costs<br />
- O<strong>the</strong>r costs<br />
EBIT<br />
(1) Earnings be<strong>for</strong>e interest, taxation, depreciation, amortisation and environmental provision releases<br />
(2) Calculated on 199 million shares in issue after consolidation of <strong>the</strong> 52 million shares owned by Trusts <strong>for</strong> IFRS purposes<br />
(3) Calculated on a total of 251 million shares in issue ignoring any IFRS Trust consolidation effects<br />
57%<br />
28%<br />
31%<br />
26%<br />
(69%)<br />
Profit <strong>for</strong> <strong>the</strong> period 460 229 101%<br />
Cash generated/(utilised) by operations<br />
Capex<br />
5 289 3 359<br />
4 089 3 193<br />
3 397<br />
670<br />
22<br />
2 590<br />
EBITDA (1) 1 200 166 623%<br />
EBITDA margin (%) 22.7% 4.3%<br />
EPS – IFRS (2) (cps)<br />
HEPS – IFRS (2) (cps)<br />
EPS – Normalised (3) (cps)<br />
HEPS – Normalised (3) (cps)<br />
FY <strong>2011</strong> FY 2010 % change<br />
532<br />
71<br />
794 412<br />
941 (7)<br />
692 881<br />
2<strong>30</strong> 132<br />
203 29<br />
183 100<br />
162 22<br />
93%<br />
(21%)<br />
74%<br />
605%<br />
83%<br />
636%
9<br />
Group EBITDA<br />
EBITDA variance<br />
Rm<br />
2 000<br />
1 800<br />
1 600<br />
1 400<br />
1 200<br />
1 000<br />
800<br />
600<br />
400<br />
200<br />
0<br />
166<br />
1 070<br />
FY10 Volume<br />
(tonnages)<br />
(524)<br />
Volume<br />
(cash costs)<br />
1 143<br />
<strong>Coal</strong> price<br />
(API#4)<br />
(283)<br />
Exchange rate<br />
(R/$)<br />
(147)<br />
(86)<br />
Inflation Additional cost<br />
escalation (cash<br />
costs)<br />
(139)<br />
Rail & export<br />
costs<br />
1 200<br />
FY11
10<br />
Group net debt<br />
Net debt variance<br />
Rm<br />
1 050<br />
900<br />
750<br />
600<br />
450<br />
<strong>30</strong>0<br />
150<br />
0<br />
(150)<br />
(<strong>30</strong>0)<br />
(450)<br />
(600)<br />
(70)<br />
Opening balance<br />
FY10<br />
941 (692)<br />
Cash generated by<br />
operations<br />
(299) 44 (77)<br />
Acquisition of PPE Interest and tax O<strong>the</strong>r Closing balance<br />
FY11<br />
Currently in process of evaluating debt re-financing proposals from various lenders<br />
The new corporate debt facility will materially increase <strong>the</strong> group‟s ability to utilise debt <strong>for</strong><br />
general corporate purposes including capital expenditure, working capital requirements and<br />
acquisitions.
11<br />
Group balance sheet<br />
(Rm, unless o<strong>the</strong>rwise indicated)<br />
Non-current assets<br />
- Property plant and equipment<br />
- Restricted rehabilitation investment<br />
- O<strong>the</strong>r non-current assets<br />
- Cash and cash equivalents<br />
- O<strong>the</strong>r assets<br />
TOTAL ASSETS<br />
9 989 9 819<br />
6 356<br />
1 276<br />
2 357<br />
6 375<br />
1 184<br />
2 260<br />
Current Assets 1 473 1 405<br />
5%<br />
567<br />
906<br />
751<br />
654<br />
11 462 11 224<br />
2%<br />
(1%)<br />
8%<br />
4%<br />
(25%)<br />
Total Equity 6 892 6 268<br />
10%<br />
Non-current liabilities 3 722 3 525<br />
8%<br />
- Environmental liability provision<br />
- O<strong>the</strong>r liabilities<br />
- Loans and borrowings<br />
- O<strong>the</strong>r liabilities<br />
As at <strong>30</strong><br />
<strong>June</strong> <strong>2011</strong><br />
1 774<br />
1 948<br />
150<br />
698<br />
As at <strong>30</strong><br />
<strong>June</strong> 2010<br />
1 899<br />
1 626<br />
Current liabilities 848 1 431<br />
(46%)<br />
7<strong>30</strong><br />
701<br />
% change<br />
38%<br />
2%<br />
(7%)<br />
24%<br />
(90%)<br />
Total liabilities 4 570 4 956<br />
(8%)<br />
TOTAL EQUITY AND LIABILITIES 11 462 11 224<br />
2%<br />
4%
Operational per<strong>for</strong>mance<br />
Riaan du Plooy
13<br />
<strong>Optimum</strong> <strong>Coal</strong> (Group) statistics<br />
ROM production (Mt)<br />
- <strong>Optimum</strong> Collieries<br />
- Koornfontein Mines (1)<br />
Saleable product (Mt)<br />
- Export and inland – <strong>Optimum</strong> Collieries<br />
- Export – Koornfontein Mines (1)<br />
- Eskom – <strong>Optimum</strong> Collieries<br />
- Eskom and inland – Koornfontein Mines (1)<br />
Railed to RBCT (Mt)<br />
Realised export revenue per ton (R/t)<br />
- Average API#4 price ($/ton)<br />
- Average R/$<br />
FY <strong>2011</strong> FY 2010<br />
14.1<br />
13.1<br />
1.0<br />
10.8<br />
4.7<br />
0.6<br />
5.1<br />
0.4<br />
5.1<br />
559.40<br />
73.80<br />
% change<br />
21%<br />
7%<br />
210%<br />
26%<br />
4%<br />
217%<br />
8%<br />
225%<br />
Realised inland revenue per ton (R/t) 549.56 594.54<br />
(8%)<br />
Capex (Rm)<br />
- <strong>Optimum</strong> Collieries<br />
- Koornfontein Mines (1)<br />
- Exploration projects<br />
17.1<br />
14.0<br />
3.1<br />
13.6<br />
4.9<br />
1.9<br />
5.5<br />
1.3<br />
6.4<br />
701.17<br />
100.02<br />
7.01<br />
692<br />
566<br />
115<br />
11<br />
(1) 4 months‟ attributable results from Koornfontein Mines have been included with effect from 1 March 2010.<br />
7.58<br />
891<br />
848<br />
33<br />
10<br />
25%<br />
25%<br />
36%<br />
(8%)<br />
(22%)<br />
(33%)<br />
248%<br />
10%
14<br />
Managing our operations – <strong>Optimum</strong> Collieries<br />
Operations mature and LOM extension projects gaining momentum<br />
Opencast<br />
Pullenshope O/C – YoY improvement in production,<br />
scaling down in FY2012 with dragline moving to Kwagga<br />
North<br />
Eikeboom O/C – Reduced production in-line with LOM<br />
plan, dragline activity reduced accordingly, long term life<br />
ahead, albeit at lower production rate<br />
Kwagga Central O/C – YoY improvement in production<br />
despite increasing strip ratios<br />
<strong>Optimum</strong> Collieries ROM production profile<br />
20 000<br />
15 000<br />
10 000<br />
5 000<br />
0<br />
2672<br />
1808<br />
4472 4<strong>30</strong>6<br />
7568 7517<br />
2007<br />
2008<br />
439<br />
1697<br />
4127<br />
6336<br />
2009<br />
2553<br />
1672<br />
4644<br />
1354<br />
5201<br />
4208 4338<br />
2010<br />
<strong>30</strong>73<br />
<strong>2011</strong><br />
3400<br />
956<br />
360<br />
1058<br />
4637<br />
6441<br />
2012F<br />
3780<br />
3600<br />
7195<br />
2013F<br />
3780 3780 3780 3780<br />
720<br />
952<br />
720<br />
795<br />
1522 1750<br />
9814 9718<br />
2014F<br />
2015F<br />
1470 1575<br />
736 810<br />
10695 10274<br />
2016F<br />
2017F<br />
3780<br />
3780<br />
1575<br />
835<br />
3780<br />
1575<br />
837<br />
2310<br />
771<br />
438<br />
2310<br />
715<br />
2310<br />
673<br />
9326 9636 9905 9573 9868<br />
2018F<br />
2019F<br />
Kwagga North O/C – <strong>Coal</strong>ing ramping up, additional<br />
dragline from Pullenshope will increase production,<br />
infrastructure project progressing well, (commissioning<br />
early calendar 2012)<br />
Underground<br />
Boschmanspoort U/G – increasing pit-room creating<br />
additional flexibility, recent per<strong>for</strong>mance positive and<br />
production ramping up well (see slide 15)<br />
kt Boschmanspoort UG<br />
2020F<br />
2021F<br />
2022F<br />
2310<br />
723<br />
8477<br />
2023F<br />
2200<br />
2281 800<br />
795 785 749<br />
6288 6700 7088<br />
2024F<br />
2025F<br />
2026F<br />
3500<br />
753<br />
3856<br />
2027F<br />
Pullenshope UG<br />
Eikeboom OC<br />
Pullenshope OC<br />
Kwagga OC<br />
3500<br />
402<br />
1500<br />
2950<br />
1000<br />
0 1100<br />
200 0<br />
2028F<br />
2029F<br />
20<strong>30</strong>F
15<br />
Managing our operations – Boschmanspoort<br />
Boschmanspoort production ramp-up is gaining good momentum<br />
Per<strong>for</strong>mance<br />
Production ramp-up achieved during <strong>June</strong> <strong>2011</strong>, on<br />
track to achieve 3.4 million tons <strong>for</strong> FY2012<br />
<strong>Coal</strong>cor (underground contractor) in wage negotiations<br />
Improved production resulted from a number of<br />
initiatives:<br />
‒ Section 2 moved from eastern to western mining<br />
area where geological conditions are less<br />
challenging<br />
‒ Engineering availability on continuous haulage<br />
improved significantly due to changes done on chain<br />
system<br />
‒ Cutting time improved with increased overtime<br />
production<br />
ktpa<br />
320<br />
270<br />
220<br />
170<br />
120<br />
Boschmanspoort monthly production<br />
(annualised production in brackets)<br />
(2 796)<br />
(2 976)<br />
(2 880)<br />
233 248 240<br />
(3 528)<br />
294<br />
Mar-10 Apr-10 May-10 Jun-10<br />
Boschmanspoort infrastructure and high wall
16<br />
Managing our operations – Kwagga North<br />
Kwagga North project development tracking on time and within budget<br />
Development progress<br />
Design work <strong>for</strong> 20 000 tonne bunker in final stage<br />
Conveyor construction progressing well<br />
Bosmanspruit bridge 80% complete<br />
Electrical orders already placed<br />
Good progress on civil work on <strong>the</strong> ROM tip<br />
Community re-location progressing and issues being<br />
addressed<br />
Immediate focus areas<br />
Earth works <strong>for</strong> civil work to be completed<br />
Bridge work to be completed<br />
ROM Tip to be completed<br />
Installation of overland conveyors to continue<br />
Conveyor belt construction<br />
Bosmanspruit bridge
17<br />
Managing our operations – Koornfontein Mines<br />
Koornfontein Mines<br />
Koornfontein Mines‟ operations mature and in steady<br />
state<br />
Koornfontein discard reclamation to continue <strong>for</strong><br />
ano<strong>the</strong>r 3 <strong>year</strong>s<br />
Upside to railing export capacity due to strategic<br />
positioning of Koornfontein rapid load-out infrastructure<br />
Various Eskom supply opportunities currently being<br />
negotiated<br />
TNC reserves will extend life of high value product by<br />
12 <strong>year</strong>s<br />
Expected Koornfontein Mines ROM production profile<br />
kt<br />
5 000<br />
4 000<br />
3 000<br />
2 000<br />
1 000<br />
0<br />
1391<br />
2791 2849<br />
2007<br />
2008<br />
3217<br />
2009<br />
2936 3129 2872 2676 2760<br />
2010<br />
<strong>2011</strong><br />
2012F<br />
2013F<br />
2014F<br />
1600<br />
1389<br />
2015F<br />
2800<br />
2016F<br />
Gloria 2-seam TNC O<strong>the</strong>r reserves<br />
Koornfontein Mines and TNC<br />
3500 3500 3500 3500 3500 3500 3500 3500 3400 3<strong>30</strong>0<br />
2017F<br />
2018F<br />
2019F<br />
2020F<br />
2021F<br />
2022F<br />
2023F<br />
2024F<br />
2025F<br />
2026F
Outlook <strong>for</strong> FY2012<br />
Mike Teke
19<br />
Market Review<br />
Export coal demand Export growth driven by Asian markets<br />
RBCT export destinations<br />
‒ Indian demand fur<strong>the</strong>r increasing as a result of<br />
west-coast coal-fired power generation growth<br />
‒ Fur<strong>the</strong>r growth in China (9% in GDP) boosted<br />
by economic growth and restricted local<br />
production supportive of increased South<br />
African demand<br />
‒ Growth in o<strong>the</strong>r Asian countries supportive of<br />
South African export coal demand<br />
API#4 coal price history<br />
Peak coal price in 2008 was over $150/ton<br />
Steady recovery in API#4 price since 2009<br />
continued to current trading levels of<br />
approximately $118/ton<br />
<strong>Coal</strong> dynamics remain favourable <strong>for</strong> price<br />
support<br />
Mt<br />
100%<br />
80%<br />
60%<br />
40%<br />
20%<br />
0%<br />
RBCT Export Destinations (calendar <strong>year</strong>s)<br />
0.8<br />
3.6<br />
10.3<br />
53.4<br />
0.5<br />
2.3<br />
10.5<br />
51.7<br />
43.1<br />
1.0 1.5 1.0<br />
3.5 4.3 6.1<br />
8.7 6.9 1.4<br />
9.8 9.8<br />
17.6<br />
8.2<br />
10.0 5.5<br />
7.3<br />
20.4<br />
4.5<br />
11.0<br />
38.1<br />
26.8<br />
8.2<br />
3.2<br />
2.6 1.1<br />
14.9<br />
2.6<br />
6.0<br />
1.2<br />
2005 2006 2007 2008 2009 2010 <strong>2011</strong><br />
YTD<br />
Americas Europe Africa & Middle East India China Rest of Asia<br />
Source: RBCT<br />
API#4 coal price and ZAR/USD rate<br />
200<br />
160<br />
120<br />
80<br />
40<br />
0<br />
API#4 (USD / mt) USD / ZAR - rhs<br />
Source : Rand Merchant Bank, FICC<br />
2000 2002 2004 2006 2008 2010<br />
14<br />
12<br />
10<br />
8<br />
6<br />
4<br />
2<br />
0
20<br />
Group Outlook <strong>for</strong> FY2012<br />
Group Outlook – FY2012<br />
<strong>Optimum</strong> <strong>Coal</strong> is on track to produce 7 - 7.2 million tons of saleable export coal in FY2012 as well<br />
as fulfill its supply commitments to Eskom. 350ktpa of exportable coal committed under inland<br />
contractual arrangements<br />
Opencast and underground operating diversification has reduced operating risk across <strong>the</strong> group<br />
Export coal stock of 503kt tons on hand at group operations as at <strong>30</strong> <strong>June</strong> <strong>2011</strong> (20 day TFR<br />
maintenance shutdown in <strong>June</strong> <strong>2011</strong>) – stocks now reducing and rail tempo normalising<br />
<strong>Optimum</strong> Collieries Outlook<br />
Kwagga North ramp up on target and project<br />
scheduled <strong>for</strong> completion during FY2012<br />
Boschmanspoort ROM initiatives implemented and<br />
delivering results<br />
Targeting 5.3 – 5.5mt export production and 5.5mt<br />
Eskom production in FY2012<br />
Completion of fixed price contract with BECSA by<br />
December <strong>2011</strong>. 510kt exports at $87/ton to be<br />
delivered between July and December <strong>2011</strong><br />
Koornfontein Mines Outlook<br />
Continued mining of Gloria 2 seam at current run<br />
rates and reclamation of discard to produce additional<br />
middlings product<br />
Targeting 1.7mt export production and 1.0mt Eskom/<br />
middlings production in FY2012<br />
Continued work on 4 seam development feasibility<br />
Advance project development work on <strong>the</strong> TNC<br />
reserve.
21<br />
Eskom<br />
Eskom arbitration<br />
Eskom arbitration in respect of Hendrina Power<br />
Station supply dispute now resolved<br />
<strong>Optimum</strong> Collieries will continue to supply 5.5mtpa to<br />
<strong>the</strong> adjacent Hendrina Power Station until December<br />
2018 under new pricing and penalty arrangements<br />
Opportunities<br />
Discussions with Eskom have commenced on <strong>the</strong><br />
following supply opportunities<br />
Koornfontien middlings<br />
Koornfontein 4 seam<br />
Schoonoord<br />
O<strong>the</strong>r green-fields resources<br />
“New” Eskom contracts will require profitable pricing to<br />
justify investment decisions<br />
Eskom looking to double generation capacity to<br />
80 000MW by 2026. Much of this growth will be coalfired<br />
generation.<br />
Mines Located Close to Power Stations<br />
Hendrina<br />
Power Station<br />
Komati<br />
Koornfontein<br />
Power Station<br />
Koornfontein<br />
<strong>Optimum</strong><br />
<strong>Optimum</strong><br />
Schoonoord<br />
Overvaal<br />
<strong>Optimum</strong> <strong>Coal</strong> Assets Power Stations<br />
Mpumalanga<br />
Vlakfontein<br />
Mpumalanga<br />
Arnot<br />
Power Station<br />
Vlakfontei<br />
Camden<br />
Power Station<br />
Overva
22<br />
Transnet Freight Rail (“TFR”) Challenges<br />
TFR per<strong>for</strong>mance<br />
General TFR coal industry per<strong>for</strong>mance has been<br />
disappointing during <strong>the</strong> <strong>year</strong> under review<br />
<strong>Optimum</strong> Collieries and Koornfontein Mines enjoy<br />
<strong>the</strong> benefit of rapid loading and have collectively<br />
railed 6.44mt to RBCT during <strong>the</strong> <strong>year</strong><br />
26% rail price increase implemented from April<br />
<strong>2011</strong>. Long term contract negotiations yet to be<br />
concluded<br />
20 day rail maintenance shutdown in May and<br />
<strong>June</strong> <strong>2011</strong> has resulted in 503kt of export coal on-<br />
mine at <strong>year</strong> end available <strong>for</strong> railing to RBCT.<br />
Post <strong>year</strong> – end, railings have normalised and on<br />
mine stocks are reducing<br />
TFR is committed to upgrading RBCT coal line to<br />
transport 81mtpa by 2015 through rolling stock<br />
and locomotive upgrades as well as efficiency<br />
improvements. RBCT railings <strong>the</strong>re<strong>for</strong>e expected<br />
to improve into FY2012<br />
TFR railings per<strong>for</strong>mance to RBCT<br />
An 8000 ton TFR train being loaded at <strong>Optimum</strong> Collieries<br />
be<strong>for</strong>e routing to RBCT
Delivering on our group strategy<br />
Mike Teke
24<br />
Delivering on our group strategy<br />
Operations maturing and life of mine projects on track<br />
<strong>Optimum</strong> Collieries<br />
Boschmanspoort & water treatment projects completed<br />
on time and within budget<br />
Completion of Kwagga North opencast project scheduled<br />
<strong>for</strong> <strong>June</strong> 2012 – on time and on budget - already coaling.<br />
Key driver of unit cost efficiencies going <strong>for</strong>ward<br />
New organisational structure in place to ensure delivery of<br />
targets<br />
Schoonoord brownfield reserve to be developed pending<br />
agreed off-take with Eskom<br />
Boschmanspoort underground mine high wall,<br />
conveyor and stock pile infrastructure<br />
Koornfontein Mines<br />
Gloria 2 seam currently being mined at commendable run<br />
rates – expected to be mined until ~ FY15<br />
TNC acquisition sets foundation <strong>for</strong> Koornfontein to return to a<br />
long life, high export quality mine. Acquisition expected to<br />
close H1, FY12.<br />
Development of 4 - seam project likely to depend on<br />
agreement on a definitive off-take with Eskom<br />
Water Reclamation Plant with lined discharge dams<br />
in <strong>the</strong> background<br />
Kwagga North tip construction progressing well
25<br />
Delivering on our strategy (continued)<br />
Looking Consolidate <strong>for</strong>ward our BEE - Optimising coal plat<strong>for</strong>m our portfolio and achieving capital and cost efficiencies<br />
Project capability increased and all projects accordingly being<br />
advanced<br />
No 1. priority is to develop TNC resource to extend Koornfontein‟s<br />
high value export product life by 12 <strong>year</strong>s<br />
Both <strong>Optimum</strong> Collieries and Koornfontein Mines now expected to<br />
use <strong>the</strong>ir full RBCT entitlement over <strong>the</strong> next 10 <strong>year</strong>s (≤ 8mtpa)<br />
Capital discipline within <strong>the</strong> group requires all projects to be<br />
ranked amidst <strong>the</strong> 2 key constraints of<br />
‒ RBCT entitlement and<br />
‒ Eskom contracts<br />
Disposal of platinum prospecting rights <strong>for</strong> R121m gross. R75.5m<br />
to be returned to shareholders through special dividend.<br />
Consolidating our BEE coal plat<strong>for</strong>m<br />
Currently considering o<strong>the</strong>r acquisitions, specifically<br />
operations and resources being disposed by o<strong>the</strong>r coal<br />
majors<br />
Remhoogte prospecting right acquisition signed in August<br />
<strong>2011</strong>, improving quality of export coal growth portfolio<br />
Ongoing review of export coal resource and RBCT<br />
opportunities<br />
South African BEE coal champion – deliver tonnage safely<br />
at competitive cost to ensure sustainable growth<br />
Sale of 26%<br />
in Afarak<br />
Platinum<br />
Recapitalise<br />
<strong>Optimum</strong><br />
Collieries<br />
IPO<br />
Acquisition of<br />
Koornfontein Mines<br />
Acquisition of<br />
Remhoogte<br />
prospecting<br />
rights<br />
Acquisition of<br />
TNC to extend<br />
Koornfontein<br />
LOM
26<br />
Growth Projects<br />
Growth pipeline intact<br />
Robust pipeline of brown and greenfields<br />
projects<br />
Timing of development project pipeline being<br />
evaluated<br />
― Capital optimisation<br />
― Product mix and production optimisation<br />
― Market requirements<br />
Brownfield projects<br />
― Kwagga North<br />
― TNC<br />
― Schoonoord<br />
― Koornfontein 4-seam<br />
Greenfield projects<br />
― Overvaal (mining right to be submitted Q2, FY12)<br />
― Vlakfontein (awaiting award of mining right)<br />
― Remhoogte (pre-feasibility work commenced)<br />
― Mpefu (to be divested)<br />
High quality growth projects<br />
Evaluation of timing of project development on-going<br />
Capital efficient projects enjoy higher ranking<br />
Project considerations to include Eskom off-take<br />
agreements, RBCT entitlement and TFR railing efficiencies<br />
Indicative project pipeline<br />
Exploration<br />
Mpefu<br />
Concept<br />
Eikeboom<br />
Pillars<br />
Remhoogte<br />
Brownfield coal projects<br />
Prefeasibility<br />
TNC<br />
Greenfield coal projects<br />
(1) Acquisitions remain subject to conditions precedent<br />
(1)<br />
(1)<br />
Feasibility<br />
Pullenshope<br />
Underground<br />
Eikeboom <strong>Coal</strong> Fines<br />
Koornfontein <strong>Coal</strong><br />
Fines<br />
Koornfontein<br />
2,4-seam<br />
Schoonoord<br />
Vlakfontein<br />
Overvaal<br />
Implementation<br />
Kwagga<br />
North<br />
<strong>Optimum</strong> <strong>Coal</strong> LOM projects
27<br />
Remhoogte acquisition<br />
High export quality green-fields project<br />
Acquisition agreements signed with BHP Billiton<br />
in August <strong>2011</strong>. Consideration of R235 million<br />
will be settled in cash from own available cash<br />
resources and/ or re-financed debt facilities post<br />
completion of transaction conditions<br />
Inferred resource of <strong>30</strong>2mt based on C upper<br />
and C lower seams<br />
Mine design<br />
Underground bord and pillar<br />
4mt ROM per <strong>year</strong> over 16 <strong>year</strong> LOM life<br />
2.5mt exports (6000kcal) and 0.4mtpa<br />
middlings<br />
Timing of development will depend on portfolio<br />
ranking. Conceptually, an ideal replacement <strong>for</strong><br />
<strong>Optimum</strong> Colliery‟s export saleable production<br />
in <strong>the</strong> medium to long term, although market<br />
conditions and an improvement in export<br />
logistics could result in <strong>the</strong> development of <strong>the</strong><br />
project being expedited<br />
Situated close to RBCT railway line
QUESTIONS
Appendices
<strong>30</strong><br />
<strong>Optimum</strong> Collieries – Statistics<br />
ROM production (Mt)<br />
- Kwagga O/C<br />
- Kwagga North O/C<br />
- Pullenshope O/C<br />
- Eikeboom O/C<br />
- Boschmanspoort U/G<br />
Saleable product (Mt)<br />
- Export and inland<br />
- Eskom<br />
Railed to RBCT (Mt)<br />
Realised export revenue per ton (R/t)<br />
- Average API#4 price ($/ton)<br />
- Average R/$<br />
Capex (Rm)<br />
- Development (Rm)<br />
- Sustaining (Rm)<br />
FY <strong>2011</strong> FY 2010<br />
14.0 13.1<br />
6.9%<br />
(9.1%)<br />
9.5%<br />
13.0%<br />
(17.6%)<br />
19.2%<br />
3.1%<br />
4.3%<br />
2.0%<br />
2.2%<br />
26.9%<br />
37.4%<br />
(7.6%)<br />
Realised inland revenue per ton (R/t) 568.02 598.01 (5.0%)<br />
2.0<br />
2.3<br />
5.2<br />
1.4<br />
3.1<br />
4.9<br />
5.2<br />
2.2<br />
2.1<br />
4.6<br />
1.7<br />
2.6<br />
10.1 9.8<br />
699.14<br />
99.73<br />
4.7<br />
5.1<br />
4.7 4.6<br />
7.01<br />
566<br />
273<br />
293<br />
550.73<br />
72.56<br />
7.59<br />
848<br />
711<br />
137<br />
% change<br />
(33%)<br />
(62%)<br />
114%
31<br />
<strong>Optimum</strong> Collieries – Cash Cost Structure<br />
<strong>Optimum</strong> Collieries costs Cash cost reconciliation<br />
On-mine cash cost per saleable ton (ZAR/ton)<br />
<strong>30</strong>0.00<br />
250.00<br />
200.00<br />
150.00<br />
100.00<br />
50.00<br />
0.00<br />
Contractor fees<br />
38%<br />
259.88 259.68<br />
FY<strong>2011</strong> FY2010<br />
<strong>Optimum</strong> on-mine cash cost structure<br />
Utilities<br />
4%<br />
O<strong>the</strong>r<br />
(4)%<br />
Labour<br />
23%<br />
Consumables<br />
39%<br />
ZAR MM, t’000 FY<strong>2011</strong> FY2010<br />
On-mine cash costs 2 703 2 539<br />
Rail and port costs 494 480<br />
Total cash costs 3 197 3 019<br />
ROM tons 13 966 13 627<br />
On-mine cash cost per ROM ton 193.53 186.29<br />
Saleable tons 10 400 9 775<br />
Sales tons 10 288 9 667<br />
On-mine cash cost per saleable ton 259.88 259.68<br />
Total cash costs 3 197 3 019<br />
Eskom sales revenue (532) (397)<br />
Total cash costs net of Eskom revenue 2 665 2 622<br />
Export saleable tons 4 904 4 721<br />
Export Sales tons 4 798 4 610<br />
All-in cash cost per export saleable ton 543.55 555.51<br />
All-in cash cost per export sales ton 555.55 568.69
32<br />
Koornfontein Mines – Statistics (1)<br />
ROM production (Mt)<br />
- Gloria U/G<br />
- Blinkpan U/G<br />
Saleable product (Mt)<br />
- Export<br />
- Eskom and inland<br />
Railed to RBCT (Mt)<br />
Realised export revenue per ton (R/t)<br />
- Average API#4 price ($/ton)<br />
- Average R/$<br />
Capex (Rm)<br />
- Development (Rm)<br />
- Sustaining (Rm)<br />
FY <strong>2011</strong> FY 2010<br />
2.9<br />
2.9<br />
-<br />
3.0<br />
1.8<br />
1.2<br />
1.7<br />
545.26<br />
71.90<br />
7.58<br />
6.9%<br />
6.9%<br />
Discard reclaimed 2.9 2.7 7.4%<br />
120<br />
22<br />
98<br />
-<br />
6.6%<br />
5.5%<br />
8.3%<br />
0%<br />
<strong>30</strong>.1%<br />
40.7%<br />
(7.9%)<br />
Realised inland revenue per ton (R/t) 138.67 133.78 3.7%<br />
3.1<br />
3.1<br />
-<br />
3.2<br />
1.9<br />
1.3<br />
1.7<br />
709.21<br />
101.17<br />
7.01<br />
115<br />
22<br />
93<br />
% change<br />
(4.2%)<br />
0%<br />
(5.1%)<br />
(1) The above analysis shows <strong>the</strong> operating data <strong>for</strong> Koornfontein mines <strong>for</strong> <strong>the</strong> relevant financial <strong>year</strong>s. Koornfontein Mines was however only<br />
consolidated into <strong>the</strong> Group operations with effect from 1 March 2010 and provided 4 months attributable production in <strong>the</strong> <strong>year</strong> to <strong>June</strong> „10
33<br />
Koornfontein Mines – Cash Cost Structure<br />
Koornfontein Mines costs Cash cost reconciliation<br />
On-mine cash cost per saleable ton (ZAR/ton)<br />
250<br />
200<br />
150<br />
100<br />
50<br />
0<br />
211.50<br />
Koornfontein on-mine cash cost structure<br />
Contractor fees<br />
19%<br />
Utilities<br />
6%<br />
O<strong>the</strong>r<br />
8%<br />
Consumables<br />
22%<br />
192.10<br />
FY<strong>2011</strong> FY2010<br />
Labour<br />
45%<br />
ZAR MM, t’000 FY<strong>2011</strong> FY2010<br />
On-mine cash costs 672 584<br />
Rail and port costs 176 187<br />
Total cash costs 848 771<br />
ROM tons 3 129 2 936<br />
On-mine cash cost per ROM ton 214.61 198.88<br />
Discard reclaimed 2 9<strong>30</strong> 2 679<br />
Saleable tons 3 175 3 040<br />
Sales tons 3 163 2 923<br />
On-mine cash cost per saleable ton 211.50 192.10<br />
Total cash costs 848 771<br />
Eskom sales revenue (184) (132)<br />
Total cash costs net of Eskom revenue 664 639<br />
Export saleable tons 1 872 1 806<br />
Export sales tons 1 719 1 664<br />
All-in cash cost per export saleable ton 354.53 353.82<br />
All-in cash cost per export sales ton 386.09 384.31
34<br />
<strong>Optimum</strong> <strong>Coal</strong> – Group Cash Cost Structure<br />
Group costs Cash cost reconciliation<br />
Koornfontein Mines was acquired on 1 March<br />
2010 and <strong>the</strong> has been fully consolidated into <strong>the</strong><br />
group with effect from this date<br />
The table on <strong>the</strong> right shows <strong>the</strong> actual group<br />
cash cost structure <strong>for</strong> <strong>the</strong> <strong>year</strong> ending <strong>30</strong> <strong>June</strong><br />
<strong>2011</strong> and <strong>the</strong> <strong>the</strong>oretical cost structure had<br />
Koornfontein Mines been wholly-owned <strong>for</strong> <strong>the</strong> full<br />
FY2010 period<br />
Group costs<br />
On-mine cash cost per saleable ton (ZAR/ton)<br />
<strong>30</strong>0<br />
250<br />
200<br />
150<br />
100<br />
50<br />
0<br />
251.81 245.42<br />
FY<strong>2011</strong> FY2010<br />
ZAR MM, t’000 FY<strong>2011</strong> FY2010<br />
On-mine cash costs 3 418 3 145<br />
Rail and port costs 670 667<br />
Total cash costs 4 089 3 812<br />
ROM tons 17 095 16 563<br />
On-mine cash cost per ROM ton 199.96 189.88<br />
Discard reclaimed 2 9<strong>30</strong> 2 679<br />
Saleable tons 13 575 12 815<br />
On-mine cash cost per saleable ton 251.81 245.42<br />
Total cash costs 4 089 3 812<br />
Eskom sales revenue (716) (529)<br />
Total cash costs net of Eskom revenue 3 373 3 283<br />
Export saleable tons 6 776 6 527<br />
Export sales tons 6 517 6 274<br />
All-in cash cost per export saleable ton 497.83 502.99<br />
All-in cash cost per export sales ton 517.61 523.27
35<br />
Reconciliation of Headline Earnings<br />
(Amounts Rm, unless o<strong>the</strong>rwise indicated)<br />
Adjusted <strong>for</strong><br />
- Loss on sale of plant and equipment<br />
- Gain from business combination (1)<br />
- Fair value gain on available <strong>for</strong> sale financial assets<br />
transferred to profit or loss on disposal<br />
- Profit on sale of platinum investments<br />
- Tax effects of above adjustments (2)<br />
- Bargain purchase gain<br />
FY<strong>2011</strong> FY2010<br />
Profit attributable to equity holders 459 215<br />
IFRS<br />
(52) (168)<br />
16<br />
-<br />
-<br />
(74)<br />
6<br />
-<br />
Headline earnings 407 47<br />
Total share in issue („000 shares)<br />
Effect of own shares held (3) („000 shares)<br />
Share issued during <strong>the</strong> <strong>year</strong><br />
Weighted no. of share o/s at <strong>year</strong> end (4) („000 shares)<br />
EPS (IFRS) (cps)<br />
HEPS (IFRS) (cps)<br />
Normalised<br />
Total share in issue („000 shares)<br />
Share issued during <strong>the</strong> <strong>year</strong><br />
Weighted no. of share o/s at <strong>year</strong> end (4) („000 shares)<br />
Normalised EPS (cps)<br />
Normalised HEPS (cps)<br />
251 786<br />
(52 000)<br />
-<br />
199 786<br />
2<strong>30</strong><br />
203<br />
251 786<br />
-<br />
251 786<br />
183<br />
162<br />
25<br />
(95)<br />
(88)<br />
-<br />
5<br />
(15)<br />
200 000<br />
(52 000)<br />
15 566<br />
163 566<br />
132<br />
29<br />
200 000<br />
15 566<br />
215 566<br />
100<br />
22<br />
Notes<br />
(1) Achieved in stages<br />
(2) Gain from business combination and<br />
bargain purchase gain are deemed to be<br />
permanent differences <strong>for</strong> taxation<br />
purposes and <strong>the</strong>re<strong>for</strong>e do not have tax<br />
adjustment effects<br />
(3) 52 000 000 shares collectively owned by<br />
<strong>the</strong> Employee, Community and Executive<br />
Share Incentive Trusts are deemed to be<br />
under <strong>the</strong> control of <strong>the</strong> Company and are<br />
<strong>the</strong>re<strong>for</strong>e excluded from <strong>the</strong> calculation of<br />
shares outstanding <strong>for</strong> IFRS purposes.<br />
(4) Weighted average number of shares<br />
outstanding during <strong>the</strong> <strong>year</strong>
36<br />
Disclaimer<br />
This document including, without limitation, those statements concerning <strong>the</strong> outlook, <strong>Optimum</strong><br />
<strong>Coal</strong>'s expansion projects and its capital resources and expenditure, contain certain <strong>for</strong>wardlooking<br />
views. By <strong>the</strong>ir nature, <strong>for</strong>ward-looking statements involve risk and uncertainty and<br />
although <strong>Optimum</strong> <strong>Coal</strong> believes that <strong>the</strong> expectations reflected in such <strong>for</strong>ward-looking statements<br />
are reasonable, no assurance can be given that such expectations will prove to have been correct.<br />
Accordingly, results could differ materially from those set out in <strong>the</strong> <strong>for</strong>ward-looking statements as a<br />
result of, among o<strong>the</strong>r factors, changes in economic and market conditions, success of business<br />
and operating initiatives, changes in <strong>the</strong> regulatory environment and o<strong>the</strong>r government action and<br />
business and operational risk management.<br />
While <strong>Optimum</strong> <strong>Coal</strong> takes reasonable care to ensure <strong>the</strong> accuracy of <strong>the</strong> in<strong>for</strong>mation presented,<br />
<strong>Optimum</strong> <strong>Coal</strong> accepts no responsibility <strong>for</strong> any direct, indirect, consequential, special and/or<br />
incidental damages, whe<strong>the</strong>r <strong>for</strong>eseeable or un<strong>for</strong>eseeable, based on claims arising out of<br />
misrepresentation or negligence arising in connection with a <strong>for</strong>ward-looking statement. This<br />
document is not int<strong>ended</strong> to contain any profit <strong>for</strong>ecasts or profit estimates, and <strong>the</strong> in<strong>for</strong>mation<br />
published in this document is unaudited.