examples from the threatened lesser kestrel - Digital.CSIC, the ...
examples from the threatened lesser kestrel - Digital.CSIC, the ...
examples from the threatened lesser kestrel - Digital.CSIC, the ...

You also want an ePaper? Increase the reach of your titles
YUMPU automatically turns print PDFs into web optimized ePapers that Google loves.
Airam Rodríguez Martín<br />
Migratory strategies of <strong>the</strong> <strong>lesser</strong> <strong>kestrel</strong>: determining wintering areas and condition<br />
for migration<br />
Estrategias migratorias del cernícalo primilla: determinación de las áreas de<br />
invernada y de la condición para la migración<br />
© Airam Rodríguez Martín, 2011, Seville<br />
i
Migratory strategies of <strong>the</strong> <strong>lesser</strong> <strong>kestrel</strong>: determining wintering areas and condition<br />
for migration<br />
Estrategias migratorias del cernícalo primilla: determinación de las áreas de<br />
invernada y de la condición para la migración<br />
PhD Thesis<br />
Airam Rodríguez Martín<br />
Seville, November 2011<br />
iii
Supervisors<br />
Dr. Juan José Negro Balmaseda<br />
Department of Evolutionary Ecology<br />
Doñana Biological Station (EBD-<strong>CSIC</strong>)<br />
Dr. Miguel Alcaide Torres<br />
Department of Organismic and Evolutionary Biology<br />
Harvard University<br />
Tutor<br />
Dr. Carlos Antonio Granado Lorencio<br />
Department of Vegetal Biology and Ecology<br />
University of Seville<br />
v
vii<br />
A mi familia<br />
“So much trouble in <strong>the</strong> world”<br />
Robert N. Marley<br />
“Life should be simpler”<br />
Gary R. Bortolotti<br />
“Pásenlo bien, pásenlo bien”<br />
Domingo (Cabrera) Rodríguez del Rosario (Chirivitas)
ix<br />
Contents<br />
Preface 1<br />
Resumen 3<br />
Introduction 7<br />
Generalities of avian migration 7<br />
Markers for migration studies 7<br />
MHC as a marker 9<br />
Conservation of migratory species 9<br />
The <strong>lesser</strong> Kestrel as a model species 10<br />
Aims 12<br />
Thesis outline 12<br />
Glossary 13<br />
References 14<br />
Chapter 1: Geolocators map <strong>the</strong> wintering grounds of <strong>threatened</strong> <strong>lesser</strong> <strong>kestrel</strong>s in Africa 17<br />
Chapter 2: Effects of geolocator attachments on breeding parameters of Lesser Kestrels<br />
Falco naumanni 35<br />
Chapter 3: Using MHC markers to assign <strong>the</strong> geographic origin of migratory birds:<br />
<strong>examples</strong> <strong>from</strong> <strong>the</strong> <strong>threatened</strong> <strong>lesser</strong> <strong>kestrel</strong> 53<br />
Chapter 4: Sampling strategies for accurate computational inferences of gametic phase<br />
across highly polymorphic Major Histocompatibility Complex loci 77<br />
Chapter 5: Sources of variation for nutritional condition indices of <strong>the</strong> plasma of<br />
migratory <strong>lesser</strong> <strong>kestrel</strong>s in <strong>the</strong> breeding grounds 93<br />
General discussion 119<br />
Migration and wintering areas 119<br />
Technical notes 121<br />
Nutritional condition 121<br />
Future research 122<br />
References 123<br />
Conclusions 125<br />
Acknowledgments / Agradecimientos 127<br />
Funding 131
1<br />
Preface<br />
In 2006, I enjoyed an I3P postgraduate fellowship at <strong>the</strong> Island Ecology and Evolution<br />
Research Group (Instituto de Productos Naturales y Agrobiología, <strong>CSIC</strong>) under <strong>the</strong><br />
supervision of Drs. Manuel Nogales and Alfredo Valido. There, I was introduced to <strong>the</strong><br />
biological sciences aiming at revealing <strong>the</strong> endozoochoric seed dispersal patterns of <strong>the</strong><br />
<strong>threatened</strong> native temperate forest of Canary Islands. After that, I sent tens of e-mails to<br />
several Spanish researchers asking for supervision on raptors or petrels studies. Finally, I<br />
applied in 2007 for an I3P pre-doctoral fellowship (4 years) at <strong>the</strong> Department of<br />
Evolutionary Ecology of <strong>the</strong> Estación Biológica de Doñana, <strong>CSIC</strong>, under <strong>the</strong> supervision of<br />
Drs. Juan J. Negro and Miguel Alcaide. I was lucky and grant was awarded to me to study<br />
phenotypic and genotypic indices of individual quality in <strong>the</strong> <strong>lesser</strong> <strong>kestrel</strong>.<br />
The <strong>lesser</strong> <strong>kestrel</strong> has been classified as vulnerable. This fact precluded us <strong>from</strong><br />
carrying out experiments on wild birds. Despite <strong>the</strong> Lesser <strong>kestrel</strong> is one of <strong>the</strong> most<br />
studied species in <strong>the</strong> world (more than 200 scientific papers published, several popular<br />
scientific monographs and at least, 8 PhD <strong>the</strong>sis defended only in Spain), <strong>the</strong> level of<br />
knowledge on <strong>the</strong> wintering areas of <strong>the</strong> <strong>lesser</strong> <strong>kestrel</strong> was scanty before this study. It was<br />
indeed known that <strong>lesser</strong> <strong>kestrel</strong> wintered both in <strong>the</strong> Sahel region and in South Africa, but<br />
<strong>the</strong> origin of populations remained unknown. On <strong>the</strong> o<strong>the</strong>r hand, more information on <strong>the</strong><br />
wintering ecology, migration routes, and <strong>the</strong> physiological implications of such behaviour is<br />
urgently needed for <strong>the</strong> appropriate management of <strong>the</strong> <strong>threatened</strong> <strong>lesser</strong> <strong>kestrel</strong> in Africa.<br />
This lack of knowledge and <strong>the</strong> difficulty to carry out experiments were decisive in <strong>the</strong><br />
restructuration and reorganization of my PhD. For this reason, <strong>the</strong> delivery date of this<br />
study has been prolonged up to October 2011.<br />
My PhD <strong>the</strong>sis deals with an array of topics within <strong>the</strong> fields of ecology, genetics and<br />
physiology. Here, we use extrinsic (geolocators) and intrinsic (MHC genes) markers to<br />
study migration and wintering areas, and plasma blood metabolites to study nutritional<br />
condition. Fur<strong>the</strong>rmore, I present two technical notes: one deals with <strong>the</strong> effect of<br />
geolocators on breeding parameters; and ano<strong>the</strong>r details a procedure to accurately<br />
genotype MHC genes. The fieldwork in connection with my PhD was mainly conducted at<br />
two breeding colonies in <strong>the</strong> Province of Huelva (Sou<strong>the</strong>rn Spain) during 2007 to 2009.<br />
Even though I also present information <strong>from</strong> <strong>the</strong> <strong>lesser</strong> <strong>kestrel</strong> wintering areas,
unfortunately I did not travel to South Africa or Senegal looking for <strong>lesser</strong> <strong>kestrel</strong> fea<strong>the</strong>rs at<br />
<strong>the</strong> roosts.<br />
During <strong>the</strong> period (2007-2011), I have been located in Seville at EBD-<strong>CSIC</strong>, although I<br />
enjoyed two research stays to complete my training: one in Finland under <strong>the</strong> supervision<br />
of Erkki Korpimäki (University of Turku) during August-October 2008 and ano<strong>the</strong>r on<br />
Kauai, Hawaiian Archipelago, under <strong>the</strong> supervision of Andrea Erichsen and Nick D. Holmes<br />
(Kauai Seabird Habitat Conservation Program, Hawaii State Department of land and Natural<br />
Resources, University of Hawaii) during October-November 2010. During <strong>the</strong> last years, and<br />
thus concurrent my PhD work, I have helped to produce several o<strong>the</strong>r scientific papers and<br />
assisted to five international congresses; some using <strong>lesser</strong> <strong>kestrel</strong>s as models, but also<br />
related to o<strong>the</strong>r bird species or even topics far away form those covered in my PhD <strong>the</strong>sis.<br />
These investigations may have diverted my efforts <strong>from</strong> <strong>the</strong> core of my <strong>the</strong>sis, but I wish to<br />
think <strong>the</strong>y have also contributed in some way to my training as a field ecologist and<br />
conservationist.<br />
2
3<br />
Resumen<br />
Estrategias migratorias del cernícalo primilla: determinación de las áreas de<br />
invernada y de la condición para la migración.<br />
A pesar de que el cernícalo primilla Falco naumanni es una de las aves más estudiadas en el<br />
campo, poco se sabe de las áreas de invernada de las poblaciones reproductoras y de su<br />
condición nutricional. El principal objetivo de la presente tesis es aportar información<br />
básica sobre la conectividad migratoria de la especie entre las áreas de cría y de invernada.<br />
Nosotros usamos, por primera vez en rapaces, geolocalizadores para determinar las áreas<br />
de invernada de una población occidental de su rango de cría. Encontramos que los<br />
cernícalos invernaron en las inmediaciones de los ríos senegaleses Senegal y Saloum.<br />
Basándonos en datos de longitud, inferimos que la duración de la migración post-nupcial es<br />
5 ± 1 días, mientras que la de la migración pre-nupcial es más larga y variable (24 ± 10<br />
días). Los geolocalizadores no mostraron efectos perjudiciales en los adultos marcados<br />
(excepto un arnés mal fijado). La tasa de retorno fue similar a la observada en otros años y<br />
colonias (15 retornaron en 2008 de los 20 marcados en 2007); y el peso de individuos<br />
marcados no difirió de los no-marcados en el momento de la recaptura. Los parámetros de<br />
cría (tamaño de puesta y número de pollos volanderos) no fueron afectados por los<br />
geolocalizadores. Sin embargo, una mayor mortalidad de pollos de las parejas marcadas fue<br />
observada en 2008, así como un aumento en el nivel de triglicéridos y ácido úrico en el<br />
plasma de los pollos con al menos un padre marcado.<br />
Por otra parte, usamos una aproximación no invasiva basada en un marcador<br />
genético, el complejo principal de histocompatibilidad (MHC, siglas en inglés), para inferir<br />
el origen de los individuos que invernan en las áreas más importantes para el cernícalo<br />
primilla. Para ello, aprovechamos la información disponible sobre la estructuración de los<br />
genes del MHC de clase II B en el área de cría y colectamos plumas mudadas bajo grandes<br />
dormideros localizados en Senegal y Sudáfrica. Las puntas y los coágulos de sangre de<br />
dichas plumas fueron usadas como fuente de DNA, a partir del cual amplificamos por PCR el<br />
segundo exón de dichos genes. Alelos privados del área de cría occidental fueron<br />
encontrados mayoritariamente en Senegal, indicando una fuerte conectividad entre estas<br />
dos áreas. Los cernícalos invernantes en Sudáfrica fueron genéticamente distintos a los
europeos, lo que sugiere que los dormideros sudafricanos están compuestos por individuos<br />
asiáticos. Esto demuestra que al menos a escala continental, los genes del MHC pueden<br />
servir como marcadores intrínsecos para el estudio de la migración de aves.<br />
Aunque los genes del MHC son muy populares entre los biólogos evolutivos por su<br />
rol en el sistema inmunitario y selección sexual, su genotipaje permanece aún desafiante a<br />
pesar de los importantes avances que se están alcanzando en la actualidad. Nosotros<br />
testamos el rendimiento del algoritmo bayesiano PHASE implementado en el programa<br />
informático DNAsp para la inferencia de haplotipos de estos genes, los cuales presentan<br />
características que han sido descritas como fuente de inexactitudes (alta heterozigosidad,<br />
gran variación genética, mezcla de poblaciones). Para este fin, aprovechamos una gran base<br />
de datos de genotipos conocidos a través de técnicas tradicionales (clonaje y herencia de<br />
alelos de padres a hijos) de ambos loci (MHC de clase I y II). En ambos loci, encontramos<br />
que el ratio alelo/individuo debe estar en torno a 1:2 para obtener un 100% de exactitud en<br />
la salida de PHASE.<br />
Finalmente, evaluamos las fuentes de variación de la condición nutricional de<br />
cernícalos adultos y pollos en su área de cría a través de los niveles de los siguientes<br />
metabolitos plasmáticos (triglicéridos, colesterol, ácido úrico y urea). En general,<br />
encontramos que los cernícalos presentaron consistentemente valores más altos de<br />
triglicéridos, ácido úrico y urea (los dos últimos, ocasionalmente) que otras rapaces. Esto<br />
fue interpretado como una consecuencia de la mayor frecuencia de alimentación y de la<br />
dieta eminentemente insectívora del cernícalo primilla. Casi todos los factores explorados<br />
(año, colonia, hora de muestreo, peso, fecha de puesta y fecha de captura) influenciaron al<br />
menos un parámetro bioquímico. El más influyente fue la hora de muestreo, el cual alcanzó<br />
significación para todos los parámetros en pollos, mientras que para adultos tan sólo en<br />
ácido úrico y urea. Los valores bioquímicos de los pollos incrementaron a lo largo de la<br />
mañana como consecuencia del ayuno de la noche, es decir, por la ingesta de comida a lo<br />
largo de la mañana. El incremento en la carga de trabajo durante la mañana (cebas de<br />
cortejo y de alimentación de pollos) podría explicar el aumento de ácido úrico y urea en<br />
adultos.<br />
En esta tesis, se empleó geolocalizadores y genes del MHC para el estudio de la<br />
migración. Ambas metodologías fueron usadas por primera vez en rapaces y en aves,<br />
respectivamente, y han aportado información básica y útil para la conservación del<br />
cernícalo primilla. Después del presente estudio, parece claro que las poblaciones<br />
reproductoras occidentales y orientales invernan en áreas diferentes. Así los cernícalos<br />
europeos invernan en el Sahel, mientras que los asiáticos lo hacen en el sur de África.<br />
4
Además, hemos demostrado que los metabolitos plasmáticos de los cernícalos difieren con<br />
respecto al de otras rapaces, posiblemente como consecuencia de sus hábitos alimenticios y<br />
de caza.<br />
5
Generalities on avian migration<br />
7<br />
Introduction<br />
Defining migration is a difficult task partially because of <strong>the</strong> huge variability of animal<br />
movements. A generally accepted definition among students of avian migration is <strong>the</strong><br />
regular, endogenously controlled, seasonal movements between breeding and non-<br />
breeding areas (Salewski & Bruderer 2007). Despite that <strong>the</strong>re is no consensus on <strong>the</strong><br />
precise definition of avian migration, it is widely agreed that is one of <strong>the</strong> most impressive<br />
natural phenomena in <strong>the</strong> world. Annually billions of birds travel to <strong>the</strong>ir breeding and non-<br />
breeding grounds, stopping to eat and rest, twice each year worldwide. These journeys can<br />
be as much as 80000 kilometres long in <strong>the</strong> case of <strong>the</strong> Arctic tern Sterna paradisaea<br />
(Egevang et al. 2010) and reached in non-stop flights (Gill et al. 2009, Klaassen et al. 2011).<br />
As a consequence of <strong>the</strong> biased distribution of land masses on <strong>the</strong> Earth surface, most birds<br />
have a North-South direction during <strong>the</strong>ir post-nuptial migrations, and spend <strong>the</strong>ir annual<br />
non-breeding period at lower latitudes than <strong>the</strong>ir breeding period or at similar latitudes,<br />
but in <strong>the</strong> opposite hemisphere (Newton 2008).<br />
Markers for migration studies<br />
Technological advances to study migration emerged a long time ago, including tracking<br />
devices such as radar. However, an exponential increase has taking place during <strong>the</strong> last<br />
two decades. Our capacity to trace or follow individual birds is mainly limited by bird size,<br />
economic costs and probability of recapture. Extrinsic markers are tagged to birds.<br />
Individual identification, by means of leg bands, neck collars, patagial tags or plumage<br />
markings, rank among <strong>the</strong> most widely used markers. During <strong>the</strong> last century, ringing has<br />
been vital for elucidating patterns of migration, and it has provided <strong>the</strong> bulk of information<br />
on this topic. Never<strong>the</strong>less, in many cases only a small proportion (sometimes no birds) is<br />
ever recovered or re-sighted. Remote-sensing capability represents a technological advance<br />
over such mark-recapture techniques. Radio tracking is a relative unexpensive method to<br />
track individuals, but researcher needs to follow <strong>the</strong> birds within a minimal distance to
each <strong>the</strong> signal of tagged transmitters. Satellite transmitters let researchers to follow <strong>the</strong><br />
birds without even leaving office, as position data <strong>from</strong> <strong>the</strong> transmitters are recovered<br />
through satellites (i.e. no recapture is needed). However, this tool is currently unachievable<br />
to most researchers because of its high economic costs, and too heavy for <strong>the</strong> most bird<br />
species (<strong>the</strong> lightest Platform Transmitter Terminal’s –PTT– on sell is now on five grams).<br />
The new miniaturized geolocators (as light as 1 gram) require of recapture to download <strong>the</strong><br />
data, <strong>the</strong>y only report two locations per day and <strong>the</strong>ir accuracy is quite lower than PTTs.<br />
The main advantages are <strong>the</strong>ir low economic cost and weight, opening <strong>the</strong>ir use to a huge<br />
number of small-sized species (Stutchbury et al. 2009).<br />
Between <strong>the</strong> intrinsic markers, <strong>the</strong> most useful to study bird migration are stable<br />
isotopes, genetic markers and trace elements (Coiffait et al. 2009). The proportions of<br />
different stable isotopes of naturally occurring elements such as carbon, nitrogen and<br />
hydrogen vary across <strong>the</strong> environment in systematic ways. Thanks to strong latitudinal<br />
gradients in <strong>the</strong> isotopic ratio of hydrogen, isotopic analyses of different tissues, such as<br />
blood, fea<strong>the</strong>rs or claws have permitted researchers to identify <strong>the</strong> areas where renovation<br />
or growth of those tissues took place. However, <strong>the</strong>se markers only provide information on<br />
<strong>the</strong> areas where tissues grew. Fur<strong>the</strong>rmore, latitudinal gradients are not always so clear.<br />
For example, stable hydrogen isotope ratios in precipitation show a continent-wide pattern<br />
in North America, but <strong>the</strong> European pattern is not so apparent (see Hobson & Wassenaar<br />
2008 for more details).<br />
Genetic markers are useful to study migration, but only if genetic variation of<br />
populations is geographically structured (Wink 2006). Thus, individuals sampled at any<br />
place of migration can be assigned back to <strong>the</strong>ir most probable geographically structured<br />
population (Webster et al. 2002). Mitochondrial DNA is <strong>the</strong> most used genetic marker in<br />
birds, especially in <strong>the</strong> recent past. Microsatellites have become one of <strong>the</strong> most popular<br />
genetic marker due to <strong>the</strong>ir pronounced polymorphism and <strong>the</strong> parallel development of<br />
assignment tests such as Structure (Pritchard et al. 2000) and o<strong>the</strong>rs (reviewed in Manel et<br />
al. 2005). O<strong>the</strong>r genetic markers such as randomly amplified polymorphic DNA (RAPD) or<br />
arbitrary fragment length polymorphism (AFLP) provide valuable alternatives to<br />
microsatellites and mitochondrial DNA.<br />
Trace elements (also called biogeochemical markers) are chemical markers,<br />
analogous to stable isotope ratios. The trace element signatures in tissues are derived <strong>from</strong><br />
diet. However, this method has been used successfully in only a few studies (see Coiffait et<br />
al. 2009).<br />
8
MHC as a marker<br />
The MHC (Major Histocompatibility Complex) constitutes <strong>the</strong> most important genetic<br />
component of <strong>the</strong> vertebrate immune system. MHC genes encode cell-surface glycoproteins<br />
that bind antigens derived <strong>from</strong> pathogens or parasites. Its primary roles are recognize<br />
foreign proteins, present <strong>the</strong>m to specialist immune cells and initiate <strong>the</strong> appropriate<br />
immune response. Genetic variation at MHC genes largely determines <strong>the</strong> foreign peptides<br />
can be recognized by <strong>the</strong> individual, and how individuals can respond to <strong>the</strong>m. Several<br />
evolutionary mechanisms have been suggested to generate and maintain <strong>the</strong> high levels of<br />
genetic polymorphisms commonly found within <strong>the</strong> antigen-binding sites (reviewed in<br />
Sommer 2005, Piertney & Oliver 2006). Given <strong>the</strong> abundance and virulence of pathogens<br />
and parasites geographically vary, <strong>the</strong> parasite-mediated selection differently act on <strong>the</strong>se<br />
genes within host distribution range. Thus, MHC genes may be more structured than o<strong>the</strong>r<br />
neutral variation markers such as microsatellites, and consequently, MHC may be a useful<br />
genetic marker for migration studies.<br />
Conservation of migratory species<br />
Migratory birds differ <strong>from</strong> residents in that limiting factors of <strong>the</strong>ir populations operate on<br />
more than one part of <strong>the</strong>ir range, i.e. in breeding and non breeding areas as well as<br />
migration routes and stopover sites (Newton 2004). As a consequence, European migratory<br />
bird species have suffered sustained and more severe population declines than resident<br />
species (Sanderson et al. 2006). Conserving avian migrants poses major scientific and<br />
political challenges (Bowlin et al. 2010). First, for <strong>the</strong> majority of bird species, limited basic<br />
life history information on <strong>the</strong> location and use of wintering areas, time of migration, use of<br />
stopovers, or migratory connectivity is available. Second, understanding seasonal<br />
interactions between wintering and breeding areas allow us evaluating <strong>the</strong>ir influence on<br />
population dynamics (Webster et al. 2002). Third, synchronicity and phenology of bird<br />
migrations is a key topic because <strong>the</strong>y are tied to <strong>the</strong> emergence of food resources. The<br />
effect of climate change on <strong>the</strong>se parameters is unknown for <strong>the</strong> majority of species (Pulido<br />
2007). Forth, birds have demonstrated to change <strong>the</strong>ir migratory behaviours in a short time<br />
scale (Nikita et al. 2008, Kasper et al. 2011). Their flexibility and adaptability to changes in<br />
<strong>the</strong> migratory landscape will determine <strong>the</strong> degree of affection.<br />
9
The <strong>lesser</strong> Kestrel as a model species<br />
The <strong>lesser</strong> <strong>kestrel</strong> Falco naumanni is one of <strong>the</strong> smallest European raptor species (along<br />
with <strong>the</strong> Merlin Falco columbarius and <strong>the</strong> Red-Footed Falcon Falco vespertinus)<br />
(Fergusson-Lees & Christie 2001). Its diet is basically composed of insects (i.e.,<br />
grasshoppers, beetles, crickets), but it also feeds on small mammals (Rodríguez et al. 2010,<br />
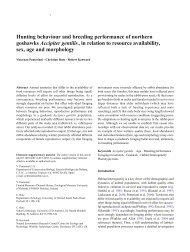
Pérez-Granados 2010, and references <strong>the</strong>rein; see Fig. 1). It exhibits a significant sexual<br />
dimorphism and dichromatism (Fig. 2), and it is associated to steppe and pseudosteppe<br />
habitats. It breeds in colonies of up to 100 pairs in towns (e.g., on ruins, churches, castles,<br />
buildings), rural areas (barns, abandoned farms, silos) or natural rocky outcrops (Tella et al.<br />
1996). It is a monogamous bird, but low levels of extra pair paternity have been detected<br />
(Alcaide et al. 2005 and references <strong>the</strong>rein). During reproductive duties, both sexes<br />
incubate a clutch varying <strong>from</strong> 3 to 6 eggs. Males provide food to <strong>the</strong>ir mates during <strong>the</strong><br />
laying period and <strong>the</strong> majority of prey during <strong>the</strong> early stages of nestlings (Donázar et al.<br />
1992).<br />
This migratory falcon’s breeding range spans <strong>from</strong> <strong>the</strong> Iberian Peninsula through <strong>the</strong><br />
Mediterranean basin, Asia Minor, Western Asia, to Mongolia and China and its wintering<br />
grounds are located in sub-Saharian Africa and South Africa (Rodríguez et al. 2009, 2011).<br />
In <strong>the</strong> South of Spain, all juveniles leave <strong>the</strong> breeding colonies, while approximately 20 % of<br />
adult birds are resident (Negro et al. 1991).<br />
Its populations have decreased dramatically (c. 95%) in <strong>the</strong> Western Palearctic since<br />
<strong>the</strong> 1950s, and a reduction of more than 30% of <strong>the</strong> world population has been estimated,<br />
leading to its current Vulnerable status. Habitat degradation and loss, as a result of<br />
agriculture intensification, afforestation and urban sprawl in its Western Palearctic<br />
breeding grounds, as well as in some winter areas, have been suggested as <strong>the</strong> main causes<br />
of <strong>the</strong> decline suffered by <strong>the</strong> species (BirdLife International 2011). As a consequence,<br />
numerous breeding programs have been put in place for reintroduction purposes (Pomarol<br />
1993, Alcaide et al. 2010).<br />
For more precise information see Cramp & Simmons (1980), Negro (1997) and<br />
Ferguson-Lees & Christie (2001).<br />
10
Fig. 1. Lesser <strong>kestrel</strong> adult male predating on a locust. Photo: Pepe Antolín<br />
Fig. 2. Lesser <strong>kestrel</strong> pair (male is perched just on <strong>the</strong> top of <strong>the</strong> roof). Photo: Pepe Antolín<br />
11
Aims<br />
The main aim of this PhD Thesis is to provide basic life history information on migratory<br />
connectivity of <strong>lesser</strong> <strong>kestrel</strong> populations, decreasing <strong>the</strong> huge information gap on this topic<br />
for this species. The specific aims were:<br />
1) to locate <strong>the</strong> wintering areas, as well as <strong>the</strong> migration routes, of Western European<br />
Lesser Kestrels by using light level geolocation.<br />
2) to examine <strong>the</strong> possible effects of geolocators on various breeding parameters (clutch<br />
size, number of fledged young, and clutch initiation date) during two consecutive<br />
nesting seasons.<br />
3) to evaluate blood biochemistry parameters (triglycerides, cholesterol, urea, and uric<br />
acid) of nestlings of geolocator-tagged and control pairs.<br />
4) to test <strong>the</strong> suitability of MHC markers to infer migratory connectivity between<br />
breeding and wintering populations.<br />
5) to test <strong>the</strong> accuracy and performance of analytical approaches (PHASE algorithm) for<br />
<strong>the</strong> computational inference of <strong>the</strong> gametic phase across highly polymorphic genes<br />
such as those belonging to <strong>the</strong> MHC.<br />
6) to examine <strong>the</strong> nutritional condition of <strong>lesser</strong> <strong>kestrel</strong>s based on selected blood<br />
biochemistry parameters.<br />
Thesis outline<br />
In chapter 1, we explain how we fitted, for <strong>the</strong> first time, geolocators to a bird of prey, <strong>the</strong><br />
<strong>lesser</strong> <strong>kestrel</strong>, to shed light on <strong>the</strong> wintering areas of <strong>the</strong> <strong>threatened</strong> western population.<br />
In chapter 2, we examine <strong>the</strong> possible effects of geolocators on various breeding parameters<br />
(clutch size, number of fledged young, and clutch initiation date) during two consecutive<br />
breeding seasons, as well as on <strong>the</strong> blood biochemistry parameters (triglycerides,<br />
cholesterol, urea, and uric acid) of nestlings of geolocator-tagged and control pairs.<br />
In chapter 3, we use, for <strong>the</strong> first time in birds, MHC loci as genetic markers to study<br />
migratory connectivity. This chapter is aimed to unravel <strong>the</strong> breeding origin of <strong>lesser</strong><br />
<strong>kestrel</strong>s wintering in two roosts located in Senegal and South Africa.<br />
12
In chapter 4, we tested <strong>the</strong> performance of <strong>the</strong> PHASE algorithm implemented in <strong>the</strong><br />
software DNAsp to resolve <strong>the</strong> gametic phase of highly polimorphic MHC genes. The<br />
verification of this methodology is critical for <strong>the</strong> correct interpretation of <strong>the</strong> previous<br />
chapter.<br />
In chapter 5, we conducted an assessment of <strong>the</strong> nutritional condition of adult and nestling<br />
<strong>lesser</strong> <strong>kestrel</strong>s in two colonies <strong>from</strong> <strong>the</strong> South of Spain.<br />
Glossary<br />
Geolocator: Archival data loggers equipped with an accurate internal clock record light<br />
intensities enabling <strong>the</strong> estimation of sun elevation.<br />
Major Histocompatibility Complex (MHC): A cluster of closely linked genes concerned<br />
with antigen production, encompassing two main groups of immune active<br />
molecules: class I and II.<br />
Marker: Tool used to answer key questions concerning avian migration (i.e. origin,<br />
phenology, route, stopover sites). Two types of markers (intrinsics or extrinsics)<br />
can be distinguished depending on <strong>the</strong> fact if <strong>the</strong>y are naturally inherent to <strong>the</strong> bird<br />
or not.<br />
Migration: The regular, endogenously controlled, seasonal movements between<br />
breeding and non-breeding areas. Irregular (nomadism, invasions, irruptions) or<br />
unidirectional journeys (juvenil dispersal) are not termed real migration.<br />
Migratory connectivity: Geographic links of individuals or populations between stages<br />
of a species's life cycle.<br />
Stable isotopes: Atoms of <strong>the</strong> same element with different numbers of neutrons, and<br />
<strong>the</strong>refore unique atomic masses.<br />
Stopover: Areas used by migrants to rest, eat or find cover during migration.<br />
13
References<br />
Alcaide, M., Negro, J.J., Serrano, D., Tella, J.L. & Rodríguez, C. (2005) Extra-pair paternity in<br />
<strong>the</strong> Lesser Kestrel Falco naumanni: a re-evaluation using microsatellite markers. Ibis<br />
147: 608-611.<br />
Alcaide, M., Negro, J.J., Serrano, D., et al. (2010) Captive breeding and reintroduction of <strong>the</strong><br />
<strong>lesser</strong> <strong>kestrel</strong> Falco naumanni: a genetic analysis using microsatellites. Conservation<br />
Genetics 11: 331-338.<br />
BirdLife International (2011) Falco naumanni. In: Birdlife species factsheet. Available at:<br />
http://www.birdlife.org. (Last accessed 1 May 2011).<br />
Bowlin, M.S., Bisson, I.-A., Shamoun-Baranes, J., et al. (2010) Grand challenges in migration<br />
biology. Integrative and Comparative Biology 50: 261-679.<br />
Chernetsov, N., Kishkinev, D. & Mouritsen, H. (2008) A long-distance avian migrant<br />
compensates for longitudinal displacement during spring migration. Current Biology<br />
18: 188-190.<br />
Coiffait, L., Redfern, C.P.F., Bevan, R.M., Newton, J. & Wolff, K. (2009) The use of intrinsic<br />
markers to study bird migration. Ringing & Migration 24: 169-174.<br />
Cramp, S. & Simmons, K.E.L. (1980) The Birds of <strong>the</strong> Western Palearctic, Vol. 2. Oxford<br />
University Press, Oxford, UK.<br />
Donázar, J.A., Negro, J.J. & Hiraldo, F. (1992) Functional analysis of mate-feeding in <strong>the</strong><br />
Lesser Kestrel Falco naumanni. Ornis Scandinavica 23: 190-194.<br />
Evegang, C., Stenhouse, I.J., Phillips, R.A., Petersen, A., Fox, J.W. & Silk, J.R.D. (2010) Tracking<br />
of Arctic terns Sterna paradisaea reveals longest animal migration. Proceedings of <strong>the</strong><br />
National Academy of Sciences of <strong>the</strong> United States 107: 2078-2081.<br />
Ferguson-Lees, J. & Christie, D.A. (2001) Raptors of <strong>the</strong> World. Christopher Helm, London,<br />
UK.<br />
Gill, R.E., Tibbitts, T.L., Douglas, D.C., et al. (2009) Extreme endurance flights by landbirds<br />
crossing <strong>the</strong> Pacific Ocean: ecological corridor ra<strong>the</strong>r than barrier? Proceedings of <strong>the</strong><br />
Royal Society of London B 276: 447-457.<br />
Hobson, K.A. & Wassenaar, L.I. (2008) Tracking animal migration with stable isotopes.<br />
Academic Press, San Diego, CA, USA.<br />
Klaassen, R.H.G., Alerstam, T., Carlsson, P., Fox, J.W. & Lindström, Å. (2011) Great flights by<br />
great snipes: long and fast non-stop migration over benign habitats. Biology Letters<br />
DOI:10.1098/rsbl.2011.0343.<br />
14
Manel, S., Gaggiotti, O.E. & Waples, R.S. (2005) Assignment methods: matching biological<br />
questions techniques with appropriate. Trends in Ecology & Evolution 20: 136-142.<br />
Negro, J.J. (1997) Lesser <strong>kestrel</strong> Falco naumanni. BWP Update 1: 49-56.<br />
Negro, J.J., de la Riva, M. & Bustamante, J. (1991) Patterns of winter distribution and<br />
abundance of <strong>the</strong> Lesser Kestrel (Falco naumanni) in Spain. Journal of Raptor Research<br />
25: 30-35.<br />
Newton, I. (2004) Population limitation in migrants. Ibis 146: 197-226.<br />
Newton, I. (2008) The migration ecology of birds. Academic Press, London, UK.<br />
Tella, J.L., Hiraldo, F., Donázar, J.A. & Negro, J.J. (1996) Costs and benefits of urban nesting in<br />
<strong>the</strong> <strong>lesser</strong> <strong>kestrel</strong>. In: Bird, D., Varland, D. & Negro, J.J. (Eds.), Raptors in Human<br />
Landscapes: Adaptations to Built and Cultivated Environments. Academic Press,<br />
London, UK, pp. 53-60.<br />
Pérez-Granados, C. (2010) Diet of adult <strong>lesser</strong> <strong>kestrel</strong>s Falco naumanni during <strong>the</strong> breeding<br />
season in central Spain. Ardeola 57: 443-448.<br />
Piertney, S.B. & Oliver, M.K. (2006) The evolutionary ecology of <strong>the</strong> major<br />
histocomaptibility complex. Heredity 96: 7-21.<br />
Pomarol, M. (1993) Lesser Kestrel recovery project in Catalonia. In: Nicholls, M.K., Clarke. R.<br />
(Eds.), Biology and conservation of small falcons: Proceedings of <strong>the</strong> 1991 Hawk and Owl<br />
Trust Conference. The Hawk and Owl Trust, London, UK, pp. 24-28.<br />
Pritchard, J.K, Stephens, M. & Donnelly, P. (2000) Inference of population structure using<br />
multilocus genotype data. Genetics 155: 945-959.<br />
Pulido, F. (2007) Phenotypic changes in spring arrival: evolution, phenotypic plasticity,<br />
effects of wea<strong>the</strong>r and condition. Climate Research 35: 5-23.<br />
Robinson, W.D., Bowlin, M.S., Bisson, I., et al. (2010) Integrating concepts and technologies<br />
to advance <strong>the</strong> study of bird migration. Frontiers in Ecology & Environment 8: 354-361.<br />
Rodríguez, A., Negro, J.J., Bustamante, J., Fox, J.W. & Afanasyev, V. (2009) Geolocators map<br />
<strong>the</strong> wintering grounds of <strong>threatened</strong> <strong>lesser</strong> <strong>kestrel</strong>s in Africa. Diversity & Distributions<br />
15: 1010-1016.<br />
Rodríguez, A., Alcaide, M., Negro, J.J. & Pilard, P. (2011) Using MHC markers to assign <strong>the</strong><br />
geographic origin of migratory birds: <strong>examples</strong> <strong>from</strong> <strong>the</strong> <strong>threatened</strong> <strong>lesser</strong> <strong>kestrel</strong>.<br />
Animal Conservation 14: 306-313.<br />
Rodríguez, C., Tapia, L., Kieny, F. & Bustamante, J. (2010) Temporal changes in <strong>lesser</strong> <strong>kestrel</strong><br />
(Falco naumanni) diet during <strong>the</strong> breeding season in sou<strong>the</strong>rn Spain. Journal of Raptor<br />
Research 44: 120-128.<br />
15
Salewski, V. & Bruderer, B. (2007) The evolution of bird migration – a syn<strong>the</strong>sis.<br />
Naturwissenschaften 94: 268-279.<br />
Sanderson, F.J., Donald, P.F., Pain, D.J., Burfield, I.J. & van Bommel, F.P.J. (2006) Long-term<br />
population declines in Afro-Palearctic migrant birds. Biological Conservation 131: 93-<br />
105.<br />
Sommer, S. (2005) The importance of immune gene variability (MHC) in evolutionary<br />
ecology and conservation. Frontiers in Zoology 2: 16.<br />
Stutchbury, B.J.M., Tarof, S.A., Done, T., et al. (2009) Tracking Long-Distance Songbird<br />
Migration by Using Geolocators. Science 323: 896.<br />
Thorup, K., Ortvad, T.E., Rabol, J., et al. (2011) Juvenil songbirds compensate for<br />
displacement to oceanic islands during autumn migration. Plos One 6: e17903.<br />
Webster, M.S., Marra, P.P., Haig, S.M., Bensch, S. & Holmes, R.T. (2002). Links between<br />
worlds: unravelling migratory connectivity. Trends in Ecology & Evolution 17: 76-83.<br />
Wink, M. (2006) Use of DNA markers to study bird migration. Journal of Ornithology 147:<br />
234-244.<br />
16
17<br />
Chapter 1<br />
Geolocators map <strong>the</strong> wintering grounds of<br />
<strong>threatened</strong> <strong>lesser</strong> <strong>kestrel</strong>s in Africa<br />
Pre-migratory concentrations of <strong>lesser</strong> <strong>kestrel</strong>s. Photo: Pepe Antolín<br />
Rodríguez, A., Negro, J.J., Bustamante, J., Fox, J.W. & Afanasyev, V. (2009) Geolocators map<br />
<strong>the</strong> wintering grounds of <strong>threatened</strong> <strong>lesser</strong> <strong>kestrel</strong>s in Africa. Diversity & Distributions<br />
15: 1010-1016.
Abstract<br />
We used archival light level geolocators (1.5 g) to map <strong>the</strong> wintering areas and determine<br />
some characteristics of <strong>the</strong> migratory journeys of 20 adult Lesser Kestrels <strong>from</strong> <strong>the</strong> Iberian<br />
Peninsula. Thirteen geolocators were recovered <strong>the</strong> following breeding season (2008) after<br />
attachment in 2007. Four recovered geolocators provided useful data. According to kernel<br />
density analyses, <strong>kestrel</strong>s wintered near <strong>the</strong> Senegal River (border between Mauritania and<br />
Senegal). Pre-nuptial migration took longer than <strong>the</strong> post-nuptial migration, which may be<br />
<strong>the</strong> consequence of a loop migration. Geolocators have solved a crucial conservation<br />
question (i.e., <strong>the</strong> winter destination of western European Lesser <strong>kestrel</strong>s), and <strong>the</strong>se<br />
devices have thus proved useful to determine <strong>the</strong> location of <strong>the</strong> winter quarters of small<br />
sized migratory species. Our data indicate that European Lesser Kestrels winter in West<br />
Africa, in accordance with previous suggestions based on scattered observations during <strong>the</strong><br />
winter months. This valuable information should serve to focus conservation efforts both in<br />
nor<strong>the</strong>rn Senegal and sou<strong>the</strong>rn Mauritania. Large roosts ga<strong>the</strong>ring thousands of <strong>lesser</strong><br />
<strong>kestrel</strong>s had been recorded in <strong>the</strong>se areas over <strong>the</strong> years, but <strong>the</strong>re was no previous<br />
confirmation of individuals staying all winter long. Specific and sustained protection of <strong>the</strong><br />
roost sites, where <strong>the</strong> birds may be most vulnerable, should be sought in conjunction with<br />
local authorities.<br />
18
Introduction<br />
The Lesser Kestrel Falco naumanni is a small migratory falcon which breeds in <strong>the</strong><br />
Palearctic <strong>from</strong> <strong>the</strong> Iberian Peninsula through <strong>the</strong> Mediterranean basin, Asia Minor,<br />
Western Asia, to Mongolia and China. Its populations have decreased dramatically (c. 95%)<br />
in <strong>the</strong> western Palearctic since <strong>the</strong> 1950s, and a reduction of more than 30% of <strong>the</strong> world<br />
population has been estimated, leading to its current Vulnerable status. Habitat degradation<br />
and loss, as a result of agriculture intensification, afforestation and urban sprawl in its<br />
Western Palearctic breeding grounds, as well as in some winter areas, have been suggested<br />
as <strong>the</strong> main causes of <strong>the</strong> decline suffered by <strong>the</strong> species (BirdLife International 2008).<br />
However, <strong>the</strong>re is no contrasted information about threat factors in its winter quarters, as<br />
<strong>the</strong> actual location of <strong>the</strong> wintering grounds in Africa of birds of known origin has never<br />
been mapped.<br />
Flocks of foraging Lesser <strong>kestrel</strong>s and roost aggregations have been sighted <strong>from</strong><br />
November to February in <strong>the</strong> Sub-Saharan region, East and South of Africa, and South of<br />
Arabian Peninsula (Ferguson-Lees & Christie 2001). Moreau (1972) reported that<br />
populations <strong>from</strong> different parts of <strong>the</strong> breeding range tended to remain separated in <strong>the</strong><br />
winter; however, evidence for this pattern is sparse and inconclusive. Genetic analyses<br />
based on sequencing of mitochondrial DNA indicated that individuals wintering in South<br />
Africa originated <strong>from</strong> <strong>the</strong> Eastern populations of <strong>the</strong> breeding range, although <strong>the</strong> origin of<br />
some haplotypes was unknown and several individuals <strong>from</strong> Western Mediterranean<br />
colonies clustered within Eastern populations (Wink et al. 2004). The recovery of banded<br />
birds in <strong>the</strong> presumptive African winter quarters seem to support this pattern, but <strong>the</strong><br />
number of band recoveries to support this hypo<strong>the</strong>sis is low (Appendix S1 A in Supporting<br />
Information). Fur<strong>the</strong>rmore, migration routes are unknown. Heim de Balsac and Mayaud<br />
(1962) hypo<strong>the</strong>sized that Lesser Kestrels <strong>from</strong> Western European populations carried out a<br />
loop migration. Thus, during <strong>the</strong> post-nuptial migration <strong>the</strong> individuals would cross <strong>the</strong><br />
Sahara desert in a wide front, while <strong>the</strong> return would be mainly carried out through <strong>the</strong><br />
Western Sahara and/or coastal Africa.<br />
The aim of our study was to locate <strong>the</strong> wintering areas, as well as <strong>the</strong> migration<br />
routes, of Western European Lesser Kestrels by using light level geolocation (a type of<br />
Global Location Sensing - GLS). At present, mapping bird wintering areas of long-distance<br />
migratory species is mainly based on banding recoveries or band controls (e.g. Ottosson et<br />
al. 2005), satellite telemetry if <strong>the</strong> species is large enough for <strong>the</strong> individuals to carry PTT’s<br />
(e.g. Strandberg et al. 2008), stable isotope analysis of fea<strong>the</strong>rs or o<strong>the</strong>r tissues (e.g.<br />
19
Sarasola et al. 2008), and through <strong>the</strong> use of genetic markers (Wink 2006, Lopes et al.<br />
2008). Light level geolocation is a relatively new technology mainly restricted so far to<br />
marine animals such as tuna, seals, penguins, albatrosses and shearwaters, which are<br />
capable of carrying heavy loggers, are easy to re-capture, and range over large pelagic areas<br />
ensuring distance <strong>from</strong> man-made light sources. Although <strong>the</strong>re is no reason why o<strong>the</strong>r<br />
animal groups presenting similar characteristics will not be successfully tracked, this<br />
technique has not yet been widely used in terrestrial animals (but see Eichhorn et al. 2006<br />
and Stutchbury et al. 2009). The currently available (and affordable) miniaturized data-<br />
loggers make it possible to track and determine migration, stop-over and wintering areas of<br />
a wide range of smaller animals with far greater accuracy than is currently possible with<br />
o<strong>the</strong>r methodologies (see above). Especially for those endangered species which have<br />
experienced alarming declines, this information is crucial to <strong>the</strong>ir conservation (Newton<br />
2004). Tracking endangered birds to <strong>the</strong>ir wintering grounds will help identify threats in<br />
<strong>the</strong>se previously unknown areas.<br />
Methods<br />
Light level geolocation is based on logging diurnal changes in light levels (Hill 1994).<br />
Archival data loggers equipped with an accurate internal clock record light intensities<br />
enabling <strong>the</strong> estimation of sun elevation. These measurements are used to estimate<br />
geographical position (a daily sunrise and sunset recording can give two fixes per day with<br />
an average accuracy of 186 ± 114 km - Phillips et al. 2004). Day and/or night length<br />
determines <strong>the</strong> latitude and time of local midday and/or midnight <strong>the</strong> longitude. The<br />
loggers measured light every minute, and recorded <strong>the</strong> maximum light level at <strong>the</strong> end of<br />
every 10 minute period (see details in Afanasyev 2004). The advantages over Platform<br />
Transmitter Terminals (PTT) are reduced costs (with no satellite requirements), small size,<br />
extended battery life, and if attached securely, indefinite device retention. However,<br />
archival light threshold-level geolocation shows several inherent disadvantages: recapture<br />
is necessary to download data, and only 2 locations are available per day. In addition, it is<br />
impossible to estimate latitude around each equinox, when day time is approximately equal<br />
to night time at all latitudes. Fur<strong>the</strong>rmore, location accuracy varies according to<br />
geographical area, thus latitude determinations are poor between tropics becoming worse<br />
closer to <strong>the</strong> equator, and position cannot be calculated without both a day and night period<br />
(Hill 1994).<br />
20
We used twenty 1.5 g data loggers designed and developed by <strong>the</strong> British Antarctic<br />
Survey (models Mk14S and Mk14 - BAS 2008), which were fitted to 10 Lesser Kestrel pairs<br />
during <strong>the</strong> 2007 breeding season in an urban colony at La Palma del Condado (37º23’N,<br />
6º33’W), Huelva province, sou<strong>the</strong>rn Spain. Data loggers were attached in two ways: on<br />
Teflon harnesses as back mounts (five pairs), and on darvic rings as leg mounts (five<br />
remaining pairs). During <strong>the</strong> 2008 breeding season, we looked for marked birds at <strong>the</strong><br />
colony to retrieve geolocators and download <strong>the</strong> data <strong>the</strong>y had accumulated. All retrieved<br />
geolocators were pre- and post-calibrated during 7-10 days following manufacturer<br />
instructions. Downloading, processing and data analysis were carried out with BasTrak,<br />
TransEdit and BirdTracker programs respectively (BAS 2008). Positions were calculated by<br />
inspecting <strong>the</strong> integrity of <strong>the</strong> daily light curve and marking sunrise and sunset times. Using<br />
calibrated data, <strong>the</strong> sun elevation value for threshold analysis was set to -4.7 degrees<br />
corresponding to <strong>the</strong> arbitrary threshold level to 32. To filter unrealistic positions during<br />
<strong>the</strong> wintering period, <strong>the</strong> following data points were removed: (a) those obtained <strong>from</strong> light<br />
curves showing interferences at dawn or dusk, and (b) those with a speed index (Vi) above<br />
25 km h -1 , as calculated by <strong>the</strong> square root speed average of <strong>the</strong> segments formed with <strong>the</strong><br />
two preceding and <strong>the</strong> two following positions:<br />
V<br />
i<br />
=<br />
1 j<br />
4<br />
∑ =<br />
2<br />
j=<br />
−2,<br />
j≠<br />
0<br />
( v<br />
i,<br />
j+<br />
i<br />
where Vi, j+i is <strong>the</strong> velocity between successive positions i and j+i.<br />
)<br />
2<br />
Data were smoo<strong>the</strong>d twice, and <strong>the</strong> iterative speed filter <strong>the</strong>n applied to remove <strong>the</strong><br />
unlikely locations remaining. The great-circle distance between consecutive fixes was used<br />
in all velocity calculations (Phillips et al. 2004). Kernel density distributions maps were<br />
derived <strong>from</strong> filtered and validated locations using <strong>the</strong> kernel function implemented in <strong>the</strong><br />
Animal Movement extension of ArcView 3.2 and a UTM 28N projection. The smoothing<br />
parameter (h) was set to 45 000 m and grid size to 500 m. Although locations are not<br />
serially independent, this is not a requirement for kernel analysis (De Solla et al. 1999).<br />
Since Lesser Kestrel migration coincides approximately with <strong>the</strong> spring and autumn<br />
equinoxes, it was not possible to determine migration routes precisely. Therefore, we only<br />
took into account <strong>the</strong> longitude data during <strong>the</strong> migration time, which are not biased during<br />
equinoxes (Hill 1994). In this case, only longitude data <strong>from</strong> unrealistic positions obtained<br />
<strong>from</strong> light curves showing interferences at dawn or dusk were deleted. Timing and rate of<br />
migration were calculated assuming birds finished migration when longitude stabilized<br />
(Guilford et al. 2009, Stutchbury et al. 2009). This assumption is certainly not valid, but lets<br />
us compares <strong>the</strong> patterns of post- and pre-nuptial migrations.<br />
21
Results<br />
At least 15 different individuals carrying geolocators were sighted during <strong>the</strong> 2008<br />
breeding season at <strong>the</strong> colony. We were able to retrieve 13 geolocators, of which six failed<br />
to download or only contained data of a few days after attachment, largely due to physical<br />
damage. Out of seven birds recaptured with geolocators which contained some data, one<br />
did not migrate and remained in <strong>the</strong> Iberian Peninsula (see Appendix S2). Geolocators fitted<br />
as leg mounts on darvic rings (n = 7) showed damage caused by bites, scratches and<br />
ingrained dirt, and none contained usable data. However, recorded data in three of <strong>the</strong>se<br />
damaged leg mounted geolocators suggested that <strong>the</strong> birds did migrate, and that <strong>the</strong>y<br />
probably wintered in <strong>the</strong> same general area as <strong>the</strong> o<strong>the</strong>r birds with back-mounted<br />
geolocators.<br />
The detailed migration results discussed here came <strong>from</strong> three harness mounted<br />
birds. All individuals (n = 3) wintered in <strong>the</strong> same area in <strong>the</strong> North of Senegal and South of<br />
Mauritania (Fig. 1). They were present in <strong>the</strong> area <strong>from</strong> <strong>the</strong> end of September until early<br />
March. Home range individually varied in area, but <strong>the</strong>re was a partial overlap in <strong>the</strong> winter<br />
areas of <strong>the</strong> three individuals (Appendix S3). These figures are probably exaggerated due to<br />
unquantifiable shading uncertainties (e.g. vegetation, clouds, dirt) adding to <strong>the</strong> inherently<br />
low accuracy of geolocators.<br />
According to longitude data, <strong>the</strong> post-nuptial migration took place during <strong>the</strong> second<br />
half of September and early October, and lasted approximately 5 ± 1 days (n = 3). The pre-<br />
nuptial migration took place during <strong>the</strong> first half of February and late March (Fig. 2), and<br />
lasted approximately 24.3 ± 10 days (n = 3) (Appendix S2). The length of pre-nuptial<br />
migration was 4.2 times longer and 3.5 times more variable in time than <strong>the</strong> post-nuptial<br />
one.<br />
Discussion<br />
Despite <strong>the</strong> constraints inherent to light level geolocation, this study shows for <strong>the</strong> first time<br />
<strong>the</strong> wintering areas of Lesser Kestrels with a known origin (i.e., a colony in <strong>the</strong> south of <strong>the</strong><br />
Iberian peninsula), as well as <strong>the</strong> first details of timing and rate of <strong>the</strong>ir migrations. So far,<br />
Lesser Kestrels had been widely recorded in West Africa, but not consistently (Moreau<br />
1972, Pilard et al. 2004, 2005). Specifically in Senegal, large flocks of Lesser Kestrels had<br />
22
een sighted in <strong>the</strong> deltas of <strong>the</strong> Senegal (Triplet et al. 1993, Triplet & Yésou 1995) and<br />
Saloum rivers (Isenmann 2005, LPO 2008; see Appendix S1 B). These observations had<br />
been carried out during January or February, and it was believed that <strong>the</strong> birds were in<br />
active migration (Pilard et al. 2004). Our data show that Lesser Kestrels may spend <strong>the</strong><br />
whole winter in those areas. Possibly, <strong>the</strong> observed large flocks reflect pre-migratory<br />
aggregations, as well as <strong>the</strong> use of communal roosts at times when migratory locusts are <strong>the</strong><br />
staple prey (Triplet et al. 1993, Triplet & Yésou 1995, Isenmann 2005). Ringing of Lesser<br />
Kestrels has provided only five recoveries in <strong>the</strong> presumptive winter quarters (Appendix S1<br />
A), two corresponding to western European birds (see below) and three to Asian birds that<br />
wintered in South Africa. In <strong>the</strong> case of Spain, more than 37,000 Lesser Kestrels have been<br />
ringed during <strong>the</strong> period 1973-2006, and only two recoveries of corpses in unusual dates<br />
(20 June 1992 and 23 April 1996) have been obtained in <strong>the</strong> Western African presumptive<br />
winter quarters. The scarcity of recoveries may be associated to <strong>the</strong> low presence of<br />
ornithologists, birdwatchers or even tourists in <strong>the</strong> Sahel area, at least compared to o<strong>the</strong>r<br />
African regions.<br />
The proportion of individuals which migrated was similar (75% or 85% if we take<br />
into account <strong>the</strong> darvic ring data-loggers with poor data) to that reported for <strong>the</strong> species in<br />
<strong>the</strong> same population (19% of adults are residents in sou<strong>the</strong>rn Spain; Negro et al. 1991,<br />
Negro 1997). The fact that Lesser Kestrel migration coincided approximately with <strong>the</strong><br />
equinoxes, and in proximity to <strong>the</strong> tropics, precluded <strong>the</strong> ability to include latitude in <strong>the</strong><br />
plotting of migratory routes (Hill 1994). The longer pre-nuptial migration in comparison to<br />
<strong>the</strong> post-nuptial migration contrasts with <strong>the</strong> typical pattern shown by o<strong>the</strong>r birds (Curry-<br />
Lindahl 1981, Alerstam et al. 2006, Stutchbury et al. 2009). In migratory birds, early<br />
arrivals on <strong>the</strong> breeding grounds entail advantages in terms of high-quality site occupancy.<br />
Several facts, including <strong>the</strong> active defence of nest holes during a three month period before<br />
egg-laying (February, March and April) or <strong>the</strong> sequential arrival of adult males, adult<br />
females and yearlings to <strong>the</strong> breeding colonies (Negro et al. 1991, Negro 1997), would<br />
predict a migratory pattern contrary to <strong>the</strong> observed one (see also Sergio et al. 2007).<br />
Nor<strong>the</strong>rn-east directions of dominant trade winds through <strong>the</strong> migratory routes could be<br />
responsible for <strong>the</strong> observed pattern with tail-winds aiding <strong>the</strong> post-nuptial migration<br />
(Liechti 2006). Ano<strong>the</strong>r plausible and non-mutually exclusive explanation for our results is<br />
<strong>the</strong> ringlet migration proposed by Heim de Balsac and Mayaud (1962). Thus, <strong>the</strong> rapid rate<br />
of change in longitude during post-nuptial migration could indicate that <strong>the</strong> birds migrate in<br />
a straight sou<strong>the</strong>rly direction crossing <strong>the</strong> Sahara desert, and ending <strong>the</strong> migration in a<br />
relatively short travel through <strong>the</strong> Sahel until <strong>the</strong> arrival to <strong>the</strong> winter areas. On <strong>the</strong> o<strong>the</strong>r<br />
23
hand, during <strong>the</strong> pre-nuptial migration, Lesser Kestrels may flock toge<strong>the</strong>r and come back<br />
to <strong>the</strong> breeding grounds through Western Sahara, and thus a gentler longitude slope would<br />
be drawn (Fig. 2). The mean velocity of post-nuptial migrations reported here (range 4-6<br />
days and 417-625 km/day) are higher than <strong>the</strong> estimated for o<strong>the</strong>r Falco species (McGrady<br />
et al. 2002, Ganusevich et al. 2004, Strandberg et al. 2009b) or raptors in general (maximum<br />
speed of about 200 km, see Strandberg et al. 2009a) and similar to two songbirds<br />
(Stutchbury et al. 2009). This may be related to <strong>the</strong> fact that <strong>the</strong> Sahara desert constitutes<br />
almost entirely <strong>the</strong> route until <strong>the</strong> wintering grounds. It is well known that birds cross <strong>the</strong><br />
Sahara desert in a shorter time period than o<strong>the</strong>r safer and more suitable zones (Meyburg<br />
et al. 2004, Klaassen et al. 2008). In <strong>the</strong> case of Lesser Kestrel, it has been proposed that<br />
birds make a continuous flight of some 2500 km in post-nuptial migration (Moreau 1972).<br />
In this sense, Eurasian Hobby Falco subbuteo is able to make a nonstop flight over a distance<br />
of 740 km across <strong>the</strong> Mediterranean Sea during 27 hours (Strandberg et al. 2009b). If we<br />
accept <strong>the</strong> loop migration hypo<strong>the</strong>sis, <strong>the</strong> pre-nuptial migratory route will cross a smaller<br />
area of desert, and consequently birds could fly over a safer terrain. However, we have only<br />
used longitude data, and <strong>the</strong>refore, our conclusions may be biased.<br />
The fitted geolocators did not appear to have severely affected <strong>the</strong> birds in any<br />
significant way. Breeding success during tagging year and survival did not vary between<br />
tagged and un-tagged individuals (Rodríguez et al. unpublished data). We will <strong>the</strong>refore<br />
assume that data obtained are representative for breeding birds of our study colony. Given<br />
that <strong>the</strong> geolocators fitted on darvic bands failed to provide usable data due to damage<br />
caused by <strong>the</strong> birds <strong>the</strong>mselves, we recommend <strong>the</strong> use of back mounted geolocators, at<br />
least for raptors or species with strong beaks. Fur<strong>the</strong>rmore, leg mounting may be<br />
unsuitable for geolocators on many terrestrial species due to <strong>the</strong> accumulation of dirt over<br />
<strong>the</strong> light sensor; to date, most success with leg mounting geolocators has been with seabirds<br />
(e.g. Guilford et al. 2009). In <strong>the</strong> case of back mounted geolocators, <strong>the</strong> light sensor is kept<br />
cleaner and less accessible to <strong>the</strong> beak and talons than in <strong>the</strong> leg mounts.<br />
According to mostly anecdotal observations, <strong>the</strong> winter ecology of <strong>the</strong> Lesser Kestrel<br />
appears to be similar to that of o<strong>the</strong>r resident or long distance migratory raptors such as<br />
<strong>the</strong> Black Kite Milvus migrans or <strong>the</strong> African Swallow-tailed Kite Chelictinia riocourii in <strong>the</strong><br />
same area, roosting in large communal roosts and feeding on locusts and grasshoppers<br />
(Triplet & Yésou 1995, Pilard et al. 2004, 2005, Isenmann 2005, LPO 2008). It has been<br />
reported by satellite telemetry that o<strong>the</strong>r Western European raptors such as <strong>the</strong> Marsh<br />
Harrier Circus aeruginosus (Strandberg et al. 2008), Montagu’s Harrier Circus pygargus<br />
(Limiñana et al. 2007) or Egyptian Vulture Neophron percnopterus (Meyburg et al. 2004),<br />
24
winter also in <strong>the</strong> Sahel zone. Some of <strong>the</strong>m, mainly locust and grasshopper consumers,<br />
have suffered severe declines in recent decades, possibly related to droughts and pesticide<br />
use to control insects (Newton 2004, Sánchez-Zapata et al. 2007). Due to <strong>the</strong> gregarious<br />
behavior of <strong>kestrel</strong>s, specific and localized conservation measures may help conserve<br />
almost <strong>the</strong> entire wintering European population (LPO 2008).<br />
While <strong>the</strong> banding of thousands of Lesser Kestrels throughout <strong>the</strong> Western European<br />
breeding range for more than 30 years has failed to provide conclusive data on wintering<br />
and migration, inexpensive geolocators have solved a crucial question in only one year of<br />
study. Because migratory <strong>kestrel</strong>s spend a considerable time on <strong>the</strong> wintering grounds, this<br />
valuable information should serve to focus conservation efforts both in time and space.<br />
Specifically, <strong>the</strong> large aggregations of <strong>kestrel</strong>s previously observed in nor<strong>the</strong>rn Senegal and<br />
sou<strong>the</strong>rn Mauritania in <strong>the</strong> winter months may now be attributed to genuine wintering<br />
individuals that may stay in <strong>the</strong> area for several months. A single roost site found in Senegal<br />
ga<strong>the</strong>ring about 24,000 individuals in 2007, and that may have been used by <strong>the</strong> <strong>kestrel</strong>s for<br />
years, holds every season more than <strong>the</strong> equivalent to one third of <strong>the</strong> western European<br />
<strong>lesser</strong> <strong>kestrel</strong> population and deserves specific protection in conjunction with local<br />
authorities (see LPO 2008).<br />
It is now clear that <strong>the</strong>re are at least two main wintering grounds for <strong>lesser</strong> <strong>kestrel</strong>s<br />
in Africa: <strong>the</strong> one reported here in Western Africa, that appears to recruit birds <strong>from</strong> <strong>the</strong><br />
Western Palearctic; and South Africa, <strong>the</strong> first destination for Lesser Kestrel recognized<br />
years ago, and that seems to hold birds of Asian origin exclusively (Wink et al. 2004). The<br />
western route is considerably shorter (2,500-3,500 km) than <strong>the</strong> eastern one (8,000-10,000<br />
km), raising interesting questions on energetic constraints and adaptations for medium or<br />
long-distance migration in birds travelling one or <strong>the</strong> o<strong>the</strong>r migration route.<br />
Acknowledgments<br />
Thanks to M. de la Riva for his valuable advices about attachment methods. F. Pacios<br />
and D. Aragonés <strong>from</strong> LAST-EBD helped us to use GIS programs. P. Pilard shared<br />
unpublished information on <strong>the</strong> <strong>lesser</strong> <strong>kestrel</strong> wintering population he surveyed in Senegal.<br />
Ring recovery data belong to Oficina de Especies Migratorias, Dirección General para la<br />
Biodiversidad (Spanish Ministry of Environment) and EURING and SAFRING Data Banks.<br />
A.R. was supported by an I3P pre-doctoral fellowship <strong>from</strong> <strong>the</strong> Spanish National Research<br />
25
Council (<strong>CSIC</strong>). This study was partially funded by a Proyecto de Excelencia de la Junta de<br />
Andalucía, HORUS Project # P06-RNM-01712.<br />
References<br />
Alerstam, T., Hake, M. & Kjellén, N. (2006) Temporal and spatial pattern of repeated<br />
migratory journeys by ospreys. Animal Behaviour 71: 555-566.<br />
Afanasyev, V. (2004) A miniature daylight level and activity data recorder for tracking<br />
animals over long periods. Memoirs of National Institute of Polar Research 58: 227-233.<br />
BirdLife International (2008) Falco naumanni. In: Birdlife species factsheet. Available at:<br />
http://www.birdlife.org. (Last accessed 6 May 2009).<br />
BAS (2008) Migrating Bird Tracking Logger. In: BAS Research: Instruments and techniques.<br />
Available at: http://www.antarctica.ac.uk. (Last accessed 18 Nov 2008).<br />
Curry-Lindahl, K. (1981) Bird Migration in Africa: Movements between six continents. Vols 1<br />
& 2. Academia Press, London.<br />
De Solla, S.R., Bonduriansky, R. & Brooks, R.J. (1999) Eliminating autocorrelation reduces<br />
biological relevance of home range estimates. Journal of Animal Ecology 68: 221-234.<br />
Eichhorn, G., Afasnasyev, V., Drent, R.H. & van der Jeud, J.P. (2006) Spring stopover routines<br />
in Russian Barnacle Geese Branta leucopsis tracked by resightings and geolocation.<br />
Ardea 94: 667-678.<br />
Ferguson-Lees, J. & Christie, D.A. (2001) Raptors of <strong>the</strong> World. Christopher Helm, London.<br />
Ganusevich, S.A., Maechtle, T.L., Seegar, W.S., et al. (2004) Autumn migration and wintering<br />
areas of Peregrine Falcons Falco peregrinus nesting on <strong>the</strong> Kola Peninsula, nor<strong>the</strong>rn<br />
Russia. Ibis 146: 291-297.<br />
Guilford, T., Meade, J., Willis, J., et al. (2009) Migration and stopover in a small pelagic<br />
seabird, <strong>the</strong> Manx shearwater Puffinus puffinus: insights <strong>from</strong> machine learning.<br />
Proceedings of <strong>the</strong> Royal Society of London B 276: 1215-1223.<br />
Hill, R.D. (1994) Theory of geolocation by light levels. Elephant Seals, Population, Ecology,<br />
Behaviour and Physiology (ed. by B.J. Le Boeuf and R.M. Laws), pp 227-236. University<br />
of California Press, Berkeley.<br />
Heim de Balsac, H. & Mayaud, N. (1962) Les Oiseaux du Nord-Ouest de L'Afrique: Distribution<br />
geográphique, Ecologie, Migrations, reproduction. Ed. Paul Lechavalier, Paris.<br />
Isenmann, P. (2005) Nouvelles observations de faucons crécerellettes Falco naumanni dans<br />
leur quartier d’hiver en Afrique de l’ouest (Sénégal). Alauda 73: 141.<br />
26
Klaassen, R.G.H., Strandberg, R., Hake, M. & Alerstam, T. (2008) Flexibility in daily travel<br />
routines causes regional variation in bird migration speed. Behavioral Ecology and<br />
Sociobiology 62: 1427-1432.<br />
Liechti, F. (2006) Birds: blowin’ by <strong>the</strong> wind? Journal of Ornithology 147: 202-211.<br />
Limiñana, R., Soutullo, A. & Urios, V. (2007) Autumn migration of Montagu’s harriers Circus<br />
pygargus tracked by satellite telemetry. Journal of Ornithology 148: 517-523.<br />
Lopes, R.J., Hortas, F. & Wennerberg, L. (2008) Geographical segregation in Dunlin Calidris<br />
alpina populations wintering along <strong>the</strong> East Atlantic migratory flyway – evidence <strong>from</strong><br />
mitochondrial DNA analysis. Diversity and Distributions 14: 732-741.<br />
LPO (2008) Dernieres nouvelles des faucons crecerellettes au Senegal. In: Faucon<br />
crecerellette. Ligue pour la Protection des Oiseaux. Available at<br />
http://www.crecerellette.lpo.fr. (Last accessed 18 Nov 2008).<br />
McGrady, M.J., Maechtle, T.L., Vargas, J.J., Seegar, W.S. & Peña, M.C.P. (2002) Movements of<br />
Peregrine Falcons Falco peregrinus wintering on <strong>the</strong> Gulf Coast of Mexico 1996-1998.<br />
Condor 104: 39-48.<br />
Meyburg, B.-U., Gallardo, M., Meyburg, C. & Dimitrova, E. (2004) Migrations and sojourn in<br />
Africa of Egyptian vultures (Neophron percnopterus) tracked by satellite. Journal of<br />
Ornithology 145: 273-280.<br />
Moreau, R.E. (1972) The Palearctic-African bird migration systems. Academic Press, London.<br />
Negro, J.J. (1997) Lesser <strong>kestrel</strong> Falco naumanni. BWP Update 1: 49-56.<br />
Negro, J.J., de la Riva, M. & Bustamante, J. (1991) Patterns of winter distribution and<br />
abundance of <strong>the</strong> Lesser Kestrel (Falco naumanni) in Spain. Journal of Raptor Research<br />
25: 30-35.<br />
Newton, I. (2004) Population limitation in migrants. Ibis 146: 197-226.<br />
Ottosson, U., Waldenstrom, J., Hjort, C. & McGregor R (2005) Garden Warbler Sylvia borin<br />
migration in sub-Saharan West Africa: phenology and body mass changes. Ibis 147:<br />
750-757.<br />
Pilard, P., Thiollay, J.M. & Rondeau, G. (2004) Données sur l’hivernage du faucon<br />
crécerellette Falco naumanni en Afrique de l’ouest. Alauda 72: 323-328.<br />
Pilard, P., Corveler, T., Roche, H.P. & Girard, C. (2005) Données sur l’hivernage du faucon<br />
crécerellette Falco naumanni au Niger. Alauda 73: 137-140.<br />
Phillips, R.A., Silk, J.R.D., Croxall, J.P., Afanasyev, V. & Briggs, D.R. (2004) Accuracy of<br />
geolocation estimates for flying seabirds. Marine Ecology Progress Series 266: 265-<br />
272.<br />
27
Sánchez-Zapata, J.A., Donázar, J.A., Delgado, A., et al. (2007) Desert locust outbreaks in <strong>the</strong><br />
Sahel: resource competition, predation and ecological effects of pest control. Journal of<br />
Applied Ecology 44: 323-329.<br />
Sarasola, J.H., Negro. J.J., Hobson, K.A., Bortolotti, G. & Bildstein, K.L. (2008) Can a ‘wintering<br />
area effect’ explain population status of Swainson’s hawks? A stable isotope approach.<br />
Diversity and Distributions 14: 686-691.<br />
Sergio, F., Blas, J., Forero, M.G., Donázar, J.A. & Hiraldo, F. (2007) Sequential settlement and<br />
site dependence in a migratory raptor. Behavioral Ecology 18: 811-821.<br />
Strandberg, R., Klaassen, R.H.G., Hake, M., et al. (2008) Complex timing of Marsh Harrier<br />
Circus aeruginosus migration due to pre- and post-migratory movements. Ardea 96:<br />
159-171.<br />
Strandberg, R., Alerstam, T., Hake, M. & Kjellén, N. (2009a). Short-distance migration of <strong>the</strong><br />
Common Buzzard Buteo buteo recorded by satellite tracking. Ibis 151: 200-206.<br />
Strandberg, R., Klaassen, R.H.G., Hake, M., Olofsson, P. & Alerstam, T. (2009b) Converging<br />
migration routes of Eurasian hobbies Falco subbuteo crossing <strong>the</strong> African equatorial<br />
rain forest. Proceedings of <strong>the</strong> Royal Society of London B 276: 727-733.<br />
Stutchbury, B.J.M., Tarof, S.A., Done, T., et al. (2009) Tracking Long-Distance Songbird<br />
Migration by Using Geolocators. Science 323: 896.<br />
Triplet, P., Tréca, B. & Schricke, V. (1993) Oiseaux consommateurs de Schistocerca gregaria.<br />
L’Oiseau et la Revue Française D’Ornitholgie 63: 224-225.<br />
Triplet, P. & Yésou, P. (1995) Concetrations inhabituelles d’oiseaux consommateurs de<br />
croquets dans le delta du fleuve Sénégal. Alauda 63: 236.<br />
Wink, M., Sauer-Gürth, H. & Pepler, D. (2004) Phylogeographic relationships of <strong>the</strong> Lesser<br />
Kestrel (Falco naumanni) in breeding and wintering quarters inferred <strong>from</strong> nucleotide<br />
sequences of <strong>the</strong> mitochondrial cytochrome b gene. Raptors Worldwide (ed. by R.D.<br />
Chancelor and B.-U. Meyburg), pp. 505-510. WWGBP, Berlin.<br />
Wink, M. (2006) Use of DNA markers to study bird migration. Journal of Ornithology 147:<br />
234-244.<br />
28
Figures<br />
Fig. 1 Validated locations and activity ranges derived <strong>from</strong> kernel analyses (encompassing<br />
95%, 75% and 50% of <strong>the</strong> locations) in <strong>the</strong> wintering areas of three adult Lesser Kestrels<br />
during a winter period (November, December 2007 and January 2008). The white circle<br />
with a black point shows <strong>the</strong> location of <strong>the</strong> breeding colony of <strong>the</strong> individuals at La Palma<br />
del Condado (Huelva Province, Spain).<br />
29
Fig. 2 Longitude variations during post and pre-nuptial migration of Lesser Kestrels. Shade<br />
area indicates <strong>the</strong> estimated duration of migration. Each point corresponds to <strong>the</strong> average<br />
longitude of <strong>the</strong> date (two locations per day).<br />
30
Supporting Information<br />
Appendix S2 (A) Band recoveries of migratory Lesser Kestrels Falco naumanni in wintering<br />
areas. Data <strong>from</strong> <strong>the</strong> Migratory Species Office a (Spanish Ministry of Environment), EURING<br />
data bank b , SAFRING c (South African Bird Ringing Unit), Preston d (1976) and Anonymous e<br />
(1997). Grey area shows putative wintering areas of <strong>the</strong> Lesser Kestrel according to<br />
Ferguson-Lees and Christie (2001). (B) Locations of Senegal and Saloum rivers (blue) and<br />
deltas (grey).<br />
31
References<br />
Anonymous. (1997) Safring news: Lesser <strong>kestrel</strong> migration route. Africa Birds & Birding 2:<br />
16.<br />
Ferguson-Lees, J. & Christie, D.A. (2001) Raptors of <strong>the</strong> World. Christopher Helm, London,<br />
UK.<br />
Preston, J. (1976) Lesser Kestrel Falco naumanni. Bokmakierie 28: 68-69.<br />
32
Appendix S2 Distances and duration of pre- and post-nuptial migration of Lesser Kestrels. Type, state at recovery and ID of <strong>the</strong><br />
geolocators is included, as well as sex of <strong>the</strong> bearer.<br />
Pre-nuptial<br />
migration<br />
speed<br />
(km/day)<br />
Post-nuptial<br />
migration<br />
speed<br />
(km/day)<br />
Pre-nuptial<br />
migration<br />
duration<br />
(days)<br />
ID Type Sex State Mode Data Migration Post-nuptial<br />
migration<br />
duration<br />
(days)<br />
6302 harness F Damaged Asleep - - - - - -<br />
Collecting<br />
6306 harness M ok<br />
Good No - - - -<br />
data<br />
Collecting<br />
6307 harness M ok<br />
Good Yes 5 14 500 179<br />
data<br />
Collecting<br />
6308 harness M ok<br />
Good Yes 6 25 417 100<br />
data<br />
Collecting<br />
6309 harness F ok<br />
Good Yes 4 34 625 74<br />
data<br />
6310 harness M Damaged Asleep - - - - - -<br />
6349 ring M Dirty Asleep - - - - - -<br />
6351 ring M ok Asleep - - - - - -<br />
Scratched Collecting<br />
6353 ring M<br />
Bad Yes - - - -<br />
and dirty data<br />
Scratched Collecting<br />
6355 ring F<br />
Bad Yes - - - -<br />
and dirty data<br />
Damaged<br />
6356 ring F<br />
Asleep - - - - - -<br />
and dirty<br />
Damaged<br />
6357 ring F<br />
Asleep - - - - - -<br />
and dirty<br />
Scratched Collecting<br />
6358 ring F<br />
Bad Yes - - - -<br />
and dirty data
Appendix S3 Validated locations and activity ranges derived <strong>from</strong> kernel analyses (encompassing 95%, 75% and 50% of <strong>the</strong> locations)<br />
for each individual in <strong>the</strong> winter areas of three Lesser Kestrels during a winter period (November 2007 to January 2008).
35<br />
Chapter 2<br />
Effects of geolocator attachments on breeding<br />
parameters of <strong>lesser</strong> <strong>kestrel</strong>s Falco naumanni<br />
An adult male <strong>lesser</strong> <strong>kestrel</strong> incubating at Manzanilla colony. Photo: Airam Rodríguez<br />
Rodríguez, A., Negro, J.J., Fox, J.W. & Afanasyev, V. (2009) Effects of geolocator attachments<br />
on breeding parameters of Lesser Kestrels Falco naumanni. Journal of Field<br />
Ornithology 80: 399-407.
Abstract<br />
Light level geolocators, also known as GLS loggers, are electronic devices intended for<br />
tracking <strong>the</strong> location of wide-ranging animals using ambient light to estimate latitude and<br />
longitude. Miniaturized geolocators have become available recently that may be used on<br />
relatively small migratory birds. However, information on potential harmful effects of<br />
geolocators on <strong>the</strong>ir bearers is scarce. The effect of 1.5 g geolocators (dimensions: 21 × 6.5<br />
× 9 mm) on breeding rates, nutritional condition of nestlings and survival of migratory<br />
Lesser Kestrels Falco naumanni was assessed during an annual cycle. Geolocators were<br />
fitted in spring 2007, during <strong>the</strong> breeding season, using two attachment methods (Teflon<br />
wing harnesses and darvic rings), and <strong>the</strong>y were removed in 2008 as soon as <strong>the</strong> birds were<br />
located and captured after <strong>the</strong> pre-nuptial migration. No differences in breeding rates of<br />
control and tagged pairs were detected during <strong>the</strong> 2007 breeding season, but tagged pairs<br />
showed an increase of fledgling mortality in <strong>the</strong> following nesting season. Fur<strong>the</strong>rmore,<br />
nestlings of tagged individuals showed higher triglycerides and uric acid concentrations in<br />
blood than control nestlings during <strong>the</strong> breeding season following tagging. As for return<br />
rates, 75% of tagged birds came back to <strong>the</strong> colony after <strong>the</strong> non-breeding period a<br />
proportion that does not differ <strong>from</strong> previous estimates for <strong>the</strong> species. Although back-<br />
mounts are slightly heavier and require more skill to fit <strong>the</strong>m, we propose <strong>the</strong>ir use on small<br />
migratory raptors or o<strong>the</strong>r similar sized and terrestrial birds, given that most of our leg-<br />
mounted geolocators were heavily damaged and dirty when recovered, failing to provide<br />
usable data.<br />
36
Introduction<br />
Telemetry studies can provide valuable information about <strong>the</strong> behavior and ecology of<br />
birds, but <strong>the</strong> effect of devices used to track animals is often assumed to be negligible<br />
(Murray and Fuller 2000). Studies where tag impact has been considered have revealed<br />
variation among species, with some reporting no adverse effects (Hiraldo et al. 1994,<br />
Terhune et al. 2007, Anich et al. 2009) and o<strong>the</strong>rs demonstrating effects on breeding<br />
behavior, predation rates, breeding success, survival, and hunting skills (e.g., Whidden et al.<br />
2007). Among raptors, tags have been found to have negative effects on <strong>the</strong> survival of<br />
Nor<strong>the</strong>rn Goshawks (Accipiter gentilis) and Prairie Falcons (Falco mexicanus; Reynolds et al.<br />
2004, Steenhof et al. 2006), as well as on <strong>the</strong> types of prey delivered to nests by Prairie<br />
Falcons (Vekasy et al. 1996).<br />
Light-level geolocation technology has recently been used on terrestrial birds to<br />
investigate long-distance movements (Eichhorn et al. 2006, Stutchbury et al. 2009,<br />
Rodríguez et al. in press). To determine if data derived <strong>from</strong> <strong>the</strong> use of geolocators are<br />
unbiased due to possible handicaps on <strong>the</strong> carriers and to ensure <strong>the</strong> well-being of <strong>the</strong> birds<br />
being studied, <strong>the</strong> possible effects of geolocator tags on birds need to be examined.<br />
We examined <strong>the</strong> possible effects of geolocators on various breeding parameters<br />
(clutch size, number of fledged young, and clutch initiation date) of Lesser Kestrels (Falco<br />
naumanni) during two consecutive nesting seasons. Because <strong>the</strong> geolocators used<br />
represented less than 3% of Lesser Kestrels’ body mass (less than <strong>the</strong> generally accepted<br />
5% threshold; Kenward 2001), we predicted that breeding parameters would not be<br />
affected. We also evaluated selected blood biochemistry parameters (triglycerides,<br />
cholesterol, urea and uric acid) of nestlings of tagged and control pairs because differences<br />
in <strong>the</strong>se parameters may indirectly indicate subtle effects of geolocators on adult breeding<br />
behavior. Finally, because <strong>the</strong> effect of devices can be influenced by where or how <strong>the</strong>y are<br />
attached (Murray and Fuller 2000), two attachment methods for <strong>the</strong> GLS loggers were<br />
compared: Teflon wing harnesses and darvic plastic leg bands.<br />
Methods<br />
Geolocation and model species<br />
Light-level geolocation uses ambient light to estimate latitude and longitude, determined by<br />
day and night lengths and time of local midday or midnight, respectively. Light-level<br />
37
geolocators are equipped with an accurate internal clock that is used to time-stamp<br />
measurements <strong>from</strong> a photoreceptor.<br />
Lesser Kestrels are small, partially migratory falcons that breed colonially in holes<br />
and crevices of buildings in western Europe. During February and March, birds arrive at<br />
breeding colonies <strong>from</strong> <strong>the</strong>ir wintering grounds. Egg laying typically occurs between late<br />
April and early May. After 28-32 days of incubation, hatching occurs during June and young<br />
fledge during <strong>the</strong> first half of July. Both males and females share incubation and brooding<br />
duties. These <strong>kestrel</strong>s are sexual dimorphic and dichromatic, with males more brightly<br />
colored and lighter than females (ranges = 90-172 g and 138-208 g for males and females,<br />
respectively). Populations have decreased dramatically (about 95%) in <strong>the</strong> western<br />
Palearctic since <strong>the</strong> 1950s, and a reduction of more than 30% of <strong>the</strong> world population has<br />
been estimated, explaining its current Vulnerable status (Negro 1997).<br />
Experimental procederes<br />
We studied a colony (about 25-30 pairs) located on a cereal silo within <strong>the</strong> urban area of La<br />
Palma del Condado (37º23’N, 6º33’W), Huelva province, in sou<strong>the</strong>rn Spain. Nests were<br />
located on <strong>the</strong> window ledges of <strong>the</strong> building, allowing us to capture <strong>kestrel</strong>s by hand at<br />
<strong>the</strong>ir nests and to accurately assess breeding parameters.<br />
During June 2007, 20 adult Lesser Kestrels representing 10 randomly chosen<br />
breeding pairs were fitted with geolocators designed and created by engineers <strong>from</strong> <strong>the</strong><br />
British Antarctic Survey (www.birdtracker.co.uk). Weight and dimensions of <strong>the</strong><br />
geolocators were 1.5 g and 21 × 6.5 × 9 mm, respectively, excluding <strong>the</strong> sensor stalk. Five<br />
randomly selected pairs were fitted with Mk14S (light sensor on stalk) devices on harness<br />
attachments, and five pairs were fitted with Mk14 (no stalk) devices on darvic plastic rings<br />
on <strong>the</strong> legs (see below). The remaining 14 pairs breeding in <strong>the</strong> silo colony in 2007 were<br />
used as controls. Most adult <strong>kestrel</strong>s were captured when brooding 1-7 day old chicks (<strong>from</strong><br />
1 - 22 June 2007) at <strong>the</strong>ir respective nest sites.<br />
We used two different methods to attach loggers to <strong>kestrel</strong>s: Teflon wing harnesses<br />
and darvic plastic leg rings. The former were constructed with cotton thread, cyanoacrylate<br />
glue, and approximately 30 cm of 4.75-mm-wide tubular Teflon ribbon (Biotrack Ltd.,<br />
Dorset, UK) and doing a frontal knot in <strong>the</strong> bird breast (M. de la Riva, Estación Biológica de<br />
Doñana <strong>CSIC</strong>, pers. comm., Kenward 2001; Fig. 1A, B). The mean weight of <strong>the</strong> harness plus<br />
geolocator was 3.09 ± 0.03 (SD) g. For <strong>the</strong> second method, geolocators were attached with a<br />
wea<strong>the</strong>rproof cable tie (TY523MXR; Thomas & Betts, Memphis, TN) to a darvic ring on <strong>the</strong><br />
38
ird’s leg (Fig. 1C). Darvic rings were provided by <strong>the</strong> Ringing Office of Doñana Biological<br />
Station, and <strong>the</strong>ir size and weight were 17.5 × 10 mm and 0.9 g. The mean weight of <strong>the</strong>se<br />
attachments was 2.44 ± 0.08 (SD) g.<br />
During <strong>the</strong> 2007 and 2008 breeding seasons, we monitored <strong>the</strong> colony to record<br />
clutch initiation dates, clutch sizes, and <strong>the</strong> number of fledged young per active pair. From<br />
February-April 2008 (before egg laying), we used a spotting scope (×30) and binoculars<br />
(×10) to search for tagged birds and locate nest-sites (i.e., window ledges). Birds were<br />
captured at night and most tags were removed between 1 March and 15 April period<br />
(before egg-laying). At <strong>the</strong> time of capture, selected body measurements and mass were<br />
recorded.<br />
During <strong>the</strong> 2007 and 2008 nesting seasons, a blood sample (0.5 ml) was taken <strong>from</strong><br />
each nestling and immediately refrigerated. To minimize possible effects of circadian<br />
rhythms on parameter levels, all blood samples were collected between 08:00 and 14:00<br />
hours. Within 6 hrs of sampling, blood samples were centrifuged for 10 min at 4500 g, and<br />
<strong>the</strong> plasma was separated and stored at -20ºC. Plasma was analyzed for triglycerides,<br />
cholesterol, urea, and uric acid using a Screen Point autoanaliser (Hospitex Diagnostics,<br />
Sesto Fiorentino, Italy), and commercial kits <strong>from</strong> Biolabo labs (Maizy, France). Plasma<br />
biochemical analyses were performed by Wildvets S.L.P. (Seville, Spain).<br />
Statistical analices<br />
We used two-way ANOVA to test for differences in <strong>the</strong> geolocator/body mass ratio (i.e.,<br />
harness/darvic included) during tagging (with sex and geolocator type as factors), and in<br />
<strong>the</strong> body mass of tagged versus untagged individuals (with sex as a factor). Because<br />
variables were not normally distributed, possible differences in clutch date, clutch size and<br />
productivity (number of fledged young) among groups were examined separately using<br />
Mann-Whitney U-tests. To avoid possible differences in productivity due to clutch size, we<br />
also assessed <strong>the</strong> productivity/clutch size ratio using Mann-Whitney U-tests. Given our<br />
small sample sizes, we calculated <strong>the</strong> statistical power (w, probability of obtaining a<br />
significant result when <strong>the</strong> hypo<strong>the</strong>sis is false) following <strong>the</strong> methodology employed by<br />
Jennions and Møller (2003), as well as <strong>the</strong> difference between effect size of our data (ES)<br />
and effect size required to be detected with high power (0.80) given our sample sizes<br />
(ESmin). Tests for possible differences in <strong>the</strong> breeding parameters (clutch date, clutch size,<br />
fledged young, and productivity/clutch size ratio) of tagged and untagged birds were one-<br />
tailed because <strong>the</strong> geolocators effect was expected to be negative. For comparison of <strong>the</strong><br />
39
possible effects of attachment method (harnesses and rings) on breeding parameters, tests<br />
were two-tailed because no directional change was expected. We used Linear Mixed Models<br />
to test <strong>the</strong> possible effects of parental status (geolocators vs. controls) on <strong>the</strong> body<br />
condition (weight and plasma biochemical parameters) of nestlings. Age and <strong>the</strong> number of<br />
siblings were included as covariates, and nest identity as a random factor to avoid<br />
pseudoreplication. Age (in days) was estimated using <strong>the</strong> eighth primary (mm) according to<br />
<strong>the</strong> function AGE = 10.44 + 0.14*EIGHTH PRIMARY (Negro 1997). Biochemical variables<br />
were Log transformed when assumptions of parametric statistics (normality and<br />
homocedasticity) were not met. Adult recapture asynchrony during 2008 precluded a<br />
comparison of plasma biochemical parameters of tagged versus untagged adults. In 2008,<br />
pairs that included at least one <strong>kestrel</strong> that was tagged in 2007 were compared to <strong>the</strong><br />
remaining pairs in <strong>the</strong> colony.<br />
Results<br />
Because of <strong>the</strong> sexual size dimorphism, <strong>the</strong> attachments represented a greater burden for<br />
male Lesser Kestrels than females (F1, 16 = 61.8, P < 0.001), and harness attachments were<br />
heavier than those on darvic rings (F1, 16 = 154.1, P < 0.001) during tagging in 2007. No<br />
interaction between factors was detected (F1, 16 = 2.0, P = 0.18; Fig. 2). Small sample size of<br />
returning birds precluded assessment of <strong>the</strong>se differences in 2008, but <strong>the</strong> pattern was<br />
similar to that in 2007 (Fig. 2).<br />
Fifteen of 20 birds (75%) tagged in 2007 were re-sighted in <strong>the</strong> colony during <strong>the</strong><br />
2008 breeding season, with 14 of those 15 re-captured and 13 geolocators recovered (see<br />
below). Despite differences in geolocator/body mass ratios, return rates of <strong>the</strong> birds did not<br />
differ with ei<strong>the</strong>r attachment type (seven harnesses and eight darvic rings) or sex (eight<br />
males and seven females). We found no difference in <strong>the</strong> body mass of tagged and untagged<br />
individuals during <strong>the</strong> 2008 pre-laying period (F1, 35 = 0.08, P = 0.79; Fig. 3).<br />
Only one <strong>kestrel</strong> had an injury at <strong>the</strong> time of recovery. This bird, a female, had a small<br />
wound on <strong>the</strong> breast, probably due to a bad harness fit. When we removed her harness, <strong>the</strong><br />
frontal knot was partly embedded in <strong>the</strong> underlying tissue (Fig. 1D). In addition, one male<br />
fitted with a leg-mounted geolocator was found apparently exhausted in late summer, two<br />
months after being banded, and well after his brood of five nestlings had fledged. This male<br />
was found 140 km north of <strong>the</strong> colony by a private citizen, and admitted to a wildlife<br />
rehabilitation center. After about six months, it was released on 2 February 2008 with <strong>the</strong><br />
40
geolocator removed. This individual returned to <strong>the</strong> silo colony and successfully fledged<br />
three young in 2008.<br />
At least 10 of <strong>the</strong> returned and tagged <strong>kestrel</strong>s bred successfully in 2008, rearing at<br />
least one fledgling (this time without <strong>the</strong> geolocators because <strong>the</strong>y were all removed). The<br />
remaining five individuals were captured or sighted in <strong>the</strong> colony before <strong>the</strong> egg-laying<br />
period (February-April), but we were not able to determine if <strong>the</strong>y bred. In 2008, most<br />
previously tagged birds (N = 8) paired with a different mate. However, one pair of <strong>kestrel</strong>s<br />
remained toge<strong>the</strong>r and nested in <strong>the</strong> same cavity as in 2007.<br />
We found no significant differences between pairs with attachments and controls in<br />
clutch size and number of fledged young (Table 1). In 2008, <strong>the</strong> productivity/clutch size<br />
ratio varied (Table 1), but clutch initiation date did not differ between experimental groups<br />
(U = 33.0, P = 0.29, w = 18.7 %, ES-ESmin = -0.87). As expected (because birds to be tagged<br />
were captured after hatching and pairs were randomly selected), we detected no<br />
differences in clutch sizes between pairs with tags and control pairs during <strong>the</strong> 2007<br />
breeding season. However, marginal significant differences were detected in clutch size and<br />
<strong>the</strong> number of young fledged for pairs with different attachment methods (Table 2). Pairs<br />
with harness attachments had a lower breeding success, although <strong>the</strong> productivity/clutch<br />
size ratio was similar (Table 2). During <strong>the</strong> 2008 nesting season, nestlings of tagged pairs<br />
had higher concentrations of triglycerides and uric acid than nestlings of untagged birds,<br />
but <strong>the</strong> body mass of nestlings was similar between experimental groups (Table 3).<br />
When recovered, some geolocators were damaged. All leg-mounted geolocators (N =<br />
7) had scratches, peck marks, and dirt, and three had been destroyed. However, geolocators<br />
mounted on harnesses had no scratches or dirt (N = 6), and only one had been damaged<br />
(missing light sensor).<br />
Discussion<br />
Light-level geolocator tags representing 1.4-2.7% of body mass did not affect <strong>the</strong> breeding<br />
success of adult Lesser Kestrels in our study during <strong>the</strong> year <strong>the</strong>y were tagged. Similarly,<br />
previous studies have revealed no effects of 3-5 g tail-mounted radio-tags on breeding<br />
Lesser Kestrels (Hiraldo et al. 1994), and of back-mounted radio-tags on o<strong>the</strong>r falcons<br />
(Vekasy et al. 1996) during <strong>the</strong> year of marking, as well as <strong>the</strong> general recommendation<br />
establishing that device load should not exceed 4-5% of body mass (Kenward 2001).<br />
However, pairs of Lesser Kestrels with at least one tagged member fledged fewer young in<br />
41
<strong>the</strong> following breeding season. Such results are difficult to explain because we found no<br />
differences in body mass between tagged and untagged birds during <strong>the</strong> 2008 pre-laying<br />
period, but <strong>the</strong> difference in fledging rates may be related to annual environmental<br />
conditions. Mean breeding success for <strong>the</strong> entire colony (fledged young per breeding<br />
attempt) was higher in 2007 (3.21 ± 1.25, N = 25) than in 2008 (2.84 ± 1.66, N = 31), as was<br />
<strong>the</strong> mean body mass of fledglings. Thus, when conditions were favorable, no effects of<br />
geolocators were detected (2007), but, with less favorable conditions, <strong>the</strong>ir effects may<br />
have been more apparent (Murray and Fuller 2000).<br />
The productivity/clutch size ratio did not vary for pairs of <strong>kestrel</strong>s with different<br />
attachment methods (i.e., harnesses and darvic rings), suggesting that <strong>the</strong> marginal<br />
differences in clutch size and productivity may have been due to <strong>the</strong> small sample size (note<br />
that clutch size was recorded before tagging <strong>kestrel</strong>s; see Table 2). In addition, <strong>the</strong> high<br />
return rates in 2008 suggest that geolocator attachment had little or no effect on <strong>kestrel</strong><br />
flight capacity. In fact, return rates in our study were similar to those reported in a previous<br />
and larger study of <strong>the</strong> same population (Hiraldo et al. 1996; see also Negro 1997). Given<br />
that breeding success and return rates were not affected by attachment type (harnesses or<br />
darvic plastic rings), we recommend <strong>the</strong> use of back-mounts (at least for raptors or o<strong>the</strong>r<br />
species with strong bills), even though <strong>the</strong>y are slightly heavier and attaching <strong>the</strong>m requires<br />
more skill than leg-mounted geolocators. Back-mounted geolocators have provided crucial<br />
information concerning <strong>the</strong> wintering areas of this <strong>threatened</strong> <strong>kestrel</strong>. However, most leg-<br />
mounted geolocators in our study were heavily damaged and dirty when recovered and did<br />
not provide usable data (Rodríguez et al. in press).<br />
The apparent similarity in nestling condition (nestling body mass was similar<br />
between experimental groups) suggests that <strong>the</strong> higher concentrations of triglycerides and<br />
uric acid in nestlings of tagged pairs might be due to differences in types of prey delivered<br />
to <strong>the</strong> nest, possibley a consequence of a post-tagging effect of geolocators on <strong>the</strong> behavior<br />
of parents. Prey delivery rates of radio-tagged and untagged adults were similar in o<strong>the</strong>r<br />
studies involving this and o<strong>the</strong>r species (Hiraldo et al. 1994, Vekasy et al. 1996), but <strong>the</strong><br />
types of prey brought to <strong>the</strong> nest differed between <strong>the</strong> two experimental groups (Vekasy et<br />
al. 1996). Ano<strong>the</strong>r possible explanation, not mutually exclusive, is that tagged birds<br />
incurred a delayed handicap during <strong>the</strong> 2008 mating season and, as a result, might have<br />
been more likely to mate with poor quality individuals. In support of this conclusion, we<br />
found that differences were not significant in 2007 when pairing occurred before<br />
attachment of <strong>the</strong> geolocators.<br />
42
To date, <strong>the</strong> use of light level geolocators to investigate <strong>the</strong> migratory strategies of<br />
birds has largely been limited to relatively large species (Croxall et al. 2005, Eichhorn et al.<br />
2006, Shaffer et al. 2006, González-Solís et al. 2007). As <strong>the</strong>ir weight and size decreases,<br />
geolocators can be used on smaller species. However, <strong>the</strong>ir possible negative effects must<br />
be tested, especially with small species with greater attachment to bird mass ratios. To our<br />
knowledge, Lesser Kestrels are one of <strong>the</strong> lightest species in which <strong>the</strong>se loggers have been<br />
used so far and <strong>the</strong>ir effects evaluated (see Igual et al. 2005 and Rayner 2007 for larger<br />
species, and Stutchbury et al. 2009 for smaller ones). Despite of effects caused by<br />
geolocators during <strong>the</strong> following breeding season, we think that <strong>the</strong> provided information<br />
by <strong>the</strong>m in our study justifies its use, due to <strong>the</strong> lack of knowledge concerning migration<br />
and winter ecology (Rodríguez et al. in press). It should be noted that <strong>the</strong> species has a<br />
disappointingly low recovery rate of banded birds. Out of 37,000 Lesser Kestrels banded in<br />
Spain during <strong>the</strong> period 1973-2006, only two recoveries have been made in <strong>the</strong><br />
presumptive African winter quarters (Oficina de Especies Migratorias, pers. comm.). Lesser<br />
Kestrels are particularly well suited for using geolocation because this technique relies on<br />
<strong>the</strong> ease of recapturing of tagged birds after a protracted period of time. As with many<br />
seabirds, where use of geolocators is more common, adult Lesser Kestrels are extremely<br />
philopatric (Negro et al. 1997, Serrano et al. 2001) and tend to return to breed at <strong>the</strong> same<br />
colony where <strong>the</strong>y bred <strong>the</strong> previous year. O<strong>the</strong>r small raptors whose migration might be<br />
tracked using geolocation are <strong>the</strong> colonial Red-legged Falcons (Falco vespertinus) and Amur<br />
Falcons (F. amurensis), as well as small migratory owls, such as Scops Owls (Otus scops).<br />
However, loggers must be retrieved and downloaded, and <strong>the</strong>refore, <strong>the</strong> probability of<br />
recovery of fitted birds must be taken into account in <strong>the</strong> design of studies. In addition,<br />
researchers should evaluate <strong>the</strong> trade off between possible harmful effects on <strong>the</strong>ir model<br />
species and potential information that <strong>the</strong>y might obtain (Murray and Fuller 2000).<br />
Acknowledgments<br />
Thanks to M. de la Riva for his valuable advice about attachment methods and to B.<br />
Rodríguez, C. Rodríguez, G. Ritchison, and three anonymous reviewers for comments and<br />
corrections on <strong>the</strong> earlier drafts. Ring recovery data belong to Oficina de Especies<br />
Migratorias, Dirección General para la Biodiversidad, Ministerio de Medio Ambiente<br />
(Spanish Government). A.R. was supported by an I3P pre-doctoral fellowship <strong>from</strong> <strong>the</strong><br />
Spanish National Research Council (<strong>CSIC</strong>). This study was partially funded by a Proyecto de<br />
43
Excelencia de la Junta de Andalucía, HORUS Project # P06-RNM-01712, granted to J.<br />
Bustamante. The procedures used in this study comply with current Spanish laws on<br />
wildlife research.<br />
References<br />
Anich, N. M., T. J. Benson, & J. C. Bednarz. (2009) Effect of radio transmitters on return rates<br />
of Swainson’s Warblers. Journal of Field Ornithology 80: 206-211.<br />
Croxall, J.P., J.R.D. Silk, R.A. Phillips, V. Afanasyev, & D.R. Briggs. (2005) Global<br />
circumnavigations: tracking year-round ranges of nonbreeding albatrosses<br />
Science 307: 249-250.<br />
Eichhorn, G., V. Afasnasyev, R.H. Drent, & J.P. van der Jeud. (2006) Spring stopover routines<br />
in Russian Barnacle Geese Branta leucopsis tracked by resightings and geolocation.<br />
Ardea 94: 667-678.<br />
González-Solís, J., J.P. Croxall, D. Oro, & X. Ruiz. (2007) Trans-equatorial migration and<br />
mixing in <strong>the</strong> wintering areas of a pelagic seabird. Frontiers in Ecology and<br />
Environment 6: 297-301.<br />
Hill, R.D. (1994) Theory of geolocation by light levels. In: Elephant seals, population,<br />
ecology, behaviour and physiology (B.J. Le Boeuf & R.M. Laws, eds.), pp. 227-236.<br />
University of California Press, Berkeley, CA.<br />
Hiraldo, F., J.A. Donázar, & J.J. Negro. (1994) Effects of tail-mounted radio-tags on adult<br />
Lesser Kestrels. Journal of Field Ornithology 65: 466-471.<br />
Hiraldo, F., J.J. Negro, J.A. Donázar, & P. Gaona. (1996) A demographic model for a<br />
population of <strong>the</strong> endangered Lesser Kestrel in sou<strong>the</strong>rn Spain. Journal of Applied<br />
Ecology 33: 1085-1093.<br />
Igual, J.M., M G. Forero, G. Tavecchia, et al.. (2005) Short-term effects of data-loggers on<br />
Cory’s Shearwater (Calonectris diomedea). Marine Biology 146: 619-624.<br />
Jennions, M.D., & A.P. Møller. (2003) A survey of <strong>the</strong> statistical power of research in<br />
behavioral ecology and animal behavior. Behavioral Ecology 14: 438-445.<br />
Kenward, R.E. (2001) A manual for wildlife radiotagging. Academic Press, London, UK.<br />
Murray, D.L., & M.R. Fuller. (2000) A critical review of <strong>the</strong> effects of marking on <strong>the</strong> biology<br />
of vertebrates. In: Research techniques in animal ecology - controversies and<br />
consequences (L. Boitani & M.R. Fuller, eds.), pp. 15-64. Columbia University Press,<br />
New York, NY.<br />
44
Negro, J.J. (1997) Lesser Kestrel Falco naumanni. BWP Update 1: 49-56.<br />
Negro, J.J., F. Hiraldo, & J.A. Donázar. (1997) Causes of natal dispersal in <strong>the</strong> Lesser Kestrel:<br />
inbreeding avoidance or resource competition? Journal of Animal Ecology 66: 640-648.<br />
Rayner, M.J. (2007) Effects of dummy global location sensors on foraging behavior of Cook’s<br />
Petrel (Pterodroma cookie). Wilson Journal of Ornithology 119: 109-111.<br />
Reynolds, R.T., G.C. White, S.M. Joy, & R.W. Mannan. (2004) Effects of radiotransmitters on<br />
Nor<strong>the</strong>rn Goshawks: do tailmounts lower survival of breeding males? Journal of<br />
Wildlife Management 68: 25-32.<br />
Rodríguez, A., J.J. Negro, J. Bustamante, J.W. Fox, & V. Afanasyev. (2009) Geolocators map <strong>the</strong><br />
wintering grounds of <strong>threatened</strong> Lesser Kestrels in Africa. Diversity & Distributions 15:<br />
1010-1016.<br />
Serrano, D., J.L. Tella, M.G. Forero, & J.A. Donázar. (2001) Factors affecting breeding<br />
dispersal in <strong>the</strong> facultatively colonial Lesser Kestrel: individual experience vs.<br />
conspecific cues. Journal of Animal Ecology 70: 568-578.<br />
Shaffer, S.A., Y. Tremblay, H. Weimerskirch, et al. (2006) Migratory shearwaters integrate<br />
oceanic resources across <strong>the</strong> Pacific Ocean in an endless summer. Proceedings of <strong>the</strong><br />
National Academy of Sciences USA 103: 12799-12802.<br />
Steenhof, K., K.K. Bates, M.R. Fuller, et al. (2006) Effects of radiomarking on Prairie Falcons:<br />
attachment failures provide insights about survival. Wildlife Society Bulletin 34: 116-<br />
126.<br />
Stutchbury, B.J.M., S.A. Tarof, T. Done, et al. (2009) Tracking long-distance songbird<br />
migration by using geolocators. Science 323: 896.<br />
Terhune, T.M., D.C. Sisson, J.B. Grand, & H.L. Stribling. (2007) Factors influencing survival of<br />
radiotagged and banded Nor<strong>the</strong>rn Bobwhites in Georgia. Journal of Wildlife<br />
Management 71: 1288-1297.<br />
Vekasy, M.S., J.M. Marzluff, M.N. Kochert, R.N. Lekman, & K. Steenhof. (1996) Influence of<br />
radio transmitters on Prairie Falcons. Journal of Field Ornithology 67: 680-690.<br />
Whidden, S.R., C.T. Williams, A.R. Breton, & C.L. Buck. (2007) Effects of transmitters on <strong>the</strong><br />
reproductive success of Tufted Puffins. Journal of Field Ornithology 78: 206-212.<br />
45
Tables<br />
Table 1 Breeding parameters of geolocator-tagged and control Lesser Kestrel Falco naumanni pairs at <strong>the</strong> Silo colony (Huelva province,<br />
sou<strong>the</strong>rn Spain). Geolocator were deployed during <strong>the</strong> 2007 hatchling and 2008 before egg-laying period. In 2007, clutches were<br />
recorded before tagging <strong>kestrel</strong>s, while in 2008, breeding parameters were recorded after deployment (see ‘Methods’). Statistical and P-<br />
values are shown.<br />
Controls Geolocator<br />
U-test P-Value Power % Es-Esmin<br />
Mean SD N Mean SD N<br />
2007<br />
Clutch size 4.36 0.76 14 4.20 1.03 10 67.5 0.34 10.9 -0.886<br />
Fledged young 2.93 1.39 14 3.60 0.97 10 58.5 0.18 36.8 -0.504<br />
Productivity/clutch size ratio 0.69 0.32 14 0.86 0.15 10 54.0 0.13 47.9 -0.383<br />
2008<br />
Clutch size 4.00 0.82 10 4.50 0.76 8 26.0 0.12 35.6 -0.601<br />
Fledged young 3.70 1.06 10 3.25 1.04 8 33.0 0.29 21.8 -0.804<br />
Productivity/clutch size ratio 0.92 0.14 10 0.70 0.16 8 16.0 0.017 90.4 0.23
Table 2 Breeding parameters of Lesser Kestrel pairs tagged with ei<strong>the</strong>r harnesses or darvic rings at <strong>the</strong> Silo colony (Huelva province,<br />
sou<strong>the</strong>rn Spain) in 2007. Clutch sizes were recorded before tagging <strong>kestrel</strong>s (see ‘Methods’).<br />
Harnesses Darvic rings<br />
U-test P-values Power % ES-Esmin<br />
Mean SD N Mean SD N<br />
Clutch size 3.60 0.89 5 4.80 0.84 5 4.0 0.095 48.7 -0.637<br />
Fledged young 3.00 0.71 5 4.20 0.84 5 3.5 0.055 57.3 -0.481<br />
0.84 0.15 5 0.88 0.16 5 11.0 0.84 6.5 -1.766<br />
Productivity/clut<br />
ch size ratio
Table 3 Summary statistics and linear mixed model results (using ‘age’ and ‘number of siblings’ as fixed factors and ‘nest identity’ as<br />
random factor) of plasma biochemical parameters and mass of nestling Lesser Kestrels <strong>from</strong> control versus geolocator-attached pairs.<br />
Confidence<br />
Control Geolocator<br />
F P<br />
Biochemistry parameters<br />
intervals<br />
Mean SD N Mean SD N<br />
2007<br />
Mass (g) 151.3 19.0 42 149.9 13.4 36 1.97 0.18 [-4.02 , 20.25]<br />
Triglycerides a (mg dl -1 ) 341.4 210.2 39 335.1 229.5 36 0.24 0.63 [-0.13 , 0.21]<br />
Cholesterol a (mg dl -1) 190.6 67.4 37 191.5 48.4 36 0.02 0.90 [-0.10 , 0.11]<br />
Urea (mg dl -1 ) 14.3 3.5 36 12.6 4.2 36 2.97 0.10 [-0.43 , 4.16]<br />
Uric acid (mg dl -1 ) 16.4 5.6 35 15.4 6.0 35 0.46 0.51 [-2.85 , 5.58]<br />
2008<br />
Mass (g) 145.2 20.3 34 144.3 15.2 27 0.02 0.90 [-15.3 , 13.6]<br />
Triglycerides a (mg dl -1 ) 226.5 168.7 29 292.7 120.1 26 11.3 0.005 [-0.39 , -0.08]<br />
Cholesterol a (mg dl -1 ) 200.2 44.9 29 226.5 47.2 26 2.89 0.12 [-0.12 , 0.01]<br />
Urea (mg dl -1 ) 15.8 7.0 29 21.7 9.7 26 4.25 0.06 [-12.1 , 0.31]<br />
Uric acid (mg dl -1 ) 16.7 5.2 29 19.8 5.5 25 7.80 0.018 [-8.28 , -0.96]<br />
a Variable Log transformed.
Figures<br />
Fig. 1 Adult female Lesser Kestrel Falco naumanni with a Mk14S geolocator attached in a<br />
Teflon harness (2007, fitting day). B, Adult male Lesser Kestrel with a geolocator attached<br />
in a Teflon harness (2008, at recovery after wintering and migration). C, Adult female<br />
Lesser Kestrel with a Mk14 geolocator attached in a darvic ring (2007, fitting day). The GLS<br />
unit dimensions are 21 × 6.5 × 9 mm excluding <strong>the</strong> sensor stalk. D, Small wound in <strong>the</strong><br />
breast of a female <strong>kestrel</strong>.<br />
49
Fig. 2 Geolocator masses (including <strong>the</strong> whole attachment, e.i. geolocators plus<br />
harness/darvic) in relation to body mass of Lesser Kestrels when <strong>the</strong>y were tagged (2007<br />
breeding season; grey boxes) and recaptured (early 2008 breeding season; white boxes).<br />
Numbers indicate sample sizes. Dotted internal line, solid line and box boundaries indicate<br />
mean, median, and 25% and 75% percentile values, respectively. * indicates classes in<br />
which a bird was not measured (see Results).<br />
50
Fig. 3 Body masses of tagged and untagged Lesser Kestrels during <strong>the</strong> pre-laying period (1<br />
March 2008 - 15 April 2008). Numbers indicate sample sizes. Dotted internal line, solid line,<br />
box boundaries and whisker caps indicate mean, median, 25% and 75% percentile values<br />
and 10% and 90% percentile values, respectively.<br />
51
53<br />
Chapter 3<br />
Using MHC markers to assign <strong>the</strong> geographic origin<br />
of migratory birds: <strong>examples</strong> <strong>from</strong> <strong>the</strong> <strong>threatened</strong><br />
<strong>lesser</strong> <strong>kestrel</strong><br />
Lesser <strong>kestrel</strong>s foraging on cattle at Senegal. Photo: Philippe Pilard<br />
Rodríguez, A., Alcaide, M., Negro, J.J. & Pilard, P. (2011) Using MHC markers to assign <strong>the</strong><br />
geographic origin of migratory birds: <strong>examples</strong> <strong>from</strong> <strong>the</strong> <strong>threatened</strong> <strong>lesser</strong> <strong>kestrel</strong>.<br />
Animal Conservation 14: 306-313.
Abstract<br />
Ga<strong>the</strong>ring knowledge about <strong>the</strong> migratory routes and wintering areas of <strong>threatened</strong><br />
populations is fundamental for <strong>the</strong>ir successful conservation. Here, we used a non-invasive<br />
approach that relies on MHC (Major Histocompatibility Complex) polymorphism to infer <strong>the</strong><br />
breeding origin of a long-distance migratory bird, <strong>the</strong> <strong>lesser</strong> <strong>kestrel</strong> Falco naumanni, in its<br />
most important wintering quarters in <strong>the</strong> Sub-Saharan Africa (Senegal and South Africa).<br />
Private alleles support a strong connectivity between wintering Senegalese and western<br />
European breeding populations. On <strong>the</strong> o<strong>the</strong>r hand, birds wintering in South Africa were<br />
genetically differentiated with respect to western European breeding populations and<br />
might <strong>the</strong>refore ga<strong>the</strong>r individuals <strong>from</strong> <strong>the</strong> Eastern distribution range. This study<br />
demonstrates that, at least at wide continental scales, MHC genes can be powerful intrinsic<br />
markers to study migration and migration connectivity, thus adding value to its role in<br />
conservation and management.<br />
54
Introduction<br />
Despite intensive ringing efforts during <strong>the</strong> last decades and <strong>the</strong> increasing number<br />
of studies in recent years using modern tracking techniques or intrinsic markers such as<br />
stable isotopes, trace elements or genetic markers (Webster et al. 2002, Hobson 2005, Wink<br />
2006, Coiffait et al. 2009), little is known about wintering and stopover sites of many<br />
migratory species (Marra et al. 2006, Faaborg et al. 2010). Given that limiting factors may<br />
act on migratory animals in both <strong>the</strong> breeding and wintering grounds, as well as through<br />
<strong>the</strong> migration routes (Newton 2004), information on population connectivity is crucial for<br />
<strong>the</strong> effective development of conservation and management initiatives of <strong>threatened</strong><br />
migratory species (Webster et al. 2002, Marra et al. 2006).<br />
Among popular genetic markers, mitochondrial DNA has been extensively used in<br />
phylogeographic studies to unravel spatial patterns of genetic differentiation in <strong>the</strong> wild.<br />
Compared to nuclear DNA, mutations in mitochondrial DNA markers become more rapidly<br />
fixed because of a four-times smaller effective population size and <strong>the</strong> possibility of being<br />
more effectively affected by selective sweeps (Ballard & Whitlock 2004). Thus, <strong>the</strong> utility of<br />
mitochondrial DNA markers to resolve evolutionarily significant units and decipher<br />
migratory routes is widely recognised (e.g. Banguera-Hinestroza et al. 2002, Stefanni &<br />
Thorley 2003, Lopes et al. 2008, Perego et al. 2009). Never<strong>the</strong>less, a single locus approach<br />
that can be affected by <strong>the</strong> co-amplification of nuclear insertions of <strong>the</strong> mitochondrial<br />
genome (i.e. numts; Mindell 1997), genetic introgression and sex-biased dispersal may<br />
sometimes complicate and even confound analyses (e.g. Rubinoff & Holland 2005, Hurst &<br />
Jiggins 2005). Although mtDNA markers are greatly useful at vast geographical scales, <strong>the</strong>ir<br />
resolution power at smaller geographical scales has proven unsuccessful in several studies<br />
as well (e.g. Lovette et al. 2004, Wink et al. 2004, Lopes et al. 2008). Multilocus genotypes<br />
based on polymorphic microsatellite markers have become a popular alternative during <strong>the</strong><br />
last two decades (e.g. Piry et al. 2004, Manel et al. 2005). Limited genetic differentiation,<br />
mostly attributed to homoplasy and back-mutation of microsatellites, has arisen, however,<br />
as an important shortcoming (Queney et al. 2001, Boulet & Norris 2006). In fact, several<br />
studies have documented low occurrence of private alleles even at vast geographical scales<br />
(e.g. Mank & Avise 2003, Alcaide et al. 2008).<br />
Despite being widely considered as a classic candidate to reflect local adaptations,<br />
studies testing <strong>the</strong> suitability of <strong>the</strong> Major Histocompatibility Complex (MHC) to identify <strong>the</strong><br />
origin of captive or vagrant individuals are surprisingly scarce in <strong>the</strong> literature. As far as we<br />
know, MHC markers have only been used for genetic stock identification of salmons to take<br />
55
appropriate fishery management decisions (Beacham et al. 2001, 2004). The MHC is a<br />
multigene family that plays a crucial role during pathogen confrontation and clearance in<br />
jawed vertebrates. MHC genes code for cell-surface glycoproteins that bind and present<br />
short foreign peptides (antigens) to specialized CD4+ and CD8+ lymphocytes, thus,<br />
initiating <strong>the</strong> development of <strong>the</strong> adaptive immune response. Extraordinarily high levels of<br />
genetic polymorphisms are commonly found within those exons comprising <strong>the</strong> antigen-<br />
binding sites, being large repertoires of alleles maintained by some form of balancing<br />
selection (Sommer 2005, Piertney & Oliver 2006, Spurgin & Richardson 2010). The spatio-<br />
temporal distribution of MHC variation is expected to reflect pathogen-host co-evolutionary<br />
dynamics. Different populations may <strong>the</strong>refore exhibit contrasting frequencies of <strong>the</strong> fittest<br />
alleles to cope with local pathogen communities. The relative role of neutral evolutionary<br />
forces and natural selection on <strong>the</strong> distribution of MHC diversity never<strong>the</strong>less remains<br />
difficult to disentangle in detail (Alcaide 2010).<br />
In this study, we have tested <strong>the</strong> suitability of MHC markers to infer migratory<br />
connectivity in <strong>the</strong> globally vulnerable <strong>lesser</strong> <strong>kestrel</strong> Falco naumanni (BirdLife International<br />
2010). This long-distance migratory and colonial falcon breeds in mid-latitudes, <strong>from</strong> <strong>the</strong><br />
Iberian Peninsula to China, and winters mainly in <strong>the</strong> Sub-Saharan Africa (Fig. 1). It has<br />
been suggested that populations <strong>from</strong> different parts of <strong>the</strong> breeding range tend to remain<br />
separated during <strong>the</strong> winter season, Western-breeding populations migrating to West<br />
Africa and Eastern-breeding populations heading to South Africa (Moreau 1972). Although<br />
band recoveries, preliminary genetic analyses and tracking of <strong>kestrel</strong>s seem to support this<br />
pattern, no conclusive information has been provided so far (see Wink et al. 2004;<br />
Rodríguez et al. 2009, Mihoub et al. 2010). Previous analyses of genetic variation at a single<br />
MHC class II B gene of <strong>the</strong> <strong>lesser</strong> <strong>kestrel</strong> have revealed extensive genetic polymorphism<br />
(>100 alleles) and remarkable patterns of genetic differentiation between European and<br />
Asian breeding populations, including a considerable occurrence of private alleles (Alcaide<br />
et al. 2008, see Supporting Information 1). This pattern contrasted with relatively<br />
homogenous distributions of microsatellite alleles but was in agreement with geographic<br />
variation at fast evolving mitochondrial DNA sequences (Alcaide et al. 2008, see also Wink<br />
et al. 2004).<br />
Profiting <strong>from</strong> previous research, our main objective is to infer <strong>the</strong> breeding origin of<br />
<strong>the</strong> African wintering quarters of <strong>lesser</strong> <strong>kestrel</strong>s. To this aim, we sampled and MHC-typed<br />
naturally shed fea<strong>the</strong>rs <strong>from</strong> two African countries (Senegal and South Africa) known to<br />
host thousands of wintering <strong>lesser</strong> <strong>kestrel</strong>s in large communal roosts (up to 28,600 and<br />
118,000, respectively; LPO 2010, MKP 2010). These numbers roughly represent <strong>the</strong><br />
56
estimated population size of <strong>the</strong> species in its breeding range (about 140,000 individuals;<br />
BirdLife International 2010), and consequently, elucidating its breeding origin is a priority<br />
for <strong>the</strong> conservation of <strong>the</strong> <strong>lesser</strong> <strong>kestrel</strong>.<br />
Materials and Methods<br />
Non-invasive sampling of wintering grounds<br />
Moulted fea<strong>the</strong>rs were collected on <strong>the</strong> ground of two roost sites during a single visit in<br />
daylight hours (around 20 January 2007-2009) to avoid disturbing <strong>the</strong> birds. Fea<strong>the</strong>rs were<br />
kept in paper envelopes at room temperature until genetic analyses were carried out during<br />
<strong>the</strong> boreal winter of 2009/2010. Sampled roosts were located in Kaolack (14º08´N,<br />
16º05´W, Senegal), and in Phillipstown (30º26´S, 24º28´E, South Africa). These roosts are<br />
known to harbour more than 35,000 wintering <strong>lesser</strong> <strong>kestrel</strong>s (around 28,000 and 7,000<br />
individuals, respectively). Lesser <strong>kestrel</strong>s shared <strong>the</strong> Senegalese roost with swallow-tailed<br />
kites (Chelictinia riocourii) and <strong>the</strong> South African roost with con-generic falcons (red-footed<br />
falcon Falco vespertinus and Amur falcon Falco amurensis) (for more details see LPO 2010,<br />
MKP 2010).<br />
DNA extraction, MHC amplification and sequence analyses<br />
DNA extracts were obtained <strong>from</strong> tips and blood clots of moulted fea<strong>the</strong>rs (Horváth et al.<br />
2005) according to <strong>the</strong> HotSHOT protocol (Truett 2006). Information on sampling and DNA<br />
extraction <strong>from</strong> breeding locations is available in Alcaide et al. (2008). The second exon of a<br />
single and highly polymorphic MHC class II B gene (<strong>the</strong>reafter referred as Fana-DAB locus)<br />
was PCR-amplified and sequenced following Alcaide et al. (2008). Direct sequencing<br />
chromatograms were carefully inspected by eye and edited in BIOEDIT v7.0.5.3 (Hall 1999)<br />
and IUPAC (International Union of Pure and Applied Chemistry) nucleotide degenerate<br />
codes were introduced for each heterozygous site. MHC diploid genotypes were <strong>the</strong>n<br />
resolved into individual haplotypes using <strong>the</strong> Bayesian PHASE platform (Stephens &<br />
Donnelly 2003) implemented in DNASP v5 (Librado & Rozas 2009). For this purpose, we ran<br />
unphased genotypes jointly with a database containing more than 100 MHC class II alleles<br />
inferred through traditional cloning methods (Alcaide et al. 2007, 2008) and also through<br />
<strong>the</strong> investigation of allele segregation patterns <strong>from</strong> parents to offspring (M. A. unpublished<br />
57
data). Calculations were carried out over 1,000 iterations, 10 thinning interval and 1,000<br />
burn-in iterations. The information provided by PHASE is valuable because it permits us to<br />
assess <strong>the</strong> presence or absence of informative alleles <strong>from</strong> Western or Eastern breeding<br />
populations (see SI 1). In order to rule out <strong>the</strong> possibility of sampling <strong>the</strong> same individual<br />
more than once, we discarded those fea<strong>the</strong>rs reporting <strong>the</strong> same MHC genotype (fourteen<br />
cases corresponding to four individuals, see SI 2).<br />
Estimates of genetic differentiation between breeding and wintering populations<br />
Genetic differentiation between breeding and wintering grounds was calculated using <strong>the</strong><br />
nucleotide-sequence-based estimate of genetic differentiation KST in DNASP (Hudson et al.<br />
1992). Fur<strong>the</strong>rmore, we calculated an additional genetic measure based on allelic<br />
composition between sampling locations (Dest –Jost 2008), using <strong>the</strong> online programme<br />
SMOGD v2.6 (Crawford 2010). Both indexes range between 0 (no genetic differentiation;<br />
negative values should be treated as 0) and 1 (complete genetic differentiation). Statistical<br />
significance was only evaluated for KST index by permutating haplotypes among samples<br />
(9999 permutations). Given <strong>the</strong> extraordinary extent of genetic polymorphism at <strong>the</strong> Fana-<br />
DAB locus, <strong>the</strong> occurrence of identical alleles in different populations and <strong>the</strong> very low<br />
frequencies of <strong>the</strong> vast majority of alleles (see Alcaide et al. 2008; SI 1 & 2), we did not<br />
calculate assignment probabilities for individual birds. Instead, we evaluated whe<strong>the</strong>r<br />
wintering populations were more genetically related to ei<strong>the</strong>r European or Asian breeding<br />
populations.<br />
Results<br />
Out of <strong>the</strong> 174 fea<strong>the</strong>rs collected in <strong>the</strong> wintering roosts, 111 (64%) yielded no or weak PCR<br />
amplification, ruling out <strong>the</strong> sequencing of <strong>the</strong>se samples. Fea<strong>the</strong>rs collected in 2007 and<br />
2008 showed a lower amplification rate than <strong>the</strong> fea<strong>the</strong>rs collected in 2009 (Likelihood<br />
ratio test: G2 = 9.32, P < 0.009). No differences in PCR amplification success were detected<br />
between wintering roosts (Likelihood ratio test: G = 1.44, P = 0.23).<br />
Our PHASE-based inferences revealed 41 alleles unreported in <strong>the</strong> breeding areas.<br />
Overall, MHC genotypes permitted us to discriminate up to 27 and 25 genetically distinct<br />
individuals in <strong>the</strong> Senegalese and South African roost, respectively (SI 2). All but three birds<br />
(94%) were heterozygous at <strong>the</strong> Fana-DAB locus. The inferring of <strong>the</strong> gametic phase in<br />
58
<strong>the</strong>se individuals was highly useful to elucidate <strong>the</strong> breeding origin of <strong>the</strong> birds wintering in<br />
both geographical areas. Senegalese genotypes reported a high occurrence of alleles<br />
previously isolated <strong>from</strong> European breeding populations (Fig. 2 & SI 2). Twenty-two out of<br />
<strong>the</strong> 34 alleles (64.7%) inferred <strong>from</strong> <strong>the</strong> Senegalese roost have been previously isolated in<br />
European breeding populations (Fig. 3). In addition, <strong>the</strong> most abundant alleles within <strong>the</strong><br />
Senegalese roost (Fana2 = 16.6%, Fana1 = 7.4% and Fana19 = 5.56%) were also among <strong>the</strong><br />
most abundant alleles in Europe (see SI 1 & 2). None of <strong>the</strong> alleles isolated in Senegal<br />
corresponded to private alleles <strong>from</strong> <strong>the</strong> Eastern breeding distribution range. In contrast,<br />
only three out 37 South African alleles (8.1%) were previously isolated in European<br />
breeding populations. We found no trace of <strong>the</strong> commonest European alleles, but a high<br />
incidence of alleles unreported at <strong>the</strong> breeding grounds. An important fraction of <strong>the</strong> alleles<br />
isolated in South Africa (5 out 37 different alleles, 13.5 %) were exclusively found in<br />
breeding populations <strong>from</strong> <strong>the</strong> Eastern distribution range of <strong>the</strong> species (Fig. 3).<br />
According to our estimates of genetic differentiation (KST and Dest), Western and<br />
Central Mediterranean breeding populations were not significantly differentiated with<br />
respect to <strong>the</strong> Senegalese roost but were remarkably differentiated with respect to <strong>the</strong><br />
South African roost (Table 1). On <strong>the</strong> o<strong>the</strong>r hand, Israeli and Kazakhstani populations<br />
showed <strong>the</strong> highest degree of genetic differentiation when compared to Senegal and <strong>the</strong><br />
lowest, although still significant, when compared to South Africa (Table 1). Genetic<br />
differentiation between <strong>the</strong> Senegalese and South African roosts was relatively high and<br />
significant (KST = 0.0216, P = 0.0013; Dest = 0.928).<br />
Discussion<br />
Our genetic analyses show a compelling genetic resemblance between European breeding<br />
populations of <strong>lesser</strong> <strong>kestrel</strong>s and wintering ones in Senegal. Moreover, our results support<br />
previous findings that pinpointed South Africa as an important wintering ground of<br />
breeding birds <strong>from</strong> <strong>the</strong> Eastern distribution ra<strong>the</strong>r than European birds (Wink et al. 2004).<br />
Besides its relevance for <strong>the</strong> conservation of <strong>the</strong> globally vulnerable <strong>lesser</strong> <strong>kestrel</strong>, <strong>the</strong><br />
present study is one of <strong>the</strong> very few employing MHC markers to decipher <strong>the</strong> breeding<br />
origin of migrating organisms (Beacham et al. 2001, 2004) and <strong>the</strong> first study that has relied<br />
on MHC polymorphism to unravel migratory connectivity in birds. It demonstrates <strong>the</strong><br />
suitability of MHC markers to achieve or complement molecular studies aimed at tracking<br />
wildlife in <strong>the</strong> future. The use of MHC markers in combination with o<strong>the</strong>r intrinsic markers<br />
59
(trace elements, stable isotopes or o<strong>the</strong>r genetic markers) might thus significantly enhance<br />
our ability to infer migratory routes and trace <strong>the</strong> origin of captive stock or illegal trade (see<br />
Beacham et al. 2001, 2004; for similar studies in salmons).<br />
MHC as genetic marker<br />
The Fana-DAB locus worked relatively well for non-invasive samples. Importantly, <strong>the</strong><br />
collection of naturally shed fea<strong>the</strong>rs during day hours allowed us to avoid disturbing <strong>the</strong><br />
birds resting in overcrowded roosts at night. Fur<strong>the</strong>rmore, fea<strong>the</strong>r collection is a very<br />
straightforward task that provides a higher number of samples than non-destructive<br />
procedures involving capture and handling of birds (Taberlet et al. 1999). As an important<br />
pitfall, non-invasive samples usually contain degraded DNA that may result in an increased<br />
risk of genotyping errors and allele dropout (Taberlet et al. 1999, Segelbacher 2002). From<br />
<strong>the</strong> battery of individuals that we successfully genotyped, heterozygosity levels (0.94) fell in<br />
<strong>the</strong> range documented during previous studies based on <strong>the</strong> analysis of fresh blood samples<br />
(Alcaide et al. 2008, 2010). Consequently, we do not expect our results be affected by high<br />
rates of allele dropout. Contrary to microsatellites, MHC alleles are identical in size and<br />
preferential amplification of small against large alleles is not expected. Fur<strong>the</strong>rmore, <strong>the</strong><br />
relatively low size of polymorphic MHC exons (< 300 bp) make <strong>the</strong>se markers well suited<br />
for genetic approaches based on DNA degraded into short fragments (Taberlet et al. 1999).<br />
The high rates of PCR failure can be none<strong>the</strong>less associated with a high proportion of low<br />
quality samples (we could not even observe <strong>the</strong> blood clot in many of <strong>the</strong> sampled fea<strong>the</strong>rs)<br />
and poor storage conditions (Taberlet et al. 1999, Segelbacher 2002). In fact, we found<br />
significant evidence of higher amplification success for fea<strong>the</strong>rs collected in 2009 (with a<br />
shorter storage period at room temperature) than those ga<strong>the</strong>red during previous years.<br />
Compared to o<strong>the</strong>r nuclear markers, <strong>the</strong> Fana-DAB locus displays higher occurrence<br />
of private alleles than microsatellites and patterns of MHC structuring has shown to be as<br />
sharp as those revealed by fast evolving mitochondrial DNA sequences (see Wink et al.<br />
2004, Alcaide et al. 2008). We also experienced higher yields of MHC amplification over<br />
mitochondrial markers (authors’ unpublished data). Mitochondrial markers have also<br />
exhibited methodological problems related to <strong>the</strong> co-amplification of numts in this and<br />
o<strong>the</strong>r species (Mindell 1997, Alcaide et al. 2008). Although we cannot discard that this fact<br />
is due to intrinsic characteristics of <strong>the</strong> PCR profile, it is known that avian blood is a tissue<br />
rich in nuclear DNA (avian erythrocytes are nucleated) but relatively depleted of<br />
mitochondrial DNA. Higher yields during PCR amplification can <strong>the</strong>refore be expected when<br />
60
targeting nuclear markers on DNA extracts obtained <strong>from</strong> blood clots. However, working<br />
with MHC markers is not easy and several caveats must be highlighted. The<br />
characterization of MHC genes in non-model species, <strong>the</strong> co-amplification of different<br />
fragments of <strong>the</strong> multigene family during single PCR experiments and extensive levels of<br />
genetic polymorphism require a considerable set-up before using <strong>the</strong>se markers (reviewed<br />
by Babik 2010). However, we have to note that important advances for <strong>the</strong> amplification<br />
and genotyping of MHC genes in non model species have been developed (Babik 2010) and<br />
several studies have successfully reported <strong>the</strong> cross-amplification of MHC fragments across<br />
a wide diversity of avian species (e.g. Alcaide et al. 2007, 2009, Burri et al. 2008, Canal et al.,<br />
2010). Even though several studies have documented that MHC markers might be more<br />
genetically structured than o<strong>the</strong>r nuclear markers in some bird species (see for instance<br />
Ekblom et al. 2007, Alcaide et al. 2008, Loiseau et al. 2009), we cannot rule out <strong>the</strong> lack of<br />
spatial patterns of genetic differentiation in o<strong>the</strong>rs. It is well-known that balancing selection<br />
can mitigate <strong>the</strong> effects of genetic drift (e.g. van Oosterhout et al. 2006) and <strong>the</strong> retention of<br />
ancestral polymorphism has been documented, for instance, in passerines (Anmarkrud et<br />
al. 2010).<br />
The segregation of <strong>lesser</strong> <strong>kestrel</strong> breeding populations at wintering range<br />
The genetic data provided in this study agrees with previous assumptions and findings<br />
regarding patterns of migratory connectivity in <strong>the</strong> <strong>lesser</strong> <strong>kestrel</strong> (Moreau 1972, Wink et al.<br />
2004, Rodríguez et al. 2009). A loop migration for Western European breeding <strong>kestrel</strong>s has<br />
been hypo<strong>the</strong>sized to cross <strong>the</strong> Sahara desert in a wide front during <strong>the</strong> post-nuptial<br />
migration and to return through <strong>the</strong> Western Sahara and/or coastal Africa (Heim de Balsac<br />
& Mayaud 1962). Both population size estimates (LPO 2010) and our MHC inferences<br />
suggest that an admixture of individuals coming <strong>from</strong> different European breeding<br />
populations may compose <strong>the</strong> Senegalese roost. This hypo<strong>the</strong>sis would be in agreement<br />
with five recent ring recoveries as well (Mihoub et al. 2010). On <strong>the</strong> o<strong>the</strong>r hand, <strong>the</strong> lack of<br />
common European MHC alleles in <strong>the</strong> South African roost, <strong>the</strong> identification of private<br />
alleles <strong>from</strong> Asian populations, previous research relying on mitochondrial cytb sequences<br />
(Wink et al. 2004) and several ring recoveries (Rodríguez et al. 2009) point towards a<br />
connection between South African roosts and breeding populations <strong>from</strong> <strong>the</strong> Eastern<br />
distribution range. The relatively high levels of genetic differentiation between <strong>the</strong> South<br />
African roost and <strong>the</strong> Asian populations <strong>from</strong> which we had MHC data could be explained by<br />
<strong>the</strong> congregation of wintering birds <strong>from</strong> non-sampled and maybe genetically structured<br />
61
eeding populations <strong>from</strong> <strong>the</strong> Eastern distribution range. In fact, <strong>the</strong> number of birds<br />
wintering in South Africa is fivefold that wintering in West Africa (LPO 2010, MKP 2010).<br />
Therefore, it would be crucial to elucidate whe<strong>the</strong>r <strong>kestrel</strong>s of different roosting flocks<br />
originate <strong>from</strong> <strong>the</strong> same Eastern breeding areas. In this respect, it is important to notice that<br />
an exclusive amino acid motif found at high frequencies in Kazakhstani birds by Alcaide et<br />
al. (2008), but lacking in European populations, was not found in any sampled fea<strong>the</strong>r <strong>from</strong><br />
<strong>the</strong> South African roost. Interestingly, this highly informative amino acid motif was found in<br />
<strong>the</strong> two alleles isolated <strong>from</strong> a museum specimen collected in Kenya in 1915 (deposited at<br />
<strong>the</strong> MCZ collection hosted by Harvard University; ID 78921; authors’ unpublished data),<br />
suggesting an Asian origin. More research in this region should be encouraged to clarify<br />
whe<strong>the</strong>r East African regions represent only migratory stopovers or if <strong>the</strong>y are likely to<br />
occasionally host large populations of wintering Asiatic birds, especially during those years<br />
when <strong>the</strong> South African wintering population decrease considerably (MKP 2010).<br />
Acknowledgments<br />
We are grateful to Migrating Kestrel Project volunteers, especially to Anthony van Zyl,<br />
Ronelle Visagie, Robert Lotze, Edwin Engelbrecht and Trevor Oertel for collecting fea<strong>the</strong>rs<br />
at <strong>the</strong> South African roosts, Scott V. Edwards and J.A. Trimble kindly for providing tissue<br />
<strong>from</strong> museum specimens, and three anonymous reviewers for improving <strong>the</strong> manuscript<br />
with <strong>the</strong>ir comments and suggestions. A.R. and M.A. contributed equally to this paper and<br />
<strong>the</strong>y were supported by I3P pre-doctoral and post-doctoral fellowships <strong>from</strong> <strong>the</strong> <strong>CSIC</strong> and<br />
MICINN, respectively. JJN wishes to acknowledge <strong>the</strong> financial contribution of Research<br />
Project CGL2006-07481 of <strong>the</strong> Spanish MICINN.<br />
References<br />
Anmarkrud, J.A., Johnsen, A., Bachmann, L. & Lifjeld, J.T. (2010) Ancestral polymorphism in<br />
exon 2 of bluethroat (Luscinia svecica) MHC class II B genes. Journal of Evolutionary<br />
Biology 23: 1206-1217.<br />
Alcaide, M. (2010) On <strong>the</strong> relative roles of selection and genetic drift shaping MHC variation.<br />
Molecular Ecology 19: 3842-3844.<br />
62
Alcaide, M., Edwards, S.V. & Negro, J.J. (2007) Characterization, polymorphism and<br />
evolution of MHC class II B genes in birds of prey. Jorunal of Molecular Evolution 65:<br />
541-554.<br />
Alcaide, M., Edwards, S.V., Negro, J.J., Serrano, D. & Tella, J.L. (2008) Extensive<br />
polymorphism and geographical variation at a positively selected MHC class IIB gene of<br />
<strong>the</strong> <strong>lesser</strong> <strong>kestrel</strong> (Falco naumanni). Molecular Ecology 17: 2652-2665.<br />
Alcaide, M., Edwards, S.V., Cadahía, L. & Negro, J.J. (2009) MHC class I genes of birds of prey:<br />
isolation, polymorphism and diversifying selection. Conservation Genetics 10: 1349-<br />
1355.<br />
Alcaide, M., Lemus, J.A., Blanco, G., et al. (2010) MHC diversity and differential exposure to<br />
pathogens in <strong>kestrel</strong>s (Aves: Falconidae). Molecular Ecology 19: 691-705.<br />
Babik, W. (2010) Methods for MHC genotyping in non-model vertebrates. Molecular Ecology<br />
Resources 10: 237-251.<br />
Ballard, J.W.O, & Whitlock M.C. (2004) The incomplete natural history of mitochondria.<br />
Molecular Ecology 13: 729-744.<br />
Banguera-Hinestroza, E., Cardenas, H., Ruiz-Garcia, M., et al. (2002) Molecular identification<br />
of evolutionarily significant units in <strong>the</strong> Amazon River dolphin Inia sp (Cetacea: Iniidae).<br />
Journal of Heredity 93, 312-322.<br />
Beacham, T.D., Candy, J.R., Supernault, K.J., et al. (2001) Evaluation and application of<br />
microsatellite and major histocompatibility complex variation for stock identification of<br />
coho salmon in British Columbia. Transactions of <strong>the</strong> American Fisheries Society 130:<br />
1116-1149.<br />
Beacham, T.D., Lapointe, M., Candy, J.R., Miller, K.M. & Withler, R.E. (2004) DNA in action:<br />
Rapid application of DNA variation to sockeye salmon fisheries management.<br />
Conservation Genetics 5: 411-416.<br />
BirdLife International. (2010) Falco naumanni. In: Birdlife species factsheet. At:<br />
http://www.birdlife.org (1 March 2010)<br />
Boulet, M. & Norris, D.R. (eds) (2006) Patterns of migratory connectivity in two nearctic-<br />
Neotropical songbirds: new insights <strong>from</strong> intrinsic markers. Ornithological Monographs<br />
61. Washington, USA: American Ornithologists’ Union.<br />
Burri, R., Niculita-Hirzel, H., Roulin, A. & Fumagalli, L. (2008) Isolation and characterization<br />
of major histocompatibility complex (MHC) class II B genes in <strong>the</strong> Barn owl (Aves: Tyto<br />
alba). Immunogenetics 60: 543-550.<br />
63
Canal, D., Alcaide, M., Anmarkrud, J.A. & Potti, J. (2010) Towards <strong>the</strong> simplification of MHC<br />
typing protocols: targeting classical MHC class II genes in a passerine, <strong>the</strong> pied flycatcher<br />
Ficedula hypoleuca. BMC Research Notes 3: 236.<br />
Coiffait, L., Redfern, C.P.F., Bevan, R.M., Newton, J. & Wolff, K. (2009) The use of intrinsic<br />
markers to study bird migration. Ringing & Migration 24: 169-174.<br />
Crawford, N.G. (2010) SMOGD: software for <strong>the</strong> measurement of genetic diversity.<br />
Molecular Ecology Resources 10: 556-557.<br />
Ekblom, R., Sæ<strong>the</strong>r, S.A., Jacobson, P., et al. (2007) Spatial patterns of MHC class II variation<br />
in <strong>the</strong> great snipe (Gallinago media). Molecular Ecology 16: 1439-1451.<br />
Faaborg, J., Holmes, R.T., Anders, A.D., et al. (2010) Conserving migratory land birds in <strong>the</strong><br />
New World: Do we know enough? Ecological Applications 20: 398-418.<br />
Hall, T.A. (1999) BioEdit: a user-friendly biological sequence alignment editor and analysis<br />
program for Windows 95/98/NT. Nucleics Acids Symposium Series 41: 95-98.<br />
Heim de Balsac, H. & Mayaud, N. (1962) Les Oiseaux du Nord Ouest de L’Afrique: Distribution<br />
geográphique, Ecologie, Migrations, Reproduction. Paris, France: Ed. Paul Lechavalier.<br />
Hobson, K.A. (2005) Stables isotopes and <strong>the</strong> determination of avian migratory connectivity<br />
and seasonal interactions. Auk 122: 1037-1048.<br />
Horváth, M.B., Martinez-Cruz, B., Negro, J.J., Kalmar, L. & Godoy, J.A. (2005) An overlooked<br />
DNA source for non-invasive genetic analysis in birds. Journal of Avian Biology 36: 84-<br />
88.<br />
Hudson, R.R., Slatkin, M. & Maddison, W.P. (1992) Estimation of levels of gene flow <strong>from</strong><br />
DNA sequence data. Genetics 132: 583-589.<br />
Hurst, G.D.D. & Jiggins, F.M. (2005) Problems with mitochondrial DNA as a marker in<br />
population, phylogeographic and phylogenetic studies: <strong>the</strong> effects of inherited<br />
symbionts. Proceedings of <strong>the</strong> Royal Society of London B 272: 1525-1534.<br />
Jost, L. (2008) GST and its relatives do not measure differentiation. Molecular Ecology 17:<br />
4015-4026.<br />
Librado, P. & Rozas, J. (2009) DnaSP v5: A software for comprehensive analysis of DNA<br />
polymorphism data. Bioinformatics 25: 1451-1452.<br />
Loiseau, C., Richard, M., Garnier, S. et al., (2009) Diversifying selection on MHC class I in <strong>the</strong><br />
house sparrow (Passer domesticus). Molecular Ecology 18: 1331-1340.<br />
Lopes, R.J., Hortas, F. & Wennerberg, L. (2008). Geographical segregation in Dunlin Calidris<br />
alpina populations wintering along <strong>the</strong> East Atlantic migratory flyway – evidence <strong>from</strong><br />
mitochondrial DNA analysis. Diversity & Distributions 14: 732-741.<br />
64
Lovette, I.J., Clegg, S.M. & Smith, T.B. (2004) Limited utility of mtDNA markers for<br />
determining connectivity among breeding and overwintering locations in three<br />
neotropical migrant birds. Conservation Biology 18: 156-166.<br />
LPO. (2010) Ligue pour la Protection des Oiseaux. Dernieres nouvelles des faucons<br />
crecerellettes au Senegal. In: Faucon crecerellette. Ligue pour la Protection des Oiseaux.<br />
At: http://crecerellette.lpo.fr (1 March 2010).<br />
Manel, S., Gaggiotti, O.E. & Waples, R.S. (2005) Assignment methods: matching biological<br />
questions techniques with appropriate. Trends Ecoogy and Evolution 20: 136-142.<br />
Mank, J.E. & Avise, J.C. (2003) Microsatellite variation and differentiation in North Atlantic<br />
eels. Jorunal of Heredity 94: 310-314.<br />
Marra, P.P., Norris, D.R., Haig, S.M., Webster, M. & Royle J.A. (2006) Migration connectivity.<br />
In Connectivity Conservation:157-183. Crooks, K.R. & Sanjayan, M. (Eds.). New York:<br />
Cambridge University Press.<br />
MKP. (2010) Migrating Kestrel Project. At http://www.<strong>kestrel</strong>ing.com (1 March 2010)<br />
Mihoub, J-B., Gimenez, O., Pilard, P. & Sarrazin, F. (2010) Challenging conservation of<br />
migratory species: Sahelian rainfalls drive first-year survival of <strong>the</strong> vulnerable Lesser<br />
Kestrel Falco naumanni. Biological Conservation 143: 839-847.<br />
Mindell, D.P. (ed) (1997) Avian molecular evolution and systematics. San Diego, USA:<br />
Academic Press.<br />
Moreau, R.E. (1972) The Palearctic-African bird migration systems. London, UK: Academic<br />
Press.<br />
Newton, I. (2004) Population limitation in migrants. Ibis 146: 197-226.<br />
Perego, U.A., Achilli, A., Angerhofer, N., et al., (2009) Distinctive Paleo-Indian Migration<br />
Routes <strong>from</strong> Beringia Marked by Two Rare mtDNA Haplogroups. Current Biology 19: 1-<br />
8.<br />
Piertney, S.B. & Oliver, M.K. (2006) The evolutionary ecology of <strong>the</strong> major<br />
histocompatibility complex. Heredity 96: 7-21.<br />
Piry, S., Alapetite, A., Cornuet, J.M., et al. (2004) GENECLASS2: A software for genetic<br />
assignment and first-generation migrant detection. Jorunal of Heredity 95: 536-539.<br />
Queney, G., Ferrand, N., Weiss, S., et al. (2001). Stationary distributions of microsatellite loci<br />
between divergent population groups of <strong>the</strong> European rabbit (Oryctolagus cuniculus).<br />
Molecular Biology & Evolution 18: 2169-21.<br />
Rodríguez, A., Negro, J.J., Bustamante, J., Fox, J.W. & Afanasyev, V. (2009) Geolocators map<br />
<strong>the</strong> wintering grounds of <strong>threatened</strong> <strong>lesser</strong> <strong>kestrel</strong>s in Africa. Diversity & Distributions.<br />
15: 1010-1016.<br />
65
Rubinoff, D. & Holland, B.S. (2005) Between two extremes: Mitochondrial DNA is nei<strong>the</strong>r <strong>the</strong><br />
panacea nor <strong>the</strong> nemesis of phylogenetic and taxonomic inference. Systematic Biology<br />
54: 952-961.<br />
Segelbacher, G. (2002) Noninvasive genetic analysis in birds: testing reliability of fea<strong>the</strong>r<br />
samples. Molecular Ecology Notes 2: 367-369.<br />
Sommer, S. (2005) The importance of immune gene variability in evolutionary ecology and<br />
evolution. Frontiers in Zoology 2: 16.<br />
Spurgin, L.G. & Richardson, D.S. (2010) How pathogens drive genetic diversity: MHC,<br />
mechanisms and misunderstandings. Proceedings of <strong>the</strong> Royal Society of London B 277:<br />
979-988.<br />
Stefanni, S. & Thorley, J.L. (2003) Mitochondrial DNA phylogeography reveals <strong>the</strong> existence<br />
of an Evolutionarily Significant Unit of <strong>the</strong> sand goby Pomatoschistus minutus in <strong>the</strong><br />
Adriatic (Eastern Mediterranean). Molecular Phylogenetics & Evolution 28: 601-609.<br />
Stephens, M. & Donnelly, P. (2003) A comparison of bayesian methods for haplotype<br />
reconstruction <strong>from</strong> population genotype data. American Journal of Human Genetics 73:<br />
1162-1169.<br />
Taberlet, P., Waits, L.P. & Luikart, G. (1999) Noninvasive genetic sampling: look before you<br />
leap. Trends in Ecology & Evolution 14: 323-327.<br />
Truett, G.E. (2006) Preparation of genomic DNA <strong>from</strong> animal tissues. In DNA sequencing II:<br />
optimizing preparation and cleanup: 33-46. Kieleczawa, J. (Ed.). Sudbury, UK: Jones and<br />
Bartlett.<br />
van Oosterhout, C., Joyce, D.A., Cummings, S.M., et al. (2006) Balancing selection, random<br />
genetic drift, and genetic variation at <strong>the</strong> major histocompatibility complex in two wild<br />
populations of guppies (Poecilia reticulata). Evolution 60: 2562-2574.<br />
Webster, M.S., Marra, P.P., Haig, S.M., Bensch, S. & Holmes, R.T. (2002) Links between<br />
worlds: unravelling migratory connectivity. Trends in Ecology & Evolution 17: 76-83.<br />
Wink, M., Sauer-Gürth, H. & Pepler, D. (2004) Phylogeographic relationships of <strong>the</strong> Lesser<br />
Kestrel (Falco naumanni) in breeding and wintering quarters inferred <strong>from</strong> nucleotide<br />
sequences of <strong>the</strong> mitochondrial cytochrome b gene. In Raptors Worldwide: Chancelor,<br />
R.D. & Meyburg, B.-U. (Eds.). Berlin, Germany: WWGBP.<br />
Wink, M. (2006) Use of DNA markers to study bird migration. Journal of Ornithology 147:<br />
234-244.<br />
66
Tables<br />
Table 1 Estimates of genetic differentiation (KST and Dest) between breeding and wintering<br />
populations of <strong>lesser</strong> <strong>kestrel</strong>s. P-values for KST estimates are showed. Statistically significant<br />
values are indicated in bold.<br />
Population<br />
Senegal South Africa<br />
KST P-value Dest KST P-value Dest<br />
SW Spain 0.00227 0.25 -0.04427 0.03406
Figures<br />
Fig. 1 Distribution range of <strong>lesser</strong> <strong>kestrel</strong> Falco naumanni andsampled locations. Dark grey,<br />
red and green areas indicate breeding and wintering ranges and partially resident<br />
populations of <strong>lesser</strong> <strong>kestrel</strong>s; respectively (modified <strong>from</strong> BirdLife International, 2010).<br />
SWS = South West Spain; NES = North East Spain; FRA = France; ITA = Italy; GRE = Greece;<br />
ISR = Israel; KAZ = Kazakhstan; SEN = Senegal; SAF = South Africa; EAF = East Africa<br />
(specimens collected in Tanzania and Kenya and deposited at <strong>the</strong> Museum of Comparative<br />
Zoology Harvard University; IDs 133154 and 78921, respectively; see Discussion). Numbers<br />
indicate individuals sampled.<br />
68
Fig. 2 Number of individuals sampled in <strong>the</strong> Senegalese and South African roosts showing<br />
one (grey) or two alleles (black) present in each breeding populations. SWS = South West<br />
Spain; NES = North East Spain; FRA = France; ITA = Italy; GRE = Greece; ISR = Israel; KAZ =<br />
Kazakhstan.<br />
69
Fig. 3 Origin of alleles found in <strong>the</strong> wintering areas of <strong>lesser</strong> <strong>kestrel</strong>s (54 and 50 alleles in<br />
Senegal and South Africa, respectively). SWS; NES; FRA; ITA; ISR and KAZ indicate private<br />
alleles found in South West Spain; North East Spain; France; Italy; Israel and Kazakhstan;<br />
respectively. ‘Shared alleles’ and ‘Private alleles’ correspond to alleles present in several<br />
breeding areas and alleles not previously isolated in any breeding area, respectively (see SI<br />
1).<br />
Alleles (%)<br />
100<br />
80<br />
60<br />
40<br />
20<br />
0<br />
Senegal South Africa<br />
70<br />
KAZ<br />
ISR<br />
ITA<br />
FRA<br />
NES<br />
SWS<br />
Shared alleles<br />
Private alleles
Supporting Information<br />
Table S1 Allelic frequencies in breeding and wintering populations of <strong>lesser</strong> <strong>kestrel</strong>s.<br />
Genbank accession numbers are shown. SWS = South West Spain; NES = North East Spain;<br />
FRA = France; ITA = Italy; GRE = Greece; ISR = Israel; KAZ = Kazakhstan; SEN = Senegal; SAF<br />
= South Africa.<br />
Allele SWS NES FRA ITA GRE ISR KAZ SEN SAF<br />
71<br />
Accesion<br />
number<br />
Fana1 0.04000 0.06000 0.12500 0.12500 0.09375 0 0 0.07407 0 EF370839<br />
Fana2 0.20000 0.16000 0.15625 0.18750 0.12500 0.02941 0 0.16667 0 EF370840<br />
Fana3 0.02000 0.02000 0.12500 0.12500 0.03125 0.02941 0 0.01852 0.02000 EF370841<br />
Fana4 0 0.02000 0 0 0 0 0 0.03704 0 EU107670<br />
Fana5 0 0.04000 0 0 0 0 0 0 0 EU107676<br />
Fana6 0 0.04000 0 0 0 0 0 0 0 EU107675<br />
Fana7 0.02000 0 0 0 0.06250 0 0 0.01852 0 EF370855<br />
Fana8 0.04000 0.08000 0.06250 0 0.03125 0 0 0.01852 0 EF370851<br />
Fana9 0.02000 0 0 0 0 0 0 0 0 EF370850<br />
Fana10 0.04000 0 0 0 0 0 0 0 0 EF370842<br />
Fana11 0.02000 0 0 0.03125 0 0 0 0 0 EF370848<br />
Fana12 0.02000 0.02000 0 0 0.03125 0.02941 0 0 0 EF370849<br />
Fana13 0.02000 0 0 0 0 0 0 0 0 EU107731<br />
Fana14 0 0 0 0 0.03125 0 0 0 0 EU107708<br />
Fana15 0 0 0.03125 0 0 0.02941 0 0 0 EU107669<br />
Fana16 0 0 0.03125 0 0 0 0 0 0 EU107716<br />
Fana17 0.02000 0 0 0 0 0 0 0 0 EU107729<br />
Fana18 0.02000 0 0 0 0 0 0 0 0 EF370852<br />
Fana19 0.12000 0.16000 0 0.06250 0 0.05882 0 0.05556 0 EF370854<br />
Fana20 0.02000 0 0 0 0 0 0 0 0 EF370853<br />
Fana21 0.02000 0 0 0 0 0 0 0.01852 0 EU107694<br />
Fana22 0 0 0 0 0 0 0 0.01852 0 EU107700<br />
Fana23 0 0 0.03125 0 0 0 0 0 0 EU107668<br />
Fana24 0 0.02000 0 0 0 0 0 0 0 EU107714<br />
Fana25 0 0.04000 0 0 0 0 0 0 0 EU107715<br />
Fana26 0 0 0 0.03125 0 0 0 0.03704 0 EU107703<br />
Fana27 0 0.02000 0 0 0 0 0 0 0 EF370847<br />
Fana28 0 0 0 0 0 0 0 0 0 EU107673<br />
Fana29 0 0 0.03125 0 0.09375 0 0 0.01852 0 EF370860<br />
Fana30 0.02000 0 0 0 0 0 0 0 0 EU107697<br />
Fana31 0.02000 0 0 0 0.03125 0 0 0.01852 0 EF370858<br />
Fana32 0.04000 0 0 0 0 0 0 0 0 EF370845<br />
Fana33 0 0.04000 0 0 0 0 0 0 0.02000 EF370844<br />
Fana35 0 0 0 0 0 0 0 0.03704 0.02000 EU107704<br />
Fana36 0.02000 0.06000 0 0.06250 0 0.14706 0 0.03704 0 EF370861<br />
Fana37 0 0.02000 0 0 0 0 0 0 0 EU107722
Fana38 0 0 0 0.03125 0 0 0 0 0 EU107684<br />
Fana39 0.04000 0 0 0 0 0 0 0 0 EU107743<br />
Fana40 0 0.02000 0 0 0 0 0 0 0 EU107734<br />
Fana42 0 0 0.03125 0 0 0.11765 0 0 0 EU107682<br />
Fana43 0 0 0 0 0 0.02941 0 0 0 EU107690<br />
Fana44 0 0 0 0 0 0.02941 0.08333 0 0 EU107724<br />
Fana45 0 0.02000 0 0 0 0 0 0 0 EU107702<br />
Fana46 0 0 0 0 0.06250 0 0 0 0 EU107691<br />
Fana47 0 0.02000 0 0 0 0 0 0 0 EU107680<br />
Fana48 0 0 0 0 0.03125 0 0 0 0 EU107733<br />
Fana49 0 0 0 0 0.03125 0 0 0 0 EU107727<br />
Fana50 0 0 0 0 0.06250 0 0 0 0 EU107726<br />
Fana51 0 0 0 0 0.06250 0 0 0 0 EU107725<br />
Fana52 0 0 0 0 0 0 0 0 0 EU107744<br />
Fana53 0 0 0 0 0.03125 0 0 0 0 EF370864<br />
Fana54 0 0 0.03125 0 0 0 0 0 0 EU107732<br />
Fana55 0 0 0.06250 0 0 0 0 0 0 EU107742<br />
Fana56 0 0 0.03125 0 0 0 0 0 0 EU107717<br />
Fana57 0 0 0.03125 0 0 0 0 0 0 EU107707<br />
Fana58 0 0 0 0.03125 0 0 0 0 0 EU107705<br />
Fana59 0 0 0 0 0 0.02941 0 0 0 EU107706<br />
Fana60 0.02000 0 0 0 0 0 0 0.01852 0 EU107740<br />
Fana61 0 0 0 0 0 0.02941 0 0 0 EU107745<br />
Fana62 0 0 0 0 0 0 0 0.01852 0 EU107741<br />
Fana65 0 0 0.06250 0 0 0 0 0.05556 0 EU107686<br />
Fana68 0.02000 0 0 0.03125 0 0 0 0 0 EF370843<br />
Fana69 0 0 0 0 0 0 0.08333 0 0.02000 EU107736<br />
Fana70 0.02000 0 0 0 0 0 0 0 0 EF370859<br />
Fana71 0 0 0 0.03125 0 0 0 0.01852 0.04000 EF370863<br />
Fana72 0 0 0 0 0 0 0 0 0 EU107681<br />
Fana73 0 0 0 0 0 0 0.08333 0 0 EU107701<br />
Fana75 0 0 0 0 0 0.02941 0 0 0 EU107687<br />
Fana76 0 0 0 0 0 0 0.08333 0 0 EU107735<br />
Fana77 0 0 0 0 0 0 0.16667 0 0 EU107712<br />
Fana78 0 0 0 0 0 0 0.08333 0 0 EU107688<br />
Fana79 0 0 0.03125 0 0 0 0 0 0 EU107739<br />
Fana81 0.02000 0.02000 0 0 0 0 0 0 0 EU107730<br />
Fana82 0.02000 0.02000 0 0 0.03125 0 0 0.03704 0 EF370856<br />
Fana83 0 0.04000 0 0 0 0 0 0.01852 0 EF370857<br />
Fana84 0 0 0 0 0.03125 0 0 0 0 EU107720<br />
Fana88 0 0 0 0 0 0 0 0.01852 0 EU107713<br />
Fana89 0 0.02000 0 0 0 0 0 0 0 EU107728<br />
Fana91 0.02000 0.02000 0 0 0 0 0 0 0 EU107693<br />
Fana94 0.02000 0 0 0 0 0 0 0 0 EU107677<br />
Fana97 0 0 0 0 0 0 0.08333 0 0 EU107696<br />
Fana98 0 0 0 0 0 0 0.08333 0 0 EU107689<br />
72
Fana99 0 0 0 0 0 0 0.08333 0 0 EU107746<br />
Fana100 0 0 0 0 0 0.08824 0 0 0.02000 EU107737<br />
Fana101 0 0 0 0 0 0.02941 0 0 0.08000 EU107699<br />
Fana102 0.02000 0 0 0 0 0 0 0 0 EU107698<br />
Fana103 0.02000 0 0 0 0 0 0 0 0 EU107719<br />
Fana104 0 0 0 0.03125 0 0 0 0 0 EU107718<br />
Fana105 0 0 0 0 0 0 0.08333 0 0 EU107674<br />
Fana106 0 0 0 0 0 0 0.08333 0 0 EU107723<br />
Fana107 0.02000 0 0 0 0 0 0 0 0 EU107738<br />
Fana108 0 0.02000 0 0 0 0 0 0 0 EU107683<br />
Fana109 0.02000 0 0 0 0 0 0 0 0 EU107672<br />
Fana110 0 0 0.06250 0 0 0 0 0 0 HQ402918<br />
Fana111 0 0 0.06250 0 0.03125 0 0 0 0 HQ402919<br />
Fana112 0 0 0 0.06250 0 0 0 0 0 HQ402920<br />
Fana113 0 0 0 0.03125 0 0.02941 0 0 0 HQ402921<br />
Fana114 0 0 0 0.06250 0 0 0 0 0 HQ418344<br />
Fana115 0 0 0 0.03125 0 0 0 0 0 HQ418345<br />
Fana116 0 0 0 0.03125 0.03125 0 0 0 0 HQ418346<br />
Fana117 0 0 0 0 0.03125 0 0 0 0 HQ418347<br />
Fana118 0 0 0 0 0.03125 0 0 0 0 HQ418348<br />
Fana119 0 0 0 0 0 0.08824 0 0 0.04000 HQ418349<br />
Fana120 0 0 0 0 0 0.02941 0 0 0 HQ418350<br />
Fana121 0 0 0 0 0 0.05882 0 0 0.06000 HQ418351<br />
Fana122 0 0 0 0 0 0.05882 0 0 0 HQ418352<br />
Fana123 0 0 0 0 0 0.02941 0 0 0 HQ418353<br />
Fana125 0 0 0 0 0 0 0 0.01852 0 HQ418354<br />
Fana126 0 0 0 0 0 0 0 0.01852 0 HQ418355<br />
Fana127 0 0 0 0 0 0 0 0.01852 0 HQ418356<br />
Fana128 0 0 0 0 0 0 0 0 0.02000 HQ418357<br />
Fana129 0 0 0 0 0 0 0 0 0.02000 HQ418358<br />
Fana130 0 0 0 0 0 0 0 0 0.02000 HQ418359<br />
Fana131 0 0 0 0 0 0 0 0 0.02000 HQ418360<br />
Fana132 0 0 0 0 0 0 0 0 0.04000 HQ418361<br />
Fana133 0 0 0 0 0 0 0 0 0.02000 HQ418362<br />
Fana134 0 0 0 0 0 0 0 0 0.02000 HQ418363<br />
Fana135 0 0 0 0 0 0 0 0 0.02000 HQ418364<br />
Fana136 0 0 0 0 0 0 0 0.01852 0 HQ418365<br />
Fana137 0 0 0 0 0 0 0 0.01852 0 HQ418366<br />
Fana138 0 0 0 0 0 0 0 0.01852 0 HQ418367<br />
Fana139 0 0 0 0 0 0 0 0.01852 0 HQ418368<br />
Fana140 0 0 0 0 0 0 0 0.01852 0 HQ418369<br />
Fana141 0 0 0 0 0 0 0 0.01852 0 HQ418370<br />
Fana142 0 0 0 0 0 0 0 0.01852 0 HQ418371<br />
Fana144 0 0 0 0 0 0 0 0.01852 0 HQ418372<br />
Fana145 0 0 0 0 0 0 0 0.01852 0 HQ418373<br />
Fana146 0 0 0 0 0 0 0 0 0.02000 HQ418374<br />
73
Fana147 0 0 0 0 0 0 0 0 0.04000 HQ418375<br />
Fana148 0 0 0 0 0 0 0 0 0.04000 HQ418376<br />
Fana149 0 0 0 0 0 0 0 0 0.02000 HQ418377<br />
Fana150 0 0 0 0 0 0 0 0.01852 0 HQ418378<br />
Fana151 0 0 0 0 0 0 0 0 0.02000 HQ418379<br />
Fana152 0 0 0 0 0 0 0 0 0.06000 HQ418380<br />
Fana153 0 0 0 0 0 0 0 0 0.02000 HQ418381<br />
Fana154 0 0 0 0 0 0 0 0 0.02000 HQ418382<br />
Fana155 0 0 0 0 0 0 0 0 0.02000 HQ418383<br />
Fana156 0 0 0 0 0 0 0 0 0.02000 HQ418384<br />
Fana157 0 0 0 0 0 0 0 0 0.02000 HQ418385<br />
Fana158 0 0 0 0 0 0 0 0 0.02000 HQ418386<br />
Fana159 0 0 0 0 0 0 0 0 0.02000 HQ418387<br />
Fana160 0 0 0 0 0 0 0 0 0.02000 HQ418388<br />
Fana161 0 0 0 0 0 0 0 0 0.02000 HQ418389<br />
Fana162 0 0 0 0 0 0 0 0 0.04000 HQ418390<br />
Fana163 0 0 0 0 0 0 0 0 0.02000 HQ418391<br />
Fana164 0 0 0 0 0 0 0 0 0.02000 HQ418392<br />
Fana167 0 0 0 0 0 0 0 0 0.02000 HQ418393<br />
Fana168<br />
Sample<br />
0 0 0 0 0 0 0 0 0.02000 HQ418394<br />
size<br />
(alleles)<br />
Nº<br />
50 50 32 32 32 34 12 54 50<br />
differen<br />
t alleles<br />
Nº<br />
31 24 17 17 21 20 11 34 37<br />
private<br />
alleles<br />
17 14 9 9 10 11 10 16 28<br />
74
Table S2 Genotypes of individuals <strong>from</strong> Senegal and South Africa and presence of alleles in<br />
<strong>the</strong> breeding populations. + = a shared allele with <strong>the</strong> breeding population; ++ = two shared<br />
alleles; SWS = South West Spain; NES = North East Spain; FRA = France; ITA = Italy; GRE =<br />
Greece; ISR = Israel; KAZ = Kazakhstan.<br />
Individual Genotype SWS NES FRA ITA GRE ISR KAZ<br />
Senegal<br />
2 Fana8; Fana71 + + + + +<br />
18 Fana1; Fana125 + + + + +<br />
35 Fana35; Fana126<br />
61; 64 Fana1; Fana7 ++ + + + ++<br />
69 Fana1; Fana136 + + + + +<br />
74; 87 Fana4; Fana137 +<br />
75 Fana65; Fana138 +<br />
76 Fana1; Fana26 + + + ++ +<br />
78 Fana2; Fana139 + + + + + +<br />
79 Fana26; Fana88 +<br />
80 Fana2; Fana82 ++ ++ + + ++ +<br />
81 Fana22; Fana140<br />
82 Fana2; Fana141 + + + + + +<br />
86 Fana2; Fana29 + + ++ + ++ +<br />
89 Fana4; Fana21 + +<br />
91 Fana36; Fana82 ++ ++ + + +<br />
92 Fana2; Fana142 + + + + + +<br />
93 Fana2; Fana3 ++ ++ ++ ++ ++ ++<br />
94 Fana19; Fana36 ++ ++ ++ ++<br />
99 Fana2; Fana19 ++ ++ + ++ + ++<br />
10 Fana31; Fana83 + + +<br />
102 Fana19; Fana60 ++ + + +<br />
103 Fana144; Fana145<br />
105 Fana35; Fana65 +<br />
108 Fana62; Fana127<br />
109 Fana2; Fana2 ++ ++ ++ ++ ++ ++<br />
83 Fana65; Fana150 +<br />
South Africa<br />
114 Fana69; Fana128 +<br />
115 Fana33; Fana129 +<br />
122 Fana130; Fana131<br />
123 Fana121; Fana132 +<br />
138 Fana101; Fana133 +<br />
221; 242; 246; 249; 254 Fana134; Fana135<br />
222; 226; 230; 231; 238 Fana100; Fana35 +<br />
152 Fana119; Fana121 ++<br />
153 Fana101; Fana146 +<br />
142 Fana147; Fana147<br />
144 Fana148; Fana148<br />
159 Fana101; Fana149 +<br />
140 Fana119; Fana151 +<br />
145 Fana152; Fana153<br />
146 Fana101; Fana154 +<br />
75
147; 151 Fana152; Fana155<br />
150 Fana156; Fana157<br />
155 Fana158; Fana159<br />
158 Fana152; Fana160<br />
160 Fana161; Fana162<br />
162 Fana3; Fana162 + + + + + +<br />
167 Fana163; Fana164<br />
112 Fana71; Fana71 ++<br />
113 Fana121; Fana132 +<br />
116 Fana167; Fana168<br />
76
77<br />
Chapter 4<br />
Sampling strategies for accurate computational<br />
inferences of gametic phase across highly<br />
polymorphic Major Histocompatibility Complex<br />
loci<br />
BioEdit panel display showing chromatograms and MHC sequences. Photo: Airam Rodríguez<br />
Alcaide, M., Rodríguez, A. & Negro, J.J. (2011) Sampling strategies for accurate<br />
computational inferences of gametic phase across highly polymorphic Major<br />
Histocompatibility Complex loci. BMC Research Notes 4: 151.
Abstract<br />
Genes of <strong>the</strong> Major Histocompatibility Complex (MHC) are very popular genetic markers<br />
among evolutionary biologists because of <strong>the</strong>ir potential role in pathogen confrontation and<br />
sexual selection. However, MHC genotyping still remains challenging and time-consuming<br />
in spite of substantial methodological advances. Although computational haplotype<br />
inference has brought into focus interesting alternatives, high heterozygosity, extensive<br />
genetic variation and population admixture are known to cause inaccuracies. We have<br />
investigated <strong>the</strong> role of sample size, genetic polymorphism and genetic structuring on <strong>the</strong><br />
performance of <strong>the</strong> popular Bayesian PHASE algorithm. To cover this aim, we took<br />
advantage of a large database of known genotypes (using traditional laboratory-based<br />
techniques) at single MHC class I (N=56 individuals and 50 alleles) and MHC class II B<br />
(N=103 individuals and 62 alleles) loci in <strong>the</strong> <strong>lesser</strong> <strong>kestrel</strong> Falco naumanni. Analyses<br />
carried out over real MHC genotypes showed that <strong>the</strong> accuracy of gametic phase<br />
reconstruction improved with sample size as a result of <strong>the</strong> reduction in <strong>the</strong> allele to<br />
individual ratio. We <strong>the</strong>n simulated different data sets introducing variations in this<br />
parameter to define an optimal ratio. Our results demonstrate a critical influence of <strong>the</strong><br />
allele to individual ratio on PHASE performance. We found that a minimum allele to<br />
individual ratio (1:2) yielded 100% accuracy for both MHC loci. Sampling effort is <strong>the</strong>refore<br />
a crucial step to obtain reliable MHC haplotype reconstructions and must be accomplished<br />
accordingly to <strong>the</strong> degree of MHC polymorphism. We expect our findings provide a foothold<br />
into <strong>the</strong> design of straightforward and cost-effective genotyping strategies of those MHC loci<br />
<strong>from</strong> which locus-specific primers are available.<br />
78
Introduction<br />
Highly polymorphic genes of <strong>the</strong> Major Histocompatibility Complex (MHC) have become<br />
very popular molecular markers among evolutionary biologists because of <strong>the</strong>ir traditional<br />
consideration as ‘good genes’ involved in pathogen resistance and sexual selection<br />
(Sommer 2005, Piertney & Oliver 2006). Despite a plethora of new methods and technical<br />
advances (Babik 2010), MHC genotyping still remains challenging and time-consuming.<br />
Recently, Bayesian computational inference of gametic phase coupled to Sanger sequencing<br />
of PCR amplicons has emerged as a promising alternative (Niu et al. 2002, Stephens et al.<br />
2001, Stephens & Donnelly 2003, Harrigan et al. 2008). These in-silico methods permit<br />
researchers to infer how multiple segregating sites are distributed within <strong>the</strong> same<br />
chromosome and are believed to provide haplotype information in a more straightforward<br />
and cost-effective way than laboratory-based methods such as cloning, non-denaturing gel<br />
electrophoresis and o<strong>the</strong>rs (Babik 2010). Even though extremely variable MHC loci<br />
subjected to <strong>the</strong> effects of natural selection violate several assumptions of <strong>the</strong> underlying<br />
neutral coalescent <strong>the</strong>ory (Stephens et al. 2001), computer packages such as PHASE have<br />
shown to perform admirably in many cases (Harrigan et al. 2008, Bos et al. 2007, Garrick et<br />
al. 2010). The current version of PHASE, that provides a biologically realistic prior for <strong>the</strong><br />
distribution of haplotypic frequencies (Stephens & Donnelly 2003), has become one of <strong>the</strong><br />
most preferred options among evolutionary biologist because of its good performance and<br />
<strong>the</strong> possibility to deal with gaps and polymorphic sites with up to four segregating sites.<br />
The accuracy of gametic phase inference has shown to be, however, very sensitive to high<br />
heterozygosity, large numbers of alleles and population admixture (e.g. Bos et al. 2007). The<br />
two first factors are particularly common among MHC genes, a fact that can explain low<br />
success rates for particular data sets (Bos et al. 2007). In spite of <strong>the</strong> cost and sample<br />
manipulation advantages put forward by <strong>the</strong>se approaches (Babik 2010), only a few studies<br />
(e.g. Bos et al. 2007, Bettencourt et al. 2008) have addressed in detail <strong>the</strong> relative role of<br />
different parameters on PHASE performance when working with highly polymorphic and<br />
recombining MHC loci usually exhibiting <strong>the</strong> genetic hallmarks of balancing and positive<br />
selection (i.e. excess of heterozygous sites and non-synonymous substitutions). In this<br />
study, we have taken advantage of a large database of MHC class I and class II genotypes<br />
built <strong>from</strong> traditional molecular cloning in <strong>the</strong> <strong>lesser</strong> <strong>kestrel</strong> Falco naumanni. Our mains<br />
goals were i) test <strong>the</strong> performance of analytical approaches to haplotype inference in <strong>the</strong><br />
<strong>kestrel</strong> MHC, and ii) evaluate <strong>the</strong> influence of sample size, genetic polymorphism and<br />
79
genetic structure on <strong>the</strong> accuracy of computational approaches dealing with phase-<br />
unknown diploid genotypes.<br />
Methods<br />
The MHC of <strong>the</strong> <strong>lesser</strong> <strong>kestrel</strong> is well suited for this study because of <strong>the</strong> specific<br />
amplification via <strong>the</strong> polymerase chain reaction (PCR) of single, highly polymorphic and<br />
positively selected MHC class I (exon 3) and MHC class II B (exon 2) loci (Alcaide et al. 2007,<br />
2009a). Both loci are 270 base pairs in length and encode for part of <strong>the</strong> antigen-binding<br />
region of MHC class I and MHC class II molecules, respectively. Heterozygosity has been<br />
shown to be extremely large in natural populations at both loci (>90%, Alcaide et al. 2008,<br />
2010a). A large proportion of <strong>the</strong> MHC alleles used in this study were isolated during<br />
previous studies and many o<strong>the</strong>rs are derived <strong>from</strong> ongoing research (Alcaide et al. 2007,<br />
2008, 2009a, 2010a, authors unpublished data, see additional file 1). The handling and<br />
sampling of <strong>the</strong> birds was done in accordance with Spanish laws concerning animal welfare,<br />
and under permission of <strong>the</strong> different National Governments.<br />
We created two data sets, one for each particular MHC locus. Overall, we ga<strong>the</strong>red<br />
<strong>the</strong> known genotypes of 56 heterozygous birds at <strong>the</strong> MHC class I locus and 103<br />
heterozygous individuals at <strong>the</strong> MHC class II B locus. Even though homozygous individuals<br />
at both loci have been reported we decided to exclude <strong>the</strong>m <strong>from</strong> our data sets as a means<br />
to create <strong>the</strong> most challenging scenario during <strong>the</strong> evaluation of <strong>the</strong> performance of <strong>the</strong><br />
PHASE algorithm. The two data sets encompassed 50 MHC class I and 62 MHC class II<br />
alleles, respectively (see Table 1 and additional files 1 and 2). For <strong>the</strong> MHC class I data set,<br />
only four and two alleles, respectively, showed frequencies beyond 5% and 10%. For <strong>the</strong><br />
MHC class II data set, only seven and three alleles, respectively, showed frequencies higher<br />
than 5% and 10%. The two data sets also represented different degrees of genetic<br />
structuring. In <strong>the</strong> case of <strong>the</strong> MHC class I, individual genotypes were obtained <strong>from</strong> birds<br />
captured in Spain, France, Italy, Greece and Israel and restrictions in gene flow are thus<br />
expected (see Alcaide et al. 2008). Individuals of <strong>the</strong> MHC class II data set were exclusively<br />
sampled <strong>from</strong> Spain, which can be essentially considered as a panmictic population<br />
according to both neutral and adaptive genetic data (Alcaide et al. 2008, 2009b). We created<br />
different sample subsets containing 8, 15, 30 or 45 individuals <strong>from</strong> <strong>the</strong> MHC class I data<br />
set. In <strong>the</strong> case of <strong>the</strong> MHC class II, sample subsets were composed of 8, 15, 30, 45, 60 or 75<br />
individuals. Five groups of individuals were randomly sub-sampled for each sample size.<br />
80
The knowledge of <strong>the</strong> real genotypes beforehand permitted us to generate those<br />
ambiguous DNA sequences resulting <strong>from</strong> <strong>the</strong> overlapping of <strong>the</strong> two alleles isolated per<br />
individual at each MHC locus (see additional file 2). These consensus DNA sequences were<br />
generated using <strong>the</strong> software BioEdit (Hall 1999). With this information, we performed a<br />
reverse approach through which analytical approaches relying on ambiguous diploid data<br />
would be validated with respect to <strong>the</strong> genotypes inferred using traditional laboratory-<br />
based techniques. Bayesian computational inference of MHC gametic phase was performed<br />
using <strong>the</strong> popular, user-friendly PHASE module implemented in <strong>the</strong> software DNAsp ver 5.0<br />
(Librado & Rozas 2009). Calculations were carried out over 1,000 iterations, 10 thinning<br />
interval and 1,000 burn-in iterations and considering a model that accounted for<br />
recombination. All <strong>the</strong> advanced options available for <strong>the</strong> algorithm were settled as default.<br />
PHASE accuracy was measured as <strong>the</strong> percentage of correctly assigned alleles. We<br />
concluded that <strong>the</strong> two alleles at each locus were correctly inferred when all nucleotide<br />
positions matched perfectly to those previously revealed by laboratory-based methods. To<br />
verify <strong>the</strong> identity of each allele, we took advantage of <strong>the</strong> output window provided by<br />
default by <strong>the</strong> software DNAsp 5.0 and we exported <strong>the</strong> alignment as a FASTA file<br />
subsequently handled in BioEdit.<br />
Results<br />
Our results show a remarkable influence of sample size on <strong>the</strong> accuracy of haplotypic<br />
inference using PHASE (Fig. 1). For both MHC loci, average accuracy improved along with<br />
sample size. The number of alleles not correctly inferred was proportional to <strong>the</strong> number of<br />
genotypes. This is due to fact that when PHASE failed to infer one of <strong>the</strong> two alleles <strong>from</strong> a<br />
given genotype it incorrectly inferred <strong>the</strong> sequence of <strong>the</strong> o<strong>the</strong>r allele as well (i.e. one or a<br />
few segregating sites where switched between <strong>the</strong> two alleles). Overall, PHASE errors were<br />
related to <strong>the</strong> incorrect calling of one or a few segregating sites, and at least, PHASE seemed<br />
to do ra<strong>the</strong>r well when inferring <strong>the</strong> allelic lineage. The increase of PHASE accuracy along<br />
with sample size can be attributed to <strong>the</strong> reduction in <strong>the</strong> ratio between <strong>the</strong> number of<br />
alleles occurring in <strong>the</strong> sample set and <strong>the</strong> number of individuals comprising that particular<br />
sample set. To get deeper insights about <strong>the</strong> influence of <strong>the</strong> allele to individual ratio, we<br />
created simulated data that introduced variations in this parameter. In <strong>the</strong>se simulations,<br />
we altered <strong>the</strong> allele-to-individual ratio for a sample size of 25 individuals and 40<br />
individuals for <strong>the</strong> MHC class I and class II locus, respectively. The simulated genotypes<br />
81
were heterozygous in all cases and we tried to distribute allele frequencies as equally as<br />
possible. Only in <strong>the</strong> case of <strong>the</strong> simulation of seven class I alleles (see Fig. 2) we repeated 4<br />
out <strong>the</strong> 25 heterozygous genotypes used in <strong>the</strong> same sample set. In <strong>the</strong> remaining cases, <strong>the</strong><br />
number of possible combinations of alleles in heterozygous form was larger than sample<br />
size (i.e. N=25 and N=40 for <strong>the</strong> MHC class I and class II data set, respectively). We added 15<br />
MHC class II B alleles isolated during previous studies (Alcaide et al. 2008, 2010a) in order<br />
to ga<strong>the</strong>r <strong>the</strong> 80 alleles needed for <strong>the</strong> 2:1 allele individual ratio. The manipulation of <strong>the</strong><br />
allele-to-individual ratio had a dramatic influence on PHASE performance (Fig. 2). For<br />
instance, <strong>the</strong> accuracy of computational inferences of MHC haplotypes was very poor when<br />
<strong>the</strong> number of alleles was twice than that of individuals. None<strong>the</strong>less, <strong>the</strong> performance of<br />
PHASE consistently increased along with <strong>the</strong> reduction of <strong>the</strong> allele to individual ratio. From<br />
<strong>the</strong> comparison between <strong>the</strong> two MHC data sets, and regardless of <strong>the</strong> degree of genetic<br />
structuring within <strong>the</strong> geographic area individuals were sampled <strong>from</strong>, we suggest a ratio<br />
allele to individual starting at (1:2).<br />
The main objective of this study was to provide useful information regarding <strong>the</strong><br />
number of individuals to be sampled, given a particular degree of genetic polymorphism, to<br />
computationally infer <strong>the</strong> gametic phase of MHC genes with reliability. Starting <strong>from</strong> a<br />
“worst-case” scenario similar to that used in our simulations (i.e. no occurrence of<br />
homozygous individuals and with homogenous distributions of allele frequencies), we<br />
recommend a first exploratory view of 25-30 individuals. Although PHASE can miscall<br />
nucleotides during <strong>the</strong> reconstruction of haplotypes, our experience suggests that <strong>the</strong><br />
overall number of alleles inferred is not very different <strong>from</strong> <strong>the</strong> actual number. Depending<br />
on <strong>the</strong> number of alleles inferred by PHASE, researchers might add more individuals until<br />
<strong>the</strong> allele to individual ratio reaches at least <strong>the</strong> 1:2 threshold. Sampling strategies must<br />
<strong>the</strong>refore be designed according to <strong>the</strong> extent of MHC polymorphisms found within a<br />
particular study population. Hopefully, researchers might find homozygous genotypes or<br />
genotypes comprised by alleles just differing in one or a few nucleotides during sampling.<br />
This might be indeed very useful regarding <strong>the</strong> verification of <strong>the</strong> set of inferred alleles. It is<br />
also advisable to ground-truth <strong>the</strong> data set by performing molecular cloning in a selected<br />
number of individuals. Molecular cloning, however, is extremely prone to report false<br />
polymorphisms and <strong>the</strong>refore, it is important to contrast cloned alleles with direct<br />
sequencing chromatograms. Special caveats should be considered in <strong>the</strong> case of<br />
synonymous diploid genotypes (i.e. different combinations of alleles can generate <strong>the</strong> same<br />
direct sequencing chromatogram). However, careful examination of our allele repertoire<br />
suggests that <strong>the</strong>se cases are rare in <strong>kestrel</strong>s (
aid of technologies such as conformational polymorphism analyses (e.g. Alcaide et al.<br />
2010b) may none<strong>the</strong>less become very useful to resolve <strong>the</strong>se particular cases. Researchers<br />
must pay special attention to generate high-quality direct sequencing chromatograms to<br />
minimize <strong>the</strong> risk of miscall double peaks. In this respect, <strong>the</strong> performance and location of<br />
sequencing primers as well as bi-directional sequencing must be carefully addressed.<br />
Finally, it is important to bear in mind that <strong>the</strong>se approaches can only be achieved when<br />
locus-specific primers are available (Bettinotti et al. 2003, Hughes et al. 2008, this study).<br />
That said, our better genomic knowledge of <strong>the</strong> MHC in both model and non-model species<br />
(e.g. Worley et al. 2008, Cloutier et al. 2011) forecasts an encouraging future in this respect.<br />
Acknowledgments<br />
During <strong>the</strong> development of <strong>the</strong> present study, MA and AR were supported by post-doctoral<br />
and I3P pre-doctoral fellowships <strong>from</strong> <strong>the</strong> MICINN of <strong>the</strong> Spanish Government and <strong>the</strong> <strong>CSIC</strong>,<br />
respectively. This study was supported by several research projects (Projects CGL2004-<br />
04120/BOS, CGL2006-07481/BOS and CGL2009-10652/BOS, and HORUS Project P06-<br />
RNM-01712).<br />
References<br />
Alcaide, M., Edwards, S.V. & Negro, J.J. (2007) Characterization, polymorphism, and<br />
evolution of MHC class II B genes in birds of prey. Journal of Molecular Evolution 65:<br />
541-554.<br />
Alcaide, M., Edwards, S.V., Negro, J.J., Serrano, D. & Tella, J.L. (2008) Extensive<br />
polymorphism and geographical variation at a positively selected MHC class II B gene<br />
of <strong>the</strong> <strong>lesser</strong> <strong>kestrel</strong> (Falco naumanni). Molecular Ecology 17: 2652-2665.<br />
Alcaide, M., Edwards, S.V., Cadahia, L. & Negro, J.J. (2009a) MHC class I genes of birds of<br />
prey: isolation, polymorphism and diversifying selection. Conservation Genetics 10:<br />
1349-1355.<br />
Alcaide, M., Serrano, D., Tella, J.L. & Negro, J.J. (2009b) Strong philopatry derived <strong>from</strong><br />
capture-recapture records does not lead to fine-scale genetic differentiation in <strong>lesser</strong><br />
<strong>kestrel</strong>s. Journal of Animal Ecology 78: 468-475.<br />
83
Alcaide, M., Lemus, J.A., Blanco, G., et al. (2010a) MHC diversity and differential exposure to<br />
pathogens in <strong>kestrel</strong>s (Aves: Falconidae). Molecular Ecology 19: 691-705.<br />
Alcaide, M., López, L., Tanferna, A., et al. (2010b) Simultaneous analysis of multiple PCR<br />
amplicons enhances capillary SSCP discrimination of MHC alleles. Electrophoresis 31:<br />
1353-1356.<br />
Babik, W. (2010) Methods for MHC genotyping in non model vertebrates. Molecular Ecology<br />
Resources 10: 237-251.<br />
Bettencourt, B.F., Santos, M.R., Fialho, R.N., et al. (2008) Evaluation of two methods for<br />
computational HLA haplotype inference using a real data set. BMC Bioinformatics 9:<br />
68.<br />
Bettinotti, M.P., Hadzikadic, L., Ruppe, E., et al. (2003) New HLA-A, -B, and -C locus-specific<br />
primers for PCR amplification <strong>from</strong> cDNA: application in clinical immunology. Journal<br />
of Immunological Methods 279: 143-148.<br />
Bos, D.H., Turner, S.M. & Dewoody, J.A. (2007) Haplotype inference <strong>from</strong> diploid sequence<br />
data: evaluating performance using non-neutral MHC sequences. Hereditas 144: 228-<br />
234.<br />
Cloutier, A., Mills, J.A. & Baker, A.J. (2011) Characterization and locus-specific typing of MHC<br />
class I genes in <strong>the</strong> red-billed gull (Larus scolopinus) provides evidence for major,<br />
minor, and nonclassical loci. Immunogenetics 63: 377-394.<br />
Garrick, R.C., Sunnucks, P. & Dyer, R.J. (2010) Nuclear gene phylogeography usingh PHASE:<br />
dealing with unresolved genotypes, lost alleles, and systematic bias in parameter<br />
estimation. BMC Evolutionary Biology 10: 118.<br />
Hall, T.A. (1999) BioEdit: a user-friendly biological sequence alignment editor and analysis<br />
program for Windows 95/98/NT. Nucleics Acids Symposium Series 41: 95-98.<br />
Harrigan, R.J., Mazza, M.E. & Sorenson, M.D. (2008) Computation versus cloning: evaluation<br />
of two methods for haplotype determination. Molecular Ecology Resources 8: 1239-<br />
1248.<br />
Hughes, C.R., Miles, S. & Walbroehl, J.M. (2008) Support for <strong>the</strong> minimal essential MHC<br />
hypo<strong>the</strong>sis: a parrot with a single, highly polymorphic MHC class II B gene.<br />
Immunogenetics 60: 219-231.<br />
Librado, P. & Rozas, J. (2009) DnaSP v5: a software for comprehensive analysis of DNA<br />
polymorphism data. Bioinformatics 25: 1451-1452.<br />
Niu, T.H., Qin, Z.H.S., Xu, X.P. & Liu, J.S. (2002) Bayesian haplotype inference for multiple<br />
linked single-nucleotide polymorphisms. American Journal of Human Genetics 70: 157-<br />
169.<br />
84
Piertney, S. & Oliver, M. (2006) The evolutionary ecology of <strong>the</strong> major histocompatibility<br />
complex. Heredity 96: 7-21.<br />
Sommer, S. (2005) The importance of immune gene variability (MHC) in evolutionary<br />
ecology and conservation. Frontiers in Zoology 2: 16.<br />
Stephens, M. & Donnelly, P. (2003) A comparison of Bayesian methods for haplotype<br />
reconstruction <strong>from</strong> population genotype data. American Journal of Human Genetics<br />
73: 1162-1169.<br />
Stephens, M., Smith, N.J. & Donnelly, P. (2001) A new statistical method for haplotype<br />
reconstruction <strong>from</strong> population data. American Journal of Human Genetics 68: 978-<br />
989.<br />
Worley, K., Gillingham, M., Jensen, P., et al. (2008) Single locus typing of MHC class I and<br />
class II B loci in a population of red jungle fowl. Immunogenetics 60: 233-247.<br />
85
Tables<br />
Table 1 Polymorphisms statistics at <strong>the</strong> <strong>kestrel</strong> MHC class I and class II data sets used in<br />
this study. This table compiles <strong>the</strong> number of alleles (Na), <strong>the</strong> number of variable sites (S),<br />
<strong>the</strong> total number of mutations (Eta), mean nucleotide diversity per site (π) and <strong>the</strong> average<br />
number of nucleotide differences between alleles (k).<br />
Locus Na S Eta π k<br />
MHC class I 50 37 41 0.030 8.45<br />
MHC class II 62 60 75 0.078 21.04<br />
86
Figures<br />
Fig. 1 Influence of <strong>the</strong> number of individuals analysed on <strong>the</strong> performance (percentage of<br />
alleles correctly assigned; bars go with primary Y-axis) of Bayesian reconstructions of MHC<br />
haplotypes using <strong>the</strong> PHASE algorithm and <strong>the</strong> allele-to-individual ratio (open circles go<br />
with secondary Y-axis). Standard deviations for each parameter are indicated.<br />
87
Fig. 2 Influence of <strong>the</strong> allele-to-individual ratio on <strong>the</strong> performance of Bayesian<br />
reconstructions of MHC haplotypes using <strong>the</strong> PHASE algorithm. We altered <strong>the</strong> number of<br />
alleles for a sample size of 25 individuals for <strong>the</strong> MHC class I and 40 individuals for <strong>the</strong> MHC<br />
class II data sets. Standard deviations for each parameter are indicated.<br />
88
Supporting information<br />
Table 1 MHC class I and MHC class II B genotypes resolved by traditional laboratory-based<br />
methods during previous studies [11-14] and ongoing research by <strong>the</strong> authors. GenBank<br />
accession numbers for <strong>the</strong> MHC alleles of <strong>the</strong> <strong>lesser</strong> <strong>kestrel</strong> Falco naumanni are shown.<br />
Genotype MHC Class I MHC Class II<br />
1 Fana10 Fana11 Fana35 Fana36<br />
2 Fana2 Fana13 Fana62 Fana83<br />
3 Fana2 Fana11 Fana1 Fana19<br />
4 Fana8 Fana18 Fana19 Fana41<br />
5 Fana12 Fana33 Fana29 Fana40<br />
6 Fana4 Fana11 Fana4 Fana12<br />
7 Fana11 Fana19 Fana2 Fana91<br />
8 Fana14 Fana17 Fana2 Fana71<br />
9 Fana2 Fana41 Fana17 Fana7<br />
10 Fana20 Fana47 Fana1 Fana2<br />
11 Fana1 Fana35 Fana34 Fana35<br />
12 Fana11 Fana13 Fana2 Fana26<br />
13 Fana10 Fana29 Fana3 Fana79<br />
14 Fana2 Fana34 Fana60 Fana10<br />
15 Fana4 Fana10 Fana19 Fana47<br />
16 Fana6 Fana11 Fana2 Fana8<br />
17 Fana2 Fana16 Fana1 Fana33<br />
18 Fana3 Fana10 Fana3 Fana91<br />
19 Fana11 Fana52 Fana26 Fana29<br />
20 Fana9 Fana19 Fana60 Fana36<br />
21 Fana2 Fana35 Fana8 Fana39<br />
22 Fana6 Fana36 Fana39 Fana68<br />
23 Fana11 Fana59 Fana2 Fana19<br />
24 Fana2 Fana48 Fana11 Fana12<br />
25 Fana27 Fana60 Fana12 Fana19<br />
26 Fana11 Fana20 Fana2 Fana7<br />
27 Fana15 Fana38 Fana40 Fana31<br />
28 Fana6 Fana40 Fana2 Fana83<br />
29 Fana9 Fana42 Fana2 Fana65<br />
30 Fana2 Fana24 Fana1 Fana8<br />
31 Fana7 Fana10 Fana111 Fana82<br />
32 Fana17 Fana20 Fana19 Fana48<br />
33 Fana24 Fana25 Fana26 Fana82<br />
34 Fana1 Fana5 Fana79 Fana80<br />
35 Fana2 Fana6 Fana29 Fana51<br />
36 Fana7 Fana11 Fana31 Fana50<br />
37 Fana13 Fana28 Fana2 Fana87<br />
38 Fana38 Fana57 Fana3 Fana7<br />
39 Fana2 Fana20 Fana2 Fana40<br />
89
40 Fana34 Fana62 Fana7 Fana21<br />
41 Fana2 Fana27 Fana1 Fana3<br />
42 Fana2 Fana45 Fana1 Fana85<br />
43 Fana20 Fana35 Fana9 Fana1<br />
44 Fana7 Fana19 Fana19 Fana42<br />
45 Fana19 Fana63 Fana36 Fana72<br />
46 Fana11 Fana46 Fana3 Fana35<br />
47 Fana17 Fana47 Fana2 Fana53<br />
48 Fana32 Fana47 Fana2 Fana63<br />
49 Fana2 Fana7 Fana29 Fana36<br />
50 Fana20 Fana50 Fana1 Fana27<br />
51 Fana11 Fana35 Fana19 Fana67<br />
52 Fana20 Fana22 Fana19 Fana52<br />
53 Fana11 Fana23 Fana19 Fana68<br />
54 Fana10 Fana30 Fana19 Fana87<br />
55 Fana27 Fana31 Fana23 Fana2<br />
56 Fana6 Fana39 Fana12 Fana37<br />
57 Fana2 Fana4<br />
58 Fana1 Fana72<br />
59 Fana1 Fana12<br />
60 Fana12 Fana33<br />
61 Fana82 Fana83<br />
62 Fana2 Fana37<br />
63 Fana8 Fana19<br />
64 Fana68 Fana75<br />
65 Fana9 Fana36<br />
66 Fana29 Fana107<br />
67 Fana2 Fana89<br />
68 Fana111 Fana2<br />
69 Fana2 Fana57<br />
70 Fana1 Fana36<br />
71 Fana2 Fana3<br />
72 Fana31 Fana62<br />
73 Fana36 Fana83<br />
74 Fana47 Fana60<br />
75 Fana1 Fana34<br />
76 Fana35 Fana1<br />
77 Fana8 Fana10<br />
78 Fana81 Fana94<br />
79 Fana2 Fana10<br />
80 Fana10 Fana32<br />
81 Fana1 Fana21<br />
82 Fana19 Fana20<br />
83 Fana32 Fana70<br />
84 Fana2 Fana31<br />
85 Fana1 Fana18<br />
86 Fana9 Fana17<br />
87 Fana19 Fana83<br />
88 Fana1 Fana25<br />
90
89 Fana4 Fana90<br />
90 Fana2 Fana60<br />
91 Fana34 Fana41<br />
92 Fana31 Fana68<br />
93 Fana87 Fana109<br />
94 Fana19 Fana34<br />
95 Fana52 Fana26<br />
96 Fana8 Fana40<br />
97 Fana19 Fana62<br />
98 Fana2 Fana36<br />
99 Fana2 Fana62<br />
100 Fana82 Fana2<br />
101 Fana3 Fana82<br />
102 Fana19 Fana36<br />
103 Fana111 Fana57<br />
91
Genbank accession numbers<br />
MHC class I locuss<br />
Fana1: EU120671<br />
Fana2: EU120672<br />
Fana3: EU120675<br />
Fana4: EU120667<br />
Fana5: JF831086<br />
Fana6: EU120676<br />
Fana7: EU120668<br />
Fana8: EU120669<br />
Fana9: EU120670<br />
Fana10: EU120665<br />
Fana11: EU120664<br />
Fana12: EU120674<br />
Fana13: EU120666<br />
Fana14: JF831087<br />
Fana15: EU120673<br />
Fana16: EU120677<br />
Fana17: EU120678<br />
MHC class II B locus<br />
Fana1: EF370839<br />
Fana2: EF370840<br />
Fana3: EF370841<br />
Fana4: EU107670<br />
Fana7: EF370855<br />
Fana8: EF370851<br />
Fana9: EF370850<br />
Fana10: EF370842<br />
Fana11: EF370848<br />
Fana12: EF370849<br />
Fana17: EU107729<br />
Fana18: EF370852<br />
Fana19: EF370854<br />
Fana20: EF370853<br />
Fana21: EF370846<br />
Fana23: EU107668<br />
Fana25: EU107715<br />
Fana26: EU107703<br />
Fana27: EF370847<br />
Fana29: EF370860<br />
Fana31: EF370858<br />
Fana18: EU120679<br />
Fana19: JF831088<br />
Fana20: JF831089<br />
Fana22: JF831090<br />
Fana23: JF831091<br />
Fana24: JF831092<br />
Fana25: JF831093<br />
Fana27: JF831094<br />
Fana28: JF831095<br />
Fana29: JF831096<br />
Fana30: JF831097<br />
Fana31: JF831098<br />
Fana32: JF831101<br />
Fana33: JF831099<br />
Fana34: JF831102<br />
Fana35: JF831100<br />
Fana36: JF831105<br />
Fana32: EF370845<br />
Fana33: EF370844<br />
Fana34: EU107671<br />
Fana35: EU107704<br />
Fana36: EF370861<br />
Fana37: EU107722<br />
Fana39: EU107743<br />
Fana40: EU107734<br />
Fana41: EU107721<br />
Fana42: EU107682<br />
Fana47: EU107680<br />
Fana48: EU107733<br />
Fana50: EU107726<br />
Fana51: EU107725<br />
Fana52: EU107744<br />
Fana53: EF370864<br />
Fana57: EU107707<br />
Fana60: EU107740<br />
Fana62: EU107741<br />
Fana63: EU107709<br />
Fana65: EU107686<br />
92<br />
Fana38: JF831104<br />
Fana39: JF831103<br />
Fana40: JF831110<br />
Fana41: JF831108<br />
Fana42: JF831111<br />
Fana45: JF831109<br />
Fana46: JF831112<br />
Fana47: JF831107<br />
Fana48: JF831113<br />
Fana50: JF831114<br />
Fana52: JF831115<br />
Fana57: JF831116<br />
Fana59: JF831117<br />
Fana60: JF831118<br />
Fana62: JF831119<br />
Fana63: JF831120<br />
Fana67: EU107667<br />
Fana68: EF370843<br />
Fana70: EF370859<br />
Fana71: EF370863<br />
Fana72: EU107681<br />
Fana75: EU107687<br />
Fana79: EU107739<br />
Fana80: EU107695<br />
Fana81: EU107730<br />
Fana82: EF370856<br />
Fana83: EF370857<br />
Fana85: EF370862<br />
Fana87: EU107692<br />
Fana89: EU107728<br />
Fana90: EU107711<br />
Fana91: EU107693<br />
Fana94: EU107677<br />
Fana107: EU107738<br />
Fana109: EU107672<br />
Fana111: HQ402919
93<br />
Chapter 5<br />
Sources of variation for nutritional condition<br />
indices of <strong>the</strong> plasma of migratory <strong>lesser</strong> <strong>kestrel</strong>s<br />
in <strong>the</strong> breeding grounds<br />
Lesser <strong>kestrel</strong> nestling feeding on a bush-cricket. Photo: Pepe Antolín<br />
Rodríguez, A., Negro, J.J. & Figuerola, J. (2011) Sources of variation for nutritional condition<br />
indices of <strong>the</strong> plasma of migratory <strong>lesser</strong> <strong>kestrel</strong>s in <strong>the</strong> breeding grounds.<br />
Comparative Biochemistry & Physiology Part A 160: 453-460.
Abstract<br />
Although published information on reference values for biochemical parameters in birds of<br />
prey has increased during <strong>the</strong> last years, little is known on <strong>the</strong>ir sources of variation. We<br />
used an insectivorous and small migratory raptor species, <strong>the</strong> <strong>lesser</strong> <strong>kestrel</strong> Falco<br />
naumanni, as a model. We looked for sources of variation of nutritional biochemical<br />
parameters (i.e. triglycerides, cholesterol, uric acid and urea) of both nestlings and adults.<br />
Reference values indicated that, as a rule, <strong>lesser</strong> <strong>kestrel</strong> showed more elevated triglycerides,<br />
urea and uric acid levels than o<strong>the</strong>r raptors. All analyzed factors except gender and<br />
presence/absence of a geolocator (i.e. year, colony, sampling time, body mass, laying date<br />
and capture date) reached significance for at least one biochemical parameter. In <strong>the</strong><br />
morning, we found an important postprandial increase in <strong>the</strong> concentration of all<br />
biochemical parameters in nestlings, and uric acid and urea levels in adults. A positive<br />
relationship was detected between triglycerides and body mass in nestlings and adults.<br />
Although we did not find differences between blood biochemical parameters of <strong>the</strong> oldest<br />
and youngest chick of each brood, we found that cholesterol levels were lower in nestlings<br />
<strong>from</strong> larger broods. Coloration of tarsi (measured as brightness) was related to<br />
triglycerides and urea levels of nestlings and adults, respectively. The feeding habits of<br />
<strong>lesser</strong> <strong>kestrel</strong> probably explain <strong>the</strong> different levels and patterns of variation of metabolites<br />
in comparison to more carnivorous raptors eating mammals or birds.<br />
94
Introduction<br />
During long-term fasting in endo<strong>the</strong>rm vertebrates, three different physiological phases<br />
based on changes in body mass and plasma biochemistry can be distinguished (see review<br />
in McCue 2010). The first phase of fasting is characterized by a severe body-mass loss as<br />
well as a decrease of <strong>the</strong> levels of uric acid and urea in plasma. During <strong>the</strong> second phase,<br />
stored lipids are used as an energy source, but <strong>the</strong> protein catabolism residues (urea and<br />
uric acid) maintain a low concentration. In <strong>the</strong> third phase (prolonged fasting), levels of<br />
glucose in blood drop dramatically and uric acid and urea reach high values due to <strong>the</strong> use<br />
of structural proteins as an energy resource (Bauchinger & Biebach 2001). Finally, animals<br />
suffer a severe body mass loss approaching death. During <strong>the</strong> three fasting phases,<br />
triglycerides steadily decrease (Jenni-Eiermann & Jenni 1998, Alonso-Alvarez & Ferrer<br />
2001).<br />
Despite an increase of studies publishing reference values of free-living raptors<br />
during <strong>the</strong> last years (e.g. Stein et al. 1998, Casado et al. 2002, Hanauska-Brown et al. 2003,<br />
Sarasola et al. 2004, Mealey et al. 2004, Limiñana et al. 2009, Hernández & Margalida 2010),<br />
most of <strong>the</strong> studies focusing on blood biochemistry have been conducted on captive birds.<br />
However, <strong>the</strong>se have non-natural diets, regular access to food, and are forced to live in<br />
relative small enclosures in comparison with <strong>the</strong> natural home ranges, and thus, blood<br />
parameters might vary with respect to free-ranging animals (Dobado-Berrios et al. 1998,<br />
Balbontín & Ferrer 2002, Villegas et al. 2002). Therefore, reference values for biochemical<br />
parameters of wild individuals are invaluable for ecophysiologists studying free-ranging<br />
birds (e.g. nutritional status, presence of diseases or exposure to pollutants; e.g. Artacho et<br />
al. 2007), and may also help <strong>the</strong> managers of rehabilitation centers or captive programs to<br />
keep birds in conditions as similar as possible to <strong>the</strong> wild ones. Fur<strong>the</strong>rmore, <strong>the</strong> majority<br />
of studies focusing on blood biochemistry have been conducted in large raptors (e.g. eagles<br />
or vultures) which ingest relatively large amounts of food at one time and endure longer<br />
fasting periods than smaller species. Therefore, feeding habits could influence <strong>the</strong><br />
interpretation of some biochemistry values, especially those related to prolonged fasting<br />
periods, such as urea and uric acid. In large raptors, high values of <strong>the</strong>se parameters have<br />
invariably been interpreted as indicators of low nutritional condition (Ferrer 1994, Ferrer<br />
& Dobado-Berrios 1998, Balbontín & Ferrer 2005).<br />
The <strong>lesser</strong> <strong>kestrel</strong> Falco naumanni is one of <strong>the</strong> smallest European raptor species<br />
(along with <strong>the</strong> Merlin Falco columbarius and <strong>the</strong> Red-Footed Falcon Falco vespertinus). Its<br />
diet is basically composed of insects (i.e., grasshoppers, beetles, crickets), but it also feeds<br />
95
on small mammals (Rodríguez et al. 2010, Pérez-Granados 2010 and references <strong>the</strong>rein). In<br />
contrast to larger raptors, <strong>the</strong> <strong>lesser</strong> <strong>kestrel</strong> typically eats several times per day due to <strong>the</strong><br />
small size of its prey. Starvation is <strong>the</strong> main cause of nestling mortality (Negro 1997),<br />
suggesting <strong>the</strong>y are not well adapted to long fasting periods. This migratory falcon’s<br />
breeding range spans <strong>from</strong> China to <strong>the</strong> Iberian peninsula and its wintering grounds are<br />
located in sub-Saharian Africa (Rodríguez et al. 2009a, 2011). Since <strong>the</strong> 1950s, its<br />
populations have suffered a severe decline (estimated at more than 30% of <strong>the</strong> world<br />
population), leading to its current vulnerable status (BirdLife International 2011). As a<br />
consequence, numerous breeding programs have been put in place for reintroduction<br />
purposes (Pomarol 1993, Alcaide et al. 2010). Therefore, information presented here on<br />
sources of variation of nutritional biochemical parameters is valuable to assess condition of<br />
<strong>the</strong> captive stock, which in Spain only numbers several hundred pairs in at least five<br />
different breeding centers.<br />
We have analyzed four biochemical parameters related to fat (triglycerides and<br />
cholesterol) and protein metabolism (uric acid and urea; see McCue 2010), in adult and<br />
nestling <strong>lesser</strong> <strong>kestrel</strong>s. These parameters have shown to be related to <strong>the</strong> physiological and<br />
nutritional state of birds (Jenni-Eiermann & Jenni 1998, Alonso-Alvarez & Ferrer 2001,<br />
Alonso-Alvarez et al. 2002a, 2002b, Sarasola & Negro 2004). Our aim is, first, to report<br />
reference values of selected plasma biochemical parameters that have been previously<br />
reported as nutritional condition indices in larger and mainly vertebrate-eating birds of<br />
prey. Second, to examine <strong>the</strong> influence of different factors, such as sex, colony, year,<br />
sampling time, body mass, brood size, capture date –for adults– and laying date –for<br />
nestlings–, on nutritional markers. Third, to evaluate differences of biochemical parameters<br />
between <strong>the</strong> eldest and <strong>the</strong> younger nestlings <strong>from</strong> <strong>the</strong> same brood, as in <strong>the</strong> <strong>lesser</strong> <strong>kestrel</strong><br />
death due to starvation typically affects sequentially <strong>the</strong> youngest and smallest individuals<br />
in <strong>the</strong> brood. Thus, we hypo<strong>the</strong>size that youngest nestlings will show lower triglyceride and<br />
cholesterol levels and higher nitrogenous waste levels (urea and uric acid) as a<br />
consequence of protein catabolism. Last, we aim to determine <strong>the</strong> relationships between<br />
certain phenotypic traits (i.e. characteristics of plumage –tail band width– and bare parts<br />
coloration –brightness and chroma of tarsi) and blood biochemical parameters. We expect<br />
that <strong>the</strong>se traits will be negatively correlated with nutritional condition.<br />
Materials and Methods<br />
96
Study area and trapping procedures<br />
Adults and nestlings were captured during three consecutive breeding seasons (2007-<br />
2009) in two neighboring urban colonies distant 10 km, <strong>the</strong> cereal silo of La Palma del<br />
Condado (37º23’N, 6º33’W) and <strong>the</strong> Purificación church of Manzanilla (37º23’N, 6º25’W),<br />
Huelva province, sou<strong>the</strong>rn Spain (for a detailed description of surrounding habitat see<br />
Rodríguez et al. 2006). Adults were captured <strong>from</strong> March to July at <strong>the</strong>ir nest cavities.<br />
Nestlings were sampled at <strong>the</strong> nest at <strong>the</strong> age of 24.0 ± 3.4 days (± SD). All birds were<br />
captured by hand and several body measurements were recorded (body mass, eighth<br />
primary, tail and wing length -<strong>the</strong> latter two only for adults). Body mass was measured with<br />
an electronic balance to <strong>the</strong> nearest 0.1 g and length measurements were done with a ruler<br />
to <strong>the</strong> nearest 1 mm. The width of <strong>the</strong> black terminal tail band was measured with a caliper<br />
at <strong>the</strong> raquis of <strong>the</strong> top central tail fea<strong>the</strong>r.<br />
Color measurements<br />
Coloration of <strong>the</strong> tarsi was measured using a Minolta 2600 spectrometer (Minolta, Osaka,<br />
Japan), which uses a high-energy xenon flash illumination and a dual-40-element silicon<br />
photodiode array (e.g. Negro et al. 2006). Automatic white calibration was performed<br />
before all measurements. Color was evaluated as <strong>the</strong> averaged reflectance over <strong>the</strong> wave<br />
length interval (360-740 nm) for brightness and as <strong>the</strong> difference between <strong>the</strong> maximum<br />
and minimum reflectance divided by <strong>the</strong> averaged reflectance for chroma (Anderson &<br />
Prager 2006).<br />
Blood sampling and plasma biochemistry<br />
All birds were bled <strong>from</strong> <strong>the</strong> brachial vein (approximately 0.5 ml) between 9:00 and 15:00 h<br />
to minimize expected variations caused by circadian rhythms of <strong>the</strong> biochemical<br />
parameters (García-Rodríguez et al. 1987, Pérez-Rodríguez et al. 2008). The blood was<br />
collected in a heparinized tube and kept in a cooler until centrifugation. Blood was<br />
centrifuged (10 min; 4500 rpm; 4 ºC), and <strong>the</strong> plasma and <strong>the</strong> cellular fraction were stored<br />
at -20 ºC until analyses were conducted. Plasma was analyzed for triglycerides, cholesterol,<br />
urea, and uric acid using a Screen Point autoanaliser (Hospitex Diagnostics, Sesto<br />
Fiorentino, Italy), and commercial kits (Biolabo Labs, Maizy, France). Plasma biochemical<br />
analyses were performed by Wildvets S.L.P. (Seville, Spain; Rodríguez et al. 2009). To assess<br />
97
epeatability (Lessells & Boag 1987), two measurements of each biochemical parameter<br />
were taken <strong>from</strong> 99 randomly selected samples (30, 44 and 25 samples <strong>from</strong> 2007, 2008<br />
and 2009, respectively; eleven adults –six females– and 88 nestlings –44 females).<br />
Coefficients of repeatability varied between 0.95 and 0.99. For analyses, we employed <strong>the</strong><br />
mean values of <strong>the</strong> two readings of <strong>the</strong>se repeated samples.<br />
Sex determination<br />
As <strong>the</strong> Lesser Kestrel shows a strong sexual dichromatism, adults were visually sexed<br />
according to plumage characteristics. However, gender determination of nestlings is<br />
sometimes difficult (Rodríguez et al. 2005). In this case, <strong>the</strong> cellular fraction was used as a<br />
source of DNA. We determined sex by PCR amplification of CHD genes using primers 2550F<br />
and 2718R (Fridolfsson & Ellegren 1999).<br />
Statistical analyses<br />
First, an ANOVA was employed to test differences in <strong>the</strong> plasma metabolite concentrations<br />
of nestlings and adults. As data coming <strong>from</strong> siblings in a same nest are not independent<br />
and some adults were sampled twice or more times, we used mean values for each brood<br />
and each adult individual, respectively. Second, we used general linear mixed models to<br />
explain <strong>the</strong> variations in blood biochemical parameters. Nestlings’ models included sex,<br />
year and colony as factors, and sampling time, body mass and laying date as covariates. To<br />
avoid <strong>the</strong> non-independence of data <strong>from</strong> siblings, brood identity was included as a random<br />
effect. As some adult birds were fitted with geolocators during <strong>the</strong> 2007-2008 winter and<br />
some biochemical parameters of nestlings were affected by this procedure (see Rodríguez<br />
et al. 2009b), we included an additional fixed factor to control for this source of variation (0<br />
= non geolocator-tagged bird or nestling without tagged parents, 1 = geolocator-tagged bird<br />
or nestling with at least one tagged parent). Adults’ models included sex, year and age<br />
(yearlings or older than 1 year) as factors, and sampling time, body mass and date of<br />
capture as covariates. To avoid pseudoreplication, identity was included as a random effect<br />
given that some adult individuals were captured in different breeding seasons. Third, to<br />
assess <strong>the</strong> effect of brood size on biochemical parameters of nestlings, we ran models<br />
including <strong>the</strong> significant terms of our previous analyses and an ordinal variable (number of<br />
nestlings). In addition, we built general linear mixed models including <strong>the</strong> sibling order (<strong>the</strong><br />
younger and <strong>the</strong> eldest), brood size and <strong>the</strong>ir interaction as fixed factors and brood identity<br />
98
as a random factor. We introduced <strong>the</strong> interaction because differences between <strong>the</strong> younger<br />
and <strong>the</strong> eldest nestlings may be more apparent in larger brood sizes. The eighth primary<br />
fea<strong>the</strong>r of <strong>the</strong> wing has been used to estimate age of nestlings (Negro 1997), thus, we<br />
assumed <strong>the</strong> eldest and youngest siblings in a brood showed <strong>the</strong> longest and <strong>the</strong> shortest<br />
eighth primary, respectively. To test <strong>the</strong> relationship between brood size and <strong>the</strong> nutritional<br />
condition of adults, we selected those adults captured during chick rearing activities (after<br />
June 10th). Given that this dataset contained a smaller number of individuals (n = 39), we<br />
used Pearson correlation analyses including breeding success (number of fledglings) and<br />
each biochemical parameter. Fourth, to evaluate <strong>the</strong> relationships between coloration<br />
phenotypic traits and biochemical parameters, we built models including <strong>the</strong> significant<br />
terms in <strong>the</strong> previous analyses. Each phenotypic trait (tail band width, chroma, and<br />
brightness) was included individually.<br />
Because variable responses were not normally distributed, <strong>the</strong>y were log or square-<br />
root transformed. F-ratio was used to test <strong>the</strong> significance of fixed effects in our full models<br />
(no backward or stepwise procedures were employed). Statistical analyses were conducted<br />
using JMP v.9 package. In some cases, <strong>the</strong> amount of plasma obtained was insufficient to<br />
assay all <strong>the</strong> parameters. For this reason, sample sizes are not uniform.<br />
Results<br />
Reference values<br />
A total of 334 nestling, belonging to 112 broods, and 104 adult <strong>lesser</strong> <strong>kestrel</strong>s were studied.<br />
Twenty eight adult birds were sampled two or three times, increasing <strong>the</strong> sample size for<br />
adults to 135. Excepting for urea levels, mean values for all biochemical parameters were<br />
significantly different between nestlings and adults, although ranges overlapped (Table 1).<br />
Factors affecting blood parameters<br />
The main factor affecting <strong>the</strong> blood biochemical parameters of nestlings was sampling time<br />
(Table 2), which reached significance for all parameters analyzed. A positive relationship<br />
was detected through <strong>the</strong> morning for all biochemical parameters (Fig. 1). Cholesterol, uric<br />
acid and urea levels were affected by year of sampling, indicating that it is a crucial factor in<br />
<strong>the</strong> nutritional status of <strong>lesser</strong> <strong>kestrel</strong> nestlings. Triglyceride levels were also affected by<br />
99
colony, and <strong>the</strong>y showed a positive relationship with body mass and laying date. Last, levels<br />
of urea increased with laying date. The geolocator tagging effect was not significant for any<br />
parameter. Models explained <strong>from</strong> 26.9 to 55.7 % of <strong>the</strong> total variation in <strong>the</strong> blood<br />
parameters (Table 2). Brood identity (random factor) explained <strong>from</strong> 6.1 to 38.5 % of <strong>the</strong><br />
total variation (Table 2).<br />
For adults, levels of triglycerides varied between years and showed a positive<br />
relationship with body mass (Fig. 2). Cholesterol concentration was not explained by any<br />
independent variable measured in this study. Uric acid and Urea were affected by sampling<br />
time, and additionally by date of capture (positive relationship) and by year of sampling,<br />
respectively (Table 2). Models explained <strong>from</strong> 20.5 to 46.8 % of <strong>the</strong> total variation in <strong>the</strong><br />
blood parameters (Table 2). The random factor (individual identity) explained low<br />
percentages of <strong>the</strong> total variation (<strong>from</strong> 2.7 to 10 %).<br />
Effect of brood size on biochemical parameters<br />
Models including <strong>the</strong> significant terms listed in Table 2 for each biochemical parameters<br />
and <strong>the</strong> number of nestlings (as an ordinal variable) indicated that cholesterol was<br />
negatively affected by brood size in nestlings (F = 3.88; d.f. = 4, 120.1; P = 0.005; Fig. 3A).<br />
Number of nestlings tended to be positively related to triglycerides (F = 2.07; d.f. = 4, 126.8;<br />
P = 0.087), but in a second analysis excluding <strong>the</strong> single nestlings, <strong>the</strong> relationship reached<br />
significance (F = 2.47; d.f. = 3, 94.5; P = 0.047; see Fig. 3B). Number of siblings was not<br />
related to uric acid nor urea (F = 1.18; d.f. = 4, 113.3; P = 0.322 and F = 0.16; d.f. = 4, 103.5; P<br />
= 0.956, respectively. No significant differences were found between <strong>the</strong> younger and eldest<br />
nestlings for any biochemical parameter (all P-values > 0.125) or <strong>the</strong> interaction between<br />
hatching order and brood size (all P-values > 0.163). In adults, only urea levels were<br />
correlated with number of fledglings (r = 0.325; P = 0.049, Fig. 4).<br />
Correlates of biochemical parameters and phenotypic traits<br />
Tarsi brightness was <strong>the</strong> single phenotypic trait which correlated with some blood<br />
biochemical parameter. Negative relationships were observed between brightness and<br />
triglyceride levels, and brightness and urea levels for nestlings and adults, respectively (see<br />
Table 3).<br />
100
Discussion<br />
Reference values<br />
We provide for <strong>the</strong> first time reference values for four plasma biochemical parameters<br />
indicative of nutritional condition for free-living nestling and adult <strong>lesser</strong> <strong>kestrel</strong>s. Nearly all<br />
ranges of plasma metabolites for nestlings and adults overlapped with those described for<br />
free-living larger raptorial birds (Dobado-Berrios et al. 1998, Ferrer & Dobado-Berrios<br />
1998, Stein et al. 1998, van Wyk et al. 1998, Bowerman et al. 2000, Casado et al. 2002,<br />
Villegas et al. 2002, Balbontín & Ferrer 2002, Hanauska-Brown et al. 2003, Mealey et al.<br />
2004, Sarasola et al. 2004, Limiñana et al. 2009, Hernández & Margalida 2010). However,<br />
we consistently detected higher mean values of triglycerides in <strong>lesser</strong> <strong>kestrel</strong> than in <strong>the</strong><br />
above cited studies on larger raptors. Given that plasma triglyceride levels decline after<br />
short periods of fasting (Jenni-Eiermann & Jenni 1997), <strong>the</strong>se differences might be<br />
explained by <strong>the</strong> higher feeding frequency of <strong>the</strong> <strong>lesser</strong> <strong>kestrel</strong> in comparison with larger<br />
raptors, which endure longer fasting periods, sometimes more than a week, due to<br />
unpredictability of <strong>the</strong>ir food. In this sense, adult <strong>lesser</strong> <strong>kestrel</strong>s need 3.1-9 min to acquire a<br />
prey item during hunting activities (Donázar et al. 1993, Tella et al. 1998) and <strong>the</strong> prey<br />
delivery rates to nestlings vary between 2.04-3.98 items per hour (Tella et al. 1996),<br />
although under food shortage conditions, prey delivery rates can notably decrease (Negro<br />
et al. 2000, Rodríguez et al. 2006).<br />
While reported in fewer studies, urea and uric acid also were lower in some raptor<br />
species (Lavin et al. 1992, Stein et al. 1998, Bowerman et al. 2000, Villegas et al. 2002,<br />
Balbontín & Ferrer 2002, Mealey et al. 2004, Sarasola et al. 2004, Limiñana et al. 2009,<br />
Hernández & Margalida 2010), or in non-raptorial species such as <strong>the</strong> greater flamingo<br />
Phoenicopterus roseus or <strong>the</strong> white stork Ciconia ciconia (Amat et al. 2007, Jerzak et al.<br />
2010). Plasma urea and uric acid are protein catabolism residues and good indicators of low<br />
nutritional condition because protein catabolism is active during <strong>the</strong> last phase of fasting<br />
(McCue 2010). However, high levels of <strong>the</strong>se parameters can be induced by protein-rich<br />
diets (Jenni-Eiermann & Jenni 1998). Although a non negligible part is sequestered in<br />
indigestible exoskeleton, grasshoppers contain higher levels of proteins than mammals or<br />
birds (Bird et al. 1982). Thus, we think differences reported here are a consequence of <strong>the</strong><br />
<strong>lesser</strong> <strong>kestrel</strong> mainly insectivorous diet (based on Ortop<strong>the</strong>ra; e.g. Rodríguez et al. 2010)<br />
more than to <strong>the</strong> effect of starvation (i.e. protein catabolism; Jenni-Eiermann & Jenni 1998,<br />
McCue 2010) given <strong>the</strong> high levels of triglycerides.<br />
101
Factors affecting blood parameters<br />
The important effect of sampling time has been reported in several studies using captive<br />
birds (García Rodríguez et al. 1987, Ferrer et al. 1994, Pérez-Rodríguez et al. 2008), but, as<br />
far as we know, it has been only described in a published field study for triglycerides and<br />
uric acid levels in adult passerines (Jenni-Eiearmann & Jenni 1997). We found an increase in<br />
<strong>the</strong> concentration of all four biochemical parameters with sampling time as daytime<br />
advanced (triglycerides, cholesterol, uric acid and urea in nestlings, and uric acid and urea<br />
in adults; Fig. 1). The increase in <strong>the</strong> values of blood biochemical parameters detected in<br />
nestlings seems to be related to <strong>the</strong> increase of feeding rates in <strong>the</strong> morning. Thus, during<br />
<strong>the</strong> first daytime hours we sampled nestlings that had fasted overnight (at least for <strong>the</strong> nine<br />
nighttime hours), but that were subsequently fed by parents during <strong>the</strong> morning. In adults,<br />
<strong>the</strong> same pattern was found for uric acid and urea levels (Fig. 1), and it may be due to<br />
energy cost incurred in food provisioning given that an increase for triglyceride and<br />
cholesterol levels was not observed. The positive relationship between plasma uric acid<br />
concentration and date of capture, which suggests an important energy cost of breeding<br />
duties, also supports this idea. However, we cannot discard that <strong>the</strong> same hypo<strong>the</strong>sis<br />
suggested for nestlings can be acting on adults, i.e. a postprandial increase in <strong>the</strong> morning.<br />
Contrary to o<strong>the</strong>r studies focused on larger raptors (Casado et al. 2002, Sarasola et<br />
al. 2004) or o<strong>the</strong>r bird species (e.g. Artacho et al. 2007, Jerzak et al. 2010), no differences<br />
between sexes were found for plasma concentration of <strong>the</strong> four analyzed parameters,<br />
despite <strong>the</strong> sexual size dimorphism of <strong>lesser</strong> <strong>kestrel</strong> and <strong>the</strong> mate-feeding by males to <strong>the</strong>ir<br />
female mates during <strong>the</strong> breeding period (Donázar et al. 1992). However, no sexual<br />
differences have been detected in free-living nestlings of o<strong>the</strong>r sexual size dimorphic<br />
raptors such as <strong>the</strong> Spanish imperial eagle Aquila adalberti, <strong>the</strong> Bonelli’s eagle Aquila<br />
fasciata or <strong>the</strong> Montagu’s harrier Circus pygargus (Ferrer & Dobado-Berrios 1998, Balbontín<br />
& Ferrer 2002, Limiñana et al. 2009) or in free-living adults of <strong>the</strong> American <strong>kestrel</strong> Falco<br />
sparverius or <strong>the</strong> nor<strong>the</strong>rn goshawk Accipiter gentilis (Stein et al. 1998, Hanauska-Brown et<br />
al. 2003).<br />
Inter-annual variation seems to be ano<strong>the</strong>r important factor explaining differences<br />
in <strong>the</strong> biochemical parameters of <strong>lesser</strong> <strong>kestrel</strong> nestlings, as it reached significance for<br />
cholesterol, uric acid and urea. For <strong>the</strong>se three parameters, lowest values were detected in<br />
2007 and <strong>the</strong> highest ones in 2008 (data not shown). Also for adults, year of sampling<br />
reached significance for triglyceride and urea levels, although <strong>the</strong> pattern for triglycerides<br />
102
was opposite to nestlings (data not shown). These annual differences could be related to<br />
quantitative and qualitative differences in prey abundance as a consequence of annual<br />
wea<strong>the</strong>r conditions, which have a strong effect on breeding success (Rodríguez &<br />
Bustamante 2003). However, we detected a decrease in <strong>the</strong> breeding success during <strong>the</strong><br />
studied years (2007, 2008 and 2009 reaching productivity values of 3.3, 3.2 and 2.5<br />
fledglings per successful nest, respectively), that suggests <strong>the</strong> involvement of multiple<br />
factors, apart <strong>from</strong> diet.<br />
Triglycerides level seems to be one of <strong>the</strong> best indicators of fasting in field studies<br />
given its interspecific consistency (Jenni-Eiearmann & Jenni 1997). Positive relationships<br />
between triglycerides concentration and body mass (or body condition) have been<br />
described in passerines, raptors and pelecaniformes (Jenni-Eiearmann & Jenni 1998,<br />
Sarasola et al. 2004, Villegas et al. 2004). Our data also indicate a relationship between<br />
triglyceride and condition, both in nestlings and adults (Fig. 2).<br />
We found a positive relationship between urea levels and laying date of nestlings<br />
(Table 2). The same pattern was found in Spanish imperial eagle nestlings, but not in<br />
Bonelli’s eagle nestlings (Balbontín & Ferrer 2005), and <strong>the</strong> former was interpreted as<br />
earlier broods having better-nourished nestlings (Ferrer 1994). However, triglyceride<br />
levels of nestlings also increased with <strong>the</strong> laying date in our study (Table 2), suggesting that<br />
a poorer diet is not <strong>the</strong> actual explanation, but more probably a change in <strong>the</strong> diet<br />
(Rodríguez et al. 2010).<br />
Effect of brood size on biochemical parameters<br />
For nestlings, we found a negative relationship between cholesterol and brood size (Fig 3).<br />
The differences were pronounced between extreme values of brood size, thus nestlings<br />
<strong>from</strong> nests with brood size equal to 1 showed <strong>the</strong> highest values and nestlings in broods<br />
with 5 nestlings showed <strong>the</strong> lowest levels. In <strong>the</strong> case of triglycerides and brood size, a high<br />
variability was observed in <strong>the</strong> single nestlings, but a clear positive relationship was found<br />
for nests with 2-5 nestlings. Although we do not have data to prove it, different type of prey<br />
delivered to nestlings by parents according to brood size may explain <strong>the</strong> observed trends.<br />
Spanish imperial eagle nestlings <strong>from</strong> nests with larger brood sizes were better<br />
nourished (Ferrer 1994) and Bonelli’s eagle nestlings <strong>from</strong> nests with two siblings showed<br />
a poorer condition than single nestlings during a year of adverse environmental<br />
circumstances (heavy rainfall; Balbontín & Ferrer 2005). However, <strong>the</strong>se conclusions were<br />
obtained based on urea and uric acid plasma levels. Interestingly, we did not find any<br />
103
elationship with <strong>the</strong>se two parameters, and <strong>the</strong>re were not clear differences between <strong>the</strong><br />
oldest and youngest siblings. This suggests that nestlings were equally fed by parents<br />
independently of <strong>the</strong>ir age, probably as a consequence of <strong>the</strong> high habitat quality and<br />
productivity of our colonies. The two colonies studied here (Silo and Purificación) showed<br />
<strong>the</strong> best habitat quality in comparison with four o<strong>the</strong>r colonies, and <strong>the</strong>ir habitat quality is<br />
high enough for population stability, according to a modeling approach based on prey<br />
abundance and prey size (see Rodríguez et al. 2006).<br />
The relationship between urea levels and breeding success of adults may be<br />
explained by <strong>the</strong> work load of reproduction duties (Fig. 4). It has been experimentally<br />
demonstrated that <strong>kestrel</strong>s adjust <strong>the</strong> provisioning rates according to brood size (Dawson &<br />
Bortolotti 2003). Thus, <strong>the</strong> parents rearing a high number of nestlings have high feeding<br />
provisioning rates, reducing time for <strong>the</strong>mselves. This would fit with <strong>the</strong> negative<br />
correlation between brightness and urea levels (see below).<br />
Correlates of biochemical parameters and phenotypic traits<br />
Melanin-based traits are static signals and may provide information on nutritional status at<br />
<strong>the</strong> time when fea<strong>the</strong>rs were growing. This may explain <strong>the</strong> lack of correlation between tail<br />
band width and biochemical parameters, which are indicative of short-term nutritional<br />
status (Jenni-Eiearmann & Jenni 1998). However, colored patches of bare skin are a<br />
reflection of recent physiological events, indicating <strong>the</strong> current physiological condition of<br />
<strong>the</strong> individual (e.g. Negro et al. 2006). High carotenoid plasma concentrations and brilliant<br />
coloration of fleshy parts have been reported as indicators of quality in <strong>kestrel</strong>s (Bostrom &<br />
Ritchison 2006, Casagrande et al. 2006, Dawson & Bortolotti 2006, Vergara & Fargallo<br />
2011). Carotenoid pigments are responsible of yellow-orange coloration of <strong>kestrel</strong> tarsi<br />
(Bortolotti et al. 1996, Casagrande et al. 2009), and important physiological modulators, but<br />
<strong>the</strong>se pigments can not be syn<strong>the</strong>sized de novo by birds. Thus, a trade-off between <strong>the</strong> show<br />
and health functions have been suggested (Negro et al. 1998).<br />
Brightness is inversely proportional to pigment concentration (Andersson & Prager<br />
2006). The negative relationships between brightness and triglyceride levels in nestlings<br />
suggest that <strong>the</strong> nestlings better nourished (higher triglyceride levels) had <strong>the</strong> higher<br />
carotenoid concentration in tarsi (lower brightness). In contrast, <strong>the</strong> negative relationship<br />
between brightness and urea levels in adults may be a consequence of higher work loads of<br />
high quality individuals (low brightness) rearing higher number of nestlings (see above).<br />
104
Conclusions<br />
The small size (atypical for <strong>the</strong> majority of raptor species studied so far for biochemical<br />
parameters) and its insectivorous diet suggest <strong>lesser</strong> <strong>kestrel</strong> may be more alike, ecologically<br />
speaking, to a medium sized passerine, such a shrike, than to a typical raptor. The high<br />
feeding frequency seems to be responsible for <strong>the</strong> general higher values of triglycerides,<br />
while <strong>the</strong> insectivorous diet may explain <strong>the</strong> higher uric acid and urea levels observed here.<br />
Also <strong>the</strong> increase of feeding rates during <strong>the</strong> morning may be <strong>the</strong> explanation for <strong>the</strong><br />
increase of metabolite concentration, which is a key factor for future studies sampling at<br />
different times.<br />
Acknowledgments<br />
We thank Luis Cadahía, Álvaro Ramos and Miguel Alcaide for helping us with <strong>the</strong> molecular<br />
sex determination of nestlings. Javier Balbontín and an anonymous reviewer offered useful<br />
comments on early drafts. A.R. was supported by a pre-doctoral grant (I3P-BPG2006) <strong>from</strong><br />
<strong>the</strong> Spanish National Research Council (<strong>CSIC</strong>). Projects CGL2006-07481/BOS, CGL2009-<br />
10652/BOS and HORUS Project P06-RNM-01712 funded this research. This study has been<br />
carried out in accordance with EC Directive 86/609/EEC for animal experiments and <strong>the</strong><br />
current laws <strong>from</strong> Spain and Andalusia.<br />
References<br />
Alcaide, M., Negro, J.J., Serrano, D., et al. (2010) Captive breeding and reintroduction of <strong>the</strong><br />
<strong>lesser</strong> <strong>kestrel</strong> Falco naumanni: a genetic analysis using microsatellites. Conservation<br />
Genetics 11: 331-338.<br />
Alonso-Alvarez, C. & Ferrer, M. (2001) A biochemical study of fasting, subfeeding, and<br />
recovery processes in Yellow-Legged Gulls. Physiological & Biochemical Zoology 74:<br />
703-713.<br />
Alonso-Alvarez, C., Ferrer, M. & Velando, A. (2002a) The plasmatic index of body condition<br />
in Yellow-legged Gulls Larus cachinnans: a food-controlled experiment. Ibis 144: 147-<br />
149.<br />
105
Alonso-Alvarez, C., Velando, A., Ferrer, M. & Veira, J.A.R. (2002b) Changes in plasma<br />
biochemistry and body mass during incubation in <strong>the</strong> Yellow-legged Gull. Waterbirds<br />
25: 253-258.<br />
Amat, J.A., Hortas, F., Arroyo, G.M., et al. (2007) Interannual variations in feeding<br />
frequencies and food quality of greater flamingo chicks (Phoenicopterus roseus):<br />
Evidence <strong>from</strong> plasma biochemistry and effects on body condition. Comparative<br />
Biochemistry & Physiology A 147: 569-576.<br />
Anderson, S. & Prager, M. (2006) Quantifying colors. In: Hill, G.E., McGraw, K.J. (Eds.), Bird<br />
coloration, vol 1: mechanisms and measurements. Harvard University Press, Boston,<br />
pp. 41-89.<br />
Artacho, P., Soto-Gamboa, M., Verdugo, C. & Nespolo, R.F. (2007) Blood biochemistry reveals<br />
malnutrition in black-necked swans (Cygnus melanocoryphus) living in a conservation<br />
priority area. Comparative Biochemistry & Physiology A 146: 283-290.<br />
Balbontín, J. & Ferrer, M. (2002) Plasma chemistry reference values in free-living Bonelli’s<br />
Eagle (Hieraaetus fasciatus) nestlings. Journal of Raptor Research 36: 231-235.<br />
Balbontín, J. & Ferrer, M. (2005) Condition of large brood in Bonelli’s Eagle Hieraaetus<br />
fasciatus. Bird Study 52: 37-41.<br />
Bauchinger, U. & Biebach, H. (2001) Differential catabolism of muscle protein in Garden<br />
Warblers: flight and leg muscle act as a protein source during long-distance migration.<br />
Journal of Comparative Physiology B 171: 293-301.<br />
Bird, D.M., Shio-Kuen, H. & Paré, D. (1982) Nutritive values of three common prey items of<br />
<strong>the</strong> American <strong>kestrel</strong>. Comparative Biochemistry & Physiology A 73: 513-515.<br />
BirdLife International (2011) Species factsheet: Falco naumanni. Downloaded <strong>from</strong><br />
http://www.birdlife.org on 19 April 2011.<br />
Bortolotti, G.R., Negro, J.J., Tella, J.L., Marchant, T.A. & Bird, D.M. (1996) Sexual dichromatism<br />
in birds independent of diet, parasites and androgens. Proceedings of <strong>the</strong> Royal Society<br />
of London B 263: 1171-1176.<br />
Bostrom, M.R. & Ritchison, G. (2006) Possible relationships between morphology, territory<br />
quality, and skin color of American Kestrels. Journal of Field Ornithology 77: 392-398.<br />
Bowerman, W.W., Stickle, J.E., Sikarskie, J.G. & Giesy, J.P. (2000) Hematology and serum<br />
chemistries of nestling bald eagles (Haliaeetus leucocephalus) in <strong>the</strong> lower peninsula of<br />
MI, USA. Chemosphere 41: 1575-1579.<br />
Casado, E., Balbontín, J. & Ferrer, M. (2002) Plasma chemistry in booted eagle (Hieraaetus<br />
fasciatus) during breeding season. Comparative Biochemistry & Physiology A 131: 233-<br />
241.<br />
106
Casagrande, S., Csermely, D., Pini, E., Bertacche, V. & Tagliavini, J. (2006) Skin carotenoid<br />
concentration correlates with male hunting skill and territory quality in <strong>the</strong> <strong>kestrel</strong><br />
Falco tinnunculus. Journal of Avian Biology 37: 190-196.<br />
Casagrande, S., Costantini, D., Tagliavini, J. & Dell’Omo, G. (2009) Phenotypic, genetic, and<br />
environmental causes of variation in yellow skin pigmentation and serum carotenoids<br />
in Eurasian <strong>kestrel</strong> nestlings. Ecological Research 24: 273-279.<br />
Dawson, R.D. & Bortolotti, G.R. (2003) Parental effort of American <strong>kestrel</strong>s: <strong>the</strong> role of<br />
variation in brood size. Canadian Journal of Zoology 81: 852-860.<br />
Dawson, R.D. & Bortolotti, G.R. (2006) Carotenoid-dependent coloration of male American<br />
<strong>kestrel</strong>s predicts ability to reduce parasitic infections. Naturwissenschaften 93: 597-<br />
602.<br />
Dobado-Berrios, P.M., Tella, J.L., Ceballos, O. & Donázar, J.A. (1998) Effects of age and<br />
captivity on plasma chemistry values of <strong>the</strong> Egyptian Vulture. Condor 100: 719-725.<br />
Donázar, J.A., Negro, J.J. & Hiraldo, F. (1992) Functional analysis of mate-feeding in <strong>the</strong><br />
Lesser Kestrel Falco naumanni. Ornis Scandinavica 23: 190-194.<br />
Donázar, J.A., Negro, J.J. & Hiraldo, F. (1993) Foraging habitat selection, land-use changes<br />
and population decline in <strong>the</strong> <strong>lesser</strong> <strong>kestrel</strong> Falco naumanni. Journal Applied Ecology<br />
30: 515-522.<br />
Fridolfsson, A.K. & Ellegren, H. (1999) A simple and universal method for molecular sexing<br />
of non-ratite birds. Journal of Avian Biology 30: 116-121.<br />
Ferrer, M. (1994) Nutritional condition of Spanish Imperial Eagle nestlings Aquila adalberti.<br />
Bird Study 41: 120-123.<br />
Ferrer, M., Amat, J.A. & Viñuela, J. (1994) Daily variations of blood chemistry values in <strong>the</strong><br />
chinstrp penguin (Pygoscelis antarctica) during <strong>the</strong> Antarctic summer. Comparative<br />
Biochemistry & Physiology A 107: 81-84.<br />
Ferrer, M. & Dobado-Berrios, P. (1998) Factors affecting plasma chemistry values of <strong>the</strong><br />
Spanish imperial Eagle, Aquila adalberti. Comparative Biochemistry & Physiology A 120:<br />
209-217.<br />
García-Rodriguez, T., Ferrer, M., Recio, F. & Castroviejo, J. (1987b) Circadian rhythms of<br />
determined blood chemistry values in Buzzards and Eagle owls. Comparative<br />
Biochemistry & Physiology A 88: 663-669.<br />
Hanauska-Brown, L.A., Dufty A.M. & Roloff, G.J. (2003) Blood chemistry, cytology, and body<br />
condition in adult Nor<strong>the</strong>rn Goshawk (Accipiter gentiles). Journal of Raptor Research<br />
37: 299-306.<br />
107
Hernández, M. & Margalida, A. (2010) Hematology and blood chemistry reference values<br />
and age-related changes in wild bearded vultures (Gypaetus barbatus). Journal of<br />
Wildlife Diseases 46: 390-400.<br />
Jenni-Eiermann, S. & Jenni, L. (1997) Diurnal variation of metabolic responses to short-term<br />
fasting in passerine birds during <strong>the</strong> postbreeding, molting and migratory period.<br />
Condor 99: 113-122.<br />
Jenni-Eiermann, S. & Jenni, L. (1998) What can plasma metabolites tell us about <strong>the</strong><br />
metabolism, physiological satate and condition of individual birds? An overview.<br />
Biologie e Conservazione della Fauna 102: 312-319.<br />
Jerzak, L., Sparks, T.H., Kasprzak, M., et al. (2010) Blood chemistry in white stork Ciconia<br />
ciconia chicks varies by sex and age. Comparative Biochemistry & Physiology B 156:<br />
144-147.<br />
Lavin, S., Cuenca, R., Marco, I., Velarde, R. & Viñas, L. (1992) Hematology and blood<br />
chemistry of Marsh Harrier (Circus aeruginosus). Comparative Biochemistry &<br />
Physiology A 103: 493-495.<br />
Lessells, C.M. & Boag, P.T. (1987) Unrepeatable repeatabilities: a common mistake. Auk 104:<br />
116-121.<br />
Limiñana, R., López-Overa, J.R., Gallardo, M., Fordham, M. & Urios, V. (2009) Blood<br />
chemistry and hematologic values in free-living nestlings of Montagu’s Harriers<br />
(Circus pygargus) in a natural habitat. Journal of Zoo & Wildlife Medicine 40: 687-695.<br />
McCue, M.D. (2010) Starvation physiology: Reviewing <strong>the</strong> different strategies animals use to<br />
survive a common challenge. Comparative Biochemistry & Physiology A 156: 1-188.<br />
Mealey, B., Parks, G.M., Pages, C.M., et al. (2004) Serum chemistry values for nestling Bald<br />
Eagles (Haliaeetus leucocephalus) in Florida Bay, Everglades National Park. Journal of<br />
Raptor Research 38: 96-100.<br />
Negro, J.J. (1997) Lesser Kestrel Falco naumanni. BWP Update 1: 49-56.<br />
Negro, J.J., Bortolotti, G.R., Tella, J.L., Fernie, K.J. & Bird, D.M. (1998) Regulation of<br />
integumentary colour and plasma carotenoids in American Kestrels consistent with<br />
sexual selection <strong>the</strong>ory. Functional Ecology 12: 307-312.<br />
Negro, J.J., Sarasola, J.H., Fariñas, F. & Zorrila, I. (2006) Function and occurrence of facial<br />
flushing in birds. Comparative Biochemistry & Physiology A 143: 78-84.<br />
Negro, J.J., Bustamante, J., Melguizo, C., Ruiz, J.L. & Grande, J.M. (2000) Nocturnal activity of<br />
<strong>lesser</strong> <strong>kestrel</strong>s under artificial lighting conditions in Seville, Spain. Journal of Raptor<br />
Research 34: 327-329.<br />
108
Pérez-Granados, C. (2010) Diet of adult <strong>lesser</strong> <strong>kestrel</strong>s Falco naumanni during <strong>the</strong> breeding<br />
season in central Spain. Ardeola 57: 443-448.<br />
Pérez-Rodríguez, L., Alonso-Alvarez, C., Martínez-Haro, M. & Viñuela, J. (2008) Variation in<br />
plasma biochemical parameters in captive adult red-legged partridges (Alectoris rufa)<br />
during daylight hours. European Journal of Wildlife Research 54: 21-26.<br />
Pomarol, M. (1993) Lesser Kestrel recovery project in Catalonia. In: Nicholls, M.K., Clarke. R.<br />
(Eds.), Biology and conservation of small falcons: Proceedings of <strong>the</strong> 1991 Hawk and<br />
Owl Trust Conference. The Hawk and Owl Trust, London, pp. 24-28.<br />
Rodríguez, A., Alcaide, M., Negro, J.J. & Pilard, P. (2011) Using Major histocompatibility<br />
complex markers to assign <strong>the</strong> geographic origin of migratory birds: <strong>examples</strong> <strong>from</strong><br />
<strong>the</strong> <strong>threatened</strong> <strong>lesser</strong> <strong>kestrel</strong>. Animal Conservation 14: 306-313.<br />
Rodríguez, A., Negro, J.J., Bustamante, J., Fox, J.W. & Afanasyev, V. (2009a) Geolocators map<br />
<strong>the</strong> wintering grounds of <strong>threatened</strong> <strong>lesser</strong> <strong>kestrel</strong>s in Africa. Diversity & Distributions<br />
15: 1010-1016.<br />
Rodríguez, A., Negro, J.J., Fox, J.W. & Afanasyev, V. (2009b) Effects of geolocator attachments<br />
on breeding parameters of Lesser Kestrels. Journal of Field Ornithology 80: 399-407.<br />
Rodríguez, C. & Bustamante, J. (2003) The effect of wea<strong>the</strong>r on <strong>lesser</strong> <strong>kestrel</strong> breeding<br />
success: can climate change explain historical population declines? Journal of Animal<br />
Ecology 72: 793-810.<br />
Rodríguez, C., Bustamante, J., Martínez-Cruz, B. & Negro, J.J. (2005) Evaluation of methods<br />
for gender determination of Lesser Kestrel nestlings. Journal of Raptor Research 39:<br />
127-133.<br />
Rodríguez, C., Johst, K. & Bustamante, J. (2006) How do crop types influence breeding<br />
success in <strong>lesser</strong> <strong>kestrel</strong>s through prey quality and availability? A modelling approach.<br />
Journal of Applied Ecology 43: 587-597.<br />
Rodríguez, C., Tapaia, L., Kieny, F. & Bustamante, J. (2010) Temporal changes in <strong>lesser</strong><br />
<strong>kestrel</strong> (Falco naumanni) diet during <strong>the</strong> breeding season in sou<strong>the</strong>rn Spain. Journal of<br />
Raptor Research 44: 120-128.<br />
Sarasola, J.H., Negro, J.J. & Travaini, A. (2004) Nutritional condition and serum biochemistry<br />
for free-living Swainson’s Hawks wintering in central Argentina. Comparative<br />
Biochemistry & Physiology A 137: 697-701.<br />
Stein, R.W., Yamamoto, J.Y., Fry, M.F. & Wilson, B.W. (1998) Comparative hematology and<br />
plasma biochemistry of Red-Tailed Hawks and American Kestrel wintering in<br />
California. Journal of Raptor Research 32: 163-169.<br />
109
Tella, J.L., Forero, M.G., Hiraldo, F. & Donázar, J.A. (1998) Conflicts between <strong>lesser</strong> <strong>kestrel</strong><br />
conservation and European agricultural policies as identified by habitat analyses.<br />
Conservation Biology 12: 593-604.<br />
Tella, J.L., Hiraldo, F., Donázar, J.A. & Negro, J.J. (1996) Costs and benefits of urban nesting in<br />
<strong>the</strong> <strong>lesser</strong> <strong>kestrel</strong>. In: Bird, D., Varland, D., Negro, J.J. (Eds.), Raptors in Human<br />
Landscapes: Adaptations to Built and Cultivated Environments. Academic Press,<br />
London, pp. 53-60.<br />
Vergara, P. & Fargallo, J.A. (2011) Multiple coloured ornaments in male common <strong>kestrel</strong>s:<br />
different mechanisms to convey quality. Naturwissenschaften 98: 289-298.<br />
Villegas, A., Sánchez, J.M., Corbacho, C., Corbacho, P. & Vargas, J.M. (2004) Blood values of<br />
Bald Ibis (Geronticus eremita) in captivity: comparative ranges and variability with<br />
age, sex and physical condition. Journal of Ornithology 145: 98-104.<br />
Villegas, A., Sánchez, J.M., Costillo, E. & Corbacho, C. (2002) Blood chemistry and<br />
haematocrit of <strong>the</strong> black vulture (Aegypius monachus). Comparative Biochemistry &<br />
Physiology A 132, 489-497.<br />
van Wyk, E., van der Bank, H. & Verdoorn, G.H. (1998) Dynamics of haematology and blood<br />
biochemistry in free-living African whitebacked vulture (Pseudogyps africanus)<br />
nestlings. Comparative Biochemistry & Physiology A 120: 495-508.<br />
110
Tables<br />
Table 1 Blood chemistry values and results of ANOVA tests for nestling and adult Lesser Kestrels. All biochemical parameters are<br />
expressed as mg/dl. Mean, SD and range are absolute values, i.e. <strong>the</strong>y have not been transformed. ANOVA tests were conducted using <strong>the</strong><br />
mean values of nestlings <strong>from</strong> <strong>the</strong> same nest and mean values of adults sampled twice or more times (see text).<br />
Nestlings Adults<br />
Parameter n Mean ± SD Range n Mean ± SD Range F d.f. P<br />
Triglycerides a 332 301.4 ± 203.8 [34.6 , 1038] 135 257.2 ± 255.3 [53.2 , 1388.7] 15.23 1, 211 < 0.001<br />
Cholesterol a 326 216.1 ± 65.1 [87.1 , 476.6] 132 275.7 ± 91.7 [87.9 , 789.6] 30.17 1, 209 < 0.001<br />
Uric acid b 320 16.8 ± 6.4 [3.6 , 38.5] 121 15.1 ± 7.6 [3.9 , 34.0] 4.98 1, 203 0.027<br />
Urea b 317 17.2 ± 9.1 [5.1 , 59.5] 124 16.0 ± 9.4 [0.7 , 47.5] 3.95 1, 204 0.052<br />
a Variable log transformed. b Variable square-root transformed.
Table 2 Summary of fixed effects and <strong>the</strong> overall variability explained (R 2 ) by <strong>the</strong> general linear mixed models on biochemical<br />
parameters of nestling and adult <strong>lesser</strong> <strong>kestrel</strong>s. All response variables were log transformed, excepting uric acid (nestling model) and<br />
urea (adult model) which were square-root transformed.<br />
Triglycerides Cholesterol Uric acid Urea<br />
Estimate ± SE P Estimate ± SE P Estimate ± SE P Estimate ± SE P<br />
Nestlings<br />
Intercept 1.009 ± 0.290 < 0.001 2.035 ± 0.167 < 0.001 1.011 ± 0.966 0.297 0.378 ± 0.241 0.119<br />
Sex - 0.102 - 0.087 - 0.398 - 0.187<br />
Female 0.023 ± 0.001 - 0.011 ± 0.006 - 0.036 ± 0.042 0.013 ± 0.010<br />
Year - 0.611 - < 0.001 - < 0.001 - < 0.001<br />
2007 0.022 ± 0.025 - -0.050 ± 0.015 - -0.294 ± 0.082 - -0.113 ± 0.020 -<br />
2008 0.010 ± 0.022 - 0.032 ± 0.013 - 0.282 ± 0.074 - 0.061 ± 0.018 -<br />
Colony - 0.005 - 0.515 - 0.912 - 0.534<br />
Silo -0.053 ± 0.019 - -0.008 ± 0.012 - -0.007 ± 0.062 - -0.010 ± 0.016 -<br />
Geolocator - 0.111 - 0.825 - 0.195 - 0.287<br />
Untagged -0.035 ± 0.022 - -0.003 ± 0.014 - -0.096 ± 0.074 - -0.020 ± 0.018 -<br />
Time of day 0.056 ± 0.011 < 0.001 0.017 ± 0.007 0.011 0.142 ± 0.037 < 0.001 0.029 ± 0.009 0.002<br />
Body mass 0.002 ± 0.001 0.012 0.000 ± 0.001 0.822 0.003 ± 0.003 0.269 -0.000 ± 0.001 0.826<br />
Laying date 0.004 ± 0.002 0.024 0.001 ± 0.001 0.522 0.008 ± 0.005 0.148 0.004 ± 0.001 0.002<br />
Brood identity (%) 6.1 - 38.4 - 17.3 - 22.2 -<br />
R 2 (%) 26.9 - 55.7 - 36.1 - 45.8 -<br />
Adults<br />
Intercept 0.678 ± 0.323 0.038 2.527 ± 0.183 < 0.001 0.094 ± 0.265 0.778 0.564 ± 1.483 0.705<br />
Sex - 0.478 - 0.264 - 0.750 - 0.751
Female -0.023 ± 0.032 - -0.020 ± 0.018 - 0.008 ± 0.026 - 0.046 ± 0.143 -<br />
Year - < 0.001 - 0.157 - 0.506 - 0.031<br />
2007 0.185 ± 0.042 - -0.031 ± 0.024 - -0.035 ± 0.035 - -0.344 ± 0.198 -<br />
2008 -0.056 ± 0.043 - 0.046 ± 0.024 - 0.040 ± 0.036 - 0.511 ± 0.191 -<br />
Age - 0.168 - 0.262 - 0.405 - 0.514<br />
0.048 ± 0.034 - 0.022 ± 0.019 - 0.023 ± 0.028 - 0.105 ± 0.161 -<br />
Time of day 0.028 ± 0.017 0.103 -0.003 ± 0.010 0.797 0.049 ± 0.014 < 0.001 0.173 ± 0.078 0.028<br />
Body mass 0.009 ± 0.002 < 0.001 -0.000 ± 0.001 0.947 0.001 ± 0.002 0.357 0.003 ± 0.008 0.722<br />
Capture date 0.000 ± 0.001 0.796 -0.001 ± 0.001 0.199 0.002 ± 0.001 0.006 0.006 ± 0.004 0.162<br />
Identity (%) 10.0 - 7.0 - 8.1 - 2.7 -<br />
R 2 (%) 46.8 - 20.5 - 38.4 - 26.1 -
Table 3 Results of General Linear Mixed models for phenotypic traits introducing<br />
significant terms of Table 2 and brood identity (for nestlings) and individual identity (for<br />
adults) as random factors.<br />
Variable<br />
response<br />
Nestlings<br />
Variable<br />
independent<br />
Estimate ± SE F d.f. P<br />
Triglycerides a Tail Band Width 0.00038 ± 0.00385 0.01 1, 275.9 0.921<br />
Chroma 0.10854 ± 0.13807 0.91 1, 278.3 0.341<br />
Brightness - 0.01157 ± 0.00487 5.65 1, 269.2 0.018<br />
Cholesterol a Tail Band Width 0.00055 ± 0.00169 0.10 1, 285.8 0.745<br />
Chroma - 0.08467 ± 0.05869 2.08 1, 301.3 0.150<br />
Brightness 0.00041 ± 0.00216 0.03 1, 302.8 0.851<br />
Uric acid b Tail Band Width -0.00758 ± 0.01195 0.40 1, 273.1 0.527<br />
Chroma 0.01123 ± 0.39688 0.00 1, 276.4 0.977<br />
Brightness - 0.01057 ± 0.01484 0.50 1, 281.1 0.477<br />
Urea a Tail Band Width 0.00114 ± 0.00295 0.14 1, 272.4 0.699<br />
Adults<br />
Chroma - 0.16672 ± 0.09967 2.79 1, 281.3 0.096<br />
Brightness 0.00339 ± 0.00371 0.83 1, 290.8 0.361<br />
Triglycerides a Tail Band Width 0.00665 ± 0.00415 2.56 1, 104.3 0.112<br />
Chroma 0.04139 ± 0.14824 0.07 1, 120.6 0.781<br />
Brightness - 0.01163 ± 0.00731 2.52 1, 123.7 0.115<br />
Cholesterol a Tail Band Width 0.00217 ± 0.00206 1.11 1, 100.7 0.294<br />
Chroma - 0.03074 ± 0.07727 0.15 1, 126.4 0.691<br />
Brightness 0.00216 ± 0.00400 0.29 1, 126.7 0.591<br />
Uric acid a Tail Band Width 0.00221 ± 0.00301 0.53 1, 82.12 0.466<br />
Chroma 0.06414 ± 0.12143 0.25 1, 104.9 0.599<br />
Brightness - 0.00511 ± 0.00604 0.71 1, 113.3 0.399<br />
Urea b Tail Band Width - 0.00183 ± 0.01705 0.01 1, 66.86 0.915<br />
Chroma 0.15205 ± 0.65867 0.05 1, 112.6 0.818<br />
Brightness - 0.06485 ± 0.03199 4.11 1, 112.2 0.045<br />
a Variable log transformed. b Variable square-root transformed.<br />
114
Figures<br />
Fig. 1 Relationship between biochemical parameters of nestling (filled circles) and adult<br />
(open circles) <strong>lesser</strong> <strong>kestrel</strong>s and sampling time. Least square means (± SE) <strong>from</strong> saturated<br />
models <strong>from</strong> Table 2 are shown.<br />
115
Fig. 2 Relationship between Triglyceride plasma levels and body mass (both variables<br />
standardized by regression of <strong>the</strong> o<strong>the</strong>r variables in <strong>the</strong> models in Table 2, i.e. leverage<br />
plots) for nestlings and adults. Dashed lines indicate 95 % confidence bands of simple linear<br />
regressions.<br />
116
Fig. 3 Relationship between cholesterol (A) and triglycerides (B) levels of nestlings and<br />
number of nestlings. Least square means (± SE), <strong>from</strong> models including <strong>the</strong> significant<br />
terms <strong>from</strong> Table 2 and number of nestlings as an ordinal variable, are shown.<br />
117
Fig. 4 Relationship between urea levels of adult <strong>lesser</strong> <strong>kestrel</strong>s captured after June 10th and<br />
breeding success (measured as number of fledglings).<br />
118
General discussion<br />
Lesser <strong>kestrel</strong> is one of <strong>the</strong> best studied bird species in <strong>the</strong> world, considering than a<br />
majority of studies have been conducted on free-ranging populations. More than two<br />
hundred papers in international scientific journals and ten PhD <strong>the</strong>sis defended in several<br />
countries, as well as a huge number of articles in popular magazines have been published<br />
mainly reporting aspects of its breeding and foraging ecology, conservation status or<br />
genetics. This PhD attempts to fill a gap of knowledge on <strong>the</strong> migration ecology and<br />
migratory connectivity of <strong>the</strong> <strong>lesser</strong> <strong>kestrel</strong>. Fur<strong>the</strong>rmore, it explores for first time <strong>the</strong><br />
general nutritional condition through plasma biochemical metabolites in <strong>the</strong> breeding<br />
grounds before migration.<br />
Migration and wintering areas<br />
Recent advances in telemetry and tracking have revolutionized <strong>the</strong> study of bird migration<br />
(reviewed in Robinson et al. 2010). The miniaturization of devices is <strong>the</strong> most significant<br />
aspect because it has let to tag a wide group of small birds. The miniaturized geolocators<br />
are currently <strong>the</strong> lightest devices (as light as 1 gram) which let us to track small passerine<br />
birds (Stutchbury et al. 2009). Although geolocators have been widely used in marine birds,<br />
<strong>the</strong>ir use in terrestrial species had been quite limited. Our study is <strong>the</strong> first one applying<br />
this technology in raptors. Eventhough several devices failed to provide information, <strong>the</strong><br />
results were far-reaching. On <strong>the</strong> positive side, geolocators provided in one year of study<br />
more information than <strong>the</strong> ringing of thousands <strong>lesser</strong> <strong>kestrel</strong>s during <strong>the</strong> last 30 years. We<br />
demonstrated conclusively that Spanish birds wintered in West Africa. On <strong>the</strong> negative side,<br />
we failed to determine <strong>the</strong> migration routes because of several factors: First, migration<br />
overlaps temporally with <strong>the</strong> equinoxes (when day and night time are approximately equal<br />
at all latitudes). At times near equinox, geolocators are not able to report accurate<br />
latitudinal estimates (Hill 1994). Second, only two locations are provided by day (Hill 1994)<br />
and given <strong>the</strong> apparent short time needed by <strong>kestrel</strong>s to migrate (according to longitude<br />
119
data 5 ± 1 and 24.3 ± 10 days for post- and pre-nuptial migrations, respectively), a small<br />
number of fixes are available, hindering us to use <strong>the</strong>se data. Finally, we failed to get useful<br />
data <strong>from</strong> nine of <strong>the</strong> 13 retrieved geolocators. Due to <strong>the</strong> lack of previous studies, we<br />
decided to tag birds using backpack harnesses and PVC rings (typically used in marine<br />
birds). We found that geolocators mounted in backpack harnesses worked better than leg<br />
mounted ones. Thus, leg mounted geolocators showed damaged caused by bites, scratches<br />
and ingrained dirt. However, Catry et al. (2010) reported pre-nuptial migration routes<br />
based on geolocators leg mounted. According to this study, <strong>kestrel</strong>s showed inter individual<br />
variations in migration routes, some birds flying hundreds of kilometers over <strong>the</strong> sea.<br />
Additionally, <strong>the</strong> estimated duration of migrations was similar to our data for <strong>the</strong> post-<br />
nuptial migration (4.8 ± 1.1 and 4.1 ± 0.3 days for post- and pre-nuptial migrations; Catry et<br />
al. 2010).<br />
In chapter three, we used a non-invasive approach that relies on major<br />
histocompatibility complex (MHC) polymorphism to infer <strong>the</strong> breeding origin of individuals<br />
wintering in its most important wintering quarters in <strong>the</strong> Sub-Saharan Africa (Senegal and<br />
South Africa; LPO 2010, MKP 2010). To our knowledge, MHC genes have never been used<br />
for this purpose in birds, but in salmons is a relatively frequently technique used with o<strong>the</strong>r<br />
genetic markers to take appropriate decisions on <strong>the</strong> salmon fisheries management<br />
(Beacham et al. 2001, 2004). MHC genes of o<strong>the</strong>r migratory birds could be more structured<br />
than o<strong>the</strong>r nuclear markers (e.g. microsatellites), and thus letting us to use <strong>the</strong>m migratory<br />
connectivity studies. For example, Great Snipe Gallinago media populations <strong>from</strong><br />
Scandinavia and mainland Europe are highly structured populations (Ekblom et al. 2007).<br />
We found private alleles <strong>from</strong> western European breeding populations in <strong>the</strong> Senegalese<br />
roost, indicating a strong connectivity between <strong>the</strong>se two areas. On <strong>the</strong> o<strong>the</strong>r hand, birds<br />
wintering in South Africa were genetically differentiated with respect to western European<br />
breeding populations, and might <strong>the</strong>refore ga<strong>the</strong>r individuals <strong>from</strong> <strong>the</strong> eastern distribution<br />
range (note that Asia was not adequately sampled). Our results coming <strong>from</strong> South Africa<br />
are similar to those reported by Wink et al. (2004) using mitochondrial DNA.<br />
Our results on migration and wintering ranges are crucial for <strong>the</strong> development of<br />
conservation measures for <strong>the</strong> species. In this sense, Mihoub et al. (2010) assumed that<br />
French <strong>lesser</strong> <strong>kestrel</strong>s wintered in Sahel region, and <strong>the</strong>y found that yearling survival<br />
probabilities were strongly correlated with rainfalls in <strong>the</strong> Sahel, suggesting a high<br />
dependence of juvenile upon <strong>the</strong> wintering conditions.<br />
120
Technical notes<br />
In <strong>the</strong> second chapter, we assess <strong>the</strong> effect of gelocators on <strong>the</strong> breeding parameters<br />
of <strong>lesser</strong> <strong>kestrel</strong>s. Except some collateral damages in individual birds (i.e., small wounds),<br />
no severe alterations in <strong>the</strong> breeding parameters were observed comparing tagged and<br />
untagged pairs. The 2007 and 2008 breeding seasons were exceptionally good for <strong>the</strong><br />
reproduction of <strong>lesser</strong> <strong>kestrel</strong>s (3.3 and 3.2 fledglings per successful nest, respectively).<br />
This may explain <strong>the</strong> lack of detrimental effects of geolocators.<br />
Nestlings of tagged individuals had higher triglyceride and uric acid concentrations<br />
in <strong>the</strong>ir blood than control nestlings during <strong>the</strong> breeding season following tagging (2008).<br />
However, in posterior analyses including more nestlings <strong>from</strong> o<strong>the</strong>r years, this factor<br />
(presence/absence of tagged parents) did not reach significance (see chapter five). A high<br />
nestling mortality was observed in <strong>the</strong> 2009 breeding season, resulting in a lower breeding<br />
success (2.5 fledglings per successful nest) than in 2007 and 2008 breeding seasons.<br />
Therefore, <strong>the</strong> inclusion of nestlings with worse nutritional condition (those <strong>from</strong> 2009) in<br />
<strong>the</strong>se more general analyses seems to explain <strong>the</strong> non-significance for this factor (see<br />
chapter five).<br />
Working with MHC markers is not easy and several caveats must be highlighted. The<br />
characterization of MHC genes in non-model species, <strong>the</strong> co-amplification of different<br />
fragments of <strong>the</strong> multigene family during single PCR experiments and extensive levels of<br />
genetic polymorphism require a considerable set-up before using <strong>the</strong>se markers (reviewed<br />
by Babik 2010). However, important advances for <strong>the</strong> amplification and genotyping of MHC<br />
genes in non-model species have been developed in <strong>the</strong> last years (Babik 2010). In chapter<br />
four, we test <strong>the</strong> accuracy of PHASE algorithm implanted in DNAsp software (Librado &<br />
Rozas 2009) to infer <strong>the</strong> gametic phase of PCR amplicons of class I and II MHC genes. Our<br />
results suggest that a minimum allele to individual ratio (1:2) to yield 100% accuracy for<br />
both MHC loci. This procedure let us to avoid <strong>the</strong> traditional and laborious cloning methods,<br />
saving money and time in <strong>the</strong> MHC genotyping.<br />
Nutritional condition<br />
As a consequence of logistic problems (<strong>the</strong> obtaining of an adequate sample size just before<br />
migration -August-September- is difficult because birds do not come into <strong>the</strong>ir nest-cavities,<br />
where capture is relatively easy), our study was conducted during <strong>the</strong> breeding period. As<br />
121
far as we know, nutritional condition of <strong>lesser</strong> <strong>kestrel</strong>s has not been previously evaluated<br />
using plasma biochemical markers, and <strong>the</strong>refore, ours is a novel study on <strong>the</strong> species<br />
biology, as well as on biochemistry and physiology of raptors. More robust statistical<br />
analyses than most studies that report blood metabolites in birds, especially raptors, are<br />
used in <strong>the</strong> present study. Fur<strong>the</strong>rmore, <strong>the</strong> relative large samples sizes let us to test <strong>the</strong><br />
effect of multiple factors.<br />
We found that nearly all ranges of plasma metabolites (triglycerides, cholesterol, uric<br />
acid and urea) for nestlings and adults overlapped with those described for o<strong>the</strong>r free-living<br />
raptors, suggesting that condition was similar to o<strong>the</strong>r falconiforms. However, we<br />
consistently detected higher mean values of triglycerides than in o<strong>the</strong>r raptors. These<br />
differences might be explained by <strong>the</strong> higher feeding frequency of <strong>lesser</strong> <strong>kestrel</strong>s in<br />
comparison with <strong>the</strong> majority of studied species.<br />
Several factors (year, colony, sampling time, body mass, laying date and capture<br />
date) influenced at least one plasma biochemical parameter. Sampling time was <strong>the</strong> most<br />
influential factor as it reached significance for nearly all parameters. As a consequence of<br />
<strong>the</strong> increase of feeding rate in <strong>the</strong> morning, nestlings showed a postprandial increase in all<br />
biochemical parameters analyzed. Uric acid and urea levels of adults also increased during<br />
<strong>the</strong> morning possibly because <strong>the</strong> increase of workload of reproduction duties. Despite<br />
sexual dimorphism of <strong>lesser</strong> <strong>kestrel</strong> and differences in <strong>the</strong> breeding behaviour, no sexual<br />
differences were detected for any biochemical parameter.<br />
Future research<br />
The present PhD tried to shed light on some previously unknown basic questions of life<br />
history traits of <strong>lesser</strong> <strong>kestrel</strong>s. However, it also opens new questions. It is now clear that<br />
<strong>the</strong>re are at least two main wintering grounds for <strong>lesser</strong> <strong>kestrel</strong>s in Africa (Wink et al. 2004,<br />
Rodríguez et al. 2011). The western route is considerably shorter than <strong>the</strong> eastern one,<br />
raising interesting questions on energetic constraints and adaptations for medium or long-<br />
distance migration in birds travelling one or <strong>the</strong> o<strong>the</strong>r migration route. The development<br />
and miniaturization of satellite devices will let us know <strong>the</strong> duration of migration journeys,<br />
as well as determine <strong>the</strong> location of stopover sites. Relating sedentary/migrant behaviours<br />
and/or migration traits with breeding parameters could help to elucidate <strong>the</strong> trade offs of<br />
both strategies and <strong>the</strong>ir evolutionary consequences. Fur<strong>the</strong>rmore, GPS dataloggers could<br />
122
e used on <strong>the</strong> wintering grounds to study habitat use and explain how <strong>lesser</strong> <strong>kestrel</strong>s can<br />
avoid prey depletion in <strong>the</strong> surroundings of <strong>the</strong> crowded roosts (Bonal & Aparicio 2008).<br />
A crucial question in conservation of this migratory species is to assess <strong>the</strong> migratory<br />
connectivity level between <strong>the</strong> different South African roosts and <strong>the</strong> breeding areas, i.e. <strong>the</strong><br />
roost site fidelity. A strong connectivity (i.e. <strong>the</strong> breeding populations winter in single,<br />
mutually exclusive roosts) highlights <strong>the</strong> relevance for conservation of roost sites (Marra et<br />
al. 2006). This has been recently addressed using stable isotopes for <strong>the</strong> Amur falcon Falco<br />
amurensis, a species which share roosts with <strong>the</strong> <strong>lesser</strong> <strong>kestrel</strong>s (Symes & Woodborne<br />
2010). A similar methodology can be applied to <strong>lesser</strong> <strong>kestrel</strong>s.<br />
References<br />
Babik, W. (2010) Methods for MHC genotyping in nonmodel vertebrates. Molecular Ecology<br />
Resources 10: 237-251.<br />
Beacham, T.D., Candy, J.R., Supernault, K.J., et al. (2001) Evaluation and application of<br />
microsatellite and major histocompatibility complex variation for stock identification<br />
of coho salmon in British Columbia. Transactions of <strong>the</strong> American Fisheries Society 130:<br />
1116-1149.<br />
Beacham, T.D., Lapointe, M., Candy, J.R., Miller, K.M. & Withler, R.E. (2004) DNA in action:<br />
Rapid application of DNA variation to sockeye salmon fisheries management.<br />
Conservation Genetics 5: 411-416.<br />
Bonal, R. & Aparicio, J.M. (2008) Evidence of prey depletion around <strong>lesser</strong> <strong>kestrel</strong> Falco<br />
naumanni colonies and its short term negative effects. Journal of Avian Biology 39:<br />
189-197.<br />
Catry, I., Dias, M.P., Catry, T., Afanasyev, V., Fox, J.W., Franco, A.M.A. & Su<strong>the</strong>rland, W.J.<br />
(2010) Individual variation in migratory movements and winter behaviour of Iberian<br />
Lesser Kestrels Falco naumanni revealed by geolocators. Ibis 153: 154-164.<br />
Ekblom, R., Sæ<strong>the</strong>r, S.A., Jacobson, P., et al. (2007) Spatial patterns of MHC class II variation<br />
in <strong>the</strong> great snipe (Gallinago media). Molecular Ecology 16: 1439-1451.<br />
Hill, R.D. (1994) Theory of geolocation by light levels. In: Le Boeuf, B.J. & Laws, R.M. (Eds.),<br />
Elephant Seals, Population, Ecology, Behaviour and Physiology. University of California<br />
Press, Berkeley, USA, pp. 227-236.<br />
Librado, P. & Rozas, J. (2009) DnaSP v5: a software for comprehensive analysis of DNA<br />
polymorphism data. Bioinformatics 25: 1451-1452.<br />
123
LPO (2010) Ligue pour la Protection des Oiseaux. Dernieres nouvelles des faucons<br />
crecerellettes au Senegal. In: Faucon crecerellette. Ligue pour la Protection des<br />
Oiseaux. Available at http://crecerellette.lpo.fr<br />
Marra, P.P., Norris, D.R., Haig, S.M., Webster, M. & Royle J.A. (2006) Migration connectivity.<br />
In: Crooks, K.R. & Sanjayan, M. (Eds.), Connectivity Conservation. Cambridge University<br />
Press, New York, USA, pp. 157-183.<br />
Mihoub, J-B., Gimenez, O., Pilard, P. & Sarrazin, F. (2010) Challenging conservation of<br />
migratory species: Sahelian rainfalls drive first-year survival of <strong>the</strong> vulnerable Lesser<br />
Kestrel Falco naumanni. Biological Conservation 143: 839-847.<br />
MKP (2010) Migrating Kestrel Project. Available at http://www.<strong>kestrel</strong>ing.com<br />
Robinson, W.D., Bowlin, M.S., Bisson, I., et al. (2010) Integrating concepts and technologies<br />
to advance <strong>the</strong> study of bird migration. Frontiers in Ecology & Environment 8: 354-361.<br />
Rodríguez, A., Alcaide, M., Negro, J.J. & Pilard, P. (2011) Using MHC markers to assign <strong>the</strong><br />
geographic origin of migratory birds: <strong>examples</strong> <strong>from</strong> <strong>the</strong> <strong>threatened</strong> <strong>lesser</strong> <strong>kestrel</strong>.<br />
Animal Conservation 14: 306-313.<br />
Symes, C.T. & Woodborne, S. (2010) Migratory connectivity and conservation of <strong>the</strong> Amur<br />
Falcon Falco amurensis: a stable isotope perspective. Bird Conservation International<br />
20: 134-148.<br />
Stutchbury, B.J.M., Tarof, S.A., Done, T., Gow, E., Kramer, P.M., Tautin, J., Fox, J.W. &<br />
Afanasyev, V. (2009) Tracking Long-Distance Songbird Migration by Using<br />
Geolocators. Science 323: 896.<br />
Wink, M., Sauer-Gürth, H. & Pepler, D. (2004). Phylogeographic relationships of <strong>the</strong> Lesser<br />
Kestrel (Falco naumanni) in breeding and wintering quarters inferred <strong>from</strong> nucleotide<br />
sequences of <strong>the</strong> mitochondrial cytochrome b gene. In: Chancelor, R.D. & Meyburg, B.-<br />
U. (Eds.), Raptors Worldwide. WWGBP, Berlin, Germany, pp. 505-510.<br />
124
125<br />
Conclusions<br />
1. Geolocators have failed to elucidate <strong>the</strong> migration routes, but <strong>the</strong>y have provided<br />
invaluable information on <strong>the</strong> wintering areas of individuals with a known breeding origin.<br />
The <strong>lesser</strong> <strong>kestrel</strong>s <strong>from</strong> <strong>the</strong> western European breeding range winter in West Africa. They<br />
show an apparent link with <strong>the</strong> deltas of Senegal and Saloum rivers.<br />
2. Geolocators have no detrimental effects on <strong>the</strong> studied breeding parameters of <strong>lesser</strong><br />
<strong>kestrel</strong>s (clutch size, breeding success or laying date). However, nestlings with tagged<br />
parents showed higher levels of triglycerides and uric acid in blood than nestlings with<br />
control parents.<br />
3. At least at a wide continental scale, Major Histocompatibility Complex class II genes are<br />
useful to determine <strong>the</strong> origin of <strong>lesser</strong> <strong>kestrel</strong>s. Birds wintering in Senegal came <strong>from</strong> <strong>the</strong><br />
Western breeding range (Europe), however birds wintering in South Africa came <strong>the</strong><br />
Eastern breeding range. MHC resolution was similar to o<strong>the</strong>r typically used genetic markers<br />
on connectivity migration studies, as for example, mitochondrial DNA.<br />
4. The use of PHASE algorithm to infer gametic phase is an accurate tool for <strong>the</strong> genotyping<br />
of MHC genes of <strong>the</strong> <strong>lesser</strong> <strong>kestrel</strong>. A critical influence of <strong>the</strong> allele to individual ratio on<br />
PHASE performance was detected. A minimum allele to individual ratio (1:2) yielded 100%<br />
accuracy for both MHC loci.<br />
5. We consistently detected higher mean values of triglycerides in <strong>lesser</strong> <strong>kestrel</strong>s than in<br />
o<strong>the</strong>r free-living raptors as a consequence of <strong>the</strong>ir small-sized prey. Lesser <strong>kestrel</strong>s show<br />
higher feeding rates than o<strong>the</strong>r larger raptors, like eagles or vultures, keeping high values of<br />
triglycerides in blood.<br />
6. Nestlings show a postprandial increase in all biochemical parameters analyzed because<br />
of <strong>the</strong> increase of feeding rate in <strong>the</strong> morning. Uric acid and urea levels of adults also<br />
increased during <strong>the</strong> morning possibly because <strong>the</strong> increase of workload.
126
Acknowledgments<br />
127<br />
Agradecimientos<br />
I am indebted to my supervisors Dr. Juan J. Negro and Dr. Miguel Alcaide who have provided<br />
excellent guidance and supervision. Without <strong>the</strong>ir help and advice, this study would never<br />
be equal. The Doñana Biological Station (including <strong>the</strong> students, researchers and <strong>the</strong>ir staff<br />
<strong>from</strong> <strong>the</strong> zoological collection, library, administration and coordination offices,<br />
teledetection, molecular, chemistry and ecophysiology labs, maintenance department, and<br />
natural processes monitoring team) provided <strong>the</strong> invaluable framework to work in my<br />
<strong>the</strong>sis on <strong>the</strong> <strong>lesser</strong> <strong>kestrel</strong>, as well as in o<strong>the</strong>r studies. My thanks goes also to <strong>the</strong> many<br />
(remunerated or volunteers) field technicians who have assisted me during <strong>the</strong> field work,<br />
especially to Luna Puentes and Pepe Ayala. I am also indebted to <strong>the</strong> Department of<br />
Evolutionary Ecology of Doñana Biological Station for <strong>the</strong> economical support necessary to<br />
assist to several congresses and for providing <strong>the</strong> economical costs of some publications.<br />
During 2007-2010, I was enjoying an I3P predoctoral fellowship <strong>from</strong> <strong>the</strong> <strong>CSIC</strong>. This<br />
grant let me to carry out two research stays in two wonderful places. In August-October<br />
2008, thanks to Professor Erkki Korpimäki, I visited <strong>the</strong> study area of many papers on <strong>the</strong><br />
common <strong>kestrel</strong> located in <strong>the</strong> surroundings of Kauhava town (Finland), as well as <strong>the</strong><br />
University of Turku. Many thanks goes to Eric Le Tortorec, Jorma Nurmi, Kalle Rainio,<br />
Markus Ahola, Chiara Morosinotto, Kirsi Reponen, Toni Laaksonen, Robert Thompson for<br />
doing our stay very nice. Especial thanks to Ville Vasko for showing us (Rut and me) <strong>the</strong><br />
Finnish idiosyncrasy, Jurmo Island, <strong>the</strong> near endless journey of hard fieldwork between<br />
mosquitoes, and obviously to introduce me to Finnish heavy metal. Kiitos!!!<br />
In October-November 2010, I enjoyed a wonderful and stimulating research stay on<br />
Kauai (Hawaiian Islands). I am grateful to Andrea Erichsen (Hawaii State Department of<br />
Land and Natural Resources, University of Hawai) and Nick D. Holmes (Kauai Endangered<br />
Seabirds Recovery Project) for holding me at <strong>the</strong>ir offices. In <strong>the</strong> offices, I shared a nice time<br />
with Emily Harbour, Solny Adalsteinsson, Angie Merritt, Mat<strong>the</strong>w P. Lucas, Barbara Heindl,<br />
Cali Crampton, Lea Taddonio and <strong>the</strong>ir families. During my stay on Kauai, in company of<br />
Chris (<strong>the</strong> guy with Mexican, American and Spanish blood), Cody, Andrew and <strong>the</strong>ir friends,
I surfed like in <strong>the</strong> Canaries. Also, Judy Lukatah helped to improve my English with her long<br />
interesting hippie stories. But I am especially grateful to Matty because I gave me all <strong>the</strong><br />
surfboards I broke. He is <strong>the</strong> only responsible. Thanks you for <strong>the</strong> surf camps on Haena and<br />
Polihale beaches. Mahalo!!!<br />
Afortunada o desafortunadamente, soy consciente de que esta parte de la tesis será<br />
seguramente la más leída. Por tanto, parte de ella será escrita en castellano. En primer lugar<br />
quiero agradecer a mi familia por soportar (o disfrutar) mis estancias en el continente.<br />
Volveré, no sé cuando, pero volveré, y alguna vez será definitivo (y espero que no sea con<br />
los pies por delante). Especialmente a ma y a pa (Carmen Mari y Felipe) por la aceptación de<br />
mi forma de vida, por el enorme apoyo logístico durante los trámites burocráticos en la<br />
distancia, por posibilitar que usted esté leyendo esto y por infinidad de ayudas prestadas. Se<br />
oye comentar a las gentes del lugar: “no somos nada”, pero sin ellos no hubiera sido ni eso.<br />
A los amigos de Buenavista les tengo que dar mil gracias por seguir aguantándome,<br />
recibiéndome y compartiendo sus cosas como si nunca me hubiera ido. Ellos son los de<br />
siempre, aunque parece que el grupo no para de crecer (y que así sea): Ricardo, Aduanich,<br />
Raico, Germán, Coré, Ingrid, Aarón, Miguelito, Heizel, Efraín, Melissa, Elisa, Keren, Antonio,<br />
Esteban, Ayoze, Juanito, y una larguísima lista de nombres (demasiado larga como para<br />
ponerla aquí). También al team Chivata por seguir recordándome cada mucho tiempo<br />
(desgraciadamente) lo que es el surf en el sur.<br />
Los hermanos McKanan (Felipe y Lolo Siverio) y, por supuesto Bene, han contribuido<br />
a que planee sobre nidos de aguilillas, halcones y guinchos multitud de veces, a pesar de<br />
haber estado sentado detrás de un ordenador en Sevilla. Rubén Barone me ha tenido al<br />
corriente de todo el conocimiento de la naturaleza macaronésica que se acumulaba durante<br />
estos años de tesis. Al grupo de ecología y evolución en islas del IPNA (<strong>CSIC</strong>) dirigido por<br />
Manuel Nogales, especialmente a David, Bea, Aarón, Patri y Beni, también les debo mil<br />
gracias por iniciarme en la biología de campo. A mi hermano, fotógrafo de naturaleza<br />
canaria por excelencia, le doy las gracias por enseñarme lo poco que sé y por crear la<br />
maravillosa portada, y a Nazaret por alimentarlo y prestármelo durante mis visitas.<br />
También a Walo y a Laura por permitirme regresar en 2010 a la isla del amor y la alegría.<br />
Estaré eternamente agradecido a aquellos que durante mis primeros días en Sevilla<br />
me dieron cobijo. Isa y Manu me dejaron dormir en una cama rodeada de trastos que al<br />
apagar la luz daban miedo. Jordi dejó que danzara por su casa en trapos menores durante<br />
algunos días. Después de esos primeros días, junto a mis buenos compañeros (Emanuel y<br />
128
Alicia) conseguimos un piso donde el diablo perdió los calzones. Un año más tarde nos<br />
mudamos al barrio de la Maca donde me dejaron solito, pero otros buenos compañeros,<br />
Carlos Marfil y Mat<strong>the</strong>w, los sustituyeron. A mi regreso de Finlandia, ocupé la casa de David,<br />
Amparo y Lidia hasta que encontré mi actual nido de amor que comparto con Rut. Espero<br />
que todos mis compañeros de piso hayan disfrutado mis arroces, lentejas y garbanzos tanto<br />
como yo, y que al menos una vez hayan probado las maravillosas arepas. Mil gracias a todos<br />
ellos por agradecer lo mal cocinero que soy y, por supuesto, por la magnífica convivencia.<br />
Durante los últimos años he compartido mi vida con una princesa (Rut) y una princesita<br />
(Tina). A la primera, le debo todo el apoyo que me ha dado cuando las cosas se ponían<br />
cuesta arriba o cuesta abajo. No sé como lo haces, pero en lo bueno y en lo malo siempre<br />
estás ahí. A la segunda, que no me dejara leer trabajos científicos en horario nocturno en el<br />
sofá de casa, aunque su finalidad fuera que la acariciara sin descanso.<br />
A todos los que compartieron la comuna y tuvieron que soportar mis malos hábitos<br />
de trabajo (gruñidos, rabietas, panes, etc.) les doy las gracias por no presentar<br />
reclamaciones formales (Olga, Emanuel, Alicia, Louise, Ainara, Amparo, David, Ana, Luis,<br />
Sarasola, y muchos más que no recuerdo porque éramos tantos que íbamos y veníamos...).<br />
Pero también a Franca por amenizarnos las mañanas teléfono en mano como si quisiera<br />
parecerse a Gila. Desde que nos mudamos a La Cartuja debe soportarme un grupo bastante<br />
menor, pero mucho más maltratado. Los perjudicados son Helder, Jesús Byoss, David<br />
O’Channal, Mara, y los itinerantes (Carlos Camacho, Sarasola, Lazlo,…). Gracias por<br />
compartir estimulantes charlas sobre nuestro futuro científico, extra pair paternity, política,<br />
el aire del despacho, y demás cosas serias como le tour de France o contraportadas de<br />
diarios deportivos. Pero por supuesto también a todos con los que he compartido algunos<br />
minutos discutiendo sobre ciencia en pasillos, despachos, bares, correos electrónicos, etc.<br />
(Luisito Cadahía, Antonio Castilla, Matthias, David O’Channal, Roger, Jimi Potti, etc.). Aquí<br />
quiero hacer mención especial a Jordi Figuerola y Juli Broggi por asesorarme, aconsejarme,<br />
e involucrarse en algún capítulo cuando la cosa parecía que no tenía salida.<br />
A todo el personal de los laboratorios que ha analizado mis muestras (Nuria,<br />
Nazaret, e Isa –LEQ–, Nene y Olaya –LEF–, Juan, Mónica, Álvaro y Antonio –LEM), de la<br />
biblioteca que ha atendido mis consultas bibliográficas (Franca, María Ángeles, Juan María y<br />
Marina), del equipo de mantenimiento, seguridad y limpieza por el apoyo logístico (Teresa,<br />
Isabel, Olga, La Pepi, Kike, Antonio, Miguel, Pedro, Soraya, Juan, Óscar, Raúl), y al equipo de<br />
seguimiento por ayudarme con las calzadas (José Luis del Valle, Luis García, Rubén<br />
Rodríguez y Antonio Martínez) les debo unas gracias sinceras. También a la gente del LAST,<br />
David Aragonés e Isa Afán, por resolver mis múltiples dudas de mapitas, proyecciones y<br />
129
coordenadas. A los que integran el proyecto HORUS, Manuel Baena, Javier Bustamante,<br />
Carlos Rodríguez y Jesús Marín, y a DEMA y sus gentes les debo una por compartir sus<br />
saberes. Muchas gracias también a los fotógrafos (Pepe Antolín y Philippe Pilard) por ceder<br />
las fotos para ilustrar esta tesis.<br />
Pero no sólo de pan vive el hombre. Las horas de curro se terminaban y empezaban<br />
las de las cervezas o el ocio. Matthias, Jordi, Juli, Fernando Pacios, Ana y José Vicente han<br />
sido los principales responsables, pero no los únicos, de mi afición a la cerveza. Charlas,<br />
discusiones, encuentros y alguna que otra borrachera he tenido con las intermonísimas,<br />
Caro (mi hija), Mercedes, Ike, Rut y Eme. También fui alguna vez a la playa a intentar coger<br />
olas con Grego y David O’Channal; e Ike y Juan me ofrecieron alojamiento en San Ambrosio<br />
durante algunas jornadas de surfing. A la gente del fútbol Bami, Ricardo, Javi G, Calamaro,<br />
Roberto Paneque, Joaquím Ayerbe, Matthias, Manolillo, Mora, Miki, Santi, Juan y Javier<br />
Balbontín, y a todos los que pasaron por las canchas, muchísimas gracias por compartir sus<br />
artes deportivas.<br />
A todas y a todos, ¡¡¡muchísimas gracias!!!<br />
130
131<br />
Funding<br />
The PhD was financially supported by Ministry of Science and Innovation, Spanish<br />
Government (Ministerio de Ciencia e Innovación, Gobierno de España) and Andalusian<br />
Government (Junta de Andalucía) through an I3P pre-doctoral fellowship (I3P-BPD-2006)<br />
and several research projects (Projects CGL2004-04120/BOS, CGL2006-07481/BOS and<br />
CGL2009-10652/BOS, and HORUS Project P06-RNM-01712).