

3D DISCRETE DISLOCATION DYNAMICS APPLIED TO ... - NUMODIS
3D DISCRETE DISLOCATION DYNAMICS APPLIED TO ... - NUMODIS
3D DISCRETE DISLOCATION DYNAMICS APPLIED TO ... - NUMODIS

You also want an ePaper? Increase the reach of your titles
YUMPU automatically turns print PDFs into web optimized ePapers that Google loves.
INSTITUT NATIONAL POLYTECHNIQUE DE GRENOBLE<br />
THESE<br />
pour obtenir le grade de<br />
DOCTEUR DE L’INPG<br />
N o attribué par la bibliothèque<br />
Spécialité : « SCIENCE ET GENIE DES MATERIAUX »<br />
préparée au laboratoire Génie Physique et Mécanique des Matériaux (GPM2)<br />
dans le cadre de l’Ecole Doctorale «MATERIAUX ET GENIE DES PROCEDES »<br />
présentée et soutenue publiquement<br />
par<br />
Chansun SHIN<br />
le 25 novembre 2004<br />
Titre :<br />
<strong>3D</strong> <strong>DISCRETE</strong> <strong>DISLOCATION</strong> <strong>DYNAMICS</strong> <strong>APPLIED</strong> <strong>TO</strong><br />
<strong>DISLOCATION</strong>-PRECIPITATE INTERACTIONS<br />
Directeur de thèse :<br />
Marc FIVEL<br />
JURY<br />
M. A. PINEAU ,Président, Rapporteur<br />
M. F. LOUCHET ,Examinateur<br />
M. M. FIVEL ,Directeur de thèse<br />
M. K. H. OH ,Co-encadrant<br />
M. H. N. HAN ,Rapporteur<br />
M. C. ROBERTSON ,Invité<br />
M. M. VERDIER ,Invité
<strong>3D</strong> <strong>DISCRETE</strong> <strong>DISLOCATION</strong> <strong>DYNAMICS</strong> <strong>APPLIED</strong> <strong>TO</strong><br />
<strong>DISLOCATION</strong>-PRECIPITATE INTERACTIONS<br />
The <strong>3D</strong> Discrete Dislocation Dynamics (DDD) method has been applied to investigate the effects of<br />
precipitates on the plasticity of FCC single crystals.<br />
A method to represent the internal interfaces by a series of facets with a pre-defined strength has been<br />
proposed. For a full account of the mutual elastic interactions between dislocations and second-phase<br />
particles, the coupling method with a finite element method is extended. In order to accelerate the<br />
computing time, the serial <strong>3D</strong> DDD algorithm has been improved by revisiting the ’box method’ and a new<br />
parallel code has been developed using the standard Message passing Interface (MPI).<br />
The image stresses due to a three-dimensional particle were computed using the FEM/DDD coupling<br />
code. The numerical results have been compared to the corresponding analytical solutions. The ef-<br />
fect of the elastic modulus mismatch on the flow stress and the subsequent hardening behavior has<br />
then been analyzed. The image stresses were found to affect significantly the work hardening and<br />
the local events such as cross slip and climb. Finally, the fatigue of precipitate-hardened materials<br />
was simulated using the new parallel DDD code. The effects of shearable and non-shearable particles<br />
on the fatigue properties were well reproduced by the simulations, and the numerical results showed<br />
good agreements with the available experimental observations in a qualitative way. The mechanism of<br />
the intense slip band formation is proposed from the observation of the simulated dislocation microstructure.<br />
KEY WORDS: <strong>DISLOCATION</strong>, PRECIPITATE, PLASTICITY, FATIGUE, IMAGE FORCES,<br />
DAMAGE, <strong>DYNAMICS</strong>, PARALLELIZATION<br />
DYNAMIQUE DES <strong>DISLOCATION</strong>S <strong>DISCRETE</strong>S APPLIQUEE AUX<br />
INTERACTIONS ENTRE <strong>DISLOCATION</strong>S ET PRECIPITES<br />
La dynamique des dislocations discrètes (DDD) a été appliquée pour examiner les effets des précipités sur<br />
la plasticité des monocristaux de structure CFC.<br />
Les précipités sont modélisés par un assemblage de facettes franchissable pour une contrainte donnée.<br />
Afin de tenir compte des interactions élastiques entre les dislocations et les particules, un couplage avec la<br />
méthode des éléments finis (MEF) a été utilisé. Afin d’accélérer les temps de calculs, la ’méthode des boites’<br />
a été revisitée et une version parallele du code a été développée en utilisant le standard du programmation<br />
’Message Passing Interface (MPI)’.<br />
Dans un premier temps, les contraintes images créées par une particule <strong>3D</strong> ont été calculées grâce un cou-<br />
plage entre la MEF et le code de DDD. Les résultats numériques ont été comparés aux solutions analytiques<br />
correspondantes. L’effet de la différence des modules d’Young sur la limite élastique et le comportement<br />
durcissant qui en découle ont ensuite été étudiés numériquement. Nous avons montré que les contraintes<br />
image ont un effet significatif sur le durcissement et les événements locaux tels que le glissement dévié et la<br />
montée. Finalement, la fatigue des matériaux durcis par des précipités cisaillables et non-cisaillables a été<br />
simulée avec le nouveau code parallèle de DDD. Les résultats obtenus grâce à nos simulations sont en accord<br />
avec nos observations experimentales et les données de la littérature. Un mécanisme de formation des ban-<br />
des de glissement intense a été proposé à partir de l’observation des microstructures obtenues par simulation.<br />
MOTS CLES: <strong>DISLOCATION</strong>, PRECIPITE, PLASTICITE, FATIGUE, FORCES IMAGES, EN-<br />
DOMMAGEMENT, DYNAMIQUE, PARALLELISATION<br />
Laboratoire Génie Physique et Mécanique des Matériaux (GPM2), ESA5010,<br />
ENSPG, 101 Rue de la Physique, BP46, 38402 Saint Martin d’Hères Cedex
Acknowledgements<br />
First of all, I express my big thanks to my advisor Marc Fivel. Five years ago, he kindly replied<br />
to my audacious e-mail, which could be easily neglected considering the content, and gave me an<br />
opportunity to visit him. This short visit led to the three-year Ph.D program between INP Greno-<br />
ble and Seoul National University, and from the moment we shook hands for the first time, to the<br />
moment we shook hands after the thesis defence, he has been my mentor on both work and life.<br />
I am also grateful to Professor Kyu Hwan Oh, whom I have been working with since I began my<br />
Master study eight years ago. He gave me many opportunities to experience in research, and kept<br />
giving me much good advice.<br />
I owe my special thanks to Marc Verdier (LTPCM) and Christian Robertson (CEA Saclay).<br />
They guided me and advised me as an unofficial co-advisor, from the start of the thesis work to<br />
the rehearsal of the thesis presentation with great patience and encouragement. And I cannot help<br />
attributing some of my work to the fantastic tools of Christophe Déprés, who started and finishes<br />
the Ph.D study with me.<br />
I want to thank Professor André Pineau (ENS Mines Paris) for serving both as ’Président’ and<br />
’Rapporteur’ for my thesis defence. From the moment I met him for the first time at the meeting<br />
of the project ’FAMICRO’ 1 , that supported my work on fatigue simulations, I was fascinated with<br />
his enthusiasm for research and with his boundless memory.. he is a walking library! I also thank<br />
Professor François Louchet (LGGE) and Heung Nam Han (SNU) for serving on my thesis<br />
committee and for their useful suggestions and critical assessment on my work.<br />
My work has been supported by EGIDE 2 , and I want to thank the CNOUS at Grenoble and the<br />
French Embassy in Korea for their efficient professional services.<br />
I am much grateful to all the members of GPM2 Laboratory for pleasant daily life, in the blue room:<br />
Julien Chaussidon, Thomas Nogaret, computing room: David Rodney, Valérie Quatela<br />
and on the playground with a soccer ball: Dider Bouvard, Rémy Dendievel, Luc Salvo,<br />
Charles Josserond, Franck Pelloux and Shigesato Genechi.<br />
And finally, I want to express my thanks and love to my wife Suejung, who is both my great<br />
supporter and best friend, for her love and devotion to our family, and to my little daughter Yvine,<br />
who likes to play with my laptop, for laughter and happiness we all share in our growing family.<br />
1 Modélisation de la durée de vie en Fatigue de matériaux métalliques structuraux, à partir de mécanismes physiques<br />
microscopiques<br />
2 Bourse Pasteur du ministère des affaires étrangères
Abstract<br />
The <strong>3D</strong> Discrete Dislocation Dynamics (DDD) method has been applied to investigate the effects<br />
of precipitates on the plasticity of FCC single crystals.<br />
A method to represent the internal interfaces by a series of facets with a pre-defined strength<br />
has been proposed. For a full account of the mutual elastic interactions between dislocations and<br />
second-phase particles, the coupling method with a finite element method is extended. In order<br />
to accelerate the computing time, the serial <strong>3D</strong> DDD algorithm has been improved by revisiting<br />
the ’box method’ and a new parallel code has been developed using the standard Message passing<br />
Interface (MPI).<br />
The image stresses due to a three-dimensional particle were computed using the FEM/DDD coupling<br />
code. The numerical results have been compared to the corresponding analytical solutions. The<br />
effect of the elastic modulus mismatch on the flow stress and the subsequent hardening behavior has<br />
then been analyzed. The image stresses were found to affect significantly the work hardening and<br />
the local events such as cross slip and climb. Finally, the fatigue of precipitate-hardened materials<br />
was simulated using the new parallel DDD code. The effects of shearable and non-shearable par-<br />
ticles on the fatigue properties were well reproduced by the simulations, and the numerical results<br />
showed good agreements with the available experimental observations in a qualitative way. The<br />
mechanism of the intense slip band formation is proposed from the observation of the simulated<br />
dislocation microstructure.
Résumé<br />
La dynamique des dislocations discrètes (DDD) a été appliquée pour examiner les effets des précip-<br />
ités sur la plasticité des monocristaux de structure CFC.<br />
Les précipités sont modélisés par un assemblage de facettes franchissable pour une contrainte don-<br />
née. Afin de tenir compte des interactions élastiques entre les dislocations et les particules, un<br />
couplage avec la méthode des éléments finis (MEF) a été utilisé. Afin d’accélérer les temps de<br />
calculs, la ’méthode des boites’ a été revisitée et une version parallele du code a été développée en<br />
utilisant le standard du programmation ’Message Passing Interface (MPI)’.<br />
Dans un premier temps, les contraintes images créées par une particule <strong>3D</strong> ont été calculées grâce un<br />
couplage entre la MEF et le code de DDD. Les résultats numériques ont été comparés aux solutions<br />
analytiques correspondantes. L’effet de la différence des modules d’Young sur la limite élastique<br />
et le comportement durcissant qui en découle ont ensuite été étudiés numériquement. Nous avons<br />
montré que les contraintes image ont un effet significatif sur le durcissement et les événements lo-<br />
caux tels que le glissement dévié et la montée. Finalement, la fatigue des matériaux durcis par des<br />
précipités cisaillables et non-cisaillables a été simulée avec le nouveau code parallèle de DDD. Les<br />
résultats obtenus grâce à nos simulations sont en accord avec nos observations experimentales et<br />
les données de la littérature. Un mécanisme de formation des bandes de glissement intense a été<br />
proposé à partir de l’observation des microstructures obtenues par simulation.
Contents<br />
Acknowledgements iii<br />
Abstract v<br />
1 Introduction 1<br />
1.1 Computational methods in plasticity . . . . . . . . . . . . . . . . . . . . . . . . . . . 1<br />
1.2 Dislocation dynamics . . . . . . . . . . . . . . . . . . . . . . . . . . . . . . . . . . . . 3<br />
1.2.1 2D simulations of dislocation dynamics . . . . . . . . . . . . . . . . . . . . . . 3<br />
1.2.2 <strong>3D</strong> simulations of dislocation dynamics . . . . . . . . . . . . . . . . . . . . . . 4<br />
1.3 Scope of Thesis . . . . . . . . . . . . . . . . . . . . . . . . . . . . . . . . . . . . . . . 4<br />
2 Description of the simulation method 9<br />
2.1 Representation of the dislocation lines in FCC metals . . . . . . . . . . . . . . . . . . 10<br />
2.1.1 Preparation of the simulation space . . . . . . . . . . . . . . . . . . . . . . . . 10<br />
2.1.2 Discretization of the dislocation lines . . . . . . . . . . . . . . . . . . . . . . . 10<br />
2.1.3 Existence of a subnetwork . . . . . . . . . . . . . . . . . . . . . . . . . . . . . 12<br />
2.1.4 Comments on other crystal structures and dislocation dynamics models . . . 13<br />
2.2 Computation of stresses and displacements of dislocations . . . . . . . . . . . . . . . 14<br />
2.2.1 Evaluation of the driving force . . . . . . . . . . . . . . . . . . . . . . . . . . 14<br />
2.2.2 Computation of displacements . . . . . . . . . . . . . . . . . . . . . . . . . . . 20<br />
2.3 Motion of dislocations . . . . . . . . . . . . . . . . . . . . . . . . . . . . . . . . . . . 24<br />
2.3.1 Preliminaries . . . . . . . . . . . . . . . . . . . . . . . . . . . . . . . . . . . . 24<br />
2.3.2 Dislocation mobility . . . . . . . . . . . . . . . . . . . . . . . . . . . . . . . . 24<br />
2.3.3 Dislocation-dislocation interactions . . . . . . . . . . . . . . . . . . . . . . . . 25<br />
2.3.4 Cross-slip of screw dislocation segments . . . . . . . . . . . . . . . . . . . . . 28
viii CONTENTS<br />
2.3.5 Plastic strain due to dislocation movement . . . . . . . . . . . . . . . . . . . . 29<br />
2.4 Boundary conditions . . . . . . . . . . . . . . . . . . . . . . . . . . . . . . . . . . . . 29<br />
2.4.1 Periodic Boundary Conditions . . . . . . . . . . . . . . . . . . . . . . . . . . . 29<br />
2.4.2 Internal interfaces . . . . . . . . . . . . . . . . . . . . . . . . . . . . . . . . . 31<br />
2.5 Acceleration of the DDD code . . . . . . . . . . . . . . . . . . . . . . . . . . . . . . . 35<br />
2.5.1 Problem description and review of literatures . . . . . . . . . . . . . . . . . . 35<br />
2.5.2 The Box method . . . . . . . . . . . . . . . . . . . . . . . . . . . . . . . . . . 36<br />
2.5.3 Speedup and Error . . . . . . . . . . . . . . . . . . . . . . . . . . . . . . . . . 40<br />
2.5.4 Boxes and Periodic boundary conditions . . . . . . . . . . . . . . . . . . . . . 46<br />
2.6 Computation procedure of the DDD program . . . . . . . . . . . . . . . . . . . . . . 48<br />
3 Parallelization of the Discrete Dislocation Dynamics method 51<br />
3.1 An introduction to Supercomputing . . . . . . . . . . . . . . . . . . . . . . . . . . . 52<br />
3.1.1 Overview . . . . . . . . . . . . . . . . . . . . . . . . . . . . . . . . . . . . . . 52<br />
3.1.2 Classification of hardware . . . . . . . . . . . . . . . . . . . . . . . . . . . . . 52<br />
3.1.3 Parallel programming models . . . . . . . . . . . . . . . . . . . . . . . . . . . 57<br />
3.1.4 Classification of parallel languages . . . . . . . . . . . . . . . . . . . . . . . . 58<br />
3.1.5 Supercomputers in France and Korea . . . . . . . . . . . . . . . . . . . . . . . 60<br />
3.2 Towards a parallel DDD code . . . . . . . . . . . . . . . . . . . . . . . . . . . . . . . 60<br />
3.2.1 Basic Steps of Parallelization . . . . . . . . . . . . . . . . . . . . . . . . . . . 60<br />
3.2.2 Writing a parallel program . . . . . . . . . . . . . . . . . . . . . . . . . . . . . 67<br />
3.3 Parallelization of the serial DDD program . . . . . . . . . . . . . . . . . . . . . . . . 67<br />
3.3.1 Initialization of parallel environments . . . . . . . . . . . . . . . . . . . . . . 67<br />
3.3.2 Long-distance stresses computations . . . . . . . . . . . . . . . . . . . . . . . 70<br />
3.3.3 Short-distance stresses computation . . . . . . . . . . . . . . . . . . . . . . . 70<br />
3.3.4 Data structures for distributing and the gathering segments . . . . . . . . . . 71<br />
3.3.5 Motion of segments . . . . . . . . . . . . . . . . . . . . . . . . . . . . . . . . . 73<br />
3.3.6 Summary and comments . . . . . . . . . . . . . . . . . . . . . . . . . . . . . . 79<br />
3.4 Performance improvment . . . . . . . . . . . . . . . . . . . . . . . . . . . . . . . . . 80<br />
3.4.1 Measure of performance . . . . . . . . . . . . . . . . . . . . . . . . . . . . . . 80<br />
3.4.2 Conditions for good performance . . . . . . . . . . . . . . . . . . . . . . . . . 80<br />
3.4.3 Performance tests . . . . . . . . . . . . . . . . . . . . . . . . . . . . . . . . . . 81
CONTENTS ix<br />
3.4.4 Load balancing . . . . . . . . . . . . . . . . . . . . . . . . . . . . . . . . . . . 84<br />
3.4.5 Comparison of simulation results between the serial and parallel DDD code . 88<br />
3.5 Application to Stage I-II transition simulation . . . . . . . . . . . . . . . . . . . . . . 88<br />
3.5.1 Stress-strain curves of FCC single crystals . . . . . . . . . . . . . . . . . . . . 88<br />
3.5.2 Simulation conditions . . . . . . . . . . . . . . . . . . . . . . . . . . . . . . . 89<br />
3.5.3 Simulation results . . . . . . . . . . . . . . . . . . . . . . . . . . . . . . . . . 91<br />
4 Dislocation-precipitate interactions 95<br />
4.1 Image stresses due to a <strong>3D</strong> particle . . . . . . . . . . . . . . . . . . . . . . . . . . . . 95<br />
4.1.1 Motivations and review of the literature . . . . . . . . . . . . . . . . . . . . . 95<br />
4.1.2 Interaction of an edge dislocation with a circular cylindrical particle . . . . . 97<br />
4.1.3 Interaction of an edge dislocation with a spherical particle . . . . . . . . . . . 99<br />
4.1.4 Interaction of an edge and a screw dislocation with a cubical particle . . . . . 102<br />
4.1.5 Discussion . . . . . . . . . . . . . . . . . . . . . . . . . . . . . . . . . . . . . . 103<br />
4.2 A simple case of dislocation-particle interaction . . . . . . . . . . . . . . . . . . . . . 105<br />
4.2.1 Motivation and review of literatures . . . . . . . . . . . . . . . . . . . . . . . 105<br />
4.2.2 Calculation procedures . . . . . . . . . . . . . . . . . . . . . . . . . . . . . . . 106<br />
4.2.3 Flow stress of impenetrable particles with a different shear modulus . . . . . 107<br />
4.2.4 Increment in hardening stress . . . . . . . . . . . . . . . . . . . . . . . . . . . 112<br />
4.2.5 Discussion . . . . . . . . . . . . . . . . . . . . . . . . . . . . . . . . . . . . . . 115<br />
4.3 Fatigue simulations of materials hardened by particles . . . . . . . . . . . . . . . . . 116<br />
4.3.1 Motivation and review of literatures . . . . . . . . . . . . . . . . . . . . . . . 116<br />
4.3.2 Description of the simulation method . . . . . . . . . . . . . . . . . . . . . . . 118<br />
4.3.3 Evolution of the dislocation microstructure during the fatigue tests . . . . . . 123<br />
4.3.4 Mechanical behavior . . . . . . . . . . . . . . . . . . . . . . . . . . . . . . . . 135<br />
4.3.5 Surface slip markings . . . . . . . . . . . . . . . . . . . . . . . . . . . . . . . . 136<br />
4.3.6 Fatigue properties of materials containing particles with a bimodal size dis-<br />
tribution . . . . . . . . . . . . . . . . . . . . . . . . . . . . . . . . . . . . . . . 140<br />
4.3.7 Summary . . . . . . . . . . . . . . . . . . . . . . . . . . . . . . . . . . . . . . 144<br />
5 Conclusions and perspectives 149
Chapter 1<br />
Introduction<br />
1.1 Computational methods in plasticity<br />
A dislocation is a line defect within a crystal, which represents permanent deviations of atoms<br />
from their original crystallographic periodicity. The dislocation glide gives rise to macroscopic<br />
deformation of metals. A dislocation thus is a microscopic carrier of the metallic plasticity.<br />
Modeling the plasticity of metals involves understanding the nature of dislocations, which is defined<br />
at the atomistic scale and also evaluating the deformation behaviors at the macroscopic scale. Many<br />
models have been developed to understand the plasticity of metals. Since the features of plasticity<br />
vary much in size and time, the models also vary largely in length and time scales. Out of a range of<br />
models, most attention is given in this section on Molecular Dynamics (MD), Dislocation Dynamics<br />
(DD) and continuum mechanics.<br />
Atoms are the basic constituent elements of MD simulations. Atoms interact with each other through<br />
an interatomic potential. The temporal trajectory of an ensemble of atoms under an external loading<br />
is simulated by minimizing the total potential energy of the system. The deviations of the position of<br />
the atoms from the lattice sites implicitly represent the dislocations. The atomistic scale topology of<br />
a dislocation line thus can be investigated by MD. MD simulations are employed mostly in studying<br />
physical properties of a single or a few dislocation lines due to the constraints of the simulation size<br />
(< (200nm) 3 ).<br />
In DD methods, dislocation lines are represented explicitly. The collective evolution of a large<br />
number of interacting dislocations is simulated under an external loading. Properties of dislocations<br />
such as mobility, junction strength etc., are input parameters of DD simulations, and dislocation<br />
glide results in plastic strain in the simulation volume. The stress-strain behavior is thus an output
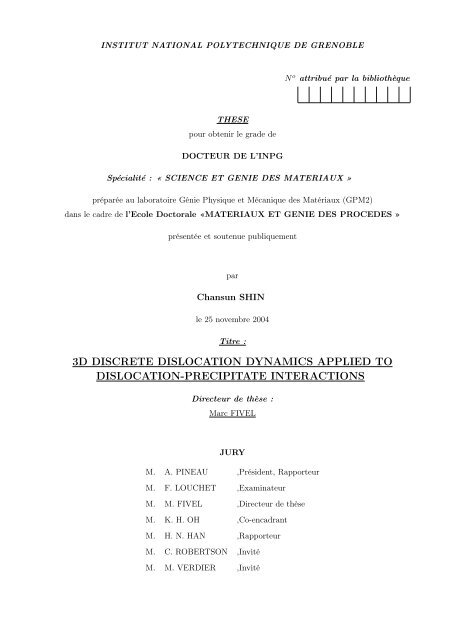
2 Introduction<br />
Time (sec)<br />
10 3<br />
1<br />
10 -3<br />
10 -6<br />
10 -9<br />
10 -12<br />
Molecular<br />
Dynamics<br />
10 -11 10 -10 10 -9<br />
10 -8<br />
10 -7<br />
10 -6<br />
Single crystal<br />
models<br />
Dislocation<br />
Dynamics<br />
10 -5<br />
Space (m)<br />
Homogenization technique<br />
Polycrystal<br />
models<br />
Continuum mechanics<br />
Figure 1.1: Figure illustrating length and time scales of each model. Solid lines represent the limit<br />
ranges imposed by the intrinsic physics of the model. Dashed lines represent the limit imposed by<br />
the available computing power.<br />
of the DD simulations.<br />
Continuum mechanics treat the behavior of a continuum medium by a set of equations and boundary<br />
conditions. There are a wide range of numerical techniques which can solve the equations. Finite<br />
difference and finite element methods are two broad subsets of such techniques. In these methods,<br />
a continuum domain of interest is subdivided into discrete cells or elements, in which the values of<br />
certain physical quantities are determined by solving a system of equations. The output of a typical<br />
application to the metallic plasticity is the deformation behavior of the simulated volume, for which<br />
a governing constitutive equation is assumed.<br />
As introduced briefly above, MD, DD and continuum methods have their own characteristic length<br />
and time scale. Fig. 1.1 shows such ranges of length and time scales of each method. As the<br />
performance of each numerical method is improved, the volume and the physical time which can<br />
be simulated are increasing (top and right domain limit of each method in Fig. 1.1). Recently the<br />
length and time scales of the various methods begin to be overlapped. This gives a great impetus<br />
to exchange information in order to build up a unified model of the metallic plasticity, which would<br />
be able to predict the behavior of a material from the fundamental properties of the material.<br />
10 -4<br />
10 -3<br />
10 -2<br />
10 -1<br />
1
1.2 Dislocation dynamics 3<br />
(a) Weak obstacles (b) Hard obstacles<br />
Figure 1.2: 2D simulations of dislocations moving through a random array of point obstacles: Effects<br />
of obstacles’ strength ([Foreman & Makin 66])<br />
1.2 Dislocation dynamics<br />
1.2.1 2D simulations of dislocation dynamics<br />
Based on the well understood elementary properties of a single dislocation, numerical DD methods<br />
have been developed first in 2D.<br />
Dislocation dynamics in 2D can be further divided in terms of the crystallographic orientation of<br />
the plane used for the simulations: (i) parallel and (ii) perpendicular to dislocation lines. In the<br />
case (i), the plane of the simulations is parallel to the glide plane of dislocation lines, thus nei-<br />
ther cross-slip nor climb of dislocations are allowed. This configurations have been applied initially<br />
to study line tension and the shape of a dislocation under stress ([Brown 64]). The dynamical<br />
movements of dislocations have also been simulated in the case of a glide plane containing random<br />
distribution of point obstacles ([Foreman & Makin 66]). The effects of obstacles’ strength on the<br />
initial flow-stress have been studied, and some of the simulation results are shown in Fig. 1.2. This<br />
type of 2D simulations is still in use to study the effect of particles’ parameters on the flow stresses,<br />
see for example [Mohles & Nembach 01].<br />
In the case (ii), dislocations are perpendicular to the simulation plane, that is, dislocations are<br />
infinite, parallel to each and have the same character. This configuration can simulate the multi-<br />
plication, annihilation, cross-slip and climb of dislocations. It is, however, difficult to include the
4 Introduction<br />
line tension effect explicitly. This kind of configuration has been used to simulate the spontaneous<br />
microstructure formation ([Lépinoux & Kubin 87]). Because of its simplicity, this 2D method<br />
can simulate dislocation motion up to relatively large strains. This method is still largely under<br />
development and applied to several studies, see for example [Cleveringa et al. 97].<br />
1.2.2 <strong>3D</strong> simulations of dislocation dynamics<br />
The motivation of a <strong>3D</strong> DD can be summarized as the needs<br />
• to include the <strong>3D</strong> nature of the dislocation behavior, cross-slip, junction formation, ...<br />
• to explain the formation of dislocation structures during the plastic deformation<br />
The first simulation in <strong>3D</strong> is proposed in [Canova & Kubin 91]. Since then, the proposed method<br />
has been developed and applied to investigate the collective motion of dislocations under various<br />
conditions by two leading groups 1 in France. This method is based on the representation of dislo-<br />
cation lines by segments in an integer space. Other versions of DD in <strong>3D</strong> have emerged since the<br />
end of 1990s, as will be detailed in Sec. 2.1.4. Due to the development of simulation methods and<br />
the increased computing power, these simulation methods have strengthened their positions in the<br />
field of crystal plasticity. The <strong>3D</strong> discrete dislocation dynamics (DDD) method has proven to be a<br />
powerful tool to investigate the plasticity of metals and been expected to serve as a link between<br />
atomistic and continuum scale simulations (see Fig. 1.1).<br />
1.3 Scope of Thesis<br />
This thesis aims at applying the <strong>3D</strong> DDD method to both rigorous computations of dislocation-<br />
precipitate interactions and studying the effects of precipitates on the fatigue properties of metals.<br />
For the rigorous computations, we extended the code coupled with a finite element method ([Fivel 97])<br />
in order to incorporate <strong>3D</strong> precipitates with a differing elastic modulus. The interaction forces due<br />
to a second phase particle are computed and the effects of these forces on the flow stress and the<br />
subsequent hardening are investigated.<br />
1 Génie Physique et Mécanique des Matériaux (GPM2) and Laboratoire d’Etude Métallurgique (LEM)
1.3 Scope of Thesis 5<br />
Recently the <strong>3D</strong> DDD method are applied successfully to the study of early fatigue crack initi-<br />
ation of 316L stainless steels ([Déprés 04]). The critical role of cross-slip was pointed out, which<br />
demonstrates the advantages of the <strong>3D</strong> DD simulations over the 2D simulations. Inspired by this<br />
study, we applied the <strong>3D</strong> DDD method to simulate the fatigue behavior of materials hardened by<br />
precipitates. It was found, however, that the feasible volume fraction of precipitates is quite small<br />
considering the performance of the currently available computing machines with a single processor<br />
and the computing efficiency of the serial <strong>3D</strong> DDD code. This is due to the additional computa-<br />
tional loads induced when many precipitates are introduced in the <strong>3D</strong> DDD simulations, which are<br />
already computationally demanding because of the long-ranged stress field of a dislocation segment<br />
and the need to handle the dislocation interactions during the segment motions. Because of the<br />
inherent computational load of the <strong>3D</strong> DDD simulations, a maximum strain which can be simulated<br />
in a reasonable time still remains in the order of 10 −3 in multislip condition.<br />
The easiest way to suffice the computational demands of the fatigue simulations of precipitation-<br />
hardened materials would be to waite until a faster single processor is available. Considering the<br />
relatively short period of a doctorate, however, it cannot be a good way to choose notwithstanding<br />
the speed of a single processor has improved tremendously 2 .<br />
The other way is to increase the computational capacity by collecting single processors and making<br />
them work together, that is, parallel computing. A parallel computer simply comprises a number of<br />
processors that solve a problem together to reduce the elapsed computation time. In fact, parallel<br />
computing has been widely adopted in many research fields to resolve the increase of the compu-<br />
tational demands, which arises due to many reasons, e.g. encompassing sophisticated boundary<br />
conditions, involving nonlinear material behaviors and many unknowns. Evident successes of the<br />
parallel computing in the field of the computational plasticity can be found in both MD meth-<br />
ods ([Abraham 97]) and continuum mechanics ([Demmel et al. 93], [Fahrat & Roux 94]). The<br />
parallel codes have enabled each model to perform large scale simulations in reasonable time. In<br />
MD simulations, for example, a volume of 0.01nm 3 can be treated over a period of time in the order<br />
of 10 −12 seconds using massively parallel machines ([Abraham 97]).<br />
As can be seen in many references including the few examples cited above, the subject of parallel<br />
2 Semiconductor technology has been known to increase a processor clock rate by double in 18 months up to now.<br />
This is known as the Moore’s law first published in 1965 ([Moore 65]) and which still holds true today. Intel expects<br />
that it will continue at least through the end of this decade. In the end, the performance of a single processor<br />
computing device will reach an upper limit due to the physical limits of semiconductor technology
6 Introduction<br />
computing has been investigated extensively and is now a well established field. From the success in<br />
atomistic and continuum parallel simulations, we came to the conclusion that parallel computation<br />
will be the best and the only choice in order to include a relatively high volume fraction of precip-<br />
itates in the simulation volume, because a dramatic increase in computational power can only be<br />
met through it.<br />
A parallel DDD code thus has been developed and applied to the fatigue simulations containing a<br />
large number of particles. The effects of particles on the fatigue properties are studied focusing on<br />
the irreversibility of slips and the formation of the intense slip bands during the cyclic deformation.<br />
The parallel DDD code developed would be of benefit to not only small scale simulations which<br />
involve a large number of internal defects but also large scale simulations which would make a com-<br />
parison with the macroscopic simulations possible. The parallel DDD code would hence reinforce<br />
the role of the <strong>3D</strong> DDD method in the series of the plasticity simulation methods.<br />
This thesis is organized as follows.<br />
Chapter 1 Introduction (this chapter)<br />
Chapter 2 summarizes the theoretical backgrounds and methodologies of the <strong>3D</strong> discrete disloca-<br />
tion dynamics method. The computation of the displacement fields of a dislocation loop is<br />
introduced. Several boundary conditions are explained, such as the implementation of internal<br />
interfaces and the periodic boundary conditions. The numerical efficiency of the serial DDD<br />
algorithm is increased by revisiting the so-called box method ([Verdier et al. 98]).<br />
Chapter 3 presents the parallel algorithm developed to parallelize the <strong>3D</strong> DDD program used<br />
in this work. The parallel version of the DDD program aims at simulating fatigue tests of<br />
materials containing large number of particles in reasonable time using parallel computers.<br />
The new parallel DDD program is tested and improved in performance by balancing the load<br />
dynamically, and then applied to stage I-II simulations. This chapter also contains general<br />
introduction to parallel computing.<br />
Chapter 4 contains three applications of the method developed and detailed in the preceding<br />
chapters. Image stresses by a cylindrical, spherical and cubical particle are computed. The<br />
effects of image stresses on flow stresses and hardening are investigated. The FEM/DDD
1.3 Scope of Thesis 7<br />
coupling method presented in Sec. 2.4.2 is used for these applications. Finally, the new<br />
parallel program is used for fatigue simulations of precipitate-hardened metals.<br />
Chapter 5 gives concluding remarks and perspectives.
Chapter 2<br />
Description of the simulation method<br />
THE discrete dislocation dynamics (DDD) method initially proposed in [Canova & Kubin 91] has<br />
been improved much in its numerical precision and applicability to problems involving complex<br />
boundary conditions over the past 15 years. The purpose of this chapter is to review the theoretical<br />
backgrounds and methodologies of the DDD method, and also to describe the author’s contributions<br />
: computation of displacement fields, implementation of internal interfaces and the periodic boundary<br />
conditions and acceleration of the code using the revised box method.<br />
The DDD method used in this thesis only deals with perfect dislocations in face-centered cubic (FCC)<br />
metals. Sec. 2.1 introduces the simulation lattice and the discretization of a dislocation line of the DDD<br />
model, and the model is compared with other dislocation dynamics models. Although the focus is given<br />
on the FCC lattice, the methodology is quite general. The extension of the method to the other cubic<br />
crystals is also discussed briefly.<br />
Computation of the effective stress of each dislocation segment is presented in Sec. 2.2. The method<br />
used for computing the displacement field of a dislocation loop is detailed also, and the extension of the<br />
method to more general dislocation structures can be found in Sec. 4.3.5. The stress and displacement<br />
solutions are all based on the theory of linear elasticity in isotropic frame.<br />
Sec. 2.3 introduces the motion of dislocation segments. This section includes a description of the several<br />
local rules needed to handle interactions between dislocations.<br />
New boundary conditions are explained in Sec. 2.4. Representation of internal interfaces is discussed<br />
in both a simple method using facets and a more rigorous way with full elastic interactions. The<br />
implementation of periodic boundary conditions is also detailed.<br />
The performance of the DDD code is improved by revising the box method which was first described in<br />
[Verdier et al. 98]. The computational efficiency of the method is significantly increased by using the
10 Description of the simulation method<br />
linked-list of segments. The methodology and the performance of the box method is described in Sec.<br />
2.5. The overall flowchart of the code is presented at the end of this chapter.<br />
2.1 Representation of the dislocation lines in FCC metals<br />
2.1.1 Preparation of the simulation space<br />
The lattice of the simulation volume is homothetic to that of FCC metals. The lattice spacing<br />
of the simulation lattice is adopted from an experimental measurement of the athermal critical<br />
self annihilation distance between edge dislocations 1 . The experiments of Essmann and Mughrabi<br />
([Essmann & Mughrabi 79]), for example, show that no edge dislocations coexist within the<br />
distance of the order of 1.5 nm in their copper specimens at room temperature. Thus the shortest<br />
distance of two edge dislocation in the simulation is set to this critical distance.<br />
An inter-planar distance of two adjacent {111} planes equals to a/ √ 3, with ’a’ the lattice spacing<br />
(see Fig. 2.2(a)). If ye denotes the critical self annihilation distance, a can be expressed as Eq. 2.1<br />
by equating a/ √ 3 to 2ye.<br />
a = 2 √ 3ye<br />
A typical value of the simulation lattice spacing xl(= a/2) is around 2.598 nm with the value of<br />
ye = 1.5 nm.<br />
The reader should note that xl is the value of the order of 10b, where b is the magnitude of the<br />
Burgers vector. This is certainly larger than the dislocation core radius (∼ 2b). The use of the<br />
lattice spacing larger than the core radius has two effects on the simulation method.<br />
1. Linear elastic solutions of stress and displacement of a dislocation is valid all over the simu-<br />
lation network (Sec. 2.2).<br />
2. It requires to express the core properties of a dislocation in a phenomenological manner (Sec.<br />
2.3.3 & 2.3.4).<br />
2.1.2 Discretization of the dislocation lines<br />
Only perfect dislocations in FCC metals are considered in this work and no dissociation into partials<br />
is allowed. It is probable that the width of spacing of two partial dislocations is smaller than the<br />
1 Screw dislocations annihilate more easily than edge ones by the cross-slip mechanism, thus the critical distance<br />
of edge dislocations defines the lattice spacing of the simulation lattice.<br />
(2.1)
2.1 Representation of the dislocation lines in FCC metals 11<br />
[-12-1]<br />
[111]<br />
[-101]<br />
Edge segment<br />
Screw segment<br />
2 xl<br />
Figure 2.1: Representation of a curved dislocation line with a link of pure edge and screw segments:<br />
The dots represent lattice points on (111) slip plane. Unit lengths of edge ( √ 6xl) and screw segment<br />
( √ 2xl) are shown.<br />
lattice spacing used (∼ 10b), because the stacking fault energy γ is about 140mJm −2 for aluminium,<br />
40mJm −2 for copper and 20mJm −2 for silver, which gives the corresponding width of staking-fault<br />
ribbons of √ 2b, 5 √ 2b and 7 √ 2b for aluminum, copper and silver respectively for the case of Poisson’s<br />
ratio being zero ([Hull & Bacon 83]).<br />
A curved dislocation line is represented as a connected set of discrete dislocation segments of a pure<br />
edge and a pure screw type. This is why the method is called as the edge-screw model. Fig. 2.1<br />
schematically shows the discretization of a dislocation line by a succession of orthogonal edge and<br />
screw segments of the same Burgers vector on the same slip plane 2 .<br />
Maximum length of a segment is set to the discretization length ld and any segment with a length<br />
lseg longer than ld is subdivided further into lseg/ld segments.<br />
The edge (< 112 > type) and screw (< 110 > type) vectors for each of the 12 slip systems used<br />
in the DDD simulations are shown in Table 2.1 3 . Each screw direction is associated to two edge<br />
directions, Edge1 and Edge2, defining the two glide systems, (Screw, Edge1) and (Screw, Edge2),<br />
which share the same Burgers vector. The line directions of the 6 screw vectors (or Burgers vectors)<br />
6 xl<br />
2 Edge segments move along the screw vector direction and vice versa. Edge segments of the line vector [¯12¯1] in<br />
Fig. 2.1, for example, move along ±[¯101], and screw segments of [¯101] move along either ±[¯12¯1] or ±[¯1¯2¯1] direction<br />
(the cross-slip mechanism (see Sec.2.3.4)).<br />
3 The notation of Schmid and Boas [Schmid & Boas 35] is written with the system number.
12 Description of the simulation method<br />
are adopted from the Thompson tetrahedron given in [Hirth & Lothe 92], p319. The signs of the<br />
vectors are defined from the following 2 rules:<br />
1. Edge × Screw = n, where n is the outgoing normal of the Thompson tetrahedron<br />
2. Edge1 × Edge2 = b so that any prismatic loop is unambiguously defined 4<br />
System 1 (B4) 2 (D4) 3 (D1) 4 (C1) 5 (B5) 6 (C5)<br />
Screw [¯101] [011] [1¯10]<br />
Edge [¯12¯1] [¯1¯2¯1] [¯2¯11] [2¯11] [¯1¯12] [¯1¯1¯2]<br />
Plane normal (111) (¯11¯1) (¯11¯1) (¯1¯11) (111) (¯1¯11)<br />
System 7 (D6) 8 (A6) 9 (A2) 10 (B2) 11 (C3) 12 (A3)<br />
Screw [¯1¯10] [0¯11] [101]<br />
Edge [1¯1¯2] [1¯12] [211] [¯211] [1¯2¯1] [12¯1]<br />
Plane normal (¯11¯1) (1¯1¯1) (1¯1¯1) (111) (¯1¯11) (1¯1¯1)<br />
Table 2.1: Vectors of line and glide directions of dislocation segments used in the DDD code.<br />
Each segment is represented numerically by a set of integers that are the three coordinates of the<br />
starting point, the length and the two indexes of the line and the moving vector. The coordinates<br />
are expressed in units of the simulation lattice parameter xl. The length is in unit of the norm of<br />
the line vector. The connection of a line is built through a pointer of segments index.<br />
2.1.3 Existence of a subnetwork<br />
There exist certain sets of slip planes in which mutual dislocation interactions cannot be treated<br />
properly. We shall call each set as subnetwork. This is due to the fact that in the edge-screw model,<br />
a unit line vector of an edge dislocation is , whose length is √ 6xl (Table 2.1).<br />
An edge dislocation [11¯2] on a (111) plane, for example, is shown in Fig. 2.2(b). There are two<br />
(¯1¯11) slip planes which intersect with the [11¯2] edge dislocation in a unit cell of a simulation volume<br />
as illustrated in Fig. 2.2(a). The lattice points along the intersecting lines are shown with filled<br />
and hollow points for each plane in Fig. 2.2(b). One of the planes cuts the unit edge segments in<br />
the middle, which is not permitted 5 .<br />
4 the Right Hand Final to Start(RHFS) rule is adopted, which can be seen in Fig.2.10<br />
5 It is noted that this improper intersection happens between two planes with the same Burgers vector.
2.1 Representation of the dislocation lines in FCC metals 13<br />
[100]<br />
xl<br />
[001]<br />
a<br />
(a) The unit cell<br />
[010]<br />
xl[-110]<br />
xl[11-2]<br />
(b) Subnetwork<br />
Unit edge segment<br />
Figure 2.2: The unit cell of the simulation space and the existence of subnetworks: The lattice is<br />
homothetic to that of FCC crystal, where xl is usually taken as ∼ 10b. There exist subnetworks<br />
due to the definition of dislocation line vectors in Tab. 2.1<br />
This indicates that there exist subnetworks which cannot be used simultaneously. Attention should<br />
thus be given to the initial dislocation configurations of the simulations so that segments in two<br />
slip planes of the same Burgers vector share a common point on one of the planes. In practice each<br />
starting point of the dislocation segments is described in the elementary basis (Screw, Edge1, Edge2)<br />
so that the origin point (0,0,0) is the same for the two involved slip systems. The subnetwork also<br />
imposes certain restrictions while applying periodic boundary conditions (see Sec.2.4.1).<br />
2.1.4 Comments on other crystal structures and dislocation dynamics models<br />
Although it is not treated in this thesis, dislocations in other cubic crystal structures can be rep-<br />
resented in a similar manner. For example, in the body-centered cubic (BCC) crystal structure,<br />
slip occurs in close packed directions. The crystallographic slip planes are {110},{112} and<br />
{123}. By the same analogy as the construction of Table 2.1, the slip systems of {110} or<br />
{112} can be defined by 4 screw and 12 edge line vectors respectively. The {123} 6<br />
slip system involves 4 screw and 24 edge line vectors. Dislocation dynamics models using the BCC<br />
crystal structure can be found in [Devincre & Roberts 96] and [Tang et al. 98].<br />
There exist several dislocation dynamics models. The difference comes mainly from how to dis-<br />
6 The {123} slip system is less closed packed, thus at low temperatures, it would be sufficient to take only<br />
{110} and {112} slip systems into account.
14 Description of the simulation method<br />
(a) Edge-screw model (b) Pure-mixed model (c) Nodal model<br />
Figure 2.3: Discretization of a curved dislocation line in edge-screw, pure-mixed and nodal model<br />
cretize dislocation lines. Zbib et al. ([Zbib et al. 98]), for example, has approximated the dis-<br />
location curves by series of mixed straight segments of an arbitrary length and orientation. The<br />
scheme, which parameterizes a dislocation line by a set of nodes, is often called as ’nodal dislocation<br />
dynamics’. Some of the nodal dislocation dynamics can even treat dislocation splitting into partials<br />
([Shenoy et al. 00], [Weygand et al. 01]). The nodal model has advantages in the numerical pre-<br />
cision. The nodal model is, however, much complex in dealing with topological aspects of segments,<br />
because it involves more degrees of freedom in segment types as compared to the edge-screw model.<br />
Thus the nodal model is used preferably to investigate phenomena involving a small number of<br />
dislocations and a high precision in the dislocation topology ([Schwarz 99], [Ghoniem et al. 00]).<br />
Recently, there has been an attempt to increase numerical accuracy by introducing one more seg-<br />
ment type in the edge-screw model. It is called as the ’pure-mixed’ model. This model incorporates<br />
additional line directions, i.e. ±60 o characters. The model aims at an accurate description of a<br />
curved dislocation line with a minimum number of segments ([Devincre et al. 01], [Madec 01]).<br />
In Fig. 2.3, the discretization description methods for a curved dislocation line used in the edge-<br />
screw, pure-mixed and nodal model are compared side by side.<br />
2.2 Computation of stresses and displacements of dislocations<br />
2.2.1 Evaluation of the driving force<br />
The velocity of each segment is governed by the effective stress τe acting on the segment. The<br />
effective stress is given by τe = fg/b, where b is the magnitude of the Burgers vector and fg is the<br />
magnitude of the glide force per unit length. fg is computed at the center of each segment and
2.2 Computation of stresses and displacements of dislocations 15<br />
includes four contributions:<br />
(i) the force due to the internal stress field produced by all the other dislocation segments in the<br />
simulation volume except by two neighboring segments and the considered segment itself<br />
(ii) the force due to applied stress fields<br />
(iii) the force due to the line tension<br />
(iv) the force due to the Peierls stress<br />
The forces due to atomistic-level interactions, such as dragging forces by solute atoms or jogs, are not<br />
treated explicitly. They can be included implicitly, however, by modifying the motion rule which de-<br />
fines the relation between the glide velocity and the effective shear stress of a segment (see Sec. 2.3).<br />
Internal stresses<br />
To compute the internal stresses at the center of a segment, the expression of the stress field of a<br />
single finite straight segment is required. This problem has been addressed by Li ([Li 64]). Li has<br />
found an interesting fact from the stress solution of an angular dislocation made of two semi-infinite<br />
dislocations joined together at one point. According to Li, the stress field of an angular dislocation<br />
is the sum of the stress fields of each dislocation arm, i.e., a semi-infinite dislocation. Although the<br />
stress field of a semi-infinite dislocation does not obey the equations of equilibrium, the sum of the<br />
stress fields of two semi-infinite dislocations satisfies the equilibrium.<br />
If a semi-infinite dislocation lies in the positive z axis running into the origin, O, the stress field<br />
produced at a point r(x,y,z) has the following components ([Li 64]).<br />
σxx(r) = −bxy−byx<br />
r(r−z) − x2 (bxy−byx)(2r−z))<br />
r 3 (r−z) 2<br />
σyy(r) = bxy+byx<br />
r(r−z) − y2 (bxy−byx)(2r−z))<br />
r 3 (r−z) 2<br />
σzz(r) = z(bxy−byx)<br />
r 3<br />
σyz(r) = y(bxy−byx)<br />
r 3<br />
σzx(r) = x(bxy−byx)<br />
r 3<br />
σxy(r) = bxx−byy<br />
r(r−z)<br />
− 2ν(bxy−byx)<br />
r(r−z)<br />
− νbx<br />
r<br />
+ νby<br />
r<br />
+ (1−ν)bzx<br />
r(r−z)<br />
− (1−ν)bzy<br />
r(r−z)<br />
− xy(bxy−byx)(2r−z)<br />
r 3 (r−z) 2<br />
In Eq. 2.2, the stresses are given in unit of µ/4π(1 − ν) with µ and ν being the shear modulus and<br />
the Poisson ratio respectively. r is the distance to the point r(x,y,z) as shown in Fig. 2.4. The<br />
stress field of a dislocation segment lying on the z axis running from z2 into z1 is obtained from<br />
(2.2)
16 Description of the simulation method<br />
X<br />
Z<br />
z2<br />
z1<br />
O<br />
Dislocation<br />
segment (z2-z1)<br />
r<br />
r(x,y,z)<br />
Y<br />
=<br />
X<br />
Z<br />
z1<br />
O<br />
Semi-infinite<br />
dislocation<br />
Y<br />
-<br />
X<br />
Z<br />
z2<br />
O<br />
Semi-infinite<br />
dislocation<br />
Figure 2.4: A configuration of a semi-infinite dislocation and a calculation of a stress field of a<br />
dislocation segment<br />
that of two semi-infinite dislocations as shown in Fig. 2.4. The stress field is constructed by using<br />
Eq. 2.2 twice, and substituting z in the equation for z − z1 and z − z2 respectively.<br />
σij(r) = σij(r)z−z1 − σij(r)z−z2<br />
(2.3)<br />
The expressions of Li (Eq.2.2) are derived such that a semi-infinite dislocation line lies on the z<br />
axis. A rotation of the stress tensor would be necessary for an arbitrary segment in order to bring<br />
the segment into the reference coordinate.<br />
The compact formulae of de Wit [dewit 67], on the other hand, are given with respect to an<br />
arbitrary Cartesian coordinate system. Thus the expressions of de Wit can be used without any<br />
rotation of the coordinate system. The final form is shown in Eq. 2.4, which has been derived by<br />
Devincre in [Devincre 95].<br />
σij(r) = µ<br />
πY 2<br />
<br />
[bYt] s ij − 1<br />
1 − ν [btY]s <br />
(b, Y, t)<br />
ij − δij + titj +<br />
2(1 − ν)<br />
2<br />
Y 2<br />
<br />
ρiYj + ρjYi + L<br />
R YiYj<br />
<br />
(2.4)<br />
The vectors in Eq. 2.4 are shown on a dislocation line of a line vector t and Burgers vector b<br />
in Fig. 2.5. The vectors and the scalars are defined as R = r − r ′ , L = R · t, ρ=R − Lt and<br />
Y = R + Rt. δij is the Kronecker delta and (b, Y, t) is the mixed product. [abc] s ij<br />
Y<br />
is defined as<br />
1<br />
2 ((a × b)icj + (a × b)jci). The stress field of a dislocation segment between two points A and B<br />
is determined by inserting Eq. 2.4 in Eq. 2.3 and substituting r ′ for r ′ A and r′ B<br />
in Eq. 2.4.
2.2 Computation of stresses and displacements of dislocations 17<br />
X<br />
Z<br />
O<br />
r<br />
r’<br />
R<br />
t<br />
Y<br />
ρ<br />
L<br />
Infinite<br />
dislocation<br />
Figure 2.5: Definitions of the geometry of Eq. 2.4<br />
The formulae of both Li and de Wit are derived within the frame of the isotropic elasticity theory.<br />
A numerical method for stress fields in anisotropic elasticity has been developed recently by Rhee<br />
et al. in [Rhee et al. 01]. The difference between the isotropic and anisotropic solution was found<br />
to have an important effect within only about 15b from the distorted hexagon they used for the<br />
calculations. The difference, however, becomes smaller as the distance from the hexagon increases,<br />
therefore it is sufficient to use the solution of the isotropic elasticity for long-range interactions.<br />
The stress field of a prismatic loop represented by successive straight segments is shown to exhibit a<br />
satisfactory accuracy comparing with the corresponding exact analytical solution ([Khraishi et al. 00a]).<br />
The computation of the segment stress fields shows no anomaly even near the joint of two rectan-<br />
gular segments. The contour of the resolved shear stress on the (¯11¯1) plane is shown in Fig. 2.6(b)<br />
and the corresponding dislocation segments in Fig. 2.6(a).<br />
Computation of internal stresses is the most computationally demanding spot in the DDD algo-<br />
rithm. A method to increase the efficiency of computation will be discussed in Sec. 2.5.<br />
Applied stresses<br />
External stresses are applied in two ways, depending on the boundary conditions involved.<br />
In the first case, the simulation volume represents a small element in a single crystal or a grain of<br />
a polycrystal. In this case, the external stress field is assumed to be homogeneous throughout the<br />
simulation volume. The same stress tensor is applied to each segment in the volume. The magnitude<br />
of this tensor is updated according to a certain rule, constant stress or strain rate ([Fivel 97]).<br />
In the second case, the simulation volume represents a finite volume with free surfaces, thus exter-
18 Description of the simulation method<br />
1 µ m<br />
Dislocation<br />
segments<br />
1 µ m<br />
3 µ m<br />
n=[111]<br />
b=[110]<br />
(a) Dislocation segments configuration (b) Contour of the resolved shear<br />
Figure 2.6: A planar set of dislocation segments and the contour of the resolved shear stress on the<br />
glide plane: The stress is computed at the corner where two orthogonal segments meet (shaded area<br />
stress<br />
of 1 µm × 1 µm). The resolved shear stress shows no anomaly.<br />
nal stresses produce inhomogeneous stress fields in the volume. This inhomogeneity of the applied<br />
stresses can be incorporated using a code coupled with a finite element method ([Fivel et al. 98]).<br />
The more general cases which include internal interfaces, e.g. second phase particles or multilayer<br />
films are treated in Sec. 2.4.2.<br />
Line tension<br />
The mutual effect between two adjacent segments, which is not considered in the internal stress<br />
computation, is accounted for by a local line tension computation. The line tension T (θ) creates<br />
a force τlt = T (θ)/(bR) along the center of a dislocation arc with a radius of curvature R. T (θ) is<br />
given by the energy of a dislocation line E(θ) with θ being the angle that the Burgers vector makes<br />
with the dislocation line direction.<br />
T (θ) = E(θ) + d2 E(θ)<br />
dθ 2<br />
The simplest form of the line tension would be obtained by assuming that edge, screw and mixed<br />
segments have the same energy per unit length, i.e., E = αµb 2 . The line tension of an arc of<br />
dislocation then becomes τlt = αµb<br />
R<br />
from Eq. 2.5.<br />
The energy of a dislocation is dependent on the character however: a screw dislocation has lower<br />
energy than an edge one. This explains why a dislocation line shape is approximately elliptical with<br />
a major axis parallel to the Burgers vector. To include the variation of the energy with a segment<br />
character, the analytical equation of line tension suggested by Foreman [Foreman 67] (Eq. 2.6) is<br />
(2.5)
2.2 Computation of stresses and displacements of dislocations 19<br />
used.<br />
b θ L<br />
τlt τ’ lt<br />
Dislocation line vector<br />
Figure 2.7: Definition of the geometry of the line tension calculation.<br />
τlt =<br />
R<br />
µb<br />
4π(1 − ν)R (1 − 2ν + 3ν cos2 <br />
<br />
L<br />
θ) ln − ν cos(2θ)<br />
2b<br />
µ and ν stand for the shear modulus and the Poisson ratio respectively. R is the radius of a circle<br />
defined by the three center points of segments. L is the length of a segment and θ is the angle<br />
between the Burgers vector b and the dislocation line vector. The dislocation line vector is taken<br />
as parallel to the vector of two center points of the neighbor segments as illustrated in Fig. 2.7.<br />
τlt is, in fact, the magnitude of the line tension along the direction to the center of the circle. τlt<br />
projected to the glide direction of a segment is finally taken as the line tension acting on a segment.<br />
The Peierls force<br />
The Peierls stress refers to the applied resolved shear stress required to make a dislocation glide in<br />
an otherwise perfect crystal. This effect arises as a direct consequence of the periodic structure of<br />
the crystal lattice and acts as a friction to the dislocation motion. In the DDD, which cannot treat<br />
atomistic effects explicitly because of the lattice parameter xl of the order of 10b (Sec.2.1.1), the<br />
Peierls stress is simply implemented as a frictional force τp and contributes to the effective stress as<br />
a back stress to motion of a segment. In practice, the frictional force τp includes all the chemical<br />
effect, the impurities, and solutes etc. identified on experiments ([Déprés et al. 04]). In the case<br />
of FCC metals, τp is the order of 10 −5 µ, thus is expected to have a minute effect on the simulation<br />
results.<br />
(2.6)
20 Description of the simulation method<br />
Effective stresses<br />
After the internal (σint) and the applied stresses (σapp) are computed, the force on a slip system<br />
is defined by the Peach-Koehler equation and a projection along the glide direction g as shown in<br />
Eq.2.7.<br />
, where l is the unit vector tangent to the dislocation line.<br />
τg b = {[(σint + σapp) · b] × l} .g (2.7)<br />
It should be noted that σint and σapp are computed at the center of a given segment on the<br />
assumption that the stress field variations are small over the segment length. The effective stress<br />
τe is then computed by summing all the contributions as τe = τg + τlt − τp. Then, the velocity of<br />
the dislocation segment is given by Eq. 2.13.<br />
2.2.2 Computation of displacements<br />
The computation of the displacement field of dislocations is very useful not only in analyzing surface<br />
deformation induced by dislocations, but also in imposing displacement boundary conditions in a<br />
coupling method with a finite element method (Sec. 2.4.2).<br />
The displacement solution of any closed curved dislocations can be found from the Burgers formula<br />
in the frame of elastic isotropy. The Burgers equation is given in terms of line and area integrals as<br />
shown in Eq. 2.8 in a vector form.<br />
u(r) = − b<br />
<br />
1 b × dl<br />
Ω −<br />
4π 4π C<br />
′<br />
R +<br />
1<br />
8π(1 − ν) ∇<br />
<br />
(b × R) dl<br />
C<br />
′<br />
R<br />
b is the Burgers vector and ν is the Poisson ratio. Ω is the solid angle through which the positive<br />
side of a loop is seen and is defined as follows.<br />
<br />
RdA<br />
Ω = −<br />
A R3 The parameters for the computation Eq. 2.8 and Eq. 2.9 are shown for the configuration of a closed<br />
loop in Fig. 2.8.<br />
An analytical solution of the displacement fields can be obtained using Eq. 2.8 for the case of<br />
simple dislocation loops 7 . The solutions of complex dislocation loops are generally difficult to be<br />
resolved analytically. The general way of computing a displacement field of an arbitrary dislocation<br />
loop is to decompose the loop into triangular loops as illustrated in Fig. 2.8. The methodology<br />
to construct a displacement field from triangular loops was first presented by Hirth and Lothe (see<br />
7 Khraishi et al. ([Khraishi et al. 00b]) have found a closed-form analytical solution of a circular dislocation loop.<br />
(2.8)<br />
(2.9)
2.2 Computation of stresses and displacements of dislocations 21<br />
b<br />
C<br />
A<br />
Field point<br />
Ω<br />
R<br />
dl’<br />
n Slip plane normal<br />
Dislocation<br />
loop<br />
b<br />
Triangular loop<br />
n<br />
Dislocation<br />
segments<br />
Figure 2.8: The parameters in the Burgers equation (Eq. 2.8) and decomposition of a dislocation<br />
loop by triangular dislocation loops<br />
[Hirth & Lothe 92]). Special care, however, should be taken at evaluating the inverse trigono-<br />
metric functions, as the author experienced. Barnett ([Barnett 85]) has developed a formula more<br />
suitable for numerical computation, which will be detailed below.<br />
The displacement at a field point P(r) generated by a triangular dislocation loop with points<br />
A(rA), B(rB) and C(rC) are expressed as Eq. 2.10. The triangular dislocation loop ABC and a<br />
field point are shown in Fig. 2.9.<br />
u(r) = − b<br />
4π Ω + FAB + FBC + FCA<br />
(2.10)<br />
Ω is the solid angle associated with the triangle ABC, which generates a discontinuity of ∆u = b<br />
in traversing the cut surface ABC. F ij(i,j=A,B or C) is a continuous displacement field term ex-<br />
cept on the dislocation line. The solid angle Ω and the continuous terms Fij are given as follows<br />
([Barnett 85]).<br />
<br />
<br />
s<br />
<br />
s − a s − b s − c<br />
Ω = −sign (Ri.n) 4 arctan tan tan tan tan<br />
2 2<br />
2<br />
2<br />
<br />
Fij = −<br />
1 − 2ν<br />
8π(1 − ν) (b × tij) ln Rj + Rj.tij<br />
Ri + Ri.tij<br />
+<br />
1<br />
8π(1 − ν) (b.nij)<br />
<br />
Rj<br />
Rj<br />
The vectors and the constants in Eq. 2.11 and Eq. 2.12 are listed below.<br />
− Ri<br />
<br />
× nij<br />
Ri<br />
(2.11)<br />
(2.12)
22 Description of the simulation method<br />
n<br />
B(r<br />
)<br />
B<br />
A<br />
(r )<br />
A<br />
RA<br />
RB<br />
P (r)<br />
RC<br />
C (r C )<br />
Triangular loop<br />
Figure 2.9: A geometric configuration of a triangular loop and the parameters for the computation<br />
of displacements using Eq. 2.10<br />
⎧<br />
⎪⎨<br />
⎪⎩<br />
s = a+b+c<br />
2<br />
a = arccos (rB−r).(rC−r)<br />
rB−rrC−r<br />
b = arccos (rA−r).(rC−r)<br />
rA−rrC−r<br />
c = arccos (rA−r).(rB−r)<br />
rA−rrB−r<br />
Ri = ri − r<br />
tij = rj−ri<br />
rj−ri<br />
nij = Ri×Rj<br />
RiRj<br />
The displacements at any field point by a dislocation loop are obtained by the summation of the<br />
displacements of triangular loops which comprise the dislocation loop. As an example, the displace-<br />
ment field of a interstitial prismatic loop (Fig. 2.10(a)) computed by Eq. 2.11 and Eq. 2.12 is<br />
shown in Fig. 2.10(b). It can be seen that the interstitial prismatic loop induces the maximum<br />
displacement of 0.5b on the plane just above the loop.<br />
Displacement computation of more general cases of dislocation loops will be presented in Sec. 4.3.5,<br />
where the presented computation method is applied to the analysis of surface deformation during<br />
fatigue tests (see Sec. 4.3.5).
2.2 Computation of stresses and displacements of dislocations 23<br />
Computation plane<br />
(a) Schematic of the deformation around an interstitial prismatic<br />
loop<br />
b<br />
e 1<br />
e2<br />
Probing line<br />
Surface, b<br />
Probing line, µ m<br />
(b) Computed displacement field around an interstitial prismatic loop<br />
Figure 2.10: Computations of displacements induced by an interstitial prismatic loop using Eq. 2.10
24 Description of the simulation method<br />
2.3 Motion of dislocations<br />
2.3.1 Preliminaries<br />
The stress field of a moving dislocation is, in fact, not equivalent to that of a static dislocation.<br />
Under most dynamic conditions of practical interest, however, dislocations move in such a way<br />
that the dynamic stresses and displacements can be approximated quite accurately by the static<br />
solutions, e.g., the stress equations presented in Sec. 2.2.<br />
Only dislocation glide on a slip plane is considered in the current DDD code. No climb mechanisms 8<br />
are implemented here. Theoretically, diffusion theories could be incorporated in the DDD code to<br />
treat climb event properly, because climb involves interactions between dislocations and point defects<br />
(vacancies or interstitial atoms). Numerically, it would be necessary to include a new line vector<br />
and a glide direction into Tab. 2.1, because climb involves the nucleation and motion of jogs.<br />
Dislocation mobility is dependent on the applied shear stress and temperature. It varies also with the<br />
crystal purity and the dislocation type 9 . There are a number of forms for the relations between glide<br />
velocity and the effective shear stress, including power law forms and expressions with an activation<br />
term in an exponential function to represent the temperature-dependency ([Hirth & Lothe 92],<br />
[Kocks et al. 75]). A simple power law form is adopted in this work for convenience sake, but any<br />
forms of equation can be readily adopted.<br />
2.3.2 Dislocation mobility<br />
The simple power law relation (v ∝ (τ) m ) is used to compute the dislocation velocity. A linear form<br />
of the equation, m=1, is known to predict well the case of glide over the Peierls barrier in FCC<br />
metals.<br />
The velocity of a dislocation segment is given by<br />
vi = τe|b|<br />
B<br />
(2.13)<br />
with the effective stress of segment (τe), the Burgers vector (b) and the phonon drag coefficient<br />
(B) 10 . At room temperature, the coefficient B is found to be of the order of 10 −4 Pa·s for aluminium<br />
8 a process by which an edge dislocation can move out of its slip plane by diffusion<br />
9 In BCC single crystals, for example, a pure screw dislocation is more difficult to move than a mixed one at low<br />
temperature, since a screw dislocation has a complex core structure ([Urabe & Weertman 75]).<br />
10 Damping forces, which oppose dislocation motion, arise from the scattering of lattice vibrations (phonons) or<br />
electrons.
2.3 Motion of dislocations 25<br />
([Mason 68]) and 1.5 · 10 −4 Pa·s for copper ([Fusenig & Nembach 75]). The coefficient B, in<br />
fact, changes with the velocity of a dislocation as B = B0<br />
1−v 2 /c 2 . For simplicity, a constant value of B<br />
is used by putting a limit on the velocity of dislocations as vmax, so that v 2 /c 2 becomes relatively<br />
small.<br />
Using the velocity of a segment given by Eq. 2.13, the next position of the segment is solved by<br />
explicit integration such that x t+∆t<br />
i<br />
= xt i + vi∆t, where xt i is the position of the segment at time t<br />
and ∆t is the time step. As is a feature of the forward explicit algorithm, the use of a larger value<br />
of ∆t causes a numerical instability. In the DDD method, a dislocation segment may oscillate,<br />
because a large time increment causes a segment to move over a too large distance. This brings a<br />
significant change in the local curvature, and in turn, produces an increase of the back stress (the<br />
line tension). The segment oscillates consequently. The use of a constant value of ∆t in the range<br />
from 0.5 × 10 −9 to 1. × 10 −9 has been verified successful in practice, but ∆t has to be adapted for<br />
each simulation. The maximum velocity vmax is imposed so as to prevent the segments to glide over<br />
a too large distance.<br />
2.3.3 Dislocation-dislocation interactions<br />
A segment can interact with other segments during the glide. The task is then to search any possible<br />
intersection with segments within a virtual glide area of the gliding segment, which is defined by<br />
the length of the segment, Li and the free flight distance, vi∆t. The nearest intersection point of<br />
the possible interaction events is found from simple geometry of two finite lines (segments). The<br />
type of interaction is, then, determined by the relation of the Burgers vectors and the slip systems<br />
of the two intersecting segments.<br />
The types of possible dislocation-dislocation interactions considered in the DDD model are catego-<br />
rized as follows:<br />
a. coplanar cases in which two dislocation segments glide on the same plane<br />
b. non-coplanar cases in which two dislocation segments glide on different planes<br />
(a) Coplanar cases<br />
The portion of intersection of two segments with the same Burgers but opposite in direction (oppo-<br />
site sign) is deleted and the links of the rest segments are rebuilt as shown in Fig. 2.11(a). In case<br />
of the same sign, no interaction is realized, since it is elastically repulsive. Only discretization of a<br />
segment is done for the next step as illustrated in Fig. 2.11(b).
26 Description of the simulation method<br />
Opposite sign<br />
Same sign<br />
(a) Annihilation<br />
(b) Repulsion<br />
Annihilation<br />
Discretization<br />
Figure 2.11: Interaction between two segments in the same glide plane: Segments are annihilated<br />
if the sign is opposite, and discretized if the sign is same.<br />
No explicit handling is done in the case of two different Burgers vectors in the same plane, which<br />
corresponds to the a copla<br />
1<br />
(b) Non-coplanar cases<br />
case explained below.<br />
Before introducing interaction handling schemes for non-planar cases, dislocation junctions are<br />
presented, because such interactions result in the formation of junctions. In the frame of the<br />
hardening theory, five different forms of dislocation junctions are usually considered:<br />
(i) a coli<br />
1<br />
(ii) a ortho<br />
1<br />
(iii) a copla<br />
1<br />
for which b1 = b2 on different slip planes<br />
for which b1 ⊥ b2 on different slip planes<br />
for which b1 = b2 on the same slip plane<br />
(iv) a2 for which b1 + b2 is glissile on either of the planes<br />
(v) a3 for which b1 + b2 is sessile on either of the planes<br />
The junctions formed between slip systems are tabulated in Table 2.2 for the 12 slip systems defined<br />
in Table 2.1.<br />
(i) a coli<br />
1<br />
is represented in the DDD by changing neighboring arms between two interacting seg-<br />
ments 11 . Fig. 2.12 shows the intersection of two dislocation segments, which glide on a slip plane<br />
11 Its role in dislocation-hardening can be found in [Madec et al. 03].
2.3 Motion of dislocations 27<br />
A2 A3 A6 B2 B4 B5 C1 C3 C5 D1 D4 D6<br />
A2 a0 a copla<br />
1<br />
a copla<br />
1<br />
a coli<br />
1 a2 a2 a ortho<br />
1 a2 a3 a ortho<br />
1 a3 a2<br />
A3 a0 a copla<br />
1 a2 aortho 1 a3 a2 acoli 1 a2 a3 aortho 1<br />
A6 a0 a2 a3 aortho 1 a3 a2 aortho 1 a2 a2 acoli 1<br />
B2 a0 a copla<br />
1<br />
a copla<br />
1<br />
a ortho<br />
1 a3 a2 a ortho<br />
1 a2 a3<br />
B4 a0 a copla<br />
1 a3 aortho 1 a2 a2 acoli 1<br />
B5 a0 a2 a2 acoli 1 a3 a2 aortho 1<br />
C1 a0 a copla<br />
1<br />
a copla<br />
1<br />
a2<br />
a2<br />
a coli<br />
1 a2 a2<br />
C3 a0 a copla<br />
1 a2 aortho 1<br />
C5 symmetric a0 a2 a3 a ortho<br />
1<br />
D1 a0 a copla<br />
1<br />
a3<br />
a copla<br />
1<br />
D4 a0 a copla<br />
1<br />
D6 a0<br />
Table 2.2: Hardening coefficients<br />
and its deviate plane respectively. Segments change its neighbors upon intersection and make an<br />
angular dislocation with θ = 70.53 ◦ .<br />
(ii) No explicit treatment is done on a ortho<br />
1<br />
(iii) No explicit treatment is done on a copla<br />
1<br />
(known as Hirth lock).<br />
as explained in the coplanar cases above.<br />
(iv) & (v) a2 (known as Glissile junction) and a3 (known as Lomer-Cottrell lock) are implicitly<br />
adopted with the simple energy analogy in Eq. 2.14 Two segments of the Burgers vector b1 and b2<br />
n prim<br />
b<br />
devi<br />
n<br />
Figure 2.12: Changing of neighbor arms between two segments in primary and deviate planes.<br />
n prim<br />
b<br />
devi<br />
n
28 Description of the simulation method<br />
b<br />
(a)<br />
b<br />
(b)<br />
Figure 2.13: Cross-slip of a screw segment<br />
are considered to form a junction if a simple energy criterion<br />
b 2 1 + b 2 2 > (b1 + b2) 2<br />
b<br />
(c)<br />
(2.14)<br />
is satisfied. The energy of a dislocation is assumed to be proportional to |b| 2 and has no dependence<br />
on the line character in this criterion. Once a junction is formed, it is given a certain breaking<br />
strength τjunc. The junction can be broken afterward only if the effective stress of a component<br />
segment of the junction is larger than τjunc, thus the junction acts as a pinning point for the<br />
dislocation motion.<br />
Detailed studies of the dislocation junctions ([Shin et al. 01], [Rodney & Phillips 99]) show that<br />
they are formed due to the elastic fields of two dislocation lines and the strength of junction is<br />
governed by the "unzipping" mechanism. Thus the properties of junctions can be treated by the<br />
elastic stress fields of the involved dislocations. The local breaking strength of a junction will serve<br />
as pinning points in so-called mass simulations.<br />
2.3.4 Cross-slip of screw dislocation segments<br />
The cross slip of a screw segment (Fig. 2.13) is implemented in a stochastic manner accounting for<br />
its thermally activated character. A cross slip probability P over each time step is computed first<br />
using the equation<br />
P = β l<br />
δt<br />
L0 t0<br />
<br />
τd − τIII<br />
exp V<br />
κT<br />
(2.15)<br />
,where β is a normalization coefficient, l is the length of the particular screw segment, L0 is 1 µm,<br />
t0 is 1 sec, V is the activation volume, τd is the resolved shear stress in the cross slip system and<br />
τIII is a threshold stress. A random number r is generated and the dislocation cross slip occurs<br />
only if r is lower than P . As an example, the values used for V and τIII in copper are V = 350eV<br />
and τIII = 32 MP a.
2.4 Boundary conditions 29<br />
2.3.5 Plastic strain due to dislocation movement<br />
Dislocation motion results in plastic strain. The plastic strain of a simulation volume is determined<br />
by summing up the slipped area taking place in each slip system. The slip γ (s) of a slip system ’s’<br />
is computed as<br />
γ (s) = |b|A(s)<br />
V<br />
(2.16)<br />
with b being the Burgers vector, V the volume of the simulation box and A (s) the area swept by<br />
all the mobile dislocations of the slip system s over a time step. A (s) is defined as<br />
A (s) = <br />
Livi∆t (2.17)<br />
i<br />
where the summation is done over all the segments of the system s and Livi∆t is the area of glide<br />
of a segment i with the length Li. The components of the plastic strain tensor are given by<br />
ɛij =<br />
12<br />
s=1<br />
1<br />
<br />
n<br />
2<br />
(s)<br />
i b(s)<br />
j + n(s)<br />
j b(s)<br />
<br />
i γ (s)<br />
(2.18)<br />
with n (s)<br />
i and b (s)<br />
i being the component of the slip plane normal and the Burgers vector of the slip<br />
system s respectively.<br />
2.4 Boundary conditions<br />
2.4.1 Periodic Boundary Conditions<br />
Motivation and review of literatures<br />
Typically simulation volume are 10 3 − 15 3 µm 3 large simulation volume for a so-called mass simu-<br />
lation addressing work hardening or dislocation cell formation. In order to compare the simulations<br />
to experiments, it is desirable to build a simulation volume representative of a small element taken<br />
out from the single crystal or from the grain of a ploycrystal.<br />
Periodic boundary conditions (PBC) forcing segments to cross a boundary between two cells to<br />
emerge in all cells at the equivalent position on the opposite boundary, are extensively used to<br />
avoid undesirable size effects due to the finite dimensions of a simulation volume. PBC can be<br />
easily applied in 2D case, for example, by subtracting a simulation volume size (Lx, Ly) from coor-<br />
dinates of dislocation segments leaving the initial volume. The simulations of Gómez-García et al.<br />
[GG et al. 00] have shown many advantages of PBC compared to free boundary surfaces which are<br />
bound to have artificial dislocation losses and undesirable size effects.
30 Description of the simulation method<br />
0 1 ... ... L-2 L-1<br />
L-1<br />
Figure 2.14: Property of p.b.c<br />
PBC in <strong>3D</strong> was considered to be difficult because of the complexities related to the connectivity<br />
of the dislocation lines segments after exiting from one boundary. Since [Bulatov et al. 01] has<br />
demonstrated that PBC can be applied to dislocation dynamics, attentions have been given on the<br />
stress calculation, initial configuration of dislocations and balancing the incoming and outgoing dis-<br />
location fluxes. Madec et al. ([Madec et al. 04]) have reported that portions of dislocation loops<br />
may self-annihilate with replicas having emerged after a certain number of boundary crossings.<br />
This self-annihilation reduces the mean free-path of dislocations and consequently leads to spurious<br />
self-interactions, because a short effective mean free-path affects the density of mobile dislocations<br />
and their storage rate and, hence, both the microstructure arrangements and the strain hardening<br />
properties. The artifact of self-annihilation can be avoided by using an orthorhombic simulation<br />
volume.<br />
A numerical method that Madec et al. ([Madec et al. 04]) have used to apply PBC in <strong>3D</strong> is to<br />
translate all the segments about a selected segment by shifting it to the center of a volume, and<br />
apply "MODULO" operations so that the segment coordinates x larger than the simulation size Lx<br />
are replaced by the remainder of x/Lx.<br />
Numerical implementation<br />
A perpendicular line joining two opposite boundaries is actually equivalent to a line on a bracelet<br />
(Fig. 2.14). A quantity ic(i) with an integer argument i in the range of [0 : L − 1] has the<br />
property as given by Eq.(2.19) under PBC. Eq. (2.19) is merely another expression of Fig. 2.14 in<br />
L-2<br />
...<br />
0<br />
...<br />
1
2.4 Boundary conditions 31<br />
a mathematical form.<br />
ic(L + i) = ic(i)<br />
ic(−i) = ic(L − i) for i = 0, . . . (2.19)<br />
The array ipc can be used to redirect a segment coordinates, which has left an initial volume lattice,<br />
to an equivalent position in the initial lattice. Then it is possible to apply PBC with a simple<br />
array reference. The orthorhombic simulation volume is readily realizable by changing the range of<br />
periodicity according to the maximum length of the simulation volume along each axis.<br />
Because of the subnetwork in the simulation volume (see Sec. 2.1.3), the periodicity should be a<br />
multiple of 4xl along each axis.<br />
2.4.2 Internal interfaces<br />
Motivations and review of the literature<br />
The collective behavior of dislocations in a single crystal can be simulated with the stress com-<br />
putation and motion treatments as explained in the previous sections. More rigorous boundary<br />
conditions need to be implemented on the method in order to treat more general cases, such as<br />
a crystal with free surfaces, a crystal containing particles of a second-phase or a polycrystal with<br />
grain boundaries.<br />
A dislocation experiences forces near an interface because the dislocation energy is different in the<br />
two mediums involved. The dislocation is attracted towards a free surface, for example, and repelled<br />
by a rigid surface layer. These image stresses can be treated by using the superposition principle.<br />
The effects of free surfaces were treated by Fivel et al. ([Fivel & Canova 99]). The forces ex-<br />
erted on a free surface by dislocations are computed assuming that the dislocations are embedded<br />
in an infinite medium. These forces are then reversed and changed into the appropriate point<br />
forces to enforce the traction free surface condition. Applications of this method can be found in<br />
[Fivel et al. 98].<br />
The image stresses by a free surface is, in fact, a special case of the more general situation in which<br />
an interface separates two materials of differing elastic constants, e.g., oxide layers and particles.<br />
The image stresses on a dislocation in the presence of a second phase particle can be computed also<br />
by the superposition principle. The formulation follows that of Van der Giessen and Needleman<br />
([Giessen & Needleman 95]). Previous applications of this method to 2D cases can be found in<br />
Cleveringa et al. ([Cleveringa et al. 97]).
32 Description of the simulation method<br />
Facet<br />
,τ facet<br />
Glide plane<br />
Intersection<br />
Segment, τ e<br />
Figure 2.15: Geometries of a facet and construction of a sphere by square facets.<br />
In this section, complete method to treat internal interfaces is described. Firstly, an interface is<br />
represented by a set of facets, which have a certain strength thus, can act as barriers to dislocation<br />
motion. The application of this method can be found in Sec. 4.3. Secondly, a full account of elastic<br />
interaction with dislocations or image stresses is presented using a coupling method with a finite<br />
element method. The method is applied to compute the image stresses in Sec. 4.1.<br />
Internal interfaces represented by facets<br />
A curved <strong>3D</strong> boundary is approximated by a series of facets, in the same way as a surface is repre-<br />
sented by a finite element meshing. Each facet is defined by indexes of its nodes or vertices, whose<br />
coordinates are stored separately.<br />
Intersection events between a segment and a facet is detected by determining the nearest intersec-<br />
tion point between a facet and a virtual glide plane of a segment (Fig. 2.15).<br />
Each facet is given a strength τfacet. Only segments whose effective stress are greater than τfacet<br />
are allowed to cross the facet, i.e. a facet acts as a barrier to dislocation motion. The strength<br />
is further specified by τ +<br />
facet<br />
and τ −<br />
facet<br />
depending on the relation between moving direction of a<br />
segment (g) and the normal direction of a facet (n), which makes the application of facets more<br />
flexible. A facet of τ +<br />
facet<br />
being 100 MP a and τ −<br />
facet<br />
being 0, for example, means that the facet<br />
blocks all the segments of g · n > 0 if the effective stress is lower than 100 MP a, but is transparent<br />
to segments moving along −n direction, that is, g · n < 0.<br />
The facet method enables simple geometrical barriers to dislocation motion in dislocation dynamics.<br />
When applied to treat the case of dislocation-precipitate interactions, this method can be consid-
2.4 Boundary conditions 33<br />
ered as a first-order approximation in the sense that elastic interactions between dislocations and<br />
interfaces are not considered. The application of the facet model to a particle-strengthened crystal<br />
is presented in Sec 4.3, where the hypothesis used to derive the strength τfacet are explained in<br />
detail for the unshearable and shearable particle cases.<br />
Full account of elastic interactions<br />
The problem of a finite volume containing dislocations is decomposed into two problems:<br />
1. the problem of dislocations in an infinite elastic isotropic medium<br />
2. the complementary problem of a finite dislocation-free volume, which compensates for the<br />
proper boundary conditions.<br />
The problem decomposition is shown schematically in Fig. 2.16. The stress and strain field of the<br />
current state of the body, σ and ɛ are determined by the governing equations<br />
∇ · σ = 0, ɛ = ∇u<br />
σ = LM : ɛ in VM and σ = LP : ɛ in VP<br />
with moduli LM, LP of matrix and particle respectively. Boundary conditions are<br />
u = Uap on Su, n · σ = Fap on St.<br />
After the decomposition, the stress and strain fields are written as the superposition of two fields:<br />
ɛ = ɛ1 + ɛ2, σ = σ1 + σ2 (2.20)<br />
In the first problem (denoted by 1), it is assumed that the dislocations are in an infinite elastic<br />
isotropic medium. The stress(σ1) /strain(ɛ1) relationship is expressed as σ1=LM : ɛ1 in the whole<br />
volume. The forces FD and displacements UD on the virtual boundaries can be computed by the<br />
expressions presented in Sec. 2.2.<br />
In the second problem, the simulation volume contains no dislocations. The fields in the second<br />
problem (denoted by 2) are the fields needed to correct the actual boundary conditions as well as for<br />
the presence of the inclusions. The governing equations for the complementary problem becomes:<br />
σ2 = LM : ɛ2 in VM<br />
σ2 = LP : ɛ2 + σcorrec in VP (2.21)
34 Description of the simulation method<br />
The complementary problem has a correction term such as σcorrec = (LP −LM) : ɛ1 in VP . With this<br />
correction term, the current stress field in the particle volume can be constructed by the superposi-<br />
tion of two fields (σ = σ1 +σ2 in VP ). By replacing ɛ1 with L −1<br />
M : σ1, this correction term equals to<br />
(LP : L −1<br />
M − I) : σ1, where I represents the fourth-order unit tensor. (LP : L −1<br />
M − I) is expressed by<br />
the Young’s modulii and the Poisson’s ratios of the matrix (E, ν) and the particle (E ∗ , ν ∗ ) as follows.<br />
(LP : L −1<br />
M<br />
⎛<br />
⎞<br />
a1 − 1<br />
⎜<br />
− I) = ⎜<br />
⎝<br />
a2<br />
a1 − 1<br />
a2<br />
a2<br />
a1 − 1<br />
0<br />
0<br />
0<br />
a3 − 1<br />
0<br />
0<br />
0<br />
0<br />
a3 − 1<br />
0<br />
0<br />
0<br />
0<br />
0<br />
a3 − 1<br />
⎟<br />
⎠<br />
with a1 being E∗ (1−ν∗−2νν ∗ )<br />
E(1+ν∗ )(1−2ν∗ ) , a2 being<br />
E∗ (ν∗−ν) E(1+ν∗ )(1−2ν∗ ) and a3 being E∗ (1+ν)<br />
E(1+ν∗ ) .<br />
The complementary problem is solved using CAST∃M( 12 ), a finite element code developed in France<br />
by the Commissariat à l’Energie Atomique. The FEM formulation in the particle volume of the<br />
second problem can be written as follows with a strain-displacement matrix (B) :<br />
<br />
VP<br />
B T <br />
· L · BdV · u +<br />
VP<br />
B T · LP : L −1<br />
M − I · σ1dV = 0 (2.22)<br />
In order to compute the body force-like term (right-hand side of Eq. 2.22) within the precipitate<br />
volume, first the stresses σ1 due to the dislocations at the points in VP , e.g., at the stress integration<br />
Gauss points, are computed. Then the correction term is computed within each finite element inside<br />
the particle. The computed stresses σcorrec are then changed into a nodal body force field, f b . This<br />
can be easily done with the ’BSIG’ operator in CAST∃M. These forces are applied to VP and the<br />
FEM gives the solution of a two phases boundary problem where forces Fap −FD and displacements<br />
Uap − UD are imposed at the boundary and body forces f b are applied inside the particle. The<br />
continuity of displacement and normal stresses at the particle/matrix interface are enforced by the<br />
FEM.<br />
12 Finite element code developed by Commissariat à l’Energie Atomique, CEA-DRN/DMT/SEMT
2.5 Acceleration of the DDD code 35<br />
Figure 2.16: Decomposition of the problem into the problem of dislocations in infinite media and<br />
the complementary problem of inhomogeneous finite volume without dislocations. Forces(Fap) and<br />
displacements(Uap) are applied on the boundary. In the complementary problem, boundary condi-<br />
tions are modified with forces(FD), displacements(UD) and a nodal body force field(f b ) generated<br />
by dislocations.<br />
2.5 Acceleration of the DDD code<br />
2.5.1 Problem description and review of literatures<br />
Internal stress computation is the most computationally intensive part in the DDD method. This<br />
is due to the fact that the stress field at a distance r from a dislocation line is proportional to 1/r.<br />
The stress field of a dislocation line is thus long-ranged. Another time consuming part in the DDD<br />
method is handling the dislocation segments interactions. Segment motion involves examination of<br />
possible interactions, between dislocations or between dislocation and internal interfaces.<br />
In a programming perspective, the two parts can be represented as follows in pseudo-code.<br />
Internal stress computation<br />
DO I=1,Nsegm<br />
DO J=1, Nsegm<br />
if(J=I and I’s neighbor)<br />
ENDDO<br />
ENDDO<br />
Compute σ int<br />
I←J<br />
Nsegm: Number of segments<br />
Nfacets: Number of facets<br />
Segment motion<br />
DO I=1,Nsegm<br />
DO J=1, Nsegm<br />
Examine interaction with segment J<br />
ENDDO<br />
DO K=1, Nfacets<br />
Examine interaction with facet K<br />
ENDDO<br />
Move segment I<br />
ENDDO
36 Description of the simulation method<br />
Both parts need the order of N 2 segm computation with Nsegm being the number of dislocation seg-<br />
ments. As for the segment motion, Nsegm × Nfacets additional computations are required. It should<br />
be noted that in the ’Segment motion’, each segment is treated and moved sequentially. In addition,<br />
each individual segment displacement generates a new dislocation configuration. In complex situ-<br />
ation, changing the computing order of the segments may slightly change the resulting dislocation<br />
structure.<br />
In Molecular Dynamics simulations, the stress computation favors the use of a cut-off distance, be-<br />
yond which the stress is called a long-distance stress and neglected, because the interatomic stress<br />
field is short-ranged. This cut-off scheme reduces the cost of the stress computation with a minor er-<br />
ror. In Dislocation Dynamics simulations, however, the cut-off distance scheme may cause a spurious<br />
formation of cells ([Gullouglu et al. 89]). The study of Devincre et al. ([Devincre et al. 01])<br />
has shown, however, that neglecting the long-distance stresses does not affect much the yield stress<br />
and hardening properties of FCC single crystal. It should be noted that the study was dealing with<br />
dislocation patterning in multislip conditions, where cross-slip of dislocations, which is governed by<br />
a short-distance stress, is supposed to play an important role. However, it would be difficult to<br />
generalize Devincre et al.’s observation to other situations. Thus it is generally required to take into<br />
account all the dislocations in the simulation volume to compute the internal stresses.<br />
Reasonable approximations in the computation of the internal stresses have been made to overcome<br />
this severe computational limitation. In [Verdier et al. 98], the simulation volume is decomposed<br />
into boxes and short- and long-distance stresses are classified by the topology of boxes. The com-<br />
putational cost can be reduced by updating the long-distance stresses less frequently. The concept<br />
of superdislocation has been adopted in stress computation by [Zbib et al. 98]. The idea is to re-<br />
place a large number of dislocation segments beyond a certain distance into a limited number of<br />
superdislocations, which have a modified Burgers vector magnitude. This method is based on the<br />
multipolar expansion of the elastic field of a 2D dislocation array and extended in <strong>3D</strong> by a simple<br />
’projection-extension’ method.<br />
2.5.2 The Box method<br />
The box method proposed by [Verdier et al. 98] is based on the fact that a dislocation micro-<br />
structure does not change rapidly by comparison with the short time step used in the simulation<br />
(O(10 −9 sec.)). Thus stress fields of the long-distance segments could be updated with a certain<br />
frequency and between updates the previous values could be used with an acceptable error.
2.5 Acceleration of the DDD code 37<br />
(a) Dislocations in a cubical simulation volume (b) Division of the simulation volume into boxes<br />
Figure 2.17: Decomposition of a simulation volume into boxes: (a) A typical dislocation structure<br />
in a cubical simulation volume (b) Simulation volume divided into 10 × 10 × 10 boxes<br />
The simulation volume is first decomposed into boxes. For the sake of simplicity of the computation<br />
scheme, each side of the simulation volume is divided into M boxes. Hence the simulation volume<br />
comprises M 3 homologous boxes. Fig. 2.17(a) shows a typical simulation volume with dislocation<br />
segments. Fig.2.17(b) is an example of the same simulation volume decomposed into 10 3 boxes.<br />
To facilitate the identification of the segments in the box ib, linked-lists of segments are constructed.<br />
As shown in Fig. 2.18, the mid-point of a segment (imid(i)) is used to determine the box index (ib)<br />
to which it belongs.<br />
ib = 1 + imid(1)<br />
N1<br />
M<br />
+ imid(2)<br />
N2<br />
M<br />
M + imid(3)<br />
M N3<br />
M<br />
2<br />
(2.23)<br />
N1, N2 and N3 are the sizes of the orthorhombic simulation volume along x, y and z axis. The array<br />
indexb(ib) saves the number of segments belonging to the box ib. An array isbox(ib, 2) saves the<br />
index of the first segment in the box ib. The linked-list of segments is implemented with the array<br />
isbox(is, 1 : 2): isbox(is, 1) indicates the index of segment prior to is and isbox(is, 2) reserves the<br />
index of segment posterior to is. The identification of the segments in box ib is shown schematically<br />
in Fig. 2.18. A segment can be easily added or subtracted by switching the array isbox.<br />
Note that the number of boxes is limited since the box size should be big enough. The minimum size<br />
of the boxes is chosen so that the first neighboring boxes include the maximum free-flight distance of<br />
a segment. The criterion defining the minimum edge length of a to adopt for a box can be expressed
38 Description of the simulation method<br />
as Eq.(2.24).<br />
ib1 ib2<br />
1<br />
ib3 3 ib4<br />
5<br />
15<br />
14<br />
7<br />
11<br />
16<br />
6<br />
212<br />
9<br />
10<br />
8<br />
13<br />
4<br />
indexb<br />
ib1 7 1<br />
ib2 10 4<br />
ib3 3 5<br />
ib4 12 2<br />
Figure 2.18: Linked list of segments<br />
<br />
min a ≥ 1<br />
√ ld, a ≥<br />
2 2 <br />
√ vmaxδt<br />
6<br />
ib1 ib2 ib3 ib4<br />
2 4 5 5<br />
6 16<br />
14 11 15<br />
13 9 8<br />
(2.24)<br />
The first term in Eq.(2.24) states that neighbors of a segment are located inside the first neighbor-<br />
hood, hence it is given by the discretization length ld. The second term states that a segment is not<br />
allowed to move across the first neighboring boxes in one step, thus it is a function of the maximum<br />
velocity vmax (see Sec 2.3.2) and time step ∆t. Fig. 2.19 shows the criterion of the minimum edge<br />
length of a box.<br />
The use of the box sizes larger than the minimum size of the box reduces computing cost in ’Segment<br />
motion’ part. This is because only interactions within a maximum free-flight distance of a segment<br />
need to be considered instead of taking all the segments and facets into consideration. This will<br />
reduce the number of segments and facets to be inspected without any approximation.<br />
The internal stress acting on a segment is divided into a long-distance stress (σ LR ), which varies<br />
rather slowly over time steps and a short-distance stress (σ SR ), which shows large fluctuation over<br />
single time steps. σ SR of a segment in the box ib is computed by taking all the segments into<br />
account in the L th neighboring boxes at every simulation step. σ LR is adopted by the stress at the<br />
center point of ib from all the segments outside of the L th neighboring boxes. All segments in the<br />
same box, therefore, have the same σ LR . This approximation is valid if σ LR has a wave length<br />
larger than the box size. The computation of σ LR for all the boxes is updated every f step.<br />
The parameters involved in the box method are listed in Table 2.3. The maximum number of boxes<br />
M is given by the minimum box size (Eq.(2.24)) and the simulation volume size. The other param-<br />
eters should be chosen based on the numerical accuracy and the speedup, and will be the issue of<br />
the following section.
2.5 Acceleration of the DDD code 39<br />
[100]<br />
[001]<br />
Slip direction,<br />
[112]<br />
(1)<br />
(2)<br />
Slip plane,<br />
(11-1)<br />
Screw<br />
segment<br />
Figure 2.19: Minimum box size<br />
Parameter Description<br />
[010]<br />
M number of boxes along each side of a simulation volume<br />
f frequency of σ LR update<br />
L number of layers for σ SR<br />
Table 2.3: Parameters of the box method<br />
The pseudo-code of internal stress computation in Sec. 2.5.1 is then substituted by the following<br />
pseudo-code.<br />
Internal stress computation<br />
DO I=1,Nsegm<br />
Identify the box ’ib’ of the segment ’I’<br />
Compute the stresses σ SR by segments<br />
within short-distance boxes<br />
Add σ LR (ib)<br />
ENDDO<br />
Long-distance stress computation (every f<br />
step)<br />
DO iz=1,M<br />
DO iy=1,M<br />
DO ix=1,M<br />
compute the box index ’ib’<br />
compute the long-distance stresses σ LR (ib)<br />
ENDDO<br />
ENDDO<br />
ENDDO<br />
at the center of ’ib’
40 Description of the simulation method<br />
And the pseudo-code of the segment motion in Sec. 2.5.1 is replaced by<br />
Segment motion<br />
DO I=1,Nsegm<br />
Identify the box ’ib’ of the segment ’I’<br />
Examine interaction with segments and facets<br />
within short-distance boxes<br />
Move the segment ’I’<br />
ENDDO<br />
2.5.3 Speedup and Error<br />
Optimum values of M, L and f in Table 2.3 should be chosen so as to minimize errors and maximize<br />
speedup. There exist two sources of errors in the internal stress computation, i.e. a spatial and a<br />
temporal error. The spatial error occurs because σ LR is computed at the center point of a box and<br />
assigned to all the segments in that box. The temporal error is induced by updating σ LR with a<br />
frequency f so that σ LR of the previous computation is used during f steps.<br />
Speedup<br />
The speedup is defined as the ratio between the execution time of the box method and that of the<br />
original method. It is used to measure the relative algorithm performance. To facilitate an analyt-<br />
ical relation, the execution time is assumed to be proportional to the number of computations.<br />
Nsegm segments are assumed to be homogeneously distributed over the simulation volume de-<br />
composed by M 3 boxes. When not using the box method, the number of computations of in-<br />
ternal stress (n orig<br />
s ) is N 2 segm 13 . Using the box method, the number of computation for σ SR is<br />
(2L + 1) 3 Nsegm<br />
M 3 Nsegm and M 3 − (2L + 1) 3 Nsegm<br />
M 3<br />
M 3<br />
f for σLR . The speedup of the box method is<br />
then given as Eq. 2.25 14<br />
Speedup = norig s<br />
nbox s<br />
=<br />
(2L + 1) 3 N 2 segm<br />
M 3<br />
N 2 segm<br />
+ (M 3 −(2L+1) 3 )Nsegm<br />
f<br />
(2.25)<br />
Solid lines in Fig. 2.20 show Eq. 2.25 as a function of M for Nsegm = 10, 000, 20, 000 and 90, 000.<br />
The number of layers L is set to 1 and σ LR update frequency f is 20. There exist maxima in<br />
13 The number of computations is Nsegm(Nsegm − 3) precisely because two neighbor segments and itself are not<br />
considered in the internal stress computation. For simplicity, it is approximated by N 2 segm<br />
14 It should be noted that the equation is derived with the assumption that periodic boundary conditions are applied<br />
as detailed in Sec. 2.5.4
2.5 Acceleration of the DDD code 41<br />
Speedup<br />
140<br />
120<br />
100<br />
80<br />
60<br />
40<br />
20<br />
0<br />
N segm =90k<br />
N segm =20k<br />
N segm =10k<br />
N segm =20k(measured)<br />
N segm =10k(measured)<br />
5 10 15 20 25<br />
M<br />
Figure 2.20: Evolution of the speedup of domain decomposition method as a function of the number<br />
of boxes (M) and number of segments (N) in the condition that L = 1, f = 20<br />
speedup depending on the number of segments. Solid dots represent the actual data measured with<br />
a 3.0-GHz Intel Pentinum 4 processor and 1 GB of memory. Only the elapsed time for computing<br />
the internal stress is measured. The measured data reflects well the characteristic of Eq. 2.25, even<br />
though the segments are not distributed perfectly homogeneously.<br />
The effect of f on the speedup is shown in Fig. 2.21(a), and that of increasing L is shown in Fig.<br />
2.21(b). The optimum value of M is dependent on the value of f and L.<br />
There is always gain in speedup regarding the segment motion by increasing the number of boxes.<br />
Assuming Nsegm segments and Nfacets facets, the speedup in examining the interactions can be<br />
represented as Eq. 2.26.<br />
Speedup = norig o<br />
nbox o<br />
= N 2 segm + NsegmNfacets<br />
N 2 segm<br />
M 3<br />
+ NsegmNfacets<br />
M 3<br />
= M 3<br />
(2.26)
42 Description of the simulation method<br />
Speedup<br />
80<br />
70<br />
60<br />
50<br />
40<br />
30<br />
20<br />
10<br />
0<br />
f=30<br />
f=20<br />
f=10<br />
5 10 15 20 25<br />
M<br />
(a) Effect of f (L = 1, Nsegm = 20, 000)<br />
Speedup<br />
70<br />
60<br />
50<br />
40<br />
30<br />
20<br />
10<br />
0<br />
L=1<br />
L=2<br />
L=3<br />
5 10 15 20 25<br />
M<br />
(b) Effect of L (f = 20, Nsegm = 20, 000)<br />
Figure 2.21: Effect of the number of layers (L) and frequency (f) on the speedup of stress compu-<br />
tations<br />
Spatial error<br />
A large box size or small M is bound to have a large spatial error at the end of the diagonal due<br />
to a large deviation from σ LR computation position (center of the box)(see Fig. 2.22(a)). A small<br />
box size or large M has also a large spatial error (Fig. 2.22(b)), but in this case the reason is due to<br />
that the front boxes for σ LR computation are too close. Segments in the front boxes would generate<br />
highly inhomogeneous stress fields.<br />
In Fig. 2.23, relative spatial error along a diagonal of the central box is shown for each M. Here,<br />
the simulation volume is cubic shape with the edge length of 16.4 µm containing 22, 210 segments<br />
(ρ 2.5 × 10 12 m −2 ), which is taken from a tensile simulation along [001]. ɛr is defined as Eq. 2.27<br />
with σ exact computed at each point on the diagonal and σ approx computed at the center point of<br />
the box.<br />
6<br />
|σ<br />
i=1<br />
ɛr =<br />
exact<br />
i<br />
6<br />
σexact i<br />
i=1<br />
− σ approx<br />
i |<br />
(2.27)<br />
From the figure, it can be seen that both small and large values of M increase the relative spatial<br />
error. To compare the curves, ɛr is averaged and shown in Fig.2.24 as a function of M . There is a<br />
certain value M that has a minimum spatial error.<br />
The most effective way to minimize the spatial error would use the smallest box size with a certain<br />
number of layers L for σ LR as shown in Fig. 2.22(c) with L = 3. Indeed, the mean spatial stress
2.5 Acceleration of the DDD code 43<br />
is<br />
Long-distance<br />
stress<br />
(a) M=5, L=1<br />
Short-distance<br />
stress<br />
is<br />
Long-distance<br />
stress<br />
(b) M=15, L=1<br />
Short-distance<br />
stress<br />
is<br />
Long-distance<br />
stress<br />
(c) M=15, L=3<br />
Short-distance<br />
stress<br />
Figure 2.22: Effect of the number of boxes (M) and layers (L) on the accuracy of stress computations<br />
Relative spatial Error<br />
0.25<br />
0.2<br />
0.15<br />
0.1<br />
0.05<br />
M=21<br />
M=15<br />
M=7<br />
0<br />
-2.5 -2 -1.5 -1 -0.5 0 0.5 1 1.5 2 2.5<br />
Position on the diagonal(microns)<br />
Figure 2.23: Relative spatial error along a diagonal of the central box. (M=number of boxes along<br />
each axis, L=1)
44 Description of the simulation method<br />
Mean Relative Spatial Error<br />
0.1<br />
0.08<br />
0.06<br />
0.04<br />
0.02<br />
0<br />
6 8 10 12 14 16 18 20 22<br />
Figure 2.24: Mean relative spatial error of stress computation as a function of the number of boxes<br />
(M) and the number of layer (L)<br />
M<br />
L=2<br />
L=3<br />
could be decreased down to 2% using L = 3 as shown in Fig.2.24.<br />
Temporal error<br />
It is difficult to evaluate a temporal error because it is strongly related to how fast a dislocation<br />
structure changes, which is governed by both the type of mechanical test simulated and the time<br />
step. So it is difficult to set f a priori. In order to evaluate the effect of f, a simple tensile test<br />
has been done in a constant strain-rate condition (˙ɛ = 10 3 sec −1 ) with 22, 210 initial segments. The<br />
time step is set to 2.10 −10 second and M = 21, L = 3. During the test, internal stress is recorded<br />
at the center point of a simulation volume. A relative temporal error is defined as in Eq. 2.27.<br />
σ exact denotes the internal stress at the central point computed over each time step and σ approx is<br />
the stress with σ LR updated at the frequency f. In Fig. 2.25, the relative temporal error is shown<br />
for the cases f = 20, 40, and 60. In the case f = 60, the maximum error level observed reaches 5%.<br />
The update frequency of 60, however, induces a negligible effect on the overall stress-strain curve<br />
as shown in Fig. 2.26.<br />
In conclusion, the use of a maximum number of boxes is favorable, although speedup analysis in<br />
stress computation indicates that there exists an optimum number of boxes. One reason is that
2.5 Acceleration of the DDD code 45<br />
Temporal error<br />
0.06<br />
0.05<br />
0.04<br />
0.03<br />
0.02<br />
0.01<br />
0<br />
1200 1250 1300 1350 1400<br />
Step number<br />
f=60<br />
f=40<br />
f=20<br />
Figure 2.25: Effect of the frequency of long-distance stress computation on the relative temporal<br />
error. (f=σ LR update frequency)<br />
Stress[MPa]<br />
180<br />
170<br />
160<br />
150<br />
140<br />
130<br />
120<br />
110<br />
Reference<br />
f=20<br />
f=40<br />
100<br />
f=60<br />
0.0e0 4.0e-5 8.0e-5 1.2e-4 1.6e-4 2.0e-4<br />
Strain<br />
Figure 2.26: Stress-strain curves of simulations with the σ LR update frequency f
46 Description of the simulation method<br />
Shifted<br />
boundaries<br />
Original<br />
boundaries<br />
Figure 2.27: Computation of stresses under periodic boundary conditions and the box method<br />
a large number of M always delivers an advantage on segment motion by the factor of 27/M 3 .<br />
Another one is related to the parallelization scheme, which will be detailed in Sec. 3.3.<br />
2.5.4 Boxes and Periodic boundary conditions<br />
An efficient method to apply PBC is presented in Sec. 2.4.1. When the simulation volume is divided<br />
into boxes and the internal stresses are decomposed into long- and short-distance stresses, attention<br />
should be paid to the segments in the boundary boxes. As shown in Fig. 2.27, some of the boxes<br />
(especially along the boundaries) may need to account for segments inside so-called image boxes<br />
for internal stress computation and segment motion. The segments’ coordinates in the image boxes<br />
are determined by translating the segments coordinates from the appropriate boxes. This operation<br />
can be performed by a simple array reference and addition/subtraction.<br />
Fig. 2.28 shows the example of the activation of a Frank-Read source in the cubic and the or-<br />
thorhombic simulation volume, and the number of segments is recorded in Fig. 2.29. In the case of<br />
the cubic simulation volume, the self annihilation of segments occurs and the number of segments<br />
oscillates as shown in Fig. 2.29, whereas the dislocation density increases in the orthorhombic sim-<br />
ulation volume. It is desirable to use the orthorhombic simulation volume to remove the artificial<br />
self annihilation of dislocations due to the periodic boundary conditions.
2.5 Acceleration of the DDD code 47<br />
[100]<br />
[001]<br />
[010]<br />
(a) The cubic and the orthorhombic simu-<br />
lation volume<br />
(b) Dislocation structure seen at (110) di- (c) Dislocation structure seen at (110) di-<br />
rection in the cubic simulation volume<br />
rection in the orthorhombic simulation vol-<br />
Figure 2.28: Activation of a Frank-Read source in the cubic and the orthorhombic simulation volume<br />
under periodic boundary conditions<br />
ume
48 Description of the simulation method<br />
Number of segments<br />
1800<br />
1600<br />
1400<br />
1200<br />
1000<br />
800<br />
600<br />
400<br />
200<br />
Orthorhombic<br />
Cubic<br />
0<br />
2500 3000 3500 4000 4500<br />
Step number<br />
Figure 2.29: Change of the number of segments with respect to the simulation steps. In the case of<br />
the cubic simulation volume, self annihilation of dislocations occurs.<br />
2.6 Computation procedure of the DDD program<br />
The serial DDD program using the box method can be subdivided into the following tasks.<br />
a. Initialization<br />
b. Discretization of the segments<br />
c. Construction of the linked-lists<br />
d. Updating of the long-distance stresses every f steps<br />
e. Computation of the short-distance stresses<br />
f. Motion of segments<br />
g. Updating the external stresses<br />
h. Save of outputs<br />
A simulation initialization (a) requires to set parameters such as the number of time steps, the<br />
number of boxes, the material property constants and the loading conditions etc. It also reads the<br />
initial segment configurations, geometries of the simulation box and internal interfaces from external
2.6 Computation procedure of the DDD program 49<br />
files.<br />
Operations from ’b’ to ’h’ are executed sequentially over each time step. The segments which are<br />
larger than a maximum length (defined explicitly at initialization) are further discretized in the task<br />
’b’. Linked-lists of segments in each box are constructed (’c’). Long-distance stresses are computed<br />
every f steps at the center of each box (’d’) as described in Sec. 2.5.2. Short-distance stresses are<br />
computed using linked-list of segments (’e’). Once stresses on each segment are known, the effective<br />
stresses are computed using Eq. 2.7, and all the segments are moved to the next positions after<br />
examination of all possible interactions (’f’). The external stresses are updated according to the<br />
loading conditions (’g’), and output data like current stresses, strains and dislocation configurations<br />
are saved in external files (’h’). This completes one time step and the same procedure is performed<br />
at the next time step.<br />
Key points<br />
• The DDD method used in this work discretizes perfect dislocations into discrete dislocation<br />
segments of a pure edge and screw type in a volume homothetic to the FCC structure with<br />
the lattice spacing of ∼ 10b.<br />
• The effective stress acting on a segment is computed, accounting for the internal, applied<br />
stresses, line tension and the Peierls stress in the frame of linear isotropic elasticity.<br />
The displacements of dislocation loops are computed using Barnett’s expressions.<br />
• A linear relation between the effective stress and the velocity of segments is used. Dislocation<br />
interactions are taken into account by local rules. The cross-slip of a screw segment is<br />
implemented in a stochastic manner.<br />
• Periodic boundary conditions are applied in an orthorhombic simulation volume.<br />
• Internal interfaces are represented either by simple facets with certain strengths or by a<br />
coupled method with a finite element method.<br />
• The box method is revisited in order to increase the computing efficiency of the DDD code.<br />
A speedup of 50 with errors lower than 3% is obtained in the typical situation of 20, 000<br />
segments submitted to tensile loading (L=1, f=20, M=15)
Chapter 3<br />
Parallelization of the Discrete<br />
Dislocation Dynamics method<br />
Although the numerical efficiency of the serial DDD method has been improved by using the box<br />
method (see Sec. 2.5), the code is still insufficient to deal with a large density of dislocations or<br />
dislocations interacting with thousands of precipitates. It is often said that there exists the gulf between<br />
the desired problem size and the available computing power, since computational demands usually exceed<br />
the performance of currently available computing hardware.<br />
A parallel version of the DDD program has been developed in an attempt to simulate the interactions<br />
between dislocations and a large number of precipitates within a reasonable time using parallel comput-<br />
ers 1 . The object of this chapter is to present the development of the new parallel DDD program and its<br />
performance.<br />
In Sec. 3.1, parallel computing hardware is listed and various models and programming languages suit-<br />
able for each hardware are reviewed. This section is intended to explain the reason of the parallel model<br />
chosen in this work.<br />
In Sec. 3.2, the hot spots of the serial DDD program are analyzed focusing on the data flow dependen-<br />
cies. Based on the flow dependencies, the existing parallel algorithms are reviewed to help in establishing<br />
a parallelization strategy.<br />
Sec. 3.3 describes the parallelization of the serial DDD code from a programming perspective. The par-<br />
allelization algorithm of each of the hot spots of the serial DDD code is presented using pseudo-codes.<br />
An attempt to increase the performance of the new parallel DDD program is presented in Sec. 3.4. The<br />
1 A parallel computer refers to several computers that are interconnected to increase computing power.
52 Parallelization of the Discrete Dislocation Dynamics method<br />
performance of the program is quantified and issues such as the load balance are investigated.<br />
Although the DDD code used here is the edge-screw model presented in Chapter 2, the parallelization<br />
scheme is quite general and may be applied to any DDD code or finite difference methods which have<br />
similar data dependencies.<br />
3.1 An introduction to Supercomputing<br />
3.1.1 Overview<br />
The different types of parallel computer need to be reviewed before attempting to create a parallel<br />
program, since a programming model and a programming language should be chosen depending on<br />
the selection of an architecture.<br />
A parallel computer is in fact a subset of a supercomputer which is defined as a computer that<br />
performs at or near the currently highest operational rate for computers. Computation using a<br />
supercomputer is often called supercomputing or high performance computing.<br />
In the following sections, the technological trend of supercomputer is reviewed using data from the<br />
top 500 list 2 . The top 500 list compiles information regarding the top 500 fastest supercomputers<br />
in the world 3 .<br />
3.1.2 Classification of hardware<br />
All the current supercomputers use multiple processors and memories. There exist many classifi-<br />
cation methods according to the usage of multiple processors and memories and their interactions.<br />
Supercomputers are usually classified as follows:<br />
(1) by processor type: scalar and vector processor<br />
(2) by memory type: shared and distributed memory<br />
(1) by processor types<br />
Processor architectures can be divided into two principal types: scalar and vector processors. The<br />
main difference between the two types relates to the number of operations performed by a single<br />
2 visit at www.top500.org<br />
3 It is published twice a year, in June at the International Supercomputer Conference and in November at the<br />
ACM/IEEE Supercomputing Conference. The list has been compiled since 1993, when the first top 500 list have<br />
published at the International Supercomputer Conference, Mannheim.
3.1 An introduction to Supercomputing 53<br />
instruction.<br />
Scalar processors perform a single operation for each single instruction. An addition instruction<br />
(a + b), for example, results in the addition of two numbers. This type refers to a general-purpose<br />
processor and is widely used 4 .<br />
In vector processors, a single instruction results in identical operations being performed on differ-<br />
ent data. It means that the addition of two arrays of data (A(i) + B(i)) can be performed in a<br />
single instruction. Vector processors are developed for a high performance numerical computation<br />
of vector data or arrays and are relatively expensive as compared to scalar processors 5 .<br />
Examples of hardware for each processor type are listed in Table 3.1. Vector processors are known to<br />
Processor classification Example<br />
Scalar processor Intel x86, DEC Alpha, PowerPC, IBM Power<br />
Vector processor Cray vector, NEC vector, Fujitsu VPP<br />
Table 3.1: Processor classification<br />
have an excellent effective performance and facilitate the development of parallelization algorithms.<br />
However, they are less frequently used due to their high cost and limited scalability. Fig. 3.1, which<br />
plots the share of each processor types over the past ten years, shows this trends clearly. In June<br />
1993, vector processor architectures accounted for 66.8% of the top 500. That proportion decreased<br />
to 5% in June 2004, whereas the share of scalar processors increases to 95%. The advantage of scalar<br />
processors would be their relatively low price and excellent scalability, though they have a poor ef-<br />
fective performance. Because the majority of supercomputers are using multiple scalar processors,<br />
parallel computing (parallel computer) are often used instead of supercomputing (supercomputer).<br />
4 Scalar processor is divided further into two groups: CISC(Complex Instruction Set Computer) and RISC(Reduced<br />
Instruction Set Computer). The CISC group comprises Motorola 680x0, Intel x86 processors whereas DEC Alpha,<br />
PowerPC and IBM POWER processors are within the RISC group.<br />
5 Vector processors do perform parallel operations in a way that is sometimes described as ’data parallel’, though<br />
they are not a parallel computer in the sense of many machines working together.
54 Parallelization of the Discrete Dislocation Dynamics method<br />
Share %<br />
(2) by memory types<br />
100<br />
90<br />
80<br />
70<br />
60<br />
50<br />
40<br />
30<br />
20<br />
10<br />
0<br />
Scalar processor<br />
Vector processor<br />
Jun 93<br />
Nov 93<br />
Jun 94<br />
Nov 94<br />
Jun 95<br />
Nov 95<br />
Jun 96<br />
Nov 96<br />
Jun 97<br />
Nov 97<br />
Jun 98<br />
Nov 98<br />
Jun 99<br />
Nov 99<br />
Jun 00<br />
Nov 00<br />
Jun 01<br />
Nov 01<br />
Jun 02<br />
Nov 02<br />
Jun 03<br />
Nov 03<br />
Jun 04<br />
Figure 3.1: A change of processor types used in major supercomputers.<br />
Memory architectures can be classified into two principal types: shared and distributed memory.<br />
In shared memory systems, memories and processors are typically all interconnected by a common<br />
bus or switching network. Each processor can access all the memories of the system and a processor<br />
can directly load or store any shared address. In other words, the data movements are transparent to<br />
the user. This provides an easy and powerful model for creating and managing a parallel program.<br />
The shared memory systems can be further grouped into UMA (Uniform Memory Access) 6 and<br />
NUMA (Non Uniform Memory Access) 7 depending on whether the main memory is a single physical<br />
or a logical one. A schematic diagram of processors and memory in UMA system is shown in Fig.<br />
3.2(a) and NUMA system in Fig. 3.2(b). The NUMA model has been developed to overcome a<br />
technical difficulty of a UMA system, which limits the possible number of processors. Because a<br />
NUMA system uses physically distributed memories in several systems as a single logically shared<br />
memory, the access time to a certain memory could be different depending on whether a memory<br />
is a local or a remote one to a specific processor.<br />
In distributed memory systems or MPP (Massively Parallel Processor) systems, several computers,<br />
6 Intel Dual CPU system, Compaq ES40, Sun E10000 and HP N-class belong to the UMA category.<br />
7 Machines such as Compaq GS320, HP Superdome and SGI Origin 3000 belong to this category.
3.1 An introduction to Supercomputing 55<br />
MEMORY<br />
. . .<br />
P P P P P<br />
(a) A UMA system<br />
MEMORY<br />
. . .<br />
P P<br />
Logical Memory interconnect<br />
MEMORY<br />
. . .<br />
P P<br />
. . .<br />
(b) An NUMA system<br />
MEMORY<br />
. . .<br />
P P<br />
Figure 3.2: (a) Schematics of UMA systems (b) Schematics of NUMA systems<br />
M<br />
P<br />
Communication Network<br />
M<br />
P<br />
. . .<br />
M<br />
P<br />
(a) An MPP system<br />
MEMORY<br />
. . .<br />
P P<br />
Communicaton Network<br />
UMA UMA UMA<br />
MEMORY<br />
. . .<br />
P P<br />
. . .<br />
(b) A SMP cluster system<br />
MEMORY<br />
. . .<br />
P P<br />
Figure 3.3: (a) Schematics of MPP systems (b) Schematics of SMP systems<br />
where a single processor has its own memory resource, are interconnected by a bus or network, and<br />
processors access to distributed memories through a network. Fig. 3.3(a) shows a configuration of<br />
processors and memories of such an MPP system. In this model, parallel processing is facilitated by<br />
explicit message passing, since each processor has its own memory resource which cannot be directly<br />
accessed by other processors in the MPP machine. Individual processors could all be of the same<br />
type such as a network or cluster of workstations or PCs, which could work independently or in<br />
unison. A heterogeneous networks of various platforms (vector processors, parallel supercomputers<br />
etc.) could also be assembled in principle. IBM P690 architecture, which is used for some of the<br />
results presented in this work, consists of several UMA machines as shown Fig. 3.3(b) 8 .<br />
Various architectures of each memory classification are summarized in Table 3.2. In the early 1990s,<br />
Memory classification Type<br />
Shared memory UMA, NUMA<br />
Distributed memory MPP, clusters of PCs, clusters of UMAs<br />
Table 3.2: Memory classification<br />
8 The UMA cluster system looks similar to a NUMA system, but as memories are not shared between nodes, the<br />
user should explicitly assign data movement like a distributed memory system.
56 Parallelization of the Discrete Dislocation Dynamics method<br />
Share %<br />
100<br />
90<br />
80<br />
70<br />
60<br />
50<br />
40<br />
30<br />
20<br />
10<br />
0<br />
Shared memory Distributed memory<br />
SMP<br />
SIMD<br />
Single processor<br />
Constellation<br />
Jun 93<br />
Nov 93<br />
Jun 94<br />
Nov 94<br />
Jun 95<br />
Nov 95<br />
Jun 96<br />
Nov 96<br />
Jun 97<br />
Nov 97<br />
Jun 98<br />
Nov 98<br />
Jun 99<br />
Nov 99<br />
Jun 00<br />
MPP<br />
Cluster<br />
Nov 00<br />
Jun 01<br />
Nov 01<br />
Jun 02<br />
Nov 02<br />
Jun 03<br />
Nov 03<br />
Jun 04<br />
Figure 3.4: The transition of the supercomputer structures for the past ten years. ’Cluster’ and<br />
’MPP’ belong to the distributed memory system and ’SMP’ , ’single processor’, ’SIMD’ and ’Con-<br />
stellation’ belongs to the shared memory system<br />
most of the top 500 was shared memory architecture. However, the mainstream has changed to<br />
distributed memory systems since the late 1990s (see Fig. 3.4).<br />
Merits and demerits of each supercomputer type<br />
Supercomputers are classified by a processor and a memory type. Each type has merits and demerits<br />
which come from the different architectures used. They are summarized in Table. 3.3. In the case<br />
Vector<br />
Scalar<br />
Shared Distributed<br />
Ease of use, Good effective performance<br />
High cost, Limited scalability<br />
Ease of use Excellent cost/peak performance<br />
Limited scalability Poor effective performance<br />
Table 3.3: Merits and demerits of each processor and memory type<br />
of a shared memory using vector processors (left-top of Table. 3.3), one can expect an excellent
3.1 An introduction to Supercomputing 57<br />
effective performance and that it is relatively easy to vectorize a code using a compiler. But on the<br />
other hand, the system is relatively expensive and shows limited scalability.<br />
A distributed memory system using scalar processors has a relatively low price and yields a good<br />
scalability. It is often said however, that it needs high skills to parallelize a code and the system<br />
shows generally poor effective performance.<br />
3.1.3 Parallel programming models<br />
The main goal of parallel programming is to minimize the elapsed time of a program by utilizing<br />
several processors. Since there is no single programming model that can be used in any architecture,<br />
it is necessary to adopt different programming models for the different architectures summarized in<br />
Sec. 3.1.2. This section is intended to provide programming models used in shared and distributed<br />
memory systems.<br />
Shared memory based<br />
A program is made threads, each of which contains a work (computation) and a memory data<br />
(object of work). A single-threaded program processes a data sequentially. The main idea of shared<br />
memory based models is to create multiple threads and let each thread compute a portion of data<br />
simultaneously. All the threads share the same address space and it is easy to reference data<br />
that other threads have updated. So multi-thread programs are best fit with the shared memory<br />
architecture in which all the memory spaces are shared.<br />
This model is often called as the ’fork-join’ model as shown in Fig. 3.5(a). The single-thread<br />
program processes S1 through S2, where S1 and S2 are inherently sequential parts. In the multi-<br />
thread program, the first thread forks two more threads and the three threads process P1 through P3<br />
in parallel. They are joined to the first thread once finishing the work. The compiler automatically<br />
parallelizes certain types of ’DO’ loops, or else one can add some directives to tell the compiler how<br />
to divide a work. OpenMP is one of such a compiler, and will be briefly reviewed in Sec. 3.1.4.<br />
Distributed memory based<br />
If the address space is not shared among the different nodes, parallel processors have to transmit<br />
data over an interconnecting network in order to access data that other processors have updated.<br />
Fig. 3.5(b) illustrates how a message-passing program runs. Each processor computes its own part<br />
and the processors communicate with each other during the execution of the parallelizable part,
58 Parallelization of the Discrete Dislocation Dynamics method<br />
t s<br />
Single thread<br />
S1<br />
P1<br />
P2<br />
P3<br />
S2<br />
S1<br />
P1<br />
S2<br />
Multi thread<br />
Fork<br />
P2 P3<br />
Join<br />
(a) Single-thread process and Multi-<br />
thread process<br />
t<br />
s<br />
Serial Parallel<br />
S1<br />
P1<br />
P2<br />
P3<br />
S2<br />
S1<br />
P1<br />
S2<br />
S1<br />
P2<br />
S2<br />
Communications<br />
S1<br />
P3<br />
S2<br />
(b) Message passing between processors<br />
Figure 3.5: Parallel programming models for the shared and distributed memory architectures<br />
P1-P3 (S1 and S2 are inherently sequential parts.). The figure shows data passing between only<br />
two processors adjacent to each other. But in general, each processor communicates with all the<br />
other processors. Due to the communication overhead 9 , time spent for processing each of P1-P3<br />
is generally longer in the message-passing program than in the serial program. So only a modest<br />
fraction is achieved of the capacity of several interconnected processors in practice 10 .<br />
3.1.4 Classification of parallel languages<br />
Different types of parallel computing hardware and the corresponding parallel models have been<br />
reviewed in the preceding sections: shared memory-fork/join model, distributed memory-message<br />
passing model. The choice of a parallel language is largely determined by the hardware type and<br />
the parallel model to be used. Table 3.4 shows possible programming languages of each hardware-<br />
model pair. In this section, two main parallel programming languages are outlined, OpenMP (Open<br />
Message Passing) and MPI (Message Passing Interface).<br />
Hardware-Model Parallel programming languages<br />
Shared memory-fork/join model OpenMP, Pthread<br />
Distributed memory-message passing model MPI, PVM<br />
Table 3.4: Parallel hardware-model pairs and corresponding languages<br />
9 and work load unbalance, and synchronization as shown in Fig. 3.16<br />
10 Theoretically, the computational power should increase linearly with the number of interconnected processors.<br />
t<br />
p
3.1 An introduction to Supercomputing 59<br />
OpenMP<br />
OpenMP is a set of compiler directives and callable runtime libraries that extend the Fortran and<br />
C languages to allow the development of scalable parallel programs on shared memory machines.<br />
OpenMP provides access to the strengths of the shared memory parallel computation without an<br />
excessive programming effort. For example, a single loop can be parallelized by simply inserting<br />
standard directives, ’!$OMP PARALLEL DO’, as follows.<br />
DO I=1, 100 DO I=1, 100<br />
!$OMP PARALLEL DO<br />
C(I)=A(I)+B(I) ⇒ C(I)=A(I)+B(I)<br />
ENDDO ENDDO<br />
!$OMP END PARALLEL DO<br />
The directive, ’!$OMP PARALLEL DO’ creates multi threads (Fork) as schematically shown in<br />
Fig.3.5(a). If four threads are created for example, the second thread would perform the addition<br />
from I = 26 to 50 in the above code. ’!$OMP END PARALLEL DO’ collects results to master<br />
thread (Join). Programming with OpenMP is relatively simple and it shows good efficiency if most<br />
of the program execution time is dominated by a single, simple ’DO’ loop. But the efficiency of<br />
this type of parallelization becomes poor as the data dependency inside the loops becomes com-<br />
plex. OpenMP is also bound to the limit of the shared memory architecture, such as the number<br />
of processors, size of memory, and it lacks portability between different platforms.<br />
MPI<br />
MPI enables message passing programming model in distributed memory architectures. As de-<br />
scribed in the previous sections, distributed memory machine holds all the variables in local memory<br />
space. The work shared across the different processors requires communication and message-passing<br />
is the context in which this communication takes place. MPI is a parallel language which facilitates<br />
message-passing between separated processors. Some of the implementations of MPI are listed in<br />
Table 3.5. MPI will be reviewed in Sec. 3.2.1.
60 Parallelization of the Discrete Dislocation Dynamics method<br />
Acronym Developers<br />
MPI/Pro MPI Software Technology<br />
IBM MPI IBM product implementation for the SP and RS/6000 workstation clusters<br />
MPICH Argonne National Lab and Mississippi State University<br />
UNIFY Mississippi State University<br />
CHIMP Edinburgh Parallel Computing Center<br />
LAM Ohio Supercomputer Center<br />
Table 3.5: Various version of MPI<br />
3.1.5 Supercomputers in France and Korea<br />
Before finishing Sec. 3.1, the states of supercomputers in Korea and France in June 2004 are listed.<br />
Table 3.6 and 3.7 shows the rank in top 500, machine specs, Rmax 11 and Rpeak 12 of the top 5<br />
supercomputers in Korea and France, respectively. At the date of this thesis (summer 2004), Korea<br />
possesses 9 supercomputers in the top 500 and France does 16 machines.<br />
Rank Site/Year Computer(manufacturer)/processors Rmax/Rpeak<br />
48 KIST/2003 xSeries Cluster Xeon(IBM)/1024 3067/4915.2<br />
113 KISTI/2004 xSeries Cluster Xeon(IBM)/512 1762/2867<br />
115 KISTI/2003 pSeries 690 (IBM)/544 1760/3699.2<br />
233 SNU/2002 Pegasus P4 Xeon cluster(Self-made)/400 1011/1843<br />
310 KT/2004 Integrity Superdome,HPlex(HP)/176 844/1056<br />
Table 3.6: Top 5 supercomputers in June 2004, Korea<br />
3.2 Towards a parallel DDD code<br />
3.2.1 Basic Steps of Parallelization<br />
In case of parallelizing an existing serial program, the basic steps could be summarized as follows<br />
([Aoyama & Nakano 99]).<br />
11 Maximal LINPACK performance achieved<br />
12 Theoretical peak performance
3.2 Towards a parallel DDD code 61<br />
Rank Site/Year Computer(manufacturer)/processors Rmax/Rpeak<br />
28 CEA/2001 AlphaServer SC45(HP)/2560 3980/5120<br />
120 TotalFinaElf/2003 xSeries Cluster Xeon(IBM)/1024 1755/4915.2<br />
124 SG SGBI/2003 xSeries Cluster Xeon(IBM)/968 1685.49/4646.4<br />
132 CNRS/IDRIS/2004 eServer pSeries 690(IBM)/384 1630/2611.2<br />
149 CNRS/IDRIS/2004 eServer pSeries 655(IBM)/384 1477/2611.2<br />
1. Tune the serial program<br />
Table 3.7: Top 5 supercomputers in June 2004, France<br />
The performance of a parallel program is bound to that of a serial program from which the<br />
parallel program is written. The first step thus is to tune the hot spots of the serial program<br />
and make the serial program as efficient as possible.<br />
2. Consider the outline of the parallelization<br />
It needs to get the profile of the tuned serial program and know which part or parts consume<br />
most of the CPU time. It might be sufficient to parallelize most time consuming parts only.<br />
At the same time, it is necessary to select the hardware on which the program is parallelized.<br />
3. Determine the strategy for the parallelization<br />
Depending on the hardware chosen and the data dependencies of the program, a parallel<br />
algorithm should be made. For this, the existing strategies can be adopted if a pattern of<br />
parallelization is similar, or else it needs to create a new algorithm. Then it should be decided<br />
which scalar variables and arrays must be transmitted.<br />
4. Parallelize the program<br />
The strategy chosen is then realized using an appropriate parallel language.<br />
The procedure of parallelization which has been selected in this work is summarized below according<br />
to the basic steps mentioned above.<br />
Step 1: Tune the serial program<br />
The numerical efficiency of the serial DDD code has been increased using the box method and<br />
the linked-list of segments (see Sec. 2.5). The internal stresses are approximated by the long- and<br />
short-distance stresses, and there is no approximation in handling the dislocations interactions. The
62 Parallelization of the Discrete Dislocation Dynamics method<br />
speedup is dependent on the parameters (in Table 2.3) chosen. The speedup of 50 is attained in the<br />
case of L = 1, M = 15 and f = 20 with Nsegm = 20, 000 (Fig. 2.20).<br />
Step 2: Consider the outline of the parallelization<br />
In this work, a parallel DDD code has been written on distributed memory machines using the<br />
MPI. The choice of the distributed memory systems and the MPI has several advantages such as<br />
popularity, portability and extendability even though they are not the most efficient and the easiest<br />
combination. As already shown in Fig. 3.4, most of the top 500 are a distributed memory system<br />
nowadays, and distributed memory systems becomes more popular and widely used as individual<br />
laboratories purchase parallel computers made of several PCs and workstations connected through<br />
a network.<br />
Computation of the internal stresses and handling of the dislocations interactions are still the most<br />
time consuming parts.<br />
Step 3: Determine the strategy for the parallelization<br />
Before developing a parallel algorithm suitable for the DDD method, a few characteristics of the<br />
method are summarized. First, the number of dislocation segments is not constant. Dislocation<br />
segments can be created or annihilated with time. Next, the DDD method has highly complex flow<br />
dependence in that a movement of a segment modifies not only its own position and connection, but<br />
also the surrounding dislocation configurations. This is because dislocation lines are represented as<br />
connected sets of segments and segments’ connections are often changed by cutting the dislocation<br />
lines.<br />
The stress computation has no flow dependence. If the computation load is distributed over P<br />
processors, ideally the elapsed time for stress calculation will decrease by a factor of 1/P . To fully<br />
make use of the box method as described in the previous chapter, it is pertinent to distribute the<br />
stress computation in the boxes to several processors.<br />
On the other hand, segment positions updating has a highly complex flow dependency as mentioned<br />
before. This dependency can be shown as follows. a(i, j, k) represents the quantity of the segments<br />
(e.g. the number of segments) in a box (i, j, k) indexed along x, y and z direction. In order to<br />
update a(i, j, k), all the information from the first neighboring boxes are needed because the segment<br />
interactions needs to take into account all the segments in the first neighboring boxes. In addition,<br />
any quantity inside the first neighbors are susceptible to modification by the motion of segments
3.2 Towards a parallel DDD code 63<br />
a(i+1,j-1) a(i+1,j)<br />
a(i,j-1)<br />
a(i-1,j-1)<br />
a(i,j)<br />
a(i-1,j)<br />
a(i+1,j+1)<br />
a(i,j+1)<br />
a(i-1,j+1)<br />
Figure 3.6: Dependence on neighbors: The center element a(i,j) is being computed. All of the<br />
surrounding elements are used in the computation and also are modified after computing the center<br />
element.<br />
in the (i, j, k) box. This dependence is represented in Fig.3.6 in a simple 2D configuration. Thus a<br />
special attention should be paid in handling segment interactions so that no boxes are overlapped<br />
between processors when updating the segment positions. A specific sequence is required to avoid<br />
updating adjacent boxes in two different processors concurrently.<br />
Among the existing parallel strategies, that of molecular dynamics and of a finite difference method<br />
are of particular interest because inter-dislocation stress computation is similar to inter-atomic stress<br />
computation and the box method divides a simulation volume with <strong>3D</strong> arrays of boxes, which is<br />
similar to a matrix in a finite difference method.<br />
In molecular dynamics programs, computation of forces on atoms usually accounts for most of the<br />
CPU time. For each atom i, the total force exerted by the other atoms is computed using a double-<br />
nested loop in which both loops are running from i = 1 to i = Natom, with Natom being the total<br />
number of atoms. These loops are often parallelized, for example, by distributing the atoms among<br />
the different processors. Each processor then computes forces of the resident atoms only. This<br />
method is referred to data decomposition.<br />
Matrix often represent physical data at grid points in a finite difference method. A parallel program<br />
breaks up these matrix and distributes the parts across the processors. This method is called<br />
domain decomposition. Domain decomposition simply refers to the subdivision or partitioning of
64 Parallelization of the Discrete Dislocation Dynamics method<br />
a problem over a number of processors in a parallel program. Various method such as red-black<br />
ordering and multi-color schemes have been proposed to deal with the data dependency between<br />
adjacent grids. Further information can be found in [Dongarra et al. 98]. The main point in the<br />
domain decomposition is how to specify the order of communication among processors to provide<br />
the necessary data. The number of inter-processor communication and the order are determined by<br />
the data dependencies of a problem.<br />
Step 4: Parallelize the program<br />
MPI is reviewed in more detail because it is the parallel library used in this work and it is used to<br />
explain the newly developed parallel code as presented in Sec. 3.3.<br />
The Message Passing Interface Forum (MPIF) has been organized to develop a standard library<br />
for writing message-passing programs in 1992. The MPIF comprised more than 40 organizations<br />
and endeavored to make the standard practical, efficient and flexible. Practically, it means that the<br />
standard should allow convenient C and Fortran bindings and define an interface not too different<br />
from the practice at that time, e.g., the Parallel Virtual Machine (PVM). The standard aimed at<br />
efficient communication on a reliable communication interface so that the users need not struggle<br />
with communication failures. Flexibility is guaranteed by defining an interface that can be imple-<br />
mented on many vendor’s platforms with no significant changes and allowing usage in heterogeneous<br />
environments. The first draft of the standard was published in 1994 and revised in 1997 (MPI-2).<br />
The standard MPI provides descriptions of the parallel tasks as subroutines in Fortran and functions<br />
in C. Only the Fortran version of MPI is presented here.<br />
There exist around 192 subroutines in the MPI. All of them facilitate the parallel tasks of a MPI<br />
program, which could be summarized as i) specifying a group of processors, ii) extracting a rank or<br />
processor ID and iii) defining message passings between or among processors. It needs not to know<br />
all of the subroutines since only about a dozen of the subroutines are frequently used to parallelize<br />
a program.<br />
The MPI subroutines could be categorized into three main groups as follows:<br />
• Environment Management Subroutines<br />
This group controls the overall environment of a MPI program. It includes initialization and<br />
finalization of a parallel environment. It also includes creation of a communicator or a group<br />
of processors.<br />
A general MPI program would look like as follows.
3.2 Towards a parallel DDD code 65<br />
PROGRAM parallel<br />
INCLUDE ’mpif.h’<br />
CALL MPI_INIT(ierr)<br />
CALL MPI_COMM_SIZE(MPI_COMM_WORLD, nprocs, ierr)<br />
CALL MPI_COMM_RANK(MPI_COMM_WORLD, myrank, ierr)<br />
Computations here . . .<br />
CALL MPI_FINALIZE(ierr)<br />
END<br />
Line 2 includes ’mpif.h’, which defines MPI-related parameters such as MPI_INTEGER and<br />
MPI_COMM_WORLD. All Fortran procedures that use MPI subroutines have to include<br />
this file. Line 3 calls ’MPI_INIT’ for initializing an MPI environment. ’MPI_INIT’ must<br />
be called only once before calling any other MPI subroutines. In Fortran, ’ierr’ is the return<br />
code of every MPI subroutine and ’0’ if successful or a non zero if failed. The subroutine<br />
’MPI_COMM_SIZE’ in line 4 returns the number of processors(nprocs) belonging to the<br />
communicator(MPI_COMM_WORLD). ’nprocs’ is given as the environmental variable of<br />
the parallel work. ’MPI_COMM_WORLD’ is an identifier associated with a group of pro-<br />
cessors and represents the group consisting of all the processors participating in the parallel<br />
job. Each processor in a communicator has its unique rank, which is in the range [0,nprocs-<br />
1]. The subroutine, ’MPI_COMM_RANK’ in line 5 returns the rank of the process within<br />
the communicator. In line 6, each processor does some work on its data, and line 7 calls<br />
’MPI_FINALIZE’. ’MPI_FINALIZE’ terminates MPI processing and no other MPI call can<br />
be made afterwards.<br />
• Point-to-point Communication Subroutines<br />
This group specifies data exchange between two processors in the communicator. There exist<br />
blocking and non-blocking communication subroutines. Details are not discussed here and the<br />
interested reader is advised to refer [Aoyama & Nakano 99].<br />
As an example of using non-blocking send/receive subroutines, which are used in the paral-<br />
lelization of the DDD code by the author, let us consider two processors that need to exchange<br />
data with each other.<br />
IF (myrank==0) THEN
66 Parallelization of the Discrete Dislocation Dynamics method<br />
CALL MPI_ISEND(a, 1, MPI_REAL8, 1, itag, MPI_COMM_WORLD, ireq1, ierr)<br />
CALL MPI_IRECV(b, 1, MPI_REAL8, 0, itag, MPI_COMM_WORLD, ireq2, ierr)<br />
ELSEIF (myrank==1) THEN<br />
CALL MPI_ISEND(a, 1, MPI_REAL8, 0, itag, MPI_COMM_WORLD, ireq1, ierr)<br />
CALL MPI_IRECV(b, 1, MPI_REAL8, 1, itag, MPI_COMM_WORLD, ireq2, ierr)<br />
ENDIF<br />
CALL MPI_WAIT(ireq1, istatus, ierr)<br />
CALL MPI_WAIT(ireq2, istatus, ierr)<br />
In this example, the processor of rank 0 sends a variable ’a’, which is one element and a real<br />
number to the processor of rank 1 in the communicator ’MPI_COMM_WORLD’. ’itag’ is<br />
the message tag. ’ireq1’ and ’ierr’ are subroutine return values. The syntax of the subroutine<br />
’MPI_IRECV’ can be understood in the similar way, and the processor of rank 1 saves the<br />
received data from rank 0 to variable ’b’.<br />
• Collective Communication Subroutines<br />
This group allows the user to exchange data among a group of processors. It happens fre-<br />
quently that data in one processor need to be shared with all the processors in the commu-<br />
nicator, or, inversely, data in each processor need to be collected to one processor. It would<br />
not be efficient to use point-to-point communication in this case considering communication<br />
latency of a network. The syntax of subroutines in this group comprise a sending and/or<br />
receiving data array, its size and type and a rank of a processor which send or receive data<br />
from a communicator. The subroutine, MPI_BCAST, for example, has the following syntax,<br />
CALL MPI_BCAST(buffer, count, datatype, root, MPI_COMM_WORLD, ierr)<br />
, where ’buffer’ is broadcasted from a processor of rank root to all processors in the commu-<br />
nicator, MPI_COMM_WORLD.<br />
In addition to the groups categorized above, there exist subroutines relating to managing processor<br />
groups, defining data types and controlling input and output files. The MPI standard also provide<br />
supports for profiling interface and file management, etc.
3.3 Parallelization of the serial DDD program 67<br />
3.2.2 Writing a parallel program<br />
To save efforts to parallelize the serial DDD program, the serial subroutines are kept intact or made<br />
minor modifications if possible. In the following, parts that need to be modified for parallelization<br />
are indicated in bold characters on the general computation procedure of the serial code from Sec.<br />
2.6).<br />
a. Initialization of parallel environments<br />
b. Discretization of the segments<br />
c. Construction of the linked-lists<br />
d. Updating of the long-distance stresses every f steps<br />
e. Computation of the short-distance stresses<br />
f. Motion of segments<br />
g. Updating the external stresses<br />
h. Save of outputs<br />
The modified ’a’ is needed to build a parallel environment involved in partitioning the computation<br />
into a selected number of concurrent processors. The internal stress computation steps (’d’-’e’)<br />
need minor modifications. The computation step ’f’ needs complex interactions between processors<br />
because of the flow dependencies. In the following section, the parallelization scheme is detailed in<br />
programming perspectives.<br />
3.3 Parallelization of the serial DDD program<br />
3.3.1 Initialization of parallel environments<br />
The boxes which decompose a simulation volume (Fig. 3.7(a)) are partitioned into parallel-piped<br />
subsystems (Fig. 3.7(b)). The processors in a parallel computer are then logically arranged accord-<br />
ing to the topology of the physical subsystems, and assigned to each subsystem.<br />
A processor of rank ’p’ is assigned to a parallel-piped subsystem assuming that the subsystems are<br />
arranged in a <strong>3D</strong> array of dimensions P1, P2 and P3. The total number P of processors required<br />
is then given by P1 × P2 × P3. Vector IDs of each subsystem on the cartesian system is stored in<br />
the array nid(:), that is, nid(1) is, for example, in the range of [0 : P 1 − 1]. A processor p is then<br />
assigned to each subsystem as defined as Eq. 3.1. Remember that each processor is given a unique
68 Parallelization of the Discrete Dislocation Dynamics method<br />
(a) Cubic simulation volume using the box method<br />
X<br />
Z<br />
Y<br />
Proc 1<br />
Proc 0<br />
Proc 3<br />
(b) Parallel-piped subsystems<br />
Figure 3.7: Domain decomposition of the simulation volume (a) into parallel-piped subsystems (b).<br />
The use of four processors is assumed and each parallel-piped is allocated to each processor.<br />
processor identification number (rank) p in the range of [0 : P − 1].<br />
p = nid(1) + nid(2)P1 + nid(3)P2P3<br />
For each processor, the six face-shared neighbor processors are identified by a sequential array,<br />
nni(:), and given automatically by the following equation.<br />
X<br />
Z<br />
Y<br />
Proc 2<br />
(3.1)<br />
nni(k) = ick(1) + ick(2)P1 + ick(3)P2P3, k = 1, 6 (3.2)<br />
nni(:) will be used to identify neighbor processors for message-passing.<br />
In Eq. 3.2, ick(i) is a vector ID of neighbor processor k, and is written in Eq. 3.3 using an<br />
array iv(:, :) defined in Table. 3.8 and the ’MODULO’ operation. A torus connection between the<br />
processors is considered in Eq. 3.3 to enforce periodic boundary conditions.<br />
ick(i) = MOD(nid(i) + iv(i, k) + Pi, Pi) i = 1, 3 & k = 1, 6 (3.3)<br />
If there exist M boxes along each axis, the boxes are distributed as follows. Suppose when M is<br />
divided into Pi (number of processors), the quotient is q and the remainder is r, that is, M = qPi+r.<br />
Processors whose vector ID, nid(i) is smaller than r are assigned q+1 boxes and the other processors<br />
are assigned q boxes. Total number of boxes along i axis are kept as (q + 1)r + q(Pi − r) equals to
3.3 Parallelization of the serial DDD program 69<br />
y<br />
12<br />
x<br />
Neighbor ID,k 1 2 3 4 5 6<br />
iv(3,k) -1 0 0 1 0 0 0 -1 0 0 1 0 0 0 -1 0 0 1<br />
Table 3.8: The relative location of each neighbor processor<br />
13<br />
14<br />
15<br />
8 9 10 11<br />
4 5 6 7<br />
0 1 2 3<br />
(a)<br />
y<br />
x<br />
3 4<br />
Figure 3.8: Top view of 20 × 20 × 20 subboxes being assigned to 4 × 4 × 1 processors. Numbers<br />
represent processor identification.<br />
M. This distribution method is useful when the number of boxes M is not divisible by the number<br />
of processors, Pi.<br />
Fig.3.8(a) shows the decomposition of 20 × 20 boxes into 4 × 4 subsystems. For simplicity, the<br />
configuration is considered in 2D, which is equivalent to <strong>3D</strong> with P3 being 1, for example. All the<br />
subsystems have the equal number of the boxes. In Fig. 3.8(a), the number of boxes is not identical<br />
in each subsystem because M = 20 is not divisible by P1, P2 = 3.<br />
IDs of the boxes which bound the subsystem of processor p are stored in the array ibs(:): ibs(1), ibs(3)<br />
and ibs(5) save the first box number along x, y and z direction respectively, and ibs(2), ibs(4) and<br />
ibs(6) represent the last box number along each direction. Processor 6 in Fig. 3.8(a), for exam-<br />
ple, is bounded by ibs(1) = 11, ibs(2) = 15, ibs(3) = 6, ibs(4) = 10 and neighbor processors are<br />
nni(1) = 5, nni(2) = 7, nni(3) = 2, nni(4) = 10.<br />
6<br />
0<br />
7<br />
1<br />
(b)<br />
8<br />
5<br />
2
70 Parallelization of the Discrete Dislocation Dynamics method<br />
3.3.2 Long-distance stresses computations<br />
The serial version computes long-distance stresses as follows. The boxes that are situated at long-<br />
distance relative to one give box are recognized by a topological relation. The stresses due to the<br />
segments in the long-distance labeled boxes are computed at the center point of the given box. Thus<br />
one processor scans all the boxes and computes the long-distance stresses in the serial program.<br />
In a parallel program, the work is divided into several processors, since each processor is responsible<br />
for a fraction of the boxes. Boxes in each processor are distinguished by the array ibs(6), and each<br />
processor computes the long-distance stresses of boxes only in its subsystem.<br />
The serial and the parallel version are compared in the following.<br />
Serial version<br />
DO iz=1, M<br />
DO iy=1, M<br />
DO ix=1, M<br />
the box ’ib’<br />
compute the box index ’ib’<br />
compute the long-distance stresses of<br />
ENDDO<br />
ENDDO<br />
ENDDO<br />
⇒<br />
Parallel version<br />
DO iz=ibs(5), ibs(6)<br />
DO iy=ibs(3), ibs(4)<br />
DO ix=ibs(1), ibs(2)<br />
compute the box index ’ib’<br />
compute the long-distance stresses of the<br />
box ’ib’<br />
ENDDO<br />
ENDDO<br />
ENDDO<br />
The parallel version uses most of the serial codings and only the range of the loops are slightly<br />
modified. And it should be noted that each subsystem shares all the segments information at the<br />
time of computing the long-distance stresses.<br />
3.3.3 Short-distance stresses computation<br />
The following pseudo-code explains how the short-distance stresses are computed both in the serial<br />
and in the parallel DDD code.
3.3 Parallelization of the serial DDD program 71<br />
Serial version<br />
DO is=1, Nsegm<br />
segment ’is’<br />
Identify the box ’ib’ containing the<br />
Compute the short-distance stresses<br />
due to the segments<br />
within the short-distance boxes<br />
ENDDO<br />
⇒<br />
Parallel version<br />
DO is=1, iscnt(p)<br />
Identify the box ’ib’ containing the seg-<br />
ment ’is’<br />
Compute the short-distance stresses due<br />
to the segments<br />
within the short-distance boxes<br />
ENDDO<br />
As for the computation of the long-distance stresses, only small modifications are made to the<br />
serial coding: in the case of the serial program, all the segments (Nsegm) are processed by a single<br />
processor. In the parallel program, on the contrary, segments are distributed among several proces-<br />
sors, and a processor p computes stresses of iscnt(p) segments only. The construction of iscnt(p)<br />
will be discussed in Sec. 3.3.4.<br />
Since the stress on a segment can be computed without regard to the stress on the other segments,<br />
all processors can work independently. The elapsed time for stress computation decreases by a<br />
factor of 1/P (the number of processors), if the number of segments of each processor is the same.<br />
Otherwise, the overall elapsed time for the stress computation is determined by the busiest proces-<br />
sor, because the other processors have to wait until the latest processor finishes the computation to<br />
move the segments. For higher efficiency, the segments have to be distributed uniformly over the<br />
different processors. This can be realized by shifting the subsystem boundaries, which changes the<br />
ibs array and consequently iscnt. This load balancing issue will be addressed in Sec. 3.4.4.<br />
3.3.4 Data structures for distributing and the gathering segments<br />
The processors do not work entirely independently in a parallel program. At some point of a pro-<br />
gram, it needs to collect all the information to one processor or to distribute the data to all the<br />
processors. An obvious example of gathering information is when data are written in external files.<br />
One processor normally takes charge of writing files, and the data to be written are sent to that<br />
processor from the other processors.<br />
In a parallel DDD program, segments’ information including coordinates, neighbors, linked-list and<br />
the effective stress etc. need to be communicated. The segments are identified by a vector of integer<br />
numbers. To send segments’ data to the other processor, the list of segments to be sent should<br />
be shared between the sender and the receiver processors. The arrays iswork(:,:) and iscnt(;) are
72 Parallelization of the Discrete Dislocation Dynamics method<br />
Proc 2 Proc 3<br />
6<br />
3<br />
14<br />
8<br />
11<br />
7<br />
13<br />
5<br />
10<br />
4<br />
12<br />
1 2<br />
Proc 0 Proc 1<br />
9<br />
Figure 3.9: List of segments<br />
p 0 1 2 3<br />
iscnt(p) 2 2 5 5<br />
iswork(i,p) 1 9 8 10<br />
i 7 2 14 4<br />
3 13<br />
11 12<br />
6 5<br />
constructed to facilitate this process and contain the list of segment identification number and the<br />
number of segments in each processor respectively. In Fig. 3.9, for example, four processors treat<br />
fourteen segments in a 2D configuration. The values of the arrays iswork and iscnt are written in<br />
the figure as an example.<br />
The segments in processor p can be recognized by scanning the processor box content and using the<br />
linked-lists, indexb(ib) and isbox(ib, 2) as described in Sec. 2.5.2. The arrays iswork and iscnt can<br />
be constructed as follows.<br />
DO iz = ibs(5), ibs(6)<br />
DO iy = ibs(3), ibs(4)<br />
DO ix = ibs(1), ibs(2)<br />
compute box number ’ib’ from ix,iy and iz<br />
call Bliste(ib, isliste)<br />
DO is=1, indexb(ib)<br />
iscnt(p)=iscnt(p)+1<br />
iswork(iscnt(p),p)=isliste(is)<br />
ENDDO<br />
ENDDO<br />
ENDDO<br />
ENDDO<br />
The subroutine Bliste generates the list isliste of segments in the box ib, and indexb(ib) contains
3.3 Parallelization of the serial DDD program 73<br />
the number of segments inside this box. For a given processor p, the number of segments and the<br />
list are saved in iscnt(p) and iswork(:,p) respectively. The arrays iscnt(p) and iswork(:,p) can then<br />
be shared among all the processors by using the MPI_BCAST subroutine,<br />
DO irank=0, nprocs-1<br />
call MPI_BCAST(iscnt(irank), 1, MPI_INTEGER,<br />
ENDDO<br />
DO irank=0, nprocs-1<br />
irank, MPI_COMM_WORLD, ierr)<br />
call MPI_BCAST(iswork(1,irank), iscnt(irank), MPI_INTEGER,<br />
ENDDO<br />
with nprocs being the total number of processors.<br />
irank, MPI_COMM_WORLD, ierr)<br />
Now all the processors in the MPI_COMM_WORLD communicator share the list of segments in<br />
each processor, segments’ information gathering or distributing can be realized using the lists.<br />
3.3.5 Motion of segments<br />
The segment motion induces interactions with the other dislocation segments. The dislocation in-<br />
teractions involve complex dependencies as shown in Fig. 3.6. The key idea of handling dislocation<br />
interactions is to avoid any overlap of neighbor boxes of concurrently updated boxes. The handling<br />
of the dislocation interactions is managed by first dividing the boxes inside a processor p into three<br />
groups according to the topology of the neighboring boxes: inner boxes (IB), boundary boxes (BB)<br />
and corner boxes (CB) (Fig. 3.10). It should be noted that at least three boxes are required along<br />
each axis in each subsystem to categorize the boxes into these three groups.<br />
The inner boxes have all their neighboring boxes in the same processor, thus the motion of the<br />
segments in the inner boxes modifies the segments located in the same processor only. Because<br />
all the information needed to handle the dislocation interactions are stored in the local memory,<br />
and there is no overlap of the neighboring boxes between the adjacent processors, the positions<br />
of the segments in the inner boxes of the different processors can be updated simultaneously and<br />
independently and involve no message passing.<br />
The boundary boxes and the corner boxes, on the other hand, have a lack of neighboring boxes<br />
in the same processor. Thus it needs message passing between processors to obtain the segments’
74 Parallelization of the Discrete Dislocation Dynamics method<br />
y<br />
12<br />
x<br />
13<br />
14<br />
15<br />
8 9 10 11<br />
4 5 6 7<br />
0 1 2 3<br />
(a) Parallel-piped subsystems<br />
CB<br />
BB<br />
BB<br />
CB<br />
IB BB<br />
CB BB CB<br />
(b) Categorization of boxes<br />
Figure 3.10: Three category of boxes in a processor p: Inner boxes (IB) have all the neighbor boxes<br />
in the same processor, thus need no communications. Boundary boxes (BB) have lack of neighbor<br />
boxes and need communications with a neighbor processor. Corner boxes (CB) have lack of neighbor<br />
boxes in three different processors.<br />
information from their neighboring boxes and to send back the information modified by the dislo-<br />
cation interactions.<br />
In the case of the boundary boxes, all the missing neighboring boxes are situated in the neighboring<br />
processors, therefore a message passing only with the adjacent processor is sufficient to provide the<br />
missing information. The corner boxes, however, have neighboring boxes scattered in more than<br />
four different processors including itself (in a 2D configuration), and thus are bound to involve<br />
complex message passings.<br />
Updating the positions of the segments is performed in the following three steps.<br />
• In the first step, all the segments in the inner boxes of each processor are updated indepen-<br />
dently and simultaneously.<br />
• In the second step, the segments in the boundary boxes are updated involving message passing<br />
with the their respective neighboring processors. The order of computation is from right to<br />
left in the x,y and z direction order (see Fig. 3.11).<br />
• In the final step, all the information of segments are collected into one processor (Master<br />
processor) and segment positions updating in the corner boxes are made in that processor<br />
only. This procedure avoids at least complex message passing between the different processors.
3.3 Parallelization of the serial DDD program 75<br />
y<br />
y<br />
12 13 14 15<br />
8 9 10 11<br />
4 5 6 7<br />
0 1 2 3<br />
x<br />
x<br />
(a) Inner boxes<br />
(d) Boundary boxes y+<br />
y<br />
y<br />
x<br />
(b) Boundary boxes x+<br />
x<br />
(e) Boundary boxes y-<br />
Figure 3.11: Overall procedure of motion of segments<br />
y<br />
y<br />
x<br />
(c) Boundary boxes x-<br />
x<br />
(f) Corner boxes<br />
The overall procedure is drawn in Fig. 3.11. Fig. 3.11 shows that the simulation volume is<br />
subdivided into nine processors. In the first step, all the inner boxes of each processor are updated<br />
and the updated boxes are represented as shaded one. The boundary boxes are then updated in the<br />
order of x, y and z direction, and at the right (plus) and the left (minus) position of each direction<br />
sequentially. After updating all the boundary boxes, the corner boxes are treated by one processor<br />
exclusively. In what follows, the details and the corresponding message passing of each step are<br />
discussed.<br />
Inner boxes<br />
The segments in the inner boxes can be identified easily by performing the loops over [ibs(1) + 1,<br />
ibs(2) − 1], [ibs(3) + 1, ibs(4) − 1] and [ibs(5) + 1, ibs(6) − 1]. The same segment motion algorithm<br />
as in the serial program can be used to update the list of segments in the inner boxes.
76 Parallelization of the Discrete Dislocation Dynamics method<br />
A special care should be taken on the label numbers assigned to the different segments, in order to<br />
avoid giving duplicate numbers to the newly created segments, in the different processors. Duplicate<br />
labels can generate confusion when all the segment information are gathered into one processor. A<br />
new label list can be generated consistently sending to each processor the number of the new<br />
segments created inside all the other processors. The procedure for renumbering the new segments<br />
is shown in Fig. 3.12 in the case of four processors. The key point is that the label numbers of the<br />
newly created segments are updated in real time and the new segments are renumbered in ascending<br />
orders of processor ranks.<br />
For label renumbering, the array isnewcnt(p) is increased by one whenever a new segment is created<br />
inside a given processor p. After all the processors have finished treating the segment motion and<br />
related interactions, this array is synchronized and used to renumber the newly created segments<br />
as follows.<br />
DO irank=0, nprocs-1<br />
call MPI_BCAST(isnewcnt(irank), 1, MPI_INTEGER,<br />
ENDDO<br />
iadd=0<br />
DO irank=0, p-1<br />
iadd=iadd+isnewcnt(irank)<br />
ENDDO<br />
DO is=nsegm, nsol+1, -1<br />
isnew=is+iadd<br />
irank, MPI_COMM_WORLD, ierr)<br />
Shifting segment information from ’is’ to ’isnew’<br />
ENDDO<br />
nsegm is the local number of segments of each processor, and nsol is the global number of segments<br />
before to treat the segment motion. After renumbering, the global number of segments can be<br />
computed by summing the array isnewcnt:.<br />
Boundary boxes<br />
Fig.3.13 shows the sequence of message passings to update the segment positions inside the bound-<br />
ary boxes, on the +x direction. Before sending the information, arrays concerning the number of
3.3 Parallelization of the serial DDD program 77<br />
Proc 2<br />
6<br />
3<br />
14<br />
8<br />
11<br />
Proc 3<br />
13<br />
5<br />
10<br />
4<br />
12<br />
Proc 2 6<br />
3<br />
14<br />
8<br />
11<br />
15<br />
16<br />
16<br />
Proc 3<br />
13 17<br />
15<br />
5<br />
10<br />
4<br />
12<br />
7<br />
1 2<br />
9<br />
7<br />
17<br />
16<br />
1<br />
15 15<br />
2<br />
9<br />
17<br />
16<br />
Proc 0 Proc 1 Proc 0<br />
Proc 1<br />
isnewcnt(0)=3<br />
isnewcnt(1)=3<br />
isnewcnt(2)=2<br />
isnewcnt(3)=3<br />
Synchronize<br />
Proc 2 6<br />
3<br />
14<br />
8<br />
11<br />
21<br />
22<br />
24 Proc 3<br />
13 25<br />
23<br />
5<br />
10<br />
4<br />
12<br />
7<br />
9<br />
17 20<br />
16<br />
1<br />
15 18<br />
2<br />
19<br />
Proc 0 Proc 1<br />
Figure 3.12: Label assignment to the newly created segments<br />
segments ibcnt and the list of segments ibwork to be sent and be received are synchronized between<br />
a sender and a receiver processor. The arrays ibcnt and ibwork are constructed and synchronized<br />
in a similar way as the arrays iscnt and iswork are processed in Sec. 3.3.4.<br />
Information of segments, e.g. coordinates, neighbor segments and effective stresses, etc., are packed<br />
in one dimensional buffer arrays of the integer, real and logical types.<br />
The buffer arrays are then sent to the next processor inext and received from the previous processor<br />
iprev using the subroutine MPI_ISEND and MPI_IRECV. An example code is shown below.<br />
call MPI_ISEND(bufsi(1), ibcnt(p)*11, MPI_INTEGER,<br />
inext, itag, MPI_COMM_WORLD, ireqs, ierr<br />
call MPI_IRECV(bufri(1), ibcnt(iprev)*11, MPI_INTEGER,<br />
call MPI_WAIT(ireqs, istatus, ierr)<br />
call MPI_WAIT(ireqr, istatus, ierr)<br />
iprev, itag, MPI_COMM_WORLD, ireqr, ierr<br />
Buffer arrays which are received, e.g. bufri in the above example, then are unpacked in the in-
78 Parallelization of the Discrete Dislocation Dynamics method<br />
Send buffer arrays of<br />
this column to nni(1)<br />
Receive buffer arrays of<br />
this column from nni(2)<br />
To be<br />
updated<br />
(a) Before updating the boundary boxes<br />
Receive modified<br />
column from nni(1)<br />
Updated<br />
Send modified<br />
column to nni(2)<br />
(b) After updating the boundary boxes<br />
Figure 3.13: A sequence of message passings to update the positions in the boundary boxes located<br />
at +x position (dark grey). Two message passing steps are involved: (a) Send segment information<br />
in the leftmost column to the neighboring processor in the −x direction and receive information<br />
from the neighboring processor in the +x direction (b) Send segment information, which is modified<br />
due to updating the boundary boxes, back to the processor in the +x direction and receive from<br />
the processor in the −x direction.<br />
verse sense of the packing using synchronized ibcnt, ibwork.<br />
When all the necessary information from the neighboring boxes are collected, segment positions in<br />
the boundary boxes are updated. The segment motion in the boundary boxes also modifies the<br />
segment configuration in the received boxes. In order to properly synchronize this modification,<br />
information of the received boxes are then repacked and resent to the original processor. This<br />
completes the boundary boxes updating in the +x direction, and likewise all the updating in the<br />
−x, ±y, ±z directions are completed.<br />
Corner boxes<br />
Once all the boundary boxes are updated, information of segments of each processor is sent to one<br />
processor (Master) and the segments in the corner boxes are treated by the Master processor only.<br />
After finishing the motion of segments in the corner boxes, only one processor (Master) contains<br />
the final configuration of the segments of the current time step. Before running the next time step,<br />
the information concerning the dislocation segments are sent to all the processors from the Master<br />
processor.
3.3 Parallelization of the serial DDD program 79<br />
Initialization of<br />
parallel environments<br />
Discretization of<br />
the segments<br />
Linked-lists of<br />
the segments<br />
Computation of the<br />
long-distance stresses<br />
Computation of the<br />
short-distance stresses<br />
Motion of<br />
the segments<br />
Update external stresses<br />
and save outputs<br />
Inner boxes<br />
Boundary boxes<br />
Corner boxes<br />
(1)<br />
(2)<br />
Send/Receive<br />
Gather (3)<br />
Broadcast<br />
Figure 3.14: The overall flow chart of the new parallel DDD code<br />
3.3.6 Summary and comments<br />
The overall flow chart of the new parallel DDD code is shown in Fig. 3.14. The ’Motion of segments’<br />
step is composed of three parts which correspond to inner, boundary and corner boxes. The message<br />
passing addresses are also indicated.<br />
It should be noted that all the processors begin each time step with the same segment information<br />
(marked as ’(1)’ in Fig. 3.14), although it is not indicated explicitly in the previous sections.<br />
After the segment discretization, each processor computes and thus alters its local segments’ data<br />
independently up to ’Inner boxes’ step (’(2)’). While updating information in the boundary boxes,<br />
two adjacent processors mutually send and receive data and then send the local data to one processor<br />
(as indicated ’Gather’ in Fig. 3.14). The Master processor then updates all the information in the<br />
corner boxes and broadcast data to the other processors (as indicated ’Broadcast’ in Fig. 3.14).<br />
Hence all the processors share the same segment information.<br />
Thus, there is no gain in a memory aspect of the program by using several processors in the present<br />
parallel version. The parallel code can further be improved by decomposing the data space, i.e. by<br />
making each processor to use only the necessary and sufficient amount of memory. This would save<br />
memory space for parallel computation, and would also decrease the communication overhead and<br />
eventually increase the performance of the code.
80 Parallelization of the Discrete Dislocation Dynamics method<br />
3.4 Performance improvment<br />
3.4.1 Measure of performance<br />
It is needed to measure the performance of the new parallel program in terms of gain of the elapsed<br />
time. The following measure is often used.<br />
Speedup(P ) = t0<br />
, where t0 is the elapsed time of the serial program and tp is that of the parallel program using P<br />
processors. The speedup indicates what the practical advantage is by using the parallel program<br />
instead of the serial program. t0 can be replaced by the elapsed time of the parallel program<br />
run with one processor. Then the speedup parameter shows the advantage of the use of several<br />
processors because both the numerator and the denominator contain overhead for initializing a<br />
parallel environment. This is often called the algorithmic speedup ratio. The speedup results<br />
presented in the following section are measured using the algorithmic speedup ratio, because it<br />
is difficult to compare directly the serial and the parallel DDD program compiled using different<br />
compilers and run in different platforms.<br />
The efficiency of a parallel program is a measure of the effectiveness of the hardware usage. The<br />
efficiency is represented as the ratio of the speedup on P processors to P , that is, Speedup(P )/P .<br />
An efficiency close to 1 indicates an excellent scalability.<br />
3.4.2 Conditions for good performance<br />
In the ideal case, the speedup is a linear function of the number of processors P , i.e. Speedup(P ) =<br />
P . This case is hardly achievable in practice because of the moderate fraction of the parallelizable<br />
part of an algorithm, the communication overhead and the load unbalance.<br />
Suppose that a fraction fp of a serial program can be parallelized and that the remaining 1 − fp<br />
cannot be parallelized. The Speedup(P ) can be written as the following equation, supposing a<br />
perfect load balancing and no communication overhead.<br />
Speedup(P ) =<br />
tp<br />
1<br />
(1 − fp) + fp/P<br />
Eq. 3.5 is plotted in Fig. 3.15 for fp = 1, 0.99, 0.9 and 0.5. The ideal case (Speedup(P ) = P ) is<br />
only possible if fp equals to 1, and a maximum speedup of only 10 is expected where fp = 0.9.<br />
A parallel program involves communication overhead to send and receive data, which does not exist<br />
(3.4)<br />
(3.5)
3.4 Performance improvment 81<br />
Speedup<br />
50<br />
45<br />
40<br />
35<br />
30<br />
25<br />
20<br />
15<br />
10<br />
5<br />
0<br />
f p =1.00<br />
f p =0.99<br />
f p =0.90<br />
f p =0.50<br />
5 10 15 20 25 30 35 40 45 50<br />
Number of CPUs<br />
Figure 3.15: Ideal speedup of a program with the number of processors when only a fraction fp of<br />
the program is parallelized<br />
in a serial program. In general situations, the performance of a parallel program is worse since the<br />
load is not perfectly balanced among the different processors. The performance of general parallel<br />
programs is shown in Fig. 3.16. It is assumed that only 80% of a serial program is parallelized, and<br />
the effects of the communication overheads and the load unbalance are shown as well.<br />
From the figure, it is obvious that good performance can be achieved by good load balancing among<br />
processors, minimizing communication overhead and increasing the parallelisable fraction f of a<br />
serial program. Note that the communication overhead can be decreased both by minimizing the<br />
amount of communication (good algorithm) and by using a fast network (good hardware).<br />
3.4.3 Performance tests<br />
A simple speedup model of our algorithm is made and compared to the actual timing results. It<br />
is assumed that the simulation volume is decomposed in M × M × M boxes and that the total<br />
number of processors used is P , dividing boxes into a 2D array of P 1/2 × P 1/2 × 1 or into a <strong>3D</strong> array<br />
of P 1/3 × P 1/3 × P 1/3 . The elapsed time by using a single processor is approximately the sum of<br />
the time needed for the stress computation (t s stress) and that used to update the positions (t s update ).<br />
Assuming that t s update is a fraction of ts stress (t s update = αts stress), the total elapsed time t s then is
82 Parallelization of the Discrete Dislocation Dynamics method<br />
Serial<br />
Parallel<br />
cpu 1<br />
cpu 2<br />
cpu 3<br />
cpu 4<br />
20 80<br />
20 20<br />
Load unbalance<br />
Unparallelizable part<br />
Parallelizable part<br />
Communications<br />
Figure 3.16: Load unbalance and communication overhead of general parallel programs<br />
written as Eq.(3.6).<br />
t s = t s stress + t s update = (1 + α)ts stress<br />
The number of inner boxes (BI), boundary boxes (BB) of each processor and the total corner boxes<br />
(BC) can be expressed using M and P as Eq.(3.7) in the case of a 2D array and as Eq.(3.8) in the<br />
case of a <strong>3D</strong> array of processors. It is assumed that every processors have the same number of boxes<br />
in its subsystem.<br />
BI =<br />
<br />
M<br />
BI = M − 2<br />
P 1/2<br />
<br />
M<br />
− 2<br />
P 1/3<br />
3<br />
2<br />
(3.6)<br />
<br />
M<br />
; BB = 4M − 2 ; BC = 4MP (3.7)<br />
P 1/2<br />
2 <br />
M<br />
; BB = 6 − 2 ; BC = P 12<br />
P 1/3 M<br />
<br />
− 16<br />
P 1/3<br />
If dislocation segments are homogeneously distributed over all the processors, the elapsed time for<br />
the stress computation of each processor (t p<br />
stress ) is merely a division of ts stress by P . Considering<br />
that the elapsed time for updating segments’ positions of a box is t s update /M 3 , the elapsed time of a<br />
processor (t p ) for both the stress computation and the segment motion can be expressed as Eq.(3.9).<br />
t p = t p<br />
stress + tp<br />
update<br />
(3.8)<br />
= ts stress<br />
P + ts update<br />
M 3 (BI + BB + BC) + tc (3.9)<br />
The elapsed time for updating BC is included on each processor, because every processors wait until<br />
the updates of BC by the Master processor are finished. tc represents the time needed for message
3.4 Performance improvment 83<br />
Speedup<br />
70<br />
60<br />
50<br />
40<br />
30<br />
20<br />
10<br />
0<br />
Ideal case<br />
<strong>3D</strong>, t c =0<br />
2D, t c =0<br />
<strong>3D</strong>, t c =0.02t s stress<br />
2D, t c =0.02t s stress<br />
10 20 30 40 50 60<br />
Number of CPUs<br />
Figure 3.17: Speedup model of the algorithm (Eq.(3.9)) with M = 21, t s update = 0.02ts stress for 2D<br />
array of processors (2D) and <strong>3D</strong> array of processors (<strong>3D</strong>)<br />
passings.<br />
A speedup (t s /t p ) is plotted in Fig.3.17 using Eq.(3.9) with M = 21, α = 0.02 and tc/t s stress =<br />
0., 0.02. The curve is drawn up to P = 49 in the case of 2D array of processors. Note that a<br />
maximum of 49 processors can be used with M = 21 in the 2D array of processors, since there<br />
should be at least three boxes along any coordinate axis.<br />
The speedup of the algorithm is strongly dependent on the network speed. If the network is fast<br />
enough (tc 0), the algorithm speedup can be as high as 23 using 25 processors with the 2D array<br />
of processors.<br />
It seems that the <strong>3D</strong> array of processors have an advantage over the 2D array if the same number<br />
of processors are used. In reality it is controversial, because a <strong>3D</strong> array of processors involves more<br />
messages passing than a 2D array. A <strong>3D</strong> array needs message passings along all of three coordinates,<br />
whereas a 2D array needs message passings along only two coordinates. The size of each message,<br />
however, is smaller in the case of a <strong>3D</strong> array of processors.<br />
Dislocation structures with 13185, 37182, 57605 and 77198 segments are extracted from a simple<br />
tensile test of a single crystal with M = 20. Then execution time for 100 steps with zero applied<br />
stress is measured and the elapsed time per step is averaged by dividing the execution time by
84 Parallelization of the Discrete Dislocation Dynamics method<br />
Time per step(seconds)<br />
160<br />
140<br />
120<br />
100<br />
80<br />
60<br />
40<br />
20<br />
0<br />
0 5 10 15 20 25 30 35 40<br />
Number of CPUs<br />
N=77198<br />
N=57605<br />
N=37182<br />
N=13185<br />
Figure 3.18: Elapsed time per step, in seconds, as a function of the number of processors for 13185,<br />
37182, 57605 and 77198 segments.<br />
100. Fig.3.18 shows the average elapsed time required to complete one time step using up to<br />
36 processors in a 2D array of processors on the IBM p690 architecture with 1.7GHz POWER4<br />
processors 13 . Fig.3.19 shows the speedup of each number of processors and compares the actual<br />
data with the speedup model. Measured data agrees well with the model except in the 13185<br />
segments case. The speedup decrease in the 13185 segments case for large values of P is due to the<br />
the proportion of the computation time over the communication time decreases with the number of<br />
processors.<br />
3.4.4 Load balancing<br />
As pointed out in Sec. 3.4.2, good load balancing is crucial to achieve high performance of a parallel<br />
computation. In many cases, DDD simulations involve highly heterogeneous dislocation structures.<br />
An example is the formation of intense slip bands in fatigue simulations as shown in Fig. 3.21 (see<br />
Sec. 4.3). Fig. 3.21 shows the worst case in load balancing, due to the inherent highly heterogeneous<br />
13 The author would like to acknowledge the support from KISTI (Korea Institute of Science and Technology<br />
Information) under "the 5th Strategic Supercomputing Applications Support Program’ with Dr. Sangmin LEE as<br />
the technical supporter. The use of the computing system of the Supercomputing Center is also greatly appreciated.
3.4 Performance improvment 85<br />
Speedup<br />
40<br />
35<br />
30<br />
25<br />
20<br />
15<br />
10<br />
5<br />
0<br />
Ideal case<br />
N=37182<br />
N=57605<br />
N=77198<br />
N=13185<br />
t c =0.015t s stress<br />
0 5 10 15 20 25 30 35 40<br />
Number of CPUs<br />
Figure 3.19: Speedup by using P processors in 2D array for 13185, 37182, 57605 and 77198 segments<br />
(on IBM p690 architecture)<br />
Efficiency<br />
1.1<br />
1<br />
0.9<br />
0.8<br />
0.7<br />
0.6<br />
0.5<br />
0.4<br />
0.3<br />
0.2<br />
Ideal case<br />
N=37182<br />
N=57605<br />
N=77198<br />
N=13185<br />
0 5 10 15 20 25 30 35 40<br />
Number of CPUs<br />
Figure 3.20: Efficiency by using P processors in 2D array for 13185, 37182, 57605 and 77198<br />
segments (on IBM p690 architecture)
86 Parallelization of the Discrete Dislocation Dynamics method<br />
(a) Intense slip bands of fatigue tested volume con-<br />
taining bimodal-sized particles<br />
[010]<br />
6 7 8<br />
3 4 5<br />
0 1 2<br />
[100]<br />
(b) Decomposition of the simulation volume by 3 × 3 × 1 proces-<br />
sors<br />
Figure 3.21: An example taken from fatigue tests of cylindrical simulation volume containing parti-<br />
cles of bimodal size distribution (see Sec.4.3). Load is highly unbalanced among processors due to<br />
the highly heterogeneous dislocation microstructure<br />
dislocation microstructure in fatigue and the geometry of the simulation volume.<br />
If the simulation volume is decomposed into equal sized subsystems as shown in Fig. 3.21(b), there<br />
is a high discrepancy in the number of segments between the different processors, and consequently<br />
in the computation time. A load-balance method is thus highly desirable to equilibrate the proces-<br />
sor loadings.<br />
One obvious way to better balance the loads is to shift the boundaries of each subsystem, or the<br />
array ibs, so that each processor has approximately the same number of segments, since the com-<br />
putation time is usually proportional to the number of segments. In surface grain simulations,<br />
however, the number of segments may not be a good yardstick because some segments are treated<br />
as virtual ones and need no internal stress computation, which will be detailed in Sec. 4.3. Hence<br />
the actual elapsed time for stress computations is taken as an indication for load balancing.<br />
The elapsed time is measured by using, for example, the MPI timer function MPI_WTIME(). Load<br />
balancing is processed every fbalan steps. To minimize the overhead of load balancing, the processor<br />
which having the minimum elapsed time is determined one step before the load balancing. This<br />
processor then takes charge of shifting the boundaries. This makes the overhead of load balancing<br />
to be hidden in the process of overall stress computation.
3.4 Performance improvment 87<br />
Y<br />
Z<br />
Initial<br />
boundaries<br />
Current<br />
boundaries<br />
Figure 3.22: Shifting of subsystem boundaries to balance load among processors<br />
The elapsed time for the stress computation of each processor is gathered to the processor in charge.<br />
The processor adds the elapsed time of processors in the same column along x, y, and z axis in the<br />
processor array, and the average elapsed time of the columns is calculated. By comparing the<br />
elapsed time of a column to the average time, the boundary is shifted by one box so that the size<br />
of a column increases or decreases. The boundary can move until the number of boxes has reached<br />
the minimum number of boxes of a subsystem on any axis (3 boxes).<br />
The boundary adjustment procedure during a fatigue test is shown in Fig. 3.22. Dislocations in<br />
the top-right part of the cubic simulation volume are ’virtual’, so less computation time is needed<br />
to treat them. The boundaries of each subsystem thus move toward bottom-left of the simulation<br />
volume until they share a comparable number of real dislocation segments.<br />
The load balancing by parallel-piped subsystems has the following limitations: (i) The different<br />
subsystems on the same column should have the same width, thus the computing load is balanced<br />
among the columns, not among the processors. (ii) There should be at least three boxes along<br />
each axis of each subsystem, thus load concentration smaller than three boxes can not be balanced<br />
further.<br />
During simulations, the number of segments can change dramatically. It is not unusual that an<br />
initial Frank-Read source produces millions of segments. When the number of segments is small,<br />
X
88 Parallelization of the Discrete Dislocation Dynamics method<br />
the efficiency of the new parallel DDD program is quickly decreasing with the number of processors<br />
(Fig. 3.20), and the speedup could be even reversed by using more processors (Fig. 3.19). One way<br />
to guarantee a maximum efficiency and to prevent inverse speedup of multiple processors would be<br />
to change the number of processors dynamically based on the current number of segments. This<br />
can be done, for example, by creating a new communicator of n [1 : N] processors in the initial<br />
communicator of N processors.<br />
3.4.5 Comparison of simulation results between the serial and parallel DDD<br />
code<br />
The simulation results of a parallel program should not be significantly different from that of a<br />
serial program when addressing the same problem. There could be a slight difference, however, due<br />
to the parallelization because the order of computations might be changed.<br />
In DDD simulations, the segments are moved sequentially, and two different orders of segments<br />
can results in different dislocation configurations even though the applied stresses are the same.<br />
Nevertheless the overall stress-strain relation and the dislocation density in the simulation should<br />
be consistent when using the parallel or the serial DDD program.<br />
Fig. 3.23(a) shows the stress-strain curves of a simple tensile test along [001] direction of a single<br />
crystal. It can be verified that the curve of the parallel program is consistent with that obtained<br />
using the serial program. The number of dislocations is slightly different by using the two programs<br />
but the error is negligible as compared to the overall evolution of dislocations (Fig. 3.23(b)).<br />
3.5 Application to Stage I-II transition simulation<br />
In this section, resorting to the performance of the new parallel DDD code, it is attempted to<br />
simulate the transition from Stage I to Stage II in the stress-strain curves of FCC single metals<br />
subjected to a uniaxial tension.<br />
3.5.1 Stress-strain curves of FCC single crystals<br />
In the general case, when a FCC single crystal is subjected to tensile tests, the stress-strain curves<br />
represent three distinctive stages, I, II and III. Fig. 3.24 shows stress-strain curves from experiments<br />
in copper crystals covering a wide range of orientations. Stage I or ’easy glide’ is a region of low
3.5 Application to Stage I-II transition simulation 89<br />
Stress[MPa]<br />
180<br />
160<br />
140<br />
120<br />
100<br />
80<br />
60<br />
40<br />
20<br />
Parallel<br />
0<br />
Serial<br />
0.0e0 1.0e-4 2.0e-4 3.0e-4 4.0e-4<br />
Strain<br />
(a) Stress-strain curves<br />
Number of segments<br />
40000<br />
35000<br />
30000<br />
25000<br />
20000<br />
15000<br />
10000<br />
5000<br />
Parallel<br />
0<br />
Serial<br />
0 500 1000 1500 2000 2500 3000<br />
Step number<br />
(b) Number of segments<br />
Figure 3.23: Comparison of (a) stress-strain curves and (b) number of segments of the serial and<br />
the parallel DDD program in a tensile test simulation<br />
linear hardening (θ = ∂τ<br />
∂γ<br />
G ∼ 300 ) and is observed at the beginning of deformation. Stage II or ’linear<br />
hardening’ is a second linear region with a much greater rate of work hardening (θ ∼ G<br />
30 ), then is<br />
followed by Stage III or ’parabolic hardening’, which represents a period of decreasing rate for the<br />
hardening. Fig. 3.24 also shows that the shape of the curves is strongly dependent on the crystal<br />
orientation, e.g. the orientations close to the [001] − [¯111] side show a short or no Stage I, whereas<br />
the orientations far from the boundaries of the standard triangle show a long Stage I.<br />
The slip system on which the resolved shear stress is the highest is called the primary system, and<br />
the deformation commences on this system involving a low work hardening rate (Stage I). The<br />
accumulated slip rotates the orientation of the crystal, and subsequently the resolved shear stress<br />
on different slip systems is modified as the slip direction rotates towards the tension axis. When<br />
the tensile axis arrives the [001] − [¯111] side, another slip system (the conjugate system), which has<br />
been inactive initially, begins to activate, and the interactions of two slip systems initiates Stage II.<br />
3.5.2 Simulation conditions<br />
The initial dislocation configuration is made of 5.65 µm-long Frank-Read sources homogeneously<br />
spread over the 12 slip systems (see Fig. 3.25(a) 14 ). The orthorhombic simulation box has been<br />
used with the ratio of the axis’ length close to 40 : 30 : 31, and the periodic boundary conditions<br />
are applied along all the axes. The simulation volume is around 577 µm 3 and the initial dislocation<br />
14 Different colors represent dislocations on different slip systems
90 Parallelization of the Discrete Dislocation Dynamics method<br />
Figure 3.24: Resolved shear sress/shear strain curves of copper crystals as a function of orientation.<br />
([Diehl 56])<br />
density is 8.82 × 10 11 m −2 (90 sources).<br />
The materials parameters of copper are used : G = 42000 MPa (Shear modulus), ν = 0.324<br />
(Poisson’s ratio), b = 2.56 Å(Burgers vector magnitude), B = 10 −5 Pa s (Viscous drag coefficient),<br />
V/b 3 = 350 (Activation volume) and τIII = 32 MPa (Threshold stress).<br />
The initial tensile axis (T) has been chosen to [ ¯14 15 25], so that the initial configuration is in<br />
single glide close to the double glide axis. The resulting Schmid factor is shown in Fig. 3.25(b).<br />
The primary system is the system B4: (111)[¯101] and the conjugate system is C1: (¯1¯11)[011] (the<br />
notations of Schmid and Boas are recalled in Table 2.1). The simulation runs in the constant strain-<br />
rate condition of ˙ɛ = 100sec −1 . The rotation tensor of the crystal is computed every time step using<br />
Eq. 3.10, and the new tensile stress axis (T ′ ) is updated as Eq. 3.11<br />
dW =<br />
12<br />
s=1<br />
1<br />
2 (ms ⊗ n s − n s ⊗ m s ) (3.10)<br />
T ′ = (I + dW) T (3.11)<br />
This way of updating the orientation of the tensile axis reproduces the experimental tensile tests<br />
where the crossheads of the tensile machine are unconstrained, i.e. the rotations of the crosshead<br />
are allowed.
3.5 Application to Stage I-II transition simulation 91<br />
(010) Y<br />
(100) X<br />
(001) Z<br />
(a) Initial dislocation configuration<br />
3.5.3 Simulation results<br />
Schmid factor<br />
0.3<br />
0.2<br />
0.1<br />
0<br />
B4 D4 D1 C1 B5 C5 D6 A6 A2 B2 C3 A3<br />
(b) The initial distributions of the Schmid fac-<br />
tors<br />
Figure 3.25: Initial conditions of the simulation<br />
In Fig. 3.26(a), the tensile stress-strain curve is plotted. The curve shows no significant hardening<br />
up to the strain level of 1.3%. The dislocation configuration at a cumulated tensile strain of about<br />
1.% are shown in Fig. 3.27, and the dislocation structure shows that the dislocations in the primary<br />
system are mainly activated, thus the simulation is still in Stage I at this moment.<br />
The stress-strain curve shows an insignificant hardening or even a negative hardening after, say,<br />
0.5% cumulated strain. This phenomenon seems to be related to the enhanced cross slip of the<br />
primary dislocations due to the spurious dipoles generated by the periodic boundary conditions.<br />
Indeed, the evolution of the dislocation densities plotted in Fig. 3.26(b) shows that the density of<br />
the cross slip dislocations of the primary system is significant even though the Schmid factor and<br />
the observed shear strain on the deviate (or cross-slip) system are negligible.<br />
However, the rotation of the tensile axis is well accounted for in the simulation. Fig. 3.28(a) shows<br />
the rotation of the stress axis plotted within the standard stereographic triangle. The stress axis<br />
rotates toward the [001] − [¯111] boundary. Subsequently, the Schmid factors are modified and the<br />
ratio between the primary and the conjugate system increases toward 1 as plotted in Fig. 3.28(b).<br />
Despite the spurious softening, the shear stress-strain curves of the primary and the conjugate<br />
system (see Fig. 3.29) demonstrate that the hardening is decreased in the primary system due to<br />
the rotation of the axis, whereas the hardening is more pronounced in the conjugate primary system.<br />
This typical simulation of the behavior of a bulk crystal of copper is a first tentative of a massive
92 Parallelization of the Discrete Dislocation Dynamics method<br />
σ 11<br />
30<br />
25<br />
20<br />
15<br />
10<br />
5<br />
0<br />
0 0.002 0.004 0.006 0.008 0.01 0.012 0.014<br />
ε11 (a) The tensile stress-strain curve<br />
ρ[10 11 m-2]<br />
140<br />
120<br />
100<br />
80<br />
60<br />
40<br />
20<br />
B4<br />
D4<br />
D1<br />
C1<br />
B5<br />
C5<br />
D6<br />
A6<br />
A2<br />
B2<br />
C3<br />
A3<br />
0<br />
0 0.002 0.004 0.006 0.008 0.01 0.012 0.014<br />
ε11 (b) The evolution of the dislocation densities<br />
Figure 3.26: The tensile stress-strain curve and the evolution of the dislocation densities<br />
Figure 3.27: The dislocation configuration at a cumulated tensile strain of about 1.%<br />
(010) Y<br />
(100) X<br />
(001) Z
3.5 Application to Stage I-II transition simulation 93<br />
τ(B4) [MPa]<br />
12<br />
10<br />
8<br />
6<br />
4<br />
2<br />
[-14 15 25]<br />
[-111]<br />
[001] [011]<br />
(a) The rotation of the tensile axis<br />
τ(C1)/τ(B4)<br />
0.985<br />
0.98<br />
0.975<br />
0.97<br />
0.965<br />
0.96<br />
0.955<br />
0.95<br />
0.945<br />
0e+00 1e+05 2e+05 3e+05 4e+05 5e+05 6e+05 7e+05<br />
Number of steps<br />
(b) The ratio between τ(C1) and τ(B4)<br />
Figure 3.28: The rotation of the tensile axis and the modified Schmid factors<br />
0<br />
0e+00 5e-03 1e-02 1e-02 2e-02 3e-02 3e-02 4e-02<br />
γ(B4)<br />
(a) The shear stress-strain curve of the primary system<br />
τ(D4) [MPa]<br />
12<br />
10<br />
8<br />
6<br />
4<br />
2<br />
0<br />
0e+00 1e-04 2e-04 3e-04 4e-04 5e-04 6e-04<br />
γ(D4)<br />
(b) The shear stress-strain curve of the conjugate system<br />
Figure 3.29: The shear stress-strain curves of the primary and the conjugate system<br />
simulation using the new parallel DDD code. The amount of cumulated shear strain on the primary<br />
system reaches 3% and the number of segments at the end of the simulation was close to 43, 000.<br />
More investigations are needed to understand the reason of the softening observed during Stage I.<br />
The transition to the stage II should nevertheless be observed in a few more steps, when the Schmid<br />
factor on the conjugate system (C1) will be high enough to multiply its dislocation density, and<br />
hinder the dislocation motion on the primary system (B4).
94 Parallelization of the Discrete Dislocation Dynamics method<br />
Key points<br />
• Parallel models and languages are strongly dependent on the different types of parallel<br />
computers. For shared memory machines, fork-join model is usually applied using<br />
OpenMP or Pthread. The message passing model is adequate for distributed memory<br />
architectures using the MPI as the programming language.<br />
• Distributed memory system and MPI have been chosen here for the development of<br />
a parallel DDD code. To handle the dislocation interactions during the segments<br />
motion is the most complex part for parallelization. Attention is focused on the fact<br />
that the <strong>3D</strong> array of boxes physically dividing the cubic simulation volume is similar<br />
to a matrix in the computer memory space.<br />
• The cubic simulation volume is decomposed into parallel-piped subsystems which are<br />
mapped to processors. The internal stress computation involves small modifications<br />
in the serial DDD code. The segment motion algorithms have been developed for the<br />
different box types categorized into inner, boundary and corner boxes. Attention is<br />
paid to avoid any overlap of the neighboring boxes between the processors.<br />
• The performance of the new parallel DDD program is measured and compared to a<br />
simple speedup model. The boundaries of each parallel-piped system are dynamically<br />
moved to balance the computing load among the processors. Simulation results of<br />
the parallel DDD version corresponds well to those obtained with the serial version.<br />
A speedup of around 17 is found when using 25 cpus to handle more than 30, 000<br />
segments<br />
• The new parallel code has been applied to simulate the Stage I-II transition of single<br />
FCC metals subjected to a uniaxial tension. The simulation runs up to the 3.2%<br />
cumulated shear strain at this moment and still remains in Stage I. However, the<br />
rotation of the axis is well accounted for, as measured on the evolution of the Schmid<br />
factors. The softening observed on the mechanical response is attributed to avalanche<br />
of cross-slip events which may be induced by the periodic boundary conditions.
Chapter 4<br />
Dislocation-precipitate interactions<br />
4.1 Image stresses due to a <strong>3D</strong> particle<br />
4.1.1 Motivations and review of the literature<br />
The image forces need to be considered when one wants to study the behavior of dislocations near<br />
a free surface. Another level of complexity arises when there are internal interfaces in metals, such<br />
as voids, second phase particles and microcracks. The magnitude of the interaction forces is at least<br />
required to understand the dislocation behaviors around the internal interfaces. There have been<br />
many studies to obtain the interaction both in analytical and numerical ways.<br />
Free surfaces<br />
The effect of a free surface can be easily treated in 2D by introducing the mirror images so that the<br />
traction on the free surface would be forced to zero. The problem is more complex in <strong>3D</strong> because it is<br />
almost impossible to find analytically the image dislocation for a finite dislocation segment that is not<br />
parallel to the free surface. This problem can be solved using either the solution of the Boussinesq<br />
problem ([Fivel et al. 96]) or the superposition principles using FEM ([Fivel et al. 98]). The<br />
main idea of this method is to apply point forces on the free surface so that these forces nullify the<br />
surface stress field generated by a dislocation in an infinite medium on the free surface. Using this<br />
method, the dislocation depletion near a free surface can be computed and the direct comparison<br />
can be made between the dislocation structure calculated in dislocation dynamics simulation and<br />
the experimental observations, e.g. TEM (Transmission Electron Microscopy).<br />
The dislocation-free zone near a crack tip ([Kobashi & Ohr 80]) and the plastic zone yielding from
96 Dislocation-precipitate interactions<br />
a crack ([Vitek 75]) are other fields where the image force acting on a dislocation is an important<br />
factor to consider. There are several analytical solutions on the interaction of a dislocation line<br />
and a hole or rigid inclusion. To make the problem to be a simple 2D case, it is generally assumed<br />
that a infinitely long dislocation line is interacting with an infinitely long cylindrical inclusion<br />
(hole or rigid) ([Santare & Keer 86], [Zhou & Lung 88], [Chen et al. 99]). The authors used<br />
a complex potential approach in plane strain restriction for an isotropic medium. They solved the<br />
elastic solution satisfying the stresses and displacements continuity at the interface. The application<br />
of these 2D solutions is rather limited to the case of fiber-strengthened composite or microcracks<br />
with large aspect ratio.<br />
Particles<br />
Even for a simple geometrical shape like a spherical particle, the calculation of the interaction force<br />
between a dislocation line and a particle satisfying the stress and displacement continuity across<br />
the interface is not an easy task. The elastic problem to satisfy the rigorous boundary conditions is<br />
too complex to solve in an analytical manner. Instead of the exact solution, approximate solutions<br />
have been obtained for <strong>3D</strong> shapes of particle. One method consists of using the interaction energy<br />
between a dislocation line and a particle. It is assumed that the interaction energy is equal to<br />
the change of the energy density of a dislocation line by the presence of a particle volume. The<br />
interaction force or the image force is obtained by differentiating the interaction energy. This ap-<br />
proach tells that the ratio of the image force acting on an edge dislocation and a screw dislocation<br />
is equal to the ratio of the energy density of a dislocation of the respective type. Using this method,<br />
an analytical equation is obtained for the force acting on a screw dislocation line near a cubical<br />
particle ([Melander & Persson 78]) and the force on an edge and a screw dislocation near a<br />
spherical particle are calculated numerically ([Nembach 83]). The long-range interaction between<br />
a screw dislocation and a spherical inclusion has been treated assuming that a straight disloca-<br />
tion line is located far from a spherical particle so that the particle disturbs the uniform stress<br />
field([Weeks et al. 69],[Comninou & Dundurs 72]).<br />
The interaction force due to a second phase particle with an elastic modulus mismatch is considered<br />
as negligible compared with the lattice mismatch and the stacking fault energy mismatch effect in<br />
the case of a penetrable particle ([Nembach 97]). The interaction forces by an elastic modulus<br />
mismatch, however, increase with the number of dislocations around the particles 1 . The image<br />
1 This type of interaction is referred to the paraelastic interaction ([Nembach 97]).
4.1 Image stresses due to a <strong>3D</strong> particle 97<br />
(-1-12) Z<br />
(111) Y<br />
(1-10) X<br />
(a) Cylindrical particle<br />
y=0.86Rp<br />
y=0.5Rp<br />
y=0<br />
(111) Y<br />
(-1-12) Z (1-10) X<br />
(b) Spherical particle<br />
Figure 4.1: Computation geometries of (a) a cylindrical particle and (b) a spherical particle<br />
stresses by particles thus could be an appreciable factor in the computation of the energy state of<br />
dislocation structures around a particle and in the phenomena involving several dislocations like<br />
work hardening rate. Moreover in dispersion-strengthened alloys at high temperature, the interac-<br />
tion force on a single dislocation line in climb direction is essential to investigate high temperature<br />
properties, for example creep threshold stresses ([Marquis & Dunand 02]).<br />
Scope of this section<br />
Image forces on a long, straight dislocation line near a particle are computed using the decompo-<br />
sition method as detailed in Sec. 2.4.2. Three cases are considered: a cylindrical (Fig. 4.1(a)), a<br />
spherical (Fig. 4.1(b)) and a cubical particle. The cylindrical particle case can be compared with<br />
analytical solutions of 2D circular particles. Image forces along both a glide and a climb direction<br />
are considered.<br />
4.1.2 Interaction of an edge dislocation with a circular cylindrical particle<br />
Image forces on an edge dislocation around a rigid particle have been solved analytically in 2D by<br />
Santare et al. ([Santare & Keer 86]) and around a void by Vitek ([Vitek 75]) and Chen et al.<br />
([Chen et al. 99]). The analytical solutions are obtained using complex potentials.<br />
In the case of a rigid particle, the image force of an edge dislocation projected along the glide
98 Dislocation-precipitate interactions<br />
y/Rp<br />
1.5<br />
1<br />
0.5<br />
1<br />
0<br />
-1 -0.5 0 0.5 1 1.5<br />
-0.5<br />
-1<br />
5<br />
9<br />
2<br />
3<br />
7<br />
4<br />
1<br />
x/Rp<br />
(a) Analytical solution [Santare & Keer 86]<br />
y/Rp<br />
1.5<br />
1<br />
0.5<br />
0<br />
1<br />
0<br />
-1 -0.5 0 0.5 1 1.5 2<br />
x/Rp<br />
-0.5<br />
-1<br />
(b) Numerical solution<br />
Figure 4.2: Case of a rigid particle (The image force is normalized by µmb 2 /(4π(1 − νRp)) (a)<br />
Analytical solution [Santare & Keer 86] (b) Numerical solution (FEM/DDD)<br />
direction can be simplified as follows ([Santare & Keer 86])<br />
F<br />
µmb 2<br />
4π(1−ν)Rp<br />
= x 4x 4 + k 2 x 2 + 2k 2 x 2 y 2 − 3x 2 − 2kx 2 y 2<br />
(x 2 + y 2 ) 3 (x 2 + y 2 − 1) k<br />
+ x 2k 2 y 4 + 2ky 2 − 4y 4 − k 2 y 2 + 5y 2 − 2ky 4<br />
(x 2 + y 2 ) 3 (x 2 + y 2 − 1) k<br />
with µm, ν being the shear modulus and the Poisson’s ratio of the matrix, Rp being the radius of<br />
the particle and k = (3 − 4ν) for a plane strain condition.<br />
There are two solutions of image forces around a circular void. The solutions are written in Eq. 4.2<br />
([Chen et al. 99]) and Eq. 4.3 ([Vitek 75]).<br />
F<br />
µmb 2<br />
4π(1−ν)Rp<br />
= −2x x 6 + x 4 y 2 + 4x 2 y 2 − x 2 y 4 + 4y 4 − 2y 2 − y 6<br />
(x 2 + y 2 ) 3 (x 2 + y 2 − 1)<br />
F<br />
µmb 2<br />
4π(1−ν)Rp<br />
= −2x 2x 4 − x 2 + 2x 2 y 2 + y 2<br />
(x 2 + y 2 ) 3 (x 2 + y 2 − 1)<br />
Image forces are computed numerically around a cylindrical particle with a height axis [¯1¯12], which<br />
is parallel to an edge dislocation. The shear modulus of the cylinder is set to be 10 3 µm for the<br />
rigid case and 10 −3 µm for the void. The contours of the image forces acting on an edge dislocation<br />
and projected along the glide direction are shown in Fig. 4.2 for the case of a rigid inclusion. The<br />
forces are normalized by µmb 2 /(4π(1 − νRp)). The image force profiles are computed on three lines<br />
45<br />
9<br />
3<br />
2<br />
1<br />
(4.1)<br />
(4.2)<br />
(4.3)
4.1 Image stresses due to a <strong>3D</strong> particle 99<br />
F/(µ m b 2 /(4π(1-ν)R p ))<br />
15<br />
10<br />
5<br />
0<br />
-5<br />
-10<br />
y=0.5R p<br />
y=0.86R p<br />
y=0.86R p<br />
y=0.5R p<br />
y=0.0<br />
y=0.0<br />
[SANTARE & KEER 86]<br />
[CHEN et al. 99]<br />
[VITEK 75]<br />
DDD/FEM<br />
1 1.1 1.2 1.3 1.4 1.5 1.6 1.7 1.8 1.9<br />
x/R p<br />
Figure 4.3: Normalized image forces on an edge dislocation situated at x/Rp from the center of a<br />
circular hole or a rigid cylinder along three lines with different stand-off distances (Rp: radius of<br />
cylindrical inclusion) Solid line: Analytical solution (Rigid case: [Santare & Keer 86], Hole case:<br />
[Vitek 75], [Chen et al. 99]) Points: Calculated by FEM/DDD<br />
with a direction of [1¯10] and a stand-off distance of 0., 0.5Rp and 0.87Rp from the plane passing<br />
through the center of the cylinder, and are plotted in Fig. 4.3 and compared with the analytical<br />
solutions. Numerical solutions fit well to the analytical solution(Eq. 4.1) in the rigid particle case.<br />
The computed image forces fall between two analytical solutions (Eq. 4.2 and Eq. 4.3) in the case<br />
of the void.<br />
From the 2D cylindrical circular case, it is thus validated that the image forces can be computed<br />
correctly using the FEM-DDD coupled method.<br />
4.1.3 Interaction of an edge dislocation with a spherical particle<br />
There is no existing analytical solution of image forces in the case of a spherical particle. However, it<br />
is common to encounter a precipitate or an inclusion of a spherical shape. Thus, numerical solutions<br />
of the spherical particle case would be useful in practice.<br />
Before computing image forces, both the issues of convergence and accuracy of the numerical solu-<br />
tions have been addressed. Using 20-node <strong>3D</strong> elements, it was verified that the numerical solutions
100 Dislocation-precipitate interactions<br />
F/(µ m b 2 /(4π(1-ν)R p ))<br />
12<br />
10<br />
8<br />
6<br />
4<br />
2<br />
0<br />
y=0.86R p<br />
y=0.5R p<br />
[SANTARE & KEER 86]<br />
y=0.0<br />
DDD/FEM, y=0.0<br />
DDD/FEM, y=0.5R p<br />
DDD/FEM, y=0.86R p<br />
0.6 0.8 1 1.2<br />
x/Rp 1.4 1.6 1.8<br />
Figure 4.4: Normalized image forces on an edge dislocation situated at x/Rp from the center of<br />
a spherical rigid particle. (Rp: radius of a spherical particle) Solid line: Analytical solution for a<br />
cylindrical rigid inclusion [Santare & Keer 86] Points: Calculated by FEM/DDD<br />
are converging by increasing the number of elements and the accuracy of the solutions were checked<br />
using the isobands method ([Bathe 96]). A mesh using 6656 20-node elements is found to be able<br />
to represent the high stress gradients correctly, although the <strong>3D</strong> spherical particle problem involves<br />
rough and discontinuous point load distributions on the elements of the particle volume.<br />
Image force profiles are obtained on three lines with a direction of [1¯10] and a stand-off distance<br />
of 0., 0.5Rp and 0.87Rp from the plane passing through the center of the sphere. In Fig. 4.4, the<br />
image force profile is compared with the corresponding 2D analytical solution (Eq. 4.1) for the case<br />
of a rigid particle and in Fig. 4.5 for the void particle with Eq. 4.2.<br />
The magnitude of the image force in the spherical particle case is lower than in the corresponding<br />
cylindrical case and the difference increases with the stand-off distance of the glide plane of the<br />
dislocation. It should be noted that the difference is much significant in the case of a spherical void.<br />
It can be deduced that the interaction volume is smaller in the case of a spherical than that of a<br />
cylindrical particle.<br />
The computed image force profiles are fitted in the form of α/(x/Rp) β . The profiles are divided in<br />
two regions, with a high gradient (up to x = 1.4Rp) and with a moderate gradient. The parameter
4.1 Image stresses due to a <strong>3D</strong> particle 101<br />
F/(µ m b 2 /(4π(1-ν)R p ))<br />
0<br />
-1<br />
-2<br />
-3<br />
-4<br />
-5<br />
-6<br />
-7<br />
-8<br />
y=0.86R p<br />
y=0.5R p<br />
y=0.0<br />
[CHEN et al]<br />
DDD/FEM, y=0.0<br />
DDD/FEM, y=0.5R p<br />
DDD/FEM, y=0.86R p<br />
0.6 0.8 1 1.2<br />
x/Rp 1.4 1.6 1.8<br />
Figure 4.5: Normalized image forces on an edge dislocation situated at x/Rp from the center of a<br />
spherical void. (Rp: radius of a spherical particle) Solid line: Analytical solution for a cylindrical<br />
hole [Chen et al. 99] Points: Calculated by FEM/DDD
102 Dislocation-precipitate interactions<br />
β is in the range of 6.42 to 8.89 in the high gradient region and 4.34 to 4.84 in the moderate gradient<br />
region. This result is consistent to the argument of Comninou et al. ([Comninou & Dundurs 72]),<br />
which shows that the interaction force is proportional to (x/Rp) −4 assuming that a straight dislo-<br />
cation line is located far from a spherical particle. Although the authors derived the equation in<br />
the case of a screw dislocation, the scheme can also be applied to an edge dislocation.<br />
4.1.4 Interaction of an edge and a screw dislocation with a cubical particle<br />
A cubical particle on a FCC matrix habit plane of {111} is now considered. It facilitates the problem<br />
because a dislocation line lies parallel to an edge and a face of the cube. The side length 2a of the<br />
cube is set to be 1.612Rp so that the volume of the cube is equal to that of the spherical particle<br />
considered previously. Image forces are computed on three glide planes with the stand-off distance<br />
y=0., y=0.5a, y=0.87a. The shear modulus of the particle (µp) is set to be twice that of the matrix<br />
and the Poisson’s ratio ν is 0.312 for both the particle and the matrix.<br />
This configuration was also proposed by Melander ([Melander & Persson 78]) using the energy<br />
density of a screw dislocation line. Image forces are obtained by differentiating the interaction<br />
energy. The image force of a screw dislocation is given by<br />
F = (µp − µm)b 2<br />
8π 2 a<br />
⎡<br />
⎣ tan−1<br />
<br />
(Y −1)<br />
|X−1| − tan−1 |X − 1|<br />
<br />
(Y +1)<br />
|X−1|<br />
tan<br />
−<br />
−1<br />
, where X, Y are coordinates normalized by the half side length a.<br />
<br />
(Y −1)<br />
|X+1| − tan−1 |X + 1|<br />
(Y +1)<br />
|X+1|<br />
⎤<br />
⎦ (4.4)<br />
Computed image force profiles on an edge dislocation line are shown in Fig. 4.6. The decrease of<br />
the image force with the stand-off distance is not as fast as in the spherical particle case, since the<br />
dislocation line is parallel to one face of the cubical particle and the glide plane is normal to the<br />
face. It is found that the image force is 20% higher in the case of a cubical particle at the stand-off<br />
distance of 0 than in the case of a spherical particle. Image forces on a screw dislocation shows that<br />
the ratio between an edge and a screw dislocation is around 0.68, which is close to (1-ν). However,<br />
Eq. 4.4 fits the edge dislocation case well, even though Eq. 4.4 is solved in the case of a screw<br />
dislocation. It is not clear whether this discrepancy is due to the mesh size or the approximations<br />
used to derive Eq. 4.4.<br />
The image force magnitude along the climb direction of an edge dislocation is given by<br />
τcl =<br />
((b · σ) × t)<br />
|b|<br />
· (b × t)<br />
|b × t|<br />
(4.5)
4.1 Image stresses due to a <strong>3D</strong> particle 103<br />
F/((µ p -µ m )b 2 /(4π(1-ν)a))<br />
3.5<br />
3<br />
2.5<br />
2<br />
1.5<br />
1<br />
0.5<br />
0<br />
y=0.87R p<br />
Edge,y=.00Rp<br />
Edge,y=.50Rp<br />
Edge,y=.87Rp<br />
Screw,y=.00Rp<br />
[MELANDER & PERSSON 78]<br />
y=0.0<br />
y=0.5R p<br />
1.1 1.2 1.3 1.4<br />
x/a<br />
1.5 1.6 1.7 1.8<br />
Figure 4.6: Image forces on a dislocation interacting with a cubical particle. solid line: Analytical<br />
solution for a cubical particle [Melander & Persson 78]<br />
with b being the Burgers vector and t being the dislocation line vector. The climb forces draw<br />
attention because it affects the local climb of a dislocation around a particle. Climb forces on an<br />
edge dislocation at the position of x = 1.1a on three different stand-off distances are plotted in Fig.<br />
4.7. The climb forces are negligible up to y = 0.5a. Even at y = 0.877a, the magnitude of the climb<br />
force is only around half that of the image force along the glide direction. The situation is quite<br />
different in the spherical particle case. The magnitude of the climb force is 2 − 3 times higher than<br />
the force along the glide direction y = 0.866Rp. It can be said that the configuration chosen for the<br />
cubical particle is more resistant to dislocation climb.<br />
4.1.5 Discussion<br />
The interaction force of a dislocation line with a circular cylindrical, spherical and cubical particles<br />
with differing elastic modulus was computed using the superposition principle. The complementary<br />
problem was solved using the FEM-DDD coupling code. There have been significant research<br />
interests in case of a long cylindrical inhomogeneity. In the case of a long edge dislocation line<br />
close to a long cylindrical particle, the image force calculated numerically was compared with the<br />
analytical solutions. It showed that good accuracy could be obtained by the superposition method.
104 Dislocation-precipitate interactions<br />
F cl /((µ m b 2 /(4π(1-ν)R p ))<br />
14<br />
12<br />
10<br />
8<br />
6<br />
4<br />
2<br />
0<br />
-2<br />
Sphere(Rigid)<br />
Sphere(Void)<br />
Cube<br />
0 0.1 0.2 0.3 0.4 0.5 0.6 0.7 0.8 0.9<br />
y/R p<br />
Figure 4.7: Climb forces on an edge dislocation at the position of x=1.1Rp(a) along y-axis<br />
The same scheme was applied to the case of a spherical particle interacting with a dislocation line,<br />
which is a more common shape for inhomogeneities observed in metals. The image force acting on<br />
a dislocation at x = 1.1Rp along the glide direction is found to be smaller than the cylindrical case<br />
by a factor of 0.89 for the rigid and 0.58 for the hole case. The interacting volume involved in the<br />
spherical case is thus much smaller than that in the cylindrical case. As for climb forces, it is found<br />
that considerable forces are acting along the climb direction. The climb force is acting on an edge<br />
dislocation in the direction of reducing the extra plane around rigid particle, and in the opposite<br />
direction around a void. As the stand-off distance of the glide plane is increased, the climb force<br />
increases. A dislocation line parallel to one face and one edge of a cubical particle showed that the<br />
image force is higher than the spherical particle by 20% and the climb force is negligible. It can be<br />
said that a cubical particle is more resistant to dislocation climb.
4.2 A simple case of dislocation-particle interaction 105<br />
4.2 A simple case of dislocation-particle interaction<br />
4.2.1 Motivation and review of literatures<br />
The hardening of materials by distributing small particles of another phase is a well-known phe-<br />
nomenon and has been used to develop high strength structural materials. The impediment of<br />
dislocation glide by second phase particles is the basic mechanism of increase in the flow stress.<br />
In the case of impenetrable particles, the back stress exerted by trapped closed loops causes the<br />
subsequent increment of stress, i.e. the work hardening. In addition to the glissile closed loops left<br />
around the particles, prismatic loops have also been observed experimentally to form near a particle<br />
by the cross slip of dislocations ([Humphreys & Martin 67]). The particles in the two phase<br />
materials can be classified by their size, shape, volume fraction, spatial distribution (regular or ran-<br />
dom) and the characteristic of the particle/matrix interface (coherent or incoherent). In addition<br />
to these morphological particle parameters, the stress fields around the particles, which arise by a<br />
difference in the lattice constant, the stress incompatibility due to a difference in the shear modulus,<br />
or the image stress caused by the change in the strain energy of the dislocation near a second phase<br />
particle are important factors needed to describe the mechanical properties of two-phase alloys.<br />
A number of experimental and analytical researches have been focused on finding the relevant param-<br />
eters and their effects in determining the flow stress and work hardening properties of these alloys.<br />
For example, well-designed experiments, in which the volume fraction, size and spacing of particles<br />
can be varied, have been made to measure the effect of such parameters on mechanical behavior of<br />
single crystals containing hard particles ([Ebeling & Ashby 66], [Humphreys & Martin 67]).<br />
Theoretical approaches to account for the effect of relevant parameters have been developed from<br />
the Orowan mechanism, which considers the elementary dislocation-particle interaction and relates<br />
the flow stress with the obstacle spacing, to the methods for dealing with the anisotropy of the<br />
material and the complicated statistics such as random distribution of particles. An overview of<br />
the analytical approaches can be found in the review article of Reppich ([Reppich 93]). To fully<br />
account for the realistic interaction of dislocations and many particles, computer simulations have<br />
also been developed. Foreman and Makin ([Foreman & Makin 66]) had investigated the effect<br />
of a random arrangement of strong and weak point obstacles on the flow stress. In recent simula-<br />
tions more complex and accurate states are treated, e.g. the distribution of finite particles including<br />
shape effect ([Zhu & Starke 99]), the particles with mismatch stress field by a difference in lattice<br />
constant ([Mohles & Nembach 01]). More insights of the effect of each parameter on the flow
106 Dislocation-precipitate interactions<br />
stress can be gained through these simulations. Note that in a simulations mentioned above, it was<br />
generally assumed that the dislocation moves on the single glide plane so that no <strong>3D</strong> events such as<br />
cross slip were allowed.<br />
Scope of this section<br />
In this work, the effect of the image stress on the flow stress and work hardening has been studied<br />
using the <strong>3D</strong> dislocation dynamics simulation coupled to a finite element code. The simulation<br />
method is detailed in section 4.2.2. The glide of a dislocation line through a channel between two<br />
incoherent, impenetrable spherical particles is considered. The dynamic interaction of a dislocation<br />
with particles and the resulting image stresses are solved in the <strong>3D</strong> space. Several dislocations are<br />
forced to move between two spherical particles one by one and the resolved shear stress needed to<br />
bypass the particles having trapped loops is monitored while the cross slip of dislocation is accounted<br />
for. By changing the shear modulus of the particle with other parameters such as particle radius<br />
and the inter-particle spacing fixed, the effect of image stress induced by second phase particles is<br />
evaluated and the relation between the flow stress and the difference in shear modulus is established.<br />
4.2.2 Calculation procedures<br />
The situation considered here consists of two impenetrable rigid spherical particles having radius<br />
Rp, inter-particle distance L and shear modulus Gp. A typical <strong>3D</strong> simulation box is shown in<br />
figure 4.8(a). In the dislocation code, the spherical particles are modeled as a set of facets made of<br />
polyhedral surface elements. Each facet of the spherical particle has a certain strength to act as an<br />
obstacle to dislocation motion, i.e. a dislocation is authorized to cross a facet if the local effective<br />
resolved shear stress is above the particle strength. In this study, the strength of the particle has<br />
been chosen high enough so that it represents impenetrable hard obstacles. That way, it is possible<br />
to use a simplified version of the code for which no image stresses are computed. The interaction<br />
between dislocations and particles is then only related to an obstacle effect. This situation is later<br />
referred as the ∆G = 0 case. In order to include the effect of the image forces, one has to solve<br />
the complementary problem described in figure 2.16. To do so, a <strong>3D</strong> box containing two spherical<br />
particles has been meshed in the code CAST∃M( 2 ). To represent correctly the high gradient of<br />
stress near the particles, the mesh has been refined near the periphery of the particles. A (111)<br />
section of the <strong>3D</strong> mesh taken at the centers of particles is shown in figure 4.8(b). The displacement<br />
2 Finite element code developed by Commissariat à l’Energie Atomique, CEA-DRN/DMT/SEMT
4.2 A simple case of dislocation-particle interaction 107<br />
(a) (b)<br />
Figure 4.8: (a)Simulation Box used in <strong>3D</strong> discrete dislocation simulation. Two particles of radius Rp<br />
and inter-particle distance L are shown with dislocation line on (111)[1-10] slip system. (b)Typical<br />
mesh of the simulation box constructed by 4672 20-nodes <strong>3D</strong> elements in the finite element code<br />
CAST∃M. Mesh is sectioned on the (111) plane containing the particle centres.<br />
of the bottom surface is set to be zero in the direction normal to the surface and two nodes located<br />
on this surface are fixed in adapted directions in order to remove the trivial rigid body solution.<br />
A dislocation line, which is initially a pure screw segment, is pinned at the two end points. The<br />
position of the pinned points is set to be 0.9 of L/2 from the border of particle so that the portion<br />
of dislocation line which lies between the particles bypasses the particles by bowing out. In section<br />
4.2.3, it will be shown that this fixed point can be used to obtain reliable results for the flow stress.<br />
Single slip loading conditions on the (111)[1-10] system are assumed. The resolved shear stress τ on<br />
the slip plane is increased step by step. After each load increment, the new positions of all segments<br />
are computed as a function of time until the shear strain γ caused by the dislocation motion has<br />
fallen below a pre-selected value. If the dislocation line has reached an equilibrium position, ∆γ is<br />
nearly equal to zero, τ is then increased and ∆γ is monitored again. After the dislocation line has<br />
completely bypassed the particles leaving two Orowan loops, a new dislocation line is introduced<br />
and the subsequent increment of τ, i.e. the work hardening is computed.<br />
4.2.3 Flow stress of impenetrable particles with a different shear modulus<br />
In order to validate the computation method used in this work, the flow stresses induced by im-<br />
penetrable particles with no image stresses have been calculated and compared with the results of
108 Dislocation-precipitate interactions<br />
Bacon et al ([Bacon et al. 73]). As explained in section 4.2.2, the finite element procedure is no<br />
more used here. The particle are modeled by the facets obstacles. The radius of particles are set to<br />
be 0.131(2 9 b), 0.262(2 10 b), 0.524(2 11 b) µm with a fixed inter-particle distance of L = 2.59 µm. The<br />
situation considered here is similar to the models used by Bacon et al ([Bacon et al. 73]) except<br />
for the periodic boundary condition. Figure 4.9 shows the dislocation configurations at the flow<br />
stress for three radius of particles respectively. The dislocation line near the particles is in paral-<br />
lel position due to the self-interaction which pulls the branches on opposite sides of the particle.<br />
The line between the particles is quite symmetric. The results obtained for the flow stresses have<br />
been compared according to the ’effective line tension’ argument proposed by the authors. They<br />
argued that the effective line tension, which properly accounts for the interactions, can be taken as<br />
A(ln(1/(2Rp) + 1/L) −1 + B) where A is 1/(2π) and 1/(2π(1 − ν)) for edges and screws respectively.<br />
Figure 4.10 shows our results obtained for the flow stresses normalized by Gmb/L plotted against<br />
ln(1/(2Rp) + 1/L) −1 . The linear relation is perfectly reproduced and the slope of the fitting line<br />
is about 0.254, which is closed to the expected value of 1/(2π(1 − ν)). Considering these observa-<br />
tions, it can be said that the fixed dislocation source at the point 0.9 of L/2 from the periphery<br />
of the spherical particle correctly reproduces the periodic boundary condition used by Bacon et al<br />
([Bacon et al. 73]).<br />
To investigate the effect of a difference in shear modulus on the flow stress, we have made simulations<br />
of an alloy made of a copper matrix containing two spherical particles of radius Rp = 0.262 µm. A<br />
shear modulus ratio (∆G/Gm) was set to be 1, 3 and 5, where ∆G = Gp − Gm. The inter-particle<br />
distance is fixed to L = 2.59 µm respectively. Figure 4.11 shows the increment in the flow stress<br />
as a function of ∆G/Gm. As the shear modulus of the particles increases, the flow stress increases<br />
due to the fact that the repulsive image stresses on the dislocation line needs higher resolved shear<br />
stress to bypass the dislocation line through particles. The fitting curve shows that the flow stress<br />
changes as (∆G/Gm) 0.6 . The change in the flow stress is small even for the particles with a shear<br />
modulus of 6Gm, for which the shear stress only increases by about 6 percent comparing to the no<br />
image stress case. Actually, the minute effect of ∆G is expected from the short range of the image<br />
stresses. Indeed, calculations show that the image stress exerted on a dislocation line decreases as<br />
|x − x0| α , where x, x0 represents the position of a dislocation line and the centre of a spherical<br />
particle respectively. α is found to be around 6 ∼ 7. So even in the case where ∆G/Gm = 5, the<br />
image stress decreases below the flow stress of hard obstacle (∆G = 0) at a distance of 1.4 × Rp<br />
from the centre of a particle. This effects means that the repulsive interaction between a dislocation
4.2 A simple case of dislocation-particle interaction 109<br />
Figure 4.9: Dislocation configuration at the flow stress. The radius of particles are 0.131, 0.262,<br />
0.524 µm from top to bottom.
110 Dislocation-precipitate interactions<br />
Normalized flow stress<br />
2.45<br />
2.4<br />
2.35<br />
2.3<br />
2.25<br />
2.2<br />
2.15<br />
2.1<br />
6.8 7 7.2 7.4 7.6 7.8 8<br />
ln[1/(2Rp )+1/L] -1<br />
Figure 4.10: τys/(Gmb/L) vs.ln(1/(2Rp) + 1/L) −1 . The line represents the fitting line and the slope<br />
is 0.254.<br />
and a particle will reduce the inter-particle spacing by about 8 percent. The small reduction in the<br />
effective inter-particle spacing will result in the small increase in the flow stress. The effect of Rp<br />
on the flow stress has been calculated with the constant ∆G/Gm value of three. The results are<br />
shown in figure 4.12. The flow stress depends almost linearly on Rp.<br />
The effects of a difference in shear modulus on the flow stress can be summarized as τys ∝<br />
Rp × (∆G/Gm) α , where α is lower than 1. Note that this result is different from the case of<br />
shearable particles. Indeed, the effects of shear modulus of coherent, penetrable particles can be<br />
found in the literature ([Nembach 83]). He has calculated the image force exerted by one spherical<br />
particle of modulus Gp on a straight, infinite dislocation line using the change in the strain energy<br />
density of the dislocation. The shear stress is found to be proportional to ∆G 1.5 and R 0.22<br />
p . Thus,<br />
we observed that ∆G has a weaker effect in the case of hard particles than in the case of shearable<br />
particles.
4.2 A simple case of dislocation-particle interaction 111<br />
Increase in flow stress<br />
0.06<br />
0.05<br />
0.04<br />
0.03<br />
0.02<br />
0.01<br />
0<br />
0 1 2 3 4 5<br />
(Gp-Gm )/Gm Figure 4.11: Increase in flow stress by a difference in shear modulus. ∆τ/τ0 is plotted against<br />
∆G/Gm, where τ0 represents the flow stress of impenetrable obstacle with no image stress. Rp =<br />
0.262 µm. The fitting curve shows ∆τ ∝ (∆G/Gm) 0.6 .<br />
Normalized flow stress<br />
2.6<br />
2.55<br />
2.5<br />
2.45<br />
2.4<br />
2.35<br />
2.3<br />
2.25<br />
2.2<br />
400 600 800 1000 1200 1400 1600 1800 2000 2200<br />
Rp /b<br />
Figure 4.12: Normalized flow stress (τys/(Gmb/L)) vs. Normalized particle radius (Rp/b).<br />
∆G/Gm = 3.
112 Dislocation-precipitate interactions<br />
4.2.4 Increment in hardening stress<br />
Although a difference in shear modulus has a little effect on the flow stress, its effect is much stronger<br />
on the hardening stress. In this section, the effects of ∆G on the hardening stress are discussed.<br />
The stress required to force a dislocation to glide between particles which have remaining Orowan<br />
loops, are plotted in figure 4.13 both for the case of Gp = 4Gm (filled symbols) and for no image<br />
stress (∆G = 0 : open symbols). The change in the shear modulus of the particles results in an<br />
increased work hardening rate and the effect of ∆G increases with the particle radius. The image<br />
stress fields are the sum of the interactions of the particle and each dislocation present around the<br />
particles. Thus the dislocation lines have to overcome the additional image stress field coming from<br />
the interaction of the residual loops and the particles. This additional stress is directly related to the<br />
number of Orowan loops stored around the particles. As a result, compared to the case of no image<br />
stress, a higher shear stress is required to bypass the particles and this effect is more pronounced as<br />
more dislocation lines are passing, which leads to a higher material hardening. Considering that the<br />
range and the magnitude of the image stress increases as the radius Rp, it can be understood that the<br />
hardening rate is increased as Rp. Fisher et al ([Fisher et al. 53]) have investigated the hardening<br />
of metal crystals induced by precipitate particles. They computed the back stress resulting from<br />
Orowan loops and calculated the effective critical stresses of the Frank-Read sources. The argument<br />
is that the hardening stress (τh) is related to the number of loops (N) by τh = γN, where γ is a<br />
function of the particle radius Rp and the inter-particle distance L. They obtained<br />
γ = 0.65cbGm<br />
<br />
1 −<br />
<br />
ν<br />
2(1 − ν)<br />
R 2 p<br />
(L + Rp) 3<br />
, where c is the parameter describing the closest distance between a source and a particle. We<br />
obtained the slopes of each graph in figure 4.13 by linear fitting and the dependence of these slopes<br />
on b(Rp) 2 /(L + Rp) 3 as shown in figure 4.14. It is found that the argument of back stress proposed<br />
by Fisher et al ([Fisher et al. 53]) still holds in the case of moving dislocation line through two<br />
particles. The parameter c is around 3.45 for the case of no image stress and 4.43 when Gp = 4Gm,<br />
which means, based on their argument, that the effective distance of a stress source is shorter or<br />
the back stress is higher if the image stress is included.<br />
It is observed experimentally that all the dislocations left around the particles by the gliding dis-<br />
locations are not rigorously confined to a single glide plane, but are rather of the prismatic form<br />
([Humphreys & Martin 67]). If cross-slip is easy, a dislocation may overcome an obstacle in its<br />
glide plane by slipping on another slip plane, with the formation of long jogs. The simulations pre-<br />
(4.6)
4.2 A simple case of dislocation-particle interaction 113<br />
Shear stress increment (MPa)<br />
12<br />
10<br />
8<br />
6<br />
4<br />
2<br />
0<br />
0 1 2 3 4 5<br />
Number of Orowan loops<br />
Figure 4.13: Work hardening of alloy containing two particles of radius 0.131 µm(1), 0.262 µm(2),<br />
0.524 µm(3). τh − τys is plotted against number of Orowan loops around each particle, where τh,<br />
τ0 represents the hardening stress and the flow stress respectively.<br />
sented above to investigate the change of hardening stress have been done under the condition that<br />
the cross slip of dislocation is prohibited by artificially changing the cross slip parameters. When<br />
the normal conditions for cross slip are used, cross slip events have been observed. As an example<br />
for the particles of radius 0.262 µm, cross slip occurs if the number of the Orowan loops reaches<br />
four in case of no image stress and two in case of Gp = 4Gm. Considering that the back stress on<br />
the primary slip plane becomes higher as the accumulation of the Orowan loops proceeds, it is easy<br />
to cross slip to the secondary slip plane and cross slip again (double cross slip) into the primary<br />
plane to bypass the particle. Figure 4.15 shows the bypassing of a dislocation line by double cross<br />
slip. If the shear modulus of the particle is higher than that of the matrix, a high local stress is<br />
generated near the particle and the local event of cross slip is more probable due to the image force.<br />
This demonstrate the importance of including the image stress to investigate local events such as<br />
cross slip.
114 Dislocation-precipitate interactions<br />
Slope<br />
2<br />
1.8<br />
1.6<br />
1.4<br />
1.2<br />
1<br />
0.8<br />
0.6<br />
0 0.02 0.04 0.06 0.08 0.1 0.12<br />
b(Rp ) 2 /(L+2Rp ) 3<br />
Figure 4.14: The slope of fitting line in figure 4.13 vs. bR 2 p/(L + Rp) 3 . ∗ : ∆G = 0, × : ∆G = 3Gm.<br />
Figure 4.15: Bypassing of particles by double cross slip of dislocation line. Dislocation initially<br />
glides on the slip system of (111)[1-10] and changes the system on (11-1)[1-10] and then comes back<br />
to initial slip system.
4.2 A simple case of dislocation-particle interaction 115<br />
4.2.5 Discussion<br />
In this work, we studied the effect of a difference in shear modulus on the flow stress and the<br />
subsequent hardening stress using the <strong>3D</strong> discrete dislocation dynamics code. The effect of ∆G on<br />
the flow stress can be summarized by τys ∝ Rp(∆G/Gm) α , where α is lower than 1 and Rp is the<br />
radius of particle. Because the range of the image stress is short, the maximum increment in the flow<br />
stress is only 6 percent in the case of ∆G/Gm = 5 comparing to no image stress case. Nevertheless<br />
the image stress increases as Orowan loops accumulate, resulting in a change of the work hardening<br />
rate. This effect is due to the fact that the image stress fields are the sum of interactions of a<br />
particle and each dislocation present around the particles. As slip accumulates, the dislocation<br />
line feels an additional image stress field coming from the interaction of the residual loops and the<br />
particles. The first order approximation on the work hardening of Fisher et al ([Fisher et al. 53])<br />
is found to be valid even in the simple configuration of two particles and one dislocation line. The<br />
effect of the image stress is that the effective distance of a stress source becomes shorter or the back<br />
stress becomes larger. If dislocation cross slip is allowed in the code, it has been observed that a<br />
dislocation can avoid an obstacle in its glide plane by cross slip into another slip plane. The back<br />
stresses on the glide plane due to the Orowan loops trigger the cross slip event. If the image stress<br />
is included, the cross slip probability increases. The image stress around the particle is large enough<br />
to affect local events such as cross slip.<br />
However, the computation time and effort are too demanding to include the effect of image stress<br />
on simulations of alloy containing a large number of particles. The number of elements used here<br />
in the simple situation of two particles is already about 5000 20-nodes elements. An approximate<br />
way to include the effect of image stress is to introduce an effective radius which can represent<br />
the difference in shear modulus. That way, the facets obstacles alone can be used to reproduce<br />
the precipitate hardening, so that the finite element coupling is no more needed. For example, in<br />
the case of ∆G = 3Gm, the average radius of the first trapped loop is 0.272 µm comparing to<br />
0.264 µm for the case of ∆G = 0. Hence, the difference in shear modulus changes the effective<br />
particle radius by only a few percent. Nevertheless the stress field generated by a second phase<br />
particle is increasing as slip accumulates and the image stress field turns out to be crucial to predict<br />
work hardening magnitude. This problem can then be treated using an empirical solution of the<br />
image stress generated by the interaction between several dislocations and a particle.
116 Dislocation-precipitate interactions<br />
4.3 Fatigue simulations of materials hardened by particles<br />
4.3.1 Motivation and review of literatures<br />
Fatigue in single-phased metals<br />
Strain is usually localized in single-phased metals submitted to cyclic deformation. The imposed<br />
plastic strain amplitude is accommodated by high local strains in strain localization zones called<br />
persistent slip bands (PSBs).<br />
The strain localization results in persistent slip markings (PSMs) at the specimen surface ([Man et al. 02]).<br />
The irreversible character of slip inside PSBs are known to generate permanent surface steps. After<br />
numerous experimental observations, it is generally agreed that fatigue crack initiates at the PSMs<br />
([Mughrabi 85], [Suresh 98]) along the individual PSBs. Fatigue life is thus largely dominated<br />
by the irreversibility of the slip in the PSBs and the associated surface step.<br />
Existing crack initiation models can be categorized in (i) crack initiation due to a surface step larger<br />
than a critical size, (ii) crack initiation due to local decohesion of crystal planes. Understanding of<br />
the intrinsic PSB microstructure is therefore crucial to establish such models.<br />
Transmission electron microscopy (TEM) are used to examine the dislocation microstructure in-<br />
volved in PSBs, and to understand the specific role of dislocations in cyclic deformation. Surface step<br />
displacements can be measured by atomic force microscopy (see for example, [Risbet et al. 03]).<br />
Fatigue in precipitation-hardened materials<br />
Multi-phase materials which contain precipitates often show good static strength compared to single-<br />
phase materials. Under cyclic loading conditions, however, precipitation-hardened materials do not<br />
always insure better fatigue properties.<br />
Typical cyclic properties of materials containing shearable and non-shearable particles are shown in<br />
Fig. 4.16 ([Gerold & Steiner 82]). The cyclic hardening behavior is shown as a function of the<br />
cumulative plastic shear strain for various particle sizes. Fig. 4.16(a) demonstrates that specimens<br />
containing shearable particles often suffer severe softening and even early fatigue failure. Large<br />
cyclic softening is observed after an initial strong hardening up to a maximum shear stress: the<br />
softening rate increases with the particle sizes, and peak-aged alloys (74 Å) show the largest cyclic<br />
softening. In the case of non-shearable particles (Fig. 4.16(b)), the rate of hardening and the stress<br />
drop decreases as the particle radius increases and the shear stresses are saturated.<br />
A few of the characteristic fatigue properties observed in experiments are outlined below for each
4.3 Fatigue simulations of materials hardened by particles 117<br />
(a) Underaged specimens (Shearable particles) (b) Overaged specimens (Non-shearable particles)<br />
Figure 4.16: Cyclic hardening and softening of aged Cu-2at%Co single crystals<br />
case ([Mughrabi 83]).<br />
• Shearable particles<br />
After an initial hardening stage, the cyclic strain becomes localized into persistent slip bands.<br />
A drastic cyclic softening related to the destruction of the precipitation hardening in the PSBs<br />
leads to the early initiation of shear-type fatigue cracks at the PSBs surface intersection.<br />
• Non-shearable particles<br />
The cyclic softening is strongly reduced and the cyclic deformation behavior is much more<br />
stable. Non-shearable particles produce more homogeneous straining.<br />
Numerical simulations of fatigue tests<br />
The dynamical features of the dislocations inside the PSBs during the cyclic deformation are not<br />
easily accessible by experimental observations, e.g. TEM. It is due to the fact that the stresses<br />
are removed during TEM observations, which makes the observed dislocation microstructure to be<br />
different from the microstructure under stresses. Besides, the free surface effects are not negligible.<br />
Another difficulty arises when relating the details of the formation of the surface steps directly<br />
with the dislocation microstructure inside the grains, since the two experiments are often performed<br />
independently, and sample preparation methods are usually destructive. Thus, a complete and<br />
comprehensive scheme for fatigue crack initiation is still missing.<br />
The development of the DDD method and the increase of the computer capabilities enable simula-
118 Dislocation-precipitate interactions<br />
tions to provide crucial information concerning the formation of slip bands. Numerical simulations<br />
make it now possible to observe the details of the PSB formation, and to investigate the relation<br />
between surface steps and the corresponding dislocation microstructure. This knowledge would help<br />
to understand better crack initiation mechanisms and to build a more elaborate fatigue life model.<br />
Scope of this section<br />
The performance of the new parallel DDD program (Chapter 3) makes it feasible to simulate dislo-<br />
cations interacting with thousands of precipitates. Fatigue tests of precipitation-hardened material<br />
are simulated in <strong>3D</strong>. The fatigue simulations are similar to the work of [Déprés 04] developed in the<br />
case of 316L stainless steel. The effects of shearable and non-shearable particles on the formation of<br />
PSBs are studied. Dislocation mechanisms for PSBs formation are detailed and some of numerical<br />
results are compared with experimental observations.<br />
4.3.2 Description of the simulation method<br />
Simulation volume geometries<br />
Cylindrical grain geometry has been adopted for the shape of the simulated volume. The volume<br />
is assumed to be a surface grain of a fatigue tested specimen, i.e. the volume consists of one free<br />
surface and grain boundaries. The cylindrical volume is represented by 20 facets as shown in Fig.<br />
4.18(a). The free surface is represented by assigning zero strength to the top facets (see Sec. 2.4.2),<br />
thus dislocations can escape through that surface. All the other facets act as strong obstacles to<br />
the dislocation motion as if for highly disordered grain boundaries.<br />
A virtual volume is prepared on top of the free surface to keep track of the dislocations exiting<br />
the simulated crystal volume (see Fig. 3.21(b)). This virtual volume and virtual dislocations are<br />
introduced to compute deformations of the free surface as will be detailed in Sec. 4.3.5. The virtual<br />
dislocations are set to have no effects on dislocations inside the simulation volume and no return<br />
into the crystal simulation volume is authorized.<br />
The normal vector of the top facet is taken as [110]. The diameter of the cylinder is 10 µm and the<br />
height is 5 µm. The image forces due to the free surface are not taken into account in this work.<br />
Materials parameters<br />
The material’s parameters used in this simulations are those of nickel as listed in Table 4.1.
4.3 Fatigue simulations of materials hardened by particles 119<br />
Poisson’s ratio Shear modulus Burgers vector<br />
magnitude<br />
Activation vol-<br />
ume<br />
Viscous drag co-<br />
efficient<br />
Threshold stress<br />
ν G(GPa) b(Å) (V/b 3 ) B(10 −5 P as) τIII(MPa)<br />
0.276 94.7 2.5 2117 1.06 51.2<br />
<strong>3D</strong> particle arrangement<br />
Table 4.1: Mechanical and microscopic parameters of nickel<br />
A cylindrical volume containing random distributed particles is constructed as follows. For sim-<br />
plicity, the particles are assumed to have the same radius rp and the associated volume fraction is<br />
vf .<br />
Step 1 Preparing closed packed spheres (Fig. 4.17(a))<br />
Close packed spheres of an arbitrary radius r are constructed in a larger sphere (radius R).<br />
The center of each sphere of radius r is assumed to be the nucleation site of each particle,<br />
and each particle gets their material from the volume of sphere r during the Ostwald ripening<br />
process.<br />
Step 2 Adjusting the volume fraction<br />
The radii of all spheres are reduced by a common factor while their locations remain un-<br />
changed. The factor is given so that the volume fraction of the shrunken spheres is equal to<br />
vf .<br />
Step 3 Adjusting the radius of particles (Fig. 4.17(b))<br />
The radius of the shrunken spheres in Step 2 is scaled to rp, and the coordinates of the centers<br />
are scaled as well.<br />
Step 4 Cutting the cylindrical volume (Fig. 4.17(c))<br />
A cylindrical simulation volume is placed at the center of the outer sphere, and spherical<br />
particles situated inside the cylinder are selected.<br />
In this work, ’Step 1’ is achieved by successive trials of putting spheres of radius ’r’ in the sphere<br />
of radius ’R’. Subsequent trials are accepted only if the new sphere is not intersecting with spheres<br />
already in the volume. Although this method does not generate closely packed arrangement of<br />
particles, the resulting particle arrangement shows a purely random arrangement. Bi-modal size
120 Dislocation-precipitate interactions<br />
(a) Randomly placed spheres<br />
Volume of interest, ri<br />
Particle, rp<br />
Simulation volume<br />
(b) Adjusting the radius of particles (c) Selecting spheres inside the<br />
cylindrical volume<br />
Figure 4.17: Construction of a randomly distributed configuration of particles in the cylindrical<br />
simulation volume (Examples of bimodal size distribution case)<br />
distributions (see Sec. 4.3.6) are constructed using the same procedure except that two radii of<br />
spheres are placed in ’Step 1’ as shown in Fig. 4.17(a).<br />
Radius and volume fraction of particles<br />
Two cases of particle radius, rp = 160 nm and 400 nm, are considered. The volume fraction vf is<br />
fixed to 14% for all the cases. The number of particles generated in the cylindrical volume by the<br />
procedure above is 2510 for rp = 160 nm and 161 for rp = 400 nm case .<br />
Each individual particle is constructed using two pyramids attached at the bottom 3 in an effort<br />
to reduce the number of nodes and facets constituting the particles (reducing the computation<br />
load). The cylindrical simulation volumes are shown in Fig. 4.18, which contain (a) 161 particles<br />
of rp = 400 nm and (b) 2510 particles of rp = 160 nm respectively.<br />
The strength of a particle<br />
Particles are assumed to act as geometrical barriers with a pre-defined strength to the dislocation<br />
motion. The image forces due to the elastic modulus difference are not computed and no stress<br />
fields around particles are considered for the simplification of computing.<br />
The strength of a particle decreases as the particle is sheared by dislocations. This is due to both<br />
the decrease of the effective particle size on the glide plane and the loss of coherency for ordered<br />
precipitates ([Stoltz & Pineau 78]). The evolution of particle’s strength is illustrated in Fig.<br />
4.19(a) for the case where a particle is sheared by successive passages of dislocations in the same<br />
3 One particle involves thus six facets and five nodes.
4.3 Fatigue simulations of materials hardened by particles 121<br />
(a) Particles of rp = 400 nm and vf = 14% (b) Particles of rp = 160 nm and vf =<br />
Figure 4.18: Cylindrical simulation volume containing randomly distributed particles of (a) rp =<br />
400 nm and vf = 14% (b) rp = 160 nm and vf = 14%<br />
Strength of particle<br />
(a) Geometrical effect<br />
Number of<br />
dislocation passage<br />
14%<br />
Strength of particle<br />
(b) Chemical effect<br />
Figure 4.19: Evolution of particle’s strength due to shear-off by dislocation passages<br />
Loss of strength<br />
Number of<br />
dislocation passage<br />
glide plane. Fig. 4.19(b) illustrates that a particle may loose its strength completely before being<br />
totally sheared off due to the surface energy increase and the loss of coherency induced by the<br />
dislocations random chop-up.<br />
In this work, the particle’s strength (or facet’s strength) is decreased linearly with each event of<br />
dislocation passage through a given particle’s facets. As a first order approximation, the strength<br />
of the facet τfacet (see Sec.2.4.2) is decreased linearly from the initial strength by τfacet/(2rp/b)<br />
whenever a dislocation penetrates the facet as shown in Fig. 4.20 4 . The facet strength is set to<br />
zero after a certain number of passages of dislocations to represent the chemical effect shown in Fig.<br />
4.19(b).<br />
4 The magnitude of the strength drop is from the assumption that a particle looses its strength after 2rp/b of<br />
dislocations passages, which corresponds to complete shear-off of the particle as sketched in Fig. 4.19(a)
122 Dislocation-precipitate interactions<br />
Strength of particle<br />
Initial strength,<br />
τ<br />
∗ facet<br />
τ facet<br />
τfacet Slope=<br />
2ri/b<br />
Number of<br />
dislocation passage<br />
Figure 4.20: Evolution of facet’s strength with dislocation passages<br />
Particles of radius 160 nm are assumed to be easily shearable, and the initial strength of facets is<br />
defined as 292 MP a and the final strength τ ∗ facet<br />
being 162 MP a. Particle of radius 400 nm are<br />
assumed to be non-shearable or difficult to be sheared by using the initial strength being 7310 MP a.<br />
The initial configuration<br />
The initial dislocation microstructure of all the simulations is composed of four Frank-Read sources,<br />
in the form of pinned dislocation segments. All the Frank-Read sources are of the edge-type with<br />
the Burgers vector a<br />
2 [¯1¯10] on the slip plane (¯11¯1) (system 7 in Table 2.1). It should be noted that<br />
there is no dislocation nucleation around the particles and also that no dislocations are punched in<br />
from the free surface.<br />
The loading conditions<br />
Fatigue simulations are performed under a plastic strain control with a fully symmetrical push-<br />
pull loading ratio (ɛmax p /ɛmin p = −1), and an applied plastic strain amplitude △ɛp = 1 × 10⁻³ . In<br />
DDD simulations, only stresses can be applied. Imposed plastic strain conditions are achieved by<br />
monitoring the total slip accumulated in all the active slip systems. The applied stresses then are<br />
increased or decreased by comparing the resulting plastic strain to the pre-selected strain level.<br />
In the fatigue simulations, the plastic strain rate is monitored at each time step. The applied stress<br />
is stepwise increased by 1 MP a if the plastic strain rate is lower than the pre-selected minimum<br />
plastic strain rate, 10 −7 ((1) in Fig. 4.21). The load is kept constant in the case that the plastic
4.3 Fatigue simulations of materials hardened by particles 123<br />
dλ<br />
λ k<br />
εp VM<br />
εp VM<br />
εp max<br />
εp min<br />
1 2 3 4<br />
Figure 4.21: Quasi-static loading condition: stepwise increment and decrement of the applied<br />
stresses<br />
strain rate is between the minimum and the maximum strain rate ((2) in Fig. 4.21), until the<br />
dislocation microstructure is in equilibrium with the external loading. This condition is achieved<br />
by keeping the load constant while performing discrete time steps until the resulting plastic strain<br />
rate becomes lower than the pre-selected minimum strain rate ((3) in Fig. 4.21). The applied stress<br />
is decreased by 1 MP a if the plastic strain rate is higher than the pre-selected maximum plastic<br />
strain rate, 10 −4 ((4) in Fig. 4.21).<br />
4.3.3 Evolution of the dislocation microstructure during the fatigue tests<br />
Pas k<br />
Pas k<br />
Pas k<br />
General features of the formation of the dislocation microstructure<br />
The initial Frank-Read sources begin to expand and generate dislocation loops as the applied stresses<br />
are increased during the first quarter cycle. Parts of the loops are leaving the simulation volume<br />
through the free surface, which prints steps on the free surface as will be detailed in Sec. 4.3.5.<br />
The other parts are piled up along the strong grain boundaries. The screw part of dislocation lines<br />
tends to cross slip owing to the back stresses from the stored dislocations. The cross slip mechanism<br />
spreads slip lines over the whole simulation volume. Particles affect both the dislocation mobility<br />
and the cross slip probabilities which result in quite different microstructures as compared with the<br />
single-phased material case.
124 Dislocation-precipitate interactions<br />
2<br />
3 4<br />
1<br />
Figure 4.22: Evolution of the dislocation microstructure by the cyclic loading (Case of rp = 400 nm).<br />
As the sign of the applied stresses is reversed, the motion of the dislocations is reversed likewise. The<br />
initial dislocation microstructure, however, can not be completely restored due to the irreversible<br />
character of slip. Slip irreversibility is caused by the cross slip, the line reconnection (colinear<br />
junction) and the elimination of dislocation lines by the free surface. It increases with the number<br />
of fatigue cycles.<br />
These general features are illustrated in Fig. 4.22 using the figures taken from the rp = 400 nm<br />
case. The evolution of the dislocation structures is shown with the stress-strain curve of the first<br />
fatigue cycle 5 . The initial expansion of the Frank-Read sources (1) is followed by cross-slip which<br />
spreads slip through the entire simulation volume (2), and by subsequent changing of the sign of<br />
the applied plastic strain, specific dislocation microstructure forms (3)-(4), and even after one cycle<br />
the microstructure (5) is quite different from the initial one (1).<br />
5 Compressive plastic strain is applied first.<br />
5
4.3 Fatigue simulations of materials hardened by particles 125<br />
Dislocation density evolution<br />
The evolution of the total dislocation density, ρtot is monitored for the case of the volume contain-<br />
ing particles with rp = 160 nm , particles with rp = 400 nm and no particles during the cyclic<br />
deformation. ρtot is plotted as a function of the accumulated cyclic Von Mises strain in Fig. 4.23.<br />
The dislocation densities quickly increase and fluctuate according to the cyclic deformation in all<br />
the cases owing to the periodically vanishing cyclic load. Here the saturation of the dislocation<br />
densities is not observed because of the relatively small number of fatigue cycles have been per-<br />
formed (close to 3 cycles 6 for rp = 160 nm and 5 cycles for rp = 400 nm). It is expected, however,<br />
that the dislocation densities would gradually saturate as the fatigue cycles proceed as observed by<br />
[Déprés et al. 04].<br />
The simulation results show that<br />
rp=160 nm<br />
1. ρtot rp=400 nm<br />
> ρtot No particle<br />
> ρtot 2. The rates of the dislocation accumulation after each fatigue cycle are of the same order as the<br />
total densities.<br />
After three fatigue cycles (around ɛ V M 0.006), ρ rp=160 nm<br />
tot<br />
and six times than ρ<br />
No particle<br />
tot<br />
.<br />
is three times larger than ρ rp=400 nm<br />
tot<br />
The simulation volume containing particles with rp = 160 nm has a high resistance related to the<br />
limited glide area per slip plane. This effect is due to the large number of particles that are supposed<br />
to be shearable. To accommodate the applied plastic strain with limited dislocation glide, it is nec-<br />
essary to have a higher density of dislocations. After reversing the stresses, the dislocations still<br />
have difficulties to find an easy glide path and to annihilate each other, thus most of the dislocations<br />
are left inside the volume. For these reasons, it can be deduced that shearable particles give rise to<br />
a high slip irreversibility.<br />
In the case of particles with rp = 400 nm, dislocations have a higher chance to find an easy glide<br />
path because there are fewer particles in the volume. Moreover the particles are more effective<br />
in spreading dislocations through the simulation volume by cross slip because they are not easily<br />
shearable and involved with Orowan loops. The applied plastic strain thus can be accommodated<br />
with a lower dislocation density, and the rate of the dislocation accumulation reduces compared<br />
to the shearable particle case, since it is easier to move reversely by annihilating Orowan loops<br />
6 The simulation has to be stopped just before ɛp reaches zero near 3 fatigue cycles because of the large number of<br />
segments involved
126 Dislocation-precipitate interactions<br />
ρ[m -2 ]<br />
1.8e+13<br />
1.6e+13<br />
1.4e+13<br />
1.2e+13<br />
1e+13<br />
8e+12<br />
6e+12<br />
4e+12<br />
2e+12<br />
0<br />
0.0e0 2.0e-3 4.0e-3 6.0e-3 8.0e-3 1.0e-2 1.2e-2<br />
ε VM *<br />
r p =160nm<br />
r p =400nm<br />
No particle<br />
Figure 4.23: Evolution of the total dislocation density of the volume containing rp = 160 nm,<br />
rp = 400 nm and no particles<br />
left around the particles from the forwarding glide. Thus the irreversibility of slip is significantly<br />
reduced in the case of non-shearable particles.<br />
Strain localization kinematics<br />
In the preceding section, it is shown that the shearable particles favor high ρtot. The next question<br />
to address is whether the simulation can reproduce the localization of the plastic deformation or<br />
strain. Fig. 4.24 shows the dislocation microstructure formed after 3 cycles in the rp = 160 nm<br />
case and after 5 cycles in the rp = 400 nm case, along [110] direction. The figures illustrate clearly<br />
that the dislocation structures are highly heterogenous and intense slip bands are formed on the<br />
primary slip plane due to the cyclic loading. This result is consistent with experimental observations<br />
([Calabrese & Laird 74]). Plastic strain localization is believed to cause fatigue damage, since<br />
the local plastic strain has to be high enough to accommodate all the applied plastic strain. This<br />
process can eventually lead to fatigue crack nucleation.<br />
To demonstrate the statistics of the PSBs formation quantitatively, the spatial distribution of the<br />
dislocation densities is computed as follows at each time step k. The cylindrical simulation volume
4.3 Fatigue simulations of materials hardened by particles 127<br />
(a) Particles with rp = 160 nm (b) Particles with rp = 400 nm<br />
Figure 4.24: Localization of slip by forming intense slip bands<br />
is sliced into finite layers along the slip planes normal [¯11¯1]. Dislocation densities are then computed<br />
in each layer . The heterogeneity of the dislocation density can be shown by plotting the calculated<br />
dislocation densities of each layer along the reference axis [¯11¯1].<br />
Fig. 4.25 shows the evolution of such spatial dislocation density distributions. Three axis of the<br />
coordinate system correspond to the dislocation density, the position of each layer and the cycle<br />
number.<br />
From the figure, the general features of the formation of dislocation microstructure can be confirmed,<br />
i.e. the first increase of the applied plastic strain spreads dislocations over the simulation volume<br />
in all the cases. In the next cycles, the heterogeneous dislocation structure forms and certain zones<br />
accumulate a high dislocation density.<br />
The detailed observation of Fig. 4.25 reveals that the particles affect the slip localization in several<br />
ways :<br />
1. The width wdisl of the dislocation distributions over the simulation volume is the largest in<br />
the case rp = 400 nm (non-shearable particles) and the smallest in the case rp = 160 nm<br />
rp=400 nm<br />
(shearable particles), i.e. wd No particle<br />
> wd > w<br />
rp=160 nm<br />
d<br />
rp=160 nm<br />
2. The maximum local dislocation densities (ρmax) are in the following order, ρmax ρ rp=400 nm<br />
max<br />
> ρ<br />
No particle<br />
max<br />
.<br />
rp=400 nm<br />
3. The intense slip band width is smaller in the case of shearable particles, i.e. db d rp=160 nm<br />
b .<br />
.<br />
><br />
>
128 Dislocation-precipitate interactions<br />
(a) Particles with rp = 160 nm (b) Particles with rp = 400 nm<br />
(c) No particle<br />
Figure 4.25: Evolution of slip localization<br />
4. There is no clear dislocation localization up to five cycles in the case containing no particles. In<br />
the other cases, dislocation localization has occurred, and at leat one high dislocation density<br />
peak is present through the whole simulated fatigue cycles.<br />
Item 1 demonstrates that non-shearable particles promote the cross-slip due to the back stresses of<br />
Orowan loops around the particles, and the dislocations easily sweep a large area of the simulation<br />
volume as a result. Item 2 and 3 are consistent with the experimental observations, according<br />
to which persistent slip bands (PSBs) are much thinner if particles are shearable, and the local<br />
plastic strain becomes higher as the PSBs gets narrower ([Lee & Laird 83]). Fig. 4.26 shows<br />
some of the experimental data of the PSB thicknesses and the related local plastic shear strain<br />
([Mughrabi 83]). Item 4 can be related to the early initiation of fatigue crack in the case of shear-
4.3 Fatigue simulations of materials hardened by particles 129<br />
Figure 4.26: Relation between the local plastic shear strain amplitude and the thickness of PSBs<br />
able particles (see Fig. 4.16(a)). It is also interesting to note that the number of intense slip bands<br />
is only one in the case of shearable particles but second intense slip band begins to form in the<br />
case of non-shearable particles. This is related to the experimental observation that the number of<br />
cycles till crack initiation is inverse to the average slip band distance ([Graf & Hornbogen 78]),<br />
although higher number of fatigue cycles are necessary to confirm it.<br />
The speed of the slip localization can be quantified by the standard deviation of the spatial dislo-<br />
cation distribution curves at each time step, because the standard deviation becomes larger as the<br />
dislocation structure gets more heterogeneous. The standard deviation at time t is computed as<br />
follows.<br />
σρ(t) =<br />
<br />
1<br />
Dg<br />
Dg<br />
0<br />
ρ(t, x (s) ) − ¯ρ(t) 2 dx (s) (4.7)<br />
¯ρ(t) is the average dislocation density, and Dg is the size of the simulation volume.<br />
Fig. 4.27 shows the evolution of σρ(t) for each case, and it shows σρ(t) rp=160 nm > σρ(t) rp=400 nm ><br />
σρ(t) No particle . It can be seen that both the intensity and the speed of the slip localization is the<br />
highest in the case with shearable particles.<br />
Details of the intense slip band<br />
The intense slip bands of the rp = 160 nm case (shearable particles) are shown in Fig. 4.28. The<br />
dislocation microstructure is taken at a cycle number 3 with ɛp ∼ 0. Fig. 4.28(a) shows a <strong>3D</strong> image<br />
of the dislocation structure viewed from the orientations normal to [1¯11] (slip plane normal), [110]<br />
(Burgers vector) and [¯112].
130 Dislocation-precipitate interactions<br />
Standard deviation<br />
3e+13<br />
2.5e+13<br />
2e+13<br />
1.5e+13<br />
1e+13<br />
5e+12<br />
0<br />
0.0e0 2.0e-3 4.0e-3 6.0e-3 8.0e-3 1.0e-2 1.2e-2<br />
ε VM *<br />
r p =160nm<br />
r p =400nm<br />
No particle<br />
Figure 4.27: Evolution of the standard deviation σρ(t) (Eq. 4.7) in different simulations<br />
In the plane perpendicular to the primary slip plane (normal to [110]), intense slip bands can be<br />
seen clearly in the form of thin and compact dislocation walls. In the plane parallel to the primary<br />
slip plane (normal to [1¯11]), the dislocation structure is quite heterogeneous, and shows ladder-like<br />
structures along the Burgers vector direction. Dislocation debris and small loops are visible between<br />
the particles. Fig. 4.28(b) shows the isolated intense slip band, and considerable amounts of residual<br />
dislocations are clearly visible. It should be noted that the residual dislocation tangles are different<br />
in size compared to those in the single-phased material case, in which large tangles are observed<br />
together with ladder-like slip bands ([Obrtlik et al. 94], [Déprés et al. 04]).<br />
Small tangles between particles in the case of shearable particles are also observed in experimental<br />
data. Fig. 4.29 shows a dislocation microstructure of fatigue tested Inconel 718 observed in TEM.<br />
Although the material characteristics are quite different 7 , this micrograph clearly shows small high<br />
density tangles of primary residual dislocations.<br />
Fig. 4.30 shows the intense slip bands of non-shearable particle case (rp = 400 nm) at cycle number<br />
5 with ɛp = 0. The wall thickness of the PSB is much larger than the previous case, and the<br />
dislocation densities are variable in the band seen along [110] direction. In the plane normal to<br />
[1¯11], several Orowan loops and dense dislocation tangles are formed around the particles. In the<br />
7 Particle radius=20 − 40 nm, Grain size=20 − 40 µm, Volume fraction> 15%
4.3 Fatigue simulations of materials hardened by particles 131<br />
(a) <strong>3D</strong> image of intense slip bands (b) Isolation of intense slip band<br />
Figure 4.28: Details of intense slip band of the shearable particle case(rp = 160 nm). Three layers<br />
of thickness 300 nm are assembled for <strong>3D</strong> image in (a)<br />
Figure 4.29: TEM micrograph of fatigue tested Inconel 718 up to 10,000 cycles
132 Dislocation-precipitate interactions<br />
(a) <strong>3D</strong> image of intense slip bands (b) Isolation of intense slip band<br />
Figure 4.30: Details of intense slip band of the non-shearable particle case(rp = 400 nm). Three<br />
layers of thickness 300 nm are assembled for <strong>3D</strong> image in (a)<br />
space between the particles, however, long dislocation lines are clearly visible and the dislocation<br />
distribution is rather homogeneous as illustrated in Fig. 4.30(b). It is also observed that some of<br />
the complex dislocation structures are formed separated by the same distance as that of between<br />
two close particles.<br />
Intense slip band formation mechanism<br />
In the case of shearable particles (rp = 160 nm), the dislocation density increases rapidly since<br />
dislocations possess a high degree of irreversibility (see Fig. 4.23). The characteristic of this con-<br />
figuration is that there is a limited number of easy glide paths for dislocations. Thus, slip bands<br />
would form along one of the easy glide paths whose thickness is usually limited (order of rp). Upon<br />
load reversal, double cross-slipped dislocations can glide in the opposite direction along path close<br />
to the initial glide path because (i) cross-slipped dislocations also have a limited glide distance and<br />
(ii) the particles in the initial path loose part of their initial strength. This would form closely<br />
spaced edge dipoles, so called vein structures. As the cycling proceeds, the subsequent cross-slipped
4.3 Fatigue simulations of materials hardened by particles 133<br />
log(frequency)<br />
10 0<br />
10 −1<br />
10 −2<br />
10<br />
160 180 200 220 240 260 280 300<br />
−3<br />
τ [MPa]<br />
facet<br />
Figure 4.31: Repartition by the particle strength<br />
screw dislocations due to the cyclic loading react with the edge dipoles and produce prismatic<br />
loops aligned in the Burgers direction or helicoidal structures as observed in single-phased materi-<br />
als ([Li & Laird 94], [Déprés et al. 04]) but with a much smaller size. The prismatic loops can<br />
move along their glide cylinder, and form ladder-like structures. The repeated motion of interfacial<br />
dislocations with the cycles will eventually make particles at the PSBs edges to loose their strength,<br />
and persistent bands will be formed at this place. This process is observed numerically in the sim-<br />
ulations.<br />
Fig. 4.31 shows the statistical distribution of the facet’s residual strength after 3 cycles. The facet<br />
strength are distributed as follows: most of the facets are not sheared and keep their initial strength<br />
(right peak) and a small portion of the facets are completely sheared (left peak). The spatial distri-<br />
bution of the facet’s strength is shown in Fig. 4.32(a) by superimposing colors corresponding to the<br />
magnitude of strength for each facet. A clear channel of sheared particles is visible and its position<br />
corresponds exactly to that of the intense slip band. The dislocation structure is overlapped in<br />
Fig. 4.32(b). It should be noted that the particles near the intense slip band also loose strength,<br />
which possibly demonstrates that there exist interfacial dislocations at the periphery of the slip<br />
band, which move rather freely according to the cyclic load changes. Clear channel is also observed<br />
experimentally in which no dislocations and no particles are visible as shown in Fig. 4.33.<br />
In the case of non-shearable particles, the accommodation of the applied plastic strain is much easier<br />
because dislocations can move over a relatively long distance on the glide plane. During the first<br />
few cycles, the particles are bypassed by the Orowan mechanism. Glissile loops are accumulated<br />
around the particles. When the critical stress is reached, the screw portions of the loops change
134 Dislocation-precipitate interactions<br />
(110)<br />
(a)<br />
τfacet[MPa]<br />
300<br />
280<br />
260<br />
240<br />
220<br />
200<br />
180<br />
160<br />
Figure 4.32: Spatial distribution of particle strength<br />
Figure 4.33: Clear channel containing no particles and no dislocations (Inconel 718)<br />
(b)<br />
τfacet[MPa]<br />
300<br />
280<br />
260<br />
240<br />
220<br />
200<br />
180<br />
160
4.3 Fatigue simulations of materials hardened by particles 135<br />
σ VM [MPa]<br />
300<br />
200<br />
100<br />
0<br />
-100<br />
-200<br />
-300<br />
-6.0e-4 -4.0e-4 -2.0e-4 0.0e0 2.0e-4 4.0e-4 6.0e-4<br />
ε VM<br />
Figure 4.34: Typical stress-strain curve coming from the simulations (No particles case)<br />
their glide plane by cross slip, which contribute both to propagate slips in the simulation volume<br />
by generating dislocations in the secondary plane, and also to the formation of <strong>3D</strong> loops around the<br />
particles. Interactions between these loops and the dislocations in the secondary plane eventually<br />
form dense tangles around the particles. As the cyclic deformation proceeds, the tangles around<br />
the particles act as pinning points of dislocations moving between the particles. It favors thus the<br />
formation of dislocation dipoles which are linked by two near particles. The cutting of these dipoles<br />
by freely gliding dislocations, then generate stable dislocation structures. The subsequent formation<br />
of dipoles between the particles and the dislocation interactions make dense dislocation structures<br />
to form between the particles. This mechanism explains the dense dislocation tangles observed<br />
around the particles and complex dislocation structures between pairs of closely spaced particles.<br />
4.3.4 Mechanical behavior<br />
Cyclic stress-strain relation<br />
A typical cyclic stress-strain curve is shown in Fig. 4.34 for the ’No particles’ case. The first<br />
quarter-cycle corresponds to the activation of the initial Frank-Read sources, which is the hardest<br />
part of the cycles.<br />
The cyclic response curves are shown in Fig. 4.35 for the case of rp = 160 nm (shearable), rp =
136 Dislocation-precipitate interactions<br />
Stress[MPa]<br />
500<br />
450<br />
400<br />
350<br />
300<br />
250<br />
r p =160nm, v f =14%<br />
r p =480nm, v f =14%<br />
r p =480nm, v f =8%<br />
No particles<br />
200<br />
0.0e0 2.0e-3 4.0e-3 6.0e-3 8.0e-3 1.0e-2 1.2e-2 1.4e-2<br />
Cumulative plastic strain<br />
Figure 4.35: Cyclic response for rp = 160 nm (vf = 14%) and rp = 400 nm (vf = 8% and 14%)<br />
compared with the single-phased material case<br />
400 nm (non-shearable) and the single-phased material case. The curves obtained with two different<br />
volume fractions (vf = 8, vf = 14%) are plotted for non-shearable particles.<br />
The initial shear stress amplitude is the highest in the case of shearable particles as expected and is<br />
the lowest in the single-phased material case. The simulation volumes containing the non-shearable<br />
particles show intermediate initial stress values, and the stress amplitude increases with the particle<br />
volume fraction.<br />
The short hardening stage is followed by a cyclic softening response in all the cases. The degree of<br />
softening is maximum for the shearable particle case, and increases as the volume fraction in the<br />
non-shearable particle case.<br />
4.3.5 Surface slip markings<br />
Surface displacement computation method<br />
Dislocations that leave the simulation volume print steps on the free surface. The computation of<br />
the surface steps can give valuable information concerning the fatigue life because it is believed that<br />
the fatigue cracks are initiated from these surface steps. In this section, the method to compute<br />
surface steps is presented.
4.3 Fatigue simulations of materials hardened by particles 137<br />
b<br />
P r i m a i r e<br />
Op<br />
D2<br />
Od<br />
D1<br />
D e v i e<br />
(a) Associated problem<br />
b<br />
d<br />
O<br />
b<br />
P r i m a i r e<br />
+...<br />
Op<br />
+<br />
+<br />
Od<br />
D e v i e<br />
∆<br />
(b) Systematic method<br />
Figure 4.36: Computation method of displacements associated with the general case of non-planar<br />
dislocation loops<br />
Displacements of closed loops can be computed by decomposing the loop into as many triangular<br />
dislocation loops as needed using the equations in Sec. 2.2.2. In the case that a part of a dislocation<br />
loop has changed its slip plane by cross slip, an additional operation is necessary [Déprés et al. 03].<br />
Fig. 4.36(a) shows a non-planar dislocation loop. Points Op and Od represent the common point to<br />
construct triangular dislocations in the primary and the cross-slip plane respectively. If triangular<br />
loops are constructed for each dislocation segment in both planes, the non-planar dislocation loop<br />
would miss two triangular loops (OpD2D1 and OdD1D2) as shown in Fig. 4.36(a). The displacement<br />
solution computed from the arbitrary dislocation segments (e.g. OpD1) would be wrong, since they<br />
are never canceled. To remove this artifact, once a segment is found to have a neighbor in a different<br />
plane, a supplementary triangular loop is constructed by three points: a common point (e.g. Op),<br />
the extreme point of the segment (e.g. D1) and the projection point of the common point along the<br />
glide axis (∆). Fig. 4.36(b) shows the procedure, which cancels the effect of the arbitrary segments<br />
generated in constructing triangular dislocation loops.<br />
In fatigue simulations, dislocations can leave the simulation volume. Thus some of the dislocation<br />
loops are cut and left open by the free surface, and the Barnett’s equations (Sec. 2.2.2) can no<br />
longer be used without a special treatment. The displacements of open loops can be solved by<br />
adding virtual dislocations outside the simulation volume ([Weygand et al. 02]). The simulation<br />
volumes are constructed by two distinct parts, one part is the crystal and the other is a virtual<br />
medium, containing the virtual segments as briefly introduced in Sec. 4.3.2. Dislocations are<br />
allowed to leave the crystal volume to the virtual medium in order to keep the dislocation loops<br />
closed. The dislocations however are not allowed to return back into the crystal volume from the<br />
b<br />
+<br />
d<br />
+<br />
O<br />
+...
138 Dislocation-precipitate interactions<br />
Figure 4.37: Examples of surface steps generated by the activation of a single Frank-Read source<br />
in the simulation volume<br />
virtual medium so that the motion of the dislocations in the crystal is not arbitrarily modified by<br />
the virtual dislocations. The activation of the Frank-Read source and the subsequent deformation<br />
of the free surface are shown in Fig. 4.37, which adopts the virtual medium method.<br />
Surface steps and associated dislocation structures<br />
Surface steps are computed and shown in Fig. 4.38(a) for the case of shearable particles after 3<br />
fatigue cycles and in Fig. 4.38(b) for the case of non-shearable particles after 5 fatigue cycles. The<br />
surface steps represent exactly the same characteristics of the associated dislocation structure. The<br />
surface markings are intensively confined in a narrow region in the case of shearable particles as the<br />
slip bands involved are narrow and contain a high density of dislocations (see Fig. 4.24(a)). The<br />
surface markings are dispersed over the free surface in case of non-shearable particles as the wall<br />
thickness of slip bands are relatively wider and there are more than one band inside the crystal as<br />
shown in Fig. 4.24(b).<br />
The differences in the surface markings for each cases can be seen clearly from one dimensional<br />
profiles along a probing line. This displaying method is similar as for experimental results obtained<br />
using atomic force microscopy (AFM). Fig. 4.39 shows such surface profiles along the direction<br />
normal to the primary plane, i.e. [1¯11]. As indicated in Sec. 4.3.3, the simulation of the shearable<br />
particle case has finished just before ɛp reaches zero near 3 fatigue cycles, thus the surface profile<br />
associated with a small plastic strain. The surface marking, however, is significantly wider in the<br />
case of non-shearable particles than in the case of shearable particles as indicated in Fig. 4.39.<br />
Detailed surface morphologies are computed on the surface at the exact location of the intense slip
4.3 Fatigue simulations of materials hardened by particles 139<br />
(a) Case of shearable particles (b) Case of non-shearable particles<br />
Figure 4.38: Surface steps of (a) the simulation volume containing shearable particles after 3 cycles<br />
and (b) the simulation volume containing non-shearable particles after 5 cycles<br />
Suface step (b)<br />
10<br />
5<br />
0<br />
−5<br />
Shearable particle<br />
Non−shearable<br />
particle<br />
−10<br />
0 1 2 3 4 5 6 7 8 9 10 11 12<br />
Probe distant (µm)<br />
Figure 4.39: One dimensional profiles of the surface steps along [1¯11] direction for the case of<br />
shearable particles (dashed curve) and non-shearable particles (solid curve)
140 Dislocation-precipitate interactions<br />
(a) Tongue-like surface slip markings in the case of<br />
shearable particles<br />
(b) Ribbon-like surface slip markings in the case<br />
of non-shearable particles<br />
Figure 4.40: Evolution of detailed surface morphologies computed on the surface of 500 nm width<br />
of (a) the shearable particle case after 1<br />
2<br />
and 4 1<br />
2 cycles<br />
and 2 1<br />
2<br />
cycles (b) the non-shearable particle case after 1<br />
2<br />
bands formed in the volume at ɛp = 0. Fig. 4.40 shows the evolution of the detail of the surface<br />
morphologies from (a) 1<br />
2<br />
4 1<br />
2<br />
cycle to 2 1<br />
2<br />
cycles in the case of sherable particles and (b) 1<br />
2<br />
cycle to<br />
cycles in the case of non-shearable particles. A close examination of these images shows that<br />
the tongue-like slip markings are associated with the intense slip bands in the simulation volumes<br />
containing shearable particles (see Fig. 4.28(b)) and the ribbon-like slip markings are associated<br />
with the intense slip bands of the non-shearable particle case (see Fig.b 4.30(b)). In the shearable<br />
particle case, prismatic loops aligned in the Burgers direction are responsible for the tongue-like slip<br />
markings. The ribbon-like slip markings are related to dislocation structures gliding between the<br />
particles. The length of the ribbon-like marking is closely related to inter-particle distance.<br />
4.3.6 Fatigue properties of materials containing particles with a bimodal size<br />
distribution<br />
Alloys which contain a bimodal size particle distribution are particularly interesting because of<br />
the optimized combination of fatigue properties, i.e. good strength (merit of underaged alloy as<br />
shown in Fig. 4.16(a) ) and cyclic stability (merit of overaged alloy as shown in Fig. 4.16(a)).<br />
Waspaloy ([Clavel & Pineau 82]) is one of the examples which have particles with a bimodal size<br />
distribution.<br />
Three bimodal cases are considered with the same volume fraction of particles vf = 14% but with<br />
different ratio between the number of large (rp = 400 nm) and small (rp = 160 nm) particles. The<br />
number of particles of each size is listed below for the three considered cases, and the simulation<br />
volume is shown in Fig. 4.41 for the ’Bimodal2’ case.
4.3 Fatigue simulations of materials hardened by particles 141<br />
(110)<br />
Unshearable<br />
Shearable<br />
partiicles (r=0.4µ m) partiicles (r=0.16µ m)<br />
Figure 4.41: The simulation volume which contains both rp = 160 nm and rp = 400 nm particles<br />
• Bimodal1 : rp = 160 nm, 2080 particles + rp = 400 nm, 31 particles<br />
• Bimodal2 : rp = 160 nm, 1456 particles + rp = 400 nm, 57 particles<br />
• Bimodal3 : rp = 160 nm, 772 particles + rp = 400 nm, 103 particles<br />
The same volume geometries and material properties are adopted for the three arrangements. The<br />
simulation box is taken as a cylindrical volume, and the particles of each size have the same initial<br />
and final strengths as before (see Sec. 4.3.2). The same loading condition as in the mono-modal<br />
cases is applied, i.e. △ɛp = 1 × 10 −3 and R = −1.<br />
The evolution of the total dislocation densities are compared with the case of the mono-modal size<br />
particles (rp = 160 nm) in Fig. 4.42(a). The total densities and the rates of the dislocation ac-<br />
cumulation decrease as the percentage of the large particles is increased. Fig. 4.42(b) shows that<br />
the slip localization retards with the percentage of large particles. It should be noted that the total<br />
dislocation densities and the slip localization kinetics of all the bimodal cases considered here lie<br />
between the two previously investigated mono-modal cases (see Fig. 4.23 and Fig. 4.27).<br />
A <strong>3D</strong> reoresentation of the dislocation structure is shown in Fig. 4.43(a) for the ’Bimodal2’ case<br />
after four fatigue cycles, and details of the associated intense slip bands are shown in Fig. 4.43(b).<br />
As compared with the mono-modal distribution case (rp = 160 nm, see Fig. 4.28(a)), the slip bands<br />
are more diffuse (the band thickness is larger and the local dislocation density is accordingly lower).<br />
The dislocation structure in the (1¯11) plane shown in Fig. 4.43(a) and the intense slip bands plotted
142 Dislocation-precipitate interactions<br />
ρ[m -2 ]<br />
2.5e+13<br />
2e+13<br />
1.5e+13<br />
1e+13<br />
5e+12<br />
r p =160nm<br />
Bimodal 1<br />
Bimodal 2<br />
Bimodal 3<br />
0<br />
0e0 2e-3 4e-3 6e-3 8e-3 1e-2 1e-2 1e-2 2e-2<br />
*<br />
εVM (a) Evolution of the total dislocation density<br />
Standard deviation<br />
3e+13<br />
2.5e+13<br />
2e+13<br />
1.5e+13<br />
1e+13<br />
5e+12<br />
r p =160nm<br />
Bimodal 1<br />
Bimodal 2<br />
Bimodal 3<br />
0<br />
0e0 2e-3 4e-3 6e-3 8e-3 1e-2 1e-2 1e-2 2e-2<br />
*<br />
εVM (b) Evolution of the standard deviation σρ(t) (Eq. 4.7)<br />
Figure 4.42: Effects of the percentage of large particles on the statistics of fatigue tests<br />
in Fig. 4.43(b) demonstrates that the structural characteristics from the two previous mono-modal<br />
cases coexist in the bimodal case: dense dislocation tangles as well as Orowan loops are observed<br />
around the large particles and ladder-like dislocation structures are formed along the Burgers vec-<br />
tor direction. Both tangles of residual dislocations and long dislocation lines with a relatively high<br />
mobility are visible.<br />
These results are consistent with the experimental observations which show a much more homoge-<br />
neous and stable slip mode than in the shearable particle cases ([Martin 80], [Edwards & Martin 82]).<br />
The effective dispersal of slip by the non-shearable particles can explain the formation of more ho-<br />
mogeneous slip mode.<br />
TEM micrographs of intense slip bands formed in fatigue tested Waspaloy are shown in Fig. 4.44.<br />
The positions of a few of the large particles are indicated to facilitate the visualization in Fig.<br />
4.44(b). Although there exists large discrepancy between the simulation and the experiments con-<br />
cerning the particle sizes and the magnitude of the applied plastic strain 8 , the micrographs simulated<br />
dislocation microstructure, i.e. dislocation tangles are formed around the large particles, residual<br />
dislocations are present between the particles (Fig. 4.44(b)) and slip bands are more diffuse com-<br />
pared to the shearable particle case (Fig. 4.44(a)).<br />
Clear channels of totally sheared particles are no more formed due to the effective dispersal of dis-<br />
location by the large particles. Fig. 4.45(a) shows the distribution of the residual strength of the<br />
small particles after seven fatigue cycles (’Bimodal3’ case). The final particle strength distribution<br />
8 Particle radius=15 nm and 80 nm, Grain size∼ 50 µm, Volume fraction> 40%, △ɛp = 10 −2
4.3 Fatigue simulations of materials hardened by particles 143<br />
(a) <strong>3D</strong> image of intense slip bands (b) Isolation of intense slip band<br />
Figure 4.43: Details of intense slip band of the ’Bimodal2’ case after four fatigue cycles<br />
(a) Slice normal to the primary plane (b) Slice parallel to the primary plane<br />
Figure 4.44: TEM micrographs of intense slip bands of fatigue tested Waspaloy
144 Dislocation-precipitate interactions<br />
log(frequency)<br />
10 0<br />
10 −1<br />
10 −2<br />
10 −3<br />
10<br />
160 180 200 220 240 260 280 300<br />
−4<br />
τ [MPa]<br />
facet<br />
(a) Repartition by the particle strength<br />
(110)<br />
(b) Spatial distribution of sheared particles<br />
Figure 4.45: Statistical and spatial distribution of the strength of small particles<br />
τfacet[MPa]<br />
is significantly broader as compared to the mono-modal case (see Fig. 4.31) between the initial and<br />
the final strength. The spatial distribution of the sheared particles in Fig. 4.45(b) also shows that<br />
the shearing-off of the small particles does not occur in a confined channel but rather in a more<br />
distributed area as compared to in Fig. 4.32(a).<br />
The addition of large particles decreases the degree of cyclic softening seen in the mono-modal case<br />
(rp = 160 nm), and the stress amplitudes of the bimodal cases lie between the two mono-modal<br />
cases presented before (rp = 160 nm and 400 nm) although the stress differences between the dif-<br />
ferent bimodal cases is rather small as shown in Fig. 4.46.<br />
The deformed surface corresponding to the ’Bimodal2’ case is shown in Fig. 4.47(a) after four<br />
fatigue cycles. As the related slip bands are dispersed in the volume, the steps spread over the<br />
free surface to a larger extent than those observed in the shearable particle case (Fig. 4.38(a)).<br />
In addition, the surface step morphologies in Fig. 4.47(b) are shifted from the tongue-like to the<br />
ribbon-like type, although with a lower extent than in the large particle mono-modal case (Fig.<br />
4.40).<br />
4.3.7 Summary<br />
The simulated fatigue properties of materials hardened by shearable and non-shearable particles<br />
are qualitatively in good agreement with experimental observations. Simple geometries are used for<br />
the simulation volume and the particles. The evolution of the particle’s strength by shearing-off<br />
is assumed also in a simplified manner. The differences of microstructural and mechanical fatigue<br />
features can be summarized as follows for the shearable and non-shearable particle cases.<br />
300<br />
280<br />
260<br />
240<br />
220<br />
200<br />
180<br />
160
4.3 Fatigue simulations of materials hardened by particles 145<br />
Stress[MPa]<br />
500<br />
450<br />
400<br />
350<br />
300<br />
250<br />
Shearable<br />
Bimodal 1<br />
Bimodal 2<br />
Bimodal 3<br />
Non-shearable<br />
200<br />
0.0e0 4.0e-3 8.0e-3 1.2e-2 1.6e-2<br />
Cumulative plastic strain<br />
Figure 4.46: Cyclic response curves of the bimodal cases compared with the mono-modal cases<br />
(a) Deformed surface of ’Bimodal2’<br />
case after four fatigue cycles<br />
(b) Evolution of surface steps above intense slip bands<br />
Figure 4.47: Surface morphology of the ’Bimodal2’ case
146 Dislocation-precipitate interactions<br />
1. Material hardened by shearable particles<br />
• High magnitude and accumulation rate of ρtot<br />
• Formation of thin slip bands with high local dislocation density<br />
• Ladder-like structures along the primary Burgers vector direction, and small-sized tangles<br />
between the particles<br />
• Clear channels of particles of low residual strength<br />
• Tongue-like surface markings<br />
• High initial stress amplitude followed by severe softening<br />
2. Material hardened by non-shearable particles<br />
• Low accumulation rate of ρtot<br />
• Larger slip band thickness and reduced inter-band spacing (more than one slip band<br />
formed in the volume)<br />
• Dense tangles around particles and complex dislocation structure between pairs of closely-<br />
spaced particles<br />
• Ribbon-like surface markings<br />
• Intermediate initial stress and rather stable cyclic response<br />
In the shearable particle case, a detailed investigation of the slip band formation shows that they<br />
are made of closely spaced edge dipolar loops. This is due to the limited glide distance of the<br />
double cross-slipped screws having a limited easy glide path. In the non-shearable particle case,<br />
dense dislocation tangles around the particles are attributed to the formation of Orowan loops and<br />
the subsequent interactions with the gliding dislocations, which act as pinning points for relatively<br />
mobile dislocations and contribute to form complex dislocation structures in the vicinity of the large<br />
particles.<br />
The addition of non-shearable particles (the bimodal cases) promotes dispersion of the slip bands,<br />
which results in retarded slip localization and in more diffused slip bands. The stress amplitude<br />
and the characteristics of slip markings are comprised between two mono-modal cases.<br />
It is observed that the large particles (rp = 400 nm) in the bimodal cases are also sheared off<br />
significantly. In Fig. 4.48, the residual facet strength are shown after 7 fatigue cycles for the<br />
bimodal case (Fig. 4.48(a)) and after 6 cycles for the mono-modal case (Fig. 4.48(b)). It is
4.3 Fatigue simulations of materials hardened by particles 147<br />
(110)<br />
(a) Bimodal case<br />
τfacet[MPa]<br />
7400<br />
6850<br />
6300<br />
5750<br />
5200<br />
4650<br />
4100<br />
3550<br />
3000<br />
(110)<br />
(b) Mono-modal case<br />
τfacet[MPa]<br />
Figure 4.48: Comparison of the strength of particles with the radius rp = 400 nm in the (a) bimodal<br />
case after 7 fatigue cycles and (b)mono-modal case after 6 fatigue cycles<br />
apparent that the large particles are more sheared off in the bimodal case, e.g. the minimum value<br />
of the strength is 5128 MP a in Fig. 4.48(a), and 7227 MP a in Fig. 4.48(b). This implies that<br />
significant softening and damaging effects could eventually take place in the large particles present<br />
in a bimodal-sized particle distribution. The small difference in the number of cycles does not seem<br />
to influence much this observation.<br />
Because of the relatively small number of the simulated fatigue cycles, quantitative analyses on the<br />
slip irreversibility are not presented in this work. The computational limitations of the simulations<br />
lie in the maximum possible number of segments (related to memory capacity) and the poor load<br />
balance characteristic (see Fig. 3.21(b)). As already pointed out in Sec. 3.3.6 and 3.4.4, the<br />
computational performance can be further increased by<br />
1. Decomposing the data space<br />
Each processor use only the necessary and sufficient data for computation, and this will allow<br />
to use larger memory for the simulations.<br />
2. Revising the load balance scheme<br />
Fatigue simulations are poor in load balance due to the highly heterogeneous dislocation<br />
microstructure involved, moreover the geometry of the simulation volume (cylinder) as shown<br />
in Fig. 3.21(b) is not easy to decompose in a set of cubic boxes as needed by the parallelization<br />
scheme. Thus a more efficient load balancing scheme is highly desirable.<br />
7400<br />
6850<br />
6300<br />
5750<br />
5200<br />
4650<br />
4100<br />
3550<br />
3000
148 Dislocation-precipitate interactions<br />
Good qualitative agreements of the microstructural and mechanical features of fatigue between the<br />
simulations and the experiments are, however, very promising for the development of fatigue-life<br />
models. It is generally agreed that the irreversible fraction of the cumulative cyclic strain describes<br />
well the fatigue life-controlling mechanisms. Like experimental efforts to well describe the state of<br />
damage ([Coupeau & Grilhe 99], [Cretegny & Saxena 01]), various parameters are measured<br />
during the simulations. Parameters such as the surface topology, slip band width and separation<br />
distance are direct outputs of the simulations. The evolution of the elastic energy inside of the<br />
slip bands is also accessible by post-processing of the simulated dislocation structures. Although<br />
each simulation needs considerable computing time 9 , the flexibility of simulations makes possible an<br />
extensive study on the effects of various parameters like geometries (grain size etc.), particle char-<br />
acteristics (particle size, volume fraction and strength etc.) and boundary conditions (the applied<br />
plastic strain etc.). The compilation of these information will serve to build fatigue crack nucleation<br />
criteria based on the intrinsic microstructural features involved.<br />
Key points<br />
• Image stresses by a <strong>3D</strong> particle are computed using the FEM/DDD coupling code<br />
explained in Sec. 2.4.2. Cylindrical, spherical and cubical particles are considered,<br />
and interaction forces along both glide and climb directions are shown.<br />
• The effect of the elastic modulus difference is investigated focusing on the flow stress<br />
and the subsequent hardening behavior. A simple configuration involving two particles<br />
is used for the computation.<br />
• Fatigue simulations are performed using the new parallel DDD code. The effects<br />
of particles (shearable or non-shearable) on the fatigue properties, like the intense<br />
slip band microstructure, the cyclic mechanical response, and the surface markings<br />
are investigated. The simulated results are compared to the available experimental<br />
observations in a qualitative way. Bimodal particle distributions are also simulated.<br />
The simulations can be used effectively to build fatigue-life models based on the<br />
intrinsic microstructural features involved.<br />
9 It takes 4 − 7 days for the fatigue simulations presented in this work using 9 processors in IBM P690 architecture<br />
supported from KISTI (Korea Institute of Science and Technology Information)
Chapter 5<br />
Conclusions and perspectives<br />
At the beginning of this thesis, we have presented the details of the <strong>3D</strong> discrete dislocation dynam-<br />
ics method. Efforts were given to elucidate the theoretical backgrounds and the assumptions lying<br />
under the method in order to ameliorate and expand the applicability of the method and also to<br />
be a good guidance to new comers in this field, especially to whom are not Francophone, since it<br />
is the first thesis on the French group written in English. The method to discretize the simulation<br />
space and the dislocation lines can be readily applied to other crystal structures, and the anisotropic<br />
stress fields and the various forms of dislocation mobility can be adopted according to the need of<br />
research objects.<br />
Besides the compilation of the existing components, new important elements are added to the<br />
<strong>3D</strong> DDD method, i.e. the computation of the displacement fields of dislocations, the implemen-<br />
tation of the internal interfaces and the periodic boundary conditions. These new features open a<br />
wide range of research areas in which the DDD code can be used.<br />
The computation of the displacement fields has been applied successfully to both the study of<br />
the surface markings during the cyclic loadings and the enforcement of displacement boundary con-<br />
ditions in the code coupled with CAST∃M, although the latter is not presented in this work.<br />
The internal interfaces represented by facets are effectively adopted for the particles in precipitation-<br />
hardened metals. This method can initiate a number of studies which involve the internal interfaces<br />
: the plasticity in a polycrystal and multilayer films ([Verdier 04]) which comprise grain bound-<br />
aries and interfaces between films respectively.<br />
The periodic boundary conditions are applied to the simulation of the Stage I-II transition. It is
150 Conclusions and perspectives<br />
now being applied to study the effect of the polarization of forest dislocations on the critical stress<br />
of a gliding dislocation line, in which the periodicity is forced along the line and the glide direction<br />
of the moving dislocation.<br />
Although it is not extensively studied in this work, the junction formation and its representation<br />
in the dislocation dynamics methods are largely investigated nowadays. Out of many important<br />
issues, the colinear junctions ([Madec et al. 03]) and the glissile junctions 1 are especially of interest.<br />
The usage of the linked-lists of segments and the decomposition of the orthorhombic simulation<br />
volume into homothetic boxes produce a significant increase in the computation efficiency and give<br />
great advantages on computing time with minor errors in the stress computation. This allows mas-<br />
sive simulations of bulk materials under homogeneous loading condition.<br />
Although the computational efficiency of the <strong>3D</strong> DDD method has improved significantly by ap-<br />
plying the box method, the code was still infeasible to incorporate many particles in the simulation<br />
volume. A parallel version of the method has thus been developed.<br />
The distributed memory system and the standard MPI have been chosen to develop a parallel<br />
DDD code since the distributed memory architectures are the major stream of the parallel comput-<br />
ers and it will be for the time being.<br />
The scheme of the new parallel code is designed based on the box method: the boxes dividing the<br />
simulation volume are decomposed into parallel-piped subsystems. The advantages of the parallel<br />
scheme developed in this work are several: most of the serial codes can be used without any mod-<br />
ification and a relatively short period of development time was needed (less than 4 months). The<br />
gained speedup is quite satisfactory anyhow. Especially the efficiency of the internal stress compu-<br />
tation is 100%, thus the anisotropic stress solutions can be incorporated with the same computing<br />
expenses as those of the isotropic solutions by using several processors. The requirement that at<br />
least three boxes should exist along each axis of an individual subsystem, however, puts a certain<br />
limit on the number of processors that can be used simultaneously. Better strategies for the load<br />
balancing and the decomposition of data space would be highly desirable to improve the efficiency<br />
and the applicability of the new parallel code.<br />
Parallel to our efforts, there have been several groups which have converted their own dislocation dy-<br />
1 D. Weygand in the conference ’Dislocations 2004’ held at "La Colle-sur-Loup, France", September 13-17, 2004
namics codes into a parallel version, especially in Lawrence Livermore National Laboratory (LLNL)<br />
and University of California in Los Angeles (UCLA). Both of them use the nodal model.<br />
The image stresses due to a <strong>3D</strong> particle were computed using the FEM/DDD coupling code. The<br />
interaction of a dislocation line with a circular cylindrical, spherical and cubical particle with differ-<br />
ing elastic modulus was investigated. The computation method was validated by comparing with<br />
the corresponding analytical solutions. It was shown that the image stresses need to be taken into<br />
account especially in the study of the local events around the particles, e.g. the computation of the<br />
energy state around a particle and the calculation of the creep threshold stresses at high tempera-<br />
tures.<br />
In these modeling, it is necessary to mesh the whole simulation volume because the geometrical<br />
symmetries are broken by the heterogeneous force boundary conditions due to a dislocation. Conse-<br />
quently, the cost of the FEM computation is relatively high both in term of cpu time and required<br />
memory. The force profiles fitted from the computed data can used as approximation solutions of<br />
interactions due to the elastic modulus mismatch. For the dynamics, however, the use of a parallel<br />
finite element method would be of benefit and will be served as a good tool in studying the plasticity<br />
of multilayer films, for example.<br />
The effect of the elastic modulus mismatch is investigated focusing on the flow stress and the<br />
subsequent hardening behavior using the simple geometry involving two particles. The characteris-<br />
tics of the image stresses (short-ranged and paraelastic) generate minor effects on the yield stresses<br />
but significant effects on the work hardening rate. The image stresses are also found to affect sig-<br />
nificantly the local events such as cross slip and climb.<br />
The fatigue simulations are performed using the internal interfaces represented by facets and the<br />
new parallel DDD program. The characters of shearable and non-shearable particles and the par-<br />
ticle’s strength evolution by shearing-off were represented in a simplified manner by adjusting the<br />
strength of the facets.<br />
Major features of the fatigue properties of materials hardened by shearable and non-shearable par-<br />
ticles are well reproduced by the simulations, e.g. microstructure of the intense slip bands, the<br />
cyclic mechanical response and the surface markings. The simulated results were compared with<br />
the available experimental observations, and showed good agreements in a qualitative way. The<br />
151
152 Conclusions and perspectives<br />
mechanism of the intense slip band formation is proposed from the observation of the simulated<br />
dislocation microstructure.<br />
The flexibility of the simulations can permit an extensive study on the effects of various parameters<br />
like the geometries (grain size etc.), the characteristic of particles (particle size, volume fraction and<br />
strength etc.) and the applied plastic strain. The compilation of these information will serve to<br />
build fatigue crack nucleation criteria based on the intrinsic microstructural features involved.<br />
To build a reliable fatigue life model, it is however imperative to increase the number of fatigue<br />
cycles of the simulations. For this purpose, the efficiency and performance of the new parallel code<br />
need to be improved by adopting better strategies for the load balancing and decomposing the data<br />
space so as to increase the maximum number of dislocation segments and particles.<br />
In conclusion, the methods that we have developed and verified have been applied to the dislocation-<br />
precipitate interactions and opens many paths to new interesting research areas.
Bibliography<br />
[Abraham 97] Abraham F. F., Portrait of a crack: Rapid fracture mechanics using parallel molec-<br />
ular dynamics, IEEE Computational Science & Engineering, Vol. 4, No. 2, 1997, pp. 66–77.<br />
[Aoyama & Nakano 99] Aoyama Y. & Nakano J., Practical MPI Programming(RS/6000 SP),<br />
IBM Redbooks, Vervante, 1999.<br />
[Bacon et al. 73] Bacon D. J., Kocks U. F. & Scattergood R. O., The effect of dislocation self-<br />
interaction on the orowan stress, Phil. Mag., Vol. 28, 1973, p. 1241.<br />
[Barnett 85] Barnett D. M., The displacment field of a triangular dislocation loop, Phil. Mag.<br />
A, Vol. 51, No. 3, 1985, pp. 383–387.<br />
[Bathe 96] Bathe K. J., Finite Element Procedures, Prentice-Hall International, INC., 1996.<br />
[Brown 64] Brown L. M., The self-stress of dislocations and the shape of extended nodes, Phil.<br />
Mag., 1964, pp. 441–466.<br />
[Bulatov et al. 01] Bulatov V. V., Rhee M. & Cai W., Periodic boundary conditions for disloca-<br />
tion dynamics simulations in three dimensions, Mat. Res. Soc. Symp. Proc., ed. by Kubin L. P.,<br />
Selinger R. L., Bassani J. L. & Cho K., 2001.<br />
[Calabrese & Laird 74] Calabrese C. & Laird C., Cyclic stress-strain response of two-phase<br />
alloys, parts i and ii, Materials Science and Engineering, Vol. 13, 1974, pp. 141–174.<br />
[Canova & Kubin 91] Canova G. R. & Kubin L. P., Dislocation microstructures and plastic flow:<br />
a three dimensional simulaiton, Continuum models and discrete systems, ed. by Maugin G. A.,<br />
1991.<br />
[Chen et al. 99] Chen B. T., Zhang T. Y. & Lee J. K., Interaction of an edge dislocation with an<br />
elliptical hole in a rectilinearly anisotropic body, Mech. of Mat., Vol. 31, 1999, p. 71.
154 BIBLIOGRAPHY<br />
[Clavel & Pineau 82] Clavel M. & Pineau A., Fatigue behaviour of two nickel-base alloys i:<br />
Experimental results on low cycle fatigue, fatigue crack propogation and substructures, Materials<br />
Science and Engineering, Vol. 55, 1982, pp. 157–171.<br />
[Cleveringa et al. 97] Cleveringa H. H. M., Giessen E. Vander. & Needleman A., Comparison of<br />
discrete dislocation and continuum plasticity predictions for a composite material, Acta Materi-<br />
alia, Vol. 45, No. 8, 1997, pp. 3163–3179.<br />
[Comninou & Dundurs 72] Comninou M. & Dundurs J., Long-range interaction between a screw<br />
dislocation and a spherical inclusion, J. Appl. Phys., Vol. 43, 1972, p. 2461.<br />
[Coupeau & Grilhe 99] Coupeau C. & Grilhe J., Quantitative analysis of surface effects of plastic<br />
deformation, Materials Science and Engineering A, Vol. 271, 1999, pp. 242–250.<br />
[Cretegny & Saxena 01] Cretegny L. & Saxena A., Afm characterization of the evolution of<br />
surface deformation during fatigue in polycrystalline copper, Acta Materialia, Vol. 49, No. 18,<br />
2001, pp. 3647–3887.<br />
[Demmel et al. 93] Demmel J., Heath M. & van der Vorst H., Parallel numerical linear algebra,<br />
Acta Numerica 1993, 1993.<br />
[Déprés 04] Déprés C., Modèlisation physique des stades précurseurs de l’endommagement en<br />
fatigue, Thèse de PhD, Institut National Polytechnique De Grenoble, 2004.<br />
[Déprés et al. 03] Déprés C., Fivel M., Robertson C. F., Fissolo A. & Verdier M., Etude des<br />
stades précurseurs de l’endommagement en fatigue: expériences et simulations à l’échelle des<br />
dislocations, Journal de Physique IV, Vol. 106, 2003, pp. 81–90.<br />
[Déprés et al. 04] Déprés C., Robertson C. F. & Fivel M., Low-strain fatigue in 316l steel surface<br />
grains: a three dimensional discrete dislocation dynamics modelling of the early cycles. part-1:<br />
Dislocation microstructures and mechanical behaviour, Phil. Mag., Vol. 84, No. 22, 2004, pp.<br />
2257–2275.<br />
[Devincre 95] Devincre B., Three dimensional stress field expressions for straight dislocation<br />
segments, Solid State Communications, Vol. 93, No. 11, 1995, pp. 875–878.<br />
[Devincre et al. 01] Devincre B., Kubin L. P., Lemarchand C. & Madec R., Mesoscopic sim-<br />
ulations of plastic deformation, Materials Science and Engineering, Vol. A309-310, 2001, pp.<br />
211–219.
BIBLIOGRAPHY 155<br />
[Devincre & Roberts 96] Devincre B. & Roberts S., Three-dimensional simulation of<br />
dislocation-crack interactions in b.c.c. metals at the mesoscopic scale, Acta Materialia, Vol. 44,<br />
No. 7, 1996, pp. 2981–2900.<br />
[dewit 67] deWit R., Some relations for straight dislocations, Phys. Stat. Sol., Vol. 20, 1967, pp.<br />
567–573.<br />
[Diehl 56] Diehl J., Z. Metallk., Vol. 47, 1956, p. 331.<br />
[Dongarra et al. 98] Dongarra J. J., Duff I. S., Sorenson D. C. & Vorst H. A., Numerical Linear<br />
Algebra for High Performance Computers, SIAM, Philadelphia, 1998.<br />
[Ebeling & Ashby 66] Ebeling R. & Ashby M. F., Dispersion hardening of copper single crystals,<br />
Phil. Mag., Vol. 13, 1966, p. 805.<br />
[Edwards & Martin 82] Edwards L. & Martin J. W., Proc. of 6th Int. Conf. on the strength of<br />
metals and alloys, ed. by Gifkins R. C., 1982.<br />
[Essmann & Mughrabi 79] Essmann U. & Mughrabi H., Annihilation of dislocations during<br />
tensile and cyclic deformation and limits of dislocation densities, Phil. Mag. A, Vol. 40, No. 6,<br />
1979, pp. 731–756.<br />
[Fahrat & Roux 94] Fahrat C. & Roux F. X., Implicit parallel processing in structural mechanics,<br />
Computational Mechanics Advances, Vol. 2, No. 1, 1994.<br />
[Fisher et al. 53] Fisher J. C., Hart E. W. & Rry R. H., The hardening of metal crystals by<br />
precipitate particles, Acta Materialia, Vol. 1, 1953, p. 336.<br />
[Fivel 97] Fivel M., Études numériques à différentes échelles de la déformation plastique des<br />
monocristaux de structure CFC, Thèse de PhD, Institut National Polytechnique De Grenoble,<br />
1997.<br />
[Fivel & Canova 99] Fivel M. & Canova G. R., Developing rigorous boundary conditions to<br />
simulations of discrete dislocation dynamics, Modelling Simul. Mater. Sci. Eng., Vol. 7, 1999, pp.<br />
753–768.<br />
[Fivel et al. 96] Fivel M., Gosling T. J. & Canova G. R., Implementing image stresses in a 3d<br />
dislocation simulation, Modelling Simul. Mater. Sci. Eng., Vol. 4, No. 6, 1996, pp. 581–596.
156 BIBLIOGRAPHY<br />
[Fivel et al. 98] Fivel M., Robertson C. F., Canova G. R. & Boulanger L., 3d modeling of indent-<br />
induced plastic zone at a mesoscale, Acta Materialia, Vol. 7, 1998, pp. 6183–6194.<br />
[Foreman 67] Foreman A. J. E., The bowing of a dislocation segment, Phil. Mag., Vol. 15, 1967,<br />
pp. 1011–1021.<br />
[Foreman & Makin 66] Foreman A. J. E. & Makin M. J., Dislocation movement through random<br />
arrays of obstacles, Phil. Mag., Vol. 14, 1966, p. 911.<br />
[Fusenig & Nembach 75] Fusenig K. D. & Nembach E., Dynamic dislocation effects in precipi-<br />
tation hardened materials, Acta metall. mater., Vol. 41, 1975, pp. 3181–3189.<br />
[Gerold & Steiner 82] Gerold V. & Steiner D., Fatigue softening in precipitation-hardened<br />
copper-cobalt, Scripta Metallurgica, Vol. 16, 1982, pp. 405–408.<br />
[GG et al. 00] GómezGarcía D., Devincre B. & Kubin L. P., Forest hardening and boundary con-<br />
ditions in 2d simulations of dislocations dynamics, Mat. Res. Soc. Symp. Proc., ed. by Robertson<br />
I. M., Lassila D. H., Devincre B. & Phillips R., 2000.<br />
[Ghoniem et al. 00] Ghoniem N. M., Singh B. N., Sun L. Z. & de la Rubia T. D., Interaction<br />
and accumulation of glissile defect clusters near dislocations, J. Nucl. Mater., Vol. 276, 2000, pp.<br />
166–177.<br />
[Giessen & Needleman 95] Giessen E. Vander. & Needleman A., Discrete dislocation plasticity:<br />
a simple planar model, Modelling Simul. Mater. Sci. Eng., Vol. 3, 1995, pp. 689–735.<br />
[Graf & Hornbogen 78] Graf M. & Hornbogen E., The effect of inhomogeneity of cyclic strain<br />
on initiation of cracks, Scripta Metallurgica, Vol. 12, 1978, pp. 147–150.<br />
[Gullouglu et al. 89] Gullouglu A. N., Srolovitz D. J., Lesar R. & Lomdahl P. S., Dislocation<br />
distributions in two dimensions, Scripta Metallurgica, Vol. 23, 1989, p. 1347.<br />
[Hirth & Lothe 92] Hirth J. P. & Lothe J., Theory of Dislocations, Krieger Publishing Company,<br />
Malabar, Florida, 1992.<br />
[Hull & Bacon 83] Hull D. & Bacon D. J., Introduction to Dislocations, Pergamon Press, p96,<br />
1983.<br />
[Humphreys & Martin 67] Humphreys F. J. & Martin J. W., Phil. Mag., Vol. 16, 1967, p. 927.
BIBLIOGRAPHY 157<br />
[Khraishi et al. 00a] Khraishi T. A., Zbib H. M., Hirth J. P. & de la Rubia T. D., The stress field<br />
of a general circular volterra dislocation loop: Analytical and numerical approches, Phil. Mag.,<br />
Vol. 80, 2000, pp. 95–105.<br />
[Khraishi et al. 00b] Khraishi T. A., Zbib H. M., Hirth J. P. & Khaleel M., The displacement,<br />
and strain-stress fields of a general circular volterra dislocation loop, Int. J. Eng. Sci., Vol. 80,<br />
2000, pp. 251–266.<br />
[Kobashi & Ohr 80] Kobashi S. & Ohr S. M., Phil. Mag. A, Vol. 42, 1980, p. 763.<br />
[Kocks et al. 75] Kocks U. F., Argon A. S. & Ashby M. F., Thermodynamics and kinetics of slip,<br />
Progress in Materials Science, ed. by Kubin L. P., Selinger R. L., Bassani J. L. & Cho K., 1975.<br />
[Lee & Laird 83] Lee J. K. & Laird C., Strain localization during fatigue of precipitation-hardened<br />
aluminium alloys, Phil. Mag., Vol. 47A, 1983, pp. 579–597.<br />
[Lépinoux & Kubin 87] Lépinoux J. & Kubin L. P., The dynamic organization of dislocation<br />
structures: a simulation, Scripta Metallurgica, Vol. 21, 1987, pp. 833–837.<br />
[Li 64] Li J. C. M., Stress field of a dislocation segment, Phil. Mag., Vol. 10, 1964, pp. 1097–1098.<br />
[Li & Laird 94] Li Y. & Laird C., Cyclic response and dislocation structures of aisi 316l stainless<br />
steel. part 1: Single crystals fatigued at intermediate strain amplitude., Materials Science and<br />
Engineering A, Vol. 186, No. 1–2, 1994, pp. 65–86.<br />
[Madec 01] Madec R., Des intersections entre dislocations a la plasticité du monocristal CFC;<br />
Étude par dynamique des dislocations, Thèse de PhD, Universite Paris XI Orsay, 2001.<br />
[Madec et al. 03] Madec R., Devincre B., Kubin L. P., Hoc T. & Rodney D., The role of collinear<br />
interaction in dislocation-induced hardening, Science, Vol. 301, No. 26, 2003, pp. 1879–1882.<br />
[Madec et al. 04] Madec R., Devincre B. & Kubin L. P., On the use of periodic boundary condi-<br />
tions in dislocation dynamcis simulation, Mesoscopic Dynamics in Fracture Process and Stresngth<br />
of Materials, ed. by Shibutani Y. & Kitagawa H., 2004.<br />
[Man et al. 02] Man J., Obrtlik K., Blochwitz C. & Polák J., Atomic force microscopy of surface<br />
relief in individual grains of fatigued 316l austenitic stainless steel, Acta Materialia, Vol. 50, 2002,<br />
pp. 3767–3780.
158 BIBLIOGRAPHY<br />
[Marquis & Dunand 02] Marquis E. A. & Dunand D. C., Model for creep threshold stress in<br />
precipitation-strengthened alloys with coherent particles, Scripta Materialia, Vol. 47, 2002, p.<br />
503.<br />
[Martin 80] Martin J. W., Micromechanisms in particle-hardened alloys, Cambrideg Solide State<br />
Science Series, ed. by Cahn R. W., Thompson M. W. & Ward I. M., 1980.<br />
[Mason 68] Mason W. P., Dislocation dynamics, MacGraw-Hill, 1968.<br />
[Melander & Persson 78] Melander A. & Persson P. A., The strength of a precipitation hard-<br />
ened alznmg alloy, Acta Materialia, Vol. 26, 1978, p. 267.<br />
[Mohles & Nembach 01] Mohles V. & Nembach E., The peak- and overaged states of particle<br />
strengthened materials: computer simulations, Acta Materialia, Vol. 49, 2001, p. 2405.<br />
[Moore 65] Moore G. E., Cramming more components onto integrated circuits, Electronics,<br />
Vol. 38, No. 8, 1965.<br />
[Mughrabi 83] Mughrabi H., Deformation of multi-phase and particle containing materials, Pro-<br />
ceedings of the 4th Risø International Symposium on Metallurgy and Materials Science, ed. by<br />
Bilde-Sørensen J. B., Hansen N., Horsewell A., Leffers T. & Lilholt H., 1983.<br />
[Mughrabi 85] Mughrabi H., Dislocation Properties in Real Materials, Book No. 323, The Institute<br />
of Metals, London, 1985.<br />
[Nembach 83] Nembach E., Phys. Stat. Sol., Vol. 78, 1983, p. 571.<br />
[Nembach 97] Nembach E., Particle strengthening of metals and alloys, John Wiley and Sons,<br />
1997.<br />
[Obrtlik et al. 94] Obrtlik K., Kruml T. & Polák J., Dislocation structures in 316l stainless steel<br />
cycled with plastic strain amplitudes over a wide interval., Materials Science and Engineering A,<br />
Vol. 187, No. 1, 1994, pp. 1–10.<br />
[Reppich 93] Reppich B., Particle strengthinig, Mater. Sci. Technol., Vol. 6, 1993, pp. 311–357.<br />
[Rhee et al. 01] Rhee M., Stolken J. S., Bulatov V. V., de la Rubia T. D., Zbib H. M. & Hirth<br />
J. P., Dislocation stress fields for dynamic codes using anisotropic elasticity: methodology and<br />
analysis, Materials Science and Engineering, Vol. A309-310, 2001, pp. 288–293.
BIBLIOGRAPHY 159<br />
[Risbet et al. 03] Risbet M., Feaugas X., Guillemer-Neel C. & Clavel M., Use of atomic force<br />
microscopy to quantify slip irreversibility in a nickel-base superalloy, Scripta Materialia, Vol. 49,<br />
2003, pp. 533–538.<br />
[Rodney & Phillips 99] Rodney D. & Phillips R., Structure and strength of dislocation junctions:<br />
an atomic-level analysis, Phy. Rev. Lett., Vol. 82, 1999, pp. 1704–1707.<br />
[Santare & Keer 86] Santare M. H. & Keer L. M., Interaction between an edge dislocation and<br />
a rigid elliptical inclusion, J. Appl. Mech., Vol. 53, 1986, p. 382.<br />
[Schmid & Boas 35] Schmid E. & Boas W., Kristallplastizitat, Springer Verlag(Berlin), 1935.<br />
[Schwarz 99] Schwarz K. W., Simulation of dislocations on the mesoscpoic scale. i. methods and<br />
examples, J. Appl. Phys., Vol. 85, No. 1, 1999, pp. 108–119.<br />
[Shenoy et al. 00] Shenoy V. B., Kukta R. V. & Phillips R., Mesoscopic analysis of structure<br />
and strength of dislocatoin junctions in fcc metals, Phy. Rev. Lett., Vol. 84, No. 7, 2000, pp.<br />
1491–1494.<br />
[Shin et al. 01] Shin C. S., Fivel M., Rodney D., Phillips R., Shenoy V. B. & Dupuy L., Forma-<br />
tion and strength of junctions in fcc metals : a study by dislocation simulation and atomistic<br />
simulations, Journal de Physique IV, Vol. 11, No. Pr5, 2001, pp. 19–26.<br />
[Stoltz & Pineau 78] Stoltz R. E. & Pineau A., Dislocation-precipitate interaction and cyclic<br />
stress-strain behavior of a γ’-strengthened superalloy, Materials Science and Engineering, Vol. 34,<br />
1978, pp. 275–284.<br />
[Suresh 98] Suresh S., Fatigue of Materials, 2nd edi., Cambridge University Press, 1998.<br />
[Tang et al. 98] Tang M., Kubin L. P. & Canova G. R., Dislocation moility and the mechanical<br />
response of bcc single crystals: a mesoscopic approach, Acta Materialia, Vol. 46, 1998, p. 9.<br />
[Urabe & Weertman 75] Urabe N. & Weertman J., Dislocation mobility in potassium and iron<br />
single crystals, Materials Science and Engineering, Vol. 18, 1975, p. 41.<br />
[Verdier 04] Verdier M., Plasticity in fine scale semi-coherent metallic films and multilayers,<br />
Scripta Materialia, Vol. 50, No. 6, 2004, pp. 769–773.
160 BIBLIOGRAPHY<br />
[Verdier et al. 98] Verdier M., Fivel M. & Groma I., Mesoscopic scale simulation of dislocation<br />
dynamic in fcc metals: Principle and applications, Modelling Simul. Mater. Sci. Eng., Vol. 6, No.<br />
6, 1998, pp. 755–770.<br />
[Vitek 75] Vitek V., Yielding from a crack with finite root-radius loaded in uniform tension, J.<br />
Mech. Phys. Solids, Vol. 24, 1975, p. 67.<br />
[Weeks et al. 69] Weeks R. W., Pati S. R., Ashby M. F. & Barrand P., The elastic interaction<br />
between a straight dislocation and a bubble or a particle, Acta Metallurgica, Vol. 17, 1969, p.<br />
1403.<br />
[Weygand et al. 01] Weygand D., Friedman L. H., Giessen E. Vander. & Needleman A., Discrete<br />
dislocation modeling in tree-dimensional confined volumes, Materials Science and Engineering,<br />
Vol. A309-310, 2001, p. 420.<br />
[Weygand et al. 02] Weygand D., Friedman L. H. & Giessen E. Vander., Aspect of boundary-<br />
value problem solutions with three-dimensional dislocation dynamics, Modelling Simul. Mater.<br />
Sci. Eng., Vol. 10, 2002, pp. 437–468.<br />
[Zbib et al. 98] Zbib H. M., Rhee M. & Hirth J. P., On plastic deformation and the dynamics of<br />
3d dislocations, Int. J. Mch. Sci., Vol. Nos, No. 2-3, 1998, pp. 113–127.<br />
[Zhou & Lung 88] Zhou S. J. & Lung C. W., An image force expression for the dislocation near<br />
a crack, J. Phys. F: Met. Phys., Vol. 18, 1988, p. 851.<br />
[Zhu & Starke 99] Zhu A. W. & Starke E. A., Computer experiment on superposition of strength-<br />
ening effects of different particles, Acta Materialia, Vol. 47, 1999, p. 3263.