Cal Stadium Renovation - Trimble
Cal Stadium Renovation - Trimble
Cal Stadium Renovation - Trimble

You also want an ePaper? Increase the reach of your titles
YUMPU automatically turns print PDFs into web optimized ePapers that Google loves.
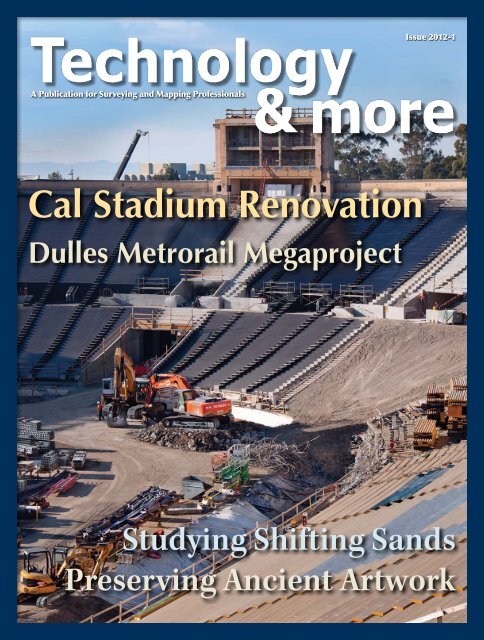
A Publication for Surveying and Mapping Professionals<br />
<strong>Cal</strong> <strong>Stadium</strong> <strong>Renovation</strong><br />
Dulles Metrorail Megaproject<br />
Issue 2012-1<br />
Studying Shifting Sands<br />
Preserving Ancient Artwork
Welcome to Technology&more:<br />
More Than a Decade of Worldwide Projects<br />
Dear Readers,<br />
It’s hard to imagine, but this issue of Technology&more begins our eleventh year of bringing<br />
you articles about our customers' innovative surveying projects around the world. From our<br />
first issue in 2002 to today, Technology&more seeks to showcase projects that demonstrate<br />
the enhanced efficiencies and expanded capabilities that can be gained through the use of<br />
<strong>Trimble</strong>® technology solutions. As always, we hope that the articles will provide useful ideas<br />
and information that will benefit you and your business today—and tomorrow.<br />
In this issue, you can learn how 3D scanning created a complete record of the before—and<br />
after—configuration of the University of <strong>Cal</strong>ifornia football<br />
stadium during a major renovation project; GNSS and<br />
GeoSpatial solutions aided the early recovery efforts in the<br />
city of Christchurch, NZ, following a disastrous series of<br />
earthquakes; integrating optical and GPS/GNSS surveying<br />
gear enables one person to measure and record the often<br />
rapid changes in the coastline of South Wales in the UK; all<br />
aspects of construction for a major Metrorail extension project<br />
near Washington, DC, were controlled through a <strong>Trimble</strong><br />
Connected Site solution; “pre-surveying” helps speeds track<br />
laying in central Germany; and 3D scanning makes it possible<br />
to accurately record 40,000-year-old cave artwork in Spain.<br />
Chris Gibson: Vice President,<br />
Survey Division<br />
Published by:<br />
<strong>Trimble</strong> Engineering<br />
& Construction<br />
10355 Westmoor Drive<br />
Westminster, Colorado 80021<br />
Phone: 720-587-6100<br />
Fax: 720-887-6101<br />
Email: T&M_info@trimble.com<br />
www.trimble.com<br />
In all of these projects, <strong>Trimble</strong> solutions, whether incorporating<br />
GNSS, Optical, Spatial Imaging, GeoSpatial, GIS or<br />
VRS technologies, helped users do their jobs faster and more<br />
efficiently—and in some cases, do work that literally couldn’t<br />
have been done a few years ago.<br />
You’ll also learn how progressive surveying professionals are utilizing specialized application<br />
software tools for <strong>Trimble</strong> surveying systems. The <strong>Trimble</strong> Access Software Development Kit<br />
(SDK) enables software developers to meet specific localized customer needs by developing<br />
application-specific software solutions. <strong>Trimble</strong> Access SDK offers surveying professionals a<br />
variety of customizable opportunities, allowing them to perform projects faster, more easily<br />
and more productively.<br />
If you’d like to share information with Technology&more readers about your own innovative<br />
project, we’d like to hear about it: just email Survey_Stories@trimble.com. We’ll even write<br />
the article for you.<br />
Be sure to mark your calendar for the <strong>Trimble</strong> Dimensions International User Conference,<br />
which will be held November 5–7, 2012, at the Mirage Hotel in Las Vegas, Nevada, U.S.A.<br />
Nearly 3,000 surveying and construction professionals attended Dimensions 2010. We hope<br />
you’ll be able to attend this year: Dimensions 2012 promises to be another powerful experience,<br />
providing extensive educational options, unmatched networking opportunities—and<br />
a whole lot of fun.<br />
And now, enjoy this issue of Technology&more.<br />
Chris Gibson<br />
Editor-in-Chief: Shelly Nooner<br />
Editorial Team: Angie Vlasaty;<br />
Lea Ann McNabb; Omar Soubra;<br />
Heather Silvestri; Eric Harris; Kelly Liberi;<br />
Susanne Preiser; Christiane Gagel; Lin Lin<br />
Ho; Bai Lu; Echo Wei; Maribel Aguinaldo;<br />
Stephanie Kirtland, Survey Technical<br />
Marketing Team<br />
Art Director: Tom Pipinou<br />
INSIDE:<br />
U.S. Pg. 4<br />
New Zealand Pg. 8<br />
Germany Pg. 12<br />
Spain Pg. 14<br />
© 2012, <strong>Trimble</strong> Navigation Limited. All rights reserved.<br />
<strong>Trimble</strong>, the Globe & Triangle logo, GEDO, GeoExplorer, Pathfinder,<br />
Ranger, RealWorks, TSC2 and TSC3 are trademarks of<br />
<strong>Trimble</strong> Navigation Limited or its subsidiaries, registered in<br />
United States Patent and Trademark Office. Access, Business<br />
Center, Connected Site, CU, FX, GeoXR, GeoXT, GX, Integrated<br />
Surveying, NetR9, POS LV, ProXH, Survey Pro, VRS, VRS Now,<br />
and VX are trademarks of <strong>Trimble</strong> Navigation Limited or its<br />
subsidiaries. All other trademarks are the property of their<br />
respective owners.<br />
Cover Image by Tom Pipinou. Thanks to KOREC for initially<br />
developing the Studying Shifting Sand article.
Surveying Wind Farms<br />
The rugged terrain of the Appalachian Mountains in<br />
Pennsylvania and West Virginia can present challenges<br />
to travel and commerce. But the high ridges<br />
contain an important opportunity for new projects and<br />
revenue: they are ideal locations for wind power. According<br />
to the U.S. National Renewable Energy Laboratory,<br />
wind in southwestern Pennsylvania can provide more<br />
than six percent of the state’s existing electricity needs.<br />
And the region generates more than electricity—in 2010,<br />
observers reported that Pennsylvania’s wind power industry<br />
supported more than 3,000 jobs in manufacturing,<br />
construction and operation of the state’s wind farms.<br />
From its offices in Pennsylvania and Maryland, CME<br />
Engineering LP provides services for wind farm development<br />
in southwestern Pennsylvania and West Virginia.<br />
CME Project Director Dan Llewellyn said that wind farms<br />
call for a range of surveying skills. A major portion of each<br />
project is cadastral work to create maps and descriptions<br />
for the easements and rights of way that host the turbines,<br />
access roads and power lines. Additional work includes<br />
construction surveys for road improvements to handle<br />
the long trailers hauling turbine blades and towers to the<br />
ridge tops. Post-construction surveys include as-built<br />
locations of transmission towers and other facilities.<br />
The difficult terrain demands a variety of surveying<br />
techniques and tools. CME Engineering Technician Asa<br />
Maust uses <strong>Trimble</strong> R8 GNSS with a <strong>Trimble</strong> TSC3®<br />
Controller running <strong>Trimble</strong> Access Software for both<br />
static and RTK surveys. Whenever possible, CME<br />
utilizes the KeyNetGPS Real-Time Network (RTN), based<br />
on <strong>Trimble</strong> VRS technology, for its RTK work.<br />
“Because of limited cell phone service in many areas, we<br />
often use the <strong>Trimble</strong> HPB450 radio modem for RTK,”<br />
Maust explained. “We use repeaters to carry the RTK<br />
signals into the deep, narrow valleys.” In areas where<br />
total stations are needed, CME technicians set control<br />
with GNSS and use a Nikon DTM-332 Total Station to<br />
run traverses between the GNSS control points. Roughly<br />
60 percent of control is set using static methods, with<br />
the remainder placed by RTK. Most work is done with a<br />
precision of 3 mm (0.01 ft).<br />
While the required precision varies, Maust said that wind<br />
projects have short construction cycles that require<br />
flexibility and quick response. He cited West Virginia’s<br />
Pinnacle Wind Farm, which has 23 turbines and will supply<br />
power for 14,000 households. Construction began in spring<br />
2011 and the farm was in full production by the end of 2011.<br />
Two CME crews used static GNSS to establish more than<br />
100 control points for construction, aerial photography<br />
and cadastral surveys. CME also provided surveying for<br />
roads, turbine foundations and transmission lines.<br />
Work on the wind projects is not letting up. Like many<br />
states, Pennsylvania has voter-approved requirements<br />
for increased use of wind and other alternative energy<br />
sources. It’s an important opportunity, and surveyors<br />
with flexible tools and techniques will be well positioned<br />
to meet the demand.<br />
-1- Technology&more; 2012-1
Studying Shifting Sand<br />
Older residents of Cwm Ivy in South Wales remember tossing pennies from the cliffs above the coastline onto anchored<br />
boats below. Today, the edge of the sea has slipped out nearly 500 m (1,640 ft), and where there was once deep water is<br />
now sand dunes.<br />
Wetland hydrologist Charlie Stratford is studying those<br />
shifting dunes and one of his key research tools to record<br />
the land’s movements is the <strong>Trimble</strong> S3 Robotic Total Station.<br />
Using optical as well as GNSS surveying techniques,<br />
Stratford and his research crew are able to monitor and<br />
survey this dynamic site using Integrated Surveying<br />
techniques.<br />
Stratford works for the Centre for Ecology & Hydrology<br />
(CEH) and collaborates with the British Geological Survey<br />
(BGS), both part of the Natural Environment Research<br />
Council, to study freshwater ecosystems and their interaction<br />
with the atmosphere.<br />
The dunes and salt marshes are located on the Gower Peninsula<br />
in Swansea, on the north coast of South Wales.<br />
Managing Change with Change<br />
The South Wales site is of particular interest to the Centre<br />
because it is constantly changing; one storm can remodel<br />
vulnerable parts of the coastline overnight, while over many<br />
years erosion can significantly alter the land’s contours. As<br />
the landscape changes, the water in the wetland becomes<br />
transformed as well. The salt water loses its salinity, enabling<br />
new plant and animal life to inhabit the area.<br />
“Few landscapes can exist as freely and as independent from<br />
human intervention as the one we are seeing in South Wales,<br />
and that makes it particularly significant and exciting for us,"<br />
Technology&more; 2012-1<br />
-2-<br />
Stratford explains. “This is a dynamic ecology that really is<br />
doing its own things and the key to observing, monitoring<br />
and understanding these changes—in fact, the linchpin in<br />
our research—is reliable topographic survey data.”<br />
The joint CEH/BGS team aims to monitor the South Wales<br />
site over the next 5–10 years and wanted to upgrade their<br />
equipment and take advantage of any relevant technological<br />
advances since their last purchase.<br />
Stratford planned to carry out most of the survey work using<br />
optical surveying methods which would also sidestep any<br />
problems caused by carrying out GNSS surveys in a forested<br />
area near the site, located in the Whiteford Burrows National<br />
Nature Reserve. Also, he hoped to do most of the surveying<br />
himself, so he needed lightweight, portable gear. His choice<br />
was a <strong>Trimble</strong> S3 Robotic Total Station and <strong>Trimble</strong> TSC2®<br />
Controller using <strong>Trimble</strong> Access Software.<br />
On the GNSS side, the upgrade included a <strong>Trimble</strong> R8 GNSS<br />
System to enable surveys to pick up both GPS and GLONASS<br />
satellite signals to capture the data he needed, even in the<br />
ever-changing coastal dune site.<br />
So that Stratford wouldn’t have to re-measure things or<br />
use permanent markers, he also chose to use the <strong>Trimble</strong><br />
VRS Now Network subscription service providing instant<br />
access to RTK corrections throughout the UK.
“This is an evolving site so permanent markers may be buried by sand or<br />
washed away during storms,” explains Stratford. “The obvious solution<br />
was the R8 GNSS which, on the one hand, would take away a whole layer<br />
of uncertainty for us and on the other, provide us with excellent mapping<br />
functionality and the ability to do repeat surveys.”<br />
Integrated Surveying<br />
The idea of Integrated Surveying is to seamlessly integrate GNSS or GPS<br />
receivers and optical total stations so that surveyors see them as a combined<br />
system. The field controller and software provide a common file<br />
and interface to GNSS/GPS and conventional survey instruments.<br />
In Stratford’s case the key to the seamless connectivity of the two systems<br />
is the <strong>Trimble</strong> TSC2 Controller using <strong>Trimble</strong> Access Software. With this<br />
system, Stratford can simply toggle between optical and GNSS data collection<br />
while the <strong>Trimble</strong> Total Station and GNSS Rover are both active.<br />
“If sand hills compromise our line of sight with the optical instrument, or<br />
heavy tree canopy affects our GNSS signal, we simply push a button and<br />
switch over,” Stratford said.<br />
“The TSC2 controller connects with the two systems at the same time.<br />
It’s a simple process that has increased our productivity enormously;<br />
depending on the task, by 50 to 100 percent compared to using our old<br />
systems individually—it’s fantastic.”<br />
“In many cases the robotic total station has turned our surveys into a oneperson<br />
operation, freeing up the second site-surveyor to carry out other<br />
pressing work while the reflectorless option allows us to get a general feel for<br />
heights of dune ridges which is particularly useful. The VRS has also worked<br />
well. Some of these coastal areas are very challenging but with Integrated<br />
Surveying we are always confident of getting good data.”<br />
Using the <strong>Trimble</strong> R8 to position the total station, Stratford carried out a<br />
resection to establish himself on the Ordnance Survey grid and was ready<br />
to go. Having a choice of GNSS or optical instruments provides positions<br />
always recorded to a six-figure OS grid value, which in turn can cut back on<br />
any post processing and give Stratford maximum flexibility for his surveys.<br />
Once data are collected they are downloaded back at the office and<br />
<strong>Trimble</strong> Business Center Software is used to display the data or to overlay<br />
collected data on to Google aerial maps. Additional analysis can be<br />
carried out in Esri ArcGIS software.<br />
Stratford concludes, “Spatial analysis is the key to our team truly understanding<br />
the changes. We’ve still a long way to go with this project but<br />
already, using overlays of our collected data, we can look back at old<br />
aerial photographs and identify clear differences between then and now.<br />
We expect to repeat our surveys annually, possibly more if we know a major<br />
storm has taken place, and build up a time series of topography. Through<br />
continued training we will ensure that we are taking advantage of the full<br />
functionality of our survey instruments and our project will continue to<br />
benefit as a result."<br />
See feature in GeoConnexion’s October 2011 issue: www.geoconnexion.com<br />
-3- Technology&more; 2012-1
Stable Footing at<br />
Berkeley’s <strong>Stadium</strong><br />
A major renovation of the football stadium at the University of<br />
<strong>Cal</strong>ifornia – Berkeley will provide protection against earthquakes.<br />
Tucked into the hillside at the mouth of Strawberry Canyon on the campus of the University of <strong>Cal</strong>ifornia at Berkeley<br />
(UCB), <strong>Cal</strong>ifornia Memorial <strong>Stadium</strong>—known simply as <strong>Cal</strong> <strong>Stadium</strong>—is considered one the most beautiful settings in<br />
college athletics. Since it opened in 1923, the stadium, which is listed on the National Register of Historic Places, has<br />
welcomed hundreds of thousands of fans to UCB football games and other events each year. But after nearly 90 years of<br />
service, <strong>Cal</strong> <strong>Stadium</strong> needs an update. The stadium has fallen behind the standards for services and facilities available at<br />
other large university stadiums, and will receive improvements including a new press box and renovations to concourses<br />
and concession areas. In addition, the playing surface will be lowered and new seating will provide better sightlines for<br />
spectators.<br />
While the modernization is important, the primary reason for the upgrade comes from deep below ground. <strong>Cal</strong> <strong>Stadium</strong><br />
sits astride the Hayward Fault, an active geologic fault that runs through the Berkeley area. Much of the renovation includes<br />
improvements that will reduce damage and protect human life in the event of an earthquake.<br />
UCB is home to strong academic programs in geophysics and engineering, and the university’s professors and scientists<br />
played an important role in developing ways to incorporate the best concepts of science and engineering into the new<br />
facilities. Rather than try to resist the motion of an earthquake, modern structures are designed to move with the quake.<br />
The new press box was designed to rest on its own pre-stressed concrete support walls and shock absorbers. It is structurally<br />
isolated from the rest of the stadium and can sway up to 30 cm (12 in) in a large quake. At the ends of the stadium,<br />
seating sections were removed and rebuilt as floating surface-rupture blocks that will allow the stadium to flex and move<br />
with even large-scale earthquakes.<br />
Technology&more; 2012-1<br />
-4-<br />
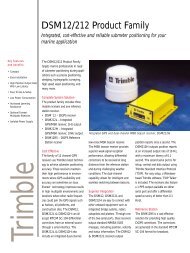
COVER STORY<br />
Chad Mathias (left) and Devin Finn conduct measurements at <strong>Cal</strong> <strong>Stadium</strong>. Finn's <strong>Trimble</strong> S6 provides control points for the <strong>Trimble</strong> GX used by Mathias.
The construction manager and general contractor, Webcor<br />
Builders, was required to preserve the stadium’s massive<br />
west wall and minimize disruption and environmental<br />
impact. Webcor selected F3 & Associates to provide surveying<br />
services for the project. One of the first activities was<br />
setting control and defining a center point and axis for the<br />
stadium coordinate system. F3 Principal Sean Finn said that<br />
F3 surveyors used a <strong>Trimble</strong> 5700 GPS System and <strong>Trimble</strong><br />
5601 DR200+ Total Station connected to <strong>Trimble</strong> Ranger®<br />
Handhelds running Survey Pro Software to establish discrete<br />
targets on the stadium wall and set control points<br />
around the stadium perimeter. After tying the stadium to the<br />
control and making measurements to the existing walls, F3<br />
worked with design and construction teams to make a collective<br />
decision on the location of the stadium center point.<br />
“It was complicated,” said Webcor Project Manager Victor<br />
Elliot. “We’re located on the fault and obviously there has<br />
been a tremendous amount of movement over the years. We<br />
are tying into an existing stadium and it was critical that we<br />
knew the point of origin. Sean and his surveying technology<br />
made it possible.”<br />
Surveying and Scanning on the Construction Site<br />
During demolition, stadium seating and structural components<br />
were removed, exposing the interior of the stadium’s<br />
west wall. F3 survey crews used a <strong>Trimble</strong> GX 3D Scanner to<br />
scan the newly exposed surfaces immediately after excavation.<br />
The crews used the scanner’s survey workflow to tie<br />
into the stadium control, ensuring that the data matched<br />
previous scans. While the <strong>Trimble</strong> GX conducted 360° scans,<br />
the F3 crew used a <strong>Trimble</strong> FX 3D Scanner to capture detailed<br />
scans in critical areas. By using the two scanners in a<br />
complementary fashion, the surveyors optimized the time<br />
spent on data collection. In the office, dedicated technicians<br />
used <strong>Trimble</strong> RealWorks® Software to combine the scans and<br />
model the columns and other components of the wall.<br />
Keeping the scans precisely on the control network is a major<br />
part of the project’s success. Over the course of the work,<br />
F3 teams have collected more than one hundred individual<br />
scans; each scan is precisely registered into the stadium<br />
control network. The result is a single 3D point cloud of the<br />
entire stadium, consisting of upwards of a billion points. The<br />
combined data of the two scanners provides a good picture<br />
of the stadium as well as the ability to zoom in on areas where<br />
more detail or dense data is needed. “That’s the beautiful<br />
part of scanning within a project datum,” Finn noted. “You<br />
can scan something and it drops right into the point cloud.”<br />
Campus officials were adamant about keeping the look<br />
and design features of the original stadium. Meeting this<br />
requirement called for detailed measurements and data on<br />
the existing structure. Accurate information was especially<br />
important in areas where new construction tied back into<br />
the original 1923 design. It was, Finn said, an ideal fit for<br />
scanning. For example, several sections of the stadium wall<br />
contain windows that are more than 7.6 m (25 ft) high. To<br />
fabricate new glass for the windows, glazing contractors need<br />
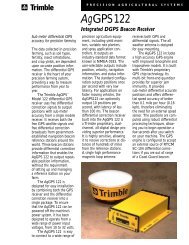
A gap in the stadium wall reveals the displacement caused by motion of the Hayward Fault. New construction will allow the stadium to move with the Fault's motion.<br />
-5- Technology&more; 2012-1
precise dimensions of the window openings. When<br />
the wall is fully exposed, the tops of the window<br />
openings can be up to 21 m (70 ft) above the ground.<br />
The F3 crews used the <strong>Trimble</strong> FX to scan each window<br />
opening, eliminating the need for scaffolding<br />
to measure the windows. F3 technicians created 3D<br />
models of the window openings and delivered fully<br />
dimensioned 2D drawings to the glass fabricators.<br />
The scanning data has a long lifetime. Following<br />
the initial deliverable, it’s common for a client or<br />
subcontractor to request additional information or<br />
detail. Rather than sending a survey crew back to<br />
the site, Finn can turn to the point cloud and extract<br />
new information from the existing models. It’s an<br />
important time saver, and is especially valuable in<br />
providing information about objects that have been<br />
concealed by subsequent construction. Webcor’s<br />
Elliot recalled an occasion when an architect needed<br />
additional information related to clearances for<br />
egress. “They asked for very specific locations and<br />
elevations of existing conditions,” Elliot said. “The<br />
beauty of the scan was that when we needed more<br />
information, F3 had the ability to just pull it up from<br />
the scan rather than have to revisit the site.” As stadium<br />
construction progressed, F3’s tasks evolved to<br />
include as-built documentation. They used <strong>Trimble</strong><br />
FX and <strong>Trimble</strong> CX scanners to measure the new<br />
press box and club level, capturing data on the steel<br />
and concrete structural elements.<br />
<strong>Cal</strong> <strong>Stadium</strong> illustrates how F3 combines <strong>Trimble</strong><br />
technologies to produce speed and precision. For<br />
example, they created a procedure that uses total<br />
stations as a quality check for the scanning. On<br />
each scanning task, crews use a <strong>Trimble</strong> S6 Total<br />
Station and direct reflex measurements to measure<br />
a number of discrete points in the scanned area. The<br />
office technicians bring the total station data into<br />
<strong>Trimble</strong> RealWorks to conduct additional checks<br />
and quality control. “The combination of scanning<br />
technology and surveying is the way it should be,”<br />
Finn concluded. “It takes a surveyor to orient a<br />
scan to a specific location on the earth. In the end,<br />
I believe that scanning should and will become an<br />
everyday part of survey life. I fully expect the scanner<br />
to become just another tool on the survey truck.”<br />
This article is an update to the feature article in POB's<br />
October 2011 issue: www.pobonline.com<br />
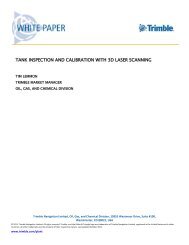
Top: Sean Finn approaches the stadium entry. Scanning<br />
provided precise measurement of the archway<br />
without need for scaffolds or lifts.<br />
Bottom: F3 surveyors prepare a scan using the <strong>Trimble</strong><br />
FX. They used the data to prepare detail drawings for<br />
fabricators and designers.<br />
Technology&more; 2012-1<br />
-6-
Restoring Arches<br />
In December 2008, a routine inspection of the Chaudière Bridge linking Ottawa, Ontario and Gatineau, Quebec<br />
revealed structural cracks in two of the bridge’s masonry arches. Because the Chaudière Bridge is a crucial interprovincial<br />
connector, Public Works and Government Services Canada (PWGSC) determined that both arches<br />
needed substantial rehabilitation.<br />
The project provided engineering and logistics challenges.<br />
Because of the 180-year-old bridge’s historical<br />
significance, its original structural characteristics needed<br />
to be preserved, and traffic demanded that restoration<br />
occur without completely closing the bridge or impacting<br />
the Ottawa River. Engineering teams developed a plan<br />
to install pre-fabricated concrete support panels into<br />
the arches, and PWGSC awarded the construction<br />
contract to Peter Kiewit Sons’ Infrastructure Group<br />
(Kiewit). Denis Dubois arpenteur-géomètre inc in Saint-<br />
Bruno-de-Montarville, Quebec, was selected to provide<br />
surveying services.<br />
The restoration required detailed measurements of the<br />
existing structure. “This work is ideal for 3D scanning,”<br />
Dubois explained. “It’s a challenge to capture the precise<br />
shape of an arch. Site access was difficult, and conventional<br />
total station surveys would be time-consuming<br />
and could not produce a comprehensive view of the<br />
arches.” The measurements needed to be absolutely correct.<br />
Once the panels were fabricated and delivered, they<br />
could not be changed.<br />
To gather the information, Dubois combined GPS and<br />
3D scanning to create a georeferenced 3D model of<br />
the arches. After establishing five control points via<br />
RTK GPS, the team used a <strong>Trimble</strong> VX Spatial Station<br />
to conduct the scan. Occupying the GPS points along<br />
the river, they collected 80,000 individual 3D points in<br />
roughly five hours. The points, spaced 5 cm (2 in) apart,<br />
were measured with a precision of 3 mm (1/8 in) and tied<br />
to the local geodetic coordinate system. In the office, the<br />
surveyors used <strong>Trimble</strong> RealWorks Software to integrate<br />
the scans and deliver 3D surfaces in DXF format to the client.<br />
After comparing the point cloud to previous engineering<br />
data, Kiewit Project Engineer Robert Cornell was<br />
confident they had the spatial and positioning information<br />
to build the arch panels. “I was surprised by how<br />
Denis used the VX to shoot the bridge with that amount<br />
of precision,” Cornell said. “The point cloud gave us the<br />
confidence to design and build our pre-fabricated panels<br />
with assurance that we could successfully complete this<br />
project.” Dubois said that the precision measurements<br />
and dense data were the keys to success. The data<br />
revealed irregularities in the arches that conventional<br />
surveying might have missed. “We produced better information<br />
in less time,” Dubois explained. “Without the<br />
scanning functionality, fieldwork would have stretched<br />
for many days, and produced less detail.”<br />
Seven months after the initial survey, twelve 20-ton<br />
concrete arch panels were ready for installation.<br />
Dubois’ survey team returned to the site, this time<br />
using the <strong>Trimble</strong> VX as a robotic total station to set<br />
control and align rails used to move the panels into<br />
place. Less than two years after the discovery of the<br />
deteriorating arches, the restoration was complete and<br />
all four lanes of the Chaudière Bridge were re-opened to<br />
traffic and pedestrians.<br />
See feature article in POB's June 2011 issue: www.pobonline.com<br />
-7- Technology&more; 2012-1
Surveying Sunken Suburbs in<br />
Christchurch’s “Orange Zone”<br />
After the June earthquake, engineers divided Christchurch<br />
into four zones representing whether repair<br />
and rebuilding were viable: green—yes; red—no;<br />
orange—need more data; and white—not yet mapped.<br />
Approximately 9,000 properties comprising the orange zone<br />
needed to be quickly surveyed to better determine whether<br />
they were “red” or “green.” For many of these properties, the<br />
main problem was land sinkage resulting from liquefaction—<br />
some land had sunk by up to 1.5 m (4.9 ft), making it less<br />
able to support construction. Engineers required survey<br />
data to understand what would be needed to bring land<br />
back above the flood level—and to determine whether it<br />
was worthwhile economically to do so.<br />
Tonkin & Taylor, Ltd, geotechnical consultants working for<br />
the Canterbury Earthquake Recovery Authority (CERA),<br />
awarded the Orange-zone survey contract to Paterson<br />
Pitts, providers of land survey and resource management<br />
services to New Zealand’s Otago region. GeoSystems<br />
New Zealand, Ltd, provided nine additional surveying<br />
systems comprising <strong>Trimble</strong> R8 GNSS Rovers and <strong>Trimble</strong><br />
TSC3 Controllers running <strong>Trimble</strong> Access Field Software.<br />
The company’s iBASE Network, based on <strong>Trimble</strong> VRS<br />
technology, has reference stations installed inside and<br />
outside the quake zone and provided control; access to<br />
the network was free for all surveyors during the initial<br />
recovery period.<br />
Due to the large surveying area, time constraints and number<br />
of surveyors from different companies, the project’s<br />
success relied on all data being consistent. “We couldn’t<br />
afford to have any mistakes,” said Paterson Pitts Project<br />
Manager Mike Botting. “People’s livelihoods and properties<br />
were at stake.” To ensure that consistency, GNSS surveying<br />
expert Reece Gardner of 3D World in Christchurch defined<br />
all surveying procedures for the project. Gardner was also<br />
responsible for processing, quality checking and ensuring<br />
data completeness.<br />
Up to 20 surveying teams were on the ground each day;<br />
at peak demand, the iBASE network reached a record<br />
number of concurrent users. Surveyors focused on the<br />
Technology&more; 2012-1<br />
Earthquake Recovery in<br />
-8-<br />
In the pre-dawn quiet on September 4, 2010, New<br />
Zealand’s second largest city, Christchurch, was<br />
struck by a magnitude 7.1 earthquake—with thousands<br />
of aftershocks following the quake since then.<br />
In particular, a magnitude 6.3 quake on February<br />
22, 2011 resulted in 181 fatalities and wreaked havoc<br />
on buildings, city infrastructure and land already<br />
vertical movement of each property, taking measurements<br />
every 10 m (32.8 ft), or 8 to 10 measurements per property.<br />
They also measured from the berm and, if possible, the<br />
centerline of the street, which typically didn’t move as<br />
much as the surrounding land. Most points gathered were<br />
GNSS measurements, with GLONASS satellites proving<br />
especially valuable in areas of tree canopy. The internal<br />
modem on the TSC3 controller also made data capture<br />
easier because no external call phone was required to<br />
access the network.<br />
The project was completed in just two weeks due to the<br />
streamlined project processes and team efficiency. “It was<br />
just basic survey work, but at such a large scale—over<br />
860 ha (2,125 acres)—that the VRS network and the speed<br />
at which we could operate made a significant difference,”<br />
said Botting. “Teams could go straight to a site and start<br />
surveying in a couple of minutes thanks to the network.”
Christchurch, New Zealand<br />
weakened by the September quake. Although<br />
smaller in magnitude, the February event was<br />
shallower and harder, and produced one of the<br />
world’s highest recordings of peak ground acceleration<br />
at 2.2g. Yet another major quake, a magnitude<br />
6.4 on June 13, 2011, significantly set back the city’s<br />
recovery.<br />
Post-Quake 3D Scan Aids in<br />
Christchurch Cadastral Recovery<br />
Within hours of the February earthquake, Christchurch’s<br />
central business district (CBD) was<br />
cordoned off behind army barricades as strong<br />
aftershocks continued to bring down city buildings. A team<br />
of spatial imaging experts ventured into this virtual war<br />
zone to capture 3D data of the damaged city.<br />
Through GeoSystems New Zealand, Ltd, <strong>Trimble</strong> offered its<br />
MX8 Mobile Spatial Imaging System with an operator to the<br />
government agencies responsible for all spatial data. The<br />
offer was immediately accepted.<br />
The <strong>Trimble</strong> MX8 system was installed on GeoSystem’s<br />
Business Development Manager Martin Hewitt’s SUV. A<br />
“pod” on the vehicle’s roof held two scanners, installed<br />
at 270° to each other, and four cameras—three facing<br />
forward and one rear-facing. A rack of computers running<br />
<strong>Trimble</strong> Trident Data Capture Software was installed<br />
where the passenger seat had been. An Applanix POS<br />
LV System, using its integrated combination of inertial,<br />
GNSS and distance measurement technologies, provided<br />
precise position and heading information under even the<br />
toughest conditions.<br />
With the assistance of the Ministry of Civil Defence and<br />
Emergency Management, the three-person spatial imaging<br />
team gained entry to the CBD after an intensive introduction<br />
that included briefings on safety procedures plus hazards<br />
such as major aftershocks and sinkholes. Still, the team was<br />
in for a shock. Says Hewitt, “It was eerie and so surreal.” Even<br />
though Hewitt is a Christchurch local, with familiar buildings<br />
now crumbled it was often difficult for him to determine<br />
where he was apart from the GNSS data.<br />
Data capture was completed in just two days, even though<br />
debris and other obstacles limited driving speeds to about<br />
20 km (12 mi) per hour. <strong>Trimble</strong>'s Montreal office then<br />
postprocessed the data, using control data from a <strong>Trimble</strong><br />
NetR9 Reference Station in Geosystem’s iBASE Network.<br />
To make the CBD safe for rebuilding, numerous damaged<br />
buildings have been rapidly demolished and cleared.<br />
This process has eliminated many survey marks, making<br />
re-measuring property boundaries extremely difficult.<br />
Additionally, the physical boundary of many commercial<br />
properties came down to the occupation on the site as the<br />
primary definition of the property. When buildings were<br />
cleared away, those physical occupations were lost.<br />
“Thanks to the scanning operation, we have a unique 3D<br />
model of the CBD accurate to around 5 cm (2 in),” says<br />
Hewitt. “And it’s available for use by anyone who requires<br />
it for the recovery process, future development, or for a<br />
historical point of view, potentially making the <strong>Trimble</strong><br />
MX scanning data critically important in the cadastral<br />
recovery process.”<br />
-9- Technology&more; 2012-1
Technology&more; 2012-1<br />
New Connections to<br />
Washington’s Airport<br />
Located in the Northern Virginia suburbs west of Washington, DC, Washington Dulles International Airport is the largest<br />
and busiest airport in the Washington/Baltimore area. In 2010, it handled more than 23.7 million passengers and the bulk<br />
of the region’s international flights. But for passengers, traveling between downtown Washington and the Dulles airport<br />
is a 48-km (30-mi) trip that requires a taxi, bus or car, and can take an hour or more depending on traffic. But a new transit<br />
option is coming soon.<br />
Thanks to the Dulles Corridor Metrorail Project, work is<br />
underway to extend Washington’s Metrorail rapid transit<br />
system to provide rail service to Dulles. When complete, the<br />
Metrorail extension will serve the airport and the large employment<br />
centers of Northern Virginia. Construction began<br />
on the project’s first phase in March 2009, with completion<br />
planned for 2013. The lead contractor on Phase 1 is Dulles<br />
Transit Partners, LLC (DTP), a team led by Bechtel.<br />
Everything about the project is tight, including the site,<br />
schedule and budget. According to DTP Survey Manager Joe<br />
Betit, PLS, the scale and complexity of the project requires<br />
advanced surveying technology and rigorous survey techniques,<br />
tied together with well-defined processes and rapid,<br />
reliable communications.<br />
The DTP surveyors draw from a variety of positioning tools.<br />
Optical instruments include digital levels, total stations and<br />
3D scanners. Each technology offers unique strengths, and<br />
Betit’s team is skilled at selecting the best approach for each<br />
task on the project. Surveyors and contractors use GNSS for<br />
site positioning, including a <strong>Trimble</strong> GNSS Reference Station<br />
and <strong>Trimble</strong> GCS900 Grade Control Systems for machine<br />
control. The surveyors use GNSS RTK for preliminary layout,<br />
and for staking pilings to support structures and excavations.<br />
When they are too far from the DTP GNSS reference station,<br />
-10-<br />
they connect to the KeyNetGPS, a RTN based on <strong>Trimble</strong><br />
VRS technology. As construction progresses to the steel and<br />
concrete phases, the surveyors turn to <strong>Trimble</strong> total stations<br />
and digital levels. The project calls for more than 5 km<br />
(3 mi) of elevated track in each direction (inbound and<br />
outbound), which requires precise measurements and<br />
positioning of piers and guideways to make sure everything<br />
fits correctly.<br />
Monitoring is a big part of DTP surveying activities. Many of<br />
the excavations are along highway medians or in developed<br />
areas, and must be monitored to ensure that existing structures<br />
aren't subsiding or slipping into the new construction.<br />
The team monitors active excavations once a day, issuing<br />
alerts if they detect movement in excess of 6 mm (1/4 in).<br />
“High-precision instruments and EDMs are critical to our<br />
mode of surveying,” Betit said. “For much of the optical<br />
work, our crews use <strong>Trimble</strong> S6 or S8 Total Stations, or a<br />
<strong>Trimble</strong> VX Spatial Station.” A <strong>Trimble</strong> GX 3D Scanner collects<br />
information for quality control, volume computations<br />
and excavation monitoring. Control for the positioning work<br />
comes from a network of 2,000 reference points, previously<br />
surveyed and established, alongside the project corridor; the<br />
surveyors perform resections to establish instrument coordinates.<br />
Behind the scenes, a common database for project<br />
information helps prevent systematic positioning errors.
The Connected Site<br />
The project has introduced challenges<br />
beyond the physical needs of construction<br />
machines and materials. DTP needs to move<br />
a large amount of information among the job’s<br />
offices, trailers, machines and personnel. To<br />
accomplish this, the project utilizes a communication<br />
system integrated with DTP’s<br />
secure Information Technology (IT) network.<br />
Creating the <strong>Trimble</strong> Connected Site for the<br />
Dulles project required strong collaboration<br />
between <strong>Trimble</strong> and DTP to ensure security,<br />
reliability and performance. “The key to success<br />
was open communication of the goals<br />
and system requirements between DTP and<br />
<strong>Trimble</strong>,” said DTP Senior Project IT Manager<br />
Misha Nikulin. “The collaboration addressed<br />
substantial technical issues as well as strategic<br />
business IT concerns.”<br />
Many of the site’s communications needs are<br />
handled using wireless technologies. DTP<br />
installed radio-frequency (RF) communications<br />
equipment at fixed locations along the<br />
alignment. In other areas, trailer-mounted,<br />
solar-powered wireless access points ensure<br />
signal strength and extend secure IT wireless<br />
service to the ends of the project corridor.<br />
GNSS corrections and two-way machine<br />
control data are carried by the DTP network<br />
between the GNSS base station and <strong>Trimble</strong><br />
access points, where it switches to <strong>Trimble</strong><br />
communications equipment for delivery<br />
to the construction machines. “It’s a very<br />
complex, two-way communication system,”<br />
Betit said. “A construction machine is basically<br />
like a printer in one of our offices—it’s<br />
treated like a device inside the DTP network.”<br />
Job files, work requests and monitoring data<br />
move quickly and seamlessly. The system<br />
also transmits GNSS data for single-base RTK<br />
positioning using the project’s reference station,<br />
and provides the wireless internet link<br />
needed to access the KeyNetGPS RTN.<br />
DTP’s instrumentation and two-way communications<br />
network is especially important<br />
in troubleshooting. The system makes it<br />
possible to observe machine operations, and<br />
even capture as-built information in real<br />
time. If there is a suspected problem, office<br />
technicians can look at the design models<br />
onboard a particular machine and can push<br />
a new model into the field when needed. The<br />
survey crews use the project’s wireless system<br />
in the field as they work on their laptop computers. They have direct access<br />
to the project IT network, and can obtain and deliver up-to-date plans and<br />
survey data.<br />
The site’s connectivity and attention to detail have paid off. As part of the<br />
project’s quality assurance, DTP crews conduct post-construction as-built<br />
surveys when a construction stage is completed. The as-builts are compared<br />
to the design, and any differences must be resolved by adjusting the alignment<br />
of the track to be laid on the concrete structures. Betit said that there has been<br />
no need for any revisions. “We put a lot of effort into our survey control and<br />
processes,” Betit said in discussing the success, “and we use state-of-the-art<br />
equipment. This has been a major savings for the project."<br />
See feature article in POB's January issue: www.pobonline.com<br />
-11- Technology&more; 2012-1
Pre-Surveying<br />
Helps Keep<br />
Railroads on<br />
Track<br />
The need for speed and ride comfort for both passenger<br />
and freight operations puts high demands on the<br />
fundamental elements of railway infrastructure—the<br />
roadbed and tracks. Roadbed and track quality must be<br />
established during initial construction and maintained over<br />
time. This involves proper ballast laying and grading, sleepers<br />
(ties) positioning, and, especially, ballast tamping and<br />
compressing for exact rail positioning. Since much of the<br />
work—whether new construction or routine maintenance—<br />
depends upon accurately establishing or verifying the track<br />
position, high-accuracy survey technology is critical.<br />
Track Renewal in Central Germany<br />
All photos by Bernd Schumacher<br />
In 2011, Germany’s primary railway service provider Deutsche Bahn AG awarded a contract to Spitzke SE, one of Germany’s<br />
biggest rail infrastructure companies, for a track-renewal project in the state of Hessen. The project required<br />
replacing the existing sleepers and rails along roughly 8 km (5 mi) of the route between the towns of Sontra and Cornberg.<br />
Part of a main north/south line, the route is used primarily by freight trains as well as regional and night passenger trains.<br />
As a first step, a track-renewal train replaced the old<br />
sleepers and rails with new ones. Next, the approximately<br />
placed track was precisely aligned, both horizontally and<br />
vertically. For this, Spitzke SE used a Stopfexpress 09-3X<br />
tamping machine from Plasser & Theurer. These huge,<br />
rail-bound machines raise the track by the required<br />
amount, compress the ballast beneath every sleeper<br />
using hydraulic tamping picks, and perform the lateral<br />
alignment during the same run. The amount of horizontal<br />
or vertical correction required depends on the track<br />
deviation from its specified position after track-laying or<br />
ballast maintenance work has been done. This deviation<br />
is determined by a process called pre-surveying.<br />
“Before starting any tamping run, the pre-surveying process<br />
precisely captures the current track position in order<br />
to determine the deviation and to obtain the right lifting<br />
and displacement values for the track,” explains Spitzke<br />
SE Surveying Engineer (Dipl. Ing. (FH)) Falko Soffner, in<br />
charge of pre-surveying tasks for the Sontra/Cornberg<br />
track renewal project.<br />
Technology&more; 2012-1<br />
-12-<br />
To perform pre-surveying work, Spitzke SE uses the<br />
<strong>Trimble</strong> GEDO® CE Trolley System. This track measurement<br />
system consists of two lightweight trolleys, each of<br />
which can be easily moved along the rails by the surveyor<br />
or assistant. One trolley is equipped with a <strong>Trimble</strong> S-series<br />
Total Station, while the second carries a fixed prism.<br />
The trolleys also have sensors to measure the distance<br />
between the rails, the cant (superelevation) and other values.<br />
All the data is transferred wirelessly to a <strong>Trimble</strong> TSC2<br />
or TSC3 Controller, which calculates the track deviation<br />
from the specified position. The trolley system, combined<br />
with <strong>Trimble</strong> GEDO Vorsys, <strong>Trimble</strong> GEDO Office and<br />
<strong>Trimble</strong> GEDO Tamp software, provides railway-level accuracy<br />
with operational speed and flexibility.<br />
Measurements are made using control points typically<br />
installed in each catenary support. The total station accurately<br />
measures the distance and the height difference<br />
to the control point and sends the data to the TSC2 (or<br />
TSC3) controller. The measurement is repeated at the<br />
next catenary support. The prism trolley is then moved
ack to the position captured at the first support, and<br />
the prism's position is measured. This creates an optical<br />
chord between the measured coordinates. When the<br />
prism trolley is moved along the track, the total station<br />
exactly follows the prism displacements and records any<br />
track deviation from the optical chord. The data is immediately<br />
evaluated by the TSC2 and used to calculate<br />
the actual position data.<br />
Since the full set of alignment data is stored in the TSC2,<br />
the vertical and horizontal shifts, the gauge and cant<br />
(superelevation) values, as well as all the significant points<br />
where the track geometry changes can be seen at any<br />
time. This is a big advantage over other methods which<br />
require manual calculation of the actual values. Because<br />
the surveying work is often performed very shortly before<br />
the tamping machine starts working, decisions on the<br />
tamping run parameters, such as the amount of ballast<br />
required, must be applied on short notice. Having accurate<br />
data readily available as early as possible makes the<br />
construction manager’s life a bit easier.<br />
A Quick Alternative to Manual Pre-Surveying<br />
The <strong>Trimble</strong> GEDO CE Trolley System offers significant<br />
advantages over conventional surveying technology for<br />
rail applications. Manual pre-surveying is a very lengthy<br />
and labor-intensive procedure, involving manual sighting,<br />
calculation and marking of data on the track. A<br />
well-organized and experienced team of three persons<br />
can survey approximately 600 m/hr (0.37 mi/hr) in one<br />
pass, but needs three passes to collect the full amount of<br />
information.<br />
By comparison, the trolley system requires only a twoperson<br />
crew and one pass to collect all the data, moving<br />
at speeds of 1,200 m/h (0.75 mi/h) to 1,500 m/h (0.93<br />
mi/h). This results in staff costs about six times lower<br />
than with manual pre-surveying. In addition, the trolley<br />
system’s measurement speed reduces the amount of<br />
expensive tamper time and the digital capture, transmission<br />
and calculation of data eliminates numerous<br />
potential sources of human error.<br />
“The time needed for pre-surveying is particularly significant,<br />
because it must be done so often. Track renewal<br />
requires three successive tamping runs; pre-surveying is<br />
essential before each,” explains Soffner. “At completion,<br />
a final check measurement must be carried out, and<br />
about six weeks after opening the line to traffic, another<br />
tamping run requires pre-surveying as well. Obviously,<br />
there are numerous reasons to carry out pre-surveying<br />
as quickly as possible, and the <strong>Trimble</strong> GEDO CE Trolley<br />
System helps us to reach maximum efficiency.”<br />
-13- Technology&more; 2012-1
Preserving Ancient Artwork<br />
More than 40,000 years ago, humans living in Europe left evidence of the beginnings of society and culture. In addition<br />
to the everyday rigors of hunting, gathering and simple survival, the prehistoric people began to document their lives<br />
and environment. Some of this documentation remains today, in the form of drawings and pictographs in the caves<br />
where the people lived. This early artwork—typically on cave walls or other large natural facades—is known as parietal art.<br />
In the Catabria region of the Principality of Asturias in northern<br />
Spain, two caves—La Lluera and El Pindal—are home to an<br />
array of paintings, inscriptions and sculptures created during<br />
the Paleolithic Era. The region is designated as a World<br />
Heritage Site by the United Nations Educational, Scientific<br />
and Cultural Organization (UNESCO). Part of this designation<br />
calls for local organizations to preserve the artifacts and<br />
conduct scientific research that protects the sites and shares<br />
the historical information. In support of this effort Ramón<br />
Argüelles, a student at the University of Oviedo, conducted<br />
studies and surveys of the artwork in the La Lluera and El<br />
Pindal caves.<br />
Ancient Artisans<br />
Parietal art provides important clues to how humans lived<br />
during the Paleolithic Era. It often depicts the animals encountered<br />
by the humans as well as outlines of human hands<br />
and fingers. Artists used chisels, scrapers and other stone<br />
tools to produce drawings and diagrams that have lasted for<br />
millennia. They created colors by mixing local minerals with<br />
animal fats, applying the color to the walls using fingers or<br />
brushes made from plant fiber or bundles of hair. The art in<br />
Technology&more; 2012-1<br />
-14-<br />
the La Lluera and El Pindal caves consists of drawings of fish,<br />
aurochs (an ancestor of modern cattle), deer, horses, goats—<br />
and possibly a mammoth.<br />
The art in the two caves is interesting because it is threedimensional.<br />
The ancient artists combined carving with<br />
painting to create images of animals. They prepared the<br />
work surface, sometimes by fashioning a chiseled “canvas”<br />
on which they then painted the figures. In other works,<br />
artists incorporated the rock’s natural texture into the<br />
drawn or chiseled figure. The most notable art in La<br />
Lluera is called the Gran Hornacina, a natural cavity that<br />
Paleolithic artists stained with ocher stripes mixed with<br />
gray-blue accents. In one location, the artists engraved a<br />
panel 3 m wide and 1 m high (9.8 by 3.3 ft). It contains the<br />
most beautiful images of the cave: a group of six or seven<br />
aurochs and a horse. The animals appear to be descending<br />
a hill, surrounded by natural furrows in the stone wall.<br />
Archaeologists estimate that the Gran Hornacina art was<br />
created between 16,500 and 21,000 years before present<br />
times (BP). The El Pindal art was done between 12,000 and<br />
14,500 years BP.
Capturing Underground Art<br />
The traditional approach to documenting cave art includes conventional<br />
surveying combined with graphic and textual documentation.<br />
Terrestrial photogrammetry has been used to document cave art; it<br />
can produce high-quality 3D models. But precise metric studies have<br />
often been limited by the location of the cave art. The artwork in El<br />
Pindal is roughly 240 m (790 ft) inside the caves. Access is only by foot,<br />
and even that is challenging. Total darkness, high humidity, low temperatures<br />
and irregular, unstable footing combine to create a difficult<br />
environment for precise location and documentation of the artwork.<br />
Even simple photography of 2D parietal art requires heavy camera<br />
equipment and extensive lighting. Capturing the 3D artwork in La<br />
Lluera and El Pindal is even more challenging; researchers must pay<br />
close attention to lighting and camera positions to accurately capture<br />
the scene. In recent years, 3D scanning has emerged as a valuable tool<br />
for archaeologists. The scanners can collect precise, detailed data on<br />
the surfaces to create 3D models and images.<br />
To conduct the scanning, Argüelles selected a <strong>Trimble</strong> VX Spatial<br />
Station. He determined that the <strong>Trimble</strong> VX was the best option to<br />
collect the information needed to accurately depict the artwork. This<br />
included tightly spaced 3D points as well as high-resolution digital<br />
images. The compact size and light weight of the <strong>Trimble</strong> VX made it<br />
easier to carry into the rugged caves, and the instrument could readily<br />
withstand the cold, wet conditions deep underground.<br />
To capture the Gran Hornacina in La Lluera, Argüelles completed scans<br />
from two locations, collecting more than 87,000 individual points and<br />
18 digital images with the <strong>Trimble</strong> VX. In El Pindal, Argüelles scanned<br />
three different panels, gathering more than 55,000 points. In addition<br />
to the internal camera of the <strong>Trimble</strong> VX, Argüelles used a digital<br />
SLR camera specially equipped for the difficult lighting conditions.<br />
Argüelles paid special attention to the positioning the instrument in<br />
the cave; he needed to gather complete information and prevent any<br />
voids in the scanned data. In order to capture the detail of the rock<br />
surface, Argüelles set the <strong>Trimble</strong> VX to collect points with spacing of<br />
1 mm (0.003 ft).<br />
The field data was downloaded from the <strong>Trimble</strong> CU Controller<br />
directly into <strong>Trimble</strong> RealWorks Software. Argüelles used the software<br />
to register the scans and manage and visualize the dense data sets.<br />
He created both mesh and rendered 3D surfaces, and then added the<br />
digital images to produce detailed orthophotos of the artwork. The 3D<br />
models can be loaded into the <strong>Trimble</strong> RealWorks Viewer for use and<br />
analysis by researchers around the world. The data can be used for<br />
multimedia animations and to build perfectly scaled 3D replicas of the<br />
artwork. With the successful completion of the work at La Lluera and<br />
El Pindal, Argüelles is now conducting further research in the use of<br />
3D scanning for mining and other underground applications.<br />
-15-<br />
Technology&more; 2012-1
Customizing <strong>Trimble</strong> Access<br />
There’s a new way to improve surveying performance and productivity in the field. The <strong>Trimble</strong> Access Software<br />
Development Kit (SDK) enables software developers to create customized applications and make them available for<br />
sale through the <strong>Trimble</strong> store. The SDK provides a focused, step-by-step approach to developing and integrating<br />
new modules into <strong>Trimble</strong> Access Field Software. The result? Streamlined workflows, new applications and customized<br />
solutions that provide a tight fit to the needs of surveyors and their clients.<br />
<strong>Trimble</strong> users have put the <strong>Trimble</strong> Access SDK to work<br />
around the world. In China, a special application created for<br />
electric utilities makes field computations and stakeout faster<br />
and easier. A developer in Spain used the SDK to implement<br />
trigonometric leveling functionality for <strong>Trimble</strong> total stations.<br />
Another developer has created an automated process for setup<br />
and orientation of a total station that matches a required<br />
workflow. Other examples include applications that simplify<br />
data collection procedures to enable non-trained surveyors<br />
to follow basic survey processes.<br />
The <strong>Trimble</strong> Access SDK was developed to meet the increasing<br />
volume and variety of specialized applications for <strong>Trimble</strong><br />
surveying systems. According to Jason Rossback, <strong>Trimble</strong>’s<br />
third-party solutions manager, the SDK is a professional-grade<br />
tool for use by distributors, end users and other developers<br />
familiar with Microsoft Visual Studio and C++ programming.<br />
It provides a platform to enable surveyors to use <strong>Trimble</strong><br />
surveying instruments and systems to address specific<br />
customer or project requirements. And it paves the way for<br />
<strong>Trimble</strong> systems to be used as the positioning components<br />
for integrated systems involving other third-party solutions<br />
or hardware. The customized approach can simplify field<br />
operations and increase surveying productivity.<br />
<strong>Trimble</strong> Access SDK consists of software, documentation and<br />
support that enable a software developer to create applications<br />
that are integrated into <strong>Trimble</strong> Access software.<br />
The SDK software components include:<br />
• An applications programming interface (API), which allows<br />
a user-generated program to interact with <strong>Trimble</strong> Access<br />
and utilize the program’s general survey functions;<br />
• A <strong>Trimble</strong> Access emulator, which increases programming<br />
productivity by providing a convenient, immediate tool for<br />
testing new code, and;<br />
• Sample source code, which the developer can study and<br />
modify to create new applications.<br />
In addition to these software components, the <strong>Trimble</strong> Access<br />
SDK includes a dedicated program of technical support.<br />
As developers create their new applications, they can tap into<br />
the knowledge of <strong>Trimble</strong> specialists and software developers.<br />
Technology&more; 2012-1<br />
-16-<br />
All photos by Bernd Schumacher<br />
SDK users also have access to an organization within the<br />
<strong>Trimble</strong> Connected Community where they can exchange<br />
information with <strong>Trimble</strong> experts and other developers.<br />
When using the SDK, a developer gains access to the powerful<br />
functions built into <strong>Trimble</strong> Access. An application can<br />
incorporate the <strong>Trimble</strong> Access library of calculations, data<br />
management, forms and displays into a customized workflow.<br />
As a result, the new application can have the same look<br />
and feel of other <strong>Trimble</strong> Access modules. Because the SDK<br />
handles all interfacing with <strong>Trimble</strong> surveying instruments—<br />
including GPS/GNSS receivers and total stations—the<br />
developer can concentrate on the application and workflow.<br />
Developers can save time by utilizing existing functions in
<strong>Trimble</strong> Access. For example, by using existing routines for instrument setup<br />
and orientation, coordinate system computations and coordinate geometry, a<br />
programmer can avoid months of work.<br />
“The bottom line for the developer is significant time savings and shorter test<br />
cycles,” Rossback said. “It’s a powerful tool for users to have customized applications<br />
that are tightly integrated with their <strong>Trimble</strong> hardware and software.” He noted<br />
that most customized applications create standard <strong>Trimble</strong> Access job files<br />
that operate seamlessly with <strong>Trimble</strong> Business Center desktop software and the<br />
<strong>Trimble</strong> Connected Community.<br />
Rossback expects the number of customized applications to grow. Disciplines<br />
such as archaeology, forensics and oil and gas exploration require specialized<br />
procedures for surveying, and are likely areas for developers to use the SDK.<br />
Rossback pointed out that <strong>Trimble</strong> developers used the SDK to create the new<br />
Land Seismic module for <strong>Trimble</strong> Access, and significantly reduced the time<br />
needed to develop and test the new module.<br />
Sharing the Wealth<br />
Some developers may wish to share—or sell—their applications, while others<br />
may want to provide applications only to in-house users. To address these<br />
needs, all applications created with the <strong>Trimble</strong> Access SDK are delivered via<br />
the <strong>Trimble</strong> Access Installation Manager (TAIM). <strong>Trimble</strong> provides the developer<br />
with control over the distribution and use of customized applications, preventing<br />
unauthorized use. It also ensures a smooth process to install and license<br />
custom applications onto <strong>Trimble</strong> controllers. To assist in distributing an<br />
application in multiple countries, the <strong>Trimble</strong> Access SDK uses the same<br />
language translation tools as <strong>Trimble</strong> Access. When an application is completed,<br />
developers can translate it into different languages. Developers can create<br />
new applications for a single user, a group of users, or for distribution around<br />
the world. During development, developers can collaborate with <strong>Trimble</strong>’s<br />
software experts for detailed, high-level technical support. <strong>Trimble</strong> tests the<br />
applications to confirm that they can be deployed via TAIM to function on the<br />
desired hardware.<br />
Some organizations want custom applications but don’t have the programming<br />
capability. To assist these groups, <strong>Trimble</strong> has identified a number of qualified<br />
developers (known as <strong>Trimble</strong> Access Development Partners) capable of<br />
creating customized applications using the SDK. Interested firms can contact<br />
<strong>Trimble</strong> (see web link below) for assistance in getting their solution developed<br />
by a Development Partner.<br />
<strong>Trimble</strong> Access applications operate on all platforms supported by <strong>Trimble</strong>,<br />
including the Windows and Windows Mobile environments. They can run on<br />
the <strong>Trimble</strong> TSC2 and <strong>Trimble</strong> TSC3 Controllers, <strong>Trimble</strong> Tablet, <strong>Trimble</strong> CU<br />
and onboard the <strong>Trimble</strong> M3 Total Station. The SDK is also supported on the<br />
<strong>Trimble</strong> GeoExplorer ® GeoXR Network Rover. Field data created using <strong>Trimble</strong><br />
Access can be shared using <strong>Trimble</strong> Access Sync and the <strong>Trimble</strong> Connected<br />
Community. For more information, visit www.trimble.com/developer.<br />
-17- Technology&more; 2012-1
Technology&more; 2012-1<br />
GIS Technology Vehicle:<br />
“Superhero”<br />
By day, the GIS Technology Vehicle supports asset<br />
mapping; by night, the vehicle serves as mobile<br />
command center for public safety operations in<br />
Monroe County, NY.<br />
In 2008, a suspected drug dealer fled into one of Monroe<br />
County’s many wooded wetland areas. Winter snows<br />
covered the maze of frozen marshes and ponds, making<br />
pursuit dangerous for law enforcement personnel. The<br />
suspect’s body was found in the marsh the next spring.<br />
Officials in the county’s Department of Environmental<br />
Services (DES) believed the manhunt could have ended<br />
differently if their vast GIS and GNSS resources could have<br />
been put into the hands of public safety personnel onsite.<br />
The idea for a mobile GIS vehicle was born.<br />
Monroe County, New York, is home to 750,000 residents living<br />
in 19 towns, 10 villages and the state’s third largest city,<br />
Rochester. More than a decade ago, the county launched<br />
an enterprise GIS based on the concept of two-way data<br />
sharing among the county and local governments. From<br />
the start, the county adopted <strong>Trimble</strong> GNSS technology to<br />
collect asset information to populate the GIS.<br />
Today, the DES’ GIS Division (GISD) supports nearly every<br />
county office with mapping services. The department<br />
decided to improve access to data collection and GIS<br />
capabilities for the entire 1898 km 2 (733 mi 2 ) county by<br />
taking the services on the road. Rochester’s Eastman<br />
Kodak Company made the concept a reality by donating<br />
a van.<br />
Monroe County turned the van into a GIS Technology<br />
Vehicle by installing three workstations, ruggedized laptops,<br />
a 36-inch plotter, printers, a SmartBoard, big-screen<br />
monitor, radios and wireless communications equipment.<br />
The onboard computers use this communications link to<br />
access the enterprise GIS as well as the county’s GNSS base<br />
stations. During asset inventories, GIS feature layers can<br />
be updated from the field with data uploaded directly from<br />
the mobile GNSS receivers carried in the van. Data can<br />
also be broadcast to the county’s Emergency Operations<br />
Center (EOC).<br />
The GISD rotates GNSS equipment from its main office to<br />
the vehicle, but it usually carries <strong>Trimble</strong> GPS Pathfinder®<br />
-18-<br />
Pro XR receiver backpack systems and newer GPS Pathfinder<br />
ProXH receivers. These mapping receivers are used<br />
alongside <strong>Trimble</strong> GeoXT GNSS handhelds. The county<br />
has established three base stations including two <strong>Trimble</strong><br />
R8 GNSS receivers. The survey rovers typically receive<br />
real-time corrections in the field through cell-phone<br />
connection, while data from the mapping receivers is<br />
post-processed in the vehicle with <strong>Trimble</strong> GPS Pathfinder<br />
Office software. In both cases, the GNSS data is differentially<br />
corrected before it reaches the enterprise GIS.<br />
During the day, the vehicle works onsite at major engineering<br />
and construction projects, generating GIS<br />
maps of where utility assets and property boundaries<br />
are located. As construction progresses, crews capture<br />
as-built data with the GNSS receivers to instantly update<br />
the enterprise GIS. Accurate records of newly installed or<br />
relocated infrastructure are never more than a few hours<br />
out of date.<br />
When not involved in a construction or repair project,<br />
the vehicle is dispatched throughout the county for asset<br />
mapping using the <strong>Trimble</strong> GeoXT GNSS handhelds. The<br />
vehicle was also used extensively during a county-wide<br />
project to extend fiber-optic cables to all towns and hamlets.<br />
The GIS shows the field crews precisely where parcel<br />
boundaries are so that trenching on private property can
e avoided whenever possible. And if field crews must enter a property, they can address the homeowner by name<br />
when making the request—thanks to the GIS database.<br />
DES Senior Operations Manager Steve Schwartzmeier likens the vehicle to a "superhero" that has one identity by day and<br />
another on nights and weekends.<br />
“It’s used day-to-day for just about any mapping service you can imagine [related to] county maintenance, operations<br />
and construction,” Schwartzmeier said. “Then at night, we serve a completely different audience, bringing a full complement<br />
of mapping capabilities to fire, police and Emergency Management folks.”<br />
The vehicle is often requested by the Monroe County Director of Public Safety. These duties are typically divided into<br />
emergency and non-emergency assignments. The majority of the planned, non-emergency activities involve festivals<br />
and other public events that are likely to draw large crowds. The vehicle plays a critical role in coordinating public safety<br />
logistics in these situations.<br />
At an annual air show, for example, the vehicle arrives in advance and its crew maps out the locations of vendor booths,<br />
power sources and staging areas, as well as public evacuation routes and emergency vehicle ingress/egress lanes. These<br />
points are added as layers to the GIS and maps are printed in the van for distribution to the public safety personnel who<br />
work the show.<br />
At least once a month, the GIS Technology Vehicle is called to the scene of a rapidly evolving emergency. Recently, an<br />
escapee from a detention facility was eluding the state police. The van arrived just as the police lost their communications<br />
link to the EOC. They quickly moved to the GIS van for onsite command operations. GIS maps and color air photos of the<br />
area were printed onboard and circulated among the officers for use on foot and in the air. The result was an incident-free<br />
apprehension—a more positive outcome than the situation three years earlier that first inspired the van’s creation.<br />
“The hard-copy maps we provided from our large-format plotter gave the officers a good feel for the surrounding terrain,<br />
and they made an apprehension within an hour or two,” said GISD Operations Manager Scott McCarty.<br />
The GIS Technology Vehicle is a resounding success and is now in great demand county-wide. The van has saved thousands<br />
of personnel hours both in the field and in the office. Its greatest benefit is that it puts information—some of it<br />
potentially life-saving—into the hands of experts when and where they need it.<br />
“We are able to get information out into the field,” said Schwartzmeier, “and good information supports better<br />
decision making.”<br />
-19- Technology&more; 2012-1
Once again, we included our <strong>Trimble</strong> Survey<br />
Facebook fans in judging this ever-popular<br />
photo contest. After our editors chose<br />
the three top photos, <strong>Trimble</strong> Survey Facebook<br />
fans chose the first place winner. First place—and<br />
a <strong>Trimble</strong> 4-in-1 all-weather jacket—goes to the<br />
Through the Fog image on page 21 and the back<br />
page. Our congratulations to all three winners for<br />
their creative photographs!<br />
Be part of the action: check out our <strong>Trimble</strong>Survey<br />
Facebook page (www.facebook.com/<strong>Trimble</strong>Survey)<br />
for the next issue’s photo contest contenders.<br />
For each contest we randomly select one of the<br />
Facebook voters to win <strong>Trimble</strong>-branded items.<br />
Join in the fun!<br />
This issue’s Honorable Mention winners will<br />
receive a limited-edition <strong>Trimble</strong> watch:<br />
A Royal Survey<br />
Germany’s City of Bielefeld Surveyor Ullrich Gaesing<br />
contributed this image taken during his survey<br />
at Sparrenburg castle, a Bielefeld landmark. Built<br />
about 1200 on a mountain in Teutoburg forest to<br />
defend the young town, the castle also boasts many<br />
underground pathways. Gaesing was working on<br />
a new map of the area surrounding Sparrenburg<br />
castle to show all the changes and archeological<br />
excavations in the area.<br />
"A 'One-Man, One-Animal' Kind of Survey!"<br />
Studio Tecnico Topografico Surveyor Benedetto<br />
Domenico sent in this fun photo, which he shot<br />
using automatic self-timer mode. Domenico was<br />
completing a survey of a rural building near Albenga<br />
in northwest Italy for inclusion in a cadastral<br />
map. Using a <strong>Trimble</strong> R6 GNSS System—both as a<br />
base and rover—and a <strong>Trimble</strong> TSC2 Controller,<br />
Benedetto worked in one-person mode. But while<br />
Benedetto was the only surveyor in the field, he<br />
soon found he was not alone: the structure was<br />
surrounded by several animals, including a<br />
donkey. Intrigued by the controller’s LED lights,<br />
the donkey ran away every time the controller<br />
Technology&more; 2012-1<br />
Photo Contest<br />
-20-
'beeped' (signaling a surveyed point), only to<br />
return immediately and show its interest in the<br />
survey—and <strong>Trimble</strong> technology. It was truly "a<br />
'one-man, one-animal' kind of survey!" writes<br />
Domenico.<br />
Through the Fog<br />
Bulgarian Surveyor Stoian Stoianov took this<br />
fascinating image above the city of Varna,<br />
Bulgaria (photo was taken on small hill about<br />
19 km (12 mi) west of Varna—at 43°14'45.87"N<br />
27°46'24.87"E). “We were making RTK measurements<br />
to create a 3D model of the terrain of the<br />
street network for several villages around Varna,”<br />
Stoianov says. “The model was used to design the<br />
plumbing and new roads between the villages.<br />
During the two-day survey there was a very dense<br />
fog, working conditions were very bad, but we got<br />
great results!”
Photo Contest<br />
Enter <strong>Trimble</strong>’s Technology&more Photo Contest!<br />
The winners of the <strong>Trimble</strong> Photo Contest receive<br />
<strong>Trimble</strong> prizes and the photos are published in<br />
Technology&more. This issue's first place winner is<br />
the Through the Fog photo on page 21. If you would<br />
like to enter the contest, just send a photo taken with<br />
an 8 megapixel (or greater) digital camera to Survey_<br />
Stories@trimble.com. Please make sure you include<br />
your name, title and contact information.<br />
To subscribe to Technology&more for free, go to: www.trimble.com/t&m.<br />
You can also send an email to: T&M_info@trimble.com.<br />
You can also view Technology&more online at www.trimble.com/t&m.<br />
Optionally, copy, fill in and fax this form to us.<br />
Fax (U.S.) +720 887 6101<br />
Fax (EU) +49 61 42 2100 140<br />
Fax (Asia) +61 7 3216 0088<br />
q Please send more information about the<br />
following product:<br />
q Please send more information about the<br />
following article:<br />
q Please include me on the mailing list of<br />
Technology&more.<br />
q Please call.<br />
q My feedback on Technology&more:<br />
Company<br />
Name<br />
Street<br />
City<br />
State / Province<br />
Zip Country<br />
Phone<br />