Mitigating the Social and Environmental Impacts of Multimodal ...
Mitigating the Social and Environmental Impacts of Multimodal ...
Mitigating the Social and Environmental Impacts of Multimodal ...

You also want an ePaper? Increase the reach of your titles
YUMPU automatically turns print PDFs into web optimized ePapers that Google loves.
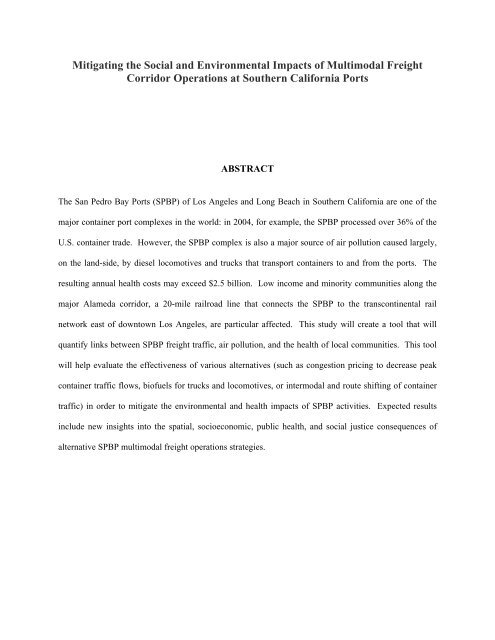
<strong>Mitigating</strong> <strong>the</strong> <strong>Social</strong> <strong>and</strong> <strong>Environmental</strong> <strong>Impacts</strong> <strong>of</strong> <strong>Multimodal</strong> Freight<br />
Corridor Operations at Sou<strong>the</strong>rn California Ports<br />
ABSTRACT<br />
The San Pedro Bay Ports (SPBP) <strong>of</strong> Los Angeles <strong>and</strong> Long Beach in Sou<strong>the</strong>rn California are one <strong>of</strong> <strong>the</strong><br />
major container port complexes in <strong>the</strong> world: in 2004, for example, <strong>the</strong> SPBP processed over 36% <strong>of</strong> <strong>the</strong><br />
U.S. container trade. However, <strong>the</strong> SPBP complex is also a major source <strong>of</strong> air pollution caused largely,<br />
on <strong>the</strong> l<strong>and</strong>-side, by diesel locomotives <strong>and</strong> trucks that transport containers to <strong>and</strong> from <strong>the</strong> ports. The<br />
resulting annual health costs may exceed $2.5 billion. Low income <strong>and</strong> minority communities along <strong>the</strong><br />
major Alameda corridor, a 20-mile railroad line that connects <strong>the</strong> SPBP to <strong>the</strong> transcontinental rail<br />
network east <strong>of</strong> downtown Los Angeles, are particular affected. This study will create a tool that will<br />
quantify links between SPBP freight traffic, air pollution, <strong>and</strong> <strong>the</strong> health <strong>of</strong> local communities. This tool<br />
will help evaluate <strong>the</strong> effectiveness <strong>of</strong> various alternatives (such as congestion pricing to decrease peak<br />
container traffic flows, bi<strong>of</strong>uels for trucks <strong>and</strong> locomotives, or intermodal <strong>and</strong> route shifting <strong>of</strong> container<br />
traffic) in order to mitigate <strong>the</strong> environmental <strong>and</strong> health impacts <strong>of</strong> SPBP activities. Expected results<br />
include new insights into <strong>the</strong> spatial, socioeconomic, public health, <strong>and</strong> social justice consequences <strong>of</strong><br />
alternative SPBP multimodal freight operations strategies.
PROBLEM STATEMENT<br />
The importance <strong>of</strong> <strong>the</strong> contiguous Port <strong>of</strong> Los Angeles <strong>and</strong> Port <strong>of</strong> Long Beach in Sou<strong>the</strong>rn<br />
California, also known as <strong>the</strong> San Pedro Bay Ports (SPBP), is difficult to overstate: in 2004, <strong>the</strong>se two<br />
Ports processed 27% <strong>of</strong> all U.S. waterborne trade by value <strong>and</strong> over 36% <strong>of</strong> all U.S. container trade<br />
(Haveman et al, 2006). The SPBP also play a critical role in California’s economy: a February 2007 trade<br />
impact study (http://www.port<strong>of</strong>losangeles.org/News/news_032207acta2.pdf) released by <strong>the</strong> Alameda<br />
Corridor Transportation Authority (ACTA) found that over 886,000 jobs in California are related to<br />
international trade activities conducted through <strong>the</strong> SPBP, which also generated more than $6.7 billion in<br />
state <strong>and</strong> local tax revenue benefits. Container traffic at <strong>the</strong> ports has soared in recent years (+32.5%<br />
from 2000 to 2004), <strong>and</strong> it is expected to continue exp<strong>and</strong>ing rapidly into <strong>the</strong> next decade.<br />
However, this growth <strong>and</strong> its associated economic benefits are threatened by increasing<br />
congestion <strong>and</strong> pollution. Indeed, <strong>the</strong> SPBP complex is a major source <strong>of</strong> air pollution, as highlighted by<br />
<strong>the</strong> draft Emission Reduction Plan for Ports <strong>and</strong> International Goods Movement in California published<br />
by <strong>the</strong> California Air Resources Board (2005). This document estimates that roughly one-third <strong>of</strong> all<br />
goods movement emissions statewide are generated in <strong>the</strong> Los Angeles region. Moreover, on a typical<br />
day, more than 400 tons <strong>of</strong> NOx are emitted from port <strong>and</strong> goods movement activities in California, which<br />
represents 10% <strong>of</strong> <strong>the</strong> statewide NOx inventory. Diesel particulate matter emissions are also a problem:<br />
according to <strong>the</strong> South Coast Air Quality Management District’s MATES II study, <strong>the</strong>y are responsible<br />
for 70% <strong>of</strong> excess lifetime cancer risk from toxic air pollutants in <strong>the</strong> region. The resulting health costs<br />
are substantial: Jon Haveman, Ph.D., an economist at <strong>the</strong> Public Policy Institute <strong>of</strong> California, estimated<br />
at a 2005 February conference in Long Beach that <strong>the</strong>se costs exceed $2.5 billion a year.<br />
Air pollution from <strong>the</strong> SPBP is caused by a number <strong>of</strong> sources on <strong>the</strong> ocean-side (ships), within<br />
<strong>the</strong> ports (heavy equipment used for moving containers), <strong>and</strong> on <strong>the</strong> l<strong>and</strong>-side (due to heavy reliance on<br />
diesel locomotives <strong>and</strong> large diesel trucks to transport containers to <strong>and</strong> from <strong>the</strong> ports). In particular, <strong>the</strong><br />
major freight corridor that provides access to <strong>the</strong> port (<strong>the</strong> Alameda Corridor), comprises a major rail-line<br />
(presently about 50 trains per day, with plans to increase to 100 trains per day) flanked by <strong>the</strong> I-110 <strong>and</strong> I-<br />
1
710 freeways, which both carry thous<strong>and</strong>s <strong>of</strong> trucks per day. These links connect <strong>the</strong> SPBP complex by<br />
rail <strong>and</strong> road to railyards, intermodal <strong>and</strong> o<strong>the</strong>r freight terminals near downtown Los Angeles some 22<br />
miles away, as shown in Figures 1 & 2 (<strong>the</strong> average width <strong>of</strong> <strong>the</strong> corridor is approximately 9 miles).<br />
Although <strong>the</strong> economic benefits <strong>of</strong> <strong>the</strong> SPBP are enjoyed by <strong>the</strong> whole country, <strong>the</strong> burden <strong>of</strong> <strong>the</strong><br />
resulting air pollution is carried by <strong>the</strong> primarily low income communities located around <strong>the</strong> I-110 <strong>and</strong> I-<br />
710 freeways, <strong>and</strong> <strong>the</strong> Alameda corridor. Based on our growing knowledge <strong>of</strong> <strong>the</strong> health effects <strong>of</strong> toxic<br />
diesel-fueled vehicle emissions, <strong>the</strong>se communities are at increased risk <strong>of</strong> respiratory problems, cancer<br />
<strong>and</strong> even death. While previous studies have indicated that <strong>the</strong>se health effects may be relatively<br />
localized (within several hundred meters to sources), <strong>the</strong> width <strong>of</strong> <strong>the</strong> Alameda Corridor <strong>and</strong> <strong>the</strong> volume<br />
<strong>of</strong> freight movement suggests that <strong>the</strong> air quality <strong>and</strong> health impacts <strong>of</strong> freight operations in <strong>the</strong> corridor<br />
could be quite extensive.<br />
In this context, this study seeks to create a tool that will shed light on <strong>the</strong> links between SPBP<br />
freight traffic, air pollution, <strong>and</strong> <strong>the</strong> health <strong>of</strong> local communities. This tool will help evaluate <strong>the</strong><br />
effectiveness <strong>of</strong> various alternatives (such as congestion pricing, bi<strong>of</strong>uels for trucks <strong>and</strong> locomotives, or<br />
intermodal <strong>and</strong> route shifting <strong>of</strong> container traffic) in order to mitigate <strong>the</strong> environmental <strong>and</strong> health<br />
impacts <strong>of</strong> port activities. Our interdisciplinary team combines expertise in engineering, planning,<br />
economics, <strong>and</strong> public health to inform public policy on a topic <strong>of</strong> great importance to California <strong>and</strong> to<br />
<strong>the</strong> country. Although we will be focusing on <strong>the</strong> SPBP, our methodology will be widely applicable.<br />
RELEVANCE TO UCTC THEME<br />
This research is closely related to <strong>the</strong> UCTC <strong>the</strong>me <strong>of</strong> Transportation Systems Analysis <strong>and</strong><br />
Policy, <strong>and</strong> to <strong>the</strong> US DOT interest area <strong>of</strong> Congestion Chokepoints: our research addresses congestion<br />
mitigation issues with an aim to produce deployable results within one year (although several years may<br />
be needed for an in-depth analysis <strong>of</strong> multiple alternatives <strong>of</strong> interest) <strong>and</strong> to identify <strong>and</strong> ameliorate <strong>the</strong><br />
factors that contribute to congestion <strong>of</strong> freight <strong>and</strong> passenger traffic for one <strong>of</strong> <strong>the</strong> largest port complexes<br />
<strong>and</strong> urban areas in <strong>the</strong> nation.<br />
2
METHODOLOGY<br />
Microscopic Simulation <strong>of</strong> <strong>the</strong> Alameda Corridor Rail <strong>and</strong> Freeway Network<br />
We will use <strong>the</strong> PARAMICS microscopic simulation s<strong>of</strong>tware (Quadstone, 2004) as our traffic<br />
modeling tool. A microscopic model is essential to simulate individual vehicle movements over small<br />
time periods <strong>and</strong> properly represent transient traffic characteristics (stop-start movements, lane-changing,<br />
accelerations, <strong>and</strong> weaving/merging behavior) because <strong>the</strong>y very significantly affect emissions. By<br />
contrast, regional static planning models are notoriously weak for predicting congestion, because <strong>the</strong>y<br />
rely on <strong>the</strong> fundamental assumption that low travel times occur under low flow levels, even though in<br />
reality <strong>the</strong> worst travel times <strong>and</strong> emissions occur under low-flow stop-<strong>and</strong>-go conditions.<br />
PARAMICS is widely considered to be a state-<strong>of</strong>-<strong>the</strong>-art microscopic simulation tool; it is<br />
utilized by Caltrans, <strong>and</strong> its underlying models are well-documented <strong>and</strong> widely accepted. Ano<strong>the</strong>r asset<br />
<strong>of</strong> PARAMICS is its Application Programming Interface (API), which allows users to easily customize<br />
features <strong>and</strong> to connect PARAMICS to o<strong>the</strong>r applications.<br />
Our simulation work will not start from scratch. Pr<strong>of</strong>essor Regan has already developed a<br />
Paramics model <strong>of</strong> <strong>the</strong> I-710 freeway for an earlier research project. Traffic dem<strong>and</strong> inputs are based on<br />
<strong>the</strong> larger Sou<strong>the</strong>rn California network <strong>and</strong> its corresponding static OD dem<strong>and</strong>s, based on periods from<br />
<strong>the</strong> 2000 Sou<strong>the</strong>rn California Association <strong>of</strong> Governments (SCAG) traffic study. The methodology to<br />
prepare dem<strong>and</strong> inputs is based on TransCAD. Figure 3 illustrates this model <strong>and</strong> <strong>the</strong> level <strong>of</strong> dem<strong>and</strong>s<br />
<strong>and</strong> truck counts simulated for <strong>the</strong> I-710. Calibration <strong>of</strong> <strong>the</strong> existing model is based on traffic data<br />
obtained from <strong>the</strong> Caltrans Freeway Performance Measurement System (PeMS). For this study, we will<br />
extend our existing PARAMICS model <strong>of</strong> <strong>the</strong> I-710 to build a network that will include <strong>the</strong> I-110<br />
freeway, <strong>the</strong> I-105, SR-91, <strong>and</strong> I-405 freeways that cross both <strong>the</strong> I-110 <strong>and</strong> <strong>the</strong> I-710, <strong>the</strong> connector links<br />
near <strong>the</strong> SPBP, as well as <strong>the</strong> Alameda corridor <strong>and</strong> <strong>the</strong> connectors to <strong>the</strong> transcontinental rail yards near<br />
downtown Los Angeles (see Figure 1). The SR-60 <strong>and</strong> <strong>the</strong> I-5 freeways that connect <strong>the</strong> I-110 <strong>and</strong> I-710<br />
form <strong>the</strong> nor<strong>the</strong>rn edge <strong>of</strong> <strong>the</strong> network will also be partly modeled. The calibration <strong>of</strong> this model will<br />
3
follow guidelines proposed by Caltrans, taking into account that our goals are different from normal<br />
traffic operations studies (Chu et al, 2004) <strong>and</strong> <strong>the</strong> elaborate calibration tasks o<strong>the</strong>rwise required.<br />
Additionally, although not a primary capability <strong>of</strong> PARAMICS, rail lines will be modeled with<br />
fixed schedules <strong>and</strong> stops using <strong>the</strong> tractor <strong>and</strong> multiple-trailer capabilities <strong>of</strong> PARAMICS (e.g., see<br />
Abdulhai, et al., 2002, Cortes et al., 2005). Our rail simulations will have two purposes: 1) predicting<br />
locomotive emissions; <strong>and</strong> 2) modeling operations at truck-rail intermodal facilities using external APIs.<br />
To generate emissions, we will use <strong>the</strong> PARAMICS API plug-in that calculates link-by-link<br />
traffic emissions using second-by-second speed, acceleration data <strong>and</strong> emission data for all vehicle types.<br />
We will also benefit from recent UCI research that correlates PARAMICS simulation results with link<br />
traffic characteristics <strong>and</strong> EMFAC2007, <strong>the</strong> California Air Resources Board's motor vehicle emission<br />
factor model (Nesamani et al., 2006). These emission predictions form <strong>the</strong> basis <strong>of</strong> our area-wide<br />
analyses detailed below. We will use APIs to h<strong>and</strong>le train movements, in order to find <strong>the</strong> emission<br />
factors used for <strong>the</strong> EPA-recommended locomotive emission analysis described below.<br />
Alternative Scenarios <strong>and</strong> Mitigation Strategies<br />
We have formulated a preliminary list <strong>of</strong> strategies for corridor operations we wish to simulate, in<br />
order to investigate <strong>the</strong> potential mitigation <strong>of</strong> air quality impacts associated with l<strong>and</strong>side SPBP<br />
operations. These strategies will be finalized during <strong>the</strong> project in consultation with SPBP authorities, as<br />
well as interested local <strong>of</strong>ficials <strong>and</strong> NGOs. After modeling current operations, we will explore how to<br />
deal with projected SPBP growth over <strong>the</strong> next decade (as a starting point). Our scenarios include:<br />
- Congestion pricing <strong>and</strong> time-<strong>of</strong>-day shifts in container traffic. We will simulate <strong>the</strong> impact <strong>of</strong><br />
fur<strong>the</strong>r shifts in <strong>of</strong>f-peak container traffic movement into <strong>and</strong> out <strong>of</strong> <strong>the</strong> ports due to changes in <strong>the</strong><br />
SPBP PierPASS congestion pricing model (http://www.pierpass.org/)<br />
- Intermodal shifts <strong>of</strong> container traffic, from truck to rail, <strong>and</strong> rail to truck, in <strong>the</strong> corridor<br />
- Freeway route shifts <strong>of</strong> container truck traffic, between I-110 <strong>and</strong> I-710<br />
- Use <strong>of</strong> biodiesel for trucks <strong>and</strong> locomotives, <strong>and</strong> electrification <strong>of</strong> <strong>the</strong> Alameda corridor.<br />
4
Generating Emission Factors<br />
To calculate emission factors from traffic on <strong>the</strong> I-110 <strong>and</strong> I-710 freeways, we will rely on<br />
EMFAC2007. This s<strong>of</strong>tware calculates air pollution emission factors for many classes <strong>of</strong> vehicles<br />
(including passenger cars, trucks <strong>and</strong> buses) manufactured up to 40 years ago. It is based on improved<br />
data <strong>and</strong> it is more user-friendly than previous versions <strong>of</strong> EMFAC. EMFAC calculates <strong>the</strong> emission<br />
rates <strong>of</strong> HC, CO, NOx, PM, lead, SO2 <strong>and</strong> CO2 for each vehicle class within each calendar year, for<br />
twenty four hourly periods, for each month <strong>of</strong> <strong>the</strong> year, <strong>and</strong> for a variety <strong>of</strong> geographical areas. Its use is<br />
required in all new transportation conformity analyses in California.<br />
For locomotives, we will rely on estimated average emission rates developed by <strong>the</strong> EPA (1997).<br />
Because <strong>of</strong> significant variability in in-use emission rates, we will develop scenarios for diesel<br />
locomotives based on low, medium, <strong>and</strong> high emission rates for NOx <strong>and</strong> PM.<br />
In our scenarios, we will also take into account EPA’s proposed three part program, which was<br />
made public in March 2007. Its goal is to cut PM emissions from locomotives by 90% <strong>and</strong> NOx<br />
emissions by 80% (http://www.epa.gov/OMSWWW/locomotv.htm). It will set new, Tier 3 exhaust<br />
emissions st<strong>and</strong>ards <strong>and</strong> idle reduction requirements for locomotives. If approved, it will start in 2009.<br />
Data about <strong>the</strong> characteristics <strong>of</strong> locomotives circulating in <strong>the</strong> Alameda corridor will be collected from<br />
<strong>the</strong> railroads <strong>and</strong> <strong>the</strong> Alameda Corridor Transportation Authority.<br />
Modeling <strong>the</strong> Dispersion <strong>of</strong> Criteria Pollutants<br />
To model <strong>the</strong> dispersion <strong>of</strong> pollutants, we will rely on CALRoads View from <strong>the</strong> Scientific<br />
S<strong>of</strong>tware Group (http://www.scientifics<strong>of</strong>twaregroup.com/pages/s<strong>of</strong>tware.php). CALRoads View is an<br />
integrated air dispersion modeling s<strong>of</strong>tware package for predicting air quality impacts <strong>of</strong> pollutants near<br />
roadways. CALRoads View features three well-known mobile source dispersion models: CALINE4,<br />
CAL3QHC, <strong>and</strong> CAL3QHCR. CALINE4 predicts air concentrations <strong>of</strong> carbon monoxide (CO), Nitrogen<br />
Dioxide (NO2), <strong>and</strong> suspended particles (PM) near roadways (UC Davis Air Quality Project, 1998). It is<br />
capable <strong>of</strong> h<strong>and</strong>ling intersections, parking lots, elevated or depressed freeways <strong>and</strong> canyons. These<br />
5
features will come in h<strong>and</strong>y for modeling <strong>the</strong> dispersion <strong>of</strong> pollutants from diesel locomotives circulating<br />
along <strong>the</strong> Alameda corridor. CAL3QHC estimates total air pollutant concentrations (CO or PM) near<br />
highways from both moving <strong>and</strong> idling vehicles. CAL3QHCR is an enhanced version <strong>of</strong> CAL3QHCR. It<br />
can process up to a year <strong>of</strong> hourly meteorological data <strong>and</strong> vehicular emissions, traffic volume, <strong>and</strong><br />
signalization (ETS) data for each hour <strong>of</strong> a week.<br />
Assessing Health <strong>Impacts</strong> From Air Quality Data<br />
We will use EPA’s “Benefits Mapping <strong>and</strong> Analysis” s<strong>of</strong>tware (BenMAP 2.3; Abt Associates,<br />
2005) for estimating <strong>the</strong> health impacts <strong>of</strong> air quality <strong>and</strong> improvement attributable to various freight<br />
operations strategies in <strong>the</strong> corridor, including alternative fuels. BenMAP is a GIS-based program that<br />
uses a damage-function approach to estimate <strong>the</strong> health benefits <strong>of</strong> changes in air quality. It relies on<br />
local concentrations <strong>of</strong> air pollutants, population distribution, <strong>and</strong> well established health-response<br />
relationships (attributable-risk levels) to generate incidence estimates for health impacts such as mortality,<br />
heart attacks, <strong>and</strong> respiratory distress (asthma) (Davidson et al, 2007). BenMAP is <strong>the</strong> gold st<strong>and</strong>ard for<br />
<strong>the</strong>se levels <strong>of</strong> assessment. Although a newer version <strong>of</strong> BenMAP was recently released (BenMAP 2.4.8,<br />
May, 2007), it covers national scale assessments. It is also not as easily customizable as BenMAP 2.3,<br />
which was developed for specialized applications including high resolution analyses at <strong>the</strong> urban- or<br />
metropolitan-level. BenMAP 2.3 will allow us to import our own spatial data (air quality, population, <strong>and</strong><br />
baseline health) <strong>and</strong> specify many <strong>of</strong> <strong>the</strong> input parameters to match <strong>the</strong> types <strong>of</strong> demographic <strong>and</strong> health<br />
surveillance data collected in <strong>the</strong> study area.<br />
<strong>Social</strong> Justice Issues<br />
A key feature <strong>of</strong> this project is to underst<strong>and</strong> who bears <strong>the</strong> costs <strong>of</strong> freight transport to <strong>and</strong> from<br />
<strong>the</strong> SPBP. The reasons for environmental inequality are complex <strong>and</strong> long-st<strong>and</strong>ing. For generations Los<br />
Angeles has been known as a place where one could go to achieve <strong>the</strong> American Dream. A major<br />
problem is, <strong>of</strong> course, historical legacy. The cities along <strong>the</strong> Alameda Corridor took <strong>the</strong> brunt <strong>of</strong> <strong>the</strong><br />
6
estructuring <strong>of</strong> <strong>the</strong> 1970’s <strong>and</strong> 80’s, characterized by heavy losses <strong>of</strong> manufacturing jobs (between 1978<br />
through 1982, more than 75,000 well-paying jobs were lost). Today, low–wage jobs have replaced many<br />
<strong>of</strong> <strong>the</strong> jobs that once provided a gateway to a middle-class life (Valle <strong>and</strong> Torres, 2000). Not surprisingly,<br />
<strong>the</strong> restructuring corresponded to a full-scale metamorphosis in this region, where <strong>the</strong> once white working<br />
class suburbs were transformed into majority Latino working class cities. In cities such as South Gate <strong>the</strong><br />
Latino population leaped from 4 % <strong>of</strong> <strong>the</strong> population in 1969 to 46 % by 1980, <strong>and</strong> 83 % in 1990. Similar<br />
population changes occurred in Maywood, Lakewood Bellflower, <strong>and</strong> Bell.<br />
To study <strong>the</strong>se environmental justice issues, we will model <strong>the</strong> study area using GIS. We will<br />
combine socio-economic data from <strong>the</strong> 2000 census with results from our dispersion models <strong>and</strong> from our<br />
health impact assessment to quantitatively assess <strong>the</strong> characteristics <strong>of</strong> <strong>the</strong> populations bearing <strong>the</strong> brunt<br />
<strong>of</strong> air pollution from <strong>the</strong> freight activities related to <strong>the</strong> SPBP. This will also allow us to estimate <strong>the</strong><br />
potential improvements that can be obtained under <strong>the</strong> different scenarios we will consider.<br />
TASK DESCRIPTIONS<br />
List <strong>of</strong> Tasks Start Date End Date<br />
1. Assemble relevant data <strong>and</strong> code PARAMICS network 9/01/07 1/31/08<br />
2. Select corridor strategies to be simulated 9/01/07 12/31/07<br />
3. Run PARAMICS simulations 1/01/08 3/31/08<br />
4. Assemble emission factors for road <strong>and</strong> rail traffic 9/01/07 11/30/08<br />
5. Model <strong>the</strong> dispersion <strong>of</strong> criteria pollutants in <strong>the</strong> corridor 12/01/07 4/30/08<br />
6. Assemble demographic data <strong>and</strong> public health impacts 9/01/07 7/31/08<br />
7. Assess environmental justice implications for corridor population 3/01/08 8/31/08<br />
8. Write final Summary report <strong>and</strong> academic papers 8/01/08 8/31/08<br />
EXPECTED RESULTS AND PRODUCTS<br />
The expected results include new insights into <strong>the</strong> spatial, socioeconomic <strong>and</strong> public health air<br />
quality impacts, <strong>and</strong> thus social justice consequences, <strong>of</strong> alternative SPBP freight operations strategies in<br />
<strong>the</strong> Alameda corridor. This will allow us to rank such strategies in terms <strong>of</strong> <strong>the</strong>se criteria for use in<br />
7
decision-making <strong>and</strong> selecting <strong>the</strong> best option(s), or combinations <strong>the</strong>re<strong>of</strong>. The resulting tool <strong>and</strong> insights<br />
we develop will be useful for ongoing policy analyses pertaining to this corridor, <strong>and</strong> could be adapted<br />
<strong>and</strong>/or exp<strong>and</strong>ed for analysis <strong>of</strong> o<strong>the</strong>r corridors <strong>and</strong> strategies. The deliverables for <strong>the</strong> project also<br />
include Progress Reports <strong>and</strong> a Final Summary Report that will present <strong>the</strong> overall findings <strong>of</strong> <strong>the</strong><br />
research, as well as algorithms <strong>and</strong> s<strong>of</strong>tware developed with project funding.<br />
KEY REFERENCES<br />
Abdulhai, B., Shalaby, A.S. <strong>and</strong> Georgi, A. (2002) “Microsimulation Modelling <strong>and</strong> Impact<br />
Assessment <strong>of</strong> Streetcar Transit Priority Options: The Toronto Experience”. Proc. 81st TRB<br />
Annual Meeting. Transportation Research Board. Washington D. C.<br />
Abt Associates, Inc. (2005) “BenMAP <strong>Environmental</strong> Benefits Mapping <strong>and</strong> Analysis Program.”<br />
Prepared for Office <strong>of</strong> Air Quality Planning <strong>and</strong> St<strong>and</strong>ards, U.S. <strong>Environmental</strong> Protection<br />
Agency, Research Triangle Park, NC (see also http://www.epa.gov/ttn/ecas/benmodels.html)<br />
California Air Resources Board (2005). State Goods Movement Action Plan, Phase I, California Emission<br />
Inventory Development <strong>and</strong> Reporting System (CEIDARS) September.<br />
Chu, L., Lu, H. L., OH, J.S., <strong>and</strong> Recker, W. W. (2004) “A Calibration Procedure for Micoprscopic<br />
Traffic Simulation”. Paper 04-4165, Proc. 83rd TRB Annual Meeting. Washington D. C.<br />
Cortes.C., Pages, L., <strong>and</strong> Jayakrishnan, R. (2005) “Microsimulation <strong>of</strong> Flexible Transit Systems in<br />
Realistic Urban Networks”. Transportation Research Record, Vol. 1923, pp. 153-163.<br />
Davidson, K., A. Hallberg, D. McCubbin, <strong>and</strong> B. Hubbell (2007) “Analysis <strong>of</strong> PM2.5 using <strong>the</strong><br />
environmental benefits mapping <strong>and</strong> analysis program (BenMAP).” Journal <strong>of</strong> Toxicology <strong>and</strong><br />
<strong>Environmental</strong> Health, Part A. 70:332-346.<br />
Desert Research Institute (2005) <strong>Environmental</strong> Justice Saturation Monitoring <strong>of</strong> Selected Pollutants in<br />
Wilmington. Report prepared Prepared for: State <strong>of</strong> California Air Resources Board.<br />
Haveman, J. D., Jennings, E.M., <strong>and</strong> Shatz, H.J. (2006) California <strong>and</strong> <strong>the</strong> Global Economy: Recent<br />
Facts <strong>and</strong> Figures, 2006 Edition, PPIC Occasional papers, Prepared for <strong>the</strong> California Trade<br />
Education Center for Presentation at <strong>the</strong> California Council for International Trade’s 8th Annual<br />
California Trade Policy Forum, San Diego, California.<br />
Houston, D., Krudysz, Margaret, <strong>and</strong> Winer, Arthur (2006) “Direct Measurements <strong>of</strong> Diesel Truck Traffic<br />
Associated with Goods Movement at Sou<strong>the</strong>rn California Ports.” Presented at <strong>the</strong> 11 th World<br />
Conference on Transportation Research (WCTRS 2007).<br />
Nesamani, K.S., Chu, L., McNally, M. G., Jayakrishnan, R (2007) “Estimation <strong>of</strong> vehicular emissions by<br />
capturing traffic variations” Atmospheric Environment, Vol. 41, #13, pp. 2996-3008.<br />
Quadstone Limited (2004) Quadstone Paramics V5.1 Monitor User Guide.<br />
U.C. Davis Air Quality Project (1998) “USER'S GUIDE FOR CL4: A USER-FRIENDLY INTERFACE<br />
FOR THE CALINE 4 MODEL FOR TRANSPORTATION PROJECT IMPACT<br />
ASSESSMENTS.” Prepared for Caltrans, Sacramento, CA.<br />
USEPA (1997) Emission Factors for Locomotives – Technical Highlights. Available at:<br />
http://www.epa.gov/otaq/regs/nonroad/locomotv/frm/42097051.pdf.<br />
Valle, V. M., <strong>and</strong> R. D. Torres (2000) Latino Metropolis, <strong>the</strong> University <strong>of</strong> Minnesota Press.<br />
8
Figure 1. Map <strong>of</strong> Alameda Corridor Study Area<br />
9
(a) Alameda Corridor Rail-line (source: ASCE) (b) I-710 Freeway approaching <strong>the</strong> ports<br />
Figure 2. Overviews <strong>of</strong> Study Area Sections<br />
238,000<br />
18,469<br />
8.0%<br />
233,000<br />
37,257<br />
15.9%<br />
180,000<br />
26,982<br />
14.9%<br />
I-105<br />
I-10<br />
I-405<br />
I-710<br />
I-5<br />
SR-91<br />
SR-60<br />
226,000<br />
33,041<br />
14.6%<br />
445,000<br />
8464<br />
19.0%<br />
152,000<br />
22,390<br />
14.7%<br />
AADT: AADT:<br />
Annual Average Daily Traffic<br />
AADTT: Ann. Ave. Daily Truck Traffic<br />
Truck %<br />
Source: Caltrans, 2005 Truck Count<br />
Figure 3. PARAMICS I-710 network <strong>and</strong> truck counts based on 2005 data.<br />
10