Correlation of yield and heterosis of maize hybrids and their parental ...
Correlation of yield and heterosis of maize hybrids and their parental ...
Correlation of yield and heterosis of maize hybrids and their parental ...

You also want an ePaper? Increase the reach of your titles
YUMPU automatically turns print PDFs into web optimized ePapers that Google loves.
UDC 575:633.15<br />
DOI: 10.2298/GENSR1202399D<br />
Original scientific paper<br />
CORRELATION OF YIELD AND HETEROSIS OF MAIZE HYBRIDS AND<br />
THEIR PARENTAL LINES WITH GENETIC DISTANCE BASED ON SSR<br />
MARKERS<br />
Snežana MLADENOVIĆ DRINIĆ, Marija KOSTADINOVIĆ, Danijela RISTIĆ,<br />
Milan STEVANOVIĆ, Zoran ČAMDŽIJA, Milomir FILIPOVIĆ,<br />
Dragan KOVAČEVIĆ<br />
Maize Research Institute, Zemun Polje, Serbia<br />
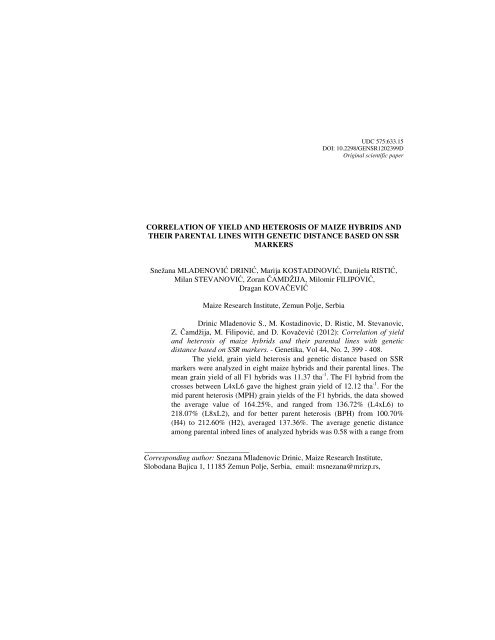
Drinic Mladenovic S., M. Kostadinovic, D. Ristic, M. Stevanovic,<br />
Z. Čamdžija, M. Filipović, <strong>and</strong> D. Kovačević (2012): <strong>Correlation</strong> <strong>of</strong> <strong>yield</strong><br />
<strong>and</strong> <strong>heterosis</strong> <strong>of</strong> <strong>maize</strong> <strong>hybrids</strong> <strong>and</strong> <strong>their</strong> <strong>parental</strong> lines with genetic<br />
distance based on SSR markers. - Genetika, Vol 44, No. 2, 399 - 408.<br />
The <strong>yield</strong>, grain <strong>yield</strong> <strong>heterosis</strong> <strong>and</strong> genetic distance based on SSR<br />
markers were analyzed in eight <strong>maize</strong> <strong>hybrids</strong> <strong>and</strong> <strong>their</strong> <strong>parental</strong> lines. The<br />
mean grain <strong>yield</strong> <strong>of</strong> all F1 <strong>hybrids</strong> was 11.37 tha -1 . The F1 hybrid from the<br />
crosses between L4xL6 gave the highest grain <strong>yield</strong> <strong>of</strong> 12.12 tha -1 . For the<br />
mid parent <strong>heterosis</strong> (MPH) grain <strong>yield</strong>s <strong>of</strong> the F1 <strong>hybrids</strong>, the data showed<br />
the average value <strong>of</strong> 164.25%, <strong>and</strong> ranged from 136.72% (L4xL6) to<br />
218.07% (L8xL2), <strong>and</strong> for better parent <strong>heterosis</strong> (BPH) from 100.70%<br />
(H4) to 212.60% (H2), averaged 137.36%. The average genetic distance<br />
among <strong>parental</strong> inbred lines <strong>of</strong> analyzed <strong>hybrids</strong> was 0.58 with a range from<br />
____________________________<br />
Corresponding author: Snezana Mladenovic Drinic, Maize Research Institute,<br />
Slobodana Bajica 1, 11185 Zemun Polje, Serbia, email: msnezana@mrizp.rs,
400 GENETIKA, Vol. 44, No.2, 399-408, 2012<br />
0.55 to 0.61. The GD showed a positive correlation with the grain <strong>yield</strong> <strong>of</strong><br />
the F1 <strong>hybrids</strong> (0.22), as well as with MPH <strong>and</strong> BPH, with the values <strong>of</strong><br />
0.12 <strong>and</strong> 0.45, respectively.<br />
Key words: grain <strong>yield</strong>, <strong>heterosis</strong>, <strong>maize</strong>, SSR markers<br />
INTRODUCTION<br />
Information on germplasm diversity <strong>and</strong> relationships among elite materials<br />
is <strong>of</strong> great importance in crop improvement. Genetic diversity studies using<br />
molecular markers reveal patterns <strong>of</strong> diversity in crops that are obscured by the<br />
complexities <strong>of</strong> pedigree records. Various kinds <strong>of</strong> markers can be used to estimate<br />
genetic diversity in <strong>maize</strong> germplasm. Among them PCR-based markers such as<br />
microsatellites have been widely used (SENIOR et al., 1998, ENOKI et al., 2002, PINTO<br />
et al., 2003, ADETIMIRIN et al, 2008; KARANJA et al, 2009, PABENDON et al, 2009).<br />
Microsatellites or SSR (Simple Sequence Repeats) correspond to the sequences from<br />
2 to 6 base pairs repeated in t<strong>and</strong>em, <strong>and</strong> are broadly used because they are<br />
codominant, highly polymorphic, multi-allelic <strong>and</strong> have a high polymorphism<br />
information content.<br />
Heterosis has been extensively exploited but, despite a century <strong>of</strong><br />
investigations, its genetic basis is not completely understood, yet. For <strong>maize</strong> breeders<br />
<strong>of</strong> particular interest is to identify genetic factors contributing to <strong>heterosis</strong> as well as<br />
a suitable method that could predict <strong>heterosis</strong> with some accuracy before field<br />
evaluation <strong>of</strong> test <strong>hybrids</strong>. In <strong>maize</strong>, the main strategy is based on the `distance'<br />
model: <strong>heterosis</strong>, defined <strong>and</strong> measured as the superiority <strong>of</strong> the hybrid over the<br />
midparent is related to the genetic divergence between its <strong>parental</strong> lines. The<br />
relationship between DNA marker-based GD <strong>and</strong> single-cross grain <strong>yield</strong>s <strong>and</strong> grain<br />
<strong>yield</strong> <strong>heterosis</strong> in temperate <strong>and</strong> tropical <strong>maize</strong> cultivars were studied, (DRINIC et al.,<br />
2002, REIF et al, 2003; BARBOSA et al., 2003; BETRAN et al., 2003; XU et al., 2004,<br />
PHUMICHAI et al, 2008, KUMARI et al, 2008, BALESTRE et al, 2008, PONSGAI et al.<br />
2009, SRDIC et al., 2011). The general tendency was that the prediction efficiency <strong>of</strong><br />
the “distance” model is high when <strong>hybrids</strong> between related lines <strong>and</strong> <strong>hybrids</strong><br />
between both related <strong>and</strong> unrelated lines are considered. However, correlations<br />
between genetic distances <strong>of</strong> unrelated lines only <strong>and</strong> <strong>their</strong> respective interheterotic<br />
crosses were <strong>of</strong> low practical predictive value. The goal <strong>of</strong> this study was to<br />
investigate the relationship between <strong>yield</strong>, <strong>yield</strong> <strong>heterosis</strong> <strong>and</strong> genetic distance<br />
determined with simple sequence repeat (SSR) markers in <strong>maize</strong> <strong>hybrids</strong> <strong>and</strong> <strong>their</strong><br />
<strong>parental</strong> lines.<br />
MATERIALS AND METHODS<br />
In this study a set <strong>of</strong> 16 <strong>maize</strong> genotypes, 8 <strong>parental</strong> lines <strong>and</strong> 8 F1 <strong>hybrids</strong><br />
was used. Hybrids H1 (L1×L7) belonged to FAO maturity group 300; H2 ((L8×L2)<br />
belonged to FAO maturity group 400, H3 (L3×L7) <strong>and</strong> H4 (L4×L8) belonged to<br />
FAO maturity group 500, H5 (L4×L6); H6 (L3×L6), H7 (L3×L8) <strong>and</strong> H8 (L6×L5)<br />
belonged to FAO maturity group 600. All <strong>hybrids</strong> were yellow-seeded dent type.
S. MLADENOVIC DRINIC et al.: YIELD, HETEROSIS AND GD BASED ON SSR IN MAIZE 401<br />
From <strong>parental</strong> inbred lines L2 <strong>and</strong> L4 were from independent source germplasm, L1,<br />
L3 <strong>and</strong> L5 from BSSS heterotic group, <strong>and</strong> L6, L7 <strong>and</strong> L8 from Lancaster<br />
germplasm. An experiment set up as r<strong>and</strong>omized block design with two replications<br />
at two experimental fields <strong>of</strong> Maize Research Instiute „Zemun Polje“, during 2011.<br />
Four rows were planted for each hybrid, with 20 plants per row, resulting in a plant<br />
density <strong>of</strong> 67,000 plants per ha. The distance between rows amounted to 0.75 m, <strong>and</strong><br />
the plot size was 12 m 2 (4 x 3 m). Two middle rows within the plot were used for<br />
data collection. The plot size for inbreeds was 3 m 2 . The identical cropping practices<br />
were applied for all genotypes at both locations. Yield <strong>of</strong> each plot was used for<br />
calculation <strong>of</strong> grain <strong>yield</strong> per hectare (t ha- 1 ) with 14% moisture. Heterosis was<br />
determined as follows:<br />
Mid-parent <strong>heterosis</strong> (MPH) (%) = ((F1-MP)/MP)*100<br />
Better-parent <strong>heterosis</strong> (BPH) (%) = ((F1-BP)/BP)*100<br />
where, F1 is the hybrid performance, MP = (P1+P2)/2 in which P1 <strong>and</strong> P2 are the<br />
performances <strong>of</strong> inbred parents <strong>and</strong> BP is the better parent value.<br />
The SSR analysis was conducted with bulked samples <strong>of</strong> five plants per<br />
genotypes. Harvested leaves were freeze-dried <strong>and</strong> ground to powder. Genomic<br />
DNA was extracted using a CTAB method (SAGAI-MAROOF, 1989). Screening the<br />
Maize DataBase (www.agron.missouri. edu), 20 primers from the bnlg/umc/phi set<br />
were assayed using the sample <strong>of</strong> 16 genotypes. Primers were excluded from the<br />
study when b<strong>and</strong>ing patterns were difficult to score accurately on agarose gels, or<br />
when they failed to amplify consistently in all genotypes. A final set <strong>of</strong> 15 SSR<br />
primers were applied in the analysis <strong>of</strong> the genotypes according to the method <strong>of</strong><br />
SENIOR et al. (1998). Sequences for these primers, type <strong>of</strong> repeat amplified, <strong>and</strong> map<br />
position are presented in Table 1.<br />
The amplification reaction was carried out in 25 µl reaction volume<br />
containing 1x enzyme buffer, 2.4 mM MgCl2, 200 µM dNTPs, 0.5 µM primers,<br />
1xBSA, 1U Taq polymerase <strong>and</strong> 200 ng <strong>of</strong> DNA. The amplification pr<strong>of</strong>iles<br />
followed were: an initial denaturation at 95°C/5min, followed by 15 cycles each <strong>of</strong><br />
denaturation at 95°C/30sec, annealing at 63.5°C/1min (-0.5°C/cycle) <strong>and</strong> extension<br />
at 72°C/1min; another 22 cycles <strong>of</strong> 95°C/30sec, 56°C/1min <strong>and</strong> 72°C/1min were<br />
performed. DNA b<strong>and</strong>ing patterns from SSR gels were converted into binary form,<br />
where a ‘one’ indicates the presence <strong>of</strong> a specific allele <strong>and</strong> a ‘zero’ indicates the<br />
absence <strong>of</strong> that allele. Pairwise comparisons <strong>of</strong> samples were done to estimate<br />
Jaccards coefficient <strong>of</strong> similarity.<br />
The similarity matrix was submitted for hierarchical cluster analyses <strong>of</strong><br />
unweighted pair group using arithmetical average (UPGMA) method <strong>and</strong> necessary<br />
computation were performed using NTSYS-pc program (ROHLF, 2000).
402 GENETIKA, Vol. 44, No.2, 399-408, 2012<br />
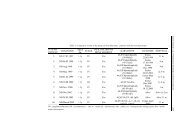
Table1. SSR markers, primer sequences, map location, number <strong>of</strong> fragment <strong>and</strong> polymorphism<br />
level<br />
primers<br />
sequences<br />
bin<br />
Total<br />
number <strong>of</strong><br />
fragment<br />
Number<br />
<strong>of</strong><br />
polymer.<br />
fragment<br />
Polymor<br />
.<br />
(%)<br />
phi087<br />
5’-GAGAGGAGGTGTTGTTTGACACAC-3’<br />
5’- ACAACCGGACAAGTCAGCAGATTG-3’ 5.06<br />
10 9<br />
90<br />
umc126<br />
bnlg2235<br />
bnlg1443<br />
umc1040<br />
umc1827<br />
umc1109<br />
phi033<br />
bnlg1350<br />
umc1506<br />
umc1695<br />
phi112<br />
bnlg1633<br />
umc2129<br />
bnlg1526<br />
5’-CAACAGGGTGAACCCTCTGTACTT-3’<br />
5’-AATATGGTGTTGTGATTTGCATCG-3’<br />
5’-ATCCGGAGACACATTCTTGG-3’<br />
5’CTGCAAGCAACTCTCATCGA-3’<br />
5’- TACCGGAATCCTCTTTGGTG-3’<br />
5’- TTTGACAACCTCTTCCAGGG-3’<br />
5’-CATTCACTCTCTTGCCAACTTGA-3’<br />
5’-AGTAAGAGTGGGATATTCTGGGAGTT-<br />
3’<br />
5’- GCAAGTCAGGGAGTCCAAGAGAG -3’<br />
5’- CCACCTCACAGGTGTTCTACGAC -3’<br />
5’-GCAACACAGGACCAAATCATCTCT-3’<br />
5’-GTTCGGTCCGTAGAAGAACTCTCA-3’<br />
5’- ATCGAAATGCAGGCGATGGTTCTC-3’<br />
5’- ATCGAGATGTTCTACGCCCTGAAGT -3’<br />
5’-TGCTTCAGCGCATTAAACTG-3’<br />
5’-TGCTCGTGTGAGTTCCTACG-3’<br />
5’-AAAAGAAACATGTTCAGTCGAGCG-3’<br />
5'-ATAAAGGTTGGCAAAACGTAGCCT-3’<br />
5’-CAGGTAATAACGACGCAGCAGAA-3’<br />
5'-GTCCTAGGTTACATGCGTTGCTCT-3’<br />
5’- TGCCCTGCAGGTTCACATTGAGT -3’<br />
5’- AGGAGTACGCTTGGATGCTCTTC -3’<br />
5’- GTACCTCCAGGTTTACGCCA -3’<br />
5’- TCAACTTCTCATGCACCCAT -3’<br />
5’- ACGTGGTCATCACTCACCGC -3’<br />
5’- AAGGAGGAGCGTTCTCGTGG -3’<br />
5’-ACGAGCGAGTGGAGAATAGG-3’<br />
5'-AGCCCAGTACGTGGGGTC-3’<br />
5.06 5 4<br />
8.02 9 9<br />
6.05 10 6<br />
9.01 7 7<br />
10.04 2 1<br />
4.10 6 6<br />
9.01<br />
6 5<br />
3.08 10 10<br />
10.05 5 5<br />
7.00<br />
7 6<br />
7.01 8 8<br />
2.07<br />
2.07<br />
10.04<br />
16 16<br />
9 9<br />
11 9<br />
total 121 110 89.4<br />
RESULTS AND DISCUSSION<br />
Hybrids <strong>yield</strong>ed an overall mean <strong>of</strong> 11.37 tha -1 , with range from 10.91<br />
to12.12 tha -1 (Table 2). The highest <strong>yield</strong> in both locations had H5 (L4xL6) <strong>and</strong> the<br />
lowest one H2 (L8xL2). The differences in <strong>yield</strong>s <strong>of</strong> different <strong>hybrids</strong> are possible in<br />
<strong>hybrids</strong> <strong>of</strong> various genetic backgrounds (ALI et al., 2007), which is confirmed by our<br />
results. Among lines, the highest <strong>yield</strong> has L4 (5.68 tha -1 ) <strong>and</strong> the lowest one L2<br />
(3.37 tha -1 ).<br />
80<br />
100<br />
60<br />
100<br />
50<br />
100<br />
83.3<br />
100<br />
100<br />
85.7<br />
100<br />
100<br />
100<br />
82
S. MLADENOVIC DRINIC et al.: YIELD, HETEROSIS AND GD BASED ON SSR IN MAIZE 403<br />
The averaged <strong>yield</strong> <strong>of</strong> <strong>parental</strong> lines was 4.20 tha -1 . Generally, the <strong>yield</strong> <strong>of</strong><br />
<strong>hybrids</strong> <strong>and</strong> <strong>parental</strong> lines was lower in location 2 than location 1 (data not shown).<br />
Midparent <strong>heterosis</strong> (MPH) from grain <strong>yield</strong> averaged 164.25%, ranged from<br />
136.72% (L4xL6) to 218.07% (L8xL2). The highest best parent <strong>heterosis</strong> was in H2<br />
(212.60%) <strong>and</strong> the lowest in H4 (100.70%), averaged 137.36%. The hybrid with the<br />
highest <strong>yield</strong>, combination <strong>of</strong> two good <strong>yield</strong>ing inbred lines, has the lowest MPH<br />
<strong>and</strong> low BPH. The parents <strong>of</strong> H2 with the lowest <strong>yield</strong> but the highest both MPH <strong>and</strong><br />
BPH are low <strong>yield</strong>ed inbred.<br />
All <strong>hybrids</strong>, as crosses between inbred lines from different heterotic group,<br />
has positive <strong>yield</strong> heteroses which is in agreement with another investigators, who<br />
commonly assumed that the combination <strong>of</strong> lines <strong>of</strong> different heterotic groups<br />
originates <strong>hybrids</strong> with higher chances <strong>of</strong> genetic expression <strong>of</strong> the target effects <strong>of</strong><br />
hybridization (TROYER, 1999; TOLLENAAR et al., 2004).<br />
Table 2. Yield, <strong>yield</strong> <strong>heterosis</strong> <strong>and</strong> GD for <strong>hybrids</strong> <strong>and</strong> <strong>their</strong> <strong>parental</strong> inbred lines<br />
genotype Yield<br />
(t/ha)<br />
genotype Yield<br />
(t/ha)<br />
Midparent<br />
<strong>heterosis</strong><br />
(%)<br />
Best parent<br />
<strong>heterosis</strong><br />
(%)<br />
Parental genotypes F1 <strong>hybrids</strong><br />
L1 4.03 L1xL7 11.10 183.88 175.43 0.59<br />
L2 3.37 L8xL2 10.91 218.07 212.60 0.61<br />
L3 5.25 L3xL7 11.05 144.46 110.47 0.55<br />
L4 5.68 L4xL8 11.40 148.90 100.70 0.59<br />
L5 3.47 L4xL6 12.12 136.72 114.79 0.61<br />
L6 4.56 L3xL6 11.82 141.22 125.15 0.57<br />
L7 3.79 L3xL8 10.98 151.25 109.14 0.55<br />
L8 3.49 L6xL5 11.61 189.52 150.60 0.57<br />
The 15 SSR primer pairs were used to reveal the genetic diversity among<br />
eight <strong>hybrids</strong> <strong>and</strong> <strong>their</strong> <strong>parental</strong> lines. From screening 20 SSRs primers, 3 primers<br />
failed to amplify products consistently, 2 primers were difficult to score accurately.<br />
Fifteen pairs <strong>of</strong> primers were chosen which could produce stable <strong>and</strong> repeatable<br />
b<strong>and</strong>s (Tab. 1). The number <strong>of</strong> SSR loci used to screen the <strong>maize</strong> genotypes was<br />
considerably lower than those reported previously in <strong>maize</strong> (PINTO et al., 2003,<br />
WARBURTON et al., 2002, LEGESSE et al., 2007) but according to SOUZA et al., (2008),<br />
16 microsatellite loci were enough to analyze the genotypes with accuracy. A total <strong>of</strong><br />
121 alleles were scored from which 110 (89.4%) was polymorphic. The average<br />
number <strong>of</strong> alleles per primer was 8.07, ranging from 2 (UMC1827) to 16 (bngl<br />
1633). The mean allele per markers in this study was little higher than those detected<br />
by previous SSR studies (SUN et al. 2001). XIA et al (2004) found an average <strong>of</strong> 7.4<br />
allelles per markers <strong>and</strong> RANATUGA et al (2009) notice 6.0 alleles per primers using<br />
22 SSR primers for analysis <strong>of</strong> <strong>maize</strong> inbreds.<br />
GD
404 GENETIKA, Vol. 44, No.2, 399-408, 2012<br />
The lowest genetic distance (0.12) was between two sister lines L7 <strong>and</strong> L8<br />
<strong>and</strong> the highest one between L2 <strong>and</strong> L3 (Tab3.). L2 is from independent source <strong>and</strong><br />
L3 belonging to BSSS germplasm. Also, inbred line L2 was genetically distinct from<br />
sister lines L7 <strong>and</strong> L8, belonging to Lancaster germplasm. Genetic distance was<br />
lower between inbred belonging to Lancaster heterotic group compared to inbreds<br />
belonging to BSSS heterotic group. The genetic distance between inbred lines is in<br />
agreement with data on the origin <strong>of</strong> the inbreds, <strong>and</strong> also with the grain <strong>yield</strong><br />
<strong>heterosis</strong> <strong>of</strong> <strong>their</strong> crosses. Hybrid H4, with the highest <strong>yield</strong>, is cross between L4 <strong>and</strong><br />
L6, lines with the highest genetic distance, which is in accordance with<br />
SAMPHANTARAK (2003), who had reported that the two main factors affected high<br />
grain <strong>yield</strong> <strong>of</strong> <strong>hybrids</strong> were high GD <strong>and</strong> adaptability <strong>of</strong> both <strong>parental</strong> lines.<br />
The genetic distance between <strong>parental</strong> inbred lines <strong>of</strong> analyzed <strong>hybrids</strong> was<br />
in range 0.55-0.61. The lowest genetic distance was estimated between <strong>hybrids</strong> H8<br />
<strong>and</strong> H6 which have one common parent <strong>and</strong> the highest one between <strong>hybrids</strong> H6 <strong>and</strong><br />
H4 (Tab 4.). In <strong>hybrids</strong> H1, H3, H7 <strong>and</strong> H8 genetic distance between hybrid <strong>and</strong><br />
both parent lines was almost similar. Hybrids H5 <strong>and</strong> H6 were more similar to<br />
female parent as well as <strong>hybrids</strong> H2 <strong>and</strong> H4 to male parent.<br />
Table 3 Genetic distance between inbred lineas<br />
L1 L2 L3 L4 L5 L6 L7<br />
L2 0.47<br />
L3 0.53 0.62<br />
L4 0.56 0.47 0.57<br />
L5 0.43 0.49 0.58 0.64<br />
L6 0.56 0.71 0.57 0.61 0.57<br />
L7 0.59 0.61 0.55 0.59 0.52 0.41<br />
L8 0.59 0.61 0.55 0.59 0.57 0.41 0.12<br />
Table 4. Genetic distance between <strong>hybrids</strong><br />
H1 H2 H3 H4 H5 H6 H7<br />
H2 0.46<br />
H3 0.48 0.59<br />
H4 0.46 0.50 0.46<br />
H5 0.53 0.42 0.61 0.40<br />
H6 0.54 0.43 0.42 0.62 0.46<br />
H7 0.48 0.57 0.39 0.44 0.56 0.40<br />
H8 0.56 0.49 0.51 0.59 0.53 0.37 0.47<br />
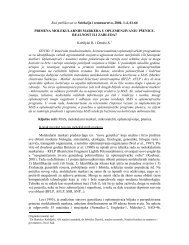
The cluster analysis based on genetic distance computed from SSR data<br />
classifies each <strong>of</strong> 16 genotypes into one <strong>of</strong> two principal clusters, designated GI, GII.<br />
Results are presented in Figure 1. The cluster I consist <strong>of</strong> two subclusters A <strong>and</strong> B.<br />
Subcluster A encompasses 6 genotypes, <strong>hybrids</strong> H1 <strong>and</strong> H2 form one subgroup <strong>and</strong>
S. MLADENOVIC DRINIC et al.: YIELD, HETEROSIS AND GD BASED ON SSR IN MAIZE 405<br />
<strong>hybrids</strong> H4 <strong>and</strong> H5 another subgroup. Hybrids H4 <strong>and</strong> H5 have L4 as a common<br />
parent. Two inbred lines, L2 <strong>and</strong> L4 are linked with those <strong>hybrids</strong>. Subcluster B<br />
contains four <strong>hybrids</strong> H3, H7, H6, H8 with one common inbred line in background.<br />
Clustering <strong>of</strong> <strong>hybrids</strong> based on SSR markers showed good agreement with <strong>their</strong><br />
pedigree data, <strong>hybrids</strong> with similar <strong>parental</strong> components were joined together in<br />
similar group. Cluster GII includes two subclusters C <strong>and</strong> D. Three inbred lines from<br />
BSSS heterotic group, L1, L5 <strong>and</strong> L3, formed subclaster C. Claster D formed two<br />
sister lines <strong>and</strong> L6 loosely linked to them All inbred lines from subclaster D<br />
belonging to Lancester heterotic group. The results show that lines the most closely<br />
related by pedigree are those that are also closely related on the basis <strong>of</strong> SSR marker<br />
information.<br />
Fig. 1. Association among <strong>hybrids</strong> <strong>and</strong> <strong>parental</strong> inbred lines revealed by cluster analysis<br />
<strong>of</strong> SSR distance data<br />
The correlation between the GD <strong>and</strong> grain <strong>yield</strong>, grain <strong>yield</strong> <strong>heterosis</strong> was<br />
established by Spearman's rank correlation coefficient. The GD between <strong>parental</strong><br />
inbred lines was positively correlated with the hybrid grain <strong>yield</strong> (r=0.22), as well as<br />
with MPH <strong>and</strong> BPH with value <strong>of</strong> 0.12 <strong>and</strong> 0.45, respectively. Our result was similar<br />
to that <strong>of</strong> BETRAN et al. (2003) who showed the GD was positively correlated with<br />
the grain <strong>yield</strong>, MPH, <strong>and</strong> best parent <strong>heterosis</strong> <strong>of</strong> F1 <strong>hybrids</strong>. PAJIC et al (2010)<br />
obtained positive <strong>and</strong> significant correlation between GD <strong>and</strong> grain <strong>yield</strong> <strong>and</strong><br />
positive correlation with grain <strong>yield</strong> <strong>heterosis</strong> in set <strong>of</strong> popcorn inbred lines.
406 GENETIKA, Vol. 44, No.2, 399-408, 2012<br />
The SSR markers represent a powerful tool in the assessment <strong>of</strong> the genetic<br />
diversity between inbred lines. Using them, field trials for the identification <strong>of</strong><br />
promising heterotic patterns can be planned more efficiently based on the prior<br />
obtained information by markers, <strong>and</strong> that would make a great contribution to the<br />
efficiency <strong>of</strong> <strong>maize</strong> breeding.<br />
ACKNOWLEDGEMENTS<br />
This study was part <strong>of</strong> the project TR31068 <strong>of</strong> Ministry <strong>of</strong> education <strong>and</strong> science<br />
Republic <strong>of</strong> Serbia<br />
Received February 21 th , 2012<br />
Accepted July 23 rd , 2012<br />
REFERENCES<br />
ADETIMIRIN, VO, I. VROH-BI, C.THE, A. MENKIR, SE. MITCHELL, S. KRESOVICH (2008): Diversity analysis <strong>of</strong><br />
elite <strong>maize</strong> inbred lines adapted to west <strong>and</strong> central Africa using SSR markers. Maydica 53:<br />
143-149<br />
ALI, W., H.REHMAN, K.AHMAD, I.MUNIR, A. KHAN (2007): Genetic variability among <strong>maize</strong> <strong>hybrids</strong> for<br />
<strong>yield</strong> <strong>and</strong> <strong>yield</strong> components. Sarhad Journal <strong>of</strong> Agriculture 23 (1): 75-80.<br />
BALESTRE, M., J.C. MACHADO, J.L. LIMA, J.C. SOUZA AND L. NÓBREGA FILHO (2008): Genetic distance<br />
estimates among single cross <strong>hybrids</strong> <strong>and</strong> correlation with specific combining ability <strong>and</strong> <strong>yield</strong><br />
in corn double cross <strong>hybrids</strong>. Genet. Mol. Res. 7 (1): 65-73<br />
BARBOSA, A.M.M., I.O. GERALDI, L.L. BENCHIMOL, A.A.F. GARCIA, C.L. SOUZA JR., A.P. SOUZA (2003):<br />
Relationship <strong>of</strong> intra- <strong>and</strong> inter-population <strong>maize</strong> single crosses hybrid performance <strong>and</strong><br />
genetic distances computed from AFLP <strong>and</strong> SSR markers. Euphytica 130, 87–99<br />
BETRAN, F.J., J.M. RIBAUT, D. BECK, D. GONZALEZ DE LEON (2003): Genetic diversity, specific combining<br />
ability, <strong>and</strong> <strong>heterosis</strong> in tropical <strong>maize</strong> under stress <strong>and</strong> nonstress environments. Crop Sci. 43,<br />
797–806<br />
DRINIĆ MLADENOVIĆ, S, S. TRIFUNOVIĆ G., DRINIĆ, K. KONSTANTINOV (2002): Genetic diversity <strong>and</strong> its<br />
correlation to <strong>heterosis</strong> in <strong>maize</strong> as revealed by SSR based markers. Maydica 47: 1-8<br />
ENOKI, H, H. SATO, K. KOINUMA (2002): SSR analysis <strong>of</strong> genetic diversity among <strong>maize</strong> inbred lines<br />
adapted to cold regions <strong>of</strong> Japan. Theoretical <strong>and</strong> Applied Genetics 104: 1270-1278<br />
KARANJA, J., N. O. AMUGUNE, J. ININDA, J.N. KIMATU AND J.W DANSON (2009): Microsatellite analysis <strong>of</strong><br />
the correlation between molecular <strong>and</strong> morphological traits in assorted <strong>maize</strong> inbred lines.<br />
African Crop Science Journal, Vol. 17, No. 3, pp. 133 - 144<br />
KUMARI, J., R. N GADAG , G. K. JHA (2008): Genetic distance based on simple sequence repeats <strong>and</strong> its<br />
relationship to specific combining ability <strong>and</strong> <strong>heterosis</strong> in <strong>maize</strong> (Zea mays L.). The Indian<br />
Journal <strong>of</strong> Genetics <strong>and</strong> Plant Breeding, vol 68 (2), 124- 131.<br />
LAMKEY, K. R. AND J. W. EDWARDS. (1999): The quantitative genetics <strong>of</strong> <strong>heterosis</strong>. p. 31-48. In: J.G. Coors<br />
<strong>and</strong> S. P<strong>and</strong>ey (ed.) Proceedings <strong>of</strong> the International Symposium on the Genetics <strong>and</strong><br />
Exploitation <strong>of</strong> Heterosis in Crops, CIMMYT, Mexico City, Mexico, 17-22 Aug. 1997. ASA,<br />
CSSA, <strong>and</strong> SSSA, Madison, WI.<br />
LEGESSE, BW, AA MYBURG, KV PIXLEY, S. TWUMASI-AFRIYIE, et al. (2007): Relationship between hybrid<br />
performance <strong>and</strong> AFLP based genetic distance in highl<strong>and</strong> <strong>maize</strong> inbred lines. Euphytica 162:<br />
313-323.<br />
PABENDON, MARCIA B, M.J. MEJAYA, J. KOSWARA, AND H. ASWIDINNOOR (2009): SSR-based genetic<br />
diversities among <strong>maize</strong> inbred lines<strong>and</strong> <strong>their</strong> relationships with F1 phenotypic data <strong>of</strong> MR4<br />
<strong>and</strong> MR14 testcrosses Indonesian journal <strong>of</strong> agriculture 2(1), 41-48<br />
PAJIC, Z., U. ERIC, S.DRINIC MLADENOVIC, J. SRDIC, M. FILIPOVIC (2010): Genetic Divergence Estimated<br />
by RAPD Markers <strong>and</strong> its Relationship with Hybrid Performance in Popcorn. Cereal Research<br />
Communications, vol. 38, 2, 184-192<br />
PHUMICHAI, C., W. DOUNGCHAN, P. PUDDHANON, S. JAMPATONG, P. GRUDLOYMA C. KIRDSRI, J.<br />
CHUNWONGSE, T. PULAM (2008): SSR-based <strong>and</strong> grain <strong>yield</strong>-based diversity <strong>of</strong> hybrid <strong>maize</strong> in<br />
Thail<strong>and</strong>. Field Crops Research 108, 157–162
S. MLADENOVIC DRINIC et al.: YIELD, HETEROSIS AND GD BASED ON SSR IN MAIZE 407<br />
PINTO, RMC, CL JR SOUZA, LA CARLINI-GARCIA, AAF GARCIA, et al. (2003): Comparison between molecular<br />
markers <strong>and</strong> diallel crosses in the assignment <strong>of</strong> <strong>maize</strong> lines to heterotic groups. Maydica 48:<br />
63-73.<br />
PONGSAI, C., XL. TAN, A. SILAPAPUN, P. SUTHIPONG <strong>and</strong> L. WEI (2009): The use <strong>of</strong> SSR markers to identify<br />
heterotic pattern <strong>of</strong> F1 <strong>hybrids</strong> in two tropical <strong>maize</strong> populations. Suranaree J. Sci. Technol.<br />
16(2):175-184<br />
RANATUNGA, M. A. B., P. MEENAKSHISUNDARAM, S. ARUMUGACHAMY, & M.MAHESWARAN (2009):<br />
Genetic diversity <strong>of</strong> <strong>maize</strong> (Zea may L.) inbreds determined with morphometric traits <strong>and</strong><br />
simple sequence repeat markers. Maydica, 54, 113-123.<br />
REIF, J.C., A.E. MELCHINGER, X.C. XIA, M.L. WARBURTON, D.A. HOISINGTON, S.K. VASAL, G. SRINIVASAN, M.<br />
BOHN, M. FRISCH (2003):. Genetic distance based on simple sequence repeats <strong>and</strong> <strong>heterosis</strong> in<br />
tropical <strong>maize</strong> populations. Crop Sci. 43,1275–1282.<br />
ROHLF, F.J. (2000): NTSYS-pc. Numerical taxonomy <strong>and</strong> multivariate analysis system. Version 2.0 Exeter<br />
S<strong>of</strong>tware, Setaket, N.Y.<br />
SAGHAI-MAROOF, MA, KM SOLIMAN, RA JORGENSEN, RW ALLARD (1984): Ribosomal DNA spacer-length<br />
polymorphisms in barley:Mendelian inheritance, chromosomal location, <strong>and</strong> population<br />
dynamics. Proc Natl Acad Sci USA 81:8014–8018<br />
SAMPHANTARAK, K. (2003): Plant breeding. 1st ed.Kasetsart Bangkok, p. 66-91.<br />
SENIOR, M.L., J.P. MURPHY, M.M. GOODMAN, C.W. STUBER (1998): Utility <strong>of</strong> SSRs for determining genetic<br />
similarities <strong>and</strong> relationships in <strong>maize</strong> using an agarose gel system. Crop Sci. 38, 1088–1098.<br />
SOUZA, S., V.CARPENTIERI-PIPOLO, C.RUAS, V.CARVALHO, P.RUAS, <strong>and</strong> A. GERAGE (2008): Comparative<br />
analysis <strong>of</strong> genetic diversity among the <strong>maize</strong> inbred lines obtained by RAPD <strong>and</strong> SSR<br />
markers. Brazilian archives <strong>of</strong> biology <strong>and</strong> technology 51: 183-192.<br />
SRDIĆ, J., A NIKOLIĆ, Z. PAJIĆ, S. MLADENOVIĆ DRINIĆ, M. FILIPOVIĆ (2011): Genetic similarity <strong>of</strong> sweet<br />
corn inbred lines in correlation with <strong>heterosis</strong>, Maydica 56,1740<br />
SUN, G.L., M.WILLIAM, J.LIU, K.J. KASHA, <strong>and</strong> K.P. PAULS (2001): Microsatellite <strong>and</strong> RAPD polymosphisms<br />
in Ontario corn hybridos are related to the commercial sources <strong>and</strong> maturity ratings. Molecular<br />
Breeding, 7, 13-24.<br />
TOLLENAAR, M, A. AHMADZADEH <strong>and</strong> EA LEE (2004): Physiological basis <strong>of</strong> <strong>heterosis</strong> for grain <strong>yield</strong> in<br />
<strong>maize</strong>. Crop Sci. 44: 2086-2094.<br />
TROYER, AF (1999): Background <strong>of</strong> U.S. hybrid corn. Crop Sci. 39: 621-626.<br />
WARBURTON, ML, X. XIANCHUN, J. CROSSA, J. FRANCO, et al. (2002): Genetic characterization <strong>of</strong><br />
CIMMYT inbred <strong>maize</strong> lines <strong>and</strong> open pollinated populations using large scale fingerprinting<br />
methods. Crop Sci. 42: 1832-1840.<br />
XIA, X.C., J.C. REIF, D.A. HOISINGTON, A.E. MELCHINGER, M. FRISCH, M.L.WARBURTON (2004): Genetic<br />
diversity among CIMMYT <strong>maize</strong> inbred lines investigated with SSR markers. I: Lowl<strong>and</strong><br />
tropical <strong>maize</strong>. Crop Sci. 44, 2230–2237.<br />
XU, S.X., J.LIU, G.S. LIU (2004): The use <strong>of</strong> SSRs for predicting the hybrid <strong>yield</strong> <strong>and</strong> <strong>yield</strong> <strong>heterosis</strong> in 15<br />
key inbred lines <strong>of</strong> Chinese <strong>maize</strong>. Hereditas 141, 207–215.
408 GENETIKA, Vol. 44, No.2, 399-408, 2012<br />
KORELACIJA PRINOSA I HETEROZISA HIBRIDA KUKURUZA<br />
I NJIHOVIH RODITELJSKIH LINIJA SA GENETIČKOM DISTANCOM<br />
NA OSNOVU SSR MARKERA<br />
Snežana MLADENOVIĆ DRINIĆ, Marija KOSTADINOVIĆ, Danijela RISTIĆ,<br />
Milan STEVANOVIĆ, Zoran ČAMDŽIJA, Milomir FILIPOVIĆ,<br />
Dragan KOVAČEVIĆ<br />
Institut za kukuruz Zemun Polje, Beograd, Srbija<br />
Prinos, heterozis za prinos zrna i genetička distanca izračunata na osnovu<br />
SSR markera, su ispitivani za osam hibrida kukuruza i njihove roditeljske<br />
komponente. Prosečan prinos zrna F1 hibrida je bio 11.37 tha -1 . Hibrid dobijen<br />
ukrštanjem linija L4xL6 je imao najveći prinos od 12.12 tha -1 . Prosečna vrednost<br />
heterozisa u odnosu na prosečnog roditelja za prinos zrna za hibride je bila 164.25%,<br />
i varirala je od 136.72% (L4xL6) do 218.07% (L8xL2), i za heterozis u odnosu na<br />
boljeg roditelja od 100.70% (H4) do 212.60% (H2), prosečno 137.36%. Prosečna<br />
genetička distanca između roditeljskih linija ispitanih hibrida je bila 0.58 sa opsegom<br />
od 0.55 do 0.61. Korelacija između GD i prinosa hibrida je bila pozitivna (r=0.22),<br />
kao i sa heterozisom u odnosu na prosečnog roditelja (r=0.12) odnosno heterozisom<br />
u odnosu na boljeg roditelja (r=0.45).<br />
Primljeno 21. II. 2012.<br />
Odobreno 23. VII. 2012.