

Geologic And Hydrologic Factors Governing ... - Gunnison County
Geologic And Hydrologic Factors Governing ... - Gunnison County
Geologic And Hydrologic Factors Governing ... - Gunnison County

Create successful ePaper yourself
Turn your PDF publications into a flip-book with our unique Google optimized e-Paper software.
<strong>Geologic</strong> <strong>And</strong> <strong>Hydrologic</strong> <strong>Factors</strong> <strong>Governing</strong> Impacts Of Development<br />
On The Crystal River Near Marble, Colorado<br />
<strong>Gunnison</strong> <strong>County</strong>, Colorado<br />
high-mountain watershed rising to above 12,000 feet. The subject ski area filings are typically well-<br />
covered with fairly dense vegetation on land with slopes often over 30 percent.<br />
4.1 Precipitation<br />
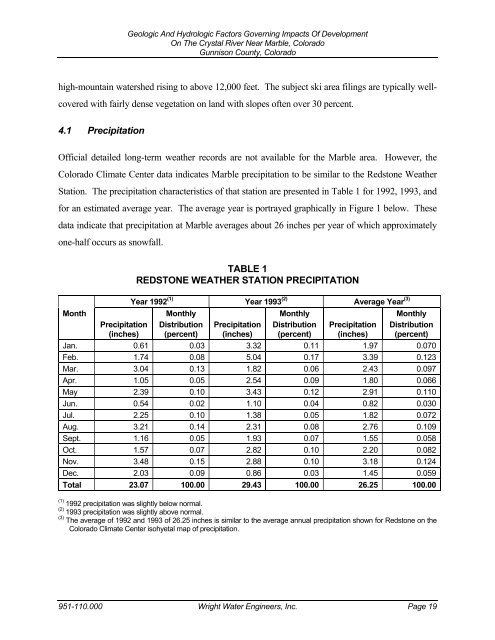
Official detailed long-term weather records are not available for the Marble area. However, the<br />
Colorado Climate Center data indicates Marble precipitation to be similar to the Redstone Weather<br />
Station. The precipitation characteristics of that station are presented in Table 1 for 1992, 1993, and<br />
for an estimated average year. The average year is portrayed graphically in Figure 1 below. These<br />
data indicate that precipitation at Marble averages about 26 inches per year of which approximately<br />
one-half occurs as snowfall.<br />
Month<br />
Precipitation<br />
(inches)<br />
TABLE 1<br />
REDSTONE WEATHER STATION PRECIPITATION<br />
Year 1992 (1) Year 1993 (2) Average Year (3)<br />
Monthly<br />
Distribution<br />
(percent)<br />
Precipitation<br />
(inches)<br />
Monthly<br />
Distribution<br />
(percent)<br />
Precipitation<br />
(inches)<br />
Monthly<br />
Distribution<br />
(percent)<br />
Jan. 0.61 0.03 3.32 0.11 1.97 0.070<br />
Feb. 1.74 0.08 5.04 0.17 3.39 0.123<br />
Mar. 3.04 0.13 1.82 0.06 2.43 0.097<br />
Apr. 1.05 0.05 2.54 0.09 1.80 0.066<br />
May 2.39 0.10 3.43 0.12 2.91 0.110<br />
Jun. 0.54 0.02 1.10 0.04 0.82 0.030<br />
Jul. 2.25 0.10 1.38 0.05 1.82 0.072<br />
Aug. 3.21 0.14 2.31 0.08 2.76 0.109<br />
Sept. 1.16 0.05 1.93 0.07 1.55 0.058<br />
Oct. 1.57 0.07 2.82 0.10 2.20 0.082<br />
Nov. 3.48 0.15 2.88 0.10 3.18 0.124<br />
Dec. 2.03 0.09 0.86 0.03 1.45 0.059<br />
Total 23.07 100.00 29.43 100.00 26.25 100.00<br />
(1) 1992 precipitation was slightly below normal.<br />
(2) 1993 precipitation was slightly above normal.<br />
(3) The average of 1992 and 1993 of 26.25 inches is similar to the average annual precipitation shown for Redstone on the<br />
Colorado Climate Center isohyetal map of precipitation.<br />
951-110.000 Wright Water Engineers, Inc. Page 19
