Annual Report 2009 on Form 20-F (PDF) - Deutsche Bank Annual ...
Annual Report 2009 on Form 20-F (PDF) - Deutsche Bank Annual ...
Annual Report 2009 on Form 20-F (PDF) - Deutsche Bank Annual ...

You also want an ePaper? Increase the reach of your titles
YUMPU automatically turns print PDFs into web optimized ePapers that Google loves.
<strong>Deutsche</strong> <strong>Bank</strong><br />
<str<strong>on</strong>g>Annual</str<strong>on</strong>g> <str<strong>on</strong>g>Report</str<strong>on</strong>g> <str<strong>on</strong>g><strong>20</strong>09</str<strong>on</strong>g><br />
<strong>on</strong> <strong>Form</strong> <strong>20</strong>-F
x<br />
As filed with the Securities and Exchange Commissi<strong>on</strong> <strong>on</strong> March 16, <strong>20</strong>10<br />
UNITED STATES<br />
SECURITIES AND EXCHANGE COMMISSION<br />
WASHINGTON, D.C. <strong>20</strong>549<br />
<strong>Form</strong> <strong>20</strong>-F<br />
REGISTRATION STATEMENT PURSUANT TO SECTION 12(b) OR (g) OF THE SECURITIES<br />
EXCHANGE ACT OF 1934<br />
or<br />
ANNUAL REPORT PURSUANT TO SECTION 13 OR 15(d) OF THE SECURITIES EXCHANGE<br />
ACT OF 1934 FOR THE FISCAL YEAR ENDED DECEMBER 31, <str<strong>on</strong>g><strong>20</strong>09</str<strong>on</strong>g><br />
or<br />
TRANSITION REPORT PURSUANT TO SECTION 13 OR 15(d) OF THE SECURITIES<br />
EXCHANGE ACT OF 1934<br />
or<br />
SHELL COMPANY REPORT PURSUANT TO SECTION 13 OR 15(d) OF THE SECURITIES<br />
EXCHANGE ACT OF 1934<br />
Date of event requiring this shell company report……………………………….<br />
Commissi<strong>on</strong> file number 1-15242<br />
<strong>Deutsche</strong> <strong>Bank</strong> Aktiengesellschaft<br />
(Exact name of Registrant as specified in its charter)<br />
<strong>Deutsche</strong> <strong>Bank</strong> Corporati<strong>on</strong><br />
(Translati<strong>on</strong> of Registrant’s name into English)<br />
Federal Republic of Germany<br />
(Jurisdicti<strong>on</strong> of incorporati<strong>on</strong> or organizati<strong>on</strong>)<br />
Theodor-Heuss-Allee 70, 60486 Frankfurt am Main, Germany<br />
(Address of Registrant’s principal executive offices)<br />
Securities registered or to be registered pursuant to Secti<strong>on</strong> 12(b) of the Act<br />
See following page<br />
Securities registered or to be registered pursuant to Secti<strong>on</strong> 12(g) of the Act.<br />
NONE<br />
(Title of Class)<br />
Securities for which there is a reporting obligati<strong>on</strong> pursuant to Secti<strong>on</strong> 15(d) of the Act.<br />
NONE<br />
(Title of Class)<br />
Indicate the number of outstanding shares of each of the issuer’s classes of capital or comm<strong>on</strong> stock as of the close of the period covered by the annual<br />
report:<br />
Ordinary Shares, no par value 6<strong>20</strong>,175,3<strong>20</strong><br />
(as of December 31, <str<strong>on</strong>g><strong>20</strong>09</str<strong>on</strong>g>)<br />
Indicate by check mark if the registrant is a well-known seas<strong>on</strong>ed issuer, as defined in Rule 405 of the Securities Act.<br />
Yes x<br />
No<br />
If this report is an annual or transiti<strong>on</strong> report, indicate by check mark if the registrant is not required to file reports pursuant to Secti<strong>on</strong> 13 or 15(d) of<br />
the Securities Exchange Act of 1934.<br />
Yes No x<br />
Indicate by check mark whether the registrant (1) has filed all reports required to be filed by Secti<strong>on</strong> 13 or 15(d) of the Securities Exchange Act of<br />
1934 during the preceding 12 m<strong>on</strong>ths (or for such shorter period that the registrant was required to file such reports), and (2) has been subject to such<br />
filing requirements for the past 90 days.<br />
Yes x<br />
No<br />
Indicate by check mark whether the registrant is a large accelerated filer, an accelerated filer, or n<strong>on</strong>- accelerated filer.<br />
See definiti<strong>on</strong> of “accelerated filer and large accelerated filer” in Rule 12b-2 of the Exchange Act (Check <strong>on</strong>e):<br />
Large accelerated filer x<br />
Accelerated filer N<strong>on</strong>-accelerated filer<br />
Indicate by check mark which basis of accounting the registrant has used to prepare the financial statements included in this filing:<br />
U.S. GAAP Internati<strong>on</strong>al Financial <str<strong>on</strong>g>Report</str<strong>on</strong>g>ing Standards x<br />
Other<br />
as issued by the Internati<strong>on</strong>al Accounting Standards Board<br />
Indicate by check mark which financial statement item the registrant has elected to follow<br />
Item 17 Item 18 x<br />
If this is an annual report, indicate by check mark whether the registrant is a shell company<br />
(as defined in Rule 12b-2 of the Exchange Act).<br />
Yes No<br />
x
Securities registered or to be registered pursuant to Secti<strong>on</strong> 12(b) of the Act (as of February 19, <strong>20</strong>10).<br />
Title of each class Name of each exchange <strong>on</strong> which<br />
registered<br />
Ordinary shares, no par value New York Stock Exchange<br />
6.375 % N<strong>on</strong>cumulative Trust Preferred Securities of <strong>Deutsche</strong> <strong>Bank</strong> Capital Funding Trust VIII New York Stock Exchange<br />
6.375 % N<strong>on</strong>cumulative Company Preferred Securities of <strong>Deutsche</strong> <strong>Bank</strong> Capital Funding Trust VIII*<br />
Subordinated Guarantees of <strong>Deutsche</strong> <strong>Bank</strong> AG in c<strong>on</strong>necti<strong>on</strong> with Capital Securities*<br />
6.55 % Trust Preferred Securities of <strong>Deutsche</strong> <strong>Bank</strong> C<strong>on</strong>tingent Capital Trust II New York Stock Exchange<br />
6.55 % Company Preferred Securities of <strong>Deutsche</strong> <strong>Bank</strong> C<strong>on</strong>tingent Capital Trust II*<br />
Subordinated Guarantees of <strong>Deutsche</strong> <strong>Bank</strong> AG in c<strong>on</strong>necti<strong>on</strong> with Capital Securities*<br />
6.625 % N<strong>on</strong>cumulative Trust Preferred Securities of <strong>Deutsche</strong> <strong>Bank</strong> Capital Funding Trust IX New York Stock Exchange<br />
6.625 % N<strong>on</strong>cumulative Company Preferred Securities of Deutsch <strong>Bank</strong> Capital Funding LLC IX*<br />
Subordinated Guarantees of <strong>Deutsche</strong> <strong>Bank</strong> AG in c<strong>on</strong>necti<strong>on</strong> with Capital Securities*<br />
ELEMENTS(SM) Linked to the Morningstar® Wide Moat Focus(SM) Total Return Index due October 24, <strong>20</strong>22 NYSE Arca<br />
ELEMENTS(SM) “Dogs of the Dow” Linked to the Dow J<strong>on</strong>es High Yield Select 10 Total Return Index due November 14,<br />
<strong>20</strong>22 NYSE Arca<br />
7.350 % N<strong>on</strong>cumulative Trust Preferred Securities of <strong>Deutsche</strong> <strong>Bank</strong> Capital Funding Trust X New York Stock Exchange<br />
7.350 % N<strong>on</strong>cumulative Company Preferred Securities of <strong>Deutsche</strong> <strong>Bank</strong> Capital Funding Trust X*<br />
Subordinated Guarantees of <strong>Deutsche</strong> <strong>Bank</strong> AG in c<strong>on</strong>necti<strong>on</strong> with Capital Securities*<br />
7.60 % Trust Preferred Securities of <strong>Deutsche</strong> <strong>Bank</strong> C<strong>on</strong>tingent Capital Trust III New York Stock Exchange<br />
7.60 % Company Preferred Securities of <strong>Deutsche</strong> <strong>Bank</strong> C<strong>on</strong>tingent Capital Trust III*<br />
Subordinated Guarantees of <strong>Deutsche</strong> <strong>Bank</strong> AG in c<strong>on</strong>necti<strong>on</strong> with Capital Securities*<br />
DB Gold Double L<strong>on</strong>g Exchange Traded notes due February 15, <strong>20</strong>38 NYSE Arca<br />
DB Gold Double Short Exchange Traded notes due February 15, <strong>20</strong>38 NYSE Arca<br />
DB Gold Short Exchange Traded notes due February 15, <strong>20</strong>38 NYSE Arca<br />
DB Agriculture Short Exchange Traded Notes due April 1, <strong>20</strong>38 NYSE Arca<br />
DB Agriculture L<strong>on</strong>g Exchange Traded Notes due April 1, <strong>20</strong>38 NYSE Arca<br />
DB Agriculture Double Short Exchange Traded Notes due April 1, <strong>20</strong>38 NYSE Arca<br />
DB Agriculture Double L<strong>on</strong>g Exchange Traded Notes due April 1, <strong>20</strong>38 NYSE Arca<br />
DB Commodity Short Exchange Traded Notes due April 1, <strong>20</strong>38 NYSE Arca<br />
DB Commodity L<strong>on</strong>g Exchange Traded Notes due April 1, <strong>20</strong>38 NYSE Arca<br />
DB Commodity Double L<strong>on</strong>g Exchange Traded Notes due April 1, <strong>20</strong>38 NYSE Arca<br />
DB Commodity Double Short Exchange Traded Notes due April 1, <strong>20</strong>38 NYSE Arca<br />
8.05 % Trust Preferred Securities of <strong>Deutsche</strong> <strong>Bank</strong> C<strong>on</strong>tingent Capital Trust V New York Stock Exchange<br />
8.05 % Company Preferred Securities of <strong>Deutsche</strong> <strong>Bank</strong> C<strong>on</strong>tingent Capital Trust V*<br />
Subordinated Guarantees of <strong>Deutsche</strong> <strong>Bank</strong> AG in c<strong>on</strong>necti<strong>on</strong> with Capital Securities*<br />
PowerShares DB Crude Oil Short Exchange Traded Notes due June 1, <strong>20</strong>38 NYSE Arca<br />
PowerShares DB Crude Oil L<strong>on</strong>g Exchange Traded Notes due June 1, <strong>20</strong>38 NYSE Arca<br />
PowerShares DB Crude Oil Double Short Exchange Traded Notes due June 1, <strong>20</strong>38 NYSE Arca<br />
PowerShares DB Base Metals Short Exchange Traded Notes due June 1, <strong>20</strong>38 NYSE Arca<br />
PowerShares DB Base Metals L<strong>on</strong>g Exchange Traded Notes due June 1, <strong>20</strong>38 NYSE Arca<br />
PowerShares DB Base Metals Double Short Exchange Traded Notes due June 1, <strong>20</strong>38 NYSE Arca<br />
PowerShares DB Base Metals Double L<strong>on</strong>g Exchange Traded Notes due June 1, <strong>20</strong>38 NYSE Arca<br />
ELEMENTS Linked to the Benjamin Graham Large Cap Value Index – Total Return due August 14, <strong>20</strong>23 NYSE Arca<br />
ELEMENTS Linked to the Benjamin Graham Small Cap Value Index – Total Return due August 14, <strong>20</strong>23 NYSE Arca<br />
ELEMENTS Linked to the Benjamin Graham Total Market Value Index – Total Return due August 14, <strong>20</strong>23 NYSE Arca<br />
* For listing purpose <strong>on</strong>ly, not for trading.<br />
i
Table of C<strong>on</strong>tents<br />
Table of C<strong>on</strong>tents ....................................................................................................................................... ii<br />
PART I ......................................................................................................................................................... 1<br />
Item 1: Identity of Directors, Senior Management and Advisers .............................................................. 1<br />
Item 2: Offer Statistics and Expected Timetable ....................................................................................... 1<br />
Item 3: Key Informati<strong>on</strong> ............................................................................................................................. 1<br />
Selected Financial Data ......................................................................................................................... 1<br />
Dividends .............................................................................................................................................. 3<br />
Exchange Rate and Currency Informati<strong>on</strong> .............................................................................................. 4<br />
L<strong>on</strong>g-term Credit Ratings ....................................................................................................................... 5<br />
Capitalizati<strong>on</strong> and Indebtedness ............................................................................................................ 6<br />
Reas<strong>on</strong>s for the Offer and Use of Proceeds ........................................................................................... 6<br />
Risk Factors .......................................................................................................................................... 7<br />
Item 4: Informati<strong>on</strong> <strong>on</strong> the Company ....................................................................................................... 18<br />
History and Development of the Company ........................................................................................... 18<br />
Business Overview .............................................................................................................................. 19<br />
Our Group Divisi<strong>on</strong>s ............................................................................................................................ 23<br />
Corporate and Investment <strong>Bank</strong> Group Divisi<strong>on</strong> ................................................................................... 23<br />
Private Clients and Asset Management Group Divisi<strong>on</strong> ........................................................................ 27<br />
Corporate Investments Group Divisi<strong>on</strong> ................................................................................................. 34<br />
Infrastructure and Regi<strong>on</strong>al Management ............................................................................................. 35<br />
The Competitive Envir<strong>on</strong>ment .............................................................................................................. 36<br />
Regulati<strong>on</strong> and Supervisi<strong>on</strong> ................................................................................................................. 39<br />
Organizati<strong>on</strong>al Structure ...................................................................................................................... 49<br />
Property and Equipment ...................................................................................................................... 50<br />
Item 4A: Unresolved Staff Comments ..................................................................................................... 50<br />
Item 5: Operating and Financial Review and Prospects ......................................................................... 51<br />
Overview ............................................................................................................................................. 51<br />
Significant Accounting Policies and Critical Accounting Estimates ........................................................ 51<br />
Recently Adopted Accounting Pr<strong>on</strong>ouncements and New Accounting Pr<strong>on</strong>ouncements ........................ 51<br />
Operating Results (<str<strong>on</strong>g><strong>20</strong>09</str<strong>on</strong>g> vs. <strong>20</strong>08) ....................................................................................................... 52<br />
Results of Operati<strong>on</strong>s by Segment (<str<strong>on</strong>g><strong>20</strong>09</str<strong>on</strong>g> vs. <strong>20</strong>08) .............................................................................. 61<br />
Group Divisi<strong>on</strong>s ................................................................................................................................... 64<br />
Operating Results (<strong>20</strong>08 vs. <strong>20</strong>07) ....................................................................................................... 78<br />
Results of Operati<strong>on</strong>s by Segment (<strong>20</strong>08 vs. <strong>20</strong>07) .............................................................................. 80<br />
Liquidity and Capital Resources ........................................................................................................... 85<br />
Post-Employment Benefit Plans ........................................................................................................... 85<br />
Special Purpose Entities ...................................................................................................................... 85<br />
Tabular Disclosure of C<strong>on</strong>tractual Obligati<strong>on</strong>s ...................................................................................... 92<br />
Research and Development, Patents and Licenses .............................................................................. 92<br />
Item 6: Directors, Senior Management and Employees .......................................................................... 93<br />
Directors and Senior Management ....................................................................................................... 93<br />
Board Practices of the Management Board ......................................................................................... 104<br />
Group Executive Committee ............................................................................................................... 105<br />
Compensati<strong>on</strong> .................................................................................................................................... 105<br />
Employees ......................................................................................................................................... 113<br />
Share Ownership ................................................................................................................................ 116<br />
Item 7: Major Shareholders and Related Party Transacti<strong>on</strong>s ............................................................... 118<br />
Major Shareholders ............................................................................................................................ 118<br />
Related Party Transacti<strong>on</strong>s ................................................................................................................. 119<br />
Interests of Experts and Counsel ........................................................................................................ 1<strong>20</strong><br />
Item 8: Financial Informati<strong>on</strong> ................................................................................................................. 121<br />
C<strong>on</strong>solidated Statements and Other Financial Informati<strong>on</strong> .................................................................. 121<br />
Significant Changes ............................................................................................................................ 124<br />
Item 9: The Offer and Listing ................................................................................................................. 125<br />
Offer and Listing Details ..................................................................................................................... 125<br />
ii
<strong>20</strong>-F Table of C<strong>on</strong>tents<br />
Plan of Distributi<strong>on</strong> ............................................................................................................................. 126<br />
Markets ............................................................................................................................................. 127<br />
Selling Shareholders .......................................................................................................................... 128<br />
Diluti<strong>on</strong> .............................................................................................................................................. 128<br />
Expenses of the Issue ........................................................................................................................ 128<br />
Item 10: Additi<strong>on</strong>al Informati<strong>on</strong> ............................................................................................................ 129<br />
Share Capital ..................................................................................................................................... 129<br />
Memorandum and Articles of Associati<strong>on</strong> ........................................................................................... 129<br />
Material C<strong>on</strong>tracts .............................................................................................................................. 129<br />
Exchange C<strong>on</strong>trols ............................................................................................................................. 129<br />
Taxati<strong>on</strong> ............................................................................................................................................ 130<br />
Dividends and Paying Agents ............................................................................................................. 134<br />
Statement by Experts ......................................................................................................................... 135<br />
Documents <strong>on</strong> Display ....................................................................................................................... 135<br />
Subsidiary Informati<strong>on</strong> ....................................................................................................................... 135<br />
Item 11: Quantitative and Qualitative Disclosures about Credit, Market and Other Risk ................... 136<br />
Market Development .......................................................................................................................... 136<br />
Risk and Capital Management ............................................................................................................ 136<br />
Risk and Capital Strategy ................................................................................................................... 138<br />
Categories of Risk ............................................................................................................................. 138<br />
Risk Management Tools ..................................................................................................................... 140<br />
Credit Risk ......................................................................................................................................... 142<br />
Market Risk ........................................................................................................................................ 167<br />
Operati<strong>on</strong>al Risk ................................................................................................................................ 178<br />
Liquidity Risk ..................................................................................................................................... 182<br />
Capital Management .......................................................................................................................... 189<br />
Balance Sheet Management .............................................................................................................. 190<br />
Overall Risk Positi<strong>on</strong> ........................................................................................................................... 190<br />
Item 12: Descripti<strong>on</strong> of Securities other than Equity Securities .......................................................... 192<br />
Part II ..................................................................................................................................................... 193<br />
Item 13: Defaults, Dividend Arrearages and Delinquencies ................................................................ 193<br />
Item 14: Material Modificati<strong>on</strong>s to the Rights of Security Holders and Use of Proceeds ................... 193<br />
Item 15: C<strong>on</strong>trols and Procedures ........................................................................................................ 194<br />
Disclosure C<strong>on</strong>trols and Procedures .................................................................................................. 194<br />
Management’s <str<strong>on</strong>g>Annual</str<strong>on</strong>g> <str<strong>on</strong>g>Report</str<strong>on</strong>g> <strong>on</strong> Internal C<strong>on</strong>trol over Financial <str<strong>on</strong>g>Report</str<strong>on</strong>g>ing ........................................ 194<br />
Change in Internal C<strong>on</strong>trol over Financial <str<strong>on</strong>g>Report</str<strong>on</strong>g>ing ........................................................................... 196<br />
Item 16A: Audit Committee Financial Expert ....................................................................................... 196<br />
Item 16B: Code of Ethics ...................................................................................................................... 197<br />
Item 16C: Principal Accountant Fees and Services ............................................................................. 198<br />
Item 16D: Exempti<strong>on</strong>s from the Listing Standards for Audit Committees .......................................... 199<br />
Item 16E: Purchases of Equity Securities by the Issuer and Affiliated Purchasers ........................... <strong>20</strong>0<br />
Issuer Purchases of Equity Securities in <str<strong>on</strong>g><strong>20</strong>09</str<strong>on</strong>g> .................................................................................... <strong>20</strong>1<br />
Item 16F: Change in Registrant’s Certifying Accountant ..................................................................... <strong>20</strong>1<br />
Item 16G: Corporate Governance ......................................................................................................... <strong>20</strong>2<br />
PART III .................................................................................................................................................. <strong>20</strong>6<br />
Item 17: Financial Statements ............................................................................................................... <strong>20</strong>6<br />
Item 18: Financial Statements ............................................................................................................... <strong>20</strong>6<br />
Item 19: Exhibits .................................................................................................................................... <strong>20</strong>7<br />
Signatures ............................................................................................................................................. <strong>20</strong>8<br />
Financial Statements .............................................................................................................................. F-2<br />
Supplemental Financial Informati<strong>on</strong> ...................................................................................................... S-1<br />
iii
<strong>Deutsche</strong> <strong>Bank</strong> Aktiengesellschaft, which we also call <strong>Deutsche</strong> <strong>Bank</strong> AG, is a stock corporati<strong>on</strong> organized<br />
under the laws of the Federal Republic of Germany. Unless otherwise specified or required by the c<strong>on</strong>text,<br />
in this document, references to “we”, “us”, and “our” are to <strong>Deutsche</strong> <strong>Bank</strong> Aktiengesellschaft and its c<strong>on</strong>solidated<br />
subsidiaries.<br />
Due to rounding, numbers presented throughout this document may not add up precisely to the totals we<br />
provide and percentages may not precisely reflect the absolute figures.<br />
Our registered address is Theodor-Heuss-Allee 70, 60486 Frankfurt am Main, Germany, and our teleph<strong>on</strong>e<br />
number is +49-69-910-00.<br />
Cauti<strong>on</strong>ary Statement Regarding Forward-Looking Statements<br />
We make certain forward-looking statements in this document with respect to our financial c<strong>on</strong>diti<strong>on</strong> and results<br />
of operati<strong>on</strong>s. In this document, forward-looking statements include, am<strong>on</strong>g others, statements relating to:<br />
— the potential development, severity, durati<strong>on</strong> and impact <strong>on</strong> us of the current ec<strong>on</strong>omic and business c<strong>on</strong>diti<strong>on</strong>s;<br />
— the implementati<strong>on</strong> of our strategic initiatives and other resp<strong>on</strong>ses to the ec<strong>on</strong>omic and business c<strong>on</strong>diti<strong>on</strong>s;<br />
— the development of aspects of our results of operati<strong>on</strong>s;<br />
— our expectati<strong>on</strong>s of the impact of risks that affect our business, including the risks of c<strong>on</strong>tinuing losses <strong>on</strong><br />
our trading processes and credit exposures; and<br />
— other statements relating to our future business development and ec<strong>on</strong>omic performance.<br />
In additi<strong>on</strong>, we may from time to time make forward-looking statements in our periodic reports to the United<br />
States Securities and Exchange Commissi<strong>on</strong> <strong>on</strong> <strong>Form</strong> 6-K, annual and interim reports, invitati<strong>on</strong>s to <str<strong>on</strong>g>Annual</str<strong>on</strong>g><br />
General Meetings and other informati<strong>on</strong> sent to shareholders, offering circulars and prospectuses, press<br />
releases and other written materials. Our Management Board, Supervisory Board, officers and employees<br />
may also make oral forward-looking statements to third parties, including financial analysts.<br />
Forward-looking statements are statements that are not historical facts, including statements about our<br />
beliefs and expectati<strong>on</strong>s. We use words such as “believe”, “anticipate”, “expect”, “intend”, “seek”, “estimate”,<br />
“project”, “should”, “potential”, “reas<strong>on</strong>ably possible”, “plan”, “aim” and similar expressi<strong>on</strong>s to identify forwardlooking<br />
statements.<br />
By their very nature, forward-looking statements involve risks and uncertainties, both general and specific.<br />
We base these statements <strong>on</strong> our current plans, estimates, projecti<strong>on</strong>s and expectati<strong>on</strong>s. You should there-<br />
fore not place too much reliance <strong>on</strong> them. Our forward-looking statements speak <strong>on</strong>ly as of the date we make<br />
them, and we undertake no obligati<strong>on</strong> to update any of them in light of new informati<strong>on</strong> or future events.<br />
iv
We cauti<strong>on</strong> you that a number of important factors could cause our actual results to differ materially from<br />
those we describe in any forward-looking statement. These factors include, am<strong>on</strong>g others, the following:<br />
— the potential development, severity and durati<strong>on</strong> of the current ec<strong>on</strong>omic and business c<strong>on</strong>diti<strong>on</strong>s;<br />
— other changes in general ec<strong>on</strong>omic and business c<strong>on</strong>diti<strong>on</strong>s;<br />
— changes and volatility in currency exchange rates, interest rates and asset prices;<br />
— changes in governmental policy and regulati<strong>on</strong>, including measures taken in resp<strong>on</strong>se to current<br />
ec<strong>on</strong>omic, business, political and social c<strong>on</strong>diti<strong>on</strong>s;<br />
— changes in our competitive envir<strong>on</strong>ment;<br />
— the success of our acquisiti<strong>on</strong>s, divestitures, mergers and strategic alliances;<br />
— our success in implementing our strategic initiatives and other resp<strong>on</strong>ses to the current ec<strong>on</strong>omic and<br />
business c<strong>on</strong>diti<strong>on</strong>s and realizing the benefits anticipated therefrom; and<br />
— other factors, including those we refer to in “Item 3: Key Informati<strong>on</strong> – Risk Factors” and elsewhere in this<br />
document and others to which we do not refer.<br />
Use of N<strong>on</strong>-GAAP Financial Measures<br />
This document and other documents we have published or may publish c<strong>on</strong>tain n<strong>on</strong>-GAAP financial measures.<br />
N<strong>on</strong>-GAAP financial measures are measures of our historical or future performance, financial positi<strong>on</strong><br />
or cash flows that c<strong>on</strong>tain adjustments that exclude or include amounts that are included or excluded, as the<br />
case may be, from the most directly comparable measure calculated and presented in accordance with IFRS<br />
in our financial statements. We refer to the definiti<strong>on</strong>s of certain adjustments as “target definiti<strong>on</strong>s” because<br />
we have in the past used and may in the future use the n<strong>on</strong>-GAAP financial measures based <strong>on</strong> them to<br />
measure our financial targets. Examples of our n<strong>on</strong>-GAAP financial measures, and the most directly comparable<br />
IFRS financial measures, are as follows:<br />
N<strong>on</strong>-GAAP Financial Measure Most Directly Comparable IFRS Financial Measure<br />
IBIT attributable to <strong>Deutsche</strong> <strong>Bank</strong> shareholders (target definiti<strong>on</strong>) Income (loss) before income taxes<br />
Average active equity Average shareholders’ equity<br />
Pre-tax return <strong>on</strong> average active equity Pre-tax return <strong>on</strong> average shareholders’ equity<br />
Pre-tax return <strong>on</strong> average active equity (target definiti<strong>on</strong>) Pre-tax return <strong>on</strong> average shareholders’ equity<br />
Net income (loss) attributable to <strong>Deutsche</strong> <strong>Bank</strong> shareholders<br />
(basis for target definiti<strong>on</strong> EPS)<br />
Net income (loss) attributable to <strong>Deutsche</strong> <strong>Bank</strong> shareholders<br />
Total assets adjusted (pro forma US GAAP) Total assets<br />
Total equity adjusted Total equity<br />
Leverage ratio (target definiti<strong>on</strong>) (total equity adjusted to<br />
total assets adjusted)<br />
Leverage ratio (total equity to total assets)<br />
Diluted earnings per share (target definiti<strong>on</strong>) Diluted earnings per share<br />
For descripti<strong>on</strong>s of these n<strong>on</strong>-GAAP financial measures and the adjustments made to the most directly comparable<br />
IFRS financial measures to obtain them, please refer to pages S-17 through S-19 of the supplemental<br />
financial informati<strong>on</strong>, which are incorporated by reference herein, and the following paragraphs.<br />
v
Our target definiti<strong>on</strong> of IBIT attributable to <strong>Deutsche</strong> <strong>Bank</strong> shareholders excludes significant gains (such as<br />
gains from the sale of industrial holdings, businesses or premises) and charges (such as charges from<br />
restructuring, goodwill impairment or litigati<strong>on</strong>) if we believe they are not indicative of the future performance<br />
of our core businesses.<br />
When used with respect to future periods, our n<strong>on</strong>-GAAP financial measures are also forward-looking state-<br />
ments. We cannot predict or quantify the levels of the most directly comparable IFRS financial measures<br />
(listed in the table above) that would corresp<strong>on</strong>d to these n<strong>on</strong>-GAAP financial measures for future periods.<br />
This is because neither the magnitude of such IFRS financial measures, nor the magnitude of the adjust-<br />
ments to be used to calculate the related n<strong>on</strong>-GAAP financial measures from such IFRS financial measures,<br />
can be predicted. Such adjustments, if any, will relate to specific, currently unknown, events and in most<br />
cases can be positive or negative, so that it is not possible to predict whether, for a future period, the n<strong>on</strong>-<br />
GAAP financial measure will be greater than or less than the related IFRS financial measure.<br />
Use of Internet Addresses<br />
This document c<strong>on</strong>tains inactive textual addresses of Internet websites operated by us and third parties.<br />
Reference to such websites is made for informati<strong>on</strong>al purposes <strong>on</strong>ly, and informati<strong>on</strong> found at such websites<br />
is not incorporated by reference into this document.<br />
vi
(This page intenti<strong>on</strong>ally left blank)
PART I<br />
Item 1: Identity of Directors, Senior Management<br />
and Advisers<br />
Not required because this document is filed as an annual report.<br />
Item 2: Offer Statistics and Expected Timetable<br />
Not required because this document is filed as an annual report.<br />
Item 3: Key Informati<strong>on</strong><br />
Selected Financial Data<br />
We have derived the data we present in the tables below from our audited c<strong>on</strong>solidated financial statements<br />
for the years presented. You should read all of the data in the tables below together with the c<strong>on</strong>solidated<br />
financial statements and notes included in “Item 18: Financial Statements” and the informati<strong>on</strong> we provide in<br />
“Item 5: Operating and Financial Review and Prospects.” Except where we have indicated otherwise, we have<br />
prepared all of the c<strong>on</strong>solidated financial informati<strong>on</strong> in this document in accordance with Internati<strong>on</strong>al Financial<br />
<str<strong>on</strong>g>Report</str<strong>on</strong>g>ing Standards (“IFRS“) as issued by the Internati<strong>on</strong>al Accounting Standards Board (“IASB”) and as<br />
endorsed by the European Uni<strong>on</strong> (“EU”). Until December 31, <strong>20</strong>06, we prepared our c<strong>on</strong>solidated financial<br />
informati<strong>on</strong> in accordance with generally accepted accounting principles in the United States (“U.S. GAAP”).<br />
All <strong>20</strong>06 data included in this report, however, have been prepared in accordance with IFRS as issued by the<br />
IASB. Our group divisi<strong>on</strong> and segment data come from our management reporting systems and are not in all<br />
cases prepared in accordance with IFRS. For a discussi<strong>on</strong> of the major differences between our management<br />
reporting systems and our c<strong>on</strong>solidated financial statements under IFRS, see “Item 5: Operating and Financial<br />
Review and Prospects – Results of Operati<strong>on</strong>s by Segment (<str<strong>on</strong>g><strong>20</strong>09</str<strong>on</strong>g> vs. <strong>20</strong>08).”<br />
1
<strong>20</strong>-F Item 3: Key Informati<strong>on</strong><br />
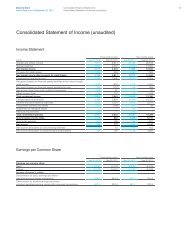
Income Statement Data<br />
<str<strong>on</strong>g><strong>20</strong>09</str<strong>on</strong>g> 1 <str<strong>on</strong>g><strong>20</strong>09</str<strong>on</strong>g> <strong>20</strong>08 <strong>20</strong>07 <strong>20</strong>06<br />
in U.S.$ m. in € m. in € m. in € m. in € m.<br />
Net interest income 17,948 12,459 12,453 8,849 7,008<br />
Provisi<strong>on</strong> for credit losses 3,789 2,630 1,076 612 298<br />
Net interest income after provisi<strong>on</strong> for credit losses 14,160 9,829 11,377 8,237 6,710<br />
Commissi<strong>on</strong>s and fee income<br />
Net gains (losses) <strong>on</strong> financial assets/liabilities at fair value through<br />
12,837 8,911 9,741 12,282 11,192<br />
profit or loss 10,241 7,109 (9,992) 7,175 8,892<br />
Other n<strong>on</strong>interest income (759) (527) 1,411 2,523 1,476<br />
Total net revenues 40,268 27,952 13,613 30,829 28,568<br />
Compensati<strong>on</strong> and benefits 16,293 11,310 9,606 13,122 12,498<br />
General and administrative expenses 12,104 8,402 8,339 8,038 7,143<br />
Policyholder benefits and claims 781 542 (252) 193 67<br />
Impairment of intangible assets (193) (134) 585 128 31<br />
Restructuring activities – – – (13) 192<br />
Total n<strong>on</strong>interest expenses 28,985 <strong>20</strong>,1<strong>20</strong> 18,278 21,468 19,931<br />
Income (loss) before income taxes 7,494 5,<strong>20</strong>2 (5,741) 8,749 8,339<br />
Income tax expense (benefit) 352 244 (1,845) 2,239 2,260<br />
Net income (loss) 7,142 4,958 (3,896) 6,510 6,079<br />
Net income (loss) attributable to minority interest (22) (15) (61) 36 9<br />
Net income (loss) attributable to <strong>Deutsche</strong> <strong>Bank</strong> shareholders 7,164 4,973 (3,835) 6,474 6,070<br />
in U.S.$ in € in € in € in €<br />
Basic earnings per share2 11.41 7.92 (7.61) 13.65 12.96<br />
Diluted earnings per share3 10.93 7.59 (7.61) 13.05 11.48<br />
Dividends paid per share4 0.72 0.50 4.50 4.00 2.50<br />
1 Amounts in this column are unaudited. We have translated the amounts solely for your c<strong>on</strong>venience at a rate of U.S.$ 1.4406 per €, the no<strong>on</strong> buying rate<br />
<strong>on</strong> December 31, <str<strong>on</strong>g><strong>20</strong>09</str<strong>on</strong>g>.<br />
2 We calculate basic earnings per share for each period by dividing our net income (loss) by the weighted-average number of comm<strong>on</strong> shares outstanding.<br />
3 We calculate diluted earnings per share for each period by dividing our net income (loss) by the weighted-average number of comm<strong>on</strong> shares outstanding<br />
after assumed c<strong>on</strong>versi<strong>on</strong>s.<br />
4 Dividends we declared and paid in the year.<br />
Balance Sheet Data<br />
<str<strong>on</strong>g><strong>20</strong>09</str<strong>on</strong>g> 1 <str<strong>on</strong>g><strong>20</strong>09</str<strong>on</strong>g> <strong>20</strong>08 <strong>20</strong>07 <strong>20</strong>06<br />
in U.S.$ m. in € m. in € m. in € m. in € m.<br />
Total assets 2,161,857 1,500,664 2,<strong>20</strong>2,423 1,925,003 1,5<strong>20</strong>,580<br />
Loans 371,826 258,105 269,281 198,892 178,524<br />
Deposits 495,883 344,2<strong>20</strong> 395,553 457,946 411,916<br />
L<strong>on</strong>g-term debt 189,845 131,782 133,856 126,703 111,363<br />
Comm<strong>on</strong> shares 2,289 1,589 1,461 1,358 1,343<br />
Total shareholders’ equity 52,794 36,647 30,703 37,893 33,169<br />
Tier 1 capital 49,565 34,406 31,094 28,3<strong>20</strong> 23,539<br />
Regulatory capital 54,641 37,929 37,396 38,049 34,309<br />
1 Amounts in this column are unaudited. We have translated the amounts solely for your c<strong>on</strong>venience at a rate of U.S.$ 1.4406 per €, the no<strong>on</strong> buying rate<br />
<strong>on</strong> December 31, <str<strong>on</strong>g><strong>20</strong>09</str<strong>on</strong>g>.<br />
2
Certain Key Ratios and Figures<br />
<str<strong>on</strong>g><strong>20</strong>09</str<strong>on</strong>g> <strong>20</strong>08 <strong>20</strong>07<br />
Share price at period-end € 49.42 € 27.83 € 89.40<br />
Share price high € 58.29 € 89.80 € 118.51<br />
Share price low € 15.38 € 18.59 € 81.33<br />
Book value per basic share outstanding1 € 57.81 € 52.59 € 79.32<br />
Return <strong>on</strong> average shareholders’ equity (post-tax)2 14.6 % (11.1)% 17.9 %<br />
Pre-tax return <strong>on</strong> average shareholders’ equity3 15.3 % (16.5)% 24.1 %<br />
Pre-tax return <strong>on</strong> average active equity4 15.1 % (17.7)% 29.0 %<br />
Cost/income ratio5 72.0 % 134.3 % 69.6 %<br />
Compensati<strong>on</strong> ratio6 40.5 % 70.6 % 42.6 %<br />
N<strong>on</strong>compensati<strong>on</strong> ratio7 Employees at period-end (full-time equivalent):<br />
31.5 % 63.7 % 27.1 %<br />
In Germany 27,321 27,942 27,779<br />
Outside Germany<br />
Branches at period-end:<br />
49,732 52,514 50,512<br />
In Germany 961 961 976<br />
Outside Germany 1,003 989 887<br />
1 Shareholders’ equity divided by the number of basic shares outstanding (both at period-end).<br />
2 Net income (loss) attributable to our shareholders as a percentage of average shareholders’ equity.<br />
3 Income (loss) before income taxes attributable to our shareholders as a percentage of average shareholders’ equity.<br />
4 Income (loss) before income taxes attributable to our shareholders as a percentage of average active equity.<br />
5 Total n<strong>on</strong>interest expenses as a percentage of net interest income before provisi<strong>on</strong> for credit losses, plus n<strong>on</strong>interest income.<br />
6 Compensati<strong>on</strong> and benefits as a percentage of total net interest income before provisi<strong>on</strong> for credit losses, plus n<strong>on</strong>interest income.<br />
7 N<strong>on</strong>compensati<strong>on</strong> n<strong>on</strong>interest expenses, which is defined as total n<strong>on</strong>interest expenses less compensati<strong>on</strong> and benefits, as a percentage of total net<br />
interest income before provisi<strong>on</strong> for credit losses, plus n<strong>on</strong>interest income.<br />
Dividends<br />
The following table shows the dividend per share in euro and in U.S. dollars for the years ended December<br />
31, <str<strong>on</strong>g><strong>20</strong>09</str<strong>on</strong>g>, <strong>20</strong>08 and <strong>20</strong>07. We declare our dividends at our <str<strong>on</strong>g>Annual</str<strong>on</strong>g> General Meeting following each year.<br />
Our dividends are based <strong>on</strong> the n<strong>on</strong>-c<strong>on</strong>solidated results of <strong>Deutsche</strong> <strong>Bank</strong> AG as prepared in accordance<br />
with German accounting principles. Because we declare our dividends in euro, the amount an investor actually<br />
receives in any other currency depends <strong>on</strong> the exchange rate between euro and that currency at the time<br />
the euros are c<strong>on</strong>verted into that currency.<br />
Effective January 1, <str<strong>on</strong>g><strong>20</strong>09</str<strong>on</strong>g>, the German withholding tax applicable to dividends increased to 26.375 % (c<strong>on</strong>sist-<br />
ing of a 25 % withholding tax and an effective 1.375 % surcharge) compared to 21.1 % applicable for the<br />
years <strong>20</strong>08 and <strong>20</strong>07. For individual German tax residents, the withholding tax represents, generally, the full<br />
and final income tax applicable to the dividends. Dividend recipients who are tax residents of countries that<br />
have entered into a c<strong>on</strong>venti<strong>on</strong> for avoiding double taxati<strong>on</strong> may be eligible to receive a refund from the German<br />
tax authorities of a porti<strong>on</strong> of the amount withheld and in additi<strong>on</strong> may be entitled to receive a tax credit<br />
for the German withholding tax not refunded in accordance with their local tax law.<br />
U.S. residents will be entitled to receive a refund equal to 11.375 % of the dividends received after Janu-<br />
ary 1, <str<strong>on</strong>g><strong>20</strong>09</str<strong>on</strong>g> (compared to an entitlement to a refund of 6.1 % of the dividends received in the years <strong>20</strong>07 and<br />
<strong>20</strong>08). For U.S. federal income tax purposes, the dividends we pay are not eligible for the dividends received<br />
deducti<strong>on</strong> generally allowed for dividends received by U.S. corporati<strong>on</strong>s from other U.S. corporati<strong>on</strong>s.<br />
3
<strong>20</strong>-F Item 3: Key Informati<strong>on</strong><br />
Dividends in the table below are presented before German withholding tax.<br />
See “Item 10: Additi<strong>on</strong>al Informati<strong>on</strong> – Taxati<strong>on</strong>” for more informati<strong>on</strong> <strong>on</strong> the tax treatment of our dividends.<br />
N/M – Not meaningful<br />
1 For your c<strong>on</strong>venience, we present dividends in U.S. dollars for each year by translating the euro amounts at the no<strong>on</strong> buying rate described below under<br />
”Exchange Rate and Currency Informati<strong>on</strong>” <strong>on</strong> the last business day of that year.<br />
2 We define our payout ratio as the dividends we paid per share in respect of each year as a percentage of our basic and diluted earnings per share for<br />
that year. For <strong>20</strong>08, the payout ratio was not calculated due to the net loss.<br />
Exchange Rate and Currency Informati<strong>on</strong><br />
Germany’s currency is the euro. For your c<strong>on</strong>venience, we have translated some amounts denominated in<br />
euro appearing in this document into U.S. dollars. Unless otherwise stated, we have made these translati<strong>on</strong>s<br />
at U.S.$ 1.4406 per euro, the no<strong>on</strong> buying rate for euros <strong>on</strong> December 31, <str<strong>on</strong>g><strong>20</strong>09</str<strong>on</strong>g>. The “no<strong>on</strong> buying rate” is the<br />
rate the Federal Reserve <strong>Bank</strong> of New York announces for customs purposes as the buying rate for foreign<br />
currencies in the City of New York <strong>on</strong> a particular date. You should not c<strong>on</strong>strue any translati<strong>on</strong>s as a representati<strong>on</strong><br />
that the amounts could have been exchanged at the rate used <strong>on</strong> December 31, <str<strong>on</strong>g><strong>20</strong>09</str<strong>on</strong>g> or any other<br />
date.<br />
The no<strong>on</strong> buying rate for euros <strong>on</strong> December 31, <str<strong>on</strong>g><strong>20</strong>09</str<strong>on</strong>g> may differ from the actual rates we used in the prepa-<br />
rati<strong>on</strong> of the financial informati<strong>on</strong> in this document. Accordingly, U.S. dollar amounts appearing in this document<br />
may differ from the actual U.S. dollar amounts that we originally translated into euros in the preparati<strong>on</strong><br />
of our financial statements.<br />
Fluctuati<strong>on</strong>s in the exchange rate between the euro and the U.S. dollar will affect the U.S. dollar equivalent of<br />
the euro price of our shares quoted <strong>on</strong> the German stock exchanges and, as a result, are likely to affect the<br />
market price of our shares <strong>on</strong> the New York Stock Exchange. These fluctuati<strong>on</strong>s will also affect the U.S. dollar<br />
value of cash dividends we may pay <strong>on</strong> our shares in euros. Past fluctuati<strong>on</strong>s in foreign exchange rates may<br />
not be predictive of future fluctuati<strong>on</strong>s.<br />
4<br />
Dividends<br />
per share 1<br />
Dividends<br />
per share<br />
Basic<br />
earnings<br />
per share<br />
Payout ratio 2<br />
Diluted<br />
earnings<br />
per share<br />
<str<strong>on</strong>g><strong>20</strong>09</str<strong>on</strong>g> (proposed) $ 1.08 € 0.75 9 % 10 %<br />
<strong>20</strong>08 $ 0.70 € 0.50 N/M N/M<br />
<strong>20</strong>07 $ 6.57 € 4.50 33 % 34 %
The following table shows the period-end, average, high and low no<strong>on</strong> buying rates for the euro. In each<br />
case, the period-end rate is the no<strong>on</strong> buying rate announced <strong>on</strong> the last business day of the period.<br />
in U.S.$ per € Period-end Average 1 <strong>20</strong>10<br />
High Low<br />
March (through March 9) 1.3557 – 1.3668 1.3525<br />
February 1.3570 – 1.3984 1.3489<br />
January<br />
<str<strong>on</strong>g><strong>20</strong>09</str<strong>on</strong>g><br />
1.3966 – 1.4563 1.3966<br />
December 1.4406 – 1.51<strong>20</strong> 1.4276<br />
November 1.5023 – 1.5083 1.4658<br />
October 1.4800 – 1.50<strong>20</strong> 1.4537<br />
September 1.4643 – 1.4783 1.42<strong>20</strong><br />
<str<strong>on</strong>g><strong>20</strong>09</str<strong>on</strong>g> 1.4406 1.3963 1.51<strong>20</strong> 1.2555<br />
<strong>20</strong>08 1.3919 1.4695 1.6010 1.2446<br />
<strong>20</strong>07 1.4603 1.3797 1.4862 1.2904<br />
<strong>20</strong>06 1.3197 1.2661 1.3327 1.1860<br />
<strong>20</strong>05 1.1842 1.2400 1.3476 1.1667<br />
1 We calculated the average rates for each year using the average of the no<strong>on</strong> buying rates <strong>on</strong> the last business day of each m<strong>on</strong>th during the year. We<br />
did not calculate average exchange rates within m<strong>on</strong>ths.<br />
On March 9, <strong>20</strong>10, the no<strong>on</strong> buying rate was U.S.$ 1.3557 per euro.<br />
L<strong>on</strong>g-term Credit Ratings<br />
We believe that maintaining a str<strong>on</strong>g credit quality is a key part of the value we offer to our clients, b<strong>on</strong>dholders<br />
and shareholders. Below are our l<strong>on</strong>g-term credit ratings, which were not changed in <str<strong>on</strong>g><strong>20</strong>09</str<strong>on</strong>g>. On January<br />
16, <str<strong>on</strong>g><strong>20</strong>09</str<strong>on</strong>g>, Fitch Ratings placed our l<strong>on</strong>g-term credit rating <strong>on</strong> rating watch negative, citing c<strong>on</strong>cern over<br />
our underlying profitability in a depressed market envir<strong>on</strong>ment. The rating watch negative was removed <strong>on</strong><br />
July 29, <str<strong>on</strong>g><strong>20</strong>09</str<strong>on</strong>g> and the AA– rating was c<strong>on</strong>firmed with a negative outlook attached to it as Fitch Ratings<br />
expected the global operating envir<strong>on</strong>ment for banks to remain difficult well into <strong>20</strong>10. On March 4, <strong>20</strong>10,<br />
Moody’s Investors Service lowered our l<strong>on</strong>g-term rating from Aa1 to Aa3 (with outlook stable), citing our<br />
substantial reliance <strong>on</strong> capital market activities and the ensuing risk management challenges, the perceived<br />
delay in the acquisiti<strong>on</strong> of a majority holding in <strong>Deutsche</strong> Postbank AG and volatility of our n<strong>on</strong>-investment<br />
banking businesses.<br />
Dec 31, <str<strong>on</strong>g><strong>20</strong>09</str<strong>on</strong>g> Dec 31, <strong>20</strong>08 Dec 31, <strong>20</strong>07<br />
Moody’s Investors Service, New York1 Aa1 Aa1 Aa1<br />
Standard & Poor’s, New York2 A+ A+ AA<br />
Fitch Ratings, New York 3 AA– AA– AA–<br />
1 Moody’s defines the Aa1 rating as denoting b<strong>on</strong>ds that are judged to be high quality by all standards. Moody’s rates Aa b<strong>on</strong>ds lower than the best b<strong>on</strong>ds<br />
(which it rates Aaa) because margins of protecti<strong>on</strong> may not be as large as in Aaa securities or fluctuati<strong>on</strong> of protective elements may be of greater amplitude<br />
or there may be other elements present which make the l<strong>on</strong>g-term risk appear somewhat greater than Aaa securities. The numerical modifier 1 indicates<br />
that Moody’s ranks the obligati<strong>on</strong> in the upper end of the Aa category.<br />
2 Standard and Poor’s defines its A rating as somewhat more susceptible to the adverse effects of changes in circumstances and ec<strong>on</strong>omic c<strong>on</strong>diti<strong>on</strong>s<br />
than obligati<strong>on</strong>s in higher-rated categories. However, the obligor’s capacity to meet its financial commitment <strong>on</strong> the obligati<strong>on</strong> is still str<strong>on</strong>g.<br />
3 Fitch Ratings defines its AA rating as very high credit quality. Fitch Ratings uses the AA rating to denote a very low expectati<strong>on</strong> of credit risk. According<br />
to Fitch Ratings, AA-ratings indicate very str<strong>on</strong>g capacity for timely payment of financial commitments. This capacity is not significantly vulnerable to<br />
foreseeable events. Category AA is Fitch Ratings sec<strong>on</strong>d-highest rating category; the minus indicates a ranking in the lower end of the AA category.<br />
Other than the downgrade by Moody’s Investors Service menti<strong>on</strong>ed above, as of the date of this document,<br />
there has been no change in any of the above ratings.<br />
5
<strong>20</strong>-F Item 3: Key Informati<strong>on</strong><br />
Each rating reflects the view of the rating agency <strong>on</strong>ly at the time it gave us the rating, and you should<br />
evaluate each rating separately and look to the rating agencies for any explanati<strong>on</strong>s of the significance of<br />
their ratings. The rating agencies can change their ratings at any time if they believe that circumstances so<br />
warrant. You should not view these l<strong>on</strong>g-term credit ratings as recommendati<strong>on</strong>s to buy, hold or sell our<br />
securities.<br />
Capitalizati<strong>on</strong> and Indebtedness<br />
The following table sets forth our c<strong>on</strong>solidated capitalizati<strong>on</strong> in accordance with IFRS as of December<br />
31, <str<strong>on</strong>g><strong>20</strong>09</str<strong>on</strong>g>:<br />
in € m.<br />
Debt1,2 :<br />
L<strong>on</strong>g-term debt 131,782<br />
Trust preferred securities 10,577<br />
L<strong>on</strong>g-term debt at fair value through profit or loss 15,395<br />
Total debt 157,754<br />
Shareholders’ equity:<br />
Comm<strong>on</strong> shares (no par value) 1,589<br />
Additi<strong>on</strong>al paid-in capital 14,830<br />
Retained earnings 24,056<br />
Comm<strong>on</strong> shares in treasury, at cost<br />
Net gains (losses) not recognized in the income statement, net of tax<br />
(48)<br />
Unrealized net (losses) <strong>on</strong> financial assets available for sale, net of applicable tax and other (186)<br />
Unrealized net (losses) <strong>on</strong> derivatives hedging variability of cash flows, net of tax (134)<br />
Foreign currency translati<strong>on</strong>, net of tax (3,521)<br />
Unrealized net gains from equity method investments 61<br />
Total shareholders’ equity 36,647<br />
Minority interest 1,322<br />
Total equity 37,969<br />
Total capitalizati<strong>on</strong> 195,723<br />
1 No third party has guaranteed any of our debt.<br />
2 € 8,439 milli<strong>on</strong> (5 %) of our debt was secured as of December 31, <str<strong>on</strong>g><strong>20</strong>09</str<strong>on</strong>g>.<br />
Reas<strong>on</strong>s for the Offer and Use of Proceeds<br />
Not required because this document is filed as an annual report.<br />
6
Risk Factors<br />
An investment in our securities involves a number of risks. You should carefully c<strong>on</strong>sider the following<br />
informati<strong>on</strong> about the risks we face, together with the other informati<strong>on</strong> in this document, when you make<br />
investment decisi<strong>on</strong>s involving our securities. If <strong>on</strong>e or more of these risks were to materialize, it could have a<br />
material adverse effect <strong>on</strong> our financial c<strong>on</strong>diti<strong>on</strong>, results of operati<strong>on</strong>s, cash flows or prices of our securities.<br />
We have been and expect to c<strong>on</strong>tinue to be affected by the current global financial crisis<br />
and ec<strong>on</strong>omic downturn.<br />
As a global investment bank with a large private client franchise, our businesses are materially affected by<br />
c<strong>on</strong>diti<strong>on</strong>s in the global financial markets and ec<strong>on</strong>omic c<strong>on</strong>diti<strong>on</strong>s generally. Since the sec<strong>on</strong>d half of <strong>20</strong>07,<br />
and particularly since September <strong>20</strong>08, the financial services industry, including ourselves, and the global<br />
financial markets have been materially and adversely affected by significant declines in the values of nearly<br />
all classes of financial assets. The financial markets experienced unprecedented levels of volatility (rapid<br />
changes in price directi<strong>on</strong>) and the breakdown of historically observed correlati<strong>on</strong>s (the extent to which prices<br />
move in tandem) across asset classes, compounded by extremely limited liquidity. This has materially and<br />
adversely affected the availability and performance of instruments used to hedge positi<strong>on</strong>s and manage risk.<br />
Furthermore, there has been a widespread loss of investor c<strong>on</strong>fidence, both in our industry and the broader<br />
markets.<br />
Market c<strong>on</strong>diti<strong>on</strong>s have also led to the failure or merger under distressed c<strong>on</strong>diti<strong>on</strong>s of a number of prominent<br />
financial instituti<strong>on</strong>s. Furthermore, declining asset values, defaults <strong>on</strong> mortgages and c<strong>on</strong>sumer loans, and<br />
the lack of market and investor c<strong>on</strong>fidence, as well as other factors, have all combined to increase credit<br />
spreads, to cause ratings agencies to lower credit ratings and otherwise to increase the cost and decrease<br />
the availability of credit, despite very significant declines in central bank borrowing rates and other government<br />
acti<strong>on</strong>s.<br />
As of the start of <str<strong>on</strong>g><strong>20</strong>09</str<strong>on</strong>g>, Europe, the United States and other important ec<strong>on</strong>omies were c<strong>on</strong>tracting, with business<br />
activities across a wide range of industries and regi<strong>on</strong>s greatly reduced and unemployment increasing<br />
significantly. While financial market and ec<strong>on</strong>omic c<strong>on</strong>diti<strong>on</strong>s improved over the course of <str<strong>on</strong>g><strong>20</strong>09</str<strong>on</strong>g>, asset values,<br />
credit spreads and liquidity have not returned to pre-crisis levels, and c<strong>on</strong>diti<strong>on</strong>s in the wider ec<strong>on</strong>omy remain<br />
challenging. Although the ec<strong>on</strong>omies of many developed countries returned to positive growth in the sec<strong>on</strong>d<br />
half of <str<strong>on</strong>g><strong>20</strong>09</str<strong>on</strong>g>, the pace of recovery has remained relatively subdued. Ec<strong>on</strong>omic headwinds persisted with unemployment<br />
increasing, weighing <strong>on</strong> household credit quality, and corporate defaults have been rising. The<br />
improvements in c<strong>on</strong>fidence and liquidity in financial markets and in ec<strong>on</strong>omic c<strong>on</strong>diti<strong>on</strong>s generally that have<br />
been seen since <str<strong>on</strong>g><strong>20</strong>09</str<strong>on</strong>g> have been reliant in large part up<strong>on</strong> public sector stimulus measures, which will not be<br />
available indefinitely. Towards the end of <str<strong>on</strong>g><strong>20</strong>09</str<strong>on</strong>g>, large fiscal deficits and sharply rising public debt, mainly a<br />
reflecti<strong>on</strong> of the deep ec<strong>on</strong>omic recessi<strong>on</strong> and the cost of financial sector support measures, led to growing<br />
c<strong>on</strong>cerns in financial markets over sovereign risk. These or other factors could render the improvements that<br />
have occurred fragile.<br />
7
<strong>20</strong>-F Item 3: Key Informati<strong>on</strong><br />
These adverse financial market and ec<strong>on</strong>omic c<strong>on</strong>diti<strong>on</strong>s have negatively impacted many of our businesses,<br />
particularly in <strong>20</strong>08, with some effects persisting into <str<strong>on</strong>g><strong>20</strong>09</str<strong>on</strong>g>. If such c<strong>on</strong>diti<strong>on</strong>s do not c<strong>on</strong>tinue to improve, or if<br />
they worsen, our results of operati<strong>on</strong>s may be materially and adversely affected. In particular, these c<strong>on</strong>diti<strong>on</strong>s<br />
required us to write down the carrying values of some of our portfolios of assets, including leveraged<br />
loans and loan commitments. Furthermore, we incurred sizeable losses in our equity derivatives trading and<br />
equity and credit proprietary trading businesses in <strong>20</strong>08. Despite initiatives to reduce our exposure to the<br />
affected asset classes or activities, such reducti<strong>on</strong> has not always been possible due to illiquid trading markets<br />
for many assets. As a result, we have substantial remaining exposures and thus c<strong>on</strong>tinue to be exposed<br />
to further deteriorati<strong>on</strong> in prices for the remaining positi<strong>on</strong>s. These write-downs and losses led us to incur a<br />
loss in <strong>20</strong>08, as performance in our other businesses was not sufficient to offset them. In additi<strong>on</strong>, while we<br />
were profitable in <str<strong>on</strong>g><strong>20</strong>09</str<strong>on</strong>g>, write-downs and losses in <str<strong>on</strong>g><strong>20</strong>09</str<strong>on</strong>g>, including large losses <strong>on</strong> our Leveraged Finance<br />
portfolio and <strong>on</strong> our exposures to m<strong>on</strong>olines, materially and negatively affected our results. Our inability to<br />
offset the potential negative effects <strong>on</strong> our profitability through performance in our other businesses may c<strong>on</strong>tinue<br />
in the future.<br />
See “Item 5: Operating and Financial Review and Prospects – Results of Operati<strong>on</strong>s by Segment (<str<strong>on</strong>g><strong>20</strong>09</str<strong>on</strong>g> vs.<br />
<strong>20</strong>08) – Corporate <strong>Bank</strong>ing & Securities Corporate Divisi<strong>on</strong>” for informati<strong>on</strong> <strong>on</strong> the impact of the current financial<br />
market envir<strong>on</strong>ment <strong>on</strong> a number of our key businesses.<br />
Market declines and volatility can materially adversely affect our revenues and profits.<br />
As a global investment bank, we have significant exposure to the financial markets and are more at risk from<br />
the adverse developments in the financial markets than instituti<strong>on</strong>s engaged predominantly in traditi<strong>on</strong>al<br />
banking activities. Market declines have caused and can c<strong>on</strong>tinue to cause our revenues to decline, and,<br />
if we are unable to reduce our expenses at the same pace, can cause our profitability to erode or cause us to<br />
show material losses, as we did in <strong>20</strong>08. Volatility can also adversely affect us, by causing the value of financial<br />
assets we hold to decline or the expense of hedging our risks to rise.<br />
We have incurred and may c<strong>on</strong>tinue to incur significant losses from our trading<br />
and investment activities due to market fluctuati<strong>on</strong>s.<br />
We enter into and maintain large trading and investment positi<strong>on</strong>s in the fixed income, equity and currency<br />
markets, primarily through our Corporate <strong>Bank</strong>ing & Securities Corporate Divisi<strong>on</strong>. We also from time to time<br />
make significant investments in individual companies, primarily through our Corporate Investments and Corporate<br />
Investment <strong>Bank</strong> Group Divisi<strong>on</strong>s. We also maintain smaller trading and investment positi<strong>on</strong>s in other<br />
assets. Many of these trading positi<strong>on</strong>s include derivative financial instruments.<br />
In each of the product and business lines in which we enter into these kinds of positi<strong>on</strong>s, part of our business<br />
entails making assessments about the financial markets and trends in them. The revenues and profits we<br />
derive from many of our positi<strong>on</strong>s and our transacti<strong>on</strong>s in c<strong>on</strong>necti<strong>on</strong> with them can be negatively impacted by<br />
market prices, which were both declining and volatile during the financial crisis. When we own assets, market<br />
price declines can expose us to losses. Many of the more sophisticated transacti<strong>on</strong>s we describe in our discussi<strong>on</strong>s<br />
of our Corporate <strong>Bank</strong>ing & Securities Corporate Divisi<strong>on</strong> are designed to profit from price movements<br />
and differences am<strong>on</strong>g prices. If prices move in a way we have not anticipated, we may experience<br />
8
losses. Also, when markets are volatile, the assessments we have made may prove to lead to lower revenues<br />
or profits, or may lead to losses, <strong>on</strong> the related transacti<strong>on</strong>s and positi<strong>on</strong>s. In additi<strong>on</strong>, we commit capital and<br />
take market risk to facilitate certain capital markets transacti<strong>on</strong>s; doing so can result in losses as well as income<br />
volatility.<br />
Protracted market declines have reduced and may c<strong>on</strong>tinue to reduce liquidity in the markets,<br />
making it harder to sell assets and possibly leading to material losses.<br />
In some of our businesses, protracted market movements, particularly asset price declines, can reduce the<br />
level of activity in the market or reduce market liquidity. As we experienced during the current financial crisis,<br />
these developments can lead to material losses if we cannot close out deteriorating positi<strong>on</strong>s in a timely way.<br />
This may especially be the case for assets we hold for which there are not very liquid markets to begin with.<br />
Assets that are not traded <strong>on</strong> stock exchanges or other public trading markets, such as derivatives c<strong>on</strong>tracts<br />
between banks, may have values that we calculate using models other than publicly-quoted prices. M<strong>on</strong>itoring<br />
the deteriorati<strong>on</strong> of prices of assets like these is difficult and could lead to losses we did not anticipate.<br />
We have incurred losses, and may incur further losses, as a result of changes in the fair value<br />
of our financial instruments.<br />
A substantial proporti<strong>on</strong> of the assets and liabilities <strong>on</strong> our balance sheet comprise financial instruments that<br />
we carry at fair value, with changes in fair value recognized in the income statement. Fair value is defined as<br />
the price at which an asset or liability could be exchanged in a current transacti<strong>on</strong> between knowledgeable,<br />
willing parties, other than in a forced or liquidati<strong>on</strong> sale. If the value of an asset carried at fair value declines<br />
(or the value of a liability carried at fair value increases) a corresp<strong>on</strong>ding write-down is recognized in the<br />
income statement. These write-downs have been and could c<strong>on</strong>tinue to be significant.<br />
Observable prices or inputs are not available for certain classes of financial instruments. Fair value is deter-<br />
mined in these cases using valuati<strong>on</strong> techniques we believe to be appropriate for the particular instrument.<br />
The applicati<strong>on</strong> of valuati<strong>on</strong> techniques to determine fair value involves estimati<strong>on</strong> and management judg-<br />
ment, the extent of which will vary with the degree of complexity of the instrument and liquidity in the market.<br />
Management judgment is required in the selecti<strong>on</strong> and applicati<strong>on</strong> of the appropriate parameters, assumpti<strong>on</strong>s<br />
and modeling techniques. If any of the assumpti<strong>on</strong>s change due to negative market c<strong>on</strong>diti<strong>on</strong>s or for<br />
other reas<strong>on</strong>s, subsequent valuati<strong>on</strong>s may result in significant changes in the fair values of our financial instruments,<br />
requiring us to record losses.<br />
Our exposure and related write-downs are reported net of any fair value gains we may record in c<strong>on</strong>necti<strong>on</strong><br />
with hedging transacti<strong>on</strong>s related to the underlying assets. However, we may never realize these gains, and<br />
the fair value of the hedges may change in future periods for a number of reas<strong>on</strong>s, including as a result of<br />
deteriorati<strong>on</strong> in the credit of our hedging counterparties. Such declines may be independent of the fair values<br />
of the underlying hedged assets and may result in future losses.<br />
9
<strong>20</strong>-F Item 3: Key Informati<strong>on</strong><br />
Adverse ec<strong>on</strong>omic c<strong>on</strong>diti<strong>on</strong>s have caused and may c<strong>on</strong>tinue to cause us<br />
to incur higher credit losses.<br />
The adverse ec<strong>on</strong>omic c<strong>on</strong>diti<strong>on</strong>s experienced during the current financial crisis have caused and may c<strong>on</strong>tinue<br />
to cause us to incur higher credit losses, with our provisi<strong>on</strong> for credit losses increasing from € 0.6 billi<strong>on</strong><br />
in <strong>20</strong>07, to € 1.1 billi<strong>on</strong> in <strong>20</strong>08, to € 2.6 billi<strong>on</strong> in <str<strong>on</strong>g><strong>20</strong>09</str<strong>on</strong>g>. Increased provisi<strong>on</strong>s occurred in both our Corporate<br />
and Investment <strong>Bank</strong> and Private Clients and Asset Management Group Divisi<strong>on</strong>s.<br />
In the sec<strong>on</strong>d half of <strong>20</strong>08 and the first quarter of <str<strong>on</strong>g><strong>20</strong>09</str<strong>on</strong>g>, as permitted by recent amendments to IFRS, we<br />
reclassified certain financial assets out of financial assets carried at fair value through profit or loss or available<br />
for sale into loans. While such reclassified assets, which had a carrying value of € 33.6 billi<strong>on</strong> as of December<br />
31, <str<strong>on</strong>g><strong>20</strong>09</str<strong>on</strong>g>, are no l<strong>on</strong>ger subject to mark-to-market accounting, we c<strong>on</strong>tinue to be exposed to the risk of<br />
impairment of such assets. In additi<strong>on</strong>, we bear additi<strong>on</strong>al funding and capital costs with respect to them. Of<br />
our € 2.6 billi<strong>on</strong> provisi<strong>on</strong> for credit losses in <str<strong>on</strong>g><strong>20</strong>09</str<strong>on</strong>g>, € 1.3 billi<strong>on</strong> was attributable to these reclassified assets<br />
and related primarily to exposures in Leveraged Finance.<br />
Even where losses are for our clients’ accounts, they may fail to repay us,<br />
leading to material losses for us, and our reputati<strong>on</strong> can be harmed.<br />
While our clients would be resp<strong>on</strong>sible for losses we incur in taking positi<strong>on</strong>s for their accounts, we may be<br />
exposed to additi<strong>on</strong>al credit risk as a result of their need to cover the losses where we do not hold adequate<br />
collateral or cannot realize it. Our business may also suffer if our clients lose m<strong>on</strong>ey and we lose the c<strong>on</strong>fidence<br />
of clients in our products and services.<br />
Our investment banking revenues may c<strong>on</strong>tinue to decline as a result of adverse market<br />
or ec<strong>on</strong>omic c<strong>on</strong>diti<strong>on</strong>s.<br />
Our investment banking revenues, in the form of financial advisory and underwriting fees, directly relate to the<br />
number and size of the transacti<strong>on</strong>s in which we participate and are susceptible to adverse effects from sustained<br />
market downturns, such as the <strong>on</strong>e currently experienced. These fees and other income are generally<br />
linked to the value of the underlying transacti<strong>on</strong>s and therefore can decline with asset values, as they have<br />
during the current financial crisis. Our revenues and profitability could sustain further material adverse effects<br />
from a significant reducti<strong>on</strong> in the number or size of debt and equity offerings and merger and acquisiti<strong>on</strong><br />
transacti<strong>on</strong>s.<br />
We may generate lower revenues from brokerage and other commissi<strong>on</strong>and<br />
fee-based businesses.<br />
Market downturns have led and may c<strong>on</strong>tinue to lead to declines in the volume of transacti<strong>on</strong>s that we<br />
execute for our clients and, therefore, to declines in our n<strong>on</strong>interest income. In additi<strong>on</strong>, because the fees that<br />
we charge for managing our clients’ portfolios are in many cases based <strong>on</strong> the value or performance of those<br />
portfolios, a market downturn that reduces the value of our clients’ portfolios or increases the amount of withdrawals<br />
reduces the revenues we receive from our asset management and private banking businesses. Even<br />
in the absence of a market downturn, below-market or negative performance by our investment funds may<br />
result in increased withdrawals and reduced inflows, which would reduce the revenue we receive from our<br />
asset management business.<br />
10
Our risk management policies, procedures and methods leave us exposed to unidentified<br />
or unanticipated risks, which could lead to material losses.<br />
We have devoted significant resources to developing our risk management policies, procedures and assessment<br />
methods and intend to c<strong>on</strong>tinue to do so in the future. N<strong>on</strong>etheless, our risk management techniques<br />
and strategies have not been and may in the future not be fully effective in mitigating our risk exposure in all<br />
ec<strong>on</strong>omic market envir<strong>on</strong>ments or against all types of risk, including risks that we fail to identify or anticipate.<br />
Some of our quantitative tools and metrics for managing risk are based up<strong>on</strong> our use of observed historical<br />
market behavior. We apply statistical and other tools to these observati<strong>on</strong>s to arrive at quantificati<strong>on</strong>s of our<br />
risk exposures. In the volatile market envir<strong>on</strong>ment of the financial crisis, these tools and metrics failed to predict<br />
some of the losses we experienced, particularly in <strong>20</strong>08, and may c<strong>on</strong>tinue to fail to predict future important<br />
risk exposures. In additi<strong>on</strong>, our quantitative modeling does not take all risks into account and makes<br />
numerous assumpti<strong>on</strong>s regarding the overall envir<strong>on</strong>ment, which may not be borne out by events. As a result,<br />
risk exposures have arisen and could c<strong>on</strong>tinue to arise from factors we did not anticipate or correctly evaluate<br />
in our statistical models. This has limited and could c<strong>on</strong>tinue to limit our ability to manage our risks. Our<br />
losses thus have been and may c<strong>on</strong>tinue to be significantly greater than the historical measures indicate.<br />
In additi<strong>on</strong>, our more qualitative approach to managing those risks not taken into account by our quantitative<br />
methods could also prove insufficient, exposing us to material unanticipated losses. Also, if existing or potential<br />
customers or counterparties believe our risk management is inadequate, they could take their business<br />
elsewhere or seek to limit their transacti<strong>on</strong>s with us. This could harm our reputati<strong>on</strong> as well as our revenues<br />
and profits. See “Item 11: Quantitative and Qualitative Disclosures about Credit, Market and Other Risk” for a<br />
more detailed discussi<strong>on</strong> of the policies, procedures and methods we use to identify, m<strong>on</strong>itor and manage our<br />
risks.<br />
In its recent lowering of our l<strong>on</strong>g-term rating, Moody’s Investors Service noted the extent of our capital allo-<br />
cated to capital markets activities and the resulting challenges for our market risk management functi<strong>on</strong> to<br />
manage “tail risks” successfully.<br />
Our n<strong>on</strong>traditi<strong>on</strong>al credit businesses materially add to our traditi<strong>on</strong>al banking credit risks.<br />
As a bank and provider of financial services, we are exposed to the risk that third parties that owe us m<strong>on</strong>ey,<br />
securities or other assets will not perform their obligati<strong>on</strong>s. Many of the businesses we engage in bey<strong>on</strong>d the<br />
traditi<strong>on</strong>al banking businesses of deposit-taking and lending also expose us to credit risk.<br />
In particular, many of the businesses we have engaged in through our Corporate <strong>Bank</strong>ing & Securities Corporate<br />
Divisi<strong>on</strong> entail credit transacti<strong>on</strong>s, frequently ancillary to other transacti<strong>on</strong>s. N<strong>on</strong>traditi<strong>on</strong>al sources of<br />
credit risk can arise, for example, from holding securities of third parties; entering into swap or other derivative<br />
c<strong>on</strong>tracts under which counterparties have obligati<strong>on</strong>s to make payments to us; executing securities,<br />
futures, currency or commodity trades that fail to settle at the required time due to n<strong>on</strong>delivery by the counterparty<br />
or systems failure by clearing agents, exchanges, clearing houses or other financial intermediaries;<br />
and extending credit through other arrangements. Parties to these transacti<strong>on</strong>s, such as trading counterparties,<br />
may default <strong>on</strong> their obligati<strong>on</strong>s to us due to bankruptcy, political and ec<strong>on</strong>omic events, lack of liquidity,<br />
operati<strong>on</strong>al failure or other reas<strong>on</strong>s.<br />
11
<strong>20</strong>-F Item 3: Key Informati<strong>on</strong><br />
Many of our derivative transacti<strong>on</strong>s are individually negotiated and n<strong>on</strong>-standardized, which can make exiting,<br />
transferring or settling the positi<strong>on</strong> difficult. Certain credit derivatives require that we deliver to the counterparty<br />
the underlying security, loan or other obligati<strong>on</strong> in order to receive payment. In a number of cases, we do<br />
not hold, and may not be able to obtain, the underlying security, loan or other obligati<strong>on</strong>. This could cause us<br />
to forfeit the payments otherwise due to us or result in settlement delays, which could damage our reputati<strong>on</strong><br />
and ability to transact future business, as well as increased costs to us.<br />
The excepti<strong>on</strong>ally difficult market c<strong>on</strong>diti<strong>on</strong>s since the sec<strong>on</strong>d half of <strong>20</strong>07 have severely adversely affected<br />
certain areas in which we do business that entail n<strong>on</strong>traditi<strong>on</strong>al credit risks, including the leveraged finance<br />
and structured credit markets, and may do so in the future.<br />
We have a c<strong>on</strong>tinuous demand for liquidity to fund our business activities. We may suffer<br />
during periods of market-wide or firm-specific liquidity c<strong>on</strong>straints and are exposed to the risk<br />
that liquidity is not made available to us even if our underlying business remains str<strong>on</strong>g.<br />
We are exposed to liquidity risk, which is the risk arising from our potential inability to meet all payment obligati<strong>on</strong>s<br />
when they become due or <strong>on</strong>ly being able to meet them at excessive costs. Our liquidity may become<br />
impaired due to a reluctance of our counterparties or the market to finance our operati<strong>on</strong>s due to actual or<br />
perceived weaknesses in our businesses. Such impairments can also arise from circumstances unrelated to<br />
our businesses and outside our c<strong>on</strong>trol, such as, but not limited to, disrupti<strong>on</strong>s in the financial markets, like<br />
those experienced during <strong>20</strong>08 and early <str<strong>on</strong>g><strong>20</strong>09</str<strong>on</strong>g>, negative developments c<strong>on</strong>cerning other financial instituti<strong>on</strong>s<br />
perceived to be comparable to us, or negative views about the financial services industry in general, or disrupti<strong>on</strong>s<br />
in the markets for any specific class of assets. Negative percepti<strong>on</strong>s c<strong>on</strong>cerning our business and<br />
prospects could develop as a result of large losses, changes of our credit ratings, a general decline in the<br />
level of business activity in the financial services sector, regulatory acti<strong>on</strong>, serious employee misc<strong>on</strong>duct or<br />
illegal activity, as well as many other reas<strong>on</strong>s.<br />
As described in “Item 3: Key Informati<strong>on</strong> – L<strong>on</strong>g-Term Credit Ratings”, since the start of the financial crisis the<br />
major credit rating agencies have lowered our credit ratings or placed them <strong>on</strong> review or watch. Ratings<br />
downgrades may impact the cost and availability of our funding, collateral requirements and the willingness of<br />
counterparties to do business with us.<br />
We require capital to support our business activities and meet regulatory requirements.<br />
Losses could diminish our capital, and market c<strong>on</strong>diti<strong>on</strong>s may prevent us from raising additi<strong>on</strong>al<br />
capital or increase our cost of capital.<br />
In the wake of the financial crisis in <strong>20</strong>08 and early <str<strong>on</strong>g><strong>20</strong>09</str<strong>on</strong>g>, the price of our shares declined and the spreads <strong>on</strong><br />
our credit default swaps widened. If the levels of market disrupti<strong>on</strong> and volatility experienced in <strong>20</strong>08 and<br />
early <str<strong>on</strong>g><strong>20</strong>09</str<strong>on</strong>g> recur, our ability to access the capital markets and obtain the necessary funding to support our<br />
business activities <strong>on</strong> acceptable terms may be adversely affected. Am<strong>on</strong>g other things, an inability to refinance<br />
assets <strong>on</strong> our balance sheet or maintain appropriate levels of capital to protect against deteriorati<strong>on</strong>s in<br />
their value could force us to liquidate assets we hold at depressed prices or <strong>on</strong> unfavorable terms, as well as<br />
forcing us to curtail business, such as extending new credit. This could have an adverse effect <strong>on</strong> our business,<br />
financial c<strong>on</strong>diti<strong>on</strong> and results of operati<strong>on</strong>s.<br />
12
Also, regulatory reforms applicable to the financial services industry have been proposed that could subject<br />
us to more stringent regulatory capital requirements. Meeting any such requirements may require us to issue<br />
securities that qualify as regulatory capital or to liquidate assets or curtail business, which may have adverse<br />
effects <strong>on</strong> our business, financial c<strong>on</strong>diti<strong>on</strong> and results of operati<strong>on</strong>s, particularly if any such proposal becomes<br />
effective at a time when financial markets are distressed, but also under normal market c<strong>on</strong>diti<strong>on</strong>s.<br />
We operate in an increasingly regulated and litigious envir<strong>on</strong>ment, potentially exposing<br />
us to liability and other costs, the amounts of which may be difficult to estimate.<br />
The financial services industry is am<strong>on</strong>g the most highly regulated industries. Our operati<strong>on</strong>s throughout the<br />
world are regulated and supervised by the central banks and regulatory authorities in the jurisdicti<strong>on</strong>s in which<br />
we operate. In recent years, regulati<strong>on</strong> and supervisi<strong>on</strong> in a number of areas has increased, and regulators,<br />
counterparties and others have sought to subject financial services providers to increasing resp<strong>on</strong>sibilities<br />
and liabilities. This trend has accelerated markedly as a result of the financial crisis. As a result, we may be<br />
subject to an increasing incidence or amount of liability or regulatory sancti<strong>on</strong>s and may be required to make<br />
greater expenditures and devote additi<strong>on</strong>al resources to address potential liability.<br />
Due to the nature of our business, we and our subsidiaries are involved in litigati<strong>on</strong>, arbitrati<strong>on</strong> and regulatory<br />
proceedings in jurisdicti<strong>on</strong>s around the world. Such matters are subject to many uncertainties, and the out-<br />
come of individual matters is not predictable with assurance. We may settle litigati<strong>on</strong> or regulatory proceed-<br />
ings prior to a final judgment or determinati<strong>on</strong> of liability. We may do so to avoid the cost, management efforts<br />
or negative business, regulatory or reputati<strong>on</strong>al c<strong>on</strong>sequences of c<strong>on</strong>tinuing to c<strong>on</strong>test liability, even when we<br />
believe we have valid defenses to liability. We may also do so when the potential c<strong>on</strong>sequences of failing to<br />
prevail would be disproporti<strong>on</strong>ate to the costs of settlement. Furthermore, we may, for similar reas<strong>on</strong>s, reimburse<br />
counterparties for their losses even in situati<strong>on</strong>s where we do not believe that we are legally compelled<br />
to do so. The financial impact of legal risks might be c<strong>on</strong>siderable but may be hard or impossible to estimate<br />
and so to quantify, so that amounts eventually paid may exceed the amount of reserves set aside to cover<br />
such risks. See “Item 8: Financial Informati<strong>on</strong> – Legal Proceedings” and Note [27] to our c<strong>on</strong>solidated financial<br />
statements for informati<strong>on</strong> <strong>on</strong> our legal, regulatory and arbitrati<strong>on</strong> proceedings.<br />
Governmental and central bank acti<strong>on</strong> in resp<strong>on</strong>se to the financial crisis significantly affects<br />
competiti<strong>on</strong> and may affect the legal or ec<strong>on</strong>omic positi<strong>on</strong> of shareholders or other investors.<br />
In resp<strong>on</strong>se to the financial markets crisis, there has been significant interventi<strong>on</strong> by governments and central<br />
banks into the financial services sector, including the taking of direct shareholdings in individual financial<br />
instituti<strong>on</strong>s, particularly in the U.S., the U.K. and Switzerland, and c<strong>on</strong>tributi<strong>on</strong>s of other forms of capital to,<br />
guarantees of debt of and purchases of distressed assets from financial instituti<strong>on</strong>s. In some instances, individual<br />
financial instituti<strong>on</strong>s have been nati<strong>on</strong>alized. The eligibility to benefit from such measures is in some<br />
instances tied to certain commitments of the participating bank, such as lending to certain types of borrowers,<br />
adjustments to the bank’s business strategy, suspensi<strong>on</strong> of dividends and other profit distributi<strong>on</strong>s and limitati<strong>on</strong>s<br />
<strong>on</strong> the compensati<strong>on</strong> of executives.<br />
13
<strong>20</strong>-F Item 3: Key Informati<strong>on</strong><br />
Such interventi<strong>on</strong>s involve significant amounts of m<strong>on</strong>ey and have significant effects <strong>on</strong> both instituti<strong>on</strong>s that<br />
participate in them and instituti<strong>on</strong>s that do not participate including with respect to access to funding and<br />
capital and recruiting and retenti<strong>on</strong> of talent. Instituti<strong>on</strong>s that do not receive such government support may be<br />
in a positi<strong>on</strong> to preserve greater aut<strong>on</strong>omy in their strategy, lending and compensati<strong>on</strong> policy but may suffer<br />
competitive disadvantages <strong>on</strong> their cost base, in particular their costs of funding and capital. They also may<br />
suffer a decline in depositor or investor c<strong>on</strong>fidence thus risking a loss of liquidity. Instituti<strong>on</strong>s that receive such<br />
government support may, as described above, have to make certain commitments and become subject to<br />
certain c<strong>on</strong>straints.<br />
Legislati<strong>on</strong> enacted in Germany in resp<strong>on</strong>se to the financial markets crisis provides am<strong>on</strong>g other things for<br />
the temporary suspensi<strong>on</strong> of otherwise applicable stock corporati<strong>on</strong> and takeover law, in particular with respect<br />
to shareholder rights and for enhanced powers of the Federal Financial Supervisory Authority (BaFin) to<br />
suspend dividends and other distributi<strong>on</strong>s <strong>on</strong> financial instruments that qualify as own funds (Eigenmittel).<br />
The implementati<strong>on</strong> of any such measures with respect to our company could adversely affect the legal or<br />
ec<strong>on</strong>omic positi<strong>on</strong> of our shareholders or other investors. The implementati<strong>on</strong> of any such measures with<br />
respect to other companies could adversely affect the percepti<strong>on</strong> of the overall prospects for the financial<br />
services sector or for a particular type or types of financial instruments. In such case the price for our shares<br />
and other financial instruments could drop and our costs of funding and capital could rise.<br />
Regulatory reforms proposed in resp<strong>on</strong>se to the financial crisis may significantly affect<br />
our business model and the competitive envir<strong>on</strong>ment.<br />
In resp<strong>on</strong>se to the financial markets crisis, governments, regulatory authorities and others have made and<br />
c<strong>on</strong>tinue to make numerous proposals to reform the regulatory framework for the financial services industry to<br />
enhance its resilience against future crises. The wide range of current proposals includes, am<strong>on</strong>g others,<br />
proposals for: more stringent regulatory capital and liquidity standards; restricti<strong>on</strong>s <strong>on</strong> compensati<strong>on</strong> practices;<br />
charging special levies to fund governmental interventi<strong>on</strong> in resp<strong>on</strong>se to crises; expansi<strong>on</strong> of the resoluti<strong>on</strong><br />
powers of regulators; separati<strong>on</strong> of certain businesses from deposit taking; breaking up financial instituti<strong>on</strong>s<br />
that are perceived to be too large for regulators to take the risk of their failure; and reforming market infrastructures.<br />
See “Item 4: Informati<strong>on</strong> <strong>on</strong> the Company – The Competitive Envir<strong>on</strong>ment – Regulatory Reform.”<br />
For some of these proposals, formal c<strong>on</strong>sultati<strong>on</strong>s and impact studies have begun, while other proposals are<br />
<strong>on</strong>ly in the political debating stage. It is presently unclear which of these proposals, if any, will become law<br />
and, if so, to what extent and <strong>on</strong> what terms. Therefore, we cannot assess their effects <strong>on</strong> us at this point. It is<br />
possible, however, that the future regulatory framework for financial instituti<strong>on</strong>s may change, perhaps significantly,<br />
which creates significant uncertainty for us and the financial industry in general. Effects of the regulatory<br />
changes <strong>on</strong> us may range from additi<strong>on</strong>al administrative costs to implement and comply with new rules to<br />
increased costs of funding and/or capital, up to restricti<strong>on</strong>s <strong>on</strong> our growth and <strong>on</strong> the businesses we are permitted<br />
to c<strong>on</strong>duct. Should proposals be adopted that require us to materially alter our business model, the<br />
resulting changes could have a material adverse effect <strong>on</strong> our business, results of operati<strong>on</strong>s and financial<br />
c<strong>on</strong>diti<strong>on</strong> as well as <strong>on</strong> our prospects.<br />
14
Operati<strong>on</strong>al risks may disrupt our businesses.<br />
We face operati<strong>on</strong>al risk arising from errors, inadvertent or intenti<strong>on</strong>al, made in the executi<strong>on</strong>, c<strong>on</strong>firmati<strong>on</strong> or<br />
settlement of transacti<strong>on</strong>s or from transacti<strong>on</strong>s not being properly recorded, evaluated or accounted for. Derivative<br />
c<strong>on</strong>tracts are not always c<strong>on</strong>firmed with the counterparties <strong>on</strong> a timely basis; while the transacti<strong>on</strong><br />
remains unc<strong>on</strong>firmed, we are subject to heightened credit and operati<strong>on</strong>al risk and in the event of a default<br />
may find it more difficult to enforce the c<strong>on</strong>tract. The current financial crisis, in which the risk of counterparty<br />
default has increased, has increased the possibility that this operati<strong>on</strong>al risk materializes.<br />
Our businesses are highly dependent <strong>on</strong> our ability to process, <strong>on</strong> a daily basis, a large number of transacti<strong>on</strong>s<br />
across numerous and diverse markets in many currencies and certain of the transacti<strong>on</strong>s we process<br />
have become increasingly complex. C<strong>on</strong>sequently, we rely heavily <strong>on</strong> our financial, accounting and other data<br />
processing systems. If any of these systems do not operate properly, or are disabled, we could suffer financial<br />
loss, a disrupti<strong>on</strong> of our businesses, liability to clients, regulatory interventi<strong>on</strong> or reputati<strong>on</strong>al damage.<br />
In additi<strong>on</strong>, despite the c<strong>on</strong>tingency plans we have in place, our ability to c<strong>on</strong>duct business may be adversely<br />
impacted by a disrupti<strong>on</strong> in the infrastructure that supports our businesses and the communities in which we<br />
are located. This may include a disrupti<strong>on</strong> due to terrorist activities, or disease pandemics, as well as disrupti<strong>on</strong><br />
involving electrical, communicati<strong>on</strong>s, transportati<strong>on</strong> or other services used by us or third parties with<br />
whom we c<strong>on</strong>duct business.<br />
The size of our clearing operati<strong>on</strong>s exposes us to a heightened risk of material losses<br />
should these operati<strong>on</strong>s fail to functi<strong>on</strong> properly.<br />
We have large clearing and settlement businesses. These give rise to the risk that we, our customers or other<br />
third parties could lose substantial sums if our systems fail to operate properly for even short periods. This will<br />
be the case even where the reas<strong>on</strong> for the interrupti<strong>on</strong> is external to us. In such a case, we might suffer harm<br />
to our reputati<strong>on</strong> even if no material amounts of m<strong>on</strong>ey are lost. This could cause customers to take their<br />
business elsewhere, which could materially harm our revenues and our profits.<br />
If we are unable to implement our strategic initiatives, we may incur losses or low profitability,<br />
and our share price may be materially and adversely affected.<br />
In late <str<strong>on</strong>g><strong>20</strong>09</str<strong>on</strong>g>, we launched Phase 4 of our management agenda, which is focused <strong>on</strong> the next two years, and<br />
comprises the following key pillars: increasing profitability in our Corporate and Investment <strong>Bank</strong> Group Divisi<strong>on</strong><br />
with renewed risk and balance sheet discipline, focusing <strong>on</strong> core Private Clients and Asset Management<br />
businesses and home market leadership, focusing <strong>on</strong> Asia as a key driver of revenue growth and renewing<br />
emphasis <strong>on</strong> our performance culture. If we fail to implement these strategic initiatives or should the initiatives<br />
that are implemented fail to produce the anticipated benefits, we may incur losses, or low profitability, and our<br />
share price may be materially and adversely affected. A number of internal and external factors could prevent<br />
the implementati<strong>on</strong> of these initiatives or the realizati<strong>on</strong> of their anticipated benefits, including the recurrence<br />
of extreme turbulence in the markets in which we are active, c<strong>on</strong>tinued weakness of global, regi<strong>on</strong>al and nati<strong>on</strong>al<br />
ec<strong>on</strong>omic c<strong>on</strong>diti<strong>on</strong>s, regulatory changes that increase our costs or restrict our activities and increased<br />
competiti<strong>on</strong> for business.<br />
15
<strong>20</strong>-F Item 3: Key Informati<strong>on</strong><br />
We may have difficulty in identifying and executing acquisiti<strong>on</strong>s, and both making acquisiti<strong>on</strong>s<br />
and avoiding them could materially harm our results of operati<strong>on</strong>s and our share price.<br />
We c<strong>on</strong>sider business combinati<strong>on</strong>s from time to time. Even though we review the companies we plan to<br />
acquire, it is generally not feasible for these reviews to be complete in all respects. As a result, we may assume<br />
unanticipated liabilities, or an acquisiti<strong>on</strong> may not perform as well as expected. Were we to announce or<br />
complete a significant business combinati<strong>on</strong> transacti<strong>on</strong>, our share price could decline significantly if investors<br />
viewed the transacti<strong>on</strong> as too costly or unlikely to improve our competitive positi<strong>on</strong>. In additi<strong>on</strong>, we might<br />
have difficulty integrating any entity with which we combine our operati<strong>on</strong>s. Failure to complete announced<br />
business combinati<strong>on</strong>s or failure to integrate acquired businesses successfully into ours could materially adversely<br />
affect our profitability. It could also affect investors’ percepti<strong>on</strong> of our business prospects and management,<br />
and thus cause our share price to fall. It could also lead to departures of key employees, or lead to<br />
increased costs and reduced profitability if we felt compelled to offer them financial incentives to remain.<br />
In February <str<strong>on</strong>g><strong>20</strong>09</str<strong>on</strong>g>, we acquired a stake of 22.9 % in <strong>Deutsche</strong> Postbank AG and b<strong>on</strong>ds of Postbank's parent<br />
that are mandatorily exchangeable in <strong>20</strong>12 into an additi<strong>on</strong>al 27.4 % of Postbank's shares. Together with a<br />
stake of approximately 2.1 % held at that point in time as well as additi<strong>on</strong>al shares purchased after that transacti<strong>on</strong>,<br />
we held an investment of 29.88 % as of December 31, <str<strong>on</strong>g><strong>20</strong>09</str<strong>on</strong>g>. If we c<strong>on</strong>tinue to hold the b<strong>on</strong>ds when<br />
they are exchanged, we would own a majority of Postbank’s shares. Our current holding does not give us<br />
c<strong>on</strong>trol of Postbank, which, like many financial instituti<strong>on</strong>s, has been affected by the financial crisis. While we<br />
are able to determine, in the implementati<strong>on</strong> of our strategy, whether to hold the exchangeable b<strong>on</strong>ds at the<br />
time of their mandatory exchange, and accordingly whether we will in fact acquire c<strong>on</strong>trol of Postbank, we<br />
remain exposed to the risk of loss <strong>on</strong> our present investment in Postbank. Any such loss could be material.<br />
We may have difficulties selling n<strong>on</strong>core assets at favorable prices, or at all.<br />
We may seek to sell certain n<strong>on</strong>core assets. Unfavorable business or market c<strong>on</strong>diti<strong>on</strong>s may make it difficult<br />
for us to sell such assets at favorable prices, or may preclude such a sale altogether.<br />
Events at companies in which we have invested may make it harder to sell our holdings<br />
and result in material losses irrespective of market developments.<br />
We have made significant investments in individual companies. Losses and risks at those companies may<br />
restrict our ability to sell our shareholdings and may reduce the value of our holdings c<strong>on</strong>siderably, potentially<br />
impacting our financial statements or earnings, even where general market c<strong>on</strong>diti<strong>on</strong>s are favorable. Our<br />
larger, less liquid interests are particularly vulnerable given the size of these exposures.<br />
Intense competiti<strong>on</strong>, in our home market of Germany as well as in internati<strong>on</strong>al markets,<br />
could materially adversely impact our revenues and profitability.<br />
Competiti<strong>on</strong> is intense in all of our primary business areas, in Germany as well as in internati<strong>on</strong>al markets. If<br />
we are unable to resp<strong>on</strong>d to the competitive envir<strong>on</strong>ment in these markets with attractive product and service<br />
offerings that are profitable for us, we may lose market share in important areas of our business or incur<br />
losses <strong>on</strong> some or all of our activities. In additi<strong>on</strong>, downturns in the ec<strong>on</strong>omies of these markets could add to<br />
the competitive pressure, through, for example, increased price pressure and lower business volumes for us.<br />
16
In recent years there has been substantial c<strong>on</strong>solidati<strong>on</strong> and c<strong>on</strong>vergence am<strong>on</strong>g financial services companies,<br />
culminating in unprecedented c<strong>on</strong>solidati<strong>on</strong>s in the course of the financial crisis. This trend has significantly<br />
increased the capital base and geographic reach of some of our competitors and has hastened the<br />
globalizati<strong>on</strong> of the securities and other financial services markets. As a result, we must compete with financial<br />
instituti<strong>on</strong>s that may be larger and better capitalized than we are and that may have a str<strong>on</strong>ger positi<strong>on</strong> in<br />
local markets. Also, as described above, governmental acti<strong>on</strong> in resp<strong>on</strong>se to the financial crisis may place us<br />
at a competitive disadvantage.<br />
Transacti<strong>on</strong>s with counterparties in countries designated by the U.S. State Department as state<br />
sp<strong>on</strong>sors of terrorism may lead potential customers and investors to avoid doing business<br />
with us or investing in our securities.<br />
We engage or have engaged in a limited amount of business with counterparties, including government<br />
owned or c<strong>on</strong>trolled counterparties, in certain countries which the U.S. State Department has designated as<br />
state sp<strong>on</strong>sors of terrorism, including Iran. We also had a representative office in Tehran, Iran, which we disc<strong>on</strong>tinued<br />
at December 31, <strong>20</strong>07. U.S. law generally prohibits U.S. pers<strong>on</strong>s from doing business with such<br />
countries. We are a German bank and our activities with respect to such countries have not involved any<br />
U.S. pers<strong>on</strong> in either a managerial or operati<strong>on</strong>al role and have been subject to policies and procedures designed<br />
to ensure compliance with United Nati<strong>on</strong>s, European Uni<strong>on</strong> and German embargoes. In <strong>20</strong>07 and<br />
before, our Management Board decided that we will not engage in new business with counterparties in countries<br />
such as Iran, Syria, Sudan and North Korea and to exit existing business to the extent legally possible.<br />
Our existing business with Iranian counterparties c<strong>on</strong>sists mostly of participati<strong>on</strong>s as lender and/or agent in a<br />
few large trade finance facilities arranged some years ago to finance the export c<strong>on</strong>tracts of exporters in Eu-<br />
rope and Asia. The lifetime of most of these facilities is ten years or more and we are legally obligated to fulfill<br />
our c<strong>on</strong>tractual obligati<strong>on</strong>s. We do not believe our business activities with Iranian counterparties are material<br />
to our overall business, with our outstandings to Iranian borrowers representing substantially less than 0.1 %<br />
of our total assets as of December 31, <str<strong>on</strong>g><strong>20</strong>09</str<strong>on</strong>g> and our revenues from all such activities representing substantially<br />
less than 0.1 % of our total revenues for the year ended December 31, <str<strong>on</strong>g><strong>20</strong>09</str<strong>on</strong>g>.<br />
We are aware, through press reports and other means, of initiatives by governmental and n<strong>on</strong>-governmental<br />
entities in the United States and elsewhere to adopt laws, regulati<strong>on</strong>s or policies prohibiting transacti<strong>on</strong>s with<br />
or investment in, or requiring divestment from, entities doing business with Iran. Such initiatives may result in<br />
our being unable to gain or retain entities subject to such prohibiti<strong>on</strong>s as customers or as investors in our<br />
securities. In additi<strong>on</strong>, our reputati<strong>on</strong> may suffer due to our associati<strong>on</strong> with Iran. Such a result could have<br />
significant adverse effects <strong>on</strong> our business or the price of our securities.<br />
17
<strong>20</strong>-F Item 4: Informati<strong>on</strong> <strong>on</strong> the Company<br />
Item 4: Informati<strong>on</strong> <strong>on</strong> the Company<br />
History and Development of the Company<br />
The legal and commercial name of our company is <strong>Deutsche</strong> <strong>Bank</strong> Aktiengesellschaft. It is a stock corporati<strong>on</strong><br />
organized under the laws of Germany.<br />
<strong>Deutsche</strong> <strong>Bank</strong> Aktiengesellschaft originated from the reunificati<strong>on</strong> of Norddeutsche <strong>Bank</strong> Aktiengesellschaft,<br />
Hamburg, Rheinisch-Westfälische <strong>Bank</strong> Aktiengesellschaft, Düsseldorf, and Süddeutsche <strong>Bank</strong> Aktiengesell-<br />
schaft, Munich. Pursuant to the Law <strong>on</strong> the Regi<strong>on</strong>al Scope of Credit Instituti<strong>on</strong>s, these were disincorporated<br />
in 1952 from <strong>Deutsche</strong> <strong>Bank</strong>, which had been founded in 1870. The merger and the name were entered in the<br />
Commercial Register of the District Court Frankfurt am Main <strong>on</strong> May 2, 1957.<br />
We are registered under registrati<strong>on</strong> number HRB 30 000. Our registered address is Theodor-Heuss-Allee 70,<br />
60486 Frankfurt am Main, Germany, and our teleph<strong>on</strong>e number is +49-69-910-00. Our agent in the United<br />
States is: Peter Sturzinger, <strong>Deutsche</strong> <strong>Bank</strong> Americas, c/o Office of the Secretary, 60 Wall Street, Mail Stop<br />
NYC60-4006, New York, NY 10005.<br />
We have made the following significant capital expenditures or divestitures since January 1, <str<strong>on</strong>g><strong>20</strong>09</str<strong>on</strong>g>:<br />
— In February <str<strong>on</strong>g><strong>20</strong>09</str<strong>on</strong>g>, Corporate Investments participated in a liquidity facility for Sicherungseinrichtungs-<br />
gesellschaft deutscher <strong>Bank</strong>en mbH (“SdB”), acquiring € 2.3 billi<strong>on</strong> of ECB-eligible notes guaranteed by<br />
SoFFin (S<strong>on</strong>derf<strong>on</strong>ds Finanzmarktstabilisierung, established in October <strong>20</strong>08 by the German government<br />
in the c<strong>on</strong>text of the financial crisis).<br />
— The acquisiti<strong>on</strong> of a minority stake in <strong>Deutsche</strong> Postbank AG was closed in February <str<strong>on</strong>g><strong>20</strong>09</str<strong>on</strong>g>. As part of<br />
that transacti<strong>on</strong> we issued 50,000,000 <strong>Deutsche</strong> <strong>Bank</strong> shares to <strong>Deutsche</strong> Post, the parent of <strong>Deutsche</strong><br />
Postbank, to acquire a stake of 22.9 % in Postbank. Together with a stake of approximately 2.1 % held at<br />
that point in time as well as additi<strong>on</strong>al shares purchased after that transacti<strong>on</strong>, we held an investment of<br />
29.88 % as of December 31, <str<strong>on</strong>g><strong>20</strong>09</str<strong>on</strong>g>. We also acquired a mandatorily-exchangeable b<strong>on</strong>d issued by<br />
<strong>Deutsche</strong> Post, which will be exchanged for an additi<strong>on</strong>al 27.4 % stake in Postbank in February <strong>20</strong>12, and<br />
a call opti<strong>on</strong> to acquire an additi<strong>on</strong>al stake of 12.1 % in Postbank exercisable between February <strong>20</strong>12<br />
and February <strong>20</strong>13 (<strong>Deutsche</strong> Post has a corresp<strong>on</strong>ding put opti<strong>on</strong> <strong>on</strong> the same 12.1 % stake).<br />
— The remaining stake of 2.4 % in Linde AG was sold via sell-down in the public markets in February, March<br />
and April <str<strong>on</strong>g><strong>20</strong>09</str<strong>on</strong>g>.<br />
— The reducti<strong>on</strong> of our holding in Daimler AG from 2.7 % to 0.04 % took place via sell-down in the public<br />
markets in April through August <str<strong>on</strong>g><strong>20</strong>09</str<strong>on</strong>g>.<br />
— The acquisiti<strong>on</strong> of Dresdner <strong>Bank</strong>’s Global Agency Securities Lending business from Commerzbank was<br />
signed in May <str<strong>on</strong>g><strong>20</strong>09</str<strong>on</strong>g> and closed in November <str<strong>on</strong>g><strong>20</strong>09</str<strong>on</strong>g>.<br />
— In December <str<strong>on</strong>g><strong>20</strong>09</str<strong>on</strong>g>, we signed a definitive agreement to acquire parts of ABN AMRO’s corporate and<br />
commercial banking activities in the Netherlands for € 700 milli<strong>on</strong>. The businesses to be acquired remain<br />
the same as those in the original agreement announced in July <strong>20</strong>08, encompassing a network of 15 ABN<br />
AMRO branches: two corporate client units serving large corporate clients and 13 commercial advisory<br />
branches serving medium-sized clients in the Netherlands. In additi<strong>on</strong>, as part of the transacti<strong>on</strong>, we will<br />
acquire the Rotterdam-based bank, Hollandsche <strong>Bank</strong> Unie N.V., and the Dutch IFN Finance B.V., which<br />
provides factoring services. The transacti<strong>on</strong> is subject to approval by De Nederlandsche <strong>Bank</strong>, the European<br />
Commissi<strong>on</strong> and other regulatory bodies and is expected to be completed in the sec<strong>on</strong>d quarter <strong>20</strong>10.<br />
18
— A framework agreement to acquire 100 % of Sal. Oppenheim Group was signed in October <str<strong>on</strong>g><strong>20</strong>09</str<strong>on</strong>g> and<br />
closes in the first quarter of <strong>20</strong>10. On provisi<strong>on</strong>al values, the purchase price for the different entities acquired<br />
is expected to total approximately € 1.3 billi<strong>on</strong>.<br />
— In additi<strong>on</strong> to the envisaged sale of BHF Asset Servicing GmbH, which was previously owned by<br />
Sal. Oppenheim, we also intend to resell parts of Sal. Oppenheim’s investment banking activities to third<br />
parties.<br />
— Agreements to acquire an additi<strong>on</strong>al share of 3.4 % in Hua Xia <strong>Bank</strong> Co. Ltd. from Sal. Oppenheim<br />
jr. & Cie. KGaA were signed in November <str<strong>on</strong>g><strong>20</strong>09</str<strong>on</strong>g>.<br />
— At the end of <str<strong>on</strong>g><strong>20</strong>09</str<strong>on</strong>g>, the existing liquidity facility for <strong>Deutsche</strong> Pfandbriefbank AG (formerly Hypo Real<br />
Estate <strong>Bank</strong> AG) was fully repaid, at which point Corporate Investments participated in a new liquidity<br />
facility for <strong>Deutsche</strong> Pfandbriefbank AG by subscribing to € 9.2 billi<strong>on</strong> of ECB-eligible notes fully guaranteed<br />
by SoFFin.<br />
Since January 1, <str<strong>on</strong>g><strong>20</strong>09</str<strong>on</strong>g>, there have been no public takeover offers by third parties with respect to our shares.<br />
Business Overview<br />
Our Organizati<strong>on</strong><br />
Headquartered in Frankfurt am Main, Germany, we are the largest bank in Germany, and <strong>on</strong>e of the largest<br />
financial instituti<strong>on</strong>s in Europe and the world, as measured by total assets of € 1,501 billi<strong>on</strong> as of December<br />
31, <str<strong>on</strong>g><strong>20</strong>09</str<strong>on</strong>g>. As of that date, we employed 77,053 people <strong>on</strong> a full-time equivalent basis and operated in<br />
72 countries out of 1,964 branches worldwide, of which 49 % were in Germany. We offer a wide variety of<br />
investment, financial and related products and services to private individuals, corporate entities and instituti<strong>on</strong>al<br />
clients around the world.<br />
We are organized into three group divisi<strong>on</strong>s, two of which are further sub-divided into corporate divisi<strong>on</strong>s. As<br />
of December 31, <str<strong>on</strong>g><strong>20</strong>09</str<strong>on</strong>g>, our group divisi<strong>on</strong>s were:<br />
— The Corporate and Investment <strong>Bank</strong> (CIB), comprising two corporate divisi<strong>on</strong>s:<br />
— Corporate <strong>Bank</strong>ing & Securities (CB&S)<br />
— Global Transacti<strong>on</strong> <strong>Bank</strong>ing (GTB)<br />
— Private Clients and Asset Management (PCAM), comprising two corporate divisi<strong>on</strong>s:<br />
— Asset and Wealth Management (AWM)<br />
— Private & Business Clients (PBC)<br />
— Corporate Investments (CI)<br />
These divisi<strong>on</strong>s are supported by infrastructure functi<strong>on</strong>s and our Corporate Center. In additi<strong>on</strong>, we have a<br />
regi<strong>on</strong>al management functi<strong>on</strong> that covers regi<strong>on</strong>al resp<strong>on</strong>sibilities worldwide.<br />
19
<strong>20</strong>-F Item 4: Informati<strong>on</strong> <strong>on</strong> the Company<br />
We have operati<strong>on</strong>s or dealings with existing or potential customers in most countries in the world. These<br />
operati<strong>on</strong>s and dealings include:<br />
— subsidiaries and branches in many countries;<br />
— representative offices in many other countries; and<br />
— <strong>on</strong>e or more representatives assigned to serve customers in a large number of additi<strong>on</strong>al countries.<br />
The following table shows our net revenues by geographical regi<strong>on</strong>, based <strong>on</strong> our management reporting<br />
systems.<br />
in € m. <str<strong>on</strong>g><strong>20</strong>09</str<strong>on</strong>g> <strong>20</strong>08 <strong>20</strong>07<br />
Germany:<br />
CIB 2,353 2,997 3,012<br />
PCAM 4,769 5,<strong>20</strong>8 5,514<br />
Total Germany<br />
Europe, Middle East and Africa:<br />
7,122 8,<strong>20</strong>5 8,525<br />
CIB 8,483 (629) 7,713<br />
PCAM 2,482 2,391 2,816<br />
Total Europe, Middle East and Africa 1 Americas (primarily U.S.):<br />
10,964 1,762 10,530<br />
CIB 5,295 (838) 4,628<br />
PCAM 724 971 1,331<br />
Total Americas 6,0<strong>20</strong> 133 5,959<br />
Asia/Pacific:<br />
CIB 2,672 1,671 3,823<br />
PCAM 289 471 468<br />
Total Asia/Pacific 2,961 2,142 4,291<br />
CI 1,044 1,290 1,517<br />
C<strong>on</strong>solidati<strong>on</strong> & Adjustments (159) 82 7<br />
C<strong>on</strong>solidated net revenues2 27,952 13,613 30,829<br />
1 For each of the years ended December 31, <str<strong>on</strong>g><strong>20</strong>09</str<strong>on</strong>g> and <strong>20</strong>07, the United Kingdom accounted for roughly 60 % of these revenues. The United Kingdom<br />
reported negative revenues for the year ended December 31, <strong>20</strong>08.<br />
2 C<strong>on</strong>solidated net revenues comprise interest and similar income, interest expense and total n<strong>on</strong>interest income (including commissi<strong>on</strong>s and fee income).<br />
Revenues are attributed to countries based <strong>on</strong> the locati<strong>on</strong> in which our booking office is located. The locati<strong>on</strong> of a transacti<strong>on</strong> <strong>on</strong> our books is sometimes<br />
different from the locati<strong>on</strong> of the headquarters or other offices of a customer and different from the locati<strong>on</strong> of our pers<strong>on</strong>nel who entered into or<br />
facilitated the transacti<strong>on</strong>. Where we record a transacti<strong>on</strong> involving our staff and customers and other third parties in different locati<strong>on</strong>s frequently depends<br />
<strong>on</strong> other c<strong>on</strong>siderati<strong>on</strong>s, such as the nature of the transacti<strong>on</strong>, regulatory c<strong>on</strong>siderati<strong>on</strong>s and transacti<strong>on</strong> processing c<strong>on</strong>siderati<strong>on</strong>s.<br />
Management Structure<br />
We operate the three group divisi<strong>on</strong>s and the infrastructure functi<strong>on</strong>s under the umbrella of a “virtual holding<br />
company”. We use this term to mean that, while we subject the group divisi<strong>on</strong>s and infrastructure areas to the<br />
overall supervisi<strong>on</strong> of our Management Board, which is supported by the Corporate Center, we do not have a<br />
separate legal entity holding these three group divisi<strong>on</strong>s but we nevertheless allocate substantial managerial<br />
aut<strong>on</strong>omy to them. To support this structure, key governance bodies functi<strong>on</strong> as follows:<br />
The Management Board has the overall resp<strong>on</strong>sibility for the management of <strong>Deutsche</strong> <strong>Bank</strong>, as provided by<br />
the German Stock Corporati<strong>on</strong> Act. Its members are appointed and removed by the Supervisory Board, which<br />
is a separate corporate body. Our Management Board focuses <strong>on</strong> strategic management, corporate governance,<br />
resource allocati<strong>on</strong>, risk management and c<strong>on</strong>trol, assisted by Functi<strong>on</strong>al Committees.<br />
<strong>20</strong>
The Group Executive Committee was established in <strong>20</strong>02. It comprises the members of the Management<br />
Board and senior representatives from the business divisi<strong>on</strong>s within our client-facing group divisi<strong>on</strong>s and from<br />
the management of our regi<strong>on</strong>s appointed by the Management Board. The Group Executive Committee is a<br />
body that is not required by the Stock Corporati<strong>on</strong> Act. It serves as a tool to coordinate our businesses and<br />
regi<strong>on</strong>s. We believe this underscores our commitment to a virtual holding company structure.<br />
Within each group divisi<strong>on</strong> and regi<strong>on</strong>, coordinati<strong>on</strong> and management functi<strong>on</strong>s are handled by Operating<br />
Committees and Executive Committees, which helps ensure that the implementati<strong>on</strong> of the strategy of individual<br />
businesses and the plans for the development of infrastructure areas are integrated with global business<br />
objectives.<br />
Our Business Strategy<br />
Our identity and missi<strong>on</strong>. We are a leading global investment bank with a str<strong>on</strong>g and growing private clients<br />
franchise. We c<strong>on</strong>sider these to be mutually reinforcing businesses, and taking full advantage of the synergy<br />
potential between these businesses is a strategic priority for us. We are a leader in Europe, with str<strong>on</strong>g positi<strong>on</strong>s<br />
in North America, Asia, and key emerging markets.<br />
We take it as our missi<strong>on</strong> to be the leading global provider of financial soluti<strong>on</strong>s creating lasting value for our<br />
clients, our shareholders, our people and the communities in which we operate.<br />
Our management agenda. Beginning in <strong>20</strong>02, we initiated a multi-year and multi-phased agenda. The first<br />
phase of this agenda focused <strong>on</strong> management’s priorities to transform the bank. The sec<strong>on</strong>d phase focused<br />
<strong>on</strong> a strategy of achieving sustainable profitable growth. The third phase focused <strong>on</strong> leveraging opportunities<br />
for our repositi<strong>on</strong>ed franchise to achieve accelerated growth.<br />
With the <strong>on</strong>set of the financial crisis in <strong>20</strong>08, the banking landscape changed, new l<strong>on</strong>g-term challenges have<br />
emerged and we recognized the underlying need to adapt our strategy and business model in order to cap-<br />
ture the opportunities of a new era. Hence, we added a new, fourth chapter to our management agenda, as a<br />
c<strong>on</strong>tinuati<strong>on</strong> of the transformati<strong>on</strong> we first launched in <strong>20</strong>02. This new phase comprises the following key<br />
pillars:<br />
— Increasing profitability in Corporate and Investment <strong>Bank</strong>ing (CIB) with renewed risk and balance sheet<br />
discipline<br />
— Focusing <strong>on</strong> core Private Clients and Asset Management businesses and home market leadership<br />
— Focusing <strong>on</strong> Asia as a key driver of revenue growth<br />
— Renewing emphasis <strong>on</strong> our performance culture<br />
Strategies in our CIB Businesses<br />
In our Corporate <strong>Bank</strong>ing & Securities business, which comprises our Global Markets and Corporate Finance<br />
businesses, we are targeting increased profitability and earnings quality.<br />
In Global Markets, our focus is <strong>on</strong> c<strong>on</strong>tinued improvement of asset efficiency, while we aim to further build <strong>on</strong><br />
the positi<strong>on</strong> we reached in recent years as <strong>on</strong>e of the world’s leading investment banks (based <strong>on</strong> publicly<br />
21
<strong>20</strong>-F Item 4: Informati<strong>on</strong> <strong>on</strong> the Company<br />
available revenue informati<strong>on</strong> and client surveys in industry publicati<strong>on</strong>s). In resp<strong>on</strong>se to the financial crisis,<br />
we have taken steps to recalibrate and reduce the risk in our platform, adjusting our deployment of capital,<br />
our resource levels and our risk-weighted assets with an aim to achieve improved profitability, earnings quality<br />
and a truly diversified platform based <strong>on</strong> revenues by business area. Looking forward, we will focus <strong>on</strong><br />
strengthening our global equity, commodity and electr<strong>on</strong>ic trading platforms. We will invest in cash equities<br />
and prime brokerage in North America and Asia as well as build out our listed / flow equity derivatives platform.<br />
In commodities, we will focus <strong>on</strong> a product and regi<strong>on</strong>al build out including physical oil, Eastern European<br />
power and gas, and metals in Asia while investing in core risk management capabilities. We also aim to<br />
develop a leading electr<strong>on</strong>ic cash equities trading product for existing and new clients, and intend to invest in<br />
foreign exchange/rates to maintain our market leading electr<strong>on</strong>ic trading positi<strong>on</strong> and protect market share.<br />
In Corporate Finance, we have built a powerful European franchise, and our principal strategic objective is to<br />
build a top 5 positi<strong>on</strong> globally, as measured by fees. We aim to achieve this goal by building <strong>on</strong> our leading<br />
positi<strong>on</strong> in Europe, profitably growing market share and capitalizing <strong>on</strong> momentum in the Americas and Asia<br />
Pacific, and by making c<strong>on</strong>sidered investments in specific industry groups and regi<strong>on</strong>s. In additi<strong>on</strong>, following<br />
the financial crisis, we have recalibrated our activities in Commercial Real Estate, tightening risk and underwriting<br />
parameters, and in Leveraged Finance, setting strict limits <strong>on</strong> pipeline and c<strong>on</strong>centrati<strong>on</strong> risk.<br />
In Global Transacti<strong>on</strong> <strong>Bank</strong>ing, we focus <strong>on</strong> maintaining profitable growth. Wherever GTB is present, we offer<br />
comprehensive services for domestic and cross-border trade, including structuring, financing and risk mitigati<strong>on</strong>.<br />
We seek to develop flexible, innovative soluti<strong>on</strong>s in areas such as the credit card business and low-value<br />
cross-currency payments. GTB seeks to grow by capitalizing <strong>on</strong> recent investments, focusing <strong>on</strong> high growth,<br />
fee and margin products, and also by seizing the right acquisiti<strong>on</strong> opportunities, for example the acquisiti<strong>on</strong> of<br />
parts of ABN AMRO’s corporate and commercial banking activities in the Netherlands. With a definitive<br />
agreement signed in December <str<strong>on</strong>g><strong>20</strong>09</str<strong>on</strong>g> and its expected closing in the sec<strong>on</strong>d quarter <strong>20</strong>10, this acquisiti<strong>on</strong><br />
will strengthen GTB’s footprint in Europe by achieving deeper client coverage and complementary product<br />
offerings.<br />
Strategies in our PCAM Businesses<br />
Asset and Wealth Management is comprised of our Asset Management and Private Wealth Management<br />
businesses.<br />
In Asset Management, we will focus <strong>on</strong> our core businesses and investment competencies, seek to leverage<br />
market-leading positi<strong>on</strong>s through strategic partnerships and c<strong>on</strong>tinue driving efficiency and cost reducti<strong>on</strong>s.<br />
The significant re-engineering initiatives achieved in <strong>20</strong>08 and <str<strong>on</strong>g><strong>20</strong>09</str<strong>on</strong>g>, including globalizati<strong>on</strong> of the DWS business,<br />
repositi<strong>on</strong>ing of the Asia/Pacific regi<strong>on</strong>, right-sizing our RREEF business, and complexity reducti<strong>on</strong>s<br />
across functi<strong>on</strong>s and products have restored operating leverage to our platform and positi<strong>on</strong>ed Asset Management<br />
to execute our strategy.<br />
22
In Private Wealth Management, we aim to strengthen our positi<strong>on</strong> in our home market by capitalizing <strong>on</strong> opportunities<br />
such as those offered by our acquisiti<strong>on</strong> of the Sal. Oppenheim Group. In additi<strong>on</strong>, we seek to<br />
strengthen our <strong>on</strong>shore positi<strong>on</strong> in the U.S. market via organic growth opportunities; expedite additi<strong>on</strong>al<br />
growth in emerging markets with a focus <strong>on</strong> Asia Pacific; develop our integrated Ultra High Net Worth<br />
(UHNW) platform; and drive profitability through key cost initiatives.<br />
In Private & Business Clients (PBC), we seek to c<strong>on</strong>tinue to strengthen our leading positi<strong>on</strong> in our home mar-<br />
ket, which has already been advanced by our acquisiti<strong>on</strong>s of Berliner <strong>Bank</strong> and Norisbank in <strong>20</strong>07 and <strong>20</strong>06<br />
respectively. In additi<strong>on</strong>, we aim to further strengthen our advisory banking in mature markets in Europe. In<br />
Asia, we increased our stake in Hua Xia <strong>Bank</strong> to generate further profits from our Asian franchise, and we will<br />
also focus <strong>on</strong> branch expansi<strong>on</strong> in India.<br />
The recent strategic efficiency investments in our platform are designed to result in cost savings. In additi<strong>on</strong><br />
we have entered into an agreement for cooperati<strong>on</strong> with <strong>Deutsche</strong> Postbank, and <strong>on</strong>e with SAP to develop<br />
and implement a new core banking platform. This new core banking platform aims to achieve a high degree of<br />
process standardizati<strong>on</strong>, resulting in sustainable efficiency gains.<br />
We recognize that Asia has become a key driver of revenue growth in our industry. We already have a substantial<br />
presence in Asia, and in the next two years we plan to invest in the regi<strong>on</strong> in order to strengthen our<br />
growth potential and propel us into even better competitive positi<strong>on</strong>s in CIB and GTB. At the same time, we<br />
seek to double the size of our Private Wealth Management business within the regi<strong>on</strong>.<br />
Overall, we aim to reinvigorate our performance culture, recommitting to efficiency across our businesses with<br />
an intense focus <strong>on</strong> costs and infrastructure optimizati<strong>on</strong>. As part of this, and to ensure clear accountability,<br />
we plan to implement new performance metrics and a value-based management system aimed at delivering<br />
higher returns to shareholders. We will c<strong>on</strong>tinue to invest in our corporate culture. Diversity will be integral<br />
from recruitment through to leadership. Talent management will be further embedded into our culture from<br />
career planning to compensati<strong>on</strong> models.<br />
Capital management strategy. Focused management of capital has been a critical part of all phases of our<br />
management agenda. In <str<strong>on</strong>g><strong>20</strong>09</str<strong>on</strong>g>, we increased our Tier 1 capital over the course of the year from € 31.1 billi<strong>on</strong><br />
to € 34.4 billi<strong>on</strong>. At the end of <str<strong>on</strong>g><strong>20</strong>09</str<strong>on</strong>g>, our Tier 1 capital ratio, as measured under Basel II, stood at 12.6 % as<br />
compared to 10.1 % at the end of <strong>20</strong>08.<br />
Our Group Divisi<strong>on</strong>s<br />
Corporate and Investment <strong>Bank</strong> Group Divisi<strong>on</strong><br />
The Corporate and Investment <strong>Bank</strong> Group Divisi<strong>on</strong> primarily serves large and medium-sized corporati<strong>on</strong>s,<br />
financial instituti<strong>on</strong>s and sovereign, public sector and multinati<strong>on</strong>al organizati<strong>on</strong>s. This group divisi<strong>on</strong> generated<br />
67 % of our net revenues in <str<strong>on</strong>g><strong>20</strong>09</str<strong>on</strong>g>, 24 % of our net revenues in <strong>20</strong>08 and 62 % of our net revenues in<br />
<strong>20</strong>07 (<strong>on</strong> the basis of our management reporting systems).<br />
23
<strong>20</strong>-F Item 4: Informati<strong>on</strong> <strong>on</strong> the Company<br />
The Corporate and Investment <strong>Bank</strong> Group Divisi<strong>on</strong>’s operati<strong>on</strong>s are predominantly located in the world’s<br />
primary financial centers, including L<strong>on</strong>d<strong>on</strong>, New York, Frankfurt, Tokyo, Singapore and H<strong>on</strong>g K<strong>on</strong>g.<br />
The businesses that comprise the Corporate and Investment <strong>Bank</strong> Group Divisi<strong>on</strong> seek to reach and sustain<br />
a leading global positi<strong>on</strong> in corporate and instituti<strong>on</strong>al banking services, as measured by financial performance,<br />
market share, reputati<strong>on</strong> and customer franchise, while making optimal usage of, and achieving<br />
optimal return <strong>on</strong>, our capital. The divisi<strong>on</strong> also c<strong>on</strong>tinues to exploit business synergies with the Private<br />
Clients and Asset Management Group Divisi<strong>on</strong> and the Corporate Investments Group Divisi<strong>on</strong>. The Corporate<br />
and Investment <strong>Bank</strong> Group Divisi<strong>on</strong>’s activities and strategy are primarily client-driven. Teams of specialists<br />
in each business divisi<strong>on</strong> give clients access not <strong>on</strong>ly to their own products and services, but also to those of<br />
our other businesses.<br />
At December 31, <str<strong>on</strong>g><strong>20</strong>09</str<strong>on</strong>g>, this group divisi<strong>on</strong> included two corporate divisi<strong>on</strong>s, comprising the following business divisi<strong>on</strong>s:<br />
— Corporate <strong>Bank</strong>ing & Securities Corporate Divisi<strong>on</strong><br />
— Global Markets<br />
— Corporate Finance<br />
— Global Transacti<strong>on</strong> <strong>Bank</strong>ing Corporate Divisi<strong>on</strong><br />
— Trade Finance and Cash Management Corporates<br />
— Trust & Securities Services and Cash Management Financial Instituti<strong>on</strong>s<br />
Corporate <strong>Bank</strong>ing & Securities includes our debt and equity sales and trading businesses, which are housed<br />
in our Global Markets Business Divisi<strong>on</strong>. Global Markets has eight primary business lines and four horiz<strong>on</strong>tally-integrated<br />
client-facing groups (Debt Capital Markets/Corporate Coverage, the Instituti<strong>on</strong>al Client Group,<br />
Research, and the Structuring Group), unified at a local level by str<strong>on</strong>g regi<strong>on</strong>al management. Corporate<br />
<strong>Bank</strong>ing & Securities also includes the Corporate Finance Business Divisi<strong>on</strong>, which focuses <strong>on</strong> providing<br />
advisory, equity and debt financing and structuring services to corporates and financial instituti<strong>on</strong>al clients<br />
and also includes our commercial real estate business. CIB’s client coverage functi<strong>on</strong>s are also a key part of<br />
the Corporate Finance Business Divisi<strong>on</strong>.<br />
Global Transacti<strong>on</strong> <strong>Bank</strong>ing is closely aligned with Corporate Finance, but is a separately managed corporate<br />
divisi<strong>on</strong>, providing trade finance, cash management and trust & securities services.<br />
Corporate <strong>Bank</strong>ing & Securities and Global Transacti<strong>on</strong> <strong>Bank</strong>ing are supported by the Loan Exposure Management<br />
Group (LEMG). LEMG has resp<strong>on</strong>sibility for a range of loan portfolios, actively managing the risk of<br />
these through the implementati<strong>on</strong> of a structured hedging regime. LEMG manages the credit risk of loans and<br />
lending-related commitments related to both our investment-grade portfolio and our medium-sized German<br />
companies portfolio. LEMG has been given the mandate to price and manage risks in the leveraged syndicati<strong>on</strong><br />
pipeline. This is distinct from the originati<strong>on</strong> and syndicati<strong>on</strong> activities which occur within Leveraged Debt<br />
Capital Markets. LEMG has also been given the mandate to manage the risks associated with any new heldto-maturity<br />
leveraged lending, while existing legacy leveraged lending will remain in Corporate Finance.<br />
24
Corporate <strong>Bank</strong>ing & Securities Corporate Divisi<strong>on</strong><br />
Corporate Divisi<strong>on</strong> Overview<br />
Corporate <strong>Bank</strong>ing & Securities is made up of the business divisi<strong>on</strong>s Global Markets and Corporate Finance.<br />
These businesses offer financial products worldwide ranging from the underwriting of stocks and b<strong>on</strong>ds to the<br />
tailoring of structured soluti<strong>on</strong>s for complex financial requirements.<br />
On April 1, <str<strong>on</strong>g><strong>20</strong>09</str<strong>on</strong>g>, management resp<strong>on</strong>sibility for The Cosmopolitan Resort and Casino property changed from<br />
Corporate <strong>Bank</strong>ing & Securities to the group divisi<strong>on</strong> Corporate Investments.<br />
In July <strong>20</strong>07, we announced the acquisiti<strong>on</strong> of Abbey Life Assurance Company Limited, a U.K. company that<br />
c<strong>on</strong>sists primarily of unit-linked life and pensi<strong>on</strong> policies and annuities. The acquisiti<strong>on</strong> was completed in<br />
October <strong>20</strong>07.<br />
Products and Services<br />
The Global Markets Business Divisi<strong>on</strong> is resp<strong>on</strong>sible for originati<strong>on</strong>, sales, financing, structuring and trading<br />
activities across a wide range of fixed income, equity, equity-linked, c<strong>on</strong>vertible b<strong>on</strong>d, foreign exchange and<br />
commodities products. The divisi<strong>on</strong> aims to deliver creative soluti<strong>on</strong>s to the capital-raising, investing, hedging<br />
and other financing needs of customers.<br />
Within our Corporate Finance Business Divisi<strong>on</strong>, our clients are offered mergers and acquisiti<strong>on</strong>s and general<br />
corporate finance advice, together with leveraged debt and equity originati<strong>on</strong> services, and a variety of credit<br />
products and financial services. In additi<strong>on</strong>, we provide a variety of financial services to the public sector.<br />
Corporate Finance also includes coverage functi<strong>on</strong>s related to corporate, financial and instituti<strong>on</strong>al clients<br />
globally.<br />
Within Corporate <strong>Bank</strong>ing & Securities, we c<strong>on</strong>duct trading <strong>on</strong> our own account, in additi<strong>on</strong> to providing products<br />
and services to customers. Most of this trading is undertaken in the normal course of facilitating client<br />
business. For example, to facilitate customer flow business, traders will maintain l<strong>on</strong>g positi<strong>on</strong>s (accumulating<br />
securities) and short positi<strong>on</strong>s (selling securities we do not yet own) in a range of securities and derivative<br />
products, reducing the exposure to hedging transacti<strong>on</strong>s where appropriate. While these activities give rise to<br />
market and other risk, we do not view this as proprietary trading. However, we also undertake activities to<br />
exploit market opportunities outside of our main customer flow businesses, and this is what we term proprietary<br />
trading.<br />
All our trading activities, including proprietary trading, are covered by our risk management procedures and<br />
c<strong>on</strong>trols which are described in detail in “Item 11: Quantitative and Qualitative Disclosures about Credit, Mar-<br />
ket and Other Risk – Market Risk”.<br />
Distributi<strong>on</strong> Channels and Marketing<br />
In the Corporate <strong>Bank</strong>ing & Securities Corporate Divisi<strong>on</strong>, the focus of our corporate and instituti<strong>on</strong>al coverage<br />
bankers and sales teams is <strong>on</strong> our client relati<strong>on</strong>ships. We have structured our client coverage model so<br />
as to provide varying levels of standardized or dedicated services to our customers depending <strong>on</strong> their needs<br />
and level of complexity.<br />
25
<strong>20</strong>-F Item 4: Informati<strong>on</strong> <strong>on</strong> the Company<br />
Global Transacti<strong>on</strong> <strong>Bank</strong>ing Corporate Divisi<strong>on</strong><br />
Corporate Divisi<strong>on</strong> Overview<br />
Global Transacti<strong>on</strong> <strong>Bank</strong>ing delivers commercial banking products and services for corporate clients and<br />
financial instituti<strong>on</strong>s, including domestic and cross-border payments, professi<strong>on</strong>al risk mitigati<strong>on</strong> and financing<br />
for internati<strong>on</strong>al trade, as well as the provisi<strong>on</strong> of trust, agency, depositary, custody and related services. Our<br />
business divisi<strong>on</strong>s include:<br />
— Trade Finance and Cash Management Corporates<br />
— Trust & Securities Services and Cash Management Financial Instituti<strong>on</strong>s<br />
In December <str<strong>on</strong>g><strong>20</strong>09</str<strong>on</strong>g>, we signed a definitive agreement to acquire parts of ABN AMRO’s corporate and commercial<br />
banking activities in the Netherlands. The businesses to be acquired remain the same as those in the<br />
original agreement announced in July <strong>20</strong>08, encompassing a network of 15 ABN AMRO branches: two corporate<br />
client units serving large corporate clients and 13 commercial advisory branches serving medium-sized<br />
clients in the Netherlands. In additi<strong>on</strong>, as part of the transacti<strong>on</strong>, we will acquire the Rotterdam-based bank,<br />
Hollandsche <strong>Bank</strong> Unie N.V., and the Dutch IFN Finance B.V., which provides factoring services. The transacti<strong>on</strong><br />
is expected to be completed in the sec<strong>on</strong>d quarter of <strong>20</strong>10.<br />
In November <str<strong>on</strong>g><strong>20</strong>09</str<strong>on</strong>g>, we closed the acquisiti<strong>on</strong> of Dresdner <strong>Bank</strong>’s Global Agency Securities Lending business<br />
from Commerzbank AG.<br />
In October <strong>20</strong>08, we closed the acquisiti<strong>on</strong> of the operating platform of Pago eTransacti<strong>on</strong> GmbH into the<br />
<strong>Deutsche</strong> Card Services GmbH, based in Germany.<br />
In January <strong>20</strong>08, we acquired HedgeWorks LLC, a hedge fund administrator based in the United States.<br />
In July <strong>20</strong>07, we closed the acquisiti<strong>on</strong> of the instituti<strong>on</strong>al cross-border custody business of Türkiye Garanti<br />
<strong>Bank</strong>asi A.Ş.<br />
Products and Services<br />
Trade Finance offers local expertise, a range of internati<strong>on</strong>al trade products and services, custom-made soluti<strong>on</strong>s<br />
for structured trade and the latest technology across our internati<strong>on</strong>al network so that our clients can<br />
better manage the risks and other issues associated with their cross-border and domestic trades.<br />
Cash Management caters to the needs of a diverse client base of corporates and financial instituti<strong>on</strong>s. With<br />
the provisi<strong>on</strong> of a comprehensive range of innovative and robust soluti<strong>on</strong>s, we handle the complexities of<br />
global and regi<strong>on</strong>al treasury functi<strong>on</strong>s including customer access, payment and collecti<strong>on</strong> services, liquidity<br />
management, informati<strong>on</strong> and account services and electr<strong>on</strong>ic bill presentati<strong>on</strong> and payment soluti<strong>on</strong>s.<br />
Trust & Securities Services provides a range of trust, payment, administrati<strong>on</strong> and related services for<br />
selected securities and financial transacti<strong>on</strong>s, as well as domestic securities custody in more than 30 markets.<br />
26
Distributi<strong>on</strong> Channels and Marketing<br />
The Global Transacti<strong>on</strong> <strong>Bank</strong>ing Corporate Divisi<strong>on</strong> develops and markets its own products and services in<br />
Europe, the Middle East, Asia and the Americas. The marketing is carried out in c<strong>on</strong>juncti<strong>on</strong> with the coverage<br />
functi<strong>on</strong>s both in this divisi<strong>on</strong> and in the Corporate <strong>Bank</strong>ing & Securities Corporate Divisi<strong>on</strong>.<br />
Customers can be differentiated into two main groups: (i) financial instituti<strong>on</strong>s, such as banks, mutual funds<br />
and retirement funds, broker-dealers, fund managers and insurance companies, and (ii) multinati<strong>on</strong>al corpora-<br />
ti<strong>on</strong>s, large local corporates and medium-sized companies, predominantly in Germany.<br />
Private Clients and Asset Management Group Divisi<strong>on</strong><br />
The Private Clients and Asset Management Group Divisi<strong>on</strong> primarily serves retail and small corporate cus-<br />
tomers as well as affluent and wealthy clients and provides asset management services to retail and institu-<br />
ti<strong>on</strong>al clients. This group divisi<strong>on</strong> generated 30 % of our net revenues in <str<strong>on</strong>g><strong>20</strong>09</str<strong>on</strong>g>, 67 % of our net revenues in<br />
<strong>20</strong>08 and 33 % of our net revenues in <strong>20</strong>07 (<strong>on</strong> the basis of our management reporting systems).<br />
At December 31, <str<strong>on</strong>g><strong>20</strong>09</str<strong>on</strong>g>, this group divisi<strong>on</strong> included the following corporate divisi<strong>on</strong>s:<br />
— Asset and Wealth Management (AWM)<br />
— Private & Business Clients (PBC)<br />
The Asset and Wealth Management (AWM) Corporate Divisi<strong>on</strong> c<strong>on</strong>sists of the Asset Management Business<br />
Divisi<strong>on</strong> (AM) and the Private Wealth Management Business Divisi<strong>on</strong> (PWM). AWM Corporate Divisi<strong>on</strong>’s<br />
operati<strong>on</strong>s are located in Europe, Middle East, Africa, the Americas and Asia.<br />
The AWM Corporate Divisi<strong>on</strong> is am<strong>on</strong>g the leading asset managers in the world as measured by total<br />
invested assets. The divisi<strong>on</strong> serves a range of retail, private and instituti<strong>on</strong>al clients.<br />
The Private & Business Clients (PBC) Corporate Divisi<strong>on</strong> serves retail and affluent clients as well as small<br />
corporate customers in our key markets of Germany, Italy and Spain, as well as in Belgium, Portugal and<br />
Poland. This is complemented by our established market presence in India and China.<br />
Asset and Wealth Management Corporate Divisi<strong>on</strong><br />
Corporate Divisi<strong>on</strong> Overview<br />
Our AM Business Divisi<strong>on</strong> is organized into four global business lines:<br />
— Retail offers a range of products, including mutual funds and structured products, across many asset<br />
classes<br />
— Alternative Investments manages real estate and infrastructure investments and private equity funds of funds<br />
— Insurance provides specialist advisory and portfolio management services to insurers and re-insurers<br />
globally<br />
— Instituti<strong>on</strong>al provides investment soluti<strong>on</strong>s across both traditi<strong>on</strong>al and alternative strategies to all other<br />
(n<strong>on</strong>-insurance) instituti<strong>on</strong>al clients, such as pensi<strong>on</strong> funds, endowments and corporates<br />
27
<strong>20</strong>-F Item 4: Informati<strong>on</strong> <strong>on</strong> the Company<br />
Our PWM Business Divisi<strong>on</strong>, which includes wealth management for high net worth clients and ultra high net<br />
worth individuals, their families and selected instituti<strong>on</strong>s, is organized into regi<strong>on</strong>al teams specialized in their<br />
respective regi<strong>on</strong>al markets.<br />
In the sec<strong>on</strong>d half of <str<strong>on</strong>g><strong>20</strong>09</str<strong>on</strong>g>, RREEF announced the decisi<strong>on</strong> to transiti<strong>on</strong> out of the property management<br />
business and assign these services to selected, specialized property management companies. RREEF will<br />
work closely with each third-party manager in our c<strong>on</strong>tinuing role as asset manager for each of the properties,<br />
c<strong>on</strong>centrating <strong>on</strong> the executi<strong>on</strong> of asset business plans, investment strategies and risk management for our<br />
clients’ portfolios.<br />
In October <str<strong>on</strong>g><strong>20</strong>09</str<strong>on</strong>g>, we announced the signing of a framework agreement with the owners of Sal. Oppenheim jr.<br />
& Cie. S.C.A., which allowed us to acquire 100 % of Sal. Oppenheim Group and 94.9 % of BHF Asset Servicing<br />
GmbH (“BAS”) at an expected purchase price of approximately € 1.3 billi<strong>on</strong>. The previous shareholders in<br />
Sal. Oppenheim have the opti<strong>on</strong> of a l<strong>on</strong>g-term shareholding of up to <strong>20</strong> % of the German subsidiary<br />
Sal. Oppenheim KGaA based in Cologne. This transacti<strong>on</strong> will strengthen our positi<strong>on</strong> am<strong>on</strong>g high net worth<br />
private clients, especially in Germany, and the Asset Management business.<br />
In June <str<strong>on</strong>g><strong>20</strong>09</str<strong>on</strong>g>, PWM DB (Suisse) S.A. integrated its wholly-owned subsidiary Rüd, Blass & Cie AG <strong>Bank</strong>-<br />
geschäft in Switzerland.<br />
In May <str<strong>on</strong>g><strong>20</strong>09</str<strong>on</strong>g>, RREEF Private Equity exited its minority stake in Aldus Equity, an alternative asset manage-<br />
ment and advisory boutique specializing in customized private equity investing for instituti<strong>on</strong>al and high net<br />
worth investors previously acquired in July <strong>20</strong>07.<br />
During the first quarter <str<strong>on</strong>g><strong>20</strong>09</str<strong>on</strong>g>, management resp<strong>on</strong>sibility for certain assets changed from the corporate divi-<br />
si<strong>on</strong> AWM to the group divisi<strong>on</strong> Corporate Investments. These assets included Maher Terminals, a c<strong>on</strong>solidated<br />
infrastructure investment, and RREEF Global Opportunity Fund III, a c<strong>on</strong>solidated real estate investment<br />
fund.<br />
In Switzerland PWM enhanced its presence by opening a representative office in St. Moritz in January <str<strong>on</strong>g><strong>20</strong>09</str<strong>on</strong>g><br />
to complement offices in Zurich, Geneva and Lugano.<br />
In December <strong>20</strong>08 RREEF Alternative Investments acquired a significant minority interest in Rosen Real<br />
Estate Securities LLC (RRES), a l<strong>on</strong>g/short real estate investment advisor.<br />
In November <strong>20</strong>08, we acquired a 40 % stake in UFG Invest, the Russian investment management company<br />
of UFG Asset Management, with an opti<strong>on</strong> to become a 100 % owner in the future. The business will be<br />
branded <strong>Deutsche</strong> UFG Capital Management.<br />
In June <strong>20</strong>08, AM sold its Italian life insurance company DWS Vita SpA to Zurich Financial Services Group.<br />
The transacti<strong>on</strong> includes an exclusive 7-year agreement for the distributi<strong>on</strong> of life insurance products via our<br />
financial advisors network in Italy, Finanza & Futuro Banca SpA.<br />
28
Also in June <strong>20</strong>08, AM sold DWS Investments Schweiz AG, c<strong>on</strong>sisting of the Swiss fund administrati<strong>on</strong> business,<br />
to State Street <strong>Bank</strong>.<br />
On June 30, <strong>20</strong>08, AM c<strong>on</strong>solidated Maher Terminal LLC and Maher Terminals of Canada Corp., collectively<br />
and hereafter referred to as Maher Terminals, a privately held operator of port terminal facilities in North<br />
America acquired in July <strong>20</strong>07. RREEF Infrastructure acquired all third party investors’ interests in the North<br />
Americas Infrastructure Fund, whose sole investment was Maher Terminals.<br />
PWM increased its footprint in two large emerging markets with the opening of representative offices in St.<br />
Petersburg, Russia, in April <strong>20</strong>08 and Kolkata, India, in February <strong>20</strong>08.<br />
Effective March <strong>20</strong>08, AM completed the acquisiti<strong>on</strong> of a 60 % interest in Far Eastern Alliance Asset Man-<br />
agement Co. Limited, a Taiwanese investment management firm.<br />
In January <strong>20</strong>08, AM increased its stake in Harvest Fund Management by 10.5 % to 30 %. Harvest is the third<br />
largest mutual fund manager in China, with a 6.0 % market share (source: Z-Ben Advisors, September <strong>20</strong>08).<br />
In July <strong>20</strong>07, AM completed the sale of its local Italian mutual fund business and established l<strong>on</strong>g-term distributi<strong>on</strong><br />
arrangements with our strategic partner, Anima S.G.R.p.A.<br />
In June <strong>20</strong>07, AM closed the sale of part of its Australian business to Aberdeen Asset Management. As a<br />
result of the repositi<strong>on</strong>ing, AM’s Australian operati<strong>on</strong> migrated from being primarily a domestic manufacturing<br />
platform to become a distributi<strong>on</strong> platform with specialist investment management capabilities.<br />
Products and Services<br />
AWM’s portfolio/fund management products include active fund management, passive/quantitative fund management,<br />
alternative investments, discreti<strong>on</strong>ary portfolio management and wealth advisory services.<br />
AM focuses primarily <strong>on</strong> active investing. Its products and services encompass a broad range of investment<br />
strategies and asset classes, and cover many industries and geographic regi<strong>on</strong>s. AM’s product offering<br />
includes mutual funds, structured products, commingled funds and separately managed accounts.<br />
AM’s global retail brand is DWS. The product range of DWS covers all regi<strong>on</strong>s and sectors as well as many<br />
forms and styles of investment. DWS Investments is <strong>on</strong>e of Europe’s leading retail asset managers and is<br />
the largest retail mutual fund management group in Germany (as measured by publicly available invested<br />
asset data, including <strong>Deutsche</strong> <strong>Bank</strong> fund products). DWS also operates in the U.S. and key markets in<br />
Asia/Pacific.<br />
In the Alternative Investments business line, real estate, infrastructure and private equity funds of funds<br />
investment management products and services are offered under the RREEF brand. RREEF is <strong>on</strong>e of the<br />
world’s largest real estate investment organizati<strong>on</strong>s (as reflected by publicly available invested asset data).<br />
29
<strong>20</strong>-F Item 4: Informati<strong>on</strong> <strong>on</strong> the Company<br />
The Insurance platform provides clients with customized investment programs designed to address an insurer’s<br />
specific needs. It offers investment soluti<strong>on</strong>s across multiple asset classes, including traditi<strong>on</strong>al fixed<br />
income, equities, asset allocati<strong>on</strong> services, and alternative asset classes such as hedge funds and real estate.<br />
Instituti<strong>on</strong>al products and services are marketed under the DB Advisors brand. The Instituti<strong>on</strong>al business<br />
offers its clients access to AM’s full range of products and services, including both traditi<strong>on</strong>al and alternative<br />
investments. The single-manager/multi-manager hedge fund business operates within DB Advisors.<br />
PWM provides a fully-integrated service offering for its clients based <strong>on</strong> dynamic strategic asset allocati<strong>on</strong><br />
including individual risk-management according to the clients’ risk/return profile.<br />
PWM offers discreti<strong>on</strong>ary portfolio management, in which our portfolio managers have discreti<strong>on</strong> to manage<br />
clients’ investments within the clients’ general guidelines. The portfolio managers invest client funds in various<br />
investment products, such as stocks, b<strong>on</strong>ds, mutual funds, hedge funds and other alternative investments<br />
including derivatives, where appropriate. In additi<strong>on</strong>, we offer wealth advisory services for actively-involved<br />
clients with customized investment advice via a unique combinati<strong>on</strong> of risk management and portfolio optimizati<strong>on</strong>.<br />
PWM also provides brokerage services in which our relati<strong>on</strong>ship managers and client advisors provide investment<br />
advice to clients but we do not exercise investment discreti<strong>on</strong>. An integrated approach to wealth<br />
management is the core of our advisory services. Our investment advice covers stocks, b<strong>on</strong>ds, mutual funds,<br />
hedge funds and other alternative investments, including derivatives where appropriate. The relati<strong>on</strong>ship<br />
managers also advise their clients <strong>on</strong> the products of third parties in all asset classes. Furthermore, our soluti<strong>on</strong>s<br />
include wealth preservati<strong>on</strong> strategies and successi<strong>on</strong> planning, philanthropic advisory services, art<br />
advisory services, family office soluti<strong>on</strong>s and services for financial intermediaries.<br />
PWM c<strong>on</strong>tinued to expand its offering of alternative investments in <str<strong>on</strong>g><strong>20</strong>09</str<strong>on</strong>g>, especially with respect to innovative<br />
soluti<strong>on</strong>s within the private equity and hedge funds asset classes. Going forward, real estate offerings will be<br />
broadened. PWM generates foreign exchange products, as well as structured investment products in cooperati<strong>on</strong><br />
with the Global Markets Business Divisi<strong>on</strong>.<br />
PWM’s loan/deposit products include traditi<strong>on</strong>al and specialized deposit products (including current accounts,<br />
time deposits and savings accounts) and both standardized and specialized secured and unsecured lending.<br />
It also provides payment, account & remaining financial services, processing and dispositi<strong>on</strong> of cash and n<strong>on</strong>cash<br />
payments in local currency, internati<strong>on</strong>al payments, letters of credit, guarantees, and other cash transacti<strong>on</strong>s.<br />
AWM generates revenues from other products, including direct real estate investments included in our alter-<br />
native investments business, rental revenues and gains and losses earned <strong>on</strong> real estate deal flows and<br />
revenues that are not part of our core business, specifically, the gain <strong>on</strong> sale of businesses.<br />
30
Distributi<strong>on</strong> Channels and Marketing<br />
AM markets our retail products in Germany and other C<strong>on</strong>tinental European countries generally through our<br />
established internal distributi<strong>on</strong> channels in PWM and PBC. We also distribute our funds through other banks,<br />
insurance companies and independent investment advisors. We market our retail funds outside Europe via<br />
our own Asset and Wealth Management distributi<strong>on</strong> channels and through third-party distributors. DWS Investments<br />
distributes its retail products to U.S. investors primarily through financial representatives at major<br />
nati<strong>on</strong>al and regi<strong>on</strong>al wirehouses, independent and bank-based broker dealers, and independent financial<br />
advisors and registered investment advisors.<br />
Products for instituti<strong>on</strong>al clients are distributed through the substantial sales and marketing network within AM<br />
and through third-party distributi<strong>on</strong> channels. They are also distributed through our other businesses, notably<br />
the Corporate and Investment <strong>Bank</strong> Group Divisi<strong>on</strong>.<br />
Alternative investment products are distributed through our sales and marketing network within Asset and<br />
Wealth Management and through third-party distributi<strong>on</strong> channels, predominantly to high net worth clients,<br />
instituti<strong>on</strong>s and retail customers worldwide.<br />
Insurance asset management soluti<strong>on</strong>s are marketed and distributed by AM’s specialist insurance unit, which<br />
provides advisory and portfolio management services for insurers and re-insurers globally.<br />
PWM pursues an integrated business model to cater to the complex needs of high net worth clients and ultra<br />
high net worth individuals, their families and selected instituti<strong>on</strong>s. The relati<strong>on</strong>ship managers work within target<br />
customer groups, assisting clients in developing individual investment strategies and creating enduring<br />
relati<strong>on</strong>ships with our clients.<br />
In our PWM <strong>on</strong>shore business, wealthy customers are served via our relati<strong>on</strong>ship manager network in the<br />
respective countries. Where PBC has a presence, our customers also have access to our retail branch network<br />
and other general banking products. The offshore business encompasses all of our clients who establish<br />
accounts outside their countries of residence. These customers are able to use our offshore services to<br />
access financial products that may not be available in their countries of residence.<br />
In additi<strong>on</strong>, the client advisors of the U.S. Private Client Services business focus <strong>on</strong> traditi<strong>on</strong>al brokerage<br />
offering and asset allocati<strong>on</strong>, including a wide range of third party products.<br />
A major competitive advantage for PWM is the fact that it is a private bank within <strong>Deutsche</strong> <strong>Bank</strong>, with its<br />
leading investment banking, corporate banking and asset management activities. In order to make optimal<br />
use of the potential offered by cross-divisi<strong>on</strong>al cooperati<strong>on</strong>, since <strong>20</strong>07 PWM has established Key Client<br />
Teams in order to serve clients with very complex assets and highly sophisticated needs. PWM offers these<br />
clients the opportunity to make direct additi<strong>on</strong>al purchases, coinvest in its private equity activities or obtain<br />
direct access to its trading units. Many family-owned businesses are increasingly expecting wealth management<br />
and investment banking operati<strong>on</strong>s to work hand in hand. Cooperati<strong>on</strong> with the corporate banking divisi<strong>on</strong><br />
also helps to identify potential PWM clients at a very early stage.<br />
31
<strong>20</strong>-F Item 4: Informati<strong>on</strong> <strong>on</strong> the Company<br />
Private & Business Clients Corporate Divisi<strong>on</strong><br />
Corporate Divisi<strong>on</strong> Overview<br />
The Private & Business Clients Corporate Divisi<strong>on</strong> operates under a single business model across Europe<br />
and selected Asian markets with a focused, sales-driven management structure predominantly under the<br />
<strong>Deutsche</strong> <strong>Bank</strong> brand. PBC serves retail and affluent clients as well as small and medium sized business<br />
customers.<br />
In <str<strong>on</strong>g><strong>20</strong>09</str<strong>on</strong>g>, we c<strong>on</strong>tinued our balanced growth in selected European and Asian markets, supported by a compre-<br />
hensive efficiency program to optimize efficiency in our middle and back offices and increase sales efficiency.<br />
In the German core market, we were able to expand our already str<strong>on</strong>g positi<strong>on</strong> by attracting new customers<br />
and business volume in a challenging market envir<strong>on</strong>ment. Furthermore, in the c<strong>on</strong>text of the acquisiti<strong>on</strong> of a<br />
minority interest in <strong>Deutsche</strong> Postbank AG, we signed a comprehensive business cooperati<strong>on</strong> agreement with<br />
Postbank. The cooperati<strong>on</strong> agreement encompasses financing and investment products, business banking<br />
and commercial loans as well as customer oriented services. Additi<strong>on</strong>ally, the agreement covers areas such<br />
as sourcing and IT infrastructure, and other fields of possible cooperati<strong>on</strong> are c<strong>on</strong>tinually reviewed by both<br />
instituti<strong>on</strong>s.<br />
In our European core markets, we further increased our customer base and c<strong>on</strong>tinued to steadily acquire new<br />
business volume. To cope with the impacts from the financial crisis, we aligned our business strategy, focus-<br />
ing <strong>on</strong> low risk products and advisory services for affluent customers.<br />
The development of PBC in Asia has also maintained momentum. PBC further invested in its strategic part-<br />
nership with Hua Xia <strong>Bank</strong> in China and further increased its shareholding from 13.7 % to 17.1 % by exercis-<br />
ing the existing call opti<strong>on</strong> with Sal. Oppenheim, investing € 82 milli<strong>on</strong>. The transacti<strong>on</strong> was signed in Novem-<br />
ber <str<strong>on</strong>g><strong>20</strong>09</str<strong>on</strong>g> and is pending approval from the Chinese regulators expected for the end of the first quarter of<br />
<strong>20</strong>10. Additi<strong>on</strong>ally, as part of the strategic partnership, we and Hua Xia <strong>Bank</strong> have jointly developed and dis-<br />
tributed credit cards in China since June <strong>20</strong>07. Moreover, PBC has currently three branches in China and<br />
thirteen branches in India with the target of c<strong>on</strong>tinuous expansi<strong>on</strong>s. Our 10 % stake in Habubank in Vietnam,<br />
including a business cooperati<strong>on</strong> arrangement, further dem<strong>on</strong>strates PBC's c<strong>on</strong>fidence in the growth potential<br />
of Asia.<br />
Products and Services<br />
PBC offers a similar range of banking products and services throughout Europe and Asia, with some variati<strong>on</strong>s<br />
am<strong>on</strong>g countries that are driven by local market, regulatory and customer requirements.<br />
In offering portfolio/fund management and brokerage services, we provide investment advice, brokerage services,<br />
discreti<strong>on</strong>ary portfolio management and securities custody services to our clients.<br />
We provide loan and deposit services, with the most significant being property financing (including mortgages)<br />
and c<strong>on</strong>sumer and commercial loans, as well as traditi<strong>on</strong>al current accounts, savings accounts and<br />
time deposits. The property finance business, which includes mortgages and c<strong>on</strong>structi<strong>on</strong> finance, is our most<br />
32
significant lending business. We provide property finance loans primarily for private purposes, such as home<br />
financing. Most of our mortgages have an original fixed interest period of five or ten years. Loan and deposit<br />
products also include the home loan and savings business in Germany, offered through our subsidiary<br />
<strong>Deutsche</strong> <strong>Bank</strong> Bauspar AG.<br />
PBC’s payments, account & remaining financial services c<strong>on</strong>sist of administrati<strong>on</strong> of current accounts in local<br />
and foreign currency as well as settlement of domestic and cross-border payments <strong>on</strong> these accounts. They<br />
also include the purchase and sale of payment media and the sale of insurance products, home loan and<br />
savings c<strong>on</strong>tracts and credit cards. In <str<strong>on</strong>g><strong>20</strong>09</str<strong>on</strong>g>, we strengthened our focus <strong>on</strong> gathering deposits, resulting in a<br />
significant increase in assets under management.<br />
Other products include primarily activities related to asset and liability management.<br />
Distributi<strong>on</strong> Channels and Marketing<br />
To achieve a str<strong>on</strong>g brand positi<strong>on</strong> internati<strong>on</strong>ally, we market our services c<strong>on</strong>sistently throughout the European<br />
and Asian countries in which PBC is active. In order to make banking products and services more<br />
attractive to clients, we seek to optimize the accessibility and availability of our services. To accomplish this,<br />
we look to self-service functi<strong>on</strong>s and technological advances to supplement our branch network with an array<br />
of access channels to PBC’s products and services. These channels c<strong>on</strong>sist of the following in-pers<strong>on</strong> and<br />
remote distributi<strong>on</strong> points:<br />
— Investment and Finance Centers. Investment and Finance Centers offer our entire range of products and<br />
advice. In <str<strong>on</strong>g><strong>20</strong>09</str<strong>on</strong>g>, several of our Investment and Finance Centers were refurbished according to innovative<br />
c<strong>on</strong>cepts which illustrate how we see branch banking in the future and which were introduced and tested<br />
in our flagship “Branch of the future – Q 110” in Berlin.<br />
— Financial Agents. In most countries, we market our retail banking products and services through self-<br />
employed financial agents.<br />
— Call Centers. Call centers provide clients with remote services supported by automated systems. Remote<br />
services include access to account informati<strong>on</strong>, securities brokerage and other basic banking transacti<strong>on</strong>s.<br />
— Internet. On our website, we offer clients brokerage services, account informati<strong>on</strong> and product informati<strong>on</strong><br />
<strong>on</strong> proprietary and third-party investment products. These offerings are complemented with services that<br />
provide informati<strong>on</strong>, analysis tools and c<strong>on</strong>tent to support the client in making independent investment<br />
decisi<strong>on</strong>s.<br />
— Self-service Terminals. These terminals support our branch network and allow clients to withdraw and<br />
transfer funds, receive custody account statements and make appointments with our financial advisors.<br />
In additi<strong>on</strong> to our branch network and financial agents, we enter into country-specific distributi<strong>on</strong> arrangements.<br />
In Germany, for example, we have a cooperati<strong>on</strong> agreement with <strong>Deutsche</strong> Vermögensberatung AG<br />
(referred to as DVAG) whereby we distribute our mutual funds and other banking products through DVAG’s<br />
independent distributi<strong>on</strong> network. We also work together with ADAC (Germany’s and Europe’s largest automobile<br />
club with more than 15 milli<strong>on</strong> members), with whom we have an exclusive sales cooperati<strong>on</strong> agreement<br />
in place. In <str<strong>on</strong>g><strong>20</strong>09</str<strong>on</strong>g>, we started a cooperati<strong>on</strong> with Vodaf<strong>on</strong>e enabling both parties to benefit from each<br />
other’s customer base. In order to complement our product range, we have signed distributi<strong>on</strong> agreements, in<br />
33
<strong>20</strong>-F Item 4: Informati<strong>on</strong> <strong>on</strong> the Company<br />
which PBC distributes the products of reputable product suppliers. These include an agreement with Zurich<br />
Financial Services for insurance products, and a strategic alliance with nine fund companies for the distributi<strong>on</strong><br />
of their investment products.<br />
Corporate Investments Group Divisi<strong>on</strong><br />
The Corporate Investments Group Divisi<strong>on</strong> manages our global principal investment activities. The principal<br />
investment activities include our industrial holdings, certain private equity and venture capital investments,<br />
private equity fund investments, certain corporate real estate investments, our minority stake in<br />
<strong>Deutsche</strong> Postbank AG, certain credit exposures and certain other n<strong>on</strong>-strategic investments. Historically, its<br />
missi<strong>on</strong> has been to provide financial, strategic, operati<strong>on</strong>al and managerial capital to enhance the values of<br />
the portfolio companies in which the group divisi<strong>on</strong> has invested.<br />
We believe that the group divisi<strong>on</strong> enhances the bank’s portfolio management and risk management capability.<br />
Corporate Investments held interests in a number of manufacturing and financial services corporati<strong>on</strong>s (our<br />
“Industrial Holdings”) which were to a large extent sold during the last years. The largest remaining positi<strong>on</strong>s<br />
of these Industrial Holdings by market value at December 31, <str<strong>on</strong>g><strong>20</strong>09</str<strong>on</strong>g> were interests of 5.75 % in Germany1<br />
Acquisiti<strong>on</strong> Limited, a special purpose acquisiti<strong>on</strong> company, and 0.75 % in European Aer<strong>on</strong>autic Defence and<br />
Space Company EADS N.V. via our 10 % holding in Dedalus GmbH & Co. KGaA.<br />
In <str<strong>on</strong>g><strong>20</strong>09</str<strong>on</strong>g>, we reduced our investment in Daimler AG from 2.7 % to 0.04 % and sold our remaining stake in<br />
Linde AG.<br />
In <strong>20</strong>08, we reduced our investment in Daimler AG from 4.4 % to 2.7 % and our investment in Linde AG from<br />
5.2 % to 2.4 %. We sold our remaining stake in Allianz SE and our investment in Arcor AG & Co. KG.<br />
In July <strong>20</strong>08, we acquired a 7.6 % stake in Germany1 Acquisiti<strong>on</strong> Ltd., a vehicle established for the purpose of<br />
acquiring ownership in companies in Germany, Austria and Switzerland.<br />
In February <strong>20</strong>07, we signed a c<strong>on</strong>tract to acquire a 10 % stake in Dedalus GmbH & Co. KGaA, ec<strong>on</strong>omically<br />
representing a 0.75 % participati<strong>on</strong> in European Aer<strong>on</strong>autic Defence and Space Company EADS N.V. The<br />
transacti<strong>on</strong> closed in March <strong>20</strong>07.<br />
In <strong>20</strong>07, we reduced our investment in Linde AG from 7.8 % to 5.2 % and our investment in Allianz SE from<br />
2.2 % to 1.7 %.<br />
On February 25, <str<strong>on</strong>g><strong>20</strong>09</str<strong>on</strong>g>, we completed the acquisiti<strong>on</strong> of a minority stake in <strong>Deutsche</strong> Postbank AG, <strong>on</strong>e of<br />
Germany’s major financial service providers. As of that date, we also entered into a mandatorily-exchangeable<br />
b<strong>on</strong>d as well as opti<strong>on</strong>s to increase our stake in the future.<br />
34
In February <str<strong>on</strong>g><strong>20</strong>09</str<strong>on</strong>g>, Corporate Investments participated in a liquidity facility for Sicherungseinrichtungsgesellschaft<br />
deutscher <strong>Bank</strong>en mbH (“SdB”) acquiring € 2.3 billi<strong>on</strong> of ECB-eligible notes guaranteed by SoFFin.<br />
In December <str<strong>on</strong>g><strong>20</strong>09</str<strong>on</strong>g>, the existing liquidity facility for <strong>Deutsche</strong> Pfandbriefbank AG (formerly Hypo Real Estate<br />
<strong>Bank</strong> AG) in which we participated in November <strong>20</strong>08 with € 12.0 billi<strong>on</strong> was fully repaid, at which point we<br />
participated in a new liquidity facility for <strong>Deutsche</strong> Pfandbriefbank AG by subscribing to € 9.2 billi<strong>on</strong> of ECBeligible<br />
notes fully guaranteed by SoFFin.<br />
Corporate Investments also holds certain private equity type investments that have been transacted both <strong>on</strong><br />
behalf of clients and for our own account, directly and through private equity funds, including venture capital<br />
opportunities and leveraged buy-out funds.<br />
In <str<strong>on</strong>g><strong>20</strong>09</str<strong>on</strong>g>, Corporate Investments further reduced the legacy private equity <strong>on</strong>-balance sheet exposure by<br />
€ 55 milli<strong>on</strong> due to various transacti<strong>on</strong>s.<br />
On April 1, <str<strong>on</strong>g><strong>20</strong>09</str<strong>on</strong>g>, management resp<strong>on</strong>sibility for The Cosmopolitan Resort and Casino property changed from<br />
CB&S to Corporate Investments.<br />
During the first quarter of <str<strong>on</strong>g><strong>20</strong>09</str<strong>on</strong>g>, management resp<strong>on</strong>sibility for certain assets changed from AWM to Corpo-<br />
rate Investments. These assets included Maher Terminals, a c<strong>on</strong>solidated infrastructure investment, and<br />
RREEF Global Opportunity Fund III, a c<strong>on</strong>solidated real estate investment fund.<br />
In <strong>20</strong>08, we c<strong>on</strong>tinued to reduce our private equity <strong>on</strong>-balance sheet exposure in Corporate Investments, with<br />
holdings declining by approximately € <strong>20</strong>0 milli<strong>on</strong> due to various transacti<strong>on</strong>s.<br />
In <strong>20</strong>07, we sold a portfolio of Latin America direct private equity investments and our investment in<br />
Od<strong>on</strong>toprev.<br />
The Corporate Investments’ portfolio also covers certain real estate holdings, many of which we occupy.<br />
In <strong>20</strong>07, we sold and leased back the bank-occupied building 60 Wall Street in New York City. In additi<strong>on</strong>, we<br />
disposed of our interest in the building at 31 West 52nd Street in New York City.<br />
In <strong>20</strong>07, we reduced our stake in HCL Technologies Limited from 2.4 % to 1.2 % in a partial sale.<br />
Infrastructure and Regi<strong>on</strong>al Management<br />
The infrastructure group c<strong>on</strong>sists of our centralized business support areas and our Corporate Center. These<br />
areas principally comprise c<strong>on</strong>trol and service functi<strong>on</strong>s supporting the CIB, PCAM and CI businesses. The<br />
Corporate Center comprises those functi<strong>on</strong>s that directly support the Management Board in its management<br />
of the Group.<br />
35
<strong>20</strong>-F Item 4: Informati<strong>on</strong> <strong>on</strong> the Company<br />
This infrastructure group is organized to reflect the areas of resp<strong>on</strong>sibility of those Management Board members<br />
that are not in charge of a specific business line. The Infrastructure group is organized into COO functi<strong>on</strong>s<br />
(e.g., informati<strong>on</strong> technology, transacti<strong>on</strong>al and other business services, global sourcing, corporate real<br />
estate services and human resources), CFO functi<strong>on</strong>s (e.g., finance, tax, audit, insurance and group strategy<br />
& planning), CRO functi<strong>on</strong>s (e.g., risk management, treasury, legal and compliance), and CEO functi<strong>on</strong>s<br />
(e.g., communicati<strong>on</strong>s & corporate social resp<strong>on</strong>sibility and ec<strong>on</strong>omics).<br />
The Regi<strong>on</strong>al Management functi<strong>on</strong> covers regi<strong>on</strong>al resp<strong>on</strong>sibilities worldwide. It focuses <strong>on</strong> governance,<br />
franchise development and performance development. Regi<strong>on</strong>al and country heads and management committees<br />
are established in the regi<strong>on</strong>s to enhance client-focused product coordinati<strong>on</strong> across businesses and<br />
to ensure compliance with regulatory and c<strong>on</strong>trol requirements, both from a local and Group perspective. In<br />
additi<strong>on</strong> the Regi<strong>on</strong>al Management functi<strong>on</strong> represents regi<strong>on</strong>al interests at the Group level and enhances<br />
cross-regi<strong>on</strong>al coordinati<strong>on</strong>.<br />
All expenses and revenues incurred within the Infrastructure and Regi<strong>on</strong>al Management areas are fully allocated<br />
to the Group Divisi<strong>on</strong>s CIB, PCAM and CI.<br />
The Competitive Envir<strong>on</strong>ment<br />
The financial services industries, and all of our businesses, are intensely competitive, and we expect them to<br />
remain so. Our main competitors are other commercial banks, savings banks, other public sector banks, brokers<br />
and dealers, investment banking firms, insurance companies, investment advisors, mutual funds and<br />
hedge funds. We compete with some of our competitors globally and with some others <strong>on</strong> a regi<strong>on</strong>al, product<br />
or niche basis. We compete <strong>on</strong> the basis of a number of factors, including the quality of client relati<strong>on</strong>ships,<br />
transacti<strong>on</strong> executi<strong>on</strong>, our products and services, innovati<strong>on</strong>, reputati<strong>on</strong> and price.<br />
New Competitor Landscape<br />
In <strong>20</strong>08, the banking sector witnessed substantial c<strong>on</strong>solidati<strong>on</strong> and merger activity, some of which occurred<br />
against a backdrop of significant losses in certain financial instituti<strong>on</strong>s resulting from exposure to troubled<br />
assets. There was a decisive shift away from the large, independent, broker-dealer business model as some<br />
were acquired by large, integrated banks, others chose to become bank holding companies, and <strong>on</strong>e collapsed<br />
in September <strong>20</strong>08.<br />
Following a period of acute stress in capital markets and interbank lending, remaining banks came under<br />
increasing pressure due to deteriorating asset values al<strong>on</strong>gside a worsening credit envir<strong>on</strong>ment as the financial<br />
crisis spread to the wider ec<strong>on</strong>omy. As a result, central banks and governments intervened <strong>on</strong> an unprecedented<br />
scale, injecting liquidity into key markets and recapitalizing the most affected banks through direct<br />
equity investments. Many other banks were forced to raise capital from other sources in order to restore strategic<br />
flexibility. <strong>Bank</strong>s that received direct capital assistance from governments or central banks were required<br />
in some instances to make commitments, such as to increase lending to certain categories of borrowers,<br />
adjust their strategies, suspend their dividends and other profit distributi<strong>on</strong>s and limit the compensati<strong>on</strong> of<br />
their executives.<br />
36
In <str<strong>on</strong>g><strong>20</strong>09</str<strong>on</strong>g>, the post-crisis envir<strong>on</strong>ment has presented opportunities for those banks that did not participate in<br />
c<strong>on</strong>solidati<strong>on</strong> activity and some have emerged str<strong>on</strong>ger as a result of the crisis. The competitor landscape<br />
has been transformed as some global banks no l<strong>on</strong>ger exist while others are restricted to de-risking and retrenching<br />
to focus <strong>on</strong> their core businesses in core markets rather than <strong>on</strong> growth initiatives. <strong>Bank</strong>s that did<br />
not receive direct capital assistance as described above in many cases were able to preserve greater aut<strong>on</strong>omy<br />
in their strategy, lending and compensati<strong>on</strong> strategies. To the extent these banks also have been able to<br />
maintain adequate capital and the ability to absorb deteriorating credit quality, they may have competitive<br />
advantages to gain market share in the changing landscape.<br />
In Germany, the retail banking market remains fragmented and our competitive envir<strong>on</strong>ment remains influenced<br />
by the three pillar system of private banks, public banks and cooperative banks. However, following<br />
recent c<strong>on</strong>solidati<strong>on</strong> activity, particularly am<strong>on</strong>g public regi<strong>on</strong>al commercial banks (“Landesbanken”) and<br />
private banks, competitive intensity has increased. The merger of the sec<strong>on</strong>d and third largest private sector<br />
banks, together with an infusi<strong>on</strong> of capital into the combined entity by the German government, will affect the<br />
domestic competitive landscape and further increase c<strong>on</strong>centrati<strong>on</strong>.<br />
Regulatory Reform<br />
In resp<strong>on</strong>se to the financial markets crisis, governments, regulatory authorities and others have made and<br />
c<strong>on</strong>tinue to make numerous proposals to reform the regulatory framework for the financial services industry to<br />
enhance its resilience against future crises. The wide range of current proposals includes, am<strong>on</strong>g others,<br />
— Revising regulatory capital standards to require more capital in some cases, such as <strong>on</strong> trading book posi-<br />
ti<strong>on</strong>s, in particular those resulting from securitizati<strong>on</strong> transacti<strong>on</strong>s, or for instituti<strong>on</strong>s that are of particular<br />
importance for the smooth functi<strong>on</strong>ing of the financial system more generally;<br />
— Tightening and modifying the definiti<strong>on</strong> of capital for regulatory purposes;<br />
— Introducing a maximum ratio of capital to total assets (leverage ratio);<br />
— Enhancing regulatory liquidity requirements;<br />
— Placing limits and restricti<strong>on</strong>s <strong>on</strong> compensati<strong>on</strong> practices;<br />
— Charging special levies and c<strong>on</strong>tributi<strong>on</strong>s to fund governmental interventi<strong>on</strong> during the current crisis or in<br />
the event of future interventi<strong>on</strong>s;<br />
— Expanding the powers of regulators to restructure financial instituti<strong>on</strong>s that are in distress;<br />
— Separating certain businesses such as proprietary trading from deposit taking, in some cases requiring the<br />
split-up of instituti<strong>on</strong>s;<br />
— Breaking up financial instituti<strong>on</strong>s that are perceived to be too large for regulators to take the risk of their<br />
failure;<br />
— Encouraging banks to formulate “living wills” to prevent systemic impact from collapse; and<br />
— Reforming market infrastructures.<br />
37
<strong>20</strong>-F Item 4: Informati<strong>on</strong> <strong>on</strong> the Company<br />
The extent of such interventi<strong>on</strong> measures is unclear at this stage, as is the degree of internati<strong>on</strong>al coordinati<strong>on</strong><br />
and risk of competitive distorti<strong>on</strong>s. However, there is no doubt that there will be significant implicati<strong>on</strong>s for<br />
the wider banking industry. These will include increased pressure <strong>on</strong> balance sheet size and profitability, an<br />
imperative to improve risk management procedures and disclosure of exposures, as well as the alignment<br />
between l<strong>on</strong>g-term performance and compensati<strong>on</strong> structures. Capital, risk management and balance sheet<br />
utilizati<strong>on</strong> will therefore become increasingly important as competitive differentiators. Those banks which are<br />
well-capitalized and streamlined will be better-positi<strong>on</strong>ed to capture market share and extract sustainable<br />
growth opportunities from the changing landscape.<br />
We recognize that our c<strong>on</strong>tinued ability to compete effectively in our businesses depends <strong>on</strong> our ability to<br />
attract new employees and to retain and motivate our existing employees. We are firmly committed to aligning<br />
compensati<strong>on</strong> with sustained firm-wide profitability, c<strong>on</strong>sidering overall risk while attracting and retaining the<br />
best talent in a competitive labor market. We are also committed to full compliance with the recently announced<br />
G<strong>20</strong> compensati<strong>on</strong> guidelines for banks and other financial instituti<strong>on</strong>s designed to rein in risks by<br />
aligning rewards with l<strong>on</strong>g-term success. We c<strong>on</strong>tinue to work <strong>on</strong> developing our methodology for reflecting<br />
risk in performance measurement, implementing deferred compensati<strong>on</strong> mechanisms and establishing sound<br />
governance standards for the overall compensati<strong>on</strong> process.<br />
Climate Change<br />
Climate change has become a topic of intense public discussi<strong>on</strong> in recent years. This discussi<strong>on</strong> also<br />
includes the financial services industry, in particular in c<strong>on</strong>necti<strong>on</strong> with projects that are perceived as c<strong>on</strong>tributing<br />
to or mitigating climate change. Projects and products that are perceived as c<strong>on</strong>tributing to climate<br />
change or other negative envir<strong>on</strong>mental or social impacts, as well as their financing and other services for<br />
these projects, are being reviewed more critically by investors, customers, envir<strong>on</strong>mental authorities, n<strong>on</strong>governmental<br />
organizati<strong>on</strong>s and others. Where our own assessment of these issues so indicates, we may<br />
abstain from participating in such projects. By c<strong>on</strong>trast, projects and products that aim to mitigate climate<br />
change are increasingly seeking financing and other financial services; these offer growth opportunities for<br />
many of our businesses. Moreover, we note that investors, customers and others increasingly take the overall<br />
approach of companies to climate change, including the direct and indirect carb<strong>on</strong> emissi<strong>on</strong>s of their operati<strong>on</strong>s,<br />
into c<strong>on</strong>siderati<strong>on</strong> in their decisi<strong>on</strong>s, even where such emissi<strong>on</strong>s are minimal. We have undertaken a<br />
number of measures to reduce our carb<strong>on</strong> emissi<strong>on</strong>s over time, such as a comprehensive renovati<strong>on</strong> of our<br />
world headquarters in Germany to bring the energy efficiency of these buildings to the highest possible level<br />
for similarly-situated office towers.<br />
Competiti<strong>on</strong> in Our Businesses<br />
Corporate and Investment <strong>Bank</strong> Group Divisi<strong>on</strong><br />
Our investment banking operati<strong>on</strong> competes in domestic and internati<strong>on</strong>al markets in Europe, the Americas<br />
and Asia Pacific. Competitors include bank holding companies, investment advisors, brokers and dealers in<br />
securities and commodities, securities brokerage firms and certain commercial banks. Within Germany and<br />
other European countries, our competitors also include German private universal banks, public state banks<br />
and foreign banks.<br />
38
Private Clients and Asset Management Group Divisi<strong>on</strong><br />
In the retail banking business we face intense competiti<strong>on</strong> from savings banks and cooperative banks, other<br />
universal banks, insurance companies, home loan and savings companies and other financial intermediaries.<br />
In Germany, savings and cooperative banks form our biggest group of competitors. These banks generally<br />
operate regi<strong>on</strong>ally. In other European countries, private universal banks and savings banks are our main<br />
competitors. The large Asian markets (India and China), where we have opened a limited number of retail<br />
branches, are dominated by local public and private sector banks. However, with deregulati<strong>on</strong>, internati<strong>on</strong>al<br />
financial instituti<strong>on</strong>s are likely to increase their investments in these markets and thereby intensify competiti<strong>on</strong>.<br />
Our private wealth management business faces competiti<strong>on</strong> from the private banking and wealth manage-<br />
ment units of other global and regi<strong>on</strong>al financial service companies and from investment banks.<br />
Our main competitors in the asset management business are asset management subsidiaries of major financial<br />
services companies and large stand-al<strong>on</strong>e retail and instituti<strong>on</strong>al asset managers. Most of our main<br />
competitors are headquartered in Europe or the United States, though many operate globally.<br />
Regulati<strong>on</strong> and Supervisi<strong>on</strong><br />
Our operati<strong>on</strong>s throughout the world are regulated and supervised by the relevant authorities in each of the<br />
jurisdicti<strong>on</strong>s where we c<strong>on</strong>duct business. Such regulati<strong>on</strong> relates to licensing, capital adequacy, liquidity, risk<br />
c<strong>on</strong>centrati<strong>on</strong>, c<strong>on</strong>duct of business as well as organizati<strong>on</strong>al and reporting requirements. It affects the type<br />
and scope of the business we c<strong>on</strong>duct in a country and how we structure specific operati<strong>on</strong>s. Currently and in<br />
reacti<strong>on</strong> to the crisis in the financial markets, significant changes in the regulatory envir<strong>on</strong>ment c<strong>on</strong>tinue to be<br />
under c<strong>on</strong>siderati<strong>on</strong> in the jurisdicti<strong>on</strong>s in which we operate. While the extent and nature of these changes<br />
cannot be predicted now, they may include an increase in regulatory oversight and enhanced prudential standards<br />
relating to capital, liquidity, employee compensati<strong>on</strong>, limitati<strong>on</strong>s <strong>on</strong> activities, and other aspects of our<br />
operati<strong>on</strong>s that may have a material effect <strong>on</strong> our businesses and the services and products that we will be<br />
able to offer.<br />
In the following secti<strong>on</strong>s, we present a descripti<strong>on</strong> of the supervisi<strong>on</strong> of our business by the authorities in<br />
Germany, our home market, the European Ec<strong>on</strong>omic Area, and in the U.S., which we view as the most significant<br />
for us. Bey<strong>on</strong>d these regi<strong>on</strong>s, local country regulati<strong>on</strong>s generally have limited impact <strong>on</strong> our operati<strong>on</strong>s<br />
that are unc<strong>on</strong>nected with these countries.<br />
Regulati<strong>on</strong> and Supervisi<strong>on</strong> in Germany – Basic Principles<br />
We are authorized to c<strong>on</strong>duct banking business and to provide financial services as set forth in the German<br />
<strong>Bank</strong>ing Act (Kreditwesengesetz). We are subject to comprehensive regulati<strong>on</strong> and supervisi<strong>on</strong> by the German<br />
Federal Financial Supervisory Authority (Bundesanstalt für Finanzdienstleistungsaufsicht, referred to as<br />
BaFin) and the <strong>Deutsche</strong> Bundesbank (referred to as Bundesbank), the German central bank.<br />
The BaFin is a federal regulatory authority and reports to the German Federal Ministry of Finance. It supervises<br />
the operati<strong>on</strong>s of German banks to ensure that they are in compliance with the <strong>Bank</strong>ing Act and other<br />
applicable German laws and regulati<strong>on</strong>s. The Bundesbank supports the BaFin and closely cooperates with it.<br />
39
<strong>20</strong>-F Item 4: Informati<strong>on</strong> <strong>on</strong> the Company<br />
The cooperati<strong>on</strong> includes the <strong>on</strong>going review and evaluati<strong>on</strong> of reports submitted by us and of our audit reports<br />
as well as assessments of the adequacy of our capital base and risk management systems. The BaFin<br />
and the Bundesbank require German banks to file comprehensive informati<strong>on</strong> in order to m<strong>on</strong>itor compliance<br />
with applicable legal requirements and to obtain informati<strong>on</strong> <strong>on</strong> the financial c<strong>on</strong>diti<strong>on</strong> of banks.<br />
Generally, supervisi<strong>on</strong> by the BaFin and the Bundesbank applies <strong>on</strong> an unc<strong>on</strong>solidated basis (company <strong>on</strong>ly)<br />
and <strong>on</strong> a c<strong>on</strong>solidated basis (the company and the entities c<strong>on</strong>solidated with it for German regulatory purposes).<br />
Parent banks of a c<strong>on</strong>solidated group may waive the applicati<strong>on</strong> of capital adequacy requirements,<br />
large exposure limits and certain organizati<strong>on</strong>al requirements <strong>on</strong> an unc<strong>on</strong>solidated basis if certain c<strong>on</strong>diti<strong>on</strong>s<br />
are met. We meet these c<strong>on</strong>diti<strong>on</strong>s and have waived applicati<strong>on</strong> of these rules since January 1, <strong>20</strong>07.<br />
We are materially in compliance with the German laws that are applicable to our business.<br />
The <strong>Bank</strong>ing Act<br />
The <strong>Bank</strong>ing Act c<strong>on</strong>tains the principal rules for German banks, including the requirements for a banking<br />
license, and regulates the business activities of German banks. In particular it requires that an enterprise that<br />
engages in <strong>on</strong>e or more of the activities defined in the <strong>Bank</strong>ing Act as “banking business” or “financial services”<br />
in Germany must be licensed as a “credit instituti<strong>on</strong>” (Kreditinstitut) or “financial services instituti<strong>on</strong>”<br />
(Finanzdienstleistungsinstitut), as the case may be. We are licensed as a credit instituti<strong>on</strong>.<br />
The <strong>Bank</strong>ing Act and the rules and regulati<strong>on</strong>s adopted thereunder implement certain European Uni<strong>on</strong> directives<br />
relating to banks. These directives reflect recommendati<strong>on</strong>s of the Basel Committee <strong>on</strong> <strong>Bank</strong>ing Supervisi<strong>on</strong><br />
and address issues such as accounting standards, regulatory capital, risk-based capital adequacy,<br />
c<strong>on</strong>solidated supervisi<strong>on</strong> and the m<strong>on</strong>itoring and c<strong>on</strong>trol of large exposures. As a result of the increased risk<br />
sensitivity of the currently applicable capital framework, which is based up<strong>on</strong> the Basel II capital framework<br />
of <strong>20</strong>04, capital requirements are more cyclical than in the past and may also increase compared to levels<br />
before applicati<strong>on</strong> of the Basel II framework in times of ec<strong>on</strong>omic downturn.<br />
The German Securities Trading Act<br />
Under the German Securities Trading Act (Wertpapierhandelsgesetz), the BaFin regulates and supervises<br />
securities trading in Germany. The Securities Trading Act prohibits, am<strong>on</strong>g other things, insider trading with<br />
respect to securities admitted to trading <strong>on</strong>, or included in the regulated market or the over-the-counter market<br />
at a German exchange, or admitted to trading <strong>on</strong> an organized market in another country that is a member<br />
state of the European Uni<strong>on</strong> or another c<strong>on</strong>tracting state of the Agreement <strong>on</strong> the European Ec<strong>on</strong>omic Area.<br />
The Securities Trading Act also c<strong>on</strong>tains rules of c<strong>on</strong>duct. These rules of c<strong>on</strong>duct apply to all businesses that<br />
provide securities services. Securities services include, in particular, the purchase and sale of securities or<br />
derivatives for others and the intermediati<strong>on</strong> of transacti<strong>on</strong>s in securities or derivatives and certain types of<br />
investment advice. The BaFin has broad powers to investigate businesses providing securities services to<br />
m<strong>on</strong>itor their compliance with the rules of c<strong>on</strong>duct and the reporting requirements. In additi<strong>on</strong>, the Securities<br />
Trading Act requires an independent auditor to perform an annual audit of the securities services provider’s<br />
compliance with its obligati<strong>on</strong>s under the Securities Trading Act.<br />
40
Capital Adequacy Requirements<br />
The <strong>Bank</strong>ing Act and the Solvency Regulati<strong>on</strong> issued by the BaFin thereunder reflect the capital adequacy<br />
rules of Basel II and require German banks to maintain an adequate level of regulatory capital in relati<strong>on</strong> to<br />
their risk positi<strong>on</strong>s. Risk positi<strong>on</strong>s (comm<strong>on</strong>ly referred to as “risk-weighted assets” or “RWA”) comprise credit<br />
risks, market risks and operati<strong>on</strong>al risks (comprising, am<strong>on</strong>g other things, risks related to certain external<br />
factors, as well as to technical errors and errors of employees). Credit risks and operati<strong>on</strong>al risks must be<br />
covered with Tier 1 capital (“core capital”) and Tier 2 capital (“supplementary capital”) (together, “regulatory<br />
banking capital”). Market risk must be covered with regulatory banking capital (to the extent not required to<br />
cover credit and operati<strong>on</strong>al risk) and Tier 3 capital (together with regulatory banking capital, “own funds”).<br />
Under certain circumstances, the BaFin may impose capital requirements <strong>on</strong> individual banks which are more<br />
stringent than statutory requirements. For details of our regulatory capital see Note [36] to the c<strong>on</strong>solidated<br />
financial statements.<br />
Limitati<strong>on</strong>s <strong>on</strong> Large Exposures<br />
The <strong>Bank</strong>ing Act and the Large Exposure Regulati<strong>on</strong> (Großkredit- und Milli<strong>on</strong>enkreditverordnung) limit a<br />
bank’s c<strong>on</strong>centrati<strong>on</strong> of credit risks through restricti<strong>on</strong>s <strong>on</strong> large exposures (Großkredite). All exposures to<br />
a single customer (and customers c<strong>on</strong>nected with it) are aggregated for these purposes.<br />
An exposure incurred in the banking book that equals or exceeds 10 % of the bank’s regulatory banking capital<br />
c<strong>on</strong>stitutes a banking book large exposure. A banking book and trading book exposure taken together that<br />
equals or exceeds 10 % of the bank’s own funds c<strong>on</strong>stitutes an aggregate book large exposure. No large<br />
exposure may exceed 25 % of the bank’s regulatory banking capital or own funds, as applicable. Where the<br />
exposure is to affiliates of the bank that are not c<strong>on</strong>solidated for regulatory purposes the limit is <strong>20</strong> %.<br />
In additi<strong>on</strong>, the total of all banking book large exposures must not exceed eight times the bank’s regulatory<br />
banking capital and the total of all aggregate book large exposures must not exceed eight times the bank’s<br />
own funds.<br />
A bank may exceed these ceilings <strong>on</strong>ly with the approval of the BaFin and subject to increased capital<br />
requirements for the amount of the large exposure that exceeds the ceiling.<br />
Furthermore, total trading book exposures to a single customer (and customers affiliated with it) must not<br />
exceed five times the bank’s own funds that are not required to meet the capital adequacy requirements with<br />
respect to the banking book. Total trading book exposures to a single customer (and customers affiliated with<br />
it) in excess of the aforementi<strong>on</strong>ed limit are not permitted.<br />
C<strong>on</strong>solidated Regulati<strong>on</strong> and Supervisi<strong>on</strong><br />
The <strong>Bank</strong>ing Act’s provisi<strong>on</strong>s <strong>on</strong> c<strong>on</strong>solidated supervisi<strong>on</strong> require that each group of instituti<strong>on</strong>s (Institutsgruppe)<br />
taken as a whole complies with the requirements <strong>on</strong> capital adequacy and the limitati<strong>on</strong>s <strong>on</strong> large<br />
exposures described above. A group of instituti<strong>on</strong>s generally c<strong>on</strong>sists of a domestic bank or financial services<br />
instituti<strong>on</strong>, as the parent company, and all other banks, financial services instituti<strong>on</strong>s, investment management<br />
companies, financial enterprises, ancillary services enterprises or payment instituti<strong>on</strong>s in which the<br />
41
<strong>20</strong>-F Item 4: Informati<strong>on</strong> <strong>on</strong> the Company<br />
parent company holds more than 50 % of the capital or voting rights or <strong>on</strong> which the parent company can<br />
otherwise exert a c<strong>on</strong>trolling influence. Special rules apply to joint venture arrangements that result in the joint<br />
management of another bank, financial services instituti<strong>on</strong>, investment company, financial enterprise, bank<br />
service enterprise or payment instituti<strong>on</strong> by a bank and <strong>on</strong>e or more third parties.<br />
Financial groups which offer services and products in various financial sectors (banking and securities business,<br />
insurance and reinsurance business) are subject to supplementary supervisi<strong>on</strong> as a financial c<strong>on</strong>glomerate<br />
(Finanzk<strong>on</strong>glomerat) <strong>on</strong>ce certain thresholds have been exceeded. The supervisi<strong>on</strong> <strong>on</strong> the level of the<br />
c<strong>on</strong>glomerate is exercised by the BaFin. It comprises requirements regarding own funds, risk c<strong>on</strong>centrati<strong>on</strong>,<br />
risk management, transacti<strong>on</strong>s within the c<strong>on</strong>glomerate and organizati<strong>on</strong>al matters. Following the acquisiti<strong>on</strong><br />
of Abbey Life Assurance Company Limited, the BaFin determined in November <strong>20</strong>07 that we are a financial<br />
c<strong>on</strong>glomerate. The main effect of this determinati<strong>on</strong> is that since <strong>20</strong>08 we have been reporting to the BaFin<br />
and the Bundesbank capital adequacy requirements and risk c<strong>on</strong>centrati<strong>on</strong>s also <strong>on</strong> a c<strong>on</strong>glomerate level. In<br />
additi<strong>on</strong>, we are required to report significant c<strong>on</strong>glomerate internal transacti<strong>on</strong>s as well as significant risk<br />
c<strong>on</strong>centrati<strong>on</strong>s.<br />
Liquidity Requirements<br />
The <strong>Bank</strong>ing Act requires German banks and certain financial services instituti<strong>on</strong>s to invest their funds so as<br />
to maintain adequate liquidity at all times. The Liquidity Regulati<strong>on</strong> (Liquiditätsverordnung) is based <strong>on</strong> a<br />
comparis<strong>on</strong> of the remaining terms of certain assets and liabilities. It requires maintenance of a ratio (Liquiditätskennzahl<br />
or “liquidity ratio”) of liquid assets to liquidity reducti<strong>on</strong>s expected during the m<strong>on</strong>th following<br />
the date <strong>on</strong> which the ratio is determined of at least <strong>on</strong>e. The Liquidity Regulati<strong>on</strong> also allows banks and<br />
financial services instituti<strong>on</strong>s subject to it to use their own methodology and procedures to measure and manage<br />
liquidity risk if the BaFin has approved such methodology and procedures. The liquidity ratio and estimated<br />
liquidity ratios for the next eleven m<strong>on</strong>ths must be reported to the BaFin <strong>on</strong> a m<strong>on</strong>thly basis. The liquidity<br />
requirements do not apply <strong>on</strong> a c<strong>on</strong>solidated basis. The BaFin may impose <strong>on</strong> individual banks liquidity<br />
requirements which are more stringent than the general statutory requirements if such bank’s c<strong>on</strong>tinuous<br />
liquidity would otherwise not be ensured.<br />
Financial Statements and Audits<br />
As required by the German Commercial Code (Handelsgesetzbuch), we prepare our n<strong>on</strong>-c<strong>on</strong>solidated financial<br />
statements in accordance with German GAAP. Our c<strong>on</strong>solidated financial statements are prepared in<br />
accordance with Internati<strong>on</strong>al Financial <str<strong>on</strong>g>Report</str<strong>on</strong>g>ing Standards, and our compliance with capital adequacy<br />
requirements and large exposure limits is determined solely based up<strong>on</strong> such c<strong>on</strong>solidated financial<br />
statements.<br />
Under German law, we are required to be audited annually by a certified public accountant (Wirt-<br />
schaftsprüfer). The accountant is appointed at the shareholders’ meeting. However, the supervisory board<br />
mandates the accountant and supervises the audit. The BaFin must be informed of and may reject the accountant’s<br />
appointment. The <strong>Bank</strong>ing Act requires that a bank’s auditor informs the BaFin of any facts that<br />
come to the accountant’s attenti<strong>on</strong> which would lead it to refuse to certify or to limit its certificati<strong>on</strong> of the<br />
bank’s annual financial statements or which would adversely affect the financial positi<strong>on</strong> of the bank. The<br />
auditor is also required to notify the BaFin in the event of a material breach by management of the articles of<br />
42
associati<strong>on</strong> or of any other applicable law. The auditor is required to prepare a detailed and comprehensive<br />
annual audit report (Prüfungsbericht) for submissi<strong>on</strong> to the bank’s supervisory board, the BaFin and the Bundesbank.<br />
Enforcement of <strong>Bank</strong>ing Regulati<strong>on</strong>s; Investigative Powers<br />
Investigati<strong>on</strong>s and Official Audits<br />
The BaFin c<strong>on</strong>ducts audits of banks <strong>on</strong> a random basis, as well as for cause. The BaFin is also resp<strong>on</strong>sible<br />
for auditing internal risk models used by a bank for regulatory purposes. It may revoke the approval to use<br />
such models or impose c<strong>on</strong>diti<strong>on</strong>s <strong>on</strong> their c<strong>on</strong>tinued use for regulatory purposes.<br />
The BaFin may require a bank to furnish informati<strong>on</strong> and documents in order to ensure that the bank is complying<br />
with the <strong>Bank</strong>ing Act and applicable regulati<strong>on</strong>s. The BaFin may c<strong>on</strong>duct investigati<strong>on</strong>s without having<br />
to state a reas<strong>on</strong> therefor. Such investigati<strong>on</strong>s may also take place at a foreign entity that is part of a bank’s<br />
group for regulatory purposes. Investigati<strong>on</strong>s of foreign entities are limited to the extent that the law of the<br />
jurisdicti<strong>on</strong> where the entity is located restricts such investigati<strong>on</strong>s. The BaFin may attend meetings of a<br />
bank’s supervisory board and shareholders’ meetings. It also has the authority to require that such meetings<br />
be c<strong>on</strong>vened.<br />
Enforcement Powers<br />
The BaFin has a wide range of enforcement powers in the event it discovers any irregularities. It may remove<br />
the bank’s managers from office, transfer their resp<strong>on</strong>sibilities in whole or in part to a special commissi<strong>on</strong>er or<br />
prohibit them from exercising their current managerial capacities. The BaFin may also cause the removal of<br />
members of the supervisory board of a bank if they are not reliable, lack the necessary expertise or violate<br />
their duties.<br />
If a bank’s own funds are inadequate, if a bank does not meet the liquidity requirements, or if, based up<strong>on</strong> the<br />
circumstances, the BaFin c<strong>on</strong>cludes that a bank will likely not be able to c<strong>on</strong>tinuously fulfill the statutory capi-<br />
tal or liquidity requirements, the BaFin may prohibit or restrict the bank from distributing profits or extending<br />
credit. In additi<strong>on</strong>, subject to the same prerequisites, the BaFin may generally prohibit a bank from making<br />
payments <strong>on</strong> own funds instruments if such payments are not covered by the bank’s annual profit. These<br />
prohibiti<strong>on</strong>s also apply to the parent bank of a group of instituti<strong>on</strong>s in the event that the own funds of the<br />
group are inadequate <strong>on</strong> a c<strong>on</strong>solidated basis. The BaFin may also order a bank to adopt measures to c<strong>on</strong>tain<br />
risks if such risks result from particular types of transacti<strong>on</strong>s or systems used by the bank.<br />
If a bank is in danger of defaulting <strong>on</strong> its obligati<strong>on</strong>s to creditors, the BaFin may take emergency measures to<br />
avert default. These emergency measures may include:<br />
— issuing instructi<strong>on</strong>s relating to the management of the bank;<br />
— prohibiting the acceptance of deposits and the extensi<strong>on</strong> of credit;<br />
— ordering that certain measures to reduce risks are taken;<br />
— prohibiting or restricting the bank’s managers from carrying <strong>on</strong> their functi<strong>on</strong>s; and<br />
— appointing supervisors.<br />
43
<strong>20</strong>-F Item 4: Informati<strong>on</strong> <strong>on</strong> the Company<br />
If these measures are inadequate, the BaFin may revoke the bank’s license and, if appropriate, order the<br />
closure of the bank.<br />
To avoid the insolvency of a bank, the BaFin may prohibit payments and disposals of assets, close the bank’s<br />
customer services, and prohibit the bank from accepting any payments other than payments of debts owed to<br />
the bank. Only the BaFin may file an applicati<strong>on</strong> for the initiati<strong>on</strong> of insolvency proceedings against a bank.<br />
Violati<strong>on</strong>s of the <strong>Bank</strong>ing Act may result in criminal and administrative penalties.<br />
Deposit Protecti<strong>on</strong> in Germany<br />
The Deposit Guarantee Act<br />
The Law <strong>on</strong> Deposit Insurance and Investor Compensati<strong>on</strong> (Einlagensicherungs- und Anlegerentschädigungsgesetz,<br />
the Deposit Guarantee Act) provides for a mandatory deposit insurance system in Germany. It<br />
requires that each German bank participate in <strong>on</strong>e of the licensed government-c<strong>on</strong>trolled investor compensati<strong>on</strong><br />
instituti<strong>on</strong>s (Entschädigungseinrichtungen). Entschädigungseinrichtung deutscher <strong>Bank</strong>en GmbH acts as<br />
the investor compensati<strong>on</strong> instituti<strong>on</strong> for private sector banks such as us, collects and administers the c<strong>on</strong>tributi<strong>on</strong>s<br />
of the member banks, and settles the compensati<strong>on</strong> claims of investors in accordance with the<br />
Deposit Guarantee Act.<br />
Investor compensati<strong>on</strong> instituti<strong>on</strong>s are liable <strong>on</strong>ly for obligati<strong>on</strong>s resulting from deposits and securities trans-<br />
acti<strong>on</strong>s that are denominated in euro or the currency of a c<strong>on</strong>tracting state to the Agreement <strong>on</strong> the European<br />
Ec<strong>on</strong>omic Area. They are not liable for obligati<strong>on</strong>s represented by instruments in bearer form or negotiable by<br />
endorsement. Claims of certain entities, such as banks, financial instituti<strong>on</strong>s (Finanzinstitute), insurance com-<br />
panies, investment funds, the Federal Republic of Germany, the German federal states, municipalities and<br />
medium-sized and large corporati<strong>on</strong>s, are not protected. The maximum liability of an investor compensati<strong>on</strong><br />
instituti<strong>on</strong> to any <strong>on</strong>e creditor is limited to an amount of € 50,000 for deposits, rising to € 100,000 from<br />
December 31, <strong>20</strong>10 <strong>on</strong>wards, and to 90 % of any <strong>on</strong>e creditor’s aggregate claims arising from securities<br />
transacti<strong>on</strong>s up to an amount of € <strong>20</strong>,000.<br />
<strong>Bank</strong>s are obliged to make annual c<strong>on</strong>tributi<strong>on</strong>s to the investor compensati<strong>on</strong> instituti<strong>on</strong> in which they participate.<br />
An investor compensati<strong>on</strong> instituti<strong>on</strong> must levy special c<strong>on</strong>tributi<strong>on</strong>s <strong>on</strong> the banks participating therein or<br />
take up loans, whenever it is necessary to settle compensati<strong>on</strong> claims by such instituti<strong>on</strong> in accordance with<br />
the Deposit Guarantee Act. There is no absolute limit <strong>on</strong> such special c<strong>on</strong>tributi<strong>on</strong>s. The investor compensati<strong>on</strong><br />
instituti<strong>on</strong> may exempt a bank from special c<strong>on</strong>tributi<strong>on</strong>s in whole or in part if full payments of such c<strong>on</strong>tributi<strong>on</strong>s<br />
are likely to render such bank unable to repay its deposits or perform its obligati<strong>on</strong>s under securities<br />
transacti<strong>on</strong>s. The amount of such c<strong>on</strong>tributi<strong>on</strong> will then be added proporti<strong>on</strong>ately to the special c<strong>on</strong>tributi<strong>on</strong>s<br />
levied <strong>on</strong> the other participating banks. Following the increase of the protected amounts of customer claims in<br />
<str<strong>on</strong>g><strong>20</strong>09</str<strong>on</strong>g>, our c<strong>on</strong>tributi<strong>on</strong>s increased and may increase further to accommodate the increased maximum liability<br />
of our investor compensati<strong>on</strong> instituti<strong>on</strong> from December 31, <strong>20</strong>10 <strong>on</strong>wards.<br />
44
Voluntary Deposit Protecti<strong>on</strong> System<br />
Liabilities to creditors that are not covered under the Deposit Guarantee Act may be covered by <strong>on</strong>e of the<br />
various protecti<strong>on</strong> funds set up by the banking industry <strong>on</strong> a voluntary basis. We take part in the Deposit Protecti<strong>on</strong><br />
Fund of the Associati<strong>on</strong> of German <strong>Bank</strong>s (Einlagensicherungsf<strong>on</strong>ds des Bundesverbandes deutscher<br />
<strong>Bank</strong>en e.V.). The Deposit Protecti<strong>on</strong> Fund covers liabilities to customers up to an amount equal to 30 % of<br />
the bank’s core capital and supplementary capital (to the extent that supplementary capital does not exceed<br />
25 % of core capital). Liabilities to other banks and other specified instituti<strong>on</strong>s, obligati<strong>on</strong>s of banks<br />
represented by instruments in bearer form and covered b<strong>on</strong>ds in registered form (Namenspfandbriefe) are not<br />
covered. To the extent the Deposit Protecti<strong>on</strong> Fund makes payments to customers of a bank, it will be subrogated<br />
to their claims against the bank.<br />
<strong>Bank</strong>s that participate in the Deposit Protecti<strong>on</strong> Fund make regular c<strong>on</strong>tributi<strong>on</strong>s to the fund based <strong>on</strong> their<br />
liabilities to customers, and may be required to make special c<strong>on</strong>tributi<strong>on</strong>s up to the amount of their regular<br />
c<strong>on</strong>tributi<strong>on</strong>s to the extent requested by the Deposit Protecti<strong>on</strong> Fund to enable it to fulfill its purpose. If <strong>on</strong>e or<br />
more German banks are in financial difficulties, we may therefore participate in their restructuring even where<br />
we have no business relati<strong>on</strong>ship or strategic interest, in order to avoid making special c<strong>on</strong>tributi<strong>on</strong>s to the<br />
Deposit Protecti<strong>on</strong> Fund in case of an insolvency of such bank or banks, or we may be required to make such<br />
special c<strong>on</strong>tributi<strong>on</strong>s. Following financial difficulties of various German banks the regular c<strong>on</strong>tributi<strong>on</strong>s to the<br />
Deposit Protecti<strong>on</strong> Fund were doubled from <str<strong>on</strong>g><strong>20</strong>09</str<strong>on</strong>g> <strong>on</strong>wards.<br />
Regulati<strong>on</strong> and Supervisi<strong>on</strong> in the European Ec<strong>on</strong>omic Area<br />
Since 1989 the European Uni<strong>on</strong> has enacted a number of directives to create a single European Uni<strong>on</strong>-wide<br />
market with almost no internal barriers <strong>on</strong> banking and financial services. The Agreement <strong>on</strong> the European<br />
Ec<strong>on</strong>omic Area extends this single market to Iceland, Liechtenstein and Norway. Within this market our<br />
branches generally operate under the so-called “European Passport.” Under the European Passport,<br />
our branches are subject to regulati<strong>on</strong> and supervisi<strong>on</strong> primarily by the BaFin. The authorities of the host<br />
country are resp<strong>on</strong>sible for the regulati<strong>on</strong> and supervisi<strong>on</strong> of the liquidity requirements and the financial markets<br />
of the host country. They also retain resp<strong>on</strong>sibility with regard to the provisi<strong>on</strong> of securities services within<br />
the territory of the host country.<br />
Regulati<strong>on</strong> and Supervisi<strong>on</strong> in the United States<br />
Our operati<strong>on</strong>s are subject to extensive federal and state banking and securities regulati<strong>on</strong> and supervisi<strong>on</strong><br />
in the United States. We engage in U.S. banking activities directly through our New York branch. We also<br />
c<strong>on</strong>trol U.S. banking subsidiaries, including <strong>Deutsche</strong> <strong>Bank</strong> Trust Company Americas (“DBTCA”), and<br />
U.S. broker-dealers, such as <strong>Deutsche</strong> <strong>Bank</strong> Securities Inc., U.S. n<strong>on</strong>depositary trust companies and n<strong>on</strong>banking<br />
subsidiaries.<br />
Regulatory Authorities<br />
<strong>Deutsche</strong> <strong>Bank</strong> AG and Taunus Corporati<strong>on</strong>, its wholly owned subsidiary, are bank holding companies under<br />
the U.S. <strong>Bank</strong> Holding Company Act of 1956, as amended (the <strong>Bank</strong> Holding Company Act), by virtue of,<br />
am<strong>on</strong>g other things, our ownership of DBTCA. As a result, we and our U.S. operati<strong>on</strong>s are subject to regulati<strong>on</strong>,<br />
supervisi<strong>on</strong> and examinati<strong>on</strong> by the Federal Reserve Board as our U.S. “umbrella supervisor”.<br />
45
<strong>20</strong>-F Item 4: Informati<strong>on</strong> <strong>on</strong> the Company<br />
DBTCA is a New York state-chartered bank whose deposits are insured by the Federal Deposit Insurance<br />
Corporati<strong>on</strong> (the FDIC). DBTCA is subject to regulati<strong>on</strong>, supervisi<strong>on</strong> and examinati<strong>on</strong> by the Federal Reserve<br />
Board and the New York State <strong>Bank</strong>ing Department and to relevant FDIC regulati<strong>on</strong>. <strong>Deutsche</strong> <strong>Bank</strong> Trust<br />
Company Delaware is a Delaware state-chartered bank which is subject to regulati<strong>on</strong>, supervisi<strong>on</strong> and<br />
examinati<strong>on</strong> by the FDIC and the Office of the State <strong>Bank</strong> Commissi<strong>on</strong>er of Delaware. Our New York branch<br />
is supervised by the Federal Reserve Board and the New York State <strong>Bank</strong>ing Department. Our federallychartered<br />
n<strong>on</strong>deposit trust companies are subject to regulati<strong>on</strong>, supervisi<strong>on</strong> and examinati<strong>on</strong> by the Office of<br />
the Comptroller of the Currency. Certain of our subsidiaries are also subject to regulati<strong>on</strong>, supervisi<strong>on</strong> and<br />
examinati<strong>on</strong> by state banking regulators of certain states in which we c<strong>on</strong>duct banking operati<strong>on</strong>s, including<br />
New Jersey and New Hampshire.<br />
Restricti<strong>on</strong>s <strong>on</strong> Activities<br />
As described below, federal and state banking laws and regulati<strong>on</strong>s restrict our ability to engage, directly or<br />
indirectly through subsidiaries, in activities in the United States.<br />
We are required to obtain the prior approval of the Federal Reserve Board before directly or indirectly<br />
acquiring the ownership or c<strong>on</strong>trol of more than 5 % of any class of voting shares of U.S. banks, certain other<br />
depository instituti<strong>on</strong>s, and bank or depository instituti<strong>on</strong> holding companies. Under applicable U.S. federal<br />
banking law, our U.S. banking operati<strong>on</strong>s are also restricted from engaging in certain “tying” arrangements<br />
involving products and services.<br />
Our two U.S. FDIC-insured bank subsidiaries are subject to requirements and restricti<strong>on</strong>s under federal and<br />
state law, including requirements to maintain reserves against deposits, restricti<strong>on</strong>s <strong>on</strong> the types and amounts<br />
of loans that may be made and the interest that may be charged there<strong>on</strong>, and limitati<strong>on</strong>s <strong>on</strong> the types of<br />
investments that may be made and the types of services that may be offered.<br />
Under U.S. law, our activities and those of our subsidiaries are generally limited to the business of banking,<br />
managing or c<strong>on</strong>trolling banks, and, so l<strong>on</strong>g as we remain a financial holding company under U.S. law, n<strong>on</strong>banking<br />
activities in the United States that are financial in nature, or incidental or complementary to such<br />
financial activity, including securities, merchant banking, insurance and other financial activities, but subject to<br />
certain limitati<strong>on</strong>s <strong>on</strong> the c<strong>on</strong>duct of such activities and to prior regulatory approval in some cases. As a n<strong>on</strong>-<br />
U.S. bank, we are generally authorized under U.S law and regulati<strong>on</strong>s to acquire a n<strong>on</strong>-U.S. company<br />
engaged in n<strong>on</strong>financial activities provided that the company’s U.S. operati<strong>on</strong>s do not exceed certain thresholds<br />
and certain other c<strong>on</strong>diti<strong>on</strong>s are met.<br />
Our status as a financial holding company, and our resulting ability to engage in a broader range of n<strong>on</strong>banking<br />
activities, is dependent <strong>on</strong> <strong>Deutsche</strong> <strong>Bank</strong> AG and our two insured U.S. depository instituti<strong>on</strong>s remaining<br />
“well capitalized” and “well managed” (as defined by Federal Reserve Board regulati<strong>on</strong>s) and up<strong>on</strong> our<br />
insured U.S. depository instituti<strong>on</strong>s meeting certain requirements under the Community Reinvestment Act. In<br />
order to meet the “well capitalized” test, we and our U.S. depository instituti<strong>on</strong>s are required to maintain a<br />
Tier 1 risk-based capital ratio of at least 6 % and a total risk-based capital ratio of at least 10 %.<br />
46
Pursuant to Federal Reserve Board policy, Taunus Corporati<strong>on</strong>, as the top-tier U.S. bank holding company<br />
subsidiary of <strong>Deutsche</strong> <strong>Bank</strong> AG, is not required to comply with capital adequacy guidelines generally made<br />
applicable to U.S. banking organizati<strong>on</strong>s, as l<strong>on</strong>g as <strong>Deutsche</strong> <strong>Bank</strong> AG remains a financial holding company<br />
that the Federal Reserve Board c<strong>on</strong>tinues to regard as well capitalized and well managed. Because Taunus<br />
Corporati<strong>on</strong> is able to fund its subsidiaries via its parent, it does not maintain stand-al<strong>on</strong>e capital. Therefore,<br />
should <strong>Deutsche</strong> <strong>Bank</strong> AG cease to be well capitalized or well managed, and should Taunus Corporati<strong>on</strong><br />
thereby (or otherwise because of a change in Federal Reserve Board policy) become subject to U.S. capital<br />
guidelines, <strong>Deutsche</strong> <strong>Bank</strong> AG would have to restructure its U.S. activities and/or materially increase the<br />
capital of Taunus Corporati<strong>on</strong>. The extent of such restructuring and recapitalizati<strong>on</strong>, and the adverse effects<br />
that they would have <strong>on</strong> the financial c<strong>on</strong>diti<strong>on</strong> and operati<strong>on</strong>s of <strong>Deutsche</strong> <strong>Bank</strong> cannot be estimated at this<br />
time.<br />
State-chartered banks (such as DBTCA) and state-licensed branches and agencies of foreign banks (such as<br />
our New York branch) may not, with certain excepti<strong>on</strong>s that require prior regulatory approval, engage as a<br />
principal in any type of activity not permissible for their federally chartered or licensed counterparts. United<br />
States federal banking laws also subject state branches and agencies to the same single-borrower lending<br />
limits that apply to federal branches or agencies, which are substantially similar to the lending limits applicable<br />
to nati<strong>on</strong>al banks. These single-borrower lending limits are based <strong>on</strong> the worldwide capital of the entire<br />
foreign bank (i.e., <strong>Deutsche</strong> <strong>Bank</strong> AG in the case of our New York branch).<br />
The Federal Reserve Board may terminate the activities of any U.S. office of a foreign bank if it determines<br />
that the foreign bank is not subject to comprehensive supervisi<strong>on</strong> <strong>on</strong> a c<strong>on</strong>solidated basis in its home country<br />
or that there is reas<strong>on</strong>able cause to believe that such foreign bank or its affiliate has violated the law or<br />
engaged in an unsafe or unsound banking practice in the United States.<br />
There are various qualitative and quantitative restricti<strong>on</strong>s <strong>on</strong> the extent to which we and our n<strong>on</strong>bank subsidiaries<br />
can borrow or otherwise obtain credit from our U.S. banking subsidiaries or engage in certain other<br />
transacti<strong>on</strong>s involving those subsidiaries. In general, these transacti<strong>on</strong>s must be <strong>on</strong> terms that would ordinarily<br />
be offered to unaffiliated entities, must be secured by designated amounts of specified collateral and are<br />
subject to volume limitati<strong>on</strong>s. These restricti<strong>on</strong>s also apply to certain transacti<strong>on</strong>s of our New York Branch<br />
with our U.S. broker-dealer and certain of our other affiliates.<br />
A major focus of U.S. governmental policy relating to financial instituti<strong>on</strong>s is aimed at preventing m<strong>on</strong>ey<br />
laundering and terrorist financing and compliance with ec<strong>on</strong>omic sancti<strong>on</strong>s. Failure of an instituti<strong>on</strong> to have<br />
policies and procedures and c<strong>on</strong>trols in place to prevent, detect and report m<strong>on</strong>ey laundering and terrorist<br />
financing could in some cases have serious legal, financial and reputati<strong>on</strong>al c<strong>on</strong>sequences for the instituti<strong>on</strong>.<br />
Our New York Branch<br />
Our New York branch is licensed by the New York Superintendent of <strong>Bank</strong>s to c<strong>on</strong>duct a commercial banking<br />
business and is required to maintain eligible high-quality assets with banks in the State of New York. Should<br />
our New York Branch cease to be “well-rated” by the New York State Superintendent of <strong>Bank</strong>s, we may need<br />
to maintain substantial additi<strong>on</strong>al amounts of eligible assets (up to a maximum of U.S.$ 100 milli<strong>on</strong> of assets<br />
47
<strong>20</strong>-F Item 4: Informati<strong>on</strong> <strong>on</strong> the Company<br />
pledged). The Superintendent of <strong>Bank</strong>s may also establish asset maintenance requirements for branches of<br />
foreign banks. Currently, no such requirement has been imposed up<strong>on</strong> our New York branch.<br />
The New York State <strong>Bank</strong>ing Law authorizes the Superintendent of <strong>Bank</strong>s to take possessi<strong>on</strong> of the business<br />
and property of a New York branch of a foreign bank under circumstances involving violati<strong>on</strong> of law, c<strong>on</strong>duct<br />
of business in an unsafe manner, impairment of capital, suspensi<strong>on</strong> of payment of obligati<strong>on</strong>s, or initiati<strong>on</strong> of<br />
liquidati<strong>on</strong> proceedings against the foreign bank at its domicile or elsewhere. In liquidating or dealing with a<br />
branch’s business after taking possessi<strong>on</strong> of a branch, <strong>on</strong>ly the claims of creditors which arose out of transacti<strong>on</strong>s<br />
with a branch are to be accepted by the Superintendent of <strong>Bank</strong>s for payment out of the business and<br />
property of the foreign bank in the State of New York, without prejudice to the rights of the holders of such<br />
claims to be satisfied out of other assets of the foreign bank. After such claims are paid, the Superintendent of<br />
<strong>Bank</strong>s will turn over the remaining assets, if any, to the foreign bank or its duly appointed liquidator or receiver.<br />
<strong>Deutsche</strong> <strong>Bank</strong> Trust Company Americas<br />
The Federal Deposit Insurance Corporati<strong>on</strong> Improvement Act of 1991 (referred to as FDICIA) provides for<br />
extensive regulati<strong>on</strong> of depository instituti<strong>on</strong>s (such as DBTCA and its direct and indirect parent companies),<br />
including requiring federal banking regulators to take “prompt corrective acti<strong>on</strong>” with respect to FDIC-insured<br />
banks that do not meet minimum capital requirements. As an insured bank’s capital level declines and the<br />
bank falls into lower categories (or if it is placed in a lower category by the discreti<strong>on</strong>ary acti<strong>on</strong> of its supervisor),<br />
greater limits are placed <strong>on</strong> its activities and federal banking regulators are authorized (and, in many<br />
cases, required) to take increasingly more stringent supervisory acti<strong>on</strong>s, which could ultimately include the<br />
appointment of a c<strong>on</strong>servator or receiver for the bank (even if it is solvent). In additi<strong>on</strong>, FDICIA generally prohibits<br />
an FDIC-insured bank from making any capital distributi<strong>on</strong> (including payment of a dividend) or payment<br />
of a management fee to its holding company if the bank would thereafter be undercapitalized. If an insured<br />
bank becomes “undercapitalized”, it is required to submit to federal regulators a capital restorati<strong>on</strong> plan guaranteed<br />
by the bank’s holding company. Since the enactment of FDICIA, both of our U.S. insured banks have<br />
been categorized as “well capitalized,” the highest capital category under applicable regulati<strong>on</strong>s.<br />
DBTCA, like other FDIC-insured banks, is required to pay assessments to the FDIC for deposit insurance<br />
under the FDIC’s Deposit Insurance Fund (calculated using the FDIC’s risk-based assessment system). As a<br />
result of losses incurred by the Deposit Insurance Fund <strong>on</strong> account of current financial market c<strong>on</strong>diti<strong>on</strong>s, the<br />
amount of these assessments has been increasing. The FDIC authorized the impositi<strong>on</strong> of special assessments<br />
of five basis points <strong>on</strong> each FDIC-insured instituti<strong>on</strong>’s assets minus its Tier 1 capital (subject to a cap<br />
of 10 basis points of an instituti<strong>on</strong>’s domestic deposits). The first special assessment was calculated based <strong>on</strong><br />
asset levels at June 30, <str<strong>on</strong>g><strong>20</strong>09</str<strong>on</strong>g>, and was collected <strong>on</strong> September 30, <str<strong>on</strong>g><strong>20</strong>09</str<strong>on</strong>g>. Instead of imposing additi<strong>on</strong>al special<br />
assessments, the FDIC issued a regulati<strong>on</strong> that required FDIC-insured instituti<strong>on</strong>s to prepay <strong>on</strong> December<br />
30, <str<strong>on</strong>g><strong>20</strong>09</str<strong>on</strong>g>, their estimated quarterly risk-based assessments for the fourth quarter of <str<strong>on</strong>g><strong>20</strong>09</str<strong>on</strong>g> and for all of<br />
<strong>20</strong>10, <strong>20</strong>11 and <strong>20</strong>12, with instituti<strong>on</strong>s accounting for the prepayment as a prepaid expense (an asset).<br />
The FDIC’s basic amount of deposit insurance was temporarily increased from U.S.$ 100,000 to U.S.$ 250,000<br />
per depositor through December 31, <strong>20</strong>13. DBTCA and its sister bank, <strong>Deutsche</strong> <strong>Bank</strong> Trust Company Delaware,<br />
participated in the FDIC’s Temporary Liquidity Guarantee Program, and particularly, the Transacti<strong>on</strong><br />
48
Account Guarantee Program (“TAGP”) thereunder, pursuant to which the FDIC fully guaranteed (for a fee)<br />
certain n<strong>on</strong>interest-bearing transacti<strong>on</strong> accounts. The TAGP was originally scheduled to expire <strong>on</strong> June 30,<br />
<str<strong>on</strong>g><strong>20</strong>09</str<strong>on</strong>g>, but has been twice extended for six m<strong>on</strong>ths, and is now scheduled to expire <strong>on</strong> June 30, <strong>20</strong>10. Both<br />
DBTCA and <strong>Deutsche</strong> <strong>Bank</strong> Trust Company Delaware are participating in the TAGP as extended.<br />
Other<br />
In the United States, our U.S.-registered broker-dealers are regulated by the Securities and Exchange Commissi<strong>on</strong>.<br />
Broker-dealers are subject to regulati<strong>on</strong>s that cover all aspects of the securities business, including<br />
sales methods, trade practices am<strong>on</strong>g broker-dealers, use and safekeeping of customers’ funds and securities,<br />
capital structure, recordkeeping, the financing of customers’ purchases and the c<strong>on</strong>duct of directors,<br />
officers and employees.<br />
In additi<strong>on</strong>, our principal U.S. SEC-registered broker dealer subsidiary, <strong>Deutsche</strong> <strong>Bank</strong> Securities Inc., is a<br />
member of the New York Stock Exchange and is regulated by the Financial Industry Regulatory Authority<br />
(“FINRA”) and the individual state securities authorities in the states in which it operates. The U.S. govern-<br />
ment agencies and self-regulatory organizati<strong>on</strong>s, as well as state securities authorities in the United States<br />
having jurisdicti<strong>on</strong> over our U.S. broker-dealer affiliates, are empowered to c<strong>on</strong>duct administrative proceed-<br />
ings that can result in censure, fine, the issuance of cease-and-desist orders or the suspensi<strong>on</strong> or expulsi<strong>on</strong><br />
of a broker-dealer or its directors, officers or employees.<br />
In June <str<strong>on</strong>g><strong>20</strong>09</str<strong>on</strong>g>, the U.S. Government released a regulatory reform proposal that includes measures to enhance<br />
the supervisi<strong>on</strong> of financial instituti<strong>on</strong>s, establish comprehensive supervisi<strong>on</strong> of financial markets (including<br />
requiring certain derivatives c<strong>on</strong>tracts to be traded <strong>on</strong> an exchange or centrally cleared), protect c<strong>on</strong>sumers<br />
and investors from financial abuse, provide government with the tools to manage a financial crisis (including<br />
enhanced resoluti<strong>on</strong> authority), and raise internati<strong>on</strong>al regulatory standards and enhance internati<strong>on</strong>al<br />
cooperati<strong>on</strong>. Although the applicability of certain of these proposals to internati<strong>on</strong>al banks is unclear, if enacted,<br />
these proposals, and other proposals announced more recently, could have a significant financial impact <strong>on</strong><br />
our businesses and <strong>on</strong> the resources needed to enhance our regulatory and compliance systems and maintain<br />
them <strong>on</strong> an <strong>on</strong>going basis.<br />
Organizati<strong>on</strong>al Structure<br />
We operate our business al<strong>on</strong>g the structure of our three group divisi<strong>on</strong>s. <strong>Deutsche</strong> <strong>Bank</strong> AG is the direct or<br />
indirect holding company for our subsidiaries. The following table sets forth the significant subsidiaries we<br />
own, directly or indirectly. We used the three-part test for significance set out in Secti<strong>on</strong> 1-02 (w) of Regulati<strong>on</strong><br />
S-X under the U.S. Securities Exchange Act of 1934. We do not have any other subsidiaries we believe<br />
are material based <strong>on</strong> other, less quantifiable, factors. We have provided informati<strong>on</strong> <strong>on</strong> Taunus Corporati<strong>on</strong>’s<br />
principal subsidiaries, to give an idea of their businesses. We have also included <strong>Deutsche</strong> <strong>Bank</strong> Luxembourg<br />
S.A., <strong>Deutsche</strong> <strong>Bank</strong> Privat- und Geschäftskunden Aktiengesellschaft as well as DB Capital Markets<br />
(Deutschland) GmbH and DB Valoren S.á.r.l. and their principal subsidiaries.<br />
49
<strong>20</strong>-F Item 4: Informati<strong>on</strong> <strong>on</strong> the Company<br />
We own 100 % of the equity and voting interests in these significant subsidiaries.<br />
Subsidiary Place of Incorporati<strong>on</strong><br />
Taunus Corporati<strong>on</strong> 1 Delaware, United States<br />
<strong>Deutsche</strong> <strong>Bank</strong> Trust Company Americas 2 New York, United States<br />
<strong>Deutsche</strong> <strong>Bank</strong> Securities Inc. 3 Delaware, United States<br />
<strong>Deutsche</strong> <strong>Bank</strong> Luxembourg S.A.4 Luxembourg<br />
<strong>Deutsche</strong> <strong>Bank</strong> Privat- und Geschäftskunden Aktiengesellschaft5 Frankfurt am Main, Germany<br />
DB Capital Markets (Deutschland) GmbH6 Frankfurt am Main, Germany<br />
DWS Investment GmbH 7 Frankfurt am Main, Germany<br />
DB Valoren S.á.r.l.8 Luxembourg<br />
DB Equity S.á.r.l. 9 Luxembourg<br />
1 This company is a holding company for most of our subsidiaries in the United States.<br />
2 This company is a subsidiary of Taunus Corporati<strong>on</strong>. <strong>Deutsche</strong> <strong>Bank</strong> Trust Company Americas is a New York State-chartered bank which originates<br />
loans and other forms of credit, accepts deposits, arranges financings and provides numerous other commercial banking and financial services.<br />
3 <strong>Deutsche</strong> <strong>Bank</strong> Securities Inc. is a U.S. SEC-registered broker dealer and is a member of the New York Stock Exchange and regulated by the Financial<br />
Industry Regulatory Authority. It is also regulated by the individual state securities authorities in the states in which it operates.<br />
4 The primary business of this company comprises treasury and global market activities, especially as a major supplier of Euro liquidity for <strong>Deutsche</strong> <strong>Bank</strong><br />
Group, the internati<strong>on</strong>al loan business with a specific focus <strong>on</strong> c<strong>on</strong>tinental Europe, and private banking.<br />
5 The company serves private individuals, affluent clients and small business clients with banking products.<br />
6 This company is a German limited liability company and operates as a holding company for a number of European subsidiaries, mainly instituti<strong>on</strong>al and<br />
mutual fund management companies located in Germany, Luxembourg, Austria, Switzerland, Italy, Poland, and Cyprus.<br />
7 This company, in which DB Capital Markets (Deutschland) GmbH indirectly owns 100 % of the equity and voting interests, is a limited liability company<br />
that operates as a mutual fund manager.<br />
8 This company is a holding company for our subgroups in Australia, New Zealand, and Singapore. It is also the holding company for DB Equity S.á.r.l.<br />
9 This company is the holding company for our minority stake in <strong>Deutsche</strong> Postbank AG.<br />
Property and Equipment<br />
As of December 31, <str<strong>on</strong>g><strong>20</strong>09</str<strong>on</strong>g>, we operated in 72 countries out of 1,964 branches around the world, of which 49 %<br />
were in Germany. We lease a majority of our offices and branches under l<strong>on</strong>g-term agreements.<br />
As of December 31, <str<strong>on</strong>g><strong>20</strong>09</str<strong>on</strong>g>, we had premises and equipment with a total book value of approximately<br />
€ 2.8 billi<strong>on</strong>. Included in this amount were land and buildings with a carrying value of approximately<br />
€ 880 milli<strong>on</strong>. As of December 31, <strong>20</strong>08, we had premises and equipment with a total book value of approxi-<br />
mately € 3.7 billi<strong>on</strong>. Included in this amount were land and buildings with a carrying value of approximately<br />
€ 911 milli<strong>on</strong>.<br />
We c<strong>on</strong>tinue to review our property requirements worldwide taking into account cost c<strong>on</strong>tainment measures<br />
as well as growth initiatives in selected businesses.<br />
Informati<strong>on</strong> Required by Industry Guide 3<br />
Please see pages S-1 through S-16 of the supplemental financial informati<strong>on</strong>, which pages are incorporated<br />
by reference herein, for informati<strong>on</strong> required by Industry Guide 3.<br />
Item 4A: Unresolved Staff Comments<br />
We have not received written comments from the Securities and Exchange Commissi<strong>on</strong> regarding our<br />
periodic reports under the Exchange Act, as of any day 180 days or more before the end of the fiscal year to<br />
which this annual report relates, which remain unresolved.<br />
50
Item 5: Operating and Financial Review<br />
and Prospects<br />
Overview<br />
The following discussi<strong>on</strong> and analysis should be read in c<strong>on</strong>juncti<strong>on</strong> with the c<strong>on</strong>solidated financial statements<br />
and the related notes to them included in “Item 18: Financial Statements” of this document, <strong>on</strong> which<br />
we have based this discussi<strong>on</strong> and analysis. Our c<strong>on</strong>solidated financial statements for the years ended December<br />
31, <str<strong>on</strong>g><strong>20</strong>09</str<strong>on</strong>g>, <strong>20</strong>08 and <strong>20</strong>07 have been audited by KPMG AG Wirtschaftsprüfungsgesellschaft, as described<br />
in the “<str<strong>on</strong>g>Report</str<strong>on</strong>g> of Independent Registered Public Accounting Firm” <strong>on</strong> page F-4.<br />
We have prepared our c<strong>on</strong>solidated financial statements in accordance with IFRS as issued by the Internati<strong>on</strong>al<br />
Accounting Standards Board (“IASB”) and as endorsed by the European Uni<strong>on</strong> (“EU”). Until December<br />
31, <strong>20</strong>06, we prepared our c<strong>on</strong>solidated financial informati<strong>on</strong> in accordance with generally accepted<br />
accounting principles in the United States. The effective date of our transiti<strong>on</strong> to IFRS was January 1, <strong>20</strong>06.<br />
Significant Accounting Policies and Critical Accounting Estimates<br />
Our significant accounting policies are essential to understanding our reported results of operati<strong>on</strong>s and<br />
financial c<strong>on</strong>diti<strong>on</strong>. Certain of these accounting policies require critical accounting estimates that involve<br />
complex and subjective judgments and the use of assumpti<strong>on</strong>s, some of which may be for matters that are<br />
inherently uncertain and susceptible to change. Such critical accounting estimates could change from period<br />
to period and have a material impact <strong>on</strong> our financial c<strong>on</strong>diti<strong>on</strong>, changes in financial c<strong>on</strong>diti<strong>on</strong> or results of<br />
operati<strong>on</strong>s. Critical accounting estimates could also involve estimates where management could have reas<strong>on</strong>ably<br />
used another estimate in the current accounting period. Actual results may differ from these estimates<br />
if c<strong>on</strong>diti<strong>on</strong>s or underlying circumstances were to change. See Notes [1] and [2] to the c<strong>on</strong>solidated<br />
financial statements for a discussi<strong>on</strong> <strong>on</strong> our significant accounting policies and critical accounting estimates.<br />
We have identified the following significant accounting policies that involve critical accounting estimates:<br />
— Fair value estimates<br />
— Impairment of financial assets<br />
— Impairment of n<strong>on</strong>-financial assets<br />
— Deferred tax-assets<br />
— Legal and regulatory c<strong>on</strong>tingencies and tax risks<br />
Recently Adopted Accounting Pr<strong>on</strong>ouncements and New Accounting Pr<strong>on</strong>ouncements<br />
See Note [3] to the c<strong>on</strong>solidated financial statements for a discussi<strong>on</strong> <strong>on</strong> our recently adopted and new accounting<br />
pr<strong>on</strong>ouncements.<br />
51
<strong>20</strong>-F Item 5: Operating and Financial Review and Prospects<br />
Operating Results (<str<strong>on</strong>g><strong>20</strong>09</str<strong>on</strong>g> vs. <strong>20</strong>08)<br />
You should read the following discussi<strong>on</strong> and analysis in c<strong>on</strong>juncti<strong>on</strong> with our c<strong>on</strong>solidated financial statements.<br />
Executive Summary<br />
In <str<strong>on</strong>g><strong>20</strong>09</str<strong>on</strong>g>, the worldwide ec<strong>on</strong>omy was significantly impacted by the global recessi<strong>on</strong>. The collapse in world<br />
trade affected especially Germany. Government stimulus measures worldwide prevented a further downturn.<br />
In the banking industry losses from traditi<strong>on</strong>al lending business reached record levels in <str<strong>on</strong>g><strong>20</strong>09</str<strong>on</strong>g> in both Europe<br />
and the U.S., while investment banking revenues improved significantly versus <strong>20</strong>08. In this envir<strong>on</strong>ment, we<br />
generated a net income of € 5.0 billi<strong>on</strong> and made the strength of our capital base a top priority, raising our<br />
Tier 1 capital ratio to 12.6 %. In additi<strong>on</strong>, we reduced our risk-weighted assets to € 273 billi<strong>on</strong> and improved<br />
our leverage ratio. We also reoriented our platforms in some core businesses and closed our dedicated credit<br />
proprietary platform.<br />
We recorded income before income taxes of € 5.2 billi<strong>on</strong> for <str<strong>on</strong>g><strong>20</strong>09</str<strong>on</strong>g>, compared with a loss before income taxes<br />
of € 5.7 billi<strong>on</strong> for <strong>20</strong>08. Net revenues of € 28.0 billi<strong>on</strong> in <str<strong>on</strong>g><strong>20</strong>09</str<strong>on</strong>g> were significantly above the € 13.6 billi<strong>on</strong> re-<br />
ported for <strong>20</strong>08. Our pre-tax return <strong>on</strong> average active equity was 15 % in <str<strong>on</strong>g><strong>20</strong>09</str<strong>on</strong>g>, versus negative 18 % in <strong>20</strong>08.<br />
Our pre-tax return <strong>on</strong> average shareholders’ equity was 15 % in <str<strong>on</strong>g><strong>20</strong>09</str<strong>on</strong>g> and negative 16 % in <strong>20</strong>08. Our net<br />
income was € 5.0 billi<strong>on</strong> in <str<strong>on</strong>g><strong>20</strong>09</str<strong>on</strong>g>, compared with a net loss of € 3.9 billi<strong>on</strong> in <strong>20</strong>08. Diluted earnings per share<br />
were € 7.59 in <str<strong>on</strong>g><strong>20</strong>09</str<strong>on</strong>g> and negative € 7.61 in <strong>20</strong>08.<br />
CIB’s net revenues increased from € 3.2 billi<strong>on</strong> in <strong>20</strong>08 to € 18.8 billi<strong>on</strong> in <str<strong>on</strong>g><strong>20</strong>09</str<strong>on</strong>g>. Overall Sales & Trading net<br />
revenues for <str<strong>on</strong>g><strong>20</strong>09</str<strong>on</strong>g> were € 12.5 billi<strong>on</strong>, compared with negative € 514 milli<strong>on</strong> in <strong>20</strong>08. This primarily reflects<br />
significantly lower mark-downs <strong>on</strong> credit-related exposures in <str<strong>on</strong>g><strong>20</strong>09</str<strong>on</strong>g>, and the n<strong>on</strong>-recurrence of losses in Credit<br />
Trading, Equity Derivatives and Equity Proprietary Trading incurred in <strong>20</strong>08. Originati<strong>on</strong> and Advisory revenues<br />
were € 2.2 billi<strong>on</strong> in <str<strong>on</strong>g><strong>20</strong>09</str<strong>on</strong>g>, an increase of € 2.0 billi<strong>on</strong> versus <strong>20</strong>08, mainly reflecting the n<strong>on</strong>-recurrence<br />
of significant net mark-downs of € 1.7 billi<strong>on</strong> <strong>on</strong> leveraged loans and loan commitments in the prior year.<br />
PCAM’s net revenues were € 8.3 billi<strong>on</strong> in <str<strong>on</strong>g><strong>20</strong>09</str<strong>on</strong>g>, a decrease of € 777 milli<strong>on</strong> compared to <strong>20</strong>08. The decrease<br />
included lower asset-based fees as a c<strong>on</strong>sequence of lower asset valuati<strong>on</strong>s during the first nine m<strong>on</strong>ths of<br />
<str<strong>on</strong>g><strong>20</strong>09</str<strong>on</strong>g>, higher impairments related to real estate asset management in AWM and lower brokerage revenues in<br />
PBC as a c<strong>on</strong>sequence of the c<strong>on</strong>tinued wariness <strong>on</strong> the part of retail investors. In CI, net revenues in <str<strong>on</strong>g><strong>20</strong>09</str<strong>on</strong>g><br />
included gains of € 1.0 billi<strong>on</strong> related to our minority stake in <strong>Deutsche</strong> Postbank AG. Revenues in C<strong>on</strong>solidati<strong>on</strong><br />
& Adjustments (C&A) reflected gains of approximately € 460 milli<strong>on</strong> from derivative c<strong>on</strong>tracts used to<br />
hedge effects <strong>on</strong> shareholders’ equity, resulting from obligati<strong>on</strong>s under share-based compensati<strong>on</strong> plans.<br />
Our n<strong>on</strong>interest expenses were € <strong>20</strong>.1 billi<strong>on</strong> in <str<strong>on</strong>g><strong>20</strong>09</str<strong>on</strong>g>, versus € 18.3 billi<strong>on</strong> in <strong>20</strong>08. The development was<br />
mainly driven by increased variable compensati<strong>on</strong> as a result of the improved operating performance. It was<br />
also impacted by the bank payroll tax announced in the U.K. However, this increase was partially counterbalanced<br />
by the impact of changes to the bank’s compensati<strong>on</strong> structure, mainly reflecting an increase in the<br />
relative share of deferred compensati<strong>on</strong> compared with prior periods.<br />
52
In <str<strong>on</strong>g><strong>20</strong>09</str<strong>on</strong>g>, provisi<strong>on</strong> for credit losses was € 2.6 billi<strong>on</strong>, versus € 1.1 billi<strong>on</strong> in <strong>20</strong>08. The increase was due to the<br />
overall deteriorating credit envir<strong>on</strong>ment, including its impact <strong>on</strong> required positi<strong>on</strong>s for assets reclassified in<br />
accordance with IAS 39.<br />
Trends and Uncertainties<br />
The significant increase in net revenues in <str<strong>on</strong>g><strong>20</strong>09</str<strong>on</strong>g> compared to <strong>20</strong>08 was driven by the n<strong>on</strong>-recurrence of certain<br />
mark-downs and of certain trading losses, which mainly occurred in the sec<strong>on</strong>d half <strong>20</strong>08 in CB&S. The<br />
increase also reflected a str<strong>on</strong>ger performance in “flow” trading products, also benefiting from favorable market<br />
c<strong>on</strong>diti<strong>on</strong>s. These factors reflect a successful reorientati<strong>on</strong> of the sales and trading platform towards<br />
customer business and liquid “flow” products. <str<strong>on</strong>g><strong>20</strong>09</str<strong>on</strong>g> revenues additi<strong>on</strong>ally benefited from favorable market<br />
c<strong>on</strong>diti<strong>on</strong>s, including both margins and volumes, particularly in the first half of the year, together with record<br />
full-year revenues in Commodities and Emerging Market Debt trading. Provided that market c<strong>on</strong>diti<strong>on</strong>s normalize<br />
with margin stabilizati<strong>on</strong> at levels which remain higher than in the pre-crisis period and that global<br />
growth c<strong>on</strong>tinues, we see potential for revenue growth.<br />
Revenues in PCAM’s investment management businesses c<strong>on</strong>tinued to suffer in <str<strong>on</strong>g><strong>20</strong>09</str<strong>on</strong>g> from prevailing weak<br />
market c<strong>on</strong>diti<strong>on</strong>s (mainly in the first nine m<strong>on</strong>ths <str<strong>on</strong>g><strong>20</strong>09</str<strong>on</strong>g>). Any <strong>on</strong>going lack of investor c<strong>on</strong>fidence is likely to<br />
cause this trend to c<strong>on</strong>tinue.<br />
In CI, revenues will c<strong>on</strong>tinue to be impacted by the share price and the results of <strong>Deutsche</strong> Postbank AG. In<br />
C&A, we do not expect further significant gains from derivative c<strong>on</strong>tracts used to hedge effects <strong>on</strong> shareholders’<br />
equity resulting from obligati<strong>on</strong>s under our share-based compensati<strong>on</strong> plans going forward.<br />
The increase in provisi<strong>on</strong> for credit losses in <str<strong>on</strong>g><strong>20</strong>09</str<strong>on</strong>g> compared to <strong>20</strong>08 resulted primarily from assets reclassified<br />
in accordance with IAS 39, relating predominantly to exposures in Leveraged Finance. The remaining<br />
increase reflects charges taken in CIB <strong>on</strong> a number of our counterparty exposures in the Americas and in<br />
Europe <strong>on</strong> the back of an overall deteriorating credit envir<strong>on</strong>ment, and in PCAM, predominantly reflecting a<br />
more challenging credit envir<strong>on</strong>ment in Spain and Poland. Based <strong>on</strong> macroec<strong>on</strong>omic outlook, increasing insolvencies<br />
and unemployment rates could negatively impact our loan loss provisi<strong>on</strong>s. This effect could be<br />
mitigated by a n<strong>on</strong>-recurrence of significant provisi<strong>on</strong>s for credit losses for assets reclassified according to<br />
IAS 39.<br />
The increase in compensati<strong>on</strong> and benefits in <str<strong>on</strong>g><strong>20</strong>09</str<strong>on</strong>g> compared to <strong>20</strong>08 mainly reflected higher performancerelated<br />
compensati<strong>on</strong> in line with improved results. It also c<strong>on</strong>tained expenses in respect of the bank payroll<br />
tax announced by the U.K. government. These increasing factors were partly offset by the effects from an<br />
increase of the proporti<strong>on</strong> of deferred compensati<strong>on</strong> compared with prior periods as a c<strong>on</strong>sequence of<br />
changes to our compensati<strong>on</strong> structure. The development of compensati<strong>on</strong> expenses will c<strong>on</strong>tinue to depend<br />
significantly <strong>on</strong> the operating performance of our businesses, the governance of bank executive compensati<strong>on</strong><br />
and future amortizati<strong>on</strong> of deferred compensati<strong>on</strong>.<br />
Severance charges increased in <str<strong>on</strong>g><strong>20</strong>09</str<strong>on</strong>g>, mainly resulting from repositi<strong>on</strong>ing and efficiency programs in PCAM.<br />
Similar measures, which aim to reduce complexity in our operati<strong>on</strong>s, standardize processes across businesses<br />
and expand the offshoring of functi<strong>on</strong>s, are expected to c<strong>on</strong>tinue in <strong>20</strong>10.<br />
53
<strong>20</strong>-F Item 5: Operating and Financial Review and Prospects<br />
The increase in general and administrative expenses in <str<strong>on</strong>g><strong>20</strong>09</str<strong>on</strong>g> compared to <strong>20</strong>08 included charges of<br />
€ 316 milli<strong>on</strong> from a legal settlement with Huntsman Corp. and of € <strong>20</strong>0 milli<strong>on</strong> related to our offer to repurchase<br />
certain products from private investors, partly offset by the n<strong>on</strong>-recurrence of significant specific items<br />
recorded in <strong>20</strong>08. Excluding these factors, general and administrative expenses decreased in <str<strong>on</strong>g><strong>20</strong>09</str<strong>on</strong>g>, following<br />
cost saving initiatives, which are expected to c<strong>on</strong>tribute to a further decline in general and administrative<br />
expenses going forward.<br />
The actual effective tax rate of 4.7 % in <str<strong>on</strong>g><strong>20</strong>09</str<strong>on</strong>g> was impacted by numerous factors, including a str<strong>on</strong>g perfor-<br />
mance of certain U.S. entities, together with improved income projecti<strong>on</strong>s that resulted in the recogniti<strong>on</strong> of<br />
previously unrecognized deferred tax assets. The resoluti<strong>on</strong> of tax audits relating to prior years also had a<br />
positive impact <strong>on</strong> the effective tax rate in the reporting period. The future actual effective tax rate could c<strong>on</strong>tinue<br />
to be influenced by the potential occurrence of specific factors.<br />
Financial Results<br />
The following table presents our c<strong>on</strong>densed c<strong>on</strong>solidated statement of income for <str<strong>on</strong>g><strong>20</strong>09</str<strong>on</strong>g>, <strong>20</strong>08 and <strong>20</strong>07.<br />
in € m.<br />
(unless stated otherwise) <str<strong>on</strong>g><strong>20</strong>09</str<strong>on</strong>g> <strong>20</strong>08 <strong>20</strong>07<br />
N/M – Not meaningful<br />
54<br />
<str<strong>on</strong>g><strong>20</strong>09</str<strong>on</strong>g> increase (decrease)<br />
from <strong>20</strong>08<br />
<strong>20</strong>08 increase (decrease)<br />
from <strong>20</strong>07<br />
in € m. in % in € m. in %<br />
Net interest income 12,459 12,453 8,849 6 0 3,604 41<br />
Provisi<strong>on</strong> for credit losses 2,630 1,076 612 1,554 144 464 76<br />
Net interest income after provisi<strong>on</strong> for credit losses 9,829 11,377 8,237 (1,548) (14) 3,140 38<br />
Commissi<strong>on</strong>s and fee income<br />
Net gains (losses) <strong>on</strong> financial assets/liabilities at fair<br />
8,911 9,741 12,282 (830) (9) (2,541) (21)<br />
value through profit or loss 7,109 (9,992) 7,175 17,101 N/M (17,167) N/M<br />
Net gains (losses) <strong>on</strong> financial assets available for sale (403) 666 793 (1,069) N/M (127) (16)<br />
Net income (loss) from equity method investments 59 46 353 13 28 (307) (87)<br />
Other income (loss) (183) 699 1,377 (882) N/M (678) (49)<br />
Total n<strong>on</strong>interest income 15,493 1,160 21,980 14,333 N/M (<strong>20</strong>,8<strong>20</strong>) (95)<br />
Total net revenues 25,322 12,537 30,217 12,785 102 (17,680) (59)<br />
Compensati<strong>on</strong> and benefits 11,310 9,606 13,122 1,704 18 (3,516) (27)<br />
General and administrative expenses 8,402 8,339 8,038 63 1 301 4<br />
Policyholder benefits and claims 542 (252) 193 794 N/M (445) N/M<br />
Impairment of intangible assets (134) 585 128 (719) N/M 457 N/M<br />
Restructuring activities – – (13) – N/M 13 N/M<br />
Total n<strong>on</strong>interest expenses <strong>20</strong>,1<strong>20</strong> 18,278 21,468 1,842 10 (3,190) (15)<br />
Income (loss) before income taxes 5,<strong>20</strong>2 (5,741) 8,749 10,943 N/M (14,490) N/M<br />
Income tax expense (benefit) 244 (1,845) 2,239 2,089 N/M (4,084) N/M<br />
Net income (loss) 4,958 (3,896) 6,510 8,854 N/M (10,406) N/M<br />
Net income (loss) attributable to minority interest<br />
Net income (loss) attributable to <strong>Deutsche</strong> <strong>Bank</strong><br />
(15) (61) 36 46 (75) (97) N/M<br />
shareholders 4,973 (3,835) 6,474 8,808 N/M (10,309) N/M
Net Interest Income<br />
The following table sets forth data related to our Net interest income.<br />
in € m.<br />
(unless stated otherwise) <str<strong>on</strong>g><strong>20</strong>09</str<strong>on</strong>g> <strong>20</strong>08 <strong>20</strong>07<br />
ppt – Percentage points<br />
1 Average balances for each year are calculated in general based up<strong>on</strong> m<strong>on</strong>th-end balances.<br />
2 Gross interest yield is the average interest rate earned <strong>on</strong> our average interest-earning assets.<br />
3 Gross interest rate paid is the average interest rate paid <strong>on</strong> our average interest-bearing liabilities.<br />
4 Net interest spread is the difference between the average interest rate earned <strong>on</strong> average interest-earning assets and the average interest rate paid <strong>on</strong> average interest-bearing<br />
liabilities.<br />
5 Net interest margin is net interest income expressed as a percentage of average interest-earning assets.<br />
Net interest income in <str<strong>on</strong>g><strong>20</strong>09</str<strong>on</strong>g> was € 12.5 billi<strong>on</strong>, virtually unchanged compared to <strong>20</strong>08. Interest income and<br />
interest expenses decreased significantly by € 27.6 billi<strong>on</strong> each, mainly reflecting decreasing interest rate<br />
levels as a result of further rate cuts by central banks in <str<strong>on</strong>g><strong>20</strong>09</str<strong>on</strong>g>, in resp<strong>on</strong>se to the credit crunch, and targeted<br />
asset reducti<strong>on</strong>s. Average interest earning assets, mainly trading assets, were reduced more significantly<br />
than average interest-bearing liabilities. The resulting decline in net interest income was offset by the positive<br />
effects from lower funding rates compared to <strong>20</strong>08. These developments resulted in a widening of our net<br />
interest spread by 46 basis points and of our net interest margin by 40 basis points.<br />
The development of our net interest income is also impacted by the accounting treatment of some of our<br />
hedging-related derivative transacti<strong>on</strong>s. We enter into n<strong>on</strong>trading derivative transacti<strong>on</strong>s primarily as ec<strong>on</strong>omic<br />
hedges of the interest rate risks of our n<strong>on</strong>trading interest-earning assets and interest-bearing liabilities.<br />
Some of these derivatives qualify as hedges for accounting purposes while others do not. When derivative<br />
transacti<strong>on</strong>s qualify as hedges of interest rate risks for accounting purposes, the interest arising from the<br />
derivatives is reported in interest income and expense, where it offsets interest flows from the hedged items.<br />
When derivatives do not qualify for hedge accounting treatment, the interest flows that arise from those derivatives<br />
will appear in trading income.<br />
55<br />
<str<strong>on</strong>g><strong>20</strong>09</str<strong>on</strong>g> increase (decrease)<br />
from <strong>20</strong>08<br />
<strong>20</strong>08 increase (decrease)<br />
from <strong>20</strong>07<br />
in € m. in % in € m. in %<br />
Total interest and similar income 26,953 54,549 64,675 (27,596) (51) (10,126) (16)<br />
Total interest expenses 14,494 42,096 55,826 (27,602) (66) (13,730) (25)<br />
Net interest income 12,459 12,453 8,849 6 0 3,604 41<br />
Average interest-earning assets1 879,601 1,216,666 1,226,191 (337,065) (28) (9,525) (1)<br />
Average interest-bearing liabilities1 853,383 1,179,631 1,150,051 (326,248) (28) 29,580 3<br />
Gross interest yield2 3.06 % 4.48 % 5.27 % (1.42) ppt (32) (0.79) ppt (15)<br />
Gross interest rate paid3 1.70 % 3.57 % 4.85 % (1.87) ppt (52) (1.28) ppt (26)<br />
Net interest spread4 1.37 % 0.91 % 0.42 % 0.46 ppt 51 0.49 ppt 117<br />
Net interest margin5 1.42 % 1.02 % 0.72 % 0.40 ppt 39 0.30 ppt 42
<strong>20</strong>-F Item 5: Operating and Financial Review and Prospects<br />
Net Gains (Losses) <strong>on</strong> Financial Assets/Liabilities at Fair Value through Profit or Loss<br />
The following table sets forth data related to our Net gains (losses) <strong>on</strong> financial assets/liabilities at fair value<br />
through profit or loss.<br />
<str<strong>on</strong>g><strong>20</strong>09</str<strong>on</strong>g> increase (decrease) <strong>20</strong>08 increase (decrease)<br />
from <strong>20</strong>08<br />
from <strong>20</strong>07<br />
in € m.<br />
(unless stated otherwise) <str<strong>on</strong>g><strong>20</strong>09</str<strong>on</strong>g> <strong>20</strong>08 <strong>20</strong>07 in € m. in % in € m. in %<br />
CIB – Sales & Trading (equity) 1,125 (1,513) 3,335 2,638 N/M (4,848) N/M<br />
CIB – Sales & Trading (debt and other products) 4,375 (6,647) 3,858 11,022 N/M (10,505) N/M<br />
Other<br />
Total net gains (losses) <strong>on</strong> financial assets/liabilities<br />
1,609 (1,832) (18) 3,441 N/M (1,814) N/M<br />
at fair value through profit or loss 7,109 (9,992) 7,175 17,101 N/M (17,167) N/M<br />
N/M – Not meaningful<br />
Net gains (losses) <strong>on</strong> financial assets/liabilities at fair value through profit or loss from Sales & Trading (debt<br />
and other products) were gains of € 4.4 billi<strong>on</strong> in <str<strong>on</strong>g><strong>20</strong>09</str<strong>on</strong>g>, compared to losses of € 6.6 billi<strong>on</strong> in <strong>20</strong>08. This development<br />
was mainly driven by significant losses in our credit trading businesses and mark-downs relating to<br />
provisi<strong>on</strong>s against m<strong>on</strong>oline insurers, residential mortgage-backed securities and commercial real estate<br />
loans recorded in <strong>20</strong>08. In additi<strong>on</strong>, the result in <str<strong>on</strong>g><strong>20</strong>09</str<strong>on</strong>g> included a str<strong>on</strong>g performance in ‘flow’ trading products.<br />
In Sales & Trading (equity), net gains (losses) <strong>on</strong> financial assets/liabilities at fair value through profit or<br />
loss were gains of € 1.1 billi<strong>on</strong> in <str<strong>on</strong>g><strong>20</strong>09</str<strong>on</strong>g>, compared to losses of € 1.5 billi<strong>on</strong> in <strong>20</strong>08, mainly due to the n<strong>on</strong>recurrence<br />
of losses recognized in Equity Derivatives and Equity Proprietary Trading in <strong>20</strong>08. In Other products,<br />
net gains of € 1.6 billi<strong>on</strong> <strong>on</strong> financial assets/liabilities at fair value through profit or loss in <str<strong>on</strong>g><strong>20</strong>09</str<strong>on</strong>g> were<br />
mainly related to our minority stake in <strong>Deutsche</strong> Postbank AG recognized in CI and to gains from derivative<br />
c<strong>on</strong>tracts used to hedge effects <strong>on</strong> shareholders’ equity, resulting from obligati<strong>on</strong>s under share-based compensati<strong>on</strong><br />
plans recorded in C&A. Net losses of € 1.8 billi<strong>on</strong> from Other products in <strong>20</strong>08 included net markdowns<br />
of € 1.7 billi<strong>on</strong> <strong>on</strong> leveraged finance loans and loan commitments.<br />
Net Interest Income and Net Gains (Losses) <strong>on</strong> Financial Assets/Liabilities<br />
at Fair Value through Profit or Loss<br />
Our trading and risk management businesses include significant activities in interest rate instruments and<br />
related derivatives. Under IFRS, interest and similar income earned from trading instruments and financial<br />
instruments designated at fair value through profit or loss (e.g. coup<strong>on</strong> and dividend income), and the costs<br />
of funding net trading positi<strong>on</strong>s are part of net interest income. Our trading activities can periodically shift<br />
income between net interest income and net gains (losses) <strong>on</strong> financial assets/liabilities at fair value through<br />
profit or loss depending <strong>on</strong> a variety of factors, including risk management strategies.<br />
56
In order to provide a more business-focused discussi<strong>on</strong>, the following table presents net interest income and<br />
net gains (losses) <strong>on</strong> financial assets/liabilities at fair value through profit or loss by group divisi<strong>on</strong> and by<br />
product within the Corporate and Investment <strong>Bank</strong>.<br />
in € m.<br />
(unless stated otherwise) <str<strong>on</strong>g><strong>20</strong>09</str<strong>on</strong>g> <strong>20</strong>08 <strong>20</strong>07<br />
N/M – Not meaningful<br />
1 This breakdown reflects net interest income and net gains (losses) <strong>on</strong> financial assets/liabilities at fair value through profit or loss <strong>on</strong>ly. For a discussi<strong>on</strong> of the group divisi<strong>on</strong>s’ total<br />
revenues by product please refer to “Results of Operati<strong>on</strong>s by Segment”.<br />
2 Includes the net interest spread <strong>on</strong> loans as well as the fair value changes of credit default swaps and loans designated at fair value through profit or loss.<br />
3 Includes net interest income and net gains (losses) <strong>on</strong> financial assets/liabilities at fair value through profit or loss of originati<strong>on</strong>, advisory and other products.<br />
Corporate and Investment <strong>Bank</strong> (CIB). Combined net interest income and net gains (losses) <strong>on</strong> financial<br />
assets/liabilities at fair value through profit or loss from Sales & Trading were € 11.8 billi<strong>on</strong> in <str<strong>on</strong>g><strong>20</strong>09</str<strong>on</strong>g>, compared<br />
to negative € 1.6 billi<strong>on</strong> in <strong>20</strong>08. The main drivers for the increase were the n<strong>on</strong>-recurrence of losses in Equity<br />
Derivatives, Equity Proprietary Trading and Credit Trading, as well as significantly lower mark-downs <strong>on</strong> creditrelated<br />
exposures. In additi<strong>on</strong>, the result in <str<strong>on</strong>g><strong>20</strong>09</str<strong>on</strong>g> included a str<strong>on</strong>g performance in ‘flow’ trading products. The<br />
decrease in Loan products was driven by lower interest income and gains (losses) <strong>on</strong> financial assets/<br />
liabilities at fair value through profit or loss in the commercial real estate business, partly offset by mark-tomarket<br />
gains in <str<strong>on</strong>g><strong>20</strong>09</str<strong>on</strong>g>, versus losses in <strong>20</strong>08, <strong>on</strong> the fair value loan and hedge portfolio. In Transacti<strong>on</strong> services,<br />
combined net interest income and net gains (losses) <strong>on</strong> financial assets/liabilities at fair value through profit<br />
or loss decreased by € 180 milli<strong>on</strong>, primarily attributable to the low interest rate envir<strong>on</strong>ment and lower depository<br />
receipts. The improvement of € 2.1 billi<strong>on</strong> in Remaining products resulted mainly from significantly lower<br />
net mark-downs <strong>on</strong> leveraged loans and loan commitments in <str<strong>on</strong>g><strong>20</strong>09</str<strong>on</strong>g> compared to <strong>20</strong>08. In additi<strong>on</strong> mark-tomarket<br />
gains in <str<strong>on</strong>g><strong>20</strong>09</str<strong>on</strong>g>, versus mark-to-market losses in <strong>20</strong>08, <strong>on</strong> investments held to back insurance policyholder<br />
claims in Abbey Life (offset in Policyholder benefits and claims in N<strong>on</strong>interest expenses) c<strong>on</strong>tributed to<br />
the increase.<br />
57<br />
<str<strong>on</strong>g><strong>20</strong>09</str<strong>on</strong>g> increase (decrease)<br />
from <strong>20</strong>08<br />
<strong>20</strong>08 increase (decrease)<br />
from <strong>20</strong>07<br />
in € m. in % in € m. in %<br />
Net interest income<br />
Total net gains (losses) <strong>on</strong> financial assets/liabilities at<br />
12,459 12,453 8,849 6 0 3,604 41<br />
fair value through profit or loss<br />
Total net interest income and net gains (losses) <strong>on</strong><br />
financial assets/liabilities at fair value through profit<br />
7,109 (9,992) 7,175 17,101 N/M (17,167) N/M<br />
or loss 19,568 2,461 16,024 17,107 N/M (13,563) (85)<br />
Breakdown by Group Divisi<strong>on</strong>/CIB product:1<br />
Sales & Trading (equity) 2,047 (1,895) 3,117 3,942 N/M (5,012) N/M<br />
Sales & Trading (debt and other products) 9,735 317 7,483 9,418 N/M (7,166) (96)<br />
Total Sales & Trading 11,782 (1,578) 10,600 13,360 N/M (12,178) N/M<br />
Loan products 2 767 1,014 499 (247) (24) 515 103<br />
Transacti<strong>on</strong> services 1,177 1,358 1,297 (180) (13) 61 5<br />
Remaining products 3 239 (1,821) (118) 2,060 N/M (1,703) N/M<br />
Total Corporate and Investment <strong>Bank</strong> 13,966 (1,027) 12,278 14,993 N/M (13,305) N/M<br />
Private Clients and Asset Management 4,160 3,871 3,529 290 7 342 10<br />
Corporate Investments 793 (172) 157 965 N/M (329) N/M<br />
C<strong>on</strong>solidati<strong>on</strong> & Adjustments<br />
Total net interest income and net gains (losses) <strong>on</strong><br />
financial assets/liabilities at fair value through profit<br />
649 (211) 61 859 N/M (272) N/M<br />
or loss 19,568 2,461 16,024 17,107 N/M (13,563) (85)
<strong>20</strong>-F Item 5: Operating and Financial Review and Prospects<br />
Private Clients and Asset Management (PCAM). Combined net interest income and net gains (losses) <strong>on</strong><br />
financial assets/liabilities at fair value through profit or loss were € 4.2 billi<strong>on</strong> in <str<strong>on</strong>g><strong>20</strong>09</str<strong>on</strong>g>, an increase of<br />
€ 290 milli<strong>on</strong>, or 7 %, compared to <strong>20</strong>08. The increase included higher net interest income from Loan products,<br />
mainly in PBC from increased loan margins, and from Other products, mainly driven by PBC’s asset and<br />
liability management functi<strong>on</strong>.<br />
Corporate Investments (CI). Combined net interest income and net gains (losses) <strong>on</strong> financial assets/liabilities<br />
at fair value through profit or loss were € 793 milli<strong>on</strong> in <str<strong>on</strong>g><strong>20</strong>09</str<strong>on</strong>g>, compared to negative € 172 milli<strong>on</strong> in <strong>20</strong>08. The<br />
development primarily reflects gains related to our minority stake in <strong>Deutsche</strong> Postbank AG recognized during<br />
<str<strong>on</strong>g><strong>20</strong>09</str<strong>on</strong>g>.<br />
C<strong>on</strong>solidati<strong>on</strong> & Adjustments. Combined net interest income and net gains (losses) <strong>on</strong> financial assets/<br />
liabilities at fair value through profit or loss were € 649 milli<strong>on</strong> in <str<strong>on</strong>g><strong>20</strong>09</str<strong>on</strong>g>, compared to negative € 211 milli<strong>on</strong> in<br />
<strong>20</strong>08. The <str<strong>on</strong>g><strong>20</strong>09</str<strong>on</strong>g> result included gains from derivative c<strong>on</strong>tracts used to hedge effects <strong>on</strong> shareholders’ equity,<br />
resulting from obligati<strong>on</strong>s under share-based compensati<strong>on</strong> plans, and higher net interest income <strong>on</strong> n<strong>on</strong>divisi<strong>on</strong>alized<br />
assets/liabilities, including taxes, compared to <strong>20</strong>08.<br />
Provisi<strong>on</strong> for Credit Losses<br />
Provisi<strong>on</strong> for credit losses was € 2.6 billi<strong>on</strong> in <str<strong>on</strong>g><strong>20</strong>09</str<strong>on</strong>g>, versus € 1.1 billi<strong>on</strong> in <strong>20</strong>08. The provisi<strong>on</strong> in CIB was<br />
€ 1.8 billi<strong>on</strong>, versus € 408 milli<strong>on</strong> in the prior year, primarily reflecting a significant increase in the provisi<strong>on</strong><br />
for assets reclassified in accordance with IAS 39, relating predominantly to exposures in Leveraged Finance.<br />
The remaining increase reflects impairment charges taken <strong>on</strong> a number of our counterparty exposures in the<br />
Americas and in Europe <strong>on</strong> the back of an overall deteriorating credit envir<strong>on</strong>ment. The provisi<strong>on</strong> in PCAM<br />
was € 806 milli<strong>on</strong>, versus € 668 milli<strong>on</strong> in the prior year, predominantly reflecting a more challenging credit<br />
envir<strong>on</strong>ment in Spain and Poland. Provisi<strong>on</strong> for credit losses in <str<strong>on</strong>g><strong>20</strong>09</str<strong>on</strong>g> was positively impacted by changes in<br />
certain parameter and model assumpti<strong>on</strong>s, which reduced the provisi<strong>on</strong> by € 87 milli<strong>on</strong> in CIB and by<br />
€ 146 milli<strong>on</strong> in PCAM.<br />
For further informati<strong>on</strong> <strong>on</strong> the provisi<strong>on</strong> for loan losses see “Item 11: Quantitative and Qualitative Disclosures<br />
about Credit, Market and Other Risk – Credit Risk – Movements in the Allowance for Loan Losses”.<br />
58
Remaining N<strong>on</strong>interest Income<br />
The following table sets forth informati<strong>on</strong> <strong>on</strong> our Remaining n<strong>on</strong>interest income.<br />
in € m.<br />
(unless stated otherwise) <str<strong>on</strong>g><strong>20</strong>09</str<strong>on</strong>g> <strong>20</strong>08 <strong>20</strong>07<br />
Commissi<strong>on</strong>s and fee income. Total commissi<strong>on</strong>s and fee income was € 8.9 billi<strong>on</strong> in <str<strong>on</strong>g><strong>20</strong>09</str<strong>on</strong>g>, a decrease of<br />
€ 830 milli<strong>on</strong>, or 9 %, compared to <strong>20</strong>08. Commissi<strong>on</strong>s and fees from fiduciary activities decreased € 489 milli<strong>on</strong><br />
compared to the prior year, driven by lower assets under management in AM, as a c<strong>on</strong>sequence of the<br />
prevailing weak market c<strong>on</strong>diti<strong>on</strong>s (mainly in the first nine m<strong>on</strong>ths of <str<strong>on</strong>g><strong>20</strong>09</str<strong>on</strong>g>). Underwriting and advisory fees<br />
improved by € 426 milli<strong>on</strong>, or 32 %, mainly from increased primary issuances as market activity increased<br />
across all regi<strong>on</strong>s, partly offset by decreased fees from advisory as a result of c<strong>on</strong>tinued low volumes of<br />
market activity. Brokerage fees decreased by € 767 milli<strong>on</strong>, or 31 %, primarily driven by lower customer<br />
demand in <str<strong>on</strong>g><strong>20</strong>09</str<strong>on</strong>g> following the market turbulence in <strong>20</strong>08. Fees for other customer services were unchanged<br />
compared to <strong>20</strong>08.<br />
Net gains (losses) <strong>on</strong> financial assets available for sale. Net losses <strong>on</strong> financial assets available for sale were<br />
€ 403 milli<strong>on</strong> in <str<strong>on</strong>g><strong>20</strong>09</str<strong>on</strong>g>, versus net gains of € 666 milli<strong>on</strong> in <strong>20</strong>08. The losses in <str<strong>on</strong>g><strong>20</strong>09</str<strong>on</strong>g> were primarily attributable<br />
to impairment charges related to investments in CB&S and to AM’s real estate business. The net gains in<br />
<strong>20</strong>08 were mainly driven by gains of € 1.3 billi<strong>on</strong> from the sale of industrial holdings in CI, partly offset by<br />
impairment charges in CIB’s sales and trading areas, including a € 490 milli<strong>on</strong> impairment loss <strong>on</strong> available for<br />
sale positi<strong>on</strong>s.<br />
Net income (loss) from equity method investments. Net income from equity method investments was<br />
€ 59 milli<strong>on</strong> and € 46 milli<strong>on</strong> in <str<strong>on</strong>g><strong>20</strong>09</str<strong>on</strong>g> and <strong>20</strong>08, respectively. In <str<strong>on</strong>g><strong>20</strong>09</str<strong>on</strong>g>, income from our investment in <strong>Deutsche</strong><br />
Postbank AG, recorded in CI, was partly offset by impairment charges <strong>on</strong> certain equity method investments<br />
in our commercial real estate business in CB&S. There were no significant individual items included in <strong>20</strong>08.<br />
59<br />
<str<strong>on</strong>g><strong>20</strong>09</str<strong>on</strong>g> increase (decrease)<br />
from <strong>20</strong>08<br />
<strong>20</strong>08 increase (decrease)<br />
from <strong>20</strong>07<br />
in € m. in % in € m. in %<br />
Commissi<strong>on</strong>s and fee income1 8,911 9,741 12,282 (830) (9) (2,541) (21)<br />
Net gains (losses) <strong>on</strong> financial assets available for sale (403) 666 793 (1,069) N/M (127) (16)<br />
Net income (loss) from equity method investments 59 46 353 13 28 (307) (87)<br />
Other income (loss) (183) 699 1,377 (882) N/M (678) (49)<br />
Total remaining n<strong>on</strong>interest income 8,384 11,152 14,805 (2,768) (25) (3,653) (25)<br />
N/M – Not meaningful<br />
1 Includes:<br />
<str<strong>on</strong>g><strong>20</strong>09</str<strong>on</strong>g> <strong>20</strong>08 <strong>20</strong>07 in € m. in % in € m. in %<br />
Commissi<strong>on</strong>s and fees from fiduciary activities:<br />
Commissi<strong>on</strong>s for administrati<strong>on</strong> 392 384 427 8 2 (43) (10)<br />
Commissi<strong>on</strong>s for assets under management 2,319 2,815 3,376 (496) (18) (561) (17)<br />
Commissi<strong>on</strong>s for other securities business 214 215 162 (1) (0) 53 33<br />
Total<br />
Commissi<strong>on</strong>s, broker’s fees, mark-ups <strong>on</strong> securities<br />
underwriting and other securities activities:<br />
2,925 3,414 3,965 (489) (14) (551) (14)<br />
Underwriting and advisory fees 1,767 1,341 2,515 426 32 (1,174) (47)<br />
Brokerage fees 1,682 2,449 2,975 (767) (31) (526) (18)<br />
Total 3,449 3,790 5,490 (341) (9) (1,700) (31)<br />
Fees for other customer services 2,537 2,537 2,827 0 0 (289) (10)<br />
Total commissi<strong>on</strong>s and fee income 8,911 9,741 12,282 (830) (9) (2,541) (21)
<strong>20</strong>-F Item 5: Operating and Financial Review and Prospects<br />
Other income. Total Other income (loss) was a loss of € 183 milli<strong>on</strong> in <str<strong>on</strong>g><strong>20</strong>09</str<strong>on</strong>g>. The decrease of € 882 milli<strong>on</strong><br />
compared to <strong>20</strong>08 reflected primarily an impairment charge of € 575 milli<strong>on</strong> <strong>on</strong> The Cosmopolitan Resort and<br />
Casino property in <str<strong>on</strong>g><strong>20</strong>09</str<strong>on</strong>g> and a lower result from derivatives qualifying for hedge accounting in <str<strong>on</strong>g><strong>20</strong>09</str<strong>on</strong>g> compared<br />
to <strong>20</strong>08.<br />
N<strong>on</strong>interest Expenses<br />
The following table sets forth informati<strong>on</strong> <strong>on</strong> our n<strong>on</strong>interest expenses.<br />
in € m.<br />
(unless stated otherwise) <str<strong>on</strong>g><strong>20</strong>09</str<strong>on</strong>g> <strong>20</strong>08 <strong>20</strong>07<br />
N/M – Not meaningful<br />
1 Includes:<br />
<str<strong>on</strong>g><strong>20</strong>09</str<strong>on</strong>g> <strong>20</strong>08 <strong>20</strong>07 in € m. in % in € m. in %<br />
IT costs 1,759 1,818 1,863 (59) (3) (45) (2)<br />
Occupancy, furniture and equipment expenses 1,457 1,434 1,347 23 2 87 6<br />
Professi<strong>on</strong>al service fees 1,088 1,164 1,257 (76) (7) (93) (7)<br />
Communicati<strong>on</strong> and data services 672 698 678 (26) (4) <strong>20</strong> 3<br />
Travel and representati<strong>on</strong> expenses 408 504 554 (96) (19) (50) (9)<br />
Payment, clearing and custodian services 406 415 436 (9) (2) (21) (5)<br />
Marketing expenses 278 373 411 (95) (25) (38) (9)<br />
Other expenses 2,334 1,933 1,492 401 21 441 30<br />
Total general and administrative expenses 8,402 8,339 8,038 63 1 301 4<br />
Compensati<strong>on</strong> and benefits. The increase of € 1.7 billi<strong>on</strong>, or 18 %, in <str<strong>on</strong>g><strong>20</strong>09</str<strong>on</strong>g> compared to <strong>20</strong>08 reflected a higher<br />
variable compensati<strong>on</strong> as a result of improved operating performance. It was also impacted by € 225 milli<strong>on</strong> in<br />
respect of the bank payroll tax announced by the U.K. government. However, this increase was partially offset<br />
by the positive impact of changes to our compensati<strong>on</strong> structure, mainly reflecting an increased proporti<strong>on</strong> of<br />
deferred compensati<strong>on</strong> compared with prior periods, in line with the requirements of the Bundesanstalt für<br />
Finanzdienstleistungsaufsicht (BaFin, German Financial Supervisory Authority) and the guidelines agreed at<br />
the G-<strong>20</strong> meeting in Pittsburgh in the U.S., in September <str<strong>on</strong>g><strong>20</strong>09</str<strong>on</strong>g>.<br />
General and administrative expenses. General and administrative expenses increased by € 63 milli<strong>on</strong> in <str<strong>on</strong>g><strong>20</strong>09</str<strong>on</strong>g><br />
compared to <strong>20</strong>08. The development in both years was impacted by specific significant charges. Such<br />
charges were higher in <str<strong>on</strong>g><strong>20</strong>09</str<strong>on</strong>g> than in <strong>20</strong>08. In <str<strong>on</strong>g><strong>20</strong>09</str<strong>on</strong>g>, these included € 316 milli<strong>on</strong> from a legal settlement with<br />
Huntsman Corp. and € <strong>20</strong>0 milli<strong>on</strong> related to our offer to repurchase certain products from private investors,<br />
both reflected in Other expenses. In <strong>20</strong>08, a provisi<strong>on</strong> of € 98 milli<strong>on</strong> related to the obligati<strong>on</strong> to repurchase<br />
Aucti<strong>on</strong> Rate Preferred (“ARP”) securities/Aucti<strong>on</strong> Rate Securities (“ARS”) at par from retail clients following a<br />
settlement in the U.S. was recorded in Other expenses. Without these specific charges, General and administrative<br />
expenses were down in <str<strong>on</strong>g><strong>20</strong>09</str<strong>on</strong>g> compared to <strong>20</strong>08, mainly from lower expenses for marketing, travel,<br />
professi<strong>on</strong>al services and IT.<br />
60<br />
<str<strong>on</strong>g><strong>20</strong>09</str<strong>on</strong>g> increase (decrease)<br />
from <strong>20</strong>08<br />
<strong>20</strong>08 increase (decrease)<br />
from <strong>20</strong>07<br />
in € m. in % in € m. in %<br />
Compensati<strong>on</strong> and benefits 11,310 9,606 13,122 1,704 18 (3,516) (27)<br />
General and administrative expenses1 8,402 8,339 8,038 63 1 301 4<br />
Policyholder benefits and claims 542 (252) 193 794 N/M (445) N/M<br />
Impairment of intangible assets (134) 585 128 (719) N/M 457 N/M<br />
Restructuring activities – – (13) – N/M 13 N/M<br />
Total n<strong>on</strong>interest expenses <strong>20</strong>,1<strong>20</strong> 18,278 21,468 1,842 10 (3,190) (15)
Policyholder benefits and claims. The charge of € 542 milli<strong>on</strong> in the current year, compared to a credit of<br />
€ 252 milli<strong>on</strong> in <strong>20</strong>08, resulted primarily from the aforementi<strong>on</strong>ed effects from Abbey Life. These insurancerelated<br />
charges are offset by related net gains <strong>on</strong> financial assets/liabilities at fair value through profit or loss.<br />
Impairment of intangible assets. Included in <str<strong>on</strong>g><strong>20</strong>09</str<strong>on</strong>g> was the reversal of an impairment charge <strong>on</strong> intangible<br />
assets of € 291 milli<strong>on</strong> in AM, related to DWS Investments in the U.S. (formerly DWS Scudder), which had<br />
been taken in the fourth quarter <strong>20</strong>08. Also included were goodwill impairment charges of € 151 milli<strong>on</strong> in<br />
<str<strong>on</strong>g><strong>20</strong>09</str<strong>on</strong>g> and of € 270 milli<strong>on</strong> in <strong>20</strong>08, which were related to a c<strong>on</strong>solidated RREEF infrastructure investment.<br />
Income Tax Expense<br />
A tax expense of € 244 milli<strong>on</strong> was recorded in <str<strong>on</strong>g><strong>20</strong>09</str<strong>on</strong>g>, compared to an income tax benefit of € 1.8 billi<strong>on</strong> in the<br />
prior year. The tax expense in <str<strong>on</strong>g><strong>20</strong>09</str<strong>on</strong>g> benefited from the recogniti<strong>on</strong> of deferred tax assets in the U.S., which<br />
reflects str<strong>on</strong>g current performance and improved income projecti<strong>on</strong>s of <strong>Deutsche</strong> <strong>Bank</strong> entities within that tax<br />
jurisdicti<strong>on</strong>, specific tax items including the resoluti<strong>on</strong> of tax audits relating to prior years, and tax exempt<br />
income. The net tax benefit in <strong>20</strong>08 was mainly driven by the geographic mix of income/loss and the valuati<strong>on</strong><br />
of unused tax losses. The effective tax rates were 4.7 % in <str<strong>on</strong>g><strong>20</strong>09</str<strong>on</strong>g> and 32.1 % in <strong>20</strong>08.<br />
Results of Operati<strong>on</strong>s by Segment (<str<strong>on</strong>g><strong>20</strong>09</str<strong>on</strong>g> vs. <strong>20</strong>08)<br />
The following is a discussi<strong>on</strong> of the results of our business segments. See Note [4] to the c<strong>on</strong>solidated financial<br />
statements for informati<strong>on</strong> regarding<br />
— our organizati<strong>on</strong>al structure;<br />
— effects of significant acquisiti<strong>on</strong>s and divestitures <strong>on</strong> segmental results;<br />
— changes in the format of our segment disclosure;<br />
— the framework of our management reporting systems;<br />
— c<strong>on</strong>solidating and other adjustments to the total results of operati<strong>on</strong>s of our business segments;<br />
— definiti<strong>on</strong>s of n<strong>on</strong>-GAAP financial measures that are used with respect to each segment, and<br />
— the rati<strong>on</strong>ale for including or excluding items in deriving the measures.<br />
61
<strong>20</strong>-F Item 5: Operating and Financial Review and Prospects<br />
The criteri<strong>on</strong> for segmentati<strong>on</strong> into divisi<strong>on</strong>s is our organizati<strong>on</strong>al structure as it existed at December 31,<br />
<str<strong>on</strong>g><strong>20</strong>09</str<strong>on</strong>g>. Segment results were prepared in accordance with our management reporting systems.<br />
<str<strong>on</strong>g><strong>20</strong>09</str<strong>on</strong>g> Corporate<br />
in € m.<br />
(unless stated otherwise)<br />
and<br />
Investment<br />
<strong>Bank</strong><br />
N/M – Not meaningful<br />
1 Includes a gain from the sale of industrial holdings (Daimler AG) of € 236 milli<strong>on</strong>, a reversal of impairment of intangible assets (Asset Management) of € 291 milli<strong>on</strong> (the related<br />
impairment had been recorded in <strong>20</strong>08), an impairment charge of € 278 milli<strong>on</strong> <strong>on</strong> industrial holdings and an impairment of intangible assets (Corporate Investments) of € 151 milli<strong>on</strong><br />
which are excluded from the Group’s target definiti<strong>on</strong>.<br />
2 The sum of corporate divisi<strong>on</strong>s does not necessarily equal the total of the corresp<strong>on</strong>ding group divisi<strong>on</strong> because of c<strong>on</strong>solidati<strong>on</strong> items between corporate divisi<strong>on</strong>s, which are to be<br />
eliminated <strong>on</strong> group divisi<strong>on</strong> level. The same approach holds true for the sum of group divisi<strong>on</strong>s compared to ‘Total C<strong>on</strong>solidated’.<br />
3 For management reporting purposes goodwill and other intangible assets with indefinite lives are explicitly assigned to the respective divisi<strong>on</strong>s. Average active equity is first allocated<br />
to divisi<strong>on</strong>s according to goodwill and intangible assets; remaining average active equity is allocated to divisi<strong>on</strong>s in proporti<strong>on</strong> to the ec<strong>on</strong>omic capital calculated for them.<br />
4 For the calculati<strong>on</strong> of pre-tax return <strong>on</strong> average active equity please refer to Note [4]. For ‘Total c<strong>on</strong>solidated’, pre-tax return <strong>on</strong> average shareholders’ equity is 15 %.<br />
N/M – Not meaningful<br />
1 Includes gains from the sale of industrial holdings (Daimler AG, Allianz SE and Linde AG) of € 1,228 milli<strong>on</strong>, a gain from the sale of the investment in Arcor AG & Co. KG of<br />
€ 97 milli<strong>on</strong> and an impairment of intangible assets (Asset Management) of € 572 milli<strong>on</strong>, which are excluded from the Group’s target definiti<strong>on</strong>.<br />
2 The sum of corporate divisi<strong>on</strong>s does not necessarily equal the total of the corresp<strong>on</strong>ding group divisi<strong>on</strong> because of c<strong>on</strong>solidati<strong>on</strong> items between corporate divisi<strong>on</strong>s, which are to be<br />
eliminated <strong>on</strong> group divisi<strong>on</strong> level. The same approach holds true for the sum of group divisi<strong>on</strong>s compared to ‘Total C<strong>on</strong>solidated’.<br />
3 For management reporting purposes goodwill and other intangible assets with indefinite lives are explicitly assigned to the respective divisi<strong>on</strong>s. Average active equity is first allocated<br />
to divisi<strong>on</strong>s according to goodwill and intangible assets; remaining average active equity is allocated to divisi<strong>on</strong>s in proporti<strong>on</strong> to the ec<strong>on</strong>omic capital calculated for them.<br />
4 For the calculati<strong>on</strong> of pre-tax return <strong>on</strong> average active equity please refer to Note [4]. For ‘Total c<strong>on</strong>solidated’, pre-tax return <strong>on</strong> average shareholders’ equity is (17) %.<br />
62<br />
Private<br />
Clients and<br />
Asset<br />
Management<br />
Corporate<br />
Investments<br />
Total<br />
Management<br />
<str<strong>on</strong>g>Report</str<strong>on</strong>g>ing<br />
C<strong>on</strong>solidati<strong>on</strong><br />
&<br />
Adjustments<br />
Total<br />
C<strong>on</strong>solidated<br />
Net revenues 18,804 8,264 1,044 28,112 (159) 27,952<br />
Provisi<strong>on</strong> for credit losses 1,816 806 8 2,630 (0) 2,630<br />
Total n<strong>on</strong>interest expenses<br />
therein:<br />
12,678 6,804 581 <strong>20</strong>,063 57 <strong>20</strong>,1<strong>20</strong><br />
Policyholder benefits and claims 541 – – 541 2 542<br />
Impairment of intangible assets 5 (291) 151 (134) – (134)<br />
Restructuring activities – – – – – –<br />
Minority interest (2) (7) (1) (10) 10 –<br />
Income (loss) before income taxes 4,312 660 456 5,428 (226) 5,<strong>20</strong>2 1<br />
Cost/income ratio 67 % 82 % 56 % 71 % N/M 72 %<br />
Assets2 1,343,824 174,738 28,456 1,491,108 9,556 1,500,664<br />
Average active equity3 19,041 8,408 4,323 31,772 2,840 34,613<br />
Pre-tax return <strong>on</strong> average active equity4 23 % 8 % 11 % 17 % N/M 15 %<br />
<strong>20</strong>08 Corporate<br />
in € m.<br />
(unless stated otherwise)<br />
and<br />
Investment<br />
<strong>Bank</strong><br />
Private<br />
Clients and<br />
Asset<br />
Management<br />
Corporate<br />
Investments<br />
Total<br />
Management<br />
<str<strong>on</strong>g>Report</str<strong>on</strong>g>ing<br />
C<strong>on</strong>solidati<strong>on</strong><br />
&<br />
Adjustments<br />
Total<br />
C<strong>on</strong>solidated<br />
Net revenues 3,<strong>20</strong>1 9,041 1,290 13,532 82 13,613<br />
Provisi<strong>on</strong> for credit losses 408 668 (1) 1,075 1 1,076<br />
Total n<strong>on</strong>interest expenses<br />
therein:<br />
10,213 7,972 95 18,279 (0) 18,278<br />
Policyholder benefits and claims (273) 18 – (256) 4 (252)<br />
Impairment of intangible assets 5 580 – 585 – 585<br />
Restructuring activities – – – – – –<br />
Minority interest (48) (<strong>20</strong>) 2 (66) 66 –<br />
Income (loss) before income taxes (7,371) 4<strong>20</strong> 1,194 (5,756) 15 (5,741) 1<br />
Cost/income ratio N/M 88 % 7 % 135 % N/M 134 %<br />
Assets2 2,047,181 188,785 18,297 2,189,313 13,110 2,<strong>20</strong>2,423<br />
Average active equity3 <strong>20</strong>,262 8,315 403 28,979 3,100 32,079<br />
Pre-tax return <strong>on</strong> average active equity4 (36) % 5 % N/M (<strong>20</strong>) % N/M (18) %
<strong>20</strong>07 Corporate<br />
in € m.<br />
(unless stated otherwise)<br />
and<br />
Investment<br />
<strong>Bank</strong><br />
Private<br />
Clients and<br />
Asset<br />
Management<br />
N/M – Not meaningful<br />
1 Includes gains from the sale of industrial holdings (Fiat S.p.A., Linde AG and Allianz SE) of € 514 milli<strong>on</strong>, income from equity method investments (<strong>Deutsche</strong> Interhotel Holding<br />
GmbH & Co. KG) of € 178 milli<strong>on</strong>, net of goodwill impairment charge of € 54 milli<strong>on</strong>, a gain from the sale of premises (sale/leaseback transacti<strong>on</strong> of 60 Wall Street) of € 317 milli<strong>on</strong><br />
and an impairment of intangible assets (Asset Management) of € 74 milli<strong>on</strong>, which are excluded from the Group’s target definiti<strong>on</strong>.<br />
2 The sum of corporate divisi<strong>on</strong>s does not necessarily equal the total of the corresp<strong>on</strong>ding group divisi<strong>on</strong> because of c<strong>on</strong>solidati<strong>on</strong> items between corporate divisi<strong>on</strong>s, which are to be<br />
eliminated <strong>on</strong> group divisi<strong>on</strong> level. The same approach holds true for the sum of group divisi<strong>on</strong>s compared to ‘Total C<strong>on</strong>solidated’.<br />
3 For management reporting purposes goodwill and other intangible assets with indefinite lives are explicitly assigned to the respective divisi<strong>on</strong>s. Average active equity is first allocated<br />
to divisi<strong>on</strong>s according to goodwill and intangible assets; remaining average active equity is allocated to divisi<strong>on</strong>s in proporti<strong>on</strong> to the ec<strong>on</strong>omic capital calculated for them.<br />
4 For the calculati<strong>on</strong> of pre-tax return <strong>on</strong> average active equity please refer to Note [4]. For ‘Total c<strong>on</strong>solidated’, pre-tax return <strong>on</strong> average shareholders’ equity is 24 %.<br />
63<br />
Corporate<br />
Investments<br />
Total<br />
Management<br />
<str<strong>on</strong>g>Report</str<strong>on</strong>g>ing<br />
C<strong>on</strong>solidati<strong>on</strong><br />
&<br />
Adjustments<br />
Total<br />
C<strong>on</strong>solidated<br />
Net revenues 19,176 10,129 1,517 30,822 7 30,829<br />
Provisi<strong>on</strong> for credit losses 109 501 3 613 (1) 612<br />
Total n<strong>on</strong>interest expenses<br />
therein:<br />
13,886 7,560 2<strong>20</strong> 21,667 (199) 21,468<br />
Policyholder benefits and claims 116 73 – 188 5 193<br />
Impairment of intangible assets – 74 54 128 – 128<br />
Restructuring activities (4) (9) – (13) – (13)<br />
Minority interest 34 8 (5) 37 (37) –<br />
Income (loss) before income taxes 5,147 2,059 1,299 8,505 243 8,749 1<br />
Cost/income ratio 72 % 75 % 15 % 70 % N/M 70 %<br />
Assets2 1,800,027 156,767 13,005 1,916,304 8,699 1,925,003<br />
Average active equity3 <strong>20</strong>,714 8,539 473 29,725 368 30,093<br />
Pre-tax return <strong>on</strong> average active equity4 25 % 24 % N/M 29 % N/M 29 %
<strong>20</strong>-F Item 5: Operating and Financial Review and Prospects<br />
Group Divisi<strong>on</strong>s<br />
Corporate and Investment <strong>Bank</strong> Group Divisi<strong>on</strong><br />
The following table sets forth the results of our Corporate and Investment <strong>Bank</strong> Group Divisi<strong>on</strong> (CIB) for the<br />
years ended December 31, <str<strong>on</strong>g><strong>20</strong>09</str<strong>on</strong>g>, <strong>20</strong>08 and <strong>20</strong>07, in accordance with our management reporting systems.<br />
in € m.<br />
(unless stated otherwise)<br />
Net revenues:<br />
<str<strong>on</strong>g><strong>20</strong>09</str<strong>on</strong>g> <strong>20</strong>08 <strong>20</strong>07<br />
Sales & Trading (equity) 2,734 (631) 4,612<br />
Sales & Trading (debt and other products) 9,795 116 8,401<br />
Originati<strong>on</strong> (equity) 663 334 860<br />
Originati<strong>on</strong> (debt) 1,132 (713) 714<br />
Advisory 402 589 1,089<br />
Loan products 1,623 1,393 1,067<br />
Transacti<strong>on</strong> services 2,606 2,774 2,585<br />
Other products (151) (661) (151)<br />
Total net revenues<br />
therein:<br />
Net interest income and net gains (losses) <strong>on</strong> financial assets/liabilities<br />
18,804 3,<strong>20</strong>1 19,176<br />
at fair value through profit or loss 13,966 (1,027) 12,278<br />
Provisi<strong>on</strong> for credit losses 1,816 408 109<br />
Total n<strong>on</strong>interest expenses<br />
therein:<br />
12,678 10,213 13,886<br />
Policyholder benefits and claims 541 (273) 116<br />
Impairment of intangible assets 5 5 –<br />
Restructuring activities – – (4)<br />
Minority interest (2) (48) 34<br />
Income (loss) before income taxes 4,312 (7,371) 5,147<br />
Cost/income ratio 67 % N/M 72 %<br />
Assets 1,343,824 2,047,181 1,800,027<br />
Average active equity1 19,041 <strong>20</strong>,262 <strong>20</strong>,714<br />
Pre-tax return <strong>on</strong> average active equity 23 % (36) % 25 %<br />
N/M – Not meaningful<br />
1 See Note [4] to the c<strong>on</strong>solidated financial statements for a descripti<strong>on</strong> of how average active equity is allocated to the divisi<strong>on</strong>s.<br />
The following paragraphs discuss the c<strong>on</strong>tributi<strong>on</strong> of the individual corporate divisi<strong>on</strong>s to the overall results of<br />
the Corporate and Investment <strong>Bank</strong> Group Divisi<strong>on</strong>.<br />
64
Corporate <strong>Bank</strong>ing & Securities Corporate Divisi<strong>on</strong><br />
The following table sets forth the results of our Corporate <strong>Bank</strong>ing & Securities Corporate Divisi<strong>on</strong> (CB&S) for<br />
the years ended December 31, <str<strong>on</strong>g><strong>20</strong>09</str<strong>on</strong>g>, <strong>20</strong>08 and <strong>20</strong>07, in accordance with our management reporting systems.<br />
in € m.<br />
(unless stated otherwise) <str<strong>on</strong>g><strong>20</strong>09</str<strong>on</strong>g> <strong>20</strong>08 <strong>20</strong>07<br />
Net revenues:<br />
Sales & Trading (equity) 2,734 (631) 4,612<br />
Sales & Trading (debt and other products) 9,795 116 8,401<br />
Originati<strong>on</strong> (equity) 663 334 860<br />
Originati<strong>on</strong> (debt) 1,132 (713) 714<br />
Advisory 402 589 1,089<br />
Loan products 1,623 1,393 1,067<br />
Other products (151) (661) (151)<br />
Total net revenues 16,197 428 16,591<br />
Provisi<strong>on</strong> for credit losses 1,789 402 102<br />
Total n<strong>on</strong>interest expenses 10,874 8,550 12,253<br />
therein:<br />
Policyholder benefits and claims 541 (273) 116<br />
Impairment of intangible assets 5 5 –<br />
Restructuring activities – – (4)<br />
Minority interest (2) (48) 34<br />
Income (loss) before income taxes 3,537 (8,476) 4,<strong>20</strong>2<br />
Cost/income ratio 67 % N/M 74 %<br />
Assets 1,308,2<strong>20</strong> 2,011,983 1,785,876<br />
Average active equity1 17,881 19,181 19,619<br />
Pre-tax return <strong>on</strong> average active equity <strong>20</strong> % (44) % 21 %<br />
N/M – Not meaningful<br />
1 See Note [4] to the c<strong>on</strong>solidated financial statements for a descripti<strong>on</strong> of how average active equity is allocated to the divisi<strong>on</strong>s.<br />
Comparis<strong>on</strong> between <str<strong>on</strong>g><strong>20</strong>09</str<strong>on</strong>g> and <strong>20</strong>08<br />
Net revenues in <str<strong>on</strong>g><strong>20</strong>09</str<strong>on</strong>g> were € 16.2 billi<strong>on</strong>, after mark-downs of € 925 milli<strong>on</strong>, versus € 428 milli<strong>on</strong>, after mark-<br />
downs of € 7.5 billi<strong>on</strong>, in <strong>20</strong>08. This development was due predominantly to str<strong>on</strong>g performance in ‘flow’ trad-<br />
ing products and the n<strong>on</strong>-recurrence of trading losses recognized in the final quarter of <strong>20</strong>08. Both factors<br />
reflected a successful reorientati<strong>on</strong> of the sales and trading platform towards customer business and liquid,<br />
‘flow’ products. <str<strong>on</strong>g><strong>20</strong>09</str<strong>on</strong>g> revenues additi<strong>on</strong>ally benefited from favorable market c<strong>on</strong>diti<strong>on</strong>s, including both margins<br />
and volumes, particularly in the first half of the year, together with record full-year revenues in Commodities<br />
and Emerging Market Debt trading.<br />
Sales & Trading (debt and other products) revenues for the year were € 9.8 billi<strong>on</strong>, compared to € 116 milli<strong>on</strong><br />
in <strong>20</strong>08. This increase primarily reflects significantly lower mark-downs of € 1.0 billi<strong>on</strong> for the year, compared<br />
to € 5.8 billi<strong>on</strong> in <strong>20</strong>08, and the n<strong>on</strong>-recurrence of Credit Trading losses of € 3.2 billi<strong>on</strong>, mainly incurred in the<br />
fourth quarter of <strong>20</strong>08. All ‘flow’ products benefited from wider bid-offer spreads and increased client volumes.<br />
Foreign Exchange and M<strong>on</strong>ey Markets reported str<strong>on</strong>g revenues, although lower than the record levels seen<br />
in <strong>20</strong>08. Rates and Emerging Markets generated record revenues, reflecting favorable market c<strong>on</strong>diti<strong>on</strong>s.<br />
Commodities also had record revenues in <str<strong>on</strong>g><strong>20</strong>09</str<strong>on</strong>g>. Credit Trading had str<strong>on</strong>g performance following a success-<br />
65
<strong>20</strong>-F Item 5: Operating and Financial Review and Prospects<br />
ful reorientati<strong>on</strong> towards more liquid, client-driven business, which included the closure of our dedicated credit<br />
proprietary trading platform.<br />
Sales & Trading (equity) revenues were € 2.7 billi<strong>on</strong>, compared to negative € 631 milli<strong>on</strong> in <strong>20</strong>08. The increase<br />
was driven by the n<strong>on</strong>-recurrence of losses in Equity Derivatives of € 1.4 billi<strong>on</strong> and in Equity Proprietary Trad-<br />
ing of € 742 milli<strong>on</strong>, mainly in the fourth quarter <strong>20</strong>08. In additi<strong>on</strong>, there was a str<strong>on</strong>g performance across all<br />
products, especially Equity Trading. Equity Derivatives performance improved significantly after the first quar-<br />
ter <str<strong>on</strong>g><strong>20</strong>09</str<strong>on</strong>g> following the reorientati<strong>on</strong> of the business. Equity Proprietary Trading performed well throughout<br />
<str<strong>on</strong>g><strong>20</strong>09</str<strong>on</strong>g> with substantially lower risk than in <strong>20</strong>08.<br />
Originati<strong>on</strong> and Advisory revenues were € 2.2 billi<strong>on</strong>, an increase of € 2.0 billi<strong>on</strong> versus <strong>20</strong>08. This increase<br />
was mainly in debt originati<strong>on</strong>, and reflected the n<strong>on</strong>-recurrence of net mark-downs of € 1.7 billi<strong>on</strong> <strong>on</strong> lev-<br />
eraged loans and loan commitments in the prior year, compared with net mark-ups of € 103 milli<strong>on</strong> in the<br />
current year. Equity originati<strong>on</strong> revenues grew substantially by € 328 milli<strong>on</strong> to € 663 milli<strong>on</strong> as market activity<br />
increased across all regi<strong>on</strong>s. Advisory revenues decreased by € 187 milli<strong>on</strong>, or 32 %, as global volumes<br />
declined from the prior year and were at the lowest level since <strong>20</strong>04.<br />
Loan products net revenues were € 1.6 billi<strong>on</strong>, an increase of € 230 milli<strong>on</strong>, or 17 %, versus <strong>20</strong>08, mainly dri-<br />
ven by mark-to-market gains <strong>on</strong> the investment grade fair value loan and hedge portfolio in the current year,<br />
compared with unrealized net mark-to-market losses in <strong>20</strong>08.<br />
Other products revenues were negative € 151 milli<strong>on</strong>, an increase of € 511 milli<strong>on</strong> over <strong>20</strong>08. This develop-<br />
ment was driven by mark-to-market gains <strong>on</strong> investments held to back insurance policyholder claims in Abbey<br />
Life, partly offset by an impairment charge of € 500 milli<strong>on</strong> relating to The Cosmopolitan Resort and Casino<br />
property and losses <strong>on</strong> private equity investments recorded in the first quarter <str<strong>on</strong>g><strong>20</strong>09</str<strong>on</strong>g>.<br />
The provisi<strong>on</strong> for credit losses was € 1.8 billi<strong>on</strong>, versus € 402 milli<strong>on</strong> in <strong>20</strong>08. The increase primarily reflected<br />
provisi<strong>on</strong>s for credit losses related to Leveraged Finance assets which had been reclassified in accordance<br />
with the amendments to IAS 39, together with additi<strong>on</strong>al provisi<strong>on</strong>s as a result of deteriorating credit c<strong>on</strong>diti<strong>on</strong>s,<br />
predominantly in Europe and the Americas.<br />
N<strong>on</strong>interest expenses increased € 2.3 billi<strong>on</strong>, or 27 %, to € 10.9 billi<strong>on</strong>. The increase mainly reflects higher<br />
performance-related compensati<strong>on</strong> in line with improved results and effects from Abbey Life. In additi<strong>on</strong>, n<strong>on</strong>-<br />
interest expenses included charges of € <strong>20</strong>0 milli<strong>on</strong> related to the bank’s offer to repurchase certain products<br />
from private investors in the third quarter <str<strong>on</strong>g><strong>20</strong>09</str<strong>on</strong>g>, and of € 316 milli<strong>on</strong> related to a legal settlement with<br />
Huntsman Corp. recorded in the sec<strong>on</strong>d quarter <str<strong>on</strong>g><strong>20</strong>09</str<strong>on</strong>g>. These were partly offset by savings from cost c<strong>on</strong>tain-<br />
ment measures and lower staff levels.<br />
66
Amendments to IAS 39 and IFRS 7, “Reclassificati<strong>on</strong> of Financial Assets”<br />
Under the amendments to IAS 39 and IFRS 7 issued in October <strong>20</strong>08, certain financial assets were reclassified<br />
in the sec<strong>on</strong>d half of <strong>20</strong>08 and the first quarter of <str<strong>on</strong>g><strong>20</strong>09</str<strong>on</strong>g> from the financial assets at fair value through<br />
profit or loss and the available for sale classificati<strong>on</strong>s into the loans classificati<strong>on</strong>. The reclassificati<strong>on</strong>s were<br />
made in instances where management believed that the expected repayment of the assets exceeded their<br />
estimated fair values, which reflected the significantly reduced liquidity in the financial markets, and that returns<br />
<strong>on</strong> these assets would be optimized by holding them for the foreseeable future. Where this clear change<br />
of intent existed and was supported by an ability to hold and fund the underlying positi<strong>on</strong>s, we c<strong>on</strong>cluded that<br />
the reclassificati<strong>on</strong>s aligned the accounting more closely with the business intent. Assets that were reclassified<br />
in the third quarter <strong>20</strong>08 were reclassified with effect from July 1, <strong>20</strong>08 at the fair value as of that date.<br />
Where the business decisi<strong>on</strong> to reclassify was made by November 1, <strong>20</strong>08 and these assets met the reclassificati<strong>on</strong><br />
rules and the Group’s internal reclassificati<strong>on</strong> criteria, the reclassificati<strong>on</strong>s were made with effect from<br />
October 1, <strong>20</strong>08 at the fair value of that date. Business decisi<strong>on</strong>s to reclassify assets after November 1, <strong>20</strong>08<br />
were made <strong>on</strong> a prospective basis at fair value <strong>on</strong> the date reclassificati<strong>on</strong> was approved.<br />
The tables below show the net c<strong>on</strong>tributi<strong>on</strong> of the reclassificati<strong>on</strong> accounting for CB&S. The tables show that<br />
the reclassificati<strong>on</strong>s resulted in € 273 milli<strong>on</strong> losses to the income statement and € 1.2 billi<strong>on</strong> gains foreg<strong>on</strong>e in<br />
net gains (losses) not recognized in the income statement for <str<strong>on</strong>g><strong>20</strong>09</str<strong>on</strong>g>. For the full year <strong>20</strong>08, the reclassificati<strong>on</strong>s<br />
resulted in € 3.3 billi<strong>on</strong> gains to the income statement and € 1.8 billi<strong>on</strong> gains to net gains (losses) not<br />
recognized in the income statement. The c<strong>on</strong>sequential effect <strong>on</strong> credit market risk disclosures is provided in<br />
“Update <strong>on</strong> Key Credit Market Exposures”.<br />
<str<strong>on</strong>g><strong>20</strong>09</str<strong>on</strong>g> impact of the reclassificati<strong>on</strong>s Dec 31, <str<strong>on</strong>g><strong>20</strong>09</str<strong>on</strong>g> Year ended Dec 31, <str<strong>on</strong>g><strong>20</strong>09</str<strong>on</strong>g><br />
Carrying value Fair value Impact <strong>on</strong><br />
income before<br />
income taxes<br />
1 The negative amount shown as the annual movement in net gains (losses) not recognized in the income statement is due to an instrument being<br />
impaired in the year. The decrease in fair value since reclassificati<strong>on</strong> that would have been recorded in equity would then be removed from equity and<br />
recognized through the income statement.<br />
2 In additi<strong>on</strong> to the impact in CB&S, income before income taxes increased by € 18 milli<strong>on</strong> in PBC.<br />
67<br />
Impact <strong>on</strong> net<br />
gains (losses) not<br />
recognized in the<br />
income statement<br />
in € bn. in € bn. in € m. in € m.<br />
Sales & Trading – Debt<br />
Trading assets reclassified to loans<br />
Financial assets available for sale reclassified to<br />
18.2 15.9 407 –<br />
loans<br />
Originati<strong>on</strong> and Advisory<br />
9.3 8.2 (16) (1,102)<br />
Trading assets reclassified to loans<br />
Loan products<br />
Financial assets available for sale reclassified to<br />
6.1 5.7 (664) –<br />
loans – – – (114) 1<br />
Total 33.6 29.8 (273) 2<br />
of which related to reclassificati<strong>on</strong>s made in<br />
(1,216)<br />
<strong>20</strong>08<br />
of which related to reclassificati<strong>on</strong>s made in<br />
30.7 27.1 (472) (1,216)<br />
<str<strong>on</strong>g><strong>20</strong>09</str<strong>on</strong>g> 2.9 2.7 199 –
<strong>20</strong>-F Item 5: Operating and Financial Review and Prospects<br />
<strong>20</strong>08 impact of the reclassificati<strong>on</strong>s Dec 31, <strong>20</strong>08 Year ended Dec 31, <strong>20</strong>08<br />
Carrying value Fair value Impact <strong>on</strong><br />
income before<br />
income taxes<br />
1 In additi<strong>on</strong> to the impact in CB&S, income before income taxes increased by € 32 milli<strong>on</strong> in PBC.<br />
The assets reclassified included funded leveraged finance loans with a fair value <strong>on</strong> the date of reclassificati<strong>on</strong><br />
of € 7.5 billi<strong>on</strong> which were entered into as part of an “originate to distribute” strategy. Assets with a fair<br />
value <strong>on</strong> the date of reclassificati<strong>on</strong> of € 9.4 billi<strong>on</strong> were c<strong>on</strong>tained within c<strong>on</strong>solidated asset backed commercial<br />
paper c<strong>on</strong>duits at reclassificati<strong>on</strong> date. Commercial real estate loans were reclassified with a fair value<br />
<strong>on</strong> the date of reclassificati<strong>on</strong> of € 9.1 billi<strong>on</strong>. These loans were intended for securitizati<strong>on</strong> at their originati<strong>on</strong><br />
or purchase date. The remaining reclassified assets, which comprised other assets principally acquired or<br />
originated for the purpose of securitizati<strong>on</strong>, had a fair value of € 11.9 billi<strong>on</strong> <strong>on</strong> the reclassificati<strong>on</strong> date.<br />
Update <strong>on</strong> Key Credit Market Exposures<br />
The following is an update <strong>on</strong> the development of certain key credit positi<strong>on</strong>s (including protecti<strong>on</strong> purchased<br />
from m<strong>on</strong>oline insurers) of those CB&S businesses <strong>on</strong> which we have previously provided additi<strong>on</strong>al risk<br />
disclosures.<br />
Mortgage Related Exposure: We have mortgage related exposures through a number of our businesses,<br />
including our CDO trading and originati<strong>on</strong> and U.S. and European mortgage businesses. The following table<br />
presents the mortgage related exposure from the businesses described, net of hedges and other protecti<strong>on</strong><br />
purchased.<br />
1 Classified as Subprime if 50 % or more of the underlying collateral are home equity loans.<br />
2 Thereof € 389 milli<strong>on</strong> Alt-A, € 71 milli<strong>on</strong> Subprime, € 244 milli<strong>on</strong> Other and € 597 milli<strong>on</strong> Trading-related net positi<strong>on</strong>s as of December 31, <str<strong>on</strong>g><strong>20</strong>09</str<strong>on</strong>g> and<br />
€ 1.0 billi<strong>on</strong> Alt-A, € (134) milli<strong>on</strong> Subprime, € (57) milli<strong>on</strong> Other and € 403 milli<strong>on</strong> Trading-related net positi<strong>on</strong>s as of December 31, <strong>20</strong>08.<br />
3 Thereof United Kingdom € 145 milli<strong>on</strong>, Italy € 26 milli<strong>on</strong> and Germany € 8 milli<strong>on</strong> as of December 31, <str<strong>on</strong>g><strong>20</strong>09</str<strong>on</strong>g> and United Kingdom € 188 milli<strong>on</strong>, Italy<br />
€ 56 milli<strong>on</strong> and Germany € 13 milli<strong>on</strong> as of December 31, <strong>20</strong>08.<br />
68<br />
Impact <strong>on</strong> net<br />
gains (losses) not<br />
recognized in the<br />
income statement<br />
in € bn. in € bn. in € m. in € m.<br />
Sales & Trading – Debt<br />
Trading assets reclassified to loans<br />
Financial assets available for sale reclassified<br />
16.2 14.3 2,073 –<br />
to loans<br />
Originati<strong>on</strong> and Advisory<br />
10.5 8.5 121 1,712<br />
Trading assets reclassified to loans<br />
Loan products<br />
Financial assets available for sale reclassified<br />
7.4 6.4 1,101 –<br />
to loans 0.3 0.1 – 114<br />
Total 34.4 29.3 3,295 1<br />
1,826<br />
Mortgage related exposure in our CDO trading and originati<strong>on</strong>,<br />
U.S. and European residential mortgage businesses<br />
in € m.<br />
Subprime and Alt-A CDO exposure in trading and originati<strong>on</strong> businesses:<br />
Dec 31, <str<strong>on</strong>g><strong>20</strong>09</str<strong>on</strong>g> Dec 31, <strong>20</strong>08<br />
CDO subprime exposure – Trading 1 317 485<br />
CDO subprime exposure – Available for sale 34 86<br />
CDO Alt-A exposure – Trading<br />
Residential mortgage trading businesses:<br />
22 54<br />
Other U.S. residential mortgage business exposure 2 1,301 1,259<br />
European residential mortgage business exposure 3 179 257
In the above table, exposure represents our potential loss in the event of a 100 % default of securities and<br />
associated hedges, assuming zero recovery. It is not an indicati<strong>on</strong> of net delta adjusted trading risk (the net<br />
delta adjusted trading risk measure is used to ensure comparability between different exposures; for each<br />
positi<strong>on</strong> the delta represents the change of the positi<strong>on</strong> in the related security which would have the same<br />
sensitivity to a given change in the market).<br />
The table above relates to key credit market positi<strong>on</strong>s exposed to fair value movements through the income<br />
statement. It excludes assets reclassified from trading or available for sale to loans and receivables in accordance<br />
with the amendments to IAS 39 with a carrying value as of December 31, <str<strong>on</strong>g><strong>20</strong>09</str<strong>on</strong>g> of € 1.9 billi<strong>on</strong> (thereof<br />
European residential mortgage exposure € 1.1 billi<strong>on</strong>, Other U.S. residential mortgage exposure € 370 milli<strong>on</strong>,<br />
CDO subprime exposure – Trading € 432 milli<strong>on</strong>) and as of December 31, <strong>20</strong>08 of € 1.9 billi<strong>on</strong> (thereof European<br />
residential mortgage exposure € 1.1 billi<strong>on</strong>, Other U.S. residential mortgage exposure € 336 milli<strong>on</strong>,<br />
CDO subprime exposure – Trading € 373 milli<strong>on</strong>).<br />
The table also excludes both agency mortgage-backed securities and agency eligible loans, which we do not<br />
c<strong>on</strong>sider to be credit sensitive products, and interest-<strong>on</strong>ly and inverse interest-<strong>on</strong>ly positi<strong>on</strong>s which are negatively<br />
correlated to deteriorating markets due to the effect <strong>on</strong> the positi<strong>on</strong> of the reduced rate of mortgage<br />
prepayments. The slower repayment rate extends the average life of these interest-<strong>on</strong>ly products which in<br />
turn leads to a higher value due to the l<strong>on</strong>ger expected interest stream.<br />
The various gross comp<strong>on</strong>ents of the overall net exposure shown above represent different vintages, loca-<br />
ti<strong>on</strong>s, credit ratings and other market-sensitive factors. Therefore, while the overall numbers above provide a<br />
view of the absolute levels of our exposure to an extreme market movement, actual future profits and losses<br />
will depend <strong>on</strong> actual market movements, basis movements between different comp<strong>on</strong>ents of our positi<strong>on</strong>s,<br />
and our ability to adjust hedges in these circumstances.<br />
Exposure to M<strong>on</strong>oline Insurers: The deteriorati<strong>on</strong> of the U.S. subprime mortgage and related markets has<br />
generated large exposures to financial guarantors, such as m<strong>on</strong>oline insurers, that have insured or guaran-<br />
teed the value of pools of collateral referenced by CDOs and other market-traded securities. Actual claims<br />
against m<strong>on</strong>oline insurers will <strong>on</strong>ly become due if actual defaults occur in the underlying assets (or collateral).<br />
There is <strong>on</strong>going uncertainty as to whether some m<strong>on</strong>oline insurers will be able to meet all their liabilities to<br />
banks and other buyers of protecti<strong>on</strong>. Under certain c<strong>on</strong>diti<strong>on</strong>s (e.g., liquidati<strong>on</strong>) we can accelerate claims<br />
regardless of actual losses <strong>on</strong> the underlying assets.<br />
The following tables summarize the fair value of our counterparty exposures to m<strong>on</strong>oline insurers with respect<br />
to U.S. residential mortgage-related activity and other activities, respectively, in each case <strong>on</strong> the basis of the<br />
fair value of the assets compared with the noti<strong>on</strong>al value guaranteed or underwritten by m<strong>on</strong>oline insurers.<br />
The other exposures described in the sec<strong>on</strong>d table arise from a range of client and trading activity, including<br />
collateralized loan obligati<strong>on</strong>s, commercial mortgage-backed securities, trust preferred securities, student<br />
loans and public sector or municipal debt. The tables show the associated credit valuati<strong>on</strong> adjustments<br />
(“CVA”) that we have recorded against the exposures. CVAs are assessed using a model-based approach<br />
with numerous input factors for each counterparty, including the likelihood of an event (either a restructuring<br />
69
<strong>20</strong>-F Item 5: Operating and Financial Review and Prospects<br />
or insolvency), an assessment of any potential settlement in the event of a restructuring and recovery rates in<br />
the event of either restructuring or insolvency. The ratings in the tables below are the lower of Standard &<br />
Poor’s, Moody’s or our own internal credit ratings as of December 31, <str<strong>on</strong>g><strong>20</strong>09</str<strong>on</strong>g> and December 31, <strong>20</strong>08.<br />
M<strong>on</strong>oline exposure related to<br />
U.S. residential mortgages<br />
in € m.<br />
AA M<strong>on</strong>olines:<br />
Noti<strong>on</strong>al<br />
amount<br />
Fair value<br />
prior to<br />
CVA<br />
The tables exclude counterparty exposure to m<strong>on</strong>oline insurers that relates to wrapped b<strong>on</strong>ds. A wrapped<br />
b<strong>on</strong>d is <strong>on</strong>e that is insured or guaranteed by a third party. As of December 31, <str<strong>on</strong>g><strong>20</strong>09</str<strong>on</strong>g> and December 31, <strong>20</strong>08,<br />
70<br />
Dec 31, <str<strong>on</strong>g><strong>20</strong>09</str<strong>on</strong>g> Dec 31, <strong>20</strong>08<br />
CVA Fair value<br />
after CVA<br />
Noti<strong>on</strong>al<br />
amount<br />
Fair value<br />
prior to<br />
CVA<br />
CVA Fair value<br />
after CVA<br />
Super Senior ABS CDO – – – – – – – –<br />
Other subprime 142 70 (6) 64 76 40 – 39<br />
Alt-A 4,337 1,873 (172) 1,701 5,063 1,573 (37) 1,536<br />
Total AA M<strong>on</strong>olines 4,479 1,943 (178) 1,765 5,139 1,613 (37) 1,576<br />
N<strong>on</strong> Investment Grade M<strong>on</strong>olines:<br />
Super Senior ABS CDO – – – – 1,110 1,031 (918) 113<br />
Other subprime – – – – 258 80 (24) 56<br />
Alt-A – – – – 1,293 336 (346) (10)<br />
Total N<strong>on</strong> Investment Grade M<strong>on</strong>olines – – – – 2,660 1,447 (1,288) 159<br />
Total 4,479 1,943 (178) 1,765 7,799 3,060 (1,325) 1,735<br />
Other M<strong>on</strong>oline exposure Dec 31, <str<strong>on</strong>g><strong>20</strong>09</str<strong>on</strong>g> Dec 31, <strong>20</strong>08<br />
in € m.<br />
AA M<strong>on</strong>olines:<br />
Noti<strong>on</strong>al<br />
amount<br />
Fair value<br />
prior to<br />
CVA<br />
CVA Fair value<br />
after CVA<br />
Noti<strong>on</strong>al<br />
amount<br />
Fair value<br />
prior to<br />
CVA<br />
CVA Fair value<br />
after CVA<br />
TPS-CLO 2,717 925 (85) 840 3,019 1,241 (29) 1,213<br />
CMBS 1,004 68 (6) 62 1,018 117 (3) 115<br />
Corporate single name/Corporate<br />
CDO 2,033 (3) – (3) 6,273 222 (2) 219<br />
Student loans 232 39 (4) 35 277 105 (2) 103<br />
Other 902 249 (23) 226 587 288 (5) 283<br />
Total AA M<strong>on</strong>olines 6,888 1,277 (117) 1,160 11,174 1,974 (41) 1,933<br />
N<strong>on</strong> AA Investment Grade M<strong>on</strong>olines:<br />
TPS-CLO – – – – 416 215 (59) 156<br />
CMBS – – – – 5,537 882 (111) 771<br />
Corporate single name/Corporate<br />
CDO – – – – 5,525 272 (38) 234<br />
Student loans – – – – 53 <strong>20</strong> (3) 17<br />
Other – – – – 498 94 (16) 78<br />
Total N<strong>on</strong> AA Investment Grade<br />
M<strong>on</strong>olines – – – – 12,029 1,484 (228) 1,256<br />
N<strong>on</strong> Investment Grade M<strong>on</strong>olines:<br />
TPS-CLO 876 274 (100) 174 831 244 (74) 169<br />
CMBS 5,932 813 (355) 458 672 125 (56) 69<br />
Corporate single name/Corporate<br />
CDO 4,366 26 (12) 14 787 9 (2) 6<br />
Student loans 1,221 560 (319) 241 1,185 906 (227) 680<br />
Other 1,645 278 (102) 176 1,244 504 (229) 275<br />
Total N<strong>on</strong> Investment Grade M<strong>on</strong>olines 14,040 1,950 (887) 1,063 4,719 1,787 (588) 1,199<br />
Total <strong>20</strong>,928 3,227 (1,004) 2,223 27,922 5,245 (857) 4,388
the exposure <strong>on</strong> wrapped b<strong>on</strong>ds related to U.S. residential mortgages was € 100 milli<strong>on</strong> and € 58 milli<strong>on</strong>,<br />
respectively, and the exposure <strong>on</strong> wrapped b<strong>on</strong>ds other than those related to U.S. residential mortgages was<br />
€ 54 milli<strong>on</strong> and € 136 milli<strong>on</strong>, respectively. In each case, the exposure represents an estimate of the potential<br />
mark-downs of wrapped assets in the event of m<strong>on</strong>oline defaults.<br />
A proporti<strong>on</strong> of the mark-to-market m<strong>on</strong>oline exposure has been mitigated with CDS protecti<strong>on</strong> arranged with<br />
other market counterparties and other ec<strong>on</strong>omic hedge activity.<br />
The following table shows the roll-forward of CVA held against m<strong>on</strong>oline insurers from December 31, <strong>20</strong>08 to<br />
December 31, <str<strong>on</strong>g><strong>20</strong>09</str<strong>on</strong>g>.<br />
Credit valuati<strong>on</strong> adjustment<br />
in € m.<br />
<str<strong>on</strong>g><strong>20</strong>09</str<strong>on</strong>g><br />
Balance, beginning of year 2,182<br />
Settlements (1,686)<br />
Increase 686<br />
Balance, end of year 1,182<br />
Commercial Real Estate Business: Our Commercial Real Estate business takes positi<strong>on</strong>s in commercial<br />
mortgage whole loans which are originated and either held with the intent to sell, syndicate, securitize or<br />
otherwise distribute to third party investors, or held <strong>on</strong> an amortized cost basis. The following is a summary of<br />
our exposure to commercial mortgage whole loans as of December 31, <str<strong>on</strong>g><strong>20</strong>09</str<strong>on</strong>g> and December 31, <strong>20</strong>08. This<br />
excludes our portfolio of sec<strong>on</strong>dary market commercial mortgage-backed securities which are actively traded<br />
and priced.<br />
Commercial Real Estate whole loans<br />
in € m. Dec 31, <str<strong>on</strong>g><strong>20</strong>09</str<strong>on</strong>g> Dec 31, <strong>20</strong>08<br />
Loans held <strong>on</strong> a fair value basis, net of risk reducti<strong>on</strong> 1 1,806 2,605<br />
Loans reclassified in accordance with the amendments to IAS 39 2 6,453 6,669<br />
Loans related to asset sales 3 2,083 2,103<br />
1 Risk reducti<strong>on</strong> trades represent a series of derivative or other transacti<strong>on</strong>s entered into in order to mitigate risk <strong>on</strong> specific whole loans. Fair value of risk<br />
reducti<strong>on</strong> amounted to € 1.0 billi<strong>on</strong> as of December 31, <str<strong>on</strong>g><strong>20</strong>09</str<strong>on</strong>g> and € 1.4 billi<strong>on</strong> as of December 31, <strong>20</strong>08.<br />
2 Carrying value.<br />
3 Carrying value of vendor financing <strong>on</strong> loans sold since January 1, <strong>20</strong>08.<br />
71
<strong>20</strong>-F Item 5: Operating and Financial Review and Prospects<br />
Leveraged Finance Business: The following is a summary of our exposures to leveraged loan and other<br />
financing commitments arising from the activities of our Leveraged Finance business as of December 31, <str<strong>on</strong>g><strong>20</strong>09</str<strong>on</strong>g><br />
and December 31, <strong>20</strong>08. These activities include private equity transacti<strong>on</strong>s and other buyout arrangements.<br />
The table excludes loans transacted prior to January 1, <strong>20</strong>07, which were undertaken prior to the disrupti<strong>on</strong> in<br />
the leveraged finance markets, and loans that have been classified as held to maturity since incepti<strong>on</strong>.<br />
Leveraged Finance<br />
in € m. Dec 31, <str<strong>on</strong>g><strong>20</strong>09</str<strong>on</strong>g> Dec 31, <strong>20</strong>08<br />
Loans held <strong>on</strong> a fair value basis 505 994<br />
thereof: loans entered into since January 1, <strong>20</strong>08 385 469<br />
Loans reclassified in accordance with the amendments to IAS 39 1 6,152 7,652<br />
Loans related to asset sales 2 5,804 5,673<br />
1 Carrying value.<br />
2 Carrying value of vendor financing <strong>on</strong> loans sold since January 1, <strong>20</strong>08.<br />
Since January 1, <strong>20</strong>08, we entered into transacti<strong>on</strong>s with special purpose entities to derecognize certain<br />
loans, predominantly U.S. leveraged loans and commercial real estate loans that were held at fair value<br />
through profit or loss, which are reflected as Loans related to asset sales in the above tables. See “Special<br />
Purpose Entities – Relati<strong>on</strong>ships with Other N<strong>on</strong>c<strong>on</strong>solidated SPEs – Group Sp<strong>on</strong>sored Securitizati<strong>on</strong>s”.<br />
Global Transacti<strong>on</strong> <strong>Bank</strong>ing Corporate Divisi<strong>on</strong><br />
The following table sets forth the results of our Global Transacti<strong>on</strong> <strong>Bank</strong>ing Corporate Divisi<strong>on</strong> (GTB) for the<br />
years ended December 31, <str<strong>on</strong>g><strong>20</strong>09</str<strong>on</strong>g>, <strong>20</strong>08 and <strong>20</strong>07, in accordance with our management reporting systems.<br />
in € m.<br />
(unless stated otherwise) <str<strong>on</strong>g><strong>20</strong>09</str<strong>on</strong>g> <strong>20</strong>08 <strong>20</strong>07<br />
Net revenues:<br />
Transacti<strong>on</strong> services 2,606 2,774 2,585<br />
Other products – – –<br />
Total net revenues 2,606 2,774 2,585<br />
Provisi<strong>on</strong> for credit losses 27 5 7<br />
Total n<strong>on</strong>interest expenses 1,804 1,663 1,633<br />
therein:<br />
Restructuring activities – – (1)<br />
Minority interest – – –<br />
Income (loss) before income taxes 776 1,106 945<br />
Cost/income ratio 69 % 60 % 63 %<br />
Assets 47,416 49,487 32,117<br />
Average active equity1 1,160 1,081 1,095<br />
Pre-tax return <strong>on</strong> average active equity 67 % 102 % 86 %<br />
1 See Note [4] to the c<strong>on</strong>solidated financial statements for a descripti<strong>on</strong> of how average active equity is allocated to the divisi<strong>on</strong>s.<br />
Comparis<strong>on</strong> between <str<strong>on</strong>g><strong>20</strong>09</str<strong>on</strong>g> and <strong>20</strong>08<br />
Net revenues were € 2.6 billi<strong>on</strong>, a decrease of € 167 milli<strong>on</strong>, or 6 %, compared to <strong>20</strong>08. The decrease was<br />
attributable to a low interest rate envir<strong>on</strong>ment, depressed asset valuati<strong>on</strong>s during the first nine m<strong>on</strong>ths of<br />
<str<strong>on</strong>g><strong>20</strong>09</str<strong>on</strong>g>, lower depository receipts and reduced dividend activity. These were partly offset by c<strong>on</strong>tinued growth in<br />
72
Trade Finance products and a positive impact of € 160 milli<strong>on</strong> related to a revisi<strong>on</strong> of our risk-based funding<br />
framework.<br />
Provisi<strong>on</strong> for credit losses was € 27 milli<strong>on</strong> for <str<strong>on</strong>g><strong>20</strong>09</str<strong>on</strong>g>, versus € 5 milli<strong>on</strong> for <strong>20</strong>08.<br />
N<strong>on</strong>interest expenses were € 1.8 billi<strong>on</strong>, an increase of € 141 milli<strong>on</strong>, or 8 %, compared to <strong>20</strong>08. The increase<br />
was driven by higher regulatory costs related to deposit and pensi<strong>on</strong> protecti<strong>on</strong>, growing transacti<strong>on</strong>-related<br />
expenses as well as increased performance-related compensati<strong>on</strong> in line with improved Group-wide results.<br />
In additi<strong>on</strong>, the formati<strong>on</strong> of <strong>Deutsche</strong> Card Services in the fourth quarter <strong>20</strong>08 c<strong>on</strong>tributed to higher n<strong>on</strong>-<br />
interest expenses.<br />
Private Clients and Asset Management Group Divisi<strong>on</strong><br />
The following table sets forth the results of our Private Clients and Asset Management Group Divisi<strong>on</strong><br />
(PCAM) for the years ended December 31, <str<strong>on</strong>g><strong>20</strong>09</str<strong>on</strong>g>, <strong>20</strong>08 and <strong>20</strong>07, in accordance with our management<br />
reporting systems.<br />
in € m.<br />
(unless stated otherwise)<br />
Net revenues:<br />
<str<strong>on</strong>g><strong>20</strong>09</str<strong>on</strong>g> <strong>20</strong>08 <strong>20</strong>07<br />
Portfolio/fund management 2,033 2,457 3,017<br />
Brokerage 1,456 1,891 2,172<br />
Loan/deposit 3,531 3,251 3,154<br />
Payments, account & remaining financial services 1,005 1,066 1,030<br />
Other products 239 376 756<br />
Total net revenues<br />
therein:<br />
Net interest income and net gains (losses) <strong>on</strong> financial assets/liabilities at fair value<br />
8,264 9,041 10,129<br />
through profit or loss 4,160 3,871 3,529<br />
Provisi<strong>on</strong> for credit losses 806 668 501<br />
Total n<strong>on</strong>interest expenses<br />
therein:<br />
6,804 7,972 7,560<br />
Policyholder benefits and claims – 18 73<br />
Impairment of intangible assets (291) 580 74<br />
Restructuring activities – – (9)<br />
Minority interest (7) (<strong>20</strong>) 8<br />
Income (loss) before income taxes 660 4<strong>20</strong> 2,059<br />
Cost/income ratio 82 % 88 % 75 %<br />
Assets 174,738 188,785 156,767<br />
Average active equity1 8,408 8,315 8,539<br />
Pre-tax return <strong>on</strong> average active equity 8 % 5 % 24 %<br />
Invested assets 2 (in € bn.) 880 816 952<br />
1 See Note [4] to the c<strong>on</strong>solidated financial statements for a descripti<strong>on</strong> of how average active equity is allocated to the divisi<strong>on</strong>s.<br />
2 We define invested assets as (a) assets we hold <strong>on</strong> behalf of customers for investment purposes and/or (b) client assets that are managed by us. We<br />
manage invested assets <strong>on</strong> a discreti<strong>on</strong>ary or advisory basis, or these assets are deposited with us.<br />
The following paragraphs discuss the c<strong>on</strong>tributi<strong>on</strong> of the individual corporate divisi<strong>on</strong>s to the overall results of<br />
the Private Clients and Asset Management Group Divisi<strong>on</strong>.<br />
73
<strong>20</strong>-F Item 5: Operating and Financial Review and Prospects<br />
Asset and Wealth Management Corporate Divisi<strong>on</strong><br />
The following table sets forth the results of our Asset and Wealth Management Corporate Divisi<strong>on</strong> (AWM) for<br />
the years ended December 31, <str<strong>on</strong>g><strong>20</strong>09</str<strong>on</strong>g>, <strong>20</strong>08 and <strong>20</strong>07, in accordance with our management reporting systems.<br />
in € m.<br />
(unless stated otherwise)<br />
Net revenues:<br />
<str<strong>on</strong>g><strong>20</strong>09</str<strong>on</strong>g> <strong>20</strong>08 <strong>20</strong>07<br />
Portfolio/fund management (AM) 1,466 1,840 2,351<br />
Portfolio/fund management (PWM) 309 361 414<br />
Total portfolio/fund management 1,775 2,<strong>20</strong>1 2,765<br />
Brokerage 758 908 964<br />
Loan/deposit 314 266 223<br />
Payments, account & remaining financial services 23 26 22<br />
Other products (183) (137) 401<br />
Total net revenues 2,688 3,264 4,374<br />
Provisi<strong>on</strong> for credit losses 17 15 1<br />
Total n<strong>on</strong>interest expenses<br />
therein:<br />
2,476 3,794 3,453<br />
Policyholder benefits and claims – 18 73<br />
Impairment of intangible assets (291) 580 74<br />
Restructuring activities – – (8)<br />
Minority interest (7) (<strong>20</strong>) 7<br />
Income (loss) before income taxes <strong>20</strong>2 (525) 913<br />
Cost/income ratio 92 % 116 % 79 %<br />
Assets 43,761 50,473 39,180<br />
Average active equity1 4,791 4,870 5,109<br />
Pre-tax return <strong>on</strong> average active equity 4 % (11) % 18 %<br />
Invested assets 2 (in € bn.) 686 628 749<br />
1 See Note [4] to the c<strong>on</strong>solidated financial statements for a descripti<strong>on</strong> of how average active equity is allocated to the divisi<strong>on</strong>s.<br />
2 We define invested assets as (a) assets we hold <strong>on</strong> behalf of customers for investment purposes and/or (b) client assets that are managed by us. We<br />
manage invested assets <strong>on</strong> a discreti<strong>on</strong>ary or advisory basis, or these assets are deposited with us.<br />
Comparis<strong>on</strong> between <str<strong>on</strong>g><strong>20</strong>09</str<strong>on</strong>g> and <strong>20</strong>08<br />
For the year <str<strong>on</strong>g><strong>20</strong>09</str<strong>on</strong>g>, AWM reported net revenues of € 2.7 billi<strong>on</strong>, a decrease of € 576 milli<strong>on</strong>, or 18 %, compared<br />
to <strong>20</strong>08. Portfolio/fund management revenues in Asset Management (AM) decreased by € 374 milli<strong>on</strong>, or<br />
<strong>20</strong> %, and in Private Wealth Management (PWM) by € 52 milli<strong>on</strong>, or 14 %, compared to <strong>20</strong>08. This develop-<br />
ment was primarily driven by lower management fees as a result of lower asset valuati<strong>on</strong>s during the first nine<br />
m<strong>on</strong>ths of <str<strong>on</strong>g><strong>20</strong>09</str<strong>on</strong>g>, while the fourth quarter <str<strong>on</strong>g><strong>20</strong>09</str<strong>on</strong>g> indicated positive revenue impacts following a stabilizati<strong>on</strong> of<br />
the capital markets after market turbulence in the prior year quarter. Brokerage revenues decreased by<br />
€ 150 milli<strong>on</strong>, or 16 %, compared to <strong>20</strong>08, affected by c<strong>on</strong>tinued lower customer activity due to the uncertain-<br />
ties in securities markets, and by a shift towards lower-margin products. Loan/deposit revenues were up<br />
€ 48 milli<strong>on</strong>, or 18 %, due to higher loan margins and the positive impact from the revisi<strong>on</strong> of our risk-based<br />
funding framework in the sec<strong>on</strong>d quarter <str<strong>on</strong>g><strong>20</strong>09</str<strong>on</strong>g>. Revenues from Other products were negative € 183 milli<strong>on</strong> for<br />
<str<strong>on</strong>g><strong>20</strong>09</str<strong>on</strong>g> compared to negative revenues of € 137 milli<strong>on</strong> in the last year. This development mainly resulted from<br />
higher impairment charges related to AM’s real estate business, partially offset by lower discreti<strong>on</strong>ary injecti<strong>on</strong>s<br />
into m<strong>on</strong>ey market funds and lower impairment charges <strong>on</strong> seed capital and other investments.<br />
74
N<strong>on</strong>interest expenses in <str<strong>on</strong>g><strong>20</strong>09</str<strong>on</strong>g> were € 2.5 billi<strong>on</strong>, a decrease of € 1.3 billi<strong>on</strong>, or 35 %, compared to <strong>20</strong>08. This<br />
development included the reversal of an impairment charge <strong>on</strong> intangible assets of € 291 milli<strong>on</strong> in AM,<br />
related to DWS Investments in the U.S. (formerly DWS Scudder), which had been taken in <strong>20</strong>08. In additi<strong>on</strong>,<br />
n<strong>on</strong>interest expenses in <strong>20</strong>08 were negatively affected by a goodwill impairment of € 270 milli<strong>on</strong> in a c<strong>on</strong>solidated<br />
RREEF infrastructure investment (transferred to Corporate Investments in <str<strong>on</strong>g><strong>20</strong>09</str<strong>on</strong>g>). Higher severance<br />
payments compared to <strong>20</strong>08, reflecting our c<strong>on</strong>tinued efforts to repositi<strong>on</strong> our platform, were partly offset by<br />
the n<strong>on</strong>-recurrence of an € 98 milli<strong>on</strong> provisi<strong>on</strong> related to the obligati<strong>on</strong> to repurchase Aucti<strong>on</strong> Rate Preferred<br />
(“ARP”) securities/Aucti<strong>on</strong> Rate Securities (“ARS”) at par from retail clients following a settlement in the<br />
U.S. in <strong>20</strong>08.<br />
Invested assets in AWM were € 686 billi<strong>on</strong> at December 31, <str<strong>on</strong>g><strong>20</strong>09</str<strong>on</strong>g>, an increase of € 58 billi<strong>on</strong> compared to<br />
December 31, <strong>20</strong>08. In AM, invested assets increased by € 33 billi<strong>on</strong> mainly due to market appreciati<strong>on</strong> and<br />
net new m<strong>on</strong>ey of € 9 billi<strong>on</strong>. Invested assets in PWM increased by € 25 billi<strong>on</strong>, also predominantly resulting<br />
from market appreciati<strong>on</strong> and net new m<strong>on</strong>ey of € 7 billi<strong>on</strong>.<br />
Private & Business Clients Corporate Divisi<strong>on</strong><br />
The following table sets forth the results of our Private & Business Clients Corporate Divisi<strong>on</strong> (PBC) for the<br />
years ended December 31, <str<strong>on</strong>g><strong>20</strong>09</str<strong>on</strong>g>, <strong>20</strong>08 and <strong>20</strong>07, in accordance with our management reporting systems.<br />
in € m.<br />
(unless stated otherwise)<br />
Net revenues:<br />
<str<strong>on</strong>g><strong>20</strong>09</str<strong>on</strong>g> <strong>20</strong>08 <strong>20</strong>07<br />
Portfolio/fund management 257 256 252<br />
Brokerage 698 983 1,<strong>20</strong>7<br />
Loan/deposit 3,216 2,985 2,932<br />
Payments, account & remaining financial services 982 1,040 1,008<br />
Other products 422 513 355<br />
Total net revenues 5,576 5,777 5,755<br />
Provisi<strong>on</strong> for credit losses 790 653 501<br />
Total n<strong>on</strong>interest expenses<br />
therein:<br />
4,328 4,178 4,108<br />
Restructuring activities – – (1)<br />
Minority interest 0 0 0<br />
Income (loss) before income taxes 458 945 1,146<br />
Cost/income ratio 78 % 72 % 71 %<br />
Assets 131,013 138,350 117,809<br />
Average active equity1 3,617 3,445 3,430<br />
Pre-tax return <strong>on</strong> average active equity 13 % 27 % 33 %<br />
Invested assets 2 (in € bn.) 194 189 <strong>20</strong>3<br />
Loan volume (in € bn.) 96 91 87<br />
Deposit volume (in € bn.) 109 118 96<br />
1 See Note [4] to the c<strong>on</strong>solidated financial statements for a descripti<strong>on</strong> of how average active equity is allocated to the divisi<strong>on</strong>s.<br />
2 We define invested assets as (a) assets we hold <strong>on</strong> behalf of customers for investment purposes and/or (b) client assets that are managed by us. We<br />
manage invested assets <strong>on</strong> a discreti<strong>on</strong>ary or advisory basis, or these assets are deposited with us.<br />
75
<strong>20</strong>-F Item 5: Operating and Financial Review and Prospects<br />
Comparis<strong>on</strong> between <str<strong>on</strong>g><strong>20</strong>09</str<strong>on</strong>g> and <strong>20</strong>08<br />
Net revenues were € 5.6 billi<strong>on</strong>, down € <strong>20</strong>1 milli<strong>on</strong>, or 3 %, versus <strong>20</strong>08. Portfolio/fund management revenues<br />
remained virtually unchanged compared to <strong>20</strong>08. Brokerage revenues decreased by € 285 milli<strong>on</strong>, or 29 %,<br />
mainly reflecting wariness <strong>on</strong> the part of retail investors in the wake of market turbulence in the fourth quar-<br />
ter <strong>20</strong>08. Loan/deposit revenues increased by € 232 milli<strong>on</strong>, or 8 %, resulting from higher loan volumes and<br />
margins, partly offset by lower deposit margins. Payments, account & remaining financial services revenues<br />
decreased by € 58 milli<strong>on</strong>, or 6 %, mainly driven by lower revenues related to insurance products sales.<br />
Revenues from Other products of € 422 milli<strong>on</strong> in <str<strong>on</strong>g><strong>20</strong>09</str<strong>on</strong>g> decreased by € 91 milli<strong>on</strong>, or 18 %, mainly driven by<br />
the n<strong>on</strong>-recurrence of a post-IPO dividend income from a co-operati<strong>on</strong> partner and subsequent gains related<br />
to the disposal of a business, both recorded in <strong>20</strong>08.<br />
Provisi<strong>on</strong> for credit losses was € 790 milli<strong>on</strong>, an increase of € 136 milli<strong>on</strong>, or 21 %, compared to <strong>20</strong>08. This<br />
development reflects the c<strong>on</strong>tinued deteriorati<strong>on</strong> of the credit envir<strong>on</strong>ment in Spain and Poland, and generally<br />
higher credit costs in the other regi<strong>on</strong>s, partly offset by releases and lower provisi<strong>on</strong>s of € 146 milli<strong>on</strong> in <str<strong>on</strong>g><strong>20</strong>09</str<strong>on</strong>g><br />
related to certain revised parameter and model assumpti<strong>on</strong>s.<br />
N<strong>on</strong>interest expenses of € 4.3 billi<strong>on</strong> were € 150 milli<strong>on</strong>, or 4 %, higher than in <strong>20</strong>08. This increase was pre-<br />
dominantly driven by higher severance payments of € 192 milli<strong>on</strong>, up from € 84 milli<strong>on</strong> in <strong>20</strong>08, related to<br />
measures to improve our efficiency.<br />
Invested assets were € 194 billi<strong>on</strong> as of December 31, <str<strong>on</strong>g><strong>20</strong>09</str<strong>on</strong>g>, an increase of € 5 billi<strong>on</strong> compared to Decem-<br />
ber 31, <strong>20</strong>08, mainly driven by market appreciati<strong>on</strong>, amounting to € 10 billi<strong>on</strong>, partly offset by outflows reflect-<br />
ing maturities in time deposits, which were acquired in the fourth quarter of <strong>20</strong>08.<br />
The number of clients in PBC was 14.6 milli<strong>on</strong> at year end <str<strong>on</strong>g><strong>20</strong>09</str<strong>on</strong>g>, unchanged compared to December 31, <strong>20</strong>08.<br />
76
Corporate Investments Group Divisi<strong>on</strong><br />
The following table sets forth the results of our Corporate Investments Group Divisi<strong>on</strong> (CI) for the years ended<br />
December 31, <str<strong>on</strong>g><strong>20</strong>09</str<strong>on</strong>g>, <strong>20</strong>08 and <strong>20</strong>07, in accordance with our management reporting systems.<br />
in € m.<br />
(unless stated otherwise) <str<strong>on</strong>g><strong>20</strong>09</str<strong>on</strong>g> <strong>20</strong>08 <strong>20</strong>07<br />
Net revenues 1,044 1,290 1,517<br />
therein:<br />
Net interest income and net gains (losses) <strong>on</strong> financial assets/liabilities at fair value<br />
through profit or loss 793 (172) 157<br />
Provisi<strong>on</strong> for credit losses 8 (1) 3<br />
Total n<strong>on</strong>interest expenses 581 95 2<strong>20</strong><br />
therein:<br />
Impairment of intangible assets 151 – 54<br />
Restructuring activities – – (0)<br />
Minority interest (1) 2 (5)<br />
Income (loss) before income taxes 456 1,194 1,299<br />
Cost/income ratio 56 % 7 % 15 %<br />
Assets 28,456 18,297 13,005<br />
Average active equity1 4,323 403 473<br />
Pre-tax return <strong>on</strong> average active equity 11 % N/M N/M<br />
N/M – Not meaningful<br />
1 See Note [4] to the c<strong>on</strong>solidated financial statements for a descripti<strong>on</strong> of how average active equity is allocated to the divisi<strong>on</strong>s.<br />
Comparis<strong>on</strong> between <str<strong>on</strong>g><strong>20</strong>09</str<strong>on</strong>g> and <strong>20</strong>08<br />
Net revenues were € 1.0 billi<strong>on</strong>, a decrease of € 245 milli<strong>on</strong> compared to <strong>20</strong>08. Net revenues in <str<strong>on</strong>g><strong>20</strong>09</str<strong>on</strong>g> included<br />
three significant comp<strong>on</strong>ents which were related to <strong>Deutsche</strong> Postbank AG: mark-to-market gains of<br />
€ 476 milli<strong>on</strong> from our derivatives related to the acquisiti<strong>on</strong> of shares, mark-to-market gains of € 352 milli<strong>on</strong><br />
from the put/call opti<strong>on</strong>s to increase our investment and a positive equity pick-up of € <strong>20</strong>0 milli<strong>on</strong>. In additi<strong>on</strong>,<br />
net revenues included mark-to-market gains of € 83 milli<strong>on</strong> from our opti<strong>on</strong> to increase our share in Hua Xia<br />
<strong>Bank</strong> Co. Ltd. and gains of € 302 milli<strong>on</strong> from the sale of industrial holdings (mainly related to Daimler AG and<br />
Linde AG). These positive items were partly offset by impairment charges of € 302 milli<strong>on</strong> <strong>on</strong> our industrial<br />
holdings and € 75 milli<strong>on</strong> <strong>on</strong> The Cosmopolitan Resort and Casino property.<br />
Net revenues in <strong>20</strong>08 included net gains of € 1.3 billi<strong>on</strong> from the sale of industrial holdings (mainly related<br />
to Daimler AG, Allianz SE and Linde AG), a gain of € 96 milli<strong>on</strong> from the disposal of our investment in<br />
Arcor AG & Co. KG, dividend income of € 114 milli<strong>on</strong>, as well as mark-downs, including the impact from our<br />
opti<strong>on</strong> to increase our share in Hua Xia <strong>Bank</strong> Co. Ltd.<br />
Total n<strong>on</strong>interest expenses were € 581 milli<strong>on</strong>, an increase of € 487 milli<strong>on</strong> compared to the previous year.<br />
This increase was mainly related to our investment in Maher Terminals (for which management resp<strong>on</strong>sibility<br />
changed from AWM to CI in the first quarter <str<strong>on</strong>g><strong>20</strong>09</str<strong>on</strong>g>), including a goodwill impairment charge of € 151 milli<strong>on</strong>.<br />
At year end <str<strong>on</strong>g><strong>20</strong>09</str<strong>on</strong>g>, the alternative assets portfolio of CI had a carrying value of € 2.1 billi<strong>on</strong> compared to<br />
€ 434 milli<strong>on</strong> at year end <strong>20</strong>08. This increase was mainly related to the change in management resp<strong>on</strong>sibili-<br />
ties for certain assets from AWM and CB&S to CI.<br />
77
<strong>20</strong>-F Item 5: Operating and Financial Review and Prospects<br />
C<strong>on</strong>solidati<strong>on</strong> & Adjustments<br />
For a discussi<strong>on</strong> of C<strong>on</strong>solidati<strong>on</strong> & Adjustments to our business segment results see Note [4] to the c<strong>on</strong>solidated<br />
financial statements.<br />
Operating Results (<strong>20</strong>08 vs. <strong>20</strong>07)<br />
Net Interest Income<br />
Net interest income in <strong>20</strong>08 was € 12.5 billi<strong>on</strong>, an increase of € 3.6 billi<strong>on</strong>, or 41 %, from <strong>20</strong>07. Both total interest<br />
and similar income and total interest expenses in <strong>20</strong>08 were significantly below those of <strong>20</strong>07, mainly<br />
reflecting the overall decline in interest levels as central banks globally cut rates during <strong>20</strong>08 in resp<strong>on</strong>se to<br />
the credit crunch. The decrease in interest expenses was more pr<strong>on</strong>ounced than the decrease in interest<br />
income. Although our average interest-bearing liabilities volume increased by € 29.6 billi<strong>on</strong>, or 3 %, in <strong>20</strong>08,<br />
our ability to fund at significantly lower rates compared to <strong>20</strong>07 was the main reas<strong>on</strong> for the widening of our<br />
net interest spread by 49 basis points and of our net interest margin by 30 basis points.<br />
Net Gains (Losses) <strong>on</strong> Financial Assets/Liabilities at Fair Value through Profit or Loss<br />
Net gains (losses) <strong>on</strong> financial assets/liabilities at fair value through profit or loss from CIB – Sales & Trading<br />
(debt and other products) were net losses of € 6.6 billi<strong>on</strong> in <strong>20</strong>08, compared to net gains of € 3.9 billi<strong>on</strong> in<br />
<strong>20</strong>07. This development was mainly driven by mark-downs relating to reserves against m<strong>on</strong>oline insurers,<br />
provisi<strong>on</strong>s against residential mortgage-backed securities and commercial real estate loans and significant<br />
losses in our credit trading businesses, including our proprietary trading businesses in the third and fourth<br />
quarter of <strong>20</strong>08. Net gains (losses) <strong>on</strong> financial assets/liabilities at fair value through profit or loss from<br />
Sales & Trading (equity) were losses of € 1.5 billi<strong>on</strong>, mainly generated in Equity Derivatives and Equity Proprietary<br />
Trading, compared to net gains of € 3.3 billi<strong>on</strong> in <strong>20</strong>07. The main c<strong>on</strong>tributor to net losses of<br />
€ 1.8 billi<strong>on</strong> <strong>on</strong> financial assets/liabilities at fair value through profit or loss from Other products were net markdowns<br />
of € 1.7 billi<strong>on</strong> <strong>on</strong> leveraged finance loans and loan commitments in <strong>20</strong>08.<br />
Net Interest Income and Net Gains (Losses) <strong>on</strong> Financial Assets/Liabilities at Fair Value through<br />
Profit or Loss<br />
Corporate and Investment <strong>Bank</strong> (CIB). Combined net interest income and net gains (losses) <strong>on</strong> financial assets/liabilities<br />
at fair value through profit or loss from Sales & Trading were negative € 1.6 billi<strong>on</strong> in <strong>20</strong>08,<br />
compared to positive € 10.6 billi<strong>on</strong> in <strong>20</strong>07. The main drivers for the decrease were the aforementi<strong>on</strong>ed markdowns<br />
<strong>on</strong> credit-related exposures, as well as losses in Equity Derivatives and Proprietary Trading. The increase<br />
in Loan products was driven by interest income <strong>on</strong> assets transferred from Originati<strong>on</strong> (Debt) to Loan<br />
Products as a result of reclassificati<strong>on</strong>s in accordance with the amendments to IAS 39 and mark-to-market<br />
hedge gains. The decrease of € 1.7 billi<strong>on</strong> in Remaining products resulted mainly from net mark-downs <strong>on</strong><br />
leveraged loans and loan commitments.<br />
Private Clients and Asset Management (PCAM). Combined net interest income and net gains (losses) <strong>on</strong><br />
financial assets/liabilities at fair value through profit or loss were € 3.9 billi<strong>on</strong> in <strong>20</strong>08, an increase of<br />
€ 342 milli<strong>on</strong>, or 10 %, compared to <strong>20</strong>07. The main c<strong>on</strong>tributor to the increase was higher net interest income<br />
following the c<strong>on</strong>solidati<strong>on</strong> of several m<strong>on</strong>ey market funds in the first half of <strong>20</strong>08. Higher loan and deposit<br />
volumes from growth in PBC also c<strong>on</strong>tributed to the increase.<br />
78
Corporate Investments (CI). Combined net interest income and net gains (losses) <strong>on</strong> financial assets/liabilities<br />
at fair value through profit or loss were negative € 172 milli<strong>on</strong> in <strong>20</strong>08, compared to positive € 157 milli<strong>on</strong> in<br />
<strong>20</strong>07, primarily reflecting mark-to-market losses from our opti<strong>on</strong> to increase our share in Hua Xia <strong>Bank</strong> Co. Ltd.<br />
Provisi<strong>on</strong> for Credit Losses<br />
Provisi<strong>on</strong> for credit losses was € 1.1 billi<strong>on</strong> in <strong>20</strong>08, up 76 %, compared to € 612 milli<strong>on</strong> in <strong>20</strong>07. This increase<br />
reflected net charges of € 408 milli<strong>on</strong> in CIB, compared to € 109 milli<strong>on</strong> in <strong>20</strong>07, and a 33 % increase in<br />
PCAM’s provisi<strong>on</strong> to € 668 milli<strong>on</strong>, primarily in PBC. The increase in CIB included € 257 milli<strong>on</strong> of provisi<strong>on</strong>s<br />
related to loans reclassified in accordance with amendments to IAS 39 and additi<strong>on</strong>al provisi<strong>on</strong>s, mainly <strong>on</strong><br />
European loans, reflecting the deteriorati<strong>on</strong> in credit c<strong>on</strong>diti<strong>on</strong>s.<br />
Remaining N<strong>on</strong>interest Income<br />
Commissi<strong>on</strong>s and fee income. Total <strong>20</strong>08 commissi<strong>on</strong>s and fee income was € 9.7 billi<strong>on</strong>, a decrease of<br />
€ 2.5 billi<strong>on</strong>, or 21 %, compared with <strong>20</strong>07. Commissi<strong>on</strong>s and fees from fiduciary activities decreased<br />
€ 551 milli<strong>on</strong> compared to the prior year, mainly driven by lower performance and asset-based fees in PCAM.<br />
Underwriting and advisory fees decreased by € 1.2 billi<strong>on</strong>, or 47 %, and Brokerage fees by € 526 milli<strong>on</strong>, or<br />
18 %, mainly driven by CB&S, as business volumes decreased in line with market developments. Fees for<br />
other customer services also decreased € 289 milli<strong>on</strong>.<br />
Net gains (losses) <strong>on</strong> financial assets available for sale. Total net gains <strong>on</strong> financial assets available for sale<br />
were € 666 milli<strong>on</strong> in <strong>20</strong>08, down € 127 milli<strong>on</strong>, or 16 %, compared to <strong>20</strong>07. The <strong>20</strong>08 result was driven mainly<br />
by net gains of € 1.3 billi<strong>on</strong> from the sale of industrial holdings in CI (mainly related to reducti<strong>on</strong>s of our holdings<br />
in Daimler AG and Linde AG and the sale of our remaining holding in Allianz SE), partly offset by impairment<br />
charges in CIB’s sales and trading areas, mainly including impairment losses of € 490 milli<strong>on</strong>. The <strong>20</strong>07<br />
result was primarily attributable to disposal gains of € 626 milli<strong>on</strong> related to CI’s industrial holdings portfolio, of<br />
which the most significant were gains from the reducti<strong>on</strong> of our stakes in Allianz SE and Linde AG, and from<br />
the disposal of our investment in Fiat S.p.A. Gains in CIB’s sales and trading areas were entirely offset by<br />
impairment charges.<br />
Net income (loss) from equity method investments. Net income from our equity method investments was<br />
€ 46 milli<strong>on</strong> and € 353 milli<strong>on</strong> in <strong>20</strong>08 and <strong>20</strong>07, respectively. There were no significant individual items in-<br />
cluded in <strong>20</strong>08. The key c<strong>on</strong>tributors in <strong>20</strong>07 were CI, driven by a gain of € 178 milli<strong>on</strong> from our investment in<br />
<strong>Deutsche</strong> Interhotel Holding GmbH & Co. KG (which also triggered an impairment charge of CI’s goodwill of<br />
€ 54 milli<strong>on</strong>), and the RREEF Alternative Investments business in AM.<br />
Other income. Total other income was € 699 milli<strong>on</strong> in <strong>20</strong>08. The decrease of € 678 milli<strong>on</strong> compared to <strong>20</strong>07<br />
reflected specific items in the prior period including the sale and leaseback transacti<strong>on</strong> of our premises at<br />
60 Wall Street in <strong>20</strong>07, and lower gains from the disposal of c<strong>on</strong>solidated subsidiaries in <strong>20</strong>08. Charges related<br />
to certain c<strong>on</strong>solidated m<strong>on</strong>ey market funds, which were offset in other revenue categories, further c<strong>on</strong>tributed<br />
to this development. The reducti<strong>on</strong> was partly offset by higher insurance premiums, primarily from the<br />
acquisiti<strong>on</strong> of Abbey Life Assurance Company Limited in the fourth quarter <strong>20</strong>07.<br />
79
<strong>20</strong>-F Item 5: Operating and Financial Review and Prospects<br />
N<strong>on</strong>interest Expenses<br />
Compensati<strong>on</strong> and benefits. The decrease of € 3.5 billi<strong>on</strong>, or 27 %, compared to <strong>20</strong>07 reflected significantly<br />
lower performance-related compensati<strong>on</strong> in <strong>20</strong>08, in line with lower operating results. This was partly offset by<br />
higher severance charges in CB&S and PBC, in c<strong>on</strong>necti<strong>on</strong> with employee reducti<strong>on</strong>s resulting from repositi<strong>on</strong>ing<br />
and efficiency programs.<br />
General and administrative expenses. The increase of € 301 milli<strong>on</strong>, or 4 %, compared to <strong>20</strong>07 was due main-<br />
ly to additi<strong>on</strong>al litigati<strong>on</strong>-related charges in <strong>20</strong>08 after net releases of provisi<strong>on</strong>s in the prior year, and higher<br />
expenses related to c<strong>on</strong>solidated investments in AM, both reflected in Other expenses. In additi<strong>on</strong>, the increase<br />
of € 441 milli<strong>on</strong> in Other expenses included a provisi<strong>on</strong> of € 98 milli<strong>on</strong> related to the obligati<strong>on</strong> to repurchase<br />
Aucti<strong>on</strong> Rate Preferred (“ARP”) securities/Aucti<strong>on</strong> Rate Securities (“ARS”) at par from retail clients<br />
following a settlement in the U.S.<br />
Policyholder benefits and claims. The credit of € 252 milli<strong>on</strong> in <strong>20</strong>08, compared to a charge of € 193 milli<strong>on</strong> in<br />
<strong>20</strong>07, resulted primarily from the aforementi<strong>on</strong>ed acquisiti<strong>on</strong> of Abbey Life Assurance Company Limited.<br />
These insurance-related credits were mainly offset by related net losses <strong>on</strong> financial assets/liabilities at fair<br />
value through profit or loss.<br />
Impairment of intangible assets. Impairments in <strong>20</strong>08 included € 310 milli<strong>on</strong> <strong>on</strong> DWS Scudder intangible as-<br />
sets and a goodwill impairment of € 270 milli<strong>on</strong> in a c<strong>on</strong>solidated investment, both in AM. Impairment charges<br />
of € 74 milli<strong>on</strong> <strong>on</strong> unamortized intangible assets in AM and a goodwill impairment charge of € 54 milli<strong>on</strong> in CI<br />
were recorded in <strong>20</strong>07.<br />
Restructuring activities. There were no restructuring charges in <strong>20</strong>08. In <strong>20</strong>07, the Business Realignment<br />
Program was completed and remaining provisi<strong>on</strong>s of € 13 milli<strong>on</strong> were released.<br />
Income Tax Expense<br />
A tax benefit of € 1.8 billi<strong>on</strong> was recorded in <strong>20</strong>08, compared to income tax expenses of € 2.2 billi<strong>on</strong> in <strong>20</strong>07.<br />
The net benefit in <strong>20</strong>08 was favorably driven by the geographic mix of income/loss, successful resoluti<strong>on</strong> of<br />
outstanding tax matters and a € 79 milli<strong>on</strong> policyholder tax credit related to the Abbey Life business. These<br />
beneficial impacts were partly offset by an increase in our unrecognized deferred tax assets through losses<br />
incurred by certain U.S. entities since the third quarter and a tax charge related to share based compensati<strong>on</strong><br />
as a result of the decline in our share price. The actual effective tax rates were 32.1 % in <strong>20</strong>08 and 25.6 % in<br />
<strong>20</strong>07.<br />
Results of Operati<strong>on</strong>s by Segment (<strong>20</strong>08 vs. <strong>20</strong>07)<br />
Corporate and Investment <strong>Bank</strong> Group Divisi<strong>on</strong><br />
Corporate <strong>Bank</strong>ing & Securities Corporate Divisi<strong>on</strong><br />
Net revenues in <strong>20</strong>08 were € 428 milli<strong>on</strong>, compared to € 16.6 billi<strong>on</strong> in <strong>20</strong>07. This development reflected markdowns<br />
<strong>on</strong> credit market related assets of € 7.5 billi<strong>on</strong>, compared to € 2.3 billi<strong>on</strong> in the prior year, significant<br />
losses in key Sales & Trading businesses, particularly in the fourth quarter of <strong>20</strong>08, and lower levels of Originati<strong>on</strong><br />
and Advisory revenues.<br />
80
The decline in net revenues reflected the impact <strong>on</strong> our business model of unprecedented levels of market<br />
volatility and correlati<strong>on</strong> across asset classes in <strong>20</strong>08 and, in particular, following the financial collapse of a<br />
U.S. investment bank in September. In resp<strong>on</strong>se CB&S reduced its trading exposures in Equity and Credit<br />
Proprietary Trading. The aforementi<strong>on</strong>ed losses more than offset significant year-<strong>on</strong>-year revenue growth in<br />
our customer-oriented m<strong>on</strong>ey market and foreign exchange flow businesses.<br />
Sales & Trading (debt and other products) revenues for <strong>20</strong>08 were € 116 milli<strong>on</strong>, compared to € 8.4 billi<strong>on</strong> in<br />
<strong>20</strong>07. Key drivers of the decline were mark-downs of € 5.8 billi<strong>on</strong>, relating to additi<strong>on</strong>al reserves against<br />
m<strong>on</strong>oline insurers (€ 2.2 billi<strong>on</strong>), further mark-downs <strong>on</strong> residential mortgage-backed securities (€ 2.1 billi<strong>on</strong>)<br />
and commercial real estate loans (€ 1.1 billi<strong>on</strong>), and impairment losses <strong>on</strong> available for sale positi<strong>on</strong>s<br />
(€ 490 milli<strong>on</strong>), compared to a total of € 1.6 billi<strong>on</strong> in <strong>20</strong>07. If reclassificati<strong>on</strong>s, in accordance with the amendments<br />
to IAS 39, had not been made, the income statement for <strong>20</strong>08 would have included additi<strong>on</strong>al negative<br />
fair value adjustments of € 2.3 billi<strong>on</strong> in Sales & Trading (debt and other products).<br />
In Credit Trading, we incurred further losses of € 3.2 billi<strong>on</strong>, predominantly in the fourth quarter <strong>20</strong>08, of which<br />
€ 1.7 billi<strong>on</strong> related to Credit Proprietary Trading. The losses in the Credit Proprietary Trading business were<br />
mainly driven by losses <strong>on</strong> l<strong>on</strong>g positi<strong>on</strong>s in the U.S. automotive sector and by falling corporate and c<strong>on</strong>vertible<br />
b<strong>on</strong>d prices, as well as basis widening <strong>on</strong> significant other debt trading inventory versus the credit default<br />
swaps (CDS) established to hedge them. The remaining losses in our Credit Trading business were incurred<br />
across many sectors, as b<strong>on</strong>ds were sold off and basis spreads widened, driven by significant market deleveraging<br />
and low levels of liquidity. These losses were partially offset by record results in Foreign Exchange,<br />
M<strong>on</strong>ey Markets and Commodities, where customer activity remained str<strong>on</strong>g.<br />
Sales & Trading (equity) revenues were negative € 631 milli<strong>on</strong> in <strong>20</strong>08, compared to positive € 4.6 billi<strong>on</strong> in<br />
<strong>20</strong>07. The decrease was mainly driven by losses in our Equity Derivatives and Equity Proprietary Trading<br />
businesses. In an envir<strong>on</strong>ment characterized by severely dislocated equity markets, with unprecedented levels<br />
of volatility and very low levels of liquidity, Equity Derivatives incurred losses of € 1.4 billi<strong>on</strong>, mainly in the<br />
fourth quarter. Significant increases in the levels of equity market volatility and in correlati<strong>on</strong>s between both<br />
individual equity securities and indices combined with the rapid downward repricing of dividend expectati<strong>on</strong>s<br />
negatively impacted the overall value of the structural positi<strong>on</strong>s we held from our significant client related<br />
trading activities in the European and other equity derivatives markets. Equity Proprietary Trading losses of<br />
€ 742 milli<strong>on</strong> were driven by market-wide de-leveraging, which drove down c<strong>on</strong>vertible values and widened<br />
basis risk. However, the prime brokerage business c<strong>on</strong>tinued to attract net new securities balances and generated<br />
revenues that were marginally lower than in <strong>20</strong>07.<br />
Revenues of € 210 milli<strong>on</strong> in Originati<strong>on</strong> and Advisory were € 2.5 billi<strong>on</strong> below <strong>20</strong>07. The revenue decrease<br />
was caused primarily by mark-downs of € 1.7 billi<strong>on</strong>, net of recoveries, against leveraged finance loans and<br />
loan commitments, compared to € 759 milli<strong>on</strong> in <strong>20</strong>07. In additi<strong>on</strong>, revenues were affected by the turbulent<br />
c<strong>on</strong>diti<strong>on</strong>s in the financial markets which led to lower issuances and new business volume compared to <strong>20</strong>07.<br />
If reclassificati<strong>on</strong>s, in accordance with the amendments to IAS 39, had not been made, the income statement<br />
for the year would have included additi<strong>on</strong>al negative fair value adjustments from Originati<strong>on</strong> and Advisory of<br />
€ 1.1 billi<strong>on</strong>.<br />
81
<strong>20</strong>-F Item 5: Operating and Financial Review and Prospects<br />
Loan products revenues were € 1.4 billi<strong>on</strong>, an increase of € 326 milli<strong>on</strong>, or 31 %, compared to <strong>20</strong>07. The increase<br />
was largely driven by mark-to-market hedge gains and interest income <strong>on</strong> assets transferred from<br />
Originati<strong>on</strong> (debt) to Loan Products as a result of reclassificati<strong>on</strong>s in accordance with the amendments to<br />
IAS 39.<br />
Other products revenues were negative € 661 milli<strong>on</strong>, a decrease of € 510 milli<strong>on</strong> compared to <strong>20</strong>07. The<br />
decrease primarily resulted from mark-to-market losses <strong>on</strong> investments held to back insurance policyholder<br />
claims in Abbey Life Assurance Company Limited, which was acquired in the fourth quarter <strong>20</strong>07. This effect<br />
was offset in n<strong>on</strong>interest expenses and had no impact <strong>on</strong> net income (loss).<br />
The Provisi<strong>on</strong> for credit losses was a net charge of € 402 milli<strong>on</strong> in <strong>20</strong>08, compared to a net charge of<br />
€ 102 milli<strong>on</strong> in <strong>20</strong>07. The increase was driven by a provisi<strong>on</strong> for credit losses of € 257 milli<strong>on</strong> related to assets<br />
which had been reclassified in accordance with the amendments to IAS 39, together with additi<strong>on</strong>al provisi<strong>on</strong>s,<br />
mainly <strong>on</strong> European loans, reflecting the deteriorati<strong>on</strong> in credit c<strong>on</strong>diti<strong>on</strong>s.<br />
N<strong>on</strong>interest expenses decreased € 3.7 billi<strong>on</strong>, or 30 %, to € 8.6 billi<strong>on</strong> in <strong>20</strong>08. This decrease was primarily<br />
due to lower performance-related compensati<strong>on</strong> in line with business results, as well as the aforementi<strong>on</strong>ed<br />
effects from Abbey Life which resulted in cost decreases of € 389 milli<strong>on</strong>. Savings from cost c<strong>on</strong>tainment<br />
measures and lower staff levels were offset by higher severance charges.<br />
The Corporate <strong>Bank</strong>ing & Securities Corporate Divisi<strong>on</strong> recorded a loss before income taxes of € 8.5 billi<strong>on</strong> in<br />
<strong>20</strong>08, compared to income before income taxes of € 4.2 billi<strong>on</strong> in <strong>20</strong>07.<br />
Global Transacti<strong>on</strong> <strong>Bank</strong>ing Corporate Divisi<strong>on</strong><br />
Net revenues increased by € 189 milli<strong>on</strong>, or 7 %, to € 2.8 billi<strong>on</strong> in <strong>20</strong>08 due mainly to an improved business<br />
flow in documentary credit services and export finance soluti<strong>on</strong>s for clients' cross-border trade transacti<strong>on</strong>s in<br />
the Trade Finance business. Cash Management also generated higher revenues as a result of significantly<br />
increased transacti<strong>on</strong> volumes in both the euro and U.S. dollar clearing business. Despite the market turmoil<br />
in <strong>20</strong>08, there was a growth of 8 % in deposit balances compared to December 31, <strong>20</strong>07.<br />
The Provisi<strong>on</strong> for credit losses was a net charge of € 5 milli<strong>on</strong> in <strong>20</strong>08, compared to a net charge of € 7 milli<strong>on</strong><br />
in <strong>20</strong>07.<br />
N<strong>on</strong>interest expenses of € 1.7 billi<strong>on</strong> in <strong>20</strong>08 remained stable compared to <strong>20</strong>07. Expenses related to invest-<br />
ments, including the acquisiti<strong>on</strong>s of HedgeWorks, LLC in the U.S. and the operating platform of Pago eTrans-<br />
acti<strong>on</strong> Services GmbH, were mostly offset by cost c<strong>on</strong>tainment measures, efficiency improvements and lower<br />
performance-related compensati<strong>on</strong>.<br />
Income before income tax expense increased by € 160 milli<strong>on</strong>, or 17 %, to € 1.1 billi<strong>on</strong> for the year ended<br />
December 31, <strong>20</strong>08.<br />
82
Private Clients and Asset Management Group Divisi<strong>on</strong><br />
Asset and Wealth Management Corporate Divisi<strong>on</strong><br />
Net revenues were € 3.3 billi<strong>on</strong> in <strong>20</strong>08, a decrease of € 1.1 billi<strong>on</strong>, or 25 %, compared to <strong>20</strong>07. Portfolio/fund<br />
management revenues in Asset Management (AM) decreased by € 510 milli<strong>on</strong>, or 22 %, and in Private Wealth<br />
Management (PWM) by € 53 milli<strong>on</strong>, or 13 %. Both business divisi<strong>on</strong>s were significantly impacted by the<br />
negative market developments in <strong>20</strong>08, especially in the fourth quarter, as well as from the str<strong>on</strong>g euro. The<br />
deteriorati<strong>on</strong> of performance and asset-based fees reflected the sharp decline of asset valuati<strong>on</strong>s and the<br />
related development of assets under management, especially with regard to equity products. Brokerage revenues<br />
decreased by € 56 milli<strong>on</strong>, or 6 %, compared to <strong>20</strong>07, reflecting limited client activity in the challenging<br />
market envir<strong>on</strong>ment and the impact of the str<strong>on</strong>ger euro. Loan/deposit revenues were up € 43 milli<strong>on</strong>, or <strong>20</strong> %,<br />
due to a significant growth of loan and deposit volumes. Revenues from Other products were negative<br />
€ 137 milli<strong>on</strong> in <strong>20</strong>08 compared to positive revenues of € 401 milli<strong>on</strong> in <strong>20</strong>07. The negative revenues in <strong>20</strong>08<br />
were composed of a number of significant specific items due to the market dislocati<strong>on</strong>s, including mark-downs<br />
of approximately € 230 milli<strong>on</strong> <strong>on</strong> seed capital and other investments and injecti<strong>on</strong>s of € 150 milli<strong>on</strong> into certain<br />
c<strong>on</strong>solidated m<strong>on</strong>ey market funds.<br />
N<strong>on</strong>interest expenses in <strong>20</strong>08 were € 3.8 billi<strong>on</strong>, an increase of € 341 milli<strong>on</strong>, or 10 %, compared to <strong>20</strong>07. The<br />
increase was primarily due to an impairment of € 310 milli<strong>on</strong> related to DWS Scudder intangible assets (com-<br />
pared to € 74 milli<strong>on</strong> in <strong>20</strong>07) and a goodwill impairment of € 270 milli<strong>on</strong> in a c<strong>on</strong>solidated investment, both in<br />
AM. In PWM, a provisi<strong>on</strong> of € 98 milli<strong>on</strong> was taken related to the obligati<strong>on</strong> to repurchase Aucti<strong>on</strong> Rate Pre-<br />
ferred (“ARP”) securities/Aucti<strong>on</strong> Rate Securities (“ARS”) at par from retail clients following a settlement in the<br />
U.S.<br />
AWM’s full year <strong>20</strong>08 resulted in a loss before income taxes of € 525 milli<strong>on</strong>, compared to an income before<br />
income taxes of € 913 milli<strong>on</strong> in <strong>20</strong>07.<br />
Invested assets were € 628 billi<strong>on</strong> at December 31, <strong>20</strong>08, a decrease of € 121 billi<strong>on</strong> compared to Decem-<br />
ber 31, <strong>20</strong>07. Asset value declines accounted for € 109 billi<strong>on</strong> of this decrease. For the full year <strong>20</strong>08, AM<br />
recorded net outflows of € 22 billi<strong>on</strong> while PWM attracted net new assets of € 10 billi<strong>on</strong>.<br />
Private & Business Clients Corporate Divisi<strong>on</strong><br />
Net revenues of € 5.8 billi<strong>on</strong> were essentially unchanged compared with <strong>20</strong>07. Portfolio/fund management<br />
revenues increased by € 4 milli<strong>on</strong>, or 1 %, driven by a successful portfolio management product campaign in<br />
the third quarter of <strong>20</strong>08. Brokerage revenues decreased by € 224 milli<strong>on</strong>, or 19 %, mainly reflecting low client<br />
activity in a difficult market envir<strong>on</strong>ment. Loan/deposit revenues increased by € 53 milli<strong>on</strong>, or 2 %, mainly<br />
driven by growth in both loan and deposit volumes, partly offset by lower margins, especially in deposit products.<br />
Payments, account & remaining financial services revenues increased by € 32 milli<strong>on</strong>, or 3 %, mainly<br />
driven by higher revenues from the credit card business. Revenues from Other products of € 513 milli<strong>on</strong> in<br />
<strong>20</strong>08 increased by € 158 milli<strong>on</strong>, or 44 %, mainly driven by PBC’s asset and liability management functi<strong>on</strong>,<br />
dividend income from a cooperati<strong>on</strong> partner after an IPO and subsequent gains related to a business sale<br />
closed in a prior period.<br />
83
<strong>20</strong>-F Item 5: Operating and Financial Review and Prospects<br />
Provisi<strong>on</strong> for credit losses increased by € 152 milli<strong>on</strong>, or 30 %, mainly reflecting the deteriorating credit c<strong>on</strong>diti<strong>on</strong>s<br />
in Spain, higher delinquencies in Germany and Italy, as well as organic growth in Poland.<br />
N<strong>on</strong>interest expenses of € 4.2 billi<strong>on</strong> were € 70 milli<strong>on</strong>, or 2 %, higher than in <strong>20</strong>07. Higher severance and<br />
staffing costs were offset by lower performance-related compensati<strong>on</strong> and tight cost management.<br />
Income before income taxes was € 945 milli<strong>on</strong> in <strong>20</strong>08, versus € 1.1 billi<strong>on</strong> in <strong>20</strong>07.<br />
Invested assets of € 189 billi<strong>on</strong> at the end of <strong>20</strong>08 decreased by € 15 billi<strong>on</strong>. Market depreciati<strong>on</strong> of € 30 billi<strong>on</strong><br />
was partly offset by net new assets of € 15 billi<strong>on</strong>.<br />
The number of clients in PBC reached 14.6 milli<strong>on</strong> at year end <strong>20</strong>08, an increase of approximately 800,000<br />
net new clients, mainly in Germany, Italy and Poland.<br />
Corporate Investments Group Divisi<strong>on</strong><br />
Net revenues were € 1.3 billi<strong>on</strong> in <strong>20</strong>08, a decrease of € 227 milli<strong>on</strong> compared to <strong>20</strong>07. Net revenues in <strong>20</strong>08<br />
included net gains of € 1.3 billi<strong>on</strong> from the sale of industrial holdings (mainly related to Daimler AG, Allianz SE<br />
and Linde AG), a gain of € 96 milli<strong>on</strong> from the disposal of our investment in Arcor AG & Co. KG, dividend<br />
income of € 114 milli<strong>on</strong>, as well as mark-downs, including the impact from our opti<strong>on</strong> to increase our share<br />
in Hua Xia <strong>Bank</strong> Co. Ltd. Net revenues in <strong>20</strong>07 included net gains of € 626 milli<strong>on</strong> from selling some of our<br />
industrial holdings (mainly Allianz SE, Linde AG and Fiat S.p.A.), a gain of € 178 milli<strong>on</strong> from our equity method<br />
investment in <strong>Deutsche</strong> Interhotel Holding GmbH & Co. KG (which also triggered an impairment charge of<br />
€ 54 milli<strong>on</strong> of CI’s goodwill), dividend income of € 141 milli<strong>on</strong> and mark-ups from our opti<strong>on</strong> to increase our<br />
share in Hua Xia <strong>Bank</strong> Co. Ltd. In additi<strong>on</strong>, net revenues included a gain of € 313 milli<strong>on</strong> from the sale and<br />
leaseback transacti<strong>on</strong> of our premises at 60 Wall Street.<br />
Total N<strong>on</strong>interest expenses were € 95 milli<strong>on</strong> in <strong>20</strong>08, a decrease of € 126 milli<strong>on</strong> compared to <strong>20</strong>07. This<br />
decrease was mainly the result of lower costs from c<strong>on</strong>solidated investments in <strong>20</strong>08 and the aforementi<strong>on</strong>ed<br />
goodwill impairment charge in <strong>20</strong>07.<br />
Income before income taxes was € 1.2 billi<strong>on</strong> in <strong>20</strong>08, versus € 1.3 billi<strong>on</strong> in <strong>20</strong>07.<br />
At year end <strong>20</strong>08, the alternative assets portfolio of CI had a carrying value of € 434 milli<strong>on</strong> (down 31 % com-<br />
pared to <strong>20</strong>07), of which 72 % was attributable to real estate investments, 23 % to private equity direct in-<br />
vestments and 5 % to private equity indirect and other investments. This compares to a carrying value of<br />
€ 631 milli<strong>on</strong> at year end <strong>20</strong>07.<br />
84
Liquidity and Capital Resources<br />
For a detailed discussi<strong>on</strong> of our liquidity risk management, see “Item 11: Quantitative and Qualitative Disclosures<br />
about Credit, Market and Other Risk – Liquidity Risk.” For a detailed discussi<strong>on</strong> of our capital management,<br />
see “Item 11: Quantitative and Qualitative Disclosures about Credit, Market and Other Risk – Liquidity<br />
Risk – Capital Management” and Note [36] to the c<strong>on</strong>solidated financial statements.<br />
Post-Employment Benefit Plans<br />
We have a number of post-employment benefit plans. In additi<strong>on</strong> to defined c<strong>on</strong>tributi<strong>on</strong> plans, there are<br />
plans accounted for as defined benefit plans.<br />
Defined benefit plans with a benefit obligati<strong>on</strong> exceeding € 1 milli<strong>on</strong> are included in our globally coordinated<br />
accounting process. Reviewed by our global actuary, the plans in each country are evaluated by locally appointed<br />
actuaries.<br />
By applying our global policy for determining the financial and demographic assumpti<strong>on</strong>s we ensure that the<br />
assumpti<strong>on</strong>s are unbiased and mutually compatible and that they follow the best estimate and <strong>on</strong>going plan<br />
principles.<br />
For a further discussi<strong>on</strong> <strong>on</strong> our employee benefit plans see Note [32] to our c<strong>on</strong>solidated financial statements.<br />
Special Purpose Entities<br />
We engage in various business activities with certain entities, referred to as special purpose entities (SPEs),<br />
which are designed to achieve a specific business purpose. The principal uses of SPEs are to provide clients<br />
with access to specific portfolios of assets and risk and to provide market liquidity for clients through securitizing<br />
financial assets. SPEs may be established as corporati<strong>on</strong>s, trusts or partnerships.<br />
We may or may not c<strong>on</strong>solidate SPEs that we have set up or sp<strong>on</strong>sored or with which we have a c<strong>on</strong>tractual<br />
relati<strong>on</strong>ship. We will c<strong>on</strong>solidate an SPE when we have the power to govern its financial and operating policies,<br />
generally accompanying a shareholding, either directly or indirectly, of more than half the voting rights.<br />
If the activities of the SPEs are narrowly defined or it is not evident who c<strong>on</strong>trols the financial and operating<br />
policies of the SPE we will c<strong>on</strong>sider other factors to determine whether we have the majority of the risks and<br />
rewards. We reassess our treatment of SPEs for c<strong>on</strong>solidati<strong>on</strong> when there is a change in the SPE’s arrangements<br />
or the substance of the relati<strong>on</strong>ship between us and an SPE changes. For further detail <strong>on</strong> our<br />
accounting policies regarding c<strong>on</strong>solidati<strong>on</strong> and reassessment of c<strong>on</strong>solidati<strong>on</strong> of SPEs please refer to<br />
Note [1] in our c<strong>on</strong>solidated financial statements.<br />
In limited situati<strong>on</strong>s we c<strong>on</strong>solidate some SPEs for both financial reporting and German regulatory purposes.<br />
However, in all other cases we hold regulatory capital, as appropriate, against all SPE-related transacti<strong>on</strong>s<br />
and related exposures, such as derivative transacti<strong>on</strong>s and lending-related commitments and guarantees. To<br />
date, our exposures to n<strong>on</strong>-c<strong>on</strong>solidated SPEs have not had a material impact <strong>on</strong> our debt covenants, capital<br />
ratios, credit ratings or dividends.<br />
85
<strong>20</strong>-F Item 5: Operating and Financial Review and Prospects<br />
The following secti<strong>on</strong>s provide detail about the assets (after c<strong>on</strong>solidati<strong>on</strong> eliminati<strong>on</strong>s) in our c<strong>on</strong>solidated<br />
SPEs and our maximum unfunded exposure remaining to certain n<strong>on</strong>-c<strong>on</strong>solidated SPEs. These secti<strong>on</strong>s<br />
should be read in c<strong>on</strong>juncti<strong>on</strong> with the Update <strong>on</strong> Key Credit Market Exposures which is included in “Results<br />
of Operati<strong>on</strong>s by Segment (<str<strong>on</strong>g><strong>20</strong>09</str<strong>on</strong>g> vs. <strong>20</strong>08) – Corporate <strong>Bank</strong>ing & Securities Corporate Divisi<strong>on</strong>”.<br />
Total Assets in C<strong>on</strong>solidated SPEs<br />
Dec 31, <str<strong>on</strong>g><strong>20</strong>09</str<strong>on</strong>g> Asset type<br />
Financial<br />
assets at<br />
fair value<br />
through<br />
in € m.<br />
profit or loss 1<br />
Financial<br />
Loans<br />
assets<br />
available<br />
for sale<br />
2<br />
Cash and Other assets Total assets<br />
cash<br />
equivalents<br />
Category:<br />
Group sp<strong>on</strong>sored ABCP c<strong>on</strong>duits2 30 279 15,222 – 33 15,564<br />
Group sp<strong>on</strong>sored securitizati<strong>on</strong>s2 Third party sp<strong>on</strong>sored<br />
3,409 – 1,175 4 57 4,645<br />
securitizati<strong>on</strong>s<br />
Repackaging and investment<br />
<strong>20</strong>0 – 516 3 73 792<br />
products 5,789 1,973 36 661 557 9,016<br />
Mutual funds 5,163 – – 1,313 35 6,511<br />
Structured transacti<strong>on</strong>s 2,531 108 5,<strong>20</strong>7 26 423 8,295<br />
Operating entities2 1,603 3,319 1,898 501 2,416 9,737<br />
Other 610 240 786 59 453 2,148<br />
Total 19,335 5,919 24,840 2,567 4,047 56,708<br />
1 Fair value of derivative positi<strong>on</strong>s is € 250 milli<strong>on</strong>.<br />
2 Certain positi<strong>on</strong>s have been reclassified from trading and available for sale into loans in accordance with IAS 39, “Reclassificati<strong>on</strong> of Financial Assets”<br />
which became effective <strong>on</strong> July 1, <strong>20</strong>08. For an explanati<strong>on</strong> of the impact of the reclassificati<strong>on</strong> please see Note [12] and “Results of Operati<strong>on</strong>s by<br />
Segment (<str<strong>on</strong>g><strong>20</strong>09</str<strong>on</strong>g> vs. <strong>20</strong>08) – Corporate <strong>Bank</strong>ing & Securities Corporate Divisi<strong>on</strong>, Amendments to IAS 39 and IFRS 7, “Reclassificati<strong>on</strong> of Financial<br />
Assets”.<br />
Dec 31, <strong>20</strong>08 Asset type<br />
Financial<br />
assets at<br />
fair value<br />
through<br />
in € m.<br />
profit or loss 1<br />
Financial<br />
Loans<br />
assets<br />
available<br />
for sale<br />
2<br />
Cash and Other assets Total assets<br />
cash<br />
equivalents<br />
Category:<br />
Group sp<strong>on</strong>sored ABCP c<strong>on</strong>duits2 – 30 24,523 6 132 24,691<br />
Group sp<strong>on</strong>sored securitizati<strong>on</strong>s2 Third party sp<strong>on</strong>sored<br />
8,447 – 1,324 41 307 10,119<br />
securitizati<strong>on</strong>s<br />
Repackaging and investment<br />
546 – 533 1 148 1,228<br />
products 9,012 1,847 101 935 2,224 14,119<br />
Mutual funds 7,005 – – 3,328 45 10,378<br />
Structured transacti<strong>on</strong>s 3,327 <strong>20</strong>2 5,066 22 416 9,033<br />
Operating entities2 1,810 3,497 1,986 600 1,472 9,365<br />
Other 415 307 926 485 839 2,972<br />
Total 30,562 5,883 34,459 5,418 5,583 81,905<br />
1 Fair value of derivative positi<strong>on</strong>s is € 391 milli<strong>on</strong>.<br />
2 Certain positi<strong>on</strong>s have been reclassified from trading and available for sale into loans in accordance with IAS 39, “Reclassificati<strong>on</strong> of Financial Assets”<br />
which became effective <strong>on</strong> July 1, <strong>20</strong>08. For an explanati<strong>on</strong> of the impact of the reclassificati<strong>on</strong> please see Note [12] and “Results of Operati<strong>on</strong>s by<br />
Segment (<strong>20</strong>08 vs. <strong>20</strong>07) – Corporate <strong>Bank</strong>ing & Securities Corporate Divisi<strong>on</strong>, Amendments to IAS 39 and IFRS 7, “Reclassificati<strong>on</strong> of Financial Assets”.<br />
86
Group Sp<strong>on</strong>sored ABCP C<strong>on</strong>duits<br />
We set up, sp<strong>on</strong>sor and administer our own asset-backed commercial paper (ABCP) programs. These programs<br />
provide our customers with access to liquidity in the commercial paper market and create investment<br />
products for our clients. As an administrative agent for the commercial paper programs, we facilitate the purchase<br />
of n<strong>on</strong>-<strong>Deutsche</strong> <strong>Bank</strong> Group loans, securities and other receivables by the commercial paper c<strong>on</strong>duit<br />
(c<strong>on</strong>duit), which then issues to the market high-grade, short-term commercial paper, collateralized by the<br />
underlying assets, to fund the purchase. The c<strong>on</strong>duits require sufficient collateral, credit enhancements and<br />
liquidity support to maintain an investment grade rating for the commercial paper. We are the liquidity provider<br />
to these c<strong>on</strong>duits and therefore exposed to changes in the carrying value of their assets. We c<strong>on</strong>solidate the<br />
majority of our sp<strong>on</strong>sored c<strong>on</strong>duit programs because we have the c<strong>on</strong>trolling interest.<br />
Our liquidity exposure to these c<strong>on</strong>duits is to the entire commercial paper issued of € 16.2 billi<strong>on</strong> and<br />
€ 25.2 billi<strong>on</strong> as of December 31, <str<strong>on</strong>g><strong>20</strong>09</str<strong>on</strong>g> and December 31, <strong>20</strong>08, of which we held € 8.2 billi<strong>on</strong> and € 5.1 billi<strong>on</strong>,<br />
respectively.<br />
The collateral in the c<strong>on</strong>duits includes a range of asset-backed loans and securities, including aircraft leasing,<br />
student loans, trust preferred securities and residential- and commercial-mortgage-backed securities. The<br />
collateral in the c<strong>on</strong>duits decreased € 9.1 billi<strong>on</strong> from December 31, <strong>20</strong>08 to December 31, <str<strong>on</strong>g><strong>20</strong>09</str<strong>on</strong>g>. This movement<br />
was predominantly due to the maturity of liquidity facilities.<br />
Group Sp<strong>on</strong>sored Securitizati<strong>on</strong>s<br />
We sp<strong>on</strong>sor SPEs for which we originate or purchase assets. These assets are predominantly commercial<br />
and residential whole loans or mortgage-backed securities. The SPEs fund these purchases by issuing multiple<br />
tranches of securities, the repayment of which is linked to the performance of the assets in the SPE.<br />
When we retain a subordinated interest in the assets that have been securitized, an assessment of the relevant<br />
factors is performed and, if SPEs are c<strong>on</strong>trolled by us, they are c<strong>on</strong>solidated. The fair value of our retained<br />
exposure in these securitizati<strong>on</strong>s as of December 31, <str<strong>on</strong>g><strong>20</strong>09</str<strong>on</strong>g> and December 31, <strong>20</strong>08 was € 3.0 billi<strong>on</strong><br />
and € 4.4 billi<strong>on</strong>, respectively. During <str<strong>on</strong>g><strong>20</strong>09</str<strong>on</strong>g> we actively sold the subordinated interests held in these SPEs,<br />
which resulted in the dec<strong>on</strong>solidati<strong>on</strong> of the SPEs and a reducti<strong>on</strong> in our c<strong>on</strong>solidated assets.<br />
Third Party Sp<strong>on</strong>sored Securitizati<strong>on</strong>s<br />
In c<strong>on</strong>necti<strong>on</strong> with our securities trading and underwriting activities, we acquire securities issued by third party<br />
securitizati<strong>on</strong> vehicles that purchase diversified pools of commercial and residential whole loans or mortgagebacked<br />
securities. The vehicles fund these purchases by issuing multiple tranches of securities, the repayment<br />
of which is linked to the performance of the assets in the vehicles. When we hold a subordinated interest<br />
in the SPE, an assessment of the relevant factors is performed and if SPEs are c<strong>on</strong>trolled by us, they are<br />
c<strong>on</strong>solidated. As of December 31, <str<strong>on</strong>g><strong>20</strong>09</str<strong>on</strong>g> and December 31, <strong>20</strong>08 the fair value of our retained exposure in<br />
these securitizati<strong>on</strong>s was € 0.7 billi<strong>on</strong> and € 0.8 billi<strong>on</strong>, respectively.<br />
87
<strong>20</strong>-F Item 5: Operating and Financial Review and Prospects<br />
Repackaging and Investment Products<br />
Repackaging is a similar c<strong>on</strong>cept to securitizati<strong>on</strong>. The primary difference is that the comp<strong>on</strong>ents of the<br />
repackaging SPE are generally securities and derivatives, rather than n<strong>on</strong>-security financial assets, which are<br />
then “repackaged” into a different product to meet specific individual investor needs. We c<strong>on</strong>solidate these<br />
SPEs when we have the majority of risks and rewards. Investment products offer clients the ability to become<br />
exposed to specific portfolios of assets and risks through purchasing our structured notes. We hedge this<br />
exposure by purchasing interests in SPEs that match the return specified in the notes. We c<strong>on</strong>solidate the<br />
SPEs when we hold the c<strong>on</strong>trolling interest or have the majority of risks and rewards. In <str<strong>on</strong>g><strong>20</strong>09</str<strong>on</strong>g>, c<strong>on</strong>solidated<br />
assets decreased by € 4.0 billi<strong>on</strong> due to the dec<strong>on</strong>solidati<strong>on</strong> of certain SPEs, and a further reducti<strong>on</strong> of<br />
€ 1.1 billi<strong>on</strong> occurred due to the reclassificati<strong>on</strong> of Maher Terminals LLC and Maher Terminals of Canada<br />
Corp. to the Operating Entities category.<br />
Mutual Funds<br />
We offer clients mutual fund and mutual fund-related products which pay returns linked to the performance of<br />
the assets held in the funds. We provide a guarantee feature to certain funds in which we guarantee certain<br />
levels of the net asset value to be returned to investors at certain dates. The risk for us as guarantor is that<br />
we have to compensate the investors if the market values of such products at their respective guarantee<br />
dates are lower than the guaranteed levels. For our investment management service in relati<strong>on</strong> to such products,<br />
we earn management fees and, <strong>on</strong> occasi<strong>on</strong>, performance-based fees. Though we are not c<strong>on</strong>tractually<br />
obliged to support these funds, we made a decisi<strong>on</strong>, in a number of cases in which actual yields were lower<br />
than originally projected (although above any guaranteed thresholds), to support the funds’ target yields by<br />
injecting cash of € 16 milli<strong>on</strong> in <str<strong>on</strong>g><strong>20</strong>09</str<strong>on</strong>g> and € <strong>20</strong>7 milli<strong>on</strong> in <strong>20</strong>08.<br />
During <str<strong>on</strong>g><strong>20</strong>09</str<strong>on</strong>g> the amount of assets held in c<strong>on</strong>solidated funds decreased by € 3.9 billi<strong>on</strong>. This movement was<br />
predominantly due to cash outflows during the period and the dec<strong>on</strong>solidati<strong>on</strong> of two funds due to the terminati<strong>on</strong><br />
of the guarantee.<br />
Structured Transacti<strong>on</strong>s<br />
We enter into certain structures which offer clients funding opportunities at favorable rates. The funding is<br />
predominantly provided <strong>on</strong> a collateralized basis. These structures are individually tailored to the needs of our<br />
clients. We c<strong>on</strong>solidate these SPEs when we hold the c<strong>on</strong>trolling interest or we have the majority of the risks<br />
and rewards through a residual interest holding and/or a related liquidity facility. The compositi<strong>on</strong> of the SPEs<br />
that we c<strong>on</strong>solidate is influenced by the executi<strong>on</strong> of new transacti<strong>on</strong>s and the maturing, restructuring and<br />
exercise of early terminati<strong>on</strong> opti<strong>on</strong>s with respect to existing transacti<strong>on</strong>s.<br />
Operating Entities<br />
We establish SPEs to c<strong>on</strong>duct some of our operating business when we benefit from the use of an SPE.<br />
These include direct holdings in certain proprietary investments and the issuance of credit default swaps<br />
where our exposure has been limited to our investment in the SPE. We c<strong>on</strong>solidate these entities when we<br />
hold the c<strong>on</strong>trolling interest or are exposed to the majority of risks and rewards of the SPE. Included within<br />
the Total assets of the exposure detailed in the table is € 1.1 billi<strong>on</strong> of U.S. real estate taken up<strong>on</strong> the foreclosure<br />
of a loan and € 1.1 billi<strong>on</strong> due to the reclassificati<strong>on</strong> of Maher Terminals LLC and Maher Terminals of<br />
Canada Corp. from the Repackaging and Investment Products category.<br />
88
Exposure to N<strong>on</strong>-c<strong>on</strong>solidated SPEs<br />
Maximum unfunded exposure remaining<br />
in € bn.<br />
Dec 31, <str<strong>on</strong>g><strong>20</strong>09</str<strong>on</strong>g> Dec 31, <strong>20</strong>08<br />
Category:<br />
Group sp<strong>on</strong>sored ABCP c<strong>on</strong>duits 2.7 3.3<br />
Third party ABCP c<strong>on</strong>duits 2.5 1<br />
Third party sp<strong>on</strong>sored securitizati<strong>on</strong>s<br />
2.1<br />
U.S. 3.9 5.3<br />
n<strong>on</strong>-U.S. 2.5 4.0<br />
Guaranteed mutual funds 12.4 10.9<br />
Real estate leasing funds 0.8 0.8<br />
1 This includes a € 1.6 billi<strong>on</strong> margin facility as a result of the restructuring of the Canadian asset-backed commercial paper program in January <str<strong>on</strong>g><strong>20</strong>09</str<strong>on</strong>g>.<br />
Group Sp<strong>on</strong>sored ABCP C<strong>on</strong>duits<br />
We sp<strong>on</strong>sor and administer five ABCP c<strong>on</strong>duits, established in Australia, which are not c<strong>on</strong>solidated because<br />
we do not hold the majority of risks and rewards. These c<strong>on</strong>duits provide our clients with access to liquidity in<br />
the commercial paper market in Australia. As of December 31, <str<strong>on</strong>g><strong>20</strong>09</str<strong>on</strong>g> and December 31, <strong>20</strong>08 they had assets<br />
totaling € 2.3 billi<strong>on</strong> and € 2.8 billi<strong>on</strong> respectively, c<strong>on</strong>sisting of securities backed by n<strong>on</strong>-U.S. residential mortgages<br />
issued by warehouse SPEs set up by the clients to facilitate the purchase of the assets by the c<strong>on</strong>duits.<br />
The minimum credit rating for these securities is AA–. The credit enhancement necessary to achieve<br />
the required credit ratings is ordinarily provided by mortgage insurance extended by third-party insurers to the<br />
SPEs.<br />
The weighted average life of the assets held in the c<strong>on</strong>duits is five years. The average life of the commercial<br />
paper issued by these off-balance sheet c<strong>on</strong>duits is <strong>on</strong>e to three m<strong>on</strong>ths.<br />
Our exposure to these entities is limited to the committed liquidity facilities totaling € 2.7 billi<strong>on</strong> as of Decem-<br />
ber 31, <str<strong>on</strong>g><strong>20</strong>09</str<strong>on</strong>g> and € 3.3 billi<strong>on</strong> as of December 31, <strong>20</strong>08. We reduced the lines of credit available to the entities<br />
in <str<strong>on</strong>g><strong>20</strong>09</str<strong>on</strong>g>, which resulted in a decline in commercial paper issued by the c<strong>on</strong>duits and the amount of assets<br />
held. N<strong>on</strong>e of these liquidity facilities have been drawn. Advances against the liquidity facilities are collater-<br />
alized by the underlying assets held in the c<strong>on</strong>duits, and thus a drawn facility will be exposed to volatility in<br />
the value of the underlying assets. Should the assets decline sufficiently in value, there may not be sufficient<br />
funds to repay the advance. As at December 31, <str<strong>on</strong>g><strong>20</strong>09</str<strong>on</strong>g> we did not hold material amounts of commercial paper<br />
or notes issued by these c<strong>on</strong>duits.<br />
89
<strong>20</strong>-F Item 5: Operating and Financial Review and Prospects<br />
Third Party ABCP C<strong>on</strong>duits<br />
In additi<strong>on</strong> to sp<strong>on</strong>soring our commercial paper programs, we also assist third parties with the formati<strong>on</strong> and<br />
<strong>on</strong>going risk management of their commercial paper programs. We do not c<strong>on</strong>solidate any third party ABCP<br />
c<strong>on</strong>duits as we do not c<strong>on</strong>trol them.<br />
Our assistance to third party c<strong>on</strong>duits is primarily financing-related in the form of unfunded committed liquidity<br />
facilities and unfunded committed repurchase agreements in the event of disrupti<strong>on</strong> in the commercial paper<br />
market. The liquidity facilities and committed repurchase agreements are recorded off-balance sheet unless a<br />
c<strong>on</strong>tingent payment is deemed probable and estimable, in which case a liability is recorded. At December 31,<br />
<str<strong>on</strong>g><strong>20</strong>09</str<strong>on</strong>g> and <strong>20</strong>08, the noti<strong>on</strong>al amount of undrawn facilities provided by us was € 2.5 billi<strong>on</strong> and € 2.1 billi<strong>on</strong>,<br />
respectively. These facilities are collateralized by the assets in the SPEs and therefore the movement in the<br />
fair value of these assets will affect the recoverability of the amount drawn.<br />
In <strong>20</strong>08 certain Canadian asset backed commercial paper c<strong>on</strong>duits that had experienced liquidity problems<br />
were restructured pursuant to a plan of compromise and arrangement under the Companies’ Creditors Arrangement<br />
Act (Canada). The restructuring was completed <strong>on</strong> January 21, <str<strong>on</strong>g><strong>20</strong>09</str<strong>on</strong>g>. Under the terms of the restructuring<br />
we have provided margin facilities of € 1.6 billi<strong>on</strong>. As at December 31, <str<strong>on</strong>g><strong>20</strong>09</str<strong>on</strong>g> there have been no draw<br />
downs <strong>on</strong> this facility.<br />
Third Party Sp<strong>on</strong>sored Securitizati<strong>on</strong>s<br />
The third party securitizati<strong>on</strong> vehicles to which we, and in some instances other parties, provide financing are<br />
third party-managed investment vehicles that purchase diversified pools of assets, including fixed income<br />
securities, corporate loans, asset-backed securities (predominantly commercial mortgage-backed securities,<br />
residential mortgage-backed securities and credit card receivables) and film rights receivables. The vehicles<br />
fund these purchases by issuing multiple tranches of debt and equity securities, the repayment of which is<br />
linked to the performance of the assets in the vehicles.<br />
The noti<strong>on</strong>al amount of liquidity facilities with an undrawn comp<strong>on</strong>ent provided by us as of December<br />
31, <str<strong>on</strong>g><strong>20</strong>09</str<strong>on</strong>g> and December 31, <strong>20</strong>08 was € 11.1 billi<strong>on</strong> and € <strong>20</strong>.1 billi<strong>on</strong>, respectively, of which € 4.7 billi<strong>on</strong><br />
and € 10.8 billi<strong>on</strong> had been drawn and € 6.4 billi<strong>on</strong> and € 9.3 billi<strong>on</strong> were still available to be drawn as detailed<br />
in the table. The reducti<strong>on</strong> in the total noti<strong>on</strong>al was largely due to maturing facilities. All facilities are available<br />
to be drawn if the assets meet certain eligibility criteria and performance triggers are not reached. These<br />
facilities are collateralized by the assets in the SPEs and therefore the movement in the fair value of<br />
these assets affects the recoverability of the amount drawn.<br />
90
Mutual Funds<br />
We provide guarantees to funds whereby we guarantee certain levels of the net asset value to be returned to<br />
investors at certain dates. These guarantees do not result in us c<strong>on</strong>solidating the funds; they are recorded <strong>on</strong>balance<br />
sheet as derivatives at fair value with changes in fair value recorded in the c<strong>on</strong>solidated statement<br />
of income. The fair value of the guarantees was € 2.5 milli<strong>on</strong> as of December 31, <str<strong>on</strong>g><strong>20</strong>09</str<strong>on</strong>g> and € 13.2 milli<strong>on</strong> as of<br />
December 31, <strong>20</strong>08. As of December 31, <str<strong>on</strong>g><strong>20</strong>09</str<strong>on</strong>g>, these n<strong>on</strong>-c<strong>on</strong>solidated funds had € 13.7 billi<strong>on</strong> assets under<br />
management and provided guarantees of € 12.4 billi<strong>on</strong>. As of December 31, <strong>20</strong>08, assets of € 11.8 billi<strong>on</strong> and<br />
guarantees of € 10.9 billi<strong>on</strong> were reported.<br />
Real Estate Leasing Funds<br />
We provide guarantees to SPEs that hold real estate assets (commercial and residential land and buildings<br />
and infrastructure assets located in Germany) that are financed by third parties and leased to our clients.<br />
These guarantees are <strong>on</strong>ly drawn up<strong>on</strong> in the event that the asset is destroyed and the insurance company<br />
does not pay for the loss. If the guarantee is drawn we hold a claim against the insurance company. We also<br />
write put opti<strong>on</strong>s to closed-end real estate funds set up by us, which purchase commercial or infrastructure<br />
assets located in Germany and which are then leased to third parties. The put opti<strong>on</strong> allows the shareholders<br />
to sell the asset to us at a fixed price at the end of the lease. As at December 31, <str<strong>on</strong>g><strong>20</strong>09</str<strong>on</strong>g> and December<br />
31, <strong>20</strong>08 the noti<strong>on</strong>al amount of the guarantees was € 525 milli<strong>on</strong> and € 535 milli<strong>on</strong> respectively, and the<br />
noti<strong>on</strong>al of the put opti<strong>on</strong>s was € 246 milli<strong>on</strong> and € 222 milli<strong>on</strong> respectively. The guarantees and the put<br />
opti<strong>on</strong>s have an immaterial fair value. We do not c<strong>on</strong>solidate these SPEs as we do not hold the majority of<br />
their risks and rewards.<br />
Relati<strong>on</strong>ships with other N<strong>on</strong>c<strong>on</strong>solidated SPEs<br />
Group Sp<strong>on</strong>sored Securitizati<strong>on</strong>s<br />
During <strong>20</strong>08 we entered into transacti<strong>on</strong>s with SPEs to derecognize € 10.4 billi<strong>on</strong> of U.S. leveraged loans and<br />
commercial real estate loans that were held at fair value through profit or loss. In the fourth quarter of <strong>20</strong>08<br />
market value default events were triggered with respect to two SPEs. This resulted in third party equity holders<br />
c<strong>on</strong>senting to invest additi<strong>on</strong>al equity of € 0.7 billi<strong>on</strong> to rectify the default. As of December 31, <strong>20</strong>08<br />
€ 0.5 billi<strong>on</strong> of the additi<strong>on</strong>al equity was c<strong>on</strong>tributed to <strong>on</strong>e SPE. The outstanding c<strong>on</strong>tributi<strong>on</strong> of € 0.2 billi<strong>on</strong><br />
due from <strong>on</strong>e equity holder was remitted in the first quarter of <str<strong>on</strong>g><strong>20</strong>09</str<strong>on</strong>g>. No further default events have been triggered<br />
in <str<strong>on</strong>g><strong>20</strong>09</str<strong>on</strong>g>.<br />
91
<strong>20</strong>-F Item 5: Operating and Financial Review and Prospects<br />
Tabular Disclosure of C<strong>on</strong>tractual Obligati<strong>on</strong>s<br />
The table below shows the cash payment requirements from c<strong>on</strong>tractual obligati<strong>on</strong>s outstanding as of<br />
December 31, <str<strong>on</strong>g><strong>20</strong>09</str<strong>on</strong>g>.<br />
C<strong>on</strong>tractual obligati<strong>on</strong>s Payment due by period<br />
Total Less than 1–3 years 3–5 years More than<br />
in € m.<br />
1 year<br />
5 years<br />
L<strong>on</strong>g-term debt obligati<strong>on</strong>s 131,782 18,895 37,599 29,299 45,989<br />
Trust preferred securities<br />
L<strong>on</strong>g-term financial liabilities designated at fair<br />
10,577 746 2,905 1,087 5,839<br />
value through profit or loss 1 16,666 4,348 3,851 2,774 5,693<br />
Finance lease obligati<strong>on</strong>s 275 25 46 60 144<br />
Operating lease obligati<strong>on</strong>s 5,126 728 1,160 886 2,352<br />
Purchase obligati<strong>on</strong>s 2,364 560 1,300 341 163<br />
L<strong>on</strong>g-term deposits 33,415 – 14,902 6,573 11,940<br />
Other l<strong>on</strong>g-term liabilities 7,256 481 327 993 5,455<br />
Total <strong>20</strong>7,461 25,783 62,090 42,013 77,575<br />
1 Mainly l<strong>on</strong>g-term debt and l<strong>on</strong>g-term deposits designated at fair value through profit or loss.<br />
Figures above do not include the benefit of n<strong>on</strong>cancelable sublease rentals of € 255 milli<strong>on</strong> <strong>on</strong> operating<br />
leases. Purchase obligati<strong>on</strong>s for goods and services include future payments for, am<strong>on</strong>g other things,<br />
processing, informati<strong>on</strong> technology and custodian services. Some figures above for purchase obligati<strong>on</strong>s<br />
represent minimum c<strong>on</strong>tractual payments and actual future payments may be higher. L<strong>on</strong>g-term deposits<br />
exclude c<strong>on</strong>tracts with a remaining maturity of less than <strong>on</strong>e year. Under certain c<strong>on</strong>diti<strong>on</strong>s future payments<br />
for some l<strong>on</strong>g-term financial liabilities designated at fair value through profit or loss may occur earlier. See the<br />
following notes to the c<strong>on</strong>solidated financial statements for further informati<strong>on</strong>: Note [11] regarding financial<br />
liabilities at fair value through profit or loss, Note [22] regarding lease obligati<strong>on</strong>s, Note [26] regarding deposits<br />
and Note [29] regarding l<strong>on</strong>g-term debt and trust preferred securities.<br />
Research and Development, Patents and Licenses<br />
Not applicable.<br />
92
Item 6: Directors, Senior Management<br />
and Employees<br />
Directors and Senior Management<br />
In accordance with the German Stock Corporati<strong>on</strong> Act (Aktiengesetz), we have a Management Board (Vorstand)<br />
and a Supervisory Board (Aufsichtsrat). The Stock Corporati<strong>on</strong> Act prohibits simultaneous membership<br />
<strong>on</strong> both the Management Board and the Supervisory Board. The members of the Management Board are the<br />
executive officers of our company. The Management Board is resp<strong>on</strong>sible for managing our company and<br />
representing us in dealings with third parties. The Supervisory Board oversees the Management Board and<br />
appoints and removes its members and determines their salaries and other compensati<strong>on</strong> comp<strong>on</strong>ents, including<br />
pensi<strong>on</strong> benefits. According to German law, our Supervisory Board represents us in dealings with<br />
members of the Management Board. Therefore, no members of the Management Board may enter into any<br />
agreement with us (for example, a loan) without the prior c<strong>on</strong>sent of our Supervisory Board.<br />
German law does not require the members of the Management Board to own any of our shares to be qualified.<br />
In additi<strong>on</strong>, German law has no requirement that members of the Management Board retire under an age<br />
limit. However, age limits for members of the Management Board are defined c<strong>on</strong>tractually and according to<br />
the rules of procedure for our Supervisory Board, an age limit of 70 years applies to the members of our<br />
Supervisory Board.<br />
The Supervisory Board may not make management decisi<strong>on</strong>s. However, German law and our Articles of<br />
Associati<strong>on</strong> (Satzung) require the Management Board to obtain the c<strong>on</strong>sent of the Supervisory Board for certain<br />
acti<strong>on</strong>s. The most important of these acti<strong>on</strong>s are:<br />
— Granting general powers of attorney (Generalvollmachten). A general power of attorney authorizes its<br />
holder to represent the company in substantially all legal matters without limitati<strong>on</strong> to the affairs of a spe-<br />
cific office;<br />
— Acquisiti<strong>on</strong> and disposal (including transacti<strong>on</strong>s carried out by a subsidiary) of real estate when the value<br />
of the object exceeds 1 % of our regulatory banking capital (haftendes Eigenkapital);<br />
— Granting loans and acquiring participati<strong>on</strong>s if the German <strong>Bank</strong>ing Act requires approval by the Supervi-<br />
sory Board. In particular, the German <strong>Bank</strong>ing Act requires the approval of the Supervisory Board if we<br />
grant a loan (to the extent legally permissible) to a member of the Management Board or the Supervisory<br />
Board or <strong>on</strong>e of our employees who holds a procurati<strong>on</strong> (Prokura) or general power of attorney; and<br />
— Acquisiti<strong>on</strong> and disposal (including transacti<strong>on</strong>s carried out by a subsidiary) of other participati<strong>on</strong>s, insofar<br />
as the object involves more than 2 % of our regulatory banking capital; the Supervisory Board must be informed<br />
without delay of any acquisiti<strong>on</strong> or disposal of such participati<strong>on</strong>s involving more than 1 % of our<br />
regulatory banking capital.<br />
The Management Board must submit regular reports to the Supervisory Board <strong>on</strong> our current operati<strong>on</strong>s and<br />
future business planning. The Supervisory Board may also request special reports from the Management<br />
Board at any time.<br />
93
<strong>20</strong>-F Item 6: Directors, Senior Management and Employees<br />
With respect to voting powers, a member of the Supervisory Board or the Management Board may not vote<br />
<strong>on</strong> resoluti<strong>on</strong>s open to a vote at a board meeting if the proposed resoluti<strong>on</strong> c<strong>on</strong>cerns:<br />
— a legal transacti<strong>on</strong> between us and the member; or<br />
— commencement, settlement or completi<strong>on</strong> of legal proceedings between us and the member.<br />
A member of the Supervisory Board or the Management Board may not directly or indirectly exercise voting<br />
rights <strong>on</strong> resoluti<strong>on</strong>s open to a vote at a shareholders’ meeting (Hauptversammlung, referred to as the <str<strong>on</strong>g>Annual</str<strong>on</strong>g><br />
General Meeting) if the proposed resoluti<strong>on</strong> c<strong>on</strong>cerns:<br />
— ratificati<strong>on</strong> of the member’s acts;<br />
— a discharge of liability of the member; or<br />
— enforcement of a claim against the member by us.<br />
Supervisory Board and Management Board<br />
In carrying out their duties, members of both the Management Board and Supervisory Board must exercise<br />
the standard of care of a prudent and diligent business pers<strong>on</strong>, and they are liable to us for damages if they<br />
fail to do so. Both boards are required to take into account a broad range of c<strong>on</strong>siderati<strong>on</strong>s in their decisi<strong>on</strong>s,<br />
including our interests and those of our shareholders, employees and creditors. The Management Board is<br />
required to ensure that shareholders are treated <strong>on</strong> an equal basis and receive equal informati<strong>on</strong>. The Management<br />
Board is also required to ensure appropriate risk management within our operati<strong>on</strong>s and to establish<br />
an internal m<strong>on</strong>itoring system.<br />
As a general rule under German law, a shareholder has no direct recourse against the members of the Management<br />
Board or the Supervisory Board in the event that they are believed to have breached a duty to us.<br />
Apart from insolvency or other special circumstances, <strong>on</strong>ly we have the right to claim damages from members<br />
of either board. We may waive this right or settle these claims <strong>on</strong>ly if at least three years have passed since<br />
the alleged breach and if the shareholders approve the waiver or settlement at the General Meeting with a<br />
simple majority of the votes cast, and provided that opposing shareholders do not hold, in the aggregate, <strong>on</strong>e<br />
tenth or more of our share capital and do not have their oppositi<strong>on</strong> formally noted in the minutes maintained<br />
by a German notary.<br />
Supervisory Board<br />
Our Articles of Associati<strong>on</strong> require our Supervisory Board to have twenty members. In the event that the number<br />
of members <strong>on</strong> our Supervisory Board falls below twenty, the Supervisory Board maintains its authority to<br />
pass resoluti<strong>on</strong>s so l<strong>on</strong>g as at least ten members participate in the passing of a resoluti<strong>on</strong>, either in pers<strong>on</strong> or<br />
by submitting their votes in writing. If the number of members remains below twenty for more than three<br />
m<strong>on</strong>ths or falls below ten, up<strong>on</strong> applicati<strong>on</strong> to a competent court, the court must appoint replacement members<br />
to serve <strong>on</strong> the board until official appointments are made.<br />
94
The German Co-Determinati<strong>on</strong> Act of 1976 (Mitbestimmungsgesetz) requires that the shareholders elect half<br />
of the members of the supervisory board of large German companies, such as <strong>Deutsche</strong> <strong>Bank</strong>, and that employees<br />
in Germany elect the other half. N<strong>on</strong>e of the current members of either of our boards were selected<br />
pursuant to any arrangement or understandings with major shareholders, customers or others.<br />
Each member of the Supervisory Board generally serves for a fixed term of approximately five years. For the<br />
electi<strong>on</strong> of shareholder representatives, the General Meeting may establish that the terms of office of up to<br />
five members may begin or end <strong>on</strong> differing dates. Pursuant to German law, the term expires at the latest at<br />
the end of the <str<strong>on</strong>g>Annual</str<strong>on</strong>g> General Meeting that approves and ratifies such member’s acti<strong>on</strong>s in the fourth fiscal<br />
year after the year in which the Supervisory Board member was elected. Supervisory Board members may<br />
also be re-elected. The shareholders may, by a majority of the votes cast in a General Meeting, remove any<br />
member of the Supervisory Board they have elected in a General Meeting. The employees may remove any<br />
member they have elected by a vote of three-quarters of the employee votes cast.<br />
The members of the Supervisory Board elect the chairpers<strong>on</strong> and the deputy chairpers<strong>on</strong> of the Supervisory<br />
Board. Traditi<strong>on</strong>ally, the chairpers<strong>on</strong> is a representative of the shareholders, and the deputy chairpers<strong>on</strong> is a<br />
representative of the employees. At least half of the members of the Supervisory Board must be present at a<br />
meeting or must have submitted their vote in writing to c<strong>on</strong>stitute a quorum. In general, approval by a simple<br />
majority of the members of the Supervisory Board present and voting is required to pass a resoluti<strong>on</strong>. In the<br />
case of a deadlock, the resoluti<strong>on</strong> is put to a sec<strong>on</strong>d vote. In the case of a sec<strong>on</strong>d deadlock, the chairpers<strong>on</strong><br />
has the deciding vote.<br />
The following table shows informati<strong>on</strong> <strong>on</strong> the current members of our Supervisory Board. The members<br />
representing our shareholders were elected at the <str<strong>on</strong>g>Annual</str<strong>on</strong>g> General Meeting <strong>on</strong> May 29, <strong>20</strong>08, except for<br />
Dr. Siegert, who was elected at the <str<strong>on</strong>g>Annual</str<strong>on</strong>g> General Meeting <strong>20</strong>07 until the end of the <str<strong>on</strong>g>Annual</str<strong>on</strong>g> General Meeting<br />
<strong>20</strong>12. The members elected by employees in Germany were elected <strong>on</strong> May 8, <strong>20</strong>08. The informati<strong>on</strong> includes<br />
the members’ ages as of December 31, <str<strong>on</strong>g><strong>20</strong>09</str<strong>on</strong>g>, the years in which they were first elected or appointed,<br />
the years when their terms expire, their principal occupati<strong>on</strong> and their membership <strong>on</strong> other companies’ supervisory<br />
boards, other n<strong>on</strong>executive directorships and other positi<strong>on</strong>s.<br />
95
<strong>20</strong>-F Item 6: Directors, Senior Management and Employees<br />
Member Principal occupati<strong>on</strong> Supervisory board memberships and other directorships<br />
Wolfgang Böhr*<br />
Age: 46<br />
First elected: <strong>20</strong>08<br />
Term expires: <strong>20</strong>13<br />
Dr. Clemens Börsig<br />
Age: 61<br />
Appointed by the court: <strong>20</strong>06<br />
Term expires: <strong>20</strong>13<br />
Dr. Karl-Gerhard Eick<br />
Age: 55<br />
Appointed by the court: <strong>20</strong>04<br />
Term expires: <strong>20</strong>13<br />
Heidrun Förster*<br />
Age: 62<br />
First elected: 1993<br />
Term expires: <strong>20</strong>13<br />
Alfred Herling*<br />
Age: 57<br />
First elected: <strong>20</strong>08<br />
Term expires: <strong>20</strong>13<br />
Gerd Herzberg*<br />
Age: 59<br />
Appointed by the court: <strong>20</strong>06<br />
Term expires: <strong>20</strong>13<br />
Sir Peter Job<br />
Age: 68<br />
Appointed by the court: <strong>20</strong>01<br />
Term expires: <strong>20</strong>11<br />
Prof. Dr. Henning<br />
Kagermann<br />
Age: 62<br />
First elected: <strong>20</strong>00<br />
Term expires: <strong>20</strong>13<br />
Martina Klee*<br />
Age: 47<br />
First elected: <strong>20</strong>08<br />
Term expires: <strong>20</strong>13<br />
Suzanne Labarge<br />
Age: 63<br />
First elected: <strong>20</strong>08<br />
Term expires: <strong>20</strong>13<br />
Maurice Lévy<br />
Age: 67<br />
First elected: <strong>20</strong>06<br />
Term expires: <strong>20</strong>12<br />
Henriette Mark*<br />
Age: 52<br />
First elected: <strong>20</strong>03<br />
Term expires: <strong>20</strong>13<br />
Chairman of the Combined Staff Council<br />
Dusseldorf of <strong>Deutsche</strong> <strong>Bank</strong>; Member<br />
of the General Staff Council<br />
Chairman of the Supervisory Board of<br />
<strong>Deutsche</strong> <strong>Bank</strong> AG, Frankfurt<br />
Deputy Chairman of the Management<br />
Board of <strong>Deutsche</strong> Telekom AG, B<strong>on</strong>n<br />
until February 28, <str<strong>on</strong>g><strong>20</strong>09</str<strong>on</strong>g>; Chairman of the<br />
Management Board of Arcandor AG,<br />
Essen from March 1, <str<strong>on</strong>g><strong>20</strong>09</str<strong>on</strong>g> until<br />
September 1, <str<strong>on</strong>g><strong>20</strong>09</str<strong>on</strong>g><br />
Chairpers<strong>on</strong> of the Combined Staff<br />
Council Berlin of <strong>Deutsche</strong> <strong>Bank</strong>;<br />
Member of the General Staff Council<br />
Chairman of the Combined Staff Council<br />
Wuppertal/Sauerland of <strong>Deutsche</strong> <strong>Bank</strong>;<br />
Deputy Chairman of the General Staff<br />
Council; Chairman of the European Staff<br />
Council<br />
Deputy Chairman of ver.di Vereinte<br />
Dienstleistungsgewerkschaft, Berlin<br />
Co-Chief Executive Officer of SAP AG,<br />
Walldorf until May 31, <str<strong>on</strong>g><strong>20</strong>09</str<strong>on</strong>g><br />
Chairpers<strong>on</strong> of the Staff Council GTO<br />
Frankfurt/Eschborn of <strong>Deutsche</strong> <strong>Bank</strong>;<br />
Member of the General Staff Council of<br />
<strong>Deutsche</strong> <strong>Bank</strong><br />
Chairman and Chief Executive Officer,<br />
Publicis Groupe S.A., Paris<br />
Chairpers<strong>on</strong> of the Combined Staff<br />
Council Munich and Southern Bavaria of<br />
<strong>Deutsche</strong> <strong>Bank</strong>; Member of the Group<br />
and General Staff Councils; Member of<br />
the European Staff Council<br />
96<br />
No memberships or directorships subject to disclosure<br />
Linde AG; Bayer AG; Daimler AG; Emers<strong>on</strong> Electric<br />
Company<br />
T-Mobile Internati<strong>on</strong>al AG (until February <str<strong>on</strong>g><strong>20</strong>09</str<strong>on</strong>g>);<br />
T-Systems Enterprise Services GmbH (until February<br />
<str<strong>on</strong>g><strong>20</strong>09</str<strong>on</strong>g>); T-Systems Business Services GmbH (until February<br />
<str<strong>on</strong>g><strong>20</strong>09</str<strong>on</strong>g>); FC Bayern München AG (until December <str<strong>on</strong>g><strong>20</strong>09</str<strong>on</strong>g>);<br />
CORPUS SIREO Holding GmbH & Co. KG (Chairman);<br />
STRABAG Property and Facility Services GmbH (until<br />
December <str<strong>on</strong>g><strong>20</strong>09</str<strong>on</strong>g>); Hellenic Telecommunicati<strong>on</strong>s<br />
Organizati<strong>on</strong> S.A. (OTE S.A.) (until March <str<strong>on</strong>g><strong>20</strong>09</str<strong>on</strong>g>); Thomas<br />
Cook Group Plc (until September <str<strong>on</strong>g><strong>20</strong>09</str<strong>on</strong>g>)<br />
<strong>Deutsche</strong> <strong>Bank</strong> Privat- und Geschäftskunden AG;<br />
Betriebskrankenkasse <strong>Deutsche</strong> <strong>Bank</strong> AG<br />
No memberships or directorships subject to disclosure<br />
Franz Haniel & Cie GmbH (Deputy Chairman); DBV<br />
Winterthur Lebensversicherung AG (until April <str<strong>on</strong>g><strong>20</strong>09</str<strong>on</strong>g>);<br />
BGAG – Beteiligungsgesellschaft der Gewerkschaften AG;<br />
DAWAG – <strong>Deutsche</strong> Angestellten Wohnungsbau AG<br />
(Chairman) (until April <str<strong>on</strong>g><strong>20</strong>09</str<strong>on</strong>g>); Vattenfall Europe AG (Deputy<br />
Chairman)<br />
Schroders Plc; Tibco Software Inc.; Royal Dutch Shell Plc;<br />
Math<strong>on</strong> Systems (Advisory Board)<br />
Münchener Rückversicherungs-Gesellschaft<br />
Aktiengesellschaft; Nokia Corporati<strong>on</strong>; <strong>Deutsche</strong> Post AG;<br />
Wipro Technologies (since October <str<strong>on</strong>g><strong>20</strong>09</str<strong>on</strong>g>)<br />
Sterbekasse für die Angestellten der <strong>Deutsche</strong>n <strong>Bank</strong> VV<br />
a.G.<br />
Coca-Cola Enterprises Inc.<br />
Publicis C<strong>on</strong>seil S.A. (Chairman); Medias et Régies<br />
Europe S.A.; MMS USA Holdings, Inc.; Zenith Optimedia<br />
Group Ltd. (U.K.); Publicis Groupe U.S. Investments LLC;<br />
MMS USA Investments, Inc.; MMS USA LLC Investments,<br />
Inc.<br />
No memberships or directorships subject to disclosure
Member Principal occupati<strong>on</strong> Supervisory board memberships and other directorships<br />
Gabriele Platscher*<br />
Age: 52<br />
First elected: <strong>20</strong>03<br />
Term expires: <strong>20</strong>13<br />
Karin Ruck*<br />
Age: 44<br />
First elected: <strong>20</strong>03<br />
Term expires: <strong>20</strong>13<br />
Dr. Theo Siegert<br />
Age: 62<br />
First elected: <strong>20</strong>06<br />
Term expires <strong>20</strong>12<br />
Dr. Johannes Teyssen<br />
Age: 50<br />
First elected: <strong>20</strong>08<br />
Term expires: <strong>20</strong>13<br />
Marlehn Thieme*<br />
Age: 52<br />
First elected: <strong>20</strong>08<br />
Term expires: <strong>20</strong>13<br />
Tilman Todenhöfer<br />
Age: 66<br />
Appointed by the court: <strong>20</strong>01<br />
Term expires: <strong>20</strong>13<br />
Werner Wenning<br />
Age: 63<br />
First elected: <strong>20</strong>08<br />
Term expires: <strong>20</strong>13<br />
Leo Wunderlich*<br />
Age: 60<br />
First elected: <strong>20</strong>03<br />
Term expires: <strong>20</strong>13<br />
* Elected by the employees in Germany.<br />
Chairpers<strong>on</strong> of the Combined Staff<br />
Council Braunschweig/Hildesheim of<br />
<strong>Deutsche</strong> <strong>Bank</strong>; Member of the Group<br />
and General Staff Councils<br />
Deputy Chairpers<strong>on</strong> of the Supervisory<br />
Board of <strong>Deutsche</strong> <strong>Bank</strong> AG; Deputy<br />
Chairpers<strong>on</strong> of the Combined Staff<br />
Council Frankfurt branch of<br />
<strong>Deutsche</strong> <strong>Bank</strong><br />
Managing Partner of de Haen<br />
Carstanjen & Söhne, Dusseldorf<br />
Chief Operating Officer and Deputy<br />
Chairman of the Management Board of<br />
E.ON AG, Dusseldorf<br />
Director Infrastructure/Regi<strong>on</strong>al<br />
Management Communicati<strong>on</strong>s<br />
Corporate Citizenship<br />
<strong>Deutsche</strong> <strong>Bank</strong> AG, Frankfurt<br />
Managing Partner of Robert Bosch<br />
Industrietreuhand KG, Stuttgart<br />
Chairman of the Management Board of<br />
Bayer AG, Leverkusen<br />
Chairman of the Group and General<br />
Staff Councils of <strong>Deutsche</strong> <strong>Bank</strong> AG,<br />
Mannheim<br />
Dr. Clemens Börsig was a member of the Management Board of <strong>Deutsche</strong> <strong>Bank</strong> AG until May 3, <strong>20</strong>06.<br />
Dr. Börsig has declared that he would abstain from voting in his functi<strong>on</strong> as member of the Supervisory Board<br />
and its committees <strong>on</strong> all questi<strong>on</strong>s that relate to his former membership of the Management Board and could<br />
create a c<strong>on</strong>flict of interest.<br />
According to Secti<strong>on</strong> 5.4.2 of the German Corporate Governance Code, the Supervisory Board determined<br />
that it has what it c<strong>on</strong>siders to be an adequate number of independent members.<br />
Standing Committees: The Supervisory Board has the authority to establish, and appoint its members to<br />
standing committees. The Supervisory Board may delegate certain of its powers to these committees. Our<br />
Supervisory Board has established the following five standing committees:<br />
Chairman’s Committee: The Chairman’s Committee is resp<strong>on</strong>sible for all Management Board and Supervisory<br />
Board matters. It prepares the decisi<strong>on</strong>s for the Supervisory Board <strong>on</strong> the appointment and dismissal of<br />
members of the Management Board, including l<strong>on</strong>g-term successi<strong>on</strong> planning. It also submits a proposal to<br />
the Supervisory Board <strong>on</strong> the compensati<strong>on</strong> for the individual members of the Management Board including<br />
the main c<strong>on</strong>tract elements. It is resp<strong>on</strong>sible for entering into, amending and terminating the service c<strong>on</strong>tracts<br />
97<br />
BVV Versicherungsverein des <strong>Bank</strong>gewerbes a.G. (Deputy<br />
Chairpers<strong>on</strong>); BVV Versorgungskasse des <strong>Bank</strong>gewerbes<br />
e.V. (Deputy Chairpers<strong>on</strong>); BVV Pensi<strong>on</strong>sf<strong>on</strong>ds des<br />
<strong>Bank</strong>gewerbes AG (Deputy Chairpers<strong>on</strong>)<br />
<strong>Deutsche</strong> <strong>Bank</strong> Privat- und Geschäftskunden AG;<br />
BVV Versicherungsverein des <strong>Bank</strong>gewerbes a.G.; BVV<br />
Versorgungskasse des <strong>Bank</strong>gewerbes e.V.; BVV<br />
Pensi<strong>on</strong>sf<strong>on</strong>ds des <strong>Bank</strong>gewerbes AG<br />
E.ON AG; ERGO AG; Merck KGaA;<br />
E. Merck OHG (Member of the Shareholders’ Committee);<br />
DKSH Holding Ltd. (Member of the Board of<br />
Administrati<strong>on</strong>); Henkel AG & Co. KGaA (since April <str<strong>on</strong>g><strong>20</strong>09</str<strong>on</strong>g>)<br />
E.ON Energie AG; E.ON Ruhrgas AG; E.ON Energy<br />
Trading SE (Chairman); Salzgitter AG; E.ON Nordic AB;<br />
E.ON Sverige AB; E.ON Italia Holding s.r.l.<br />
No memberships or directorships subject to disclosure<br />
Robert Bosch GmbH; Robert Bosch Internati<strong>on</strong>ale<br />
Beteiligungen AG (President of the Board of<br />
Administrati<strong>on</strong>); HOCHTIEF AG<br />
E.ON AG; Henkel AG & Co. KGaA (Member of the<br />
Shareholders’ Committee); Bayer Schering Pharma AG<br />
(Chairman) (until August <str<strong>on</strong>g><strong>20</strong>09</str<strong>on</strong>g>); HDI V.a.G. (since October<br />
<str<strong>on</strong>g><strong>20</strong>09</str<strong>on</strong>g>); Talanx AG (since October <str<strong>on</strong>g><strong>20</strong>09</str<strong>on</strong>g>)<br />
No memberships or directorships subject to disclosure
<strong>20</strong>-F Item 6: Directors, Senior Management and Employees<br />
and other agreements with the Management Board members and provides its approval for ancillary activities<br />
of Management Board members pursuant to Secti<strong>on</strong> 112 of the German Stock Corporati<strong>on</strong> Act and for certain<br />
c<strong>on</strong>tracts with Supervisory Board members pursuant to Secti<strong>on</strong> 114 of the German Stock Corporati<strong>on</strong> Act.<br />
Furthermore, it prepares the decisi<strong>on</strong>s of the Supervisory Board in the field of corporate governance. The<br />
Chairman’s Committee held seven meetings in <str<strong>on</strong>g><strong>20</strong>09</str<strong>on</strong>g>.<br />
The current members of the Chairman’s Committee are Dr. Clemens Börsig (Chairman), Heidrun Förster,<br />
Karin Ruck and Tilman Todenhöfer.<br />
Nominati<strong>on</strong> Committee: The Nominati<strong>on</strong> Committee prepares the Supervisory Board’s proposals for the elec-<br />
ti<strong>on</strong> or appointment of new shareholder representatives to the Supervisory Board. The Nominati<strong>on</strong> Committee<br />
held no meetings in <str<strong>on</strong>g><strong>20</strong>09</str<strong>on</strong>g>.<br />
The current members of the Nominati<strong>on</strong> Committee are Dr. Clemens Börsig (Chairman), Tilman Todenhöfer<br />
and Werner Wenning.<br />
Audit Committee: The Audit Committee handles in particular the m<strong>on</strong>itoring of financial accounting, including<br />
the accounting process and the effectiveness of the system of internal c<strong>on</strong>trols, issues of risk management<br />
and especially the effectiveness of the risk management system, as well as the effectiveness of the internal<br />
audit system, compliance and the auditing of annual financial statements. It reviews the documentati<strong>on</strong> relating<br />
to the annual and c<strong>on</strong>solidated financial statements and discusses the audit reports with the auditor. It<br />
prepares the decisi<strong>on</strong>s of the Supervisory Board <strong>on</strong> the annual financial statements and the approval of the<br />
c<strong>on</strong>solidated financial statements and discusses important changes to the audit and accounting methods. The<br />
Audit Committee also discusses the quarterly financial statements and the report <strong>on</strong> the limited review of the<br />
quarterly financial statements with the Management Board and the auditor prior to their publicati<strong>on</strong>. In additi<strong>on</strong>,<br />
the Audit Committee issues the audit mandate to the auditor elected by the General Meeting. It resolves<br />
<strong>on</strong> the compensati<strong>on</strong> paid to the auditor and m<strong>on</strong>itors the auditor’s independence, qualificati<strong>on</strong>s and efficiency.<br />
The Head of Internal Audit regularly reports to the Audit Committee <strong>on</strong> the work d<strong>on</strong>e. The Audit Committee<br />
is informed about special audits, substantial complaints and other excepti<strong>on</strong>al measures <strong>on</strong> the part of<br />
bank regulatory authorities. It has functi<strong>on</strong>al resp<strong>on</strong>sibility for taking receipt of and dealing with complaints<br />
c<strong>on</strong>cerning accounting, internal accounting c<strong>on</strong>trols and issues relating to the audit. Subject to its review, the<br />
Audit Committee grants its approval for mandates engaging the auditor for n<strong>on</strong>-audit-related services (in this<br />
c<strong>on</strong>text, see also “Item 16C: Principal Accountant Fees and Services”). The Audit Committee held nine meetings<br />
in <str<strong>on</strong>g><strong>20</strong>09</str<strong>on</strong>g>.<br />
The current members of the Audit Committee are Dr. Karl-Gerhard Eick (Chairman), Dr. Clemens Börsig, Sir<br />
Peter Job, Henriette Mark, Karin Ruck and Marlehn Thieme.<br />
98
Risk Committee: The Risk Committee handles loans which require a resoluti<strong>on</strong> by the Supervisory Board<br />
pursuant to law or our Articles of Associati<strong>on</strong>. Subject to its review, it grants its approval for the acquisiti<strong>on</strong> of<br />
shareholdings in other companies that amount to between 2 % and 3 % of our regulatory banking capital if it is<br />
likely that the shareholding will not remain in our full or partial possessi<strong>on</strong> for more than twelve m<strong>on</strong>ths. At the<br />
meetings of the Risk Committee, the Management Board reports <strong>on</strong> credit, market, liquidity, operati<strong>on</strong>al, litigati<strong>on</strong><br />
and reputati<strong>on</strong>al risks. The Management Board also reports <strong>on</strong> risk strategy, credit portfolios, loans<br />
requiring a Supervisory Board approval pursuant to law or our Articles of Associati<strong>on</strong>, questi<strong>on</strong>s of capital<br />
resources and matters of special importance due to the risks they entail. The Risk Committee held six meetings<br />
in <str<strong>on</strong>g><strong>20</strong>09</str<strong>on</strong>g>.<br />
The current members of the Risk Committee are Dr. Clemens Börsig (Chairman), Professor Dr. Henning<br />
Kagermann and Sir Peter Job. Suzanne Labarge and Dr. Theo Siegert are substitute members of the Risk<br />
Committee. They are invited to all meetings and regularly attend them.<br />
In additi<strong>on</strong> to these four committees, the Mediati<strong>on</strong> Committee, which is required by German law, makes pro-<br />
posals to the Supervisory Board <strong>on</strong> the appointment or dismissal of members of the Management Board in<br />
those cases where the Supervisory Board is unable to reach a two-thirds majority decisi<strong>on</strong> with respect to the<br />
appointment or dismissal. The Mediati<strong>on</strong> Committee <strong>on</strong>ly meets if necessary and did not hold any meetings in<br />
<str<strong>on</strong>g><strong>20</strong>09</str<strong>on</strong>g>.<br />
The current members of the Mediati<strong>on</strong> Committee are Dr. Clemens Börsig (Chairman), Wolfgang Böhr, Karin<br />
Ruck, and Tilman Todenhöfer.<br />
The business address of the members of the Supervisory Board is the same as our business address,<br />
Theodor-Heuss-Allee 70, 60486 Frankfurt am Main, Germany.<br />
Management Board<br />
Our Articles of Associati<strong>on</strong> require the Management Board to have at least three members. Our Management<br />
Board currently has eight members. The Supervisory Board has appointed a chairman of the Management<br />
Board.<br />
The Supervisory Board appoints the members of the Management Board for a maximum term of five years<br />
and supervises them. They may be re-appointed or have their term extended for <strong>on</strong>e or more terms of up to a<br />
maximum of five years each. The Supervisory Board may remove a member of the Management Board prior<br />
to the expirati<strong>on</strong> of his or her term for good cause.<br />
Pursuant to our Articles of Associati<strong>on</strong>, two members of the Management Board, or <strong>on</strong>e member of the Man-<br />
agement Board together with a holder of procurati<strong>on</strong>, may represent us for legal purposes. A holder of procu-<br />
rati<strong>on</strong> is an attorney-in-fact who holds a legally defined power under German law, which cannot be restricted<br />
with respect to third parties. However, pursuant to German law, the Management Board itself must resolve <strong>on</strong><br />
certain matters as a body. In particular, it may not delegate strategic planning, coordinating or c<strong>on</strong>trolling<br />
resp<strong>on</strong>sibilities to individual members of the Management Board.<br />
99
<strong>20</strong>-F Item 6: Directors, Senior Management and Employees<br />
Other resp<strong>on</strong>sibilities of the Management Board are:<br />
— Appointing key pers<strong>on</strong>nel;<br />
— Making decisi<strong>on</strong>s regarding significant credit exposures or other risks which have not been delegated to<br />
individual risk management units in accordance with the terms of reference (Geschäftsordnung) for the<br />
Management Board and terms of reference for our Risk Executive Committee;<br />
— Calling shareholders’ meetings;<br />
— Filing petiti<strong>on</strong>s to set aside shareholders’ resoluti<strong>on</strong>s;<br />
— Preparing and executing shareholders’ resoluti<strong>on</strong>s; and<br />
— <str<strong>on</strong>g>Report</str<strong>on</strong>g>ing to the Supervisory Board.<br />
According to German law, our Supervisory Board represents us in dealings with members of the Management<br />
Board. Therefore, no member of the Management Board may enter into any agreement with us without the<br />
prior c<strong>on</strong>sent of our Supervisory Board.<br />
The following paragraphs show informati<strong>on</strong> <strong>on</strong> the current members of the Management Board. The informa-<br />
ti<strong>on</strong> includes their ages as of December 31, <str<strong>on</strong>g><strong>20</strong>09</str<strong>on</strong>g>, the year in which they were appointed and the year in<br />
which their term expires, their current positi<strong>on</strong>s and area of resp<strong>on</strong>sibility and their principal business activities<br />
outside our company. The members of our Management Board have generally undertaken not to assume<br />
chairmanships of supervisory boards of companies outside our c<strong>on</strong>solidated group.<br />
Dr. Josef Ackermann<br />
Age: 61<br />
First appointed: 1996<br />
Term expires: <strong>20</strong>13<br />
Dr. Josef Ackermann joined <strong>Deutsche</strong> <strong>Bank</strong> as a member of our Management Board in 1996, where he was<br />
resp<strong>on</strong>sible for the investment banking divisi<strong>on</strong>. On May 22, <strong>20</strong>02, Dr. Ackermann was appointed Spokesman<br />
of the Management Board. On February 1, <strong>20</strong>06, he was appointed Chairman of the Management Board.<br />
After studying Ec<strong>on</strong>omics and Social Sciences at the University of St. Gallen, he worked at the University’s<br />
Institute of Ec<strong>on</strong>omics as research assistant and received a doctorate in Ec<strong>on</strong>omics. Dr. Ackermann started<br />
his professi<strong>on</strong>al career in 1977 at Schweizerische Kreditanstalt (SKA) where he held a variety of positi<strong>on</strong>s in<br />
Corporate <strong>Bank</strong>ing, Foreign Exchange/M<strong>on</strong>ey Markets and Treasury, Investment <strong>Bank</strong>ing and Multinati<strong>on</strong>al<br />
Services. He worked in L<strong>on</strong>d<strong>on</strong> and New York, as well as at several locati<strong>on</strong>s in Switzerland. Between 1993<br />
and 1996, he served as President of SKA’s Executive Board, following his appointment to that board in 1990.<br />
Dr. Ackermann is a member of the Supervisory Board of Siemens AG (Sec<strong>on</strong>d Deputy Chairman), Vice-<br />
Chairman of the Board of Directors of Belenos Clean Power Holding Ltd. and n<strong>on</strong>-executive member of the<br />
Board of Directors of Royal Dutch Shell Plc.<br />
100
Dr. Hugo Bänziger<br />
Age: 53<br />
First appointed: <strong>20</strong>06<br />
Term expires: <strong>20</strong>14<br />
Dr. Hugo Bänziger became a member of our Management Board <strong>on</strong> May 4, <strong>20</strong>06. He is our Chief Risk Officer.<br />
He joined <strong>Deutsche</strong> <strong>Bank</strong> in L<strong>on</strong>d<strong>on</strong> in 1996 as Head of Global Markets Credit. He was appointed Chief Credit<br />
Officer in <strong>20</strong>00 and became Chief Risk Officer for Credit and Operati<strong>on</strong>al Risk in <strong>20</strong>04.<br />
Dr. Bänziger began his career in 1983 at the Swiss Federal <strong>Bank</strong>ing Commissi<strong>on</strong> in Berne. From 1985 to<br />
1996, he worked at Schweizerische Kreditanstalt (SKA) in Zurich and L<strong>on</strong>d<strong>on</strong>, first in Retail <strong>Bank</strong>ing and<br />
subsequently as Relati<strong>on</strong>ship Manager in Corporate Finance. In 1990 he was appointed Global Head of<br />
Credit for CS Financial Products.<br />
He studied Modern History, Law and Ec<strong>on</strong>omics at the University of Berne, where he subsequently earned a<br />
doctorate in Ec<strong>on</strong>omic History.<br />
Dr. Bänziger is a member of the Supervisory Board of EUREX Clearing AG, member of the Supervisory Board<br />
of EUREX Frankfurt AG and a member of the Supervisory Board of EUREX Zürich AG.<br />
Michael Cohrs<br />
Age: 53<br />
First appointed: <str<strong>on</strong>g><strong>20</strong>09</str<strong>on</strong>g><br />
Term expires: <strong>20</strong>12<br />
Michael Cohrs became a member of our Management Board <strong>on</strong> April 1, <str<strong>on</strong>g><strong>20</strong>09</str<strong>on</strong>g>. Mr. Cohrs joined <strong>Deutsche</strong><br />
<strong>Bank</strong> in 1995 and has been a member of the Group Executive Committee since <strong>20</strong>02. As member of our<br />
Management Board, he is resp<strong>on</strong>sible for the Global <strong>Bank</strong>ing Divisi<strong>on</strong>.<br />
Mr. Cohrs began his career in 1981 at Goldman Sachs & Co., New York. From 1989 to 1991 he worked as<br />
Head of European Equity Capital Markets at Goldman Sachs Internati<strong>on</strong>al, L<strong>on</strong>d<strong>on</strong> and from 1991 to 1995 as<br />
Head of Global Equity Markets for SG. Warburg Securities in L<strong>on</strong>d<strong>on</strong>.<br />
Mr. Cohrs studied Ec<strong>on</strong>omics at Harvard College and graduated in 1979 with a bachelor’s degree and studied<br />
Business Administrati<strong>on</strong> at Harvard Business School and graduated in 1981 with a MBA.<br />
Mr. Cohrs does not have any external directorships subject to disclosure.<br />
101
<strong>20</strong>-F Item 6: Directors, Senior Management and Employees<br />
Jürgen Fitschen<br />
Age: 61<br />
Appointed: <str<strong>on</strong>g><strong>20</strong>09</str<strong>on</strong>g><br />
Term expires: <strong>20</strong>12<br />
Jürgen Fitschen became a member of our Management Board <strong>on</strong> April 1, <str<strong>on</strong>g><strong>20</strong>09</str<strong>on</strong>g>. Mr. Fitschen has been with<br />
<strong>Deutsche</strong> <strong>Bank</strong> since 1987, was already a member of the Management Board from <strong>20</strong>01 to the beginning of<br />
<strong>20</strong>02 and has been a member of the Group Executive Committee since <strong>20</strong>02 and Head of Regi<strong>on</strong>al Management<br />
since <strong>20</strong>05. As member of our Management Board, he is resp<strong>on</strong>sible for Regi<strong>on</strong>al Management.<br />
Mr. Fitschen studied Ec<strong>on</strong>omics and Business Administrati<strong>on</strong> at the University of Hamburg and graduated in<br />
1975 with a master’s degree in Business Administrati<strong>on</strong>.<br />
From 1975 to 1987, he worked at Citibank in Hamburg and Frankfurt am Main in various positi<strong>on</strong>s. In 1983 he<br />
was appointed member of the Executive Committee Germany of Citibank.<br />
Mr. Fitschen is a member of the Board of Directors of Kühne + Nagel Internati<strong>on</strong>al AG, member of the Supervisory<br />
Board of METRO AG and member of the Supervisory Board of Schott AG.<br />
Anshuman Jain<br />
Age: 46<br />
First Appointed: <str<strong>on</strong>g><strong>20</strong>09</str<strong>on</strong>g><br />
Term expires: <strong>20</strong>12<br />
Anshuman Jain became a member of our Management Board <strong>on</strong> April 1, <str<strong>on</strong>g><strong>20</strong>09</str<strong>on</strong>g>. Mr. Jain joined <strong>Deutsche</strong> <strong>Bank</strong><br />
in 1995 and became Head of Global Markets in <strong>20</strong>01 as well as a member of the Group Executive Committee<br />
in <strong>20</strong>02. As member of our Management Board, he is resp<strong>on</strong>sible for Global Markets.<br />
Mr. Jain studied Ec<strong>on</strong>omics at Shri Ram College (Delhi University) and graduated in 1983, receiving a BA,<br />
and studied Business Administrati<strong>on</strong> at the University of Massachusetts and graduated in 1985 with a MBA<br />
Finance.<br />
After his academic studies Mr. Jain worked until 1988 for Kidder Peabody, New York in Derivatives Research;<br />
from 1988 to 1995 he set up and ran the global hedge fund coverage group for Merrill Lynch, New York.<br />
Mr. Jain is a n<strong>on</strong>-executive Director of Sasol Ltd.<br />
102
Stefan Krause<br />
Age: 47<br />
First appointed: <strong>20</strong>08<br />
Term expires: <strong>20</strong>13<br />
Stefan Krause became a member of our Management Board <strong>on</strong> April 1, <strong>20</strong>08. He is our Chief Financial<br />
Officer.<br />
Previously, Mr. Krause spent over <strong>20</strong> years in the automotive industry, holding various senior management<br />
positi<strong>on</strong>s with a str<strong>on</strong>g focus <strong>on</strong> Finance and Financial Services. Starting in 1987 at BMW’s C<strong>on</strong>trolling department<br />
in Munich, he transferred to the U.S. in 1993, building up and ultimately heading BMW’s Financial<br />
Services Divisi<strong>on</strong> in the Americas. Relocating to Munich in <strong>20</strong>01, he became Head of Sales Western Europe<br />
(excluding Germany). He was appointed member of the Management Board of BMW Group in May <strong>20</strong>02,<br />
serving as Chief Financial Officer until September <strong>20</strong>07 and subsequently as Chief of Sales &<br />
Marketing.<br />
Mr. Krause studied Business Administrati<strong>on</strong> in Würzburg and graduated in 1986 with a master’s degree in<br />
Business Administrati<strong>on</strong>.<br />
Mr. Krause does not have any external directorships subject to disclosure.<br />
Hermann-Josef Lamberti<br />
Age: 53<br />
First appointed: 1999<br />
Term expires: <strong>20</strong>14<br />
Hermann-Josef Lamberti became a member of our Management Board in 1999. He is our Chief Operating<br />
Officer. He joined <strong>Deutsche</strong> <strong>Bank</strong> in 1998 as an Executive Vice President, based in Frankfurt.<br />
Mr. Lamberti began his professi<strong>on</strong>al career in 1982 with Touche Ross in Tor<strong>on</strong>to and subsequently joined<br />
Chemical <strong>Bank</strong> in Frankfurt. From 1985 to 1998 he worked for IBM, initially in Germany in the areas C<strong>on</strong>trolling,<br />
Internal Applicati<strong>on</strong> Development and Sales <strong>Bank</strong>s/Insurance Companies. In 1993, he was appointed<br />
General Manager of the Pers<strong>on</strong>al Software Divisi<strong>on</strong> for Europe, the Middle East and Africa at IBM Europe in<br />
Paris. In 1995, he moved to IBM in the U.S., where he was Vice President for Marketing and Brand Management.<br />
He returned to Germany in 1997 to take up the positi<strong>on</strong> of Chairman of the Management of IBM Germany<br />
in Stuttgart.<br />
Mr. Lamberti studied Business Administrati<strong>on</strong> at the Universities of Cologne and Dublin and graduated in 1982<br />
with a master’s degree in Business Administrati<strong>on</strong>.<br />
103
<strong>20</strong>-F Item 6: Directors, Senior Management and Employees<br />
Mr. Lamberti is a member of the Supervisory Board of BVV Versicherungsverein des <strong>Bank</strong>gewerbes a.G.,<br />
BVV Versorgungskasse des <strong>Bank</strong>gewerbes e.V., BVV Pensi<strong>on</strong>sf<strong>on</strong>ds des <strong>Bank</strong>gewerbes AG, member of the<br />
Supervisory Board of <strong>Deutsche</strong> Börse AG, member of the Board of Directors of European Aer<strong>on</strong>autic Defence<br />
and Space Company EADS N.V. and member of the Supervisory Board of Carl Zeiss AG.<br />
Rainer Neske<br />
Age: 45<br />
First Appointed: <str<strong>on</strong>g><strong>20</strong>09</str<strong>on</strong>g><br />
Term expires: <strong>20</strong>12<br />
Rainer Neske became a member of our Management Board <strong>on</strong> April 1, <str<strong>on</strong>g><strong>20</strong>09</str<strong>on</strong>g>. He joined <strong>Deutsche</strong> <strong>Bank</strong> in<br />
1990 and in <strong>20</strong>00 was appointed member of the Management Board of <strong>Deutsche</strong> <strong>Bank</strong> Privat- und<br />
Geschäftskunden AG. Since <strong>20</strong>03 he has been a member of the Group Executive Committee and Spokesman<br />
of the Management Board of <strong>Deutsche</strong> <strong>Bank</strong> Privat- und Geschäftskunden AG. On our Management Board,<br />
he is resp<strong>on</strong>sible for our Private & Business Clients Corporate Divisi<strong>on</strong>.<br />
Mr. Neske studied Computer Science and Business Administrati<strong>on</strong> at the University of Karlsruhe and gradu-<br />
ated in 1990 with a master’s degree in Informati<strong>on</strong> Technology.<br />
Mr. Neske does not have any external directorships subject to disclosure.<br />
Board Practices of the Management Board<br />
The Supervisory Board issued new terms of reference for our Management Board for the c<strong>on</strong>duct of its affairs<br />
in July <str<strong>on</strong>g><strong>20</strong>09</str<strong>on</strong>g>. These terms of reference provide that in additi<strong>on</strong> to the joint overall resp<strong>on</strong>sibility of the Management<br />
Board as a group, the individual resp<strong>on</strong>sibilities of the members of the Management Board are determined<br />
by the business allocati<strong>on</strong> plan for the Management Board. The terms of reference stipulate that,<br />
notwithstanding the Management Board’s joint management and joint resp<strong>on</strong>sibility, and the functi<strong>on</strong>al resp<strong>on</strong>sibilities<br />
of the operating committees of our group divisi<strong>on</strong>s and of the functi<strong>on</strong>al committees, the members<br />
of the Management Board each have a primary resp<strong>on</strong>sibility for the divisi<strong>on</strong>s or functi<strong>on</strong>s to which they<br />
are assigned, as well as for those committees of which they are members.<br />
In additi<strong>on</strong> to managing our company, some of the members of our Management Board also supervise and<br />
advise our affiliated companies. As permitted by German law, some of the members also serve as members<br />
of the supervisory boards of other companies. Also, to assist us in avoiding c<strong>on</strong>flicts of interest, the members<br />
of our Management Board have generally undertaken not to assume chairmanships of supervisory boards of<br />
companies outside our c<strong>on</strong>solidated group.<br />
104
Secti<strong>on</strong> 161 of the Stock Corporati<strong>on</strong> Act requires that the management board and supervisory board of any<br />
German exchange-listed company declare annually that the recommendati<strong>on</strong>s of the German Corporate<br />
Governance Code have been adopted by the company or which recommendati<strong>on</strong>s have not been so adopted.<br />
These recommendati<strong>on</strong>s go bey<strong>on</strong>d the requirements of German law. The Management Board and Supervisory<br />
Board issued a new Declarati<strong>on</strong> of C<strong>on</strong>formity in accordance with § 161 German Stock Corporati<strong>on</strong> Act<br />
(AktG) <strong>on</strong> October 28, <str<strong>on</strong>g><strong>20</strong>09</str<strong>on</strong>g>. The Declarati<strong>on</strong> was amended <strong>on</strong> January 5, <strong>20</strong>10 as the Supervisory Board<br />
introduced a deductible for the Supervisory Board in the D&O liability insurance policy. The adjusted Declarati<strong>on</strong><br />
of C<strong>on</strong>formity of our Management Board and Supervisory Board dated January 5, <strong>20</strong>10 is available <strong>on</strong><br />
our Internet website at http://www.deutsche-bank.com/corporate-governance under the heading “Declarati<strong>on</strong>s<br />
of C<strong>on</strong>formity”.<br />
Group Executive Committee<br />
The Group Executive Committee was established in <strong>20</strong>02. It comprises the members of the Management<br />
Board and senior representatives from the business divisi<strong>on</strong>s within our client-facing group divisi<strong>on</strong>s and from<br />
the management of our regi<strong>on</strong>s appointed by the Management Board. Dr. Josef Ackermann, Chairman of the<br />
Management Board, is also the Chairman of the Group Executive Committee.<br />
The Group Executive Committee serves as a tool to coordinate our businesses and regi<strong>on</strong>s through the fol-<br />
lowing tasks and resp<strong>on</strong>sibilities:<br />
— Provisi<strong>on</strong> of <strong>on</strong>going informati<strong>on</strong> to the Management Board <strong>on</strong> business developments and particular<br />
transacti<strong>on</strong>s;<br />
— Regular review of our business segments;<br />
— C<strong>on</strong>sultati<strong>on</strong> with and furnishing advice to the Management Board <strong>on</strong> strategic decisi<strong>on</strong>s;<br />
— Preparati<strong>on</strong> of decisi<strong>on</strong>s to be made by the Management Board.<br />
Compensati<strong>on</strong><br />
Supervisory Board<br />
Principles of the Compensati<strong>on</strong> System for Members of the Supervisory Board<br />
The principles of the compensati<strong>on</strong> of the Supervisory Board members are set forth in our Articles of Associati<strong>on</strong>,<br />
which our shareholders amend from time to time at their <str<strong>on</strong>g>Annual</str<strong>on</strong>g> General Meetings. Such compensati<strong>on</strong><br />
provisi<strong>on</strong>s were last amended at our <str<strong>on</strong>g>Annual</str<strong>on</strong>g> General Meeting <strong>on</strong> May 24, <strong>20</strong>07.<br />
105
<strong>20</strong>-F Item 6: Directors, Senior Management and Employees<br />
The following provisi<strong>on</strong>s apply to the <str<strong>on</strong>g><strong>20</strong>09</str<strong>on</strong>g> financial year: compensati<strong>on</strong> c<strong>on</strong>sists of a fixed compensati<strong>on</strong> of<br />
€ 60,000 per year and a dividend-based b<strong>on</strong>us of € 100 per year for every full or fracti<strong>on</strong>al € 0.01 increment<br />
by which the dividend we distribute to our shareholders exceeds € 1.00 per share. The members of the Supervisory<br />
Board also receive annual remunerati<strong>on</strong> linked to our l<strong>on</strong>g-term profits in the amount of € 100 each<br />
for each € 0.01 by which the average earnings per share (diluted), reported in our financial statements in<br />
accordance with the accounting principles to be applied in each case <strong>on</strong> the basis of the net income figures<br />
for the three previous financial years, exceed the amount of € 4.00.<br />
These amounts increase by 100 % for each membership in a committee of the Supervisory Board. For the<br />
chairpers<strong>on</strong> of a committee the rate of increment is <strong>20</strong>0 %. These provisi<strong>on</strong>s do not apply to the Mediati<strong>on</strong><br />
Committee formed pursuant to Secti<strong>on</strong> 27 (3) of the Co-determinati<strong>on</strong> Act. We pay the Supervisory Board<br />
Chairman four times the total compensati<strong>on</strong> of a regular member, without any such increment for committee<br />
work, and we pay his deputy <strong>on</strong>e and a half times the total compensati<strong>on</strong> of a regular member. In additi<strong>on</strong>, the<br />
members of the Supervisory Board receive a meeting fee of € 1,000 for each Supervisory Board and committee<br />
meeting which they attend. Furthermore, in our interest, the members of the Supervisory Board will be<br />
included in any financial liability insurance policy held in an appropriate amount by us, with the corresp<strong>on</strong>ding<br />
premiums being paid by us.<br />
We also reimburse members of the Supervisory Board for all cash expenses and any value added tax (Um-<br />
satzsteuer, at present 19 %) they incur in c<strong>on</strong>necti<strong>on</strong> with their roles as members of the Supervisory Board.<br />
Employee representatives <strong>on</strong> the Supervisory Board also c<strong>on</strong>tinue to receive their employee benefits. For<br />
Supervisory Board members who served <strong>on</strong> the board for <strong>on</strong>ly part of the year, we pay a fracti<strong>on</strong> of their total<br />
compensati<strong>on</strong> based <strong>on</strong> the number of m<strong>on</strong>ths they served, rounding up to whole m<strong>on</strong>ths.<br />
The members of the Nominati<strong>on</strong> Committee, which has been newly formed after the <str<strong>on</strong>g>Annual</str<strong>on</strong>g> General Meeting<br />
<strong>20</strong>08, waived all remunerati<strong>on</strong>, including the meeting fee, for such Nominati<strong>on</strong> Committee work for <str<strong>on</strong>g><strong>20</strong>09</str<strong>on</strong>g> and<br />
the following years, as in the previous years.<br />
Supervisory Board Compensati<strong>on</strong> for Fiscal Year <str<strong>on</strong>g><strong>20</strong>09</str<strong>on</strong>g><br />
We compensate our Supervisory Board members after the end of each fiscal year. In January <strong>20</strong>10, we paid<br />
each Supervisory Board member the fixed porti<strong>on</strong> of their remunerati<strong>on</strong> for their services in <str<strong>on</strong>g><strong>20</strong>09</str<strong>on</strong>g> and their<br />
meeting fees. In additi<strong>on</strong>, we will pay each Supervisory Board member a remunerati<strong>on</strong> linked to our l<strong>on</strong>g-term<br />
performance as well as a dividend-based b<strong>on</strong>us, as defined in our Articles of Associati<strong>on</strong>, for their services in<br />
<str<strong>on</strong>g><strong>20</strong>09</str<strong>on</strong>g>. Assuming that the <str<strong>on</strong>g>Annual</str<strong>on</strong>g> General Meeting in May <strong>20</strong>10 approves the proposed dividend of € 0.75 per<br />
share, the Supervisory Board will receive a total remunerati<strong>on</strong> of € 2,561,316 (<strong>20</strong>08: € 2,478,500). Individual<br />
members of the Supervisory Board received the following compensati<strong>on</strong> for the <str<strong>on</strong>g><strong>20</strong>09</str<strong>on</strong>g> financial year (excluding<br />
statutory value added tax):<br />
106
Members of the Supervisory Board Compensati<strong>on</strong> for fiscal year <str<strong>on</strong>g><strong>20</strong>09</str<strong>on</strong>g> Compensati<strong>on</strong> for fiscal year <strong>20</strong>08<br />
in €<br />
Fixed Variable 3<br />
Meeting<br />
fee<br />
1 Member until May 29, <strong>20</strong>08.<br />
2 Member since May 29, <strong>20</strong>08.<br />
3 Variable compensati<strong>on</strong> for a simple member of € 3,433 is made up of a dividend-based amount of € 0 and an amount of € 3,433 linked to the l<strong>on</strong>g-term<br />
performance of the company.<br />
As menti<strong>on</strong>ed above, most of the employee-elected members of the Supervisory Board are employed by us.<br />
In additi<strong>on</strong>, Dr. Börsig was formerly employed by us as a member of the Management Board. The aggregate<br />
compensati<strong>on</strong> we and our c<strong>on</strong>solidated subsidiaries paid to such members as a group during the year ended<br />
December 31, <str<strong>on</strong>g><strong>20</strong>09</str<strong>on</strong>g> for their services as employees or status as former employees (retirement, pensi<strong>on</strong> and<br />
deferred compensati<strong>on</strong>) was € 3.2 milli<strong>on</strong>.<br />
We do not provide the members of the Supervisory Board any benefits up<strong>on</strong> terminati<strong>on</strong> of their service <strong>on</strong><br />
the Supervisory Board, except that members who are or were employed by us are entitled to the benefits<br />
associated with their terminati<strong>on</strong> of such employment. During <str<strong>on</strong>g><strong>20</strong>09</str<strong>on</strong>g>, we set aside € 0.1 milli<strong>on</strong> for pensi<strong>on</strong>,<br />
retirement or similar benefits for the members of the Supervisory Board who are or were employed by us.<br />
107<br />
Total Fixed Variable Meeting<br />
fee<br />
Dr. Clemens Börsig 240,000 13,733 28,000 281,733 240,000 – 24,000 264,000<br />
Karin Ruck 210,000 12,017 23,000 245,017 160,000 – 12,000 172,000<br />
Wolfgang Böhr2 60,000 3,433 7,000 70,433 40,000 – 4,000 44,000<br />
Dr. Karl-Gerhard Eick 180,000 10,300 16,000 <strong>20</strong>6,300 180,000 – 10,000 190,000<br />
Heidrun Förster 1<strong>20</strong>,000 6,867 14,000 140,867 157,500 – 15,000 172,500<br />
Ulrich Hartmann1 – – – – 50,000 – 6,000 56,000<br />
Alfred Herling2 60,000 3,433 7,000 70,433 40,000 – 4,000 44,000<br />
Gerd Herzberg 60,000 3,433 7,000 70,433 60,000 – 6,000 66,000<br />
Sabine Horn1 – – – – 50,000 – 6,000 56,000<br />
Rolf Hunck1 – – – – 50,000 – 6,000 56,000<br />
Sir Peter Job 180,000 10,300 22,000 212,300 180,000 – 15,000 195,000<br />
Prof. Dr. Henning Kagermann 1<strong>20</strong>,000 6,867 12,000 138,867 1<strong>20</strong>,000 – 13,000 133,000<br />
Ulrich Kaufmann1 – – – – 50,000 – 6,000 56,000<br />
Peter Kazmierczak1 – – – – 25,000 – 3,000 28,000<br />
Martina Klee2 60,000 3,433 7,000 70,433 40,000 – 4,000 44,000<br />
Suzanne Labarge2 1<strong>20</strong>,000 6,867 12,000 138,867 80,000 – 8,000 88,000<br />
Maurice Lévy 60,000 3,433 6,000 69,433 60,000 – 6,000 66,000<br />
Henriette Mark<br />
Prof. Dr. jur. Dr.-Ing. E. h.<br />
1<strong>20</strong>,000 6,867 16,000 142,867 100,000 – 10,000 110,000<br />
Heinrich v<strong>on</strong> Pierer 1 – – – – 50,000 – 5,000 55,000<br />
Gabriele Platscher 60,000 3,433 7,000 70,433 60,000 – 7,000 67,000<br />
Dr. Theo Siegert 1<strong>20</strong>,000 6,867 12,000 138,867 100,000 – 11,000 111,000<br />
Dr. Johannes Teyssen2 60,000 3,433 7,000 70,433 40,000 – 4,000 44,000<br />
Marlehn Thieme2 1<strong>20</strong>,000 6,867 15,000 141,867 80,000 – 7,000 87,000<br />
Tilman Todenhöfer 1<strong>20</strong>,000 6,867 14,000 140,867 125,000 – 11,000 136,000<br />
Dipl.-Ing. Dr.-Ing. E. h. Jürgen Weber1 – – – – 25,000 – 3,000 28,000<br />
Werner Wenning2 60,000 3,433 7,000 70,433 40,000 – 3,000 43,000<br />
Leo Wunderlich 60,000 3,433 7,000 70,433 60,000 – 7,000 67,000<br />
Total 2,190,000 125,316 246,000 2,561,316 2,262,500 – 216,000 2,478,500<br />
Total
<strong>20</strong>-F Item 6: Directors, Senior Management and Employees<br />
Management Board<br />
The Supervisory Board as a whole is resp<strong>on</strong>sible for the compensati<strong>on</strong> framework, including the main c<strong>on</strong>tract<br />
elements, for the members of the Management Board <strong>on</strong> the recommendati<strong>on</strong> of the Chairman’s<br />
Committee of the Supervisory Board and reviews the compensati<strong>on</strong> framework, including the main c<strong>on</strong>tract<br />
elements, regularly. It also determines the total compensati<strong>on</strong> and its compositi<strong>on</strong> for the members of the<br />
Management Board <strong>on</strong> the recommendati<strong>on</strong> of the Chairman’s Committee of the Supervisory Board.<br />
In respect of the <str<strong>on</strong>g><strong>20</strong>09</str<strong>on</strong>g> financial year, the members of the Management Board received compensati<strong>on</strong> for their<br />
service <strong>on</strong> the Management Board totaling € 38,978,972 (<strong>20</strong>08: € 4,476,684). This aggregate compensati<strong>on</strong><br />
c<strong>on</strong>sisted of the following comp<strong>on</strong>ents and for the <str<strong>on</strong>g><strong>20</strong>09</str<strong>on</strong>g> financial year was primarily performance-related.<br />
in € 1 N<strong>on</strong>-performance-related comp<strong>on</strong>ents:<br />
<str<strong>on</strong>g><strong>20</strong>09</str<strong>on</strong>g> <strong>20</strong>08<br />
Base salary 5,950,000 3,950,000<br />
Other benefits<br />
Performance-related (variable) comp<strong>on</strong>ents:<br />
849,346 526,684<br />
without l<strong>on</strong>g-term incentives (n<strong>on</strong>-deferred) 2 9,587,269 –<br />
with l<strong>on</strong>g-term incentives (deferred) 22,592,357 –<br />
Total compensati<strong>on</strong> 38,978,972 4,476,684<br />
1 Compensati<strong>on</strong> figures relate to Management Board members active in the respective financial year for their service <strong>on</strong> the Management Board.<br />
2 Immediately paid out.<br />
We have entered into c<strong>on</strong>tractual agreements with the members of our Management Board. These agreements<br />
established the following principal elements of compensati<strong>on</strong>:<br />
N<strong>on</strong>-Performance-Related Comp<strong>on</strong>ents. The n<strong>on</strong>-performance-related comp<strong>on</strong>ents comprise the base salary<br />
and other benefits.<br />
The members of the Management Board receive a base salary which is reviewed at regular intervals. The<br />
base salary is disbursed in m<strong>on</strong>thly installments. Other benefits comprise taxable reimbursements of<br />
expenses and the m<strong>on</strong>etary value of n<strong>on</strong>-cash benefits such as company cars and driver services, insurance<br />
premiums, expenses for company-related social functi<strong>on</strong>s and security measures, including payments, if<br />
applicable, of taxes <strong>on</strong> these benefits.<br />
Performance-Related Comp<strong>on</strong>ents. The performance-related comp<strong>on</strong>ents comprised for the year <str<strong>on</strong>g><strong>20</strong>09</str<strong>on</strong>g> a<br />
b<strong>on</strong>us payment, a mid-term incentive (“MTI”) and, for the Management Board members resp<strong>on</strong>sible for the<br />
CIB Group Divisi<strong>on</strong>, a divisi<strong>on</strong>-related compensati<strong>on</strong> comp<strong>on</strong>ent (“divisi<strong>on</strong> incentive”). The annual b<strong>on</strong>us<br />
payment, which was based <strong>on</strong> a target amount, was driven primarily by the achievement of our planned return<br />
<strong>on</strong> equity. The MTI (also based <strong>on</strong> a target amount) was based <strong>on</strong> the ratio between our total shareholder<br />
return and the corresp<strong>on</strong>ding average figure for a selected group of comparable companies for a rolling<br />
two year period. The divisi<strong>on</strong> incentive c<strong>on</strong>sidered the performance of the CIB Group Divisi<strong>on</strong> (for example,<br />
net income before tax), also in relati<strong>on</strong> to peers and set targets, as well as the risk aspects and individual<br />
performance.<br />
108
Comp<strong>on</strong>ents with L<strong>on</strong>g-Term Incentives. The variable compensati<strong>on</strong> comp<strong>on</strong>ents that the members of the<br />
Management Board received for <str<strong>on</strong>g><strong>20</strong>09</str<strong>on</strong>g> (b<strong>on</strong>us, MTI and (if applicable) divisi<strong>on</strong> incentive) were deferred to a<br />
much higher proporti<strong>on</strong> than in previous years, c<strong>on</strong>stituting for each member of the Management Board more<br />
than 60 % of his variable compensati<strong>on</strong>. These deferrals were granted as restricted incentive awards and as<br />
restricted equity awards. Both deferred compensati<strong>on</strong> elements have a l<strong>on</strong>g-term incentive effect and are<br />
subject to forfeiture. Forfeiture will take place in defined cases, for example, in the event of n<strong>on</strong>-achievement<br />
of defined parameters, breach of policy or financial impairment.<br />
Restricted incentive awards were distributed under the DB Restricted Incentive Plan. Their ultimate value will<br />
depend <strong>on</strong>, am<strong>on</strong>g other things, return <strong>on</strong> equity developments during the next three years (<strong>20</strong>10 – <strong>20</strong>12).<br />
The awards are divided into three equal tranches which vest in early <strong>20</strong>11, <strong>20</strong>12 and <strong>20</strong>13.<br />
Restricted equity awards were distributed under the DB Equity Plan. Their ultimate value will depend <strong>on</strong>,<br />
am<strong>on</strong>g other things, the price of <strong>Deutsche</strong> <strong>Bank</strong> shares up<strong>on</strong> their delivery. Subject to the above-menti<strong>on</strong>ed<br />
c<strong>on</strong>diti<strong>on</strong>s, a part of the shares from these rights will vest in nine equal tranches, the last of which will be<br />
delivered in November <strong>20</strong>13, and a significant porti<strong>on</strong> of the rights will vest <strong>on</strong>ly in November <strong>20</strong>13, i.e., after<br />
almost four years. In February <strong>20</strong>10, members of the Management Board were granted a total of<br />
405,349 shares in the form of restricted equity awards under the DB Equity Plan for their performance in <str<strong>on</strong>g><strong>20</strong>09</str<strong>on</strong>g><br />
(<strong>20</strong>08: 0).<br />
For further informati<strong>on</strong> <strong>on</strong> our DB Restricted Incentive Plan and DB Equity Plan see Notes [31] and [32] to the<br />
c<strong>on</strong>solidated financial statements.<br />
The Supervisory Board reviews the compensati<strong>on</strong> framework for the members of the Management Board <strong>on</strong> a<br />
regular basis and develops it further as appropriate. Due to revised legal and regulatory requirements, which<br />
have been newly implemented through the end of last year, the Supervisory Board recently decided to review<br />
the compensati<strong>on</strong> framework and to re-design it for the future – without changing the total target amount –<br />
c<strong>on</strong>sidering and incorporating the following aspects:<br />
The main focus of the further-developed framework is to align the compensati<strong>on</strong> of the members of the Man-<br />
agement Board with the sustainable and l<strong>on</strong>g-term leadership and development of the company, to c<strong>on</strong>stitute<br />
an adequate combinati<strong>on</strong> of fixed and variable compensati<strong>on</strong> comp<strong>on</strong>ents, to establish an even more comprehensive<br />
assessment basis for the variable compensati<strong>on</strong>, to grant large porti<strong>on</strong>s of the variable compensati<strong>on</strong><br />
<strong>on</strong> a deferred basis, to subject already granted variable compensati<strong>on</strong> comp<strong>on</strong>ents to possible forfeiture<br />
in case of defined events as well as to c<strong>on</strong>tinue to combine the interest of the members of the Management<br />
Board with the interest of the company by their l<strong>on</strong>g-term investment in the company.<br />
To provide further for the appropriate mix of fixed and variable compensati<strong>on</strong>, in the future base salaries will<br />
be increased to € 1,150,000 per year for an ordinary Management Board member and to € 1,650,000 per year<br />
for Dr. Ackermann. Target b<strong>on</strong>us numbers will be reduced accordingly.<br />
109
<strong>20</strong>-F Item 6: Directors, Senior Management and Employees<br />
To achieve a multi-year basis of assessment, the b<strong>on</strong>us will be calculated in the future based <strong>on</strong> two equally<br />
weighted factors, which are designed as follows. The first factor depends <strong>on</strong> our two year average return <strong>on</strong><br />
equity in comparis<strong>on</strong> to our internal plan. The sec<strong>on</strong>d factor is driven by our two year average return <strong>on</strong> equity<br />
(with the excepti<strong>on</strong> for the <strong>20</strong>10 financial year for which <strong>on</strong>ly our <strong>20</strong>10 return <strong>on</strong> equity will be c<strong>on</strong>sidered). In<br />
additi<strong>on</strong>, the calculated amount may be increased or reduced by up to 50 % at the discreti<strong>on</strong> of the Supervisory<br />
Board depending <strong>on</strong> individual performance and other c<strong>on</strong>siderati<strong>on</strong>s. The part of the b<strong>on</strong>us that relates<br />
to the respective factor will not be paid if pre-defined targets are not met. Any b<strong>on</strong>us will, as a rule, be in part<br />
deferred.<br />
As further part of the variable compensati<strong>on</strong> the MTI will be replaced by a L<strong>on</strong>g-Term Performance Award<br />
(“LTPA”), which is a compensati<strong>on</strong> element with l<strong>on</strong>g-term incentive effect. The LTPA, which is based <strong>on</strong> a<br />
target number, reflects, for a rolling three year period, the ratio between our total shareholder return and the<br />
corresp<strong>on</strong>ding average figure for a selected group of comparable companies. If the average calculated for<br />
<strong>Deutsche</strong> <strong>Bank</strong> is less than a specific threshold value in comparis<strong>on</strong> with the selected group of companies, no<br />
LTPA payment will be made. Any payout of the LTPA will, as a rule, be predominantly deferred.<br />
The divisi<strong>on</strong> incentive will c<strong>on</strong>tinue to apply to Management Board members with resp<strong>on</strong>sibility for the CIB<br />
Group Divisi<strong>on</strong>. Such divisi<strong>on</strong> incentive will c<strong>on</strong>sider the performance of the CIB Group Divisi<strong>on</strong> (e.g. net<br />
income before tax), also in relati<strong>on</strong> to peers and the set targets, as well as the risk aspects of the business<br />
and individual performance.<br />
In general, more than 60 % of the sum of all variable compensati<strong>on</strong> elements (b<strong>on</strong>us, LTPA and (if applicable)<br />
divisi<strong>on</strong> incentive) will be deferred. Any deferred amount may be granted in cash and/or in equity or equity-<br />
linked compensati<strong>on</strong> instruments. As a further general rule more than 50 % of the deferred amount will be<br />
settled in equity or equity-linked compensati<strong>on</strong>. The b<strong>on</strong>us deferral will in general be delivered in restricted<br />
incentive awards, whereas the LTPA and divisi<strong>on</strong> incentive deferrals will as a rule be delivered in<br />
restricted equity awards or equity-linked compensati<strong>on</strong>. Restricted incentive awards will be granted in three<br />
equal tranches and will vest starting <strong>on</strong>e year after grant over a period of three years in total. Restricted<br />
equity awards will be granted to vest in several tranches starting <strong>on</strong>e year after grant, the last of which will be<br />
delivered after almost four years. The value of those awards or equity-linked compensati<strong>on</strong> instruments will<br />
be subject to share price performance.<br />
Any deferred award will be subject to forfeiture based <strong>on</strong> group performance and individual behavior and<br />
performance, to reflect and safeguard the risk orientati<strong>on</strong> of the compensati<strong>on</strong>. The members of the Manage-<br />
ment Board will not be allowed to restrict or suspend the risk orientati<strong>on</strong> by hedging or other counter-<br />
measures. Even in case of extraordinary developments the total compensati<strong>on</strong> including all variable comp<strong>on</strong>ents<br />
may be limited to a maximum amount.<br />
A payment of variable compensati<strong>on</strong> elements will not take place, if the payment is prohibited or restricted by<br />
the German Federal Financial Supervisory Authority (“Bundesanstalt für Finanzdienstleistungsaufsicht”) in<br />
accordance with existing statutory requirements.<br />
110
The members of the Management Board will still receive in the future the above-menti<strong>on</strong>ed other benefits and<br />
are entitled – with the excepti<strong>on</strong> of members of the Management Board which receive a divisi<strong>on</strong> incentive – to<br />
the pensi<strong>on</strong> benefits described below.<br />
Our Management Board members have and will have a share holding requirement. They are required to keep<br />
during their membership <strong>on</strong> the Management Board 45 % of the <strong>Deutsche</strong> <strong>Bank</strong> shares which have been<br />
delivered or will be delivered to them during their membership <strong>on</strong> the Management Board since <strong>20</strong>08. If the<br />
share-based comp<strong>on</strong>ents of the variable compensati<strong>on</strong> exceed 50 % of the variable compensati<strong>on</strong> in a given<br />
year, the requirement will not apply to the porti<strong>on</strong> exceeding 50 %.<br />
In the course of developing the compensati<strong>on</strong> structure further as well as defining the variable comp<strong>on</strong>ents<br />
for the financial year <str<strong>on</strong>g><strong>20</strong>09</str<strong>on</strong>g>, the Supervisory Board was advised by an external independent c<strong>on</strong>sultant.<br />
The Management Board members received the following compensati<strong>on</strong> comp<strong>on</strong>ents for their service <strong>on</strong> the<br />
Management Board for the years <str<strong>on</strong>g><strong>20</strong>09</str<strong>on</strong>g> and to the extent applicable <strong>20</strong>08. All Management Board members<br />
active in <strong>20</strong>08 have irrevocably waived any entitlements to payment of variable compensati<strong>on</strong> for the <strong>20</strong>08<br />
financial year.<br />
Members of the Management Board N<strong>on</strong>-performance-related<br />
comp<strong>on</strong>ents<br />
Base salary Other<br />
benefits<br />
in €<br />
1 Immediately paid out.<br />
2 L<strong>on</strong>g-term incentives include restricted incentive awards and restricted equity awards granted for the respective year. The number of shares in the form of restricted equity awards<br />
granted in <strong>20</strong>10 for the year <str<strong>on</strong>g><strong>20</strong>09</str<strong>on</strong>g> to each member of the Management Board was determined by dividing the respective Euro amounts by € 45.978, the average Xetra closing price of<br />
the DB share during the last ten trading days prior to February 1, <strong>20</strong>10. As a result, the number of share awards to each member was as follows: Dr. Ackermann: 103,255, Dr.<br />
Bänziger: 36,049, Mr. Cohrs: 33,637, Mr. Fitschen: 27,037, Mr. Jain: 106,236, Mr. Krause: 36,049, Mr. Lamberti: 36,049, and Mr. Neske: 27,037.<br />
3 Member of the Management Board since April 1, <str<strong>on</strong>g><strong>20</strong>09</str<strong>on</strong>g>.<br />
4 Member of the Management Board since April 1, <strong>20</strong>08.<br />
111<br />
without<br />
l<strong>on</strong>g-term<br />
incentives<br />
(n<strong>on</strong>-<br />
deferred) 1<br />
Performance-related comp<strong>on</strong>ents Total<br />
compensati<strong>on</strong><br />
with l<strong>on</strong>g-term incentives<br />
(deferred) 2<br />
Restricted<br />
incentive<br />
award<br />
Restricted<br />
equity award<br />
Dr. Josef Ackermann <str<strong>on</strong>g><strong>20</strong>09</str<strong>on</strong>g> 1,150,000 154,030 1,575,000 1,925,000 4,747,500 9,551,530<br />
<strong>20</strong>08 1,150,000 239,586 – – – 1,389,586<br />
Dr. Hugo Bänziger <str<strong>on</strong>g><strong>20</strong>09</str<strong>on</strong>g> 800,000 51,388 1,231,425 268,575 1,657,500 4,008,888<br />
<strong>20</strong>08 800,000 62,160 – – – 862,160<br />
Michael Cohrs3 <str<strong>on</strong>g><strong>20</strong>09</str<strong>on</strong>g> 600,000 39,661 905,428 130,210 1,546,575 3,221,874<br />
<strong>20</strong>08 – – – – – –<br />
Jürgen Fitschen 3 <str<strong>on</strong>g><strong>20</strong>09</str<strong>on</strong>g> 600,000 131,111 923,569 <strong>20</strong>1,431 1,243,125 3,099,236<br />
<strong>20</strong>08 – – – – – –<br />
Anshuman Jain3 <str<strong>on</strong>g><strong>20</strong>09</str<strong>on</strong>g> 600,000 52,697 1,565,428 691,210 4,884,525 7,793,860<br />
<strong>20</strong>08 – – – – – –<br />
Stefan Krause4 <str<strong>on</strong>g><strong>20</strong>09</str<strong>on</strong>g> 800,000 58,267 1,231,425 268,575 1,657,500 4,015,767<br />
<strong>20</strong>08 600,000 107,306 – – – 707,306<br />
Hermann-Josef Lamberti <str<strong>on</strong>g><strong>20</strong>09</str<strong>on</strong>g> 800,000 102,123 1,231,425 268,575 1,657,500 4,059,623<br />
<strong>20</strong>08 800,000 92,893 – – – 892,893<br />
Rainer Neske3 <str<strong>on</strong>g><strong>20</strong>09</str<strong>on</strong>g> 600,000 260,069 923,569 <strong>20</strong>1,431 1,243,125 3,228,194<br />
<strong>20</strong>08 – – – – – –
<strong>20</strong>-F Item 6: Directors, Senior Management and Employees<br />
Management Board members did not receive any compensati<strong>on</strong> for mandates <strong>on</strong> boards of our subsidiaries.<br />
The members of the Management Board (with the excepti<strong>on</strong> of members of the Management Board which<br />
receive a divisi<strong>on</strong> incentive) are entitled to a c<strong>on</strong>tributi<strong>on</strong>-oriented pensi<strong>on</strong> plan which in its structure corresp<strong>on</strong>ds<br />
to a general pensi<strong>on</strong> plan for our employees. Under this c<strong>on</strong>tributi<strong>on</strong>-oriented pensi<strong>on</strong> plan, a pers<strong>on</strong>al<br />
pensi<strong>on</strong> account has been set up for each participating member of the Management Board (after appointment<br />
to the Management Board). A c<strong>on</strong>tributi<strong>on</strong> is made annually by us into this pensi<strong>on</strong> account. This annual c<strong>on</strong>tributi<strong>on</strong><br />
is calculated using an individual c<strong>on</strong>tributi<strong>on</strong> rate <strong>on</strong> the basis of each member’s base salary and<br />
b<strong>on</strong>us up to a defined ceiling and accrues interest credited in advance, determined by means of an agerelated<br />
factor, at an average rate of 6 % per year up to the age of 60. From the age of 61 <strong>on</strong>, the pensi<strong>on</strong><br />
account is credited with an annual interest payment of 6 % up to the date of retirement. The annual payments,<br />
taken together, form the pensi<strong>on</strong> amount which is available to pay the future pensi<strong>on</strong> benefit. The pensi<strong>on</strong><br />
may fall due for payment after a member has left the Management Board, but before a pensi<strong>on</strong> event (age<br />
limit, disability or death) has occurred. The pensi<strong>on</strong> right is vested from the start.<br />
The following table shows the service costs for the years ended December 31, <str<strong>on</strong>g><strong>20</strong>09</str<strong>on</strong>g> and December 31, <strong>20</strong>08<br />
and the balance of the pensi<strong>on</strong> accounts at the respective dates.<br />
Members of the Management Board1 in €<br />
Service costs Balance of pensi<strong>on</strong> accounts<br />
Dr. Josef Ackermann <str<strong>on</strong>g><strong>20</strong>09</str<strong>on</strong>g> 318,006 4,459,769<br />
<strong>20</strong>08 317,893 4,098,838<br />
Dr. Hugo Bänziger <str<strong>on</strong>g><strong>20</strong>09</str<strong>on</strong>g> 405,530 1,583,668<br />
<strong>20</strong>08 429,167 1,379,668<br />
Jürgen Fitschen 2 <str<strong>on</strong>g><strong>20</strong>09</str<strong>on</strong>g> 62,984 60,000<br />
<strong>20</strong>08 – –<br />
Stefan Krause3 <str<strong>on</strong>g><strong>20</strong>09</str<strong>on</strong>g> 407,171 492,000<br />
<strong>20</strong>08 100,691 216,000<br />
Hermann-Josef Lamberti <str<strong>on</strong>g><strong>20</strong>09</str<strong>on</strong>g> 260,217 4,302,174<br />
<strong>20</strong>08 273,192 4,166,174<br />
Rainer Neske2 <str<strong>on</strong>g><strong>20</strong>09</str<strong>on</strong>g> 114,385 225,000<br />
<strong>20</strong>08 – –<br />
1 Other members of the Management Board do not participate in the Management Board pensi<strong>on</strong> plan.<br />
2 Member of the Management Board since April 1, <str<strong>on</strong>g><strong>20</strong>09</str<strong>on</strong>g>.<br />
3 Member of the Management Board since April 1, <strong>20</strong>08.<br />
The different sizes of the balances are due to the different length of services <strong>on</strong> the Management Board, the<br />
respective age-related factors, the different c<strong>on</strong>tributi<strong>on</strong> rates and the individual pensi<strong>on</strong>able compensati<strong>on</strong><br />
amounts. Dr. Ackermann and Mr. Lamberti are also entitled, in principle, after they have left the Management<br />
Board, to a m<strong>on</strong>thly pensi<strong>on</strong> payment of € 29,400 each under a discharged prior pensi<strong>on</strong> entitlement.<br />
If a Management Board member, whose appointment was in effect at the beginning of <strong>20</strong>08, leaves office, he<br />
is entitled, for a period of six m<strong>on</strong>ths, to a transiti<strong>on</strong> payment. Excepti<strong>on</strong>s to this arrangement exist where, for<br />
instance, the Management Board member gives cause for summary dismissal. The transiti<strong>on</strong> payment a<br />
Management Board member would have received over this six m<strong>on</strong>ths period, if he had left <strong>on</strong> December 31,<br />
<str<strong>on</strong>g><strong>20</strong>09</str<strong>on</strong>g> or <strong>on</strong> December 31, <strong>20</strong>08, was for Dr. Ackermann € 2,825,000 and for each of Dr. Bänziger and<br />
Mr. Lamberti € 1,150,000.<br />
112
If a Management Board member, whose appointment was in effect at the beginning of <strong>20</strong>06 (Dr. Ackermann<br />
and Mr. Lamberti), leaves office after reaching the age of 60, he is subsequently entitled, in principle, directly<br />
after the end of the six-m<strong>on</strong>th transiti<strong>on</strong> period, to payment of first 75 % and then 50 % of the sum of his<br />
salary and last target b<strong>on</strong>us, each for a period of 24 m<strong>on</strong>ths. This payment ends no later than six m<strong>on</strong>ths<br />
after the end of the <str<strong>on</strong>g>Annual</str<strong>on</strong>g> General Meeting in the year in which the Board member reaches his 65th birthday.<br />
Pursuant to the c<strong>on</strong>tractual agreements c<strong>on</strong>cluded with each of the Management Board members, they are<br />
entitled to receive a severance payment up<strong>on</strong> a premature terminati<strong>on</strong> of their appointment at our initiative,<br />
without us having been entitled to revoke the appointment or give notice under the c<strong>on</strong>tractual agreement for<br />
cause. The severance payment will be determined by the Supervisory Board according to its reas<strong>on</strong>able discreti<strong>on</strong><br />
and, as a rule, will not exceed the lesser of two annual compensati<strong>on</strong> amounts and the claims to<br />
compensati<strong>on</strong> for the remaining term of the c<strong>on</strong>tract (compensati<strong>on</strong> calculated <strong>on</strong> the basis of the annual<br />
compensati<strong>on</strong> for the previous financial year).<br />
If a Management Board member’s departure is in c<strong>on</strong>necti<strong>on</strong> with a change of c<strong>on</strong>trol, he is entitled to a<br />
severance payment. The severance payment will be determined by the Supervisory Board according to its<br />
reas<strong>on</strong>able discreti<strong>on</strong> and, as a rule, will not exceed the lesser of three annual compensati<strong>on</strong> amounts and<br />
the claims to compensati<strong>on</strong> for the remaining term of the c<strong>on</strong>tract (compensati<strong>on</strong> calculated <strong>on</strong> the basis of<br />
the annual compensati<strong>on</strong> for the previous financial year).<br />
The total compensati<strong>on</strong> paid to former Management Board members or their surviving dependents in <str<strong>on</strong>g><strong>20</strong>09</str<strong>on</strong>g><br />
and <strong>20</strong>08 amounted to an aggregate of € 19,849,430 and € 19,741,906, respectively.<br />
Employees<br />
As of December 31, <str<strong>on</strong>g><strong>20</strong>09</str<strong>on</strong>g>, we employed a total of 77,053 staff members as compared to 80,456 as of<br />
December 31, <strong>20</strong>08. We calculate our employee figures <strong>on</strong> a full-time equivalent basis, meaning we include<br />
proporti<strong>on</strong>ate numbers of part-time employees.<br />
The following table shows our numbers of full-time equivalent employees as of December 31, <str<strong>on</strong>g><strong>20</strong>09</str<strong>on</strong>g>, <strong>20</strong>08 and<br />
<strong>20</strong>07.<br />
Employees1 Dec 31, <str<strong>on</strong>g><strong>20</strong>09</str<strong>on</strong>g> Dec 31, <strong>20</strong>08 Dec 31, <strong>20</strong>07<br />
Germany 27,321 27,942 27,779<br />
Europe (outside Germany), Middle East and Africa 22,025 23,067 21,989<br />
Asia/Pacific 16,524 17,126 15,080<br />
North America2 10,815 11,947 13,088<br />
Central and South America 368 374 355<br />
Total employees 77,053 80,456 78,291<br />
1 Full-time equivalent employees.<br />
2 Primarily the United States.<br />
113
<strong>20</strong>-F Item 6: Directors, Senior Management and Employees<br />
The number of our employees decreased in <str<strong>on</strong>g><strong>20</strong>09</str<strong>on</strong>g> by 3,403 or 4.2 % due to the following factors:<br />
— The number of Corporate and Investment <strong>Bank</strong> Group Divisi<strong>on</strong> staff was reduced by 641 due to market<br />
developments in the first six m<strong>on</strong>ths <str<strong>on</strong>g><strong>20</strong>09</str<strong>on</strong>g>, particularly in the global financial centers in the U.K., U.S. and<br />
H<strong>on</strong>g K<strong>on</strong>g.<br />
— In the sec<strong>on</strong>d half year <str<strong>on</strong>g><strong>20</strong>09</str<strong>on</strong>g>, due to a slowing global ec<strong>on</strong>omy and a reducti<strong>on</strong> in market volumes, the<br />
number of Private Clients and Asset Management Group Divisi<strong>on</strong> staff was reduced by 1,997, particularly<br />
in our Asset and Wealth Management Corporate Divisi<strong>on</strong> in the U.S. as well as our Private & Business<br />
Clients Corporate Divisi<strong>on</strong> internati<strong>on</strong>ally.<br />
— In Infrastructure, our service centers in India and the Philippines, and the establishment of service centers<br />
in Birmingham (U.K.) and Jacks<strong>on</strong>ville (U.S.) c<strong>on</strong>tributed to the increase of approximately 1,000 employees.<br />
This increase was offset by staff reducti<strong>on</strong>s of approximately 1,800 in other locati<strong>on</strong>s.<br />
The following charts show the relative proporti<strong>on</strong>s of employees in the Group Divisi<strong>on</strong>s and Infrastructure/Regi<strong>on</strong>al<br />
Management as of December 31, <str<strong>on</strong>g><strong>20</strong>09</str<strong>on</strong>g>, <strong>20</strong>08 and <strong>20</strong>07.<br />
Employees<br />
in %<br />
<str<strong>on</strong>g><strong>20</strong>09</str<strong>on</strong>g> <strong>20</strong>08 <strong>20</strong>07<br />
50<br />
40<br />
30<br />
<strong>20</strong><br />
10<br />
0<br />
39.8<br />
40.6<br />
Private Clients and<br />
Asset Management<br />
40.3<br />
18.4<br />
18.4<br />
114<br />
<strong>20</strong>.8<br />
Corporate & Investment<br />
<strong>Bank</strong>ing<br />
41.8<br />
41.0<br />
38.9<br />
Infrastructure/<br />
Regi<strong>on</strong>al Management
Labor Relati<strong>on</strong>s<br />
In Germany, labor uni<strong>on</strong>s and employers’ associati<strong>on</strong>s generally negotiate collective bargaining agreements<br />
<strong>on</strong> salaries and benefits for employees below the management level. Many companies in Germany, including<br />
ourselves and our material German subsidiaries, are members of employers’ associati<strong>on</strong>s and are bound by<br />
collective bargaining agreements.<br />
Each year, our employers’ associati<strong>on</strong>, the Arbeitgeberverband des privaten <strong>Bank</strong>gewerbes e.V., ordinarily<br />
renegotiates the collective bargaining agreements that cover many of our employees. The current agreement<br />
reached in April <str<strong>on</strong>g><strong>20</strong>09</str<strong>on</strong>g> includes the c<strong>on</strong>firmati<strong>on</strong> of a voluntarily pay raise of 2.5 % since November <strong>20</strong>08 and a<br />
single payment of € <strong>20</strong>0 in February <strong>20</strong>10. It terminates <strong>on</strong> April 30, <strong>20</strong>10. As a result of the financial turmoil<br />
in <str<strong>on</strong>g><strong>20</strong>09</str<strong>on</strong>g>, some potential aspects of the negotiati<strong>on</strong>s have been postp<strong>on</strong>ed by the negotiati<strong>on</strong> parties to the<br />
following negotiati<strong>on</strong>s in <strong>20</strong>10.<br />
Our employers’ associati<strong>on</strong> negotiates with the following uni<strong>on</strong>s:<br />
— ver.di (Vereinigte Dienstleistungsgewerkschaft), a uni<strong>on</strong> formed in July <strong>20</strong>01 resulting from the merger of<br />
five uni<strong>on</strong>s, including the former bank uni<strong>on</strong>s <strong>Deutsche</strong> Angestellten Gewerkschaft and Gewerkschaft<br />
Handel, <strong>Bank</strong>en und Versicherungen<br />
— <strong>Deutsche</strong>r <strong>Bank</strong>angestellten Verband (DBV – Gewerkschaft der Finanzdienstleister)<br />
— <strong>Deutsche</strong>r Handels- und Industrieangestellten Verband (DHV – Die Berufsgewerkschaft)<br />
German law prohibits us from asking our employees whether they are members of labor uni<strong>on</strong>s. Therefore,<br />
we do not know how many of our employees are members of uni<strong>on</strong>s. Approximately 15 % of the employees in<br />
the German banking industry are uni<strong>on</strong>ized. We estimate that less than 15 % of our employees in Germany<br />
are uni<strong>on</strong>ized. On a worldwide basis, we estimate that approximately 15 % of our employees are members of<br />
labor uni<strong>on</strong>s.<br />
115
<strong>20</strong>-F Item 6: Directors, Senior Management and Employees<br />
Share Ownership<br />
Management Board<br />
As of February 19, <strong>20</strong>10 and February 27, <str<strong>on</strong>g><strong>20</strong>09</str<strong>on</strong>g>, respectively, the members of our Management Board held<br />
the following numbers of our shares and share awards.<br />
Members of the Management Board Number of<br />
shares<br />
Dr. Josef Ackermann <strong>20</strong>10 355,474 197,260<br />
<str<strong>on</strong>g><strong>20</strong>09</str<strong>on</strong>g> 334,577 133,789<br />
Dr. Hugo Bänziger <strong>20</strong>10 36,116 89,402<br />
<str<strong>on</strong>g><strong>20</strong>09</str<strong>on</strong>g> 24,101 77,441<br />
1 Including the share awards Dr. Bänziger, Mr. Cohrs, Mr. Fitschen, Mr. Jain and Mr. Neske received in c<strong>on</strong>necti<strong>on</strong> with their employment by us prior to<br />
their appointment as member of the Management Board. The share awards listed in the table have different vesting and allocati<strong>on</strong> dates. The last share<br />
awards will mature and be allocated in November <strong>20</strong>13.<br />
2 This pers<strong>on</strong> was not a member of the Management Board as of February 27, <str<strong>on</strong>g><strong>20</strong>09</str<strong>on</strong>g>.<br />
3 Thereof 138,405 vested.<br />
Michael Cohrs2 <strong>20</strong>10 144,537 268,708<br />
<str<strong>on</strong>g><strong>20</strong>09</str<strong>on</strong>g> – –<br />
Jürgen Fitschen 2 <strong>20</strong>10 98,339 86,747<br />
<str<strong>on</strong>g><strong>20</strong>09</str<strong>on</strong>g> – –<br />
Anshuman Jain2 <strong>20</strong>10 338,717 433,046<br />
<str<strong>on</strong>g><strong>20</strong>09</str<strong>on</strong>g> – –<br />
Stefan Krause <strong>20</strong>10 – 36,049<br />
<str<strong>on</strong>g><strong>20</strong>09</str<strong>on</strong>g> – –<br />
Hermann-Josef Lamberti <strong>20</strong>10 97,740 78,190<br />
<str<strong>on</strong>g><strong>20</strong>09</str<strong>on</strong>g> 88,373 59,973<br />
Rainer Neske2 <strong>20</strong>10 42,547 75,395<br />
<str<strong>on</strong>g><strong>20</strong>09</str<strong>on</strong>g> – –<br />
Total <strong>20</strong>10 1,113,470 1,264,797 3<br />
Total <str<strong>on</strong>g><strong>20</strong>09</str<strong>on</strong>g> 447,051 271,<strong>20</strong>3<br />
The members of our Management Board held an aggregate of 1,113,470 of our shares <strong>on</strong> February 19, <strong>20</strong>10,<br />
amounting to approximately 0.18 % of our shares issued <strong>on</strong> that date. They held an aggregate of 447,051 of<br />
our shares <strong>on</strong> February 27, <str<strong>on</strong>g><strong>20</strong>09</str<strong>on</strong>g>, amounting to approximately 0.08 % of our shares issued <strong>on</strong> that date.<br />
The number of shares delivered to the members of the Management Board in <str<strong>on</strong>g><strong>20</strong>09</str<strong>on</strong>g> from deferred compensati<strong>on</strong><br />
awards granted in prior years amounted to 633,531.<br />
In <str<strong>on</strong>g><strong>20</strong>09</str<strong>on</strong>g>, compensati<strong>on</strong> expense for l<strong>on</strong>g-term incentive comp<strong>on</strong>ents of compensati<strong>on</strong> granted for their service<br />
in prior years <strong>on</strong> the Management Board was € 2,013,402 for Dr. Ackermann, € 810,967 for Dr. Bänziger, and<br />
€ 902,559 for Mr. Lamberti. Mr. Cohrs, Mr. Fitschen, Mr. Jain and Mr. Neske joined the Management Board<br />
<strong>on</strong>ly in April <str<strong>on</strong>g><strong>20</strong>09</str<strong>on</strong>g> and no expense was therefore recognized for l<strong>on</strong>g-term incentives granted for their service<br />
<strong>on</strong> the Management Board in <str<strong>on</strong>g><strong>20</strong>09</str<strong>on</strong>g>. In <strong>20</strong>08, the corresp<strong>on</strong>ding compensati<strong>on</strong> expense for these comp<strong>on</strong>ents<br />
was € 3,368,011 for Dr. Ackermann, € 1,103,939 for Dr. Bänziger and € 1,509,798 for Mr. Lamberti. Mr. Krause<br />
joined the Management Board <strong>on</strong>ly in April <strong>20</strong>08 and no expense was therefore recognized for l<strong>on</strong>g-term<br />
incentives granted for his service <strong>on</strong> the Management Board in <str<strong>on</strong>g><strong>20</strong>09</str<strong>on</strong>g> and <strong>20</strong>08.<br />
For more informati<strong>on</strong> <strong>on</strong> share awards in the table above granted under the share plans, see Note [31] to the<br />
c<strong>on</strong>solidated financial statements.<br />
116<br />
Number of<br />
share awards 1
Supervisory Board<br />
As of February 19, <strong>20</strong>10, the current members of our Supervisory Board held the following numbers of our<br />
shares and share awards under our employee share plans.<br />
Members of the Supervisory Board Number of<br />
shares<br />
1 This does not include 150 <strong>Deutsche</strong> <strong>Bank</strong> shares held by a family-owned partnership, in which Dr. Clemens Börsig has a 25 % interest as well as 14,612<br />
<strong>Deutsche</strong> <strong>Bank</strong> shares attributable to a charitable foundati<strong>on</strong> with separate legal capacity, the “Gerhild und Clemens Börsig Jugend- und Sozialstiftung”.<br />
The members of the Supervisory Board held 137,815 shares, amounting to less than 0.02 % of our shares as<br />
of February 19, <strong>20</strong>10.<br />
As listed in the “Number of share awards” column in the table, Dr. Clemens Börsig holds 5,322 DB Equity<br />
Units granted under the DB Global Partnership Plan in c<strong>on</strong>necti<strong>on</strong> with his prior service as a member of our<br />
Management Board, which are scheduled to be delivered to him in August <strong>20</strong>10.<br />
The German law <strong>on</strong> directors’ dealings (Secti<strong>on</strong> 15a of the German Securities Trading Act (Wertpapierhandelsgesetz)<br />
requires pers<strong>on</strong>s discharging managerial resp<strong>on</strong>sibilities within an issuer of financial instruments,<br />
and pers<strong>on</strong>s closely associated with them, to disclose their pers<strong>on</strong>al transacti<strong>on</strong>s in shares of such<br />
issuer and financial instruments based <strong>on</strong> them, especially derivatives, to the issuer and to the BaFin.<br />
In accordance with German law, we disclose directors’ dealings in our shares and financial instruments based<br />
<strong>on</strong> them through the media prescribed by German law and through the Company Register (Unternehmensregister).<br />
Employee Share Programs<br />
For a descripti<strong>on</strong> of our employee share programs, please refer to Note [31] to the c<strong>on</strong>solidated financial<br />
statements.<br />
117<br />
Number of<br />
share awards<br />
Wolfgang Böhr <strong>20</strong> –<br />
Dr. Clemens Börsig1 129,367 5,322<br />
Dr. Karl-Gerhard Eick – –<br />
Heidrun Förster 905 –<br />
Alfred Herling 777 –<br />
Gerd Herzberg – –<br />
Sir Peter Job 4,000 –<br />
Prof. Dr. Henning Kagermann – –<br />
Martina Klee 378 –<br />
Suzanne Labarge – –<br />
Maurice Lévy – –<br />
Henriette Mark 388 –<br />
Gabriele Platscher 739 –<br />
Karin Ruck 110 –<br />
Dr. Theo Siegert – –<br />
Dr. Johannes Teyssen – –<br />
Marlehn Thieme 109 –<br />
Tilman Todenhöfer 300 –<br />
Werner Wenning – –<br />
Leo Wunderlich 722 –<br />
Total 137,815 5,322
<strong>20</strong>-F Item 7: Major Shareholders and Related Party Transacti<strong>on</strong>s<br />
Item 7: Major Shareholders and<br />
Related Party Transacti<strong>on</strong>s<br />
Major Shareholders<br />
On December 31, <str<strong>on</strong>g><strong>20</strong>09</str<strong>on</strong>g>, our issued share capital amounted to € 1,589,399,078 divided into 6<strong>20</strong>,859,015<br />
no par value ordinary registered shares.<br />
On December 31, <str<strong>on</strong>g><strong>20</strong>09</str<strong>on</strong>g>, we had 586,295 registered shareholders. The majority of our shareholders are retail<br />
investors in Germany.<br />
The following charts show the distributi<strong>on</strong> of our share capital and the compositi<strong>on</strong> of our shareholders <strong>on</strong><br />
December 31, <str<strong>on</strong>g><strong>20</strong>09</str<strong>on</strong>g>.<br />
BY VALUE OF SHAREHOLDING<br />
Other instituti<strong>on</strong>al investors and companies 66 %<br />
Insurance companies, investment companies 7 %<br />
Other private pers<strong>on</strong>s 17 %<br />
Wage and salary earners, pensi<strong>on</strong>ers* 10 %<br />
* Including <strong>Deutsche</strong> <strong>Bank</strong> employees and pensi<strong>on</strong>ers<br />
On February 26, <strong>20</strong>10, a total of 93,025,246 of our shares were registered in the names of 1,500 sharehold-<br />
ers resident in the United States. These shares represented 14.98 % of our share capital <strong>on</strong> that date. On<br />
December 31, <strong>20</strong>08, a total of 64,415,069 of our shares were registered in the names of 1,572 shareholders<br />
resident in the United States. These shares represented 11.28 % of our share capital <strong>on</strong> that date.<br />
118<br />
BY NUMBERS OF SHAREHOLDERS<br />
Wage and salary earners, pensi<strong>on</strong>ers* 37 %<br />
Instituti<strong>on</strong>al investors 1 %<br />
Other private pers<strong>on</strong>s 62 %
The German Securities Trading Act (Wertpapierhandelsgesetz) requires investors in publicly-traded corporati<strong>on</strong>s<br />
whose investments reach certain thresholds to notify both the corporati<strong>on</strong> and the BaFin of such change<br />
within seven days. The minimum disclosure threshold is 3 % of the corporati<strong>on</strong>’s issued voting share capital.<br />
As of February 26, <strong>20</strong>10, we have been notified by the following investors that they hold 3 % or more of our<br />
shares: Credit Suisse Group, Zurich holds 3.86 % of our shares (via financial instruments), AXA S.A. Group,<br />
Paris holds 4.64 % of our shares and BlackRock, Inc., New York holds 5.05 % of our shares.<br />
We are neither directly nor indirectly owned nor c<strong>on</strong>trolled by any other corporati<strong>on</strong>, by any government or by<br />
any other natural or legal pers<strong>on</strong> severally or jointly.<br />
Pursuant to German law and our Articles of Associati<strong>on</strong>, to the extent that we may have major shareholders at<br />
any time, we may not give them different voting rights from any of our other shareholders.<br />
We are aware of no arrangements which may at a subsequent date result in a change in c<strong>on</strong>trol of our<br />
company.<br />
Related Party Transacti<strong>on</strong>s<br />
We have business relati<strong>on</strong>ships with a number of the companies in which we own significant equity interests.<br />
We also have business relati<strong>on</strong>ships with a number of companies where members of our Management Board<br />
also hold positi<strong>on</strong>s <strong>on</strong> boards of directors. Our business relati<strong>on</strong>ships with these companies cover many of<br />
the financial services we provide to our clients generally. For more detailed informati<strong>on</strong>, refer to Note [37] of<br />
the c<strong>on</strong>solidated financial statements.<br />
We believe that we c<strong>on</strong>duct all of our business with these companies <strong>on</strong> terms equivalent to those that would<br />
exist if we did not have equity holdings in them or management members in comm<strong>on</strong>, and that we have c<strong>on</strong>ducted<br />
business with these companies <strong>on</strong> that basis in <str<strong>on</strong>g><strong>20</strong>09</str<strong>on</strong>g> and prior years. N<strong>on</strong>e of these transacti<strong>on</strong>s is or<br />
was material to us.<br />
Am<strong>on</strong>g our business with related party companies in <str<strong>on</strong>g><strong>20</strong>09</str<strong>on</strong>g>, there have been and currently are loans, guarantees<br />
and commitments, which totaled € 1.0 billi<strong>on</strong> (including loans of € 0.9 billi<strong>on</strong>) as of January 31, <strong>20</strong>10. All<br />
these credit exposures<br />
— were made in the ordinary course of business,<br />
— were made <strong>on</strong> substantially the same terms, including interest rates and collateral, as those prevailing at<br />
the time for comparable transacti<strong>on</strong>s with other pers<strong>on</strong>s, and<br />
— did not involve more than the normal risk of collectability or present other unfavorable features compared<br />
to loans to n<strong>on</strong>related parties.<br />
119
<strong>20</strong>-F Item 7: Major Shareholders and Related Party Transacti<strong>on</strong>s<br />
We have not c<strong>on</strong>ducted material business with parties that fall outside of the definiti<strong>on</strong> of related parties, but<br />
with whom we or our related parties have a relati<strong>on</strong>ship that enables the parties to negotiate terms of material<br />
transacti<strong>on</strong>s that may not be available from other, more clearly independent, parties <strong>on</strong> an arm’s-length basis.<br />
Related Party N<strong>on</strong>accrual Loans<br />
In additi<strong>on</strong> to our other shareholdings, we hold acquired equity interests in some of our clients arising from<br />
our efforts to protect our then-outstanding lending exposures to them.<br />
As of December 31, <str<strong>on</strong>g><strong>20</strong>09</str<strong>on</strong>g>, we had a loan to a single related party, in which we held a participati<strong>on</strong> of 10 % or<br />
more of its voting rights, which was classified as n<strong>on</strong>accrual. As of January 31, <strong>20</strong>10, this exposure reflected<br />
a real estate financing loan of € 15 milli<strong>on</strong> with c<strong>on</strong>tractual interest of 6.27 % per annum, though interest ac-<br />
crual has ceased, and guarantees, bearing no interest, which were h<strong>on</strong>ored after the company filed for liquidati<strong>on</strong>.<br />
A loan loss allowance of € 15 milli<strong>on</strong> had been established in prior years covering the impairment loss.<br />
We also had loans to two related parties held as an at equity investment. As of January 31, <strong>20</strong>10, <strong>on</strong>e exposure<br />
reflected an uncollateralized loan of € 7 milli<strong>on</strong> with c<strong>on</strong>tractual interest of 12 % per annum, which has<br />
been set to n<strong>on</strong>accrual status. A loan loss allowance of € 4 milli<strong>on</strong> had been established in prior years covering<br />
the impairment loss. As of January 31, <strong>20</strong>10, the last exposure reflected an uncollateralized loan of<br />
€ 10 milli<strong>on</strong> with c<strong>on</strong>tractual interest of 8.8 % per annum, which has been set to n<strong>on</strong>accrual status. N<strong>on</strong>accrual<br />
loans to related parties which may exhibit more than normal risk of collectability or present other unfavorable<br />
features compared to performing loans increased by € 8 milli<strong>on</strong>, or 34 % to € 32 milli<strong>on</strong>, from January 31,<br />
<str<strong>on</strong>g><strong>20</strong>09</str<strong>on</strong>g>. The largest problem loan amount outstanding during the period from January 1, <str<strong>on</strong>g><strong>20</strong>09</str<strong>on</strong>g> to January 29, <strong>20</strong>10<br />
was € 73 milli<strong>on</strong>.<br />
We have not disclosed the names of the related party customers described above because we have c<strong>on</strong>cluded<br />
that such disclosure would violate applicable privacy laws, such as customer c<strong>on</strong>fidentiality and data<br />
protecti<strong>on</strong> laws, and those customers have not waived applicati<strong>on</strong> of these privacy laws. A legal opini<strong>on</strong><br />
regarding the applicable privacy laws is filed as Exhibit 14.1 hereto.<br />
Interests of Experts and Counsel<br />
Not required because this document is filed as an annual report.<br />
1<strong>20</strong>
Item 8: Financial Informati<strong>on</strong><br />
C<strong>on</strong>solidated Statements and Other Financial Informati<strong>on</strong><br />
C<strong>on</strong>solidated Financial Statements<br />
See “Item 18: Financial Statements” and our c<strong>on</strong>solidated financial statements beginning <strong>on</strong> page F-5.<br />
Legal Proceedings<br />
General. Due to the nature of our business, we and our subsidiaries are involved in litigati<strong>on</strong>, arbitrati<strong>on</strong> and<br />
regulatory proceedings in jurisdicti<strong>on</strong>s around the world, arising in the ordinary course of our businesses.<br />
Please refer to Note [27] for descripti<strong>on</strong>s of pending legal proceedings that are material as defined in IAS 37,<br />
“Provisi<strong>on</strong>s, C<strong>on</strong>tingent Liabilities and C<strong>on</strong>tingent Assets”. Additi<strong>on</strong>al legal proceedings that may have, or<br />
have had in the recent past, significant effects <strong>on</strong> our financial positi<strong>on</strong> or profitability but are not required to<br />
be described in the notes to our financial statements pursuant to IAS 37 are described below.<br />
IPO allocati<strong>on</strong> litigati<strong>on</strong>. <strong>Deutsche</strong> <strong>Bank</strong> Securities Inc. (“DBSI”), our U.S. broker-dealer subsidiary, and its<br />
predecessor firms, al<strong>on</strong>g with numerous other securities firms, have been named as defendants in over 80<br />
putative class acti<strong>on</strong> lawsuits pending in the United States District Court for the Southern District of New York.<br />
These lawsuits allege violati<strong>on</strong>s of securities and antitrust laws in c<strong>on</strong>necti<strong>on</strong> with the allocati<strong>on</strong> of shares in a<br />
large number of initial public offerings (“IPOs”) by issuers, officers and directors of issuers, and underwriters<br />
of those securities. DBSI is named in these suits as an underwriter. The securities cases allege material misstatements<br />
and omissi<strong>on</strong>s in registrati<strong>on</strong> statements and prospectuses for the IPOs and market manipulati<strong>on</strong><br />
with respect to aftermarket trading in the IPO securities. A related putative antitrust class acti<strong>on</strong> was finally<br />
dismissed in <strong>20</strong>07. Am<strong>on</strong>g the allegati<strong>on</strong>s in the securities cases are that the underwriters tied the receipt of<br />
allocati<strong>on</strong>s of IPO shares to required aftermarket purchases by customers and to the payment of undisclosed<br />
compensati<strong>on</strong> to the underwriters in the form of commissi<strong>on</strong>s <strong>on</strong> securities trades, and that the underwriters<br />
caused misleading analyst reports to be issued. In the securities cases, the moti<strong>on</strong>s to dismiss the complaints<br />
of DBSI and others were denied <strong>on</strong> February 13, <strong>20</strong>03. Plaintiffs’ moti<strong>on</strong> to certify six “test” cases as class<br />
acti<strong>on</strong>s in the securities cases was granted <strong>on</strong> October 13, <strong>20</strong>04. On December 5, <strong>20</strong>06, the U.S. Court of<br />
Appeals for the Sec<strong>on</strong>d Circuit vacated the decisi<strong>on</strong> and held that the classes in the six cases, as defined,<br />
could not be certified. On March 26, <strong>20</strong>08, the trial court granted in part and denied in part moti<strong>on</strong>s to dismiss<br />
plaintiffs' amended complaints. The extent to which the court granted the moti<strong>on</strong>s did not affect any cases in<br />
which DBSI is a defendant. Following mediati<strong>on</strong>, a settlement was reached and approved by the trial court <strong>on</strong><br />
October 6, <str<strong>on</strong>g><strong>20</strong>09</str<strong>on</strong>g>. On October 23, <str<strong>on</strong>g><strong>20</strong>09</str<strong>on</strong>g>, an objector filed a petiti<strong>on</strong> with the Sec<strong>on</strong>d Circuit, seeking leave to<br />
appeal the trial court’s certificati<strong>on</strong> of the settlement class in c<strong>on</strong>necti<strong>on</strong> with all 310 cases, including the<br />
cases in which DBSI was named as a defendant. The plaintiffs objected, and all the underwriter defendants<br />
resp<strong>on</strong>ded, to the petiti<strong>on</strong> <strong>on</strong> November 2, <str<strong>on</strong>g><strong>20</strong>09</str<strong>on</strong>g>. The petiti<strong>on</strong> is currently pending before the Sec<strong>on</strong>d Circuit.<br />
Parmalat litigati<strong>on</strong>. Following the bankruptcy of the Italian company Parmalat, the Special Administrator of<br />
Parmalat, Mr. Enrico B<strong>on</strong>di, sued <strong>Deutsche</strong> <strong>Bank</strong> for damages totaling € 2.2 billi<strong>on</strong> and brought claw-back<br />
acti<strong>on</strong>s against <strong>Deutsche</strong> <strong>Bank</strong> S.p.A. for a total of € 177 milli<strong>on</strong>. <strong>Deutsche</strong> <strong>Bank</strong>, <strong>Deutsche</strong> <strong>Bank</strong> S.p.A.,<br />
Parmalat and Mr. B<strong>on</strong>di (<strong>on</strong> behalf of their respective groups) agreed a settlement of all of these acti<strong>on</strong>s in<br />
February <str<strong>on</strong>g><strong>20</strong>09</str<strong>on</strong>g>.<br />
In additi<strong>on</strong>, following the Parmalat insolvency, the prosecutors in Milan c<strong>on</strong>ducted a criminal investigati<strong>on</strong><br />
which led to criminal indictments <strong>on</strong> charges of alleged market manipulati<strong>on</strong> against various banks, including<br />
121
<strong>20</strong>-F Item 8: Financial Informati<strong>on</strong><br />
<strong>Deutsche</strong> <strong>Bank</strong> and <strong>Deutsche</strong> <strong>Bank</strong> S.p.A., and some of their employees. Trial before the Court of Milan<br />
(Sec<strong>on</strong>d Criminal Secti<strong>on</strong>) commenced in January <strong>20</strong>08 and is <strong>on</strong>going. Prosecutors in Parma have c<strong>on</strong>ducted<br />
a criminal investigati<strong>on</strong> against various bank employees, including employees of <strong>Deutsche</strong> <strong>Bank</strong>, <strong>on</strong><br />
charges of fraudulent bankruptcy. The trial commenced in September <str<strong>on</strong>g><strong>20</strong>09</str<strong>on</strong>g> and is <strong>on</strong>going. One former<br />
<strong>Deutsche</strong> <strong>Bank</strong> employee entered into a plea bargain in respect of the charges against him in Milan and Parma<br />
(most of which related to the period prior to his employment with us) which have accordingly been withdrawn.<br />
Certain retail b<strong>on</strong>dholders and shareholders have alleged civil liability against <strong>Deutsche</strong> <strong>Bank</strong> in c<strong>on</strong>necti<strong>on</strong><br />
with the above-menti<strong>on</strong>ed criminal proceedings. <strong>Deutsche</strong> <strong>Bank</strong> has made a formal settlement offer to those<br />
retail investors who have asserted claims against <strong>Deutsche</strong> <strong>Bank</strong>. This offer has been accepted by some of<br />
the retail investors.<br />
Huntsman. On June 23, <str<strong>on</strong>g><strong>20</strong>09</str<strong>on</strong>g>, DBSI and Credit Suisse Securities (USA) LLC (“CSUSA”) settled a lawsuit that<br />
had been brought against them by Huntsman Corporati<strong>on</strong> (“Huntsman”) in Texas state court in late <strong>20</strong>08. The<br />
lawsuit arose out of the failed merger of Hexi<strong>on</strong> Specialty Chemicals, Inc. (“Hexi<strong>on</strong>”) and Huntsman, the<br />
financing for which was to have been provided by affiliates of DBSI and CSUSA under a July <strong>20</strong>07 commitment<br />
letter. The suit alleged, am<strong>on</strong>g other things, that DBSI and CSUSA had fraudulently induced Huntsman to<br />
terminate a prior merger agreement with Basell in favor of the Hexi<strong>on</strong> merger agreement and had tortiously<br />
interfered with Huntsman’s merger agreements with both Basell and Hexi<strong>on</strong>. The suit also alleged that DBSI<br />
and CSUSA had c<strong>on</strong>spired with n<strong>on</strong>-party Apollo Management LLP to interfere with Huntsman’s c<strong>on</strong>tractual<br />
rights. After the trial commenced <strong>on</strong> June 15, <str<strong>on</strong>g><strong>20</strong>09</str<strong>on</strong>g>, the parties settled the acti<strong>on</strong>. As part of the settlement,<br />
each of DBSI and CSUSA paid U.S.$ 316 milli<strong>on</strong> in cash to Huntsman and provided U.S.$ 550 milli<strong>on</strong> of<br />
financing to be repaid over seven years.<br />
Sebastian Holdings. <strong>Deutsche</strong> <strong>Bank</strong> AG is in litigati<strong>on</strong> in the United Kingdom and the United States with Sebastian<br />
Holdings Inc., a Turks and Caicos company (“SHI”). The dispute arose in October <strong>20</strong>08 when SHI<br />
accumulated trading losses and subsequently failed to meet margin calls issued by <strong>Deutsche</strong> <strong>Bank</strong> AG. The<br />
U.K. acti<strong>on</strong> is brought by <strong>Deutsche</strong> <strong>Bank</strong> AG to recover approximately U.S.$ 230 milli<strong>on</strong> owed by SHI after<br />
<strong>Deutsche</strong> <strong>Bank</strong> AG closed out two sets of master trading agreements with SHI. <strong>Deutsche</strong> <strong>Bank</strong> AG has also<br />
commenced a related restituti<strong>on</strong>ary acti<strong>on</strong> in the U.K. against Alexander M. Vik, the sole director of SHI, and<br />
Vik Millahue, a Chilean company, seeking repayment to <strong>Deutsche</strong> <strong>Bank</strong> AG of certain funds transferred from<br />
SHI’s accounts with <strong>Deutsche</strong> <strong>Bank</strong> AG. The U.S. acti<strong>on</strong> is a damages claim brought by SHI against <strong>Deutsche</strong><br />
<strong>Bank</strong> AG in New York State court, arising out of the same circumstances as <strong>Deutsche</strong> <strong>Bank</strong> AG’s suit against<br />
SHI in the U.K. and seeking damages of at least U.S.$ 750 milli<strong>on</strong>. In the U.K. acti<strong>on</strong> against SHI, the trial<br />
court held that it has jurisdicti<strong>on</strong> over <strong>Deutsche</strong> <strong>Bank</strong> AG’s suit and rejected SHI’s claim that the U.K. is an<br />
inc<strong>on</strong>venient forum for the case to be heard. SHI is appealing from those determinati<strong>on</strong>s. The U.K. acti<strong>on</strong><br />
against Vik and the Chilean company is in its early stages. In the U.S. acti<strong>on</strong> against <strong>Deutsche</strong> <strong>Bank</strong> AG, the<br />
trial court denied SHI’s request to enjoin <strong>Deutsche</strong> <strong>Bank</strong> AG’s suits in the U.K. The trial court denied<br />
<strong>Deutsche</strong> <strong>Bank</strong> AG’s moti<strong>on</strong> to dismiss or stay the U.S. acti<strong>on</strong> in favor of the L<strong>on</strong>d<strong>on</strong> acti<strong>on</strong>, while granting<br />
<strong>Deutsche</strong> <strong>Bank</strong> AG’s moti<strong>on</strong> to dismiss SHI’s tort claims but not its c<strong>on</strong>tract and quasi-c<strong>on</strong>tractual claims. SHI<br />
has moved for reargument of the trial court’s decisi<strong>on</strong>, and both parties have filed notices of appeal with the<br />
New York Appellate Divisi<strong>on</strong>.<br />
122
Ocala. <strong>Deutsche</strong> <strong>Bank</strong> AG is a secured creditor of Ocala Funding LLC (“Ocala”), a commercial paper vehicle<br />
sp<strong>on</strong>sored by Taylor Bean & Whitaker Mortgage Corp., which ceased mortgage lending operati<strong>on</strong>s and filed<br />
for bankruptcy protecti<strong>on</strong> in August <str<strong>on</strong>g><strong>20</strong>09</str<strong>on</strong>g>. <strong>Bank</strong> of America is the trustee, collateral agent, custodian and depository<br />
agent for Ocala. <strong>Deutsche</strong> <strong>Bank</strong> AG has commenced a civil litigati<strong>on</strong> in the United States District<br />
Court for the Southern District of New York against <strong>Bank</strong> of America for breach of c<strong>on</strong>tract and for c<strong>on</strong>tractual<br />
indemnity resulting from <strong>Bank</strong> of America’s failure to secure and safeguard cash and mortgage loans that<br />
secured <strong>Deutsche</strong> <strong>Bank</strong> AG’s commercial paper investment. The litigati<strong>on</strong> is in its early stages.<br />
Adelphia Communicati<strong>on</strong>s Corporati<strong>on</strong>. Certain of <strong>Deutsche</strong> <strong>Bank</strong> AG’s affiliates are am<strong>on</strong>g numerous finan-<br />
cial instituti<strong>on</strong>s and other entities that were named as defendants in two adversary proceedings commenced<br />
in <strong>20</strong>03 by a creditors committee and an equity committee of Adelphia Communicati<strong>on</strong>s Corporati<strong>on</strong>. In October<br />
<strong>20</strong>07, the Adelphia Recovery Trust filed an amended complaint c<strong>on</strong>solidating the two adversary proceedings,<br />
which was amended again in February <strong>20</strong>08. The c<strong>on</strong>solidated suit sought to avoid and recover certain<br />
loan payments, including approximately U.S.$ 50 milli<strong>on</strong> allegedly paid to DBSI in c<strong>on</strong>necti<strong>on</strong> with margin<br />
loans, and sought affirmative damages from defendants collectively based <strong>on</strong> statutory claims and comm<strong>on</strong><br />
law tort claims. The bank defendants filed several moti<strong>on</strong>s to dismiss the c<strong>on</strong>solidated complaint, which were<br />
granted in part and denied in part, and certain of those rulings are the subject of a pending appeal and various<br />
moti<strong>on</strong>s. The claims that remain pending in the district court include a <strong>Bank</strong> Holding Company Act claim,<br />
comm<strong>on</strong> law tort claims, and an avoidance claim relating to the margin loans. Summary judgment moti<strong>on</strong>s are<br />
being filed, and a trial date has been set for September <strong>20</strong>10.<br />
Dividend Policy<br />
We generally pay dividends each year. However, we may not pay dividends in the future at rates we have<br />
paid them in previous years. In particular, the dividend proposed for <str<strong>on</strong>g><strong>20</strong>09</str<strong>on</strong>g> is € 0.75, compared to dividends<br />
paid of € 0.50 for <strong>20</strong>08 and € 4.50 for <strong>20</strong>07. If we are not profitable, we may not pay dividends at all. If we fail<br />
to meet the capital adequacy requirements or the liquidity requirements under the <strong>Bank</strong>ing Act, the BaFin may<br />
suspend or limit the payment of dividends. See “Item 4: Informati<strong>on</strong> <strong>on</strong> the Company – Regulati<strong>on</strong> and Supervisi<strong>on</strong><br />
– Regulati<strong>on</strong> and Supervisi<strong>on</strong> in Germany”.<br />
Under German law, our dividends are based <strong>on</strong> the unc<strong>on</strong>solidated results of <strong>Deutsche</strong> <strong>Bank</strong> AG as prepared<br />
in accordance with German accounting rules. Our Management Board, which prepares the annual financial<br />
statements of <strong>Deutsche</strong> <strong>Bank</strong> AG <strong>on</strong> an unc<strong>on</strong>solidated basis, and our Supervisory Board, which reviews<br />
them, first allocate part of <strong>Deutsche</strong> <strong>Bank</strong>’s annual surplus (if any) to our statutory reserves and to any losses<br />
carried forward, as it is legally required to do. For treasury shares a reserve in the amount of their value<br />
recorded <strong>on</strong> the asset side must be set up from the annual surplus or from other revenue reserves. They then<br />
allocate the remainder between other revenue reserves (or retained earnings) and balance sheet profit (or<br />
distributable profit). They may allocate up to <strong>on</strong>e-half of this remainder to other revenue reserves, and must<br />
allocate at least <strong>on</strong>e-half to balance sheet profit. We then distribute the full amount of the balance sheet profit<br />
of <strong>Deutsche</strong> <strong>Bank</strong> AG if the <str<strong>on</strong>g>Annual</str<strong>on</strong>g> General Meeting so resolves. The <str<strong>on</strong>g>Annual</str<strong>on</strong>g> General Meeting may resolve a<br />
n<strong>on</strong>-cash distributi<strong>on</strong> instead of or in additi<strong>on</strong> to a cash dividend. However, we are not legally required to<br />
distribute our balance sheet profit to our shareholders to the extent that we have issued participatory rights<br />
(Genussrechte) or granted a silent participati<strong>on</strong> (stille Gesellschaft) that accord their holders the right to a<br />
porti<strong>on</strong> of our distributable profit.<br />
123
<strong>20</strong>-F Item 8: Financial Informati<strong>on</strong><br />
Where the capital base of a bank is increased by issuing shares, hybrid capital or other instruments that qualify<br />
as own funds to the German Financial Market Stabilizati<strong>on</strong> Fund (referred to as the Fund), the Fund will<br />
generally, as a prec<strong>on</strong>diti<strong>on</strong> to subscribing for such issuances require that, to the extent legally possible, the<br />
bank does not pay dividends or make other profit distributi<strong>on</strong>s other than payments <strong>on</strong> the instruments held<br />
by the Fund. The Fund is a special fund (S<strong>on</strong>dervermögen) created by the German Financial Market Stabilizati<strong>on</strong><br />
Act in October <strong>20</strong>08 to acquire rights and incur obligati<strong>on</strong>s in its own name for which the Federal Republic<br />
of Germany is liable. The Federal Ministry of Finance determines whether the Fund will implement<br />
stabilizati<strong>on</strong> measures to support financial instituti<strong>on</strong>s in distress and which measures will be employed.<br />
We declare dividends by resoluti<strong>on</strong> of the <str<strong>on</strong>g>Annual</str<strong>on</strong>g> General Meeting and pay them <strong>on</strong>ce a year. Dividends approved<br />
at a General Meeting are payable <strong>on</strong> the first stock exchange trading day after that meeting, unless<br />
otherwise decided at that meeting. In accordance with the German Stock Corporati<strong>on</strong> Act, the record date for<br />
determining which holders of our ordinary shares are entitled to the payment of dividends, if any, or other<br />
distributi<strong>on</strong>s whether cash, stock or property, is the date of the General Meeting at which such dividends or<br />
other distributi<strong>on</strong>s are declared. If we issue a new class of shares, our Articles of Associati<strong>on</strong> permit us to<br />
declare a different dividend entitlement for the new class of shares.<br />
Significant Changes<br />
Except as otherwise stated in this document, there have been no significant changes subsequent to December<br />
31, <str<strong>on</strong>g><strong>20</strong>09</str<strong>on</strong>g>.<br />
124
Item 9: The Offer and Listing<br />
Offer and Listing Details<br />
Our share capital c<strong>on</strong>sists of ordinary shares issued in registered form without par value. Under German law,<br />
shares without par value are deemed to have a “nominal” value equal to the total amount of share capital<br />
divided by the number of shares. Our shares have a nominal value of € 2.56 per share.<br />
The principal trading market for our shares is the Frankfurt Stock Exchange. We maintain a share register in<br />
Frankfurt am Main and, for the purposes of trading our shares <strong>on</strong> the New York Stock Exchange, a share<br />
register in New York.<br />
All shares <strong>on</strong> German stock exchanges trade in euro. The following table sets forth, for the calendar periods<br />
indicated, high, low and period-end prices and average daily trading volumes for our shares as reported by<br />
the Frankfurt Stock Exchange and the high, low and period-end quotati<strong>on</strong> for the DAX® (<strong>Deutsche</strong>r Aktienindex)<br />
index, the principal German share index. All quotati<strong>on</strong>s are based <strong>on</strong> intraday prices. The DAX is a<br />
c<strong>on</strong>tinuously updated, capital-weighted performance index of 30 major German companies. The DAX includes<br />
shares selected <strong>on</strong> the basis of stock exchange turnover and market capitalizati<strong>on</strong>. Adjustments to the DAX<br />
are made for capital changes, subscripti<strong>on</strong> rights and dividends, as well as for changes in the available<br />
free float.<br />
Our shares DAX ® -Index<br />
Price per share Average daily<br />
High<br />
(in €)<br />
Low<br />
(in €)<br />
Period-end<br />
(in €)<br />
trading volume<br />
(in thousands of<br />
shares)<br />
High Low Period-end<br />
M<strong>on</strong>thly <strong>20</strong>10:<br />
February 48.17 42.31 46.64 7,443.06 5,743.89 5,433.02 5,598.46<br />
January<br />
M<strong>on</strong>thly <str<strong>on</strong>g><strong>20</strong>09</str<strong>on</strong>g>:<br />
53.90 43.05 44.38 6,894.99 6,094.26 5,540.33 5,608.79<br />
December 52.24 46.87 49.42 4,729.19 6,026.69 5,605,43 5,957.43<br />
November 52.68 45.30 48.06 4,862.47 5,843.27 5,312.64 5,625.95<br />
October 58.29 45.98 49.56 5,988.35 5,888.21 5,394.80 5,414.96<br />
September<br />
Quarterly <str<strong>on</strong>g><strong>20</strong>09</str<strong>on</strong>g>:<br />
53.94 45.22 52.45 5,533.85 5,760.83 5,263.11 5,675.16<br />
Fourth Quarter 58.29 45.30 49.42 5,213.32 6,026.69 5,312.64 5,957,43<br />
Third Quarter 53.94 41.04 52.45 5,906.13 5,760.83 4,524.01 5,675.16<br />
Sec<strong>on</strong>d Quarter 49.62 29.37 43.<strong>20</strong> 8,041.41 5,177.59 3,997.46 4,808.64<br />
First Quarter<br />
Quarterly <strong>20</strong>08:<br />
32.92 15.38 30.30 11,351.<strong>20</strong> 5,111.02 3,588.89 4,084.76<br />
Fourth Quarter 54.32 18.59 27.83 11,141.50 5,876.93 4,014.60 4,810.<strong>20</strong><br />
Third Quarter 64.85 47.48 49.54 9,873.37 6,626.70 5,658.<strong>20</strong> 5,831.02<br />
Sec<strong>on</strong>d Quarter 79.<strong>20</strong> 54.32 54.85 5,872.59 7,231.86 6,308.24 6,418.32<br />
First Quarter 89.80 64.62 71.70 8,806.70 8,100.64 6,167.82 6,534.97<br />
<str<strong>on</strong>g>Annual</str<strong>on</strong>g>:<br />
<str<strong>on</strong>g><strong>20</strong>09</str<strong>on</strong>g> 58.29 15.38 49.42 7,606.05 6,026.69 3,588.89 5,957.43<br />
<strong>20</strong>08 89.80 18.59 27.83 9,116.66 8,100.64 4,014.60 4,810.<strong>20</strong><br />
<strong>20</strong>07 118.51 81.33 89.40 6,062.94 8,151.57 6,437.25 8,067.32<br />
<strong>20</strong>06 103.29 80.74 101.34 4,195.14 6,629.33 5,243.71 6,596.92<br />
<strong>20</strong>05 85.00 60.90 81.90 3,709.96 5,469.96 4,157.51 5,408.26<br />
Note: Data is based <strong>on</strong> Thoms<strong>on</strong> Reuters and Bloomberg.<br />
125
<strong>20</strong>-F Item 9: The Offer and Listing<br />
On February 26, <strong>20</strong>10, the closing quotati<strong>on</strong> of our shares <strong>on</strong> the Frankfurt Stock Exchange within the Xetra<br />
system (which we describe below) was € 46.64 per share and the closing quotati<strong>on</strong> of the DAX index was<br />
5,598.46. Our shares represented 5.8 % of the DAX index <strong>on</strong> that date.<br />
Our shares also trade <strong>on</strong> the New York Stock Exchange, trading under the symbol “DB”. The following table<br />
shows, for the periods indicated, high, low and period-end prices and average daily trading volumes for our<br />
shares as reported by the New York Stock Exchange.<br />
M<strong>on</strong>thly <strong>20</strong>10:<br />
For a discussi<strong>on</strong> of the possible effects of fluctuati<strong>on</strong>s in the exchange rate between the euro and the<br />
U.S. dollar <strong>on</strong> the price of our shares, see “Item 3: Key Informati<strong>on</strong> – Exchange Rate and Currency Informa-<br />
ti<strong>on</strong>.”<br />
You should not rely <strong>on</strong> our past share performance as a guide to our future share performance.<br />
Plan of Distributi<strong>on</strong><br />
High<br />
(in U.S.$)<br />
Not required because this document is filed as an annual report.<br />
126<br />
Low<br />
(in U.S.$)<br />
Our shares<br />
Price per share Average daily<br />
Period-end<br />
(in U.S.$)<br />
trading volume<br />
(in number of<br />
shares)<br />
February 65.84 57.78 63.50 534,067<br />
January 77.76 60.64 60.97 362,350<br />
M<strong>on</strong>thly <str<strong>on</strong>g><strong>20</strong>09</str<strong>on</strong>g>:<br />
December 76.14 68.94 70.91 239,362<br />
November 78.23 69.21 73.10 251,908<br />
October 84.93 70.54 71.63 310,106<br />
September 80.00 63.95 76.77 400,715<br />
Quarterly <str<strong>on</strong>g><strong>20</strong>09</str<strong>on</strong>g>:<br />
Fourth Quarter 84.93 68.94 70.91 267,601<br />
Third Quarter 80.00 56.74 76.77 455,538<br />
Sec<strong>on</strong>d Quarter 70.37 39.86 61.00 1,215,497<br />
First Quarter 44.80 21.15 40.65 1,242,596<br />
Quarterly <strong>20</strong>08:<br />
Fourth Quarter 75.25 22.45 40.69 743,491<br />
Third Quarter 97.27 66.43 72.79 670,363<br />
Sec<strong>on</strong>d Quarter 122.98 85.35 85.35 246,953<br />
First Quarter 130.79 102.41 113.05 467,<strong>20</strong>8<br />
<str<strong>on</strong>g>Annual</str<strong>on</strong>g>:<br />
<str<strong>on</strong>g><strong>20</strong>09</str<strong>on</strong>g> 84.93 21.15 70.91 788,316<br />
<strong>20</strong>08 130.79 22.45 40.69 532,772<br />
<strong>20</strong>07 159.73 1<strong>20</strong>.02 129.41 227,769<br />
<strong>20</strong>06 134.71 97.18 133.24 119,515<br />
<strong>20</strong>05 100.41 76.16 96.87 93,537
Markets<br />
As described above, the principal trading market for our shares is the Frankfurt Stock Exchange. Our shares<br />
are also traded <strong>on</strong> the New York Stock Exchange and <strong>on</strong> the six other German stock exchanges (Berlin,<br />
Düsseldorf, Hamburg, Hannover, Munich and Stuttgart).<br />
Frankfurt Stock Exchange<br />
<strong>Deutsche</strong> Börse AG operates the Frankfurt Stock Exchange, the most significant of the seven German stock<br />
exchanges. The Frankfurt Stock Exchange, including Xetra (as described below), accounted for more than<br />
96.30 % of the total turnover in exchange-traded shares in Germany in <str<strong>on</strong>g><strong>20</strong>09</str<strong>on</strong>g> (including 92.85 % of the total<br />
turnover which is accounted for by Xetra in <str<strong>on</strong>g><strong>20</strong>09</str<strong>on</strong>g>). According to the World Federati<strong>on</strong> of Exchanges, <strong>Deutsche</strong><br />
Börse AG was the seventh largest stock exchange in the world in <str<strong>on</strong>g><strong>20</strong>09</str<strong>on</strong>g> measured by total value of share trading,<br />
after NASDAQ, the NYSE Eur<strong>on</strong>ext (U.S.), Shanghai, Tokyo, L<strong>on</strong>d<strong>on</strong> and Shenzhen.<br />
As of December 31, <str<strong>on</strong>g><strong>20</strong>09</str<strong>on</strong>g>, the shares of 10,266 companies traded <strong>on</strong> the various market segments of the<br />
Frankfurt Stock Exchange. Of these, 1,017 were German companies and 9,249 were n<strong>on</strong>-German companies.<br />
The prices of actively-traded securities, including our shares, are c<strong>on</strong>tinuously quoted <strong>on</strong> the Frankfurt Stock<br />
Exchange trading floor between 9:00 a.m. and 8:00 p.m., Central European time, each bank business day.<br />
Most securities listed <strong>on</strong> the Frankfurt Stock Exchange are traded <strong>on</strong> the aucti<strong>on</strong> market. Securities also trade<br />
in interbank dealer markets, both <strong>on</strong> and off the Frankfurt Stock Exchange. The price of securities <strong>on</strong> the<br />
Frankfurt Stock Exchange is determined by open outcry and noted by publicly commissi<strong>on</strong>ed stockbrokers.<br />
These publicly commissi<strong>on</strong>ed stockbrokers are members of the exchange but do not, as a rule, deal with the<br />
public.<br />
The Frankfurt Stock Exchange publishes a daily official list of its quotati<strong>on</strong>s (Amtliches Kursblatt) for all traded<br />
securities. The list is available <strong>on</strong> the Internet at http://www.deutsche-boerse.com under the heading: “Market<br />
Data & Analytics – Trading Statistics + Analyses – Spot Market Statistic – Order Book Statistics”.<br />
Our shares trade <strong>on</strong> Xetra (Exchange Electr<strong>on</strong>ic Trading) in additi<strong>on</strong> to trading <strong>on</strong> the aucti<strong>on</strong> market. Xetra is<br />
an electr<strong>on</strong>ic exchange trading platform operated by <strong>Deutsche</strong> Börse AG. Xetra is integrated into the Frankfurt<br />
Stock Exchange and is subject to its rules and regulati<strong>on</strong>s. Xetra trading takes place from 9:00 a.m. until<br />
5:30 p.m. Central European time, each bank business day by brokers and banks that have been admitted to<br />
Xetra by the Frankfurt Stock Exchange. Private investors are permitted to trade <strong>on</strong> Xetra through their banks<br />
or brokers.<br />
Transacti<strong>on</strong>s <strong>on</strong> the Frankfurt Stock Exchange (including transacti<strong>on</strong>s through the Xetra system) are settled<br />
<strong>on</strong> the sec<strong>on</strong>d business day following the transacti<strong>on</strong>. Transacti<strong>on</strong>s off the Frankfurt Stock Exchange are also<br />
generally settled <strong>on</strong> the sec<strong>on</strong>d business day following the transacti<strong>on</strong>, although parties may agree <strong>on</strong> a dif-<br />
ferent settlement time. Transacti<strong>on</strong>s off the Frankfurt Stock Exchange may occur in the case of large trades or<br />
if <strong>on</strong>e of the parties is not German. The standard terms and c<strong>on</strong>diti<strong>on</strong>s under which German banks generally<br />
c<strong>on</strong>duct their business with customers require the banks to execute customer buy and sell orders for listed<br />
securities <strong>on</strong> a stock exchange unless the customer specifies otherwise.<br />
127
<strong>20</strong>-F Item 9: The Offer and Listing<br />
The Frankfurt Stock Exchange can suspend trading if orderly trading is temporarily endangered or if necessary<br />
to protect the public interest. The BaFin m<strong>on</strong>itors trading activities <strong>on</strong> the Frankfurt Stock Exchange and<br />
the other German stock exchanges.<br />
Selling Shareholders<br />
Not required because this document is filed as an annual report.<br />
Diluti<strong>on</strong><br />
Not required because this document is filed as an annual report.<br />
Expenses of the Issue<br />
Not required because this document is filed as an annual report.<br />
128
Item 10: Additi<strong>on</strong>al Informati<strong>on</strong><br />
Share Capital<br />
Not required because this document is filed as an annual report.<br />
Memorandum and Articles of Associati<strong>on</strong><br />
For informati<strong>on</strong> regarding our Articles of Associati<strong>on</strong>, please refer to the discussi<strong>on</strong> under the corresp<strong>on</strong>ding<br />
secti<strong>on</strong> of our <str<strong>on</strong>g>Annual</str<strong>on</strong>g> <str<strong>on</strong>g>Report</str<strong>on</strong>g> <strong>on</strong> <strong>Form</strong> <strong>20</strong>-F for the year ended December 31, <strong>20</strong>08, which discussi<strong>on</strong> we hereby<br />
incorporate by reference into this document. In c<strong>on</strong>sidering such discussi<strong>on</strong>, please note that the authorizati<strong>on</strong><br />
to increase share capital under the German Financial Market Stabilizati<strong>on</strong> Act of <strong>20</strong>08 is effective<br />
through December 31, <strong>20</strong>10 and the amendment to the German Foreign Trade Act providing for review of<br />
acquisiti<strong>on</strong>s of 25 % or more of the voting rights in a German company became effective in <str<strong>on</strong>g><strong>20</strong>09</str<strong>on</strong>g>. Copies<br />
of our Articles of Associati<strong>on</strong> are publicly available at the Commercial Register in Frankfurt am Main, and an<br />
English translati<strong>on</strong> is filed as Exhibit 1.1 to this <str<strong>on</strong>g>Annual</str<strong>on</strong>g> <str<strong>on</strong>g>Report</str<strong>on</strong>g>. For more informati<strong>on</strong> <strong>on</strong> provisi<strong>on</strong>s of our<br />
Articles of Associati<strong>on</strong> relating to our Supervisory Board and Management Board, see “Item 6: Directors, Senior<br />
Management and Employees.” For a summary of our dividend policy and legal basis for dividends under<br />
German law, see “Item 8: Financial Informati<strong>on</strong> – Dividend Policy.”<br />
Material C<strong>on</strong>tracts<br />
In the usual course of our business, we enter into numerous c<strong>on</strong>tracts with various other entities. We have<br />
not, however, entered into any material c<strong>on</strong>tracts outside the ordinary course of our business within the past<br />
two years.<br />
Exchange C<strong>on</strong>trols<br />
As in other member states of the European Uni<strong>on</strong>, regulati<strong>on</strong>s issued by the competent European Uni<strong>on</strong> authorities<br />
to comply with United Nati<strong>on</strong>s Resoluti<strong>on</strong>s have caused freeze orders <strong>on</strong> assets of certain legal and<br />
natural pers<strong>on</strong>s designated in such regulati<strong>on</strong>s. Currently, these European Uni<strong>on</strong> regulati<strong>on</strong>s relate to pers<strong>on</strong>s<br />
of or in Myanmar (Burma), Côte d’Ivoire, the Democratic Republic of C<strong>on</strong>go (Zaire), Guinea, Iran, Iraq,<br />
Liberia, North Korea, Somalia, Sudan and Zimbabwe, as well as pers<strong>on</strong>s associated with terrorism, the Taliban,<br />
Slobodan Milosevic, the deceased former president of Serbia and Yugoslavia, and other pers<strong>on</strong>s indicted<br />
by the Internati<strong>on</strong>al Criminal Tribunal for the former Yugoslavia, and President Alexander Lukashenko<br />
and certain other officials of Belarus.<br />
With some excepti<strong>on</strong>s, corporati<strong>on</strong>s or individuals residing in Germany are required to report to the Bundes-<br />
bank any payment received from, or made to or for the account of, a n<strong>on</strong>resident corporati<strong>on</strong> or individual<br />
that exceeds € 12,500 (or the equivalent in a foreign currency). This reporting requirement is for statistical<br />
purposes.<br />
129
<strong>20</strong>-F Item 10: Additi<strong>on</strong>al Informati<strong>on</strong><br />
Subject to the above-menti<strong>on</strong>ed excepti<strong>on</strong>s, there are currently no German laws, decrees or regulati<strong>on</strong>s that<br />
would prevent the transfer of capital or remittance of dividends or other payments to our shareholders who<br />
are not residents or citizens of Germany.<br />
There are also no restricti<strong>on</strong>s under German law or our Articles of Associati<strong>on</strong> c<strong>on</strong>cerning the right of n<strong>on</strong>resident<br />
or foreign shareholders to hold our shares or to exercise any applicable voting rights. Where the<br />
investment reaches or exceeds certain thresholds, certain reporting obligati<strong>on</strong>s apply and the investment may<br />
become subject to review by the BaFin and other competent authorities. See “Item 10: Additi<strong>on</strong>al Informati<strong>on</strong><br />
– Memorandum and Articles of Associati<strong>on</strong> – Notificati<strong>on</strong> Requirements” in our <str<strong>on</strong>g>Annual</str<strong>on</strong>g> <str<strong>on</strong>g>Report</str<strong>on</strong>g> <strong>on</strong> <strong>Form</strong> <strong>20</strong>-F<br />
for the year ended December 31, <strong>20</strong>08.<br />
Taxati<strong>on</strong><br />
The following is a summary of the material German and United States federal income tax c<strong>on</strong>sequences of<br />
the ownership and dispositi<strong>on</strong> of shares for a resident of the United States for purposes of the income tax<br />
c<strong>on</strong>venti<strong>on</strong> between the United States and Germany (the “Treaty”) who is fully eligible for benefits under the<br />
Treaty. A U.S. resident will generally be entitled to Treaty benefits if it is:<br />
— the beneficial owner of shares (and of the dividends paid with respect to the shares);<br />
— an individual resident of the United States, a U.S. corporati<strong>on</strong>, or a partnership, estate or trust to the<br />
extent its income is subject to taxati<strong>on</strong> in the United States in its hands or in the hands of its partners or<br />
beneficiaries;<br />
— not also a resident of Germany for German tax purposes; and<br />
— not subject to “anti-treaty shopping” articles under German domestic law or the Treaty that apply in limited<br />
circumstances.<br />
The Treaty benefits discussed below generally are not available to shareholders who hold shares in c<strong>on</strong>necti<strong>on</strong><br />
with the c<strong>on</strong>duct of business through a permanent establishment, or the performance of pers<strong>on</strong>al services<br />
through a fixed base, in Germany. The summary does not discuss the treatment of those shareholders.<br />
The summary does not purport to be a comprehensive descripti<strong>on</strong> of all of the tax c<strong>on</strong>siderati<strong>on</strong>s that may be<br />
relevant to any particular shareholder, including tax c<strong>on</strong>siderati<strong>on</strong>s that arise from rules of general applicati<strong>on</strong><br />
or that are generally assumed to be known by shareholders. In particular, the summary deals <strong>on</strong>ly with shareholders<br />
that will hold shares as capital assets and does not address the tax treatment of shareholders that are<br />
subject to special rules, such as fiduciaries of pensi<strong>on</strong>, profit-sharing or other employee benefit plans, banks,<br />
insurance companies, dealers in securities or currencies, pers<strong>on</strong>s that hold shares as a positi<strong>on</strong> in a straddle,<br />
c<strong>on</strong>versi<strong>on</strong> transacti<strong>on</strong>, synthetic security or other integrated financial transacti<strong>on</strong>, pers<strong>on</strong>s that elect mark-tomarket<br />
treatment, pers<strong>on</strong>s that own, directly or indirectly, ten percent or more of our voting stock, pers<strong>on</strong>s that<br />
hold shares through a partnership and pers<strong>on</strong>s whose “functi<strong>on</strong>al currency” is not the U.S. dollar. The summary<br />
is based <strong>on</strong> German and U.S. laws, treaties and regulatory interpretati<strong>on</strong>s, including in the United<br />
States current and proposed U.S. Treasury regulati<strong>on</strong>s as of the date hereof, all of which are subject to<br />
change (possibly with retroactive effect).<br />
130
Shareholders should c<strong>on</strong>sult their own advisors regarding the tax c<strong>on</strong>sequences of the ownership and<br />
dispositi<strong>on</strong> of shares in light of their particular circumstances, including the effect of any state, local, or other<br />
nati<strong>on</strong>al laws.<br />
Taxati<strong>on</strong> of Dividends<br />
Dividends that we pay after January 1, <str<strong>on</strong>g><strong>20</strong>09</str<strong>on</strong>g> are subject to German withholding tax at an aggregate rate of<br />
26.375 % (c<strong>on</strong>sisting of a 25 % withholding tax and a 1.375 % surcharge). Under the Treaty, a U.S. resident<br />
will be entitled to receive a refund from the German tax authorities of 11.375 in respect of a declared dividend<br />
of 100. For example, for a declared dividend of 100, a U.S. resident initially will receive 73.625 and may<br />
claim a refund from the German tax authorities of 11.375 and, therefore, receive a total cash payment of 85<br />
(i.e., 85 % of the declared dividend). For U.S. tax purposes, a U.S. resident will be deemed to have received<br />
total dividends of 100 with the opti<strong>on</strong>, subject to applicable limitati<strong>on</strong>s, to credit or deduct withholding tax<br />
suffered. In any event, German withholding tax will be levied <strong>on</strong> the full amount of the cash dividend paid to a<br />
U.S. resident as described above.<br />
The gross amount of dividends that a U.S. resident receives (including amounts withheld in respect of Ger-<br />
man withholding tax) generally will be subject to U.S. federal income taxati<strong>on</strong> as foreign source dividend in-<br />
come, and will not be eligible for the dividends received deducti<strong>on</strong> generally allowed to U.S. corporati<strong>on</strong>s.<br />
German withholding tax at the 15 % rate provided under the Treaty will be treated as a foreign income tax<br />
that, subject to generally applicable limitati<strong>on</strong>s under U.S. tax law, is eligible for credit against a<br />
U.S. resident’s U.S. federal income tax liability or, at its electi<strong>on</strong>, may be deducted in computing taxable income.<br />
Thus, for a declared dividend of 100, a U.S. resident will be deemed to have paid German taxes of 15.<br />
A U.S. resident cannot claim credits for German taxes that would have been refunded to it if it had filed a<br />
claim for refund. Foreign tax credits will not be allowed for withholding taxes imposed in respect of certain<br />
short-term or hedged positi<strong>on</strong>s in securities. U.S. tax authorities have indicated an intenti<strong>on</strong> to use existing<br />
law and to issue new regulati<strong>on</strong>s to limit the creditability of foreign withholding taxes in certain situati<strong>on</strong>s,<br />
including where the burden of foreign taxes is separated inappropriately from the related foreign income.<br />
Subject to certain excepti<strong>on</strong>s for short-term and hedged positi<strong>on</strong>s, the U.S. dollar amount of dividends<br />
received by certain n<strong>on</strong>-corporate U.S. shareholders with respect to shares before January 1, <strong>20</strong>11 will be<br />
subject to taxati<strong>on</strong> at a maximum rate of 15 % if the dividends are “qualified dividends.” Dividends received<br />
with respect to shares will be qualified dividends if we (i) are eligible for the benefits of a comprehensive in-<br />
come tax treaty with the United States that the IRS has approved for purposes of the qualified dividend rules<br />
and (ii) were not, in the year prior to the year in which the dividend was paid, and are not, in the year in which<br />
the dividend is paid, a passive foreign investment company (“PFIC”). The current income tax treaty between<br />
the United States and Germany (the “Treaty”) has been approved for purposes of the qualified dividend rules,<br />
and we believe we qualify for benefits under the Treaty. The determinati<strong>on</strong> whether we are a PFIC must be<br />
made annually depending <strong>on</strong> the particular facts and circumstances, such as the valuati<strong>on</strong> of our assets,<br />
including goodwill and other intangible assets, at the time. Based <strong>on</strong> our audited financial statements and<br />
relevant market and shareholder data, we believe that we were not treated as a PFIC for U.S. federal income<br />
tax purposes with respect to our taxable year ended December 31, <str<strong>on</strong>g><strong>20</strong>09</str<strong>on</strong>g>. In additi<strong>on</strong>, based <strong>on</strong> our current<br />
131
<strong>20</strong>-F Item 10: Additi<strong>on</strong>al Informati<strong>on</strong><br />
expectati<strong>on</strong>s regarding the value and nature of our assets, the sources and nature of our income, and relevant<br />
market and shareholder data, we do not currently anticipate becoming a PFIC for our taxable year ending<br />
December 31, <strong>20</strong>10, or for the foreseeable future. The PFIC rules are however complex and their applicati<strong>on</strong><br />
to financial services companies are unclear. Each U.S. shareholder should c<strong>on</strong>sult its own tax advisor<br />
regarding the potential applicability of the PFIC regime to us and its implicati<strong>on</strong>s for their particular circumstances.<br />
If a U.S. resident receives a dividend paid in euros, it will recognize income in a U.S. dollar amount calculated<br />
by reference to the exchange rate in effect <strong>on</strong> the date of receipt, regardless of whether the payment is in fact<br />
c<strong>on</strong>verted into U.S. dollars. If dividends are c<strong>on</strong>verted into U.S. dollars <strong>on</strong> the date of receipt, a U.S. resident<br />
generally should not be required to recognize foreign currency gain or loss in respect of the dividend income<br />
but may be required to recognize foreign currency gain or loss <strong>on</strong> the receipt of a refund in respect of German<br />
withholding tax (but not with respect to the porti<strong>on</strong> of the Treaty refund that is treated as an additi<strong>on</strong>al dividend)<br />
to the extent the U.S. dollar value of the refund differs from the U.S. dollar equivalent of that amount <strong>on</strong><br />
the date of receipt of the underlying dividend.<br />
Refund Procedures<br />
To claim a refund, a U.S. resident must submit, within four years from the end of the calendar year in which<br />
the dividend is received, a claim for refund to the German tax authorities together with the original bank<br />
voucher (or certified copy thereof) issued by the paying entity documenting the tax withheld. Claims for refunds<br />
are made <strong>on</strong> a special German claim for refund form (<strong>Form</strong> E-USA), which must be filed with the German<br />
tax authorities: Bundeszentralamt für Steuern, An der Küppe 1, 53225 B<strong>on</strong>n, Germany. The German<br />
claim for refund forms may be obtained from the German tax authorities at the same address where the applicati<strong>on</strong>s<br />
are filed, from the Embassy of the Federal Republic of Germany, 4645 Reservoir Road, N.W.,<br />
Washingt<strong>on</strong>, D.C. <strong>20</strong>007-1998 or from the Office of Internati<strong>on</strong>al Operati<strong>on</strong>s, Internal Revenue Service, 1325<br />
K Street, N.W., Washingt<strong>on</strong>, D.C. <strong>20</strong>225, Attenti<strong>on</strong>: Taxpayer Service Divisi<strong>on</strong>, Room 900 or can be downloaded<br />
from the homepage of the Bundeszentralamt für Steuern (http://www.bzst.bund.de).<br />
A U.S. resident must also submit to the German tax authorities a certificati<strong>on</strong> (<strong>on</strong> IRS <strong>Form</strong> 6166) with respect<br />
to its last filed U.S. federal income tax return. Requests for certificati<strong>on</strong> are to be made in writing or by faxing<br />
a request and must include the U.S. resident’s name, social security number or employer identificati<strong>on</strong> number,<br />
tax return form number, the address where the certificati<strong>on</strong> should be sent, the name of the country requesting<br />
the certificati<strong>on</strong> (Germany), and the tax year being certified. Generally, the tax year being certified<br />
would most likely reflect the period of the U.S. resident’s last filed tax return. If the U.S. resident desires a<br />
“current year” <strong>Form</strong> 6166, its <strong>Form</strong> 6166 request must include a penalties of perjury statement, which has<br />
been signed by it in the current year under penalties of perjury, certifying that (1) it is a resident of the United<br />
States currently, and (2) it will c<strong>on</strong>tinue to be a resident of the United States for the remainder of the current,<br />
taxable year. For the purpose of requesting IRS <strong>Form</strong> 6166 it must use IRS <strong>Form</strong> 8802 (which will not be<br />
processed unless a user fee is paid). Requests for certificati<strong>on</strong> can include a request to the Internal Revenue<br />
Service to send the certificati<strong>on</strong> directly to the German tax authorities. This certificati<strong>on</strong> is valid for three<br />
years.<br />
132
The former simplified refund procedure for U.S. residents by the Depository Trust Company is not available<br />
for dividends received after December 31, <strong>20</strong>08. The former simplified refund procedure has been revoked<br />
by the German Ministry of Finance as of year-end <strong>20</strong>08. Instead an IT-supported quick-refund procedure<br />
is available (“Datenträgerverfahren – DTV”/“Data Medium Procedure – DMP”) for dividends received after<br />
December 31, <strong>20</strong>08. If the U.S. resident’s bank or broker elects to participate in the DMP, it will perform administrative<br />
functi<strong>on</strong>s necessary to claim the Treaty refund for the beneficiaries. The refund beneficiaries must<br />
c<strong>on</strong>firm to the DMP participant that they meet the c<strong>on</strong>diti<strong>on</strong>s of the U.S.-German treaty provisi<strong>on</strong>s and that<br />
they authorize the DMP participant to file applicati<strong>on</strong>s and receive notices and payments <strong>on</strong> their behalf.<br />
Further each refund beneficiary must c<strong>on</strong>firm<br />
— that it is the beneficial owner of the dividends received,<br />
— that it is resident in the U.S. in the meaning of the U.S.-German treaty,<br />
— that it does not have his domicile, residence or place of management in Germany,<br />
— that the dividends received do not form part of a permanent establishment or fixed base in Germany, and<br />
— that it commits, due to his participati<strong>on</strong> in the DMP, not to claim separately for refund.<br />
The beneficiaries also must provide a “certificati<strong>on</strong> of filing a tax return” <strong>on</strong> IRS <strong>Form</strong> 6166 with the DMP<br />
participant. The DMP participant is required to keep these documents in its files and prepare and file a combined<br />
claim for refund with the German tax authorities by electr<strong>on</strong>ic media. The combined claim provides<br />
evidence of a U.S. resident’s pers<strong>on</strong>al data including its U.S. Tax Identificati<strong>on</strong> Number.<br />
The German tax authorities reserve the right to audit the entitlement to tax refunds for several years following<br />
their payment pursuant to the U.S.-German treaty in individual cases. The DMP participant must assist with<br />
the audit by providing the necessary details or by forwarding the queries to the respective refund beneficiaries/shareholders.<br />
The German tax authorities will issue refunds denominated in euros. In the case of shares held through banks<br />
or brokers participating in the Depository Trust Company, the refunds will be issued to the Depository Trust<br />
Company, which will c<strong>on</strong>vert the refunds to U.S. dollars. The resulting amounts will be paid to banks or brokers<br />
for the account of holders.<br />
If a U.S. resident holds its shares through a bank or broker who elects to participate in the DMP, it could take<br />
at least three weeks for it to receive a refund after a combined claim for refund has been filed with the German<br />
tax authorities. If a U.S. resident files a claim for refund directly with the German tax authorities, it could<br />
take at least eight m<strong>on</strong>ths for it to receive a refund. The length of time between filing a claim for refund and<br />
receipt of that refund is uncertain and we can give no assurances as to when any refund will be received.<br />
Taxati<strong>on</strong> of Capital Gains<br />
Under the Treaty, a U.S. resident will not be subject to German capital gains tax in respect of a sale or other<br />
dispositi<strong>on</strong> of shares. For U.S. federal income tax purposes, a U.S. holder will recognize capital gain or loss<br />
<strong>on</strong> the sale or other dispositi<strong>on</strong> of shares in an amount equal to the difference between such holder’s tax<br />
basis in the shares, and the U.S. dollar value of the amount realized from the sale or other dispositi<strong>on</strong>. Such<br />
gain or loss will be capital gain or loss, and will be l<strong>on</strong>g-term capital gain or loss if the shares were held for<br />
133
<strong>20</strong>-F Item 10: Additi<strong>on</strong>al Informati<strong>on</strong><br />
more than <strong>on</strong>e year. The net amount of l<strong>on</strong>g-term capital gain realized by an individual generally is subject to<br />
taxati<strong>on</strong> at a current maximum rate of 15 %. Any such gain generally would be treated as income arising from<br />
sources within the United States; any such loss would generally be allocated against U.S. source income. The<br />
ability to offset capital losses against ordinary income is subject to limitati<strong>on</strong>s.<br />
Shareholders whose shares are held in an account with a German bank or financial services instituti<strong>on</strong> (including<br />
a German branch of a n<strong>on</strong>-German bank or financial services instituti<strong>on</strong>) are urged to c<strong>on</strong>sult their<br />
own advisors. This summary does not discuss their particular tax situati<strong>on</strong>.<br />
United States Informati<strong>on</strong> <str<strong>on</strong>g>Report</str<strong>on</strong>g>ing and Backup Withholding<br />
Dividends and payments of the proceeds <strong>on</strong> a sale of shares, paid within the United States or through certain<br />
U.S.-related financial intermediaries are subject to informati<strong>on</strong> reporting and may be subject to backup withholding<br />
unless the U.S. resident (1) is a corporati<strong>on</strong> or other exempt recipient or (2) provides a taxpayer identificati<strong>on</strong><br />
number and certifies (<strong>on</strong> IRS <strong>Form</strong> W-9) that no loss of exempti<strong>on</strong> from backup withholding has<br />
occurred.<br />
Shareholders that are not U.S. pers<strong>on</strong>s generally are not subject to informati<strong>on</strong> reporting or backup withhold-<br />
ing. However, a n<strong>on</strong>-U.S. pers<strong>on</strong> may be required to provide a certificati<strong>on</strong> (generally <strong>on</strong> IRS <strong>Form</strong> W-8BEN)<br />
of its n<strong>on</strong>-U.S. status in c<strong>on</strong>necti<strong>on</strong> with payments received in the United States or through a U.S.-related<br />
financial intermediary.<br />
Backup withholding tax is not an additi<strong>on</strong>al tax, and any amounts withheld under the backup withholding rules<br />
will be allowed as a refund or a credit against a holder’s U.S. federal income tax liability, provided the required<br />
informati<strong>on</strong> is furnished to the IRS.<br />
German Gift and Inheritance Taxes<br />
Under the current estate, inheritance and gift tax treaty between the United States and Germany (the “Estate<br />
Tax Treaty”), a transfer of shares generally will not be subject to German gift or inheritance tax so l<strong>on</strong>g as the<br />
d<strong>on</strong>or or decedent, and the heir, d<strong>on</strong>ee or other beneficiary, was not domiciled in Germany for purposes of the<br />
Estate Tax Treaty at the time the gift was made, or at the time of the decedent’s death, and the shares were<br />
not held in c<strong>on</strong>necti<strong>on</strong> with a permanent establishment or fixed base in Germany.<br />
The Estate Tax Treaty provides a credit against U.S. federal estate and gift tax liability for the amount of inheri-<br />
tance and gift tax paid in Germany, subject to certain limitati<strong>on</strong>s, in a case where shares are subject to Ger-<br />
man inheritance or gift tax and United States federal estate or gift tax.<br />
Other German Taxes<br />
There are presently no German net wealth, transfer, stamp or other similar taxes that would apply to a<br />
U.S. resident as a result of the receipt, purchase, ownership or sale of shares.<br />
Dividends and Paying Agents<br />
Not required because this document is filed as an annual report.<br />
134
Statement by Experts<br />
Not required because this document is filed as an annual report.<br />
Documents <strong>on</strong> Display<br />
We are subject to the informati<strong>on</strong>al requirements of the Securities Exchange Act of 1934, as amended. In<br />
accordance with these requirements, we file reports and other informati<strong>on</strong> with the Securities and Exchange<br />
Commissi<strong>on</strong>. You may inspect and copy these materials, including this document and its exhibits, at the<br />
Commissi<strong>on</strong>’s Public Reference Room at 100 F Street, N.E., Room 1580, Washingt<strong>on</strong>, D.C. <strong>20</strong>549, and at the<br />
Commissi<strong>on</strong>’s regi<strong>on</strong>al offices at 175 W. Jacks<strong>on</strong> Boulevard, Suite 900, Chicago, Illinois 60604, and at<br />
3 World Financial Center, Suite 400, New York, New York, 10281-1022. You may obtain copies of the materials<br />
from the Public Reference Room of the Commissi<strong>on</strong> at 100 F Street, N.E., Room 1580, Washingt<strong>on</strong>, D.C.<br />
<strong>20</strong>549, at prescribed rates. You may obtain informati<strong>on</strong> <strong>on</strong> the operati<strong>on</strong> of the Commissi<strong>on</strong>’s Public Reference<br />
Room by calling the Commissi<strong>on</strong> in the United States at 1-800-SEC-0330. Our Securities and Exchange<br />
Commissi<strong>on</strong> filings are also available over the Internet at the Securities and Exchange Commissi<strong>on</strong>’s website<br />
at http://www.sec.gov under File Number 1-15242. In additi<strong>on</strong>, you may visit the offices of the New York Stock<br />
Exchange at <strong>20</strong> Broad Street, New York, New York 10005 to inspect material filed by us.<br />
Subsidiary Informati<strong>on</strong><br />
Not applicable.<br />
135
<strong>20</strong>-F Item 11: Quantitative and Qualitative Disclosures about Credit, Market and Other Risk<br />
Item 11: Quantitative and Qualitative Disclosures<br />
about Credit, Market and Other Risk<br />
Included in the following secti<strong>on</strong> <strong>on</strong> quantitative and qualitative disclosures about credit, market and other<br />
risks is informati<strong>on</strong> which forms part of the financial statements of <strong>Deutsche</strong> <strong>Bank</strong> and which is incorporated<br />
by reference into the financial statements of this report. Such informati<strong>on</strong> is marked by a bracket in the margins<br />
throughout this secti<strong>on</strong>.<br />
Market Development<br />
C<strong>on</strong>fidence and liquidity in financial markets improved during much of <str<strong>on</strong>g><strong>20</strong>09</str<strong>on</strong>g>, underpinned by c<strong>on</strong>tinued<br />
government and central bank support measures. Equity markets recovered sharply, volatility subsided, and<br />
corporate credit and interbank spreads approached, and in some cases returned to, pre-crisis levels.<br />
Issuance volumes in corporate b<strong>on</strong>d markets were very str<strong>on</strong>g as investor risk appetite improved. However,<br />
securitizati<strong>on</strong> markets saw <strong>on</strong>ly a more modest recovery, despite extensive liquidity support and outright<br />
purchases of assets by governmental instituti<strong>on</strong>s. Issuance volumes have remained low, and prices<br />
depressed, indicating that c<strong>on</strong>fidence in securitizati<strong>on</strong> has not yet been restored.<br />
C<strong>on</strong>diti<strong>on</strong>s in the wider ec<strong>on</strong>omy remained challenging. Most developed ec<strong>on</strong>omies returned to positive<br />
growth in the sec<strong>on</strong>d half of <str<strong>on</strong>g><strong>20</strong>09</str<strong>on</strong>g>, but the pace of recovery remained relatively subdued and reliant <strong>on</strong> public<br />
sector stimulus measures. Ec<strong>on</strong>omic headwinds persisted with unemployment increasing, weighing <strong>on</strong> household<br />
credit quality, and corporate defaults rising further. Residential real estate prices c<strong>on</strong>tinued to fall in many<br />
developed markets, but the German market remained stable. Towards the end of the year, large fiscal deficits<br />
and sharply rising public debt, mainly a reflecti<strong>on</strong> of the deep ec<strong>on</strong>omic recessi<strong>on</strong> and the cost of financial<br />
sector support measures, led to growing c<strong>on</strong>cerns in financial markets over sovereign risk.<br />
Risk and Capital Management<br />
The wide variety of our businesses requires us to identify, measure, aggregate and manage our risks effectively,<br />
and to allocate our capital am<strong>on</strong>g our businesses appropriately. We manage risk and capital through a<br />
framework of principles, organizati<strong>on</strong>al structures as well as measurement and m<strong>on</strong>itoring processes that are<br />
closely aligned with the activities of our group divisi<strong>on</strong>s. The importance of a str<strong>on</strong>g focus <strong>on</strong> risk management<br />
and the c<strong>on</strong>tinuous need to refine risk management practice have become particularly evident during<br />
the financial market crisis. While our risk and capital management c<strong>on</strong>tinuously evolves and improves, there<br />
can be no assurance that all market developments, in particular those of extreme nature, can be fully anticipated<br />
at all times.<br />
136
Risk and Capital Management Principles<br />
The following key principles underpin our approach to risk and capital management:<br />
— Our Management Board provides overall risk and capital management supervisi<strong>on</strong> for our c<strong>on</strong>solidated<br />
Group. Our Supervisory Board regularly m<strong>on</strong>itors our risk and capital profile.<br />
— We manage credit, market, liquidity, operati<strong>on</strong>al, business, legal and reputati<strong>on</strong>al risks as well as our cap-<br />
ital in a coordinated manner at all relevant levels within our organizati<strong>on</strong>. This also holds true for complex<br />
products which we typically manage within our framework established for trading exposures.<br />
— The structure of our integrated legal, risk & capital functi<strong>on</strong> is closely aligned with the structure of our<br />
group divisi<strong>on</strong>s.<br />
— The legal, risk & capital functi<strong>on</strong> is independent of our group divisi<strong>on</strong>s.<br />
Risk and Capital Management Organizati<strong>on</strong><br />
Our Chief Risk Officer, who is a member of our Management Board, is resp<strong>on</strong>sible for our Group-wide credit,<br />
market, operati<strong>on</strong>al, liquidity, business, legal and reputati<strong>on</strong>al risk management as well as capital management<br />
activities and heads our integrated legal, risk & capital functi<strong>on</strong>.<br />
Two functi<strong>on</strong>al committees, which are both chaired by our Chief Risk Officer, are central to the legal,<br />
risk & capital functi<strong>on</strong>.<br />
— Our Risk Executive Committee is resp<strong>on</strong>sible for management and c<strong>on</strong>trol of the aforementi<strong>on</strong>ed risks<br />
across our c<strong>on</strong>solidated Group. To fulfill this mandate, the Risk Executive Committee is supported by sub-<br />
committees that are resp<strong>on</strong>sible for dedicated areas of risk management, including several policy<br />
committees and the Group Reputati<strong>on</strong>al Risk Committee.<br />
— The resp<strong>on</strong>sibilities of the Capital and Risk Committee include risk profile and capital planning, capital<br />
capacity m<strong>on</strong>itoring and optimizati<strong>on</strong> of funding.<br />
Dedicated legal, risk & capital units are established with the mandate to:<br />
— Ensure that the business c<strong>on</strong>ducted within each divisi<strong>on</strong> is c<strong>on</strong>sistent with the risk appetite that the Capital<br />
and Risk Committee has set within a framework established by the Management Board;<br />
— <strong>Form</strong>ulate and implement risk and capital management policies, procedures and methodologies that are<br />
appropriate to the businesses within each divisi<strong>on</strong>;<br />
— Approve credit, market and liquidity risk limits;<br />
— C<strong>on</strong>duct periodic portfolio reviews to ensure that the portfolio of risks is within acceptable parameters; and<br />
— Develop and implement risk and capital management infrastructures and systems that are appropriate for<br />
each divisi<strong>on</strong>.<br />
The heads of our legal, risk & capital units, which are am<strong>on</strong>gst the members of our Risk Executive Committee,<br />
are resp<strong>on</strong>sible for the performance of the units and report directly to our Chief Risk Officer.<br />
Our finance and audit departments support our legal, risk & capital functi<strong>on</strong>. They operate independently of<br />
both the group divisi<strong>on</strong>s and of the legal, risk & capital functi<strong>on</strong>. The role of the finance department is to help<br />
137
<strong>20</strong>-F Item 11: Quantitative and Qualitative Disclosures about Credit, Market and Other Risk<br />
quantify and verify the risk that we assume and ensure the quality and integrity of our risk-related data. Our<br />
audit department performs risk-oriented reviews of the design and operating effectiveness of our internal<br />
c<strong>on</strong>trol procedures.<br />
Risk and Capital Strategy<br />
The legal, risk & capital functi<strong>on</strong> annually develops its risk and capital strategy in an integrated process<br />
together with the group divisi<strong>on</strong>s and Finance, ensuring Group-wide alignment of risk and performance<br />
targets. The strategy is ultimately presented to, and approved by, the Management Board. Subsequently, this<br />
plan is also presented to, and discussed with, the Risk Committee of the Supervisory Board.<br />
Targets and projecti<strong>on</strong>s are set for various parameters and different levels of the Group. Performance against<br />
these targets is m<strong>on</strong>itored regularly and a report <strong>on</strong> selected important and high-level targets is brought to the<br />
direct attenti<strong>on</strong> of the Chief Risk Officer and/or the Management Board. In case of a significant deviati<strong>on</strong> from<br />
the targets, it is the resp<strong>on</strong>sibility of the divisi<strong>on</strong>al legal, risk & capital units to bring this to the attenti<strong>on</strong><br />
of their superiors and ultimately the Chief Risk Officer if no mitigati<strong>on</strong> or mitigati<strong>on</strong> strategy can be achieved<br />
<strong>on</strong> a subordinated level.<br />
Amendments to the risk and capital strategy must be approved by the Chief Risk Officer or the full Management<br />
Board, depending <strong>on</strong> significance.<br />
Categories of Risk<br />
The most important risks we assume are specific banking risks and reputati<strong>on</strong>al risks, as well as risks arising<br />
from the general business envir<strong>on</strong>ment.<br />
Specific <strong>Bank</strong>ing Risks<br />
Our risk management processes distinguish am<strong>on</strong>g four kinds of specific banking risks: credit risk, market<br />
risk, operati<strong>on</strong>al risk and liquidity risk. A detailed discussi<strong>on</strong> of these risks follows later in Item 11.<br />
— Credit risk arises from all transacti<strong>on</strong>s that give rise to actual, c<strong>on</strong>tingent or potential claims against any<br />
counterparty, borrower or obligor (which we refer to collectively as “counterparties”). We distinguish be-<br />
tween three kinds of credit risk:<br />
— Default risk is the risk that counterparties fail to meet c<strong>on</strong>tractual payment obligati<strong>on</strong>s.<br />
— Country risk is the risk that we may suffer a loss, in any given country, due to any of the following<br />
reas<strong>on</strong>s: a possible deteriorati<strong>on</strong> of ec<strong>on</strong>omic c<strong>on</strong>diti<strong>on</strong>s, political and social upheaval, nati<strong>on</strong>alizati<strong>on</strong><br />
and expropriati<strong>on</strong> of assets, government repudiati<strong>on</strong> of indebtedness, exchange c<strong>on</strong>trols and disruptive<br />
currency depreciati<strong>on</strong> or devaluati<strong>on</strong>. Country risk includes transfer risk which arises when debtors<br />
are unable to meet their obligati<strong>on</strong>s owing to an inability to transfer assets to n<strong>on</strong>residents due to<br />
direct sovereign interventi<strong>on</strong>.<br />
— Settlement risk is the risk that the settlement or clearance of transacti<strong>on</strong>s will fail. It arises whenever<br />
the exchange of cash, securities and/or other assets is not simultaneous.<br />
138
— Market risk arises from the uncertainty c<strong>on</strong>cerning changes in market prices and rates (including interest<br />
rates, equity prices, foreign exchange rates and commodity prices), the correlati<strong>on</strong>s am<strong>on</strong>g them and their<br />
levels of volatility.<br />
— Operati<strong>on</strong>al risk is the potential for incurring losses in relati<strong>on</strong> to employees, c<strong>on</strong>tractual specificati<strong>on</strong>s and<br />
documentati<strong>on</strong>, technology, infrastructure failure and disasters, external influences and customer relati<strong>on</strong>ships.<br />
This definiti<strong>on</strong> includes legal and regulatory risk, but excludes business and reputati<strong>on</strong>al risk.<br />
— Liquidity risk is the risk arising from our potential inability to meet all payment obligati<strong>on</strong>s when they come<br />
due or <strong>on</strong>ly being able to meet these obligati<strong>on</strong>s at excessive costs.<br />
Reputati<strong>on</strong>al Risk<br />
Within our risk management processes, we define reputati<strong>on</strong>al risk as the risk that publicity c<strong>on</strong>cerning a<br />
transacti<strong>on</strong>, counterparty or business practice involving a client will negatively impact the public’s trust in our<br />
organizati<strong>on</strong>.<br />
Several policies and guidelines form the framework of our reputati<strong>on</strong>al risk management. The primary resp<strong>on</strong>sibility<br />
for the identificati<strong>on</strong>, escalati<strong>on</strong> and resoluti<strong>on</strong> of reputati<strong>on</strong>al risk issues resides with the business<br />
divisi<strong>on</strong>s. The risk management units assist and advise the business divisi<strong>on</strong>s in ascertaining that reputati<strong>on</strong>al<br />
risk issues are appropriately identified, escalated and addressed.<br />
The most senior dedicated body for reputati<strong>on</strong>al risk issues is our Group Reputati<strong>on</strong>al Risk Committee<br />
(GRRC). It is a permanent sub-committee of the Risk Executive Committee and is chaired by the Chief Risk<br />
Officer. The GRRC reviews and makes final determinati<strong>on</strong>s <strong>on</strong> all reputati<strong>on</strong>al risk issues, where escalati<strong>on</strong> of<br />
such issues is deemed necessary by senior business and regi<strong>on</strong>al management, or required under other<br />
Group policies and procedures.<br />
Business Risk<br />
Business risk describes the risk we assume due to potential changes in general business c<strong>on</strong>diti<strong>on</strong>s, such as<br />
our market envir<strong>on</strong>ment, client behavior and technological progress. This can affect our results if we fail to<br />
adjust quickly to these changing c<strong>on</strong>diti<strong>on</strong>s.<br />
Insurance Specific Risk<br />
Our exposure to insurance risk increased up<strong>on</strong> our <strong>20</strong>07 acquisiti<strong>on</strong> of Abbey Life Assurance Company<br />
Limited and our <strong>20</strong>06 acquisiti<strong>on</strong> of a stake in Paternoster Limited, a regulated insurance company. We are<br />
primarily exposed to the following insurance-related risks.<br />
— Mortality and morbidity risks – the risks of a higher or lower than expected number of death claims <strong>on</strong><br />
assurance products and of an occurrence of <strong>on</strong>e or more large claims, and the risk of a higher or lower<br />
than expected number of disability claims, respectively. We aim to mitigate these risks by the use of rein-<br />
surance and the applicati<strong>on</strong> of discreti<strong>on</strong>ary charges. We investigate rates of mortality and morbidity annually.<br />
— L<strong>on</strong>gevity risk – the risk of faster or slower than expected improvements in life expectancy <strong>on</strong> immediate<br />
and deferred annuity products. We m<strong>on</strong>itor this risk against the latest external industry data and emerging<br />
trends.<br />
139
<strong>20</strong>-F Item 11: Quantitative and Qualitative Disclosures about Credit, Market and Other Risk<br />
— Expenses risk – the risk that policies cost more or less to administer than expected. We m<strong>on</strong>itor these<br />
expenses by an analysis of our actual expenses relative to our budget. We investigate reas<strong>on</strong>s for any<br />
significant divergence from expectati<strong>on</strong>s and take remedial acti<strong>on</strong>. We reduce the expense risk by having<br />
in place (until <strong>20</strong>10 with the opti<strong>on</strong> of renewal for two more years) an outsourcing agreement which covers<br />
the administrati<strong>on</strong> of the policies.<br />
— Persistency risk – the risk of a higher or lower than expected percentage of lapsed policies. We assess<br />
our persistency rates annually by reference to appropriate risk factors.<br />
We m<strong>on</strong>itor the actual claims and persistency against the assumpti<strong>on</strong>s used and refine the assumpti<strong>on</strong>s for<br />
the future assessment of liabilities. Actual experience may vary from estimates, the more so as projecti<strong>on</strong>s<br />
are made further into the future. Liabilities are evaluated at least annually.<br />
To the extent that actual experience is less favorable than the underlying assumpti<strong>on</strong>s, or it is necessary to<br />
increase provisi<strong>on</strong>s due to more <strong>on</strong>erous assumpti<strong>on</strong>s, the amount of capital required in the insurance entities<br />
may increase.<br />
The profitability of our n<strong>on</strong> unit-linked l<strong>on</strong>g-term insurance businesses depends to a significant extent <strong>on</strong> the<br />
value of claims paid in the future relative to the assets accumulated to the date of claim. Typically, over<br />
the lifetime of a c<strong>on</strong>tract, premiums and investment returns exceed claim costs in the early years and it is<br />
necessary to set aside these amounts to meet future obligati<strong>on</strong>s. The amount of such future obligati<strong>on</strong>s<br />
is assessed <strong>on</strong> actuarial principles by reference to assumpti<strong>on</strong>s about the development of financial and insurance<br />
risks.<br />
For unit-linked investment c<strong>on</strong>tracts, profitability is based <strong>on</strong> the charges taken being sufficient to meet<br />
expenses and profit. The premium and charges are assessed based <strong>on</strong> actuarial principles by reference to<br />
assumpti<strong>on</strong>s about the development of financial and insurance risks.<br />
As stated above, reinsurance is used as a mechanism to reduce risk. Our strategy is to c<strong>on</strong>tinue to utilize<br />
reinsurance as appropriate.<br />
Risk Management Tools<br />
We use a comprehensive range of quantitative tools and metrics for m<strong>on</strong>itoring and managing risks. As a<br />
matter of policy, we c<strong>on</strong>tinually assess the appropriateness and the reliability of our quantitative tools and<br />
metrics in light of our changing risk envir<strong>on</strong>ment. Some of these tools are comm<strong>on</strong> to a number of risk categories,<br />
while others are tailored to the particular features of specific risk categories. The following are the most<br />
important quantitative tools and metrics we currently use to measure, manage and report our risk:<br />
— Ec<strong>on</strong>omic capital. Ec<strong>on</strong>omic capital measures the amount of capital we need to absorb very severe unexpected<br />
losses arising from our exposures. “Very severe” in this c<strong>on</strong>text means that ec<strong>on</strong>omic capital is set<br />
at a level to cover with a probability of 99.98 % the aggregated unexpected losses within <strong>on</strong>e year. We<br />
calculate ec<strong>on</strong>omic capital for the default risk, transfer risk and settlement risk elements of credit risk, for<br />
market risk including traded default risk, for operati<strong>on</strong>al risk and for general business risk. We c<strong>on</strong>tinuous-<br />
140
ly review and enhance our ec<strong>on</strong>omic capital model as appropriate. Notably during the course of <str<strong>on</strong>g><strong>20</strong>09</str<strong>on</strong>g> the<br />
ec<strong>on</strong>omic capital stress tests for market risk were recalibrated to reflect the extreme market moves observed<br />
in the later part of <strong>20</strong>08. This included extensi<strong>on</strong> of the assumed holding periods <strong>on</strong> credit positi<strong>on</strong>s,<br />
and significant increases to the shocks applied to equity indices and credit spreads, especially for<br />
securitized products. In additi<strong>on</strong> to the recalibrati<strong>on</strong>, there were improvements to the ec<strong>on</strong>omic capital<br />
model. These included the additi<strong>on</strong> of stress tests for leveraged exchange traded funds and for gap risk in<br />
n<strong>on</strong>-recourse finance in emerging markets. Within our ec<strong>on</strong>omic capital framework we capture the effects<br />
of rating migrati<strong>on</strong> as well as profits and losses due to fair value accounting. We use ec<strong>on</strong>omic capital to<br />
show an aggregated view of our risk positi<strong>on</strong> from individual business lines up to our c<strong>on</strong>solidated Group<br />
level. We also use ec<strong>on</strong>omic capital (as well as goodwill and unamortized other intangible assets) in order<br />
to allocate our book capital am<strong>on</strong>g our businesses. This enables us to assess each business unit’s riskadjusted<br />
profitability, which is a key metric in managing our financial resources. In additi<strong>on</strong>, we c<strong>on</strong>sider<br />
ec<strong>on</strong>omic capital, in particular for credit risk, when we measure the risk-adjusted profitability of our client<br />
relati<strong>on</strong>ships. See “Overall Risk Positi<strong>on</strong>” below for a quantitative summary of our ec<strong>on</strong>omic capital usage.<br />
— Expected loss. We use expected loss as a measure of our credit and operati<strong>on</strong>al risk. Expected loss is a<br />
measurement of the loss we can expect within a <strong>on</strong>e-year period from these risks as of the respective reporting<br />
date, based <strong>on</strong> our historical loss experience. When calculating expected loss for credit risk, we<br />
take into account credit risk ratings, collateral, maturities and statistical averaging procedures to reflect the<br />
risk characteristics of our different types of exposures and facilities. All parameter assumpti<strong>on</strong>s are based<br />
<strong>on</strong> statistical averages of up to seven years based <strong>on</strong> our internal default and loss history as well as external<br />
benchmarks. We use expected loss as a tool of our risk management process and as part of our<br />
management reporting systems. We also c<strong>on</strong>sider the applicable results of the expected loss calculati<strong>on</strong>s<br />
as a comp<strong>on</strong>ent of our collectively assessed allowance for credit losses included in our financial statements.<br />
For operati<strong>on</strong>al risk we determine the expected loss from statistical averages of our internal loss<br />
history, recent risk trends as well as forward looking expert estimates.<br />
— Value-at-Risk. We use the value-at-risk approach to derive quantitative measures for our trading book<br />
market risks under normal market c<strong>on</strong>diti<strong>on</strong>s. Our value-at-risk figures play a role in both internal and external<br />
(regulatory) reporting. For a given portfolio, value-at-risk measures the potential future loss (in<br />
terms of market value) that, under normal market c<strong>on</strong>diti<strong>on</strong>s, will not be exceeded with a defined c<strong>on</strong>fidence<br />
level in a defined period. The value-at-risk for a total portfolio represents a measure of our diversified<br />
market risk (aggregated, using pre-determined correlati<strong>on</strong>s) in that portfolio.<br />
— Stress testing. We supplement our analysis of credit, market, operati<strong>on</strong>al and liquidity risk with stress<br />
testing. For credit risk management purposes, we perform stress tests to assess the impact of changes in<br />
general ec<strong>on</strong>omic c<strong>on</strong>diti<strong>on</strong>s or specific parameters <strong>on</strong> our credit exposures or parts thereof as well as the<br />
impact <strong>on</strong> the creditworthiness of our portfolio. For market risk management purposes, we perform stress<br />
tests because value-at-risk calculati<strong>on</strong>s are based <strong>on</strong> relatively recent historical data, <strong>on</strong>ly purport to estimate<br />
risk up to a defined c<strong>on</strong>fidence level and assume good asset liquidity. Therefore, they <strong>on</strong>ly reflect<br />
possible losses under relatively normal market c<strong>on</strong>diti<strong>on</strong>s. Stress tests help us determine the effects of potentially<br />
extreme market developments <strong>on</strong> the value of our market risk sensitive exposures, both <strong>on</strong> our<br />
highly liquid and less liquid trading positi<strong>on</strong>s as well as our investments. The correlati<strong>on</strong>s between market<br />
risk factors used in our current stress tests are estimated from volatile market c<strong>on</strong>diti<strong>on</strong>s in the past using<br />
an algorithm, and the estimated correlati<strong>on</strong>s proved to be essentially c<strong>on</strong>sistent with those observed during<br />
recent periods of market stress. We use stress testing to determine the amount of ec<strong>on</strong>omic capital we<br />
141
<strong>20</strong>-F Item 11: Quantitative and Qualitative Disclosures about Credit, Market and Other Risk<br />
need to allocate to cover our market risk exposure under the scenarios of extreme market c<strong>on</strong>diti<strong>on</strong>s we<br />
select for our simulati<strong>on</strong>s. For operati<strong>on</strong>al risk management purposes, we perform stress tests <strong>on</strong> our<br />
ec<strong>on</strong>omic capital model to assess its sensitivity to changes in key model comp<strong>on</strong>ents, which include<br />
external losses. For liquidity risk management purposes, we perform stress tests and scenario analysis to<br />
evaluate the impact of sudden stress events <strong>on</strong> our liquidity positi<strong>on</strong>. In <str<strong>on</strong>g><strong>20</strong>09</str<strong>on</strong>g>, we have stepped up our<br />
efforts to further align our stress testing framework across the different risk types.<br />
— Regulatory risk assessment. German banking regulators assess our capacity to assume risk in several<br />
ways, which are described in more detail in “Item 4: Informati<strong>on</strong> <strong>on</strong> the Company – Regulati<strong>on</strong> and Supervisi<strong>on</strong>”<br />
and Note [36] of the c<strong>on</strong>solidated financial statements.<br />
Credit Risk<br />
We measure and manage our credit risk following the below principles:<br />
— In all our group divisi<strong>on</strong>s c<strong>on</strong>sistent standards are applied in the respective credit decisi<strong>on</strong> processes.<br />
— The approval of credit limits for counterparties and the management of our individual credit exposures<br />
must fit within our portfolio guidelines and our credit strategies.<br />
— Every extensi<strong>on</strong> of credit or material change to a credit facility (such as its tenor, collateral structure or<br />
major covenants) to any counterparty requires credit approval at the appropriate authority level.<br />
— We assign credit approval authorities to individuals according to their qualificati<strong>on</strong>s, experience and training,<br />
and we review these periodically.<br />
— We measure and c<strong>on</strong>solidate all our credit exposures to each obligor <strong>on</strong> a global c<strong>on</strong>solidated basis that<br />
applies across our c<strong>on</strong>solidated Group. We define an “obligor” as a group of individual borrowers that are<br />
linked to <strong>on</strong>e another by any of a number of criteria we have established, including capital ownership, voting<br />
rights, dem<strong>on</strong>strable c<strong>on</strong>trol, other indicati<strong>on</strong> of group affiliati<strong>on</strong>; or are jointly and severally liable for<br />
all or significant porti<strong>on</strong>s of the credit we have extended.<br />
Credit Risk Ratings<br />
Basic and key element of the credit approval process is a detailed risk assessment of every credit exposure<br />
associated with a counterparty. Our risk assessment procedures c<strong>on</strong>sider both the creditworthiness of the<br />
counterparty and the risks related to the specific type of credit facility or exposure. This risk assessment not<br />
<strong>on</strong>ly affects the structuring of the transacti<strong>on</strong> and the outcome of the credit decisi<strong>on</strong>, but also influences the<br />
level of decisi<strong>on</strong>-making authority required to extend or materially change the credit and the m<strong>on</strong>itoring procedures<br />
we apply to the <strong>on</strong>going exposure.<br />
We have our own in-house assessment methodologies, scorecards and rating scale for evaluating the credit-<br />
worthiness of our counterparties. Our granular 26-grade rating scale, which is calibrated <strong>on</strong> a probability of<br />
default measure based up<strong>on</strong> a statistical analysis of historical defaults in our portfolio, enables us to compare<br />
our internal ratings with comm<strong>on</strong> market practice and ensures comparability between different sub-portfolios<br />
of our instituti<strong>on</strong>. Several default ratings therein enable us to incorporate the potential recovery rate of<br />
defaulted exposures. We generally rate our credit exposures individually, though certain portfolios of securitized<br />
receivables are rated <strong>on</strong> a pool level. When we assign our internal risk ratings, we compare them with<br />
external risk ratings assigned to our counterparties by the major internati<strong>on</strong>al rating agencies, where possible.<br />
142
Credit Limits<br />
Credit limits set forth maximum credit exposures we are willing to assume over specified periods. They relate<br />
to products, c<strong>on</strong>diti<strong>on</strong>s of the exposure and other factors. Credit limits are established by the Credit Risk<br />
Management functi<strong>on</strong> via the executi<strong>on</strong> of assigned credit authorities. Credit authority reflects the mandate to<br />
approve new credit limits as well as increases or the extensi<strong>on</strong> of existing credit limits. Credit authority is<br />
generally assigned to individuals as pers<strong>on</strong>al credit authority according to the individual’s professi<strong>on</strong>al qualificati<strong>on</strong><br />
and experience.<br />
Where an individual’s pers<strong>on</strong>al authority is insufficient to establish required credit limits, the transacti<strong>on</strong> is<br />
referred to a higher credit authority holder or where necessary to an appropriate credit committee such as the<br />
CRM Underwriting Committee. Where pers<strong>on</strong>al and committee authorities are insufficient to establish appropriate<br />
limits the case is referred to the Management Board for approval.<br />
All assigned credit authorities are reviewed <strong>on</strong> a periodic basis to ensure that they are adequate. The results of<br />
the review are presented to the Group Credit Policy Committee and reported to the Risk Executive Committee.<br />
Segregati<strong>on</strong> of Credit Exposures<br />
Counterparty credit exposure arises from our traditi<strong>on</strong>al n<strong>on</strong>trading lending activities which include elements<br />
such as loans and c<strong>on</strong>tingent liabilities. Counterparty credit exposure also arises via our direct trading activity<br />
with clients in certain instruments which include OTC derivatives, FX forwards and Forward Rate Agreements.<br />
A default risk also arises from our positi<strong>on</strong>s in traded credit products such as b<strong>on</strong>ds. This risk is managed<br />
using both credit & market risk parameters.<br />
M<strong>on</strong>itoring Default Risk<br />
Ongoing active m<strong>on</strong>itoring and management of credit risk positi<strong>on</strong>s is an integral part of our credit risk man-<br />
agement. M<strong>on</strong>itoring tasks are primarily performed by the divisi<strong>on</strong>al risk units in close cooperati<strong>on</strong> with our<br />
portfolio management functi<strong>on</strong>. We m<strong>on</strong>itor all of our credit exposures <strong>on</strong> a c<strong>on</strong>tinuing basis using the risk<br />
management tools described above.<br />
Credit counterparties are allocated to credit officers within specified divisi<strong>on</strong>al risk units which are aligned to<br />
respective business units such as Global <strong>Bank</strong>ing, Global Markets or Global Transacti<strong>on</strong> <strong>Bank</strong>ing. The individual<br />
credit officers within these divisi<strong>on</strong>al risk units have the most relevant expertise and experience to<br />
manage the credit risks associated with these counterparties and their associated credit related transacti<strong>on</strong>s.<br />
It is the resp<strong>on</strong>sibility of each credit officer to undertake <strong>on</strong>going credit m<strong>on</strong>itoring for their allocated portfolio<br />
of counterparties. M<strong>on</strong>itoring of credit risk arising from our trading activities with credit counterparties is undertaken<br />
in accordance with industry best practice by reference to various dedicated measures that quantify<br />
the expected current and future exposure levels, including the exposure levels under adverse market developments.<br />
The credit process for trading instruments requires limits to be established against trading instrument<br />
exposures which are m<strong>on</strong>itored by respective credit officers as part of their <strong>on</strong>going counterparty m<strong>on</strong>itoring<br />
activities.<br />
143
<strong>20</strong>-F Item 11: Quantitative and Qualitative Disclosures about Credit, Market and Other Risk<br />
We also have procedures in place intended to identify at an early stage credit exposures for which there may<br />
be an increased risk of loss. In instances where we have identified counterparties where problems might<br />
arise, the respective exposure is generally placed <strong>on</strong> a watchlist. We aim to identify counterparties that, <strong>on</strong><br />
the basis of the applicati<strong>on</strong> of our risk management tools, dem<strong>on</strong>strate the likelihood of problems well in advance<br />
in order to effectively manage the credit exposure and maximize the recovery. The objective of this<br />
early warning system is to address potential problems while adequate alternatives for acti<strong>on</strong> are still available.<br />
This early risk detecti<strong>on</strong> is a tenet of our credit culture and is intended to ensure that greater attenti<strong>on</strong> is<br />
paid to such exposures.<br />
M<strong>on</strong>itoring Traded Default Risk<br />
Traded credit products such as b<strong>on</strong>ds in our developed markets’ trading book are managed by a dedicated<br />
risk management unit combining our credit and market risk expertise. We use appropriate portfolio limits and<br />
ratings-driven thresholds <strong>on</strong> single-issuer basis, combined with our market risk management tools to risk<br />
manage such positi<strong>on</strong>s. Emerging markets traded credit products are risk managed using expertise which<br />
resides within our respective emerging markets credit risk unit and market risk management.<br />
Ec<strong>on</strong>omic Capital for Credit Risk<br />
We calculate ec<strong>on</strong>omic capital for the default risk, transfer risk and settlement risk as elements of credit risk.<br />
In line with our ec<strong>on</strong>omic capital framework, ec<strong>on</strong>omic capital for credit risk is set at a level to absorb with a<br />
probability of 99.98 % very severe aggregate unexpected losses within <strong>on</strong>e year.<br />
Our ec<strong>on</strong>omic capital for credit risk is derived from the loss distributi<strong>on</strong> of a portfolio via M<strong>on</strong>te Carlo simulati<strong>on</strong><br />
of correlated rating migrati<strong>on</strong>s. The loss distributi<strong>on</strong> is modeled in two steps. First, individual credit exposures<br />
are specified based <strong>on</strong> parameters for the probability of default, exposure at default and loss given<br />
default. In a sec<strong>on</strong>d step, the probability of joint defaults is modeled through the introducti<strong>on</strong> of ec<strong>on</strong>omic<br />
factors, which corresp<strong>on</strong>d to geographic regi<strong>on</strong>s and industries. The simulati<strong>on</strong> of portfolio losses is then<br />
performed by an internally developed model, which takes rating migrati<strong>on</strong> and maturity effects into account.<br />
We allocate expected losses and ec<strong>on</strong>omic capital derived from this loss distributi<strong>on</strong> down to transacti<strong>on</strong> level<br />
to enable management <strong>on</strong> transacti<strong>on</strong>, customer and business level.<br />
Loan Exposure Management Group<br />
As part of our overall framework of risk management, the Loan Exposure Management Group (“LEMG”)<br />
focuses <strong>on</strong> managing the credit risk of loans and lending-related commitments of the internati<strong>on</strong>al investmentgrade<br />
portfolio and the medium-sized German companies’ portfolio within our Corporate and Investment <strong>Bank</strong><br />
Group Divisi<strong>on</strong>.<br />
Acting as a central pricing reference, LEMG provides the respective Corporate and Investment <strong>Bank</strong> Group<br />
Divisi<strong>on</strong> businesses with an observed or derived capital market rate for loan applicati<strong>on</strong>s; however, the deci-<br />
si<strong>on</strong> of whether or not the business can enter into the loan remains with Credit Risk Management.<br />
144
LEMG is c<strong>on</strong>centrating <strong>on</strong> two primary initiatives within the credit risk framework to further enhance risk management<br />
discipline, improve returns and use capital more efficiently:<br />
— to reduce single-name and industry credit risk c<strong>on</strong>centrati<strong>on</strong>s within the credit portfolio and<br />
— to manage credit exposures actively by utilizing techniques including loan sales, securitizati<strong>on</strong> via collateralized<br />
loan obligati<strong>on</strong>s, default insurance coverage and single-name and portfolio credit default swaps.<br />
The noti<strong>on</strong>al amount of LEMG’s risk reducti<strong>on</strong> activities decreased by 7 % from € 56.7 billi<strong>on</strong> as of December<br />
31, <strong>20</strong>08, to € 52.9 billi<strong>on</strong> as of December 31, <str<strong>on</strong>g><strong>20</strong>09</str<strong>on</strong>g>.<br />
As of year-end <str<strong>on</strong>g><strong>20</strong>09</str<strong>on</strong>g>, LEMG held credit derivatives with an underlying noti<strong>on</strong>al amount of € 32.7 billi<strong>on</strong>. The<br />
positi<strong>on</strong> totaled € 36.5 billi<strong>on</strong> as of December 31, <strong>20</strong>08.<br />
The credit derivatives used for our portfolio management activities are accounted for at fair value.<br />
LEMG also mitigated the credit risk of € <strong>20</strong>.2 billi<strong>on</strong> of loans and lending-related commitments as of December<br />
31, <str<strong>on</strong>g><strong>20</strong>09</str<strong>on</strong>g>, by synthetic collateralized loan obligati<strong>on</strong>s supported predominantly by financial guarantees<br />
and, to a lesser extent, credit derivatives for which the first loss piece has been sold. This positi<strong>on</strong> totaled<br />
€ <strong>20</strong>.1 billi<strong>on</strong> as of December 31, <strong>20</strong>08.<br />
LEMG has elected to use the fair value opti<strong>on</strong> under IAS 39 to report loans and commitments at fair value,<br />
provided the criteria for this opti<strong>on</strong> are met. The noti<strong>on</strong>al amount of LEMG loans and commitments reported at<br />
fair value decreased during the year to € 48.9 billi<strong>on</strong> as of December 31, <str<strong>on</strong>g><strong>20</strong>09</str<strong>on</strong>g>, from € 50.5 billi<strong>on</strong> as of<br />
December 31, <strong>20</strong>08. By reporting loans and commitments at fair value, LEMG has significantly reduced profit<br />
and loss volatility that resulted from the accounting mismatch that existed when all loans and commitments<br />
were reported at historical cost while derivative hedges were reported at fair value.<br />
Credit Exposure<br />
We define our credit exposure by taking into account all transacti<strong>on</strong>s where losses might occur due to the fact<br />
that counterparties may not fulfill their c<strong>on</strong>tractual payment obligati<strong>on</strong>s.<br />
145
<strong>20</strong>-F Item 11: Quantitative and Qualitative Disclosures about Credit, Market and Other Risk<br />
Maximum Exposure to Credit Risk<br />
The following table presents our maximum exposure to credit risk without taking account of any collateral held<br />
or other credit enhancements that do not qualify for offset in our financial statements.<br />
in € m. 1 Dec 31, <str<strong>on</strong>g><strong>20</strong>09</str<strong>on</strong>g> Dec 31, <strong>20</strong>08<br />
Due from banks 9,346 9,826<br />
Interest-earning deposits with banks 47,233 64,739<br />
Central bank funds sold and securities purchased under resale agreements 6,8<strong>20</strong> 9,267<br />
Securities borrowed 43,509 35,022<br />
Financial assets at fair value through profit or loss 2 900,800 1,569,<strong>20</strong>3<br />
Financial assets available for sale 2 14,852 19,194<br />
Loans 3 261,448 271,219<br />
Other assets subject to credit risk 52,457 78,957<br />
Financial guarantees and other credit related c<strong>on</strong>tingent liabilities 4 52,183 48,815<br />
Irrevocable lending commitments and other credit related commitments 4 104,125 104,077<br />
Maximum exposure to credit risk 1,492,773 2,210,319<br />
1 All amounts at carrying value unless otherwise indicated.<br />
2 Excludes equities, other equity interests and commodities. Prior year numbers have been adjusted to reflect the exclusi<strong>on</strong> of commodities respectively.<br />
3 Gross loans less (deferred expense)/unearned income before deducti<strong>on</strong>s of allowance for loan losses.<br />
4 Financial guarantees, other credit related c<strong>on</strong>tingent liabilities and irrevocable lending commitments (including commitments designated under the fair<br />
value opti<strong>on</strong>) are reflected at noti<strong>on</strong>al amounts.<br />
In the tables below, we show details about several of our main credit exposure categories, namely loans,<br />
irrevocable lending commitments, c<strong>on</strong>tingent liabilities and over-the-counter (“OTC”) derivatives:<br />
— “Loans” are net loans as reported <strong>on</strong> our balance sheet at amortized cost but before deducti<strong>on</strong> of our<br />
allowance for loan losses.<br />
— “Irrevocable lending commitments” c<strong>on</strong>sist of the undrawn porti<strong>on</strong> of irrevocable lending-related commitments.<br />
— “C<strong>on</strong>tingent liabilities” c<strong>on</strong>sist of financial and performance guarantees, standby letters of credit and<br />
indemnity agreements.<br />
— “OTC derivatives” are our credit exposures from over-the-counter derivative transacti<strong>on</strong>s that we have<br />
entered into, after netting and cash collateral received. On our balance sheet, these are included in trading<br />
assets or, for derivatives qualifying for hedge accounting, in other assets, in either case, before netting<br />
and cash collateral received.<br />
146
Credit risk profile<br />
by regi<strong>on</strong><br />
in € m.<br />
The following table breaks down several of our main credit exposure categories by geographical regi<strong>on</strong>. For<br />
this table, we have allocated exposures to regi<strong>on</strong>s based <strong>on</strong> the country of domicile of our counterparties,<br />
irrespective of any affiliati<strong>on</strong>s the counterparties may have with corporate groups domiciled elsewhere. The<br />
decreases in the below credit exposure were primarily in OTC derivatives (mainly in Western Europe and<br />
North America) and loans. The loan reducti<strong>on</strong> was due to a decline of € 10.4 billi<strong>on</strong> loans in our North<br />
American portfolio while the derivative decrease across almost all regi<strong>on</strong>s was driven largely by rising interest<br />
rate curves and reducti<strong>on</strong> activities as well as tightening credit spreads during <str<strong>on</strong>g><strong>20</strong>09</str<strong>on</strong>g>.<br />
Dec 31,<br />
<str<strong>on</strong>g><strong>20</strong>09</str<strong>on</strong>g><br />
Loans 1 Irrevocable lending<br />
commitments 2<br />
Dec 31,<br />
<strong>20</strong>08<br />
Dec 31,<br />
<str<strong>on</strong>g><strong>20</strong>09</str<strong>on</strong>g><br />
Dec 31,<br />
<strong>20</strong>08<br />
C<strong>on</strong>tingent liabilities OTC derivatives 3 Total<br />
Eastern Europe 6,986 7,672 1,306 1,654 1,428 2,086 690 2,033 10,410 13,445<br />
Western Europe 187,251 185,577 41,118 38,698 25,254 25,289 24,536 48,677 278,159 298,241<br />
Africa 947 1,076 233 333 6<strong>20</strong> 566 458 297 2,258 2,272<br />
Asia/Pacific 16,921 16,887 5,793 6,156 7,086 6,223 7,060 13,225 36,860 42,491<br />
North America 45,717 56,129 55,337 56,812 17,018 13,943 30,805 57,177 148,877 184,061<br />
Central and South America 3,325 3,530 214 196 777 660 831 1,552 5,147 5,938<br />
Other4 301 348 124 228 – 48 160 629 585 1,253<br />
Total 261,448 271,219 104,125 104,077 52,183 48,815 64,540 123,590 482,296 547,701<br />
Dec 31,<br />
<str<strong>on</strong>g><strong>20</strong>09</str<strong>on</strong>g><br />
1 Includes impaired loans amounting to € 7.2 billi<strong>on</strong> as of December 31, <str<strong>on</strong>g><strong>20</strong>09</str<strong>on</strong>g> and € 3.7 billi<strong>on</strong> as of December 31, <strong>20</strong>08.<br />
2 Includes irrevocable lending commitments related to c<strong>on</strong>sumer credit exposure of € 2.9 billi<strong>on</strong> as of December 31, <str<strong>on</strong>g><strong>20</strong>09</str<strong>on</strong>g> and € 2.8 billi<strong>on</strong> as of December 31, <strong>20</strong>08.<br />
3 Includes the effect of netting agreements and cash collateral received where applicable.<br />
4 Includes supranati<strong>on</strong>al organizati<strong>on</strong>s and other exposures that we have not allocated to a single regi<strong>on</strong>.<br />
Credit risk profile<br />
by industry sector<br />
in € m.<br />
The following table breaks down several of our main credit exposure categories according to the industry<br />
sectors of our counterparties.<br />
Dec 31,<br />
<str<strong>on</strong>g><strong>20</strong>09</str<strong>on</strong>g><br />
Loans 1 Irrevocable lending<br />
commitments 2<br />
Dec 31,<br />
<strong>20</strong>08<br />
Dec 31,<br />
<str<strong>on</strong>g><strong>20</strong>09</str<strong>on</strong>g><br />
Dec 31,<br />
<strong>20</strong>08<br />
1 Includes impaired loans amounting to € 7.2 billi<strong>on</strong> as of December 31, <str<strong>on</strong>g><strong>20</strong>09</str<strong>on</strong>g> and € 3.7 billi<strong>on</strong> as of December 31, <strong>20</strong>08.<br />
2 Includes irrevocable lending commitments related to c<strong>on</strong>sumer credit exposure of € 2.9 billi<strong>on</strong> as of December 31, <strong>20</strong>08 and € 2.8 billi<strong>on</strong> as of December 31, <strong>20</strong>08.<br />
3 Includes the effect of netting agreements and cash collateral received where applicable.<br />
4 Loan exposures for Other include lease financing.<br />
147<br />
Dec 31,<br />
<strong>20</strong>08<br />
Dec 31,<br />
<str<strong>on</strong>g><strong>20</strong>09</str<strong>on</strong>g><br />
Dec 31,<br />
<strong>20</strong>08<br />
Dec 31,<br />
<str<strong>on</strong>g><strong>20</strong>09</str<strong>on</strong>g><br />
Dec 31,<br />
<strong>20</strong>08<br />
C<strong>on</strong>tingent liabilities OTC derivatives 3 Total<br />
<strong>Bank</strong>s and insurance 22,002 26,998 25,289 24,970 11,315 11,568 27,948 68,641 86,554 132,177<br />
Manufacturing 17,314 19,043 24,814 24,889 16,809 13,669 2,169 4,550 61,106 62,151<br />
Households 85,675 83,376 4,278 3,862 1,8<strong>20</strong> 1,768 801 791 92,574 89,797<br />
Public sector 9,572 9,972 5<strong>20</strong> 819 19 628 5,527 7,125 15,638 18,544<br />
Wholesale and retail trade<br />
Commercial real estate<br />
10,938 11,761 6,027 6,377 3,443 3,423 604 1,264 21,012 22,825<br />
activities 28,959 27,083 1,876 2,239 2,194 2,403 1,286 3,213 34,315 34,938<br />
Fund management activities 26,462 31,158 11,135 12,998 540 678 12,922 23,114 51,059 67,948<br />
Other4 60,526 61,828 30,186 27,923 16,043 14,678 13,283 14,892 1<strong>20</strong>,038 119,321<br />
Total 261,448 271,219 104,125 104,077 52,183 48,815 64,540 123,590 482,296 547,701<br />
Dec 31,<br />
<str<strong>on</strong>g><strong>20</strong>09</str<strong>on</strong>g><br />
Dec 31,<br />
<strong>20</strong>08<br />
Dec 31,<br />
<str<strong>on</strong>g><strong>20</strong>09</str<strong>on</strong>g><br />
Dec 31,<br />
<strong>20</strong>08<br />
Dec 31,<br />
<str<strong>on</strong>g><strong>20</strong>09</str<strong>on</strong>g><br />
Dec 31,<br />
<strong>20</strong>08
<strong>20</strong>-F Item 11: Quantitative and Qualitative Disclosures about Credit, Market and Other Risk<br />
Our loans, irrevocable lending commitments, c<strong>on</strong>tingent liabilities and OTC derivatives-related credit<br />
exposure to our ten largest counterparties account for 7 % of our aggregated total credit exposure in these<br />
categories as of December 31, <str<strong>on</strong>g><strong>20</strong>09</str<strong>on</strong>g>. Our top ten counterparty exposures are by majority with well-rated<br />
counterparties or relate to structured trades which show high levels of risk mitigati<strong>on</strong>, with the excepti<strong>on</strong> of<br />
<strong>on</strong>e leveraged finance exposure.<br />
Higher-Risk Loans<br />
Certain types of loans have a higher risk of n<strong>on</strong>-collecti<strong>on</strong> than others. In our amortized cost loan portfolio we<br />
c<strong>on</strong>sider our Corporate Finance Leveraged and commercial real estate loans to be included in this category<br />
as well as certain other loans not included in our low and medium risk categories.<br />
As of December 31, <str<strong>on</strong>g><strong>20</strong>09</str<strong>on</strong>g> our higher-risk amortized cost loan portfolio amounted to € 31.2 billi<strong>on</strong> or 12 % of<br />
our overall loan portfolio. The below table summarizes our higher-risk loans by risk category as well as the<br />
level of impaired loans and corresp<strong>on</strong>ding allowances for loan losses.<br />
Higher-risk loans by risk category Dec 31, <str<strong>on</strong>g><strong>20</strong>09</str<strong>on</strong>g><br />
Amortized<br />
thereof: Allowance for<br />
in € m.<br />
cost loans impaired loans loan losses<br />
Leveraged finance 11,768 2,122 815<br />
Commercial real estate1 12,990 460 274<br />
Other 6,442 934 377<br />
Total 31,<strong>20</strong>0 3,516 1,466<br />
1 Reflects commercial real estate related loans in our Corporate Finance divisi<strong>on</strong> within our Corporate <strong>Bank</strong>ing & Securities segment.<br />
We typically do not enter into subprime lending, junior lien mortgages or interest <strong>on</strong>ly lending. We do however,<br />
enter into higher margin c<strong>on</strong>sumer finance lending within our Private & Business Clients segment which<br />
we categorize as medium risk. The majority of our c<strong>on</strong>sumer finance exposure relates to customers in<br />
Germany and Italy.<br />
Please see the following secti<strong>on</strong>s <strong>on</strong> corporate credit exposure and c<strong>on</strong>sumer credit exposure for additi<strong>on</strong>al<br />
informati<strong>on</strong> <strong>on</strong> our overall loan portfolio.<br />
Credit Exposure Classificati<strong>on</strong><br />
We also classify our credit exposure under two broad headings: corporate credit exposure and c<strong>on</strong>sumer<br />
credit exposure.<br />
— Our corporate credit exposure c<strong>on</strong>sists of all exposures not defined as c<strong>on</strong>sumer credit exposure.<br />
— Our c<strong>on</strong>sumer credit exposure c<strong>on</strong>sists of our smaller-balance standardized homogeneous loans, primari-<br />
ly in Germany, Italy and Spain, which include pers<strong>on</strong>al loans, residential and n<strong>on</strong>residential mortgage<br />
loans, overdrafts and loans to self-employed and small business customers of our private and retail<br />
business.<br />
148
Corporate credit exposure<br />
credit risk profile<br />
by creditworthiness category<br />
in € m.<br />
Corporate Credit Exposure<br />
The following table breaks down several of our main corporate credit exposure categories according to the<br />
creditworthiness categories of our counterparties.<br />
This table reflects a marginal decrease in our corporate loan book combined with a larger decrease in our<br />
OTC derivatives exposure. The porti<strong>on</strong> of our corporate loan book carrying an investment-grade rating<br />
decreased from 66 % at December 31, <strong>20</strong>08 to 61 % at December 31, <str<strong>on</strong>g><strong>20</strong>09</str<strong>on</strong>g>, reflecting the c<strong>on</strong>tinued credit<br />
deteriorati<strong>on</strong> throughout <str<strong>on</strong>g><strong>20</strong>09</str<strong>on</strong>g> in light of the credit crisis. However, the loan exposure shown in the table below<br />
does not take into account any collateral, other credit enhancement or credit risk mitigating transacti<strong>on</strong>s. After<br />
c<strong>on</strong>siderati<strong>on</strong> of such credit mitigants, we believe that there is no inappropriate c<strong>on</strong>centrati<strong>on</strong> risk and our<br />
loan book is well-diversified. The decrease in our OTC derivatives exposure, particularly in the AAA–AA<br />
range, was substantially driven by rising interest rate curves and reducti<strong>on</strong> activities as well as tightening<br />
credit spreads during <str<strong>on</strong>g><strong>20</strong>09</str<strong>on</strong>g>. The OTC derivatives exposure as shown below does not include credit risk mitigants<br />
(other than master agreement netting) or collateral (other than cash). Taking these mitigants into<br />
account, the remaining current credit exposure is significantly lower and in our judgment well-diversified and<br />
geared towards investment grade counterparties.<br />
Dec 31,<br />
<str<strong>on</strong>g><strong>20</strong>09</str<strong>on</strong>g><br />
Loans 1 Irrevocable lending<br />
commitments 2<br />
Dec 31,<br />
<strong>20</strong>08<br />
Dec 31,<br />
<str<strong>on</strong>g><strong>20</strong>09</str<strong>on</strong>g><br />
Dec 31,<br />
<strong>20</strong>08<br />
1 Includes impaired loans mainly in category CCC and below amounting to € 4.9 billi<strong>on</strong> as of December 31, <str<strong>on</strong>g><strong>20</strong>09</str<strong>on</strong>g> and € 2.3 billi<strong>on</strong> as of December 31, <strong>20</strong>08.<br />
2 Includes irrevocable lending commitments related to c<strong>on</strong>sumer credit exposure of € 2.9 billi<strong>on</strong> as of December 31, <str<strong>on</strong>g><strong>20</strong>09</str<strong>on</strong>g> and € 2.8 billi<strong>on</strong> as of<br />
December 31, <strong>20</strong>08.<br />
3 Includes the effect of netting agreements and cash collateral received where applicable.<br />
C<strong>on</strong>sumer Credit Exposure<br />
The table below presents our total c<strong>on</strong>sumer credit exposure, c<strong>on</strong>sumer loan delinquencies in terms of loans<br />
that are 90 days or more past due, and net credit costs, which are the net provisi<strong>on</strong>s charged during the<br />
period, after recoveries. Loans 90 days or more past due and net credit costs are both expressed as a percentage<br />
of total exposure.<br />
1 Includes impaired loans amounting to € 2.3 billi<strong>on</strong> as of December 31, <str<strong>on</strong>g><strong>20</strong>09</str<strong>on</strong>g> and € 1.4 billi<strong>on</strong> as of December 31, <strong>20</strong>08.<br />
C<strong>on</strong>tingent liabilities OTC derivatives 3 Total<br />
AAA–AA 28,134 40,749 22,211 <strong>20</strong>,373 6,573 5,926 23,966 65,598 80,884 132,646<br />
A 29,634 29,752 22,758 30,338 13,231 11,976 13,793 22,231 79,416 94,297<br />
BBB 46,889 53,360 28,814 26,510 15,753 15,375 7,600 15,762 99,056 111,007<br />
BB 43,401 44,132 23,031 19,657 9,860 10,239 12,785 13,009 89,077 87,037<br />
B 9,090 10,458 5,935 5,276 4,290 4,412 1,952 3,898 21,267 24,044<br />
CCC and below 14,633 8,268 1,376 1,923 2,476 887 4,444 3,092 22,929 14,170<br />
Total 171,781 186,719 104,125 104,077 52,183 48,815 64,540 123,590 392,629 463,<strong>20</strong>1<br />
Dec 31,<br />
<str<strong>on</strong>g><strong>20</strong>09</str<strong>on</strong>g><br />
Dec 31,<br />
<str<strong>on</strong>g><strong>20</strong>09</str<strong>on</strong>g><br />
Total exposure<br />
in € m.<br />
Dec 31,<br />
<strong>20</strong>08<br />
149<br />
Dec 31,<br />
<strong>20</strong>08<br />
Dec 31,<br />
<str<strong>on</strong>g><strong>20</strong>09</str<strong>on</strong>g><br />
90 days or more past due<br />
as a % of total exposure<br />
Dec 31,<br />
<str<strong>on</strong>g><strong>20</strong>09</str<strong>on</strong>g><br />
Dec 31,<br />
<strong>20</strong>08<br />
Dec 31,<br />
<strong>20</strong>08<br />
Dec 31,<br />
<str<strong>on</strong>g><strong>20</strong>09</str<strong>on</strong>g><br />
Dec 31,<br />
<strong>20</strong>08<br />
Net credit costs<br />
as a % of total exposure<br />
Dec 31,<br />
<str<strong>on</strong>g><strong>20</strong>09</str<strong>on</strong>g><br />
Dec 31,<br />
<strong>20</strong>08<br />
C<strong>on</strong>sumer credit exposure Germany: 59,804 57,139 1.73 % 1.54 % 0.55 % 0.65 %<br />
C<strong>on</strong>sumer and small business financing 13,556 15,047 2.72 % 1.98 % 1.69 % 1.98 %<br />
Mortgage lending 46,248 42,092 1.44 % 1.39 % 0.22 % 0.18 %<br />
C<strong>on</strong>sumer credit exposure outside Germany 29,864 27,361 3.37 % 1.92 % 1.27 % 0.94 %<br />
Total c<strong>on</strong>sumer credit exposure 1 89,668 84,500 2.28 % 1.67 % 0.79 % 0.74 %
<strong>20</strong>-F Item 11: Quantitative and Qualitative Disclosures about Credit, Market and Other Risk<br />
The volume of our c<strong>on</strong>sumer credit exposure rose by € 5.2 billi<strong>on</strong>, or 6 %, from <strong>20</strong>08 to <str<strong>on</strong>g><strong>20</strong>09</str<strong>on</strong>g>, driven both by<br />
the volume growth of our portfolio in Germany (up € 2.7 billi<strong>on</strong>) as well as outside Germany (up € 2.5 billi<strong>on</strong>)<br />
with str<strong>on</strong>g growth in Italy (up € 1.1 billi<strong>on</strong>), Poland (up € 1.0 billi<strong>on</strong>) and Spain (up € 0.2 billi<strong>on</strong>).<br />
Total net credit costs as a percentage of total exposure were positively impacted by changes in certain parameter<br />
and model assumpti<strong>on</strong>s, which reduced provisi<strong>on</strong>s by € 146 milli<strong>on</strong>. The increase in net credit costs in<br />
<str<strong>on</strong>g><strong>20</strong>09</str<strong>on</strong>g> compared to <strong>20</strong>08 reflected our strategy to invest in higher margin c<strong>on</strong>sumer finance business as well<br />
as the deteriorating credit c<strong>on</strong>diti<strong>on</strong>s in Spain. The increase in net credit costs took place in our portfolios<br />
outside Germany and was mainly driven by the exacerbating ec<strong>on</strong>omic crisis in Spain which adversely<br />
affected our mortgage loan and commercial finance portfolios there and by our c<strong>on</strong>sumer finance business<br />
in Poland and India. The higher percentage of delinquent loans outside Germany was predominantly driven<br />
by our mortgage business in Spain.<br />
Collateral held as Security<br />
We regularly agree <strong>on</strong> collateral to be received from customers in c<strong>on</strong>tracts that are subject to credit risk. We<br />
also regularly agree <strong>on</strong> collateral to be received from borrowers in our lending c<strong>on</strong>tracts. Collateral is security<br />
in the form of an asset or third-party obligati<strong>on</strong> that serves to mitigate the inherent risk of credit loss in an<br />
exposure, by either substituting the borrower default risk or improving recoveries in the event of a default.<br />
While collateral can be an alternative source of repayment, it does not replace the necessity of high quality<br />
underwriting standards.<br />
We segregate collateral received into the following two types:<br />
— Financial and other collateral, which enables us to recover all or part of the outstanding exposure by liqui-<br />
dating the collateral asset provided, in cases where the borrower is unable or unwilling to fulfill its primary<br />
obligati<strong>on</strong>s. Cash collateral, securities (equity, b<strong>on</strong>ds), collateral assignments of other claims or inventory,<br />
equipment (e.g., plant, machinery, aircraft) and real estate typically fall into this category.<br />
— Guarantee collateral, which substitutes the borrower’s ability to fulfill its obligati<strong>on</strong> under the legal c<strong>on</strong>tract<br />
and as such is provided by third parties. Letters of Credit, insurance c<strong>on</strong>tracts, received guarantees and<br />
risk participati<strong>on</strong>s typically fall into this category.<br />
Additi<strong>on</strong>ally, we actively manage the credit risk of our loans and lending-related commitments through our<br />
specialized unit LEMG. To manage better our derivatives-related credit risk, we enter into collateral support<br />
arrangements as described further below.<br />
150
C<strong>on</strong>centrati<strong>on</strong>s of Credit Risk<br />
Significant c<strong>on</strong>centrati<strong>on</strong>s of credit risk exist if we have material exposures to a number of counterparties with<br />
similar ec<strong>on</strong>omic characteristics, or who are engaged in comparable activities, where these similarities may<br />
cause their ability to meet c<strong>on</strong>tractual obligati<strong>on</strong>s to be affected in the same manner by changes in ec<strong>on</strong>omic<br />
or industry c<strong>on</strong>diti<strong>on</strong>s. A c<strong>on</strong>centrati<strong>on</strong> of credit risk may also exist at an individual counterparty level.<br />
In order to m<strong>on</strong>itor and manage credit risks, we use a comprehensive range of quantitative tools and metrics.<br />
Credit limits relating to counterparties, countries, products and other factors set the maximum credit exposures<br />
that we intend to incur.<br />
Our largest c<strong>on</strong>centrati<strong>on</strong>s of credit risk within loans are in Western Europe and North America, with a significant<br />
share in households. The c<strong>on</strong>centrati<strong>on</strong> in Western Europe is principally in our home market Germany,<br />
which includes most of the mortgage lending business. Within the OTC derivatives business our largest c<strong>on</strong>centrati<strong>on</strong>s<br />
are also in Western Europe and North America, with a significant share in banks and insurances<br />
mainly within the investment-grade rating band.<br />
Our higher-risk loans are c<strong>on</strong>centrated in Commercial Real Estate and Leveraged Finance, with the latter<br />
including a borrower group c<strong>on</strong>centrati<strong>on</strong> c<strong>on</strong>tributing approximately 40 % of the exposure in this category.<br />
Credit Exposure from Derivatives<br />
Exchange-traded derivative transacti<strong>on</strong>s (e.g., futures and opti<strong>on</strong>s) are regularly settled through a central<br />
counterparty (e.g., LCH. Clearnet Ltd. or Eurex Clearing AG), the rules and regulati<strong>on</strong>s of which provide for<br />
daily margining of all current and future credit risk positi<strong>on</strong>s emerging out of such transacti<strong>on</strong>s. To the extent<br />
possible, we also use central counterparty clearing services for OTC derivative transacti<strong>on</strong>s (“OTC clearing”);<br />
we thereby benefit from the credit risk mitigati<strong>on</strong> achieved through the central counterparty’s settlement system.<br />
In order to reduce the credit risk resulting from OTC derivative transacti<strong>on</strong>s, where OTC clearing is not avail-<br />
able, we regularly seek the executi<strong>on</strong> of standard master agreements (such as the Internati<strong>on</strong>al Swaps and<br />
Derivatives Associati<strong>on</strong>’s master agreements for derivatives or the German Master Agreement for Financial<br />
Derivative Transacti<strong>on</strong>s) with our clients. A master agreement allows the netting of rights and obligati<strong>on</strong>s aris-<br />
ing under derivative transacti<strong>on</strong>s that have been entered into under such master agreement up<strong>on</strong> the counterparty’s<br />
default, resulting in a single net claim owed by or to the counterparty (“close-out netting”). For parts<br />
of the derivatives business (e.g., foreign exchange transacti<strong>on</strong>s) we also enter into master agreements under<br />
which we set off amounts payable <strong>on</strong> the same day in the same currency and in respect to transacti<strong>on</strong>s<br />
covered by such master agreements (“payment netting”), reducing our settlement risk.<br />
151
<strong>20</strong>-F Item 11: Quantitative and Qualitative Disclosures about Credit, Market and Other Risk<br />
In our risk measurement and risk assessment processes we apply netting <strong>on</strong>ly to the extent we have satisfied<br />
ourselves of the legal validity and enforceability of the master agreement in all relevant jurisdicti<strong>on</strong>s.<br />
Also, we enter into collateral support annexes (“CSA”) to master agreements in order to further reduce our<br />
derivatives-related credit risk. These collateral support annexes generally provide risk mitigati<strong>on</strong> through<br />
periodic (usually daily) margining of the covered exposure. The CSA also provides for the right to terminate<br />
the related derivative transacti<strong>on</strong>s up<strong>on</strong> the counterparty’s failure to h<strong>on</strong>or a margin call. As with netting, when<br />
we believe the collateral support annex is enforceable, we reflect this in our exposure measurement.<br />
As the replacement values of derivatives portfolios fluctuate with movements in market rates and with<br />
changes in the transacti<strong>on</strong>s in the portfolios, we also estimate the potential future replacement costs of the<br />
portfolios over their lifetimes or, in case of collateralized portfolios, over appropriate unwind periods. We<br />
measure the potential future exposure against separate limits. We supplement the potential future exposure<br />
analysis with stress tests to estimate the immediate impact of extreme market events <strong>on</strong> our exposures (such<br />
as event risk in our Emerging Markets portfolio).<br />
The potential future exposure measure which we use is generally given by a time profile of simulated positive<br />
market values of each counterparty’s derivatives portfolio, for which netting and collateralizati<strong>on</strong> are c<strong>on</strong>sidered.<br />
For limit m<strong>on</strong>itoring we employ the 95th quantile of the resulting distributi<strong>on</strong> of market values, internally<br />
referred to as potential future exposure (“PFE”). The average exposure profiles generated by the same calculati<strong>on</strong><br />
process are used to derive the so-called average expected exposure (“AEE”) measure, which we use to<br />
reflect potential future replacement costs within our credit risk ec<strong>on</strong>omic capital, and the expected positive<br />
exposure (“EPE”) measure driving our regulatory capital requirements. While AEE and EPE are generally<br />
calculated with respect to a time horiz<strong>on</strong> of <strong>on</strong>e year, the PFE is measured over the entire lifetime of a transacti<strong>on</strong><br />
or netting set. We also employ the aforementi<strong>on</strong>ed calculati<strong>on</strong> process to derive stressed exposure<br />
results for input into our credit portfolio stress testing.<br />
Certain collateral support annexes to master agreements provide for rating dependent triggers, where addi-<br />
ti<strong>on</strong>al collateral must be pledged if a party’s rating is downgraded. We also enter into master agreements that<br />
provide for an additi<strong>on</strong>al terminati<strong>on</strong> event up<strong>on</strong> a party’s rating downgrade. We analyze and m<strong>on</strong>itor potential<br />
c<strong>on</strong>tingent payment obligati<strong>on</strong>s resulting from a rating downgrade in our stress testing approach for liquidity<br />
risk <strong>on</strong> an <strong>on</strong>going basis.<br />
152
Credit Valuati<strong>on</strong> Adjustment<br />
We establish a counterparty credit valuati<strong>on</strong> adjustment for OTC derivative transacti<strong>on</strong>s to cover expected<br />
credit losses. The adjustment amount is determined at each reporting date by assessing the potential credit<br />
exposure to all counterparties, taking into account any collateral held, the effect of netting under a master<br />
agreement, expected loss given default and the credit risk for each counterparty based <strong>on</strong> historic default<br />
levels.<br />
The credit valuati<strong>on</strong> adjustments are significant for certain m<strong>on</strong>oline counterparties. These credit valuati<strong>on</strong><br />
adjustments are assessed using a model-based approach with numerous input factors for each counterparty,<br />
including the likelihood of an event (either a restructuring or insolvency), an assessment of any potential<br />
settlement in the event of a restructuring, and recovery rates in the event of either restructuring or insolvency.<br />
We recorded € 1.2 billi<strong>on</strong> in credit valuati<strong>on</strong> adjustments against our aggregate m<strong>on</strong>oline exposures for <str<strong>on</strong>g><strong>20</strong>09</str<strong>on</strong>g><br />
and € 2.2 billi<strong>on</strong> for <strong>20</strong>08.<br />
Treatment of Default Situati<strong>on</strong>s under Derivatives<br />
Unlike in the case of the standard loan assets, we generally have more opti<strong>on</strong>s to manage the credit risk in<br />
our OTC derivatives when movement in the current replacement costs of the transacti<strong>on</strong>s and the behavior of<br />
our counterparty indicate that there is the risk that upcoming payment obligati<strong>on</strong>s under the transacti<strong>on</strong>s<br />
might not be h<strong>on</strong>ored. In these situati<strong>on</strong>s, we are frequently able under prevailing c<strong>on</strong>tracts to obtain additi<strong>on</strong>al<br />
collateral or terminate the transacti<strong>on</strong>s or the related master agreement.<br />
The master agreements executed with our clients usually provide for a broad set of standard or bespoke terminati<strong>on</strong><br />
rights, which allows us to resp<strong>on</strong>d swiftly to a counterparty’s default or to other circumstances which<br />
indicate a high probability of failure. When our decisi<strong>on</strong> to terminate derivative transacti<strong>on</strong>s or the related<br />
master agreement results in a residual net obligati<strong>on</strong> owed by the counterparty, we restructure the obligati<strong>on</strong><br />
into a n<strong>on</strong>-derivative claim and manage it through our regular work-out process. As a c<strong>on</strong>sequence, for<br />
accounting purposes we typically do not show any n<strong>on</strong>performing derivatives.<br />
153
<strong>20</strong>-F Item 11: Quantitative and Qualitative Disclosures about Credit, Market and Other Risk<br />
The following table shows the noti<strong>on</strong>al amounts and gross market values of OTC and exchange-traded<br />
derivative c<strong>on</strong>tracts we held for trading and n<strong>on</strong>trading purposes as of December 31, <str<strong>on</strong>g><strong>20</strong>09</str<strong>on</strong>g>.<br />
Dec 31, <str<strong>on</strong>g><strong>20</strong>09</str<strong>on</strong>g> Noti<strong>on</strong>al amount maturity distributi<strong>on</strong> Positive<br />
in € m.<br />
Interest-rate-related transacti<strong>on</strong>s:<br />
OTC products:<br />
Within<br />
1 year<br />
> 1 and<br />
≤ 5 years<br />
After<br />
5 years<br />
Total market<br />
value<br />
FRAs 4,004,491 615,931 2,303 4,622,725 4,397 (4,527) (130)<br />
Interest rate swaps (single currency) 10,572,347 11,700,210 9,269,299 31,541,856 299,453 (279,432) <strong>20</strong>,021<br />
Purchased interest rate opti<strong>on</strong>s 450,445 581,527 280,712 1,312,684 48,463 – 48,463<br />
Written interest rate opti<strong>on</strong>s<br />
Exchange-traded products:<br />
442,358 614,986 311,080 1,368,424 – (51,171) (51,171)<br />
Interest rate futures <strong>20</strong>5,162 303,061 531 508,754 – – –<br />
Purchased interest rate opti<strong>on</strong>s 336,826 13,<strong>20</strong>9 – 350,035 188 – 188<br />
Written interest rate opti<strong>on</strong>s 331,852 17,997 – 349,849 – (182) (182)<br />
Sub-total<br />
Currency-related transacti<strong>on</strong>s:<br />
OTC products:<br />
16,343,481 13,846,921 9,863,925 40,054,327 352,501 (335,312) 17,189<br />
Forward exchange trades 549,758 44,789 5,362 599,909 9,894 (9,486) 408<br />
Cross currency swaps 1,851,617 882,409 561,<strong>20</strong>0 3,295,226 65,502 (71,424) (5,922)<br />
Purchased foreign currency opti<strong>on</strong>s 242,068 83,743 27,3<strong>20</strong> 353,131 11,947 – 11,947<br />
Written foreign currency opti<strong>on</strong>s<br />
Exchange-traded products:<br />
236,324 100,351 27,239 363,914 – (11,699) (11,699)<br />
Foreign currency futures 10,169 522 – 10,691 – (8) (8)<br />
Purchased foreign currency opti<strong>on</strong>s 2,695 85 – 2,780 45 – 45<br />
Written foreign currency opti<strong>on</strong>s 1,716 4 – 1,7<strong>20</strong> – (58) (58)<br />
Sub-total<br />
Equity/index-related transacti<strong>on</strong>s:<br />
OTC products:<br />
2,894,347 1,111,903 621,121 4,627,371 87,388 (92,675) (5,287)<br />
Equity forward 1,546 7 489 2,042 183 (151) 32<br />
Equity/index swaps 68,333 27,602 18,970 114,905 6,525 (7,802) (1,277)<br />
Purchased equity/index opti<strong>on</strong>s 79,512 89,839 29,879 199,230 28,469 – 28,469<br />
Written equity/index opti<strong>on</strong>s<br />
Exchange-traded products:<br />
104,732 117,965 37,347 260,044 – (34,248) (34,248)<br />
Equity/index futures 17,<strong>20</strong>1 258 63 17,522 – – –<br />
Equity/index purchased opti<strong>on</strong>s 126,918 56,747 6,887 190,552 2,985 – 2,985<br />
Equity/index written opti<strong>on</strong>s 119,173 56,478 7,172 182,823 – (2,327) (2,327)<br />
Sub-total 517,415 348,896 100,807 967,118 38,162 (44,528) (6,366)<br />
Credit derivatives<br />
Other transacti<strong>on</strong>s:<br />
OTC products:<br />
398,530 2,236,492 794,414 3,429,436 104,384 (88,337) 16,047<br />
Precious metal trades 55,705 40,469 5,<strong>20</strong>2 101,376 4,446 (3,959) 487<br />
Other trades<br />
Exchange-traded products:<br />
59,483 115,358 4,631 179,472 13,238 (13,111) 127<br />
Futures <strong>20</strong>,073 15,092 1,067 36,232 <strong>20</strong> (27) (7)<br />
Purchased opti<strong>on</strong>s 17,235 12,390 262 29,887 3,093 – 3,093<br />
Written opti<strong>on</strong>s 17,511 10,226 723 28,460 – (2,827) (2,827)<br />
Sub-total 170,007 193,535 11,885 375,427 <strong>20</strong>,797 (19,924) 873<br />
Total OTC business 19,117,249 17,251,678 11,375,447 47,744,374 596,901 (575,347) 21,554<br />
Total exchange-traded business 1,<strong>20</strong>6,531 486,069 16,705 1,709,305 6,331 (5,429) 902<br />
Total<br />
Positive market values including the effect of netting<br />
<strong>20</strong>,323,780 17,737,747 11,392,152 49,453,679 603,232 (580,776) 22,456<br />
and cash collateral received 69,368<br />
154<br />
Negative<br />
market<br />
value<br />
Net<br />
market<br />
value
Distributi<strong>on</strong> Risk<br />
We frequently underwrite large commitments with the intenti<strong>on</strong> to sell down or distribute most of the risk to<br />
third parties. These commitments include the undertaking to fund bank loans and to provide bridge loans for<br />
the issuance of public b<strong>on</strong>ds.<br />
For risk management purposes we treat the full amount of all such commitments as credit exposure requiring<br />
formal credit approval. This approval also includes our intended final hold. Amounts which we intend to sell<br />
are classified as trading assets and are subject to fair value accounting. The price volatility is m<strong>on</strong>itored in our<br />
market risk process. To protect us against a value deteriorati<strong>on</strong> of such amounts, we may enter into generic<br />
market risk hedges (most comm<strong>on</strong>ly using related indices), which are also captured in our market risk<br />
process.<br />
Country Risk<br />
We manage country risk through a number of risk measures and limits, the most important being:<br />
— Total counterparty exposure. All credit extended and OTC derivatives exposure to counterparties domiciled<br />
in a given country that we view as being at risk due to ec<strong>on</strong>omic or political events (“country risk<br />
event”). It includes n<strong>on</strong>guaranteed subsidiaries of foreign entities and offshore subsidiaries of local clients.<br />
— Transfer risk exposure. Credit risk arising where an otherwise solvent and willing debtor is unable to meet<br />
its obligati<strong>on</strong>s due to the impositi<strong>on</strong> of governmental or regulatory c<strong>on</strong>trols restricting its ability either to<br />
obtain foreign exchange or to transfer assets to n<strong>on</strong>residents (a “transfer risk event”). It includes all of our<br />
credit extended and OTC derivatives exposure from <strong>on</strong>e of our offices in <strong>on</strong>e country to a counterparty in<br />
a different country.<br />
— Highly-stressed event risk scenarios. We use stress testing to measure potential risks <strong>on</strong> our trading positi<strong>on</strong>s<br />
and view these as market risk.<br />
Country Risk Ratings<br />
Our country risk ratings represent a key tool in our management of country risk. They are established by an<br />
independent country risk research functi<strong>on</strong> within our Credit Risk Management functi<strong>on</strong> and include:<br />
— Sovereign rating. A measure of the probability of the sovereign defaulting <strong>on</strong> its foreign or local currency<br />
obligati<strong>on</strong>s.<br />
— Transfer risk rating. A measure of the probability of a “transfer risk event.”<br />
— Event risk rating. A measure of the probability of major disrupti<strong>on</strong>s in the market risk factors relating to a<br />
country.<br />
All sovereign and transfer risk ratings are reviewed, at least annually, by the Group Credit Policy Committee,<br />
a sub-committee of our Risk Executive Committee. Our country risk research group also reviews, at least<br />
quarterly, our ratings for the major Emerging Markets countries. Ratings for countries that we view as particularly<br />
volatile, as well as all event risk ratings, are subject to c<strong>on</strong>tinuous review.<br />
We also regularly compare our internal risk ratings with the ratings of the major internati<strong>on</strong>al rating agencies.<br />
155
<strong>20</strong>-F Item 11: Quantitative and Qualitative Disclosures about Credit, Market and Other Risk<br />
Country Risk Limits<br />
We manage our exposure to country risk through a framework of limits. The bank specifically limits and m<strong>on</strong>itors<br />
its exposure to Emerging Markets. For this purpose, Emerging Markets are defined as Latin America<br />
(including the Caribbean), Asia (excluding Japan), Eastern Europe, the Middle East and Africa. Limits are<br />
reviewed at least annually, in c<strong>on</strong>juncti<strong>on</strong> with the review of country risk ratings. Country Risk limits are set by<br />
either our Management Board or by our Group Credit Policy Committee, pursuant to delegated authority.<br />
M<strong>on</strong>itoring Country Risk<br />
We charge our group divisi<strong>on</strong>s with the resp<strong>on</strong>sibility of managing their country risk within the approved limits.<br />
The regi<strong>on</strong>al units within Credit Risk Management m<strong>on</strong>itor our country risk based <strong>on</strong> informati<strong>on</strong> provided by<br />
our finance functi<strong>on</strong>. Our Group Credit Policy Committee also reviews data <strong>on</strong> transfer risk.<br />
Country Risk Exposure<br />
The following tables show the development of total Emerging Markets net counterparty exposure (net of collateral),<br />
and the utilized Emerging Markets net transfer risk exposure (net of collateral) by regi<strong>on</strong>.<br />
Emerging Markets net counterparty exposure<br />
in € m.<br />
Dec 31, <str<strong>on</strong>g><strong>20</strong>09</str<strong>on</strong>g> Dec 31, <strong>20</strong>08<br />
Total net counterparty exposure 28,075 26,214<br />
Total net counterparty exposure (excluding OTC derivatives) 22,591 17,697<br />
Excluding irrevocable commitments and exposures to n<strong>on</strong>-Emerging Markets bank branches.<br />
Emerging Markets net transfer risk exposure<br />
in € m.<br />
Dec 31, <str<strong>on</strong>g><strong>20</strong>09</str<strong>on</strong>g> Dec 31, <strong>20</strong>08<br />
Africa 1,101 914<br />
Asia (excluding Japan) 5,321 5,472<br />
Eastern Europe 2,129 3,364<br />
Latin America 2,234 1,647<br />
Middle East 4,041 3,402<br />
Total emerging markets net transfer risk exposure 14,826 14,799<br />
Excluding irrevocable commitments and exposures to n<strong>on</strong>-Emerging Markets bank branches.<br />
As of December 31, <str<strong>on</strong>g><strong>20</strong>09</str<strong>on</strong>g>, our net transfer risk exposure to Emerging Markets (excluding irrevocable commitments<br />
and exposures to n<strong>on</strong>-Emerging Markets bank branches) amounted to € 14.8 billi<strong>on</strong>, virtually unchanged,<br />
from December 31, <strong>20</strong>08, as increases in cross border credit related transacti<strong>on</strong>s to Middle East,<br />
Latin America and Asia (excluding Japan) were offset by a reducti<strong>on</strong> to Eastern Europe and a reducti<strong>on</strong> of<br />
OTC derivative exposures across almost all regi<strong>on</strong>s.<br />
156
Problem Loans<br />
Our problem loans c<strong>on</strong>sist mainly of our impaired loans. Our Credit Risk Management regularly assesses<br />
whether there is objective evidence that a loan or group of loans is impaired. A loan or group of loans is impaired<br />
and impairment losses are incurred if<br />
— there is objective evidence of impairment as a result of a loss event that occurred after the initial recogni-<br />
ti<strong>on</strong> of the asset and up to the balance sheet date (a “loss event”),<br />
— the loss event had an impact <strong>on</strong> the estimated future cash flows of the financial asset or the group of<br />
financial assets, and<br />
— a reliable estimate of the loss amount can be made.<br />
The impairment loss is generally calculated <strong>on</strong> the basis of discounted expected cash flows using the original<br />
effective interest rate of the loan. For troubled debt restructurings (as defined below) the original effective<br />
interest rate before modificati<strong>on</strong> of terms is used.<br />
While we assess the impairment for our corporate credit exposures individually, we assess the impairment of<br />
our smaller-balance standardized homogeneous loans collectively.<br />
The sec<strong>on</strong>d comp<strong>on</strong>ent of our problem loans are n<strong>on</strong>impaired problem loans, where no impairment loss is<br />
recorded but where either known informati<strong>on</strong> about possible credit problems of borrowers causes manage-<br />
ment to have serious doubts as to the ability of such borrowers to comply with the present loan repayment<br />
terms or that are 90 days or more past due but for which the accrual of interest has not been disc<strong>on</strong>tinued.<br />
In keeping with SEC industry guidance, we also c<strong>on</strong>tinue to m<strong>on</strong>itor and report the following categories in our<br />
problem loans:<br />
— N<strong>on</strong>accrual Loans: We place a loan <strong>on</strong> n<strong>on</strong>accrual status if the loan has been in default as to payment of<br />
principal or interest for 90 days or more and the loan is neither well secured nor in the process of collecti<strong>on</strong>,<br />
or the accrual of interest should be ceased according to management’s judgment as to collectability<br />
of c<strong>on</strong>tractual cash flows. When a loan is placed <strong>on</strong> n<strong>on</strong>accrual status, the accrual of interest in accordance<br />
with the c<strong>on</strong>tractual terms of the loan is disc<strong>on</strong>tinued. However, the accreti<strong>on</strong> of the net present<br />
value of the written down amount of the loan due to the passage of time is recognized as interest income<br />
based <strong>on</strong> the original effective interest rate of the loan. Cash receipts of interest <strong>on</strong> n<strong>on</strong>accrual loans are<br />
recorded as a reducti<strong>on</strong> of principal.<br />
— Loans Ninety Days or More Past Due and Still Accruing: These are loans in which c<strong>on</strong>tractual interest or<br />
principal payments are 90 days or more past due but <strong>on</strong> which we c<strong>on</strong>tinue to accrue interest as no<br />
impairment loss is recorded.<br />
— Troubled Debt Restructurings: These are loans that we have restructured due to deteriorati<strong>on</strong> in the borrower’s<br />
financial positi<strong>on</strong> <strong>on</strong> terms that we would not otherwise c<strong>on</strong>sider. If a borrower performs satisfactorily<br />
for <strong>on</strong>e year under a restructured loan, we no l<strong>on</strong>ger c<strong>on</strong>sider that borrower’s loan to be a troubled debt<br />
restructuring, unless at the time of restructuring the new interest rate was lower than the market rate for<br />
similar credit risks.<br />
157
<strong>20</strong>-F Item 11: Quantitative and Qualitative Disclosures about Credit, Market and Other Risk<br />
The following two tables present a breakdown of our problem loans for the dates specified.<br />
Dec 31, <str<strong>on</strong>g><strong>20</strong>09</str<strong>on</strong>g> Impaired loans N<strong>on</strong>impaired problem loans Problem<br />
loans<br />
in € m. German N<strong>on</strong>-German Total German N<strong>on</strong>-German Total Total<br />
Individually assessed 758 4,145 4,903 304 1,037 1,341 6,244<br />
N<strong>on</strong>accrual loans<br />
Loans 90 days or more past due and<br />
707 4,027 4,734 <strong>20</strong>0 1,003 1,<strong>20</strong>3 5,937<br />
still accruing – – – 50 5 55 55<br />
Troubled debt restructurings 1 51 118 169 54 29 83 252<br />
Collectively assessed 907 1,391 2,298 274 97 371 2,669<br />
N<strong>on</strong>accrual loans<br />
Loans 90 days or more past due and<br />
905 1,281 2,186 – – – 2,186<br />
still accruing – – – 260 6 266 266<br />
Troubled debt restructurings 1 2 110 112 14 91 105 217<br />
Total problem loans<br />
thereof: IAS 39 reclassified problem<br />
1,665 5,536 7,<strong>20</strong>1 578 1,134 1,712 8,913<br />
loans 28 2,750 2,778 – 159 159 2,937<br />
1 The table above shows troubled debt restructurings within our smaller-balance standardized homogeneous loans under collectively assessed problem loans as in last quarter <str<strong>on</strong>g><strong>20</strong>09</str<strong>on</strong>g><br />
credit policies and processes were enhanced to assess them accordingly.<br />
Dec 31, <strong>20</strong>08 Impaired loans N<strong>on</strong>impaired problem loans Problem<br />
loans<br />
in € m. German N<strong>on</strong>-German Total German N<strong>on</strong>-German Total Total<br />
Individually assessed 750 1,532 2,282 294 391 685 2,967<br />
N<strong>on</strong>accrual loans<br />
Loans 90 days or more past due and<br />
699 1,519 2,218 215 377 592 2,810<br />
still accruing – – – 8 5 13 13<br />
Troubled debt restructurings 51 13 64 71 9 80 144<br />
Collectively assessed 824 576 1,400 175 13 188 1,588<br />
N<strong>on</strong>accrual loans<br />
Loans 90 days or more past due and<br />
824 576 1,400 – – – 1,400<br />
still accruing – – – 175 13 188 188<br />
Troubled debt restructurings – – – – – – –<br />
Total problem loans<br />
thereof: IAS 39 reclassified problem<br />
1,574 2,108 3,682 469 404 873 4,555<br />
loans 9 745 754 – 86 86 840<br />
The € 4.4 billi<strong>on</strong>, or 96 %, increase in our total problem loans in <str<strong>on</strong>g><strong>20</strong>09</str<strong>on</strong>g> was due to a € 5.6 billi<strong>on</strong> gross increase<br />
of problem loans partly offset by € 1.2 billi<strong>on</strong> of charge-offs and a € 60 milli<strong>on</strong> decrease as a result of<br />
exchange rate movements. The increase in problem loans is mainly attributable to our individually assessed<br />
loans, with gross increases of € 4.0 billi<strong>on</strong>, partly offset by charge-offs of € 670 milli<strong>on</strong> and a € 57 milli<strong>on</strong> decrease<br />
as a result of exchange rate movements. For collectively assessed problem loans, gross increases of<br />
€ 1.6 billi<strong>on</strong> were partly offset by charge-offs of € 552 milli<strong>on</strong>. Included in the € 2.7 billi<strong>on</strong> of collectively<br />
assessed problem loans as of December 31, <str<strong>on</strong>g><strong>20</strong>09</str<strong>on</strong>g> are € 2.1 billi<strong>on</strong> of loans that are 90 days or more past due<br />
as well as € 564 milli<strong>on</strong> of loans that are less than 90 days past due.<br />
Our problem loans included € 2.9 billi<strong>on</strong> of problem loans am<strong>on</strong>g the loans reclassified to the banking book as<br />
permitted by IAS 39. For these loans we recorded gross increases in problem loans of € 2.5 billi<strong>on</strong> partly offset<br />
by € 414 milli<strong>on</strong> of charge-offs and a € 34 milli<strong>on</strong> decrease as a result of exchange rate movements.<br />
158
Our commitments to lend additi<strong>on</strong>al funds to debtors with problem loans amounted to € 191 milli<strong>on</strong> as of December<br />
31, <str<strong>on</strong>g><strong>20</strong>09</str<strong>on</strong>g>, an increase of € 1<strong>20</strong> milli<strong>on</strong> or 169 % compared to December 31, <strong>20</strong>08. Of these commitments,<br />
€ 51 milli<strong>on</strong> were to debtors whose loan terms have been modified in a troubled debt restructuring, an<br />
increase of € 45 milli<strong>on</strong> compared to December 31, <strong>20</strong>08.<br />
In additi<strong>on</strong>, as of December 31, <str<strong>on</strong>g><strong>20</strong>09</str<strong>on</strong>g>, we had € 7 milli<strong>on</strong> of lease financing transacti<strong>on</strong>s that were n<strong>on</strong>performing,<br />
an increase of € 3 milli<strong>on</strong> or 71 % compared to December 31, <strong>20</strong>08. These amounts are not included<br />
in our total problem loans.<br />
The following table presents an overview of n<strong>on</strong>impaired Troubled Debt Restructurings representing our renegotiated<br />
loans that would otherwise be past due or impaired.<br />
in € m. Dec 31, <str<strong>on</strong>g><strong>20</strong>09</str<strong>on</strong>g> Dec 31, <strong>20</strong>08<br />
Troubled debt restructurings not impaired 188 80<br />
The following table breaks down the n<strong>on</strong>impaired past due loan exposure carried at amortized cost according<br />
to its past due status.<br />
in € m. Dec 31, <str<strong>on</strong>g><strong>20</strong>09</str<strong>on</strong>g> Dec 31, <strong>20</strong>08<br />
Loans less than 30 days past due 6,192 8,345<br />
Loans 30 or more but less than 60 days past due 941 1,308<br />
Loans 60 or more but less than 90 days past due 558 939<br />
Loans 90 days or more past due 925 407<br />
Total loans past due but not impaired 8,616 10,999<br />
The following table presents the aggregated value of collateral – with the fair values of collateral capped at<br />
loan outstandings – held by us against our loans past due but not impaired.<br />
in € m. Dec 31, <str<strong>on</strong>g><strong>20</strong>09</str<strong>on</strong>g> Dec 31, <strong>20</strong>08<br />
Financial and other collateral 3,965 3,222<br />
Guarantees received 330 987<br />
Total capped fair value of collateral held for loans past due but not impaired 4,295 4,<strong>20</strong>9<br />
159
<strong>20</strong>-F Item 11: Quantitative and Qualitative Disclosures about Credit, Market and Other Risk<br />
Impaired Loans<br />
As of December 31, <str<strong>on</strong>g><strong>20</strong>09</str<strong>on</strong>g>, our impaired loans totaled € 7.2 billi<strong>on</strong>, representing a 96 % increase compared to<br />
December 31, <strong>20</strong>08. The total € 4.8 billi<strong>on</strong> gross increase of impaired loans was <strong>on</strong>ly partly offset by<br />
€ 1.2 billi<strong>on</strong> of charge-offs and a € 31 milli<strong>on</strong> decrease as a result of exchange rate movements. The increase<br />
in impaired loans is mainly attributable to our individually assessed impaired loans with gross increases of<br />
€ 3.3 billi<strong>on</strong>, partly offset by charge-offs of € 670 milli<strong>on</strong> and a € 27 milli<strong>on</strong> decrease as a result of exchange<br />
rate movements. The collectively assessed impaired loans increased by € 897 milli<strong>on</strong>, as gross increases of<br />
€ 1.5 billi<strong>on</strong> were offset by charge-offs of € 552 milli<strong>on</strong>.<br />
Our impaired loans included € 2.8 billi<strong>on</strong> of problem loans am<strong>on</strong>g the loans reclassified to the banking book<br />
as permitted by IAS 39. For these loans we recorded gross increases in impaired loans of € 2.5 billi<strong>on</strong>, partly<br />
offset by € 414 milli<strong>on</strong> of charge-offs and a € 28 milli<strong>on</strong> decrease as a result of exchange rate movements.<br />
The following table presents a breakdown of our impaired loans by regi<strong>on</strong> based <strong>on</strong> the country of domicile of<br />
our counterparties for the dates specified.<br />
in € m.<br />
Individually<br />
assessed<br />
Collectively<br />
assessed<br />
The following table presents a breakdown of our impaired loans by industry sector for the dates specified.<br />
1 For December 31, <str<strong>on</strong>g><strong>20</strong>09</str<strong>on</strong>g> the category Other c<strong>on</strong>tains primarily the impaired junior debt porti<strong>on</strong> of <strong>on</strong>e Leveraged Finance exposure which was reclassified<br />
in accordance with IAS 39.<br />
160<br />
Dec 31, <str<strong>on</strong>g><strong>20</strong>09</str<strong>on</strong>g> Dec 31, <strong>20</strong>08<br />
Total Individually<br />
assessed<br />
Collectively<br />
assessed<br />
Eastern Europe 30 121 151 16 38 54<br />
Western Europe 3,215 2,152 5,367 1,439 1,338 2,777<br />
Africa 27 – 27 – – –<br />
Asia/Pacific 136 21 157 50 22 72<br />
North America 1,392 3 1,395 543 1 544<br />
Central and South America 84 1 85 233 1 234<br />
Other 19 – 19 1 – 1<br />
Total 4,903 2,298 7,<strong>20</strong>1 2,282 1,400 3,682<br />
in € m.<br />
Individually<br />
assessed<br />
Collectively<br />
assessed<br />
Total<br />
Dec 31, <str<strong>on</strong>g><strong>20</strong>09</str<strong>on</strong>g> Dec 31, <strong>20</strong>08<br />
Total Individually<br />
assessed<br />
Collectively<br />
assessed<br />
<strong>Bank</strong>s and insurance 101 – 101 146 10 156<br />
Manufacturing 582 116 698 347 80 427<br />
Households 103 1,556 1,659 228 981 1,<strong>20</strong>9<br />
Public sector 45 – 45 118 – 118<br />
Wholesale and retail trade 255 91 346 145 55 <strong>20</strong>0<br />
Commercial real estate activities 710 250 960 137 35 172<br />
Fund management activities 848 – 848 644 1 645<br />
Other1 2,259 285 2,544 517 238 755<br />
Total 4,903 2,298 7,<strong>20</strong>1 2,282 1,400 3,682<br />
Total
The following table presents the aggregated value of collateral we held against impaired loans, with fair<br />
values capped at transacti<strong>on</strong>al outstandings.<br />
in € m. Dec 31, <str<strong>on</strong>g><strong>20</strong>09</str<strong>on</strong>g> Dec 31, <strong>20</strong>08<br />
Financial and other collateral 1,757 1,175<br />
Guarantees received 57 18<br />
Total capped fair value of collateral held for impaired loans 1,814 1,193<br />
Collateral Obtained<br />
The following table presents the aggregated value of collateral we obtained <strong>on</strong> the balance sheet during the<br />
reporting periods by taking possessi<strong>on</strong> of collateral held as security or by calling up<strong>on</strong> other credit enhancements.<br />
in € m. <str<strong>on</strong>g><strong>20</strong>09</str<strong>on</strong>g> <strong>20</strong>08<br />
Commercial real estate 78 799<br />
Residential real estate 10 170<br />
Other – 1,837<br />
Total collateral obtained during the reporting period 88 2,806<br />
Collateral obtained is made available for sale in an orderly fashi<strong>on</strong> or through public aucti<strong>on</strong>s, with the<br />
proceeds used to repay or reduce outstanding indebtedness. Generally we do not occupy obtained properties<br />
for our business use.<br />
The commercial real estate collateral obtained in <str<strong>on</strong>g><strong>20</strong>09</str<strong>on</strong>g> related to two of our U.S. exposures while the residen-<br />
tial real estate collateral obtained relates to a variety of cases in Spain where we have executed foreclosure<br />
by taking possessi<strong>on</strong>.<br />
The residential real estate collateral obtained, as shown in the table above, excludes collateral recorded as a<br />
result of c<strong>on</strong>solidating securitizati<strong>on</strong> trusts under SIC-12 and IAS 27. The year-end amounts in relati<strong>on</strong> to<br />
collateral obtained for these trusts were € 33 milli<strong>on</strong> and € 127 milli<strong>on</strong>, for December 31, <str<strong>on</strong>g><strong>20</strong>09</str<strong>on</strong>g> and December<br />
31, <strong>20</strong>08 respectively.<br />
161
<strong>20</strong>-F Item 11: Quantitative and Qualitative Disclosures about Credit, Market and Other Risk<br />
Allowance for Loan Losses<br />
The following table presents the comp<strong>on</strong>ents of our allowance for loan losses <strong>on</strong> the dates specified, including,<br />
with respect to our German loan portfolio, a breakdown by industry of the borrower and the percentage of<br />
our total loan portfolio accounted for by those industry classificati<strong>on</strong>s. The breakdown between German and<br />
n<strong>on</strong>-German borrowers is based <strong>on</strong> the country of domicile of our borrowers.<br />
in € m.<br />
(unless stated otherwise) Dec 31, <str<strong>on</strong>g><strong>20</strong>09</str<strong>on</strong>g> Dec 31, <strong>20</strong>08<br />
German:<br />
Individually assessed loan loss allowance:<br />
<strong>Bank</strong>s and insurance 2 4 % 1 5 %<br />
Manufacturing 199 3 % 165 3 %<br />
Households (excluding mortgages) 18 5 % 21 5 %<br />
Households – mortgages 3 15 % 5 13 %<br />
Public sector – 2 % – 2 %<br />
Wholesale and retail trade 95 1 % 81 1 %<br />
Commercial real estate activities 55 5 % 60 5 %<br />
Fund management activities 3 1 % 2 1 %<br />
Other 123 4 % 144 5 %<br />
Individually assessed loan loss allowance German total 498 479<br />
Collectively assessed loan loss allowance 454 464<br />
German total 952 40 % 943 39 %<br />
N<strong>on</strong>-German:<br />
Individually assessed loan loss allowance 1,532 499<br />
Collectively assessed loan loss allowance 859 496<br />
N<strong>on</strong>-German total 2,391 60 % 995 61 %<br />
Total allowance for loan losses 3,343 100 % 1,938 100 %<br />
Total individually assessed loan loss allowance 2,029 977<br />
Total collectively assessed loan loss allowance 1,314 961<br />
Total allowance for loan losses 3,343 1,938<br />
162
Movements in the Allowance for Loan Losses<br />
We record increases to our allowance for loan losses as an increase of the provisi<strong>on</strong> for loan losses in our<br />
income statement. Charge-offs reduce our allowance while recoveries, if any, are credited to the allowance<br />
account. If we determine that we no l<strong>on</strong>ger require allowances which we have previously established, we<br />
decrease our allowance and record the amount as a reducti<strong>on</strong> of the provisi<strong>on</strong> for loan losses in our income<br />
statement.<br />
The following table presents a breakdown of the movements in our allowance for loan losses for the periods<br />
specified.<br />
in € m.<br />
Individually<br />
assessed<br />
Collectively<br />
assessed<br />
163<br />
<str<strong>on</strong>g><strong>20</strong>09</str<strong>on</strong>g> <strong>20</strong>08<br />
Total Individually<br />
assessed<br />
Collectively<br />
assessed<br />
Balance, beginning of year 977 961 1,938 930 775 1,705<br />
Provisi<strong>on</strong> for loan losses 1,789 808 2,597 382 702 1,084<br />
Net charge-offs (637) (419) (1,056) (301) (477) (778)<br />
Charge-offs (670) (552) (1,222) (364) (626) (990)<br />
Recoveries 33 133 166 63 149 212<br />
Changes in the group of<br />
c<strong>on</strong>solidated companies – – – – – –<br />
Exchange rate changes/other (101) (36) (137) (34) (39) (74)<br />
Balance, end of year 2,029 1,314 3,343 977 961 1,938<br />
Total
<strong>20</strong>-F Item 11: Quantitative and Qualitative Disclosures about Credit, Market and Other Risk<br />
The following table sets forth a breakdown of the movements in our allowance for loan losses, including, with<br />
respect to our German loan portfolio, by industry classificati<strong>on</strong>s for the periods specified. The breakdown<br />
between German and n<strong>on</strong>-German borrowers is based <strong>on</strong> the country of domicile of our borrowers.<br />
in € m.<br />
(unless stated otherwise) <str<strong>on</strong>g><strong>20</strong>09</str<strong>on</strong>g> <strong>20</strong>08<br />
Balance, beginning of year 1,938 1,705<br />
Charge-offs:<br />
German:<br />
<strong>Bank</strong>s and insurance (2) (2)<br />
Manufacturing (43) (53)<br />
Households (excluding mortgages) (340) (330)<br />
Households – mortgages (23) (32)<br />
Public sector – –<br />
Wholesale and retail trade (23) (41)<br />
Commercial real estate activities (6) (19)<br />
Fund management activities – –<br />
Other (72) (127)<br />
German total (509) (604)<br />
N<strong>on</strong>-German total (713) (386)<br />
Total charge-offs (1,222) (990)<br />
Recoveries:<br />
German:<br />
<strong>Bank</strong>s and insurance 1 1<br />
Manufacturing 11 14<br />
Households (excluding mortgages) 83 81<br />
Households – mortgages 1 3<br />
Public sector – –<br />
Wholesale and retail trade 7 8<br />
Commercial real estate activities 7 9<br />
Fund management activities – –<br />
Other 25 41<br />
German total 135 157<br />
N<strong>on</strong>-German total 31 55<br />
Total recoveries 166 212<br />
Net charge-offs (1,056) (778)<br />
Provisi<strong>on</strong> for loan losses 2,597 1,084<br />
Other changes (e.g. exchange rate changes, changes in the group of c<strong>on</strong>solidated companies) (137) (74)<br />
Balance, end of year 3,343 1,938<br />
Percentage of total net charge-offs to average loans for the year 0.39 % 0.33 %<br />
Our allowance for loan losses as of December 31, <str<strong>on</strong>g><strong>20</strong>09</str<strong>on</strong>g> was € 3.3 billi<strong>on</strong>, a 72 % increase from the<br />
€ 1.9 billi<strong>on</strong> reported for the end of <strong>20</strong>08. The increase in our allowance was principally due to provisi<strong>on</strong>s<br />
exceeding substantially our charge-offs.<br />
Our gross charge-offs amounted to € 1.2 billi<strong>on</strong> in <str<strong>on</strong>g><strong>20</strong>09</str<strong>on</strong>g>. Of the charge-offs for <str<strong>on</strong>g><strong>20</strong>09</str<strong>on</strong>g>, € 637 milli<strong>on</strong> were related<br />
to our corporate credit exposure, of which € 414 milli<strong>on</strong> were related to assets which had been re-classified in<br />
accordance with IAS 39 in our U.S. and U.K. portfolios, and € 419 milli<strong>on</strong> to our c<strong>on</strong>sumer credit exposure,<br />
mainly driven by our German portfolios.<br />
164
Our provisi<strong>on</strong> for loan losses in <str<strong>on</strong>g><strong>20</strong>09</str<strong>on</strong>g> was € 2.6 billi<strong>on</strong>, principally driven by € 1.8 billi<strong>on</strong> for our corporate credit<br />
exposures, of which € 1.3 billi<strong>on</strong> of new provisi<strong>on</strong>s were established relating to assets which had been reclassified<br />
in accordance with IAS 39, relating predominantly to exposures in Leveraged Finance. The remaining<br />
increase reflected impairment charges taken <strong>on</strong> a number of exposures in the Americas and in Europe in an<br />
overall deteriorating credit envir<strong>on</strong>ment. Loan loss provisi<strong>on</strong>s for PCAM amounted to € 805 milli<strong>on</strong>, predominately<br />
reflecting a more challenging credit envir<strong>on</strong>ment in Spain and Poland. Provisi<strong>on</strong>s in <str<strong>on</strong>g><strong>20</strong>09</str<strong>on</strong>g> were positively<br />
impacted by changes in certain parameter and model assumpti<strong>on</strong>s, which reduced provisi<strong>on</strong>s by<br />
€ 87 milli<strong>on</strong> in CIB and € 146 milli<strong>on</strong> in PCAM.<br />
Our individually assessed loan loss allowance was € 2.0 billi<strong>on</strong> as of December 31, <str<strong>on</strong>g><strong>20</strong>09</str<strong>on</strong>g>. The € 1.1 billi<strong>on</strong><br />
increase in <str<strong>on</strong>g><strong>20</strong>09</str<strong>on</strong>g> is comprised of net provisi<strong>on</strong>s of € 1.8 billi<strong>on</strong> (including the aforementi<strong>on</strong>ed impact from<br />
IAS 39 reclassificati<strong>on</strong>s), net charge-offs of € 637 milli<strong>on</strong> and a € 101 milli<strong>on</strong> decrease from currency translati<strong>on</strong><br />
and unwinding effects.<br />
Our collectively assessed loan loss allowance totaled € 1.3 billi<strong>on</strong> as of December 31, <str<strong>on</strong>g><strong>20</strong>09</str<strong>on</strong>g>, representing an<br />
increase of € 353 milli<strong>on</strong> against the level reported for the end of <strong>20</strong>08 (€ 961 milli<strong>on</strong>). Movements in this com-<br />
p<strong>on</strong>ent include a € 808 milli<strong>on</strong> provisi<strong>on</strong>, including a positive impact by changes in certain parameter<br />
and model assumpti<strong>on</strong>s which reduced provisi<strong>on</strong> by € 87 milli<strong>on</strong>, being offset by € 419 milli<strong>on</strong> net charge-offs<br />
and a € 36 milli<strong>on</strong> net decrease from currency translati<strong>on</strong> and unwinding effects.<br />
Our allowance for loan losses as of December 31, <strong>20</strong>08 was € 1.9 billi<strong>on</strong>, a 14 % increase from the € 1.7 billi<strong>on</strong><br />
reported for the end of <strong>20</strong>07. The increase in our allowance was principally due to provisi<strong>on</strong>s exceeding our<br />
charge-offs.<br />
Our gross charge-offs amounted to € 990 milli<strong>on</strong> in <strong>20</strong>08. Of the charge-offs for <strong>20</strong>08, € 626 milli<strong>on</strong> were<br />
related to our c<strong>on</strong>sumer credit exposure and € 364 milli<strong>on</strong> were related to our corporate credit exposure,<br />
mainly driven by our German and U.S. portfolios.<br />
Our provisi<strong>on</strong> for loan losses in <strong>20</strong>08 was € 1.1 billi<strong>on</strong>, up € 433 milli<strong>on</strong> or 67 %, principally driven by our c<strong>on</strong>-<br />
sumer credit exposure, as a result of the deteriorating credit c<strong>on</strong>diti<strong>on</strong>s in Spain, higher delinquencies in<br />
Germany and Italy, as well as organic growth in Poland. For our corporate exposures, new provisi<strong>on</strong>s<br />
of € 257 milli<strong>on</strong> were established in the sec<strong>on</strong>d half of <strong>20</strong>08 relating to assets which had been reclassified in<br />
accordance with IAS 39. Additi<strong>on</strong>al loan loss provisi<strong>on</strong>s within this portfolio were required, mainly <strong>on</strong> European<br />
loans, reflecting the deteriorati<strong>on</strong> in credit c<strong>on</strong>diti<strong>on</strong>s.<br />
Our individually assessed loan loss allowance was € 977 milli<strong>on</strong> as of December 31, <strong>20</strong>08. The € 47 milli<strong>on</strong><br />
increase in <strong>20</strong>08 is comprised of net provisi<strong>on</strong>s of € 382 milli<strong>on</strong> (including the aforementi<strong>on</strong>ed impact from<br />
IAS 39 reclassificati<strong>on</strong>s), net charge-offs of € 301 milli<strong>on</strong> and a € 34 milli<strong>on</strong> decrease from currency translati<strong>on</strong><br />
and unwinding effects.<br />
165
<strong>20</strong>-F Item 11: Quantitative and Qualitative Disclosures about Credit, Market and Other Risk<br />
Our collectively assessed loan loss allowance totaled € 961 milli<strong>on</strong> as of December 31, <strong>20</strong>08, representing an<br />
increase of € 186 milli<strong>on</strong> against the level at the end of <strong>20</strong>07 (€ 775 milli<strong>on</strong>). Movements in this comp<strong>on</strong>ent<br />
include € 702 milli<strong>on</strong> provisi<strong>on</strong> being offset by € 477 milli<strong>on</strong> net charge-offs, and a € 39 milli<strong>on</strong> net reducti<strong>on</strong><br />
due to exchange rate movements and unwinding effects. Given this increase, our collectively assessed loan<br />
loss allowance was almost at the same level as our individually assessed loan loss allowance.<br />
N<strong>on</strong>-German Comp<strong>on</strong>ent of the Allowance for Loan Losses<br />
The following table presents an analysis of the changes in the n<strong>on</strong>-German comp<strong>on</strong>ent of the allowance for<br />
loan losses. As of December 31, <str<strong>on</strong>g><strong>20</strong>09</str<strong>on</strong>g>, 72 % of our total allowance was attributable to n<strong>on</strong>-German clients.<br />
in € m. <str<strong>on</strong>g><strong>20</strong>09</str<strong>on</strong>g> <strong>20</strong>08<br />
Balance, beginning of year 995 615<br />
Provisi<strong>on</strong> for loan losses 2,182 752<br />
Net charge-offs (682) (330)<br />
Charge-offs (713) (385)<br />
Recoveries 31 55<br />
Other changes (e.g. exchange rate changes, changes in the group of c<strong>on</strong>solidated companies) (104) (42)<br />
Balance, end of year 2,391 995<br />
Allowance for Off-balance Sheet Positi<strong>on</strong>s<br />
The following table shows the activity in our allowance for off-balance sheet positi<strong>on</strong>s, which comprises c<strong>on</strong>tingent<br />
liabilities and lending-related commitments.<br />
<str<strong>on</strong>g><strong>20</strong>09</str<strong>on</strong>g> <strong>20</strong>08<br />
Individually Collectively Total Individually Collectively Total<br />
in € m.<br />
assessed assessed<br />
assessed assessed<br />
Balance, beginning of year 98 112 210 101 118 219<br />
Provisi<strong>on</strong> for off-balance sheet positi<strong>on</strong>s 21 12 33 (2) (6) (8)<br />
Usage<br />
Changes in the group of c<strong>on</strong>solidated<br />
(45) – (45) – – –<br />
companies – – – – – –<br />
Exchange rate changes 10 – 10 (1) – (1)<br />
Balance, end of year 83 124 <strong>20</strong>7 98 112 210<br />
For further informati<strong>on</strong> <strong>on</strong> our credit risk development, including factors which influenced changes to the<br />
allowance, in the three preceding years to the informati<strong>on</strong> c<strong>on</strong>tained herein please refer to pages S-6 through<br />
S-14 of the supplemental financial informati<strong>on</strong>, which are incorporated by reference herein.<br />
166
Settlement Risk<br />
Our trading activities may give rise to risk at the time of settlement of those trades. Settlement risk is the risk<br />
of loss due to the failure of a counterparty to h<strong>on</strong>or its obligati<strong>on</strong>s to deliver cash, securities or other assets as<br />
c<strong>on</strong>tractually agreed.<br />
For many types of transacti<strong>on</strong>s, we mitigate settlement risk by closing the transacti<strong>on</strong> through a clearing<br />
agent, which effectively acts as a stakeholder for both parties, <strong>on</strong>ly settling the trade <strong>on</strong>ce both parties have<br />
fulfilled their sides of the bargain.<br />
Where no such settlement system exists, the simultaneous commencement of the payment and the delivery<br />
parts of the transacti<strong>on</strong> is comm<strong>on</strong> practice between trading partners (free settlement). In these cases,<br />
we may seek to mitigate our settlement risk through the executi<strong>on</strong> of bilateral payment netting agreements.<br />
We are also an active participant in industry initiatives to reduce settlement risks. Acceptance of settlement<br />
risk <strong>on</strong> free settlement trades requires approval from our credit risk pers<strong>on</strong>nel, either in the form of pre-<br />
approved settlement risk limits, or through transacti<strong>on</strong>-specific approvals. We do not aggregate settlement<br />
risk limits with other credit exposures for credit approval purposes, but we take the aggregate exposure into<br />
account when we c<strong>on</strong>sider whether a given settlement risk would be acceptable.<br />
Market Risk<br />
The vast majority of our businesses are subject to market risk, defined as the potential for change in the market<br />
value of our trading and investing positi<strong>on</strong>s. Risk can arise from adverse changes in interest rates, credit<br />
spreads, foreign exchange rates, equity prices, commodity prices and other relevant parameters, such as<br />
market volatility.<br />
The primary objective of Market Risk Management is to ensure that our business units optimize the risk-<br />
reward relati<strong>on</strong>ship and do not expose it to unacceptable losses. To achieve this objective, Market Risk<br />
Management works closely together with risk takers (the business units) and other c<strong>on</strong>trol and support groups.<br />
We differentiate between two substantially different types of market risk:<br />
— Trading market risk arises primarily through the market-making activities of the Corporate and Investment<br />
<strong>Bank</strong> divisi<strong>on</strong>. This involves taking positi<strong>on</strong>s in debt, equity, foreign exchange, other securities and com-<br />
modities as well as in equivalent derivatives.<br />
— N<strong>on</strong>trading market risk in the form of equity risk arises primarily from n<strong>on</strong>-c<strong>on</strong>solidated strategic invest-<br />
ments in the Corporate Investment portfolio, alternative asset investments and equity compensati<strong>on</strong>.<br />
Interest risk stems from our n<strong>on</strong>trading asset and liability positi<strong>on</strong>s. Other n<strong>on</strong>trading market risk elements<br />
are risks arising from asset management and fund related activities as well as model risks in PBC, GTB<br />
and PWM, which are derived by shocking assumpti<strong>on</strong>s <strong>on</strong> client behavior in combinati<strong>on</strong> with interest rate<br />
movements.<br />
167
<strong>20</strong>-F Item 11: Quantitative and Qualitative Disclosures about Credit, Market and Other Risk<br />
Trading Market Risk Management Framework<br />
Our primary instrument to manage trading market risk is the limit setting process. Our Management Board,<br />
supported by Market Risk Management, which is part of our independent legal, risk & capital functi<strong>on</strong>, sets a<br />
Group-wide value-at-risk and ec<strong>on</strong>omic capital limits for the market risk in the trading book. Market Risk Management<br />
sub-allocates this overall limit to our group divisi<strong>on</strong>s (e.g., Global Markets and Corporate Finance)<br />
and individual business areas (e.g., Global Rates, Global Markets Equity, etc.) based <strong>on</strong> anticipated business<br />
plans and risk appetite. Within the individual business areas, the business heads or Chief Operating Officers<br />
may establish business limits by sub-allocating the Market Risk Management limit down to individual portfolios<br />
or geographical regi<strong>on</strong>s.<br />
Value-at-risk and ec<strong>on</strong>omic capital limits are not sufficient for managing all types of market risk <strong>on</strong> their own.<br />
In additi<strong>on</strong>, Market Risk Management operates sensitivity and c<strong>on</strong>centrati<strong>on</strong>/liquidity limits. A distincti<strong>on</strong> is<br />
made between Market Risk Management limits and business limits for sensitivities and c<strong>on</strong>centrati<strong>on</strong>/liquidity.<br />
In practice, the Market Risk Management limits are likely to be a relatively small number of key limits necessary<br />
to capture an exposure to a particular risk factor and will tend to be global in nature rather than for any<br />
particular geographical regi<strong>on</strong>.<br />
To manage the exposures inside the limits, the risk takers apply several risk mitigating measures, most not-<br />
ably the use of<br />
— Diversificati<strong>on</strong> effects: Diversificati<strong>on</strong> is a portfolio strategy designed to reduce exposure by combining a<br />
variety of positi<strong>on</strong>s. Because some investments rise in value while others decline, diversificati<strong>on</strong> can help<br />
to lower the overall level of risk for a given portfolio.<br />
— Hedging: Hedging involves taking positi<strong>on</strong>s in related securities, including derivative products, such as<br />
futures, swaps and opti<strong>on</strong>s. Hedging activities may not always provide effective mitigati<strong>on</strong> against losses<br />
due to differences in the terms, specific characteristics or other basis risks that may exist between the<br />
hedge instrument and the exposure being hedged.<br />
Trading Market Risk Management: Refined framework and de-risking discipline in <str<strong>on</strong>g><strong>20</strong>09</str<strong>on</strong>g><br />
In <str<strong>on</strong>g><strong>20</strong>09</str<strong>on</strong>g>, Market Risk Management implemented new processes to improve the m<strong>on</strong>itoring and reporting of<br />
key risks. These processes included creating a list of exposures which had been targeted for de-risking. The<br />
identificati<strong>on</strong> of such positi<strong>on</strong>s was guided by a four step de-risking framework.<br />
Reduce risk c<strong>on</strong>centrati<strong>on</strong>s:<br />
— Adapt positi<strong>on</strong> size to liquidity envir<strong>on</strong>ment<br />
— Invest in unwinding most illiquid risk positi<strong>on</strong>s.<br />
C<strong>on</strong>tinued use of active hedging:<br />
— Active program of macro hedging<br />
— Improve hedging efficiency of individual strategies.<br />
168
De-leverage balance sheet:<br />
— Manage down gross and net exposure<br />
— Align market risk appetite to new balance sheet and leverage targets.<br />
Reduce uncertainty:<br />
— Avoid exposure to difficult to value products<br />
— Reduce reliance <strong>on</strong> complex, highly structured products.<br />
As a result of the c<strong>on</strong>tinued focus, the majority of these key exposures have been reduced to appropriate<br />
levels. For a minority of exposures, de-risking progress has been slowed by the current market c<strong>on</strong>diti<strong>on</strong>s;<br />
and potential for future loss remains. Acti<strong>on</strong> has been taken to reduce this potential. The positi<strong>on</strong>s have been<br />
segregated from the 'Ongoing' trading books, and are managed in separate ‘Legacy’ books. Hedges have<br />
also been purchased to limit the downside risk. We c<strong>on</strong>tinue to seek and take market opportunities to reduce<br />
these risks.<br />
The plan was part of a wider recalibrati<strong>on</strong> of the business model. This aims to increase the proporti<strong>on</strong> of revenues<br />
earned from the most liquid flow markets, and to reduce reliance <strong>on</strong> exotic and structured businesses<br />
which may lack liquidity.<br />
Quantitative Risk Management Tools<br />
Value-at-Risk<br />
Value-at-risk is a quantitative measure of the potential loss (in value) of trading positi<strong>on</strong>s due to market<br />
movements that will not be exceeded in a defined period of time and with a defined c<strong>on</strong>fidence level.<br />
Our value-at-risk for the trading businesses is based <strong>on</strong> our own internal value-at-risk model. In October 1998,<br />
the German <strong>Bank</strong>ing Supervisory Authority (now the BaFin) approved our internal value-at-risk model for<br />
calculating the regulatory market risk capital for our general and specific market risks. Since then the model<br />
has been periodically refined and approval has been maintained.<br />
We calculate value-at-risk using a 99 % c<strong>on</strong>fidence level and a holding period of <strong>on</strong>e day. This means we<br />
estimate there is a 1 in 100 chance that a mark-to-market loss from our trading positi<strong>on</strong>s will be at least as<br />
large as the reported value-at-risk. For regulatory reporting, the holding period is ten days.<br />
We use historical market data to estimate value-at-risk, with an equally-weighted 261 trading day history. The<br />
calculati<strong>on</strong> employs a M<strong>on</strong>te Carlo simulati<strong>on</strong> technique, and we assume that changes in risk factors follow a<br />
certain distributi<strong>on</strong>, e.g., normal or logarithmic normal distributi<strong>on</strong>. To determine our aggregated value-at-risk,<br />
we use observed correlati<strong>on</strong>s between the risk factors during this 261 trading day period.<br />
Our value-at-risk model is designed to take into account the following risk factors: interest rates, credit<br />
spreads, equity prices, foreign exchange rates and commodity prices, as well as their implied volatilities and<br />
comm<strong>on</strong> basis risk. The model incorporates both linear and, especially for derivatives, n<strong>on</strong>linear effects of the<br />
risk factors <strong>on</strong> the portfolio value.<br />
169
<strong>20</strong>-F Item 11: Quantitative and Qualitative Disclosures about Credit, Market and Other Risk<br />
The value-at-risk measure enables us to apply a c<strong>on</strong>stant and uniform measure across all of our trading businesses<br />
and products. It allows a comparis<strong>on</strong> of risk in different businesses, and also provides a means of<br />
aggregating and netting positi<strong>on</strong>s within a portfolio to reflect correlati<strong>on</strong>s and offsets between different asset<br />
classes. Furthermore, it facilitates comparis<strong>on</strong>s of our market risk both over time and against our daily trading<br />
results.<br />
When using value-at-risk estimates a number of c<strong>on</strong>siderati<strong>on</strong>s should be taken into account. The model is<br />
subject to known limitati<strong>on</strong>s, many of which manifested themselves in <strong>20</strong>08, resulting in a high number of<br />
outliers. These include the following:<br />
— The use of historical data may not be a good indicator of potential future events, particularly those that are<br />
extreme in nature. This ‘backward-looking’ limitati<strong>on</strong> can cause value-at-risk to understate risk (as in<br />
<strong>20</strong>08), but can also cause it to be overstated. In <str<strong>on</strong>g><strong>20</strong>09</str<strong>on</strong>g> we observed fewer outliers than would be predicted<br />
by the model. In a strict statistical sense, the value-at-risk in <str<strong>on</strong>g><strong>20</strong>09</str<strong>on</strong>g> was over-c<strong>on</strong>servative, and had over-<br />
estimated the risk in the trading books. As discussed, our value-at-risk model bases estimates of future<br />
volatility <strong>on</strong> market data observed over the previous year. For much of <str<strong>on</strong>g><strong>20</strong>09</str<strong>on</strong>g>, this estimate incorporated<br />
the extreme market volatility observed in the fourth quarter of <strong>20</strong>08 following the bankruptcy of Lehman<br />
Brothers. As markets normalized in <str<strong>on</strong>g><strong>20</strong>09</str<strong>on</strong>g>, estimated volatility exceeded actual volatility, and fewer outliers<br />
occurred than expected.<br />
— Assumpti<strong>on</strong>s c<strong>on</strong>cerning the distributi<strong>on</strong> of changes in risk factors, and the correlati<strong>on</strong> between different<br />
risk factors, may not hold true, particularly during market events that are extreme in nature. While we<br />
believe our assumpti<strong>on</strong>s are reas<strong>on</strong>able, there is no standard value-at-risk methodology to follow. Differ-<br />
ent assumpti<strong>on</strong>s would produce different results.<br />
— The <strong>on</strong>e day holding period does not fully capture the market risk arising during periods of illiquidity, when<br />
positi<strong>on</strong>s cannot be closed out or hedged within <strong>on</strong>e day.<br />
— Value-at-risk does not indicate the potential loss bey<strong>on</strong>d the 99th quantile.<br />
— Intra-day risk is not captured.<br />
— Although we c<strong>on</strong>sider the material risks to be covered by our value-at-risk model and we further enhance<br />
it, there still may be risks in the trading book that are not covered by the value-at-risk model.<br />
We c<strong>on</strong>tinuously analyze potential weaknesses of our value-at-risk model using statistical techniques such as<br />
back-testing, but also rely <strong>on</strong> risk management experience and expert opini<strong>on</strong>. Back-testing provides an analysis<br />
of the predictive power of the value-at-risk calculati<strong>on</strong>s based <strong>on</strong> actual experience. We compare the<br />
hypothetical daily profits and losses under the buy-and-hold assumpti<strong>on</strong> (in accordance with German regulatory<br />
requirements) with the estimates from our value-at-risk model.<br />
A committee, chaired by Market Risk Management and with participati<strong>on</strong> from Market Risk Operati<strong>on</strong>s, Risk<br />
Analytics and Instruments, Finance and others, meets <strong>on</strong> a quarterly basis to discuss back-testing results of<br />
our Group as a whole and of individual businesses. The committee analyzes performance fluctuati<strong>on</strong>s and<br />
assesses the predictive power of our value-at-risk model, which in turn allows us to improve the risk estimati<strong>on</strong><br />
process.<br />
170
We are committed to the <strong>on</strong>going development of our proprietary risk models, and we allocate substantial<br />
resources to reviewing and improving them. Special attenti<strong>on</strong> is given to improving those parts of the valueat-risk<br />
model that relate to the areas where losses have been experienced in the recent past. During <str<strong>on</strong>g><strong>20</strong>09</str<strong>on</strong>g>,<br />
significant methodology improvements were made to the value-at-risk calculati<strong>on</strong>, including the following:<br />
— Introducti<strong>on</strong> of opti<strong>on</strong>-adjusted spread sensitivity for mortgage backed securities. This measure of credit<br />
spread more accurately captures prepayment risk, which arises from mortgage holders’ opti<strong>on</strong> to prepay<br />
their mortgage if interest rates fall<br />
— Introducti<strong>on</strong> of credit spread implied volatility sensitivity<br />
— Inclusi<strong>on</strong> of basis risk between different m<strong>on</strong>ey market instruments and swaps based <strong>on</strong> them<br />
— Inclusi<strong>on</strong> of basis risk between credit default swaps and b<strong>on</strong>d spreads<br />
Ec<strong>on</strong>omic Capital for Market Risk<br />
As for other risk categories, ec<strong>on</strong>omic capital for market risk measures the amount of capital we need to absorb<br />
very severe unexpected losses arising from our exposures. “Very severe” in this c<strong>on</strong>text means that<br />
ec<strong>on</strong>omic capital is set at a level to cover with a probability of 99.98 % the aggregated unexpected losses<br />
within <strong>on</strong>e year.<br />
Some firms calculate ec<strong>on</strong>omic capital for market risk using their value-at-risk model, by applying a higher<br />
c<strong>on</strong>fidence level and l<strong>on</strong>ger holding period. A key limitati<strong>on</strong> of this approach is that value-at-risk models are<br />
based <strong>on</strong> relatively recent historical data, and therefore typically <strong>on</strong>ly reflect losses under normal market<br />
c<strong>on</strong>diti<strong>on</strong>s. To address this, we calculate ec<strong>on</strong>omic capital using stress tests and scenario analyses. The<br />
stress tests are derived from historically observed severe market shocks. The resulting losses from these<br />
stress scenarios are then aggregated using correlati<strong>on</strong>s observed during periods of market crises, to reflect<br />
the increase in correlati<strong>on</strong>s which occurs during severe downturns.<br />
The stress tests are augmented by subjective assessments where <strong>on</strong>ly limited historical data is available, or<br />
where market developments are viewed to make historical data a poor indicator of possible future market<br />
scenarios.<br />
The calculati<strong>on</strong> of ec<strong>on</strong>omic capital for market risk from the trading units is performed weekly. The model<br />
incorporates the following risk factors: interest rates, credit spreads, equity prices, foreign exchange rates and<br />
commodity prices. Volatility, credit correlati<strong>on</strong> and comm<strong>on</strong> basis risks are also captured.<br />
During the course of <str<strong>on</strong>g><strong>20</strong>09</str<strong>on</strong>g> the ec<strong>on</strong>omic capital stress tests were recalibrated to reflect the extreme market<br />
moves observed in the later part of <strong>20</strong>08. This included extensi<strong>on</strong> of the assumed holding periods <strong>on</strong> credit<br />
positi<strong>on</strong>s, and significant increases to the shocks applied to equity indices and credit spreads, especially for<br />
securitized products.<br />
In additi<strong>on</strong> to the recalibrati<strong>on</strong>, there were improvements to the ec<strong>on</strong>omic capital model. These included the<br />
additi<strong>on</strong> of stress tests for leveraged exchange traded funds and for gap risk in n<strong>on</strong>-recourse finance in<br />
emerging markets.<br />
171
<strong>20</strong>-F Item 11: Quantitative and Qualitative Disclosures about Credit, Market and Other Risk<br />
Our stress testing results and ec<strong>on</strong>omic capital estimati<strong>on</strong>s are necessarily limited by the number of stress<br />
tests executed and the fact that not all downside scenarios can be predicted and simulated. While our risk<br />
managers have used their best judgment to define worst case scenarios based up<strong>on</strong> the knowledge of past<br />
extreme market moves, it is possible for our market risk positi<strong>on</strong>s to lose more value than even our ec<strong>on</strong>omic<br />
capital estimates. We also c<strong>on</strong>tinuously assess and refine our stress tests in an effort to ensure they capture<br />
material risks as well as reflect possible extreme market moves.<br />
Value-at-Risk of Trading Units of Our Corporate and Investment <strong>Bank</strong> Group Divisi<strong>on</strong><br />
The following table shows the value-at-risk (with a 99 % c<strong>on</strong>fidence level and a <strong>on</strong>e-day holding period) of the<br />
trading units of our Corporate and Investment <strong>Bank</strong> Group Divisi<strong>on</strong>. Our trading market risk outside of these<br />
units is immaterial. “Diversificati<strong>on</strong> effect” reflects the fact that the total value-at-risk <strong>on</strong> a given day will be<br />
lower than the sum of the values-at-risk relating to the individual risk classes. Simply adding the value-at-risk<br />
figures of the individual risk classes to arrive at an aggregate value-at-risk would imply the assumpti<strong>on</strong> that<br />
the losses in all risk categories occur simultaneously.<br />
Value-at-risk of trading units<br />
in € m. Dec 31, <str<strong>on</strong>g><strong>20</strong>09</str<strong>on</strong>g> Dec 31, <strong>20</strong>08<br />
Interest rate risk 111.0 129.9<br />
Equity price risk 37.0 34.5<br />
Foreign exchange risk 23.9 38.0<br />
Commodity price risk 14.8 13.5<br />
Diversificati<strong>on</strong> effect (65.7) (84.5)<br />
Total 121.0 131.4<br />
The following table shows the maximum, minimum and average value-at-risk (with a 99 % c<strong>on</strong>fidence level<br />
and a <strong>on</strong>e-day holding period) of the trading units of our Corporate and Investment <strong>Bank</strong> Group Divisi<strong>on</strong> by<br />
risk categories for the periods specified.<br />
Value-at-risk of<br />
trading units<br />
Total Diversificati<strong>on</strong><br />
effect<br />
172<br />
Interest rate risk Equity price risk Foreign<br />
exchange risk<br />
Commodity<br />
price risk<br />
in € m. <str<strong>on</strong>g><strong>20</strong>09</str<strong>on</strong>g> <strong>20</strong>08 <str<strong>on</strong>g><strong>20</strong>09</str<strong>on</strong>g> <strong>20</strong>08 <str<strong>on</strong>g><strong>20</strong>09</str<strong>on</strong>g> <strong>20</strong>08 <str<strong>on</strong>g><strong>20</strong>09</str<strong>on</strong>g> <strong>20</strong>08 <str<strong>on</strong>g><strong>20</strong>09</str<strong>on</strong>g> <strong>20</strong>08 <str<strong>on</strong>g><strong>20</strong>09</str<strong>on</strong>g> <strong>20</strong>08<br />
Average 126.8 122.0 (61.6) (74.7) 117.6 105.4 26.9 60.7 28.7 18.4 15.1 12.2<br />
Maximum 180.1 172.9 (112.3) (104.1) 169.2 143.3 47.3 93.8 64.4 42.4 34.7 21.1<br />
Minimum 91.9 97.5 (35.9) (48.4) 83.2 83.1 14.5 31.0 11.9 8.5 8.5 7.6
The following graph shows the daily aggregate value-at-risk of our trading units in <str<strong>on</strong>g><strong>20</strong>09</str<strong>on</strong>g>, including diversificati<strong>on</strong><br />
effects, and actual income of the trading units throughout the year.<br />
Income of Trading Units and Value-at-Risk in <str<strong>on</strong>g><strong>20</strong>09</str<strong>on</strong>g><br />
in € m.<br />
400<br />
300<br />
<strong>20</strong>0<br />
100<br />
0<br />
(100)<br />
(<strong>20</strong>0)<br />
1/09 2/09 3/09 4/09 5/09 6/09 7/09 8/09 9/09 10/09 11/09 12/09<br />
Income of Trading Units Value-at-Risk<br />
Our value-at-risk for the trading units remained within a band between € 91.9 milli<strong>on</strong> and € 180.1 milli<strong>on</strong>. The<br />
average value-at-risk in <str<strong>on</strong>g><strong>20</strong>09</str<strong>on</strong>g> was € 126.8 milli<strong>on</strong>, which is 4 % above the <strong>20</strong>08 average of € 122 milli<strong>on</strong>.<br />
The increase in average value-at-risk observed in <str<strong>on</strong>g><strong>20</strong>09</str<strong>on</strong>g> was driven primarily by an increased market volatility<br />
observed in <strong>20</strong>08, and to a lesser extent by development of the value-at-risk model. For much of <str<strong>on</strong>g><strong>20</strong>09</str<strong>on</strong>g>, these<br />
factors offset the significant de-risking achieved in the trading book.<br />
Value-at-risk peaked in the sec<strong>on</strong>d quarter <str<strong>on</strong>g><strong>20</strong>09</str<strong>on</strong>g> at € 180.1 milli<strong>on</strong>, and then fell as the high volatility observa-<br />
ti<strong>on</strong>s from the sec<strong>on</strong>d quarter <strong>20</strong>08 were no l<strong>on</strong>ger included in the dataset. There was also a c<strong>on</strong>sistent fall in<br />
value-at-risk for much of the last quarter in <str<strong>on</strong>g><strong>20</strong>09</str<strong>on</strong>g>, as the extreme observati<strong>on</strong>s in the last quarter of <strong>20</strong>08<br />
(following the bankruptcy of Lehman Brothers) fell out of the dataset. In early December, value-at-risk<br />
reached a low point of € 91.9 milli<strong>on</strong>, which compared to the <strong>20</strong>08 average of € 122 milli<strong>on</strong>, illustrates the<br />
significant reducti<strong>on</strong> in risk. A combinati<strong>on</strong> of additi<strong>on</strong>al risk positi<strong>on</strong>s in interest rate and equity risk as well as<br />
a recalibrati<strong>on</strong> of parameters in our credit correlati<strong>on</strong> business drove the value-at-risk back to € 121 milli<strong>on</strong><br />
as per year-end <str<strong>on</strong>g><strong>20</strong>09</str<strong>on</strong>g>.<br />
173
<strong>20</strong>-F Item 11: Quantitative and Qualitative Disclosures about Credit, Market and Other Risk<br />
Our trading units achieved a positive actual income for over 91 % of the trading days in <str<strong>on</strong>g><strong>20</strong>09</str<strong>on</strong>g> (over 57 % in<br />
<strong>20</strong>08).<br />
An outlier is a hypothetical buy-and-hold trading loss that exceeds our value-at-risk estimate. In our regulatory<br />
back-testing in <str<strong>on</strong>g><strong>20</strong>09</str<strong>on</strong>g>, we observed <strong>on</strong>e outlier compared to 35 in <strong>20</strong>08. We would expect a 99 percent c<strong>on</strong>fidence<br />
level to give rise to two to three outliers in any <strong>on</strong>e year. This significant improvement in model performance<br />
reflects the developments carried out in <strong>20</strong>08 and <str<strong>on</strong>g><strong>20</strong>09</str<strong>on</strong>g> and the return of markets to more normal<br />
volatility and correlati<strong>on</strong> patterns.<br />
The following histogram illustrates the distributi<strong>on</strong> of actual daily income of our trading units in <str<strong>on</strong>g><strong>20</strong>09</str<strong>on</strong>g>. The<br />
histogram displays the number of trading days <strong>on</strong> which we reached each level of trading income shown <strong>on</strong><br />
the horiz<strong>on</strong>tal axis in milli<strong>on</strong>s of euro.<br />
Income of Trading Units in <str<strong>on</strong>g><strong>20</strong>09</str<strong>on</strong>g><br />
in € m.<br />
Days<br />
<strong>20</strong><br />
15<br />
10<br />
5<br />
0<br />
(45) to (40)<br />
(40) to (35)<br />
(35) to (30)<br />
(30) to (25)<br />
(25) to (<strong>20</strong>)<br />
(<strong>20</strong>) to (15)<br />
(15) to (10)<br />
(10) to (5)<br />
(5) to 0<br />
0 to 5<br />
5 to 10<br />
10 to 15<br />
15 to <strong>20</strong><br />
<strong>20</strong> to 25<br />
25 to 30<br />
30 to 35<br />
35 to 40<br />
40 to 45<br />
45 to 50<br />
50 to 55<br />
55 to 60<br />
60 to 65<br />
65 to 70<br />
70 to 75<br />
75 to 80<br />
80 to 85<br />
85 to 90<br />
90 to 95<br />
95 to 100<br />
100 to 105<br />
105 to 110<br />
110 to 115<br />
115 to 1<strong>20</strong><br />
1<strong>20</strong> to 125<br />
125 to 130<br />
130 to 135<br />
135 to 140<br />
140 to 145<br />
145 to 150<br />
Over 150<br />
The ec<strong>on</strong>omic capital usage for market risk arising from the trading units totaled € 4.6 billi<strong>on</strong> at year-end <str<strong>on</strong>g><strong>20</strong>09</str<strong>on</strong>g><br />
compared with € 5.5 billi<strong>on</strong> at year-end <strong>20</strong>08. The reducti<strong>on</strong> reflects the de-risking carried out in the trading<br />
books. This was partially offset by increases driven by recalibrati<strong>on</strong> of shocks and developments to the ec<strong>on</strong>omic<br />
capital model.<br />
174
N<strong>on</strong>trading Market Risk Management<br />
Our N<strong>on</strong>trading Market Risk Management units oversee a number of risk exposures resulting from various<br />
business activities and initiatives.<br />
The most dominant n<strong>on</strong>trading market risk is the equity risk arising from our n<strong>on</strong>-c<strong>on</strong>solidated strategic in-<br />
vestments in the Corporate Investment portfolio, which in particular includes our stake in the <strong>Deutsche</strong> Post-<br />
bank AG. Moreover, the alternative asset portfolio c<strong>on</strong>tributes to our n<strong>on</strong>trading equity risk positi<strong>on</strong> as it c<strong>on</strong>-<br />
sists primarily of business-related principal investments as well as private equity and alternative asset<br />
investments.<br />
The majority of the interest rate and foreign exchange risks arising from our n<strong>on</strong>trading asset and liability<br />
positi<strong>on</strong>s has been transferred through internal hedges to Global Markets within our Corporate and Investment<br />
<strong>Bank</strong> and is thus managed <strong>on</strong> the basis of value-at-risk as reflected in our trading value-at-risk numbers.<br />
For the remaining risks that have not been transferred through those hedges, in general foreign<br />
exchange risk is mitigated through match funding the investment in the same currency and <strong>on</strong>ly residual risk<br />
remains in the portfolios. Also, for these residual positi<strong>on</strong>s there is modest interest rate risk remaining from<br />
the mismatch between the funding term and the expected maturity of the investment.<br />
A significant c<strong>on</strong>tributi<strong>on</strong> to our foreign exchange risk in our n<strong>on</strong>trading portfolio results from unhedged capital<br />
and retained earnings in n<strong>on</strong>-euro currencies in certain subsidiaries, mainly U.S. and U.K. entities. It is also<br />
referred to as structural foreign exchange risk exposure.<br />
Apart from these more c<strong>on</strong>venti<strong>on</strong>al risk topics, our N<strong>on</strong>trading Market Risk Management functi<strong>on</strong> also has<br />
the mandate to m<strong>on</strong>itor and manage risks arising from equity compensati<strong>on</strong> and asset management and fund<br />
related activities resulting primarily from guaranteed funds. Moreover, our PBC, GTB and PWM businesses<br />
are subject to modeling risk with regard to client deposits. This risk materializes if assumpti<strong>on</strong>s <strong>on</strong> client<br />
behavior are shocked in combinati<strong>on</strong> with interest rate movements.<br />
The Capital and Risk Committee supervises our n<strong>on</strong>trading market risk exposures. Investment proposals for<br />
strategic investments are analyzed by the Group Investment Committee. Depending <strong>on</strong> size of the strategic<br />
investment the investment requires approval from the Group Investment Committee, the Management Board<br />
or even the Supervisory Board. The development of Strategic Investments is m<strong>on</strong>itored by the Group Invest-<br />
ment Committee <strong>on</strong> a regular basis. Multiple members of the Capital and Risk Committee are also members<br />
of the Group Investment Committee, ensuring a close link between both committees.<br />
Due to the complexity and variety of risk characteristics in the area of n<strong>on</strong>trading market risks, the resp<strong>on</strong>si-<br />
bility of risk management is split into three teams<br />
— The N<strong>on</strong>trading Market Risk Management team within our Market Risk Management functi<strong>on</strong> covers mar-<br />
ket risks in PBC, GTB, PWM and Corporate Investments as well as Structural FX Risks, Equity Compen-<br />
sati<strong>on</strong> Risks and Pensi<strong>on</strong> Risks.<br />
175
<strong>20</strong>-F Item 11: Quantitative and Qualitative Disclosures about Credit, Market and Other Risk<br />
— The Principal Investments team within our Credit Risk Management functi<strong>on</strong> is specialized in risk-related<br />
aspects of our n<strong>on</strong>trading alternative asset activities and performs m<strong>on</strong>thly reviews of the risk profile of the<br />
n<strong>on</strong>trading alternative asset portfolios.<br />
— The Asset Management Risk unit within our Credit Risk Management functi<strong>on</strong> is specialized in risk-related<br />
aspects of our asset and fund management business. Noteworthy risks in this area arise, for example,<br />
from performance and/or principal guarantees and reputati<strong>on</strong>al risk related to managing client funds.<br />
Assessment of Market Risk in Our N<strong>on</strong>trading Portfolios<br />
Due to the nature of these positi<strong>on</strong>s as well as the static nature of some of the pricing we do not use value-atrisk<br />
to assess the market risk in our n<strong>on</strong>trading portfolios. Rather we assess the risk through the use of stress<br />
testing procedures that are particular to each risk class and which c<strong>on</strong>sider, am<strong>on</strong>g other factors, large historically-observed<br />
market moves and the liquidity of each asset class as well as changes in client behaviors in<br />
relati<strong>on</strong> to deposit products. In this c<strong>on</strong>text, we also utilize our macroec<strong>on</strong>omic credit portfolio model to estimate<br />
the ec<strong>on</strong>omic capital demand for our strategic investments. This assessment forms the basis of our<br />
ec<strong>on</strong>omic capital estimates which enables us to actively m<strong>on</strong>itor and manage our n<strong>on</strong>trading market risk.<br />
As of year-end <str<strong>on</strong>g><strong>20</strong>09</str<strong>on</strong>g> several enhancements to the ec<strong>on</strong>omic capital coverage across the n<strong>on</strong>trading market<br />
risk portfolio have been introduced. Most significant additi<strong>on</strong>s to our ec<strong>on</strong>omic capital coverage are Equity<br />
Compensati<strong>on</strong> Risks, Structural FX risks and modeling risks with regard to our client deposits in our PBC,<br />
GTB and PWM businesses. Although these positi<strong>on</strong>s have a large ec<strong>on</strong>omic capital impact <strong>on</strong> a standal<strong>on</strong>e<br />
basis, they have <strong>on</strong>ly incremental impact <strong>on</strong> a diversified basis.<br />
Ec<strong>on</strong>omic Capital Usage for Our N<strong>on</strong>trading Market Risk Portfolios per Business Area<br />
The table below shows the ec<strong>on</strong>omic capital usages for our n<strong>on</strong>trading portfolios by business divisi<strong>on</strong>.<br />
Ec<strong>on</strong>omic capital usage for our n<strong>on</strong>trading portfolios<br />
in € m. Dec 31, <str<strong>on</strong>g><strong>20</strong>09</str<strong>on</strong>g> Dec 31, <strong>20</strong>08<br />
CIB 890 941<br />
PCAM 2,246 1,730<br />
Corporate Investments 5,043 577<br />
Other n<strong>on</strong>trading market risk (277) 14<br />
Total DB Group 7,902 3,262<br />
Most significant changes in <str<strong>on</strong>g><strong>20</strong>09</str<strong>on</strong>g> result from the acquisiti<strong>on</strong> of shares in <strong>Deutsche</strong> Postbank AG, which is the<br />
main driver of the ec<strong>on</strong>omic capital increase within Corporate Investments. The increase in PCAM is mainly<br />
driven by further enhancements to the ec<strong>on</strong>omic capital model in Private & Business Clients and Asset and<br />
Wealth Management. The allocati<strong>on</strong> of the ec<strong>on</strong>omic capital c<strong>on</strong>tributi<strong>on</strong> for deposit modeling amounting to<br />
€ 15 milli<strong>on</strong> was shifted from business risk ec<strong>on</strong>omic capital to n<strong>on</strong>trading market risk ec<strong>on</strong>omic capital as of<br />
December 31, <strong>20</strong>08.<br />
176
Carrying Value and Ec<strong>on</strong>omic Capital Usage for Our N<strong>on</strong>trading Market Risk Portfolios<br />
The table below shows the carrying values and ec<strong>on</strong>omic capital usages separately for our n<strong>on</strong>trading portfolios.<br />
N<strong>on</strong>trading portfolios Carrying value Ec<strong>on</strong>omic capital usage<br />
in € bn. Dec 31, <str<strong>on</strong>g><strong>20</strong>09</str<strong>on</strong>g> Dec 31, <strong>20</strong>08 Dec 31, <str<strong>on</strong>g><strong>20</strong>09</str<strong>on</strong>g> Dec 31, <strong>20</strong>08<br />
Strategic Investments 7.6 1.2 4.9 0.8<br />
Major Industrial Holdings1 0.2 1.1 – 0.4<br />
Other Corporate Investments 0.9 0.9 0.2 0.2<br />
Alternative Assets 3.8 3.2 1.3 1.3<br />
Principal Investments 2.0 1.6 0.7 0.7<br />
Real Estate 1.7 1.3 0.6 0.6<br />
Hedge Funds 2 0.1 0.2 – –<br />
Other n<strong>on</strong>trading market risks3 N/A N/A 1.5 0.6<br />
Total 12.5 6.3 7.9 3.3<br />
1 There is a small ec<strong>on</strong>omic capital usage of € 28 milli<strong>on</strong> as of December 31, <str<strong>on</strong>g><strong>20</strong>09</str<strong>on</strong>g>.<br />
2 There is a small ec<strong>on</strong>omic capital usage of € 17 milli<strong>on</strong> as of December 31, <str<strong>on</strong>g><strong>20</strong>09</str<strong>on</strong>g> and € 42 milli<strong>on</strong> as of December 31, <strong>20</strong>08.<br />
3 N/A indicates that the risk is mostly related to off-balance sheet and liability items.<br />
Our ec<strong>on</strong>omic capital usage for these n<strong>on</strong>trading market risk portfolios totaled € 7.9 billi<strong>on</strong> at year-end <str<strong>on</strong>g><strong>20</strong>09</str<strong>on</strong>g>,<br />
which is € 4.6 billi<strong>on</strong>, or 142 %, above our ec<strong>on</strong>omic capital usage at year-end <strong>20</strong>08.<br />
— Strategic Investments. Our ec<strong>on</strong>omic capital usage of € 4.9 billi<strong>on</strong> at December 31, <str<strong>on</strong>g><strong>20</strong>09</str<strong>on</strong>g> was mainly driven<br />
by our participati<strong>on</strong>s in <strong>Deutsche</strong> Postbank AG and Hua Xia <strong>Bank</strong> Company Limited.<br />
— Major Industrial Holdings. Our ec<strong>on</strong>omic capital usage was € 28 milli<strong>on</strong> at December 31, <str<strong>on</strong>g><strong>20</strong>09</str<strong>on</strong>g>. Most of<br />
these Major Industrial Holdings have been divested during <str<strong>on</strong>g><strong>20</strong>09</str<strong>on</strong>g>, most notably the majority of our shareholdings<br />
in Daimler AG. The remaining positi<strong>on</strong>s are no l<strong>on</strong>ger substantial to us.<br />
— Other Corporate Investments. Our ec<strong>on</strong>omic capital usage was € <strong>20</strong>3 milli<strong>on</strong> for our other corporate<br />
investments at year-end <str<strong>on</strong>g><strong>20</strong>09</str<strong>on</strong>g>.<br />
— Alternative assets. Our alternative assets include principal investments, real estate investments (including<br />
mezzanine debt) and small investments in hedge funds. Principal investments are composed of direct<br />
in-vestments in private equity, mezzanine debt, short-term investments in financial sp<strong>on</strong>sor leveraged buyout<br />
funds, bridge capital to leveraged buy-out funds and private equity led transacti<strong>on</strong>s. The alternative<br />
assets portfolio has some c<strong>on</strong>centrati<strong>on</strong> in infrastructure and real estate assets. While recent market c<strong>on</strong>diti<strong>on</strong>s<br />
have limited the opportunities to sell down the portfolio, our intenti<strong>on</strong> remains to do so, provided<br />
suitable c<strong>on</strong>diti<strong>on</strong>s allow it.<br />
— Other n<strong>on</strong>trading market risks:<br />
— Deposit bucketing. Ec<strong>on</strong>omic capital derived from stressing modeling assumpti<strong>on</strong>s for the effective<br />
durati<strong>on</strong> of overnight deposits. Our ec<strong>on</strong>omic capital usage was € 247 milli<strong>on</strong> at December 31, <str<strong>on</strong>g><strong>20</strong>09</str<strong>on</strong>g><br />
and was mainly driven by PBC with a c<strong>on</strong>tributi<strong>on</strong> of € 228 milli<strong>on</strong>.<br />
— Equity compensati<strong>on</strong>. Risk arising from structural short positi<strong>on</strong> in our own share price arising from<br />
restricted equity units. Our ec<strong>on</strong>omic capital usage was € (597) milli<strong>on</strong> at December 31, <str<strong>on</strong>g><strong>20</strong>09</str<strong>on</strong>g> <strong>on</strong> a<br />
diversified basis. The negative c<strong>on</strong>tributi<strong>on</strong> to our diversified ec<strong>on</strong>omic capital is derived from the fact<br />
that a reducti<strong>on</strong> of our share price in a downside scenario as expressed by ec<strong>on</strong>omic capital would<br />
lead to reduced negative impact <strong>on</strong> our capital positi<strong>on</strong> from the equity compensati<strong>on</strong> liabilities.<br />
177
<strong>20</strong>-F Item 11: Quantitative and Qualitative Disclosures about Credit, Market and Other Risk<br />
— Structural Foreign Exchange Risk. Our foreign exchange exposure arising from unhedged capital and<br />
retained earnings in n<strong>on</strong>-euro currencies in certain subsidiaries. Our ec<strong>on</strong>omic capital usage was<br />
€ 307 milli<strong>on</strong> at December 31, <str<strong>on</strong>g><strong>20</strong>09</str<strong>on</strong>g> <strong>on</strong> a diversified basis.<br />
— Asset Management. Guaranteed Funds: Our ec<strong>on</strong>omic capital usage was € 1.3 billi<strong>on</strong> at December<br />
31, <str<strong>on</strong>g><strong>20</strong>09</str<strong>on</strong>g>, an increase of 139 % over our ec<strong>on</strong>omic capital usage at year-end <strong>20</strong>08, driven by a recalibrati<strong>on</strong><br />
of ec<strong>on</strong>omic capital calculati<strong>on</strong> parameters (shocks, correlati<strong>on</strong>s) in July <str<strong>on</strong>g><strong>20</strong>09</str<strong>on</strong>g> reflecting<br />
changed market c<strong>on</strong>diti<strong>on</strong>s.<br />
Our total ec<strong>on</strong>omic capital figures do not currently take into account diversificati<strong>on</strong> benefits between the asset<br />
categories except for those of equity compensati<strong>on</strong> and structural FX risks.<br />
Operati<strong>on</strong>al Risk<br />
Organizati<strong>on</strong>al Structure<br />
The Global Head of Operati<strong>on</strong>al Risk Management is a member of the Risk Executive Committee and reports<br />
to the Chief Risk Officer. He chairs the Operati<strong>on</strong>al Risk Management Committee, which is a permanent subcommittee<br />
of the Risk Executive Committee and is composed of the Operati<strong>on</strong>al Risk Officers from our Business<br />
Divisi<strong>on</strong>s and our Infrastructure Functi<strong>on</strong>s. It is the main decisi<strong>on</strong>-making committee for all operati<strong>on</strong>al<br />
risk management matters.<br />
While the day-to-day operati<strong>on</strong>al risk management lies with our business divisi<strong>on</strong>s and infrastructure functi<strong>on</strong>s,<br />
the Operati<strong>on</strong>al Risk Management functi<strong>on</strong> manages the cross divisi<strong>on</strong>al and cross regi<strong>on</strong>al operati<strong>on</strong>al<br />
risk and ensures a c<strong>on</strong>sistent applicati<strong>on</strong> of our operati<strong>on</strong>al risk management strategy across the bank. Based<br />
<strong>on</strong> this Business Partnership Model, which is also shown in the chart below, we ensure close m<strong>on</strong>itoring and<br />
high awareness of operati<strong>on</strong>al risk.<br />
178
Business Partnership Model of Operati<strong>on</strong>al Risk Management<br />
Business Partners<br />
Divisi<strong>on</strong>al OR Teams<br />
Managing Our Operati<strong>on</strong>al Risk<br />
We manage operati<strong>on</strong>al risk based <strong>on</strong> a Group-wide c<strong>on</strong>sistent framework that enables us to determine our<br />
operati<strong>on</strong>al risk profile in comparis<strong>on</strong> to our risk appetite and systematically identify operati<strong>on</strong>al risk themes to<br />
define risk mitigating measures and priorities.<br />
We apply a number of techniques to efficiently manage the operati<strong>on</strong>al risk in our business, for example:<br />
— We perform systematic risk analyses, root cause analyses and less<strong>on</strong>s learned activities for events above<br />
€ 2 milli<strong>on</strong> to identify inherent areas of risk and to define appropriate risk mitigating acti<strong>on</strong>s which are<br />
m<strong>on</strong>itored for resoluti<strong>on</strong>. The prerequisite for these detailed analyses and the timely informati<strong>on</strong> of our<br />
senior management <strong>on</strong> the development of the operati<strong>on</strong>al risk events and <strong>on</strong> single larger events is the<br />
c<strong>on</strong>tinuous collecti<strong>on</strong> of all losses above € 10,000 arising from operati<strong>on</strong>al risk events in our “db-Incident<br />
<str<strong>on</strong>g>Report</str<strong>on</strong>g>ing System”.<br />
— We systematically utilize informati<strong>on</strong> <strong>on</strong> external events occurring in the banking industry to ensure that<br />
similar incidents will not happen to us.<br />
Daily Executi<strong>on</strong><br />
• Part of business lines<br />
• Daily risk management<br />
• Implementati<strong>on</strong> of<br />
ORM Framework<br />
Independent central<br />
ORM functi<strong>on</strong><br />
Strategy<br />
<str<strong>on</strong>g>Report</str<strong>on</strong>g>ing<br />
Target Setting<br />
ORM Framework<br />
AMA Capital Calculati<strong>on</strong><br />
— Key Risk Indicators (“KRI”) are used to alert the organizati<strong>on</strong> to impending problems in a timely fashi<strong>on</strong>.<br />
They allow the m<strong>on</strong>itoring of the bank’s c<strong>on</strong>trol culture as well as the operati<strong>on</strong>al risk profile and trigger<br />
risk mitigating acti<strong>on</strong>s. Within the KRI program we capture data at a granular level allowing for business<br />
envir<strong>on</strong>ment m<strong>on</strong>itoring and facilitating the forward looking management of operati<strong>on</strong>al risk based <strong>on</strong> early<br />
warning signals returned by the KRIs. We capture and m<strong>on</strong>itor key operati<strong>on</strong>al risk indicators in our tool<br />
“db-Score”.<br />
179<br />
M<strong>on</strong>itoring<br />
Testing and verificati<strong>on</strong><br />
by: Audit, Compliance,<br />
Legal, Finance and others<br />
C<strong>on</strong>trol Groups<br />
Functi<strong>on</strong>al OR Teams
<strong>20</strong>-F Item 11: Quantitative and Qualitative Disclosures about Credit, Market and Other Risk<br />
— In our bottom-up Risk and C<strong>on</strong>trol Self Assessment (“RCSA”) process, which is c<strong>on</strong>ducted at least<br />
annually, areas with high risk potential are highlighted and risk mitigating measures to resolve issue are<br />
identified. In general, RCSAs are performed in our tool “db-SAT”. On a regular basis we c<strong>on</strong>duct country<br />
risk workshops aiming to evaluate risks specific to countries and local legal entities we are operating in<br />
and take appropriate risk mitigating acti<strong>on</strong>s.<br />
— Regular operati<strong>on</strong>al risk profile reports for our business divisi<strong>on</strong>s, the countries we are operating in and<br />
selected infrastructure groups are reviewed and discussed with the department’s senior management. The<br />
regular performance of the risk profile reviews enables us to early detect changes to the units risk profile<br />
and to take corrective acti<strong>on</strong>s.<br />
— Within our tracking tool “db-Track” we m<strong>on</strong>itor risk mitigating measures identified via these techniques for<br />
resoluti<strong>on</strong>.<br />
— Due to the heterogeneous nature of operati<strong>on</strong>al risks in certain cases operati<strong>on</strong>al risks cannot be fully<br />
mitigated. In such cases operati<strong>on</strong>al risks are mitigated following the “as low as reas<strong>on</strong>able possible” principle<br />
and the residual risk is formally accepted.<br />
— We perform top risk analyses in which the results of the aforementi<strong>on</strong>ed activities are c<strong>on</strong>sidered. The top<br />
risk analyses mainly c<strong>on</strong>tribute into the annual operati<strong>on</strong>al risk management strategy and planning<br />
process. Besides the operati<strong>on</strong>al risk management strategic and tactical planning we define capital and<br />
expected loss targets which are m<strong>on</strong>itored <strong>on</strong> a regular basis within the quarterly forecasting process.<br />
Measuring Our Operati<strong>on</strong>al Risks<br />
Ec<strong>on</strong>omic capital usage (for operati<strong>on</strong>al risk)<br />
in € m.<br />
Dec 31, <str<strong>on</strong>g><strong>20</strong>09</str<strong>on</strong>g> Dec 31, <strong>20</strong>08<br />
CIB 2,822 3,324<br />
PCAM 654 803<br />
CI 17 <strong>20</strong><br />
Total 3,493 4,147<br />
Our ec<strong>on</strong>omic capital for operati<strong>on</strong>al risk as of December 31, <str<strong>on</strong>g><strong>20</strong>09</str<strong>on</strong>g> was € 3.5 billi<strong>on</strong>, a 16 % reducti<strong>on</strong> from<br />
€ 4.1 billi<strong>on</strong> reported for the end of <strong>20</strong>08. The reducti<strong>on</strong> is principally driven by<br />
— € <strong>20</strong>0 milli<strong>on</strong> additi<strong>on</strong>al insurances for professi<strong>on</strong>al indemnity tail risk in the investment banking area.<br />
— New m<strong>on</strong>itoring and c<strong>on</strong>trol mechanisms enable us to identify earlier where staff is n<strong>on</strong>-compliant with a<br />
number of established direct and indirect fraud preventi<strong>on</strong> measures.<br />
— Positive development of the Key Risk Indicators utilized in the Qualitative Adjustment combined with an<br />
increased sensitivity of our Advanced Measurement Approach (AMA) capital model to recent business<br />
envir<strong>on</strong>ment developments.<br />
We calculate and measure the ec<strong>on</strong>omic and regulatory capital for operati<strong>on</strong>al risk using the internal AMA<br />
methodology. Ec<strong>on</strong>omic capital is derived from the 99.98 % quantile and allocated to the businesses and used<br />
in performance measurement and resource allocati<strong>on</strong>, providing an incentive to manage operati<strong>on</strong>al risk,<br />
optimizing ec<strong>on</strong>omic capital utilizati<strong>on</strong>. The regulatory capital operati<strong>on</strong>al risk applies the 99.9 % quantile and<br />
is calculated globally across all businesses.<br />
180
Our internal AMA capital calculati<strong>on</strong> is based up<strong>on</strong> the loss distributi<strong>on</strong> approach. Net losses (gross losses<br />
adjusted for direct recoveries) from historical internal and external loss data (Operati<strong>on</strong>al Riskdata eXchange<br />
Associati<strong>on</strong> (ORX) c<strong>on</strong>sortium data and a public database), plus scenario data are used to estimate the risk<br />
profile (that is, a loss frequency and a loss severity distributi<strong>on</strong>). Thereafter, frequency and severity distributi<strong>on</strong><br />
are combined in a M<strong>on</strong>te Carlo simulati<strong>on</strong> to generate losses over a <strong>on</strong>e year time horiz<strong>on</strong>. Finally, the<br />
risk mitigating benefits of insurance are applied to each loss generated in the M<strong>on</strong>te Carlo simulati<strong>on</strong>. Correlati<strong>on</strong>/diversificati<strong>on</strong><br />
benefits are applied to the net losses – in a manner compatible with regulatory requirements<br />
– to arrive at a net loss distributi<strong>on</strong> at the Group level covering expected and unexpected losses. Capital<br />
is then allocated to each of the business divisi<strong>on</strong>s and both the qualitative adjustment (“QA”) and expected<br />
losses deducti<strong>on</strong> are made.<br />
The QA reflects the effectiveness and performance of the day-to-day operati<strong>on</strong>al risk management activities<br />
via KRIs and RCSAs focusing <strong>on</strong> the business envir<strong>on</strong>ment and internal c<strong>on</strong>trol factors. QA is applied as a<br />
percentage adjustment to the final capital number. This approach makes qualitative adjustment transparent to<br />
the management of the businesses and provides feedback <strong>on</strong> their risk profile as well as <strong>on</strong> the success of<br />
their management of operati<strong>on</strong>al risk. It thus provides incentives for the businesses to c<strong>on</strong>tinuously improve<br />
Operati<strong>on</strong>al Risk Management in their areas.<br />
The expected loss for operati<strong>on</strong>al risk is based <strong>on</strong> historical loss experience and expert judgment c<strong>on</strong>sidering<br />
business changes denoting the expected cost of operati<strong>on</strong>al losses for doing business. To the extent it is<br />
c<strong>on</strong>sidered in the divisi<strong>on</strong>al business plans it is deducted from the AMA capital figure.<br />
The unexpected losses for the business divisi<strong>on</strong>s (after QA and expected loss) are aggregated to produce the<br />
Group AMA capital figure.<br />
Since <strong>20</strong>08 we have maintained approval by the BaFin to use the AMA.<br />
Our Operati<strong>on</strong>al Risk Management Stress Testing C<strong>on</strong>cept<br />
Within our Stress Testing c<strong>on</strong>cept we ensure that operati<strong>on</strong>al risks are sufficiently and adequately stressed.<br />
Our AMA methodology already incorporates stress testing elements such as external data c<strong>on</strong>taining extreme<br />
data points and an over 25 year loss history both used to model the severity distributi<strong>on</strong>. Additi<strong>on</strong>ally, we<br />
perform complementary sensitivity and firm wide stress tests. We also participate in stress tests initiated by<br />
the banking supervisi<strong>on</strong>, e.g., the EU-wide stress test from the Committee of European <strong>Bank</strong>ing Supervisors,<br />
which resulted in <strong>on</strong>ly a minimal capital impact.<br />
Role of Corporate Insurance/Deuk<strong>on</strong>a<br />
The definiti<strong>on</strong> of our insurance strategy and supporting insurance policy and guidelines is the resp<strong>on</strong>sibility of<br />
our specialized unit Corporate Insurance/Deuk<strong>on</strong>a (“CI/D”). CI/D is resp<strong>on</strong>sible for our global corporate insurance<br />
policy which is approved by our Management Board.<br />
181
<strong>20</strong>-F Item 11: Quantitative and Qualitative Disclosures about Credit, Market and Other Risk<br />
CI/D is resp<strong>on</strong>sible for acquiring insurance coverage and for negotiating c<strong>on</strong>tract terms and premiums. CI/D<br />
also has a role in the allocati<strong>on</strong> of insurance premiums to the businesses. CI/D specialists assist in devising<br />
the method for reflecting insurance in the capital calculati<strong>on</strong>s and in arriving at parameters to reflect the regulatory<br />
requirements. CI/D is actively involved in industry efforts to reflect the effect of insurance in the results<br />
of the capital calculati<strong>on</strong>s.<br />
We buy insurance in order to protect ourselves against unexpected and substantial unforeseeable losses. The<br />
identificati<strong>on</strong>, definiti<strong>on</strong> of magnitude and estimati<strong>on</strong> procedures used are based <strong>on</strong> the recognized insurance<br />
terms of “comm<strong>on</strong> sense”, “state-of-the-art” and/or “benchmarking”. The maximum limit per insured risk takes<br />
into account the reliability of the insurer and a cost/benefit ratio, especially in cases in which the insurance<br />
market tries to reduce coverage by restricted/limited policy wordings and specific exclusi<strong>on</strong>s.<br />
We maintain a number of captive insurance companies, both primary and re-insurance companies. However,<br />
insurance c<strong>on</strong>tracts provided are <strong>on</strong>ly c<strong>on</strong>sidered in the modeling/calculati<strong>on</strong> of insurance-related reducti<strong>on</strong>s<br />
of operati<strong>on</strong>al risk capital requirements where the risk is re-insured in the external insurance market. Other<br />
insurance c<strong>on</strong>tracts from captive companies will <strong>on</strong>ly be c<strong>on</strong>sidered if and when they have been explicitly<br />
approved by the BaFin in compliance with the relevant Solvency Regulati<strong>on</strong>s requirements.<br />
CI/D selects insurance partners in strict compliance with the regulatory requirements specified in the Solven-<br />
cy Regulati<strong>on</strong>s and the “Operati<strong>on</strong>al Risks Experts Group recommendati<strong>on</strong> <strong>on</strong> the recogniti<strong>on</strong> of insurance in<br />
advanced measurement approaches”. The insurance portfolio, as well as CI/D activities are audited by Group<br />
Audit <strong>on</strong> a periodic basis.<br />
Liquidity Risk<br />
Liquidity risk management safeguards our ability to meet all payment obligati<strong>on</strong>s when they come due. Our<br />
liquidity risk management framework has been an important factor in maintaining adequate liquidity and in<br />
managing our funding profile during <str<strong>on</strong>g><strong>20</strong>09</str<strong>on</strong>g>.<br />
Liquidity Risk Management Framework<br />
Our Treasury functi<strong>on</strong> is resp<strong>on</strong>sible for the management of liquidity risk. Our liquidity risk management<br />
framework is designed to identify, measure and manage the liquidity risk positi<strong>on</strong> of the Group. The underlying<br />
policy, including the bank’s risk tolerance, is reviewed and approved regularly by the Management Board.<br />
The policy defines the liquidity risk limits which are applied to the Group.<br />
Our liquidity risk management approach starts at the intraday level (operati<strong>on</strong>al liquidity) managing the daily<br />
payments queue, forecasting cash flows and factoring in our access to Central <strong>Bank</strong>s. It then covers tactical<br />
liquidity risk management dealing with the access to secured and unsecured funding sources. Finally, the<br />
strategic perspective comprises the maturity profile of all assets and liabilities (Funding Matrix) <strong>on</strong> our bal-<br />
ance sheet and our issuance strategy.<br />
Our cash-flow based reporting system provides daily liquidity risk informati<strong>on</strong> to global and regi<strong>on</strong>al manage-<br />
ment.<br />
182
Stress testing and scenario analysis plays a central role in our liquidity risk management framework. This also<br />
incorporates an assessment of asset liquidity, i.e. the characteristics of our asset inventory, under various<br />
stress scenarios.<br />
Short-term Liquidity and Wholesale Funding<br />
Our reporting system tracks cash flows <strong>on</strong> a daily basis over an 18-m<strong>on</strong>th horiz<strong>on</strong>. This system allows<br />
management to assess our short-term liquidity positi<strong>on</strong> in each locati<strong>on</strong>, regi<strong>on</strong> and globally <strong>on</strong> a by-currency,<br />
by-product and by-divisi<strong>on</strong> basis. The system captures all of our cash flows from transacti<strong>on</strong>s <strong>on</strong> our balance<br />
sheet, as well as liquidity risks resulting from off-balance sheet transacti<strong>on</strong>s. We model products that have no<br />
specific c<strong>on</strong>tractual maturities using statistical methods to reflect the behavioral characteristics of their cash<br />
flows. Liquidity outflow limits (Maximum Cash Outflow Limits), which have been set to limit cumulative global<br />
and local cash outflows, are m<strong>on</strong>itored <strong>on</strong> a daily basis to safeguard our access to liquidity.<br />
As of year-end <str<strong>on</strong>g><strong>20</strong>09</str<strong>on</strong>g> we have implemented a new reporting system which focuses <strong>on</strong> c<strong>on</strong>tractual cash flows<br />
from wholesale funding sources <strong>on</strong> a daily basis over a 12-m<strong>on</strong>th horiz<strong>on</strong>. The system captures all cash flows<br />
from unsecured as well as from secured funding transacti<strong>on</strong>s. Wholesale funding limits, which are calibrated<br />
against our stress testing results and approved by the Management Board, describe our maximum tolerance<br />
for liquidity risk. These limits apply to the cumulative global cash outflows and are m<strong>on</strong>itored <strong>on</strong> a daily basis.<br />
Unsecured Funding<br />
Unsecured funding is a finite resource. Total unsecured funding represents the amount of external liabilities<br />
which we take from the market irrespective of instrument, currency or tenor. Unsecured funding is measured<br />
<strong>on</strong> a regi<strong>on</strong>al basis by currency and aggregated to a global utilizati<strong>on</strong> report. The management board<br />
approves limits to protect our access to unsecured funding at attractive levels.<br />
Funding Diversificati<strong>on</strong><br />
Diversificati<strong>on</strong> of our funding profile in terms of investor types, regi<strong>on</strong>s, products and instruments is an important<br />
element of our liquidity risk management framework. Our core funding resources come from retail clients,<br />
l<strong>on</strong>g-term capital markets investors and transacti<strong>on</strong> banking clients. Other customer deposits and borrowing<br />
from other banks are additi<strong>on</strong>al sources of funding. We use interbank deposits primarily to fund liquid assets.<br />
In <str<strong>on</strong>g><strong>20</strong>09</str<strong>on</strong>g> we c<strong>on</strong>tinued to focus <strong>on</strong> increasing our stable core funding comp<strong>on</strong>ents and <strong>on</strong> reducing our short-<br />
term discreti<strong>on</strong>ary wholesale funding.<br />
The following chart shows the compositi<strong>on</strong> of our external funding sources that c<strong>on</strong>tribute to the liquidity risk<br />
positi<strong>on</strong> as of December 31, <str<strong>on</strong>g><strong>20</strong>09</str<strong>on</strong>g> and December 31, <strong>20</strong>08, both in euro billi<strong>on</strong> and as a percentage of our<br />
total external funding sources. Compared to the <strong>20</strong>08 versi<strong>on</strong> of the below chart, we have added funding<br />
sources such as secured funding and financing vehicles, in order to further increase the transparency <strong>on</strong> the<br />
bank’s overall funding mix.<br />
183
<strong>20</strong>-F Item 11: Quantitative and Qualitative Disclosures about Credit, Market and Other Risk<br />
Compositi<strong>on</strong> of external funding sources<br />
in € bn.<br />
250<br />
<strong>20</strong>0<br />
150<br />
100<br />
50<br />
0<br />
164<br />
21%<br />
169<br />
<strong>20</strong>%<br />
Capital Markets<br />
and Equity<br />
153<br />
<strong>20</strong>%<br />
Dec 31, <str<strong>on</strong>g><strong>20</strong>09</str<strong>on</strong>g>: total € 777 billi<strong>on</strong><br />
152<br />
18%<br />
100<br />
13%<br />
97<br />
11%<br />
Retail Transacti<strong>on</strong><br />
<strong>Bank</strong>ing<br />
* Other includes fiduciary, self-funding structures (e.g. X-markets), margin/Prime Brokerage cash balances (shown <strong>on</strong> a net basis).<br />
** Includes ABCP c<strong>on</strong>duits.<br />
118<br />
15%<br />
Funding Matrix<br />
We map all funding-relevant assets and all liabilities into time buckets corresp<strong>on</strong>ding to their maturities to<br />
compile a maturity profile (funding matrix). Given that trading assets are typically more liquid than their c<strong>on</strong>tractual<br />
maturities suggest, we determine individual liquidity profiles reflecting their relative liquidity value. We<br />
take assets and liabilities from the retail bank that show a behavior of being renewed or prol<strong>on</strong>ged regardless<br />
of capital market c<strong>on</strong>diti<strong>on</strong>s (mortgage loans and retail deposits) and assign them to time buckets reflecting<br />
the expected prol<strong>on</strong>gati<strong>on</strong>. Wholesale banking products are included with their c<strong>on</strong>tractual maturities.<br />
The funding matrix identifies the excess or shortfall of assets over liabilities in each time bucket, facilitating<br />
management of open liquidity exposures. The funding matrix is a key input parameter for our annual capital<br />
market issuance plan, which, up<strong>on</strong> approval by the Capital and Risk Committee, establishes issuing targets<br />
for securities by tenor, volume and instrument. As per the year-end <str<strong>on</strong>g><strong>20</strong>09</str<strong>on</strong>g>, we were l<strong>on</strong>g funded in each of the<br />
annual time buckets of the funding matrix (2-10 years).<br />
In <str<strong>on</strong>g><strong>20</strong>09</str<strong>on</strong>g>, Treasury issued capital market instruments with a total value of approximately € 19.9 billi<strong>on</strong>,<br />
€ 3.9 billi<strong>on</strong> more than the original issuance plan.<br />
For informati<strong>on</strong> regarding the maturity profile of our l<strong>on</strong>g-term debt, please refer to Note [29] of our c<strong>on</strong>solidated<br />
financial statements.<br />
184<br />
144<br />
17%<br />
Other<br />
Customers*<br />
Dec 31, <strong>20</strong>08: total € 858 billi<strong>on</strong><br />
51<br />
7%<br />
55<br />
6%<br />
Discreti<strong>on</strong>ary<br />
Wholesale<br />
165<br />
21%<br />
<strong>20</strong>2<br />
24%<br />
Secured Funding<br />
and Shorts<br />
26<br />
3%<br />
39<br />
5%<br />
Financing<br />
Vehicles**
Stress Testing and Scenario Analysis<br />
We use stress testing and scenario analysis to evaluate the impact of sudden stress events <strong>on</strong> our liquidity<br />
positi<strong>on</strong>. The scenarios have been based <strong>on</strong> historic events, such as the 1987 stock market crash, the 1990<br />
U.S. liquidity crunch and the September <strong>20</strong>01 terrorist attacks, liquidity crisis case studies and hypothetical<br />
events. Also incorporated are new liquidity risk drivers revealed by the latest financial markets crisis:<br />
prol<strong>on</strong>ged term m<strong>on</strong>ey-market freeze, collateral repudiati<strong>on</strong>, limited fungibility of currencies, stranded<br />
syndicati<strong>on</strong>s, systemic knock-<strong>on</strong> effects and further liquidity risk drivers such as intraday liquidity risk. As of<br />
year-end <str<strong>on</strong>g><strong>20</strong>09</str<strong>on</strong>g> we also have introduced a scenario which combines a systemic market shock with a multi<br />
notch rating downgrade.<br />
Under each of these scenarios we assume that all maturing loans to customers will need to be rolled over and<br />
require funding whereas rollover of liabilities will be partially impaired resulting in a funding gap. We then<br />
model the steps we would take to counterbalance the resulting net shortfall in funding. Countermeasures<br />
would include the bank’s l<strong>on</strong>g cash balance and unencumbered asset inventory as well as our Strategic<br />
Liquidity Reserve.<br />
The asset liquidity analysis thereby forms an integral piece of stress testing and tracks the volume and booking<br />
locati<strong>on</strong> within our c<strong>on</strong>solidated inventory of unencumbered, liquid assets which we can use to raise<br />
liquidity via secured funding transacti<strong>on</strong>s. Securities inventories include a wide variety of different securities.<br />
As a first step, we segregate illiquid and liquid securities in each inventory. Subsequently we assign liquidity<br />
values to different classes of liquid securities. The liquidity of these assets is an important element in protecting<br />
us against short-term liquidity squeezes.<br />
In additi<strong>on</strong>, we keep a dedicated strategic liquidity reserve c<strong>on</strong>taining highly liquid and central bank eligible<br />
securities in major currencies around the world to support our liquidity profile in case of potential deteriorating<br />
market c<strong>on</strong>diti<strong>on</strong>s. The strategic liquidity reserve amounts to € 54.9 billi<strong>on</strong> as of December 31, <str<strong>on</strong>g><strong>20</strong>09</str<strong>on</strong>g>. This<br />
reserve is held in additi<strong>on</strong> to the bank’s cash balance and the collateral the bank needs to support its clearing<br />
activities in euro, U.S. dollars and other currencies which are held in separate portfolios around the globe.<br />
Stress testing is fully integrated in our liquidity risk management framework. We track c<strong>on</strong>tractual cash flows<br />
per currency and product over an eight-week horiz<strong>on</strong> (which we c<strong>on</strong>sider the most critical time span in a<br />
liquidity crisis) and apply the relevant stress case to all potential risk drivers from <strong>on</strong> balance sheet and off<br />
balance sheet products. Bey<strong>on</strong>d the eight week time horiz<strong>on</strong> we analyze <strong>on</strong> a quarterly basis the impact of a<br />
change of business model out to 12 m<strong>on</strong>ths. The liquidity stress testing provides the basis for the bank’s c<strong>on</strong>tingency<br />
funding plans which are approved by the Management Board.<br />
185
<strong>20</strong>-F Item 11: Quantitative and Qualitative Disclosures about Credit, Market and Other Risk<br />
Our stress testing analysis assesses our ability to generate sufficient liquidity under critical c<strong>on</strong>diti<strong>on</strong>s and has<br />
been a valuable input when defining our target liquidity risk positi<strong>on</strong>. The analysis is performed m<strong>on</strong>thly. The<br />
following table shows stress testing results as of December 31, <str<strong>on</strong>g><strong>20</strong>09</str<strong>on</strong>g>. For each scenario, the table shows<br />
what our cumulative funding gap would be over an eight-week horiz<strong>on</strong> after occurrence of the triggering event<br />
and how much counterbalancing liquidity we could generate.<br />
Scenario Funding gap 1<br />
Gap closure<br />
in € bn.<br />
2<br />
Liquidity impact<br />
in € bn.<br />
3<br />
Systemic market risk 45 112 Improves over time<br />
Emerging markets 14 116 Improves over time<br />
Event shock 17 95 Temporary disrupti<strong>on</strong><br />
Operati<strong>on</strong>al risk (DB specific) 15 1<strong>20</strong> Temporary disrupti<strong>on</strong><br />
1 notch downgrade (DB specific) 34 119 Permanent<br />
Downgrade to A-2/P-2 (DB specific) 106 118 Permanent<br />
Combined4 108 116 Permanent<br />
1 Funding gap caused by impaired rollover of liabilities and other expected outflows.<br />
2 Based <strong>on</strong> liquidity generati<strong>on</strong> through counterbalancing and asset liquidity opportunities.<br />
3 We analyze whether the risk to our liquidity would be temporary or l<strong>on</strong>ger-term in nature.<br />
4 Combined impact of systemic market risk and downgrade to A-2/P-2.<br />
With the increasing importance of liquidity management in the financial industry, we c<strong>on</strong>sider it important to<br />
c<strong>on</strong>fer with central banks, supervisors, rating agencies and market participants <strong>on</strong> liquidity risk-related topics.<br />
We participate in a number of working groups regarding liquidity and participate in efforts to create industrywide<br />
standards that are appropriate to evaluate and manage liquidity risk at financial instituti<strong>on</strong>s.<br />
186
Maturity Analysis of Financial Liabilities<br />
The following table presents a maturity analysis of the earliest c<strong>on</strong>tractual undiscounted cash flows for financial<br />
liabilities as of December 31, <str<strong>on</strong>g><strong>20</strong>09</str<strong>on</strong>g>, and <strong>20</strong>08.<br />
Dec 31, <str<strong>on</strong>g><strong>20</strong>09</str<strong>on</strong>g><br />
in € m.<br />
On demand Due within<br />
3 m<strong>on</strong>ths<br />
1 Trading liabilities and derivatives not qualifying for hedge accounting balances are recorded at fair value. We believe that this best represents the cash<br />
flow that would have to be paid if these positi<strong>on</strong>s had to be closed out. Trading liabilities and derivatives not qualifying for hedge accounting balances are<br />
shown within <strong>on</strong> demand which management believes most accurately reflects the short-term nature of trading activities. The c<strong>on</strong>tractual maturity of the<br />
instruments may however extend over significantly l<strong>on</strong>ger periods.<br />
2 These are investment c<strong>on</strong>tracts where the policy terms and c<strong>on</strong>diti<strong>on</strong>s result in their redempti<strong>on</strong> value equaling fair value. See Note [39] for more detail<br />
<strong>on</strong> these c<strong>on</strong>tracts.<br />
3 Derivatives designated for hedge accounting are recorded at fair value and are shown in the time bucket at which the hedged relati<strong>on</strong>ship is expected to<br />
terminate.<br />
4 The balances in the table do not agree to the numbers in the Group balance sheet as the cash flows included in the table are undiscounted. This analysis<br />
represents the worst case scenario for the Group if they were required to repay all liabilities earlier than expected. We believe that the likelihood of such<br />
an event occurring is remote. Interest cash flows have been excluded from the table.<br />
187<br />
Due between<br />
3 and 12<br />
m<strong>on</strong>ths<br />
Due between<br />
1 and 5 years<br />
Due after<br />
5 years<br />
N<strong>on</strong>interest bearing deposits 51,731 – – – –<br />
Interest bearing deposits 117,960 126,598 14,649 21,362 11,987<br />
Trading liabilities 1 Negative market values from derivative<br />
64,501 – – – –<br />
financial instruments 1 Financial liabilities designated at fair<br />
576,973 – – – –<br />
value through profit or loss 64,9<strong>20</strong> 33,785 4,806 5,797 4,826<br />
Investment c<strong>on</strong>tract liabilities 2 Negative market values from derivative<br />
financial instruments qualifying for<br />
– 514 806 1,247 4,710<br />
hedge accounting 3 946 – 10 392 2,455<br />
Central bank funds purchased<br />
Securities sold under repurchase<br />
3,824 1,884 – – –<br />
agreements 1,349 38,292 104 37 5<br />
Securities loaned 5,028 54 16 – 466<br />
Other short-term borrowings 24,830 17,370 632 – –<br />
L<strong>on</strong>g-term debt 1,856 2,044 <strong>20</strong>,373 67,837 41,011<br />
Trust preferred securities – – 746 3,991 5,840<br />
Other financial liabilities 1<strong>20</strong>,731 6,705 375 233 60<br />
Off-balance sheet loan commitments 63,662 – – – –<br />
Financial guarantees 21,719 – – – –<br />
Total 4 1,1<strong>20</strong>,030 227,246 42,517 100,896 71,360
<strong>20</strong>-F Item 11: Quantitative and Qualitative Disclosures about Credit, Market and Other Risk<br />
Dec 31, <strong>20</strong>08 On demand Due within<br />
in € m.<br />
3 m<strong>on</strong>ths<br />
1 Trading liabilities and derivatives balances are recorded at fair value. We believe that this best represents the cash flow that would have to be paid if<br />
these positi<strong>on</strong>s had to be closed out. Trading and derivatives balances are shown within <strong>on</strong> demand which management believes most accurately reflects<br />
the short-term nature of trading activities. The c<strong>on</strong>tractual maturity of the instruments may however extend over significantly l<strong>on</strong>ger periods.<br />
2 These are investment c<strong>on</strong>tracts where the policy terms and c<strong>on</strong>diti<strong>on</strong>s result in their redempti<strong>on</strong> value equaling fair value. See Note [39] for more detail<br />
<strong>on</strong> these c<strong>on</strong>tracts.<br />
3 The balances in the table do not agree to the numbers in the balance sheet as the cash flows included in the table are undiscounted. This analysis<br />
represents the worst case scenario if they were required to repay all liabilities earlier than expected. We believe that the likelihood of such an event<br />
occurring is remote. Interest cash flows have been excluded from the table.<br />
4 The prior year amounts have been adjusted and the <str<strong>on</strong>g><strong>20</strong>09</str<strong>on</strong>g> amendment to IFRS 7 has not been applied to the comparative informati<strong>on</strong>. The fair value for<br />
embedded derivatives and derivatives designated for hedge accounting are shown within <strong>on</strong> demand.<br />
In additi<strong>on</strong> to our internal liquidity management systems, the liquidity exposure of German banks is regulated<br />
by the <strong>Bank</strong>ing Act and regulati<strong>on</strong>s issued by the BaFin. For a further descripti<strong>on</strong> of these regulati<strong>on</strong>s, see<br />
“Item 4: Informati<strong>on</strong> <strong>on</strong> the Company – Regulati<strong>on</strong> and Supervisi<strong>on</strong> – Regulati<strong>on</strong> and Supervisi<strong>on</strong> in Germany –<br />
Liquidity Requirements.” We are in compliance with all applicable liquidity regulati<strong>on</strong>s.<br />
188<br />
Due between 3<br />
and 12 m<strong>on</strong>ths<br />
Due between<br />
1 and 5 years<br />
Due after<br />
5 years<br />
N<strong>on</strong>interest bearing deposits 34,211 – – – –<br />
Interest bearing deposits 143,417 143,309 39,367 <strong>20</strong>,917 14,332<br />
Trading liabilities 1 Negative market values from<br />
68,168 – – – –<br />
derivative financial instruments<br />
Financial liabilities designated at fair<br />
1,181,617 – – – –<br />
value through profit or loss 52,323 33,751 8,494 7,909 9,180<br />
Investment c<strong>on</strong>tract liabilities 2 Negative market values from<br />
derivative financial instruments<br />
– 438 668 985 3,886<br />
qualifying for hedge accounting 1 4,362 – – – –<br />
Central bank funds purchased<br />
Securities sold under repurchase<br />
9,669 17,440 – – –<br />
agreements 871 36,899 19,602 – 2,636<br />
Securities loaned 2,155 1,047 3 7 3<br />
Other short-term borrowings 24,732 13,372 815 – –<br />
L<strong>on</strong>g-term debt 9,799 4,455 15,096 68,337 35,685<br />
Trust preferred securities – – 983 4,088 4,658<br />
Other financial liabilities 124,534 6,751 234 108 49<br />
Off-balance sheet loan commitments 69,516 – – – –<br />
Financial guarantees 22,505 – – – –<br />
Total 3, 4 1,747,879 257,462 85,262 102,351 70,429
Capital Management<br />
Our Treasury functi<strong>on</strong> manages our capital at Group level and locally in each regi<strong>on</strong>. The allocati<strong>on</strong> of financial<br />
resources, in general, and capital, in particular, favors business portfolios with the highest positive impact<br />
<strong>on</strong> our profitability and shareholder value. As a result, Treasury periodically reallocates capital am<strong>on</strong>g business<br />
portfolios.<br />
Treasury implements our capital strategy, which itself is developed by the Capital and Risk Committee and<br />
approved by the Management Board, including the issuance and repurchase of shares. We are committed to<br />
maintain our sound capitalizati<strong>on</strong>. Overall capital demand and supply are c<strong>on</strong>stantly m<strong>on</strong>itored and adjusted,<br />
if necessary, to meet the need for capital from various perspectives. These include book equity based <strong>on</strong><br />
IFRS accounting standards, regulatory capital and ec<strong>on</strong>omic capital. Since October <strong>20</strong>08, our target for the<br />
Tier 1 capital ratio c<strong>on</strong>tinued to be at 10 % or above.<br />
The allocati<strong>on</strong> of capital, determinati<strong>on</strong> of our funding plan and other resource issues are framed by the<br />
Capital and Risk Committee.<br />
Regi<strong>on</strong>al capital plans covering the capital needs of our branches and subsidiaries are prepared <strong>on</strong> a semiannual<br />
basis and presented to the Group Investment Committee. Most of our subsidiaries are subject to legal<br />
and regulatory capital requirements. Local Asset and Liability Committees attend to those needs under the<br />
stewardship of regi<strong>on</strong>al Treasury teams. Furthermore, they safeguard compliance with requirements such as<br />
restricti<strong>on</strong>s <strong>on</strong> dividends allowable for remittance to <strong>Deutsche</strong> <strong>Bank</strong> AG or <strong>on</strong> the ability of our subsidiaries to<br />
make loans or advances to the parent bank. In developing, implementing and testing our capital and liquidity,<br />
we take such legal and regulatory requirements into account.<br />
The <strong>20</strong>08 <str<strong>on</strong>g>Annual</str<strong>on</strong>g> General Meeting granted our management the authority to buy back up to 53.1 milli<strong>on</strong><br />
shares before the end of October <str<strong>on</strong>g><strong>20</strong>09</str<strong>on</strong>g>. No shares had been repurchased under this authorizati<strong>on</strong> until the<br />
<str<strong>on</strong>g>Annual</str<strong>on</strong>g> General Meeting in May <str<strong>on</strong>g><strong>20</strong>09</str<strong>on</strong>g> when a new authorizati<strong>on</strong> was granted.<br />
The <str<strong>on</strong>g><strong>20</strong>09</str<strong>on</strong>g> <str<strong>on</strong>g>Annual</str<strong>on</strong>g> General Meeting granted our management the authority to buy back up to 62.1 milli<strong>on</strong><br />
shares before the end of October <strong>20</strong>10. During the period from the <str<strong>on</strong>g>Annual</str<strong>on</strong>g> General Meeting in May <str<strong>on</strong>g><strong>20</strong>09</str<strong>on</strong>g> until<br />
year-end <str<strong>on</strong>g><strong>20</strong>09</str<strong>on</strong>g>, 11.7 milli<strong>on</strong> shares (or 1.9 % of shares issued) were purchased, which were used for equity<br />
compensati<strong>on</strong> purposes. The purchases were executed in July and August <str<strong>on</strong>g><strong>20</strong>09</str<strong>on</strong>g>.<br />
In March <str<strong>on</strong>g><strong>20</strong>09</str<strong>on</strong>g>, we issued 50 milli<strong>on</strong> new registered shares to <strong>Deutsche</strong> Post AG. In turn, <strong>Deutsche</strong> Post AG<br />
c<strong>on</strong>tributed-in-kind a minority stake in <strong>Deutsche</strong> Postbank AG to <strong>Deutsche</strong> <strong>Bank</strong> AG.<br />
We issued € 1.3 billi<strong>on</strong> of hybrid Tier 1 capital for the year ended December 31, <str<strong>on</strong>g><strong>20</strong>09</str<strong>on</strong>g>. Total outstanding hybrid<br />
Tier 1 capital (all n<strong>on</strong>cumulative trust preferred securities) as of December 31, <str<strong>on</strong>g><strong>20</strong>09</str<strong>on</strong>g>, amounted to € 10.6 billi<strong>on</strong><br />
compared to € 9.6 billi<strong>on</strong> as of December 31, <strong>20</strong>08.<br />
189
<strong>20</strong>-F Item 11: Quantitative and Qualitative Disclosures about Credit, Market and Other Risk<br />
Balance Sheet Management<br />
We manage our balance sheet <strong>on</strong> a Group level and, where applicable, locally in each regi<strong>on</strong>. In the allocati<strong>on</strong><br />
of financial resources we favor business portfolios with the highest positive impact <strong>on</strong> our profitability and<br />
shareholder value. During <str<strong>on</strong>g><strong>20</strong>09</str<strong>on</strong>g>, we strengthened balance sheet oversight by the introducti<strong>on</strong> of a new functi<strong>on</strong><br />
within Finance with the mandate to m<strong>on</strong>itor and analyze balance sheet developments and to track certain<br />
market observed balance sheet ratios. Based <strong>on</strong> this we trigger discussi<strong>on</strong> and management acti<strong>on</strong> by<br />
the Capital and Risk Committee. While we m<strong>on</strong>itor IFRS balance sheet developments, our balance sheet<br />
management is principally focused <strong>on</strong> U.S. GAAP pro-forma values as used in our leverage ratio target definiti<strong>on</strong>.<br />
In <str<strong>on</strong>g><strong>20</strong>09</str<strong>on</strong>g>, we reduced our leverage ratio, according to our target definiti<strong>on</strong>, from 28 as of December 31,<br />
<strong>20</strong>08 to 23 as of December 31, <str<strong>on</strong>g><strong>20</strong>09</str<strong>on</strong>g>, well below our leverage ratio target of 25. This improvement in our<br />
leverage ratio, according to our target definiti<strong>on</strong>, principally reflects lower U.S. GAAP pro-forma assets, as<br />
well as higher adjusted equity. The leverage ratio, according to our target definiti<strong>on</strong>, is calculated using<br />
adjusted total assets and total equity figures, as described <strong>on</strong> page S-19 of the supplemental financial informati<strong>on</strong>.<br />
Our leverage ratio calculated as the ratio of total assets under IFRS to total equity under IFRS was 40<br />
at the end of <str<strong>on</strong>g><strong>20</strong>09</str<strong>on</strong>g> compared to 69 at the end of <strong>20</strong>08.<br />
Overall Risk Positi<strong>on</strong><br />
To determine our overall (n<strong>on</strong>regulatory) risk positi<strong>on</strong>, we generally c<strong>on</strong>sider diversificati<strong>on</strong> benefits across<br />
risk types except for business risk, which we aggregate by simple additi<strong>on</strong>.<br />
The table below shows our overall risk positi<strong>on</strong> at year-end <str<strong>on</strong>g><strong>20</strong>09</str<strong>on</strong>g> and <strong>20</strong>08 as measured by the ec<strong>on</strong>omic<br />
capital calculated for credit, market, business and operati<strong>on</strong>al risk; it does not include liquidity risk.<br />
Ec<strong>on</strong>omic capital usage<br />
in € m.<br />
Dec 31, <str<strong>on</strong>g><strong>20</strong>09</str<strong>on</strong>g> Dec 31, <strong>20</strong>08<br />
Credit risk 7,453 8,986<br />
Market risk1 12,515 8,809<br />
Trading market risk 4,613 5,547<br />
N<strong>on</strong>trading market risk 1 7,902 3,262<br />
Operati<strong>on</strong>al risk 3,493 4,147<br />
Diversificati<strong>on</strong> benefit across credit, market and operati<strong>on</strong>al risk (3,166) (3,134)<br />
Sub-total credit, market and operati<strong>on</strong>al risk1 <strong>20</strong>,295 18,808<br />
Business risk1 501 498<br />
Total ec<strong>on</strong>omic capital usage <strong>20</strong>,796 19,306<br />
1 Deposit bucketing risk is reported under n<strong>on</strong>trading market risk beginning in <str<strong>on</strong>g><strong>20</strong>09</str<strong>on</strong>g>. It was reported previously under business risk. The amount for <strong>20</strong>08<br />
has been restated.<br />
As of December 31, <str<strong>on</strong>g><strong>20</strong>09</str<strong>on</strong>g>, our ec<strong>on</strong>omic capital usage totaled € <strong>20</strong>.8 billi<strong>on</strong>, which is € 1.5 billi<strong>on</strong>, or 8 %,<br />
above the € 19.3 billi<strong>on</strong> ec<strong>on</strong>omic capital usage as of December 31, <strong>20</strong>08. This increase in ec<strong>on</strong>omic capital<br />
primarily reflected the acquisiti<strong>on</strong> of a minority stake in <strong>Deutsche</strong> Postbank AG, partly off-set by results from<br />
our de-risking initiative during the year.<br />
190
The € 1.5 billi<strong>on</strong>, or 17 % decrease in credit risk ec<strong>on</strong>omic capital usage was primarily caused by lower derivative<br />
exposure, c<strong>on</strong>tributing € 1.3 billi<strong>on</strong> to the decrease, which was largely due to market movements, but also<br />
to reducti<strong>on</strong> efforts. The other changes were primarily driven by higher diversificati<strong>on</strong> within our portfolio as<br />
well as an impact from regular recalibrati<strong>on</strong>s of the credit risk parameter and other refinements of the credit<br />
risk model.<br />
Our ec<strong>on</strong>omic capital usage for market risk increased by € 3.7 billi<strong>on</strong>, or 42 %, to € 12.5 billi<strong>on</strong> as of Decem-<br />
ber 31, <str<strong>on</strong>g><strong>20</strong>09</str<strong>on</strong>g>. This increase was principally driven by n<strong>on</strong>trading market risk, which increased by € 4.6 billi<strong>on</strong>,<br />
or 142 %, primarily reflecting the acquisiti<strong>on</strong> of a minority stake in <strong>Deutsche</strong> Postbank AG, which c<strong>on</strong>tributed<br />
€ 4.3 billi<strong>on</strong> to the increase. Other increases reflected refinements of market risk shock parameters and other<br />
methodology changes, which were partially offset by exposure reducti<strong>on</strong>s. Trading market risk ec<strong>on</strong>omic capi-<br />
tal decreased by € 934 milli<strong>on</strong>, or 17 %, principally reflecting lower positi<strong>on</strong>s as a result of de-risking which<br />
was partly offset by the impact from refined stress test shocks reflecting unfavorable market developments in<br />
<strong>20</strong>08 and <str<strong>on</strong>g><strong>20</strong>09</str<strong>on</strong>g>, as well as other methodology enhancements.<br />
Operati<strong>on</strong>al Risk ec<strong>on</strong>omic capital usage decreased by € 654 milli<strong>on</strong>, or 16 %, to € 3.5 billi<strong>on</strong> as of Decem-<br />
ber 31, <str<strong>on</strong>g><strong>20</strong>09</str<strong>on</strong>g>. The reducti<strong>on</strong> in the ec<strong>on</strong>omic capital usage was largely driven by improved insurance cover-<br />
age, new m<strong>on</strong>itoring and c<strong>on</strong>trol mechanisms and an increased sensitivity of our AMA model to better reflect<br />
recent developments of the c<strong>on</strong>trol framework.<br />
Our ec<strong>on</strong>omic capital usage for business risk, c<strong>on</strong>sisting of a strategic risk and a tax risk comp<strong>on</strong>ent, totaled<br />
€ 501 milli<strong>on</strong> as of December 31, <str<strong>on</strong>g><strong>20</strong>09</str<strong>on</strong>g>, and was materially unchanged compared to December, 31, <strong>20</strong>08.<br />
The diversificati<strong>on</strong> effect of the ec<strong>on</strong>omic capital usage across credit, market and operati<strong>on</strong>al risk increased<br />
by € 32 milli<strong>on</strong>, or 1 %, as of December 31, <str<strong>on</strong>g><strong>20</strong>09</str<strong>on</strong>g>.<br />
As of December 31, <str<strong>on</strong>g><strong>20</strong>09</str<strong>on</strong>g> active book equity stood at 118 % of ec<strong>on</strong>omic capital plus goodwill and intangibles.<br />
The table below shows the ec<strong>on</strong>omic capital usage of our business segments as of December 31, <str<strong>on</strong>g><strong>20</strong>09</str<strong>on</strong>g>.<br />
Dec 31, <str<strong>on</strong>g><strong>20</strong>09</str<strong>on</strong>g> Corporate and Investment <strong>Bank</strong> Private Clients and Asset Management Corporate<br />
1 Including € (253) milli<strong>on</strong> of C<strong>on</strong>solidati<strong>on</strong> & Adjustments.<br />
The future allocati<strong>on</strong> of ec<strong>on</strong>omic capital may change to reflect refinements in our risk measurement methodology.<br />
191<br />
Total DB<br />
Group 1<br />
Corporate<br />
<strong>Bank</strong>ing &<br />
Global<br />
Trans-<br />
Total Asset and<br />
Wealth<br />
Private &<br />
Business<br />
Total Investments<br />
Securities acti<strong>on</strong>Manage-<br />
Clients<br />
in € m.<br />
<strong>Bank</strong>ing<br />
ment<br />
Total ec<strong>on</strong>omic capital usage 11,242 732 11,974 1,878 2,556 4,434 4,641 <strong>20</strong>,796
<strong>20</strong>-F Item 12: Descripti<strong>on</strong> of Securities other than Equity Securities<br />
Item 12: Descripti<strong>on</strong> of Securities other than<br />
Equity Securities<br />
Not required because this document is filed as an annual report.<br />
192
Part II<br />
Item 13: Defaults, Dividend Arrearages and<br />
Delinquencies<br />
Not applicable.<br />
Item 14: Material Modificati<strong>on</strong>s to the Rights of<br />
Security Holders and Use of Proceeds<br />
Not applicable.<br />
193
<strong>20</strong>-F Item 15: C<strong>on</strong>trols and Procedures<br />
Item 15: C<strong>on</strong>trols and Procedures<br />
Disclosure C<strong>on</strong>trols and Procedures<br />
An evaluati<strong>on</strong> was carried out under the supervisi<strong>on</strong> and with the participati<strong>on</strong> of our management, including<br />
our Chief Executive Officer and Chief Financial Officer, of the effectiveness of the design and operati<strong>on</strong> of our<br />
disclosure c<strong>on</strong>trols and procedures (as defined in Rule 13a-15(e) under the Securities Exchange Act of 1934)<br />
as of December 31, <str<strong>on</strong>g><strong>20</strong>09</str<strong>on</strong>g>. There are, as described below, inherent limitati<strong>on</strong>s to the effectiveness of any c<strong>on</strong>trol<br />
system, including disclosure c<strong>on</strong>trols and procedures. Accordingly, even effective disclosure c<strong>on</strong>trols and<br />
procedures can provide <strong>on</strong>ly reas<strong>on</strong>able assurance of achieving their c<strong>on</strong>trol objectives. Based up<strong>on</strong> such<br />
evaluati<strong>on</strong>, our Chief Executive Officer and Chief Financial Officer c<strong>on</strong>cluded that the design and operati<strong>on</strong> of<br />
our disclosure c<strong>on</strong>trols and procedures were effective as of December 31, <str<strong>on</strong>g><strong>20</strong>09</str<strong>on</strong>g>.<br />
Management’s <str<strong>on</strong>g>Annual</str<strong>on</strong>g> <str<strong>on</strong>g>Report</str<strong>on</strong>g> <strong>on</strong> Internal C<strong>on</strong>trol over Financial <str<strong>on</strong>g>Report</str<strong>on</strong>g>ing<br />
Management of <strong>Deutsche</strong> <strong>Bank</strong> Aktiengesellschaft, together with its c<strong>on</strong>solidated subsidiaries, is resp<strong>on</strong>sible<br />
for establishing and maintaining adequate internal c<strong>on</strong>trol over financial reporting. Our internal c<strong>on</strong>trol over<br />
financial reporting is a process designed under the supervisi<strong>on</strong> of the our principal executive officer and our<br />
principal financial officer to provide reas<strong>on</strong>able assurance regarding the reliability of financial reporting and<br />
the preparati<strong>on</strong> of the firm’s financial statements for external reporting purposes in accordance with Internati<strong>on</strong>al<br />
Financial <str<strong>on</strong>g>Report</str<strong>on</strong>g>ing Standards. As of December 31, <str<strong>on</strong>g><strong>20</strong>09</str<strong>on</strong>g>, management c<strong>on</strong>ducted an assessment of<br />
the effectiveness of our internal c<strong>on</strong>trol over financial reporting based <strong>on</strong> the framework established in Internal<br />
C<strong>on</strong>trol — Integrated Framework issued by the Committee of Sp<strong>on</strong>soring Organizati<strong>on</strong>s of the Treadway<br />
Commissi<strong>on</strong> (COSO). Based <strong>on</strong> this assessment, management has determined that our internal c<strong>on</strong>trol over<br />
financial reporting as of December 31, <str<strong>on</strong>g><strong>20</strong>09</str<strong>on</strong>g> was effective based <strong>on</strong> such framework.<br />
KPMG AG Wirtschaftsprüfungsgesellschaft, the registered public accounting firm that audited the financial<br />
statements included in this document, has issued an attestati<strong>on</strong> report <strong>on</strong> our internal c<strong>on</strong>trol over financial<br />
reporting, which attestati<strong>on</strong> report is set forth below.<br />
<str<strong>on</strong>g>Report</str<strong>on</strong>g> of Independent Registered Public Accounting Firm<br />
To the Supervisory Board of<br />
<strong>Deutsche</strong> <strong>Bank</strong> Aktiengesellschaft:<br />
We have audited <strong>Deutsche</strong> <strong>Bank</strong> Aktiengesellschaft’s internal c<strong>on</strong>trol over financial reporting as of Decem-<br />
ber 31, <str<strong>on</strong>g><strong>20</strong>09</str<strong>on</strong>g>, based <strong>on</strong> criteria established in Internal C<strong>on</strong>trol – Integrated Framework issued by the Commit-<br />
tee of Sp<strong>on</strong>soring Organizati<strong>on</strong>s of the Treadway Commissi<strong>on</strong> (COSO). <strong>Deutsche</strong> <strong>Bank</strong> Aktiengesellschaft's<br />
management is resp<strong>on</strong>sible for maintaining effective internal c<strong>on</strong>trol over financial reporting and for its as-<br />
sessment of the effectiveness of internal c<strong>on</strong>trol over financial reporting, included in the accompanying ‘Man-<br />
agement’s <str<strong>on</strong>g>Annual</str<strong>on</strong>g> <str<strong>on</strong>g>Report</str<strong>on</strong>g> <strong>on</strong> Internal C<strong>on</strong>trol over Financial <str<strong>on</strong>g>Report</str<strong>on</strong>g>ing’. Our resp<strong>on</strong>sibility is to express an<br />
opini<strong>on</strong> <strong>on</strong> the Company’s internal c<strong>on</strong>trol over financial reporting based <strong>on</strong> our audit.<br />
194
We c<strong>on</strong>ducted our audit in accordance with the standards of the Public Company Accounting Oversight Board<br />
(United States). Those standards require that we plan and perform the audit to obtain reas<strong>on</strong>able assurance<br />
about whether effective internal c<strong>on</strong>trol over financial reporting was maintained in all material respects. Our<br />
audit included obtaining an understanding of internal c<strong>on</strong>trol over financial reporting, assessing the risk that a<br />
material weakness exists, and testing and evaluating the design and operating effectiveness of internal c<strong>on</strong>trol<br />
based <strong>on</strong> the assessed risk. Our audit also included performing such other procedures as we c<strong>on</strong>sidered<br />
necessary in the circumstances. We believe that our audit provides a reas<strong>on</strong>able basis for our opini<strong>on</strong>.<br />
A company's internal c<strong>on</strong>trol over financial reporting is a process designed to provide reas<strong>on</strong>able assurance<br />
regarding the reliability of financial reporting and the preparati<strong>on</strong> of financial statements for external purposes<br />
in accordance with generally accepted accounting principles. A company's internal c<strong>on</strong>trol over financial reporting<br />
includes those policies and procedures that (1) pertain to the maintenance of records that, in reas<strong>on</strong>able<br />
detail, accurately and fairly reflect the transacti<strong>on</strong>s and dispositi<strong>on</strong>s of the assets of the company; (2)<br />
provide reas<strong>on</strong>able assurance that transacti<strong>on</strong>s are recorded as necessary to permit preparati<strong>on</strong> of financial<br />
statements in accordance with generally accepted accounting principles, and that receipts and expenditures<br />
of the company are being made <strong>on</strong>ly in accordance with authorizati<strong>on</strong>s of management and directors of the<br />
company; and (3) provide reas<strong>on</strong>able assurance regarding preventi<strong>on</strong> or timely detecti<strong>on</strong> of unauthorized<br />
acquisiti<strong>on</strong>, use, or dispositi<strong>on</strong> of the company’s assets that could have a material effect <strong>on</strong> the financial<br />
statements.<br />
Because of its inherent limitati<strong>on</strong>s, internal c<strong>on</strong>trol over financial reporting may not prevent or detect mis-<br />
statements. Also, projecti<strong>on</strong>s of any evaluati<strong>on</strong> of effectiveness to future periods are subject to the risk that<br />
c<strong>on</strong>trols may become inadequate because of changes in c<strong>on</strong>diti<strong>on</strong>s, or that the degree of compliance with the<br />
policies or procedures may deteriorate.<br />
In our opini<strong>on</strong>, <strong>Deutsche</strong> <strong>Bank</strong> Aktiengesellschaft maintained, in all material respects, effective internal c<strong>on</strong>trol<br />
over financial reporting as of December 31, <str<strong>on</strong>g><strong>20</strong>09</str<strong>on</strong>g>, based <strong>on</strong> criteria established in Internal C<strong>on</strong>trol – Integrated<br />
Framework issued by the Committee of Sp<strong>on</strong>soring Organizati<strong>on</strong>s of the Treadway Commissi<strong>on</strong>.<br />
We also have audited, in accordance with the standards of the Public Company Accounting Oversight Board<br />
(United States), the c<strong>on</strong>solidated balance sheets of <strong>Deutsche</strong> <strong>Bank</strong> Aktiengesellschaft as of Decem-<br />
ber 31, <str<strong>on</strong>g><strong>20</strong>09</str<strong>on</strong>g> and <strong>20</strong>08, and the related c<strong>on</strong>solidated statements of income, changes in equity, recognized<br />
income and expense and cash flows for each of the years in the three-year period ended December 31, <str<strong>on</strong>g><strong>20</strong>09</str<strong>on</strong>g>,<br />
and our report dated March 5, <strong>20</strong>10 expressed an unqualified opini<strong>on</strong> <strong>on</strong> those c<strong>on</strong>solidated financial statements.<br />
Frankfurt am Main, March 5, <strong>20</strong>10<br />
KPMG AG<br />
Wirtschaftsprüfungsgesellschaft<br />
195
<strong>20</strong>-F Item 16A: Audit Committee Financial Expert<br />
Change in Internal C<strong>on</strong>trol over Financial <str<strong>on</strong>g>Report</str<strong>on</strong>g>ing<br />
There was no change in our internal c<strong>on</strong>trol over financial reporting identified in c<strong>on</strong>necti<strong>on</strong> with the evaluati<strong>on</strong><br />
referred to above that occurred during the year ended December 31, <str<strong>on</strong>g><strong>20</strong>09</str<strong>on</strong>g> that has materially affected, or<br />
is reas<strong>on</strong>ably likely to materially affect, our internal c<strong>on</strong>trol over financial reporting.<br />
A c<strong>on</strong>trol system, no matter how well c<strong>on</strong>ceived and operated, can provide <strong>on</strong>ly reas<strong>on</strong>able, not absolute,<br />
assurance that the objectives of the c<strong>on</strong>trol system are met. As such, disclosure c<strong>on</strong>trols and procedures or<br />
systems for internal c<strong>on</strong>trol over financial reporting may not prevent all error and all fraud. Further, the design<br />
of a c<strong>on</strong>trol system must reflect the fact that there are resource c<strong>on</strong>straints, and the benefits of c<strong>on</strong>trols must<br />
be c<strong>on</strong>sidered relative to their costs. Because of the inherent limitati<strong>on</strong>s in all c<strong>on</strong>trol systems, no evaluati<strong>on</strong><br />
of c<strong>on</strong>trols can provide absolute assurance that all c<strong>on</strong>trol issues and instances of fraud, if any, within the<br />
company have been detected. These inherent limitati<strong>on</strong>s include the realities that judgments in decisi<strong>on</strong>making<br />
can be faulty, and that breakdowns can occur because of simple error or mistake. Additi<strong>on</strong>ally, c<strong>on</strong>trols<br />
can be circumvented by the individual acts of some pers<strong>on</strong>s, by collusi<strong>on</strong> of two or more people, or by<br />
management override of the c<strong>on</strong>trol. The design of any system of c<strong>on</strong>trols also is based in part up<strong>on</strong> certain<br />
assumpti<strong>on</strong>s about the likelihood of future events, and any design may not succeed in achieving its stated<br />
goals under all potential future c<strong>on</strong>diti<strong>on</strong>s; over time, c<strong>on</strong>trol may become inadequate because of changes in<br />
c<strong>on</strong>diti<strong>on</strong>s, or the degree of compliance with the policies or procedures may deteriorate. Because of the inherent<br />
limitati<strong>on</strong>s in a cost-effective c<strong>on</strong>trol system, misstatements due to error or fraud may occur and not be<br />
detected.<br />
Item 16A: Audit Committee Financial Expert<br />
Our Supervisory Board has determined that Dr. Clemens Börsig and Dr. Karl-Gerhard Eick, who are members<br />
of its Audit Committee, are “audit committee financial experts”, as such term is defined by the regulati<strong>on</strong>s of<br />
the Securities and Exchange Commissi<strong>on</strong> issued pursuant to Secti<strong>on</strong> 407 of the Sarbanes-Oxley Act of <strong>20</strong>02.<br />
For a descripti<strong>on</strong> of their experience, please see “Item 6: Directors, Senior Management and Employees –<br />
Directors and Senior Management – Supervisory Board.” The audit committee financial experts menti<strong>on</strong>ed<br />
above are “independent” of us, as defined in Rule 10A-3 under the U.S. Securities Exchange Act of 1934,<br />
which is the definiti<strong>on</strong> to which we, as a foreign private issuer the comm<strong>on</strong> shares of which are listed <strong>on</strong> the<br />
New York Stock Exchange, are subject.<br />
The German Stock Corporati<strong>on</strong> Act requires for German stock corporati<strong>on</strong>s listed in the European Ec<strong>on</strong>omic<br />
Area like us that at least <strong>on</strong>e member of their Supervisory Board is an independent financial expert and,<br />
where the Supervisory Board has formed an Audit Committee, that at least <strong>on</strong>e member of the Audit Committee<br />
is an independent financial expert. Though this requirement does not apply as l<strong>on</strong>g as all members of the<br />
Supervisory Board and of the Audit Committee have been appointed before May 29, <str<strong>on</strong>g><strong>20</strong>09</str<strong>on</strong>g>, our Supervisory<br />
Board has determined that Dr. Börsig and Dr. Eick are “independent financial experts”, as such term is<br />
defined in Secti<strong>on</strong>s 100 (5) and 107 (4) of the German Stock Corporati<strong>on</strong> Act.<br />
196
Item 16B: Code of Ethics<br />
In resp<strong>on</strong>se to Secti<strong>on</strong> 406 of the Sarbanes-Oxley Act of <strong>20</strong>02, we have adopted a code of ethics that applies<br />
to our principal executive officer, principal financial officer, principal accounting officer or c<strong>on</strong>troller, or pers<strong>on</strong>s<br />
performing similar functi<strong>on</strong>s. A copy of this code of ethics is available <strong>on</strong> our Internet website at<br />
http://www.deutsche-bank.com/corporate-governance, under the heading “Codes of Ethics”. Other than several<br />
n<strong>on</strong>substantive changes made in May <strong>20</strong>06, there have been no amendments or waivers to this code of<br />
ethics since its adopti<strong>on</strong>. Informati<strong>on</strong> regarding any future amendments or waivers will be published <strong>on</strong> the<br />
aforementi<strong>on</strong>ed website.<br />
197
<strong>20</strong>-F Item 16C: Principal Accountant Fees and Services<br />
Item 16C: Principal Accountant Fees and<br />
Services<br />
In accordance with German law, our principal accountants are appointed by our <str<strong>on</strong>g>Annual</str<strong>on</strong>g> General Meeting<br />
based <strong>on</strong> a recommendati<strong>on</strong> of our Supervisory Board. The Audit Committee of our Supervisory Board prepares<br />
such recommendati<strong>on</strong>. Subsequent to the principal accountants’ appointment, the Audit Committee<br />
awards the c<strong>on</strong>tract and in its sole authority approves the terms and scope of the audit and all audit engagement<br />
fees as well as m<strong>on</strong>itors the principal accountants’ independence. At our <strong>20</strong>08 and <str<strong>on</strong>g><strong>20</strong>09</str<strong>on</strong>g> <str<strong>on</strong>g>Annual</str<strong>on</strong>g> General<br />
Meetings, our shareholders appointed KPMG AG Wirtschaftsprüfungsgesellschaft, which had been our principal<br />
accountants for a number of years, as our principal accountants for the <strong>20</strong>08 and <str<strong>on</strong>g><strong>20</strong>09</str<strong>on</strong>g> fiscal years,<br />
respectively.<br />
The table set forth below c<strong>on</strong>tains the aggregate fees billed for each of the last two fiscal years by our principal<br />
accountants in each of the following categories: (1) Audit Fees, which are fees for professi<strong>on</strong>al services<br />
for the audit of our annual financial statements or services that are normally provided by the accountant in<br />
c<strong>on</strong>necti<strong>on</strong> with statutory and regulatory filings or engagements for those fiscal years, (2) Audit-Related Fees,<br />
which are fees for assurance and related services that are reas<strong>on</strong>ably related to the performance of the audit<br />
or review of our financial statements and are not reported as Audit Fees, and (3) Tax-Related Fees, which are<br />
fees for professi<strong>on</strong>al services rendered for tax compliance, tax c<strong>on</strong>sulting and tax planning, and (4) All Other<br />
Fees, which are fees for products and services other than Audit Fees, Audit-Related Fees and Tax-Related<br />
Fees. These amounts include expenses and exclude VAT.<br />
Fee category in € m. <str<strong>on</strong>g><strong>20</strong>09</str<strong>on</strong>g> <strong>20</strong>08<br />
Audit fees 45 47<br />
Audit-related fees 6 8<br />
Tax-related fees 5 7<br />
All other fees – –<br />
Total fees 56 62<br />
Our Audit-Related Fees included fees for accounting advisory, due diligence relating to actual or c<strong>on</strong>tem-<br />
plated acquisiti<strong>on</strong>s and dispositi<strong>on</strong>s, attestati<strong>on</strong> engagements and other agreed-up<strong>on</strong> procedure engagements.<br />
Our Tax-Related Fees included fees for services relating to the preparati<strong>on</strong> and review of tax returns<br />
and related compliance assistance and advice, tax c<strong>on</strong>sultati<strong>on</strong> and advice relating to Group tax planning<br />
strategies and initiatives and assistance with assessing compliance with tax regulati<strong>on</strong>s. Our Other Fees were<br />
incurred for project-related advisory services.<br />
United States law and regulati<strong>on</strong>s, and our own policies, generally require all engagements of our principal<br />
accountants be pre-approved by our Audit Committee or pursuant to policies and procedures adopted by it.<br />
Our Audit Committee has adopted the following policies and procedures for c<strong>on</strong>siderati<strong>on</strong> and approval of<br />
requests to engage our principal accountants to perform n<strong>on</strong>-audited services. Engagement requests must in<br />
the first instance be submitted to the Accounting Engagement Team established and supervised by our Group<br />
Finance Committee, whose members c<strong>on</strong>sist of our Chief Financial Officer and senior members of our<br />
Finance and Tax departments. If the request relates to services that would impair the independence of our<br />
principal accountants, the request must be rejected. Our Audit Committee has given its pre-approval for specified<br />
assurance, financial advisory and tax services, provided the expected fees for any such service do not<br />
198
exceed € 1 milli<strong>on</strong>. If the engagement request relates to such specified pre-approved services, it may be<br />
approved by the Group Finance Committee, which must thereafter report such approval to the Audit Committee.<br />
If the engagement request relates neither to prohibited n<strong>on</strong>-audit services nor to pre-approved n<strong>on</strong>-audit<br />
services, it must be forwarded by the Group Finance Committee to the Audit Committee for c<strong>on</strong>siderati<strong>on</strong>. In<br />
additi<strong>on</strong>, to facilitate the c<strong>on</strong>siderati<strong>on</strong> of engagement requests between its meetings, the Audit Committee<br />
has delegated approval authority to several of its members who are “independent” as defined by the Securities<br />
and Exchange Commissi<strong>on</strong> and the New York Stock Exchange. Such members are required to report any<br />
approvals made by them to the Audit Committee at its next meeting.<br />
Additi<strong>on</strong>ally, United States law and regulati<strong>on</strong>s permit the pre-approval requirement to be waived with respect<br />
to engagements for n<strong>on</strong>-audit services aggregating no more than five percent of the total amount of revenues<br />
we paid to our principal accountants, if such engagements were not recognized by us at the time of engagement<br />
and were promptly brought to the attenti<strong>on</strong> of our Audit Committee or a designated member thereof and<br />
approved prior to the completi<strong>on</strong> of the audit. In each of <strong>20</strong>08 and <str<strong>on</strong>g><strong>20</strong>09</str<strong>on</strong>g>, the percentage of the total amount of<br />
revenue we paid to our principal accountants represented by n<strong>on</strong>-audit services in each category that were<br />
subject to such a waiver was less than 5 %.<br />
Item 16D: Exempti<strong>on</strong>s from the Listing<br />
Standards for Audit Committees<br />
Our comm<strong>on</strong> shares are listed <strong>on</strong> the New York Stock Exchange, the corporate governance rules of which<br />
require a foreign private issuer such as us to have an audit committee that satisfies the requirements of Rule<br />
10A-3 under the U.S. Securities Exchange Act of 1934. These requirements include a requirement that the<br />
audit committee be composed of members that are “independent” of the issuer, as defined in the Rule, subject<br />
to certain exempti<strong>on</strong>s, including an exempti<strong>on</strong> for employees who are not executive officers of the issuer<br />
if the employees are elected or named to the board of directors or audit committee pursuant to the issuer's<br />
governing law or documents, an employee collective bargaining or similar agreement or other home country<br />
legal or listing requirements. The German Co-Determinati<strong>on</strong> Act of 1976 (Mitbestimmungsgesetz) requires<br />
that the shareholders elect half of the members of the supervisory board of large German companies, such as<br />
us, and that employees in Germany elect the other half. Employee-elected members are typically themselves<br />
employees or representatives of labor uni<strong>on</strong>s representing employees. Pursuant to law and practice, committees<br />
of the Supervisory Board are typically composed of both shareholder- and employee-elected members.<br />
Of the current members of our Audit Committee, three – Henriette Mark, Karin Ruck and Marlehn Thieme –<br />
are current employees of <strong>Deutsche</strong> <strong>Bank</strong> who have been elected as Supervisory Board members by the employees.<br />
N<strong>on</strong>e of them is an executive officer. Accordingly, their service <strong>on</strong> the Audit Committee is permissible<br />
pursuant to the exempti<strong>on</strong> from the independence requirements provided for by paragraph (b)(1)(iv)(C) of the<br />
Rule. We do not believe the reliance <strong>on</strong> such exempti<strong>on</strong> would materially adversely affect the ability of the<br />
Audit Committee to act independently and to satisfy the other requirements of the Rule.<br />
199
<strong>20</strong>-F Item 16E: Purchases of Equity Securities by the Issuer and Affiliated Purchasers<br />
Item 16E: Purchases of Equity Securities by the<br />
Issuer and Affiliated Purchasers<br />
In <str<strong>on</strong>g><strong>20</strong>09</str<strong>on</strong>g>, we repurchased 11,672,726 of our ordinary shares pursuant to the share buy-back program authorized<br />
by the <str<strong>on</strong>g>Annual</str<strong>on</strong>g> General Meeting <strong>on</strong> May 26, <str<strong>on</strong>g><strong>20</strong>09</str<strong>on</strong>g> at an average price of € 46.41 for a total c<strong>on</strong>siderati<strong>on</strong><br />
of € 542 milli<strong>on</strong>. This share buy-back program, pursuant to which up to 62,085,901 shares may be repurchased<br />
through October 31, <strong>20</strong>10, replaced the authorizati<strong>on</strong> from May 29, <strong>20</strong>08 under which no shares were<br />
repurchased. At December 31, <str<strong>on</strong>g><strong>20</strong>09</str<strong>on</strong>g>, the number of shares held in Treasury from buybacks totaled 0.6 milli<strong>on</strong>.<br />
This figure stems from 8.1 milli<strong>on</strong> shares at the beginning of the year, plus 11.7 milli<strong>on</strong> shares from buybacks<br />
in <str<strong>on</strong>g><strong>20</strong>09</str<strong>on</strong>g>, less 19.2 milli<strong>on</strong> shares which were used to fulfill delivery obligati<strong>on</strong>s in the course of share-based<br />
compensati<strong>on</strong> of employees. We did not cancel any shares in the year <str<strong>on</strong>g><strong>20</strong>09</str<strong>on</strong>g>.<br />
In additi<strong>on</strong> to these share buy-back programs, pursuant to shareholder authorizati<strong>on</strong>s approved at our <strong>20</strong>08<br />
and <str<strong>on</strong>g><strong>20</strong>09</str<strong>on</strong>g> <str<strong>on</strong>g>Annual</str<strong>on</strong>g> General Meetings, we are authorized to buy and sell, for the purpose of securities trading,<br />
our ordinary shares through October 31, <strong>20</strong>10, provided that the net number of shares held for this purpose at<br />
the close of any trading day may not exceed 5 % of our share capital <strong>on</strong> that day. The gross volume of these<br />
securities trading transacti<strong>on</strong>s is often large, and even the net amount of such repurchases or sales may, in a<br />
given m<strong>on</strong>th, be large, though over l<strong>on</strong>ger periods of time such transacti<strong>on</strong>s tend to offset and are in any<br />
event c<strong>on</strong>strained by the 5 % of share capital limit. These securities trading transacti<strong>on</strong>s c<strong>on</strong>sist predominantly<br />
of transacti<strong>on</strong>s <strong>on</strong> major n<strong>on</strong>-U.S. securities exchanges. We also enter into derivative c<strong>on</strong>tracts with respect<br />
to our shares.<br />
The following table sets forth, for each m<strong>on</strong>th in <str<strong>on</strong>g><strong>20</strong>09</str<strong>on</strong>g> and for the year as a whole, the total gross number of<br />
our shares repurchased by us and our affiliated purchasers (pursuant to both the share buy-back programs<br />
noted above and the securities trading activities described above), the total gross number of shares sold, the<br />
net number of shares purchased or sold, the average price paid per share (based <strong>on</strong> the gross shares repurchased),<br />
the number of shares that were purchased as part of the two publicly announced share buy-back<br />
programs menti<strong>on</strong>ed above and the maximum number of shares that at that date remained eligible for purchase<br />
under such programs.<br />
<strong>20</strong>0
Issuer Purchases of Equity Securities in <str<strong>on</strong>g><strong>20</strong>09</str<strong>on</strong>g><br />
M<strong>on</strong>th<br />
Total number of Total number of Net number of shares Average price paid Number of shares Maximum number of<br />
shares purchased<br />
shares sold purchased or (sold)<br />
per share purchased as part of shares that may yet<br />
(in €) publicly announced be purchased under<br />
plans or programs plans or programs<br />
January 31,993,999 33,085,418 (1,091,419) <strong>20</strong>.88 53,053,143<br />
February 26,992,062 31,148,999 (4,156,937) <strong>20</strong>.77 53,053,143<br />
March 43,642,<strong>20</strong>7 43,640,748 1,459 26.54 53,053,143<br />
April 28,800,694 28,771,854 28,840 38.01 53,053,143<br />
May 96,448,818 96,595,266 (146,448) 42.70 53,053,143<br />
June 99,535,719 99,759,462 (223,743) 45.71 62,085,901<br />
July 22,814,197 19,600,282 3,213,915 45.80 2,664,000 59,421,901<br />
August 70,740,511 75,236,730 (4,496,219) 46.38 9,008,726 50,413,175<br />
September <strong>20</strong>,396,407 <strong>20</strong>,358,238 38,169 49.28 50,413,175<br />
October 12,687,330 12,681,811 5,519 52.17 50,413,175<br />
November 10,321,767 10,379,688 (57,921) 49.04 50,413,175<br />
December 11,911,280 12,534,860 (623,580) 49.41 50,413,175<br />
Total <str<strong>on</strong>g><strong>20</strong>09</str<strong>on</strong>g> 476,284,991 483,793,356 (7,508,365) 40.39 11,672,726 50,413,175<br />
At December 31, <str<strong>on</strong>g><strong>20</strong>09</str<strong>on</strong>g>, our issued share capital c<strong>on</strong>sisted of 6<strong>20</strong>,859,015 ordinary shares, of which<br />
6<strong>20</strong>,175,3<strong>20</strong> were outstanding and 683,695 were held by us in treasury. On March 6, <str<strong>on</strong>g><strong>20</strong>09</str<strong>on</strong>g>, we issued<br />
50 milli<strong>on</strong> new comm<strong>on</strong> shares against a c<strong>on</strong>tributi<strong>on</strong>-in-kind of 50 milli<strong>on</strong> ordinary shares of <strong>Deutsche</strong><br />
Postbank AG, resulting in a share capital increase of € 128 milli<strong>on</strong>. The shares were issued with full dividend<br />
rights for the year <strong>20</strong>08 from authorized capital and without subscripti<strong>on</strong> rights.<br />
Item 16F: Change in Registrant’s Certifying<br />
Accountant<br />
Not applicable.<br />
<strong>20</strong>1
<strong>20</strong>-F Item 16G: Corporate Governance<br />
Item 16G: Corporate Governance<br />
Our comm<strong>on</strong> shares are listed <strong>on</strong> the New York Stock Exchange, as well as <strong>on</strong> all seven German stock exchanges.<br />
Set forth below is a descripti<strong>on</strong> of the significant ways in which our corporate governance practices<br />
differ from those applicable to U.S. domestic companies under the New York Stock Exchange's listing standards.<br />
This disclosure is also available <strong>on</strong> our internet website at: http://www.deutsche-bank.com/corporategovernance<br />
under the heading “Differences in Corporate Governance Practices”.<br />
The Legal Framework. Corporate governance principles for German stock corporati<strong>on</strong>s (Aktiengesellschaften)<br />
are set forth in the German Stock Corporati<strong>on</strong> Act (Aktiengesetz), the German Co-Determinati<strong>on</strong> Act of 1976<br />
(Mitbestimmungsgesetz) and the German Corporate Governance Code (<strong>Deutsche</strong>r Corporate Governance<br />
Kodex, referred to as the Code).<br />
The Two-Tier Board System of a German Stock Corporati<strong>on</strong>. The Stock Corporati<strong>on</strong> Act provides for a clear<br />
separati<strong>on</strong> of management and oversight functi<strong>on</strong>s. It therefore requires German stock corporati<strong>on</strong>s to have<br />
both a Supervisory Board (Aufsichtsrat) and a Management Board (Vorstand). These boards are separate; no<br />
individual may be a member of both. Both the members of the Management Board and the members of the<br />
Supervisory Board must exercise the standard of care of a diligent business pers<strong>on</strong> to the company. In complying<br />
with this standard of care they are required to take into account a broad range of c<strong>on</strong>siderati<strong>on</strong>s,<br />
including the interests of the company and those of its shareholders, employees and creditors.<br />
The Management Board is resp<strong>on</strong>sible for managing the company and representing the company in its deal-<br />
ings with third parties. The Management Board is also required to ensure appropriate risk management within<br />
the corporati<strong>on</strong> and to establish an internal m<strong>on</strong>itoring system. The members of the Management Board,<br />
including its chairpers<strong>on</strong> or speaker, are regarded as peers and share a collective resp<strong>on</strong>sibility for all man-<br />
agement decisi<strong>on</strong>s.<br />
The Supervisory Board appoints and removes the members of the Management Board. It also may appoint a<br />
chairpers<strong>on</strong> of the Management Board. Although it is not permitted to make management decisi<strong>on</strong>s, the<br />
Supervisory Board has comprehensive m<strong>on</strong>itoring functi<strong>on</strong>s, including advising the company <strong>on</strong> a regular basis<br />
and participating in decisi<strong>on</strong>s of fundamental importance to the company. To ensure that these m<strong>on</strong>itoring<br />
functi<strong>on</strong>s are carried out properly, the Management Board must, am<strong>on</strong>g other things, regularly report to the<br />
Supervisory Board with regard to current business operati<strong>on</strong>s and business planning, including any deviati<strong>on</strong><br />
of actual developments from c<strong>on</strong>crete and material targets previously presented to the Supervisory Board.<br />
The Supervisory Board may also request special reports from the Management Board at any time. Transacti<strong>on</strong>s<br />
of fundamental importance to the company, such as major strategic decisi<strong>on</strong>s or other acti<strong>on</strong>s that may<br />
have a fundamental impact <strong>on</strong> the company’s assets and liabilities, financial c<strong>on</strong>diti<strong>on</strong> or results of operati<strong>on</strong>s,<br />
may be subject to the c<strong>on</strong>sent of the Supervisory Board. Pursuant to our Articles of Associati<strong>on</strong> (Satzung),<br />
such transacti<strong>on</strong>s include the granting of powers of attorney without limitati<strong>on</strong> to the affairs of a specific office,<br />
major acquisiti<strong>on</strong>s or disposals of real estate or participati<strong>on</strong>s in companies and granting of loans and acquiring<br />
participati<strong>on</strong>s if the <strong>Bank</strong>ing Act (Kreditwesengesetz) requires approval by the Supervisory Board.<br />
<strong>20</strong>2
Pursuant to the Co-Determinati<strong>on</strong> Act, our Supervisory Board c<strong>on</strong>sists of representatives elected by the<br />
shareholders and representatives elected by the employees in Germany. Based <strong>on</strong> the total number of<br />
<strong>Deutsche</strong> <strong>Bank</strong> employees in Germany these employees have the right to elect <strong>on</strong>e-half of the total of twenty<br />
Supervisory Board members. The chairpers<strong>on</strong> of the Supervisory Board of <strong>Deutsche</strong> <strong>Bank</strong> is a shareholder<br />
representative who has the deciding vote in the event of a tie.<br />
This two-tier board system c<strong>on</strong>trasts with the unitary board of directors envisaged by the relevant laws of all<br />
U.S. states and the New York Stock Exchange listing standards.<br />
The Group Executive Committee of <strong>Deutsche</strong> <strong>Bank</strong> is a body that is not based <strong>on</strong> the Stock Corporati<strong>on</strong> Act.<br />
It has been created by the Management Board under its terms of reference and serves as a tool to coordinate<br />
the group divisi<strong>on</strong>s and regi<strong>on</strong>al management with the Management Board. It comprises the members of the<br />
Management Board and senior representatives from the business divisi<strong>on</strong>s within our client-facing group<br />
divisi<strong>on</strong>s and from the management of our regi<strong>on</strong>s appointed by the Management Board. It reviews the development<br />
of the businesses, discusses matters of group strategy and prepares recommendati<strong>on</strong>s for decisi<strong>on</strong><br />
by the Management Board. Functi<strong>on</strong>al committees assist the Management Board in executing cross divisi<strong>on</strong>al<br />
strategic management, resource allocati<strong>on</strong>, c<strong>on</strong>trol and risk management.<br />
The Recommendati<strong>on</strong>s of the Code. The Code was issued in <strong>20</strong>02 by a commissi<strong>on</strong> composed of German<br />
corporate governance experts appointed by the German Federal Ministry of Justice in <strong>20</strong>01. The Code was<br />
last amended in June <str<strong>on</strong>g><strong>20</strong>09</str<strong>on</strong>g> and, as a general rule, will be reviewed annually and amended if necessary to<br />
reflect internati<strong>on</strong>al corporate governance developments. The Code describes and summarizes the basic<br />
mandatory statutory corporate governance principles found in the provisi<strong>on</strong>s of German law. In additi<strong>on</strong>, it<br />
c<strong>on</strong>tains supplemental recommendati<strong>on</strong>s and suggesti<strong>on</strong>s for standards <strong>on</strong> resp<strong>on</strong>sible corporate governance<br />
intended to reflect generally accepted best practice.<br />
The Code addresses six core areas of corporate governance. These are (1) shareholders and shareholders’<br />
meetings, (2) the cooperati<strong>on</strong> between the Management Board and the Supervisory Board, (3) the Manage-<br />
ment Board, (4) the Supervisory Board, (5) transparency and (6) financial reporting and audits.<br />
The Code c<strong>on</strong>tains three types of provisi<strong>on</strong>s. First, the Code describes and summarizes the existing statutory,<br />
i.e., legally binding, corporate governance framework set forth in the Stock Corporati<strong>on</strong> Act and in other German<br />
laws. Those laws – and not the incomplete and abbreviated summaries of them reflected in the Code –<br />
must be complied with. The sec<strong>on</strong>d type of provisi<strong>on</strong>s are recommendati<strong>on</strong>s. While these are not legally binding,<br />
Secti<strong>on</strong> 161 of the Stock Corporati<strong>on</strong> Act requires that any German exchange-listed company declares<br />
annually that the recommendati<strong>on</strong>s of the Code have been adopted by it or which recommendati<strong>on</strong>s have not<br />
been adopted. The third type of Code provisi<strong>on</strong>s comprises suggesti<strong>on</strong>s which companies may choose not to<br />
adopt without disclosure. The Code c<strong>on</strong>tains a significant number of such suggesti<strong>on</strong>s, covering almost all of<br />
the core areas of corporate governance it addresses.<br />
<strong>20</strong>3
<strong>20</strong>-F Item 16G: Corporate Governance<br />
In their last Declarati<strong>on</strong> of C<strong>on</strong>formity of October 28, <str<strong>on</strong>g><strong>20</strong>09</str<strong>on</strong>g>, as amended <strong>on</strong> January 5, <strong>20</strong>10, the Management<br />
Board and the Supervisory Board of <strong>Deutsche</strong> <strong>Bank</strong> stated that it will act in c<strong>on</strong>formity with the recommendati<strong>on</strong>s<br />
of the Code. The Declarati<strong>on</strong> of C<strong>on</strong>formity and the amendments are available <strong>on</strong> <strong>Deutsche</strong> <strong>Bank</strong>’s<br />
internet website at http://www.deutschebank.com/corporate-governance.<br />
The Code also recommends that the Management Board and the Supervisory Board report each year <strong>on</strong> the<br />
company’s corporate governance in the annual report to shareholders.<br />
Supervisory Board Committees. The Supervisory Board may form committees. The Co-Determinati<strong>on</strong> Act<br />
requires that the Supervisory Board forms a mediati<strong>on</strong> committee to propose candidates for the Management<br />
Board in the event that the two-thirds majority of the members of the Supervisory Board needed to appoint<br />
members of the Management Board is not met.<br />
The Code c<strong>on</strong>tains the recommendati<strong>on</strong> that the Supervisory Board also establishes <strong>on</strong>e or more committees<br />
with sufficiently qualified members. In particular, it recommends establishing an “audit committee” to handle<br />
issues of accounting and risk management, compliance, auditor independence, the engagement and compensati<strong>on</strong><br />
of outside auditors appointed by the shareholders’ meeting and the determinati<strong>on</strong> of auditing focal<br />
points. Since <strong>20</strong>07 the Code also recommends establishing a “nominati<strong>on</strong> committee” comprised <strong>on</strong>ly of<br />
shareholder elected Supervisory Board members to prepare the Supervisory Board’s proposals for the electi<strong>on</strong><br />
or appointment of new shareholder representatives to the Supervisory Board. The Code also includes<br />
suggesti<strong>on</strong>s <strong>on</strong> the subjects that may be handled by Supervisory Board committees, including corporate<br />
strategy, compensati<strong>on</strong> of the members of the Management Board, investments and financing. Under the<br />
Stock Corporati<strong>on</strong> Act, any Supervisory Board committee must regularly report to the Supervisory Board.<br />
The Supervisory Board of <strong>Deutsche</strong> <strong>Bank</strong> has established a Chairman’s Committee (Präsidialausschuss)<br />
which is resp<strong>on</strong>sible for deciding the terms of the service c<strong>on</strong>tracts and other c<strong>on</strong>tractual arrangements with<br />
the members of the Management Board, a Nominati<strong>on</strong> Committee (Nominierungsausschuss), an Audit Committee<br />
(Prüfungsausschuss), a Risk Committee (Risikoausschuss) and the required Mediati<strong>on</strong> Committee<br />
(Vermittlungsausschuss). The functi<strong>on</strong>s of a nominating/corporate governance committee and of a compensati<strong>on</strong><br />
committee required by the NYSE Manual for U.S. companies listed <strong>on</strong> the NYSE are therefore performed<br />
by the Supervisory Board or <strong>on</strong>e of its committees, in particular the Chairman’s Committee and the Mediati<strong>on</strong><br />
Committee.<br />
Independent Board Members. The NYSE Manual requires that a majority of the members of the board of<br />
directors of a NYSE listed U.S. company and each member of its nominating/corporate governance, compen-<br />
sati<strong>on</strong> and audit committees be “independent” according to strict criteria and that the board of directors<br />
determines that such member has no material direct or indirect relati<strong>on</strong>ship with the company.<br />
<strong>20</strong>4
As a foreign private issuer, <strong>Deutsche</strong> <strong>Bank</strong> is not subject to these requirements. However, its audit committee<br />
must meet the more lenient independence requirement of Rule 10A-3 under the Securities Exchange Act of<br />
1934. German corporate law does not require an affirmative independence determinati<strong>on</strong>, meaning that the<br />
Supervisory Board need not make affirmative findings that audit committee members are independent. Nevertheless,<br />
both the Stock Corporati<strong>on</strong> Act and the Code c<strong>on</strong>tain several rules, recommendati<strong>on</strong>s and suggesti<strong>on</strong>s<br />
to ensure the Supervisory Board’s independent advice to, and supervisi<strong>on</strong> of, the Management Board.<br />
As noted above, no member of the Management Board may serve <strong>on</strong> the Supervisory Board (and vice versa).<br />
Supervisory Board members will not be bound by directi<strong>on</strong>s or instructi<strong>on</strong>s from third parties. Any advisory,<br />
service or similar c<strong>on</strong>tract between a member of the Supervisory Board and the company is subject to the<br />
Supervisory Board’s approval. A similar requirement applies to loans granted by the company to a Supervisory<br />
Board member or other pers<strong>on</strong>s, such as certain members of a Supervisory Board member’s family. In<br />
additi<strong>on</strong>, the Code recommends that no more than two former members of the Management Board be members<br />
of the Supervisory Board and that Supervisory Board members do not hold directorships or accept advisory<br />
tasks for important competitors of the company. Furthermore, the Code suggests that the chairpers<strong>on</strong> of<br />
the audit committee should not be the current chair of the Supervisory Board or a former member of the Management<br />
Board of the company. <strong>Deutsche</strong> <strong>Bank</strong> complies with this recommendati<strong>on</strong> and suggesti<strong>on</strong>.<br />
The Code also recommends that each member of the Supervisory Board informs the Supervisory Board of<br />
any c<strong>on</strong>flicts of interest which may result from a c<strong>on</strong>sulting or directorship functi<strong>on</strong> with clients, suppliers,<br />
lenders or other business partners of the stock corporati<strong>on</strong>. In the case of material c<strong>on</strong>flicts of interest or<br />
<strong>on</strong>going c<strong>on</strong>flicts, the Code recommends that the mandate of the Supervisory Board member be removed by<br />
the shareholders’ meeting. The Code further recommends that any c<strong>on</strong>flicts of interest that have occurred be<br />
reported by the Supervisory Board at the <str<strong>on</strong>g>Annual</str<strong>on</strong>g> General Meeting, together with the acti<strong>on</strong> taken, and that<br />
potential c<strong>on</strong>flicts of interest be also taken into account in the nominati<strong>on</strong> process for the electi<strong>on</strong> of Supervisory<br />
Board members.<br />
Audit Committee Procedures. Pursuant to the NYSE Manual the audit committee of a U.S. company listed <strong>on</strong><br />
the NYSE must have a written charter addressing its purpose, an annual performance evaluati<strong>on</strong>, and the<br />
review of an auditor’s report describing internal quality c<strong>on</strong>trol issues and procedures and all relati<strong>on</strong>ships<br />
between the auditor and the company. The Audit Committee of <strong>Deutsche</strong> <strong>Bank</strong> operates under written terms<br />
of reference and reviews the efficiency of its activities regularly.<br />
Disclosure of Corporate Governance Guidelines. <strong>Deutsche</strong> <strong>Bank</strong> discloses its Articles of Associati<strong>on</strong>, the<br />
Terms of Reference of its Management Board, its Supervisory Board, the Chairman’s Committee and the<br />
Audit Committee, its Declarati<strong>on</strong> of C<strong>on</strong>formity under the Code and other documents pertaining to its corpo-<br />
rate governance <strong>on</strong> its internet website at http://www.deutsche-bank.com/corporate-governance.<br />
<strong>20</strong>5
<strong>20</strong>-F PART III<br />
PART III<br />
Item 17: Financial Statements<br />
Not applicable.<br />
Item 18: Financial Statements<br />
See our c<strong>on</strong>solidated financial statements beginning <strong>on</strong> page F-5, which we incorporate by reference into this<br />
document.<br />
<strong>20</strong>6
Item 19: Exhibits<br />
We have filed the following documents as exhibits to this document.<br />
Exhibit<br />
number<br />
Descripti<strong>on</strong> of Exhibit<br />
1.1 English translati<strong>on</strong> of the Articles of Associati<strong>on</strong> of <strong>Deutsche</strong> <strong>Bank</strong> AG<br />
2.1<br />
4.1<br />
The total amount of l<strong>on</strong>g-term debt securities of us or our subsidiaries authorized under any instrument does not exceed 10 percent<br />
of the total assets of our Group <strong>on</strong> a c<strong>on</strong>solidated basis. We hereby agree to furnish to the Commissi<strong>on</strong>, up<strong>on</strong> its request, a<br />
copy of any instrument defining the rights of holders of l<strong>on</strong>g-term debt of us or of our subsidiaries for which c<strong>on</strong>solidated or unc<strong>on</strong>solidated<br />
financial statements are required to be filed.<br />
Global Partnership Plan – Equity Units Plan Rules, furnished as Exhibit 4.3 to our <strong>20</strong>04 <str<strong>on</strong>g>Annual</str<strong>on</strong>g> <str<strong>on</strong>g>Report</str<strong>on</strong>g> <strong>on</strong> <strong>Form</strong> <strong>20</strong>-F and incorporated<br />
by reference herein.<br />
4.2 Equity Units Plan Rules <strong>20</strong>10<br />
7.1<br />
Statement re Computati<strong>on</strong> of Ratio of Earnings to Fixed Charges of <strong>Deutsche</strong> <strong>Bank</strong> AG for the periods ended December<br />
31, <str<strong>on</strong>g><strong>20</strong>09</str<strong>on</strong>g>, <strong>20</strong>08, <strong>20</strong>07 and <strong>20</strong>06 (also incorporated as Exhibit 12.2 to Registrati<strong>on</strong> Statement No. 333-162195 of<br />
<strong>Deutsche</strong> <strong>Bank</strong> AG).<br />
8.1 List of Subsidiaries.<br />
12.1 Principal Executive Officer Certificati<strong>on</strong>s Required by 17 C.F.R. 240.13a-14(a).<br />
12.2 Principal Financial Officer Certificati<strong>on</strong>s Required by 17 C.F.R. 240.13a-14(a).<br />
13.1 Chief Executive Officer Certificati<strong>on</strong> Required by 18 U.S.C. Secti<strong>on</strong> 1350.<br />
13.2 Chief Financial Officer Certificati<strong>on</strong> Required by 18 U.S.C. Secti<strong>on</strong> 1350.<br />
14.1 Legal Opini<strong>on</strong> regarding c<strong>on</strong>fidentiality of related party customers.<br />
15.1 C<strong>on</strong>sent of KPMG AG Wirtschaftsprüfungsgesellschaft.<br />
<strong>20</strong>7
<strong>20</strong>-F Signatures<br />
Signatures<br />
The registrant hereby certifies that it meets all of the requirements for filing <strong>on</strong> <strong>Form</strong> <strong>20</strong>-F and has duly<br />
caused and authorized the undersigned to sign this annual report <strong>on</strong> its behalf.<br />
Date: March 16, <strong>20</strong>10<br />
<strong>Deutsche</strong> <strong>Bank</strong> Aktiengesellschaft<br />
/s/ DR. JOSEF ACKERMANN<br />
Dr. Josef Ackermann<br />
Chairman of the Management Board<br />
/s/ STEFAN KRAUSE<br />
Stefan Krause<br />
Member of the Management Board<br />
Chief Financial Officer<br />
<strong>20</strong>8
<strong>Deutsche</strong> <strong>Bank</strong> Aktiengesellschaft<br />
C<strong>on</strong>solidated Financial Statements
<strong>20</strong>-F <strong>Deutsche</strong> <strong>Bank</strong> Aktiengesellschaft<br />
Index to C<strong>on</strong>solidated Financial Statements<br />
<str<strong>on</strong>g>Report</str<strong>on</strong>g> of Independent Registered Public Accounting Firm F-4<br />
C<strong>on</strong>solidated Financial Statements:<br />
C<strong>on</strong>solidated Statement of Income for the years ended December 31, <str<strong>on</strong>g><strong>20</strong>09</str<strong>on</strong>g>,<br />
December 31, <strong>20</strong>08 and December 31, <strong>20</strong>07. F-5<br />
C<strong>on</strong>solidated Statement of Recognized Income and Expense for the years ended<br />
December 31, <str<strong>on</strong>g><strong>20</strong>09</str<strong>on</strong>g>, December 31, <strong>20</strong>08 and December 31, <strong>20</strong>07. F-6<br />
C<strong>on</strong>solidated Balance Sheet as of December 31, <str<strong>on</strong>g><strong>20</strong>09</str<strong>on</strong>g>, and December 31, <strong>20</strong>08. F-7<br />
C<strong>on</strong>solidated Statement of Changes in Equity for the years ended December 31, <str<strong>on</strong>g><strong>20</strong>09</str<strong>on</strong>g>,<br />
December 31, <strong>20</strong>08 and December 31, <strong>20</strong>07. F-8<br />
C<strong>on</strong>solidated Statement of Cash Flows for the years ended December 31, <str<strong>on</strong>g><strong>20</strong>09</str<strong>on</strong>g>, December 31, <strong>20</strong>08<br />
and December 31, <strong>20</strong>07. F-10<br />
Notes to the C<strong>on</strong>solidated Financial Statements<br />
[1] Significant Accounting Policies 11<br />
[2] Critical Accounting Estimates 46<br />
[3] Recently Adopted and New Accounting Pr<strong>on</strong>ouncements 55<br />
[4] Business Segments and Related Informati<strong>on</strong> 58<br />
Notes to the C<strong>on</strong>solidated Income Statement<br />
[5] Net Interest Income and Net Gains (Losses) <strong>on</strong> Financial Assets/Liabilities<br />
at Fair Value through Profit or Loss 71<br />
[6] Commissi<strong>on</strong>s and Fee Income 73<br />
[7] Net Gains (Losses) <strong>on</strong> Financial Assets Available for Sale 74<br />
[8] Other Income 74<br />
[9] General and Administrative Expenses 75<br />
[10] Earnings per Comm<strong>on</strong> Share 75<br />
Notes to the C<strong>on</strong>solidated Balance Sheet<br />
[11] Financial Assets/Liabilities at Fair Value through Profit or Loss 77<br />
[12] Amendments to IAS 39 and IFRS 7, “Reclassificati<strong>on</strong> of Financial Assets” 80<br />
[13] Financial Instruments carried at Fair Value 82<br />
[14] Fair Value of Financial Instruments not carried at Fair Value 96<br />
[15] Financial Assets Available for Sale 99<br />
[16] Equity Method Investments 99<br />
[17] Loans 101<br />
[18] Allowance for Credit Losses 102<br />
[19] Derecogniti<strong>on</strong> of Financial Assets 103<br />
F - 2<br />
Page
[<strong>20</strong>] Assets Pledged and Received as Collateral 104<br />
[21] Property and Equipment 105<br />
[22] Leases 106<br />
[23] Goodwill and Other Intangible Assets 108<br />
[24] Assets Held for Sale 116<br />
[25] Other Assets and Other Liabilities 118<br />
[26] Deposits 118<br />
[27] Provisi<strong>on</strong>s 119<br />
[28] Other Short-Term Borrowings 125<br />
[29] L<strong>on</strong>g-Term Debt and Trust Preferred Securities 125<br />
Additi<strong>on</strong>al Notes<br />
[30] Comm<strong>on</strong> Shares 126<br />
[31] Share-Based Compensati<strong>on</strong> Plans 128<br />
[32] Employee Benefits 134<br />
[33] Income Taxes 140<br />
[34] Acquisiti<strong>on</strong>s and Dispositi<strong>on</strong>s 144<br />
[35] Derivatives 153<br />
[36] Regulatory Capital 156<br />
[37] Related Party Transacti<strong>on</strong>s 162<br />
[38] Informati<strong>on</strong> <strong>on</strong> Subsidiaries 165<br />
[39] Insurance and Investment C<strong>on</strong>tracts 167<br />
[40] Current and N<strong>on</strong>-Current Assets and Liabilities 170<br />
[41] C<strong>on</strong>densed <strong>Deutsche</strong> <strong>Bank</strong> AG (Parent Company <strong>on</strong>ly) Financial Statements 172<br />
[42] C<strong>on</strong>densed C<strong>on</strong>solidating Financial Informati<strong>on</strong> 175<br />
F - 3
<strong>20</strong>-F <str<strong>on</strong>g>Report</str<strong>on</strong>g> of Independent Registered Public Accounting Firm<br />
<str<strong>on</strong>g>Report</str<strong>on</strong>g> of Independent Registered Public<br />
Accounting Firm<br />
To the Supervisory Board of<br />
<strong>Deutsche</strong> <strong>Bank</strong> Aktiengesellschaft:<br />
We have audited the accompanying c<strong>on</strong>solidated financial statements of <strong>Deutsche</strong> <strong>Bank</strong> Aktiengesellschaft<br />
and subsidiaries (the “Company”) which comprise the c<strong>on</strong>solidated balance sheets as of December 31, <str<strong>on</strong>g><strong>20</strong>09</str<strong>on</strong>g><br />
and <strong>20</strong>08, and the related c<strong>on</strong>solidated statements of income, changes in equity, recognized income and<br />
expense, and cash flows for each of the years in the three-year period ended December 31, <str<strong>on</strong>g><strong>20</strong>09</str<strong>on</strong>g> including<br />
the disclosures described as being part of the financial statements within Item 11, ‘Quantitative and Qualitative<br />
Disclosures about Credit, Market and Other Risk’. These c<strong>on</strong>solidated financial statements are the resp<strong>on</strong>sibility<br />
of the Company’s management. Our resp<strong>on</strong>sibility is to express an opini<strong>on</strong> <strong>on</strong> these c<strong>on</strong>solidated<br />
financial statements based <strong>on</strong> our audits.<br />
We c<strong>on</strong>ducted our audits in accordance with the standards of the Public Company Accounting Oversight<br />
Board (United States). Those standards require that we plan and perform the audit to obtain reas<strong>on</strong>able<br />
assurance about whether the financial statements are free of material misstatement. An audit includes<br />
examining, <strong>on</strong> a test basis, evidence supporting the amounts and disclosures in the financial statements.<br />
An audit also includes assessing the accounting principles used and significant estimates made by management,<br />
as well as evaluating the overall financial statement presentati<strong>on</strong>. We believe that our audits provide a<br />
reas<strong>on</strong>able basis for our opini<strong>on</strong>.<br />
In our opini<strong>on</strong>, the c<strong>on</strong>solidated financial statements referred to above present fairly, in all material respects,<br />
the financial positi<strong>on</strong> of <strong>Deutsche</strong> <strong>Bank</strong> Aktiengesellschaft and subsidiaries as of December 31, <str<strong>on</strong>g><strong>20</strong>09</str<strong>on</strong>g> and<br />
<strong>20</strong>08, and the results of their operati<strong>on</strong>s and their cash flows for each of the years in the three-year period<br />
ended December 31, <str<strong>on</strong>g><strong>20</strong>09</str<strong>on</strong>g>, in c<strong>on</strong>formity with Internati<strong>on</strong>al Financial <str<strong>on</strong>g>Report</str<strong>on</strong>g>ing Standards as issued by the<br />
Internati<strong>on</strong>al Accounting Standards Board.<br />
As described in Note 1 to the c<strong>on</strong>solidated financial statements, the Company changed its method of accounting<br />
for certain financial assets in the year ended December 31, <strong>20</strong>08 following the adopti<strong>on</strong> of “Reclassificati<strong>on</strong><br />
of Financial Assets (Amendments to IAS 39 “Financial Instruments: Recogniti<strong>on</strong> and Measurement” and<br />
IFRS 7 “Financial Instruments: Disclosures”)”.<br />
We also have audited, in accordance with the standards of the Public Company Accounting Oversight Board<br />
(United States), <strong>Deutsche</strong> <strong>Bank</strong> Aktiengesellschaft’s internal c<strong>on</strong>trol over financial reporting as of December<br />
31, <str<strong>on</strong>g><strong>20</strong>09</str<strong>on</strong>g>, based <strong>on</strong> criteria established in Internal C<strong>on</strong>trol – Integrated Framework issued by the Committee<br />
of Sp<strong>on</strong>soring Organizati<strong>on</strong>s of the Treadway Commissi<strong>on</strong> (COSO), and our report dated March 5, <strong>20</strong>10<br />
expressed an unqualified opini<strong>on</strong> <strong>on</strong> the effectiveness of the Company’s internal c<strong>on</strong>trol over financial reporting.<br />
Frankfurt am Main, March 5, <strong>20</strong>10<br />
KPMG AG<br />
Wirtschaftsprüfungsgesellschaft<br />
F - 4
C<strong>on</strong>solidated Statement of Income<br />
in € m. [Notes] <str<strong>on</strong>g><strong>20</strong>09</str<strong>on</strong>g> <strong>20</strong>08 <strong>20</strong>07<br />
Interest and similar income [5] 26,953 54,549 64,675<br />
Interest expense [5] 14,494 42,096 55,826<br />
Net interest income [5] 12,459 12,453 8,849<br />
Provisi<strong>on</strong> for credit losses [18] 2,630 1,076 612<br />
Net interest income after provisi<strong>on</strong> for credit losses 9,829 11,377 8,237<br />
Commissi<strong>on</strong>s and fee income<br />
Net gains (losses) <strong>on</strong> financial assets/liabilities at fair value through<br />
[6] 8,911 9,741 12,282<br />
profit or loss [5] 7,109 (9,992) 7,175<br />
Net gains (losses) <strong>on</strong> financial assets available for sale [7] (403) 666 793<br />
Net income (loss) from equity method investments [16] 59 46 353<br />
Other income (loss) [8] (183) 699 1,377<br />
Total n<strong>on</strong>interest income 15,493 1,160 21,980<br />
Compensati<strong>on</strong> and benefits [31], [32] 11,310 9,606 13,122<br />
General and administrative expenses [9] 8,402 8,339 8,038<br />
Policyholder benefits and claims [39] 542 (252) 193<br />
Impairment of intangible assets [23] (134) 585 128<br />
Restructuring activities [27] – – (13)<br />
Total n<strong>on</strong>interest expenses <strong>20</strong>,1<strong>20</strong> 18,278 21,468<br />
Income (loss) before income taxes 5,<strong>20</strong>2 (5,741) 8,749<br />
Income tax expense (benefit) [33] 244 (1,845) 2,239<br />
Net income (loss) 4,958 (3,896) 6,510<br />
Net income (loss) attributable to minority interest (15) (61) 36<br />
Net income (loss) attributable to <strong>Deutsche</strong> <strong>Bank</strong> shareholders 4,973 (3,835) 6,474<br />
Earnings per Comm<strong>on</strong> Share<br />
in € [Notes] <str<strong>on</strong>g><strong>20</strong>09</str<strong>on</strong>g> <strong>20</strong>08 <strong>20</strong>07<br />
Earnings per comm<strong>on</strong> share: [10]<br />
Basic € 7.92 € (7.61) € 13.65<br />
Diluted1 Number of shares in milli<strong>on</strong>:<br />
Denominator for basic earnings per share –<br />
€ 7.59 € (7.61) € 13.05<br />
weighted-average shares outstanding<br />
Denominator for diluted earnings per share –<br />
628.1 504.1 474.2<br />
adjusted weighted-average shares after assumed c<strong>on</strong>versi<strong>on</strong>s 655.4 504.2 496.1<br />
1 Includes numerator effect of assumed c<strong>on</strong>versi<strong>on</strong>s. For further detail please see Note [10].<br />
The accompanying notes are an integral part of the C<strong>on</strong>solidated Financial Statements.<br />
F - 5
<strong>20</strong>-F C<strong>on</strong>solidated Statement of Recognized Income and Expense<br />
C<strong>on</strong>solidated Statement of<br />
Recognized Income and Expense<br />
in € m. <str<strong>on</strong>g><strong>20</strong>09</str<strong>on</strong>g> <strong>20</strong>08 <strong>20</strong>07<br />
Net income (loss) recognized in the income statement 4,958 (3,896) 6,510<br />
Actuarial gains (losses) related to defined benefit plans, net of tax1 Net gains (losses) not recognized in the income statement, net of tax<br />
Unrealized net gains (losses) <strong>on</strong> financial assets available for sale:2<br />
(679) (1) 486<br />
Unrealized net gains (losses) arising during the period, before tax 523 (4,516) 1,031<br />
Net (gains) losses reclassified to profit or loss, before tax<br />
Unrealized net gains (losses) <strong>on</strong> derivatives hedging variability of cash flows:2<br />
556 (666) (793)<br />
Unrealized net gains (losses) arising during the period, before tax 118 (263) (19)<br />
Net (gains) losses reclassified to profit or loss, before tax<br />
Foreign currency translati<strong>on</strong>:<br />
6 2 13<br />
2<br />
Unrealized net gains (losses) arising during the period, before tax 40 (1,144) (1,772)<br />
Net (gains) losses reclassified to profit or loss, before tax 11 (3) (5)<br />
Unrealized net gains (losses) from equity method investments2 85 (15) (<strong>20</strong>)<br />
Tax <strong>on</strong> net gains (losses) not recognized in the income statement (254) 731 215<br />
Total net gains (losses) not recognized in the income statement, net of tax 1,085 3<br />
(5,874) 4 (1,350) 5<br />
Total recognized income and expense<br />
Attributable to:<br />
5,364 (9,771) 5,646<br />
Minority interest (1) (37) 4<br />
<strong>Deutsche</strong> <strong>Bank</strong> shareholders 5,365 (9,734) 5,642<br />
1 Due to a change in accounting policy, actuarial gains (losses) related to defined benefit plans were recognized directly in retained earnings with prior<br />
periods adjusted in accordance with Note [1]. Included in these amounts are deferred taxes of € 113 milli<strong>on</strong>, € 1 milli<strong>on</strong> and € (192) milli<strong>on</strong> for the years<br />
<str<strong>on</strong>g><strong>20</strong>09</str<strong>on</strong>g>, <strong>20</strong>08 and <strong>20</strong>07, respectively.<br />
2 The unrealized net gains (losses) from equity method investments are disclosed separately starting December 31, <str<strong>on</strong>g><strong>20</strong>09</str<strong>on</strong>g>. These amounts were included in<br />
the other categories of unrealized net gains (losses) not recognized in the income statement in prior periods.<br />
3 Represents the change in the balance sheet in net gains (losses) not recognized in the income statement (net of tax) between December 31, <strong>20</strong>08 of<br />
€ (4,851) milli<strong>on</strong> and December 31, <str<strong>on</strong>g><strong>20</strong>09</str<strong>on</strong>g> of € (3,780) milli<strong>on</strong>, adjusted for changes in minority interest attributable to these comp<strong>on</strong>ents of € 14 milli<strong>on</strong>.<br />
4 Represents the change in the balance sheet in net gains (losses) not recognized in the income statement (net of tax) between December 31, <strong>20</strong>07 of<br />
€ 1,047 milli<strong>on</strong> and December 31, <strong>20</strong>08 of € (4,851) milli<strong>on</strong>, adjusted for changes in minority interest attributable to these comp<strong>on</strong>ents of € 24 milli<strong>on</strong>.<br />
5 Represents the change in the balance sheet in net gains (losses) not recognized in the income statement (net of tax) between December 31, <strong>20</strong>06 of<br />
€ 2,365 milli<strong>on</strong> and December 31, <strong>20</strong>07 of € 1,047 milli<strong>on</strong>, adjusted for changes in minority interest attributable to these comp<strong>on</strong>ents of € (32) milli<strong>on</strong>.<br />
The accompanying notes are an integral part of the C<strong>on</strong>solidated Financial Statements.<br />
F - 6
C<strong>on</strong>solidated Balance Sheet<br />
in € m. [Notes] Dec 31, <str<strong>on</strong>g><strong>20</strong>09</str<strong>on</strong>g> Dec 31, <strong>20</strong>08<br />
Assets:<br />
Cash and due from banks 9,346 9,826<br />
Interest-earning deposits with banks 47,233 64,739<br />
Central bank funds sold and securities purchased under resale agreements [19], [<strong>20</strong>] 6,8<strong>20</strong> 9,267<br />
Securities borrowed<br />
Financial assets at fair value through profit or loss<br />
[19], [<strong>20</strong>] 43,509 35,022<br />
Trading assets 234,910 247,462<br />
Positive market values from derivative financial instruments 596,410 1,224,493<br />
Financial assets designated at fair value through profit or loss 134,000 151,856<br />
Total financial assets at fair value through profit or loss<br />
of which € 79 billi<strong>on</strong> and € 69 billi<strong>on</strong> were pledged to creditors and can be sold or<br />
repledged at December 31, <str<strong>on</strong>g><strong>20</strong>09</str<strong>on</strong>g>, and <strong>20</strong>08, respectively<br />
The accompanying notes are an integral part of the C<strong>on</strong>solidated Financial Statements.<br />
F - 7<br />
[11], [13],<br />
[<strong>20</strong>], [35] 965,3<strong>20</strong> 1,623,811<br />
Financial assets available for sale<br />
of which € 492 milli<strong>on</strong> and € 464 milli<strong>on</strong> were pledged to creditors and can be sold<br />
or repledged at December 31, <str<strong>on</strong>g><strong>20</strong>09</str<strong>on</strong>g>, and <strong>20</strong>08, respectively [15], [19], [<strong>20</strong>] 18,819 24,835<br />
Equity method investments [16] 7,788 2,242<br />
Loans [17], [18] 258,105 269,281<br />
Property and equipment [21] 2,777 3,712<br />
Goodwill and other intangible assets [23] 10,169 9,877<br />
Other assets [24], [25] 121,538 137,829<br />
Assets for current tax [33] 2,090 3,512<br />
Deferred tax assets [33] 7,150 8,470<br />
Total assets 1,500,664 2,<strong>20</strong>2,423<br />
Liabilities and equity:<br />
Deposits [26] 344,2<strong>20</strong> 395,553<br />
Central bank funds purchased and securities sold under repurchase agreements [19], [<strong>20</strong>] 45,495 87,117<br />
Securities loaned [19], [<strong>20</strong>] 5,564 3,216<br />
Financial liabilities at fair value through profit or loss [11], [13], [35]<br />
Trading liabilities 64,501 68,168<br />
Negative market values from derivative financial instruments 576,973 1,181,617<br />
Financial liabilities designated at fair value through profit or loss 73,522 78,003<br />
Investment c<strong>on</strong>tract liabilities 7,278 5,977<br />
Total financial liabilities at fair value through profit or loss 722,274 1,333,765<br />
Other short-term borrowings [28] 42,897 39,115<br />
Other liabilities [24], [25] 154,281 160,598<br />
Provisi<strong>on</strong>s [18], [27] 1,307 1,418<br />
Liabilities for current tax [33] 2,141 2,354<br />
Deferred tax liabilities [33] 2,157 3,784<br />
L<strong>on</strong>g-term debt [29] 131,782 133,856<br />
Trust preferred securities [29] 10,577 9,729<br />
Obligati<strong>on</strong> to purchase comm<strong>on</strong> shares – 4<br />
Total liabilities 1,462,695 2,170,509<br />
Comm<strong>on</strong> shares, no par value, nominal value of € 2.56 [30] 1,589 1,461<br />
Additi<strong>on</strong>al paid-in capital 14,830 14,961<br />
Retained earnings 24,056 <strong>20</strong>,074<br />
Comm<strong>on</strong> shares in treasury, at cost [30] (48) (939)<br />
Equity classified as obligati<strong>on</strong> to purchase comm<strong>on</strong> shares – (3)<br />
Net gains (losses) not recognized in the income statement, net of tax (3,780) (4,851)<br />
Total shareholders’ equity 36,647 30,703<br />
Minority interest 1,322 1,211<br />
Total equity 37,969 31,914<br />
Total liabilities and equity 1,500,664 2,<strong>20</strong>2,423
<strong>20</strong>-F C<strong>on</strong>solidated Statement of Changes in Equity<br />
C<strong>on</strong>solidated Statement of Changes in Equity<br />
in € m.<br />
Comm<strong>on</strong><br />
shares<br />
(no par value)<br />
Additi<strong>on</strong>al<br />
paid-in capital<br />
Retained<br />
earnings 1<br />
Comm<strong>on</strong><br />
shares in<br />
treasury,<br />
at cost<br />
1 The balances as of December 31, <strong>20</strong>06 and December 31, <strong>20</strong>07 were increased by € 449 milli<strong>on</strong> and € 935 milli<strong>on</strong>, respectively, for a change in accounting policy and other<br />
adjustments in accordance with Note [1].<br />
2 Excluding actuarial gains (losses) related to defined benefit plans, net of tax.<br />
3 The unrealized net gains (losses) from equity method investments are disclosed separately starting December 31, <str<strong>on</strong>g><strong>20</strong>09</str<strong>on</strong>g>. These amounts were included in<br />
the other categories of unrealized net gains (losses) not recognized in the income statement in prior periods.<br />
F - 8<br />
Equity<br />
classified as<br />
obligati<strong>on</strong> to<br />
purchase<br />
comm<strong>on</strong> shares<br />
Balance as of December 31, <strong>20</strong>06 1,343 15,246 <strong>20</strong>,900 (2,378) (4,307)<br />
Total recognized income and expense 2 – – 6,474 – –<br />
Comm<strong>on</strong> shares issued – – – – –<br />
Cash dividends paid – – (2,005) – –<br />
Dividend related to equity classified as obligati<strong>on</strong> to purchase comm<strong>on</strong> shares – – 277 – –<br />
Actuarial gains (losses) related to defined benefit plans, net of tax – – 486 – –<br />
Net change in share awards – 122 – – –<br />
Treasury shares distributed under share-based compensati<strong>on</strong> plans – – – 1,010 –<br />
Tax benefits related to share-based compensati<strong>on</strong> plans – (44) – – –<br />
Amendment of derivative instruments indexed to <strong>Deutsche</strong> <strong>Bank</strong> comm<strong>on</strong> shares – – – – –<br />
Comm<strong>on</strong> shares issued under share-based compensati<strong>on</strong> plans 15 377 – – –<br />
Additi<strong>on</strong>s to Equity classified as obligati<strong>on</strong> to purchase comm<strong>on</strong> shares – – – – (1,292)<br />
Deducti<strong>on</strong>s from Equity classified as obligati<strong>on</strong> to purchase comm<strong>on</strong> shares – – – – 2,047<br />
Opti<strong>on</strong> premiums and other effects from opti<strong>on</strong>s <strong>on</strong> comm<strong>on</strong> shares – 76 3 – –<br />
Purchases of treasury shares – – – (41,128) –<br />
Sale of treasury shares – – – 39,677 –<br />
Net gains (losses) <strong>on</strong> treasury shares sold – 28 – – –<br />
Other – 3 (84) – –<br />
Balance as of December 31, <strong>20</strong>07 1,358 15,808 26,051 (2,819) (3,552)<br />
Total recognized income and expense 2 – – (3,835) – –<br />
Comm<strong>on</strong> shares issued 102 2,098 – – –<br />
Cash dividends paid – – (2,274) – –<br />
Dividend related to equity classified as obligati<strong>on</strong> to purchase comm<strong>on</strong> shares – – 226 – –<br />
Actuarial gains (losses) related to defined benefit plans, net of tax – – (1) – –<br />
Net change in share awards – 225 – – –<br />
Treasury shares distributed under share-based compensati<strong>on</strong> plans – – – 1,072 –<br />
Tax benefits related to share-based compensati<strong>on</strong> plans – (136) – – –<br />
Amendment of derivative instruments indexed to <strong>Deutsche</strong> <strong>Bank</strong> comm<strong>on</strong> shares – (1,815) – – 2,690<br />
Comm<strong>on</strong> shares issued under share-based compensati<strong>on</strong> plans 1 17 – – –<br />
Additi<strong>on</strong>s to Equity classified as obligati<strong>on</strong> to purchase comm<strong>on</strong> shares – – – – (366)<br />
Deducti<strong>on</strong>s from Equity classified as obligati<strong>on</strong> to purchase comm<strong>on</strong> shares – – – – 1,225<br />
Opti<strong>on</strong> premiums and other effects from opti<strong>on</strong>s <strong>on</strong> comm<strong>on</strong> shares – 3 (4) – –<br />
Purchases of treasury shares – – – (21,736) –<br />
Sale of treasury shares – – – 22,544 –<br />
Net gains (losses) <strong>on</strong> treasury shares sold – (1,191) – – –<br />
Other – (48) (89) – –<br />
Balance as of December 31, <strong>20</strong>08 1,461 14,961 <strong>20</strong>,074 (939) (3)<br />
Total recognized income and expense 2 – – 4,973 – –<br />
Comm<strong>on</strong> shares issued 128 830 – – –<br />
Cash dividends paid – – (309) – –<br />
Dividend related to equity classified as obligati<strong>on</strong> to purchase comm<strong>on</strong> shares – – – – –<br />
Actuarial gains (losses) related to defined benefit plans, net of tax – – (679) – –<br />
Net change in share awards – (688) – – –<br />
Treasury shares distributed under share-based compensati<strong>on</strong> plans – – – 1,313 –<br />
Tax benefits related to share-based compensati<strong>on</strong> plans – 35 – – –<br />
Amendment of derivative instruments indexed to <strong>Deutsche</strong> <strong>Bank</strong> comm<strong>on</strong> shares – – – – –<br />
Comm<strong>on</strong> shares issued under share-based compensati<strong>on</strong> plans – – – – –<br />
Additi<strong>on</strong>s to Equity classified as obligati<strong>on</strong> to purchase comm<strong>on</strong> shares – – – – (5)<br />
Deducti<strong>on</strong>s from Equity classified as obligati<strong>on</strong> to purchase comm<strong>on</strong> shares – – – – 8<br />
Opti<strong>on</strong> premiums and other effects from opti<strong>on</strong>s <strong>on</strong> comm<strong>on</strong> shares – (149) – – –<br />
Purchases of treasury shares – – – (19,238) –<br />
Sale of treasury shares – – – 18,816 –<br />
Net gains (losses) <strong>on</strong> treasury shares sold – (177) – – –<br />
Other – 18 (3) – –<br />
Balance as of December 31, <str<strong>on</strong>g><strong>20</strong>09</str<strong>on</strong>g> 1,589 14,830 24,056 (48) –
Unrealized net gains<br />
(losses) <strong>on</strong> financial<br />
assets available for sale,<br />
net of applicable<br />
tax and other 3<br />
Unrealized net<br />
gains (losses) <strong>on</strong><br />
derivatives hedging<br />
variability of cash<br />
flows, net of tax 3<br />
Foreign currency<br />
translati<strong>on</strong>,<br />
3, 4<br />
net of tax<br />
Unrealized net<br />
gains (losses)<br />
from equity<br />
method<br />
investments 3<br />
Total net gains<br />
(losses) not<br />
recognized in the<br />
income statement,<br />
net of tax 4<br />
4 The balances as of December 31, <strong>20</strong>06 and December 31, <strong>20</strong>07 were reduced by € 38 milli<strong>on</strong> and € 86 milli<strong>on</strong>, respectively, for a change in accounting policy and other adjustments<br />
in accordance with Note [1].<br />
The accompanying notes are an integral part of the C<strong>on</strong>solidated Financial Statements.<br />
F - 9<br />
Total<br />
shareholders’<br />
equity<br />
Minority<br />
interest<br />
Total equity<br />
3,194 (45) (800) 16 2,365 33,169 717 33,886<br />
435 (7) (1,724) (22) (1,318) 5,156 4 5,160<br />
– – – – – – – –<br />
– – – – – (2,005) – (2,005)<br />
– – – – – 277 – 277<br />
– – – – – 486 – 486<br />
– – – – – 122 – 122<br />
– – – – – 1,010 – 1,010<br />
– – – – – (44) – (44)<br />
– – – – – – – –<br />
– – – – – 392 – 392<br />
– – – – – (1,292) – (1,292)<br />
– – – – – 2,047 – 2,047<br />
– – – – – 79 – 79<br />
– – – – – (41,128) – (41,128)<br />
– – – – – 39,677 – 39,677<br />
– – – – – 28 – 28<br />
– – – – – (81) 701 6<strong>20</strong><br />
3,629 (52) (2,524) (6) 1,047 37,893 1,422 39,315<br />
(4,484) (294) (1,104) (16) (5,898) (9,733) (37) (9,770)<br />
– – – – – 2,<strong>20</strong>0 – 2,<strong>20</strong>0<br />
– – – – – (2,274) – (2,274)<br />
– – – – – 226 – 226<br />
– – – – – (1) – (1)<br />
– – – – – 225 – 225<br />
– – – – – 1,072 – 1,072<br />
– – – – – (136) – (136)<br />
– – – – – 875 – 875<br />
– – – – – 18 – 18<br />
– – – – – (366) – (366)<br />
– – – – – 1,225 – 1,225<br />
– – – – – (1) – (1)<br />
– – – – – (21,736) – (21,736)<br />
– – – – – 22,544 – 22,544<br />
– – – – – (1,191) – (1,191)<br />
– – – – – (137) (174) (311)<br />
(855) (346) (3,628) (22) (4,851) 30,703 1,211 31,914<br />
669 212 107 83 1,071 6,044 (1) 6,043<br />
– – – – – 958 – 958<br />
– – – – – (309) – (309)<br />
– – – – – – – –<br />
– – – – – (679) – (679)<br />
– – – – – (688) – (688)<br />
– – – – – 1,313 – 1,313<br />
– – – – – 35 – 35<br />
– – – – – – – –<br />
– – – – – – – –<br />
– – – – – (5) – (5)<br />
– – – – – 8 – 8<br />
– – – – – (149) – (149)<br />
– – – – – (19,238) – (19,238)<br />
– – – – – 18,816 – 18,816<br />
– – – – – (177) – (177)<br />
– – – – – 15 112 127<br />
(186) (134) (3,521) 61 (3,780) 36,647 1,322 37,969
<strong>20</strong>-F C<strong>on</strong>solidated Statement of Cash Flows<br />
C<strong>on</strong>solidated Statement of Cash Flows<br />
in € m. <str<strong>on</strong>g><strong>20</strong>09</str<strong>on</strong>g> <strong>20</strong>08 <strong>20</strong>07<br />
Net income (loss)<br />
Cash flows from operating activities:<br />
Adjustments to rec<strong>on</strong>cile net income to net cash provided by (used in) operating activities:<br />
4,958 (3,896) 6,510<br />
Provisi<strong>on</strong> for credit losses 2,630 1,076 612<br />
Restructuring activities – – (13)<br />
Gain <strong>on</strong> sale of financial assets available for sale, equity method investments, and other (656) (1,732) (1,907)<br />
Deferred income taxes, net (296) (1,525) (918)<br />
Impairment, depreciati<strong>on</strong> and other amortizati<strong>on</strong>, and accreti<strong>on</strong> 1,782 3,047 1,731<br />
Share of net income from equity method investments (189) (53) (358)<br />
Income (loss) adjusted for n<strong>on</strong>cash charges, credits and other items<br />
Adjustments for net change in operating assets and liabilities:<br />
8,229 (3,083) 5,657<br />
Interest-earning time deposits with banks<br />
Central bank funds sold, securities purchased under resale agreements, securities<br />
4,583 (3,964) 7,588<br />
borrowed (4,<strong>20</strong>3) 24,363 5,146<br />
Trading assets and positive market values from derivative financial instruments 726,237 (472,<strong>20</strong>3) (270,948)<br />
Financial assets designated at fair value through profit or loss 24,890 169,423 (75,775)<br />
Loans 17,213 (37,981) (22,185)<br />
Other assets 21,960 38,573 (42,674)<br />
Deposits (57,330) (56,918) 47,464<br />
Trading liabilities and negative market values from derivative financial instruments<br />
Financial liabilities designated at fair value through profit or loss and investment c<strong>on</strong>tract<br />
(686,214) 655,218 173,830<br />
liabilities<br />
Central bank funds purchased, securities sold under repurchase agreements, securities<br />
(7,061) (159,613) 70,232<br />
loaned (40,644) (97,009) 69,072<br />
Other short-term borrowings 2,592 (14,216) 6,531<br />
Other liabilities (15,645) (15,482) 21,133<br />
Senior l<strong>on</strong>g-term debt (7,150) 12,769 22,935<br />
Other, net (1,243) (2,760) (1,216)<br />
Net cash provided by (used in) operating activities<br />
Cash flows from investing activities:<br />
Proceeds from:<br />
(13,786) 37,117 16,790<br />
Sale of financial assets available for sale 9,023 19,433 12,470<br />
Maturities of financial assets available for sale 8,938 18,713 8,179<br />
Sale of equity method investments 574 680 1,331<br />
Sale of property and equipment<br />
Purchase of:<br />
39 107 987<br />
Financial assets available for sale (12,082) (37,819) (25,230)<br />
Equity method investments (3,730) (881) (1,265)<br />
Property and equipment (592) (939) (675)<br />
Net cash paid for business combinati<strong>on</strong>s/divestitures (<strong>20</strong>) (24) (648)<br />
Other, net (1,749) (39) 463<br />
Net cash provided by (used in) investing activities<br />
Cash flows from financing activities:<br />
401 (769) (4,388)<br />
Issuances of subordinated l<strong>on</strong>g-term debt 457 523 429<br />
Repayments and extinguishments of subordinated l<strong>on</strong>g-term debt (1,448) (659) (2,809)<br />
Issuances of trust preferred securities 1,303 3,404 1,874<br />
Repayments and extinguishments of trust preferred securities – – (4<strong>20</strong>)<br />
Comm<strong>on</strong> shares issued under share-based compensati<strong>on</strong> plans – 19 389<br />
Capital increase – 2,<strong>20</strong>0 –<br />
Purchases of treasury shares (19,238) (21,736) (41,128)<br />
Sale of treasury shares 18,111 21,426 39,729<br />
Dividends paid to minority interests (5) (14) (13)<br />
Net change in minority interests 109 331 585<br />
Cash dividends paid (309) (2,274) (2,005)<br />
Net cash provided by (used in) financing activities (1,0<strong>20</strong>) 3,2<strong>20</strong> (3,369)<br />
Net effect of exchange rate changes <strong>on</strong> cash and cash equivalents 690 (402) (289)<br />
Net increase (decrease) in cash and cash equivalents (13,715) 39,166 8,744<br />
Cash and cash equivalents at beginning of period 65,264 26,098 17,354<br />
Cash and cash equivalents at end of period<br />
Net cash provided by (used in) operating activities include<br />
51,549 65,264 26,098<br />
Income taxes paid (received), net (5<strong>20</strong>) (2,495) 2,806<br />
Interest paid 15,878 43,724 55,066<br />
Interest and dividends received<br />
Cash and cash equivalents comprise<br />
28,211 54,549 64,675<br />
Cash and due from banks<br />
Interest-earning demand deposits with banks (not included: time deposits of € 5,030 m. as of<br />
9,346 9,826 8,632<br />
December 31, <str<strong>on</strong>g><strong>20</strong>09</str<strong>on</strong>g>, and € 9,301 m. and € 4,149 m. as of December 31, <strong>20</strong>08 and <strong>20</strong>07) 42,<strong>20</strong>3 55,438 17,466<br />
Total 51,549 65,264 26,098<br />
The accompanying notes are an integral part of the C<strong>on</strong>solidated Financial Statements.<br />
The acquisiti<strong>on</strong> of <strong>Deutsche</strong> Postbank AG shares in <str<strong>on</strong>g><strong>20</strong>09</str<strong>on</strong>g>, including the n<strong>on</strong>-cash porti<strong>on</strong>, is described in detail in Note [16].<br />
F - 10
Notes to the C<strong>on</strong>solidated Financial Statements<br />
[1] Significant Accounting Policies<br />
Basis of Accounting<br />
<strong>Deutsche</strong> <strong>Bank</strong> Aktiengesellschaft (“<strong>Deutsche</strong> <strong>Bank</strong>” or the “Parent”) is a stock corporati<strong>on</strong> organized under<br />
the laws of the Federal Republic of Germany. <strong>Deutsche</strong> <strong>Bank</strong> together with all entities in which <strong>Deutsche</strong> <strong>Bank</strong><br />
has a c<strong>on</strong>trolling financial interest (the “Group”) is a global provider of a full range of corporate and investment<br />
banking, private clients and asset management products and services. For a discussi<strong>on</strong> of the Group’s<br />
business segment informati<strong>on</strong>, see Note [4].<br />
The accompanying c<strong>on</strong>solidated financial statements are stated in euros, the presentati<strong>on</strong> currency of<br />
the Group. All financial informati<strong>on</strong> presented in milli<strong>on</strong> euros has been rounded to the nearest milli<strong>on</strong>. The<br />
c<strong>on</strong>solidated financial statements have been prepared in accordance with Internati<strong>on</strong>al Financial <str<strong>on</strong>g>Report</str<strong>on</strong>g>ing<br />
Standards (“IFRS”) as issued by the Internati<strong>on</strong>al Accounting Standards Board (“IASB”) and endorsed by the<br />
European Uni<strong>on</strong> (“EU”). The Group’s applicati<strong>on</strong> of IFRS results in no differences between IFRS as issued by<br />
the IASB and IFRS as endorsed by the EU. In accordance with IFRS 4, “Insurance C<strong>on</strong>tracts”, the Group has<br />
applied its previous accounting practices (U.S. GAAP) for the measurement of insurance c<strong>on</strong>tracts.<br />
Risk disclosures under IFRS 7, “Financial Instruments: Disclosures” about the nature and extent of risks arising<br />
from financial instruments are incorporated herein by reference to the porti<strong>on</strong>s marked by a bracket in the<br />
margins of “Item 11: Quantitative and Qualitative Disclosures about Credit, Market and Other Risk” for the<br />
year ended December 31, <str<strong>on</strong>g><strong>20</strong>09</str<strong>on</strong>g>.<br />
The preparati<strong>on</strong> of financial statements under IFRS requires management to make estimates and assump-<br />
ti<strong>on</strong>s for certain categories of assets and liabilities. Areas where this is required include the fair value of cer-<br />
tain financial assets and liabilities, the allowance for loan losses, the impairment of assets other than loans,<br />
goodwill and other intangibles, the recogniti<strong>on</strong> and measurement of deferred tax assets, provisi<strong>on</strong>s for uncertain<br />
income tax positi<strong>on</strong>s, legal and regulatory c<strong>on</strong>tingencies, reserves for insurance and investment c<strong>on</strong>tracts,<br />
reserves for pensi<strong>on</strong>s and similar obligati<strong>on</strong>s. These estimates and assumpti<strong>on</strong>s affect the reported<br />
amounts of assets and liabilities and disclosure of c<strong>on</strong>tingent assets and liabilities at the balance sheet date,<br />
and the reported amounts of revenue and expenses during the reporting period. Actual results could differ<br />
from management’s estimates. Refer to Note [2] for a descripti<strong>on</strong> of the critical accounting estimates and<br />
judgments used in the preparati<strong>on</strong> of the financial statements.<br />
The Group applies estimates in determining the allowance for loan losses in its homogeneous loan portfolio<br />
which use statistical models based <strong>on</strong> historical experience. On a regular basis the Group performs procedures<br />
to align input parameters and model assumpti<strong>on</strong>s with historically evidenced loss levels which led to a<br />
lower level of provisi<strong>on</strong>s for credit losses of € 145.8 milli<strong>on</strong> for the <str<strong>on</strong>g><strong>20</strong>09</str<strong>on</strong>g> reporting period.<br />
F - 11
<strong>20</strong>-F Notes to the C<strong>on</strong>solidated Financial Statements<br />
In preparati<strong>on</strong> of the <str<strong>on</strong>g><strong>20</strong>09</str<strong>on</strong>g> and <strong>20</strong>08 financial statements, the Group made a number of minor adjustments,<br />
with immaterial effect, to prior year footnote disclosures. The Group has assessed the impact of errors <strong>on</strong><br />
current and prior periods and c<strong>on</strong>cluded that the following described adjustments are required to comparative<br />
amounts or the earliest opening balance sheet. The Group also voluntarily elected to change its accounting<br />
policy for the recogniti<strong>on</strong> of actuarial gains and losses related to post-employment benefits.<br />
Balance (as<br />
reported)<br />
Change in<br />
accounting<br />
policy<br />
Defined<br />
benefit<br />
plan<br />
accounting<br />
F - 12<br />
Adjustments Balance<br />
(adjusted)<br />
LCH Interest Income tax Financial Clearing<br />
Offsetting<br />
liabilities guarantees and settlement<br />
fees<br />
in € m.<br />
Dec 31, <strong>20</strong>07<br />
Income Statement<br />
Interest and similar income 67,706 (3,031) 64,675<br />
Interest expense 58,857 (3,031) 55,826<br />
Commissi<strong>on</strong>s and fee income 12,289 (7) 12,282<br />
Other income 1,286 91 1,377<br />
General and administrative expenses<br />
Balance Sheet<br />
Assets:<br />
Financial assets at fair value through<br />
7,954 91 (7) 8,037<br />
profit or loss 1,474,103 (96,092)<br />
1,378,011<br />
Deferred tax assets 4,772 5 4,777<br />
Other assets<br />
Liabilities:<br />
Financial liabilities at fair value<br />
182,897 741 183,638<br />
through profit or loss 966,177 (96,092)<br />
870,085<br />
Other liabilities 171,509 (65) 171,444<br />
Liabilities for current tax 4,515 (294) 4,221<br />
Deferred tax liabilities<br />
Equity:<br />
2,124 256 2,380<br />
Retained earnings<br />
Net gains (losses) not recognized in<br />
the income statement:<br />
25,116 570 365 26,051<br />
Foreign currency translati<strong>on</strong>, net of tax (2,450) (15) (71) (2,536)<br />
<strong>20</strong>08<br />
Commissi<strong>on</strong>s and fee income 9,749 (8) 9,741<br />
Other income 568 131 699<br />
General and administrative expenses 8,216 131 (8) 8,339
Employee Benefits: Defined Benefit Accounting<br />
In the fourth quarter <strong>20</strong>08, the Group changed its accounting policy for the recogniti<strong>on</strong> of actuarial gains and<br />
losses related to post-employment benefits for defined benefit plans. The Group has elected to voluntarily<br />
change its accounting policy from the corridor approach to immediate recogniti<strong>on</strong> of actuarial gains and<br />
losses in shareholders’ equity in the period in which they arise. In accordance with IFRS, the change was<br />
applied retrospectively. The change in accounting policy is c<strong>on</strong>sidered to provide more relevant informati<strong>on</strong><br />
about the Group’s financial positi<strong>on</strong>, as it recognizes ec<strong>on</strong>omic events in the period in which they occur. The<br />
retrospective adjustments had an impact <strong>on</strong> the c<strong>on</strong>solidated balance sheet and the c<strong>on</strong>solidated statement<br />
of recognized income and expense but not <strong>on</strong> the c<strong>on</strong>solidated statement of income or c<strong>on</strong>solidated cash flow<br />
statement.<br />
Offsetting<br />
In the sec<strong>on</strong>d quarter <strong>20</strong>08, the Group c<strong>on</strong>cluded that it meets the criteria required to offset the positive and<br />
negative market values of OTC interest rate swaps transacted with the L<strong>on</strong>d<strong>on</strong> Clearing House (“LCH”).<br />
Under IFRS, positi<strong>on</strong>s are netted by currency and across maturities. The applicati<strong>on</strong> of offsetting had no net<br />
impact <strong>on</strong> the c<strong>on</strong>solidated income statement or shareholder’s equity.<br />
The presentati<strong>on</strong> of interest and similar income and interest expense was adjusted with no impact <strong>on</strong> net<br />
interest income or <strong>on</strong> shareholders’ equity.<br />
Adjustment of Current Tax Liability<br />
In the fourth quarter <strong>20</strong>08, the Group determined that it had c<strong>on</strong>tinued to report tax liabilities for periods prior<br />
to <strong>20</strong>06 which were not required. Current tax liabilities were retrospectively adjusted by the amounts in the<br />
table above, with related adjustments to opening retained earnings and opening foreign currency translati<strong>on</strong><br />
reserves where appropriate.<br />
Financial Guarantees<br />
In the sec<strong>on</strong>d quarter <str<strong>on</strong>g><strong>20</strong>09</str<strong>on</strong>g> retrospective adjustments were made in the income statement to present premiums<br />
paid for financial guarantees as expenses instead of offsetting them against revenues because they<br />
are not directly related to a revenue generating activity. The adjustment did not have any impact <strong>on</strong> net income<br />
or shareholders’ equity but resulted in an increase of both n<strong>on</strong>interest income and n<strong>on</strong>interest expenses.<br />
Significant Accounting Policies<br />
The following is a descripti<strong>on</strong> of the significant accounting policies of the Group. Other than as previously and<br />
otherwise described, these policies have been c<strong>on</strong>sistently applied for <strong>20</strong>07, <strong>20</strong>08 and <str<strong>on</strong>g><strong>20</strong>09</str<strong>on</strong>g>.<br />
F - 13
<strong>20</strong>-F Notes to the C<strong>on</strong>solidated Financial Statements<br />
Principles of C<strong>on</strong>solidati<strong>on</strong><br />
The financial informati<strong>on</strong> in the c<strong>on</strong>solidated financial statements includes that for the parent company,<br />
<strong>Deutsche</strong> <strong>Bank</strong> AG, together with its subsidiaries, including certain special purpose entities (“SPEs”), pre-<br />
sented as a single ec<strong>on</strong>omic unit.<br />
Subsidiaries<br />
The Group’s subsidiaries are those entities which it c<strong>on</strong>trols. The Group c<strong>on</strong>trols entities when it has the power<br />
to govern the financial and operating policies of the entity, generally accompanying a shareholding, either<br />
directly or indirectly, of more than <strong>on</strong>e half of the voting rights. The existence and effect of potential voting<br />
rights that are currently exercisable or c<strong>on</strong>vertible are c<strong>on</strong>sidered in assessing whether the Group c<strong>on</strong>trols an<br />
entity.<br />
The Group sp<strong>on</strong>sors the formati<strong>on</strong> of SPEs and interacts with n<strong>on</strong>-sp<strong>on</strong>sored SPEs for a variety of reas<strong>on</strong>s,<br />
including allowing clients to hold investments in separate legal entities, allowing clients to invest jointly in<br />
alternative assets, for asset securitizati<strong>on</strong> transacti<strong>on</strong>s, and for buying or selling credit protecti<strong>on</strong>. When<br />
assessing whether to c<strong>on</strong>solidate an SPE, the Group evaluates a range of factors, including whether (1) the<br />
activities of the SPE are being c<strong>on</strong>ducted <strong>on</strong> behalf of the Group according to its specific business needs so<br />
that the Group obtains the benefits from the SPE’s operati<strong>on</strong>s, (2) the Group has decisi<strong>on</strong>-making powers to<br />
obtain the majority of the benefits, (3) the Group obtains the majority of the benefits of the activities of the<br />
SPE, or (4) the Group retains the majority of the residual ownership risks related to the assets in order to<br />
obtain the benefits from its activities. The Group c<strong>on</strong>solidates an SPE if an assessment of the relevant factors<br />
indicates that it c<strong>on</strong>trols the SPE.<br />
Subsidiaries are c<strong>on</strong>solidated from the date <strong>on</strong> which c<strong>on</strong>trol is transferred to the Group and are no l<strong>on</strong>ger<br />
c<strong>on</strong>solidated from the date that c<strong>on</strong>trol ceases.<br />
The Group reassesses c<strong>on</strong>solidati<strong>on</strong> status at least at every quarterly reporting date. Therefore, any changes<br />
in structure are c<strong>on</strong>sidered when they occur. This includes changes to any c<strong>on</strong>tractual arrangements the<br />
Group has, including those newly executed with the entity, and is not <strong>on</strong>ly limited to changes in ownership.<br />
F - 14
The Group reassesses its treatment of SPEs for c<strong>on</strong>solidati<strong>on</strong> when there is an overall change in the SPE’s<br />
arrangements or when there has been a substantive change in the relati<strong>on</strong>ship between the Group and an<br />
SPE. The circumstances that would indicate that a reassessment for c<strong>on</strong>solidati<strong>on</strong> is necessary include, but<br />
are not limited to, the following:<br />
— substantive changes in ownership of the SPE, such as the purchase of more than an insignificant addi-<br />
ti<strong>on</strong>al interest or disposal of more than an insignificant interest in the SPE;<br />
— changes in c<strong>on</strong>tractual or governance arrangements of the SPE;<br />
— additi<strong>on</strong>al activities undertaken in the structure, such as providing a liquidity facility bey<strong>on</strong>d the terms<br />
established originally or entering into a transacti<strong>on</strong> with an SPE that was not c<strong>on</strong>templated originally; and<br />
— changes in the financing structure of the entity.<br />
In additi<strong>on</strong>, when the Group c<strong>on</strong>cludes that the SPE might require additi<strong>on</strong>al support to c<strong>on</strong>tinue in business,<br />
and such support was not c<strong>on</strong>templated originally, and, if required, the Group would provide such support for<br />
reputati<strong>on</strong>al or other reas<strong>on</strong>s, the Group reassesses the need to c<strong>on</strong>solidate the SPE.<br />
The reassessment of c<strong>on</strong>trol over the existing SPEs does not automatically lead to c<strong>on</strong>solidati<strong>on</strong> or dec<strong>on</strong>solidati<strong>on</strong>.<br />
In making such a reassessment, the Group may need to change its assumpti<strong>on</strong>s with respect to<br />
loss probabilities, the likelihood of additi<strong>on</strong>al liquidity facilities being drawn in the future and the likelihood of<br />
future acti<strong>on</strong>s being taken for reputati<strong>on</strong>al or other purposes. All currently available informati<strong>on</strong>, including<br />
current market parameters and expectati<strong>on</strong>s (such as loss expectati<strong>on</strong>s <strong>on</strong> assets), which would incorporate<br />
any market changes since incepti<strong>on</strong> of the SPE, is used in the reassessment of c<strong>on</strong>solidati<strong>on</strong> c<strong>on</strong>clusi<strong>on</strong>s.<br />
The purchase method of accounting is used to account for the acquisiti<strong>on</strong> of subsidiaries. The cost of an<br />
acquisiti<strong>on</strong> is measured at the fair value of the assets given, equity instruments issued and liabilities incurred<br />
or assumed, plus any costs directly related to the acquisiti<strong>on</strong>. The excess of the cost of an acquisiti<strong>on</strong> over<br />
the Group’s share of the fair value of the identifiable net assets acquired is recorded as goodwill. If the acquisiti<strong>on</strong><br />
cost is below the fair value of the identifiable net assets (negative goodwill), a gain may be reported in<br />
other income.<br />
All intercompany transacti<strong>on</strong>s, balances and unrealized gains <strong>on</strong> transacti<strong>on</strong>s between Group companies are<br />
eliminated <strong>on</strong> c<strong>on</strong>solidati<strong>on</strong>. C<strong>on</strong>sistent accounting policies are applied throughout the Group for the purposes<br />
of c<strong>on</strong>solidati<strong>on</strong>. Issuances of a subsidiary’s stock to third parties are treated as minority interests.<br />
F - 15
<strong>20</strong>-F Notes to the C<strong>on</strong>solidated Financial Statements<br />
Assets held in an agency or fiduciary capacity are not assets of the Group and are not included in the Group’s<br />
c<strong>on</strong>solidated balance sheet.<br />
Minority interests are shown in the c<strong>on</strong>solidated balance sheet as a separate comp<strong>on</strong>ent of equity, which is<br />
distinct from <strong>Deutsche</strong> <strong>Bank</strong>’s shareholders’ equity. The net income attributable to minority interests is separately<br />
disclosed <strong>on</strong> the face of the c<strong>on</strong>solidated income statement.<br />
Associates and Jointly C<strong>on</strong>trolled Entities<br />
An associate is an entity in which the Group has significant influence, but not a c<strong>on</strong>trolling interest, over the<br />
operating and financial management policy decisi<strong>on</strong>s of the entity. Significant influence is generally presumed<br />
when the Group holds between <strong>20</strong> % and 50 % of the voting rights. The existence and effect of potential voting<br />
rights that are currently exercisable or c<strong>on</strong>vertible are c<strong>on</strong>sidered in assessing whether the Group has<br />
significant influence. Am<strong>on</strong>g the other factors that are c<strong>on</strong>sidered in determining whether the Group has significant<br />
influence are representati<strong>on</strong> <strong>on</strong> the board of directors (supervisory board in the case of German stock<br />
corporati<strong>on</strong>s) and material intercompany transacti<strong>on</strong>s. The existence of these factors could require the applicati<strong>on</strong><br />
of the equity method of accounting for a particular investment even though the Group’s investment is<br />
for less than <strong>20</strong> % of the voting stock.<br />
A jointly c<strong>on</strong>trolled entity exists when the Group has a c<strong>on</strong>tractual arrangement with <strong>on</strong>e or more parties to<br />
undertake activities through entities which are subject to joint c<strong>on</strong>trol.<br />
Investments in associates and jointly c<strong>on</strong>trolled entities are accounted for under the equity method of account-<br />
ing. The Group’s share of the results of associates and jointly c<strong>on</strong>trolled entities is adjusted to c<strong>on</strong>form to the<br />
accounting policies of the Group and are reported in the income statement as net income (loss) from equity<br />
method investments. Unrealized gains <strong>on</strong> transacti<strong>on</strong>s are eliminated to the extent of the Group’s interest in<br />
the investee.<br />
Under the equity method of accounting, the Group’s investments in associates and jointly c<strong>on</strong>trolled entities<br />
are initially recorded at cost, and subsequently increased (or decreased) to reflect both the Group’s pro-rata<br />
share of the post-acquisiti<strong>on</strong> net income (or loss) of the associate or jointly c<strong>on</strong>trolled entity and other movements<br />
included directly in the equity of the associate or jointly c<strong>on</strong>trolled entity. Goodwill arising <strong>on</strong> the acquisiti<strong>on</strong><br />
of an associate or a jointly c<strong>on</strong>trolled entity is included in the carrying value of the investment (net of<br />
any accumulated impairment loss). As goodwill is not reported separately it is not specifically tested for impairment.<br />
Rather, the entire equity method investment is tested for impairment.<br />
F - 16
At each balance sheet date, the Group assesses whether there is any objective evidence that the investment<br />
in an associate or jointly c<strong>on</strong>trolled entity is impaired. If there is objective evidence of an impairment, an<br />
impairment test is performed by comparing the investment’s recoverable amount, which is the higher of its<br />
value in use and fair value less costs to sell, with its carrying amount. An impairment loss recognized in prior<br />
periods is reversed <strong>on</strong>ly if there has been a change in the estimates used to determine the investment’s recoverable<br />
amount since the last impairment loss was recognized. If this is the case the carrying amount of the<br />
investment is increased to its higher recoverable amount. That increase is a reversal of an impairment loss.<br />
Equity method losses in excess of the Group’s carrying value of the investment in the entity are charged<br />
against other assets held by the Group related to the investee. If those assets are written down to zero, a<br />
determinati<strong>on</strong> is made whether to report additi<strong>on</strong>al losses based <strong>on</strong> the Group’s obligati<strong>on</strong> to fund such<br />
losses.<br />
Foreign Currency Translati<strong>on</strong><br />
The c<strong>on</strong>solidated financial statements are prepared in euros, which is the presentati<strong>on</strong> currency of the Group.<br />
Various entities in the Group use a different functi<strong>on</strong>al currency, being the currency of the primary ec<strong>on</strong>omic<br />
envir<strong>on</strong>ment in which the entity operates.<br />
An entity records foreign currency revenues, expenses, gains and losses in its functi<strong>on</strong>al currency using the<br />
exchange rates prevailing at the dates of recogniti<strong>on</strong>.<br />
M<strong>on</strong>etary assets and liabilities denominated in currencies other than the entity’s functi<strong>on</strong>al currency are trans-<br />
lated at the period end closing rate. Foreign exchange gains and losses resulting from the translati<strong>on</strong> and<br />
settlement of these items are recognized in the income statement as net gains (losses) <strong>on</strong> financial assets/<br />
liabilities at fair value through profit or loss.<br />
Translati<strong>on</strong> differences <strong>on</strong> n<strong>on</strong>-m<strong>on</strong>etary items classified as available for sale (for example, equity securities)<br />
are not recognized in the income statement but are included in net gains (losses) not recognized in the income<br />
statement within shareholders’ equity until the sale of the asset when they are transferred to the income statement<br />
as part of the overall gain or loss <strong>on</strong> sale of the item.<br />
F - 17
<strong>20</strong>-F Notes to the C<strong>on</strong>solidated Financial Statements<br />
For purposes of translati<strong>on</strong> into the presentati<strong>on</strong> currency, assets, liabilities and equity of foreign operati<strong>on</strong>s<br />
are translated at the period end closing rate, and items of income and expense are translated into euro at the<br />
rates prevailing <strong>on</strong> the dates of the transacti<strong>on</strong>s, or average rates of exchange where these approximate<br />
actual rates. The exchange differences arising <strong>on</strong> the translati<strong>on</strong> of a foreign operati<strong>on</strong> are included in net<br />
gains (losses) not recognized in the income statement within shareholders’ equity and subsequently included<br />
in the profit or loss <strong>on</strong> disposal or partial disposal of the operati<strong>on</strong>.<br />
Interest, Fees and Commissi<strong>on</strong>s<br />
Revenue is recognized when the amount of revenue and associated costs can be reliably measured, it is<br />
probable that ec<strong>on</strong>omic benefits associated with the transacti<strong>on</strong> will be realized, and the stage of completi<strong>on</strong><br />
of the transacti<strong>on</strong> can be reliably measured. This c<strong>on</strong>cept is applied to the key-revenue generating activities<br />
of the Group as follows.<br />
Net Interest Income – Interest from all interest-bearing assets and liabilities is recognized as net interest<br />
income using the effective interest method. The effective interest rate is a method of calculating the amortized<br />
cost of a financial asset or a financial liability and of allocating the interest income or expense over the relevant<br />
period using the estimated future cash flows. The estimated future cash flows used in this calculati<strong>on</strong><br />
include those determined by the c<strong>on</strong>tractual terms of the asset or liability, all fees that are c<strong>on</strong>sidered to be<br />
integral to the effective interest rate, direct and incremental transacti<strong>on</strong> costs, and all other premiums or discounts.<br />
Once an impairment loss has been recognized <strong>on</strong> a loan or available for sale debt security financial asset,<br />
although the accrual of interest in accordance with the c<strong>on</strong>tractual terms of the instrument is disc<strong>on</strong>tinued,<br />
interest income is recognized based <strong>on</strong> the rate of interest that was used to discount future cash flows for the<br />
purpose of measuring the impairment loss. For a loan this would be the original effective interest rate, but a<br />
new effective interest rate would be established each time an available for sale debt security is impaired as<br />
impairment is measured to fair value and would be based <strong>on</strong> a current market rate.<br />
When financial assets are reclassified from trading or available for sale to loans a new effective interest rate<br />
is established based <strong>on</strong> a best estimate of future expected cash flows.<br />
F - 18
Commissi<strong>on</strong> and Fee Income – The recogniti<strong>on</strong> of fee revenue (including commissi<strong>on</strong>s) is determined by the<br />
purpose for the fees and the basis of accounting for any associated financial instruments. If there is an asso-<br />
ciated financial instrument, fees that are an integral part of the effective interest rate of that financial instru-<br />
ment are included within the effective yield calculati<strong>on</strong>. However, if the financial instrument is carried at fair<br />
value through profit or loss, any associated fees are recognized in profit or loss when the instrument is initially<br />
recognized, provided there are no significant unobservable inputs used in determining its fair value. Fees<br />
earned from services that are provided over a specified service period are recognized over that service period.<br />
Fees earned for the completi<strong>on</strong> of a specific service or significant event are recognized when the service has<br />
been completed or the event has occurred.<br />
Loan commitment fees related to commitments that are not accounted for at fair value through profit or loss<br />
are recognized in commissi<strong>on</strong>s and fee income over the life of the commitment if it is unlikely that the Group<br />
will enter into a specific lending arrangement. If it is probable that the Group will enter into a specific lending<br />
arrangement, the loan commitment fee is deferred until the originati<strong>on</strong> of a loan and recognized as an adjustment<br />
to the loan’s effective interest rate.<br />
Performance-linked fees or fee comp<strong>on</strong>ents are recognized when the performance criteria are fulfilled.<br />
The following fee income is predominantly earned from services that are provided over a period of time:<br />
investment fund management fees, fiduciary fees, custodian fees, portfolio and other management and advisory<br />
fees, credit-related fees and commissi<strong>on</strong> income. Fees predominantly earned from providing transacti<strong>on</strong>type<br />
services include underwriting fees, corporate finance fees and brokerage fees.<br />
Arrangements involving multiple services or products – If the Group c<strong>on</strong>tracts to provide multiple products,<br />
services or rights to a counterparty, an evaluati<strong>on</strong> is made as to whether an overall fee should be allocated to<br />
the different comp<strong>on</strong>ents of the arrangement for revenue recogniti<strong>on</strong> purposes. Structured trades executed by<br />
the Group are the principal example of such arrangements and are assessed <strong>on</strong> a transacti<strong>on</strong> by transacti<strong>on</strong><br />
basis. The assessment c<strong>on</strong>siders the value of items or services delivered to ensure that the Group’s c<strong>on</strong>tinuing<br />
involvement in other aspects of the arrangement are not essential to the items delivered. It also assesses<br />
the value of items not yet delivered and, if there is a right of return <strong>on</strong> delivered items, the probability of future<br />
delivery of remaining items or services. If it is determined that it is appropriate to look at the arrangements as<br />
separate comp<strong>on</strong>ents, the amounts received are allocated based <strong>on</strong> the relative value of each comp<strong>on</strong>ent.<br />
If there is no objective and reliable evidence of the value of the delivered item or an individual item is required<br />
to be recognized at fair value then the residual method is used. The residual method calculates the amount to<br />
be recognized for the delivered comp<strong>on</strong>ent as being the amount remaining after allocating an appropriate<br />
amount of revenue to all other comp<strong>on</strong>ents.<br />
F - 19
<strong>20</strong>-F Notes to the C<strong>on</strong>solidated Financial Statements<br />
Financial Assets and Liabilities<br />
The Group classifies its financial assets and liabilities into the following categories: financial assets and liabilities<br />
at fair value through profit or loss, loans, financial assets available for sale (“AFS”) and other financial<br />
liabilities. The Group does not classify any financial instruments under the held-to-maturity category. Appropriate<br />
classificati<strong>on</strong> of financial assets and liabilities is determined at the time of initial recogniti<strong>on</strong> or when<br />
reclassified in the balance sheet.<br />
Financial instruments classified at fair value through profit or loss and financial assets classified as AFS are<br />
recognized <strong>on</strong> trade date, which is the date <strong>on</strong> which the Group commits to purchase or sell the asset or issue<br />
or repurchase the financial liability. All other financial instruments are recognized <strong>on</strong> a settlement date basis.<br />
Financial Assets and Liabilities at Fair Value through Profit or Loss<br />
The Group classifies certain financial assets and financial liabilities as either held for trading or designated at<br />
fair value through profit or loss. They are carried at fair value and presented as financial assets at fair value<br />
through profit or loss and financial liabilities at fair value through profit or loss, respectively. Related realized<br />
and unrealized gains and losses are included in net gains (losses) <strong>on</strong> financial assets/liabilities at fair value<br />
through profit or loss. Interest <strong>on</strong> interest earning assets such as trading loans and debt securities and divi-<br />
dends <strong>on</strong> equity instruments are presented in interest and similar income for financial instruments at fair value<br />
through profit or loss.<br />
Trading Assets and Liabilities – Financial instruments are classified as held for trading if they have been originated,<br />
acquired or incurred principally for the purpose of selling or repurchasing them in the near term, or<br />
they form part of a portfolio of identified financial instruments that are managed together and for which there<br />
is evidence of a recent actual pattern of short-term profit-taking.<br />
F - <strong>20</strong>
Financial Instruments Designated at Fair Value through Profit or Loss – Certain financial assets and liabilities<br />
that do not meet the definiti<strong>on</strong> of trading assets and liabilities are designated at fair value through profit or<br />
loss using the fair value opti<strong>on</strong>. To be designated at fair value through profit or loss, financial assets and liabilities<br />
must meet <strong>on</strong>e of the following criteria: (1) the designati<strong>on</strong> eliminates or significantly reduces a measurement<br />
or recogniti<strong>on</strong> inc<strong>on</strong>sistency; (2) a group of financial assets or liabilities or both is managed and its<br />
performance is evaluated <strong>on</strong> a fair value basis in accordance with a documented risk management or investment<br />
strategy; or (3) the instrument c<strong>on</strong>tains <strong>on</strong>e or more embedded derivatives unless: (a) the embedded<br />
derivative does not significantly modify the cash flows that otherwise would be required by the c<strong>on</strong>tract;<br />
or (b) it is clear with little or no analysis that separati<strong>on</strong> is prohibited. In additi<strong>on</strong>, the Group allows the fair<br />
value opti<strong>on</strong> to be designated <strong>on</strong>ly for those financial instruments for which a reliable estimate of fair value<br />
can be obtained.<br />
Loan Commitments<br />
Certain loan commitments are designated at fair value through profit or loss under the fair value opti<strong>on</strong>. As<br />
indicated under the discussi<strong>on</strong> of ‘Derivatives and Hedge Accounting’, some loan commitments are classified<br />
as financial liabilities at fair value through profit or loss. All other loan commitments remain off-balance sheet.<br />
Therefore, the Group does not recognize and measure changes in fair value of these off-balance sheet loan<br />
commitments that result from changes in market interest rates or credit spreads. However, as specified in the<br />
discussi<strong>on</strong> “Impairment of loans and provisi<strong>on</strong> for off-balance sheet positi<strong>on</strong>s” below, these off-balance sheet<br />
loan commitments are assessed for impairment individually and, where appropriate, collectively.<br />
Loans<br />
Loans include originated and purchased n<strong>on</strong>-derivative financial assets with fixed or determinable payments<br />
that are not quoted in an active market and which are not classified as financial assets at fair value through<br />
profit or loss or financial assets available for sale. An active market exists when quoted prices are readily and<br />
regularly available from an exchange, dealer, broker, industry group, pricing service or regulatory agency<br />
and those prices represent actual and regularly occurring market transacti<strong>on</strong>s <strong>on</strong> an arm’s length basis.<br />
Loans are initially recognized at fair value. When the loan is issued at a market rate, fair value is represented<br />
by the cash advanced to the borrower plus the net of direct and incremental transacti<strong>on</strong> costs and fees. They<br />
are subsequently measured at amortized cost using the effective interest method less impairment.<br />
F - 21
<strong>20</strong>-F Notes to the C<strong>on</strong>solidated Financial Statements<br />
Financial Assets Classified as Available for Sale<br />
Financial assets that are not classified as at fair value through profit or loss or as loans are classified as AFS.<br />
A financial asset classified as AFS is initially recognized at its fair value plus transacti<strong>on</strong> costs that are directly<br />
attributable to the acquisiti<strong>on</strong> of the financial asset. The amortizati<strong>on</strong> of premiums and accreti<strong>on</strong> of discount<br />
are recorded in net interest income. Financial assets classified as AFS are carried at fair value with the<br />
changes in fair value reported in equity, in net gains (losses) not recognized in the income statement, unless<br />
the asset is subject to a fair value hedge, in which case changes in fair value resulting from the risk being<br />
hedged are recorded in other income. For m<strong>on</strong>etary financial assets classified as AFS (for example, debt<br />
instruments), changes in carrying amounts relating to changes in foreign exchange rate are recognized in the<br />
income statement and other changes in carrying amount are recognized in equity as indicated above. For<br />
financial assets classified as AFS that are not m<strong>on</strong>etary items (for example, equity instruments), the gain or<br />
loss that is recognized in equity includes any related foreign exchange comp<strong>on</strong>ent.<br />
Financial assets classified as AFS are assessed for impairment as discussed in the secti<strong>on</strong> of this Note<br />
“Impairment of financial assets classified as Available for Sale”. Realized gains and losses are reported in net<br />
gains (losses) <strong>on</strong> financial assets available for sale. Generally, the weighted-average cost method is used to<br />
determine the cost of financial assets. Gains and losses recorded in equity are transferred to the income<br />
statement <strong>on</strong> disposal of an available for sale asset and reported in net gains (losses) <strong>on</strong> financial assets<br />
available for sale.<br />
Financial Liabilities<br />
Except for financial liabilities at fair value through profit or loss, financial liabilities are measured at amortized<br />
cost using the effective interest rate method.<br />
Financial liabilities include l<strong>on</strong>g-term and short-term debt issued which are initially measured at fair value,<br />
which is the c<strong>on</strong>siderati<strong>on</strong> received, net of transacti<strong>on</strong> costs incurred. Repurchases of issued debt in the market<br />
are treated as extinguishments and any related gain or loss is recorded in the c<strong>on</strong>solidated statement of<br />
income. A subsequent sale of own b<strong>on</strong>ds in the market is treated as a reissuance of debt.<br />
F - 22
Reclassificati<strong>on</strong> of Financial Assets<br />
The Group may reclassify certain financial assets out of the financial assets at fair value through profit or loss<br />
classificati<strong>on</strong> (trading assets) and the available for sale classificati<strong>on</strong> into the loans classificati<strong>on</strong>. For assets<br />
to be reclassified there must be a clear change in management intent with respect to the assets since initial<br />
recogniti<strong>on</strong> and the financial asset must meet the definiti<strong>on</strong> of a loan at the reclassificati<strong>on</strong> date. Additi<strong>on</strong>ally,<br />
there must be an intent and ability to hold the asset for the foreseeable future at the reclassificati<strong>on</strong> date.<br />
There is no single specific period that defines foreseeable future. Rather, it is a matter requiring management<br />
judgment. In exercising this judgment, the Group established the following minimum guideline for what c<strong>on</strong>stitutes<br />
foreseeable future. At the time of reclassificati<strong>on</strong>, there must be:<br />
— no intent to dispose of the asset through sale or securitizati<strong>on</strong> within <strong>on</strong>e year and no internal or external<br />
requirement that would restrict the Group’s ability to hold or require sale; and<br />
— the business plan going forward should not be to profit from short-term movements in price.<br />
Financial assets proposed for reclassificati<strong>on</strong> which meet these criteria are c<strong>on</strong>sidered based <strong>on</strong> the facts and<br />
circumstances of each financial asset under c<strong>on</strong>siderati<strong>on</strong>. A positive management asserti<strong>on</strong> is required after<br />
taking into account the ability and plausibility to execute the strategy to hold.<br />
In additi<strong>on</strong> to the above criteria the Group also requires that persuasive evidence exists to assert that the<br />
expected repayment of the asset exceeds the estimated fair value and the returns <strong>on</strong> the asset will be optimized<br />
by holding it for the foreseeable future.<br />
Financial assets are reclassified at their fair value at the reclassificati<strong>on</strong> date. Any gain or loss already recog-<br />
nized in the income statement is not reversed. The fair value of the instrument at reclassificati<strong>on</strong> date<br />
becomes the new amortized cost of the instrument. The expected cash flows <strong>on</strong> the financial instruments are<br />
estimated at the reclassificati<strong>on</strong> date and these estimates are used to calculate a new effective interest rate<br />
for the instruments. If there is a subsequent increase in expected future cash flows <strong>on</strong> reclassified assets as a<br />
result of increased recoverability, the effect of that increase is recognized as an adjustment to the effective<br />
interest rate from the date of the change in estimate rather than as an adjustment to the carrying amount of<br />
the asset at the date of the change in estimate. If there is a subsequent decrease in expected future cash<br />
flows the asset would be assessed for impairment as discussed in the secti<strong>on</strong> of this Note “Impairment of<br />
Loans and Provisi<strong>on</strong> for Off-Balance Sheet Positi<strong>on</strong>s”. Any change in the timing of the cash flows of reclassi-<br />
fied assets which are not deemed impaired are recorded as an adjustment to the carrying amount of the<br />
asset.<br />
F - 23
<strong>20</strong>-F Notes to the C<strong>on</strong>solidated Financial Statements<br />
For instruments reclassified from available for sale to loans and receivables any unrealized gain or loss<br />
recognized in shareholders’ equity is subsequently amortized into interest income using the effective interest<br />
rate of the instrument. If the instrument is subsequently impaired any unrealized loss which is held in shareholders’<br />
equity for that instrument at that date is immediately recognized in the income statement as a loan<br />
loss provisi<strong>on</strong>.<br />
To the extent that assets categorized as loans are repaid, restructured or eventually sold and the amount<br />
received is less than the carrying value at that time, then a loss would be recognized.<br />
Determinati<strong>on</strong> of Fair Value<br />
Fair value is defined as the price at which an asset or liability could be exchanged in a current transacti<strong>on</strong><br />
between knowledgeable, willing parties, other than in a forced or liquidati<strong>on</strong> sale. The fair value of instruments<br />
that are quoted in active markets is determined using the quoted prices where they represent those at which<br />
regularly and recently occurring transacti<strong>on</strong>s take place. The Group uses valuati<strong>on</strong> techniques to establish the<br />
fair value of instruments where prices quoted in active markets are not available. Therefore, where possible,<br />
parameter inputs to the valuati<strong>on</strong> techniques are based <strong>on</strong> observable data derived from prices of relevant<br />
instruments traded in an active market. These valuati<strong>on</strong> techniques involve some level of management estimati<strong>on</strong><br />
and judgment, the degree of which will depend <strong>on</strong> the price transparency for the instrument or market<br />
and the instrument’s complexity. Refer to Note [2] Critical Accounting Estimates – Fair Value Estimates –<br />
Methods of Determining Fair Value for further discussi<strong>on</strong> of the accounting estimates and judgments required<br />
in the determinati<strong>on</strong> of fair value.<br />
Recogniti<strong>on</strong> of Trade Date Profit<br />
If there are significant unobservable inputs used in the valuati<strong>on</strong> technique, the financial instrument is recognized<br />
at the transacti<strong>on</strong> price and any profit implied from the valuati<strong>on</strong> technique at trade date is deferred.<br />
Using systematic methods, the deferred amount is recognized over the period between trade date and the<br />
date when the market is expected to become observable, or over the life of the trade (whichever is shorter).<br />
Such methodology is used because it reflects the changing ec<strong>on</strong>omic and risk profile of the instrument as the<br />
market develops or as the instrument itself progresses to maturity. Any remaining trade date deferred profit is<br />
recognized in the income statement when the transacti<strong>on</strong> becomes observable or the Group enters into offsetting<br />
transacti<strong>on</strong>s that substantially eliminate the instrument’s risk. In the rare circumstances that a trade<br />
date loss arises, it would be recognized at incepti<strong>on</strong> of the transacti<strong>on</strong> to the extent that it is probable that a<br />
loss has been incurred and a reliable estimate of the loss amount can be made. Refer to Note [2] Critical<br />
Accounting Estimates – Fair Value Estimates – Methods of Determining Fair Value for further discussi<strong>on</strong> of<br />
the estimates and judgments required in assessing observability of inputs and risk mitigati<strong>on</strong>.<br />
F - 24
Derivatives and Hedge Accounting<br />
Derivatives are used to manage exposures to interest rate, foreign currency, credit and other market price<br />
risks, including exposures arising from forecast transacti<strong>on</strong>s. All freestanding c<strong>on</strong>tracts that are c<strong>on</strong>sidered<br />
derivatives for accounting purposes are carried at fair value <strong>on</strong> the balance sheet regardless of whether they<br />
are held for trading or n<strong>on</strong>trading purposes.<br />
Gains and losses <strong>on</strong> derivatives held for trading are included in net gains (losses) <strong>on</strong> financial assets/<br />
liabilities at fair value through profit or loss.<br />
The Group makes commitments to originate loans it intends to sell. Such positi<strong>on</strong>s are classified as financial<br />
assets/liabilities at fair value through profit or loss, and related gains and losses are included in net gains<br />
(losses) <strong>on</strong> financial assets/liabilities at fair value through profit or loss. Loan commitments that can be settled<br />
net in cash or by delivering or issuing another financial instrument are classified as derivatives. Market value<br />
guarantees provided <strong>on</strong> specific mutual fund products offered by the Group are also accounted for as derivatives<br />
and carried at fair value, with changes in fair value recorded in net gains (losses) <strong>on</strong> financial assets/<br />
liabilities at fair value through profit or loss.<br />
Certain derivatives entered into for n<strong>on</strong>trading purposes, which do not qualify for hedge accounting but are<br />
otherwise effective in offsetting the effect of transacti<strong>on</strong>s <strong>on</strong> n<strong>on</strong>interest income and expenses, are recorded<br />
in other assets or other liabilities with both realized and unrealized changes in fair value recorded in the same<br />
n<strong>on</strong>interest income and expense capti<strong>on</strong>s as those affected by the transacti<strong>on</strong> being offset. The changes in<br />
fair value of all other derivatives not qualifying for hedge accounting are recorded in net gains and losses <strong>on</strong><br />
financial assets/liabilities at fair value through profit or loss.<br />
Embedded Derivatives<br />
Some hybrid c<strong>on</strong>tracts c<strong>on</strong>tain both a derivative and a n<strong>on</strong>-derivative comp<strong>on</strong>ent. In such cases, the derivative<br />
comp<strong>on</strong>ent is termed an embedded derivative, with the n<strong>on</strong>-derivative comp<strong>on</strong>ent representing the host<br />
c<strong>on</strong>tract. If the ec<strong>on</strong>omic characteristics and risks of embedded derivatives are not closely related to those of<br />
the host c<strong>on</strong>tract, and the hybrid c<strong>on</strong>tract itself is not carried at fair value through profit or loss, the embedded<br />
derivative is bifurcated and reported at fair value, with gains and losses recognized in net gains (losses) <strong>on</strong><br />
financial assets/liabilities at fair value through profit or loss. The host c<strong>on</strong>tract will c<strong>on</strong>tinue to be accounted<br />
for in accordance with the appropriate accounting standard. The carrying amount of an embedded derivative<br />
is reported in the same c<strong>on</strong>solidated balance sheet line item as the host c<strong>on</strong>tract. Certain hybrid instruments<br />
have been designated at fair value through profit or loss using the fair value opti<strong>on</strong>.<br />
F - 25
<strong>20</strong>-F Notes to the C<strong>on</strong>solidated Financial Statements<br />
Hedge Accounting<br />
If derivatives are held for risk management purposes and the transacti<strong>on</strong>s meet specific criteria, the Group<br />
applies hedge accounting. For accounting purposes there are three possible types of hedges: (1) hedges of<br />
changes in the fair value of assets, liabilities or unrecognized firm commitments (fair value hedges);<br />
(2) hedges of the variability of future cash flows from highly probable forecast transacti<strong>on</strong>s and floating rate<br />
assets and liabilities (cash flow hedges); and (3) hedges of the translati<strong>on</strong> adjustments resulting from translating<br />
the functi<strong>on</strong>al currency financial statements of foreign operati<strong>on</strong>s into the presentati<strong>on</strong> currency of the<br />
parent (hedges of net investments in foreign operati<strong>on</strong>s).<br />
When hedge accounting is applied, the Group designates and documents the relati<strong>on</strong>ship between the hedging<br />
instrument and the hedged item as well as its risk management objective and strategy for undertaking the<br />
hedging transacti<strong>on</strong>s, and the nature of the risk being hedged. This documentati<strong>on</strong> includes a descripti<strong>on</strong> of<br />
how the Group will assess the hedging instrument’s effectiveness in offsetting the exposure to changes in the<br />
hedged item’s fair value or cash flows attributable to the hedged risk. Hedge effectiveness is assessed at<br />
incepti<strong>on</strong> and throughout the term of each hedging relati<strong>on</strong>ship. Hedge effectiveness is always calculated,<br />
even when the terms of the derivative and hedged item are matched.<br />
Hedging derivatives are reported as other assets and other liabilities. In the event that any derivative is sub-<br />
sequently de-designated as a hedging derivative, it is transferred to financial assets/liabilities at fair value<br />
through profit or loss. Subsequent changes in fair value are recognized in net gains (losses) <strong>on</strong> financial<br />
assets/liabilities at fair value through profit or loss.<br />
For hedges of changes in fair value, the changes in the fair value of the hedged asset, liability or unrecog-<br />
nized firm commitment, or a porti<strong>on</strong> thereof, attributable to the risk being hedged are recognized in the income<br />
statement al<strong>on</strong>g with changes in the entire fair value of the derivative. When hedging interest rate risk, any<br />
interest accrued or paid <strong>on</strong> both the derivative and the hedged item is reported in interest income or expense<br />
and the unrealized gains and losses from the hedge accounting fair value adjustments are reported in other<br />
income. When hedging the foreign exchange risk of an available for sale security, the fair value adjustments<br />
related to the security’s foreign exchange exposures are also recorded in other income. Hedge ineffectiveness<br />
is reported in other income and is measured as the net effect of changes in the fair value of the hedging<br />
instrument and changes in the fair value of the hedged item arising from changes in the market rate or price<br />
related to the risk(s) being hedged.<br />
F - 26
If a fair value hedge of a debt instrument is disc<strong>on</strong>tinued prior to the instrument’s maturity because the deriva-<br />
tive is terminated or the relati<strong>on</strong>ship is de-designated, any remaining interest rate-related fair value adjust-<br />
ments made to the carrying amount of the debt instrument (basis adjustments) are amortized to interest<br />
income or expense over the remaining term of the original hedging relati<strong>on</strong>ship. For other types of fair value<br />
adjustments and whenever a fair value hedged asset or liability is sold or otherwise derecognized any basis<br />
adjustments are included in the calculati<strong>on</strong> of the gain or loss <strong>on</strong> derecogniti<strong>on</strong>.<br />
For hedges of variability in future cash flows, there is no change to the accounting for the hedged item and<br />
the derivative is carried at fair value, with changes in value reported initially in net gains (losses) not recognized<br />
in the income statement to the extent the hedge is effective. These amounts initially recorded in net<br />
gains (losses) not recognized in the income statement are subsequently reclassified into the income statement<br />
in the same periods during which the forecast transacti<strong>on</strong> affects the income statement. Thus, for<br />
hedges of interest rate risk, the amounts are amortized into interest income or expense at the same time as<br />
the interest is accrued <strong>on</strong> the hedged transacti<strong>on</strong>.<br />
Hedge ineffectiveness is recorded in other income and is measured as changes in the excess (if any) in the<br />
absolute cumulative change in fair value of the actual hedging derivative over the absolute cumulative change<br />
in the fair value of the hypothetically perfect hedge.<br />
When hedges of variability in cash flows attributable to interest rate risk are disc<strong>on</strong>tinued, amounts remaining<br />
in net gains (losses) not recognized in the income statement are amortized to interest income or expense<br />
over the remaining life of the original hedge relati<strong>on</strong>ship, unless the hedged transacti<strong>on</strong> is no l<strong>on</strong>ger expected<br />
to occur in which case the amount will be reclassified into other income immediately. When hedges of variability<br />
in cash flows attributable to other risks are disc<strong>on</strong>tinued, the related amounts in net gains (losses) not<br />
recognized in the income statement are reclassified into either the same income statement capti<strong>on</strong> and period<br />
as profit or loss from the forecasted transacti<strong>on</strong>, or into other income when the forecast transacti<strong>on</strong> is no<br />
l<strong>on</strong>ger expected to occur.<br />
F - 27
<strong>20</strong>-F Notes to the C<strong>on</strong>solidated Financial Statements<br />
For hedges of the translati<strong>on</strong> adjustments resulting from translating the functi<strong>on</strong>al currency financial statements<br />
of foreign operati<strong>on</strong>s (hedges of net investments in foreign operati<strong>on</strong>s) into the presentati<strong>on</strong> currency<br />
of the parent, the porti<strong>on</strong> of the change in fair value of the derivative due to changes in the spot foreign<br />
exchange rates is recorded as a foreign currency translati<strong>on</strong> adjustment in net gains (losses) not recognized<br />
in the income statement to the extent the hedge is effective; the remainder is recorded as other income in the<br />
income statement.<br />
Gains or losses <strong>on</strong> the hedging instrument relating to the effective porti<strong>on</strong> of the hedge are recognized in<br />
profit or loss <strong>on</strong> disposal of the foreign operati<strong>on</strong>s.<br />
Impairment of Financial Assets<br />
At each balance sheet date, the Group assesses whether there is objective evidence that a financial asset or<br />
a group of financial assets is impaired. A financial asset or group of financial assets is impaired and impairment<br />
losses are incurred if:<br />
— there is objective evidence of impairment as a result of a loss event that occurred after the initial recogni-<br />
ti<strong>on</strong> of the asset and up to the balance sheet date (“a loss event”);<br />
— the loss event had an impact <strong>on</strong> the estimated future cash flows of the financial asset or the group of<br />
financial assets and<br />
— a reliable estimate of the loss amount can be made.<br />
Impairment of Loans and Provisi<strong>on</strong> for Off-Balance Sheet Positi<strong>on</strong>s<br />
The Group first assesses whether objective evidence of impairment exists individually for loans that are individually<br />
significant. It then assesses collectively for loans that are not individually significant and loans which<br />
are significant but for which there is no objective evidence of impairment under the individual assessment.<br />
To allow management to determine whether a loss event has occurred <strong>on</strong> an individual basis, all significant<br />
counterparty relati<strong>on</strong>ships are reviewed periodically. This evaluati<strong>on</strong> c<strong>on</strong>siders current informati<strong>on</strong> and events<br />
related to the counterparty, such as the counterparty experiencing significant financial difficulty or a breach of<br />
c<strong>on</strong>tract, for example, default or delinquency in interest or principal payments.<br />
F - 28
If there is evidence of impairment leading to an impairment loss for an individual counterparty relati<strong>on</strong>ship,<br />
then the amount of the loss is determined as the difference between the carrying amount of the loan(s),<br />
including accrued interest, and the present value of expected future cash flows discounted at the loan’s original<br />
effective interest rate or the effective interest rate established up<strong>on</strong> reclassificati<strong>on</strong> to loans, including cash<br />
flows that may result from foreclosure less costs for obtaining and selling the collateral. The carrying amount<br />
of the loans is reduced by the use of an allowance account and the amount of the loss is recognized in the<br />
income statement as a comp<strong>on</strong>ent of the provisi<strong>on</strong> for credit losses.<br />
The collective assessment of impairment is principally to establish an allowance amount relating to loans that<br />
are either individually significant but for which there is no objective evidence of impairment, or are not individually<br />
significant but for which there is, <strong>on</strong> a portfolio basis, a loss amount that is probable of having occurred<br />
and is reas<strong>on</strong>ably estimable. The loss amount has three comp<strong>on</strong>ents. The first comp<strong>on</strong>ent is an amount for<br />
transfer and currency c<strong>on</strong>vertibility risks for loan exposures in countries where there are serious doubts about<br />
the ability of counterparties to comply with the repayment terms due to the ec<strong>on</strong>omic or political situati<strong>on</strong><br />
prevailing in the respective country of domicile. This amount is calculated using ratings for country risk and<br />
transfer risk which are established and regularly reviewed for each country in which the Group does business.<br />
The sec<strong>on</strong>d comp<strong>on</strong>ent is an allowance amount representing the incurred losses <strong>on</strong> the portfolio of smallerbalance<br />
homogeneous loans, which are loans to individuals and small business customers of the private and<br />
retail business. The loans are grouped according to similar credit risk characteristics and the allowance for<br />
each group is determined using statistical models based <strong>on</strong> historical experience. The third comp<strong>on</strong>ent<br />
represents an estimate of incurred losses inherent in the group of loans that have not yet been individually<br />
identified or measured as part of the smaller-balance homogeneous loans. Loans that were found not to be<br />
impaired when evaluated <strong>on</strong> an individual basis are included in the scope of this comp<strong>on</strong>ent of the allowance.<br />
Once a loan is identified as impaired, although the accrual of interest in accordance with the c<strong>on</strong>tractual terms<br />
of the loan is disc<strong>on</strong>tinued, the accreti<strong>on</strong> of the net present value of the written down amount of the loan due<br />
to the passage of time is recognized as interest income based <strong>on</strong> the original effective interest rate of the<br />
loan.<br />
F - 29
<strong>20</strong>-F Notes to the C<strong>on</strong>solidated Financial Statements<br />
At each balance sheet date, all impaired loans are reviewed for changes to the present value of expected<br />
future cash flows discounted at the loan’s original effective interest rate. Any change to the previously recognized<br />
impairment loss is recognized as a change to the allowance account and recorded in the income statement<br />
as a comp<strong>on</strong>ent of the provisi<strong>on</strong> for credit losses.<br />
When it is c<strong>on</strong>sidered that there is no realistic prospect of recovery and all collateral has been realized or<br />
transferred to the Group, the loan and any associated allowance is written off. Subsequent recoveries, if any,<br />
are credited to the allowance account and recorded in the income statement as a comp<strong>on</strong>ent of the provisi<strong>on</strong><br />
for credit losses.<br />
The process to determine the provisi<strong>on</strong> for off-balance sheet positi<strong>on</strong>s is similar to the methodology used for<br />
loans. Any loss amounts are recognized as an allowance in the balance sheet within other liabilities and<br />
charged to the income statement as a comp<strong>on</strong>ent of the provisi<strong>on</strong> for credit losses.<br />
If in a subsequent period the amount of a previously recognized impairment loss decreases and the decrease<br />
is due to an event occurring after the impairment was recognized, the impairment loss is reversed by reducing<br />
the allowance account accordingly. Such reversal is recognized in profit or loss.<br />
Impairment of Financial Assets Classified as Available for Sale<br />
For financial assets classified as AFS, management assesses at each balance sheet date whether there is<br />
objective evidence that an individual asset is impaired.<br />
In the case of equity investments classified as AFS, objective evidence includes a significant or prol<strong>on</strong>ged<br />
decline in the fair value of the investment below cost. In the case of debt securities classified as AFS, impair-<br />
ment is assessed based <strong>on</strong> the same criteria as for loans.<br />
If there is evidence of impairment, any amounts previously recognized in equity, in net gains (losses) not<br />
recognized in the income statement, is removed from equity and recognized in the income statement for the<br />
period, reported in net gains (losses) <strong>on</strong> financial assets available for sale. This amount is determined as<br />
the difference between the acquisiti<strong>on</strong> cost (net of any principal repayments and amortizati<strong>on</strong>) and current<br />
fair value of the asset less any impairment loss <strong>on</strong> that investment previously recognized in the income<br />
statement.<br />
F - 30
When an AFS debt security is impaired, subsequent measurement is <strong>on</strong> a fair value basis with changes<br />
reported in the income statement. When the fair value of the AFS debt security recovers to at least amortized<br />
cost it is no l<strong>on</strong>ger c<strong>on</strong>sidered impaired and subsequent changes in fair value are reported in equity.<br />
Reversals of impairment losses <strong>on</strong> equity investments classified as AFS are not reversed through the income<br />
statement; increases in their fair value after impairment are recognized in equity.<br />
Derecogniti<strong>on</strong> of Financial Assets and Liabilities<br />
Financial Asset Derecogniti<strong>on</strong><br />
A financial asset is c<strong>on</strong>sidered for derecogniti<strong>on</strong> when the c<strong>on</strong>tractual rights to the cash flows from the financial<br />
asset expire, or the Group has either transferred the c<strong>on</strong>tractual right to receive the cash flows from that<br />
asset, or has assumed an obligati<strong>on</strong> to pay those cash flows to <strong>on</strong>e or more recipients, subject to certain<br />
criteria.<br />
The Group derecognizes a transferred financial asset if it transfers substantially all the risks and rewards of<br />
ownership.<br />
The Group enters into transacti<strong>on</strong>s in which it transfers previously recognized financial assets but retains<br />
substantially all the associated risks and rewards of those assets; for example, a sale to a third party in which<br />
the Group enters into a c<strong>on</strong>current total return swap with the same counterparty. These types of transacti<strong>on</strong>s<br />
are accounted for as secured financing transacti<strong>on</strong>s.<br />
In transacti<strong>on</strong>s in which substantially all the risks and rewards of ownership of a financial asset are neither<br />
retained nor transferred, the Group derecognizes the transferred asset if c<strong>on</strong>trol over that asset, i.e. the practical<br />
ability to sell the transferred asset, is relinquished. The rights and obligati<strong>on</strong>s retained in the transfer are<br />
recognized separately as assets and liabilities, as appropriate. If c<strong>on</strong>trol over the asset is retained, the Group<br />
c<strong>on</strong>tinues to recognize the asset to the extent of its c<strong>on</strong>tinuing involvement, which is determined by the extent<br />
to which it remains exposed to changes in the value of the transferred asset.<br />
F - 31
<strong>20</strong>-F Notes to the C<strong>on</strong>solidated Financial Statements<br />
The derecogniti<strong>on</strong> criteria are also applied to the transfer of part of an asset, rather than the asset as a whole,<br />
or to a group of similar financial assets in their entirety, when applicable. If transferring a part of an asset,<br />
such part must be a specifically identified cash flow, a fully proporti<strong>on</strong>ate share of the asset, or a fully proporti<strong>on</strong>ate<br />
share of a specifically-identified cash flow.<br />
Securitizati<strong>on</strong><br />
The Group securitizes various c<strong>on</strong>sumer and commercial financial assets, which is achieved via the sale of<br />
these assets to an SPE, which in turn issues securities to investors. The transferred assets may qualify for<br />
derecogniti<strong>on</strong> in full or in part, under the policy <strong>on</strong> derecogniti<strong>on</strong> of financial assets. Synthetic securitizati<strong>on</strong><br />
structures typically involve derivative financial instruments for which the policies in the “Derivatives and<br />
Hedge Accounting” secti<strong>on</strong> would apply. Those transfers that do not qualify for derecogniti<strong>on</strong> may be reported<br />
as secured financing or result in the recogniti<strong>on</strong> of c<strong>on</strong>tinuing involvement liabilities. The investors and the<br />
securitizati<strong>on</strong> vehicles generally have no recourse to the Group’s other assets in cases where the issuers of<br />
the financial assets fail to perform under the original terms of those assets.<br />
Interests in the securitized financial assets may be retained in the form of senior or subordinated tranches,<br />
interest <strong>on</strong>ly strips or other residual interests (collectively referred to as ‘retained interests’). Provided the<br />
Group’s retained interests do not result in c<strong>on</strong>solidati<strong>on</strong> of an SPE, nor in c<strong>on</strong>tinued recogniti<strong>on</strong> of the transferred<br />
assets, these interests are typically recorded in financial assets at fair value through profit or loss and<br />
carried at fair value. C<strong>on</strong>sistent with the valuati<strong>on</strong> of similar financial instruments, fair value of retained<br />
tranches or the financial assets is initially and subsequently determined using market price quotati<strong>on</strong>s where<br />
available or internal pricing models that utilize variables such as yield curves, prepayment speeds, default<br />
rates, loss severity, interest rate volatilities and spreads. The assumpti<strong>on</strong>s used for pricing are based <strong>on</strong><br />
observable transacti<strong>on</strong>s in similar securities and are verified by external pricing sources, where available.<br />
Gains or losses <strong>on</strong> securitizati<strong>on</strong> depend in part <strong>on</strong> the carrying amount of the transferred financial assets,<br />
allocated between the financial assets derecognized and the retained interests based <strong>on</strong> their relative fair<br />
values at the date of the transfer.<br />
F - 32
Derecogniti<strong>on</strong> of Financial Liabilities<br />
A financial liability is derecognized when the obligati<strong>on</strong> under the liability is discharged or canceled or expires.<br />
If an existing financial liability is replaced by another from the same lender <strong>on</strong> substantially different terms, or<br />
the terms of the existing liability are substantially modified, such an exchange or modificati<strong>on</strong> is treated as a<br />
derecogniti<strong>on</strong> of the original liability and the recogniti<strong>on</strong> of a new liability, and the difference in the respective<br />
carrying amounts is recognized in the income statement.<br />
Repurchase and Reverse Repurchase Agreements<br />
Securities purchased under resale agreements (“reverse repurchase agreements”) and securities sold under<br />
agreements to repurchase (“repurchase agreements”) are treated as collateralized financings and are recognized<br />
initially at fair value, being the amount of cash disbursed and received, respectively. The party disbursing<br />
the cash takes possessi<strong>on</strong> of the securities serving as collateral for the financing and having a market<br />
value equal to, or in excess of the principal amount loaned. The securities received under reverse repurchase<br />
agreements and securities delivered under repurchase agreements are not recognized <strong>on</strong>, or derecognized<br />
from, the balance sheet, unless the risks and rewards of ownership are obtained or relinquished.<br />
The Group has chosen to apply the fair value opti<strong>on</strong> to certain repurchase and reverse repurchase portfolios<br />
that are managed <strong>on</strong> a fair value basis.<br />
Interest earned <strong>on</strong> reverse repurchase agreements and interest incurred <strong>on</strong> repurchase agreements is reported<br />
as interest income and interest expense, respectively.<br />
Securities Borrowed and Securities Loaned<br />
Securities borrowed transacti<strong>on</strong>s generally require the Group to deposit cash with the securities lender. In a<br />
securities loaned transacti<strong>on</strong>, the Group generally receives either cash collateral, in an amount equal to or in<br />
excess of the market value of securities loaned, or securities. The Group m<strong>on</strong>itors the fair value of securities<br />
borrowed and securities loaned and additi<strong>on</strong>al collateral is disbursed or obtained, if necessary.<br />
The amount of cash advanced or received is recorded as securities borrowed and securities loaned, respec-<br />
tively.<br />
The securities borrowed are not themselves recognized in the financial statements. If they are sold to third<br />
parties, the obligati<strong>on</strong> to return the securities is recorded as a financial liability at fair value through profit or<br />
loss and any subsequent gain or loss is included in the income statement in net gain (loss) <strong>on</strong> financial<br />
assets/liabilities at fair value through profit or loss. Securities lent to counterparties are also retained <strong>on</strong> the<br />
balance sheet.<br />
F - 33
<strong>20</strong>-F Notes to the C<strong>on</strong>solidated Financial Statements<br />
Fees received or paid are reported in interest income and interest expense, respectively. Securities owned<br />
and pledged as collateral under securities lending agreements in which the counterparty has the right by<br />
c<strong>on</strong>tract or custom to sell or repledge the collateral are disclosed as such <strong>on</strong> the face of the c<strong>on</strong>solidated<br />
balance sheet.<br />
Offsetting Financial Instruments<br />
Financial assets and liabilities are offset, with the net amount presented in the balance sheet, <strong>on</strong>ly if the<br />
Group holds a currently enforceable legal right to set off the recognized amounts, and there is an intenti<strong>on</strong> to<br />
settle <strong>on</strong> a net basis or to realize an asset and settle the liability simultaneously. In all other situati<strong>on</strong>s they<br />
are presented gross. When financial assets and financial liabilities are offset in the balance sheet, the associated<br />
income and expense items will also be offset in the income statement, unless specifically prohibited by<br />
an applicable accounting standard.<br />
Property and Equipment<br />
Property and equipment includes own-use properties, leasehold improvements, furniture and equipment and<br />
software (operating systems <strong>on</strong>ly). Own-use properties are carried at cost less accumulated depreciati<strong>on</strong> and<br />
accumulated impairment losses. Depreciati<strong>on</strong> is generally recognized using the straight-line method over the<br />
estimated useful lives of the assets. The range of estimated useful lives is 25 to 50 years for property and 3 to<br />
10 years for furniture and equipment. Leasehold improvements are capitalized and subsequently depreciated<br />
<strong>on</strong> a straight-line basis over the shorter of the term of the lease and the estimated useful life of the improvement,<br />
which generally ranges from 3 to 10 years. Depreciati<strong>on</strong> of property and equipment is included in general<br />
and administrative expenses. Maintenance and repairs are also charged to general and administrative<br />
expenses. Gains and losses <strong>on</strong> disposals are included in other income.<br />
Property and equipment are tested for impairment at least annually and an impairment charge is recorded to<br />
the extent the recoverable amount, which is the higher of fair value less costs to sell and value in use, is less<br />
than its carrying amount. Value in use is the present value of the future cash flows expected to be derived<br />
from the asset. After the recogniti<strong>on</strong> of impairment of an asset, the depreciati<strong>on</strong> charge is adjusted in future<br />
periods to reflect the asset’s revised carrying amount. If an impairment is later reversed, the depreciati<strong>on</strong><br />
charge is adjusted prospectively.<br />
Properties leased under a finance lease are capitalized as assets in property and equipment and depreciated<br />
over the terms of the leases.<br />
F - 34
Investment Property<br />
The Group generally uses the cost model for valuati<strong>on</strong> of investment property, and the carrying value is included<br />
<strong>on</strong> the balance sheet in other assets. When the Group issues liabilities that are backed by investment proper-<br />
ty, which pay a return linked directly to the fair value of, or returns from, specified investment property assets,<br />
it has elected to apply the fair value model to those specific investment property assets. The Group engages,<br />
as appropriate, external real estate experts to determine the fair value of the investment property by using<br />
recognized valuati<strong>on</strong> techniques. In cases in which prices of recent market transacti<strong>on</strong>s of comparable prop-<br />
erties are available, fair value is determined by reference to these transacti<strong>on</strong>s.<br />
Goodwill and Other Intangible Assets<br />
Goodwill arises <strong>on</strong> the acquisiti<strong>on</strong> of subsidiaries, associates and jointly c<strong>on</strong>trolled entities, and represents<br />
the excess of the fair value of the purchase c<strong>on</strong>siderati<strong>on</strong> and costs directly attributable to the acquisiti<strong>on</strong><br />
over the net fair value of the Group’s share of the identifiable assets acquired and the liabilities and c<strong>on</strong>tin-<br />
gent liabilities assumed <strong>on</strong> the date of the acquisiti<strong>on</strong>.<br />
For the purpose of calculating goodwill, fair values of acquired assets, liabilities and c<strong>on</strong>tingent liabilities are<br />
determined by reference to market values or by discounting expected future cash flows to present value. This<br />
discounting is either performed using market rates or by using risk-free rates and risk-adjusted expected<br />
future cash flows.<br />
Goodwill <strong>on</strong> the acquisiti<strong>on</strong> of subsidiaries is capitalized and reviewed for impairment annually, or more frequently<br />
if there are indicati<strong>on</strong>s that impairment may have occurred. Goodwill is allocated to cash-generating<br />
units for the purpose of impairment testing c<strong>on</strong>sidering the business level at which goodwill is m<strong>on</strong>itored for<br />
internal management purposes. On this basis, the Group’s primary cash-generating units are:<br />
— Global Markets and Corporate Finance (within the Corporate <strong>Bank</strong>ing & Securities corporate divisi<strong>on</strong>);<br />
— Global Transacti<strong>on</strong> <strong>Bank</strong>ing;<br />
— Asset Management and Private Wealth Management (within the Asset and Wealth Management corporate<br />
divisi<strong>on</strong>);<br />
— Private & Business Clients; and<br />
— Corporate Investments.<br />
In additi<strong>on</strong>, for certain n<strong>on</strong>integrated investments which are not allocated to the respective segments’ primary<br />
cash-generating units, goodwill is tested individually for impairment <strong>on</strong> the level of each of these n<strong>on</strong>integrated<br />
investments.<br />
F - 35
<strong>20</strong>-F Notes to the C<strong>on</strong>solidated Financial Statements<br />
Goodwill <strong>on</strong> the acquisiti<strong>on</strong>s of associates and jointly c<strong>on</strong>trolled entities is included in the cost of the investments<br />
and the entire carrying amount of the equity method investment is reviewed for impairment annually, or<br />
more frequently if there is an indicati<strong>on</strong> that impairment may have occurred.<br />
If goodwill has been allocated to a cash-generating unit and an operati<strong>on</strong> within that unit is disposed of, the<br />
attributable goodwill is included in the carrying amount of the operati<strong>on</strong> when determining the gain or loss <strong>on</strong><br />
its disposal.<br />
Intangible assets are recognized separately from goodwill when they are separable or arise from c<strong>on</strong>tractual<br />
or other legal rights and their fair value can be measured reliably. Intangible assets that have a finite useful<br />
life are stated at cost less any accumulated amortizati<strong>on</strong> and accumulated impairment losses. Customer-<br />
related intangible assets that have a finite useful life are amortized over periods of between 1 and <strong>20</strong> years <strong>on</strong><br />
a straight-line basis based <strong>on</strong> their expected useful life. Mortgage servicing rights are carried at cost and<br />
amortized in proporti<strong>on</strong> to, and over the estimated period of, net servicing revenue. The assets are tested for<br />
impairment and their useful lives reaffirmed at least annually.<br />
Certain intangible assets have an indefinite useful life; these are primarily investment management agree-<br />
ments related to retail mutual funds. These indefinite life intangibles are not amortized but are tested for<br />
impairment at least annually or more frequently if events or changes in circumstances indicate that impairment<br />
may have occurred.<br />
Costs related to software developed or obtained for internal use are capitalized if it is probable that future<br />
ec<strong>on</strong>omic benefits will flow to the Group, and the cost can be measured reliably. Capitalized costs are depreciated<br />
using the straight-line method over a period of 1 to 3 years. Eligible costs include external direct costs<br />
for materials and services, as well as payroll and payroll-related costs for employees directly associated with<br />
an internal-use software project. Overhead costs, as well as costs incurred during the research phase or after<br />
software is ready for use, are expensed as incurred.<br />
On acquisiti<strong>on</strong> of insurance businesses, the excess of the purchase price over the acquirer’s interest in the<br />
net fair value of the identifiable assets, liabilities and c<strong>on</strong>tingent liabilities is accounted for as an intangible<br />
asset. This intangible asset represents the present value of future cash flows over the reported liability at the<br />
date of acquisiti<strong>on</strong>. This is known as value of business acquired (“VOBA”).<br />
F - 36
The VOBA is amortized at a rate determined by c<strong>on</strong>sidering the profile of the business acquired and the<br />
expected depleti<strong>on</strong> in its value. The VOBA acquired is reviewed regularly for any impairment in value and any<br />
reducti<strong>on</strong>s are charged as an expense to the income statement.<br />
Financial Guarantees<br />
Financial guarantee c<strong>on</strong>tracts are c<strong>on</strong>tracts that require the issuer to make specified payments to reimburse<br />
the holder for a loss it incurs because a specified debtor fails to make payments when due in accordance with<br />
the terms of a debt instrument. Such financial guarantees are given to banks, financial instituti<strong>on</strong>s and other<br />
parties <strong>on</strong> behalf of customers to secure loans, overdrafts and other banking facilities.<br />
The Group has chosen to apply the fair value opti<strong>on</strong> to certain written financial guarantees that are managed<br />
<strong>on</strong> a fair value basis. Financial guarantees that the Group has not designated at fair value are recognized<br />
initially in the financial statements at fair value <strong>on</strong> the date the guarantee is given. Subsequent to initial<br />
recogniti<strong>on</strong>, the Group’s liabilities under such guarantees are measured at the higher of the amount initially<br />
recognized, less cumulative amortizati<strong>on</strong>, and the best estimate of the expenditure required to settle any<br />
financial obligati<strong>on</strong> as of the balance sheet date. These estimates are determined based <strong>on</strong> experience with<br />
similar transacti<strong>on</strong>s and history of past losses, and management’s determinati<strong>on</strong> of the best estimate.<br />
Any increase in the liability relating to guarantees is recorded in the income statement in provisi<strong>on</strong> for credit<br />
losses.<br />
Leasing Transacti<strong>on</strong>s<br />
Lessor<br />
Assets leased to customers under agreements which transfer substantially all the risks and rewards of ownership,<br />
with or without ultimate legal title, are classified as finance leases. When assets held are subject to a<br />
finance lease, the leased assets are derecognized and a receivable is recognized which is equal to the<br />
present value of the minimum lease payments, discounted at the interest rate implicit in the lease. Initial direct<br />
costs incurred in negotiating and arranging a finance lease are incorporated into the receivable through the<br />
discount rate applied to the lease. Finance lease income is recognized over the lease term based <strong>on</strong> a pattern<br />
reflecting a c<strong>on</strong>stant periodic rate of return <strong>on</strong> the net investment in the finance lease.<br />
F - 37
<strong>20</strong>-F Notes to the C<strong>on</strong>solidated Financial Statements<br />
Assets leased to customers under agreements which do not transfer substantially all the risks and rewards of<br />
ownership are classified as operating leases. The leased assets are included within premises and equipment<br />
<strong>on</strong> the Group’s balance sheet and depreciati<strong>on</strong> is provided <strong>on</strong> the depreciable amount of these assets <strong>on</strong> a<br />
systematic basis over their estimated useful ec<strong>on</strong>omic lives. Rental income is recognized <strong>on</strong> a straight-line<br />
basis over the period of the lease. Initial direct costs incurred in negotiating and arranging an operating lease<br />
are added to the carrying amount of the leased asset and recognized as an expense <strong>on</strong> a straight-line basis<br />
over the lease term.<br />
Lessee<br />
Assets held under finance leases are initially recognized <strong>on</strong> the balance sheet at an amount equal to the fair<br />
value of the leased property or, if lower, the present value of the minimum lease payments. The corresp<strong>on</strong>ding<br />
liability to the lessor is included in the balance sheet as a finance lease obligati<strong>on</strong>. The discount rate used<br />
in calculating the present value of the minimum lease payments is either the interest rate implicit in the<br />
lease, if it is practicable to determine, or the incremental borrowing rate. C<strong>on</strong>tingent rentals are recognized as<br />
expense in the periods in which they are incurred.<br />
Operating lease rentals payable are recognized as an expense <strong>on</strong> a straight-line basis over the lease term,<br />
which commences when the lessee c<strong>on</strong>trols the physical use of the property. Lease incentives are treated as<br />
a reducti<strong>on</strong> of rental expense and are also recognized over the lease term <strong>on</strong> a straight-line basis. C<strong>on</strong>tingent<br />
rentals arising under operating leases are recognized as an expense in the period in which they are incurred.<br />
Sale-Leaseback Arrangements<br />
If a sale-leaseback transacti<strong>on</strong> results in a finance lease, any excess of sales proceeds over the carrying<br />
amount of the asset is not immediately recognized as income by a seller-lessee but is deferred and amortized<br />
over the lease term.<br />
If a sale-leaseback transacti<strong>on</strong> results in an operating lease, the timing of the profit recogniti<strong>on</strong> is a functi<strong>on</strong> of<br />
the difference between the sales price and fair value. When it is clear that the sales price is at fair value, the<br />
profit (the difference between the sales price and carrying value) is recognized immediately. If the sales price<br />
is below fair value, any profit or loss is recognized immediately, except that if the loss is compensated for by<br />
future lease payments at below market price, it is deferred and amortized in proporti<strong>on</strong> to the lease payments<br />
over the period the asset is expected to be used. If the sales price is above fair value, the excess over fair<br />
value is deferred and amortized over the period the asset is expected to be used.<br />
F - 38
Employee Benefits<br />
Pensi<strong>on</strong> Benefits<br />
The Group provides a number of pensi<strong>on</strong> plans. In additi<strong>on</strong> to defined c<strong>on</strong>tributi<strong>on</strong> plans, there are retirement<br />
benefit plans accounted for as defined benefit plans. The assets of all the Group’s defined c<strong>on</strong>tributi<strong>on</strong> plans<br />
are held in independently-administered funds. C<strong>on</strong>tributi<strong>on</strong>s are generally determined as a percentage of<br />
salary and are expensed based <strong>on</strong> employee services rendered, generally in the year of c<strong>on</strong>tributi<strong>on</strong>.<br />
All retirement benefit plans are valued using the projected unit-credit method to determine the present value<br />
of the defined benefit obligati<strong>on</strong> and the related service costs. Under this method, the determinati<strong>on</strong> is based<br />
<strong>on</strong> actuarial calculati<strong>on</strong>s which include assumpti<strong>on</strong>s about demographics, salary increases and interest and<br />
inflati<strong>on</strong> rates. Actuarial gains and losses are recognized in shareholders’ equity and presented in the Statement<br />
of Recognized Income and Expense in the period in which they occur. The Group’s benefit plans are<br />
usually funded.<br />
Other Post-Employment Benefits<br />
In additi<strong>on</strong>, the Group maintains unfunded c<strong>on</strong>tributory post-employment medical plans for a number of current<br />
and retired employees who are mainly located in the United States. These plans pay stated percentages<br />
of eligible medical and dental expenses of retirees after a stated deductible has been met. The Group funds<br />
these plans <strong>on</strong> a cash basis as benefits are due. Analogous to retirement benefit plans these plans are valued<br />
using the projected unit-credit method. Actuarial gains and losses are recognized in full in the period in which<br />
they occur in shareholders’ equity and presented in the Statement of Recognized Income and Expense.<br />
Share-Based Compensati<strong>on</strong><br />
Compensati<strong>on</strong> expense for awards classified as equity instruments is measured at the grant date based <strong>on</strong><br />
the fair value of the share-based award. For share awards, the fair value is the quoted market price of<br />
the share reduced by the present value of the expected dividends that will not be received by the employee<br />
and adjusted for the effect, if any, of restricti<strong>on</strong>s bey<strong>on</strong>d the vesting date. In case an award is modified such<br />
that its fair value immediately after modificati<strong>on</strong> exceeds its fair value immediately prior to modificati<strong>on</strong>, a<br />
remeasurement takes place and the resulting increase in fair value is recognized as additi<strong>on</strong>al compensati<strong>on</strong><br />
expense.<br />
F - 39
<strong>20</strong>-F Notes to the C<strong>on</strong>solidated Financial Statements<br />
The Group records the offsetting amount to the recognized compensati<strong>on</strong> expense in additi<strong>on</strong>al paid-in capital<br />
(APIC). Compensati<strong>on</strong> expense is recorded <strong>on</strong> a straight-line basis over the period in which employees per-<br />
form services to which the awards relate or over the period of the tranches for those awards delivered in<br />
tranches. Estimates of expected forfeitures are periodically adjusted in the event of actual forfeitures or for<br />
changes in expectati<strong>on</strong>s. The timing of expense recogniti<strong>on</strong> relating to grants which, due to early retirement<br />
provisi<strong>on</strong>s, include a nominal but n<strong>on</strong>substantive service period are accelerated by shortening the amortizati<strong>on</strong><br />
period of the expense from the grant date to the date when the employee meets the eligibility criteria for<br />
the award, and not the vesting date. For awards that are delivered in tranches, each tranche is c<strong>on</strong>sidered a<br />
separate award and amortized separately.<br />
Compensati<strong>on</strong> expense for share-based awards payable in cash is remeasured to fair value at each balance<br />
sheet date, and the related obligati<strong>on</strong>s are included in other liabilities until paid.<br />
Obligati<strong>on</strong>s to Purchase Comm<strong>on</strong> Shares<br />
Forward purchases of <strong>Deutsche</strong> <strong>Bank</strong> shares, and written put opti<strong>on</strong>s where <strong>Deutsche</strong> <strong>Bank</strong> shares are the<br />
underlying, are reported as obligati<strong>on</strong>s to purchase comm<strong>on</strong> shares if the number of shares is fixed and physical<br />
settlement for a fixed amount of cash is required. At incepti<strong>on</strong> the obligati<strong>on</strong> is recorded at the present<br />
value of the settlement amount of the forward or opti<strong>on</strong>. For forward purchases and written put opti<strong>on</strong>s of<br />
<strong>Deutsche</strong> <strong>Bank</strong> shares, a corresp<strong>on</strong>ding charge is made to shareholders’ equity and reported as equity classified<br />
as an obligati<strong>on</strong> to purchase comm<strong>on</strong> shares.<br />
The liabilities are accounted for <strong>on</strong> an accrual basis, and interest costs, which c<strong>on</strong>sist of time value of m<strong>on</strong>ey<br />
and dividends, <strong>on</strong> the liability are reported as interest expense. Up<strong>on</strong> settlement of such forward purchases<br />
and written put opti<strong>on</strong>s, the liability is extinguished and the charge to equity is reclassified to comm<strong>on</strong> shares<br />
in treasury.<br />
<strong>Deutsche</strong> <strong>Bank</strong> comm<strong>on</strong> shares subject to such forward c<strong>on</strong>tracts are not c<strong>on</strong>sidered to be outstanding for<br />
purposes of basic earnings per share calculati<strong>on</strong>s, but are for dilutive earnings per share calculati<strong>on</strong>s to the<br />
extent that they are, in fact, dilutive.<br />
Put and call opti<strong>on</strong> c<strong>on</strong>tracts with <strong>Deutsche</strong> <strong>Bank</strong> shares as the underlying where the number of shares is<br />
fixed and physical settlement is required are not classified as derivatives. They are transacti<strong>on</strong>s in the<br />
Group’s equity. All other derivative c<strong>on</strong>tracts in which <strong>Deutsche</strong> <strong>Bank</strong> shares are the underlying are recorded<br />
as financial assets/liabilities at fair value through profit or loss.<br />
F - 40
Income Taxes<br />
The Group recognizes the current and deferred tax c<strong>on</strong>sequences of transacti<strong>on</strong>s that have been included in<br />
the c<strong>on</strong>solidated financial statements using the provisi<strong>on</strong>s of the respective jurisdicti<strong>on</strong>s’ tax laws. Current<br />
and deferred taxes are charged or credited to equity if the tax relates to items that are charged or credited<br />
directly to equity.<br />
Deferred tax assets and liabilities are recognized for future tax c<strong>on</strong>sequences attributable to temporary differ-<br />
ences between the financial statement carrying amounts of existing assets and liabilities and their respective<br />
tax bases, unused tax losses and unused tax credits. Deferred tax assets are recognized <strong>on</strong>ly to the extent<br />
that it is probable that sufficient taxable profit will be available against which those unused tax losses, unused<br />
tax credits and deductible temporary differences can be utilized.<br />
Deferred tax assets and liabilities are measured based <strong>on</strong> the tax rates that are expected to apply in the<br />
period that the asset is realized or the liability is settled, based <strong>on</strong> tax rates and tax laws that have been<br />
enacted or substantively enacted at the balance sheet date.<br />
Current tax assets and liabilities are offset when (1) they arise from the same tax reporting entity or tax group<br />
of reporting entities, (2) the legally enforceable right to offset exists and (3) they are intended to be settled net<br />
or realized simultaneously.<br />
Deferred tax assets and liabilities are offset when the legally enforceable right to offset current tax assets and<br />
liabilities exists and the deferred tax assets and liabilities relate to income taxes levied by the same taxing<br />
authority <strong>on</strong> either the same tax reporting entity or tax group of reporting entities.<br />
Deferred tax liabilities are provided <strong>on</strong> taxable temporary differences arising from investments in subsidiaries,<br />
branches and associates and interests in joint ventures except when the timing of the reversal of the tempo-<br />
rary difference is c<strong>on</strong>trolled by the Group and it is probable that the difference will not reverse in the foresee-<br />
able future. Deferred income tax assets are provided <strong>on</strong> deductible temporary differences arising from such<br />
investments <strong>on</strong>ly to the extent that it is probable that the differences will reverse in the foreseeable future and<br />
sufficient taxable income will be available against which those temporary differences can be utilized.<br />
F - 41
<strong>20</strong>-F Notes to the C<strong>on</strong>solidated Financial Statements<br />
Deferred tax related to fair value remeasurement of available for sale investments, cash flow hedges and<br />
other items, which are charged or credited directly to equity, is also credited or charged directly to equity and<br />
subsequently recognized in the income statement <strong>on</strong>ce the underlying gain or loss to which the deferred tax<br />
relates is realized.<br />
For share-based payment transacti<strong>on</strong>s, the Group may receive a tax deducti<strong>on</strong> related to the compensati<strong>on</strong><br />
paid in shares. The amount deductible for tax purposes may differ from the cumulative compensati<strong>on</strong> expense<br />
recorded. At any reporting date, the Group must estimate the expected future tax deducti<strong>on</strong> based <strong>on</strong> the<br />
current share price. If the amount deductible, or expected to be deductible, for tax purposes exceeds<br />
the cumulative compensati<strong>on</strong> expense, the excess tax benefit is recognized in equity. If the amount deductible,<br />
or expected to be deductible, for tax purposes is less than the cumulative compensati<strong>on</strong> expense, the<br />
shortfall is recognized in the Group’s income statement for the period.<br />
The Group’s insurance business in the United Kingdom (Abbey Life Assurance Company Limited) is subject<br />
to income tax <strong>on</strong> the policyholder’s investment returns (policyholder tax). This tax is included in the Group’s<br />
income tax expense/benefit even though it is ec<strong>on</strong>omically the income tax expense/benefit of the policyholder,<br />
which reduces/increases the Group’s liability to the policyholder.<br />
Provisi<strong>on</strong>s<br />
Provisi<strong>on</strong>s are recognized if the Group has a present legal or c<strong>on</strong>structive obligati<strong>on</strong> as a result of past<br />
events, if it is probable that an outflow of resources will be required to settle the obligati<strong>on</strong>, and a reliable<br />
estimate can be made of the amount of the obligati<strong>on</strong>.<br />
The amount recognized as a provisi<strong>on</strong> is the best estimate of the c<strong>on</strong>siderati<strong>on</strong> required to settle the present<br />
obligati<strong>on</strong> as of the balance sheet date, taking into account the risks and uncertainties surrounding the<br />
obligati<strong>on</strong>.<br />
If the effect of the time value of m<strong>on</strong>ey is material, provisi<strong>on</strong>s are discounted and measured at the present<br />
value of the expenditure expected to be required to settle the obligati<strong>on</strong>, using a pre-tax rate that reflects the<br />
current market assessments of the time value of m<strong>on</strong>ey and the risks specific to the obligati<strong>on</strong>. The increase<br />
in the provisi<strong>on</strong> due to the passage of time is recognized as interest expense.<br />
F - 42
When some or all of the ec<strong>on</strong>omic benefits required to settle a provisi<strong>on</strong> are expected to be recovered from a<br />
third party (for example, because the obligati<strong>on</strong> is covered by an insurance policy), an asset is recognized if it<br />
is virtually certain that reimbursement will be received.<br />
Statement of Cash Flows<br />
For purposes of the c<strong>on</strong>solidated statement of cash flows, the Group’s cash and cash equivalents include<br />
highly liquid investments that are readily c<strong>on</strong>vertible into cash and which are subject to an insignificant risk of<br />
change in value. Such investments include cash and balances at central banks and demand deposits with<br />
banks.<br />
The Group’s assignment of cash flows to the operating, investing or financing category depends <strong>on</strong> the busi-<br />
ness model (“management approach”). For the Group the primary operating activity is to manage financial<br />
assets and financial liabilities. Therefore, the issuance and management of l<strong>on</strong>g-term borrowings is a core<br />
operating activity which is different than for a n<strong>on</strong>-financial company, where borrowing is not a principal<br />
revenue producing activity and thus is part of the financing category.<br />
The Group views the issuance of senior l<strong>on</strong>g-term debt as an operating activity. Senior l<strong>on</strong>g-term debt comprises<br />
structured notes and asset backed securities, which are designed and executed by CIB business lines<br />
and which are revenue generating activities and the other comp<strong>on</strong>ent is debt issued by Treasury, which is<br />
c<strong>on</strong>sidered interchangeable with other funding sources; all of the funding costs are allocated to business<br />
activities to establish their profitability.<br />
Cash flows related to subordinated l<strong>on</strong>g-term debt and trust preferred securities are viewed differently than<br />
those related to senior-l<strong>on</strong>g term debt because they are managed as an integral part of the Group’s capital,<br />
primarily to meet regulatory capital requirements. As a result they are not interchangeable with other operat-<br />
ing liabilities, but can <strong>on</strong>ly be interchanged with equity and thus are c<strong>on</strong>sidered part of the financing category.<br />
The amounts shown in the statement of cash flows do not precisely match the movements in the balance<br />
sheet from <strong>on</strong>e period to the next as they exclude n<strong>on</strong>-cash items such as movements due to foreign<br />
exchange translati<strong>on</strong> and movements due to changes in the group of c<strong>on</strong>solidated companies.<br />
F - 43
<strong>20</strong>-F Notes to the C<strong>on</strong>solidated Financial Statements<br />
Movements in balances carried at fair value through profit or loss represent all changes affecting the carrying<br />
value. This includes the effects of market movements and cash inflows and outflows. The movements in balances<br />
carried at fair value are usually presented in operating cash flows.<br />
Insurance<br />
The Group’s insurance business issues two types of c<strong>on</strong>tracts:<br />
Insurance C<strong>on</strong>tracts – These are annuity and universal life c<strong>on</strong>tracts under which the Group accepts signifi-<br />
cant insurance risk from another party (the policyholder) by agreeing to compensate the policyholder if a spe-<br />
cific uncertain future event adversely affects the policyholder. Such c<strong>on</strong>tracts remain insurance c<strong>on</strong>tracts until<br />
all rights and obligati<strong>on</strong>s are extinguished or expire. All insurance c<strong>on</strong>tract liabilities are measured under the<br />
provisi<strong>on</strong>s of U.S. GAAP for insurance c<strong>on</strong>tracts.<br />
N<strong>on</strong>-Participating Investment C<strong>on</strong>tracts (“Investment C<strong>on</strong>tracts”) – These c<strong>on</strong>tracts do not c<strong>on</strong>tain significant<br />
insurance risk or discreti<strong>on</strong>ary participati<strong>on</strong> features. These are measured and reported c<strong>on</strong>sistently with<br />
other financial liabilities, which are classified as financial liabilities at fair value through profit or loss.<br />
Financial assets held to back annuity c<strong>on</strong>tracts have been classified as financial instruments available for<br />
sale. Financial assets held for other insurance and investment c<strong>on</strong>tracts have been designated as fair value<br />
through profit or loss under the fair value opti<strong>on</strong>.<br />
Insurance C<strong>on</strong>tracts<br />
Premiums for single premium business are recognized as income when received. This is the date from which<br />
the policy is effective. For regular premium c<strong>on</strong>tracts, receivables are recognized at the date when payments<br />
are due. Premiums are shown before deducti<strong>on</strong> of commissi<strong>on</strong>s. When policies lapse due to n<strong>on</strong>-receipt of<br />
premiums, all related premium income accrued but not received from the date they are deemed to have<br />
lapsed, net of related expense, is offset against premiums.<br />
Claims are recorded as an expense when they are incurred, and reflect the cost of all claims arising during<br />
the year, including policyholder profit participati<strong>on</strong>s allocated in anticipati<strong>on</strong> of a participati<strong>on</strong> declarati<strong>on</strong>.<br />
The aggregate policy reserves for universal life insurance c<strong>on</strong>tracts are equal to the account balance, which<br />
represents premiums received and investment returns credited to the policy, less deducti<strong>on</strong>s for mortality<br />
costs and expense charges. For other unit-linked insurance c<strong>on</strong>tracts the policy reserve represents the fair<br />
value of the underlying assets.<br />
F - 44
For annuity c<strong>on</strong>tracts, the liability is calculated by estimating the future cash flows over the durati<strong>on</strong> of the<br />
in-force c<strong>on</strong>tracts and discounting them back to the valuati<strong>on</strong> date allowing for the probability of occurrence.<br />
The assumpti<strong>on</strong>s are fixed at the date of acquisiti<strong>on</strong> with suitable provisi<strong>on</strong>s for adverse deviati<strong>on</strong>s (PADs).<br />
This calculated liability value is tested against a value calculated using best estimate assumpti<strong>on</strong>s and interest<br />
rates based <strong>on</strong> the yield <strong>on</strong> the amortized cost of the underlying assets. Should this test produce a higher<br />
value, the liability amount would be reset.<br />
Aggregate policy reserves include liabilities for certain opti<strong>on</strong>s attached to the Group’s unit-linked pensi<strong>on</strong><br />
products. These liabilities are calculated based <strong>on</strong> c<strong>on</strong>tractual obligati<strong>on</strong>s using actuarial assumpti<strong>on</strong>s.<br />
Liability adequacy tests are performed for the insurance portfolios <strong>on</strong> the basis of estimated future claims,<br />
costs, premiums earned and proporti<strong>on</strong>ate investment income. For l<strong>on</strong>g durati<strong>on</strong> c<strong>on</strong>tracts, if actual experience<br />
regarding investment yields, mortality, morbidity, terminati<strong>on</strong>s or expense indicate that existing c<strong>on</strong>tract<br />
liabilities, al<strong>on</strong>g with the present value of future gross premiums, will not be sufficient to cover the present<br />
value of future benefits and to recover deferred policy acquisiti<strong>on</strong> costs, then a premium deficiency is recognized.<br />
The costs directly attributable to the acquisiti<strong>on</strong> of incremental insurance and investment business are<br />
deferred to the extent that they are expected to be recoverable out of future margins in revenues <strong>on</strong> these<br />
c<strong>on</strong>tracts. These costs will be amortized systematically over a period no l<strong>on</strong>ger than that in which they are<br />
expected to be recovered out of these future margins.<br />
Investment C<strong>on</strong>tracts<br />
All of the Group’s investment c<strong>on</strong>tracts are unit-linked. These c<strong>on</strong>tract liabilities are determined using current<br />
unit prices multiplied by the number of units attributed to the c<strong>on</strong>tract holders as of the balance sheet date.<br />
As this amount represents fair value, the liabilities have been classified as financial liabilities at fair value<br />
through profit or loss. Deposits collected under investment c<strong>on</strong>tracts are accounted for as an adjustment to<br />
the investment c<strong>on</strong>tract liabilities. Investment income attributable to investment c<strong>on</strong>tracts is included in the<br />
income statement. Investment c<strong>on</strong>tract claims reflect the excess of amounts paid over the account balance<br />
released. Investment c<strong>on</strong>tract policyholders are charged fees for policy administrati<strong>on</strong>, investment management,<br />
surrenders or other c<strong>on</strong>tract services.<br />
The financial assets for investment c<strong>on</strong>tracts are recorded at fair value with changes in fair value, and offset-<br />
ting changes in the fair value of the corresp<strong>on</strong>ding financial liabilities, recorded in profit or loss.<br />
F - 45
<strong>20</strong>-F Notes to the C<strong>on</strong>solidated Financial Statements<br />
Reinsurance<br />
Premiums ceded for reinsurance and reinsurance recoveries <strong>on</strong> policyholder benefits and claims incurred are<br />
reported in income and expense as appropriate. Assets and liabilities related to reinsurance are reported <strong>on</strong> a<br />
gross basis when material. Amounts ceded to reinsurers from reserves for insurance c<strong>on</strong>tracts are estimated<br />
in a manner c<strong>on</strong>sistent with the reinsured risk. Accordingly, revenues and expenses related to reinsurance<br />
agreements are recognized in a manner c<strong>on</strong>sistent with the underlying risk of the business reinsured.<br />
[2] Critical Accounting Estimates<br />
Certain of the accounting policies described in Note [1] require critical accounting estimates that involve complex<br />
and subjective judgments and the use of assumpti<strong>on</strong>s, some of which may be for matters that are inherently<br />
uncertain and susceptible to change. Such critical accounting estimates could change from period to<br />
period and have a material impact <strong>on</strong> the Group’s financial c<strong>on</strong>diti<strong>on</strong>, changes in financial c<strong>on</strong>diti<strong>on</strong> or results<br />
of operati<strong>on</strong>s. Critical accounting estimates could also involve estimates where management could have reas<strong>on</strong>ably<br />
used another estimate in the current accounting period. The Group has identified the following significant<br />
accounting policies that involve critical accounting estimates.<br />
Fair Value Estimates<br />
Certain of the Group’s financial instruments are carried at fair value with changes in fair value recognized in<br />
the c<strong>on</strong>solidated statement of income. This includes trading assets and liabilities and financial assets and<br />
liabilities designated at fair value through profit or loss. In additi<strong>on</strong>, financial assets that are classified as<br />
available for sale are carried at fair value with the changes in fair value reported in a comp<strong>on</strong>ent of shareholders’<br />
equity. Derivatives held for n<strong>on</strong>-trading purposes are carried at fair value with changes in value recognized<br />
through the c<strong>on</strong>solidated income statement, except where they are in cash flow hedge accounting<br />
relati<strong>on</strong>ships when changes in fair value of the effective porti<strong>on</strong> of the hedge are reflected directly in a comp<strong>on</strong>ent<br />
of shareholders’ equity.<br />
Trading assets include debt and equity securities, derivatives held for trading purposes, commodities and<br />
trading loans. Trading liabilities c<strong>on</strong>sist primarily of derivative liabilities and short positi<strong>on</strong>s. Financial assets<br />
and liabilities which are designated at fair value through profit or loss, under the fair value opti<strong>on</strong>, include<br />
repurchase and reverse repurchase agreements, certain loans and loan commitments, debt and equity securities<br />
and structured note liabilities. Private equity investments in which the Group does not have a c<strong>on</strong>trolling<br />
financial interest or significant influence, are also carried at fair value either as trading instruments, designated<br />
as at fair value through profit or loss or as available for sale instruments.<br />
F - 46
Fair value is defined as the price at which an asset or liability could be exchanged in a current transacti<strong>on</strong><br />
between knowledgeable, willing parties, other than in a forced or liquidati<strong>on</strong> sale.<br />
In reaching estimates of fair value management judgment needs to be exercised. The areas requiring significant<br />
management judgment are identified, documented and reported to senior management as part of the<br />
valuati<strong>on</strong> c<strong>on</strong>trol framework and the standard m<strong>on</strong>thly reporting cycle. The Group’s specialist model validati<strong>on</strong><br />
and valuati<strong>on</strong> groups focus attenti<strong>on</strong> <strong>on</strong> the areas of subjectivity and judgment.<br />
The level of management judgment required in establishing fair value of financial instruments for which there<br />
is a quoted price in an active market is minimal. Similarly there is little subjectivity or judgment required for<br />
instruments valued using valuati<strong>on</strong> models that are standard across the industry and where all parameter<br />
inputs are quoted in active markets.<br />
The level of subjectivity and degree of management judgment required is more significant for those instruments<br />
valued using specialized and sophisticated models and those where some or all of the parameter<br />
inputs are not observable. Management judgment is required in the selecti<strong>on</strong> and applicati<strong>on</strong> of appropriate<br />
parameters, assumpti<strong>on</strong>s and modeling techniques. In particular, where data are obtained from infrequent<br />
market transacti<strong>on</strong>s extrapolati<strong>on</strong> and interpolati<strong>on</strong> techniques must be applied. In additi<strong>on</strong>, where no market<br />
data are available parameter inputs are determined by assessing other relevant sources of informati<strong>on</strong> such<br />
as historical data, fundamental analysis of the ec<strong>on</strong>omics of the transacti<strong>on</strong> and proxy informati<strong>on</strong> from similar<br />
transacti<strong>on</strong>s with appropriate adjustments to reflect the terms of the actual instrument being valued and<br />
current market c<strong>on</strong>diti<strong>on</strong>s. Where different valuati<strong>on</strong> techniques indicate a range of possible fair values for an<br />
instrument, management has to establish what point within the range of estimates best represents fair value.<br />
Further, some valuati<strong>on</strong> adjustments may require the exercise of management judgment to achieve fair value.<br />
F - 47
<strong>20</strong>-F Notes to the C<strong>on</strong>solidated Financial Statements<br />
Methods of Determining Fair Value<br />
A substantial percentage of the Group’s financial assets and liabilities carried at fair value are based <strong>on</strong>, or<br />
derived from, observable prices or inputs. The availability of observable prices or inputs varies by product and<br />
market, and may change over time. For example, observable prices or inputs are usually available for: liquid<br />
securities; exchange traded derivatives; over the counter (OTC) derivatives transacted in liquid trading markets<br />
such as interest rate swaps, foreign exchange forward and opti<strong>on</strong> c<strong>on</strong>tracts in G7 currencies; and equity<br />
swap and opti<strong>on</strong> c<strong>on</strong>tracts <strong>on</strong> listed securities or indices. If observable prices or inputs are available, they are<br />
utilized in the determinati<strong>on</strong> of fair value and, as such, fair value can be determined without significant judgment.<br />
This includes instruments for which the fair value is derived from a valuati<strong>on</strong> model that is standard<br />
across the industry and the inputs are directly observable. This is the case for many generic swap and opti<strong>on</strong><br />
c<strong>on</strong>tracts.<br />
In other markets or for certain instruments, observable prices or inputs are not available, and fair value is<br />
determined using valuati<strong>on</strong> techniques appropriate for the particular instrument. For example, instruments<br />
subject to valuati<strong>on</strong> techniques include: trading loans and other loans or loan commitments designated at fair<br />
value through profit or loss, under the fair value opti<strong>on</strong>; new, complex and l<strong>on</strong>g-dated OTC derivatives; transacti<strong>on</strong>s<br />
in immature or limited markets; distressed debt securities and loans; private equity securities and<br />
retained interests in securitizati<strong>on</strong>s of financial assets. The applicati<strong>on</strong> of valuati<strong>on</strong> techniques to determine<br />
fair value involves estimati<strong>on</strong> and management judgment, the extent of which will vary with the degree of<br />
complexity and liquidity in the market. Valuati<strong>on</strong> techniques include industry standard models based <strong>on</strong> discounted<br />
cash flow analysis, which are dependent up<strong>on</strong> estimated future cash flows and the discount rate<br />
used. For more complex products, the valuati<strong>on</strong> models include more complex modeling techniques, parameters<br />
and assumpti<strong>on</strong>s, such as volatility, correlati<strong>on</strong>, prepayment speeds, default rates and loss severity.<br />
Management judgment is required in the selecti<strong>on</strong> and applicati<strong>on</strong> of the appropriate parameters, assumpti<strong>on</strong>s<br />
and modeling techniques. Because the objective of using a valuati<strong>on</strong> technique is to establish the price<br />
at which market participants would currently transact, the valuati<strong>on</strong> techniques incorporate all factors that the<br />
Group believes market participants would c<strong>on</strong>sider in setting a transacti<strong>on</strong> price.<br />
F - 48
Valuati<strong>on</strong> adjustments are an integral part of the fair value process that requires the exercise of judgment. In<br />
making appropriate valuati<strong>on</strong> adjustments, the Group follows methodologies that c<strong>on</strong>sider factors such as bid-<br />
offer spread valuati<strong>on</strong> adjustments, liquidity, and credit risk (both counterparty credit risk in relati<strong>on</strong> to financial<br />
assets and the Group’s own credit risk in relati<strong>on</strong> to financial liabilities which are at fair value through<br />
profit or loss).<br />
The fair value of the Group’s financial liabilities which are at fair value through profit or loss (e.g., OTC deriva-<br />
tive liabilities and structured note liabilities designated at fair value through profit or loss) incorporates the<br />
change in the Group’s own credit risk of the financial liability. For derivative liabilities the Group c<strong>on</strong>siders its<br />
own creditworthiness by assessing all counterparties’ potential future exposure to us, taking into account any<br />
collateral held, the effect of any master netting agreements, expected loss given default and the Group’s own<br />
credit risk based <strong>on</strong> historic default levels. The change in the Group’s own credit risk for structured note liabilities<br />
is calculated by discounting the c<strong>on</strong>tractual cash flows of the instrument using the rate at which similar<br />
instruments would be issued at the measurement date. The resulting fair value is an estimate of the price at<br />
which the specific liability would be exchanged at the measurement date with another market participant.<br />
Under IFRS, if there are significant unobservable inputs used in the valuati<strong>on</strong> technique as of the trade date<br />
the financial instrument is recognized at the transacti<strong>on</strong> price and any trade date profit is deferred. Management<br />
judgment is required in determining whether there exist significant unobservable inputs in the valuati<strong>on</strong><br />
technique. Once deferred the decisi<strong>on</strong> to subsequently recognize the trade date profit requires a careful<br />
assessment of the then current facts and circumstances supporting observability of parameters and/or risk<br />
mitigati<strong>on</strong>.<br />
The Group has established internal c<strong>on</strong>trol procedures over the valuati<strong>on</strong> process to provide assurance over<br />
the appropriateness of the fair values applied. If fair value is determined by valuati<strong>on</strong> models, the assump-<br />
ti<strong>on</strong>s and techniques within the models are independently validated by a specialist group. Price and parameter<br />
inputs, assumpti<strong>on</strong>s and valuati<strong>on</strong> adjustments are subject to verificati<strong>on</strong> and review processes. If the<br />
price and parameter inputs are observable, they are verified against independent sources.<br />
F - 49
<strong>20</strong>-F Notes to the C<strong>on</strong>solidated Financial Statements<br />
If prices and parameter inputs or assumpti<strong>on</strong>s are not observable, the appropriateness of fair value is subject<br />
to additi<strong>on</strong>al procedures to assess its reas<strong>on</strong>ableness. Such procedures include performing revaluati<strong>on</strong>s<br />
using independently generated models, assessing the valuati<strong>on</strong>s against appropriate proxy instruments, performing<br />
sensitivity analysis and extrapolati<strong>on</strong> techniques, and c<strong>on</strong>sidering other benchmarks. Assessment is<br />
made as to whether the valuati<strong>on</strong> techniques yield fair value estimates that are reflective of the way the market<br />
operates by calibrating the results of the valuati<strong>on</strong> models against market transacti<strong>on</strong>s. These procedures<br />
require the applicati<strong>on</strong> of management judgment.<br />
Other valuati<strong>on</strong> c<strong>on</strong>trols include review and analysis of daily profit and loss, validati<strong>on</strong> of valuati<strong>on</strong> through<br />
close out profit and loss and Value-at-Risk back-testing.<br />
Fair Value Estimates Used in Disclosures<br />
Under IFRS, the financial assets and liabilities carried at fair value are required to be disclosed according to<br />
the valuati<strong>on</strong> method used to determine their fair value. Specifically, segmentati<strong>on</strong> is required between those<br />
valued using quoted market prices in an active market (level 1), valuati<strong>on</strong> techniques based <strong>on</strong> observable<br />
parameters (level 2) and valuati<strong>on</strong> techniques using significant unobservable parameters (level 3). This disclosure<br />
is provided in Note [13]. The financial assets held at fair value categorized in level 3 were<br />
€ 58.2 billi<strong>on</strong> at December 31, <str<strong>on</strong>g><strong>20</strong>09</str<strong>on</strong>g>, compared to € 87.7 billi<strong>on</strong> at December 31, <strong>20</strong>08. The financial liabilities<br />
held at fair value categorized in level 3 were € 18.2 billi<strong>on</strong> at December 31, <str<strong>on</strong>g><strong>20</strong>09</str<strong>on</strong>g> and € 34.4 billi<strong>on</strong> at December<br />
31, <strong>20</strong>08. Management judgment is required in determining the category to which certain instruments<br />
should be allocated. This specifically arises when the valuati<strong>on</strong> is determined by a number of parameters,<br />
some of which are observable and others are not. Further, the classificati<strong>on</strong> of an instrument can change over<br />
time to reflect changes in market liquidity and therefore price transparency.<br />
In additi<strong>on</strong> to the fair value hierarchy disclosure in Note [13] the Group provides a sensitivity analysis of the<br />
impact up<strong>on</strong> the level 3 financial instruments of using a reas<strong>on</strong>ably possible alternative for the unobservable<br />
parameter. The determinati<strong>on</strong> of reas<strong>on</strong>ably possible alternatives requires significant management judgment.<br />
For financial instruments measured at amortized cost (of which includes loans, deposits and short and l<strong>on</strong>g<br />
term debt issued) the Group discloses the fair value. This disclosure is provided in Note [14]. Generally there<br />
is limited or no trading activity in these instruments and therefore the fair value determinati<strong>on</strong> requires signifi-<br />
cant management judgment.<br />
F - 50
Reclassificati<strong>on</strong> of Financial Assets<br />
The Group classifies financial assets into the following categories: financial assets at fair value through profit<br />
or loss, financial assets available for sale (“AFS”) or loans. The appropriate classificati<strong>on</strong> of financial assets is<br />
determined at the time of initial recogniti<strong>on</strong>. In additi<strong>on</strong>, under the amendments to IAS 39 and IFRS 7,<br />
“Reclassificati<strong>on</strong> of Financial Assets” which were approved by the IASB and endorsed by the EU in October<br />
<strong>20</strong>08, it is permissible to reclassify certain financial assets out of financial assets at fair value through<br />
profit or loss (trading assets) and the available for sale classificati<strong>on</strong>s into the loans classificati<strong>on</strong>. For assets<br />
to be reclassified there must be a clear change in management intent with respect to the assets since initial<br />
recogniti<strong>on</strong> and the financial asset must meet the definiti<strong>on</strong> of a loan at the reclassificati<strong>on</strong> date. Additi<strong>on</strong>ally,<br />
there must be an intent and ability to hold the asset for the foreseeable future at the reclassificati<strong>on</strong> date.<br />
There is no ability for subsequent reclassificati<strong>on</strong> back to the trading or available for sale classificati<strong>on</strong>s.<br />
Refer to Note [12] Amendments to IAS 39 and IFRS 7, “Reclassificati<strong>on</strong> of Financial Assets” for further informati<strong>on</strong><br />
<strong>on</strong> the assets reclassified by the Group.<br />
Significant management judgment and assumpti<strong>on</strong>s are required to identify assets eligible under the amendments<br />
for which expected repayment exceeds estimated fair value. Significant management judgment and<br />
assumpti<strong>on</strong>s are also required to estimate the fair value of the assets identified (as described in “Fair Value<br />
Estimates”) at the date of reclassificati<strong>on</strong>, which becomes the amortized cost base under the loan classificati<strong>on</strong>.<br />
The task facing management in both these matters can be particularly challenging in the highly volatile<br />
and uncertain ec<strong>on</strong>omic and financial market c<strong>on</strong>diti<strong>on</strong>s such as those which existed in the third and fourth<br />
quarters of <strong>20</strong>08. The change of intent to hold for the foreseeable future is another matter requiring significant<br />
management judgment. The change in intent is not simply determined because of an absence of attractive<br />
prices nor is foreseeable future defined as the period until the return of attractive prices. Refer to Note [1]<br />
Significant Accounting Policies – Reclassificati<strong>on</strong> of Financial Assets for the Group’s minimum guidelines for<br />
what c<strong>on</strong>stitutes foreseeable future.<br />
Impairment of Loans and Provisi<strong>on</strong> for Off-Balance Sheet Positi<strong>on</strong>s<br />
The accounting estimates and judgments related to the impairment of loans and provisi<strong>on</strong> for off-balance<br />
sheet positi<strong>on</strong>s is a critical accounting estimate for the Corporate <strong>Bank</strong>ing & Securities and Private & Business<br />
Clients Corporate Divisi<strong>on</strong>s because the underlying assumpti<strong>on</strong>s used for both the individually and collectively<br />
assessed impairment can change from period to period and may significantly affect the Group’s results<br />
of operati<strong>on</strong>s.<br />
F - 51
<strong>20</strong>-F Notes to the C<strong>on</strong>solidated Financial Statements<br />
In assessing assets for impairment, management judgment is required, particularly in circumstances of eco-<br />
nomic and financial uncertainty, such as those of the current financial crisis, when developments and changes<br />
to expected cash flows can occur both with greater rapidity and less predictability.<br />
The provisi<strong>on</strong> for credit losses totaled € 2,630 milli<strong>on</strong>, € 1,076 milli<strong>on</strong> and € 612 milli<strong>on</strong> for the years ended<br />
December 31, <str<strong>on</strong>g><strong>20</strong>09</str<strong>on</strong>g>, <strong>20</strong>08 and <strong>20</strong>07.<br />
The determinati<strong>on</strong> of the impairment allowance required for loans which are deemed to be individually significant<br />
often requires the use of c<strong>on</strong>siderable management judgment c<strong>on</strong>cerning such matters as local ec<strong>on</strong>omic<br />
c<strong>on</strong>diti<strong>on</strong>s, the financial performance of the counterparty and the value of any collateral held, for which<br />
there may not be a readily accessible market. In certain situati<strong>on</strong>s, such as for certain leveraged loans, the<br />
Group may assess the enterprise value of the borrower to assess impairment. This requires use of c<strong>on</strong>siderable<br />
management judgment regarding timing of exit and the market value of the borrowing entity. The actual<br />
amount of the future cash flows and their timing may differ from the estimates used by management and c<strong>on</strong>sequently<br />
may cause actual losses to differ from the reported allowances.<br />
The impairment allowance for portfolios of smaller-balance homogenous loans, such as those to individuals<br />
and small business customers of the private and retail business, and for those loans which are individually<br />
significant but for which no objective evidence of impairment exists, is determined <strong>on</strong> a collective basis. The<br />
collective impairment allowance is calculated <strong>on</strong> a portfolio basis using statistical models which incorporate<br />
numerous estimates and judgments. The Group performs a regular review of the models and underlying data<br />
and assumpti<strong>on</strong>s. The probability of defaults, loss recovery rates, and judgments c<strong>on</strong>cerning the ability of<br />
borrowers in foreign countries to transfer the foreign currency necessary to comply with debt repayments,<br />
am<strong>on</strong>gst other things, are all taken into account during this review. For further discussi<strong>on</strong> of the methodologies<br />
used to determine the Group’s allowance for credit losses, see Note [1]. Refer also to Note [18].<br />
Impairment of Other Financial Assets<br />
Equity method investments, and financial assets classified as available for sale are evaluated for impairment<br />
<strong>on</strong> a quarterly basis, or more frequently if events or changes in circumstances indicate that these assets are<br />
impaired. If there is objective evidence of an impairment of an associate or jointly-c<strong>on</strong>trolled entity, an impairment<br />
test is performed by comparing the investments’ recoverable amount, which is the higher of its value in<br />
use and fair value less costs to sell, with its carrying amount. In the case of equity investments classified as<br />
available for sale, objective evidence of impairment would include a significant or prol<strong>on</strong>ged decline in fair<br />
value of the investment below cost. It could also include specific c<strong>on</strong>diti<strong>on</strong>s in an industry or geographical<br />
area or specific informati<strong>on</strong> regarding the financial c<strong>on</strong>diti<strong>on</strong> of the company, such as a downgrade in credit<br />
rating. In the case of debt securities classified as available for sale, impairment is assessed based <strong>on</strong> the<br />
same criteria as for loans. If informati<strong>on</strong> becomes available after the Group makes its evaluati<strong>on</strong>, the Group<br />
may be required to recognize impairment in the future. Because the estimate for impairment could change<br />
from period to period based up<strong>on</strong> future events that may or may not occur, the Group c<strong>on</strong>siders this to be a<br />
critical accounting estimate. The impairment reviews for equity method investments and financial assets<br />
available for sale resulted in net impairment charges of € 1,125 milli<strong>on</strong> in <str<strong>on</strong>g><strong>20</strong>09</str<strong>on</strong>g>, € 970 milli<strong>on</strong> in <strong>20</strong>08 and<br />
€ 286 milli<strong>on</strong> in <strong>20</strong>07. For additi<strong>on</strong>al informati<strong>on</strong> <strong>on</strong> financial assets classified as available for sale, see<br />
Note [15] and for equity method investments, see Note [16].<br />
F - 52
Impairment of N<strong>on</strong>-financial Assets<br />
Certain n<strong>on</strong>-financial assets, including goodwill and other intangible assets, are subject to impairment review.<br />
The Group records impairment losses <strong>on</strong> assets in this category when the Group believes that their carrying<br />
value may not be recoverable. A reversal of an impairment loss (excluding goodwill) is recognized immediately.<br />
Goodwill and other intangible assets are tested for impairment <strong>on</strong> an annual basis, or more frequently if<br />
events or changes in circumstances, such as an adverse change in business climate, indicate that these<br />
assets may be impaired. The determinati<strong>on</strong> of the recoverable amount in the impairment assessment requires<br />
estimates based <strong>on</strong> quoted market prices, prices of comparable businesses, present value or other valuati<strong>on</strong><br />
techniques, or a combinati<strong>on</strong> thereof, necessitating management to make subjective judgments and assumpti<strong>on</strong>s.<br />
Because these estimates and assumpti<strong>on</strong>s could result in significant differences to the amounts<br />
reported if underlying circumstances were to change, the Group c<strong>on</strong>siders this estimate to be critical. As of<br />
December 31, <str<strong>on</strong>g><strong>20</strong>09</str<strong>on</strong>g> and <strong>20</strong>08, goodwill had carrying amounts of € 7.4 billi<strong>on</strong> and € 7.5 billi<strong>on</strong>, respectively,<br />
and other intangible assets had carrying amounts of € 2.7 billi<strong>on</strong> and € 2.3 billi<strong>on</strong>, respectively. Evaluati<strong>on</strong> of<br />
impairment of these assets is a significant estimate for multiple businesses.<br />
In <str<strong>on</strong>g><strong>20</strong>09</str<strong>on</strong>g>, goodwill and other intangible assets impairment losses of € 157 milli<strong>on</strong> were recorded, of which<br />
€ 151 milli<strong>on</strong> related to investments in Corporate Investments. In additi<strong>on</strong>, € 291 milli<strong>on</strong> were recorded as<br />
reversals of impairment losses of other intangible assets in Asset and Wealth Management, which had been<br />
taken in the fourth quarter of <strong>20</strong>08. In <strong>20</strong>08, goodwill and other intangible assets impairment losses of<br />
€ 586 milli<strong>on</strong> were recorded, of which € 580 milli<strong>on</strong> related to investments in Asset and Wealth Management.<br />
In <strong>20</strong>07, goodwill and other intangible assets impairment losses were € 133 milli<strong>on</strong>, of which € 77 milli<strong>on</strong> were<br />
recognized in Asset and Wealth Management and € 54 milli<strong>on</strong> in Corporate Investments. For further discus-<br />
si<strong>on</strong> <strong>on</strong> goodwill and other intangible assets, see Note [23].<br />
F - 53
<strong>20</strong>-F Notes to the C<strong>on</strong>solidated Financial Statements<br />
Deferred Tax Assets<br />
The Group recognizes deferred tax assets and liabilities for the future tax c<strong>on</strong>sequences attributable to temporary<br />
differences between the financial statement carrying amounts of existing assets and liabilities and their<br />
respective tax bases, unused tax losses and unused tax credits. Deferred tax assets are recognized <strong>on</strong>ly to<br />
the extent that it is probable that sufficient taxable profit will be available against which those unused tax<br />
losses, unused tax credits or deductible temporary differences can be utilized. This assessment requires<br />
significant management judgments and assumpti<strong>on</strong>s. In determining unrecognized deferred tax assets, the<br />
Group uses historical tax capacity and profitability informati<strong>on</strong> and, if relevant, forecasted operating results,<br />
based up<strong>on</strong> approved business plans, including a review of the eligible carry-forward periods, available tax<br />
planning opportunities and other relevant c<strong>on</strong>siderati<strong>on</strong>s. Each quarter, the Group re-evaluates its estimate<br />
related to unrecognized deferred tax assets, including its assumpti<strong>on</strong>s about future profitability. As of December<br />
31, <str<strong>on</strong>g><strong>20</strong>09</str<strong>on</strong>g> and December 31, <strong>20</strong>08 the amount of unrecognized deferred tax assets was € 1.3 billi<strong>on</strong> and<br />
€ 1.7 billi<strong>on</strong>, respectively and the amount of recognized deferred tax assets was € 7.2 billi<strong>on</strong> and € 8.5 billi<strong>on</strong>,<br />
respectively.<br />
The Group believes that the accounting estimate related to the deferred tax assets is a critical accounting<br />
estimate because the underlying assumpti<strong>on</strong>s can change from period to period. For example, tax law<br />
changes or variances in future projected operating performance could result in a change of the deferred tax<br />
asset. If the Group was not able to realize all or part of its net deferred tax assets in the future, an adjustment<br />
to its deferred tax assets would be charged to income tax expense or directly to equity in the period such<br />
determinati<strong>on</strong> was made. If the Group was to recognize previously unrecognized deferred tax assets in the<br />
future, an adjustment to its deferred tax asset would be credited to income tax expense or directly to equity in<br />
the period such determinati<strong>on</strong> was made.<br />
For further informati<strong>on</strong> <strong>on</strong> the Group’s deferred taxes see Note [33].<br />
Legal and Regulatory C<strong>on</strong>tingencies and Tax Risks<br />
The Group c<strong>on</strong>ducts its business in many different legal, regulatory and tax envir<strong>on</strong>ments, and, accordingly,<br />
legal claims, regulatory proceedings and income tax provisi<strong>on</strong>s for uncertain tax positi<strong>on</strong>s may arise.<br />
The use of estimates is important in determining provisi<strong>on</strong>s for potential losses that may arise from litigati<strong>on</strong>,<br />
regulatory proceedings and uncertain income tax positi<strong>on</strong>s. The Group estimates and provides for potential<br />
losses that may arise out of litigati<strong>on</strong>, regulatory proceedings and uncertain income tax positi<strong>on</strong>s to the extent<br />
that such losses are probable and can be estimated, in accordance with IAS 37, “Provisi<strong>on</strong>s, C<strong>on</strong>tingent<br />
Liabilities and C<strong>on</strong>tingent Assets” and IAS 12, “Income Taxes”. Significant judgment is required in making<br />
these estimates and the Group’s final liabilities may ultimately be materially different.<br />
F - 54
C<strong>on</strong>tingencies in respect of legal matters are subject to many uncertainties and the outcome of individual<br />
matters is not predictable with assurance. Significant judgment is required in assessing probability and<br />
making estimates in respect of c<strong>on</strong>tingencies, and the Group’s final liability may ultimately be materially different.<br />
The Group’s total liability in respect of litigati<strong>on</strong>, arbitrati<strong>on</strong> and regulatory proceedings is determined<br />
<strong>on</strong> a case-by-case basis and represents an estimate of probable losses after c<strong>on</strong>sidering, am<strong>on</strong>g other factors,<br />
the progress of each case, the Group’s experience and the experience of others in similar cases, and the<br />
opini<strong>on</strong>s and views of legal counsel. Predicting the outcome of the Group’s litigati<strong>on</strong> matters is inherently<br />
difficult, particularly in cases in which claimants seek substantial or indeterminate damages. See Note [27] for<br />
informati<strong>on</strong> <strong>on</strong> the Group’s judicial, regulatory and arbitrati<strong>on</strong> proceedings.<br />
[3] Recently Adopted and New Accounting Pr<strong>on</strong>ouncements<br />
Recently Adopted Accounting Pr<strong>on</strong>ouncements<br />
The following are those accounting pr<strong>on</strong>ouncements which are relevant to the Group and which have been<br />
adopted during <str<strong>on</strong>g><strong>20</strong>09</str<strong>on</strong>g> in the preparati<strong>on</strong> of these c<strong>on</strong>solidated financial statements.<br />
IFRIC 9 and IAS 39<br />
In March <str<strong>on</strong>g><strong>20</strong>09</str<strong>on</strong>g>, the IASB issued amendments to IFRIC 9, “Reassessment of Embedded Derivatives”, and<br />
IAS 39, “Financial Instruments: Recogniti<strong>on</strong> and Measurement”, entitled “Embedded Derivatives”. The<br />
amendments require entities to assess whether they need to separate an embedded derivative from a hybrid<br />
financial instrument when financial assets are reclassified out of the fair value through profit or loss category.<br />
When the fair value of an embedded derivative that would be separated cannot be measured reliably, the<br />
reclassificati<strong>on</strong> of the hybrid financial asset out of the fair value through profit or loss category is not permitted.<br />
The amendments are effective for annual periods ending <strong>on</strong> or after June 30, <str<strong>on</strong>g><strong>20</strong>09</str<strong>on</strong>g>. The adopti<strong>on</strong> of the<br />
amendments did not have a material impact <strong>on</strong> the Group’s c<strong>on</strong>solidated financial statements.<br />
IFRS 7<br />
In March <str<strong>on</strong>g><strong>20</strong>09</str<strong>on</strong>g>, the IASB issued amendments to IFRS 7, “Financial Instruments: Disclosures”, entitled “Improving<br />
Disclosures about Financial Instruments”. The amendments require disclosures of financial instruments<br />
measured at fair value to be based <strong>on</strong> a three-level fair value hierarchy that reflects the significance of the<br />
inputs in such fair value measurements. The amendments also require additi<strong>on</strong>al qualitative and quantitative<br />
disclosures of liquidity risk. They are effective for annual periods beginning <strong>on</strong> or after January 1, <str<strong>on</strong>g><strong>20</strong>09</str<strong>on</strong>g>, with<br />
earlier applicati<strong>on</strong> permitted. The adopti<strong>on</strong> of the amendments <strong>on</strong>ly has a disclosure impact <strong>on</strong> the Group’s<br />
c<strong>on</strong>solidated financial statements.<br />
F - 55
<strong>20</strong>-F Notes to the C<strong>on</strong>solidated Financial Statements<br />
Improvements to IFRS <strong>20</strong>08<br />
In May <strong>20</strong>08, the IASB issued amendments to IFRS, which resulted from the IASB’s annual improvements<br />
project. They comprise amendments that result in accounting changes for presentati<strong>on</strong>, recogniti<strong>on</strong> or measurement<br />
purposes as well as terminology or editorial amendments related to a variety of individual IFRS<br />
standards. Most of the amendments are effective for annual periods beginning <strong>on</strong> or after January 1, <str<strong>on</strong>g><strong>20</strong>09</str<strong>on</strong>g>,<br />
with earlier applicati<strong>on</strong> permitted. The adopti<strong>on</strong> of the amendments did not have a material impact <strong>on</strong> the<br />
Group’s c<strong>on</strong>solidated financial statements.<br />
IAS 1<br />
In September <strong>20</strong>07, the IASB issued a revised versi<strong>on</strong> of IAS 1, “Presentati<strong>on</strong> of Financial Statements”<br />
(“IAS 1 R”). The revised standard sets overall requirements for the presentati<strong>on</strong> of financial statements,<br />
guidelines for their structure and minimum requirements for their c<strong>on</strong>tent. IAS 1 R is effective for annual<br />
periods beginning <strong>on</strong> or after January 1, <str<strong>on</strong>g><strong>20</strong>09</str<strong>on</strong>g>, with earlier applicati<strong>on</strong> permitted. The adopti<strong>on</strong> of the IAS 1 R<br />
did <strong>on</strong>ly have a presentati<strong>on</strong> impact <strong>on</strong> the Group’s c<strong>on</strong>solidated financial statements.<br />
New Accounting Pr<strong>on</strong>ouncements<br />
The following accounting pr<strong>on</strong>ouncements will be relevant to the Group but were not effective as at December<br />
31, <str<strong>on</strong>g><strong>20</strong>09</str<strong>on</strong>g> and therefore have not been applied in preparing these financial statements.<br />
IFRS 3 and IAS 27<br />
In January <strong>20</strong>08, the IASB issued a revised versi<strong>on</strong> of IFRS 3, “Business Combinati<strong>on</strong>s” (“IFRS 3 R”), and an<br />
amended versi<strong>on</strong> of IAS 27, “C<strong>on</strong>solidated and Separate Financial Statements” (“IAS 27 R”). IFRS 3 R rec<strong>on</strong>siders<br />
the applicati<strong>on</strong> of acquisiti<strong>on</strong> accounting for business combinati<strong>on</strong>s and IAS 27 R mainly relates to<br />
changes in the accounting for n<strong>on</strong>c<strong>on</strong>trolling interests and the loss of c<strong>on</strong>trol of a subsidiary. Under IFRS 3 R,<br />
the acquirer can elect to measure any n<strong>on</strong>c<strong>on</strong>trolling interest <strong>on</strong> a transacti<strong>on</strong>-by-transacti<strong>on</strong> basis, either at<br />
fair value as of the acquisiti<strong>on</strong> date or at its proporti<strong>on</strong>ate interest in the fair value of the identifiable assets<br />
and liabilities of the acquiree. When an acquisiti<strong>on</strong> is achieved in successive share purchases (step acquisiti<strong>on</strong>),<br />
the identifiable assets and liabilities of the acquiree are recognized at fair value when c<strong>on</strong>trol is obtained.<br />
A gain or loss is recognized in profit or loss for the difference between the fair value of the previously held<br />
equity interest in the acquiree and its carrying amount. IAS 27 R also requires the effects of all transacti<strong>on</strong>s<br />
with n<strong>on</strong>c<strong>on</strong>trolling interests to be recorded in equity if there is no change in c<strong>on</strong>trol. Transacti<strong>on</strong>s resulting in<br />
a loss of c<strong>on</strong>trol result in a gain or loss being recognized in profit or loss. The gain or loss includes a remeasurement<br />
to fair value of any retained equity interest in the investee. In additi<strong>on</strong>, all items of c<strong>on</strong>siderati<strong>on</strong><br />
transferred by the acquirer are measured and recognized at fair value, including c<strong>on</strong>tingent c<strong>on</strong>siderati<strong>on</strong>, as<br />
of the acquisiti<strong>on</strong> date. Transacti<strong>on</strong> costs incurred by the acquirer in c<strong>on</strong>necti<strong>on</strong> with the business combinati<strong>on</strong><br />
do not form part of the cost of the business combinati<strong>on</strong> transacti<strong>on</strong> but are expensed as incurred unless<br />
they relate to the issuance of debt or equity securities, in which case they are accounted for under IAS 39,<br />
“Financial Instruments: Recogniti<strong>on</strong> and Measurement”. IFRS 3 R and IAS 27 R are effective for business<br />
combinati<strong>on</strong>s in annual periods beginning <strong>on</strong> or after July 1, <str<strong>on</strong>g><strong>20</strong>09</str<strong>on</strong>g>, with early applicati<strong>on</strong> permitted provided<br />
that both Standards are applied together.<br />
F - 56
Improvements to IFRS <str<strong>on</strong>g><strong>20</strong>09</str<strong>on</strong>g><br />
In April <str<strong>on</strong>g><strong>20</strong>09</str<strong>on</strong>g>, the IASB issued amendments to IFRS, which resulted from the IASB’s annual improvement<br />
project. They comprise amendments that result in accounting changes for presentati<strong>on</strong>, recogniti<strong>on</strong> or measurement<br />
purposes as well as terminology or editorial amendments related to a variety of individual IFRS<br />
standards. Most of the amendments are effective for annual periods beginning <strong>on</strong> or after January 1, <strong>20</strong>10,<br />
with earlier applicati<strong>on</strong> permitted. While approved by the IASB, the standard has yet to be endorsed by the<br />
EU. The adopti<strong>on</strong> of the amendments is not expected to have a material impact <strong>on</strong> the Group’s c<strong>on</strong>solidated<br />
financial statements.<br />
IAS 24<br />
In November <str<strong>on</strong>g><strong>20</strong>09</str<strong>on</strong>g>, the IASB issued a revised versi<strong>on</strong> of IAS 24, “Related Party Disclosures” (“IAS 24 R”).<br />
IAS 24 R provides a partial exempti<strong>on</strong> from the disclosure requirements for government-related entities and<br />
clarifies the definiti<strong>on</strong> of a related party. The revised standard is effective for annual periods beginning <strong>on</strong> or<br />
after January 1, <strong>20</strong>11, with earlier applicati<strong>on</strong> permitted. While approved by the IASB, the standard has yet to<br />
be endorsed by the EU. The Group is currently evaluating the potential impact that the adopti<strong>on</strong> of IAS 24 R<br />
will have <strong>on</strong> its c<strong>on</strong>solidated financial statements.<br />
IFRS 9<br />
In November <str<strong>on</strong>g><strong>20</strong>09</str<strong>on</strong>g>, the IASB issued IFRS 9, “Financial Instruments”, as a first step in its project to replace<br />
IAS 39, “Financial Instruments: Recogniti<strong>on</strong> and Measurement”. IFRS 9 introduces new requirements for how<br />
an entity should classify and measure financial assets that are in the scope of IAS 39. The standard requires<br />
all financial assets to be classified <strong>on</strong> the basis of the entity’s business model for managing the financial<br />
assets, and the c<strong>on</strong>tractual cash flow characteristics of the financial asset. A financial asset is measured at<br />
amortized cost if two criteria are met: (a) the objective of the business model is to hold the financial asset for<br />
the collecti<strong>on</strong> of the c<strong>on</strong>tractual cash flows, and (b) the c<strong>on</strong>tractual cash flows under the instrument solely<br />
represent payments of principal and interest. If a financial asset meets the criteria to be measured at amortized<br />
cost, it can be designated at fair value through profit or loss under the fair value opti<strong>on</strong>, if doing so would<br />
significantly reduce or eliminate an accounting mismatch. If a financial asset does not meet the business<br />
model and c<strong>on</strong>tractual terms criteria to be measured at amortized cost, then it is subsequently measured at<br />
fair value. IFRS 9 also removes the requirement to separate embedded derivatives from financial asset hosts.<br />
It requires a hybrid c<strong>on</strong>tract with a financial asset host to be classified in its entirety at either amortized cost or<br />
fair value. IFRS 9 requires reclassificati<strong>on</strong>s when the entity’s business model changes, which is expected to<br />
be an infrequent occurrence; in this case, the entity is required to reclassify affected financial assets prospectively.<br />
There is specific guidance for c<strong>on</strong>tractually linked instruments that create c<strong>on</strong>centrati<strong>on</strong>s of credit risk,<br />
which is often the case with investment tranches in a securitizati<strong>on</strong>. In additi<strong>on</strong> to assessing the instrument<br />
itself against the IFRS 9 classificati<strong>on</strong> criteria, management should also ‘look through’ to the underlying pool<br />
of instruments that generate cash flows to assess their characteristics. To qualify for amortized cost, the<br />
investment must have equal or lower credit risk than the weighted-average credit risk in the underlying pool of<br />
instruments, and those instruments must meet certain criteria. If a ‘look through’ is impracticable, the tranche<br />
F - 57
<strong>20</strong>-F Notes to the C<strong>on</strong>solidated Financial Statements<br />
must be classified at fair value through profit or loss. Under IFRS 9, all equity investments should be mea-<br />
sured at fair value. However, management has an opti<strong>on</strong> to present directly in equity unrealized and realized<br />
fair value gains and losses <strong>on</strong> equity investments that are not held for trading. Such designati<strong>on</strong> is available<br />
<strong>on</strong> initial recogniti<strong>on</strong> <strong>on</strong> an instrument-by-instrument basis and is irrevocable. There is no subsequent recycling<br />
of fair value gains and losses to profit or loss; however, dividends from such investments will c<strong>on</strong>tinue to<br />
be recognized in profit or loss. IFRS 9 is effective for annual periods beginning <strong>on</strong> or after January 1, <strong>20</strong>13,<br />
with earlier applicati<strong>on</strong> permitted. IFRS 9 should be applied retrospectively; however, if adopted before<br />
January 1, <strong>20</strong>12, comparative periods do not need to be restated. In additi<strong>on</strong>, entities adopting before January<br />
1, <strong>20</strong>11 are allowed to designate any date between the date of issuance of IFRS 9 and January 1, <strong>20</strong>11,<br />
as the date of initial applicati<strong>on</strong> that will be the date up<strong>on</strong> which the classificati<strong>on</strong> of financial assets will be<br />
determined. While approved by the IASB, the standard has yet to be endorsed by the EU. The Group is currently<br />
evaluating the potential impact that the adopti<strong>on</strong> of the amendments will have <strong>on</strong> its c<strong>on</strong>solidated financial<br />
statements.<br />
[4] Business Segments and Related Informati<strong>on</strong><br />
The following segment informati<strong>on</strong> has been prepared in accordance with the “management approach”, which<br />
requires presentati<strong>on</strong> of the segments <strong>on</strong> the basis of the internal reports about comp<strong>on</strong>ents of the entity<br />
which are regularly reviewed by the chief operating decisi<strong>on</strong>-maker in order to allocate resources to a segment<br />
and to assess its performance.<br />
F - 58
Business Segments<br />
The following business segments represent the Group’s organizati<strong>on</strong>al structure as reflected in its internal<br />
management reporting systems.<br />
The Group is organized into three group divisi<strong>on</strong>s, which are further subdivided into corporate divisi<strong>on</strong>s. As of<br />
December 31, <str<strong>on</strong>g><strong>20</strong>09</str<strong>on</strong>g>, the group divisi<strong>on</strong>s and corporate divisi<strong>on</strong>s were as follows:<br />
The Corporate and Investment <strong>Bank</strong> (CIB), which combines the Group’s corporate banking and securities<br />
activities (including sales and trading and corporate finance activities) with the Group’s transacti<strong>on</strong> banking<br />
activities. CIB serves corporate and instituti<strong>on</strong>al clients, ranging from medium-sized enterprises to multina-<br />
ti<strong>on</strong>al corporati<strong>on</strong>s, banks and sovereign organizati<strong>on</strong>s. Within CIB, the Group manages these activities in two<br />
global corporate divisi<strong>on</strong>s: Corporate <strong>Bank</strong>ing & Securities (CB&S) and Global Transacti<strong>on</strong> <strong>Bank</strong>ing (GTB).<br />
— CB&S is made up of the Global Markets and Corporate Finance business divisi<strong>on</strong>s. These businesses<br />
offer financial products worldwide, ranging from the underwriting of stocks and b<strong>on</strong>ds to the tailoring of<br />
structured soluti<strong>on</strong>s for complex financial requirements.<br />
— GTB is primarily engaged in the gathering, transferring, safeguarding and c<strong>on</strong>trolling of assets for its<br />
clients throughout the world. It provides processing, fiduciary and trust services to corporati<strong>on</strong>s, financial<br />
instituti<strong>on</strong>s and governments and their agencies.<br />
Private Clients and Asset Management (PCAM), which combines the Group’s asset management, private<br />
wealth management and private and business client activities. Within PCAM, the Group manages these activi-<br />
ties in two global corporate divisi<strong>on</strong>s: Asset and Wealth Management (AWM) and Private & Business Clients<br />
(PBC).<br />
— AWM is composed of the business divisi<strong>on</strong>s Asset Management (AM), which focuses <strong>on</strong> managing assets<br />
<strong>on</strong> behalf of instituti<strong>on</strong>al clients and providing mutual funds and other retail investment vehicles, and<br />
Private Wealth Management (PWM), which focuses <strong>on</strong> the specific needs of high net worth clients, their<br />
families and selected instituti<strong>on</strong>s.<br />
— PBC serves retail and affluent clients as well as small corporate customers with a full range of retail banking<br />
products.<br />
Corporate Investments (CI), which manages certain alternative assets of the Group and other debt and equity<br />
positi<strong>on</strong>s.<br />
Changes in the compositi<strong>on</strong> of segments can arise from either changes in management resp<strong>on</strong>sibility, or from<br />
acquisiti<strong>on</strong>s and divestitures.<br />
F - 59
<strong>20</strong>-F Notes to the C<strong>on</strong>solidated Financial Statements<br />
The following describes changes in management resp<strong>on</strong>sibilities with a significant impact <strong>on</strong> segmental report-<br />
ing during <str<strong>on</strong>g><strong>20</strong>09</str<strong>on</strong>g>:<br />
— On April 1, <str<strong>on</strong>g><strong>20</strong>09</str<strong>on</strong>g>, management resp<strong>on</strong>sibility for The Cosmopolitan Resort and Casino property changed<br />
from the corporate divisi<strong>on</strong> CB&S to the corporate divisi<strong>on</strong> CI.<br />
— During the first quarter <str<strong>on</strong>g><strong>20</strong>09</str<strong>on</strong>g>, management resp<strong>on</strong>sibility for certain assets changed from the corporate<br />
divisi<strong>on</strong> AWM to the corporate divisi<strong>on</strong> CI. These assets included Maher Terminals, a c<strong>on</strong>solidated infrastructure<br />
investment, and RREEF Global Opportunity Fund III, a c<strong>on</strong>solidated real estate investment fund.<br />
The following describes acquisiti<strong>on</strong>s and divestitures which had a significant impact <strong>on</strong> the Group’s segment<br />
operati<strong>on</strong>s:<br />
— In November <str<strong>on</strong>g><strong>20</strong>09</str<strong>on</strong>g>, the Group completed the acquisiti<strong>on</strong> of Dresdner <strong>Bank</strong>’s Global Agency Securities<br />
Lending business from Commerzbank AG. The business is included in the corporate divisi<strong>on</strong> GTB.<br />
— On February 25, <str<strong>on</strong>g><strong>20</strong>09</str<strong>on</strong>g>, the Group completed the acquisiti<strong>on</strong> of a minority stake in <strong>Deutsche</strong> Postbank AG,<br />
<strong>on</strong>e of Germany’s major financial services providers. As of that date, the Group also entered into a manda-<br />
torily-exchangeable b<strong>on</strong>d as well as opti<strong>on</strong>s to increase its stake in the future. All comp<strong>on</strong>ents of the<br />
transacti<strong>on</strong> are included in the corporate divisi<strong>on</strong> CI.<br />
— In December <strong>20</strong>08, RREEF Alternative Investments acquired a significant minority interest in Rosen Real<br />
Estate Securities LLC (RRES), a l<strong>on</strong>g/short real estate investment advisor. The investment is included in<br />
the corporate divisi<strong>on</strong> AWM.<br />
— In November <strong>20</strong>08, the Group acquired a 40 % stake in UFG Invest, the Russian investment management<br />
company of UFG Asset Management, with an opti<strong>on</strong> to become a 100 % owner in the future. The business<br />
is branded <strong>Deutsche</strong> UFG Capital Management. The investment is included in the corporate divisi<strong>on</strong><br />
AWM.<br />
— In October <strong>20</strong>08, the Group completed the acquisiti<strong>on</strong> of the operating platform of Pago eTransacti<strong>on</strong><br />
GmbH into the <strong>Deutsche</strong> Card Services GmbH, based in Germany. The investment is included in the corporate<br />
divisi<strong>on</strong> GTB.<br />
— In June <strong>20</strong>08, the Group c<strong>on</strong>solidated Maher Terminals LLC and Maher Terminals of Canada Corp, collectively<br />
and hereafter referred to as Maher Terminals, a privately held operator of port terminal facilities in<br />
North America. RREEF Infrastructure acquired all third party investors' interests in the North America<br />
Infrastructure Fund, whose sole underlying investment was Maher Terminals. The investment is included<br />
in the corporate divisi<strong>on</strong> CI.<br />
— In June <strong>20</strong>08, the Group sold DWS Investments Schweiz AG, comprising the Swiss fund administrati<strong>on</strong><br />
business of the corporate divisi<strong>on</strong> AWM, to State Street <strong>Bank</strong>.<br />
— Effective June <strong>20</strong>08, the Group sold its Italian life insurance company DWS Vita S.p.A. to Zurich Financial<br />
Services Group. The business was included in the corporate divisi<strong>on</strong> AWM.<br />
F - 60
— Effective March <strong>20</strong>08, the Group completed the acquisiti<strong>on</strong> of a 60 % interest in Far Eastern Alliance Asset<br />
Management Co. Limited, a Taiwanese investment management firm. The investment is included in the<br />
corporate divisi<strong>on</strong> AWM.<br />
— In February <strong>20</strong>08, the 50 % interest in the management company of the Australia based DEXUS Property<br />
Group was sold by RREEF Alternative Investments to DEXUS’ unitholders. The investment was included<br />
in the corporate divisi<strong>on</strong> AWM.<br />
— In January <strong>20</strong>08, the Group acquired HedgeWorks LLC, a hedge fund administrator based in the United<br />
States. The investment is included in the corporate divisi<strong>on</strong> GTB.<br />
— In January <strong>20</strong>08, the Group increased its stake in Harvest Fund Management Company Limited to 30 %.<br />
Harvest is a mutual fund manager in China. The investment is included in the corporate divisi<strong>on</strong> AWM.<br />
— In October <strong>20</strong>07, the Group acquired Abbey Life Assurance Company Limited, a U.K. company that c<strong>on</strong>sists<br />
primarily of unit-linked life and pensi<strong>on</strong> policies and annuities. The business is included in the corporate<br />
divisi<strong>on</strong> CB&S.<br />
— In July <strong>20</strong>07, AM completed the sale of its local Italian mutual fund business and established l<strong>on</strong>g term<br />
distributi<strong>on</strong> arrangements with the Group’s strategic partner, Anima S.G.R.p.A. The business was included<br />
in the corporate divisi<strong>on</strong> AWM.<br />
— In July <strong>20</strong>07, RREEF Private Equity acquired a significant stake in Aldus Equity, an alternative asset<br />
management and advisory boutique, which specializes in customized private equity investing for instituti<strong>on</strong>al<br />
and high net worth investors. The business is included in the corporate divisi<strong>on</strong> AWM.<br />
— In July <strong>20</strong>07, the Group announced the completi<strong>on</strong> of the acquisiti<strong>on</strong> of the instituti<strong>on</strong>al cross-border custody<br />
business of Türkiye Garanti <strong>Bank</strong>asi A. Ş. The business is included in the corporate divisi<strong>on</strong> GTB.<br />
— In July <strong>20</strong>07, RREEF Infrastructure completed the acquisiti<strong>on</strong> of Maher Terminals. After a partial sale into<br />
the fund for which it was acquired, Maher Terminals was dec<strong>on</strong>solidated in October <strong>20</strong>07.<br />
— In June <strong>20</strong>07, the Group completed the sale of the Australian Asset Management domestic manufacturing<br />
operati<strong>on</strong>s to Aberdeen Asset Management. The business was included in the corporate divisi<strong>on</strong> AWM.<br />
— In January <strong>20</strong>07, the Group sold the sec<strong>on</strong>d tranche (41 %) of PBC’s Italian <strong>Bank</strong>Americard processing<br />
activities to Istituto Centrale delle Banche Popolari Italiane (“ICBPI”), the central body of Italian cooperative<br />
banks. The business was included in the corporate divisi<strong>on</strong> PBC.<br />
— In January <strong>20</strong>07, the Group completed the acquisiti<strong>on</strong> of MortgageIT Holdings, Inc., a residential mortgage<br />
real estate investment trust (REIT) in the United States. The business is included in the corporate divisi<strong>on</strong><br />
CB&S.<br />
— In January <strong>20</strong>07, the Group completed the acquisiti<strong>on</strong> of Berliner <strong>Bank</strong>, which is included in the corporate<br />
divisi<strong>on</strong> PBC. The acquisiti<strong>on</strong> expands the Group’s market share in the retail banking sector of the German<br />
capital.<br />
F - 61
<strong>20</strong>-F Notes to the C<strong>on</strong>solidated Financial Statements<br />
Measurement of Segment Profit or Loss<br />
Segment reporting requires a presentati<strong>on</strong> of the segment results based <strong>on</strong> management reporting methods,<br />
including a rec<strong>on</strong>ciliati<strong>on</strong> between the results of the business segments and the c<strong>on</strong>solidated financial statements,<br />
which is presented in the “Rec<strong>on</strong>ciliati<strong>on</strong> of Segmental Results of Operati<strong>on</strong>s to C<strong>on</strong>solidated Results<br />
of Operati<strong>on</strong>s” secti<strong>on</strong> of this note. The informati<strong>on</strong> provided about each segment is based <strong>on</strong> the internal<br />
reports about segment profit or loss, assets and other informati<strong>on</strong> which are regularly reviewed by the chief<br />
operating decisi<strong>on</strong>-maker.<br />
Management reporting for the Group is generally based <strong>on</strong> IFRS. N<strong>on</strong>-IFRS compliant accounting methods<br />
are rarely used and represent either valuati<strong>on</strong> or classificati<strong>on</strong> differences. The largest valuati<strong>on</strong> differences<br />
relate to mark-to-market accounting in management reporting versus accrual accounting under IFRS (for<br />
example, for certain financial instruments in the Group’s treasury books in CB&S and PBC) and to the recogniti<strong>on</strong><br />
of trading results from own shares in revenues in management reporting (mainly in CB&S) and in equity<br />
under IFRS. The major classificati<strong>on</strong> difference relates to minority interest, which represents the net share<br />
of minority shareholders in revenues, provisi<strong>on</strong> for credit losses, n<strong>on</strong>interest expenses and income tax<br />
expenses. Minority interest is reported as a comp<strong>on</strong>ent of pre-tax income for the businesses in management<br />
reporting (with a reversal in C<strong>on</strong>solidati<strong>on</strong> & Adjustments, or C&A) and a comp<strong>on</strong>ent of net income appropriati<strong>on</strong><br />
under IFRS.<br />
Revenues from transacti<strong>on</strong>s between the business segments are allocated <strong>on</strong> a mutually-agreed basis. Inter-<br />
nal service providers, which operate <strong>on</strong> a n<strong>on</strong>profit basis, allocate their n<strong>on</strong>interest expenses to the recipient<br />
of the service. The allocati<strong>on</strong> criteria are generally based <strong>on</strong> service level agreements and are either determined<br />
based up<strong>on</strong> “price per unit”, “fixed price” or “agreed percentages”. Since the Group’s business activities<br />
are diverse in nature and its operati<strong>on</strong>s are integrated, certain estimates and judgments have been made<br />
to apporti<strong>on</strong> revenue and expense items am<strong>on</strong>g the business segments.<br />
The management reporting systems follow a “matched transfer pricing c<strong>on</strong>cept” in which the Group’s external<br />
net interest income is allocated to the business segments based <strong>on</strong> the assumpti<strong>on</strong> that all positi<strong>on</strong>s are<br />
funded or invested via the wholesale m<strong>on</strong>ey and capital markets. Therefore, to create comparability with<br />
those competitors who have legally independent units with their own equity funding, the Group allocates the<br />
net noti<strong>on</strong>al interest credit <strong>on</strong> its c<strong>on</strong>solidated capital (after deducti<strong>on</strong> of certain related charges such as<br />
hedging of net investments in certain foreign operati<strong>on</strong>s) to the business segments, in proporti<strong>on</strong> to each<br />
business segment’s allocated average active equity.<br />
F - 62
The Group reviewed its internal funding systems as a reacti<strong>on</strong> to the significant changes of funding costs<br />
during the financial crisis, and adopted in <str<strong>on</strong>g><strong>20</strong>09</str<strong>on</strong>g> a refinement of internal funding rates used to more adequately<br />
reflect risk of certain assets and the value of liquidity provided by unsecured funding sources.<br />
The financial impact <strong>on</strong> the business segments for <str<strong>on</strong>g><strong>20</strong>09</str<strong>on</strong>g> was as follows:<br />
— GTB (€ 160 milli<strong>on</strong>), AWM (€ 32 milli<strong>on</strong>) and PBC (€ 4 milli<strong>on</strong>) received additi<strong>on</strong>al funding benefit.<br />
— CB&S (€ 167 milli<strong>on</strong>) and CI (€ 30 milli<strong>on</strong>) received additi<strong>on</strong>al funding costs.<br />
Management uses certain measures for equity and related ratios as part of its internal reporting system<br />
because it believes that these measures provide it with a more useful indicati<strong>on</strong> of the financial performance<br />
of the business segments. The Group discloses such measures to provide investors and analysts with further<br />
insight into how management operates the Group’s businesses and to enable them to better understand the<br />
Group’s results. These measures include:<br />
— Average Active Equity: The Group calculates active equity to facilitate comparis<strong>on</strong> to its peers. The Group<br />
uses average active equity to calculate several ratios. However, active equity is not a measure provided<br />
for in IFRS and therefore the Group’s ratios based <strong>on</strong> average active equity should not be compared<br />
to other companies’ ratios without c<strong>on</strong>sidering the differences in the calculati<strong>on</strong>. The items for which the<br />
average shareholders’ equity is adjusted are average unrealized net gains (losses) <strong>on</strong> assets available for<br />
sale and average fair value adjustments <strong>on</strong> cash flow hedges (both comp<strong>on</strong>ents net of applicable taxes)<br />
as well as average dividends, for which a proposal is accrued <strong>on</strong> a quarterly basis and payments occur<br />
<strong>on</strong>ce a year following the approval by the <str<strong>on</strong>g>Annual</str<strong>on</strong>g> General Meeting. Tax rates applied in the calculati<strong>on</strong> of<br />
average active equity are those used in the financial statements for the individual items and not an average<br />
overall tax rate. The Group’s average active equity is allocated to the business segments and to C&A<br />
in proporti<strong>on</strong> to their ec<strong>on</strong>omic risk exposures, which c<strong>on</strong>sist of ec<strong>on</strong>omic capital, goodwill and unamortized<br />
other intangible assets. The total amount allocated is the higher of the Group’s overall ec<strong>on</strong>omic risk<br />
exposure or regulatory capital demand. In <strong>20</strong>07 and <strong>20</strong>08, this demand for regulatory capital was derived<br />
by assuming a Tier 1 ratio of 8.5 %. In <str<strong>on</strong>g><strong>20</strong>09</str<strong>on</strong>g>, the Group derived its internal demand for regulatory capital<br />
assuming a Tier 1 ratio of 10.0 %. If the Group’s average active equity exceeds the higher of the overall<br />
ec<strong>on</strong>omic risk exposure or the regulatory capital demand, this surplus is assigned to C&A.<br />
— Return <strong>on</strong> Average Active Equity in % is defined as income before income taxes less minority interest as<br />
a percentage of average active equity. These returns, which are based <strong>on</strong> average active equity, should<br />
not be compared to those of other companies without c<strong>on</strong>sidering the differences in the calculati<strong>on</strong> of such<br />
ratios.<br />
F - 63
<strong>20</strong>-F Notes to the C<strong>on</strong>solidated Financial Statements<br />
Segmental Results of Operati<strong>on</strong>s<br />
The following tables present the results of the business segments, including the rec<strong>on</strong>ciliati<strong>on</strong> to the c<strong>on</strong>soli-<br />
dated results under IFRS, for the years ended December 31, <str<strong>on</strong>g><strong>20</strong>09</str<strong>on</strong>g>, <strong>20</strong>08 and <strong>20</strong>07, respectively. The presen-<br />
tati<strong>on</strong> of revenues and n<strong>on</strong>interest expenses in prior periods has been adjusted for changes in accounting<br />
policy relating to premiums paid for financial guarantees and certain clearing and settlement fees, in accor-<br />
dance with Note [1].<br />
<str<strong>on</strong>g><strong>20</strong>09</str<strong>on</strong>g> Corporate and Investment <strong>Bank</strong> Private Clients and Asset Management Corporate<br />
in € m.<br />
(unless stated otherwise)<br />
Corporate<br />
<strong>Bank</strong>ing &<br />
Securities<br />
Global<br />
Transacti<strong>on</strong><br />
<strong>Bank</strong>ing<br />
3 The sum of corporate divisi<strong>on</strong>s does not necessarily equal the total of the corresp<strong>on</strong>ding group divisi<strong>on</strong> because of c<strong>on</strong>solidati<strong>on</strong> items between corporate divisi<strong>on</strong>s, which are<br />
eliminated at the group divisi<strong>on</strong> level. The same approach holds true for the sum of group divisi<strong>on</strong>s compared to Total Management <str<strong>on</strong>g>Report</str<strong>on</strong>g>ing.<br />
4 For management reporting purposes goodwill and other intangible assets with indefinite useful lives are explicitly assigned to the respective divisi<strong>on</strong>s. The Group’s average active<br />
equity is allocated to the business segments and to C<strong>on</strong>solidati<strong>on</strong> & Adjustments in proporti<strong>on</strong> to their ec<strong>on</strong>omic risk exposures, which comprise ec<strong>on</strong>omic capital, goodwill and<br />
unamortized other intangible assets.<br />
5 Includes a gain from the sale of industrial holdings (Daimler AG) of € 236 milli<strong>on</strong>, a reversal of impairment of intangible assets (Asset Management) of € 291 milli<strong>on</strong> (the related<br />
impairment had been recorded in <strong>20</strong>08), an impairment charge of € 278 milli<strong>on</strong> <strong>on</strong> industrial holdings and an impairment of intangible assets (Corporate Investments) of € 151 milli<strong>on</strong><br />
which are excluded from the Group’s target definiti<strong>on</strong>.<br />
F - 64<br />
Total Asset and<br />
Wealth<br />
Management<br />
Private &<br />
Business<br />
Clients<br />
Total<br />
Investments<br />
Total<br />
Management<br />
<str<strong>on</strong>g>Report</str<strong>on</strong>g>ing 5<br />
Net revenues1 16,197 2,606 18,804 2,688 5,576 8,264 1,044 28,112<br />
Provisi<strong>on</strong> for credit losses 1,789 27 1,816 17 790 806 8 2,630<br />
Total n<strong>on</strong>interest expenses 10,874 1,804 12,678 2,476 4,328 6,804 581 <strong>20</strong>,063<br />
therein:<br />
Depreciati<strong>on</strong>, depleti<strong>on</strong> and<br />
amortizati<strong>on</strong> 71 5 76 18 69 87 8 171<br />
Severance payments 138 7 145 106 192 297 0 442<br />
Policyholder benefits and claims 541 – 541 0 – 0 – 541<br />
Impairment of intangible assets 5 – 5 (291) – (291) 151 (134)<br />
Restructuring activities – – – – – – – –<br />
Minority interest (2) – (2) (7) 0 (7) (1) (10)<br />
Income (loss) before income taxes 3,537 776 4,312 <strong>20</strong>2 458 660 456 5,428<br />
Cost/income ratio 67 % 69 % 67 % 92 % 78 % 82 % 56 % 71 %<br />
Assets2, 3 1,308,2<strong>20</strong> 47,416 1,343,824 43,761 131,013 174,738 28,456 1,491,108<br />
Expenditures for additi<strong>on</strong>s to l<strong>on</strong>g-lived<br />
assets 73 17 89 56 42 98 395 583<br />
Risk-weighted assets 188,116 15,846 <strong>20</strong>3,962 12,<strong>20</strong>1 36,872 49,073 16,935 269,969<br />
Average active equity4 17,881 1,160 19,041 4,791 3,617 8,408 4,323 31,772<br />
Pre-tax return <strong>on</strong> average active equity <strong>20</strong> % 67 % 23 % 4 % 13 % 8 % 11 % 17 %<br />
1 Includes:<br />
Net interest income 7,480 1,037 8,516 381 3,493 3,874 (108) 12,283<br />
Net revenues from external customers 17,000 2,127 19,127 2,528 5,372 7,900 1,053 28,079<br />
Net intersegment revenues (802) 479 (323) 160 <strong>20</strong>4 364 (9) 33<br />
Net income (loss) from<br />
equity method investments (77) 1 (76) (14) 1 (12) 155 67<br />
2 Includes:<br />
Equity method investments 1,543 40 1,584 <strong>20</strong>2 42 244 5,911 7,739
<strong>20</strong>08 Corporate and Investment <strong>Bank</strong> Private Clients and Asset Management Corporate<br />
in € m.<br />
(unless stated otherwise)<br />
Corporate<br />
<strong>Bank</strong>ing &<br />
Securities<br />
Global<br />
Transacti<strong>on</strong><br />
<strong>Bank</strong>ing<br />
Total Asset and<br />
Wealth<br />
Management<br />
N/M – Not meaningful<br />
3 The sum of corporate divisi<strong>on</strong>s does not necessarily equal the total of the corresp<strong>on</strong>ding group divisi<strong>on</strong> because of c<strong>on</strong>solidati<strong>on</strong> items between corporate divisi<strong>on</strong>s, which are<br />
eliminated at the group divisi<strong>on</strong> level. The same approach holds true for the sum of group divisi<strong>on</strong>s compared to Total Management <str<strong>on</strong>g>Report</str<strong>on</strong>g>ing.<br />
4 For management reporting purposes goodwill and other intangible assets with indefinite useful lives are explicitly assigned to the respective divisi<strong>on</strong>s. The Group’s average active<br />
equity is allocated to the business segments and to C<strong>on</strong>solidati<strong>on</strong> & Adjustments in proporti<strong>on</strong> to their ec<strong>on</strong>omic risk exposures, which comprise ec<strong>on</strong>omic capital, goodwill and<br />
unamortized other intangible assets.<br />
5 Includes gains from the sale of industrial holdings (Daimler AG, Allianz SE and Linde AG) of € 1,228 milli<strong>on</strong>, a gain from the sale of the investment in Arcor AG & Co. KG of<br />
€ 97 milli<strong>on</strong> and an impairment of intangible assets (Asset Management) of € 572 milli<strong>on</strong>, which are excluded from the Group’s target definiti<strong>on</strong>.<br />
Net revenues1 428 2,774 3,<strong>20</strong>1 3,264 5,777 9,041 1,290 13,532<br />
Provisi<strong>on</strong> for credit losses 402 5 408 15 653 668 (1) 1,075<br />
Total n<strong>on</strong>interest expenses<br />
therein:<br />
Depreciati<strong>on</strong>, depleti<strong>on</strong> and<br />
8,550 1,663 10,213 3,794 4,178 7,972 95 18,279<br />
amortizati<strong>on</strong> 53 6 57 17 77 93 8 158<br />
Severance payments 334 3 337 29 84 113 0 450<br />
Policyholder benefits and claims (273) – (273) 18 – 18 – (256)<br />
Impairment of intangible assets 5 – 5 580 – 580 – 585<br />
Restructuring activities – – – – – – – –<br />
Minority interest (48) – (48) (<strong>20</strong>) 0 (<strong>20</strong>) 2 (66)<br />
Income (loss) before income taxes (8,476) 1,106 (7,371) (525) 945 4<strong>20</strong> 1,194 (5,756)<br />
Cost/income ratio N/M 60 % N/M 116 % 72 % 88 % 7 % 135 %<br />
Assets2, 3 Expenditures for additi<strong>on</strong>s to l<strong>on</strong>g-lived<br />
2,011,983 49,487 2,047,181 50,473 138,350 188,785 18,297 2,189,313<br />
assets 1,167 38 1,<strong>20</strong>5 13 56 70 0 1,275<br />
Risk-weighted assets 234,344 15,400 249,744 16,051 37,482 53,533 2,677 305,953<br />
Average active equity4 19,181 1,081 <strong>20</strong>,262 4,870 3,445 8,315 403 28,979<br />
Pre-tax return <strong>on</strong> average active equity (44) % 102 % (36) % (11) % 27 % 5 % N/M (<strong>20</strong>) %<br />
1 Includes:<br />
Net interest income 7,683 1,157 8,840 496 3,249 3,746 7 12,592<br />
Net revenues from external customers 546 2,814 3,359 3,418 5,463 8,881 1,259 13,499<br />
Net intersegment revenues<br />
Net income (loss) from<br />
(118) (40) (158) (154) 314 160 31 33<br />
equity method investments (110) 2 (108) 87 2 88 62 42<br />
2 Includes:<br />
Equity method investments 1,687 40 1,727 321 44 365 71 2,163<br />
F - 65<br />
Private &<br />
Business<br />
Clients<br />
Total<br />
Investments<br />
Total<br />
Management<br />
<str<strong>on</strong>g>Report</str<strong>on</strong>g>ing 5
<strong>20</strong>-F Notes to the C<strong>on</strong>solidated Financial Statements<br />
<strong>20</strong>07 Corporate and Investment <strong>Bank</strong> Private Clients and Asset Management Corporate<br />
in € m.<br />
(unless stated otherwise)<br />
Corporate<br />
<strong>Bank</strong>ing &<br />
Securities<br />
Global<br />
Transacti<strong>on</strong><br />
<strong>Bank</strong>ing<br />
N/M – Not meaningful<br />
3 The sum of corporate divisi<strong>on</strong>s does not necessarily equal the total of the corresp<strong>on</strong>ding group divisi<strong>on</strong> because of c<strong>on</strong>solidati<strong>on</strong> items between corporate divisi<strong>on</strong>s, which are<br />
eliminated at the group divisi<strong>on</strong> level. The same approach holds true for the sum of group divisi<strong>on</strong>s compared to Total Management <str<strong>on</strong>g>Report</str<strong>on</strong>g>ing.<br />
4 For management reporting purposes goodwill and other intangible assets with indefinite useful lives are explicitly assigned to the respective divisi<strong>on</strong>s. The Group’s average active<br />
equity is allocated to the business segments and to C<strong>on</strong>solidati<strong>on</strong> & Adjustments in proporti<strong>on</strong> to their ec<strong>on</strong>omic risk exposures, which comprise ec<strong>on</strong>omic capital, goodwill and<br />
unamortized other intangible assets.<br />
5 Includes gains from the sale of industrial holdings (Fiat S.p.A., Linde AG and Allianz SE) of € 514 milli<strong>on</strong>, income from equity method investments (<strong>Deutsche</strong> Interhotel Holding<br />
GmbH & Co. KG) of € 178 milli<strong>on</strong>, net of goodwill impairment charge of € 54 milli<strong>on</strong>, a gain from the sale of premises (sale/leaseback transacti<strong>on</strong> of 60 Wall Street) of € 317 milli<strong>on</strong><br />
and an impairment of intangible assets (Asset Management) of € 74 milli<strong>on</strong>, which are excluded from the Group’s target definiti<strong>on</strong>.<br />
Net revenues1 16,591 2,585 19,176 4,374 5,755 10,129 1,517 30,822<br />
Provisi<strong>on</strong> for credit losses 102 7 109 1 501 501 3 613<br />
Total n<strong>on</strong>interest expenses<br />
therein:<br />
Depreciati<strong>on</strong>, depleti<strong>on</strong> and<br />
12,253 1,633 13,886 3,453 4,108 7,560 2<strong>20</strong> 21,667<br />
amortizati<strong>on</strong> 52 8 57 <strong>20</strong> 82 102 17 176<br />
Severance payments 100 7 107 28 27 55 0 162<br />
Policyholder benefits and claims 116 – 116 73 – 73 – 188<br />
Impairment of intangible assets – – – 74 – 74 54 128<br />
Restructuring activities (4) (1) (4) (8) (1) (9) (0) (13)<br />
Minority interest 34 – 34 7 0 8 (5) 37<br />
Income (loss) before income taxes 4,<strong>20</strong>2 945 5,147 913 1,146 2,059 1,299 8,505<br />
Cost/income ratio 74 % 63 % 72 % 79 % 71 % 75 % 15 % 70 %<br />
Assets2, 3 Expenditures for additi<strong>on</strong>s to l<strong>on</strong>g-lived<br />
1,785,876 32,117 1,800,027 39,180 117,809 156,767 13,005 1,916,304<br />
assets 351 87 438 2 62 65 0 503<br />
Risk-weighted assets 218,663 18,363 237,026 15,864 69,722 85,586 4,891 327,503<br />
Average active equity4 19,619 1,095 <strong>20</strong>,714 5,109 3,430 8,539 473 29,725<br />
Pre-tax return <strong>on</strong> average active equity 21 % 86 % 25 % 18 % 33 % 24 % N/M 29 %<br />
1 Includes:<br />
Net interest income 4,362 1,106 5,467 165 3,083 3,248 (5) 8,710<br />
Net revenues from external customers 16,775 2,498 19,273 4,615 5,408 10,023 1,492 30,788<br />
Net intersegment revenues<br />
Net income (loss) from<br />
(184) 87 (97) (241) 347 106 25 34<br />
equity method investments 72 1 74 142 3 145 197 416<br />
2 Includes:<br />
Equity method investments 2,430 39 2,469 560 45 605 221 3,295<br />
F - 66<br />
Total Asset and<br />
Wealth<br />
Management<br />
Private &<br />
Business<br />
Clients<br />
Total<br />
Investments<br />
Total<br />
Management<br />
<str<strong>on</strong>g>Report</str<strong>on</strong>g>ing 5
1 Net interest income and n<strong>on</strong>interest income.<br />
Rec<strong>on</strong>ciliati<strong>on</strong> of Segmental Results of Operati<strong>on</strong>s to C<strong>on</strong>solidated Results of Operati<strong>on</strong>s<br />
The following table presents a rec<strong>on</strong>ciliati<strong>on</strong> of the total results of operati<strong>on</strong>s and total assets of the Group’s<br />
business segments under management reporting systems to the c<strong>on</strong>solidated financial statements for the<br />
years ended December 31, <str<strong>on</strong>g><strong>20</strong>09</str<strong>on</strong>g>, <strong>20</strong>08 and <strong>20</strong>07, respectively.<br />
<str<strong>on</strong>g><strong>20</strong>09</str<strong>on</strong>g> <strong>20</strong>08 <strong>20</strong>07<br />
Total C<strong>on</strong>soli- Total Total C<strong>on</strong>soli- Total Total C<strong>on</strong>soli- Total<br />
Manage- dati<strong>on</strong> & C<strong>on</strong>soliManagedati<strong>on</strong> & C<strong>on</strong>soli- Manage- dati<strong>on</strong> & C<strong>on</strong>soli-<br />
ment Adjust- datedmentAdjustdated ment Adjustdated in € m.<br />
<str<strong>on</strong>g>Report</str<strong>on</strong>g>ing ments<br />
<str<strong>on</strong>g>Report</str<strong>on</strong>g>ing ments<br />
<str<strong>on</strong>g>Report</str<strong>on</strong>g>ing ments<br />
Net revenues1 28,112 (159) 27,952 13,532 82 13,613 30,822 7 30,829<br />
Provisi<strong>on</strong> for credit losses 2,630 (0) 2,630 1,075 1 1,076 613 (1) 612<br />
N<strong>on</strong>interest expenses <strong>20</strong>,063 57 <strong>20</strong>,1<strong>20</strong> 18,279 (0) 18,278 21,667 (199) 21,468<br />
Minority interest (10) 10 – (66) 66 – 37 (37) –<br />
Income (loss) before income taxes 5,428 (226) 5,<strong>20</strong>2 (5,756) 15 (5,741) 8,505 243 8,749<br />
Assets 1,491,108 9,556 1,500,664 2,189,313 13,110 2,<strong>20</strong>2,423 1,916,304 8,699 1,925,003<br />
Risk-weighted assets 269,969 3,507 273,476 305,953 1,779 307,732 327,503 1,315 328,818<br />
Average active equity 31,772 2,840 34,613 28,979 3,100 32,079 29,725 368 30,093<br />
In <str<strong>on</strong>g><strong>20</strong>09</str<strong>on</strong>g>, loss before income taxes in C&A was € 226 milli<strong>on</strong>. N<strong>on</strong>interest expenses included charges related to<br />
litigati<strong>on</strong> provisi<strong>on</strong>s and other items outside the management resp<strong>on</strong>sibility of the business segments. Partly<br />
offsetting were value-added tax benefits. The main adjustments to net revenues in C&A in <str<strong>on</strong>g><strong>20</strong>09</str<strong>on</strong>g> were:<br />
— Adjustments related to positi<strong>on</strong>s which were marked-to-market for management reporting purposes and<br />
accounted for <strong>on</strong> an accrual basis under IFRS. These adjustments, which decreased net revenues by<br />
approximately € 535 milli<strong>on</strong>, relate to ec<strong>on</strong>omically hedged short-term positi<strong>on</strong>s as well as ec<strong>on</strong>omically<br />
hedged debt issuance trades and were mainly driven by movements in short-term interest rates in both<br />
euro and U.S. dollar.<br />
— Hedging of net investments in certain foreign operati<strong>on</strong>s decreased net revenues by approximately<br />
€ 225 milli<strong>on</strong>.<br />
— Derivative c<strong>on</strong>tracts used to hedge effects <strong>on</strong> shareholders’ equity, resulting from obligati<strong>on</strong>s under sharebased<br />
compensati<strong>on</strong> plans, resulted in an increase of approximately € 460 milli<strong>on</strong>.<br />
— The remainder of net revenues was due to net interest expenses which were not allocated to the business<br />
segments and items outside the management resp<strong>on</strong>sibility of the business segments. Such items include<br />
net funding expenses <strong>on</strong> n<strong>on</strong>divisi<strong>on</strong>alized assets/liabilities, e.g. deferred tax assets/liabilities, and net<br />
interest expenses related to tax refunds and accruals.<br />
F - 67
<strong>20</strong>-F Notes to the C<strong>on</strong>solidated Financial Statements<br />
In <strong>20</strong>08, income before income taxes in C&A was € 15 milli<strong>on</strong>. N<strong>on</strong>interest expenses included charges related<br />
to litigati<strong>on</strong> provisi<strong>on</strong>s offset by value-added tax benefits. The main adjustments to net revenues in C&A in<br />
<strong>20</strong>08 were:<br />
— Adjustments related to positi<strong>on</strong>s which were marked-to-market for management reporting purposes and<br />
accounted for <strong>on</strong> an accrual basis under IFRS. These adjustments, which increased net revenues by<br />
approximately € 450 milli<strong>on</strong>, relate to ec<strong>on</strong>omically hedged short-term positi<strong>on</strong>s and were driven by the<br />
significant volatility and overall decline of short-term interest rates.<br />
— Hedging of net investments in certain foreign operati<strong>on</strong>s decreased net revenues by approximately<br />
€ 160 milli<strong>on</strong>.<br />
— Trading results from the Group’s own shares and certain derivatives indexed to own shares are reflected<br />
in CB&S. The eliminati<strong>on</strong> of such results under IFRS resulted in an increase of approximately € 80 milli<strong>on</strong>.<br />
— Decreases related to the eliminati<strong>on</strong> of intra-Group rental income were € 37 milli<strong>on</strong>.<br />
— The remainder of net revenues was due to net interest expenses which were not allocated to the business<br />
segments and items outside the management resp<strong>on</strong>sibility of the business segments. Such items include<br />
net funding expenses <strong>on</strong> n<strong>on</strong>divisi<strong>on</strong>alized assets/liabilities, e.g. deferred tax assets/liabilities, and net<br />
interest expenses related to tax refunds and accruals.<br />
In <strong>20</strong>07, income before income taxes in C&A was € 243 milli<strong>on</strong>. N<strong>on</strong>interest expenses benefited primarily from<br />
a recovery of value-added tax paid in prior years, based <strong>on</strong> a refined methodology which was agreed with the<br />
tax authorities, and reimbursements associated with several litigati<strong>on</strong> cases. The main adjustments to net<br />
revenues in C&A in <strong>20</strong>07 were:<br />
— Adjustments related to positi<strong>on</strong>s which were marked-to-market for management reporting purposes and<br />
accounted for <strong>on</strong> an accrual basis under IFRS decreased net revenues by approximately € 100 milli<strong>on</strong>.<br />
— Trading results from the Group’s own shares are reflected in CB&S. The eliminati<strong>on</strong> of such results under<br />
IFRS resulted in an increase of approximately € 30 milli<strong>on</strong>.<br />
— Decreases related to the eliminati<strong>on</strong> of intra-Group rental income were € 39 milli<strong>on</strong>.<br />
— Net interest income related to tax refunds and accruals increased net revenues by € 69 milli<strong>on</strong>.<br />
— The remainder of net revenues was due to other corporate items outside the management resp<strong>on</strong>sibility of<br />
the business segments, such as net funding expenses for n<strong>on</strong>divisi<strong>on</strong>alized assets/liabilities and results<br />
from hedging the net investments in certain foreign operati<strong>on</strong>s.<br />
Assets and risk-weighted assets in C&A reflect corporate assets, such as deferred tax assets and central<br />
clearing accounts, outside of the management resp<strong>on</strong>sibility of the business segments.<br />
F - 68
Average active equity assigned to C&A reflects the residual amount of equity that is not allocated to the<br />
segments as described in the “Measurement of Segment Profit or Loss” secti<strong>on</strong> of this Note.<br />
Entity-Wide Disclosures<br />
The following tables present the net revenue comp<strong>on</strong>ents of the CIB and PCAM Group Divisi<strong>on</strong>s, for the<br />
years ended December 31, <str<strong>on</strong>g><strong>20</strong>09</str<strong>on</strong>g>, <strong>20</strong>08 and <strong>20</strong>07, respectively.<br />
F - 69<br />
Corporate and Investment <strong>Bank</strong><br />
in € m. <str<strong>on</strong>g><strong>20</strong>09</str<strong>on</strong>g> <strong>20</strong>08 <strong>20</strong>07<br />
Sales & Trading (equity) 2,734 (631) 4,612<br />
Sales & Trading (debt and other products) 9,795 116 8,401<br />
Total Sales & Trading 12,529 (514) 13,013<br />
Originati<strong>on</strong> (equity) 663 334 860<br />
Originati<strong>on</strong> (debt) 1,132 (713) 714<br />
Total originati<strong>on</strong> 1,795 (379) 1,573<br />
Advisory 402 589 1,089<br />
Loan products 1,623 1,393 1,067<br />
Transacti<strong>on</strong> services 2,606 2,774 2,585<br />
Other products (151) (661) (151)<br />
Total 18,804 3,<strong>20</strong>1 19,176<br />
Private Clients and Asset Management<br />
in € m. <str<strong>on</strong>g><strong>20</strong>09</str<strong>on</strong>g> <strong>20</strong>08 <strong>20</strong>07<br />
Portfolio/fund management 2,033 2,457 3,017<br />
Brokerage 1,456 1,891 2,172<br />
Loan/deposit 3,531 3,251 3,154<br />
Payments, account & remaining financial services 1,005 1,066 1,030<br />
Other products 239 376 756<br />
Total 8,264 9,041 10,129
<strong>20</strong>-F Notes to the C<strong>on</strong>solidated Financial Statements<br />
The following table presents total net revenues (before provisi<strong>on</strong>s for credit losses) by geographic area for the<br />
years ended December 31, <str<strong>on</strong>g><strong>20</strong>09</str<strong>on</strong>g>, <strong>20</strong>08 and <strong>20</strong>07, respectively. The informati<strong>on</strong> presented for CIB and PCAM<br />
has been classified based primarily <strong>on</strong> the locati<strong>on</strong> of the Group’s office in which the revenues are recorded.<br />
The informati<strong>on</strong> for CI and C&A is presented <strong>on</strong> a global level <strong>on</strong>ly, as management resp<strong>on</strong>sibility for these<br />
areas is held centrally.<br />
in € m. <str<strong>on</strong>g><strong>20</strong>09</str<strong>on</strong>g> <strong>20</strong>08 <strong>20</strong>07<br />
Germany:<br />
CIB 2,353 2,997 3,012<br />
PCAM 4,769 5,<strong>20</strong>8 5,514<br />
Total Germany<br />
Europe, Middle East and Africa:<br />
7,122 8,<strong>20</strong>5 8,525<br />
CIB 8,483 (629) 7,713<br />
PCAM 2,482 2,391 2,816<br />
Total Europe, Middle East and Africa 1 Americas (primarily United States):<br />
10,964 1,762 10,530<br />
CIB 5,295 (838) 4,628<br />
PCAM 724 971 1,331<br />
Total Americas 6,0<strong>20</strong> 133 5,959<br />
Asia/Pacific:<br />
CIB 2,672 1,671 3,823<br />
PCAM 289 471 468<br />
Total Asia/Pacific 2,961 2,142 4,291<br />
CI 1,044 1,290 1,517<br />
C<strong>on</strong>solidati<strong>on</strong> & Adjustments (159) 82 7<br />
C<strong>on</strong>solidated net revenues2 27,952 13,613 30,829<br />
1 For the years ended December 31, <str<strong>on</strong>g><strong>20</strong>09</str<strong>on</strong>g> and <strong>20</strong>07, respectively, the United Kingdom accounted for roughly 60 % of these revenues. The United Kingdom<br />
reported negative revenues for the year ended December 31, <strong>20</strong>08.<br />
2 C<strong>on</strong>solidated net revenues comprise interest and similar income, interest expenses and total n<strong>on</strong>interest income (including net commissi<strong>on</strong> and fee<br />
income). Revenues are attributed to countries based <strong>on</strong> the locati<strong>on</strong> in which the Group’s booking office is located. The locati<strong>on</strong> of a transacti<strong>on</strong> <strong>on</strong> the<br />
Group’s books is sometimes different from the locati<strong>on</strong> of the headquarters or other offices of a customer and different from the locati<strong>on</strong> of the Group’s<br />
pers<strong>on</strong>nel who entered into or facilitated the transacti<strong>on</strong>. Where the Group records a transacti<strong>on</strong> involving its staff and customers and other third parties<br />
in different locati<strong>on</strong>s frequently depends <strong>on</strong> other c<strong>on</strong>siderati<strong>on</strong>s, such as the nature of the transacti<strong>on</strong>, regulatory c<strong>on</strong>siderati<strong>on</strong>s and transacti<strong>on</strong><br />
processing c<strong>on</strong>siderati<strong>on</strong>s.<br />
F - 70
Notes to the C<strong>on</strong>solidated Income Statement<br />
[5] Net Interest Income and Net Gains (Losses) <strong>on</strong> Financial Assets/Liabilities<br />
at Fair Value through Profit or Loss<br />
Net Interest Income<br />
The following are the comp<strong>on</strong>ents of interest and similar income and interest expense.<br />
in € m. <str<strong>on</strong>g><strong>20</strong>09</str<strong>on</strong>g> <strong>20</strong>08 <strong>20</strong>07<br />
Interest and similar income:<br />
Interest-earning deposits with banks 633 1,313 1,384<br />
Central bank funds sold and securities purchased under resale agreements 3<strong>20</strong> 964 1,090<br />
Securities borrowed 67 1,011 3,784<br />
Financial assets at fair value through profit or loss 13,634 34,938 42,9<strong>20</strong><br />
Interest income <strong>on</strong> financial assets available for sale 496 1,260 1,596<br />
Dividend income <strong>on</strong> financial assets available for sale 91 312 <strong>20</strong>0<br />
Loans 10,555 12,269 10,901<br />
Other 1,157 2,482 2,800<br />
Total interest and similar income 26,953 54,549 64,675<br />
Interest expense:<br />
Interest-bearing deposits 5,119 13,015 17,371<br />
Central bank funds purchased and securities sold under repurchase<br />
agreements 280 4,425 6,869<br />
Securities loaned 269 304 996<br />
Financial liabilities at fair value through profit or loss 4,503 14,811 <strong>20</strong>,989<br />
Other short-term borrowings 798 1,905 2,665<br />
L<strong>on</strong>g-term debt 2,612 5,273 4,912<br />
Trust preferred securities 680 571 339<br />
Other 233 1,792 1,685<br />
Total interest expense 14,494 42,096 55,826<br />
Net interest income 12,459 12,453 8,849<br />
Interest income recorded <strong>on</strong> impaired financial assets was € 133 milli<strong>on</strong>, € 65 milli<strong>on</strong> and € 57 milli<strong>on</strong> for the<br />
years ended December 31, <str<strong>on</strong>g><strong>20</strong>09</str<strong>on</strong>g>, <strong>20</strong>08 and <strong>20</strong>07, respectively.<br />
F - 71
<strong>20</strong>-F Notes to the C<strong>on</strong>solidated Income Statement<br />
Net Gains (Losses) <strong>on</strong> Financial Assets/Liabilities at Fair Value through Profit or Loss<br />
The following are the comp<strong>on</strong>ents of net gains (losses) <strong>on</strong> financial assets/liabilities at fair value through profit<br />
or loss.<br />
in € m.<br />
Trading income:<br />
<str<strong>on</strong>g><strong>20</strong>09</str<strong>on</strong>g> <strong>20</strong>08 <strong>20</strong>07<br />
Sales & Trading (equity) 2,148 (9,615) 3,797<br />
Sales & Trading (debt and other products) 5,668 (25,369) (427)<br />
Total Sales & Trading 7,816 (34,984) 3,370<br />
Other trading income (2,182) 1,155 548<br />
Total trading income<br />
Net gains (losses) <strong>on</strong> financial assets/liabilities designated at fair value<br />
through profit or loss:<br />
Breakdown by financial asset/liability category:<br />
5,634 (33,829) 3,918<br />
Securities purchased/sold under resale/repurchase agreements (73) – (41)<br />
Securities borrowed/loaned (2) (4) 33<br />
Loans and loan commitments 3,929 (4,016) (570)<br />
Deposits (162) 139 10<br />
L<strong>on</strong>g-term debt 1 (2,550) 28,630 3,782<br />
Other financial assets/liabilities designated at fair value through profit or loss<br />
Total net gains (losses) <strong>on</strong> financial assets/liabilities designated at fair value<br />
333 (912) 43<br />
through profit or loss<br />
Total net gains (losses) <strong>on</strong> financial assets/liabilities at fair value through<br />
1,475 23,837 3,257<br />
profit or loss 7,109 (9,992) 7,175<br />
1 Includes € 176 milli<strong>on</strong>, € 17.9 billi<strong>on</strong> and € 3.5 billi<strong>on</strong> from securitizati<strong>on</strong> structures for the years ended December 31, <str<strong>on</strong>g><strong>20</strong>09</str<strong>on</strong>g>, December 31, <strong>20</strong>08 and<br />
December 31, <strong>20</strong>07, respectively. Fair value movements <strong>on</strong> related instruments of € (49) milli<strong>on</strong>, € (<strong>20</strong>.1) billi<strong>on</strong> and € (4.4) billi<strong>on</strong> for December<br />
31, <str<strong>on</strong>g><strong>20</strong>09</str<strong>on</strong>g>, December 31, <strong>20</strong>08 and December 31, <strong>20</strong>07, respectively, are reported within trading income. Both are reported under Sales & Trading<br />
(debt and other products). The total of these gains and losses represents the Group’s share of the losses in these c<strong>on</strong>solidated securitizati<strong>on</strong> structures.<br />
Combined Overview<br />
The Group’s trading and risk management businesses include significant activities in interest rate instruments<br />
and related derivatives. Under IFRS, interest and similar income earned from trading instruments and financial<br />
instruments designated at fair value through profit or loss (e.g., coup<strong>on</strong> and dividend income), and the<br />
costs of funding net trading positi<strong>on</strong>s, are part of net interest income. The Group’s trading activities can<br />
periodically shift income between net interest income and net gains (losses) of financial assets/liabilities at<br />
fair value through profit or loss depending <strong>on</strong> a variety of factors, including risk management strategies. In<br />
order to provide a more business-focused presentati<strong>on</strong>, the Group combines net interest income and net<br />
gains (losses) of financial assets/liabilities at fair value through profit or loss by group divisi<strong>on</strong> and by product<br />
within the Corporate and Investment <strong>Bank</strong>.<br />
F - 72
The following table presents data relating to the Group’s combined net interest and net gains (losses) <strong>on</strong><br />
financial assets/liabilities at fair value through profit or loss by group divisi<strong>on</strong> and, for the Corporate and<br />
Investment <strong>Bank</strong>, by product, for the years ended December 31, <str<strong>on</strong>g><strong>20</strong>09</str<strong>on</strong>g>, <strong>20</strong>08 and <strong>20</strong>07, respectively.<br />
in € m. <str<strong>on</strong>g><strong>20</strong>09</str<strong>on</strong>g> <strong>20</strong>08 <strong>20</strong>07<br />
Net interest income 12,459 12,453 8,849<br />
Net gains (losses) <strong>on</strong> financial assets/liabilities at fair value through<br />
profit or loss 7,109 (9,992) 7,175<br />
Total net interest income and net gains (losses) <strong>on</strong><br />
financial assets/liabilities at fair value through profit or loss 19,568 2,461 16,024<br />
Net interest income and net gains (losses) <strong>on</strong> financial assets/liabilities at<br />
fair value through profit or loss by Group Divisi<strong>on</strong>/CIB product:<br />
Sales & Trading (equity) 2,047 (1,895) 3,117<br />
Sales & Trading (debt and other products) 9,735 317 7,483<br />
Total Sales & Trading 11,782 (1,578) 10,600<br />
Loan products 1 767 1,014 499<br />
Transacti<strong>on</strong> services 1,177 1,358 1,297<br />
Remaining products 2 239 (1,821) (118)<br />
Total Corporate and Investment <strong>Bank</strong> 13,966 (1,027) 12,278<br />
Private Clients and Asset Management 4,160 3,871 3,529<br />
Corporate Investments 793 (172) 157<br />
C<strong>on</strong>solidati<strong>on</strong> & Adjustments 649 (211) 61<br />
Total net interest income and net gains (losses) <strong>on</strong><br />
financial assets/liabilities at fair value through profit or loss 19,568 2,461 16,024<br />
1 Includes the net interest spread <strong>on</strong> loans as well as the fair value changes of credit default swaps and loans designated at fair value through profit or loss.<br />
2 Includes net interest income and net gains (losses) <strong>on</strong> financial assets/liabilities at fair value through profit or loss of originati<strong>on</strong>, advisory and other<br />
products.<br />
[6] Commissi<strong>on</strong>s and Fee Income<br />
The following are the comp<strong>on</strong>ents of commissi<strong>on</strong> and fee income and expense.<br />
in € m. <str<strong>on</strong>g><strong>20</strong>09</str<strong>on</strong>g> <strong>20</strong>08 <strong>20</strong>07<br />
Commissi<strong>on</strong> and fee income and expense:<br />
Commissi<strong>on</strong> and fee income 11,377 12,449 15,199<br />
Commissi<strong>on</strong> and fee expense 2,466 2,708 2,917<br />
Net commissi<strong>on</strong>s and fee income 8,911 9,741 12,282<br />
in € m. <str<strong>on</strong>g><strong>20</strong>09</str<strong>on</strong>g> <strong>20</strong>08 <strong>20</strong>07<br />
Net commissi<strong>on</strong>s and fee income:<br />
Net commissi<strong>on</strong>s and fees from fiduciary activities 2,925 3,414 3,965<br />
Net commissi<strong>on</strong>s, brokers’ fees, mark-ups <strong>on</strong> securities underwriting and other<br />
securities activities 3,449 3,790 5,490<br />
Net fees for other customer services 2,537 2,537 2,827<br />
Net commissi<strong>on</strong>s and fee income 8,911 9,741 12,282<br />
F - 73
<strong>20</strong>-F Notes to the C<strong>on</strong>solidated Income Statement<br />
[7] Net Gains (Losses) <strong>on</strong> Financial Assets Available for Sale<br />
The following are the comp<strong>on</strong>ents of net gains (losses) <strong>on</strong> financial assets available for sale.<br />
in € m.<br />
Net gains (losses) <strong>on</strong> financial assets available for sale:<br />
<str<strong>on</strong>g><strong>20</strong>09</str<strong>on</strong>g> <strong>20</strong>08 <strong>20</strong>07<br />
Net gains (losses) <strong>on</strong> debt securities: 37 (534) (192)<br />
Net gains (losses) from disposal 119 17 8<br />
Impairments (82) (551) (<strong>20</strong>0)<br />
Net gains (losses) <strong>on</strong> equity securities: (295) 1,156 944<br />
Net gains (losses) from disposal 443 1,428 1,004<br />
Impairments (738) (272) (60)<br />
Net gains (losses) <strong>on</strong> loans: (56) (63) (12)<br />
Net gains (losses) from disposal 9 (12) (8)<br />
Impairments (81) (52) (4)<br />
Reversal of impairments 16 1 –<br />
Net gains (losses) <strong>on</strong> other equity interests: (89) 107 53<br />
Net gains (losses) from disposal – 108 60<br />
Impairments (89) (1) (7)<br />
Total net gains (losses) <strong>on</strong> financial assets available for sale (403) 666 793<br />
[8] Other Income<br />
The following are the comp<strong>on</strong>ents of other income.<br />
in € m.<br />
Other income:<br />
<str<strong>on</strong>g><strong>20</strong>09</str<strong>on</strong>g> <strong>20</strong>08 <strong>20</strong>07<br />
Net income (loss) from investment properties (117) 8 29<br />
Net gains (losses) <strong>on</strong> disposal of investment properties (2) – 8<br />
Net gains (losses) <strong>on</strong> disposal of c<strong>on</strong>solidated subsidiaries 61 85 321<br />
Net gains (losses) <strong>on</strong> disposal of loans 2 50 44<br />
Insurance premiums 1 129 308 134<br />
Remaining other income2 (256) 248 841<br />
Total other income (183) 699 1,377<br />
1 Net of reinsurance premiums paid. The development is primarily driven by Abbey Life Assurance Company Limited.<br />
2 The decrease from <strong>20</strong>08 to <str<strong>on</strong>g><strong>20</strong>09</str<strong>on</strong>g> in remaining other income was primarily driven by an impairment charge of € 575 milli<strong>on</strong> <strong>on</strong> The Cosmopolitan Resort<br />
and Casino property recorded in <str<strong>on</strong>g><strong>20</strong>09</str<strong>on</strong>g>. The decrease from <strong>20</strong>07 to <strong>20</strong>08 was primarily driven by the n<strong>on</strong>-recurrence of gains of € 317 milli<strong>on</strong> from the<br />
sale/leaseback of the Group’s 60 Wall Street premises in New York and € 148 milli<strong>on</strong> other income from c<strong>on</strong>solidated investments recorded in <strong>20</strong>07.<br />
F - 74
[9] General and Administrative Expenses<br />
The following are the comp<strong>on</strong>ents of general and administrative expenses.<br />
in € m. <str<strong>on</strong>g><strong>20</strong>09</str<strong>on</strong>g> <strong>20</strong>08 <strong>20</strong>07<br />
General and administrative expenses:<br />
IT costs 1,759 1,818 1,863<br />
Occupancy, furniture and equipment expenses 1,457 1,434 1,347<br />
Professi<strong>on</strong>al service fees 1,088 1,164 1,257<br />
Communicati<strong>on</strong> and data services 672 698 678<br />
Travel and representati<strong>on</strong> expenses 408 504 554<br />
Payment, clearing and custodian services 406 415 436<br />
Marketing expenses 278 373 411<br />
Other expenses 2,334 1,933 1,492<br />
Total general and administrative expenses 8,402 8,339 8,038<br />
Other expenses include, am<strong>on</strong>g other items, regulatory and insurance related costs, other taxes, operati<strong>on</strong>al<br />
losses and other n<strong>on</strong>-compensati<strong>on</strong> staff related expenses. The increase in other expenses was mainly driven<br />
by charges of € 316 milli<strong>on</strong> from a legal settlement with Huntsman Corp. and of € <strong>20</strong>0 milli<strong>on</strong> related to the<br />
Group’s offer to repurchase certain products from private investors.<br />
[10] Earnings per Comm<strong>on</strong> Share<br />
Basic earnings per comm<strong>on</strong> share amounts are computed by dividing net income (loss) attributable to<br />
<strong>Deutsche</strong> <strong>Bank</strong> shareholders by the average number of comm<strong>on</strong> shares outstanding during the year. The<br />
average number of comm<strong>on</strong> shares outstanding is defined as the average number of comm<strong>on</strong> shares issued,<br />
reduced by the average number of shares in treasury and by the average number of shares that will be<br />
acquired under physically-settled forward purchase c<strong>on</strong>tracts, and increased by undistributed vested shares<br />
awarded under deferred share plans.<br />
Diluted earnings per share assumes the c<strong>on</strong>versi<strong>on</strong> into comm<strong>on</strong> shares of outstanding securities or other<br />
c<strong>on</strong>tracts to issue comm<strong>on</strong> stock, such as share opti<strong>on</strong>s, c<strong>on</strong>vertible debt, unvested deferred share awards<br />
and forward c<strong>on</strong>tracts. The aforementi<strong>on</strong>ed instruments are <strong>on</strong>ly included in the calculati<strong>on</strong> of diluted earnings<br />
per share if they are dilutive in the respective reporting period.<br />
In December <strong>20</strong>08, the Group decided to amend existing forward purchase c<strong>on</strong>tracts covering 33.6 milli<strong>on</strong><br />
<strong>Deutsche</strong> <strong>Bank</strong> comm<strong>on</strong> shares from physical to net-cash settlement and these instruments are no l<strong>on</strong>ger<br />
included in the computati<strong>on</strong> of basic and diluted earnings per share.<br />
F - 75
<strong>20</strong>-F Notes to the C<strong>on</strong>solidated Income Statement<br />
The following table presents the computati<strong>on</strong> of basic and diluted earnings per share for the years ended<br />
December 31, <str<strong>on</strong>g><strong>20</strong>09</str<strong>on</strong>g>, <strong>20</strong>08 and <strong>20</strong>07, respectively.<br />
in € m. <str<strong>on</strong>g><strong>20</strong>09</str<strong>on</strong>g> <strong>20</strong>08 <strong>20</strong>07<br />
Net income (loss) attributable to <strong>Deutsche</strong> <strong>Bank</strong> shareholders –<br />
numerator for basic earnings per share 4,973 (3,835) 6,474<br />
Effect of dilutive securities:<br />
Forwards and opti<strong>on</strong>s – – –<br />
C<strong>on</strong>vertible debt 2 (1) –<br />
Net income (loss) attributable to <strong>Deutsche</strong> <strong>Bank</strong> shareholders after assumed<br />
c<strong>on</strong>versi<strong>on</strong>s – numerator for diluted earnings per share 4,975 (3,836) 6,474<br />
Number of shares in m.<br />
Weighted-average shares outstanding – denominator for basic earnings per share 628.1 504.1 474.2<br />
Effect of dilutive securities:<br />
Forwards 0.0 0.0 0.3<br />
Employee stock compensati<strong>on</strong> opti<strong>on</strong>s 0.1 0.0 1.8<br />
C<strong>on</strong>vertible debt 0.7 0.1 0.7<br />
Deferred shares 26.4 0.0 18.6<br />
Other (including trading opti<strong>on</strong>s) 0.1 0.0 0.5<br />
Dilutive potential comm<strong>on</strong> shares 27.3 0.1 21.9<br />
Adjusted weighted-average shares after assumed c<strong>on</strong>versi<strong>on</strong>s –<br />
denominator for diluted earnings per share 655.4 504.2 496.1<br />
in € <str<strong>on</strong>g><strong>20</strong>09</str<strong>on</strong>g> <strong>20</strong>08 <strong>20</strong>07<br />
Basic earnings per share 7.92 (7.61) 13.65<br />
Diluted earnings per share 7.59 (7.61) 13.05<br />
Due to the net loss situati<strong>on</strong>, potentially dilutive instruments were generally not c<strong>on</strong>sidered for the calculati<strong>on</strong><br />
of diluted earnings per share for the year ended December 31, <strong>20</strong>08, because to do so would have been antidilutive.<br />
Under a net income situati<strong>on</strong> however, the number of adjusted weighted-average shares after<br />
assumed c<strong>on</strong>versi<strong>on</strong>s for the year ended December 31, <strong>20</strong>08 would have increased by 31.2 milli<strong>on</strong> shares.<br />
As of December 31, <str<strong>on</strong>g><strong>20</strong>09</str<strong>on</strong>g>, <strong>20</strong>08 and <strong>20</strong>07, the following instruments were outstanding and were not included<br />
in the calculati<strong>on</strong> of diluted earnings per share, because to do so would have been anti-dilutive.<br />
Number of shares in m. <str<strong>on</strong>g><strong>20</strong>09</str<strong>on</strong>g> <strong>20</strong>08 <strong>20</strong>07<br />
Forward purchase c<strong>on</strong>tracts 0.0 0.0 39.4<br />
Put opti<strong>on</strong>s sold 0.0 0.1 0.2<br />
Call opti<strong>on</strong>s sold 0.0 0.3 0.7<br />
Employee stock compensati<strong>on</strong> opti<strong>on</strong>s 0.3 1.8 0.1<br />
Deferred shares 0.0 26.9 0.6<br />
F - 76
Notes to the C<strong>on</strong>solidated Balance Sheet<br />
[11] Financial Assets/Liabilities at Fair Value through Profit or Loss<br />
The following are the comp<strong>on</strong>ents of financial assets and liabilities at fair value through profit or loss.<br />
in € m.<br />
Trading assets:<br />
Dec 31, <str<strong>on</strong>g><strong>20</strong>09</str<strong>on</strong>g> Dec 31, <strong>20</strong>08<br />
Trading securities <strong>20</strong>6,710 <strong>20</strong>4,994<br />
Other trading assets 1 28,<strong>20</strong>0 42,468<br />
Total trading assets 234,910 247,462<br />
Positive market values from derivative financial instruments<br />
Financial assets designated at fair value through profit or loss:<br />
596,410 1,224,493<br />
Securities purchased under resale agreements 89,977 94,726<br />
Securities borrowed 19,987 29,079<br />
Loans 12,964 18,739<br />
Other financial assets designated at fair value through profit or loss 11,072 9,312<br />
Total financial assets designated at fair value through profit or loss 134,000 151,856<br />
Total financial assets at fair value through profit or loss 965,3<strong>20</strong> 1,623,811<br />
1 Includes traded loans of € 21,847 milli<strong>on</strong> and € 31,421 milli<strong>on</strong> at December 31, <str<strong>on</strong>g><strong>20</strong>09</str<strong>on</strong>g> and <strong>20</strong>08 respectively.<br />
in € m.<br />
Trading liabilities:<br />
Dec 31, <str<strong>on</strong>g><strong>20</strong>09</str<strong>on</strong>g> Dec 31, <strong>20</strong>08<br />
Trading securities 62,402 56,967<br />
Other trading liabilities 2,099 11,<strong>20</strong>1<br />
Total trading liabilities 64,501 68,168<br />
Negative market values from derivative financial instruments<br />
Financial liabilities designated at fair value through profit or loss:<br />
576,973 1,181,617<br />
Securities sold under repurchase agreements 52,795 52,633<br />
Loan commitments 447 2,352<br />
L<strong>on</strong>g-term debt 15,395 18,439<br />
Other financial liabilities designated at fair value through profit or loss 4,885 4,579<br />
Total financial liabilities designated at fair value through profit or loss 73,522 78,003<br />
Investment c<strong>on</strong>tract liabilities 1 7,278 5,977<br />
Total financial liabilities at fair value through profit or loss 722,274 1,333,765<br />
1 These are investment c<strong>on</strong>tracts where the policy terms and c<strong>on</strong>diti<strong>on</strong>s result in their redempti<strong>on</strong> value equaling fair value. See Note [39] for more detail<br />
<strong>on</strong> these c<strong>on</strong>tracts.<br />
Loans and Loan Commitments designated at Fair Value through Profit or Loss<br />
The Group has designated various lending relati<strong>on</strong>ships at fair value through profit or loss. Lending facilities<br />
c<strong>on</strong>sist of drawn loan assets and undrawn irrevocable loan commitments. The maximum exposure to credit<br />
risk <strong>on</strong> a drawn loan is its fair value. The Group’s maximum exposure to credit risk <strong>on</strong> drawn loans, including<br />
securities purchased under resale agreements and securities borrowed, was € 123 billi<strong>on</strong> and € 143 billi<strong>on</strong> as<br />
of December 31, <str<strong>on</strong>g><strong>20</strong>09</str<strong>on</strong>g>, and <strong>20</strong>08, respectively. Exposure to credit risk also exists for undrawn irrevocable<br />
loan commitments.<br />
F - 77
<strong>20</strong>-F Notes to the C<strong>on</strong>solidated Balance Sheet<br />
The credit risk <strong>on</strong> the securities purchased under resale agreements and securities borrowed designated<br />
under the fair value opti<strong>on</strong> was € 110.0 billi<strong>on</strong> and € 123.8 billi<strong>on</strong> at December 31, <str<strong>on</strong>g><strong>20</strong>09</str<strong>on</strong>g> and December 31,<br />
<strong>20</strong>08 respectively, this credit risk is mitigated by the holding of collateral. The valuati<strong>on</strong> of these instruments<br />
takes into account the credit enhancement in the form of the collateral received. As such there is no material<br />
movement during the year or cumulatively due to movements in counterparty credit risk <strong>on</strong> these instruments.<br />
The credit risk <strong>on</strong> the loans designated under the fair value opti<strong>on</strong> of € 13.0 billi<strong>on</strong> and € 18.7 billi<strong>on</strong> as of<br />
December 31, <str<strong>on</strong>g><strong>20</strong>09</str<strong>on</strong>g> and <strong>20</strong>08, respectively, is mitigated in a number of ways. The majority of the drawn loan<br />
balance is mitigated through the purchase of credit default swaps, the remainder is mitigated by the holding of<br />
collateral.<br />
The valuati<strong>on</strong> of collateralized loans takes into account the credit enhancement received. Where the instru-<br />
ments are over-collateralized there is no material movement in valuati<strong>on</strong> during the year or cumulatively due<br />
to movements in counterparty credit risk, rather the fair value movement of the instruments is due to market<br />
risk movements in the value of the collateral and interest rates.<br />
Of the total drawn and undrawn lending facilities designated at fair value, the Group managed counterparty<br />
credit risk by purchasing credit default swap protecti<strong>on</strong> <strong>on</strong> facilities with a noti<strong>on</strong>al value of € 48.9 billi<strong>on</strong> and<br />
€ 50.5 billi<strong>on</strong> as of December 31, <str<strong>on</strong>g><strong>20</strong>09</str<strong>on</strong>g>, and <strong>20</strong>08, respectively. The noti<strong>on</strong>al value of credit derivatives used<br />
to mitigate the exposure to credit risk <strong>on</strong> drawn loans and undrawn irrevocable loan commitments designated<br />
at fair value was € 32.7 billi<strong>on</strong> and € 36.5 billi<strong>on</strong> as of December 31, <str<strong>on</strong>g><strong>20</strong>09</str<strong>on</strong>g>, and <strong>20</strong>08, respectively.<br />
The changes in fair value attributable to movements in counterparty credit risk are detailed in the table below.<br />
in € m.<br />
Changes in fair value of loans and loan commitments<br />
due to credit risk<br />
The change in fair value of the loans and loan commitments attributable to movements in the counterparty’s<br />
credit risk is determined as the amount of change in its fair value that is not attributable to changes in market<br />
c<strong>on</strong>diti<strong>on</strong>s that give rise to market risk. For collateralized loans, including securities purchased under resale<br />
agreements and securities borrowed, the collateral received acts to mitigate the counterparty credit risk. The<br />
fair value movement due to counterparty credit risk <strong>on</strong> securities purchased under resale agreements was not<br />
material due to the credit enhancement received.<br />
F - 78<br />
Dec 31, <str<strong>on</strong>g><strong>20</strong>09</str<strong>on</strong>g> Dec 31, <strong>20</strong>08<br />
Loans Loan<br />
commitments<br />
Loans Loan<br />
commitments<br />
Cumulative change in the fair value 28 (24) (870) (2,731)<br />
<str<strong>on</strong>g>Annual</str<strong>on</strong>g> change in the fair value in <str<strong>on</strong>g><strong>20</strong>09</str<strong>on</strong>g>/<strong>20</strong>08<br />
Changes in fair value of credit derivatives<br />
used to mitigate credit risk<br />
938 1,565 (815) (2,558)<br />
Cumulative change in the fair value (47) (51) 844 2,674<br />
<str<strong>on</strong>g>Annual</str<strong>on</strong>g> change in the fair value in <str<strong>on</strong>g><strong>20</strong>09</str<strong>on</strong>g>/<strong>20</strong>08 (1,250) (1,355) 784 2,482
Financial Liabilities designated at Fair Value through Profit or Loss<br />
The fair value of a financial liability incorporates the credit risk of that financial liability. The changes in fair<br />
value of financial liabilities designated at fair value through profit or loss in issue at the year-end attributable<br />
to movements in the Group’s credit risk are detailed in the table below. The changes in the fair value of finan-<br />
cial liabilities designated at fair value through profit or loss issued by c<strong>on</strong>solidated SPEs have been excluded<br />
as this is not related to the Group’s credit risk but to that of the legally isolated SPE, which is dependent <strong>on</strong><br />
the collateral it holds.<br />
in € m. Dec 31, <str<strong>on</strong>g><strong>20</strong>09</str<strong>on</strong>g> Dec 31, <strong>20</strong>08<br />
Cumulative change in the fair value 30 364<br />
<str<strong>on</strong>g>Annual</str<strong>on</strong>g> change in the fair value in <str<strong>on</strong>g><strong>20</strong>09</str<strong>on</strong>g>/<strong>20</strong>08 (264) 349<br />
The fair value of the debt issued takes into account the credit risk of the Group. Where the instrument is<br />
quoted in an active market, the movement in fair value due to credit risk is calculated as the amount of<br />
change in fair value that is not attributable to changes in market c<strong>on</strong>diti<strong>on</strong>s that give rise to market risk.<br />
Where the instrument is not quoted in an active market, the fair value is calculated using a valuati<strong>on</strong><br />
technique that incorporates credit risk by discounting the c<strong>on</strong>tractual cash flows <strong>on</strong> the debt using a creditadjusted<br />
yield curve which reflects the level at which the Group could issue similar instruments at the reporting<br />
date.<br />
The credit risk <strong>on</strong> undrawn irrevocable loan commitments is predominantly counterparty credit risk. The<br />
change in fair value due to counterparty credit risk <strong>on</strong> undrawn irrevocable loan commitments has been dis-<br />
closed with the counterparty credit risk <strong>on</strong> the drawn loans.<br />
For all financial liabilities designated at fair value through profit or loss the amount that the Group would c<strong>on</strong>tractually<br />
be required to pay at maturity was € 36.8 billi<strong>on</strong> and € 33.7 billi<strong>on</strong> more than the carrying amount as<br />
of December 31, <str<strong>on</strong>g><strong>20</strong>09</str<strong>on</strong>g> and <strong>20</strong>08, respectively. The amount c<strong>on</strong>tractually required to pay at maturity assumes<br />
the liability is extinguished at the earliest c<strong>on</strong>tractual maturity that the Group can be required to repay. When<br />
the amount payable is not fixed, the amount the Group would c<strong>on</strong>tractually be required to pay is determined<br />
by reference to the c<strong>on</strong>diti<strong>on</strong>s existing at the reporting date.<br />
The majority of the difference between the fair value of financial liabilities designated at fair value through<br />
profit or loss and the c<strong>on</strong>tractual cash flows which will occur at maturity is attributable to undrawn loan com-<br />
mitments where the c<strong>on</strong>tractual cash flow at maturity assumes full drawdown of the facility. The difference<br />
between the fair value and the c<strong>on</strong>tractual amount repayable at maturity excluding the amount of undrawn<br />
loan commitments designated at fair value through profit or loss was € 0.6 billi<strong>on</strong> and € 1.4 billi<strong>on</strong> as of<br />
December 31, <str<strong>on</strong>g><strong>20</strong>09</str<strong>on</strong>g>, and <strong>20</strong>08, respectively.<br />
F - 79
<strong>20</strong>-F Notes to the C<strong>on</strong>solidated Balance Sheet<br />
[12] Amendments to IAS 39 and IFRS 7, “Reclassificati<strong>on</strong> of Financial Assets”<br />
Under the amendments to IAS 39 and IFRS 7 certain financial assets were reclassified in the sec<strong>on</strong>d half of<br />
<strong>20</strong>08 and the first quarter of <str<strong>on</strong>g><strong>20</strong>09</str<strong>on</strong>g> from the financial assets at fair value through profit or loss and the avail-<br />
able for sale classificati<strong>on</strong>s into the loans classificati<strong>on</strong>. The reclassificati<strong>on</strong>s were made in instances where<br />
management believed that the expected repayment of the assets exceeded their estimated fair values, which<br />
reflected the significantly reduced liquidity in the financial markets, and that returns <strong>on</strong> these assets would be<br />
optimized by holding them for the foreseeable future. Where this clear change of intent existed and was supported<br />
by an ability to hold and fund the underlying positi<strong>on</strong>s, the Group c<strong>on</strong>cluded that the reclassificati<strong>on</strong>s<br />
aligned the accounting more closely with the business intent. Assets that were reclassified in the third quarter<br />
<strong>20</strong>08 were reclassified with effect from July 1, <strong>20</strong>08 at the fair value as of that date. Where the business decisi<strong>on</strong><br />
to reclassify was made by November 1, <strong>20</strong>08 and these assets met the reclassificati<strong>on</strong> rules and the<br />
Group’s internal reclassificati<strong>on</strong> criteria, the reclassificati<strong>on</strong>s were made with effect from October 1, <strong>20</strong>08.<br />
Business decisi<strong>on</strong>s to reclassify assets after November 1, <strong>20</strong>08 were made <strong>on</strong> a prospective basis at fair<br />
value <strong>on</strong> the date reclassificati<strong>on</strong> was approved. The disclosures below detail the impact of the reclassificati<strong>on</strong>s<br />
<strong>on</strong> the Group.<br />
The following table shows carrying values and fair values of the assets reclassified in <strong>20</strong>08 and <str<strong>on</strong>g><strong>20</strong>09</str<strong>on</strong>g>.<br />
in € m.<br />
Assets reclassified in <strong>20</strong>08:<br />
Carrying<br />
value at<br />
reclassificati<strong>on</strong><br />
date<br />
1 The decline of the carrying values since reclassificati<strong>on</strong> was mainly attributable to repayments, credit loss provisi<strong>on</strong>s and foreign exchange movements.<br />
F - 80<br />
Cumulative reclassificati<strong>on</strong>s<br />
through Dec 31, <str<strong>on</strong>g><strong>20</strong>09</str<strong>on</strong>g><br />
Carrying<br />
value<br />
Dec 31, <str<strong>on</strong>g><strong>20</strong>09</str<strong>on</strong>g> Carrying<br />
Fair value value at<br />
reclassificati<strong>on</strong><br />
date<br />
Carrying<br />
value<br />
Cumulative reclassificati<strong>on</strong>s<br />
through Dec 31, <strong>20</strong>08<br />
Dec 31, <strong>20</strong>08<br />
Fair Value<br />
Trading assets reclassified to loans 23,633 21,397 18,837 23,633 23,637 <strong>20</strong>,717<br />
Financial assets available for sale reclassified to loans 11,354 9,267 8,290 11,354 10,787 8,628<br />
Total financial assets reclassified to loans 34,987 30,664 1<br />
Assets reclassified in <str<strong>on</strong>g><strong>20</strong>09</str<strong>on</strong>g>:<br />
Trading assets reclassified to loans 2,961 2,890 2,715<br />
Total financial assets reclassified to loans 2,961 2,890 2,715<br />
27,127 34,987 34,424 29,345
The following table shows the ranges of effective interest rates based <strong>on</strong> weighted average rates by business<br />
and the expected recoverable cash flows estimated at reclassificati<strong>on</strong> date.<br />
in € bn.<br />
(unless stated otherwise)<br />
Effective interest rates at reclassificati<strong>on</strong> date:<br />
Trading assets<br />
reclassified to loans<br />
Cumulative reclassificati<strong>on</strong>s<br />
through Dec 31, <str<strong>on</strong>g><strong>20</strong>09</str<strong>on</strong>g><br />
Financial assets<br />
available for sale<br />
reclassified to loans<br />
The additi<strong>on</strong>al impact <strong>on</strong> the Group’s income statement and shareholders’ equity if the reclassificati<strong>on</strong>s had<br />
not been made is shown in the table below.<br />
1 Reclassificati<strong>on</strong>s were made from 1 July <strong>20</strong>08 and so the <strong>20</strong>08 balances represent a six m<strong>on</strong>th period.<br />
After reclassificati<strong>on</strong>, the pre-tax c<strong>on</strong>tributi<strong>on</strong> of all reclassified assets to the income statement was as follows.<br />
1 Reclassificati<strong>on</strong>s were made from 1 July <strong>20</strong>08 and so the <strong>20</strong>08 balances represent a six m<strong>on</strong>th period.<br />
Prior to their reclassificati<strong>on</strong>, assets reclassified in <str<strong>on</strong>g><strong>20</strong>09</str<strong>on</strong>g> c<strong>on</strong>tributed fair value losses of € 252 milli<strong>on</strong> to the<br />
income statement for the year ended December 31, <strong>20</strong>08 and fair value losses of € 48 milli<strong>on</strong> to the income<br />
statement for the year ended December 31, <str<strong>on</strong>g><strong>20</strong>09</str<strong>on</strong>g>.<br />
F - 81<br />
Trading assets<br />
reclassified to loans<br />
Cumulative reclassificati<strong>on</strong>s<br />
through Dec 31, <strong>20</strong>08<br />
Financial assets<br />
available for sale<br />
reclassified to loans<br />
upper range 13.1 % 9.9 % 13.1 % 9.9 %<br />
lower range<br />
Expected recoverable cash flows at<br />
2.8 % 3.9 % 2.8 % 3.9 %<br />
reclassificati<strong>on</strong> date 39.6 17.6 35.9 17.6<br />
in € m. <str<strong>on</strong>g><strong>20</strong>09</str<strong>on</strong>g> <strong>20</strong>08 1<br />
Unrealized fair value losses <strong>on</strong> the reclassified trading assets,<br />
gross of provisi<strong>on</strong>s for credit losses<br />
Impairment losses <strong>on</strong> the reclassified financial assets available for sale<br />
(884) (3,230)<br />
which were impaired<br />
Movement in shareholders’ equity representing additi<strong>on</strong>al unrealized fair value gains (losses) <strong>on</strong> the<br />
(9) (<strong>20</strong>9)<br />
reclassified financial assets available for sale 1,147 (1,826)<br />
<str<strong>on</strong>g><strong>20</strong>09</str<strong>on</strong>g> <strong>20</strong>08 1<br />
in € m.<br />
Interest income 1,368 659<br />
Provisi<strong>on</strong> for credit losses (1,047) (166)<br />
Income before income taxes <strong>on</strong> reclassified trading assets 321 493<br />
Interest income 227 258<br />
Provisi<strong>on</strong> for credit losses (<strong>20</strong>5) (91)<br />
Income before income taxes <strong>on</strong> reclassified financial assets available for sale 22 167
<strong>20</strong>-F Notes to the C<strong>on</strong>solidated Balance Sheet<br />
Prior to their reclassificati<strong>on</strong>, assets reclassified from trading in <strong>20</strong>08 c<strong>on</strong>tributed fair value losses of<br />
€ 1.8 billi<strong>on</strong> to the income statement for the year ended December 31, <strong>20</strong>08 and € 613 milli<strong>on</strong> of fair value<br />
losses for the year ended December 31, <strong>20</strong>07. Assets reclassified from available for sale during <strong>20</strong>08 c<strong>on</strong>tributed,<br />
prior to their reclassificati<strong>on</strong>, impairment charges of € 174 milli<strong>on</strong> to the income statement and additi<strong>on</strong>al<br />
unrealized losses of € 736 milli<strong>on</strong> to the c<strong>on</strong>solidated statement of recognized income and expense for<br />
the year ended December 31, <strong>20</strong>08 and no impairment losses and additi<strong>on</strong>al unrealized losses of € 275 milli<strong>on</strong><br />
to the c<strong>on</strong>solidated statement of recognized income and expense for the year ended December 31, <strong>20</strong>07.<br />
As of the reclassificati<strong>on</strong> dates, unrealized fair value losses recorded directly in shareholders’ equity<br />
amounted to € 1.1 billi<strong>on</strong>, which relate to reclassificati<strong>on</strong>s made during <strong>20</strong>08. This amount is released<br />
from shareholders’ equity to the income statement <strong>on</strong> an effective interest rate basis. Where the asset sub-<br />
sequently becomes impaired the amount recorded in shareholders’ equity relating to the impaired asset is<br />
released to the income statement at the impairment date.<br />
[13] Financial Instruments carried at Fair Value<br />
Valuati<strong>on</strong> Methods and C<strong>on</strong>trol<br />
The Group has an established valuati<strong>on</strong> c<strong>on</strong>trol framework which governs internal c<strong>on</strong>trol standards, methodologies,<br />
and procedures over the valuati<strong>on</strong> process.<br />
Prices Quoted in Active Markets: The fair value of instruments that are quoted in active markets are deter-<br />
mined using the quoted prices where they represent those at which regularly and recently occurring transac-<br />
ti<strong>on</strong>s take place.<br />
Valuati<strong>on</strong> Techniques: The Group uses valuati<strong>on</strong> techniques to establish the fair value of instruments where<br />
prices, quoted in active markets, are not available. Valuati<strong>on</strong> techniques used for financial instruments include<br />
modeling techniques, the use of indicative quotes for proxy instruments, quotes from less recent and less<br />
regular transacti<strong>on</strong>s and broker quotes.<br />
For some financial instruments a rate or other parameter, rather than a price, is quoted. Where this is the<br />
case then the market rate or parameter is used as an input to a valuati<strong>on</strong> model to determine fair value. For<br />
some instruments, modeling techniques follow industry standard models for example, discounted cash flow<br />
analysis and standard opti<strong>on</strong> pricing models such as Black-Scholes. These models are dependent up<strong>on</strong> estimated<br />
future cash flows, discount factors and volatility levels. For more complex or unique instruments, more<br />
sophisticated modeling techniques, assumpti<strong>on</strong>s and parameters are required, including correlati<strong>on</strong>, prepayment<br />
speeds, default rates and loss severity.<br />
F - 82
Frequently, valuati<strong>on</strong> models require multiple parameter inputs. Where possible, parameter inputs are based<br />
<strong>on</strong> observable data which are derived from the prices of relevant instruments traded in active markets. Where<br />
observable data is not available for parameter inputs then other market informati<strong>on</strong> is c<strong>on</strong>sidered. For example,<br />
indicative broker quotes and c<strong>on</strong>sensus pricing informati<strong>on</strong> is used to support parameter inputs where it<br />
is available. Where no observable informati<strong>on</strong> is available to support parameter inputs then they are based <strong>on</strong><br />
other relevant sources of informati<strong>on</strong> such as prices for similar transacti<strong>on</strong>s, historic data, ec<strong>on</strong>omic fundamentals<br />
with appropriate adjustment to reflect the terms of the actual instrument being valued and current<br />
market c<strong>on</strong>diti<strong>on</strong>s.<br />
Valuati<strong>on</strong> Adjustments: Valuati<strong>on</strong> adjustments are an integral part of the valuati<strong>on</strong> process. In making appro-<br />
priate valuati<strong>on</strong> adjustments, the Group follows methodologies that c<strong>on</strong>sider factors such as bid/offer spreads,<br />
liquidity and counterparty credit risk. Bid/offer spread valuati<strong>on</strong> adjustments are required to adjust mid market<br />
valuati<strong>on</strong>s to the appropriate bid or offer valuati<strong>on</strong>. The bid or offer valuati<strong>on</strong> is the best representati<strong>on</strong> of the<br />
fair value for an instrument, and therefore its fair value. The carrying value of a l<strong>on</strong>g positi<strong>on</strong> is adjusted from<br />
mid to bid, and the carrying value of a short positi<strong>on</strong> is adjusted from mid to offer. Bid/offer valuati<strong>on</strong> adjustments<br />
are determined from bid-offer prices observed in relevant trading activity and in quotes from other<br />
broker-dealers or other knowledgeable counterparties. Where the quoted price for the instrument is already a<br />
bid/offer price then no bid/offer valuati<strong>on</strong> adjustment is necessary. Where the fair value of financial instruments<br />
is derived from a modeling technique then the parameter inputs into that model are normally at a midmarket<br />
level. Such instruments are generally managed <strong>on</strong> a portfolio basis and valuati<strong>on</strong> adjustments are<br />
taken to reflect the cost of closing out the net exposure the <strong>Bank</strong> has to each of the input parameters. These<br />
adjustments are determined from bid-offer prices observed in relevant trading activity and quotes from other<br />
broker-dealers.<br />
Large positi<strong>on</strong> liquidity adjustments are appropriate when the size of a positi<strong>on</strong> is large enough relative to the<br />
market size that it could not be liquidated at the market bid/offer spread within a reas<strong>on</strong>able time frame.<br />
These adjustments reflect the wider bid/offer spread appropriate for deriving fair value of the large positi<strong>on</strong>s;<br />
they are not the amounts that would be required to reach a forced sale valuati<strong>on</strong>. Large positi<strong>on</strong> liquidity<br />
adjustments are not made for instruments that are traded in active markets.<br />
Counterparty credit valuati<strong>on</strong> adjustments are required to cover expected credit losses to the extent that the<br />
valuati<strong>on</strong> technique does not already include an expected credit loss factor. For example, a valuati<strong>on</strong> adjustment<br />
is required to cover expected credit losses <strong>on</strong> over-the-counter derivatives which are typically not<br />
reflected in mid-market or bid/offer quotes. The adjustment amount is determined at each reporting date by<br />
assessing the potential credit exposure to all counterparties taking into account any collateral held, the effect<br />
of any master netting agreements, expected loss given default and the credit risk for each counterparty based<br />
<strong>on</strong> market evidence, which may include historic default levels, fundamental analysis of financial informati<strong>on</strong>,<br />
and CDS spreads.<br />
F - 83
<strong>20</strong>-F Notes to the C<strong>on</strong>solidated Balance Sheet<br />
Similarly, in establishing the fair value of derivative liabilities the Group c<strong>on</strong>siders its own creditworthiness <strong>on</strong><br />
derivatives by assessing all counterparties potential future exposure to the Group, taking into account any<br />
collateral held, the effect of any master netting agreements, expected loss given default and the credit risk of<br />
the Group based <strong>on</strong> historic default levels of entities of the same credit quality. The impact of this valuati<strong>on</strong><br />
adjustment was that an insignificant gain was recognized for the year ended December 31, <str<strong>on</strong>g><strong>20</strong>09</str<strong>on</strong>g>.<br />
Where there is uncertainty in the assumpti<strong>on</strong>s used within a modeling technique, an additi<strong>on</strong>al adjustment is<br />
taken to calibrate the model price to the expected market price of the financial instrument. Where a financial<br />
instrument is part of a group of transacti<strong>on</strong>s risk managed <strong>on</strong> a portfolio basis, but where the trade itself is of<br />
sufficient complexity that the cost of closing it out would be higher than the cost of closing out its comp<strong>on</strong>ent<br />
risks, then an additi<strong>on</strong>al adjustment is taken to reflect this fact.<br />
Validati<strong>on</strong> and C<strong>on</strong>trol: The Group has an independent specialist valuati<strong>on</strong> group within the Finance functi<strong>on</strong><br />
which oversees and develops the valuati<strong>on</strong> c<strong>on</strong>trol framework and manages the valuati<strong>on</strong> c<strong>on</strong>trol processes.<br />
The mandate of this specialist functi<strong>on</strong> includes the performance of the valuati<strong>on</strong> c<strong>on</strong>trol process for the com-<br />
plex derivative businesses as well as the c<strong>on</strong>tinued development of valuati<strong>on</strong> c<strong>on</strong>trol methodologies and the<br />
valuati<strong>on</strong> policy framework. Results of the valuati<strong>on</strong> c<strong>on</strong>trol process are collected and analyzed as part of a<br />
standard m<strong>on</strong>thly reporting cycle. Variances of differences outside of preset and approved tolerance levels<br />
are escalated both within the Finance functi<strong>on</strong> and with Senior Business Management for review, resoluti<strong>on</strong><br />
and, if required, adjustment.<br />
For instruments where fair value is determined from valuati<strong>on</strong> models, the assumpti<strong>on</strong>s and techniques used<br />
within the models are independently validated by an independent specialist model validati<strong>on</strong> group that is part<br />
of the Group’s Risk Management functi<strong>on</strong>.<br />
Quotes for transacti<strong>on</strong>s and parameter inputs are obtained from a number of third party sources including<br />
exchanges, pricing service providers, firm broker quotes and c<strong>on</strong>sensus pricing services. Price sources<br />
are examined and assessed to determine the quality of fair value informati<strong>on</strong> they represent. The results are<br />
compared against actual transacti<strong>on</strong>s in the market to ensure the model valuati<strong>on</strong>s are calibrated to market<br />
prices.<br />
Price and parameter inputs to models, assumpti<strong>on</strong>s and valuati<strong>on</strong> adjustments are verified against independent<br />
sources. Where they cannot be verified to independent sources due to lack of observable informati<strong>on</strong>,<br />
the estimate of fair value is subject to procedures to assess its reas<strong>on</strong>ableness. Such procedures include<br />
performing revaluati<strong>on</strong> using independently generated models, assessing the valuati<strong>on</strong>s against appropriate<br />
proxy instruments and other benchmarks, and performing extrapolati<strong>on</strong> techniques. Assessment is made as<br />
to whether the valuati<strong>on</strong> techniques yield fair value estimates that are reflective of market levels by calibrating<br />
the results of the valuati<strong>on</strong> models against market transacti<strong>on</strong>s where possible.<br />
F - 84
Management Judgment: In reaching estimates of fair value management judgment needs to be exercised.<br />
The areas requiring significant management judgment are identified, documented and reported to senior<br />
management as part of the valuati<strong>on</strong> c<strong>on</strong>trol framework and the standard m<strong>on</strong>thly reporting cycle. The specialist<br />
model validati<strong>on</strong> and valuati<strong>on</strong> groups focus attenti<strong>on</strong> <strong>on</strong> the areas of subjectivity and judgment.<br />
The level of management judgment required in establishing fair value of financial instruments for which there<br />
is a quoted price in an active market is minimal. Similarly there is little subjectivity or judgment required for<br />
instruments valued using valuati<strong>on</strong> models which are standard across the industry and where all parameter<br />
inputs are quoted in active markets.<br />
The level of subjectivity and degree of management judgment required is more significant for those instruments<br />
valued using specialized and sophisticated models and where some or all of the parameter inputs are<br />
not observable. Management judgment is required in the selecti<strong>on</strong> and applicati<strong>on</strong> of appropriate parameters,<br />
assumpti<strong>on</strong>s and modeling techniques. In particular, where data is obtained from infrequent market transacti<strong>on</strong>s<br />
then extrapolati<strong>on</strong> and interpolati<strong>on</strong> techniques must be applied. In additi<strong>on</strong>, where no market data is<br />
available then parameter inputs are determined by assessing other relevant sources of informati<strong>on</strong> such as<br />
historical data, fundamental analysis of the ec<strong>on</strong>omics of the transacti<strong>on</strong> and proxy informati<strong>on</strong> from similar<br />
transacti<strong>on</strong>s and making appropriate adjustment to reflect the actual instrument being valued and current<br />
market c<strong>on</strong>diti<strong>on</strong>s. Where different valuati<strong>on</strong> techniques indicate a range of possible fair values for an instrument<br />
then management has to establish what point within the range of estimates best represents fair value.<br />
Further, some valuati<strong>on</strong> adjustments may require the exercise of management judgment to ensure they<br />
achieve fair value.<br />
Fair Value Hierarchy<br />
The financial instruments carried at fair value have been categorized under the three levels of the IFRS fair<br />
value hierarchy as follows:<br />
Quoted Prices in an Active Market (Level 1): This level of the hierarchy includes listed equity securities <strong>on</strong><br />
major exchanges, quoted corporate debt instruments, G7 Government debt and exchange traded derivatives.<br />
The fair value of instruments that are quoted in active markets are determined using the quoted prices where<br />
they represent those at which regularly and recently occurring transacti<strong>on</strong>s take place.<br />
Valuati<strong>on</strong> Techniques with Observable Parameters (Level 2): This level of the hierarchy includes the majority<br />
of the Group’s OTC derivative c<strong>on</strong>tracts, corporate debt held, securities purchased/sold under resale/<br />
repurchase agreements, securities borrowed/loaned, traded loans and issued structured debt designated<br />
under the fair value opti<strong>on</strong>.<br />
F - 85
<strong>20</strong>-F Notes to the C<strong>on</strong>solidated Balance Sheet<br />
Valuati<strong>on</strong> Techniques with Significant Unobservable Parameters (Level 3): Instruments classified in this category<br />
have a parameter input or inputs which are unobservable and which have a more than insignificant<br />
impact <strong>on</strong> the fair value of the instrument. This level of the hierarchy includes more complex OTC derivatives,<br />
certain private equity investments, illiquid loans, certain highly structured b<strong>on</strong>ds including illiquid asset backed<br />
securities and structured debt issuances with unobservable comp<strong>on</strong>ents.<br />
The following table presents the carrying value of the financial instruments held at fair value across the three<br />
levels of the fair value hierarchy. Amounts in this table are generally presented <strong>on</strong> a gross basis, in line with<br />
the Group's accounting policy regarding offsetting of financial instruments, as described in Note [1].<br />
Dec 31, <str<strong>on</strong>g><strong>20</strong>09</str<strong>on</strong>g> Dec 31, <strong>20</strong>08<br />
Quoted Valuati<strong>on</strong> Valuati<strong>on</strong> Quoted Valuati<strong>on</strong> Valuati<strong>on</strong><br />
prices in technique technique prices in technique technique<br />
active market observable unobservable active market observable unobservable<br />
(Level 1) parameters parameters (Level 1) parameters parameters<br />
in € m.<br />
Financial assets held at fair value:<br />
(Level 2) (Level 3)<br />
(Level 2) (Level 3)<br />
Trading securities<br />
Positive market values from derivative financial<br />
84,833 106,268 15,609 72,240 115,486 17,268<br />
instruments 19,684 551,514 25,211 36,062 1,139,639 48,792<br />
Other trading assets<br />
Financial assets designated at fair value through profit<br />
456 16,963 10,782 348 28,560 13,560<br />
or loss 5,698 124,892 3,410 8,630 137,421 5,805<br />
Financial assets available for sale 10,789 4,863 3,167 11,911 11,474 1,450<br />
Other financial assets at fair value 1 – 7,014 41 – 9,691 788<br />
Total financial assets held at fair value<br />
Financial liabilities held at fair value:<br />
121,460 811,514 58,2<strong>20</strong> 129,191 1,442,271 87,663<br />
Trading securities<br />
Negative market values from derivative financial<br />
43,182 18,787 431 38,921 17,380 666<br />
instruments 18,699 542,683 15,591 38,380 1,114,499 28,738<br />
Other trading liabilities<br />
Financial liabilities designated at fair value through<br />
1 1,817 283 – 11,027 174<br />
profit or loss 177 70,724 2,621 708 71,265 6,030<br />
Investment c<strong>on</strong>tract liabilities 2 – 7,278 – – 5,977 –<br />
Other financial liabilities at fair value 1 – 2,698 (757) – 5,513 (1,249)<br />
Total financial liabilities held at fair value 62,059 643,987 18,169 78,009 1,225,661 34,359<br />
1 Derivatives which are embedded in c<strong>on</strong>tracts where the host c<strong>on</strong>tract is not held at fair value through the profit or loss but for which the embedded derivative is separated are presented<br />
within other financial assets/liabilities at fair value for the purposes of this disclosure. The separated embedded derivatives may have a positive or a negative fair value but<br />
have been presented in this table to be c<strong>on</strong>sistent with the classificati<strong>on</strong> of the host c<strong>on</strong>tract. The separated embedded derivatives are held at fair value <strong>on</strong> a recurring basis and have<br />
been split between the fair value hierarchy classificati<strong>on</strong>s.<br />
2 These are investment c<strong>on</strong>tracts where the policy terms and c<strong>on</strong>diti<strong>on</strong>s result in their redempti<strong>on</strong> value equaling fair value. See Note [39] for more detail <strong>on</strong> these c<strong>on</strong>tracts.<br />
There have been no significant transfers of instruments between level 1 and level 2 of the fair value hierarchy.<br />
F - 86
Valuati<strong>on</strong> Techniques<br />
The following is an explanati<strong>on</strong> of the valuati<strong>on</strong> techniques used in establishing the fair value of the different<br />
types of financial instruments that the Group trades.<br />
Sovereign, Quasi-sovereign and Corporate Debt and Equity Securities: Where there are no recent trans-<br />
acti<strong>on</strong>s then fair value may be determined from the last market price adjusted for all changes in risks and<br />
informati<strong>on</strong> since that date. Where a close proxy instrument is quoted in an active market then fair value is<br />
determined by adjusting the proxy value for differences in the risk profile of the instruments. Where close<br />
proxies are not available then fair value is estimated using more complex modeling techniques. These techniques<br />
include discounted cash flow models using current market rates for credit, interest, liquidity and other<br />
risks. For equity securities modeling techniques may also include those based <strong>on</strong> earnings multiples. For<br />
some illiquid securities several valuati<strong>on</strong> techniques are used and an assessment is made to determine what<br />
point within the range of estimates best represents fair value.<br />
Mortgage and Other Asset Backed Securities (“ABS”): These instruments include residential and commercial<br />
mortgage backed securities and other asset backed securities including collateralized debt obligati<strong>on</strong>s<br />
(“CDO”). Asset backed securities have specific characteristics as they have different underlying assets and<br />
the issuing entities have different capital structures. The complexity increases further where the underlying<br />
assets are themselves asset backed securities, as is the case with many of the CDO instruments.<br />
Where no reliable external pricing is available, ABS are valued, where applicable, using either relative value<br />
analysis which is performed based <strong>on</strong> similar transacti<strong>on</strong>s observable in the market, or industry-standard<br />
valuati<strong>on</strong> models incorporating available observable inputs. The industry standard external models calculate<br />
principal and interest payments for a given deal based <strong>on</strong> assumpti<strong>on</strong>s that are independently price tested.<br />
The inputs include prepayment speeds, loss assumpti<strong>on</strong>s (timing and severity) and a discount rate (spread,<br />
yield or discount margin). These inputs/assumpti<strong>on</strong>s are derived from actual transacti<strong>on</strong>s, external market<br />
research and market indices where appropriate.<br />
Loans: For certain loans fair value may be determined from the market price <strong>on</strong> a recently occurring trans-<br />
acti<strong>on</strong> adjusted for all changes in risks and informati<strong>on</strong> since that transacti<strong>on</strong> date. Where there are no recent<br />
market transacti<strong>on</strong>s then broker quotes, c<strong>on</strong>sensus pricing, proxy instruments or discounted cash flow models<br />
are used to determine fair value. Discounted cash flow models incorporate parameter inputs for credit risk,<br />
interest rate risk, foreign exchange risk, loss given default estimates and amounts utilized given default, as<br />
appropriate. Credit risk, loss given default and utilizati<strong>on</strong> given default parameters are determined using<br />
informati<strong>on</strong> from the loan or CDS markets, where available and appropriate.<br />
F - 87
<strong>20</strong>-F Notes to the C<strong>on</strong>solidated Balance Sheet<br />
Leveraged loans have transacti<strong>on</strong>-specific characteristics. Where similar transacti<strong>on</strong>s exist for which observ-<br />
able quotes are available from external pricing services then this informati<strong>on</strong> is used with appropriate adjust-<br />
ments to reflect the transacti<strong>on</strong> differences. When no similar transacti<strong>on</strong>s exist, a discounted cash flow valua-<br />
ti<strong>on</strong> technique is used with credit spreads derived from the appropriate leveraged loan index, incorporating<br />
the industry classificati<strong>on</strong>, subordinati<strong>on</strong> of the loan, and any other relevant informati<strong>on</strong> <strong>on</strong> the loan and loan<br />
counterparty.<br />
Over-The-Counter (OTC) Derivative Financial Instruments: Market standard transacti<strong>on</strong>s in liquid trading<br />
markets, such as interest rate swaps, foreign exchange forward and opti<strong>on</strong> c<strong>on</strong>tracts in G7 currencies, and<br />
equity swap and opti<strong>on</strong> c<strong>on</strong>tracts <strong>on</strong> listed securities or indices are valued using market standard models<br />
and quoted parameter inputs. Parameter inputs are obtained from pricing services, c<strong>on</strong>sensus pricing services<br />
and recently occurring transacti<strong>on</strong>s in active markets wherever possible.<br />
More complex instruments are modeled using more sophisticated modeling techniques specific for the instrument<br />
and calibrated to the market prices. Where the model value does not calibrate to the market price then<br />
adjustments are made to the model value to adjust to the market value. In less active markets, data is<br />
obtained from less frequent market transacti<strong>on</strong>s, broker quotes and through extrapolati<strong>on</strong> and interpolati<strong>on</strong><br />
techniques. Where observable prices or inputs are not available, management judgment is required to determine<br />
fair values by assessing other relevant sources of informati<strong>on</strong> such as historical data, fundamental<br />
analysis of the ec<strong>on</strong>omics of the transacti<strong>on</strong> and proxy informati<strong>on</strong> from similar transacti<strong>on</strong>s.<br />
Financial Liabilities Designated at Fair Value through Profit or Loss under the Fair Value Opti<strong>on</strong>: The fair value<br />
of financial liabilities designated at fair value through profit or loss under the fair value opti<strong>on</strong> incorporates<br />
all market risk factors including a measure of the Group’s credit risk relevant for that financial liability. The<br />
financial liabilities include structured note issuances, structured deposits, and other structured securities<br />
issued by c<strong>on</strong>solidated vehicles, which may not be quoted in an active market. The fair value of these financial<br />
liabilities is determined by discounting the c<strong>on</strong>tractual cash flows using the relevant credit-adjusted yield<br />
curve. The market risk parameters are valued c<strong>on</strong>sistently to similar instruments held as assets, for example,<br />
any derivatives embedded within the structured notes are valued using the same methodology discussed in<br />
the “OTC derivative financial instruments” secti<strong>on</strong> above.<br />
Where the financial liabilities designated at fair value through profit or loss under the fair value opti<strong>on</strong><br />
are collateralized, such as securities loaned and securities sold under repurchase agreements, the credit<br />
enhancement is factored into the fair valuati<strong>on</strong> of the liability.<br />
F - 88
Investment C<strong>on</strong>tract Liabilities: Assets which are linked to the investment c<strong>on</strong>tract liabilities are owned by<br />
the Group. The investment c<strong>on</strong>tract obliges the Group to use these assets to settle these liabilities. Therefore,<br />
the fair value of investment c<strong>on</strong>tract liabilities is determined by the fair value of the underlying assets<br />
(i.e., amount payable <strong>on</strong> surrender of the policies).<br />
Analysis of Financial Instruments with Fair Value Derived from Valuati<strong>on</strong> Techniques C<strong>on</strong>taining<br />
Significant Unobservable Parameters (Level 3)<br />
The table below presents the financial instruments categorized in the third level followed by an analysis and<br />
discussi<strong>on</strong> of the financial instruments so categorized. Some of the instruments in the third level of the fair<br />
value hierarchy have identical or similar offsetting exposures to the unobservable input. However, according<br />
to IFRS they are required to be presented as gross assets and liabilities in the table below.<br />
in € m.<br />
Financial assets held at fair value:<br />
Trading securities:<br />
Dec 31, <str<strong>on</strong>g><strong>20</strong>09</str<strong>on</strong>g> Dec 31, <strong>20</strong>08<br />
Sovereign and quasi-sovereign obligati<strong>on</strong>s 335 602<br />
Mortgage and other asset-backed securities 7,068 5,870<br />
Corporate debt securities and other debt obligati<strong>on</strong>s 7,444 10,669<br />
Equity securities 762 127<br />
Total trading securities 15,609 17,268<br />
Positive market values from derivative financial instruments 25,211 48,792<br />
Other trading assets<br />
Financial assets designated at fair value through profit or loss:<br />
10,782 13,560<br />
Loans 2,905 5,531<br />
Other financial assets designated at fair value through profit or loss 505 274<br />
Total financial assets designated at fair value through profit or loss 3,410 5,805<br />
Financial assets available for sale 3,167 1,450<br />
Other financial assets at fair value 41 788<br />
Total financial assets held at fair value<br />
Financial liabilities held at fair value:<br />
58,2<strong>20</strong> 87,663<br />
Trading securities 431 666<br />
Negative market values from derivative financial instruments 15,591 28,738<br />
Other trading liabilities<br />
Financial liabilities designated at fair value through profit or loss:<br />
283 174<br />
Loan commitments 447 2,195<br />
L<strong>on</strong>g-term debt 1,723 1,488<br />
Other financial liabilities designated at fair value through profit or loss 451 2,347<br />
Total financial liabilities designated at fair value through profit or loss 2,621 6,030<br />
Other financial liabilities at fair value (757) (1,249)<br />
Total financial liabilities held at fair value 18,169 34,359<br />
Trading Securities: Certain illiquid emerging market corporate b<strong>on</strong>ds and illiquid highly structured corporate<br />
b<strong>on</strong>ds are included in this level of the hierarchy. In additi<strong>on</strong>, some of the holdings of notes issued by securitizati<strong>on</strong><br />
entities, commercial and residential mortgage-backed securities, collateralized debt obligati<strong>on</strong> securities<br />
and other asset-backed securities are reported here.<br />
F - 89
<strong>20</strong>-F Notes to the C<strong>on</strong>solidated Balance Sheet<br />
Positive and Negative Market Values from Derivative Instruments: Derivatives categorized in this level of the<br />
fair value hierarchy are valued based <strong>on</strong> <strong>on</strong>e or more significant unobservable parameters. The unobservable<br />
parameters may include certain correlati<strong>on</strong>s, certain l<strong>on</strong>ger-term volatilities, certain prepayment rates, credit<br />
spreads and other transacti<strong>on</strong>-specific parameters.<br />
The following derivatives are included within this level of the hierarchy: customized CDO derivatives in which<br />
the underlying reference pool of corporate assets is not closely comparable to regularly market-traded indices;<br />
certain tranched index credit derivatives; certain opti<strong>on</strong>s where the volatility is unobservable; certain<br />
basket opti<strong>on</strong>s in which the correlati<strong>on</strong>s between the referenced underlying assets are unobservable; l<strong>on</strong>gerterm<br />
interest rate opti<strong>on</strong> derivatives; multi-currency foreign exchange derivatives; and certain credit default<br />
swaps for which the credit spread is not observable.<br />
During <str<strong>on</strong>g><strong>20</strong>09</str<strong>on</strong>g>, the market value of derivatives instruments in the third level of the hierarchy has significantly<br />
declined primarily as a result of changes to input parameters, in particular tightening credit spreads. In addi-<br />
ti<strong>on</strong> there has been an increase in liquidity for some products which has enabled some migrati<strong>on</strong> to the<br />
sec<strong>on</strong>d level of the fair value hierarchy.<br />
Other Trading Instruments: Other trading instruments classified in level 3 of the fair value hierarchy mainly<br />
c<strong>on</strong>sist of traded loans valued using valuati<strong>on</strong> models based <strong>on</strong> <strong>on</strong>e or more significant unobservable para-<br />
meters. The loan balance reported in this level of the fair value hierarchy comprises illiquid leveraged loans<br />
and illiquid residential and commercial mortgage loans. The balance was significantly reduced in the year due<br />
to falls in the value of the loans as well as from positi<strong>on</strong>s which have matured during the year.<br />
Financial Assets/Liabilities designated at Fair Value through Profit or Loss: Certain corporate loans and struc-<br />
tured liabilities which were designated at fair value through profit or loss under the fair value opti<strong>on</strong> are cate-<br />
gorized in this level of the fair value hierarchy. The corporate loans are valued using valuati<strong>on</strong> techniques<br />
which incorporate observable credit spreads, recovery rates and unobservable utilizati<strong>on</strong> parameters. Revolving<br />
loan facilities are reported in the third level of the hierarchy because the utilizati<strong>on</strong> in the event of the<br />
default parameter is significant and unobservable. The balance has reduced during <str<strong>on</strong>g><strong>20</strong>09</str<strong>on</strong>g> mainly as a result of<br />
reduced drawings <strong>on</strong> revolving loan facilities and loan facilities which have matured during the year.<br />
In additi<strong>on</strong>, certain hybrid debt issuances designated at fair value through profit or loss c<strong>on</strong>taining embedded<br />
derivatives are valued based <strong>on</strong> significant unobservable parameters. These unobservable parameters include<br />
single stock volatility correlati<strong>on</strong>s.<br />
F - 90
Financial Assets Available for Sale: Unlisted equity instruments are reported in this level of the fair value<br />
hierarchy where there is no close proxy and the market is very illiquid.<br />
Rec<strong>on</strong>ciliati<strong>on</strong> of financial instruments classified in Level 3<br />
The table below presents a rec<strong>on</strong>ciliati<strong>on</strong> of financial instruments categorized in level 3 of the fair value<br />
hierarchy followed by an analysis and discussi<strong>on</strong> of the financial instruments so categorized. Some of the<br />
instruments in level 3 of the fair value hierarchy have identical or similar offsetting exposures to the unobservable<br />
input, however; they are required to be presented as gross assets and liabilities in the table below.<br />
Further, certain instruments are hedged with instruments in level 1 or level 2 but the table below does not<br />
include the gains and losses <strong>on</strong> these hedging instruments. Additi<strong>on</strong>ally, both observable and unobservable<br />
parameters may be used to determine the fair value of an instrument classified within level 3 of the fair value<br />
hierarchy; the gains and losses presented below are attributable to movements in both the observable and<br />
unobservable parameters.<br />
Transfers in and transfers out of level 3 during the year are recorded at their fair value at the beginning of<br />
year in the table below. For instruments transferred into level 3 the table shows the gains and losses and<br />
cash flows <strong>on</strong> the instruments as if they had been transferred at the beginning of the year. Similarly for<br />
instruments transferred out of level 3 the table does not show any gains or losses or cash flows <strong>on</strong> the<br />
instruments during the year since the table is presented as if they have been transferred out at the beginning<br />
of the year.<br />
F - 91
<strong>20</strong>-F Notes to the C<strong>on</strong>solidated Balance Sheet<br />
Balance, Total<br />
beginning gains/<br />
in € m.<br />
of year losses 1<br />
Purchases Sales Issuances 5<br />
Settlements<br />
6<br />
Transfers Transfers Balance,<br />
into out of end of<br />
Financial assets held at fair<br />
value:<br />
Level 3 Level 3 year<br />
Trading securities<br />
Positive market values from<br />
derivative financial<br />
17,268 (2,304) 2,883 (5,084) – (1,570) 8,410 (3,994) 15,609<br />
instruments 48,792 (15,563) 7 – – – (6,397) 7,510 (9,131) 25,211<br />
Other trading assets<br />
Financial assets designated<br />
at fair value through profit or<br />
13,560 1,832 1,919 (3,057) 246 (3,184) 2,309 (2,843) 10,782<br />
loss<br />
Financial assets available for<br />
5,805 1,507 222 (60) 952 (5,267) 695 (444) 3,410<br />
sale 1,450 (221) 2 Other financial assets at fair<br />
136 (143) – (97) 2,135 (93) 3,167<br />
value<br />
Total financial assets held at<br />
788 70 9 – – – – (826) 41<br />
fair value 87,663 (14,679) 3,4 Financial liabilities held at<br />
fair value:<br />
5,169 (8,344) 1,198 (16,515) 21,059 (17,331) 58,2<strong>20</strong><br />
Trading securities<br />
Negative market values from<br />
derivative financial<br />
666 26 – – – 113 186 (560) 431<br />
instruments 28,738 (4,374) 7 – – – (5,546) 5,034 (8,261) 15,591<br />
Other trading liabilities<br />
Financial liabilities<br />
designated at fair value<br />
174 68 – – – <strong>20</strong>5 – (164) 283<br />
through profit or loss<br />
Other financial liabilities at<br />
6,030 (1,753) – – <strong>20</strong>8 (269) 1,443 (3,038) 2,621<br />
fair value<br />
Total financial liabilities held<br />
(1,249) 649 – – – 93 (253) 3 (757)<br />
at fair value 34,359 (5,384) 3,4 – – <strong>20</strong>8 (5,404) 6,410 (12,0<strong>20</strong>) 18,169<br />
1 Total gains and losses predominantly relate to net gains (losses) <strong>on</strong> financial assets/liabilities at fair value through profit or loss reported in the c<strong>on</strong>solidated statement of income.<br />
The balance also includes net gains (losses) <strong>on</strong> financial assets available for sale reported in the c<strong>on</strong>solidated statement of income and unrealized net gains (losses) <strong>on</strong> financial<br />
assets available for sale and exchange rate changes reported in net gains (losses) not recognized in the income statement net of tax.<br />
2 Total gains and losses <strong>on</strong> available for sale include a gain of € 177 milli<strong>on</strong> recognized in Total net gains (losses) not recognized in the income statement, net of tax, and a loss of<br />
€ 398 milli<strong>on</strong> recognized in the income statement presented in Net gains (losses) <strong>on</strong> financial assets available for sale.<br />
3 This amount includes the effect of exchange rate changes. For total financial assets held at fair value this effect is a positive € 6.6 billi<strong>on</strong> and for total financial liabilities held at fair<br />
value this is a negative € 2.3 billi<strong>on</strong>. This predominately relates to derivatives. The effect of exchange rate changes is reported in total gains (losses) not recognized in the income<br />
statement, net of tax.<br />
4 For assets positive balances represent gains, negative balances represent losses. For liabilities positive balances represent losses, negative balances represent gains.<br />
5 Issuances relates to the cash amount received <strong>on</strong> the issuance of a liability and the cash amount paid <strong>on</strong> the primary issuance of a loan to a borrower.<br />
6 Settlements represent cash flows to settle the asset or liability. For debt and loan instruments this includes principal <strong>on</strong> maturity, principal amortizati<strong>on</strong>s and principal repayments.<br />
For derivatives all cash flows are presented in settlements.<br />
7 The gains and losses <strong>on</strong> derivatives arise as a result of changes to input parameters, in particular tightening of credit spreads.<br />
F - 92
Sensitivity Analysis of Unobservable Parameters<br />
Where the value of financial instruments is dependent <strong>on</strong> unobservable parameter inputs, the precise level for<br />
these parameters at the balance sheet date might be drawn from a range of reas<strong>on</strong>ably possible alternatives.<br />
In preparing the financial statements, appropriate levels for these unobservable input parameters are chosen<br />
so that they are c<strong>on</strong>sistent with prevailing market evidence and in line with the Group’s approach to valuati<strong>on</strong><br />
c<strong>on</strong>trol detailed above. Were the Group to have marked the financial instruments c<strong>on</strong>cerned using parameter<br />
values drawn from the extremes of the ranges of reas<strong>on</strong>ably possible alternatives then as of December<br />
31, <str<strong>on</strong>g><strong>20</strong>09</str<strong>on</strong>g>, it could have increased fair value by as much as € 4.3 billi<strong>on</strong> or decreased fair value by as much<br />
as € 3.9 billi<strong>on</strong>. As of December 31, <strong>20</strong>08, it could have increased fair value by as much as € 4.9 billi<strong>on</strong> or<br />
decreased fair value by as much as € 4.7 billi<strong>on</strong>. In estimating these impacts, the Group either re-valued certain<br />
financial instruments using reas<strong>on</strong>ably possible alternative parameter values, or used an approach based<br />
<strong>on</strong> its valuati<strong>on</strong> adjustment methodology for bid/offer spread valuati<strong>on</strong> adjustments. Bid/offer spread valuati<strong>on</strong><br />
adjustments reflect the amount that must be paid in order to close out a holding in an instrument or comp<strong>on</strong>ent<br />
risk and as such they reflect factors such as market illiquidity and uncertainty.<br />
This disclosure is intended to illustrate the potential impact of the relative uncertainty in the fair value of finan-<br />
cial instruments for which valuati<strong>on</strong> is dependent <strong>on</strong> unobservable input parameters. However, it is unlikely in<br />
practice that all unobservable parameters would be simultaneously at the extremes of their ranges of reas<strong>on</strong>ably<br />
possible alternatives. Hence, the estimates disclosed above are likely to be greater than the true uncertainty<br />
in fair value at the balance sheet date. Furthermore, the disclosure is not predictive or indicative of<br />
future movements in fair value.<br />
For many of the financial instruments c<strong>on</strong>sidered here, in particular derivatives, unobservable input parameters<br />
represent <strong>on</strong>ly a subset of the parameters required to price the financial instrument, the remainder being<br />
observable. Hence for these instruments the overall impact of moving the unobservable input parameters to<br />
the extremes of their ranges might be relatively small compared with the total fair value of the financial<br />
instrument. For other instruments, fair value is determined based <strong>on</strong> the price of the entire instrument, for<br />
example, by adjusting the fair value of a reas<strong>on</strong>able proxy instrument. In additi<strong>on</strong>, all financial instruments are<br />
already carried at fair values which are inclusive of valuati<strong>on</strong> adjustments for the cost to close out that instrument<br />
and hence already factor in uncertainty as it reflects itself in market pricing. Any negative impact of<br />
uncertainty calculated within this disclosure, then, will be over and above that already included in the fair<br />
value c<strong>on</strong>tained in the financial statements.<br />
F - 93
<strong>20</strong>-F Notes to the C<strong>on</strong>solidated Balance Sheet<br />
The table below provides a breakdown of the sensitivity analysis by type of instrument. Where the exposure<br />
to an unobservable parameter is offset across different instruments then <strong>on</strong>ly the net impact is disclosed in<br />
the table.<br />
Dec 31, <str<strong>on</strong>g><strong>20</strong>09</str<strong>on</strong>g> Dec 31, <strong>20</strong>08<br />
Positive fair value Negative fair value Positive fair value Negative fair value<br />
movement from using movement from using movement from using movement from using<br />
reas<strong>on</strong>able possible reas<strong>on</strong>able possible reas<strong>on</strong>able possible reas<strong>on</strong>able possible<br />
in € m.<br />
alternatives<br />
alternatives<br />
alternatives<br />
alternatives<br />
Derivatives:<br />
Credit 2,585 2,689 3,606 3,731<br />
Equity 213 106 226 105<br />
Interest Related 103 117 40 31<br />
Hybrid 342 168 140 76<br />
Other 264 314 178 124<br />
Securities:<br />
Debt securities 311 277 162 152<br />
Equity securities 36 28 8 2<br />
Mortgage and asset backed<br />
Loans:<br />
<strong>20</strong>6 50 243 243<br />
Leveraged loans 5 5 32 17<br />
Commercial loans 88 88 70 70<br />
Traded loans 136 83 197 126<br />
Total 4,289 3,925 4,902 4,677<br />
Total gains or losses <strong>on</strong> level 3 instruments held or in issue at the reporting date<br />
The total gains or losses are not due solely to unobservable parameters. Many of the parameter inputs to the<br />
valuati<strong>on</strong> of instruments in this level of the hierarchy are observable and the gain or loss is partly due to<br />
movements in these observable parameters over the period. Many of the positi<strong>on</strong>s in this level of the<br />
hierarchy are ec<strong>on</strong>omically hedged by instruments which are categorized in other levels of the fair value<br />
hierarchy. The offsetting gains and losses that have been recorded <strong>on</strong> all such hedges are not included in the<br />
table below, which <strong>on</strong>ly shows the gains and losses related to the level 3 classified instruments themselves, in<br />
accordance with IFRS 7.<br />
F - 94
An analysis of the total gains and losses recorded in profit or loss.<br />
Total gains or losses recorded in net gains (losses) <strong>on</strong> financial instruments<br />
at fair value through profit or loss<br />
in € m.<br />
Financial assets held at fair value:<br />
Dec 31, <str<strong>on</strong>g><strong>20</strong>09</str<strong>on</strong>g><br />
Trading securities (433)<br />
Positive market values from derivative financial instruments (10,325)<br />
Other trading assets (404)<br />
Financial assets designated at fair value through profit or loss 554<br />
Financial assets available for sale 1 (<strong>20</strong>0)<br />
Other financial assets at fair value (8)<br />
Total financial assets held at fair value<br />
Financial liabilities held at fair value:<br />
(10,816)<br />
Trading securities (15)<br />
Negative market values from derivative financial instruments 2,226<br />
Other trading liabilities (35)<br />
Financial liabilities designated at fair value through profit or loss 1,121<br />
Other financial liabilities at fair value (197)<br />
Total financial liabilities held at fair value 3,100<br />
Total (7,716)<br />
1 This amount relates to impairment losses <strong>on</strong> level 3 financial assets available for sale.<br />
Recogniti<strong>on</strong> of Trade Date Profit<br />
In accordance with the Group’s accounting policy as described in Note [1], if there are significant unobserv-<br />
able inputs used in a valuati<strong>on</strong> technique, the financial instrument is recognized at the transacti<strong>on</strong> price and<br />
any trade date profit is deferred. The table below presents the year-to-year movement of the trade date profits<br />
deferred due to significant unobservable parameters for financial instruments classified at fair value through<br />
profit or loss. The balance is predominantly related to derivative instruments.<br />
in € m. <str<strong>on</strong>g><strong>20</strong>09</str<strong>on</strong>g> <strong>20</strong>08<br />
Balance, beginning of year 697 521<br />
New trades during the period 467 587<br />
Amortizati<strong>on</strong> (182) (152)<br />
Matured trades (138) (141)<br />
Subsequent move to observability (41) (94)<br />
Exchange rate changes 19 (24)<br />
Balance, end of year 822 697<br />
F - 95
<strong>20</strong>-F Notes to the C<strong>on</strong>solidated Balance Sheet<br />
[14] Fair Value of Financial Instruments not carried at Fair Value<br />
The valuati<strong>on</strong> techniques used to establish fair value for the Group’s financial instruments which are not car-<br />
ried at fair value in the balance sheet are c<strong>on</strong>sistent with those outlined in Note [13], Financial Instruments<br />
carried at fair value.<br />
As described in Note [12], Amendments to IAS 39 and IFRS 7, “Reclassificati<strong>on</strong> of Financial Assets”, the<br />
Group reclassified certain eligible assets from the trading and available for sale classificati<strong>on</strong>s to loans. The<br />
Group c<strong>on</strong>tinues to apply the relevant valuati<strong>on</strong> techniques set out in Note [13], Financial Instruments carried<br />
at Fair Value, to the reclassified assets.<br />
Other financial instruments not carried at fair value are not part of a trading portfolio and are not managed <strong>on</strong><br />
a fair value basis, for example, retail loans and deposits and credit facilities extended to corporate clients. For<br />
these instruments fair values are calculated for disclosure purposes <strong>on</strong>ly and do not impact the balance sheet<br />
or income statement. Additi<strong>on</strong>ally since the instruments generally do not trade there is significant management<br />
judgment required to determine these fair values.<br />
The valuati<strong>on</strong> techniques the Group applies are as follows:<br />
Short-term financial instruments: The carrying amount represents a reas<strong>on</strong>able estimate of fair value for shortterm<br />
financial instruments. The following instruments are predominantly short-term and fair value is estimated<br />
from the carrying value.<br />
Assets Liabilities<br />
Cash and due from banks Deposits<br />
Interest-earning deposits with banks Central bank funds purchased and securities sold under<br />
repurchase agreements<br />
Central bank funds sold and securities purchased under resale<br />
agreements<br />
Securities loaned<br />
Securities borrowed Other short-term borrowings<br />
Other assets Other liabilities<br />
For l<strong>on</strong>ger-term financial instruments within these categories, fair value is determined by discounting c<strong>on</strong>trac-<br />
tual cash flows using rates which could be earned for assets with similar remaining maturities and credit risks<br />
and, in the case of liabilities, rates at which the liabilities with similar remaining maturities could be issued, at<br />
the balance sheet date.<br />
F - 96
Loans: Fair value is determined using discounted cash flow models that incorporate parameter inputs for<br />
credit risk, interest rate risk, foreign exchange risk, loss given default estimates and amounts utilized given<br />
default, as appropriate. Credit risk, loss given default and utilizati<strong>on</strong> given default parameters are determined<br />
using informati<strong>on</strong> from the loan or credit default swap (“CDS”) markets, where available and appropriate.<br />
For retail lending portfolios with a large number of homogenous loans (e.g., German residential mortgages),<br />
the fair value is calculated <strong>on</strong> a portfolio basis by discounting the portfolio’s c<strong>on</strong>tractual cash flows using riskfree<br />
interest rates. This present value calculati<strong>on</strong> is then adjusted for credit risk by discounting at the margins<br />
which could be earned <strong>on</strong> similar loans if issued at the balance sheet date. For other portfolios the present<br />
value calculati<strong>on</strong> is adjusted for credit risk by calculating the expected loss over the estimated life of the loan<br />
based <strong>on</strong> various parameters including probability of default and loss given default and level of collateralizati<strong>on</strong>.<br />
The fair value of corporate lending portfolios is estimated by discounting a projected margin over<br />
expected maturities using parameters derived from the current market values of collateralized lending obligati<strong>on</strong><br />
(CLO) transacti<strong>on</strong>s collateralized with loan portfolios that are similar to the Group’s corporate lending<br />
portfolio.<br />
Securities purchased under resale agreements, securities borrowed, securities sold under repurchase<br />
agreements and securities loaned: Fair value is derived from valuati<strong>on</strong> techniques by discounting future cash<br />
flows using the appropriate credit risk-adjusted discount rate. The credit risk-adjusted discount rate includes<br />
c<strong>on</strong>siderati<strong>on</strong> of the collateral received or pledged in the transacti<strong>on</strong>. These products are typically short-term<br />
and highly collateralized, therefore the fair value is not significantly different to the carrying value.<br />
L<strong>on</strong>g-term debt and trust preferred securities: Fair value is determined from quoted market prices, where<br />
available. Where quoted market prices are not available, fair value is estimated using a valuati<strong>on</strong> technique<br />
that discounts the remaining c<strong>on</strong>tractual cash at a rate at which an instrument with similar characteristics<br />
could be issued at the balance sheet date.<br />
F - 97
<strong>20</strong>-F Notes to the C<strong>on</strong>solidated Balance Sheet<br />
The following table presents the estimated fair value of the Group’s financial instruments which are not car-<br />
ried at fair value in the balance sheet.<br />
Dec 31, <str<strong>on</strong>g><strong>20</strong>09</str<strong>on</strong>g> Dec 31, <strong>20</strong>08 1<br />
Carrying Fair value Carrying Fair value<br />
in € m.<br />
Financial assets:<br />
value<br />
value<br />
Cash and due from banks 9,346 9,346 9,826 9,826<br />
Interest-earning deposits with banks<br />
Central bank funds sold and securities purchased under resale<br />
47,233 47,236 64,739 64,727<br />
agreements 6,8<strong>20</strong> 6,8<strong>20</strong> 9,267 9,218<br />
Securities borrowed 43,509 43,509 35,022 34,764<br />
Loans 258,105 249,661 269,281 254,536<br />
Other assets 1 Financial liabilities:<br />
105,004 104,995 115,871 115,698<br />
Deposits<br />
Central bank funds purchased and securities sold under repurchase<br />
344,2<strong>20</strong> 344,700 395,553 396,148<br />
agreements 45,495 45,511 87,117 87,128<br />
Securities loaned 5,564 5,564 3,216 3,216<br />
Other short-term borrowings 42,897 42,833 39,115 38,954<br />
Other liabilities 2 127,777 127,789 131,156 130,989<br />
L<strong>on</strong>g-term debt 131,782 132,577 133,856 126,432<br />
Trust preferred securities 10,577 9,518 9,729 6,148<br />
1 Only includes financial assets or financial liabilities.<br />
2 Prior year amounts have been adjusted by € 84.7 billi<strong>on</strong> to include certain short-term liabilities which meet the definiti<strong>on</strong> of a financial instrument.<br />
Amounts in this table are generally presented <strong>on</strong> a gross basis, in line with the Group’s accounting policy<br />
regarding offsetting of financial instruments as described in Note [1].<br />
Loans: The difference between fair value and carrying value at December 31, <str<strong>on</strong>g><strong>20</strong>09</str<strong>on</strong>g> does not reflect the ec<strong>on</strong>omic<br />
benefits and costs that the Group expects to receive from these instruments. The difference arose<br />
predominantly due to an increase in expected default rates and reducti<strong>on</strong> in liquidity as implied from market<br />
pricing since initial recogniti<strong>on</strong>. These reducti<strong>on</strong>s in fair value are partially offset by an increase in fair value<br />
due to interest rate movements <strong>on</strong> fixed rate instruments. The difference between fair value and carrying<br />
value has declined during <str<strong>on</strong>g><strong>20</strong>09</str<strong>on</strong>g> primarily due to a reducti<strong>on</strong> in the size of the loan portfolio as well as a<br />
decrease in expected default rates as implied from the market pricing during <str<strong>on</strong>g><strong>20</strong>09</str<strong>on</strong>g>.<br />
L<strong>on</strong>g-term debt and trust preferred securities: The difference between fair value and carrying value is due to<br />
the effect of changes in the rates at which the Group could issue debt with similar maturity and subordinati<strong>on</strong><br />
at the balance sheet date compared to when the instrument was issued. The decrease in the difference<br />
between the fair value and carrying value during the year is primarily due to the tightening of the Group’s<br />
credit spread since the prior year.<br />
F - 98
[15] Financial Assets Available for Sale<br />
The following are the comp<strong>on</strong>ents of financial assets available for sale.<br />
in € m.<br />
Debt securities:<br />
Dec 31, <str<strong>on</strong>g><strong>20</strong>09</str<strong>on</strong>g> Dec 31, <strong>20</strong>08<br />
German government 2,585 2,672<br />
U.S. Treasury and U.S. government agencies 901 302<br />
U.S. local (municipal) governments 1 1<br />
Other foreign governments 3,832 3,700<br />
Corporates 4,280 6,035<br />
Other asset-backed securities 999 372<br />
Mortgage-backed securities, including obligati<strong>on</strong>s of U.S. federal agencies 815 87<br />
Other debt securities 438 4,797<br />
Total debt securities<br />
Equity securities:<br />
13,851 17,966<br />
Equity shares 3,192 4,539<br />
Investment certificates and mutual funds 76 <strong>20</strong>8<br />
Total equity securities 3,268 4,747<br />
Other equity interests 699 893<br />
Loans 1,001 1,229<br />
Total financial assets available for sale 18,819 24,835<br />
[16] Equity Method Investments<br />
Investments in associates and jointly c<strong>on</strong>trolled entities are accounted for using the equity method of account-<br />
ing unless they are held for sale. As of December 31, <str<strong>on</strong>g><strong>20</strong>09</str<strong>on</strong>g>, there were three associates which were<br />
accounted for as held for sale. For informati<strong>on</strong> <strong>on</strong> assets held for sale please refer to Note [24].<br />
As of December 31, <str<strong>on</strong>g><strong>20</strong>09</str<strong>on</strong>g>, the most significant equity method investment was the investment in <strong>Deutsche</strong><br />
Postbank AG, B<strong>on</strong>n, representing approximately 75 % of the carrying value of equity method investments.<br />
On February 25, <str<strong>on</strong>g><strong>20</strong>09</str<strong>on</strong>g>, the Group acquired a 22.9 % stake in <strong>Deutsche</strong> Postbank AG as a c<strong>on</strong>tributi<strong>on</strong>-in-kind<br />
against 50 milli<strong>on</strong> <strong>Deutsche</strong> <strong>Bank</strong> shares, which became effective with the registrati<strong>on</strong> of the shares in the<br />
commercial register <strong>on</strong> March 6, <str<strong>on</strong>g><strong>20</strong>09</str<strong>on</strong>g>. Together with a stake of approximately 2.1 % held at that point in time<br />
as well as additi<strong>on</strong>al shares purchased after that transacti<strong>on</strong>, the Group held an investment of 29.88 % in<br />
<strong>Deutsche</strong> Postbank AG as of December 31, <str<strong>on</strong>g><strong>20</strong>09</str<strong>on</strong>g>. In additi<strong>on</strong> to the acquisiti<strong>on</strong> of the shares, the transacti<strong>on</strong><br />
comprised two further tranches: a mandatorily-exchangeable b<strong>on</strong>d of € 3.0 billi<strong>on</strong> covering an additi<strong>on</strong>al<br />
27.4 % stake and put and call opti<strong>on</strong>s covering an additi<strong>on</strong>al 12.1 % stake in <strong>Deutsche</strong> Postbank AG. Due to<br />
its specific terms and c<strong>on</strong>diti<strong>on</strong>s, the mandatorily-exchangeable b<strong>on</strong>d primarily c<strong>on</strong>tains equity risk and is<br />
reported as part of the equity method investment. In additi<strong>on</strong>, the net fair value of the derivative liability resulting<br />
from the put/call structure up<strong>on</strong> completi<strong>on</strong> of the transacti<strong>on</strong> was added to the acquisiti<strong>on</strong> cost of the<br />
equity method investment.<br />
F - 99
<strong>20</strong>-F Notes to the C<strong>on</strong>solidated Balance Sheet<br />
The following table provides summarized financial informati<strong>on</strong> of <strong>Deutsche</strong> Postbank AG for the years ended<br />
December 31, <str<strong>on</strong>g><strong>20</strong>09</str<strong>on</strong>g>, <strong>20</strong>08 and <strong>20</strong>07. The informati<strong>on</strong> for the year ended December 31, <str<strong>on</strong>g><strong>20</strong>09</str<strong>on</strong>g> is based <strong>on</strong><br />
preliminary data, which was published by <strong>Deutsche</strong> Postbank AG <strong>on</strong> February 25, <strong>20</strong>10. Complete financial<br />
statements for the year ended December 31, <str<strong>on</strong>g><strong>20</strong>09</str<strong>on</strong>g> are not yet publicly available.<br />
in € m.<br />
Preliminary<br />
Dec 31, <str<strong>on</strong>g><strong>20</strong>09</str<strong>on</strong>g> Dec 31, <strong>20</strong>08 1 Dec 31, <strong>20</strong>07<br />
Total assets 226,609 231,219 <strong>20</strong>2,913<br />
Total liabilities 221,358 226,267 197,688<br />
Revenues 3,088 2,288 4,244<br />
Net income (loss) 76 (886) 856<br />
1 On February 25, <strong>20</strong>10, <strong>Deutsche</strong> Postbank AG disclosed preliminary results for the year ended December 31, <str<strong>on</strong>g><strong>20</strong>09</str<strong>on</strong>g>. According to this informati<strong>on</strong>, the net<br />
loss for the year ended December 31, <strong>20</strong>08 was retrospectively adjusted to € 886 milli<strong>on</strong> instead of € 821 milli<strong>on</strong> as reported before. The impact of this<br />
change <strong>on</strong> other financial informati<strong>on</strong> in the table above has been adjusted as well.<br />
The following are the comp<strong>on</strong>ents of the net income (loss) from all equity method investments.<br />
in € m.<br />
Net income (loss) from equity method investments:<br />
<str<strong>on</strong>g><strong>20</strong>09</str<strong>on</strong>g> <strong>20</strong>08<br />
Pro-rata share of investees’ net income (loss) 189 53<br />
Net gains (losses) <strong>on</strong> disposal of equity method investments 21 87<br />
Impairments (151) (94)<br />
Total net income (loss) from equity method investments 59 46<br />
There was no unrecognized share of losses of an investee, neither for the period, nor cumulatively.<br />
Equity method investments for which there were published price quotati<strong>on</strong>s had a carrying value of € 6.1 billi<strong>on</strong><br />
and a fair value of € 3.8 billi<strong>on</strong> as of December 31, <str<strong>on</strong>g><strong>20</strong>09</str<strong>on</strong>g>, and a carrying value of € 154 milli<strong>on</strong> and a fair value<br />
of € 147 milli<strong>on</strong> as of December 31, <strong>20</strong>08.<br />
The difference between fair value and carrying value of equity method investments is mainly related to the<br />
investment in <strong>Deutsche</strong> Postbank AG. For this investment, an impairment test was performed based <strong>on</strong> the<br />
recoverable amount defined as the higher of the fair value less costs to sell and the value in use which is<br />
derived from future cash flows expected to be generated by <strong>Deutsche</strong> Postbank AG discounted to their<br />
present value. The future cash flows are derived from the estimate as to the development of the future capital<br />
requirements and the expected corresp<strong>on</strong>ding annual return <strong>on</strong> that future capital base. The assessment of<br />
the capital development and the corresp<strong>on</strong>ding profitability is based <strong>on</strong> publicly available informati<strong>on</strong> issued<br />
by <strong>Deutsche</strong> Postbank AG, such as annual and quarterly reports, management and investor relati<strong>on</strong>s<br />
announcements as well as broker reports <strong>on</strong> <strong>Deutsche</strong> Postbank AG. This informati<strong>on</strong> is further substantiated<br />
by internal analysis. In additi<strong>on</strong>, the expected benefits of the signed cooperati<strong>on</strong> agreement between<br />
<strong>Deutsche</strong> <strong>Bank</strong> AG and <strong>Deutsche</strong> Postbank AG are taken into account further c<strong>on</strong>tributing to the value in use.<br />
The impairment test based <strong>on</strong> the discounted cash flow model did not indicate an impairment of the investment<br />
as the derived value in use exceeded the fair value less costs to sell as well as the book value as of<br />
December 31, <str<strong>on</strong>g><strong>20</strong>09</str<strong>on</strong>g>.<br />
F - 100
The investees have no significant c<strong>on</strong>tingent liabilities to which the Group is exposed.<br />
In <str<strong>on</strong>g><strong>20</strong>09</str<strong>on</strong>g> and <strong>20</strong>08, n<strong>on</strong>e of the Group’s investees experienced any significant restricti<strong>on</strong>s to transfer funds in<br />
the form of cash dividends, or repayment of loans or advances.<br />
[17] Loans<br />
The following are the principal comp<strong>on</strong>ents of loans by industry classificati<strong>on</strong>.<br />
in € m. Dec 31, <str<strong>on</strong>g><strong>20</strong>09</str<strong>on</strong>g> Dec 31, <strong>20</strong>08<br />
<strong>Bank</strong>s and insurance 22,002 26,998<br />
Manufacturing 17,314 19,043<br />
Households (excluding mortgages) 27,002 30,923<br />
Households – mortgages 58,673 52,453<br />
Public sector 9,572 9,972<br />
Wholesale and retail trade 10,938 11,761<br />
Commercial real estate activities 28,959 27,083<br />
Lease financing 2,078 2,700<br />
Fund management activities 26,462 31,158<br />
Other 59,698 60,276<br />
Gross loans 262,698 272,367<br />
(Deferred expense)/unearned income 1,250 1,148<br />
Loans less (deferred expense)/unearned income 261,448 271,219<br />
Less: Allowance for loan losses 3,343 1,938<br />
Total loans 258,105 269,281<br />
Government Assistance<br />
In the course of its business, the Group regularly applies for and receives government support by means of<br />
Export Credit Agency (“ECA”) guarantees covering transfer and default risks for the financing of exports and<br />
investments into Emerging Markets and, to a lesser extent, developed markets for Structured Trade & Export<br />
Finance business. Almost all export-oriented states have established such ECAs to support their domestic<br />
exporters. The ECAs act in the name and <strong>on</strong> behalf of the government of their respective country and are<br />
either c<strong>on</strong>stituted directly as governmental departments or organized as private companies vested with the<br />
official mandate of the government to act <strong>on</strong> its behalf. Terms and c<strong>on</strong>diti<strong>on</strong>s of such ECA guarantees granted<br />
for short-term, mid-term and l<strong>on</strong>g-term financings are quite comparable due to the fact that most of the ECAs<br />
act within the scope of the Organisati<strong>on</strong> for Ec<strong>on</strong>omic Cooperati<strong>on</strong> and Development (“OECD”) c<strong>on</strong>sensus<br />
rules. The OECD c<strong>on</strong>sensus rules, an intergovernmental agreement of the OECD member states, define<br />
benchmarks to ensure that a fair competiti<strong>on</strong> between different exporting nati<strong>on</strong>s will take place. Almost 50 %<br />
of such ECA guarantees received by the Group were issued by the Euler-Hermes Kreditversicherungs AG<br />
acting <strong>on</strong> behalf of the Federal Republic of Germany.<br />
In certain financings, the Group also receives government guarantees from nati<strong>on</strong>al and internati<strong>on</strong>al<br />
governmental instituti<strong>on</strong>s as collateral to support financings in the interest of the respective governments.<br />
F - 101
<strong>20</strong>-F Notes to the C<strong>on</strong>solidated Balance Sheet<br />
[18] Allowance for Credit Losses<br />
The allowance for credit losses c<strong>on</strong>sists of an allowance for loan losses and an allowance for off-balance<br />
sheet positi<strong>on</strong>s.<br />
The following table presents a breakdown of the movements in the Group’s allowance for loan losses for the<br />
periods specified.<br />
<str<strong>on</strong>g><strong>20</strong>09</str<strong>on</strong>g> <strong>20</strong>08 <strong>20</strong>07<br />
Individually Collectively Total Individually Collectively Total Individually Collectively Total<br />
in € m.<br />
Allowance,<br />
assessed assessed<br />
assessed assessed<br />
assessed assessed<br />
beginning of year 977 961 1,938 930 775 1,705 985 684 1,670<br />
Provisi<strong>on</strong> for loan losses 1,789 808 2,597 382 702 1,084 146 505 651<br />
Net charge-offs: (637) (419) (1,056) (301) (477) (778) (149) (378) (527)<br />
Charge-offs (670) (552) (1,222) (364) (626) (990) (244) (508) (752)<br />
Recoveries<br />
Changes in the group of<br />
33 133 166 63 149 212 95 130 225<br />
c<strong>on</strong>solidated companies<br />
Exchange rate<br />
– – – – – – – – –<br />
changes/other (101) (36) (137) (34) (39) (74) (52) (36) (88)<br />
Allowance, end of year 2,029 1,314 3,343 977 961 1,938 930 775 1,705<br />
The following table presents the activity in the Group’s allowance for off-balance sheet positi<strong>on</strong>s, which c<strong>on</strong>sists<br />
of c<strong>on</strong>tingent liabilities and lending-related commitments.<br />
<str<strong>on</strong>g><strong>20</strong>09</str<strong>on</strong>g> <strong>20</strong>08 <strong>20</strong>07<br />
Individually Collectively Total Individually Collectively Total Individually Collectively Total<br />
in € m.<br />
Allowance,<br />
assessed assessed<br />
assessed assessed<br />
assessed assessed<br />
beginning of year<br />
Provisi<strong>on</strong> for off-balance<br />
98 112 210 101 118 219 127 129 256<br />
sheet positi<strong>on</strong>s 21 12 33 (2) (6) (8) (32) (6) (38)<br />
Usage<br />
Changes in the group of<br />
(45) – (45) – – – – – –<br />
c<strong>on</strong>solidated companies<br />
Exchange rate<br />
– – – – – – 7 3 10<br />
changes/other 10 – 10 (1) – (1) (1) (8) (8)<br />
Allowance, end of year 83 124 <strong>20</strong>7 98 112 210 101 118 219<br />
F - 102
[19] Derecogniti<strong>on</strong> of Financial Assets<br />
The Group enters into transacti<strong>on</strong>s in which it transfers previously recognized financial assets, such as debt<br />
securities, equity securities and traded loans, but retains substantially all of the risks and rewards of those<br />
assets. Due to this retenti<strong>on</strong>, the transferred financial assets are not derecognized and the transfers are<br />
accounted for as secured financing transacti<strong>on</strong>s. The most comm<strong>on</strong> transacti<strong>on</strong>s of this nature entered into<br />
by the Group are repurchase agreements, securities lending agreements and total return swaps, in which the<br />
Group retains substantially all of the associated credit, equity price, interest rate and foreign exchange risks<br />
and rewards associated with the assets as well as the associated income streams.<br />
The following table provides further informati<strong>on</strong> <strong>on</strong> the asset types and the associated transacti<strong>on</strong>s that did<br />
not qualify for derecogniti<strong>on</strong>, and their associated liabilities.<br />
Carrying amount of transferred assets<br />
in € m. Dec 31, <str<strong>on</strong>g><strong>20</strong>09</str<strong>on</strong>g> Dec 31, <strong>20</strong>08 1<br />
Trading securities not derecognized due to the following transacti<strong>on</strong>s:<br />
Repurchase agreements 58,584 47,882<br />
Securities lending agreements 18,943 10,518<br />
Total return swaps 10,028 10,971<br />
Total trading securities 87,555 69,371<br />
Other trading assets 2,915 2,560<br />
Financial assets available for sale 492 472<br />
Loans 2,049 2,250<br />
Total 93,011 74,653<br />
Carrying amount of associated liability 84,381 66,597<br />
1 Prior year amounts have been adjusted.<br />
C<strong>on</strong>tinuing involvement accounting is typically applied when the Group retains the rights to future cash flows<br />
of an asset, c<strong>on</strong>tinues to be exposed to a degree of default risk in the transferred assets or holds a residual<br />
interest in, or enters into derivative c<strong>on</strong>tracts with, securitizati<strong>on</strong> or special purpose entities.<br />
The following table provides further detail <strong>on</strong> the carrying value of the assets transferred in which the Group<br />
still has c<strong>on</strong>tinuing involvement.<br />
in € m. Dec 31, <str<strong>on</strong>g><strong>20</strong>09</str<strong>on</strong>g> Dec 31, <strong>20</strong>08<br />
Carrying amount of the original assets transferred:<br />
Trading securities 4,688 7,250<br />
Other trading assets 4,594 4,190<br />
Carrying amount of the assets c<strong>on</strong>tinued to be recognized:<br />
Trading securities 2,899 4,490<br />
Other trading assets 1,429 1,262<br />
Carrying amount of associated liability 4,253 6,383<br />
F - 103
<strong>20</strong>-F Notes to the C<strong>on</strong>solidated Balance Sheet<br />
[<strong>20</strong>] Assets Pledged and Received as Collateral<br />
The Group pledges assets primarily for repurchase agreements and securities borrowing agreements which<br />
are generally c<strong>on</strong>ducted under terms that are usual and customary to standard securitized borrowing c<strong>on</strong>tracts.<br />
In additi<strong>on</strong> the Group pledges collateral against other borrowing arrangements and for margining<br />
purposes <strong>on</strong> OTC derivative liabilities. The carrying value of the Group’s assets pledged as collateral for liabilities<br />
or c<strong>on</strong>tingent liabilities is as follows.<br />
in € m. Dec 31, <str<strong>on</strong>g><strong>20</strong>09</str<strong>on</strong>g> Dec 31, <strong>20</strong>08 1<br />
Interest-earning deposits with banks 59 69<br />
Financial assets at fair value through profit or loss 88,663 81,555<br />
Financial assets available for sale 558 517<br />
Loans 19,537 22,534<br />
Other2 56 24<br />
Total 108,873 104,699<br />
1 Prior year amounts have been adjusted.<br />
2 Includes Property and equipment pledged as collateral.<br />
Assets transferred where the transferee has the right to sell or repledge are disclosed <strong>on</strong> the face of the<br />
balance sheet. As of December 31, <str<strong>on</strong>g><strong>20</strong>09</str<strong>on</strong>g>, and December 31, <strong>20</strong>08, these amounts were € 80 billi<strong>on</strong> and<br />
€ 69 billi<strong>on</strong>, respectively.<br />
As of December 31, <str<strong>on</strong>g><strong>20</strong>09</str<strong>on</strong>g>, and December 31, <strong>20</strong>08, the Group had received collateral with a fair value of<br />
€ 225 billi<strong>on</strong> and € 255 billi<strong>on</strong>, respectively, arising from securities purchased under reverse repurchase<br />
agreements, securities borrowed, derivatives transacti<strong>on</strong>s, customer margin loans and other transacti<strong>on</strong>s.<br />
These transacti<strong>on</strong>s were generally c<strong>on</strong>ducted under terms that are usual and customary for standard secured<br />
lending activities and the other transacti<strong>on</strong>s described. The Group, as the secured party, has the right to sell<br />
or repledge such collateral, subject to the Group returning equivalent securities up<strong>on</strong> completi<strong>on</strong> of the transacti<strong>on</strong>.<br />
As of December 31, <str<strong>on</strong>g><strong>20</strong>09</str<strong>on</strong>g>, and <strong>20</strong>08, the Group had resold or repledged € <strong>20</strong>0 billi<strong>on</strong> and € 232 billi<strong>on</strong>,<br />
respectively. This was primarily to cover short sales, securities loaned and securities sold under repurchase<br />
agreements.<br />
F - 104
[21] Property and Equipment<br />
in € m.<br />
Cost of acquisiti<strong>on</strong>:<br />
Owner<br />
occupied<br />
properties<br />
F - 105<br />
Furniture and<br />
equipment<br />
Leasehold<br />
improvements<br />
C<strong>on</strong>structi<strong>on</strong>in-progress<br />
Balance as of January 1, <strong>20</strong>08 1,528 2,297 1,444 124 5,394<br />
Changes in the group of c<strong>on</strong>solidated companies (29) – (3) – (32)<br />
Additi<strong>on</strong>s <strong>20</strong> 253 182 484 939<br />
Transfers 11 217 36 717 981<br />
Reclassificati<strong>on</strong>s (to)/from ‘held for sale’ – – (40) – (40)<br />
Disposals 48 153 44 – 245<br />
Exchange rate changes (15) (114) (62) (8) (199)<br />
Balance as of December 31, <strong>20</strong>08 1,467 2,500 1,513 1,317 6,797<br />
Changes in the group of c<strong>on</strong>solidated companies 5 (2) (2) – 1<br />
Additi<strong>on</strong>s 4 242 70 277 592<br />
Transfers 2 23 19 (1,121) (1,076)<br />
Reclassificati<strong>on</strong>s (to)/from ‘held for sale’ (2) – – – (2)<br />
Disposals 11 75 34 – 1<strong>20</strong><br />
Exchange rate changes 4 53 25 (6) 76<br />
Balance as of December 31, <str<strong>on</strong>g><strong>20</strong>09</str<strong>on</strong>g> 1,469 2,741 1,592 466 6,268<br />
Accumulated depreciati<strong>on</strong> and impairment:<br />
Balance as of January 1, <strong>20</strong>08 547 1,658 779 – 2,985<br />
Changes in the group of c<strong>on</strong>solidated companies (6) – (1) – (7)<br />
Depreciati<strong>on</strong> 36 227 144 – 407<br />
Impairment losses – 1 15 – 16<br />
Reversals of impairment losses – – – – –<br />
Transfers (5) 18 6 – 19<br />
Reclassificati<strong>on</strong>s (to)/from ‘held for sale’ – – (40) – (40)<br />
Disposals 9 108 39 – 156<br />
Exchange rate changes (7) (91) (40) – (138)<br />
Balance as of December 31, <strong>20</strong>08 556 1,705 824 – 3,085<br />
Changes in the group of c<strong>on</strong>solidated companies (1) (3) (2) – (7)<br />
Depreciati<strong>on</strong> 36 232 150 – 417<br />
Impairment losses 5 – 11 5 21<br />
Reversals of impairment losses – – – – –<br />
Transfers (1) 10 3 – 12<br />
Reclassificati<strong>on</strong>s (to)/from ‘held for sale’ – – – – –<br />
Disposals 5 55 24 – 85<br />
Exchange rate changes – 37 9 – 47<br />
Balance as of December 31, <str<strong>on</strong>g><strong>20</strong>09</str<strong>on</strong>g> 589 1,926 970 5 3,491<br />
Carrying amount:<br />
Balance as of December 31, <strong>20</strong>08 911 795 689 1,317 3,712<br />
Balance as of December 31, <str<strong>on</strong>g><strong>20</strong>09</str<strong>on</strong>g> 880 815 621 461 2,777<br />
Total
<strong>20</strong>-F Notes to the C<strong>on</strong>solidated Balance Sheet<br />
In <strong>20</strong>08 <strong>Deutsche</strong> <strong>Bank</strong> completed a foreclosure <strong>on</strong> a property under c<strong>on</strong>structi<strong>on</strong> (with a carrying value of<br />
€ 1.1 billi<strong>on</strong>), previously held as collateral of a loan under trading assets. The asset was then reclassified as<br />
c<strong>on</strong>structi<strong>on</strong>-in-progress in Property and Equipment, in the <strong>20</strong>08 financial statements. In <str<strong>on</strong>g><strong>20</strong>09</str<strong>on</strong>g>, following a<br />
change in the relevant accounting standards, the Group changed the accounting treatment for this asset and<br />
reclassified it to investment property under Other Assets in the <str<strong>on</strong>g><strong>20</strong>09</str<strong>on</strong>g> financial statements.<br />
Impairment losses <strong>on</strong> property and equipment are recorded within General and administrative expenses in<br />
the income statement.<br />
The carrying value of items of property and equipment <strong>on</strong> which there is a restricti<strong>on</strong> <strong>on</strong> sale was € 72 milli<strong>on</strong><br />
as of December 31, <str<strong>on</strong>g><strong>20</strong>09</str<strong>on</strong>g>.<br />
Commitments for the acquisiti<strong>on</strong> of property and equipment were € 145 milli<strong>on</strong> at year-end <str<strong>on</strong>g><strong>20</strong>09</str<strong>on</strong>g>.<br />
[22] Leases<br />
The Group is lessee under lease arrangements covering real property and equipment.<br />
Finance Lease Commitments<br />
The following table presents the net carrying value for each class of leasing assets held under finance leases.<br />
in € m. Dec 31, <str<strong>on</strong>g><strong>20</strong>09</str<strong>on</strong>g> Dec 31, <strong>20</strong>08<br />
Land and buildings 91 95<br />
Furniture and equipment 2 2<br />
Other – –<br />
Net carrying value 93 97<br />
Additi<strong>on</strong>ally, the Group has sublet leased assets classified as finance leases with a net carrying value of<br />
€ 67 milli<strong>on</strong> as of December 31, <str<strong>on</strong>g><strong>20</strong>09</str<strong>on</strong>g>, and € 60 milli<strong>on</strong> as of December 31, <strong>20</strong>08.<br />
The future minimum lease payments required under the Group’s finance leases were as follows.<br />
in € m. Dec 31, <str<strong>on</strong>g><strong>20</strong>09</str<strong>on</strong>g> Dec 31, <strong>20</strong>08<br />
Future minimum lease payments:<br />
not later than <strong>on</strong>e year 25 32<br />
later than <strong>on</strong>e year and not later than five years 106 118<br />
later than five years 144 <strong>20</strong>2<br />
Total future minimum lease payments 275 352<br />
less: Future interest charges 108 160<br />
Present value of finance lease commitments 167 192<br />
F - 106
Future minimum sublease payments of € 111 milli<strong>on</strong> are expected to be received under n<strong>on</strong>-cancelable sub-<br />
leases as of December 31, <str<strong>on</strong>g><strong>20</strong>09</str<strong>on</strong>g>. As of December 31, <strong>20</strong>08 future minimum sublease payments of € 193 milli<strong>on</strong><br />
were expected. As of December 31, <str<strong>on</strong>g><strong>20</strong>09</str<strong>on</strong>g> the amount of c<strong>on</strong>tingent rent recognized in the income statement<br />
was (0.7) milli<strong>on</strong>. As of December 31, <strong>20</strong>08 c<strong>on</strong>tingent rent was € 1 milli<strong>on</strong>. The c<strong>on</strong>tingent rent is based <strong>on</strong><br />
market interest rates; below a certain rate the Group receives a rebate.<br />
Operating Lease Commitments<br />
The future minimum lease payments required under the Group’s operating leases were as follows.<br />
in € m. Dec 31, <str<strong>on</strong>g><strong>20</strong>09</str<strong>on</strong>g> Dec 31, <strong>20</strong>08<br />
Future minimum rental payments:<br />
not later than <strong>on</strong>e year 728 765<br />
later than <strong>on</strong>e year and not later than five years 2,046 2,187<br />
later than five years 2,352 2,797<br />
Total future minimum rental payments 5,126 5,749<br />
less: Future minimum rentals to be received 255 245<br />
Net future minimum rental payments 4,871 5,504<br />
In <str<strong>on</strong>g><strong>20</strong>09</str<strong>on</strong>g>, € 804 milli<strong>on</strong> were charges relating to lease and sublease agreements, of which € 819 milli<strong>on</strong> was for<br />
minimum lease payments, € 22 milli<strong>on</strong> for c<strong>on</strong>tingent rents and € 37 milli<strong>on</strong> for sublease rentals received.<br />
F - 107
<strong>20</strong>-F Notes to the C<strong>on</strong>solidated Balance Sheet<br />
[23] Goodwill and Other Intangible Assets<br />
Goodwill<br />
Changes in Goodwill<br />
The changes in the carrying amount of goodwill, as well as gross amounts and accumulated impairment<br />
losses of goodwill, for the years ended December 31, <str<strong>on</strong>g><strong>20</strong>09</str<strong>on</strong>g>, and <strong>20</strong>08, are shown below by business<br />
segment.<br />
in € m.<br />
Corporate<br />
<strong>Bank</strong>ing &<br />
Securities<br />
Global<br />
Transacti<strong>on</strong><br />
<strong>Bank</strong>ing<br />
1 Impairment losses of goodwill are recorded as impairment of intangible assets in the income statement.<br />
2 Includes € 10 milli<strong>on</strong> of reducti<strong>on</strong> in goodwill related to a prior year’s dispositi<strong>on</strong>.<br />
In <str<strong>on</strong>g><strong>20</strong>09</str<strong>on</strong>g>, additi<strong>on</strong>s to goodwill totaled € 3 milli<strong>on</strong> and included € 2 milli<strong>on</strong> in Corporate <strong>Bank</strong>ing & Securities<br />
(CB&S) resulting from the acquisiti<strong>on</strong> of outstanding minority interest in an Algerian financial advisory company<br />
and € 1 milli<strong>on</strong> in Global Transacti<strong>on</strong> <strong>Bank</strong>ing (GTB) related to the acquisiti<strong>on</strong> of Dresdner <strong>Bank</strong>’s Global<br />
Agency Securities Lending business. Effective January 1, <str<strong>on</strong>g><strong>20</strong>09</str<strong>on</strong>g> and following a change in management<br />
resp<strong>on</strong>sibility, goodwill of € 306 milli<strong>on</strong> related to Maher Terminals LLC and Maher Terminals of Canada Corp.,<br />
collectively and hereafter referred to as Maher Terminals, was transferred from Asset and Wealth Management<br />
(AWM) to Corporate Investments (CI). Due to their reclassificati<strong>on</strong> to the held for sale category in the<br />
third quarter <str<strong>on</strong>g><strong>20</strong>09</str<strong>on</strong>g>, goodwill of € 14 milli<strong>on</strong> (CB&S) related to a n<strong>on</strong>integrated investment in a renewable energy<br />
development project was transferred as part of a disposal group to other assets (see Note [24]).<br />
F - 108<br />
Asset and<br />
Wealth<br />
Management<br />
Private &<br />
Business<br />
Clients<br />
Corporate<br />
Investments<br />
Balance as of January 1, <strong>20</strong>08 3,076 416 2,769 971 – 7,232<br />
Purchase accounting adjustments – – – – – –<br />
Goodwill acquired during the year 1 28 33 2 – 64<br />
Reclassificati<strong>on</strong>s from (to) held for sale<br />
Goodwill related to dispositi<strong>on</strong>s without being<br />
– – 564 – – 564<br />
classified as held for sale – – (21) – – (21)<br />
Impairment losses 1 (5) – (270) – – (275)<br />
Exchange rate changes/other 56 12 (100)2<br />
1 – (31)<br />
Balance as of December 31, <strong>20</strong>08 3,128 456 2,975 974 – 7,533<br />
Gross amount of goodwill 3,133 456 3,245 974 261 8,069<br />
Accumulated impairment losses (5) – (270) – (261) (536)<br />
Balance as of January 1, <str<strong>on</strong>g><strong>20</strong>09</str<strong>on</strong>g> 3,128 456 2,975 974 – 7,533<br />
Purchase accounting adjustments – – – – – –<br />
Goodwill acquired during the year 2 1 – – – 3<br />
Transfers – – (306) – 306 –<br />
Reclassificati<strong>on</strong>s from (to) held for sale<br />
Goodwill related to dispositi<strong>on</strong>s without being<br />
(14) – – – – (14)<br />
classified as held for sale – – – – – –<br />
Impairment losses 1 – – – – (151) (151)<br />
Exchange rate changes/other (11) (4) 46 – 18 49<br />
Balance as of December 31, <str<strong>on</strong>g><strong>20</strong>09</str<strong>on</strong>g> 3,105 453 2,715 974 173 7,4<strong>20</strong><br />
Gross amount of goodwill 3,109 453 2,715 974 849 8,100<br />
Accumulated impairment losses (4) – – – (676) (680)<br />
Total
In <strong>20</strong>08, the main additi<strong>on</strong> to goodwill in AWM was € 597 milli<strong>on</strong> related to Maher Terminals. The total of<br />
€ 597 milli<strong>on</strong> c<strong>on</strong>sisted of an additi<strong>on</strong> to goodwill amounting to € 33 milli<strong>on</strong> which resulted from the reacquisi-<br />
ti<strong>on</strong> of a minority interest stake in Maher Terminals. Further, disc<strong>on</strong>tinuing the held for sale accounting of<br />
Maher Terminals resulted in a transfer of € 564 milli<strong>on</strong> to goodwill from assets held for sale. The main additi<strong>on</strong><br />
to goodwill in GTB was € 28 milli<strong>on</strong> related to the acquisiti<strong>on</strong> of HedgeWorks LLC.<br />
In the sec<strong>on</strong>d quarter of <str<strong>on</strong>g><strong>20</strong>09</str<strong>on</strong>g>, a goodwill impairment loss of € 151 milli<strong>on</strong> was recorded in CI related to its<br />
n<strong>on</strong>integrated investment in Maher Terminals, following the c<strong>on</strong>tinued negative outlook for c<strong>on</strong>tainer and<br />
business volumes. The fair value less costs to sell of the investment was determined based <strong>on</strong> a discounted<br />
cash flow model.<br />
In <strong>20</strong>08, a total goodwill impairment loss of € 275 milli<strong>on</strong> was recorded. Of this total, € 270 milli<strong>on</strong> related to an<br />
investment in AWM and € 5 milli<strong>on</strong> related to a listed investment in CB&S. Both impairment losses related to<br />
investments which were not integrated into the primary cash-generating units within AWM and CB&S. The<br />
impairment review of the investment Maher Terminals in AWM was triggered by a significant decline in business<br />
volume as a result of the ec<strong>on</strong>omic climate at that time. The fair value less costs to sell of the investment<br />
was determined based <strong>on</strong> a discounted cash flow model. The impairment review of the investment in<br />
CB&S was triggered by write-downs of certain other assets and the negative business outlook of the investment.<br />
The fair value less costs to sell of the investment was determined based <strong>on</strong> the market price of the<br />
listed investment.<br />
In the first quarter of <strong>20</strong>07, an impairment review of goodwill was triggered in CI after the divisi<strong>on</strong> realized a<br />
gain of € 178 milli<strong>on</strong> related to its equity method investment in <strong>Deutsche</strong> Interhotel Holding GmbH & Co. KG.<br />
As a result of this review, a goodwill impairment loss totaling € 54 milli<strong>on</strong> was recognized.<br />
Goodwill Impairment Test<br />
Goodwill is allocated to cash-generating units for the purpose of impairment testing, c<strong>on</strong>sidering the business<br />
level at which goodwill is m<strong>on</strong>itored for internal management purposes. On this basis, the Group’s cashgenerating<br />
units primarily are Global Markets and Corporate Finance within the Corporate <strong>Bank</strong>ing & Securities<br />
segment, Global Transacti<strong>on</strong> <strong>Bank</strong>ing, Asset Management and Private Wealth Management within the Asset<br />
and Wealth Management segment, Private & Business Clients and Corporate Investments. In additi<strong>on</strong>, the<br />
segments CB&S and CI carry goodwill resulting from the acquisiti<strong>on</strong> of n<strong>on</strong>integrated investments which are<br />
not allocated to the respective segments’ primary cash-generating units. Such goodwill is tested individually<br />
for impairment <strong>on</strong> the level of each of the n<strong>on</strong>integrated investments and summarized as Others in the table<br />
below. The n<strong>on</strong>integrated investment in CI c<strong>on</strong>stitutes Maher Terminals, which was transferred from AWM to<br />
CI effective January 1, <str<strong>on</strong>g><strong>20</strong>09</str<strong>on</strong>g>.<br />
F - 109
<strong>20</strong>-F Notes to the C<strong>on</strong>solidated Balance Sheet<br />
The carrying amounts of goodwill by cash-generating unit for the years ended December 31, <str<strong>on</strong>g><strong>20</strong>09</str<strong>on</strong>g>, and <strong>20</strong>08,<br />
are as follows.<br />
in € m.<br />
Global<br />
Markets<br />
Corporate<br />
Finance<br />
Global<br />
Transacti<strong>on</strong><br />
<strong>Bank</strong>ing<br />
Goodwill is tested for impairment annually in the fourth quarter by comparing the recoverable amount of each<br />
goodwill carrying cash-generating unit with its carrying amount. The carrying amount of a cash-generating unit<br />
is derived based <strong>on</strong> the amount of equity allocated to a cash-generating unit. The carrying amount also c<strong>on</strong>siders<br />
the amount of goodwill and unamortized intangible assets of a cash-generating unit. The recoverable<br />
amount is the higher of a cash-generating unit’s fair value less costs to sell and its value in use. The annual<br />
goodwill impairment tests in <str<strong>on</strong>g><strong>20</strong>09</str<strong>on</strong>g>, <strong>20</strong>08 and <strong>20</strong>07 did not result in an impairment loss of goodwill of the<br />
Group’s primary cash-generating units as the recoverable amount for these cash-generating units was higher<br />
than their respective carrying amount.<br />
The following secti<strong>on</strong>s describe how the Group determines the recoverable amount of its primary goodwill<br />
carrying cash-generating units and provides informati<strong>on</strong> <strong>on</strong> certain key assumpti<strong>on</strong>s <strong>on</strong> which management<br />
based its determinati<strong>on</strong> of the recoverable amount.<br />
Recoverable Amount<br />
The Group determines the recoverable amount of its primary cash-generating units <strong>on</strong> the basis of value in<br />
use and employs a valuati<strong>on</strong> model based <strong>on</strong> discounted cash flows (“DCF”). The DCF model employed by<br />
the Group reflects the specifics of the banking business and its regulatory envir<strong>on</strong>ment. The model calculates<br />
the present value of the estimated future earnings that are distributable to shareholders after fulfilling the<br />
respective regulatory capital requirements.<br />
F - 110<br />
Asset<br />
Management<br />
Private<br />
Wealth<br />
Management<br />
Private &<br />
Business<br />
Clients<br />
Corporate<br />
Investments<br />
Others Total<br />
Goodwill<br />
As of December 31, <strong>20</strong>08 2,113 1,000 456 1,765 904 974 – 321 7,533<br />
As of December 31, <str<strong>on</strong>g><strong>20</strong>09</str<strong>on</strong>g> 2,106 998 453 1,788 927 974 – 174 7,4<strong>20</strong>
The DCF model uses earnings projecti<strong>on</strong>s based <strong>on</strong> financial plans agreed by management which, for<br />
purposes of the goodwill impairment test, are extrapolated to a five-year period and are discounted to their<br />
present value. Estimating future earnings requires judgment, c<strong>on</strong>sidering past and actual performance as well<br />
as expected developments in the respective markets and in the overall macro-ec<strong>on</strong>omic envir<strong>on</strong>ment. Earnings<br />
projecti<strong>on</strong>s bey<strong>on</strong>d the initial five-year period are, where applicable, adjusted to derive a sustainable<br />
level and assumed to increase by or c<strong>on</strong>verging towards a c<strong>on</strong>stant l<strong>on</strong>g-term growth rate, which is based <strong>on</strong><br />
expectati<strong>on</strong>s for the development of gross domestic product and inflati<strong>on</strong>, and are captured in the terminal<br />
value.<br />
Key Assumpti<strong>on</strong>s and Sensitivities<br />
The value in use of a cash-generating unit is sensitive to the earnings projecti<strong>on</strong>s, to the discount rate applied<br />
and, to a much lesser extent, to the l<strong>on</strong>g-term growth rate. The discount rates applied have been determined<br />
based <strong>on</strong> the capital asset pricing model which is comprised of a risk-free interest rate, a market risk premium<br />
and a factor covering the systematic market risk (beta factor). The values for the risk-free interest rate, the<br />
market risk premium and the beta factors are determined using external sources of informati<strong>on</strong>. Businessspecific<br />
beta factors are determined based <strong>on</strong> a respective group of peer companies. Variati<strong>on</strong>s in all of these<br />
comp<strong>on</strong>ents might impact the calculati<strong>on</strong> of the discount rates. Pre-tax discount rates applied to determine<br />
the value in use of the cash-generating units in <str<strong>on</strong>g><strong>20</strong>09</str<strong>on</strong>g> and <strong>20</strong>08 are as follows.<br />
Primary cash-generating units Discount rate (pre-tax)<br />
Corporate and Investment <strong>Bank</strong><br />
F - 111<br />
<str<strong>on</strong>g><strong>20</strong>09</str<strong>on</strong>g> <strong>20</strong>08<br />
Global Markets 14.7 % 13.1 %<br />
Corporate Finance 14.5 % 13.4 %<br />
Global Transacti<strong>on</strong> <strong>Bank</strong>ing 12.5 % 12.9 %<br />
Private Clients and Asset Management<br />
Asset Management 13.5 % 14.1 %<br />
Private Wealth Management 13.2 % 14.1 %<br />
Private & Business Clients 13.1 % 13.2 %
<strong>20</strong>-F Notes to the C<strong>on</strong>solidated Balance Sheet<br />
Sensitivities: In validating the value in use determined for the cash-generating units, the major value drivers of<br />
each cash-generating unit are reviewed annually. In additi<strong>on</strong>, key assumpti<strong>on</strong>s used in the DCF model<br />
(for example, the discount rate and the earnings projecti<strong>on</strong>s) are sensitized to test the resilience of value in<br />
use. Management believes that the <strong>on</strong>ly circumstance where reas<strong>on</strong>ably possible changes in key assumpti<strong>on</strong>s<br />
might have caused an impairment loss to be recognized was in respect of Corporate Finance where the<br />
recoverable amount was 126 % of its respective carrying amount. An increase of approximately <strong>20</strong> % in the<br />
discount rate or a decrease of approximately <strong>20</strong> % in projected earnings in every year of the initial five-year<br />
period, assuming unchanged values for the other assumpti<strong>on</strong>s, would have caused the recoverable amount to<br />
equal the respective carrying amount.<br />
The recoverable amount of Corporate Finance is based <strong>on</strong>, am<strong>on</strong>g other things, a financial plan which reflects<br />
management’s assumpti<strong>on</strong>s, such as expected development of global fee pools and market shares, which are<br />
key revenue drivers. While these estimates reflect management’s assessment and expectati<strong>on</strong>s of future<br />
ec<strong>on</strong>omic c<strong>on</strong>diti<strong>on</strong>s, it is inherently uncertain whether the reported amounts will actually be in line with plan.<br />
For example, if projected global fee pools do not develop as expected or assumed market shares are not<br />
achieved, revenues might significantly differ from plan assumpti<strong>on</strong>s, negatively impacting the recoverable<br />
amount of Corporate Finance.<br />
The backdrop of a fragile recovery of the global ec<strong>on</strong>omy and likely significant changes in the regulati<strong>on</strong> of<br />
the banking industry as a result of the financial crisis, and its implicati<strong>on</strong>s for the Group’s operating envir<strong>on</strong>-<br />
ment, may negatively impact the performance forecasts of certain of the Group’s cash-generating units and<br />
thus could result in an impairment of goodwill in the future.<br />
Other Intangible Assets<br />
Other intangible assets are separated into those that are internally generated, which c<strong>on</strong>sist <strong>on</strong>ly of internallygenerated<br />
software, and purchased intangible assets. Purchased intangible assets are further split into amortized<br />
and unamortized other intangible assets.<br />
The changes of other intangible assets by asset class for the years ended December 31, <str<strong>on</strong>g><strong>20</strong>09</str<strong>on</strong>g>, and <strong>20</strong>08, are<br />
as follows.<br />
F - 112
Internally<br />
generated<br />
intangible<br />
assets<br />
Software Customerrelated<br />
intangible<br />
assets<br />
1 Of which € 181 milli<strong>on</strong> were included in general and administrative expenses and € 11 milli<strong>on</strong> were recorded in commissi<strong>on</strong>s and fee income. The latter related to the amortizati<strong>on</strong> of<br />
mortgage servicing rights.<br />
2 Of which € 310 milli<strong>on</strong> were recorded as impairment of intangible assets and € 1 milli<strong>on</strong> was recorded in commissi<strong>on</strong>s and fee income. The latter related to an impairment of mortgage<br />
servicing rights.<br />
3 Of which € 162 milli<strong>on</strong> were included in general and administrative expenses and € 12 milli<strong>on</strong> were recorded in commissi<strong>on</strong>s and fee income. The latter related to the amortizati<strong>on</strong> of<br />
mortgage servicing rights.<br />
4 Of which € 5 milli<strong>on</strong> were recorded as impairment of intangible assets.<br />
5 € 291 milli<strong>on</strong> were recorded as reversal of a prior year’s impairment and are included under impairment of intangible assets.<br />
F - 113<br />
Purchased intangible assets<br />
Total<br />
other<br />
intangible<br />
assets<br />
Amortized Unamortized<br />
Value of C<strong>on</strong>tract- Other Total Retail Other Total<br />
business based<br />
amortized investment<br />
unamor-<br />
acquired intangible<br />
purchased manage-<br />
tized<br />
assets<br />
intangible ment<br />
purchased<br />
assets agree-<br />
intangible<br />
in € m.<br />
Cost of acquisiti<strong>on</strong>/<br />
manufacture:<br />
Balance as of<br />
ments<br />
assets<br />
January 1, <strong>20</strong>08 374 534 863 109 323 1,829 786 11 797 3,000<br />
Additi<strong>on</strong>s<br />
Changes in the group of<br />
46 19 – 38 19 76 – 4 4 126<br />
c<strong>on</strong>solidated companies – 5 5 – – 10 – 4 4 14<br />
Disposals<br />
Reclassificati<strong>on</strong>s from<br />
– – – 1 6 7 – – – 7<br />
(to) held for sale – 42 – 562 166 770 – – – 770<br />
Exchange rate changes<br />
Balance as of<br />
(9) (37) (214) – (7) (258) 31 (2) 29 (238)<br />
December 31, <strong>20</strong>08 411 563 654 708 495 2,4<strong>20</strong> 817 17 834 3,665<br />
Additi<strong>on</strong>s<br />
Changes in the group of<br />
128 37 12 15 35 99 – – – 227<br />
c<strong>on</strong>solidated companies – – – – (1) (1) – – – (1)<br />
Disposals<br />
Reclassificati<strong>on</strong>s from<br />
14 – – 28 3 31 – – – 45<br />
(to) held for sale – – – – – – – (11) (11) (11)<br />
Transfers (22) – 14 – 21 35 – – – 13<br />
Exchange rate changes<br />
Balance as of<br />
4 9 63 (5) 4 71 (9) 3 (6) 69<br />
December 31, <str<strong>on</strong>g><strong>20</strong>09</str<strong>on</strong>g><br />
Accumulated<br />
amortizati<strong>on</strong><br />
and impairment:<br />
Balance as of<br />
507 609 743 690 551 2,593 808 9 817 3,917<br />
January 1, <strong>20</strong>08 328 149 8 52 238 447 74 – 74 849<br />
Amortizati<strong>on</strong> for the year 13 68 42 47 22 179 – – – 1921<br />
Disposals<br />
Reclassificati<strong>on</strong>s from<br />
– – – – 4 4 – – – 4<br />
(to) held for sale – – – – – – – – – –<br />
Impairment losses – 6 – 1 – 7 304 – 304 311 2<br />
Exchange rate changes<br />
Balance as of<br />
(12) (2) (10) – (5) (17) 2 – 2 (27)<br />
December 31, <strong>20</strong>08 329 221 40 100 251 612 380 – 380 1,321<br />
Amortizati<strong>on</strong> for the year<br />
Changes in the group of<br />
13 61 29 40 31 161 – – – 1743<br />
c<strong>on</strong>solidated companies – – – – (1) (1) – – – (1)<br />
Disposals<br />
Reclassificati<strong>on</strong>s from<br />
14 – – 27 2 29 – – – 43<br />
(to) held for sale – – – – – – – (2) (2) (2)<br />
Impairment losses – – – 4 – 4 – 1 1 5 4<br />
Reversals of impairment<br />
losses – 4 – – – 4 287 – 287 291 5<br />
Transfers – – – – (1) (1) – – – (1)<br />
Exchange rate changes<br />
Balance as of<br />
3 1 4 (3) 4 6 (4) – (3) 6<br />
December 31, <str<strong>on</strong>g><strong>20</strong>09</str<strong>on</strong>g><br />
Carrying amount:<br />
331 279 73 114 282 748 89 – 89 1,168<br />
As of December 31, <strong>20</strong>08 82 342 614 608 244 1,808 437 17 454 2,344<br />
As of December 31, <str<strong>on</strong>g><strong>20</strong>09</str<strong>on</strong>g> 176 330 670 576 269 1,845 719 9 728 2,749
<strong>20</strong>-F Notes to the C<strong>on</strong>solidated Balance Sheet<br />
Amortized Intangible Assets<br />
In <str<strong>on</strong>g><strong>20</strong>09</str<strong>on</strong>g>, additi<strong>on</strong>s and transfers to amortized intangible assets amounted to € 134 milli<strong>on</strong> and mainly included<br />
purchased software of € 35 milli<strong>on</strong>, the capitalizati<strong>on</strong> of deferred policy acquisiti<strong>on</strong> costs (DAC) of € 26 milli<strong>on</strong><br />
related to incremental costs of acquiring investment management c<strong>on</strong>tracts, which are commissi<strong>on</strong>s payable<br />
to intermediaries and business counterparties of the Group’s insurance business (see Note [39]), and the<br />
recogniti<strong>on</strong> of customer relati<strong>on</strong>ships resulting from the acquisiti<strong>on</strong> of Dresdner <strong>Bank</strong>’s Global Agency Securities<br />
Lending business of € 21 milli<strong>on</strong> (see Note [34]).<br />
In <strong>20</strong>08, the main additi<strong>on</strong> to other intangible assets related to Maher Terminals, a privately held operator<br />
of port terminal facilities in North America. When held for sale accounting for Maher Terminals ceased as of<br />
September 30, <strong>20</strong>08, € 770 milli<strong>on</strong> of intangible assets were reclassified from assets held for sale to amortized<br />
intangible assets. The total comprised c<strong>on</strong>tract-based (lease rights to operate the ports), other (trade<br />
names) and customer-related intangible assets. As of December 31, <str<strong>on</strong>g><strong>20</strong>09</str<strong>on</strong>g> and December 31, <strong>20</strong>08, respectively,<br />
the carrying values were € 5<strong>20</strong> milli<strong>on</strong> and € 551 milli<strong>on</strong> for the lease rights, € 153 milli<strong>on</strong> and<br />
€ 161 milli<strong>on</strong> for the trade names, and € 35 milli<strong>on</strong> and € 35 milli<strong>on</strong> for the customer-related intangible assets.<br />
The amortizati<strong>on</strong> of these intangible assets is expected to end in <strong>20</strong>30 for the lease rights, in <strong>20</strong>27 for the<br />
trade names and between <strong>20</strong>12 and <strong>20</strong>22 for the customer-related intangible assets.<br />
In <str<strong>on</strong>g><strong>20</strong>09</str<strong>on</strong>g>, impairment of intangible assets in the income statement included an impairment loss of € 4 milli<strong>on</strong><br />
relating to c<strong>on</strong>tract-based intangible assets as well as a reversal of an impairment loss of € 4 milli<strong>on</strong> relating<br />
to customer-related intangible assets, which had been taken in the fourth quarter of <strong>20</strong>08. The impairment<br />
loss was included in CB&S, the impairment reversal was recorded in AWM.<br />
In <strong>20</strong>08, impairment losses relating to customer-related intangible assets and c<strong>on</strong>tract-based intangible<br />
assets (mortgage servicing rights) amounting to € 6 milli<strong>on</strong> and € 1 milli<strong>on</strong> were recognized as impairment of<br />
intangible assets and in commissi<strong>on</strong>s and fee income, respectively, in the income statement. The impairment<br />
of customer-related intangible assets was recorded in AWM and the impairment of c<strong>on</strong>tract-based intangible<br />
assets was recorded in CB&S.<br />
In <strong>20</strong>07, impairment losses relating to purchased software and customer-related intangible assets amounting<br />
to € 3 milli<strong>on</strong> and € 2 milli<strong>on</strong>, respectively, were recognized as general and administrative expenses in the<br />
income statement. The impairment of the purchased software was recorded in AWM and the impairment of<br />
the customer-related intangible assets was recorded in GTB.<br />
F - 114
Other intangible assets with finite useful lives are generally amortized over their useful lives based <strong>on</strong> the<br />
straight-line method (except for the VOBA, as explained in Notes [1] and [39], and for mortgage servicing<br />
rights).<br />
Mortgage servicing rights are amortized in proporti<strong>on</strong> to and over the estimated period of net servicing reve-<br />
nues. The useful lives of other amortized intangible assets by asset class are as follows.<br />
Useful lives in years<br />
Internally generated intangible assets:<br />
Software<br />
Purchased intangible assets:<br />
up to 3<br />
Customer-related intangible assets up to <strong>20</strong><br />
C<strong>on</strong>tract-based intangible assets up to 35<br />
Value of business acquired up to 30<br />
Other up to <strong>20</strong><br />
Unamortized Intangible Assets<br />
Almost 99 % of unamortized intangible assets, amounting to € 719 milli<strong>on</strong>, relate to the Group’s U.S. retail<br />
mutual fund business and are allocated to the Asset Management cash-generating unit. This asset comprises<br />
retail investment management agreements, which are c<strong>on</strong>tracts that give DWS Investments the exclusive<br />
right to manage a variety of mutual funds for a specified period. Since the c<strong>on</strong>tracts are easily renewable, the<br />
cost of renewal is minimal, and they have a l<strong>on</strong>g history of renewal, these agreements are not expected to<br />
have a foreseeable limit <strong>on</strong> the c<strong>on</strong>tract period. Therefore, the rights to manage the associated assets under<br />
management are expected to generate cash flows for an indefinite period of time. The intangible asset was<br />
valued at fair value based up<strong>on</strong> a third party valuati<strong>on</strong> at the date of the Group’s acquisiti<strong>on</strong> of Zurich Scudder<br />
Investments, Inc. in <strong>20</strong>02.<br />
In <str<strong>on</strong>g><strong>20</strong>09</str<strong>on</strong>g>, a reversal of an impairment loss of € 287 milli<strong>on</strong> was recognized and recorded as impairment of<br />
intangible assets in the income statement. A related impairment loss had been taken in the fourth quarter<br />
of <strong>20</strong>08. The impairment reversal was related to retail investment management agreements for certain open<br />
end funds and was recorded in AWM. The impairment reversal was due to an increase in fair value as a result<br />
of increases in market values of invested assets as well as current and projected operating results and cash<br />
flows of investment management agreements, which had been acquired from Zurich Scudder Investments,<br />
Inc. The recoverable amount of the asset was calculated as fair value less costs to sell. As market prices are<br />
ordinarily not observable for such assets, the fair value was determined based <strong>on</strong> the income approach, using<br />
a post-tax discounted cash flow calculati<strong>on</strong> (multi-period excess earnings method).<br />
F - 115
<strong>20</strong>-F Notes to the C<strong>on</strong>solidated Balance Sheet<br />
In <strong>20</strong>08 and <strong>20</strong>07, impairment losses of € 304 milli<strong>on</strong> and € 74 milli<strong>on</strong>, respectively, were recognized in the<br />
income statement as impairment of intangible assets. The losses were related to retail investment manage-<br />
ment agreements and were recorded in AWM. The impairment losses were due to a decrease in fair values as<br />
a result of declines in market values of invested assets as well as current and projected operating results and<br />
cash flows of investment management agreements, which had been acquired from Zurich Scudder Investments,<br />
Inc. The impairment recorded in <strong>20</strong>08 related to certain open end and closed end funds whereas the<br />
impairment recorded in <strong>20</strong>07 related to certain closed end funds and variable annuity funds. The recoverable<br />
amounts of the assets were calculated as fair value less costs to sell.<br />
[24] Assets Held for Sale<br />
As of December 31, <str<strong>on</strong>g><strong>20</strong>09</str<strong>on</strong>g>, the Group classified several disposal groups (comprising nineteen subsidiaries),<br />
three investments in associates, a loan and several real estate assets allocated to the Corporate Divisi<strong>on</strong><br />
Corporate <strong>Bank</strong>ing & Securities (CB&S) as held for sale. The Group reported these items in other assets and<br />
other liabilities and valued them at the lower of their carrying amount or fair value less costs to sell resulting<br />
in an impairment loss of € 10 milli<strong>on</strong> relating to the disposal groups which was recorded in other income in<br />
CB&S. The disposal groups, the three investments in associates and the loan related to a series of renewable<br />
energy development projects. The real estate assets included commercial and residential property in North<br />
America owned through foreclosure. These items are expected to be sold in <strong>20</strong>10.<br />
As of December 31, <strong>20</strong>08, the Group classified several real estate assets as held for sale. The Group<br />
reported these items in other assets and valued them at the lower of their carrying amount or fair value less<br />
costs to sell, which did not lead to an impairment loss in <strong>20</strong>08. The real estate assets included commercial<br />
and residential property in Germany and North America owned by CB&S through foreclosure. The real estate<br />
assets in Germany and most of the items in North America were sold in <str<strong>on</strong>g><strong>20</strong>09</str<strong>on</strong>g>.<br />
As of December 31, <strong>20</strong>07, the Group classified three disposal groups (two subsidiaries and a c<strong>on</strong>solidated<br />
fund) and several n<strong>on</strong>-current assets as held for sale. The Group reported these items in other assets and<br />
other liabilities, and valued them at the lower of their carrying amount or fair value less costs to sell, resulting<br />
in an impairment loss of € 2 milli<strong>on</strong> in <strong>20</strong>07, which was recorded in income before income taxes of the Group<br />
Divisi<strong>on</strong> Corporate Investments (CI).<br />
F - 116
The three disposal groups included two in the Corporate Divisi<strong>on</strong> Asset and Wealth Management (AWM). One<br />
was an Italian life insurance company for which a disposal c<strong>on</strong>tract was signed in December <strong>20</strong>07 and which<br />
was sold in the first half of <strong>20</strong>08, and a sec<strong>on</strong>d related to a real estate fund in North America, which ceased to<br />
be classified as held for sale as of December 31, <strong>20</strong>08. The expenses which were not to be recognized during<br />
the held for sale period, were recognized at the date of reclassificati<strong>on</strong>. This resulted in an increase of other<br />
expenses of € 13 milli<strong>on</strong> in AWM in <strong>20</strong>08. This amount included expenses of € 3 milli<strong>on</strong> which related to <strong>20</strong>07.<br />
Due to the market c<strong>on</strong>diti<strong>on</strong>s the timing of the ultimate disposal of this investment was uncertain. The last<br />
disposal group, a subsidiary in CI, was classified as held for sale at year-end <strong>20</strong>06 but, due to circumstances<br />
arising in <strong>20</strong>07 that were previously c<strong>on</strong>sidered unlikely, was not sold in <strong>20</strong>07. In <strong>20</strong>08, the Group changed its<br />
plans to sell the subsidiary because the envisaged sales transacti<strong>on</strong> did not materialize due to the lack of<br />
interest of the designated buyer. In the light of the weak market envir<strong>on</strong>ment there were no sales activities<br />
regarding this subsidiary. The reclassificati<strong>on</strong> did not lead to any impact <strong>on</strong> revenues and expenses.<br />
N<strong>on</strong>-current assets classified as held for sale as of December 31, <strong>20</strong>07 included two alternative investments<br />
of AWM in North America, several office buildings in CI and in the Corporate Divisi<strong>on</strong> Private & Business<br />
Clients (PBC), and other real estate assets in North America, obtained by CB&S through foreclosure. While<br />
the office buildings in CI and PBC and most of the real estate in CB&S were sold during <strong>20</strong>08, the ownership<br />
structure of the two alternative investments Maher Terminals LLC and Maher Terminals of Canada Corp. was<br />
restructured and the Group c<strong>on</strong>solidated these investments commencing June 30, <strong>20</strong>08. Due to the market<br />
c<strong>on</strong>diti<strong>on</strong>s the timing of the ultimate disposal of these investments was uncertain. As a result, the assets and<br />
liabilities were no l<strong>on</strong>ger classified as held for sale at the end of the third quarter <strong>20</strong>08. The revenues<br />
and expenses which were not to be recognized during the held for sale period were recognized at the date of<br />
reclassificati<strong>on</strong>. This resulted in a negative impact <strong>on</strong> other income of € 62 milli<strong>on</strong> and an increase of other<br />
expenses of € 38 milli<strong>on</strong> in AWM in <strong>20</strong>08. These amounts included a charge to revenues of € <strong>20</strong> milli<strong>on</strong> and<br />
expenses of € 21 milli<strong>on</strong> which related to <strong>20</strong>07.<br />
The following are the principal comp<strong>on</strong>ents of assets and liabilities which the Group classified as held for sale<br />
for the years ended December 31, <str<strong>on</strong>g><strong>20</strong>09</str<strong>on</strong>g>, and <strong>20</strong>08, respectively.<br />
in € m. Dec 31, <str<strong>on</strong>g><strong>20</strong>09</str<strong>on</strong>g> Dec 31, <strong>20</strong>08<br />
Investments in associates 18 –<br />
Property and equipment 21 1<br />
Other assets 53 131<br />
Total assets classified as held for sale 92 132<br />
L<strong>on</strong>g-term debt 21 –<br />
Other liabilities 2 –<br />
Total liabilities classified as held for sale 23 –<br />
F - 117
<strong>20</strong>-F Notes to the C<strong>on</strong>solidated Balance Sheet<br />
[25] Other Assets and Other Liabilities<br />
The following are the comp<strong>on</strong>ents of other assets and other liabilities.<br />
in € m. Dec 31, <str<strong>on</strong>g><strong>20</strong>09</str<strong>on</strong>g> Dec 31, <strong>20</strong>08<br />
Other assets:<br />
Brokerage and securities related receivables<br />
Cash/margin receivables 43,890 56,492<br />
Receivables from prime brokerage 6,837 17,844<br />
Pending securities transacti<strong>on</strong>s past settlement date 9,229 8,383<br />
Receivables from unsettled regular way trades 33,496 21,339<br />
Total brokerage and securities related receivables 93,452 104,058<br />
Accrued interest receivable 3,426 4,657<br />
Other 24,660 29,114<br />
Total other assets 121,538 137,829<br />
in € m. Dec 31, <str<strong>on</strong>g><strong>20</strong>09</str<strong>on</strong>g> Dec 31, <strong>20</strong>08<br />
Other liabilities:<br />
Brokerage and securities related payables<br />
Cash/margin payables 40,448 40,955<br />
Payables from prime brokerage 31,427 46,602<br />
Pending securities transacti<strong>on</strong>s past settlement date 5,708 4,530<br />
Payables from unsettled regular way trades 33,214 19,380<br />
Total brokerage and securities related payables 110,797 111,467<br />
Accrued interest payable 3,713 5,112<br />
Other 39,771 44,019<br />
Total other liabilities 154,281 160,598<br />
[26] Deposits<br />
The following are the comp<strong>on</strong>ents of deposits.<br />
in € m. Dec 31, <str<strong>on</strong>g><strong>20</strong>09</str<strong>on</strong>g> Dec 31, <strong>20</strong>08<br />
N<strong>on</strong>interest-bearing demand deposits 51,731 34,211<br />
Interest-bearing deposits<br />
Demand deposits 117,955 143,702<br />
Time deposits 108,730 152,481<br />
Savings deposits 65,804 65,159<br />
Total interest-bearing deposits 292,489 361,342<br />
Total deposits 344,2<strong>20</strong> 395,553<br />
F - 118
[27] Provisi<strong>on</strong>s<br />
The following table presents movements by class of provisi<strong>on</strong>s.<br />
Operati<strong>on</strong>al/<br />
Other Total<br />
in € m.<br />
Litigati<strong>on</strong><br />
1<br />
Balance as of January 1, <strong>20</strong>08 617 459 1,076<br />
Changes in the group of c<strong>on</strong>solidated companies 1 21 22<br />
New provisi<strong>on</strong>s 275 217 492<br />
Amounts used (75) (135) (210)<br />
Unused amounts reversed (61) (111) (172)<br />
Effects from exchange rate fluctuati<strong>on</strong>s/Unwind of discount 5 (5) –<br />
Balance as of December 31, <strong>20</strong>08 762 446 1,<strong>20</strong>8<br />
Changes in the group of c<strong>on</strong>solidated companies 2 4 6<br />
New provisi<strong>on</strong>s 338 152 490<br />
Amounts used (164) (155) (319)<br />
Unused amounts reversed (183) (115) (298)<br />
Effects from exchange rate fluctuati<strong>on</strong>s/Unwind of discount 3 9 12<br />
Balance as of December 31, <str<strong>on</strong>g><strong>20</strong>09</str<strong>on</strong>g> 758 341 1,099<br />
1 For the remaining porti<strong>on</strong> of provisi<strong>on</strong>s as disclosed <strong>on</strong> the c<strong>on</strong>solidated balance sheet, please see Note [18] to the Group’s c<strong>on</strong>solidated financial<br />
statements, in which allowances for credit related off-balance sheet positi<strong>on</strong>s are disclosed.<br />
Operati<strong>on</strong>al and Litigati<strong>on</strong><br />
The Group defines operati<strong>on</strong>al risk as the potential for incurring losses in relati<strong>on</strong> to staff, technology,<br />
projects, assets, customer relati<strong>on</strong>ships, other third parties or regulators, such as through unmanageable<br />
events, business disrupti<strong>on</strong>, inadequately-defined or failed processes or c<strong>on</strong>trol and system failure.<br />
Due to the nature of its business, the Group is involved in litigati<strong>on</strong>, arbitrati<strong>on</strong> and regulatory proceedings in<br />
Germany and in a number of jurisdicti<strong>on</strong>s outside Germany, including the United States, arising in the ordinary<br />
course of business. In accordance with applicable accounting requirements, the Group provides for<br />
potential losses that may arise out of c<strong>on</strong>tingencies, including c<strong>on</strong>tingencies in respect of such matters, when<br />
the potential losses are probable and estimable. C<strong>on</strong>tingencies in respect of legal matters are subject to<br />
many uncertainties and the outcome of individual matters is not predictable with assurance. Significant judgment<br />
is required in assessing probability and making estimates in respect of c<strong>on</strong>tingencies, and the Group’s<br />
final liabilities may ultimately be materially different. The Group’s total liability recorded in respect of litigati<strong>on</strong>,<br />
arbitrati<strong>on</strong> and regulatory proceedings is determined <strong>on</strong> a case-by-case basis and represents an estimate of<br />
probable losses after c<strong>on</strong>sidering, am<strong>on</strong>g other factors, the progress of each case, the Group’s experience<br />
and the experience of others in similar cases, and the opini<strong>on</strong>s and views of legal counsel. Although the final<br />
resoluti<strong>on</strong> of any such matters could have a material effect <strong>on</strong> the Group’s c<strong>on</strong>solidated operating results for a<br />
particular reporting period, the Group believes that it will not materially affect its c<strong>on</strong>solidated financial positi<strong>on</strong>.<br />
In respect of each of the matters specifically described below, some of which c<strong>on</strong>sist of a number of<br />
claims, it is the Group’s belief that the reas<strong>on</strong>ably possible losses relating to each claim in excess of any<br />
provisi<strong>on</strong>s are either not material or not estimable.<br />
F - 119
<strong>20</strong>-F Notes to the C<strong>on</strong>solidated Balance Sheet<br />
The Group’s significant legal proceedings, which are required to be disclosed in accordance with IAS 37 are<br />
described below.<br />
Tax-Related Products. <strong>Deutsche</strong> <strong>Bank</strong> AG, al<strong>on</strong>g with certain affiliates, and current and/or former employees<br />
(collectively referred to as “<strong>Deutsche</strong> <strong>Bank</strong>”), have collectively been named as defendants in a number of<br />
legal proceedings brought by customers in various tax-oriented transacti<strong>on</strong>s. <strong>Deutsche</strong> <strong>Bank</strong> provided financial<br />
products and services to these customers, who were advised by various accounting, legal and financial<br />
advisory professi<strong>on</strong>als. The customers claimed tax benefits as a result of these transacti<strong>on</strong>s, and the United<br />
States Internal Revenue Service has rejected those claims. In these legal proceedings, the customers allege<br />
that the professi<strong>on</strong>al advisors, together with <strong>Deutsche</strong> <strong>Bank</strong>, improperly misled the customers into believing<br />
that the claimed tax benefits would be upheld by the Internal Revenue Service. The legal proceedings are<br />
pending in numerous state and federal courts and in arbitrati<strong>on</strong>, and claims against <strong>Deutsche</strong> <strong>Bank</strong> are<br />
alleged under both U.S. state and federal law. Many of the claims against <strong>Deutsche</strong> <strong>Bank</strong> are asserted by<br />
individual customers, while others are asserted <strong>on</strong> behalf of a putative customer class. No litigati<strong>on</strong> class has<br />
been certified as against <strong>Deutsche</strong> <strong>Bank</strong>. Approximately 90 legal proceedings have been resolved and dismissed<br />
with prejudice with respect to <strong>Deutsche</strong> <strong>Bank</strong>. Approximately ten other legal proceedings remain<br />
pending as against <strong>Deutsche</strong> <strong>Bank</strong> and are currently at various pre-trial stages, including discovery.<br />
<strong>Deutsche</strong> <strong>Bank</strong> has received a number of unfiled claims as well, and has resolved certain of those unfiled<br />
claims. Approximately seven unfiled claims also remain pending against <strong>Deutsche</strong> <strong>Bank</strong>.<br />
The United States Department of Justice (“DOJ”) is also c<strong>on</strong>ducting a criminal investigati<strong>on</strong> of tax-oriented<br />
transacti<strong>on</strong>s that were executed from approximately 1997 through early <strong>20</strong>02. In c<strong>on</strong>necti<strong>on</strong> with that<br />
investigati<strong>on</strong>, DOJ has sought various documents and other informati<strong>on</strong> from <strong>Deutsche</strong> <strong>Bank</strong> and has been<br />
investigating the acti<strong>on</strong>s of various individuals and entities, including <strong>Deutsche</strong> <strong>Bank</strong>, in such transacti<strong>on</strong>s. In<br />
the latter half of <strong>20</strong>05, DOJ brought criminal charges against numerous individuals based <strong>on</strong> their participa-<br />
ti<strong>on</strong> in certain tax-oriented transacti<strong>on</strong>s while employed by entities other than <strong>Deutsche</strong> <strong>Bank</strong>. In the latter half<br />
of <strong>20</strong>05, DOJ also entered into a Deferred Prosecuti<strong>on</strong> Agreement with an accounting firm (the “Accounting<br />
Firm”), pursuant to which DOJ agreed to defer prosecuti<strong>on</strong> of a criminal charge against the Accounting Firm<br />
based <strong>on</strong> its participati<strong>on</strong> in certain tax-oriented transacti<strong>on</strong>s provided that the Accounting Firm satisfied the<br />
terms of the Deferred Prosecuti<strong>on</strong> Agreement. On February 14, <strong>20</strong>06, DOJ announced that it had entered into<br />
a Deferred Prosecuti<strong>on</strong> Agreement with a financial instituti<strong>on</strong> (the “Financial Instituti<strong>on</strong>”), pursuant to which<br />
DOJ agreed to defer prosecuti<strong>on</strong> of a criminal charge against the Financial Instituti<strong>on</strong> based <strong>on</strong> its role in<br />
providing financial products and services in c<strong>on</strong>necti<strong>on</strong> with certain tax-oriented transacti<strong>on</strong>s provided that the<br />
Financial Instituti<strong>on</strong> satisfied the terms of the Deferred Prosecuti<strong>on</strong> Agreement. <strong>Deutsche</strong> <strong>Bank</strong> provided similar<br />
financial products and services in certain tax-oriented transacti<strong>on</strong>s that are the same or similar to the<br />
tax-oriented transacti<strong>on</strong>s that are the subject of the above-referenced criminal charges. <strong>Deutsche</strong> <strong>Bank</strong> also<br />
provided financial products and services in additi<strong>on</strong>al tax-oriented transacti<strong>on</strong>s as well. In December <strong>20</strong>08,<br />
following a trial of four of the individuals against whom DOJ had brought criminal charges in <strong>20</strong>05, three of<br />
those individuals were c<strong>on</strong>victed. In May <str<strong>on</strong>g><strong>20</strong>09</str<strong>on</strong>g>, following a trial of four additi<strong>on</strong>al individuals against whom<br />
F - 1<strong>20</strong>
DOJ had brought criminal charges based <strong>on</strong> their participati<strong>on</strong> in certain tax-oriented transacti<strong>on</strong>s while<br />
employed by an entity other than <strong>Deutsche</strong> <strong>Bank</strong>, those individuals were c<strong>on</strong>victed. In June <str<strong>on</strong>g><strong>20</strong>09</str<strong>on</strong>g>, DOJ<br />
brought criminal charges against five additi<strong>on</strong>al individuals, based <strong>on</strong> their participati<strong>on</strong> in certain tax-oriented<br />
transacti<strong>on</strong>s while employed by entities other than <strong>Deutsche</strong> <strong>Bank</strong>, and two former employees of <strong>Deutsche</strong><br />
<strong>Bank</strong> based <strong>on</strong> their participati<strong>on</strong> in certain tax-oriented transacti<strong>on</strong>s while employed by <strong>Deutsche</strong> <strong>Bank</strong>. DOJ’s<br />
criminal investigati<strong>on</strong> is <strong>on</strong>going. <strong>Deutsche</strong> <strong>Bank</strong> is engaged in discussi<strong>on</strong>s with DOJ c<strong>on</strong>cerning a resoluti<strong>on</strong><br />
of the investigati<strong>on</strong>.<br />
Kirch Litigati<strong>on</strong>. In May <strong>20</strong>02, Dr. Leo Kirch pers<strong>on</strong>ally and as an assignee of two entities of the former Kirch<br />
Group, i.e., PrintBeteiligungs GmbH and the group holding company TaurusHolding GmbH & Co. KG, initiated<br />
legal acti<strong>on</strong> against Dr. Rolf-E. Breuer and <strong>Deutsche</strong> <strong>Bank</strong> AG alleging that a statement made by Dr. Breuer<br />
(then the Spokesman of <strong>Deutsche</strong> <strong>Bank</strong> AG’s Management Board) in an interview with Bloomberg televisi<strong>on</strong><br />
<strong>on</strong> February 4, <strong>20</strong>02 regarding the Kirch Group was in breach of laws and resulted in financial damage.<br />
On January 24, <strong>20</strong>06, the German Federal Supreme Court sustained the acti<strong>on</strong> for the declaratory judgment<br />
<strong>on</strong>ly in respect of the claims assigned by PrintBeteiligungs GmbH. Such acti<strong>on</strong> and judgment did not require<br />
a proof of any loss caused by the statement made in the interview. PrintBeteiligungs GmbH is the <strong>on</strong>ly company<br />
of the Kirch Group which was a borrower of <strong>Deutsche</strong> <strong>Bank</strong> AG. Claims by Dr. Kirch pers<strong>on</strong>ally and by<br />
TaurusHolding GmbH & Co. KG were dismissed. In May <strong>20</strong>07, Dr. Kirch filed an acti<strong>on</strong> for payment as assignee<br />
of PrintBeteiligungs GmbH against <strong>Deutsche</strong> <strong>Bank</strong> AG and Dr. Breuer. After having changed the basis for<br />
the computati<strong>on</strong> of his alleged damages in the meantime, Dr. Kirch currently claims payment of approximately<br />
€ 1.3 billi<strong>on</strong> plus interest. In these proceedings Dr. Kirch will have to prove that such statement caused<br />
financial damages to PrintBeteiligungs GmbH and the amount thereof. In the view of <strong>Deutsche</strong> <strong>Bank</strong> AG, the<br />
causality in respect of the basis and scope of the claimed damages has not been sufficiently substantiated.<br />
On December 31, <strong>20</strong>05, KGL Pool GmbH filed a lawsuit against <strong>Deutsche</strong> <strong>Bank</strong> AG and Dr. Breuer. The lawsuit<br />
is based <strong>on</strong> alleged claims assigned from various subsidiaries of the former Kirch Group. KGL Pool<br />
GmbH seeks a declaratory judgment to the effect that <strong>Deutsche</strong> <strong>Bank</strong> AG and Dr. Breuer are jointly and severally<br />
liable for damages as a result of the interview statement and the behavior of <strong>Deutsche</strong> <strong>Bank</strong> AG in<br />
respect of several subsidiaries of the Kirch Group. In December <strong>20</strong>07, KGL Pool GmbH supplemented this<br />
lawsuit by a moti<strong>on</strong> for payment of approximately € 2.0 billi<strong>on</strong> plus interest as compensati<strong>on</strong> for the purported<br />
damages which two subsidiaries of the former Kirch Group allegedly suffered as a result of the statement by<br />
Dr. Breuer. On March 31, <str<strong>on</strong>g><strong>20</strong>09</str<strong>on</strong>g> the District Court Munich I dismissed the lawsuit in its entirety. The plaintiff<br />
appealed the decisi<strong>on</strong>. In the view of <strong>Deutsche</strong> <strong>Bank</strong>, due to the lack of a relevant c<strong>on</strong>tractual relati<strong>on</strong>ship<br />
with any of these subsidiaries there is no basis for such claims and neither the causality in respect of the<br />
basis and scope of the claimed damages nor the effective assignment of the alleged claims to KGL Pool<br />
GmbH has been sufficiently substantiated.<br />
F - 121
<strong>20</strong>-F Notes to the C<strong>on</strong>solidated Balance Sheet<br />
Asset Backed Securities Matters. <strong>Deutsche</strong> <strong>Bank</strong> AG, al<strong>on</strong>g with certain affiliates (collectively referred to as<br />
“<strong>Deutsche</strong> <strong>Bank</strong>”), has received subpoenas and requests for informati<strong>on</strong> from certain regulators and government<br />
entities c<strong>on</strong>cerning its activities regarding the originati<strong>on</strong>, purchase, securitizati<strong>on</strong>, sale and trading of<br />
asset backed securities, asset backed commercial paper and credit derivatives, including, am<strong>on</strong>g others,<br />
residential mortgage backed securities, collateralized debt obligati<strong>on</strong>s and credit default swaps. <strong>Deutsche</strong><br />
<strong>Bank</strong> is cooperating fully in resp<strong>on</strong>se to those subpoenas and requests for informati<strong>on</strong>. <strong>Deutsche</strong> <strong>Bank</strong> has<br />
also been named as defendant in various civil litigati<strong>on</strong>s (including putative class acti<strong>on</strong>s), brought under<br />
federal and state securities laws and state comm<strong>on</strong> law, related to residential mortgage backed securities.<br />
Included in those litigati<strong>on</strong>s are (1) a putative class acti<strong>on</strong> pending in California Superior Court in Los Angeles<br />
County regarding the role of <strong>Deutsche</strong> <strong>Bank</strong>’s subsidiary <strong>Deutsche</strong> <strong>Bank</strong> Securities Inc. (“DBSI”), al<strong>on</strong>g with<br />
other financial instituti<strong>on</strong>s, as an underwriter of offerings of certain securities issued by Countrywide Financial<br />
Corporati<strong>on</strong> or an affiliate (“Countrywide”), and a putative class acti<strong>on</strong> pending in the United States District<br />
Court for the Central District of California regarding the role of DBSI, al<strong>on</strong>g with other financial instituti<strong>on</strong>s, as<br />
an underwriter of offerings of certain mortgage pass-through certificates issued by Countrywide; (2) a putative<br />
class acti<strong>on</strong> pending in the United States District Court for the Southern District of New York regarding the<br />
role of DBSI, al<strong>on</strong>g with other financial instituti<strong>on</strong>s, as an underwriter of offerings of certain mortgage passthrough<br />
certificates issued by affiliates of Novastar Mortgage Funding Corporati<strong>on</strong>; (3) a putative class acti<strong>on</strong><br />
pending in the United States District Court for the Southern District of New York regarding the role of DBSI,<br />
al<strong>on</strong>g with other financial instituti<strong>on</strong>s, as an underwriter of offerings of certain mortgage pass-through certificates<br />
issued by affiliates of IndyMac MBS, Inc.; (4) a putative class acti<strong>on</strong> pending in the United States District<br />
Court for the Northern District of California regarding the role of DBSI, al<strong>on</strong>g with other financial instituti<strong>on</strong>s,<br />
as an underwriter of offerings of certain mortgage pass-through certificates issued by affiliates of Wells<br />
Fargo Asset Securities Corporati<strong>on</strong>; and (5) a putative class acti<strong>on</strong> pending in New York Supreme Court in<br />
New York County regarding the role of a number of financial instituti<strong>on</strong>s, including DBSI, as underwriter, of<br />
certain mortgage pass-through certificates issued by affiliates of Residential Accredit Loans, Inc. In additi<strong>on</strong>,<br />
certain affiliates of <strong>Deutsche</strong> <strong>Bank</strong>, including DBSI, have been named in a putative class acti<strong>on</strong> pending in the<br />
United States District Court for the Eastern District of New York regarding their roles as issuer and underwriter<br />
of certain mortgage pass-through securities. Each of the civil litigati<strong>on</strong>s is in its early stages.<br />
F - 122
Aucti<strong>on</strong> Rate Securities. <strong>Deutsche</strong> <strong>Bank</strong> AG and DBSI are the subjects of a putative class acti<strong>on</strong>, filed in the<br />
United States District Court for the Southern District of New York, asserting various claims under the federal<br />
securities laws <strong>on</strong> behalf of all pers<strong>on</strong>s or entities who purchased and c<strong>on</strong>tinue to hold aucti<strong>on</strong> rate preferred<br />
securities and aucti<strong>on</strong> rate securities (together “ARS”) offered for sale by <strong>Deutsche</strong> <strong>Bank</strong> AG and DBSI<br />
between March 17, <strong>20</strong>03 and February 13, <strong>20</strong>08. <strong>Deutsche</strong> <strong>Bank</strong> AG, DBSI and/or <strong>Deutsche</strong> <strong>Bank</strong> Alex.<br />
Brown, a divisi<strong>on</strong> of DBSI, have also been named as defendants in 16 individual acti<strong>on</strong>s asserting various<br />
claims under the federal securities laws and state comm<strong>on</strong> law arising out of the sale of ARS. The purported<br />
class acti<strong>on</strong> and 12 of the individual acti<strong>on</strong>s are pending, and four of the individual acti<strong>on</strong>s have been<br />
resolved and dismissed with prejudice. <strong>Deutsche</strong> <strong>Bank</strong> AG was also named as a defendant, al<strong>on</strong>g with ten<br />
other financial instituti<strong>on</strong>s, in two putative class acti<strong>on</strong>s, filed in the United States District Court for the Southern<br />
District of New York, asserting violati<strong>on</strong>s of the antitrust laws. The putative class acti<strong>on</strong>s allege that the<br />
defendants c<strong>on</strong>spired to artificially support and then, in February <strong>20</strong>08, restrain the ARS market. On or about<br />
January 26, <strong>20</strong>10, the court dismissed the two putative class acti<strong>on</strong>s.<br />
<strong>Deutsche</strong> <strong>Bank</strong> AG and DBSI have also been the subjects of proceedings by state and federal securities<br />
regulatory and enforcement agencies relating to the marketing and sale of ARS. In August <strong>20</strong>08, <strong>Deutsche</strong><br />
<strong>Bank</strong> AG and its subsidiaries, entered into agreements in principle with the New York Attorney General’s<br />
Office (“NYAG”) and the North American Securities Administrati<strong>on</strong> Associati<strong>on</strong>, representing a c<strong>on</strong>sortium of<br />
other states and U.S. territories, pursuant to which <strong>Deutsche</strong> <strong>Bank</strong> AG and its subsidiaries agreed to purchase<br />
from their retail, certain smaller and medium-sized instituti<strong>on</strong>al, and charitable clients, ARS that those<br />
clients purchased from <strong>Deutsche</strong> <strong>Bank</strong> AG and its subsidiaries prior to February 13, <strong>20</strong>08; to work expeditiously<br />
to provide liquidity soluti<strong>on</strong>s for their larger instituti<strong>on</strong>al clients who purchased ARS from<br />
<strong>Deutsche</strong> <strong>Bank</strong> AG and its subsidiaries; to pay an aggregate penalty of U.S.$ 15 milli<strong>on</strong> to state regulators;<br />
and to be subject to state orders requiring future compliance with applicable state laws. On June 3, <str<strong>on</strong>g><strong>20</strong>09</str<strong>on</strong>g>,<br />
DBSI finalized settlements with the NYAG and the New Jersey Bureau of Securities that were c<strong>on</strong>sistent with<br />
the August <strong>20</strong>08 agreements in principle, and DBSI entered into a settlement with Securities and Exchange<br />
Commissi<strong>on</strong> (“SEC”) that incorporated the terms of the agreements in principle with the states and c<strong>on</strong>tained<br />
certain additi<strong>on</strong>al terms, including authority by the SEC to seek an additi<strong>on</strong>al m<strong>on</strong>etary penalty from DBSI if<br />
the SEC believes that DBSI has not complied with its undertakings under the settlement. DBSI has since<br />
received proposed settled orders from a number of state and territorial agencies pursuant to which those<br />
agencies have claimed their respective shares of the U.S.$ 15 milli<strong>on</strong> penalty. DBSI expects to finalize<br />
those settled orders and pay the requisite shares of the penalty to the requesting states over the next several<br />
m<strong>on</strong>ths.<br />
F - 123
<strong>20</strong>-F Notes to the C<strong>on</strong>solidated Balance Sheet<br />
ÖBB Litigati<strong>on</strong>. In September <strong>20</strong>05, <strong>Deutsche</strong> <strong>Bank</strong> AG entered into a Portfolio Credit Default Swap (“PCDS”)<br />
transacti<strong>on</strong> with ÖBB Infrastruktur Bau AG (“ÖBB”), a subsidiary of Österreichische Bundesbahnen-Holding<br />
Aktiengesellschaft. Under the PCDS, ÖBB assumed the credit risk of a € 612 milli<strong>on</strong> AAA rated tranche of a<br />
diversified portfolio of corporates and asset-backed securities (“ABS”). As a result of the developments in the<br />
ABS market since mid <strong>20</strong>07, the market value of the PCDS declined.<br />
In June <strong>20</strong>08, ÖBB filed a claim against <strong>Deutsche</strong> <strong>Bank</strong> AG in the Vienna Trade Court, asking that the Court<br />
declare the PCDS null and void. ÖBB argued that the transacti<strong>on</strong> violates Austrian law, and alleged to have<br />
been misled about certain features of the PCDS. ÖBB’s claim was dismissed by the Trade Court in January<br />
<str<strong>on</strong>g><strong>20</strong>09</str<strong>on</strong>g>. On June 25, <str<strong>on</strong>g><strong>20</strong>09</str<strong>on</strong>g>, the Vienna Higher Court dismissed ÖBB’s appeal against the decisi<strong>on</strong> of the Trade<br />
Court. On September 21, <str<strong>on</strong>g><strong>20</strong>09</str<strong>on</strong>g>, ÖBB filed an extraordinary further appeal in the matter to the Austrian<br />
Supreme Court. On January 15, <strong>20</strong>10, ÖBB and <strong>Deutsche</strong> <strong>Bank</strong> AG agreed to settle the case. The settlement<br />
does not have a material adverse impact <strong>on</strong> <strong>Deutsche</strong> <strong>Bank</strong> AG.<br />
Trust Preferred Securities. <strong>Deutsche</strong> <strong>Bank</strong> AG and certain of its affiliates and officers are the subject of a<br />
c<strong>on</strong>solidated putative class acti<strong>on</strong>, filed in the United States District Court for the Southern District of New<br />
York, asserting claims under the federal securities laws <strong>on</strong> behalf of pers<strong>on</strong>s who purchased certain trust<br />
preferred securities issued by <strong>Deutsche</strong> <strong>Bank</strong> and its affiliates between October <strong>20</strong>06 and May <strong>20</strong>08. Claims<br />
are asserted under Secti<strong>on</strong>s 11, 12(a)(2), and 15 of the Securities Act of 1933. An amended and c<strong>on</strong>solidated<br />
class acti<strong>on</strong> complaint was filed <strong>on</strong> January 25, <strong>20</strong>10. The litigati<strong>on</strong> is in its early stages.<br />
Other<br />
Other provisi<strong>on</strong>s include n<strong>on</strong>-staff related provisi<strong>on</strong>s that are not captured <strong>on</strong> other specific provisi<strong>on</strong> accounts<br />
and provisi<strong>on</strong>s for restructuring. Restructuring provisi<strong>on</strong>s are recorded in c<strong>on</strong>juncti<strong>on</strong> with acquisiti<strong>on</strong>s as well<br />
as business realignments. Other costs primarily include, am<strong>on</strong>g others, amounts for lease terminati<strong>on</strong>s and<br />
related costs.<br />
F - 124
[28] Other Short-Term Borrowings<br />
The following are the comp<strong>on</strong>ents of other short-term borrowings.<br />
in € m. Dec 31, <str<strong>on</strong>g><strong>20</strong>09</str<strong>on</strong>g> Dec 31, <strong>20</strong>08<br />
Other short-term borrowings:<br />
Commercial paper <strong>20</strong>,906 26,095<br />
Other 21,991 13,0<strong>20</strong><br />
Total other short-term borrowings 42,897 39,115<br />
[29] L<strong>on</strong>g-Term Debt and Trust Preferred Securities<br />
L<strong>on</strong>g-Term Debt<br />
The following table presents the Group’s l<strong>on</strong>g-term debt by c<strong>on</strong>tractual maturity.<br />
By remaining maturities Due in Due in Due in Due in Due in Due after<br />
Total Total<br />
in € m. <strong>20</strong>10 <strong>20</strong>11 <strong>20</strong>12 <strong>20</strong>13 <strong>20</strong>14 <strong>20</strong>14 Dec 31, <str<strong>on</strong>g><strong>20</strong>09</str<strong>on</strong>g> Dec 31, <strong>20</strong>08<br />
Senior debt:<br />
B<strong>on</strong>ds and notes:<br />
Fixed rate 6,738 11,544 11,703 8,615 9,462 28,474 76,536 76,527<br />
Floating rate 9,607 7,437 5,378 4,289 4,705 16,230 47,646 49,127<br />
Subordinated debt:<br />
B<strong>on</strong>ds and notes:<br />
Fixed rate 27 314 197 1,166 729 1,115 3,548 3,780<br />
Floating rate 2,523 513 513 45 288 170 4,052 4,422<br />
Total l<strong>on</strong>g-term debt 18,895 19,808 17,791 14,115 15,184 45,989 131,782 133,856<br />
The Group did not have any defaults of principal, interest or other breaches with respect to its liabilities in<br />
<str<strong>on</strong>g><strong>20</strong>09</str<strong>on</strong>g> and <strong>20</strong>08.<br />
Trust Preferred Securities<br />
The following table summarizes the Group’s fixed and floating rate trust preferred securities, which are perpetual<br />
instruments, redeemable at specific future dates at the Group’s opti<strong>on</strong>.<br />
in € m. Dec 31, <str<strong>on</strong>g><strong>20</strong>09</str<strong>on</strong>g> Dec 31, <strong>20</strong>08<br />
Fixed rate 9,971 9,147<br />
Floating rate 606 582<br />
Total trust preferred securities 10,577 9,729<br />
F - 125
<strong>20</strong>-F Additi<strong>on</strong>al Notes<br />
Additi<strong>on</strong>al Notes<br />
[30] Comm<strong>on</strong> Shares<br />
Comm<strong>on</strong> Shares<br />
<strong>Deutsche</strong> <strong>Bank</strong>’s share capital c<strong>on</strong>sists of comm<strong>on</strong> shares issued in registered form without par value. Under<br />
German law, each share represents an equal stake in the subscribed capital. Therefore, each share has a<br />
nominal value of € 2.56, derived by dividing the total amount of share capital by the number of shares.<br />
Number of shares Issued and<br />
fully paid<br />
There are no issued ordinary shares that have not been fully paid.<br />
Shares purchased for treasury c<strong>on</strong>sist of shares held by the Group for a period of time, as well as any shares<br />
purchased with the intenti<strong>on</strong> of being resold in the short-term. In additi<strong>on</strong>, the Group has launched share buy-<br />
back programs. Shares acquired under these programs serve am<strong>on</strong>g other things, share-based compensati<strong>on</strong><br />
programs, and also allow the Group to balance capital supply and demand. The sixth buy-back program was<br />
completed in May <strong>20</strong>08. In the fourth quarter of <strong>20</strong>08, the majority of the remaining shares were sold in the<br />
market. The seventh share buy-back program was started in July <str<strong>on</strong>g><strong>20</strong>09</str<strong>on</strong>g>. All such transacti<strong>on</strong>s were recorded in<br />
shareholders’ equity and no revenues and expenses were recorded in c<strong>on</strong>necti<strong>on</strong> with these activities.<br />
On March 6, <str<strong>on</strong>g><strong>20</strong>09</str<strong>on</strong>g>, <strong>Deutsche</strong> <strong>Bank</strong> AG issued 50 milli<strong>on</strong> new comm<strong>on</strong> shares against a c<strong>on</strong>tributi<strong>on</strong>-in-kind of<br />
50 milli<strong>on</strong> ordinary shares of <strong>Deutsche</strong> Postbank AG, resulting in a share capital increase of € 128 milli<strong>on</strong>. The<br />
shares were issued with full dividend rights for the year <strong>20</strong>08 from authorized capital and without subscripti<strong>on</strong><br />
rights.<br />
F - 126<br />
Treasury<br />
shares<br />
Outstanding<br />
Comm<strong>on</strong> shares, January 1, <strong>20</strong>08 530,400,100 (29,334,819) 501,065,281<br />
Shares issued under share-based compensati<strong>on</strong> plans 458,915 – 458,915<br />
Capital increase 40,000,000 – 40,000,000<br />
Shares purchased for treasury – (369,614,111) (369,614,111)<br />
Shares sold or distributed from treasury – 390,756,870 390,756,870<br />
Comm<strong>on</strong> shares, December 31, <strong>20</strong>08 570,859,015 (8,192,060) 562,666,955<br />
Shares issued under share-based compensati<strong>on</strong> plans – – –<br />
Capital increase 50,000,000 – 50,000,000<br />
Shares purchased for treasury – (476,284,991) (476,284,991)<br />
Shares sold or distributed from treasury – 483,793,356 483,793,356<br />
Comm<strong>on</strong> shares, December 31, <str<strong>on</strong>g><strong>20</strong>09</str<strong>on</strong>g> 6<strong>20</strong>,859,015 (683,695) 6<strong>20</strong>,175,3<strong>20</strong>
Authorized and C<strong>on</strong>diti<strong>on</strong>al Capital<br />
<strong>Deutsche</strong> <strong>Bank</strong>’s share capital may be increased by issuing new shares for cash and in some circumstances<br />
for n<strong>on</strong>-cash c<strong>on</strong>siderati<strong>on</strong>. As of December 31, <str<strong>on</strong>g><strong>20</strong>09</str<strong>on</strong>g>, <strong>Deutsche</strong> <strong>Bank</strong> had authorized but unissued capital of<br />
€ 485,480,000 which may be issued at various dates through April 30, <strong>20</strong>14 as follows.<br />
Authorized capital Expirati<strong>on</strong> date<br />
€ 30,600,000 April 30, <strong>20</strong>12<br />
€ 140,000,000 1 April 30, <strong>20</strong>13<br />
€ 314,880,000 April 30, <strong>20</strong>14<br />
1 Capital increase may be affected for n<strong>on</strong>-cash c<strong>on</strong>tributi<strong>on</strong>s with the intent of acquiring a company or holdings in companies.<br />
The <str<strong>on</strong>g>Annual</str<strong>on</strong>g> General Meeting <strong>on</strong> May 26, <str<strong>on</strong>g><strong>20</strong>09</str<strong>on</strong>g> authorized the Management Board to increase the share<br />
capital by up to a total of € 128,000,000 against cash payments with the c<strong>on</strong>sent of the Supervisory Board.<br />
The expirati<strong>on</strong> date is April 30, <strong>20</strong>14. This additi<strong>on</strong>al authorized capital was subject of a law suit (summary<br />
proceeding according to Secti<strong>on</strong> 246a AktG) which ended February 23, <strong>20</strong>10, with the approval by the Higher<br />
Regi<strong>on</strong>al Court Frankfurt. The entry in the Commercial Register will follow shortly. This authorized capital will<br />
become effective up<strong>on</strong> its entry.<br />
Additi<strong>on</strong>ally, the <str<strong>on</strong>g>Annual</str<strong>on</strong>g> General Meeting <strong>on</strong> May 26, <str<strong>on</strong>g><strong>20</strong>09</str<strong>on</strong>g> authorized the Management Board to increase the<br />
share capital by up to a total of € 176,640,000 against cash payments or c<strong>on</strong>tributi<strong>on</strong>s-in-kind with the c<strong>on</strong>sent<br />
of the Supervisory Board. The expirati<strong>on</strong> date is April 30, <strong>20</strong>14. This authorized capital was also subject<br />
of a law suit (summary proceeding according to Secti<strong>on</strong> 246a AktG) which ended February 23, <strong>20</strong>10, with the<br />
approval by the Higher Regi<strong>on</strong>al Court Frankfurt. The entry in the Commercial Register will follow shortly. This<br />
authorized capital will become effective up<strong>on</strong> its entry.<br />
<strong>Deutsche</strong> <strong>Bank</strong> also had c<strong>on</strong>diti<strong>on</strong>al capital of € 406,000,000. C<strong>on</strong>diti<strong>on</strong>al capital is available for various<br />
instruments that may potentially be c<strong>on</strong>verted into comm<strong>on</strong> shares.<br />
The <str<strong>on</strong>g>Annual</str<strong>on</strong>g> General Meeting <strong>on</strong> May 29, <strong>20</strong>08 authorized the Management Board to issue <strong>on</strong>ce or more than<br />
<strong>on</strong>ce, bearer or registered participatory notes with bearer warrants and/or c<strong>on</strong>vertible participatory notes,<br />
b<strong>on</strong>ds with warrants, and/or c<strong>on</strong>vertible b<strong>on</strong>ds <strong>on</strong> or before April 30, <strong>20</strong>13. For this purpose, share capital was<br />
increased c<strong>on</strong>diti<strong>on</strong>ally by up to € 150,000,000.<br />
The <str<strong>on</strong>g>Annual</str<strong>on</strong>g> General Meeting <strong>on</strong> May 26, <str<strong>on</strong>g><strong>20</strong>09</str<strong>on</strong>g> authorized the Management Board to issue <strong>on</strong>ce or more than<br />
<strong>on</strong>ce, bearer or registered participatory notes with bearer warrants and/or c<strong>on</strong>vertible participatory notes,<br />
b<strong>on</strong>ds with warrants, and/or c<strong>on</strong>vertible b<strong>on</strong>ds <strong>on</strong> or before April 30, <strong>20</strong>14. For this purpose, share capital was<br />
increased c<strong>on</strong>diti<strong>on</strong>ally by up to € 256,000,000.<br />
F - 127
<strong>20</strong>-F Additi<strong>on</strong>al Notes<br />
Dividends<br />
The following table presents the amount of dividends proposed or declared for the years ended December 31,<br />
<str<strong>on</strong>g><strong>20</strong>09</str<strong>on</strong>g>, <strong>20</strong>08 and <strong>20</strong>07, respectively.<br />
1 Cash dividend for <str<strong>on</strong>g><strong>20</strong>09</str<strong>on</strong>g> is based <strong>on</strong> the number of shares issued as of December 31, <str<strong>on</strong>g><strong>20</strong>09</str<strong>on</strong>g>.<br />
No dividends have been declared since the balance sheet date.<br />
[31] Share-Based Compensati<strong>on</strong> Plans<br />
Share-Based Compensati<strong>on</strong> Plans used for Granting New Awards in <str<strong>on</strong>g><strong>20</strong>09</str<strong>on</strong>g><br />
In <str<strong>on</strong>g><strong>20</strong>09</str<strong>on</strong>g>, the Group made grants of share-based compensati<strong>on</strong> under the DB Equity Plan. All awards<br />
represent a c<strong>on</strong>tingent right to receive <strong>Deutsche</strong> <strong>Bank</strong> comm<strong>on</strong> shares after a specified period of time. The<br />
award recipient is not entitled to receive dividends before the settlement of the award. The terms of the<br />
DB Equity Plan are presented in the table below.<br />
1 Weighted average relevant service period: <strong>20</strong> m<strong>on</strong>ths.<br />
An award, or porti<strong>on</strong>s of it, may be forfeited if the recipient voluntarily terminates employment before the end<br />
of the relevant vesting period.<br />
Vesting usually c<strong>on</strong>tinues after terminati<strong>on</strong> of employment in cases such as redundancy or retirement. Vesting<br />
is accelerated if the recipient’s terminati<strong>on</strong> of employment is due to death or disability.<br />
In countries where legal or other restricti<strong>on</strong>s hinder the delivery of shares, a cash plan variant of the<br />
DB Equity Plan was used for making awards from <strong>20</strong>07 <strong>on</strong>wards.<br />
F - 128<br />
<str<strong>on</strong>g><strong>20</strong>09</str<strong>on</strong>g><br />
(proposed)<br />
<strong>20</strong>08 <strong>20</strong>07<br />
Cash dividends declared1 (in € m.) 466 309 2,274<br />
Cash dividends declared per comm<strong>on</strong> share (in €) 0.75 0.50 4.50<br />
Plan Vesting schedule Early retirement provisi<strong>on</strong>s Eligibility<br />
DB Equity Plan<br />
<str<strong>on</strong>g>Annual</str<strong>on</strong>g> Award<br />
50 % : 24 m<strong>on</strong>ths<br />
25 % : 36 m<strong>on</strong>ths<br />
25 % : 48 m<strong>on</strong>ths<br />
Retenti<strong>on</strong>/New Hire Individual specificati<strong>on</strong> 1 No<br />
No<br />
Select employees as annual<br />
retenti<strong>on</strong><br />
Select employees to attract or<br />
retain key staff
Plan<br />
A successor plan for the former Global Share Plan has been developed over the course of <str<strong>on</strong>g><strong>20</strong>09</str<strong>on</strong>g> and will be<br />
implemented in early <strong>20</strong>10 for entities in selected countries.<br />
The Group has other local share-based compensati<strong>on</strong> plans, n<strong>on</strong>e of which, individually or in the aggregate,<br />
are material to the c<strong>on</strong>solidated financial statements.<br />
Share-Based Compensati<strong>on</strong> Plans used for Granting Awards prior to <str<strong>on</strong>g><strong>20</strong>09</str<strong>on</strong>g><br />
Share Plans and Stock Appreciati<strong>on</strong> Right Plans<br />
Prior to <str<strong>on</strong>g><strong>20</strong>09</str<strong>on</strong>g>, the Group granted share-based compensati<strong>on</strong> under a number of other plans. The following<br />
table summarizes the main features of these prior plans.<br />
Restricted Equity Units (REU) Plan <str<strong>on</strong>g>Annual</str<strong>on</strong>g> Award<br />
DB Share Scheme<br />
<str<strong>on</strong>g>Annual</str<strong>on</strong>g> Award<br />
Off Cycle<br />
Award<br />
Vesting schedule Early retirement<br />
provisi<strong>on</strong>s<br />
80 % : 48 m<strong>on</strong>ths 1<br />
Yes<br />
<strong>20</strong> % : 54 m<strong>on</strong>ths<br />
1/3 : 6 m<strong>on</strong>ths<br />
1/3 : 18 m<strong>on</strong>ths<br />
No<br />
1/3 : 30 m<strong>on</strong>ths<br />
Individual specificati<strong>on</strong> No<br />
1 With delivery after further 6 m<strong>on</strong>ths.<br />
2 With delivery after further 18 m<strong>on</strong>ths.<br />
3 Participant must have been active and working for the Group for at least <strong>on</strong>e year at date of grant.<br />
All Plans except for the SAR plan represent a c<strong>on</strong>tingent right to receive <strong>Deutsche</strong> <strong>Bank</strong> comm<strong>on</strong> shares after<br />
a specified period of time. The award recipient is not entitled to receive dividends before the settlement of<br />
the award.<br />
F - 129<br />
Eligibility Last grant in<br />
Select employees as annual<br />
retenti<strong>on</strong><br />
Select employees as annual<br />
retenti<strong>on</strong><br />
Select employees to attract or<br />
retain key staff<br />
DB Key Employee Equity Plan (KEEP) – Individual specificati<strong>on</strong><br />
Exercisable after 36<br />
No Select executives <strong>20</strong>05<br />
Stock Appreciati<strong>on</strong> Rights (SAR) Plan –<br />
m<strong>on</strong>ths<br />
Expiry after 72 m<strong>on</strong>ths<br />
No Select employees <strong>20</strong>02<br />
Global Share Plan – 100 % : 12 m<strong>on</strong>ths No<br />
Global Partnership Plan Equity Units <str<strong>on</strong>g>Annual</str<strong>on</strong>g> Award<br />
80 % : 24 m<strong>on</strong>ths 2<br />
<strong>20</strong> % : 42 m<strong>on</strong>ths<br />
Global Share Plan – Germany – 100 % : 12 m<strong>on</strong>ths No<br />
DB Equity Plan <str<strong>on</strong>g>Annual</str<strong>on</strong>g> Award<br />
50 % : 24 m<strong>on</strong>ths<br />
25 % : 36 m<strong>on</strong>ths<br />
25 % : 48 m<strong>on</strong>ths<br />
All employee plan granting up to<br />
10 shares per employee<br />
<strong>20</strong>06<br />
<strong>20</strong>06<br />
<strong>20</strong>06<br />
<strong>20</strong>07<br />
No Group Board <strong>20</strong>08<br />
Yes<br />
Employee plan granting up to<br />
10 shares per employee in<br />
Germany 3<br />
Select employees as annual<br />
retenti<strong>on</strong><br />
<strong>20</strong>08<br />
<strong>20</strong>08
<strong>20</strong>-F Additi<strong>on</strong>al Notes<br />
An award, or porti<strong>on</strong> of it, may be forfeited if the recipient voluntarily terminates employment before the end of<br />
the relevant vesting period. Early retirement provisi<strong>on</strong>s for the REU Plan or DB Equity Plan, however, allow<br />
c<strong>on</strong>tinued vesting after voluntary terminati<strong>on</strong> of employment when certain c<strong>on</strong>diti<strong>on</strong>s regarding age or tenure<br />
are fulfilled.<br />
In countries where legal or other restricti<strong>on</strong>s hinder the delivery of shares, a cash plan variant of the plans<br />
used for making awards from <strong>20</strong>07 <strong>on</strong>wards.<br />
Vesting usually c<strong>on</strong>tinues after terminati<strong>on</strong> of employment in certain cases, such as redundancy or retirement.<br />
Vesting is accelerated if the recipient’s terminati<strong>on</strong> of employment is due to death or disability.<br />
The SAR plan provided eligible employees of the Group with the right to receive cash equal to the appreciati<strong>on</strong><br />
of <strong>Deutsche</strong> <strong>Bank</strong> comm<strong>on</strong> shares over an established strike price. The last rights granted under the SAR<br />
plan expired in <strong>20</strong>07.<br />
Performance Opti<strong>on</strong>s<br />
<strong>Deutsche</strong> <strong>Bank</strong> used performance opti<strong>on</strong>s as a remunerati<strong>on</strong> instrument under the Global Partnership Plan<br />
and the pre-<strong>20</strong>04 Global Share Plan. No new opti<strong>on</strong>s were issued under these plans after February <strong>20</strong>04.<br />
The following table summarizes the main features related to performance opti<strong>on</strong>s granted under the pre-<strong>20</strong>04<br />
Global Share Plan and the Global Partnership Plan.<br />
Plan Grant Year Exercise price Additi<strong>on</strong>al Partnership<br />
Appreciati<strong>on</strong> Rights (PAR)<br />
Global Share Plan<br />
(pre-<strong>20</strong>04)<br />
Performance Opti<strong>on</strong>s<br />
Global<br />
Partnership Plan<br />
Performance Opti<strong>on</strong>s<br />
1 Participant must have been active and working for the Group for at least <strong>on</strong>e year at date of grant.<br />
Under both plans, the opti<strong>on</strong> represents the right to purchase <strong>on</strong>e <strong>Deutsche</strong> <strong>Bank</strong> comm<strong>on</strong> share at an exer-<br />
cise price equal to 1<strong>20</strong> % of the reference price. This reference price was set as the higher of the fair market<br />
value of the comm<strong>on</strong> shares <strong>on</strong> the date of grant or an average of the fair market value of the comm<strong>on</strong> shares<br />
for the ten trading days <strong>on</strong> the Frankfurt Stock Exchange up to, and including, the date of grant.<br />
F - 130<br />
Exercisable until Eligibility<br />
<strong>20</strong>01 € 87.66 No Nov <strong>20</strong>07 All employees 1<br />
<strong>20</strong>02 € 55.39 No Nov <strong>20</strong>08 All employees 1<br />
<strong>20</strong>03 € 75.24 No Dec <str<strong>on</strong>g><strong>20</strong>09</str<strong>on</strong>g> All employees 1<br />
<strong>20</strong>02 € 89.96 Yes Feb <strong>20</strong>08 Select executives<br />
<strong>20</strong>03 € 47.53 Yes Feb <str<strong>on</strong>g><strong>20</strong>09</str<strong>on</strong>g> Select executives<br />
<strong>20</strong>04 € 76.61 Yes Feb <strong>20</strong>10 Group Board
Performance opti<strong>on</strong>s under the Global Partnership Plan were granted to select executives in the years <strong>20</strong>02<br />
to <strong>20</strong>04. Participants were granted <strong>on</strong>e Partnership Appreciati<strong>on</strong> Right (PAR) for each opti<strong>on</strong> granted. PARs<br />
represent a right to receive a cash award in an amount equal to <strong>20</strong> % of the reference price. The reference<br />
price was determined in the same way as described above for the performance opti<strong>on</strong>s. PARs vested at the<br />
same time and to the same extent as the performance opti<strong>on</strong>s. They are automatically exercised at the same<br />
time, and in the same proporti<strong>on</strong>, as the Global Partnership Plan performance opti<strong>on</strong>s.<br />
Performance opti<strong>on</strong>s under the Global Share Plan (pre-<strong>20</strong>04), a broad-based employee plan, were granted in<br />
the years <strong>20</strong>01 to <strong>20</strong>03. The plan allowed the purchase of up to 60 shares in <strong>20</strong>01 and up to <strong>20</strong> shares<br />
in both <strong>20</strong>02 and <strong>20</strong>03. For each share purchased, participants were granted <strong>on</strong>e performance opti<strong>on</strong> in <strong>20</strong>01<br />
and five performance opti<strong>on</strong>s in <strong>20</strong>02 and <strong>20</strong>03. Performance opti<strong>on</strong>s under the Global Share Plan (pre-<strong>20</strong>04)<br />
are forfeited up<strong>on</strong> terminati<strong>on</strong> of employment. Participants who retire or become permanently disabled retain<br />
the right to exercise the performance opti<strong>on</strong>s.<br />
Compensati<strong>on</strong> Expense<br />
Compensati<strong>on</strong> expense for awards classified as equity instruments is measured at the grant date based <strong>on</strong><br />
the fair value of the share-based award.<br />
Compensati<strong>on</strong> expense for share-based awards payable in cash is remeasured to fair value at each balance<br />
sheet date, and the related obligati<strong>on</strong>s are included in other liabilities until paid. For awards granted under the<br />
cash plan versi<strong>on</strong> of the DB Equity Plan and DB Global Share Plan, remeasurement is based <strong>on</strong> the current<br />
market price of <strong>Deutsche</strong> <strong>Bank</strong> comm<strong>on</strong> shares.<br />
A further descripti<strong>on</strong> of the underlying accounting principles can be found in Note [1].<br />
The Group recognized compensati<strong>on</strong> expense related to its significant share-based compensati<strong>on</strong> plans as<br />
follows:<br />
in € m. <str<strong>on</strong>g><strong>20</strong>09</str<strong>on</strong>g> <strong>20</strong>08 <strong>20</strong>07<br />
DB Global Partnership Plan 4 10 7<br />
DB Global Share Plan 6 39 49<br />
DB Share Scheme/Restricted Equity Units Plan/DB KEEP/DB Equity Plan 637 1,249 1,088<br />
Stock Appreciati<strong>on</strong> Rights Plan1 – – 1<br />
Total 647 1,298 1,145<br />
1 For the year ended December 31, <strong>20</strong>07 net gains of € 1 milli<strong>on</strong> from n<strong>on</strong>-trading equity derivatives, used to offset fluctuati<strong>on</strong>s in employee share-based<br />
compensati<strong>on</strong> expense, were included.<br />
Of the compensati<strong>on</strong> expense recognized in <str<strong>on</strong>g><strong>20</strong>09</str<strong>on</strong>g> and <strong>20</strong>08 approximately € 22 milli<strong>on</strong> and € 4 milli<strong>on</strong>, respec-<br />
tively, was attributable to the cash-settled variant of the DB Global Share Plan and the DB Equity Plan.<br />
F - 131
<strong>20</strong>-F Additi<strong>on</strong>al Notes<br />
Share-based payment transacti<strong>on</strong>s which will result in a cash payment give rise to a liability, which amounted<br />
to approximately € 26 milli<strong>on</strong> and € 10 milli<strong>on</strong> for the years ended December 31, <str<strong>on</strong>g><strong>20</strong>09</str<strong>on</strong>g> and <strong>20</strong>08 respectively.<br />
This liability is attributable to unvested share awards.<br />
As of December 31, <str<strong>on</strong>g><strong>20</strong>09</str<strong>on</strong>g> and <strong>20</strong>08, unrecognized compensati<strong>on</strong> cost related to n<strong>on</strong>-vested share-based<br />
compensati<strong>on</strong> was approximately € 0.4 billi<strong>on</strong> and € 0.6 billi<strong>on</strong> respectively.<br />
Award-Related Activities<br />
Share Plans<br />
The following table summarizes the activity in plans involving share awards, which are those plans granting a<br />
c<strong>on</strong>tingent right to receive <strong>Deutsche</strong> <strong>Bank</strong> comm<strong>on</strong> shares after a specified period of time. It also includes the<br />
grants under the cash plan variant of the DB Equity Plan and DB Global Share Plan.<br />
in thousands of units<br />
(except per share data)<br />
Global<br />
Partnership Plan<br />
Equity Units<br />
In additi<strong>on</strong> to the amounts shown in the table above, in February <strong>20</strong>10 the Group granted awards of approx-<br />
imately 35.2 milli<strong>on</strong> units, with an average fair value of € 44.01 per unit under the DB Equity Plan with<br />
modified plan c<strong>on</strong>diti<strong>on</strong>s for <strong>20</strong>10. Approximately 0.8 milli<strong>on</strong> of these grants under the DB Equity Plan were<br />
granted under the cash plan variant of this plan.<br />
DB share<br />
scheme/<br />
DB KEEP/REU/<br />
DB equity plan<br />
Approximately 10.6 milli<strong>on</strong> shares were issued to plan participants in February <strong>20</strong>10, resulting from the vest-<br />
ing of prior years DB Equity Plan and DB Share Scheme awards.<br />
F - 132<br />
Global Share Plan<br />
(since <strong>20</strong>04)<br />
Total Weightedaverage<br />
grant<br />
date fair value<br />
per unit<br />
Balance as of<br />
December 31, <strong>20</strong>07 324 49,309 599 50,232 € 71.05<br />
Granted 150 18,007 258 18,415 € 61.17<br />
Issued (139) (16,541) (561) (17,241) € 62.52<br />
Forfeited – (2,508) (38) (2,546) € 73.44<br />
Balance as of<br />
December 31, <strong>20</strong>08 335 48,267 258 48,860 € 70.22<br />
Granted – 23,809 – 23,809 € 22.02<br />
Issued (93) (18,903) (253) (19,249) € 68.76<br />
Forfeited – (3,059) (5) (3,064) € 43.51<br />
Balance as of<br />
December 31, <str<strong>on</strong>g><strong>20</strong>09</str<strong>on</strong>g> 242 50,114 – 50,356 € 49.61
Performance Opti<strong>on</strong>s<br />
The following table summarizes the activities for performance opti<strong>on</strong>s granted under the Global Partnership<br />
Plan and the DB Global Share Plan (pre-<strong>20</strong>04).<br />
in thousands of units<br />
(except per share data and exercise prices)<br />
Global<br />
Partnership Plan<br />
Performance<br />
Opti<strong>on</strong>s<br />
1 The weighted-average exercise price does not include the effect of the Partnership Appreciati<strong>on</strong> Rights for the DB Global Partnership Plan.<br />
The following two tables present details related to performance opti<strong>on</strong>s outstanding as of December 31, <strong>20</strong>08<br />
and <strong>20</strong>07, by range of exercise prices.<br />
As of December 31, <str<strong>on</strong>g><strong>20</strong>09</str<strong>on</strong>g> no more performance opti<strong>on</strong>s were outstanding since those granted in <strong>20</strong>04 were<br />
already exercised and all others not previously exercised expired in <str<strong>on</strong>g><strong>20</strong>09</str<strong>on</strong>g>.<br />
1 The weighted-average exercise price does not include the effect of the Partnership Appreciati<strong>on</strong> Rights for the DB Global Partnership Plan.<br />
1 The weighted-average exercise price does not include the effect of the Partnership Appreciati<strong>on</strong> Rights for the DB Global Partnership Plan.<br />
The weighted average share price at the date of exercise was € 64.31 and € 99.70 in the years ended<br />
December 31, <strong>20</strong>08 and <strong>20</strong>07, respectively.<br />
F - 133<br />
Weightedaverage<br />
exercise price 1<br />
DB Global Share<br />
Plan (pre-<strong>20</strong>04)<br />
Performance<br />
Opti<strong>on</strong>s<br />
Weightedaverage<br />
exercise price<br />
Balance as of December 31, <strong>20</strong>07 1,637 € 53.32 812 € 68.14<br />
Exercised (434) € 47.53 (26) € 57.67<br />
Forfeited – – (16) € 65.75<br />
Expired (223) € 89.96 (260) € 55.39<br />
Balance as of December 31, <strong>20</strong>08 980 € 47.53 510 € 75.24<br />
Exercised – – – –<br />
Forfeited – – (9) € 75.24<br />
Expired (980) € 47.53 (501) € 75.24<br />
Balance as of December 31, <str<strong>on</strong>g><strong>20</strong>09</str<strong>on</strong>g> – – – –<br />
Range of exercise prices Performance opti<strong>on</strong>s outstanding December 31, <strong>20</strong>08<br />
Opti<strong>on</strong>s<br />
outstanding<br />
(in thousands)<br />
Weightedaverage<br />
exercise price 1<br />
Weightedaverage<br />
remaining<br />
c<strong>on</strong>tractual life<br />
€ 40.00 – 59.99 980 € 47.53 1 m<strong>on</strong>th<br />
€ 60.00 – 79.99 510 € 75.24 12 m<strong>on</strong>ths<br />
€ 80.00 – 99.99 – – –<br />
Range of exercise prices Performance opti<strong>on</strong>s outstanding December 31, <strong>20</strong>07<br />
Opti<strong>on</strong>s<br />
outstanding<br />
(in thousands)<br />
Weightedaverage<br />
exercise price 1<br />
Weightedaverage<br />
remaining<br />
c<strong>on</strong>tractual life<br />
€ 40.00 – 59.99 1,704 € 48.87 13 m<strong>on</strong>ths<br />
€ 60.00 – 79.99 522 € 75.24 24 m<strong>on</strong>ths<br />
€ 80.00 – 99.99 223 € 89.96 1 m<strong>on</strong>th
<strong>20</strong>-F Additi<strong>on</strong>al Notes<br />
[32] Employee Benefits<br />
Deferred Compensati<strong>on</strong><br />
In February <str<strong>on</strong>g><strong>20</strong>09</str<strong>on</strong>g> awards of approximately € 1.0 billi<strong>on</strong> were granted under the terms and c<strong>on</strong>diti<strong>on</strong>s of the DB<br />
Restricted Cash Plan. As a rule, the awards are <strong>on</strong>ly paid out to the employee if there is a n<strong>on</strong>-terminated<br />
employment relati<strong>on</strong>ship between the employee and <strong>Deutsche</strong> <strong>Bank</strong> at the respective vesting date. The<br />
award c<strong>on</strong>sists of three tranches each amounting to <strong>on</strong>e third of the grant volume. The first tranche vested in<br />
early <strong>20</strong>10 and was paid out, net of those parts of the awards forfeited during the course of <str<strong>on</strong>g><strong>20</strong>09</str<strong>on</strong>g> according to<br />
the terms and c<strong>on</strong>diti<strong>on</strong>s of the plan. The two remaining tranches vest in early <strong>20</strong>11 and early <strong>20</strong>12, respectively.<br />
Each tranche is expensed over its vesting period.<br />
In February <strong>20</strong>10 new awards of approximately € 0.5 billi<strong>on</strong> were granted under the terms and c<strong>on</strong>diti<strong>on</strong>s of<br />
the DB Restricted Incentive Plan. The award c<strong>on</strong>sists of three tranches each amounting to <strong>on</strong>e third of the<br />
grant volume. The tranches vest in early <strong>20</strong>11, <strong>20</strong>12 and <strong>20</strong>13. Each tranche is expensed over its vesting<br />
period. In line with regulatory requirements this plan includes performance-indexed clawback rules for the<br />
most senior employees. Thus, there is the possibility that parts of the awards will be subject to forfeiture in<br />
the event of n<strong>on</strong>-achievement of defined targets, breach of policy or financial impairment.<br />
In additi<strong>on</strong>, as described in Note [31], the Group granted share awards totaling approximately € 1.5 billi<strong>on</strong> in<br />
February <strong>20</strong>10. Total deferred compensati<strong>on</strong> awards of approximately € 2.0 billi<strong>on</strong> were therefore granted<br />
in February <strong>20</strong>10.<br />
Post-employment Benefit Plans<br />
The Group provides a number of post-employment benefit plans. In additi<strong>on</strong> to defined c<strong>on</strong>tributi<strong>on</strong> plans,<br />
there are plans accounted for as defined benefit plans. The Group’s defined benefit plans are classified as<br />
post-employment medical plans and retirement benefit plans such as pensi<strong>on</strong>s.<br />
The majority of the beneficiaries of retirement benefit plans are located in Germany, the United Kingdom and<br />
the United States. The value of a participant’s accrued benefit is based primarily <strong>on</strong> each employee’s remunerati<strong>on</strong><br />
and length of service.<br />
The Group’s funding policy is to maintain full coverage of the defined benefit obligati<strong>on</strong> (“DBO”) by plan<br />
assets within a range of 90 % to 110 % of the obligati<strong>on</strong>, subject to meeting any local statutory requirements.<br />
Any obligati<strong>on</strong> for the Group’s unfunded plans is accrued for as book provisi<strong>on</strong>.<br />
Moreover, the Group maintains unfunded c<strong>on</strong>tributory post-employment medical plans for a number of current<br />
and retired employees who are mainly located in the United States. These plans pay stated percentages of<br />
eligible medical and dental expenses of retirees after a stated deductible has been met. The Group funds<br />
these plans <strong>on</strong> a cash basis as benefits are due.<br />
F - 134
December 31 is the measurement date for all plans. All plans are valued using the projected unit credit<br />
method.<br />
The following table provides rec<strong>on</strong>ciliati<strong>on</strong>s of opening and closing balances of the defined benefit obligati<strong>on</strong><br />
and of the fair value of plan assets of the Group’s defined benefit plans over the years ended December 31,<br />
<str<strong>on</strong>g><strong>20</strong>09</str<strong>on</strong>g> and <strong>20</strong>08, a statement of the funded status as well as its rec<strong>on</strong>ciliati<strong>on</strong> to the amounts recognized <strong>on</strong><br />
balance sheet as of December 31 in each year.<br />
Retirement benefit plans Post-employment<br />
medical plans<br />
in € m.<br />
Change in defined benefit obligati<strong>on</strong>:<br />
<str<strong>on</strong>g><strong>20</strong>09</str<strong>on</strong>g> <strong>20</strong>08 <str<strong>on</strong>g><strong>20</strong>09</str<strong>on</strong>g> <strong>20</strong>08<br />
Balance, beginning of year 8,189 8,518 119 116<br />
Current service cost 186 264 3 2<br />
Interest cost 457 453 7 7<br />
C<strong>on</strong>tributi<strong>on</strong>s by plan participants 6 8 – –<br />
Actuarial loss (gain) 846 (160) 14 1<br />
Exchange rate changes 181 (572) – 1<br />
Benefits paid (467) (393) (7) (8)<br />
Past service cost (credit) 18 14 – –<br />
Acquisiti<strong>on</strong>s – – – –<br />
Divestitures – – – –<br />
Settlements/curtailments – (1) – –<br />
Other 1 – 58 – –<br />
Balance, end of year 9,416 8,189 136 119<br />
thereof: unfunded <strong>20</strong>1 245 136 119<br />
thereof: funded<br />
Change in fair value of plan assets:<br />
9,215 7,944 – –<br />
Balance, beginning of year 8,755 9,331 – –<br />
Expected return <strong>on</strong> plan assets 403 446 – –<br />
Actuarial gain (loss) 92 (221) – –<br />
Exchange rate changes 231 (689) – –<br />
C<strong>on</strong>tributi<strong>on</strong>s by the employer 264 239 – –<br />
C<strong>on</strong>tributi<strong>on</strong>s by plan participants 6 8 – –<br />
Benefits paid 2 (398) (358) – –<br />
Acquisiti<strong>on</strong>s – – – –<br />
Divestitures – – – –<br />
Settlements (1) (1) – –<br />
Other – – – –<br />
Balance, end of year 9,352 8,755 – –<br />
Funded status, end of year (64) 566 (136) (119)<br />
Past service cost (credit) not recognized – – – –<br />
Asset ceiling (7) (9) – –<br />
Net asset (liability) recognized (71) 557 (136) (119)<br />
thereof: other assets 276 885 – –<br />
thereof: other liabilities (347) (328) (136) (119)<br />
1 Includes opening balance of first time applicati<strong>on</strong> of smaller plans.<br />
2 For funded plans <strong>on</strong>ly.<br />
F - 135
<strong>20</strong>-F Additi<strong>on</strong>al Notes<br />
The principal actuarial assumpti<strong>on</strong>s applied were as follows. They are provided in the form of weighted<br />
averages.<br />
Assumpti<strong>on</strong>s used for retirement benefit plans<br />
to determine defined benefit obligati<strong>on</strong>s, end of year<br />
<str<strong>on</strong>g><strong>20</strong>09</str<strong>on</strong>g> <strong>20</strong>08 <strong>20</strong>07<br />
Discount rate 5.4 % 5.6 % 5.5 %<br />
Rate of price inflati<strong>on</strong> 2.7 % 2.1 % 2.1 %<br />
Rate of nominal increase in future compensati<strong>on</strong> levels 3.4 % 3.0 % 3.3 %<br />
Rate of nominal increase for pensi<strong>on</strong>s in payment<br />
to determine expense, year ended<br />
2.4 % 1.8 % 1.8 %<br />
Discount rate 5.6 % 5.5 % 4.8 %<br />
Rate of price inflati<strong>on</strong> 2.1 % 2.1 % 2.0 %<br />
Rate of nominal increase in future compensati<strong>on</strong> levels 3.0 % 3.3 % 3.2 %<br />
Rate of nominal increase for pensi<strong>on</strong>s in payment 1.8 % 1.8 % 1.7 %<br />
Expected rate of return <strong>on</strong> plan assets 1 Assumpti<strong>on</strong>s used for post-employment medical plans<br />
to determine defined benefit obligati<strong>on</strong>s, end of year<br />
4.5 % 5.0 % 4.6 %<br />
Discount rate<br />
to determine expense, year ended<br />
5.9 % 6.1 % 6.1 %<br />
Discount rate<br />
Assumed life expectancy at age 65<br />
6.1 % 6.1 % 5.8 %<br />
for a male aged 65 at measurement date 19.4 19.1 19.1<br />
for a male aged 45 at measurement date 21.5 21.1 21.0<br />
for a female aged 65 at measurement date 22.8 22.6 22.5<br />
for a female aged 45 at measurement date 24.8 24.5 24.3<br />
1 The expected rate of return <strong>on</strong> assets for determining income in <strong>20</strong>10 is 5.0 %.<br />
In determining expenses for post-employment medical plans, an annual weighted-average rate of increase of<br />
8.9 % in the per capita cost of covered health care benefits was assumed for <strong>20</strong>10. The rate is assumed<br />
to decrease gradually to 4.9 % by the end of <strong>20</strong>17 and to remain at that level thereafter.<br />
Mortality assumpti<strong>on</strong>s are significant in measuring the Group’s obligati<strong>on</strong>s under its defined benefit plans.<br />
These assumpti<strong>on</strong>s have been set in accordance with current best practice in the respective countries. Future<br />
l<strong>on</strong>gevity improvements have been c<strong>on</strong>sidered and included where appropriate.<br />
The price inflati<strong>on</strong> assumpti<strong>on</strong>s in the U.K. and euroz<strong>on</strong>e are set with reference to market implied measures<br />
of inflati<strong>on</strong> based <strong>on</strong> inflati<strong>on</strong> swap rates in those markets at December 31, <str<strong>on</strong>g><strong>20</strong>09</str<strong>on</strong>g>, to better estimate the impact<br />
of inflati<strong>on</strong> <strong>on</strong> the Group’s pensi<strong>on</strong> commitments. In previous years, these assumpti<strong>on</strong>s were set predominantly<br />
with reference to the l<strong>on</strong>g term inflati<strong>on</strong> forecasts by C<strong>on</strong>sensus Ec<strong>on</strong>omics Inc. This change results<br />
in an increase of the Defined Benefit Obligati<strong>on</strong> at December 31, <str<strong>on</strong>g><strong>20</strong>09</str<strong>on</strong>g> by approximately € 540 milli<strong>on</strong>.<br />
The expected rate of return <strong>on</strong> assets is developed separately for each plan, using a building block approach<br />
recognizing the plan’s specific asset allocati<strong>on</strong> and the assumed return <strong>on</strong> assets for each asset category.<br />
The plan’s target asset allocati<strong>on</strong> at the measurement date is used, rather than the actual allocati<strong>on</strong>.<br />
F - 136
The weighted-average asset allocati<strong>on</strong> of the Group’s funded retirement benefit plans as of December 31,<br />
<str<strong>on</strong>g><strong>20</strong>09</str<strong>on</strong>g> and <strong>20</strong>08, as well as the target allocati<strong>on</strong> by asset category are as follows.<br />
Asset categories:<br />
The general principle is to use a risk-free rate as a benchmark, with adjustments for the effect of durati<strong>on</strong> and<br />
specific relevant factors for each major category of plan assets. For example, the expected rate of return for<br />
equities and property is derived by adding a respective risk premium to the yield-to-maturity <strong>on</strong> ten-year fixed<br />
interest government b<strong>on</strong>ds.<br />
Expected returns are adjusted for factors such as taxati<strong>on</strong>, but no allowance is made for expected outperfor-<br />
mance due to active management. Finally, the relevant risk premiums and overall expected rates of return are<br />
c<strong>on</strong>firmed for reas<strong>on</strong>ableness through comparis<strong>on</strong> with other reputable published forecasts and any other<br />
relevant market practice.<br />
The Group’s primary investment objective is to immunize broadly the <strong>Bank</strong> to large swings in the funded<br />
status of the retirement benefit plans, with some limited amount of risk-taking through durati<strong>on</strong> mismatches<br />
and asset class diversificati<strong>on</strong>. The aim is to maximize returns within a defined risk tolerance level specified<br />
by the Group.<br />
The actual return <strong>on</strong> plan assets for the years ended December 31, <str<strong>on</strong>g><strong>20</strong>09</str<strong>on</strong>g>, and December 31, <strong>20</strong>08, was<br />
€ 495 milli<strong>on</strong> and € 225 milli<strong>on</strong>, respectively.<br />
Plan assets as of December 31, <str<strong>on</strong>g><strong>20</strong>09</str<strong>on</strong>g>, include derivatives with a positive market value of € 249 milli<strong>on</strong>.<br />
Derivative transacti<strong>on</strong>s are made within the Group and with external counterparties. In additi<strong>on</strong>, there are<br />
€ 26 milli<strong>on</strong> of securities issued by the Group included in the plan assets.<br />
It is not expected that any plan assets will be returned to the Group during the year ending December<br />
31, <strong>20</strong>10.<br />
The Group expects to c<strong>on</strong>tribute approximately € 275 milli<strong>on</strong> to its retirement benefit plans in <strong>20</strong>10. The final<br />
amounts to be c<strong>on</strong>tributed in <strong>20</strong>10 will be determined in the fourth quarter of <strong>20</strong>10.<br />
F - 137<br />
Target allocati<strong>on</strong> Percentage of plan assets<br />
Dec 31, <str<strong>on</strong>g><strong>20</strong>09</str<strong>on</strong>g> Dec 31, <strong>20</strong>08<br />
Equity instruments 5 % 8 % 7 %<br />
Debt instruments (including Cash and Derivatives) 90 % 90 % 90 %<br />
Alternative Investments (including Property) 5 % 2 % 3 %<br />
Total asset categories 100 % 100 % 100 %
<strong>20</strong>-F Additi<strong>on</strong>al Notes<br />
The table below reflects the benefits expected to be paid in each of the next five years, and in the aggregate<br />
for the five years thereafter. The amounts include benefits attributable to estimated future employee service.<br />
1 Expected reimbursements from Medicare for prescripti<strong>on</strong> drugs.<br />
The Group applies the policy of recognizing actuarial gains and losses in the period in which they occur.<br />
Actuarial gains and losses are taken directly to shareholders’ equity and are presented in the C<strong>on</strong>solidated<br />
Statement of Recognized Income and Expense and in the C<strong>on</strong>solidated Statement of Changes in Equity. The<br />
following table shows the cumulative amounts recognized as at December 31, <str<strong>on</strong>g><strong>20</strong>09</str<strong>on</strong>g> since incepti<strong>on</strong> of IFRS<br />
<strong>on</strong> January 1, <strong>20</strong>06 as well as the amounts recognized in the years ended December 31, <str<strong>on</strong>g><strong>20</strong>09</str<strong>on</strong>g> and <strong>20</strong>08,<br />
respectively, not taking deferred taxes into account. Deferred taxes are disclosed in a separate table for<br />
income taxes taken to equity in Note [33]. Adjusted amounts recognized for prior periods are presented in<br />
Note [1].<br />
1 Accumulated since incepti<strong>on</strong> of IFRS and inclusive of the impact of exchange rate changes.<br />
F - 138<br />
Retirement<br />
benefit plans<br />
Post-employment<br />
medical plans<br />
Gross Reimbursein<br />
€ m.<br />
amount<br />
ment 1<br />
<strong>20</strong>10 415 9 (1)<br />
<strong>20</strong>11 409 11 (1)<br />
<strong>20</strong>12 424 11 (1)<br />
<strong>20</strong>13 441 12 (2)<br />
<strong>20</strong>14 449 12 (2)<br />
<strong>20</strong>15 – <strong>20</strong>19 2,619 65 (11)<br />
Amount recognized in<br />
shareholders' equity (gain(loss))<br />
in € m. Dec 31, <str<strong>on</strong>g><strong>20</strong>09</str<strong>on</strong>g> 1<br />
Retirement benefit plans:<br />
<str<strong>on</strong>g><strong>20</strong>09</str<strong>on</strong>g> <strong>20</strong>08<br />
Actuarial gain (loss) (89) (754) (61)<br />
Asset ceiling (7) 1 –<br />
Total retirement benefit plans<br />
Post-employment medical plans:<br />
(96) (753) (61)<br />
Actuarial gain (loss) 38 (14) (1)<br />
Total post-employment medical plans 38 (14) (1)<br />
Total amount recognized (58) (767) (62)
The following table shows the amounts for the current annual period and the previous annual periods of the<br />
present value of the defined benefit obligati<strong>on</strong>, the fair value of plan assets and the funded status as well as<br />
the experience adjustments arising <strong>on</strong> the obligati<strong>on</strong> and the plan assets.<br />
in € m.<br />
Retirement benefit plans:<br />
Dec 31, <str<strong>on</strong>g><strong>20</strong>09</str<strong>on</strong>g> Dec 31, <strong>20</strong>08 Dec 31, <strong>20</strong>07 Dec 31, <strong>20</strong>06<br />
Defined benefit obligati<strong>on</strong> 9,416 8,189 8,518 9,129<br />
thereof: experience adjustments (loss (gain)) (72) 24 (68) 18<br />
Fair Value of plan assets 9,352 8,755 9,331 9,447<br />
thereof: experience adjustments (gain (loss)) 92 (221) (266) (368)<br />
Funded status<br />
Post-employment medical plans:<br />
(64) 566 813 318<br />
Defined benefit obligati<strong>on</strong> 136 119 116 147<br />
thereof: experience adjustments (loss (gain)) – (5) (17) (27)<br />
Funded status (136) (119) (116) (147)<br />
Expenses for defined benefit plans and other selected employee benefits recognized in the C<strong>on</strong>solidated<br />
Statement of Income for the years ended December 31, <str<strong>on</strong>g><strong>20</strong>09</str<strong>on</strong>g>, <strong>20</strong>08 and <strong>20</strong>07 included the following items.<br />
All items are part of compensati<strong>on</strong> and benefits expenses.<br />
in € m.<br />
Expenses for retirement benefit plans:<br />
<str<strong>on</strong>g><strong>20</strong>09</str<strong>on</strong>g> <strong>20</strong>08 <strong>20</strong>07<br />
Current service cost 186 264 265<br />
Interest cost 457 453 436<br />
Expected return <strong>on</strong> plan assets (403) (446) (435)<br />
Past service cost (credit) recognized immediately 18 14 11<br />
Settlements/curtailments 1 – (5)<br />
Recogniti<strong>on</strong> of actuarial losses (gains) due to settlements/curtailments 1 – 9 (6)<br />
Amortizati<strong>on</strong> of actuarial losses (gains) 1 – 1 (1)<br />
Asset ceiling 1 – (2) 2<br />
Total retirement benefit plans<br />
Expenses for post-employment medical plans:<br />
259 293 267<br />
Current service cost 3 2 3<br />
Interest cost 7 7 8<br />
Amortizati<strong>on</strong> of actuarial losses (gains) 1 – 2 (3)<br />
Total post-employment medical plans 10 11 8<br />
Total expenses defined benefit plans 269 304 275<br />
Total expenses for defined c<strong>on</strong>tributi<strong>on</strong> plans <strong>20</strong>3 <strong>20</strong>6 <strong>20</strong>3<br />
Total expenses for post-employment benefits 472 510 478<br />
Disclosures of other selected employee benefits<br />
Employer c<strong>on</strong>tributi<strong>on</strong>s to mandatory German social security pensi<strong>on</strong> plan 162 159 156<br />
Expenses for cash retenti<strong>on</strong> plans 688 13 18<br />
Expenses for severance payments 629 555 225<br />
1 Items accrued under the corridor approach in <strong>20</strong>06 and <strong>20</strong>07 were reversed in <strong>20</strong>08 due to the change in accounting policy.<br />
Expected expenses for <strong>20</strong>10 are € 225 milli<strong>on</strong> for the retirement benefit plans and € 11 milli<strong>on</strong> for the postemployment<br />
medical plans. The average remaining service period at measurement date for retirement benefit<br />
plans is 11 years and for post-employment medical plans 7 years respectively.<br />
F - 139
<strong>20</strong>-F Additi<strong>on</strong>al Notes<br />
The following table presents the sensitivity to key assumpti<strong>on</strong>s of the defined benefit obligati<strong>on</strong> as of Decem-<br />
ber 31, <str<strong>on</strong>g><strong>20</strong>09</str<strong>on</strong>g>, and the aggregate of service costs and interest costs as well as the expected return <strong>on</strong> plan<br />
assets for the year ended December 31, <str<strong>on</strong>g><strong>20</strong>09</str<strong>on</strong>g>. Each assumpti<strong>on</strong> is shifted in isolati<strong>on</strong>.<br />
Increase (decrease) Defined benefit obligati<strong>on</strong> as at Expenses for<br />
in € m.<br />
Retirement benefit plans sensitivity:<br />
Dec 31, <str<strong>on</strong>g><strong>20</strong>09</str<strong>on</strong>g> Dec 31, <strong>20</strong>08 <str<strong>on</strong>g><strong>20</strong>09</str<strong>on</strong>g> <strong>20</strong>08<br />
Discount rate (fifty basis point decrease) 695 560 5 15<br />
Rate of price inflati<strong>on</strong> (fifty basis point increase)<br />
Rate of real increase in future compensati<strong>on</strong> levels (fifty basis<br />
4<strong>20</strong> 370 30 40<br />
point increase) 80 75 10 10<br />
L<strong>on</strong>gevity (improvement by ten percent) 1 175 130 10 10<br />
Expected rate of return (fifty basis point decrease)<br />
Post-employment medical plans sensitivity:<br />
– – 45 45<br />
Health care cost rate (100 basis point increase) 16 13 2 1<br />
Health care cost rate (100 basis point decrease) (14) (12) (1) (1)<br />
1 Improvement by ten percent <strong>on</strong> l<strong>on</strong>gevity means that the probability of death at each age is reduced by ten percent. The sensitivity has, broadly, the<br />
effect of increasing the expected l<strong>on</strong>gevity at age 65 by about <strong>on</strong>e year.<br />
[33] Income Taxes<br />
The comp<strong>on</strong>ents of income tax expense (benefit) for <str<strong>on</strong>g><strong>20</strong>09</str<strong>on</strong>g>, <strong>20</strong>08 and <strong>20</strong>07 are as follows.<br />
in € m.<br />
Current tax expense (benefit):<br />
<str<strong>on</strong>g><strong>20</strong>09</str<strong>on</strong>g> <strong>20</strong>08 <strong>20</strong>07<br />
Tax expense (benefit) for current year 970 (32) 3,504<br />
Adjustments for prior years (430) (288) (347)<br />
Total current tax expense (benefit)<br />
Deferred tax expense (benefit):<br />
540 (3<strong>20</strong>) 3,157<br />
Originati<strong>on</strong> and reversal of temporary difference, unused tax losses and tax credits 570 (1,346) (651)<br />
Effects of changes in tax rates 3 26 (181)<br />
Adjustments for prior years (869) (<strong>20</strong>5) (86)<br />
Total deferred tax expense (benefit) (296) (1,525) (918)<br />
Total income tax expense (benefit) 244 (1,845) 2,239<br />
Income tax expense (benefit) includes policyholder tax attributable to policyholder earnings, amounting to an<br />
income tax benefit of € 1 milli<strong>on</strong>, € 79 milli<strong>on</strong> and € 1 milli<strong>on</strong> in <str<strong>on</strong>g><strong>20</strong>09</str<strong>on</strong>g>, <strong>20</strong>08 and <strong>20</strong>07, respectively.<br />
Total current tax expense includes benefits from previously unrecognized tax losses, tax credits and deductible<br />
temporary differences, which reduced the current tax expense by € 0.2 milli<strong>on</strong> in <str<strong>on</strong>g><strong>20</strong>09</str<strong>on</strong>g>. In <strong>20</strong>08 these<br />
effects increased the current tax benefit by € 45 milli<strong>on</strong> and reduced the current tax expense by € 3 milli<strong>on</strong><br />
in <strong>20</strong>07.<br />
F - 140
Total deferred tax benefit includes expenses arising from write-downs of deferred tax assets and benefits from<br />
previously unrecognized tax losses (tax credits/temporary differences) and the reversal of previous write-<br />
downs of deferred tax assets, which increased the deferred tax benefit by € 537 milli<strong>on</strong> in <str<strong>on</strong>g><strong>20</strong>09</str<strong>on</strong>g>. In <strong>20</strong>08 these<br />
effects reduced the deferred tax benefit by € 971 milli<strong>on</strong> and by € 71 milli<strong>on</strong> in <strong>20</strong>07.<br />
The following is an analysis of the difference between the amount that results from applying the German<br />
statutory (domestic) income tax rate to income before tax and the Group’s actual income tax expense.<br />
in € m.<br />
Expected tax expense at domestic income tax rate of 30.7 %<br />
<str<strong>on</strong>g><strong>20</strong>09</str<strong>on</strong>g> <strong>20</strong>08 <strong>20</strong>07<br />
(30.7 % for <strong>20</strong>08 and 39.2 % for <strong>20</strong>07) 1,595 (1,760) 3,429<br />
Foreign rate differential (63) (665) (6<strong>20</strong>)<br />
Tax-exempt gains <strong>on</strong> securities and other income (763) (746) (657)<br />
Loss (income) <strong>on</strong> equity method investments (29) (36) (22)<br />
N<strong>on</strong>deductible expenses 624 403 393<br />
Goodwill impairment 0 1 21<br />
Changes in recogniti<strong>on</strong> and measurement of deferred tax assets (537) 926 68<br />
Effect of changes in tax law or tax rate 3 26 (181)<br />
Effect related to share based payments (95) 227 –<br />
Effect of policyholder tax (1) (79) (1)<br />
Other (490) (142) (191)<br />
Actual income tax expense (benefit) 244 (1,845) 2,239<br />
The Group is under c<strong>on</strong>tinuous examinati<strong>on</strong>s by tax authorities in various jurisdicti<strong>on</strong>s. The line item other in<br />
the preceding table includes mainly the n<strong>on</strong>recurring effect of settling examinati<strong>on</strong>s in <str<strong>on</strong>g><strong>20</strong>09</str<strong>on</strong>g>.<br />
The domestic income tax rate, including corporate tax, solidarity surcharge, and trade tax, used for calculating<br />
deferred tax assets and liabilities was 30.7 % for the years ended December 31, <str<strong>on</strong>g><strong>20</strong>09</str<strong>on</strong>g>, <strong>20</strong>08 and <strong>20</strong>07.<br />
In August <strong>20</strong>07, the German legislature enacted a tax law change <strong>on</strong> company taxati<strong>on</strong> (“Unternehmensteuerreformgesetz<br />
<strong>20</strong>08”), which lowered the statutory corporate income tax rate from 25 % to 15 %, and changed<br />
the trade tax calculati<strong>on</strong> from <strong>20</strong>08 <strong>on</strong>wards. This tax law change reduced the deferred tax expense for <strong>20</strong>07<br />
by € 232 milli<strong>on</strong>. Further tax rate changes, mainly in the United Kingdom, Spain, Italy and the United States of<br />
America, increased the deferred tax expense for <strong>20</strong>07 by € 51 milli<strong>on</strong>.<br />
F - 141
<strong>20</strong>-F Additi<strong>on</strong>al Notes<br />
Income taxes charged or credited to equity are as follows.<br />
in € m. <str<strong>on</strong>g><strong>20</strong>09</str<strong>on</strong>g> <strong>20</strong>08 <strong>20</strong>07<br />
Tax (charge)/credit <strong>on</strong> actuarial gains (losses) related to defined benefit plans 113 1 (192)<br />
Financial assets available for sale<br />
Unrealized net gains (losses) arising during the period (195) 892 154<br />
Net (gains) losses reclassified to profit or loss (214) (194) 43<br />
Derivatives hedging variability of cash flows<br />
Unrealized net gains (losses) arising during the period 90 (34) 4<br />
Net (gains) losses reclassified to profit or loss (2) – (5)<br />
Other equity movement<br />
Unrealized net gains (losses) arising during the period 54 67 19<br />
Net (gains) losses reclassified to profit or loss 13 – –<br />
Income taxes (charged) credited to recognized income and expenses in total equity (254) 731 215<br />
Other income taxes (charged) credited to total equity (35) (75) (35)<br />
Major comp<strong>on</strong>ents of the Group’s gross deferred income tax assets and liabilities are as follows.<br />
in € m. Dec 31, <str<strong>on</strong>g><strong>20</strong>09</str<strong>on</strong>g> Dec 31, <strong>20</strong>08<br />
Deferred tax assets:<br />
Unused tax losses 2,986 3,477<br />
Unused tax credits 218 134<br />
Deductible temporary differences:<br />
Trading activities 7,244 8,769<br />
Property and equipment 654 380<br />
Other assets 1,544 1,167<br />
Securities valuati<strong>on</strong> 563 654<br />
Allowance for loan losses 353 144<br />
Other provisi<strong>on</strong>s 1,088 1,016<br />
Other liabilities 439 568<br />
Total deferred tax assets 15,089 16,309<br />
Deferred tax liabilities:<br />
Taxable temporary differences:<br />
Trading activities 6,666 7,819<br />
Property and equipment 55 53<br />
Other assets 652 1,042<br />
Securities valuati<strong>on</strong> 652 605<br />
Allowance for loan losses 122 167<br />
Other provisi<strong>on</strong>s 932 1,221<br />
Other liabilities 1,017 716<br />
Total deferred tax liabilities 10,096 11,623<br />
Net deferred tax assets 4,993 4,686<br />
F - 142
After offsetting, deferred tax assets and liabilities are presented <strong>on</strong> the balance sheet as follows.<br />
in € m. Dec 31, <str<strong>on</strong>g><strong>20</strong>09</str<strong>on</strong>g> Dec 31, <strong>20</strong>08<br />
Presented as deferred tax assets 7,150 8,470<br />
Presented as deferred tax liabilities 2,157 3,784<br />
Net deferred tax assets 4,993 4,686<br />
The change in the balance of net deferred tax assets and deferred tax liabilities does not equal the deferred<br />
tax expense. This is due to (1) deferred taxes that are booked directly to equity, (2) the effects of exchange<br />
rate changes <strong>on</strong> tax assets and liabilities denominated in currencies other than euro, (3) the acquisiti<strong>on</strong> and<br />
disposal of entities as part of ordinary activities and (4) the reclassificati<strong>on</strong> of deferred tax assets and liabilities<br />
which are presented <strong>on</strong> the face of the balance sheet as comp<strong>on</strong>ents of other assets and liabilities.<br />
As of December 31, <str<strong>on</strong>g><strong>20</strong>09</str<strong>on</strong>g> and <strong>20</strong>08, no deferred tax assets are recognized for the following items. 1<br />
in € m. Dec 31, <str<strong>on</strong>g><strong>20</strong>09</str<strong>on</strong>g> Dec 31, <strong>20</strong>08<br />
Deductible temporary differences (69) (26)<br />
Not expiring (1,598) (617)<br />
Expiring in subsequent period 0 (1)<br />
Expiring after subsequent period (659) (2,851)<br />
Unused tax losses (2,257) (3,469)<br />
Expiring in subsequent period – –<br />
Expiring after subsequent period (87) (90)<br />
Unused tax credits (87) (90)<br />
1 Amounts in the table refer to deductible temporary differences, unused tax losses and tax credits for federal income tax purposes.<br />
Deferred tax assets were not recognized <strong>on</strong> these items because it is not probable that future taxable<br />
profit will be available against which the unused tax losses, unused tax credits and deductible temporary<br />
differences can be utilized.<br />
As of December 31, <str<strong>on</strong>g><strong>20</strong>09</str<strong>on</strong>g> and December 31, <strong>20</strong>08, the Group recognized deferred tax assets of € 6 billi<strong>on</strong><br />
and € 5.6 billi<strong>on</strong>, respectively that exceed deferred tax liabilities in entities which have suffered a loss in either<br />
the current or preceding period. This is based <strong>on</strong> management’s assessment that it is probable that the<br />
respective entities will have taxable profits against which the unused tax losses, unused tax credits and<br />
deductible temporary differences can be utilized. Generally, in determining the amounts of deferred tax assets<br />
to be recognized, management uses profitability informati<strong>on</strong> and, if relevant, forecasted operating results,<br />
based up<strong>on</strong> approved business plans, including a review of the eligible carry-forward periods, tax planning<br />
opportunities and other relevant c<strong>on</strong>siderati<strong>on</strong>s.<br />
F - 143
<strong>20</strong>-F Additi<strong>on</strong>al Notes<br />
As of December 31, <str<strong>on</strong>g><strong>20</strong>09</str<strong>on</strong>g> and December 31, <strong>20</strong>08, the Group had temporary differences associated with<br />
the Group’s parent company’s investments in subsidiaries, branches and associates and interests in joint<br />
ventures of € 105 milli<strong>on</strong> and € 157 milli<strong>on</strong> respectively, in respect of which no deferred tax liabilities were<br />
recognized.<br />
[34] Acquisiti<strong>on</strong>s and Dispositi<strong>on</strong>s<br />
Business Combinati<strong>on</strong>s finalized in <str<strong>on</strong>g><strong>20</strong>09</str<strong>on</strong>g><br />
In <str<strong>on</strong>g><strong>20</strong>09</str<strong>on</strong>g>, the Group finalized several acquisiti<strong>on</strong>s that were accounted for as business combinati<strong>on</strong>s. Of these<br />
transacti<strong>on</strong>s, n<strong>on</strong>e were individually significant and are, therefore, presented in the aggregate. These transacti<strong>on</strong>s<br />
involved the acquisiti<strong>on</strong> of interests of 100 % respectively for a total c<strong>on</strong>siderati<strong>on</strong> of € 22 milli<strong>on</strong>,<br />
including cash payments of € <strong>20</strong> milli<strong>on</strong> and costs of € 2 milli<strong>on</strong> directly related to these acquisiti<strong>on</strong>s. Based <strong>on</strong><br />
provisi<strong>on</strong>al values, the aggregated purchase prices were allocated as other intangible assets of € 21 milli<strong>on</strong>,<br />
reflecting customer relati<strong>on</strong>ships, and goodwill of € 1 milli<strong>on</strong>. Am<strong>on</strong>g these transacti<strong>on</strong>s is the acquisiti<strong>on</strong> of<br />
Dresdner <strong>Bank</strong>’s Global Agency Securities Lending business which closed <strong>on</strong> November 30, <str<strong>on</strong>g><strong>20</strong>09</str<strong>on</strong>g>. The business<br />
is operating from offices in L<strong>on</strong>d<strong>on</strong>, New York and Frankfurt and was integrated into GTB. The completi<strong>on</strong><br />
of this transacti<strong>on</strong> added <strong>on</strong>e of the largest third-party agency securities lending providers to the Group’s<br />
existing custody platform, closing a strategic product gap in the securities servicing area.<br />
The aggregate impact from these acquisiti<strong>on</strong>s <strong>on</strong> the Group’s balance sheet was as follows.<br />
in € m.<br />
Assets:<br />
Their related effect <strong>on</strong> net revenues and net profit or loss after tax of the Group in <str<strong>on</strong>g><strong>20</strong>09</str<strong>on</strong>g> was € 1 milli<strong>on</strong> and<br />
€ (1) milli<strong>on</strong>, respectively.<br />
Carrying value before<br />
the acquisiti<strong>on</strong><br />
F - 144<br />
Adjustments to<br />
fair value<br />
Fair value<br />
Cash and due from banks – – –<br />
Goodwill – 1 1<br />
Other intangible assets – 21 21<br />
All remaining assets – – –<br />
Total assets – 22 22<br />
Liabilities:<br />
L<strong>on</strong>g-term debt – – –<br />
All remaining liabilities – 3 3<br />
Total liabilities – 3 3<br />
Net assets – 19 19<br />
Total liabilities and equity – 22 22
Potential Profit or Loss Impact of Business Combinati<strong>on</strong>s finalized in <str<strong>on</strong>g><strong>20</strong>09</str<strong>on</strong>g><br />
If the business combinati<strong>on</strong>s described above which were finalized in <str<strong>on</strong>g><strong>20</strong>09</str<strong>on</strong>g> had all been effective as of<br />
January 1, <str<strong>on</strong>g><strong>20</strong>09</str<strong>on</strong>g>, the effect <strong>on</strong> the Group’s net revenues and net profit or loss after tax in <str<strong>on</strong>g><strong>20</strong>09</str<strong>on</strong>g> would have<br />
been € 22 milli<strong>on</strong> and less than € 1 milli<strong>on</strong>, respectively.<br />
Business Combinati<strong>on</strong>s finalized in <strong>20</strong>08<br />
In <strong>20</strong>08, the Group finalized several acquisiti<strong>on</strong>s that were accounted for as business combinati<strong>on</strong>s. Of these<br />
transacti<strong>on</strong>s, the acquisiti<strong>on</strong>s of DB HedgeWorks, LLC and the reacquisiti<strong>on</strong> of Maher Terminals LLC and<br />
Maher Terminals of Canada Corp. were individually significant and are, therefore, presented separately. The<br />
other business combinati<strong>on</strong>s, which were not individually significant, are presented in the aggregate.<br />
DB HedgeWorks, LLC<br />
On January 31, <strong>20</strong>08, the Group acquired 100 % of HedgeWorks, LLC, a hedge fund administrator based in<br />
the United States which it subsequently renamed DB HedgeWorks, LLC (“DB HedgeWorks”). The acquisiti<strong>on</strong><br />
further strengthened the Group’s service offering to the hedge fund industry. The cost of this business combinati<strong>on</strong><br />
c<strong>on</strong>sisted of a cash payment of € 19 milli<strong>on</strong> and another € 15 milli<strong>on</strong> subject to the acquiree exceeding<br />
certain performance targets over the following three years. The purchase price was allocated as goodwill<br />
of € 28 milli<strong>on</strong>, other intangible assets of € 5 milli<strong>on</strong> and net tangible assets of € 1 milli<strong>on</strong>. DB HedgeWorks is<br />
included in GTB. The impact of this acquisiti<strong>on</strong> <strong>on</strong> the Group’s balance sheet was as follows.<br />
Carrying value before Adjustments to<br />
Fair value<br />
in € m.<br />
the acquisiti<strong>on</strong><br />
fair value<br />
Assets:<br />
Cash and due from banks 1 – 1<br />
Goodwill – 28 28<br />
Other intangible assets – 5 5<br />
All remaining assets 1 – 1<br />
Total assets<br />
Liabilities:<br />
2 33 35<br />
L<strong>on</strong>g-term debt – 15 15<br />
All remaining liabilities 1 – 1<br />
Total liabilities 1 15 16<br />
Net assets 1 18 19<br />
Total liabilities and equity 2 33 35<br />
Following the acquisiti<strong>on</strong> in <strong>20</strong>08, DB HedgeWorks recorded net revenues and net losses after tax of<br />
€ 6 milli<strong>on</strong> and € 2 milli<strong>on</strong>, respectively.<br />
F - 145
<strong>20</strong>-F Additi<strong>on</strong>al Notes<br />
Maher Terminals LLC and Maher Terminals of Canada Corp.<br />
Commencing June 30, <strong>20</strong>08, the Group has c<strong>on</strong>solidated Maher Terminals LLC and Maher Terminals of<br />
Canada Corp., collectively and hereafter referred to as Maher Terminals, a privately held operator of port<br />
terminal facilities in North America. Maher Terminals was acquired as seed asset for the North American<br />
Infrastructure Fund. The Group initially owned 100 % of Maher Terminals and following a partial sale of an<br />
11.4 % minority stake to the RREEF North America Infrastructure Fund in <strong>20</strong>07, the Group retained a n<strong>on</strong>c<strong>on</strong>trolling<br />
interest which was accounted for as equity method investment under the held for sale category at<br />
December 31, <strong>20</strong>07 (see Note [24]). In a subsequent effort to restructure the fund in <strong>20</strong>08, RREEF Infrastructure<br />
reacquired all outstanding interests in the North America Infrastructure Fund, whose sole investment was<br />
Maher Terminals, for a cash c<strong>on</strong>siderati<strong>on</strong> of € 109 milli<strong>on</strong>.<br />
In disc<strong>on</strong>tinuing the held for sale accounting for the investment at the end of the third quarter <strong>20</strong>08, the assets<br />
and liabilities of Maher Terminals were reclassified from the held for sale category, with the reacquisiti<strong>on</strong><br />
accounted for as a purchase transacti<strong>on</strong>. The cost of this acquisiti<strong>on</strong> was allocated as goodwill of € 33 milli<strong>on</strong><br />
and net tangible assets of € 76 milli<strong>on</strong>. At acquisiti<strong>on</strong>, Maher Terminals was included in AWM. Following a<br />
change in management resp<strong>on</strong>sibility, Maher Terminals was transferred to CI effective January 1, <str<strong>on</strong>g><strong>20</strong>09</str<strong>on</strong>g>.<br />
As of the acquisiti<strong>on</strong> date, the impact <strong>on</strong> the Group’s balance sheet was as follows.<br />
Carrying value before Reclassificati<strong>on</strong> from<br />
Fair value<br />
the acquisiti<strong>on</strong> and held-for-sale category<br />
included under held- and Adjustments to<br />
in € m.<br />
for-sale category<br />
fair value<br />
Assets:<br />
Interest-earning time deposits with banks – 30 30<br />
Property and equipment – 169 169<br />
Goodwill – 597 597<br />
Other intangible assets – 770 770<br />
All remaining assets 1,840 (1,656) 184<br />
Total assets<br />
Liabilities:<br />
1,840 (90) 1,750<br />
L<strong>on</strong>g-term debt – 839 839<br />
All remaining liabilities 983 (845) 138<br />
Total liabilities 983 (6) 977<br />
Net assets 857 (84) 773<br />
Total liabilities and equity 1,840 (90) 1,750<br />
Post-acquisiti<strong>on</strong> net revenues and net losses after tax related to Maher Terminals in <strong>20</strong>08 amounted to<br />
negative € 7 milli<strong>on</strong> and € 256 milli<strong>on</strong>, respectively. The latter included a charge of € 175 milli<strong>on</strong> net of tax<br />
reflecting a goodwill impairment loss recognized in the fourth quarter <strong>20</strong>08 (see Note [23]).<br />
F - 146
Other Business Combinati<strong>on</strong>s finalized in <strong>20</strong>08<br />
Other business combinati<strong>on</strong>s, not being individually material, which were finalized in <strong>20</strong>08, are presented in<br />
the aggregate, and, am<strong>on</strong>g others, included the acquisiti<strong>on</strong> of Far Eastern Alliance Asset Management Co.<br />
Limited, a Taiwanese investment management firm, as well as the acquisiti<strong>on</strong> of the operating platform of<br />
Pago eTransacti<strong>on</strong> GmbH, a cash management and merchant acquiring business domiciled in Germany.<br />
These transacti<strong>on</strong>s involved the acquisiti<strong>on</strong> of majority interests ranging between more than 50 % and up to<br />
100 % for a total c<strong>on</strong>siderati<strong>on</strong> of € 7 milli<strong>on</strong>, including less than € 1 milli<strong>on</strong> of costs directly related to these<br />
acquisiti<strong>on</strong>s.<br />
Their impact <strong>on</strong> the Group’s balance sheet was as follows.<br />
Carrying value before Adjustments to<br />
Fair value<br />
in € m.<br />
the acquisiti<strong>on</strong><br />
fair value<br />
Assets:<br />
Cash and due from banks 4 6 10<br />
Interest-earning demand deposits with banks 6 3 9<br />
Interest-earning time deposits with banks 2 3 5<br />
Other intangible assets – 1 1<br />
All remaining assets <strong>20</strong> 2 22<br />
Total assets<br />
Liabilities:<br />
32 15 47<br />
Other liabilities 1 7 8<br />
All remaining liabilities – 1 1<br />
Total liabilities 1 8 9<br />
Net assets 31 7 38<br />
Total liabilities and equity 32 15 47<br />
The effect of these acquisiti<strong>on</strong>s <strong>on</strong> net revenues and net profit or loss after tax of the Group in <strong>20</strong>08 was<br />
€ 2 milli<strong>on</strong> and € (4) milli<strong>on</strong>, respectively.<br />
Potential Profit or Loss Impact of Business Combinati<strong>on</strong>s finalized in <strong>20</strong>08<br />
If the business combinati<strong>on</strong>s described above which were finalized in <strong>20</strong>08 had all been effective as of<br />
January 1, <strong>20</strong>08, the effect <strong>on</strong> the Group’s net revenues and net profit or loss after tax in <strong>20</strong>08 would have<br />
been € 44 milli<strong>on</strong> and € (223) milli<strong>on</strong>, respectively. The latter included a charge of € 175 milli<strong>on</strong> net of tax<br />
reflecting a goodwill impairment related to Maher Terminals recognized in the fourth quarter <strong>20</strong>08.<br />
F - 147
<strong>20</strong>-F Additi<strong>on</strong>al Notes<br />
Business Combinati<strong>on</strong>s finalized in <strong>20</strong>07<br />
In <strong>20</strong>07, the Group finalized several acquisiti<strong>on</strong>s that were accounted for as business combinati<strong>on</strong>s. Of these<br />
transacti<strong>on</strong>s, the acquisiti<strong>on</strong>s of Berliner <strong>Bank</strong> AG & Co. KG, MortgageIT Holdings, Inc. and Abbey Life Assurance<br />
Company Limited were individually significant and are, therefore, presented separately. The other business<br />
combinati<strong>on</strong>s, which were not individually significant, are presented in the aggregate.<br />
Berliner <strong>Bank</strong> AG & Co. KG<br />
Effective January 1, <strong>20</strong>07, the Group completed the acquisiti<strong>on</strong> of Berliner <strong>Bank</strong> AG & Co. KG (“Berliner<br />
<strong>Bank</strong>”) which expands the Group’s market share in the retail banking sector of the German capital. The cost<br />
of the acquisiti<strong>on</strong> c<strong>on</strong>sisted of a cash c<strong>on</strong>siderati<strong>on</strong> of € 645 milli<strong>on</strong> and € 1 milli<strong>on</strong> of cost directly attributable<br />
to the acquisiti<strong>on</strong>.<br />
From the purchase price, € 508 milli<strong>on</strong> were allocated to goodwill, € 45 milli<strong>on</strong> were allocated to other intan-<br />
gible assets, and € 93 milli<strong>on</strong> reflected net tangible assets. Berliner <strong>Bank</strong> is included in PBC. The impact of<br />
this acquisiti<strong>on</strong> <strong>on</strong> the Group’s balance sheet was as follows.<br />
in € m.<br />
Assets:<br />
Post-acquisiti<strong>on</strong> net revenues and net profits after tax related to Berliner <strong>Bank</strong> in <strong>20</strong>07 amounted to<br />
€ 251 milli<strong>on</strong> and € 35 milli<strong>on</strong>, respectively.<br />
Carrying value before<br />
the acquisiti<strong>on</strong><br />
F - 148<br />
Adjustments to<br />
fair value<br />
Fair value<br />
Cash and due from banks 190 – 190<br />
Interest-earning demand deposits with banks 808 – 808<br />
Interest-earning time deposits with banks 1,945 – 1,945<br />
Loans 2,443 (28) 2,415<br />
Goodwill – 508 508<br />
Other intangible assets – 45 45<br />
All remaining assets 18 2 <strong>20</strong><br />
Total assets 5,404 527 5,931<br />
Liabilities:<br />
Deposits 5,107 – 5,107<br />
All remaining liabilities 133 45 178<br />
Total liabilities 5,240 45 5,285<br />
Net assets 164 482 646<br />
Total liabilities and equity 5,404 527 5,931
MortgageIT Holdings, Inc.<br />
On January 2, <strong>20</strong>07, the Group completed the acquisiti<strong>on</strong> of 100 % of MortgageIT Holdings, Inc. (“MortgageIT”)<br />
for a total cash c<strong>on</strong>siderati<strong>on</strong> of € 326 milli<strong>on</strong>. The purchase price was allocated as goodwill of € 149 milli<strong>on</strong><br />
and net tangible assets of € 177 milli<strong>on</strong>. MortgageIT, a residential mortgage real estate investment trust<br />
(REIT) in the U.S., is included in CB&S.<br />
The impact of this acquisiti<strong>on</strong> <strong>on</strong> the Group’s balance sheet was as follows.<br />
Carrying value before Adjustments to<br />
Fair value<br />
in € m.<br />
the acquisiti<strong>on</strong><br />
fair value<br />
Assets:<br />
Cash and due from banks 29 – 29<br />
Financial assets at fair value through profit or loss 5,854 (5) 5,849<br />
Goodwill 9 140 149<br />
All remaining assets 160 (7) 153<br />
Total assets<br />
Liabilities:<br />
6,052 128 6,180<br />
Financial liabilities at fair value through profit or loss 3,390 – 3,390<br />
Other liabilities 2,349 10 2,359<br />
All remaining liabilities 95 10 105<br />
Total liabilities 5,834 <strong>20</strong> 5,854<br />
Net assets 218 108 326<br />
Total liabilities and equity 6,052 128 6,180<br />
Following the acquisiti<strong>on</strong> in <strong>20</strong>07, MortgageIT recorded net negative revenues and net losses after tax of<br />
€ 38 milli<strong>on</strong> and € 212 milli<strong>on</strong>, respectively.<br />
F - 149
<strong>20</strong>-F Additi<strong>on</strong>al Notes<br />
Abbey Life Assurance Company Limited<br />
On October 1, <strong>20</strong>07, the Group completed the acquisiti<strong>on</strong> of 100 % of Abbey Life Assurance Company Limited<br />
(“Abbey Life”) for a cash c<strong>on</strong>siderati<strong>on</strong> of € 1,412 milli<strong>on</strong> and € 12 milli<strong>on</strong> of costs directly related to the acquisiti<strong>on</strong>.<br />
The allocati<strong>on</strong> of the purchase price resulted in net tangible assets of € 512 milli<strong>on</strong> and other intangible<br />
assets of € 912 milli<strong>on</strong>. These identified intangible assets represent the present value of the future cash flows<br />
of the l<strong>on</strong>g-term insurance and investment c<strong>on</strong>tracts acquired in a business combinati<strong>on</strong> (the Value of Business<br />
Acquired (“VOBA”)). Abbey Life is a U.K. life assurance company which closed to new business in <strong>20</strong>00<br />
but still holds a valid license under which it is permitted to write new c<strong>on</strong>tracts if required. The company comprises<br />
primarily unit-linked life and pensi<strong>on</strong> policies and annuities and is included in CB&S. The impact of this<br />
acquisiti<strong>on</strong> <strong>on</strong> the Group's balance sheet was as follows.<br />
Carrying value before Adjustments to<br />
Fair value<br />
in € m.<br />
the acquisiti<strong>on</strong><br />
fair value<br />
Assets:<br />
Interest-earning demand deposits with banks 232 – 232<br />
Financial assets at fair value through profit or loss 14,145 – 14,145<br />
Financial assets available for sale 2,261 – 2,261<br />
Other intangible assets – 912 912<br />
All remaining assets 1,317 (1) 1,316<br />
Total assets<br />
Liabilities:<br />
17,955 911 18,866<br />
Financial liabilities at fair value through profit or loss 10,387 – 10,387<br />
Provisi<strong>on</strong>s - Insurance policies and reserves 6,339 – 6,339<br />
All remaining liabilities 246 318 564<br />
Total liabilities 16,972 318 17,290<br />
Net assets1 983 593 1,576<br />
Total liabilities and equity 17,955 911 18,866<br />
1 Includes minority interest of € 152 milli<strong>on</strong>.<br />
Following the acquisiti<strong>on</strong> and in finalizing the purchase accounting in <strong>20</strong>08, net assets acquired were reduced<br />
against the VOBA for € 5 milli<strong>on</strong>, resulting in revised net tangible assets of € 507 milli<strong>on</strong> and VOBA of<br />
€ 917 milli<strong>on</strong>. Post-acquisiti<strong>on</strong> net revenues and net profits after tax related to Abbey Life in <strong>20</strong>07 amounted to<br />
€ 53 milli<strong>on</strong> and € 26 milli<strong>on</strong>, respectively.<br />
Other Business Combinati<strong>on</strong>s finalized in <strong>20</strong>07<br />
Other business combinati<strong>on</strong>s, not being individually material, which were finalized in <strong>20</strong>07, are presented in<br />
the aggregate. These transacti<strong>on</strong>s involved the acquisiti<strong>on</strong> of majority interests ranging between 51 % and<br />
100 % for a total c<strong>on</strong>siderati<strong>on</strong> of € 107 milli<strong>on</strong>, including € 1 milli<strong>on</strong> of costs directly related to these acquisiti<strong>on</strong>s.<br />
F - 150
Their impact <strong>on</strong> the Group’s balance sheet was as follows.<br />
Carrying value before Adjustments to<br />
Fair value<br />
in € m.<br />
the acquisiti<strong>on</strong><br />
fair value<br />
Assets:<br />
Cash and due from banks 3 77 80<br />
Goodwill 3 25 28<br />
Other intangible assets 8 – 8<br />
All remaining assets 91 44 135<br />
Total assets 105 146 251<br />
Total liabilities 87 13 100<br />
Net assets 18 133 151<br />
Total liabilities and equity 105 146 251<br />
The effect of these acquisiti<strong>on</strong>s <strong>on</strong> net revenues and net profit or loss after tax of the Group in <strong>20</strong>07 was<br />
€ 2 milli<strong>on</strong> and € 1 milli<strong>on</strong>, respectively.<br />
Potential Profit or Loss Impact of Business Combinati<strong>on</strong>s finalized in <strong>20</strong>07<br />
If the business combinati<strong>on</strong>s described above which were finalized in <strong>20</strong>07, had all been effective as of January<br />
1, <strong>20</strong>07, the effect <strong>on</strong> the Group’s net revenues and net profit or loss after tax in <strong>20</strong>07 would have been<br />
€ 426 milli<strong>on</strong> and € (74) milli<strong>on</strong>, respectively.<br />
Business Combinati<strong>on</strong>s subject to completi<strong>on</strong> in <strong>20</strong>10<br />
The following acquisiti<strong>on</strong>s have been or will be completed in <strong>20</strong>10 and therefore are accounted for under the<br />
revised IFRS 3 R, “Business Combinati<strong>on</strong>s”, which the Group decided to adopt as of January 1, <strong>20</strong>10. However,<br />
disclosure requirements for these transacti<strong>on</strong>s at year-end <str<strong>on</strong>g><strong>20</strong>09</str<strong>on</strong>g> are still governed by current IFRS 3.<br />
Sal. Oppenheim. On October 28, <str<strong>on</strong>g><strong>20</strong>09</str<strong>on</strong>g>, <strong>Deutsche</strong> <strong>Bank</strong> AG (“<strong>Deutsche</strong> <strong>Bank</strong>”) and the owners of Luxembourg<br />
based holding company Sal. Oppenheim jr. & Cie. S.C.A. (“Sal. Opp. S.C.A.”) signed a framework agreement<br />
which allowed <strong>Deutsche</strong> <strong>Bank</strong> to acquire 100 % of Sal. Oppenheim Group (“Sal. Opp. Group”) at a purchase<br />
price of approximately € 1.0 billi<strong>on</strong>. The previous shareholders in Sal. Opp. S.C.A. have the opti<strong>on</strong> of acquiring<br />
a l<strong>on</strong>g-term shareholding of up to <strong>20</strong> % in the German subsidiary Sal. Oppenheim KGaA (“Sal. Opp.<br />
KGaA”).<br />
With the purchase of Sal. Opp. S.C.A., all activities of Sal. Opp. KGaA, BHF BANK AG (“BHF”) and the pri-<br />
vate equity fund of funds business managed in the separate holding Sal. Oppenheim Private Equity Partners<br />
S.A. (“SOPEP”) have transferred to <strong>Deutsche</strong> <strong>Bank</strong>. In additi<strong>on</strong>, <strong>Deutsche</strong> <strong>Bank</strong> acquired 94.9 % (49 % of<br />
voting rights) of BHF Asset Servicing GmbH (“BAS”) which was held by the Sal. Opp. S.C.A. shareholders.<br />
In additi<strong>on</strong> to the envisaged sale of BAS, <strong>Deutsche</strong> <strong>Bank</strong> also intends to resell parts of Sal. Opp. KGaA’s<br />
investment banking activities to third parties.<br />
F - 151
<strong>20</strong>-F Additi<strong>on</strong>al Notes<br />
On provisi<strong>on</strong>al values, the purchase price for the different entities acquired is expected to total approximately<br />
€ 1.3 billi<strong>on</strong>. Further agreements have been reached with the owners of Sal. Opp. S.C.A. that could lead to an<br />
increase of the purchase price c<strong>on</strong>tingent up<strong>on</strong> the future performance of specific risk positi<strong>on</strong>s. The alloca-<br />
ti<strong>on</strong> of the purchase price and the determinati<strong>on</strong> of the net fair value of the identifiable assets, liabilities, and<br />
c<strong>on</strong>tingent liabilities for the Sal. Opp. Group as of the acquisiti<strong>on</strong> date is not yet finalized.<br />
Sal. Oppenheim’s Asset and Wealth Management activities will be maintained and expanded in the future<br />
under the private bank’s established brand “Oppenheim” and “Sal. Oppenheim” and will preserve<br />
Sal. Oppenheim’s identity, values, culture and service quality. With this transacti<strong>on</strong>, the Group strengthens its<br />
positi<strong>on</strong> am<strong>on</strong>g high-net-worth private clients, family offices and trusts, especially in Germany.<br />
The acquisiti<strong>on</strong> of the Sal. Opp. Group closes in the first quarter of <strong>20</strong>10 and is implemented via various<br />
executi<strong>on</strong> agreements which, in accordance with definiti<strong>on</strong>s provided in IAS 28, resulted in the Group having<br />
significant influence over the Sal. Opp. Group at year end <str<strong>on</strong>g><strong>20</strong>09</str<strong>on</strong>g>. As all significant legal and regulatory approvals<br />
have been obtained by January 29, <strong>20</strong>10, the date of acquisiti<strong>on</strong> was set for that date and accordingly, the<br />
Group commenced c<strong>on</strong>solidati<strong>on</strong> of the Sal. Opp. Group in the first quarter <strong>20</strong>10.<br />
ABN AMRO. In December <str<strong>on</strong>g><strong>20</strong>09</str<strong>on</strong>g>, the Group signed a definitive agreement with ABN AMRO <strong>Bank</strong> N.V. (“ABN<br />
AMRO”) to acquire parts of ABN AMRO’s corporate and commercial banking activities in the Netherlands. The<br />
businesses to be acquired remain the same as those in the original agreement announced in July <strong>20</strong>08,<br />
encompassing a network of 15 ABN AMRO branches: two corporate client units serving large corporate<br />
clients and 13 commercial advisory branches serving medium-sized clients in the Netherlands. In additi<strong>on</strong>, as<br />
part of the transacti<strong>on</strong>, the Group will acquire the Rotterdam-based bank, Hollandsche <strong>Bank</strong> Unie N.V. and<br />
the Dutch IFN Finance B.V which provides factoring services. The transacti<strong>on</strong> is expected to be completed in<br />
the sec<strong>on</strong>d quarter <strong>20</strong>10.<br />
Other Business Combinati<strong>on</strong>s completed in <strong>20</strong>10<br />
Other business combinati<strong>on</strong>s, not being individually material, which were finalized in <strong>20</strong>10, include the stepacquisiti<strong>on</strong><br />
of an additi<strong>on</strong>al 47.5 % interest in an existing associate domiciled in the Philippines. The acquisiti<strong>on</strong><br />
resulted in a c<strong>on</strong>trolling ownership interest of 95 % and the c<strong>on</strong>solidati<strong>on</strong> of the investment in the first<br />
quarter <strong>20</strong>10. The total c<strong>on</strong>siderati<strong>on</strong> of € 6 milli<strong>on</strong> paid in cash was allocated to net assets acquired (including<br />
liabilities assumed) of € 10 milli<strong>on</strong>, resulting in negative goodwill of € 4 milli<strong>on</strong> which will be recognized as<br />
other income in the Group’s income statement of the first quarter <strong>20</strong>10.<br />
F - 152
Dispositi<strong>on</strong>s<br />
During <str<strong>on</strong>g><strong>20</strong>09</str<strong>on</strong>g>, <strong>20</strong>08 and <strong>20</strong>07, the Group finalized several dispositi<strong>on</strong>s of subsidiaries/businesses. For a list<br />
and further details about these dispositi<strong>on</strong>s, please see Note [4]. The total cash c<strong>on</strong>siderati<strong>on</strong> received for<br />
these dispositi<strong>on</strong>s in <str<strong>on</strong>g><strong>20</strong>09</str<strong>on</strong>g>, <strong>20</strong>08 and <strong>20</strong>07 was € 51 milli<strong>on</strong>, € 182 milli<strong>on</strong> and € 375 milli<strong>on</strong>, respectively. The<br />
table below includes the assets and liabilities that were included in these disposals.<br />
in € m. <str<strong>on</strong>g><strong>20</strong>09</str<strong>on</strong>g> <strong>20</strong>08 <strong>20</strong>07<br />
Cash and cash equivalents 49 66 52<br />
All remaining assets 15 4,079 885<br />
Total assets disposed 64 4,145 937<br />
Total liabilities disposed 73 3,490 463<br />
[35] Derivatives<br />
Derivative Financial Instruments and Hedging Activities<br />
Derivative c<strong>on</strong>tracts used by the Group include swaps, futures, forwards, opti<strong>on</strong>s and other similar types of<br />
c<strong>on</strong>tracts. In the normal course of business, the Group enters into a variety of derivative transacti<strong>on</strong>s for both<br />
trading and risk management purposes. The Group’s objectives in using derivative instruments are to meet<br />
customers’ risk management needs, to manage the Group’s exposure to risks and to generate revenues<br />
through proprietary trading activities.<br />
In accordance with the Group’s accounting policy relating to derivatives and hedge accounting as described in<br />
Note [1], all derivatives are carried at fair value in the balance sheet regardless of whether they are held for<br />
trading or n<strong>on</strong>-trading purposes.<br />
Derivatives held for Trading Purposes<br />
Sales and Trading<br />
The majority of the Group’s derivatives transacti<strong>on</strong>s relate to sales and trading activities. Sales activities<br />
include the structuring and marketing of derivative products to customers to enable them to take, transfer,<br />
modify or reduce current or expected risks. Trading includes market-making, positi<strong>on</strong>ing and arbitrage activities.<br />
Market-making involves quoting bid and offer prices to other market participants, enabling revenue to be<br />
generated based <strong>on</strong> spreads and volume. Positi<strong>on</strong>ing means managing risk positi<strong>on</strong>s in the expectati<strong>on</strong> of<br />
benefiting from favorable movements in prices, rates or indices. Arbitrage involves identifying and profiting<br />
from price differentials between markets and products.<br />
F - 153
<strong>20</strong>-F Additi<strong>on</strong>al Notes<br />
Risk Management<br />
The Group uses derivatives in order to reduce its exposure to credit and market risks as part of its asset and<br />
liability management. This is achieved by entering into derivatives that hedge specific portfolios of fixed rate<br />
financial instruments and forecast transacti<strong>on</strong>s as well as strategic hedging against overall balance sheet<br />
exposures. The Group actively manages interest rate risk through, am<strong>on</strong>g other things, the use of derivative<br />
c<strong>on</strong>tracts. Utilizati<strong>on</strong> of derivative financial instruments is modified from time to time within prescribed limits in<br />
resp<strong>on</strong>se to changing market c<strong>on</strong>diti<strong>on</strong>s, as well as to changes in the characteristics and mix of the related<br />
assets and liabilities.<br />
Derivatives qualifying for Hedge Accounting<br />
The Group applies hedge accounting if derivatives meet the specific criteria described in Note [1].<br />
Fair Value Hedging<br />
The Group undertakes fair value hedging, using primarily interest rate swaps and opti<strong>on</strong>s, in order to protect<br />
itself against movements in the fair value of fixed-rate financial instruments due to movements in market<br />
interest rates.<br />
The following table presents the value of derivatives held as fair value hedges.<br />
in € m.<br />
For the years ended December 31, <str<strong>on</strong>g><strong>20</strong>09</str<strong>on</strong>g> and <strong>20</strong>08, a loss of € 1.6 billi<strong>on</strong> and a gain of € 4.1 billi<strong>on</strong>, respec-<br />
tively, were recognized <strong>on</strong> the hedging instruments. For the same periods the gain <strong>on</strong> the hedged items,<br />
which were attributable to the hedged risk, was € 1.5 billi<strong>on</strong> and a loss of € 3.8 billi<strong>on</strong>, respectively.<br />
Cash Flow Hedging<br />
The Group undertakes cash flow hedging, using equity futures, interest rate swaps and foreign exchange<br />
forwards, in order to protect itself against exposures to variability in equity indices, interest rates and exchange<br />
rates.<br />
The following table presents the value of derivatives held as cash flow hedges.<br />
F - 154<br />
Assets<br />
<str<strong>on</strong>g><strong>20</strong>09</str<strong>on</strong>g><br />
Liabilities<br />
<str<strong>on</strong>g><strong>20</strong>09</str<strong>on</strong>g><br />
Assets<br />
<strong>20</strong>08<br />
Liabilities<br />
<strong>20</strong>08<br />
Derivatives held as fair value hedges 6,726 3,240 8,441 3,142<br />
in € m.<br />
Assets<br />
<str<strong>on</strong>g><strong>20</strong>09</str<strong>on</strong>g><br />
Liabilities<br />
<str<strong>on</strong>g><strong>20</strong>09</str<strong>on</strong>g><br />
Assets<br />
<strong>20</strong>08<br />
Liabilities<br />
<strong>20</strong>08<br />
Derivatives held as cash flow hedges 2 197 12 355
A schedule indicating the periods when hedged cash flows are expected to occur and when they are expected<br />
to affect the income statement is as follows.<br />
Within <strong>on</strong>e 1–3 years 3–5 years Over five<br />
in € m.<br />
As of December 31, <str<strong>on</strong>g><strong>20</strong>09</str<strong>on</strong>g><br />
year<br />
years<br />
Cash inflows from assets 42 79 65 106<br />
Cash outflows from liabilities (40) (58) (27) (140)<br />
Net cash flows<br />
As of December 31, <strong>20</strong>081<br />
2 21 38 (34)<br />
Cash inflows from assets 102 65 58 111<br />
Cash outflows from liabilities (71) (38) (49) (304)<br />
Net cash flows 31 27 9 (194)<br />
1 Prior year amounts have been adjusted.<br />
Of these expected future cash flows, most will arise in relati<strong>on</strong> to the Group’s two largest cash flow hedging<br />
programs.<br />
First, Maher Terminals LLC, a fully c<strong>on</strong>solidated subsidiary, utilizes a term borrowings program to fund its<br />
infrastructure asset portfolio. Future interest payments under the program are exposed to changes in whole-<br />
sale variable interest rates. To hedge this volatility in highly probable future interest cash flows, and align its<br />
funding costs with the nature of its revenue profile, Maher Terminals LLC has transacted a series of term pay<br />
fixed interest rate swaps.<br />
Sec<strong>on</strong>d, under the terms of unit-linked c<strong>on</strong>tracts written by Abbey Life Assurance Company Limited, policyholders<br />
are charged an annual management fee expressed as a percentage of assets under management. In<br />
order to protect against volatility in the highly probable forecasted cash flow stream arising from the management<br />
fees, the Group has entered into three m<strong>on</strong>th rolling FTSE futures. Other cash flow hedging programs<br />
use interest rate swaps and FX forwards as hedging instruments.<br />
For the years ended December 31, <str<strong>on</strong>g><strong>20</strong>09</str<strong>on</strong>g> and December 31, <strong>20</strong>08, balances of € (217) milli<strong>on</strong> and<br />
€ (342) milli<strong>on</strong>, respectively, were reported in equity related to cash flow hedging programs. Of these,<br />
€ (48) milli<strong>on</strong> and € (56) milli<strong>on</strong>, respectively, related to terminated programs. These amounts will be released<br />
to the income statement as appropriate.<br />
For the years ended December 31, <str<strong>on</strong>g><strong>20</strong>09</str<strong>on</strong>g> and December 31, <strong>20</strong>08, a gain of € 119 milli<strong>on</strong> and a loss of<br />
€ 265 milli<strong>on</strong>, respectively, were recognized in equity in respect of effective cash flow hedging.<br />
For the years ended December 31, <str<strong>on</strong>g><strong>20</strong>09</str<strong>on</strong>g> and December 31, <strong>20</strong>08, losses of € 6 milli<strong>on</strong> and € 2 milli<strong>on</strong>, respectively,<br />
were removed from equity and included in the income statement.<br />
F - 155
<strong>20</strong>-F Additi<strong>on</strong>al Notes<br />
For the years ended December 31, <str<strong>on</strong>g><strong>20</strong>09</str<strong>on</strong>g> and December 31, <strong>20</strong>08, a loss of € 7 milli<strong>on</strong> and a gain of € 27 milli<strong>on</strong>,<br />
respectively, were recognized due to hedge ineffectiveness.<br />
As of December 31, <str<strong>on</strong>g><strong>20</strong>09</str<strong>on</strong>g> the l<strong>on</strong>gest term cash flow hedge matures in <strong>20</strong>27.<br />
Net Investment Hedging<br />
Using foreign exchange forwards and swaps, the Group undertakes hedges of translati<strong>on</strong> adjustments resulting<br />
from translating the financial statements of net investments in foreign operati<strong>on</strong>s into the reporting currency<br />
of the parent.<br />
The following table presents the value of derivatives held as net investment hedges.<br />
in € m.<br />
For the years ended December 31, <str<strong>on</strong>g><strong>20</strong>09</str<strong>on</strong>g> and December 31, <strong>20</strong>08 losses of € 238 milli<strong>on</strong> and € 151 milli<strong>on</strong><br />
respectively, were recognized due to hedge ineffectiveness.<br />
[36] Regulatory Capital<br />
Capital Management<br />
The Group’s Treasury functi<strong>on</strong> manages its capital at Group level and locally in each regi<strong>on</strong>. The allocati<strong>on</strong> of<br />
financial resources, in general, and capital, in particular, favors business portfolios with the highest positive<br />
impact <strong>on</strong> the Group’s profitability and shareholder value. As a result, Treasury periodically reallocates capital<br />
am<strong>on</strong>g business portfolios.<br />
Treasury implements the Group’s capital strategy, which itself is developed by the Capital and Risk Commit-<br />
tee and approved by the Management Board, including the issuance and repurchase of shares. The Group is<br />
committed to maintain its sound capitalizati<strong>on</strong>. Overall capital demand and supply are c<strong>on</strong>stantly m<strong>on</strong>itored<br />
and adjusted, if necessary, to meet the need for capital from various perspectives. These include book equity<br />
based <strong>on</strong> IFRS accounting standards, regulatory capital and ec<strong>on</strong>omic capital. The Group’s target for the<br />
Tier 1 capital ratio c<strong>on</strong>tinues to be at 10 % or above.<br />
The allocati<strong>on</strong> of capital, determinati<strong>on</strong> of the Group’s funding plan and other resource issues are framed by<br />
the Capital and Risk Committee.<br />
F - 156<br />
Assets<br />
<str<strong>on</strong>g><strong>20</strong>09</str<strong>on</strong>g><br />
Liabilities<br />
<str<strong>on</strong>g><strong>20</strong>09</str<strong>on</strong>g><br />
Assets<br />
<strong>20</strong>08<br />
Liabilities<br />
<strong>20</strong>08<br />
Derivatives held as net investment hedges 94 364 1,081 1,2<strong>20</strong>
Regi<strong>on</strong>al capital plans covering the capital needs of the Group’s branches and subsidiaries are prepared <strong>on</strong><br />
a semi-annual basis and presented to the Group Investment Committee. Most of the Group’s subsidiaries are<br />
subject to legal and regulatory capital requirements. Local Asset and Liability Committees attend to those<br />
needs under the stewardship of regi<strong>on</strong>al Treasury teams. Furthermore, they safeguard compliance with<br />
requirements such as restricti<strong>on</strong>s <strong>on</strong> dividends allowable for remittance to <strong>Deutsche</strong> <strong>Bank</strong> AG or <strong>on</strong> the ability<br />
of the Group’s subsidiaries to make loans or advances to the parent bank. In developing, implementing and<br />
testing the Group’s capital and liquidity, the Group takes such legal and regulatory requirements into account.<br />
The <strong>20</strong>08 <str<strong>on</strong>g>Annual</str<strong>on</strong>g> General Meeting granted our management the authority to buy back up to 53.1 milli<strong>on</strong><br />
shares before the end of October <str<strong>on</strong>g><strong>20</strong>09</str<strong>on</strong>g>. No shares had been repurchased under this authorizati<strong>on</strong> through the<br />
<str<strong>on</strong>g>Annual</str<strong>on</strong>g> General Meeting in May <str<strong>on</strong>g><strong>20</strong>09</str<strong>on</strong>g> when a new authorizati<strong>on</strong> was granted.<br />
The <str<strong>on</strong>g><strong>20</strong>09</str<strong>on</strong>g> <str<strong>on</strong>g>Annual</str<strong>on</strong>g> General Meeting granted the Group’s management the authority to buy back up to<br />
62.1 milli<strong>on</strong> shares before the end of October <strong>20</strong>10. During the period from the <str<strong>on</strong>g>Annual</str<strong>on</strong>g> General Meeting in<br />
May <str<strong>on</strong>g><strong>20</strong>09</str<strong>on</strong>g> until year-end <str<strong>on</strong>g><strong>20</strong>09</str<strong>on</strong>g>, 11.7m shares (or 1.9 % of shares issued) were purchased for equity compensati<strong>on</strong><br />
purposes. The purchases were executed in July and August <str<strong>on</strong>g><strong>20</strong>09</str<strong>on</strong>g>.<br />
In March <str<strong>on</strong>g><strong>20</strong>09</str<strong>on</strong>g>, the Group issued 50 milli<strong>on</strong> new registered shares to <strong>Deutsche</strong> Post AG. In turn, <strong>Deutsche</strong><br />
Post AG c<strong>on</strong>tributed-in-kind a minority stake in <strong>Deutsche</strong> Postbank AG to <strong>Deutsche</strong> <strong>Bank</strong> AG.<br />
The Group issued € 1.3 billi<strong>on</strong> of hybrid Tier 1 capital for the year ended December 31, <str<strong>on</strong>g><strong>20</strong>09</str<strong>on</strong>g>. Total outstanding<br />
hybrid Tier 1 capital (all n<strong>on</strong>cumulative trust preferred securities) as of December 31, <str<strong>on</strong>g><strong>20</strong>09</str<strong>on</strong>g>, amounted to<br />
€ 10.6 billi<strong>on</strong> compared to € 9.6 billi<strong>on</strong> as of December 31, <strong>20</strong>08.<br />
Capital Adequacy<br />
Since <strong>20</strong>08, <strong>Deutsche</strong> <strong>Bank</strong> calculated and published c<strong>on</strong>solidated capital ratios for the <strong>Deutsche</strong> <strong>Bank</strong> group<br />
of instituti<strong>on</strong>s pursuant to the <strong>Bank</strong>ing Act and the Solvency Regulati<strong>on</strong> (“Solvabilitätsverordnung”), which<br />
adopted the revised capital framework of the Basel Committee from <strong>20</strong>04 (“Basel II”) into German law.<br />
The group of companies c<strong>on</strong>solidated for banking regulatory purposes (“group of instituti<strong>on</strong>s”) includes all<br />
subsidiaries as defined in the German <strong>Bank</strong>ing Act that are classified as banks, financial services instituti<strong>on</strong>s,<br />
investment management companies, financial enterprises, ancillary services enterprises or payment instituti<strong>on</strong>s.<br />
It does not include insurance companies or companies outside the finance sector.<br />
F - 157
<strong>20</strong>-F Additi<strong>on</strong>al Notes<br />
For financial c<strong>on</strong>glomerates, however, insurance companies are included in an additi<strong>on</strong>al capital adequacy<br />
(also “solvency margin”) calculati<strong>on</strong>. The Group has been designated as a financial c<strong>on</strong>glomerate following<br />
the acquisiti<strong>on</strong> of Abbey Life Assurance Company Limited in October <strong>20</strong>07. The Group’s solvency margin as a<br />
financial c<strong>on</strong>glomerate remains dominated by its banking activities.<br />
A bank’s total regulatory capital, also referred to as “Own Funds”, is divided into three tiers: Tier 1, Tier 2 and<br />
Tier 3 capital, and the sum of Tier 1 and Tier 2 capital is also referred to as “Regulatory <strong>Bank</strong>ing Capital”.<br />
— Tier 1 capital c<strong>on</strong>sists primarily of comm<strong>on</strong> share capital, additi<strong>on</strong>al paid-in capital, retained earnings and<br />
hybrid capital comp<strong>on</strong>ents such as n<strong>on</strong>cumulative trust preferred securities. Comm<strong>on</strong> shares in treasury,<br />
goodwill and other intangible assets are deducted from Tier 1. Other regulatory adjustments according to<br />
the <strong>Bank</strong>ing Act entail the exclusi<strong>on</strong> of capital from entities outside the group of instituti<strong>on</strong>s and the rever-<br />
sal of capital effects under the fair value opti<strong>on</strong> <strong>on</strong> financial liabilities due to own credit risk. Tier 1 capital<br />
without hybrid capital comp<strong>on</strong>ents is referred to as Core Tier 1 capital.<br />
— Tier 2 capital c<strong>on</strong>sists primarily of cumulative trust preferred securities and l<strong>on</strong>g-term subordinated debt,<br />
as well as 45 % of unrealized gains <strong>on</strong> certain listed securities.<br />
Certain items must be deducted from Tier 1 and Tier 2 capital. Primarily these include deductible invest-<br />
ments in unc<strong>on</strong>solidated banking, financial and insurance entities where the Group holds more than 10 %<br />
of the capital (in case of insurance entities <strong>20</strong> % either of the capital or of voting rights unless included in<br />
the solvency margin calculati<strong>on</strong> of the financial c<strong>on</strong>glomerate), the amount by which the expected loss for<br />
exposures to central governments, instituti<strong>on</strong>s and corporate and retail exposures as measured under the<br />
bank’s internal ratings based approach (“IRBA”) model exceeds the value adjustments and provisi<strong>on</strong>s for<br />
such exposures, the expected losses for certain equity exposures, securitizati<strong>on</strong> positi<strong>on</strong>s not included in<br />
the risk-weighted assets and the value of securities delivered to a counterparty plus any replacement cost<br />
to the extent the required payment by the counterparty has not been made within five business days after<br />
delivery provided the transacti<strong>on</strong> has been allocated to the bank’s trading book.<br />
— Tier 3 capital c<strong>on</strong>sists mainly of certain short-term subordinated debt.<br />
The amount of subordinated debt that may be included as Tier 2 capital is limited to 50 % of Tier 1 capital.<br />
Total Tier 2 capital is limited to 100 % of Tier 1 capital.<br />
F - 158
The Tier 1 capital ratio is the principal measure of capital adequacy for internati<strong>on</strong>ally active banks. The ratio<br />
compares a bank’s regulatory Tier 1 capital with its credit risks, market risks and operati<strong>on</strong>al risks pursuant to<br />
Basel II (which the Group refers to collectively as the “risk-weighted assets” or “RWA”). In the calculati<strong>on</strong> of<br />
the risk-weighted assets the Group uses BaFin approved internal models for all three risk types. More than<br />
90 % of the Group’s exposure relating to asset and off-balance sheet credit risks is measured using internal<br />
rating models under the so-called advanced IRBA. The Group’s market risk comp<strong>on</strong>ent is a multiple of its<br />
value-at-risk figure, which is calculated for regulatory purposes based <strong>on</strong> the Group’s internal models. For<br />
operati<strong>on</strong>al risk calculati<strong>on</strong>s, the Group uses the so-called Advanced Measurement Approach (“AMA”) pursuant<br />
to the German <strong>Bank</strong>ing Act.<br />
The following two tables present a summary of the Group’s regulatory capital and RWA.<br />
in € m.<br />
(unless stated otherwise) Dec 31, <str<strong>on</strong>g><strong>20</strong>09</str<strong>on</strong>g> Dec 31, <strong>20</strong>08<br />
Credit risk 217,003 247,611<br />
Market risk1 24,880 23,496<br />
Operati<strong>on</strong>al risk 31,593 36,625<br />
Total risk-weighted assets 273,476 307,732<br />
Tier 1 capital 34,406 31,094<br />
Thereof Core Tier 1 capital 23,790 21,472<br />
Tier 2 capital 3,523 6,302<br />
Tier 3 capital – –<br />
Total regulatory capital 37,929 37,396<br />
Tier 1 capital ratio 12.6 % 10.1 %<br />
Core Tier 1 capital ratio 8.7 % 7.0 %<br />
Total capital ratio 13.9 % 12.2 %<br />
Average Active Book Equity 34,613 32,079<br />
1 A multiple of the Group’s value-at-risk, calculated with a c<strong>on</strong>fidence level of 99 % and a ten-day holding period.<br />
The Group’s total capital ratio was 13.9 % <strong>on</strong> December 31, <str<strong>on</strong>g><strong>20</strong>09</str<strong>on</strong>g>, significantly higher than the 8 % minimum<br />
ratio required.<br />
The Group’s Tier 1 capital was € 34.4 billi<strong>on</strong> <strong>on</strong> December 31, <str<strong>on</strong>g><strong>20</strong>09</str<strong>on</strong>g> and € 31.1 billi<strong>on</strong> <strong>on</strong> December 31, <strong>20</strong>08.<br />
The Tier 1 capital ratio was 12.6 % as of December 31, <str<strong>on</strong>g><strong>20</strong>09</str<strong>on</strong>g> and 10.1 % as of December 31, <strong>20</strong>08, both<br />
exceeding the Group’s target ratio of 10 %. Core Tier 1 capital amounted to € 23.8 billi<strong>on</strong> <strong>on</strong> December 31,<br />
<str<strong>on</strong>g><strong>20</strong>09</str<strong>on</strong>g> and € 21.5 billi<strong>on</strong> <strong>on</strong> December 31, <strong>20</strong>08 with Core Tier 1 ratio of 8.7 % and 7.0 % respectively.<br />
The Group’s Tier 2 capital was € 3.5 billi<strong>on</strong> <strong>on</strong> December 31, <str<strong>on</strong>g><strong>20</strong>09</str<strong>on</strong>g>, and € 6.3 billi<strong>on</strong> <strong>on</strong> December 31, <strong>20</strong>08,<br />
amounting to 10 % and <strong>20</strong> % of Tier 1 capital, respectively.<br />
F - 159
<strong>20</strong>-F Additi<strong>on</strong>al Notes<br />
The German <strong>Bank</strong>ing Act and Solvency Regulati<strong>on</strong> rules require the Group to cover its market risk as of<br />
December 31, <str<strong>on</strong>g><strong>20</strong>09</str<strong>on</strong>g>, with € 1,990 milli<strong>on</strong> of total regulatory capital (Tier 1 + 2 + 3) compared to € 1,880 milli<strong>on</strong><br />
as of December 31, <strong>20</strong>08. The Group met this requirement entirely with Tier 1 and Tier 2 capital that was not<br />
required for the minimum coverage of credit and operati<strong>on</strong>al risk.<br />
The following are the comp<strong>on</strong>ents of Tier 1 and Tier 2 capital for the Group of companies c<strong>on</strong>solidated for<br />
regulatory purposes as of December 31, <str<strong>on</strong>g><strong>20</strong>09</str<strong>on</strong>g>, and December 31, <strong>20</strong>08.<br />
in € m.<br />
Tier 1 capital:<br />
Core Tier 1 capital:<br />
Dec 31, <str<strong>on</strong>g><strong>20</strong>09</str<strong>on</strong>g> Dec 31, <strong>20</strong>08<br />
Comm<strong>on</strong> shares 1,589 1,461<br />
Additi<strong>on</strong>al paid-in capital<br />
Retained earnings, comm<strong>on</strong> shares in treasury, equity classified as obligati<strong>on</strong> to purchase comm<strong>on</strong><br />
14,830 14,961<br />
shares, foreign currency translati<strong>on</strong>, minority interest 21,807 16,724<br />
Items to be fully deducted from Tier 1 capital (inter alia goodwill and intangible assets)<br />
Items to be partly deducted from Tier 1 capital:<br />
(10,238) (10,125)<br />
Deductible investments in banking, financial and insurance entities (2,1<strong>20</strong>) (771)<br />
Securitizati<strong>on</strong> positi<strong>on</strong>s not included in risk-weighted assets (1,033) (279)<br />
Excess of expected losses over risk provisi<strong>on</strong>s (1,045) (499)<br />
Items to be partly deducted from Tier 1 capital 1 (4,198) (1,549)<br />
Core Tier 1 capital<br />
Additi<strong>on</strong>al Tier 1 capital:<br />
23,790 21,472<br />
N<strong>on</strong>cumulative trust preferred securities 10,616 9,622<br />
Additi<strong>on</strong>al Tier 1 capital 10,616 9,622<br />
Total Tier 1 capital<br />
Tier 2 capital:<br />
34,406 31,094<br />
Unrealized gains <strong>on</strong> listed securities 2 (45 % eligible) 331 –<br />
Cumulative preferred securities 294 300<br />
Qualified subordinated liabilities 7,096 7,551<br />
Items to be partly deducted from Tier 2 capital (4,198) (1,549)<br />
Total Tier 2 capital 3,523 6,302<br />
1 Pursuant to German <strong>Bank</strong>ing Act Secti<strong>on</strong> 10 (6) and Secti<strong>on</strong> 10 (6a) in c<strong>on</strong>juncti<strong>on</strong> with German <strong>Bank</strong>ing Act Secti<strong>on</strong> 10a.<br />
2 Net unrealized gains and losses <strong>on</strong> listed securities as to be determined for regulatory purposes were negative at the end of <strong>20</strong>08 € (108) milli<strong>on</strong> and<br />
were fully deducted from Tier 1 capital.<br />
F - 160
The following table rec<strong>on</strong>ciles shareholders’ equity according to IFRS to Tier 1 capital pursuant to Basel II.<br />
in € m. Dec 31, <str<strong>on</strong>g><strong>20</strong>09</str<strong>on</strong>g> Dec 31, <strong>20</strong>08<br />
Total shareholders’ equity 36,647 30,703<br />
Unrealized net gains (losses) <strong>on</strong> financial assets available for sale 121 882<br />
Unrealized net gains (losses) <strong>on</strong> cash flow hedges 136 349<br />
Accrued future dividend (466) (310)<br />
Active book equity 36,438 31,624<br />
Goodwill and intangible assets (10,169) (9,877)<br />
Minority interest 1,322 1,211<br />
Other (c<strong>on</strong>solidati<strong>on</strong> and regulatory adjustments) 397 63<br />
N<strong>on</strong>cumulative trust preferred securities 10,616 9,622<br />
Items to be partly deducted from Tier 1 capital (4,198) (1,549)<br />
Tier 1 capital 34,406 31,094<br />
Basel II requires the deducti<strong>on</strong> of goodwill from Tier 1 capital. However, for a transiti<strong>on</strong>al period the partial<br />
inclusi<strong>on</strong> of certain goodwill comp<strong>on</strong>ents in Tier 1 capital is allowed pursuant to German <strong>Bank</strong>ing Act Secti<strong>on</strong><br />
64h (3). While such goodwill comp<strong>on</strong>ents are not included in the regulatory capital and capital adequacy<br />
ratios shown above, the Group makes use of this transiti<strong>on</strong> rule in its capital adequacy reporting to the<br />
German regulatory authorities.<br />
As of December 31, <str<strong>on</strong>g><strong>20</strong>09</str<strong>on</strong>g>, the transiti<strong>on</strong>al item amounted to € 462 milli<strong>on</strong>. In the Group’s reporting to the<br />
German regulatory authorities, the Tier 1 capital, total regulatory capital and the total risk-weighted assets<br />
shown above were increased by this amount. Corresp<strong>on</strong>dingly, the Group’s Tier 1 and total capital ratios<br />
reported to the German regulatory authorities including this item were 12.7 % and 14.0 %, respectively, <strong>on</strong><br />
December 31, <str<strong>on</strong>g><strong>20</strong>09</str<strong>on</strong>g>.<br />
Failure to meet minimum capital requirements can result in orders to suspend or reduce dividend payments<br />
or other profit distributi<strong>on</strong>s <strong>on</strong> regulatory capital and discreti<strong>on</strong>ary acti<strong>on</strong>s by the BaFin that, if undertaken,<br />
could have a direct material effect <strong>on</strong> the Group’s businesses. The Group complied with the regulatory capital<br />
adequacy requirements in <str<strong>on</strong>g><strong>20</strong>09</str<strong>on</strong>g>.<br />
F - 161
<strong>20</strong>-F Additi<strong>on</strong>al Notes<br />
[37] Related Party Transacti<strong>on</strong>s<br />
Parties are c<strong>on</strong>sidered to be related if <strong>on</strong>e party has the ability to directly or indirectly c<strong>on</strong>trol the other party<br />
or exercise significant influence over the other party in making financial or operati<strong>on</strong>al decisi<strong>on</strong>s. The Group’s<br />
related parties include<br />
— key management pers<strong>on</strong>nel, close family members of key management pers<strong>on</strong>nel and entities which are<br />
c<strong>on</strong>trolled, significantly influenced by, or for which significant voting power is held by key management<br />
pers<strong>on</strong>nel or their close family members,<br />
— subsidiaries, joint ventures and associates, and<br />
— post-employment benefit plans for the benefit of <strong>Deutsche</strong> <strong>Bank</strong> employees.<br />
The Group has several business relati<strong>on</strong>ships with related parties. Transacti<strong>on</strong>s with such parties are made in<br />
the ordinary course of business and <strong>on</strong> substantially the same terms, including interest rates and collateral,<br />
as those prevailing at the time for comparable transacti<strong>on</strong>s with other parties. These transacti<strong>on</strong>s also did not<br />
involve more than the normal risk of collectibility or present other unfavorable features.<br />
Transacti<strong>on</strong>s with Key Management Pers<strong>on</strong>nel<br />
Key management pers<strong>on</strong>nel are those pers<strong>on</strong>s having authority and resp<strong>on</strong>sibility for planning, directing and<br />
c<strong>on</strong>trolling the activities of <strong>Deutsche</strong> <strong>Bank</strong>, directly or indirectly. The Group c<strong>on</strong>siders the members of the<br />
Management Board and of the Supervisory Board to c<strong>on</strong>stitute key management pers<strong>on</strong>nel for purposes of<br />
IAS 24.<br />
The following table presents the compensati<strong>on</strong> expense of key management pers<strong>on</strong>nel.<br />
in € m. <str<strong>on</strong>g><strong>20</strong>09</str<strong>on</strong>g> <strong>20</strong>08 <strong>20</strong>07<br />
Short-term employee benefits 22 9 30<br />
Post-employment benefits 3 3 4<br />
Other l<strong>on</strong>g-term benefits – – –<br />
Terminati<strong>on</strong> benefits – – –<br />
Share-based payment 7 8 8<br />
Total 32 <strong>20</strong> 42<br />
Am<strong>on</strong>g the Group’s transacti<strong>on</strong>s with key management pers<strong>on</strong>nel as of December 31, <str<strong>on</strong>g><strong>20</strong>09</str<strong>on</strong>g> were loans and<br />
commitments of € 9 milli<strong>on</strong> and deposits of € 21 milli<strong>on</strong>. In additi<strong>on</strong>, the Group provides banking services, such<br />
as payment and account services as well as investment advice, to key management pers<strong>on</strong>nel and their close<br />
family members.<br />
F - 162
Transacti<strong>on</strong>s with Subsidiaries, Joint Ventures and Associates<br />
Transacti<strong>on</strong>s between <strong>Deutsche</strong> <strong>Bank</strong> AG and its subsidiaries meet the definiti<strong>on</strong> of related party trans-<br />
acti<strong>on</strong>s. If these transacti<strong>on</strong>s are eliminated <strong>on</strong> c<strong>on</strong>solidati<strong>on</strong>, they are not disclosed as related party<br />
transacti<strong>on</strong>s. Transacti<strong>on</strong>s between the Group and its associated companies and joint ventures also qualify as<br />
related party transacti<strong>on</strong>s and are disclosed as follows.<br />
Loans<br />
in € m. <str<strong>on</strong>g><strong>20</strong>09</str<strong>on</strong>g> <strong>20</strong>08<br />
Loans outstanding, beginning of year 834 2,081<br />
Loans issued during the year 366 1,623<br />
Loan repayment during the year <strong>20</strong>9 514<br />
Changes in the group of c<strong>on</strong>solidated companies1 (83) (2,<strong>20</strong>0)<br />
Exchange rate changes/other 57 (156)<br />
Loans outstanding, end of year 2 Other credit risk related transacti<strong>on</strong>s:<br />
965 834<br />
Allowance for loan losses 4 4<br />
Provisi<strong>on</strong> for loan losses 31 4<br />
Guarantees and commitments3 135 95<br />
1 In <str<strong>on</strong>g><strong>20</strong>09</str<strong>on</strong>g> <strong>on</strong>e entity that was accounted for using the equity method was sold. In <strong>20</strong>08 four entities that were accounted for using the equity method were<br />
fully c<strong>on</strong>solidated for the first time. Therefore loans made to these investments were eliminated <strong>on</strong> c<strong>on</strong>solidati<strong>on</strong>.<br />
2 Included in this amount are loans past due of € 15 milli<strong>on</strong> and € 7 milli<strong>on</strong> as of December 31, <str<strong>on</strong>g><strong>20</strong>09</str<strong>on</strong>g> and <strong>20</strong>08, respectively. For the above loans the<br />
Group held collateral of € 375 milli<strong>on</strong> and € 361 milli<strong>on</strong> as of December 31, <str<strong>on</strong>g><strong>20</strong>09</str<strong>on</strong>g> and as of December 31, <strong>20</strong>08, respectively. Loans included also<br />
€ 4 milli<strong>on</strong> and € 143 milli<strong>on</strong> loans with joint ventures as of December 31, <str<strong>on</strong>g><strong>20</strong>09</str<strong>on</strong>g> and <strong>20</strong>08, respectively. For these loans no loan loss allowance was<br />
required.<br />
3 The guarantees above include financial and performance guarantees, standby letters of credit, indemnity agreements and irrevocable lending-related<br />
commitments.<br />
Deposits<br />
in € m. <str<strong>on</strong>g><strong>20</strong>09</str<strong>on</strong>g> <strong>20</strong>08<br />
Deposits outstanding, beginning of year 246 962<br />
Deposits received during the year 287 955<br />
Deposits repaid during the year 161 685<br />
Changes in the group of c<strong>on</strong>solidated companies1 (6) (693)<br />
Exchange rate changes/other 1 (293)<br />
Deposits outstanding, end of year2 367 246<br />
1 In <str<strong>on</strong>g><strong>20</strong>09</str<strong>on</strong>g> <strong>on</strong>e entity that was accounted for using the equity method was sold. In <strong>20</strong>08 <strong>on</strong>e entity that was accounted for using the equity method was fully<br />
c<strong>on</strong>solidated. Therefore deposits received from this investment were eliminated <strong>on</strong> c<strong>on</strong>solidati<strong>on</strong>.<br />
2 The deposits are unsecured. Deposits include also € 0.4 milli<strong>on</strong> and € 18 milli<strong>on</strong> deposits from joint ventures as of December 31, <str<strong>on</strong>g><strong>20</strong>09</str<strong>on</strong>g> and as of<br />
December 31, <strong>20</strong>08, respectively.<br />
F - 163
<strong>20</strong>-F Additi<strong>on</strong>al Notes<br />
Other Transacti<strong>on</strong>s<br />
As of December 31, <str<strong>on</strong>g><strong>20</strong>09</str<strong>on</strong>g> positive and negative market values from derivative financial transacti<strong>on</strong>s with<br />
associated companies amounted to € 3.7 billi<strong>on</strong> and € 3.0 billi<strong>on</strong>, respectively. Positive market values from<br />
derivative financial instruments with associated companies were € 390 milli<strong>on</strong> as of December 31, <strong>20</strong>08. The<br />
increase was attributable to changes in the compositi<strong>on</strong> of the Group’s associated companies. Other trans-<br />
acti<strong>on</strong>s with related parties also reflected the following:<br />
Business Relati<strong>on</strong>ships with <strong>Deutsche</strong> Postbank AG: In additi<strong>on</strong> to the acquisiti<strong>on</strong> of an interest in<br />
<strong>Deutsche</strong> Postbank AG, <strong>Deutsche</strong> <strong>Bank</strong> AG signed a cooperati<strong>on</strong> agreement with Postbank. The cooperati<strong>on</strong><br />
agreement encompasses financing and investment products, business banking and commercial loans as well<br />
as customer-oriented services. The agreement also covers sourcing and IT-infrastructure.<br />
Xchanging etb GmbH: The Group holds a stake of 44 % in Xchanging etb GmbH and accounts for it under the<br />
equity method. Xchanging etb GmbH is the holding company of Xchanging Transacti<strong>on</strong> <strong>Bank</strong> GmbH (“XTB”).<br />
Two of the four executive directors of Xchanging etb GmbH and <strong>on</strong>e member of the supervisory board of XTB<br />
are employees of the Group. The Group’s arrangements reached with Xchanging in <strong>20</strong>04 include a 12-year<br />
outsourcing agreement with XTB for security settlement services and are aimed at reducing costs without<br />
compromising service quality. In <str<strong>on</strong>g><strong>20</strong>09</str<strong>on</strong>g> and <strong>20</strong>08, the Group received services from XTB with volume of<br />
€ 104 milli<strong>on</strong> and € 94 milli<strong>on</strong>, respectively. In <str<strong>on</strong>g><strong>20</strong>09</str<strong>on</strong>g> and <strong>20</strong>08, the Group provided supply services (e.g., IT and<br />
real estate-related services) with volumes of € 29 milli<strong>on</strong> and € 26 milli<strong>on</strong>, respectively, to XTB.<br />
Mutual funds: The Group offers clients mutual fund and mutual fund-related products which pay returns linked<br />
to the performance of the assets held in the funds. For all funds the Group determines a projected yield based<br />
<strong>on</strong> current m<strong>on</strong>ey market rates. However, no guarantee or assurance is given that these yields will actually be<br />
achieved. Though the Group is not c<strong>on</strong>tractually obliged to support these funds, it made a decisi<strong>on</strong>, in a number<br />
of cases in which actual yields were lower than originally projected (although still above any guaranteed<br />
thresholds), to support the funds’ target yields by injecting cash of € 16 milli<strong>on</strong> in <str<strong>on</strong>g><strong>20</strong>09</str<strong>on</strong>g> and € <strong>20</strong>7 milli<strong>on</strong> in <strong>20</strong>08.<br />
F - 164
Transacti<strong>on</strong>s with Pensi<strong>on</strong> Plans<br />
Under IFRS, certain post-employment benefit plans are c<strong>on</strong>sidered related parties. The Group has business<br />
relati<strong>on</strong>ships with a number of its pensi<strong>on</strong> plans pursuant to which it provides financial services to these<br />
plans, including investment management services. The Group’s pensi<strong>on</strong> funds may hold or trade <strong>Deutsche</strong><br />
<strong>Bank</strong> shares or securities. A summary of transacti<strong>on</strong>s with related party pensi<strong>on</strong> plans follows.<br />
in € m.<br />
<strong>Deutsche</strong> <strong>Bank</strong> securities held in plan assets:<br />
<str<strong>on</strong>g><strong>20</strong>09</str<strong>on</strong>g> <strong>20</strong>08<br />
Equity shares – –<br />
B<strong>on</strong>ds – –<br />
Other securities 26 4<br />
Total 26 4<br />
Property occupied by/other assets used by <strong>Deutsche</strong> <strong>Bank</strong> – –<br />
Derivatives: Market value for which DB (or subsidiary) is a counterparty 177 335<br />
Derivatives: Noti<strong>on</strong>al amount for which DB (or subsidiary) is a counterparty 11,604 9,172<br />
Fees paid from Fund to any <strong>Deutsche</strong> <strong>Bank</strong> asset manager(s) 21 23<br />
[38] Informati<strong>on</strong> <strong>on</strong> Subsidiaries<br />
<strong>Deutsche</strong> <strong>Bank</strong> AG is the direct or indirect holding company for the Group’s subsidiaries.<br />
Significant Subsidiaries<br />
The following table presents the significant subsidiaries <strong>Deutsche</strong> <strong>Bank</strong> AG owns, directly or indirectly.<br />
Subsidiary Place of Incorporati<strong>on</strong><br />
Taunus Corporati<strong>on</strong> 1 Delaware, United States<br />
<strong>Deutsche</strong> <strong>Bank</strong> Trust Company Americas 2 New York, United States<br />
<strong>Deutsche</strong> <strong>Bank</strong> Securities Inc. 3 Delaware, United States<br />
<strong>Deutsche</strong> <strong>Bank</strong> Luxembourg S.A.4 Luxembourg<br />
<strong>Deutsche</strong> <strong>Bank</strong> Privat- und Geschäftskunden Aktiengesellschaft5 Frankfurt am Main, Germany<br />
DB Capital Markets (Deutschland) GmbH6 Frankfurt am Main, Germany<br />
DWS Investment GmbH 7 Frankfurt am Main, Germany<br />
DB Valoren S.á.r.l.8 Luxembourg<br />
DB Equity S.á.r.l. 9 Luxembourg<br />
1 This company is a holding company for most of the Group’s subsidiaries in the United States.<br />
2 This company is a subsidiary of Taunus Corporati<strong>on</strong>. <strong>Deutsche</strong> <strong>Bank</strong> Trust Company Americas is a New York State-chartered bank which originates<br />
loans and other forms of credit, accepts deposits, arranges financings and provides numerous other commercial banking and financial services.<br />
3 <strong>Deutsche</strong> <strong>Bank</strong> Securities Inc. is a U.S. SEC-registered broker dealer and is a member of the New York Stock Exchange and regulated by the Financial<br />
Industry Regulatory Authority. It is also regulated by the individual state securities authorities in the states in which it operates.<br />
4 The primary business of this company comprises treasury and global market activities, especially as a major supplier of Euro liquidity for <strong>Deutsche</strong> <strong>Bank</strong><br />
Group, the internati<strong>on</strong>al loan business with a specific focus <strong>on</strong> c<strong>on</strong>tinental Europe, and private banking.<br />
5 The company serves private individuals, affluent clients and small business clients with banking products.<br />
6 This company is a German limited liability company and operates as a holding company for a number of European subsidiaries, mainly instituti<strong>on</strong>al and<br />
mutual fund management companies located in Germany, Luxembourg, Austria, Switzerland, Italy, Poland, and Cyprus.<br />
7 This company, in which DB Capital Markets (Deutschland) GmbH indirectly owns 100 % of the equity and voting interests, is a limited liability company<br />
that operates as a mutual fund manager.<br />
8 This company is a holding company for the Group’s subgroups in Australia, New Zealand, and Singapore. It is also the holding company for<br />
DB Equity S.á.r.l.<br />
9 This company is the holding company for the Group’s minority stake in <strong>Deutsche</strong> Postbank AG.<br />
F - 165
<strong>20</strong>-F Additi<strong>on</strong>al Notes<br />
The Group owns 100 % of the equity and voting rights in these significant subsidiaries. They prepare financial<br />
statements as of December 31 and are included in the Group’s c<strong>on</strong>solidated financial statements. Their prin-<br />
cipal countries of operati<strong>on</strong> are the same as their countries of incorporati<strong>on</strong>.<br />
Subsidiaries may have restricti<strong>on</strong>s <strong>on</strong> their ability to transfer funds, including payment of dividends and<br />
repayment of loans, to <strong>Deutsche</strong> <strong>Bank</strong> AG. Reas<strong>on</strong>s for the restricti<strong>on</strong>s include:<br />
— Central bank restricti<strong>on</strong>s relating to local exchange c<strong>on</strong>trol laws<br />
— Central bank capital adequacy requirements<br />
— Local corporate laws, for example limitati<strong>on</strong>s regarding the transfer of funds to the parent when the<br />
respective entity has a loss carried forward not covered by retained earnings or other comp<strong>on</strong>ents of<br />
capital.<br />
Subsidiaries where the Group owns 50 percent or less of the Voting Rights<br />
The Group also c<strong>on</strong>solidates certain subsidiaries although it owns 50 percent or less of the voting rights. Most<br />
of those subsidiaries are special purpose entities (“SPEs”) that are sp<strong>on</strong>sored by the Group for a variety of<br />
purposes.<br />
In the normal course of business, the Group becomes involved with SPEs, primarily through the following<br />
types of transacti<strong>on</strong>s: asset securitizati<strong>on</strong>s, commercial paper programs, repackaging and investment products,<br />
mutual funds, structured transacti<strong>on</strong>s, leasing and closed-end funds. The Group’s involvement includes<br />
transferring assets to the entities, entering into derivative c<strong>on</strong>tracts with them, providing credit enhancement<br />
and liquidity facilities, providing investment management and administrative services, and holding ownership<br />
or other investment interests in the entities.<br />
Investees where the Group owns more than half of the Voting Rights<br />
The Group owns directly or indirectly more than half of the voting rights of investees but does not have c<strong>on</strong>trol<br />
over these investees when<br />
— another investor has the power over more than half of the voting rights by virtue of an agreement with the<br />
Group, or<br />
— another investor has the power to govern the financial and operating policies of the investee under a<br />
statute or an agreement, or<br />
— another investor has the power to appoint or remove the majority of the members of the board of directors<br />
or equivalent governing body and the investee is c<strong>on</strong>trolled by that board or body, or when<br />
— another investor has the power to cast the majority of votes at meetings of the board of directors or<br />
equivalent governing body and c<strong>on</strong>trol of the entity is by that board or body.<br />
F - 166
The “List of Shareholdings <str<strong>on</strong>g><strong>20</strong>09</str<strong>on</strong>g>” is published as a separate document and deposited with the German<br />
Electr<strong>on</strong>ic Federal Gazette (“elektr<strong>on</strong>ischer Bundesanzeiger”). It is available in the Investor Relati<strong>on</strong>s secti<strong>on</strong><br />
of <strong>Deutsche</strong> <strong>Bank</strong>’s website (http://www.deutsche-bank.de/ir/en/c<strong>on</strong>tent/reports.htm), but can also be ordered<br />
free of charge.<br />
[39] Insurance and Investment C<strong>on</strong>tracts<br />
Liabilities arising from Insurance and Investment C<strong>on</strong>tracts<br />
Dec 31, <str<strong>on</strong>g><strong>20</strong>09</str<strong>on</strong>g> Dec 31, <strong>20</strong>08<br />
in € m. Gross Reinsurance Net Gross Reinsurance Net<br />
Insurance c<strong>on</strong>tracts 4,613 (1,534) 3,079 3,963 (1,407) 2,556<br />
Investment c<strong>on</strong>tracts 7,278 – 7,278 5,977 – 5,977<br />
Total 11,891 (1,534) 10,357 9,940 (1,407) 8,533<br />
Generally, amounts relating to reinsurance c<strong>on</strong>tracts are reported gross unless they have an immaterial<br />
impact to their respective balance sheet line items. In the table above, reinsurance amounts are shown gross.<br />
Carrying Amount<br />
The following table presents an analysis of the change in insurance and investment c<strong>on</strong>tracts liabilities.<br />
in € m.<br />
Included in Other changes in existing business for the investment c<strong>on</strong>tracts is € 1,145 milli<strong>on</strong> and<br />
€ (935) milli<strong>on</strong> attributable to changes in the underlying assets’ fair value for the years ended December 31,<br />
<str<strong>on</strong>g><strong>20</strong>09</str<strong>on</strong>g> and December 31, <strong>20</strong>08, respectively.<br />
Key Assumpti<strong>on</strong>s in relati<strong>on</strong> to Insurance Business<br />
The liabilities will vary with movements in interest rates, which are applicable, in particular, to the cost of<br />
guaranteed benefits payable in the future, investment returns and the cost of life assurance and annuity benefits<br />
where future mortality is uncertain.<br />
F - 167<br />
Insurance<br />
c<strong>on</strong>tracts<br />
Investment<br />
c<strong>on</strong>tracts<br />
<str<strong>on</strong>g><strong>20</strong>09</str<strong>on</strong>g> <strong>20</strong>08<br />
Insurance<br />
c<strong>on</strong>tracts<br />
Investment<br />
c<strong>on</strong>tracts<br />
Balance, beginning of year 3,963 5,977 6,450 9,796<br />
New business 121 171 236 158<br />
Claims paid (285) (549) (405) (618)<br />
Other changes in existing business 427 1,145 (850) (935)<br />
Exchange rate changes 387 534 (1,468) (2,424)<br />
Balance, end of year 4,613 7,278 3,963 5,977
<strong>20</strong>-F Additi<strong>on</strong>al Notes<br />
Assumpti<strong>on</strong>s are made related to all material factors affecting future cash flows, including future interest<br />
rates, mortality and costs. The assumpti<strong>on</strong>s to which the l<strong>on</strong>g term business amount is most sensitive are the<br />
interest rates used to discount the cash flows and the mortality assumpti<strong>on</strong>s, particularly those for annuities.<br />
The assumpti<strong>on</strong>s are set out below:<br />
Interest Rates<br />
Interest rates are used that reflect a best estimate of future investment returns taking into account the nature<br />
and term of the assets used to support the liabilities. Suitable margins for default risk are allowed for in the<br />
assumed interest rate.<br />
Mortality<br />
Mortality rates are based <strong>on</strong> published tables, adjusted appropriately to take into account changes in the<br />
underlying populati<strong>on</strong> mortality since the table was published, company experience and forecast changes in<br />
future mortality. If appropriate, a margin is added to assurance mortality rates to allow for adverse future<br />
deviati<strong>on</strong>s. Annuitant mortality rates are adjusted to make allowance for future improvements in pensi<strong>on</strong>er<br />
l<strong>on</strong>gevity. Improvements in annuitant mortality are based <strong>on</strong> a percentage of the medium cohort projecti<strong>on</strong><br />
subject to a minimum of rate of improvement of 1.25 % per annum.<br />
Costs<br />
For n<strong>on</strong>-linked c<strong>on</strong>tracts, allowance is made explicitly for future expected per policy costs.<br />
Other Assumpti<strong>on</strong>s<br />
The take-up rate of guaranteed annuity rate opti<strong>on</strong>s <strong>on</strong> pensi<strong>on</strong> business is assumed as 60 % for the years<br />
ended December 31, <str<strong>on</strong>g><strong>20</strong>09</str<strong>on</strong>g> and December 31, <strong>20</strong>08.<br />
Key Assumpti<strong>on</strong>s impacting Value of Business Acquired (VOBA)<br />
The opening VOBA arising <strong>on</strong> the purchase of Abbey Life Assurance Company Limited was determined by<br />
capitalizing the present value of the future cash flows of the business over the reported liability at the date<br />
of acquisiti<strong>on</strong>. If assumpti<strong>on</strong>s were required about future mortality, morbidity, persistency and expenses, they<br />
were determined <strong>on</strong> a best estimate basis taking into account the business’s own experience. General ec<strong>on</strong>omic<br />
assumpti<strong>on</strong>s were set c<strong>on</strong>sidering the ec<strong>on</strong>omic indicators at the date of acquisiti<strong>on</strong>.<br />
F - 168
The rate of VOBA amortizati<strong>on</strong> is determined by c<strong>on</strong>sidering the profile of the business acquired and the<br />
expected depleti<strong>on</strong> in future value. At the end of each accounting period, the remaining VOBA is tested<br />
against the future net profit expected related to the business that was in force at the date of acquisiti<strong>on</strong>.<br />
If there is insufficient net profit, the VOBA will be written down to its supportable value.<br />
Key Changes in Assumpti<strong>on</strong>s<br />
Up<strong>on</strong> acquisiti<strong>on</strong> of Abbey Life Assurance Company Limited in October <strong>20</strong>07, liabilities for insurance c<strong>on</strong>tracts<br />
were recalculated from a U.K. GAAP to a U.S. GAAP best estimate basis in line with the provisi<strong>on</strong>s of IFRS 4.<br />
The n<strong>on</strong>ec<strong>on</strong>omic assumpti<strong>on</strong>s set at that time have not been changed but the ec<strong>on</strong>omic assumpti<strong>on</strong>s have<br />
been reviewed in line with changes in key ec<strong>on</strong>omic indicators. For annuity c<strong>on</strong>tracts, the liability was valued<br />
using the locked-in basis determined at the date of acquisiti<strong>on</strong>.<br />
Sensitivity Analysis (in respect of Insurance C<strong>on</strong>tracts <strong>on</strong>ly)<br />
The following table presents the sensitivity of the Group’s profit before tax and equity to changes in some of<br />
the key assumpti<strong>on</strong>s used for insurance c<strong>on</strong>tract liability calculati<strong>on</strong>s. For each sensitivity test, the impact of a<br />
reas<strong>on</strong>ably possible change in a single factor is shown with other assumpti<strong>on</strong>s left unchanged.<br />
Impact <strong>on</strong> profit before tax Impact <strong>on</strong> equity<br />
in € m. <str<strong>on</strong>g><strong>20</strong>09</str<strong>on</strong>g> <strong>20</strong>08 <str<strong>on</strong>g><strong>20</strong>09</str<strong>on</strong>g> <strong>20</strong>08<br />
Variable:<br />
Mortality1 (worsening by ten percent) (11) (12) (11) (12)<br />
Renewal expense (ten percent increase) (2) (1) (2) (1)<br />
Interest rate (<strong>on</strong>e percent increase) (1) (6) (158) (142)<br />
1 The impact of mortality assumes a ten percent decrease in annuitant mortality and a ten percent increase in mortality for other business.<br />
For certain insurance c<strong>on</strong>tracts, the underlying valuati<strong>on</strong> basis c<strong>on</strong>tains a Provisi<strong>on</strong> for Adverse Deviati<strong>on</strong>s<br />
(“PADs”). For these c<strong>on</strong>tracts, under U.S. GAAP, any worsening of expected future experience would not<br />
change the level of reserves held until all the PADs have been eroded while any improvement in experience<br />
would not result in an increase to these reserves. Therefore, in the sensitivity analysis, if the variable change<br />
represents a worsening of experience, the impact shown represents the excess of the best estimate liability<br />
over the PADs held at the balance sheet date. As a result, the figures disclosed in this table should not be<br />
used to imply the impact of a different level of change, and it should not be assumed that the impact would<br />
be the same if the change occurred at a different point in time.<br />
F - 169
<strong>20</strong>-F Additi<strong>on</strong>al Notes<br />
[40] Current and N<strong>on</strong>-Current Assets and Liabilities<br />
The following tables present an analysis of each asset and liability line item by amounts recovered or settled<br />
within or after <strong>on</strong>e year as of December 31, <str<strong>on</strong>g><strong>20</strong>09</str<strong>on</strong>g> and December 31, <strong>20</strong>08.<br />
Asset items as of December 31, <str<strong>on</strong>g><strong>20</strong>09</str<strong>on</strong>g>, follow.<br />
in € m.<br />
Liability items as of December 31, <str<strong>on</strong>g><strong>20</strong>09</str<strong>on</strong>g>, follow.<br />
F - 170<br />
Amounts recovered or settled Total<br />
within <strong>on</strong>e<br />
year<br />
after <strong>on</strong>e<br />
year Dec 31, <str<strong>on</strong>g><strong>20</strong>09</str<strong>on</strong>g><br />
Cash and due from banks 9,346 – 9,346<br />
Interest-earning deposits with banks 46,383 850 47,233<br />
Central bank funds sold and securities purchased under resale agreements 6,587 233 6,8<strong>20</strong><br />
Securities borrowed 43,509 – 43,509<br />
Financial assets at fair value through profit or loss 943,143 22,177 965,3<strong>20</strong><br />
Financial assets available for sale 3,605 15,214 18,819<br />
Equity method investments – 7,788 7,788<br />
Loans 93,781 164,324 258,105<br />
Property and equipment – 2,777 2,777<br />
Goodwill and other intangible assets – 10,169 10,169<br />
Other assets 113,255 8,283 121,538<br />
Assets for current tax 1,247 843 2,090<br />
Total assets before deferred tax assets 1,260,856 232,658 1,493,514<br />
Deferred tax assets 7,150<br />
Total assets 1,500,664<br />
in € m.<br />
Amounts recovered or settled Total<br />
within <strong>on</strong>e<br />
year<br />
after <strong>on</strong>e<br />
year Dec 31, <str<strong>on</strong>g><strong>20</strong>09</str<strong>on</strong>g><br />
Deposits 310,805 33,415 344,2<strong>20</strong><br />
Central bank funds purchased and securities sold under repurchase agreements 45,453 42 45,495<br />
Securities loaned 5,098 466 5,564<br />
Financial liabilities at fair value through profit or loss 702,804 19,470 722,274<br />
Other short-term borrowings 42,897 – 42,897<br />
Other liabilities 147,506 6,775 154,281<br />
Provisi<strong>on</strong>s 1,307 – 1,307<br />
Liabilities for current tax 729 1,412 2,141<br />
L<strong>on</strong>g-term debt 18,895 112,887 131,782<br />
Trust preferred securities 746 9,831 10,577<br />
Obligati<strong>on</strong> to purchase comm<strong>on</strong> shares – – –<br />
Total liabilities before deferred tax liabilities 1,276,240 184,298 1,460,538<br />
Deferred tax liabilities 2,157<br />
Total liabilities 1,462,695
Asset items as of December 31, <strong>20</strong>08, follow.<br />
in € m.<br />
Liability items as of December 31, <strong>20</strong>08, follow.<br />
F - 171<br />
Amounts recovered or settled Total<br />
within <strong>on</strong>e<br />
year<br />
after <strong>on</strong>e<br />
year Dec 31, <strong>20</strong>08<br />
Cash and due from banks 9,826 – 9,826<br />
Interest-earning deposits with banks 63,900 839 64,739<br />
Central bank funds sold and securities purchased under resale agreements 8,671 596 9,267<br />
Securities borrowed 35,016 6 35,022<br />
Financial assets at fair value through profit or loss 1,598,362 25,449 1,623,811<br />
Financial assets available for sale 7,586 17,249 24,835<br />
Equity method investments – 2,242 2,242<br />
Loans 103,436 165,845 269,281<br />
Property and equipment – 3,712 3,712<br />
Goodwill and other intangible assets – 9,877 9,877<br />
Other assets 135,408 2,421 137,829<br />
Assets for current tax 3,217 295 3,512<br />
Total assets before deferred tax assets 1,965,422 228,531 2,193,953<br />
Deferred tax assets 8,470<br />
Total assets 2,<strong>20</strong>2,423<br />
in € m.<br />
Amounts recovered or settled Total<br />
within <strong>on</strong>e<br />
year<br />
after <strong>on</strong>e<br />
year Dec 31, <strong>20</strong>08<br />
Deposits 360,298 35,255 395,553<br />
Central bank funds purchased and securities sold under repurchase agreements 84,481 2,636 87,117<br />
Securities loaned 3,<strong>20</strong>6 10 3,216<br />
Financial liabilities at fair value through profit or loss 1,308,128 25,637 1,333,765<br />
Other short-term borrowings 39,115 – 39,115<br />
Other liabilities 157,750 2,848 160,598<br />
Provisi<strong>on</strong>s 1,418 – 1,418<br />
Liabilities for current tax 1,086 1,268 2,354<br />
L<strong>on</strong>g-term debt 22,225 111,631 133,856<br />
Trust preferred securities 983 8,746 9,729<br />
Obligati<strong>on</strong> to purchase comm<strong>on</strong> shares 4 – 4<br />
Total liabilities before deferred tax liabilities 1,978,694 188,031 2,166,725<br />
Deferred tax liabilities 3,784<br />
Total liabilities 2,170,509
<strong>20</strong>-F Additi<strong>on</strong>al Notes<br />
[41] C<strong>on</strong>densed <strong>Deutsche</strong> <strong>Bank</strong> AG (Parent Company <strong>on</strong>ly) Financial Statements<br />
C<strong>on</strong>densed Statement of Income<br />
in € m. <str<strong>on</strong>g><strong>20</strong>09</str<strong>on</strong>g> <strong>20</strong>08 <strong>20</strong>07<br />
Interest income, excluding dividends from subsidiaries<br />
Dividends received from subsidiaries:<br />
16,732 38,239 45,695<br />
<strong>Bank</strong> subsidiaries 456 2,221 1,003<br />
N<strong>on</strong>bank subsidiaries 1,772 2,251 914<br />
Interest expense 13,008 36,015 42,834<br />
Net interest and dividend income 5,952 6,696 4,778<br />
Provisi<strong>on</strong> for credit losses 2,390 259 85<br />
Net interest and dividend income after provisi<strong>on</strong> for credit losses<br />
N<strong>on</strong>interest income:<br />
3,562 6,437 4,693<br />
Commissi<strong>on</strong>s and fee income 3,358 3,163 3,988<br />
Net gains (losses) <strong>on</strong> financial assets/liabilities at fair value through profit or loss 3,842 (3,607) 8,023<br />
Other income (753) (<strong>20</strong>6) (591)<br />
Total n<strong>on</strong>interest income<br />
N<strong>on</strong>interest expenses:<br />
6,447 (650) 11,4<strong>20</strong><br />
Compensati<strong>on</strong> and benefits 5,553 4,552 6,748<br />
Other expenses 4,126 3,917 4,153<br />
Services provided by (to) affiliates, net 81 (370) (496)<br />
Total n<strong>on</strong>interest expenses 9,760 8,099 10,405<br />
Income (loss) before income taxes 249 (2,312) 5,708<br />
Income tax expense (benefit) (932) (1,356) 2,214<br />
Net income (loss) attributable to <strong>Deutsche</strong> <strong>Bank</strong> shareholders 1,181 (956) 3,494<br />
F - 172
C<strong>on</strong>densed Balance Sheet<br />
in € m. Dec 31, <str<strong>on</strong>g><strong>20</strong>09</str<strong>on</strong>g> Dec 31, <strong>20</strong>08<br />
Assets:<br />
Cash and due from banks:<br />
<strong>Bank</strong> subsidiaries 279 227<br />
Other<br />
Interest-earning deposits with banks:<br />
5,790 5,862<br />
<strong>Bank</strong> subsidiaries 62,314 54,956<br />
Other<br />
Central bank funds sold, securities purchased under resale agreements, securities borrowed:<br />
26,450 31,240<br />
<strong>Bank</strong> subsidiaries 235 42<br />
N<strong>on</strong>bank subsidiaries <strong>20</strong>,926 36,060<br />
Other<br />
Financial assets at fair value through profit or loss:<br />
22,264 14,878<br />
<strong>Bank</strong> subsidiaries 6,701 5,990<br />
N<strong>on</strong>bank subsidiaries 40,991 80,512<br />
Other 758,800 1,357,840<br />
Financial assets available for sale 11,128 16,271<br />
Equity method investments<br />
Investment in subsidiaries:<br />
588 494<br />
<strong>Bank</strong> subsidiaries 8,653 6,121<br />
N<strong>on</strong>bank subsidiaries<br />
Loans:<br />
35,<strong>20</strong>8 36,112<br />
<strong>Bank</strong> subsidiaries 15,811 22,336<br />
N<strong>on</strong>bank subsidiaries 89,118 99,808<br />
Other<br />
Other assets:<br />
107,354 112,651<br />
<strong>Bank</strong> subsidiaries 1,943 3,284<br />
N<strong>on</strong>bank subsidiaries 33,327 33,113<br />
Other 93,893 1<strong>20</strong>,433<br />
Total assets<br />
Liabilities and shareholders’ equity:<br />
1,341,773 2,038,230<br />
Deposits:<br />
<strong>Bank</strong> subsidiaries 86,764 93,115<br />
N<strong>on</strong>bank subsidiaries 61,014 72,040<br />
Other<br />
Central bank funds purchased, securities sold under repurchase agreements and securities loaned:<br />
<strong>20</strong>5,<strong>20</strong>6 246,987<br />
<strong>Bank</strong> subsidiaries 2,817 3,710<br />
N<strong>on</strong>bank subsidiaries 16,371 15,571<br />
Other<br />
Financial liabilities at fair value through profit or loss:<br />
11,319 24,652<br />
<strong>Bank</strong> subsidiaries 7,913 6,116<br />
N<strong>on</strong>bank subsidiaries 38,2<strong>20</strong> 80,081<br />
Other<br />
Other short-term borrowings:<br />
597,165 1,175,983<br />
<strong>Bank</strong> subsidiaries 285 323<br />
N<strong>on</strong>bank subsidiaries 171 10,169<br />
Other<br />
Other liabilities:<br />
21,455 7,164<br />
<strong>Bank</strong> subsidiaries 1,883 1,634<br />
N<strong>on</strong>bank subsidiaries 15,176 11,946<br />
Other 104,662 124,060<br />
L<strong>on</strong>g-term debt 145,606 141,051<br />
Total liabilities 1,316,027 2,014,602<br />
Total shareholders’ equity 25,746 23,628<br />
Total liabilities and shareholders’ equity 1,341,773 2,038,230<br />
F - 173
<strong>20</strong>-F Additi<strong>on</strong>al Notes<br />
C<strong>on</strong>densed Statement of Cash Flows<br />
in € m. <str<strong>on</strong>g><strong>20</strong>09</str<strong>on</strong>g> <strong>20</strong>08 <strong>20</strong>07<br />
Net income (loss)<br />
Cash flows from operating activities:<br />
Adjustments to rec<strong>on</strong>cile net income to net cash provided by (used in) operating<br />
activities:<br />
1,181 (956) 3,494<br />
Provisi<strong>on</strong> for credit losses 2,390 259 85<br />
Restructuring activities<br />
Gain <strong>on</strong> sale of financial assets available for sale, equity method investments,<br />
– – (6)<br />
and other (138) (266) (336)<br />
Deferred income taxes, net (856) (491) (543)<br />
Impairment, depreciati<strong>on</strong> and other amortizati<strong>on</strong>, and accreti<strong>on</strong> 1,094 2,928 1,558<br />
Income (loss) adjusted for n<strong>on</strong>cash charges, credits and other items<br />
Adjustments for net change in operating assets and liabilities:<br />
3,671 1,474 4,252<br />
Interest-earning time deposits with banks<br />
Central bank funds sold, securities purchased under resale agreements, securities<br />
(3,696) 7,624 2,017<br />
borrowed 7,615 57,767 (8,786)<br />
Trading assets and positive market values from derivative financial instruments 638,445 (545,176) (<strong>20</strong>9,066)<br />
Financial assets designated at fair value through profit or loss 4,131 72,919 (30,631)<br />
Loans 24,629 (10,324) (28,227)<br />
Other assets 16,304 36,859 (50,562)<br />
Deposits (59,140) (80,267) 42,579<br />
Trading liabilities and negative market values from derivative financial instruments<br />
Financial liabilities designated at fair value through profit or loss and investment<br />
(613,041) 636,835 175,300<br />
c<strong>on</strong>tract liabilities<br />
Central bank funds purchased, securities sold under repurchase agreements,<br />
(8,234) (89,678) 48,256<br />
securities loaned (13,425) (50,407) 11,461<br />
Other short-term borrowings 4,255 1,633 1,547<br />
Other liabilities (7,362) (11,925) 28,806<br />
Senior l<strong>on</strong>g-term debt 3,872 8,389 26,281<br />
Other, net 154 45 (184)<br />
Net cash provided by (used in) operating activities<br />
Cash flows from investing activities:<br />
Proceeds from:<br />
(1,822) 35,768 13,043<br />
Sale of financial assets available for sale 4,359 6,270 4,<strong>20</strong>1<br />
Maturities of financial assets available for sale 6,499 15,878 4,311<br />
Sale of equity method investments 168 218 769<br />
Sale of property and equipment<br />
Purchase of:<br />
10 7 134<br />
Financial assets available for sale (6,891) (26,496) (6,713)<br />
Equity method investments (291) (301) (242)<br />
Property and equipment (424) (348) (342)<br />
Net change in investments in subsidiaries (2,189) (2,187) (1,666)<br />
Other, net (137) (15) (8)<br />
Net cash provided by (used in) investing activities<br />
Cash flows from financing activities:<br />
1,104 (6,974) 444<br />
Issuances of subordinated l<strong>on</strong>g-term debt 1,677 22 2,343<br />
Repayments and extinguishments of subordinated l<strong>on</strong>g-term debt (1,044) (<strong>20</strong>3) (1,989)<br />
Comm<strong>on</strong> shares issued under share-based compensati<strong>on</strong> plans – 19 389<br />
Capital increase – 2,<strong>20</strong>0 –<br />
Purchases of treasury shares (19,189) (21,708) (41,128)<br />
Sale of treasury shares 18,070 21,400 39,729<br />
Cash dividends paid (309) (2,274) (2,005)<br />
Net cash provided by (used in) financing activities (795) (544) (2,661)<br />
Net effect of exchange rate changes <strong>on</strong> cash and cash equivalents 365 (125) (109)<br />
Net increase (decrease) in cash and cash equivalents (1,148) 28,125 10,717<br />
Cash and cash equivalents at beginning of period 60,263 32,138 21,421<br />
Cash and cash equivalents at end of period<br />
Net cash provided by (used in) operating activities include<br />
59,115 60,263 32,138<br />
Income taxes paid (received), net (1,082) (1,923) 1,728<br />
Interest paid 14,295 37,191 42,855<br />
Interest and dividends received<br />
Cash and cash equivalents comprise<br />
21,017 44,524 47,612<br />
Cash and due from banks<br />
Interest-earning demand deposits with banks (not included: time deposits of € 35,718 m.<br />
6,069 6,089 4,245<br />
at December 31, <str<strong>on</strong>g><strong>20</strong>09</str<strong>on</strong>g> and € 32,022 m. and € 40,710 m. at December 31, <strong>20</strong>08 and <strong>20</strong>07) 53,046 54,174 27,893<br />
Total 59,115 60,263 32,138<br />
F - 174
The following table presents the Parent Company’s l<strong>on</strong>g-term debt.<br />
By remaining maturities Due in Due in Due in Due in Due in Due after Dec 31, <str<strong>on</strong>g><strong>20</strong>09</str<strong>on</strong>g> Dec 31, <strong>20</strong>08<br />
in € m.<br />
Senior debt:<br />
B<strong>on</strong>ds and notes:<br />
<strong>20</strong>10<br />
<strong>20</strong>11<br />
<strong>20</strong>12<br />
<strong>20</strong>13<br />
<strong>20</strong>14<br />
<strong>20</strong>14<br />
Total<br />
Total<br />
Fixed rate 5,<strong>20</strong>0 11,6<strong>20</strong> 12,850 9,237 9,613 31,215 79,735 77,492<br />
Floating rate<br />
Subordinated debt<br />
B<strong>on</strong>ds and notes:<br />
9,989 7,980 6,233 3,694 4,162 16,265 48,323 46,694<br />
Fixed rate 1,931 619 1,532 2,166 483 6,586 13,317 12,366<br />
Floating rate 2,584 624 626 45 <strong>20</strong>3 149 4,231 4,499<br />
Total l<strong>on</strong>g-term debt 19,704 <strong>20</strong>,843 21,241 15,142 14,461 54,215 145,606 141,051<br />
[42] C<strong>on</strong>densed C<strong>on</strong>solidating Financial Informati<strong>on</strong><br />
On June 4, 1999, <strong>Deutsche</strong> <strong>Bank</strong>, acting through a subsidiary, acquired all outstanding shares of<br />
<strong>Deutsche</strong> <strong>Bank</strong> Trust Corporati<strong>on</strong> (formerly <strong>Bank</strong>ers Trust Corporati<strong>on</strong>), a bank holding company headquartered<br />
in New York. <strong>Deutsche</strong> <strong>Bank</strong> c<strong>on</strong>ducts some of its activities in the United States through <strong>Deutsche</strong> <strong>Bank</strong><br />
Trust Corporati<strong>on</strong> and its subsidiaries (“DBTC”). On July 10, <strong>20</strong>02, <strong>Deutsche</strong> <strong>Bank</strong> issued full and unc<strong>on</strong>diti<strong>on</strong>al<br />
guarantees of DBTC’s outstanding SEC-registered obligati<strong>on</strong>s. DBTC is a wholly-owned subsidiary of<br />
<strong>Deutsche</strong> <strong>Bank</strong>. Set forth below is c<strong>on</strong>densed c<strong>on</strong>solidating financial informati<strong>on</strong> regarding the Parent, DBTC<br />
and other subsidiaries of <strong>Deutsche</strong> <strong>Bank</strong> <strong>on</strong> a combined basis.<br />
<strong>Deutsche</strong> <strong>Bank</strong> AG has, via several subsidiaries, issued “trust preferred” securities that are listed <strong>on</strong> the New<br />
York Stock Exchange. In each such transacti<strong>on</strong>, an indirect wholly-owned subsidiary of <strong>Deutsche</strong> <strong>Bank</strong> AG<br />
organized in the form of a Delaware business trust (the “Trust”) issues trust preferred securities (the “Trust<br />
Preferred Securities”) in a public offering in the United States. All the proceeds from the sale of the Trust<br />
Preferred Securities are invested by the Trust in the Class B Preferred Securities (the “Class B Preferred<br />
Securities”) of a sec<strong>on</strong>d wholly-owned subsidiary of <strong>Deutsche</strong> <strong>Bank</strong> AG organized in the form of a limited<br />
liability company (the “LLC”). The LLC uses all the proceeds from the sale of the Class B Preferred Securities<br />
to the Trust to purchase a debt obligati<strong>on</strong> from <strong>Deutsche</strong> <strong>Bank</strong> AG (the “Debt Obligati<strong>on</strong>”). The distributi<strong>on</strong>s <strong>on</strong><br />
the Class B Preferred Securities match those of the Trust Preferred Securities. The Trust Preferred Securities<br />
and the Class B Preferred Securities pay distributi<strong>on</strong>s quarterly in arrears and are redeemable <strong>on</strong>ly up<strong>on</strong> the<br />
occurrence of certain events specified in the documents governing the terms of those securities. Subject to<br />
limited excepti<strong>on</strong>s, the Class B Preferred Securities generally cannot be redeemed until at least five or 10 years<br />
after their issuance. The Trust Preferred Securities and the Class B Preferred Securities are each subject to a<br />
full and unc<strong>on</strong>diti<strong>on</strong>al subordinated guarantee of <strong>Deutsche</strong> <strong>Bank</strong> AG. These subordinated guarantees are<br />
general and unsecured obligati<strong>on</strong>s of <strong>Deutsche</strong> <strong>Bank</strong> AG and rank, both as to payment and in liquidati<strong>on</strong> of<br />
<strong>Deutsche</strong> <strong>Bank</strong> AG, junior in priority of payment to all current and future indebtedness of <strong>Deutsche</strong> <strong>Bank</strong> AG<br />
and <strong>on</strong> parity in priority of payment with the most senior preference shares, if any, of <strong>Deutsche</strong> <strong>Bank</strong> AG. The<br />
F - 175
<strong>20</strong>-F Additi<strong>on</strong>al Notes<br />
Group treats the Class B Preferred Securities of the LLC as Tier 1 or Upper Tier 2 regulatory capital <strong>on</strong> a<br />
c<strong>on</strong>solidated basis. In the following <str<strong>on</strong>g><strong>20</strong>09</str<strong>on</strong>g> c<strong>on</strong>densed c<strong>on</strong>solidating balance sheet, a total of € 4.6 billi<strong>on</strong> of the<br />
l<strong>on</strong>g-term debt of the Parent and <strong>Deutsche</strong> <strong>Bank</strong> AG C<strong>on</strong>solidated represents the Debt Obligati<strong>on</strong>s issued by<br />
<strong>Deutsche</strong> <strong>Bank</strong> AG to the LLC in these transacti<strong>on</strong>s.<br />
Each such issuance of Trust Preferred Securities is described in the table below.<br />
Trust LLC Issuance Date Earliest<br />
Redempti<strong>on</strong> Date<br />
1 Amount of l<strong>on</strong>g-term debt of the Parent and <strong>Deutsche</strong> <strong>Bank</strong> AG C<strong>on</strong>solidated represented by the Debt Obligati<strong>on</strong>s issued by <strong>Deutsche</strong> <strong>Bank</strong> AG to the<br />
applicable LLC, as of December 31, <str<strong>on</strong>g><strong>20</strong>09</str<strong>on</strong>g>.<br />
F - 176<br />
Parent L<strong>on</strong>gterm<br />
Debt 1<br />
<strong>Deutsche</strong> <strong>Bank</strong> Capital Funding Trust VIII <strong>Deutsche</strong> <strong>Bank</strong> Capital Funding<br />
LLC VIII October 18, <strong>20</strong>06 October 18, <strong>20</strong>11 € 4<strong>20</strong> milli<strong>on</strong><br />
<strong>Deutsche</strong> <strong>Bank</strong> C<strong>on</strong>tingent Capital Trust II <strong>Deutsche</strong> <strong>Bank</strong> C<strong>on</strong>tingent<br />
Capital LLC II May 23, <strong>20</strong>07 May 23, <strong>20</strong>17 € 559 milli<strong>on</strong><br />
<strong>Deutsche</strong> <strong>Bank</strong> Capital Funding Trust IX <strong>Deutsche</strong> <strong>Bank</strong> Capital Funding<br />
LLC IX July <strong>20</strong>, <strong>20</strong>07 August <strong>20</strong>, <strong>20</strong>12 € 804 milli<strong>on</strong><br />
<strong>Deutsche</strong> <strong>Bank</strong> Capital Funding Trust X <strong>Deutsche</strong> <strong>Bank</strong> Capital Funding<br />
LLC X November 15, <strong>20</strong>07 December 15, <strong>20</strong>12 € 563 milli<strong>on</strong><br />
<strong>Deutsche</strong> <strong>Bank</strong> C<strong>on</strong>tingent Capital Trust III <strong>Deutsche</strong> <strong>Bank</strong> C<strong>on</strong>tingent<br />
Capital LLC III February <strong>20</strong>, <strong>20</strong>08 February <strong>20</strong>, <strong>20</strong>18 € 1,381 milli<strong>on</strong><br />
<strong>Deutsche</strong> <strong>Bank</strong> C<strong>on</strong>tingent Capital Trust V <strong>Deutsche</strong> <strong>Bank</strong> C<strong>on</strong>tingent<br />
Capital LLC V May 9, <strong>20</strong>08 June 30, <strong>20</strong>18 € 884 milli<strong>on</strong>
C<strong>on</strong>densed C<strong>on</strong>solidating Statement of Income<br />
<str<strong>on</strong>g><strong>20</strong>09</str<strong>on</strong>g> Parent DBTC Other subC<strong>on</strong>solidat- <strong>Deutsche</strong><br />
sidiariesing entries <strong>Bank</strong> AG<br />
in € m.<br />
Net interest income:<br />
c<strong>on</strong>solidated<br />
Interest income, including dividends from subsidiaries 18,960 733 24,744 (17,484) 26,953<br />
Interest expense 13,008 274 14,194 (12,982) 14,494<br />
Net interest and dividend income 5,952 459 10,550 (4,502) 12,459<br />
Provisi<strong>on</strong> for credit losses<br />
Net interest and dividend income after provisi<strong>on</strong><br />
2,390 158 1,012 (930) 2,630<br />
for credit losses<br />
N<strong>on</strong>interest income:<br />
3,562 301 9,538 (3,572) 9,829<br />
Commissi<strong>on</strong>s and fee income<br />
Net gains (losses) <strong>on</strong> financial assets/liabilities<br />
3,358 582 4,971 – 8,911<br />
at fair value through profit or loss 3,842 (25) 3,447 (155) 7,109<br />
Net gains (losses) <strong>on</strong> financial assets available for sale (219) 2 (334) 148 (403)<br />
Other income (534) 30 (83) 463 (124)<br />
Total n<strong>on</strong>interest income<br />
N<strong>on</strong>interest expenses:<br />
6,447 589 8,001 456 15,493<br />
Compensati<strong>on</strong> and benefits 5,553 429 5,328 – 11,310<br />
Other expenses 4,<strong>20</strong>7 225 4,990 (612) 8,810<br />
Total n<strong>on</strong>interest expenses 9,760 654 10,318 (612) <strong>20</strong>,1<strong>20</strong><br />
Income (loss) before income taxes 249 236 7,221 (2,504) 5,<strong>20</strong>2<br />
Income tax expense (benefit) (932) 132 1,039 5 244<br />
Net income (loss) 1,181 104 6,182 (2,509) 4,958<br />
Net income (loss) attributable to minority interest<br />
Net income (loss) attributable to <strong>Deutsche</strong> <strong>Bank</strong><br />
– 2 (2) (15) (15)<br />
shareholders 1,181 102 6,184 (2,494) 4,973<br />
F - 177
<strong>20</strong>-F Additi<strong>on</strong>al Notes<br />
<strong>20</strong>08<br />
in € m.<br />
Parent DBTC Other subsidiaries<br />
Net interest income:<br />
F - 178<br />
C<strong>on</strong>solidating<br />
entries<br />
<strong>Deutsche</strong><br />
<strong>Bank</strong> AG<br />
c<strong>on</strong>solidated<br />
Interest income, including dividends from subsidiaries 42,711 1,307 43,2<strong>20</strong> (32,689) 54,549<br />
Interest expense 36,015 809 30,759 (25,487) 42,096<br />
Net interest and dividend income 6,696 498 12,461 (7,<strong>20</strong>2) 12,453<br />
Provisi<strong>on</strong> for credit losses 259 15 802 – 1,076<br />
Net interest and dividend income after provisi<strong>on</strong><br />
for credit losses 6,437 483 11,659 (7,<strong>20</strong>2) 11,377<br />
N<strong>on</strong>interest income:<br />
Commissi<strong>on</strong>s and fee income 3,163 601 5,977 – 9,741<br />
Net gains (losses) in financial assets/liabilities<br />
at fair value through profit or loss (3,607) (148) (6,906) 669 (9,992)<br />
Net gains (losses) <strong>on</strong> financial assets available for sale (335) 14 975 12 666<br />
Other income 129 2 623 (9) 745<br />
Total n<strong>on</strong>interest income (650) 469 669 672 1,160<br />
N<strong>on</strong>interest expenses:<br />
Compensati<strong>on</strong> and benefits 4,552 383 4,671 – 9,606<br />
Other expenses 3,547 219 5,016 (110) 8,672<br />
Total n<strong>on</strong>interest expenses 8,099 602 9,687 (110) 18,278<br />
Income (loss) before income taxes (2,312) 350 2,641 (6,4<strong>20</strong>) (5,741)<br />
Income tax expense (benefit) (1,356) 91 (960) 380 (1,845)<br />
Net income (loss) (956) 259 3,601 (6,800) (3,896)<br />
Net income (loss) attributable to minority interest – 14 33 (108) (61)<br />
Net income (loss) attributable to <strong>Deutsche</strong> <strong>Bank</strong><br />
shareholders (956) 245 3,568 (6,692) (3,835)
<strong>20</strong>07<br />
in € m.<br />
Parent DBTC Other subsidiaries<br />
Net interest income:<br />
F - 179<br />
C<strong>on</strong>solidating<br />
entries<br />
<strong>Deutsche</strong><br />
<strong>Bank</strong> AG<br />
c<strong>on</strong>solidated<br />
Interest income, including dividends from subsidiaries 47,612 2,015 48,296 (33,248) 64,675<br />
Interest expense 42,834 1,592 41,102 (29,702) 55,826<br />
Net interest and dividend income 4,778 423 7,194 (3,546) 8,849<br />
Provisi<strong>on</strong> for credit losses 85 12 675 (160) 612<br />
Net interest and dividend income after provisi<strong>on</strong><br />
for credit losses 4,693 411 6,519 (3,386) 8,237<br />
N<strong>on</strong>interest income:<br />
Commissi<strong>on</strong>s and fee income 3,988 614 7,680 – 12,282<br />
Net gains (losses) in financial assets/liabilities<br />
at fair value through profit or loss 8,023 (4) (704) (140) 7,175<br />
Net gains (losses) <strong>on</strong> financial assets available for sale 125 (4) 673 (1) 793<br />
Other income (716) 86 1,979 381 1,730<br />
Total n<strong>on</strong>interest income 11,4<strong>20</strong> 692 9,628 240 21,980<br />
N<strong>on</strong>interest expenses:<br />
Compensati<strong>on</strong> and benefits 6,748 443 5,931 – 13,122<br />
Other expenses 3,657 394 4,771 (476) 8,346<br />
Total n<strong>on</strong>interest expenses 10,405 837 10,702 (476) 21,468<br />
Income (loss) before income taxes 5,708 266 5,445 (2,670) 8,749<br />
Income tax expense (benefit) 2,214 198 (44) (129) 2,239<br />
Net income (loss) 3,494 68 5,489 (2,541) 6,510<br />
Net income (loss) attributable to minority interest – 26 33 (23) 36<br />
Net income (loss) attributable to <strong>Deutsche</strong> <strong>Bank</strong><br />
shareholders 3,494 42 5,456 (2,518) 6,474
<strong>20</strong>-F Additi<strong>on</strong>al Notes<br />
C<strong>on</strong>densed C<strong>on</strong>solidating Balance Sheet<br />
Dec 31, <str<strong>on</strong>g><strong>20</strong>09</str<strong>on</strong>g><br />
Parent DBTC Other subsidiaries<br />
F - 180<br />
C<strong>on</strong>solidating<br />
entries<br />
<strong>Deutsche</strong><br />
<strong>Bank</strong> AG<br />
c<strong>on</strong>solidated<br />
in € m.<br />
Assets:<br />
Cash and due from banks 6,069 296 5,583 (2,602) 9,346<br />
Interest-earning deposits with banks 88,764 15,892 178,771 (236,194) 47,233<br />
Central bank funds sold, securities purchased<br />
under resale agreements, securities borrowed 43,425 1,435 49,460 (43,991) 50,329<br />
Financial assets at fair value through profit or loss 806,492 3,238 192,774 (37,184) 965,3<strong>20</strong><br />
Financial assets available for sale 11,128 1,094 42,543 (35,946) 18,819<br />
Equity method investments 588 – 7,<strong>20</strong>0 – 7,788<br />
Loans 212,283 21,885 234,270 (210,333) 258,105<br />
Other assets 173,024 2,060 100,100 (131,460) 143,724<br />
Total assets 1,341,773 45,900 810,701 (697,710) 1,500,664<br />
Liabilities:<br />
Deposits 352,984 15,007 215,628 (239,399) 344,2<strong>20</strong><br />
Central bank funds purchased, securities sold<br />
under repurchase agreements and securities<br />
loaned 30,507 3,827 60,745 (44,0<strong>20</strong>) 51,059<br />
Financial liabilities at fair value through profit or loss 643,298 325 103,980 (25,329) 722,274<br />
Other short-term borrowings 21,911 <strong>20</strong>,541 110,350 (109,905) 42,897<br />
Other liabilities 121,721 2,003 101,1<strong>20</strong> (64,958) 159,886<br />
L<strong>on</strong>g-term debt 145,606 1,332 131,787 (146,943) 131,782<br />
Trust preferred securities – – 10,999 (422) 10,577<br />
Total liabilities 1,316,027 43,035 734,609 (630,976) 1,462,695<br />
Total shareholders’ equity 25,746 2,138 74,737 (65,974) 36,647<br />
Minority interest – 727 1,355 (760) 1,322<br />
Total equity 25,746 2,865 76,092 (66,734) 37,969<br />
Total liabilities and equity 1,341,773 45,900 810,701 (697,710) 1,500,664<br />
Dec 31, <strong>20</strong>08<br />
Parent DBTC Other subsidiaries<br />
C<strong>on</strong>solidating<br />
entries<br />
<strong>Deutsche</strong><br />
<strong>Bank</strong> AG<br />
c<strong>on</strong>solidated<br />
in € m.<br />
Assets:<br />
Cash and due from banks 6,089 979 4,822 (2,064) 9,826<br />
Interest-earning deposits with banks 86,196 19,675 197,573 (238,705) 64,739<br />
Central bank funds sold, securities purchased<br />
under resale agreements, securities borrowed 50,980 844 50,493 (58,028) 44,289<br />
Financial assets at fair value through profit or loss 1,444,342 3,262 219,691 (43,484) 1,623,811<br />
Financial assets available for sale 16,271 418 62,759 (54,613) 24,835<br />
Equity method investments 494 33 1,695 <strong>20</strong> 2,242<br />
Loans 234,795 22,272 242,489 (230,275) 269,281<br />
Other assets 199,063 1,941 91,858 (129,462) 163,400<br />
Total assets 2,038,230 49,424 871,380 (756,611) 2,<strong>20</strong>2,423<br />
Liabilities:<br />
Deposits 412,142 13,221 212,127 (241,937) 395,553<br />
Central bank funds purchased, securities sold<br />
under repurchase agreements and securities<br />
loaned 43,933 9,670 94,761 (58,031) 90,333<br />
Financial liabilities at fair value through profit or loss 1,262,180 595 111,570 (40,580) 1,333,765<br />
Other short-term borrowings 17,656 19,295 128,677 (126,513) 39,115<br />
Other liabilities 137,640 2,560 82,794 (54,836) 168,158<br />
L<strong>on</strong>g-term debt 141,051 1,269 151,725 (160,189) 133,856<br />
Trust preferred securities – – 9,729 – 9,729<br />
Total liabilities 2,014,602 46,610 791,383 (682,086) 2,170,509<br />
Total shareholders’ equity 23,628 2,061 78,758 (73,744) 30,703<br />
Minority interest – 753 1,239 (781) 1,211<br />
Total equity 23,628 2,814 79,997 (74,525) 31,914<br />
Total liabilities and equity 2,038,230 49,424 871,380 (756,611) 2,<strong>20</strong>2,423
C<strong>on</strong>densed C<strong>on</strong>solidating Statement of Cash Flows<br />
<str<strong>on</strong>g><strong>20</strong>09</str<strong>on</strong>g> Parent DBTC Other sub-<br />
in € m.<br />
1 This column includes amounts for other subsidiaries and intercompany cash flows.<br />
F - 181<br />
sidiaries 1<br />
<strong>Deutsche</strong><br />
<strong>Bank</strong> AG<br />
c<strong>on</strong>solidated<br />
Net cash provided by (used in) operating activities (1,822) (3,486) (8,478) (13,786)<br />
Cash flows from investing activities:<br />
Proceeds from:<br />
Sale of financial assets available for sale 4,359 303 4,361 9,023<br />
Maturities of financial assets available for sale 6,499 1,869 570 8,938<br />
Sale of equity method investments 168 31 375 574<br />
Sale of property and equipment 10 1 28 39<br />
Purchase of:<br />
Financial assets available for sale (6,891) (2,837) (2,354) (12,082)<br />
Equity method investments (291) – (3,439) (3,730)<br />
Property and equipment (424) (31) (137) (592)<br />
Net cash paid for business combinati<strong>on</strong>s/divestitures – – (<strong>20</strong>) (<strong>20</strong>)<br />
Other, net (2,326) (15) 592 (1,749)<br />
Net cash provided by (used in) investing activities 1,104 (679) (24) 401<br />
Cash flows from financing activities:<br />
Issuances of subordinated l<strong>on</strong>g-term debt 1,677 – (1,2<strong>20</strong>) 457<br />
Repayments and extinguishments of subordinated l<strong>on</strong>g-term debt (1,044) – (404) (1,448)<br />
Issuances of trust preferred securities – – 1,303 1,303<br />
Repayments and extinguishments of trust preferred securities – – – –<br />
Comm<strong>on</strong> shares issued under share-based compensati<strong>on</strong> plans – – – –<br />
Capital increase – – – –<br />
Purchases of treasury shares (19,189) – (49) (19,238)<br />
Sale of treasury shares 18,070 – 41 18,111<br />
Cash dividends paid (309) – – (309)<br />
Other, net – (17) 121 104<br />
Net cash provided by (used in) financing activities (795) (17) (<strong>20</strong>8) (1,0<strong>20</strong>)<br />
Net effect of exchange rate changes <strong>on</strong> cash and cash equivalents 365 (190) 515 690<br />
Net increase (decrease) in cash and cash equivalents (1,148) (4,372) (8,195) (13,715)<br />
Cash and cash equivalents at beginning of period 60,263 17,251 (12,250) 65,264<br />
Cash and cash equivalents at end of period 59,115 12,879 (<strong>20</strong>,445) 51,549<br />
Net cash provided by (used in) operating activities include<br />
Income taxes paid (received), net (1,082) (28) 590 (5<strong>20</strong>)<br />
Interest paid 14,295 266 1,317 15,878<br />
Interest and dividends received 21,017 761 6,433 28,211<br />
Cash and cash equivalents comprise<br />
Cash and due from banks 6,069 296 2,981 9,346<br />
Demand deposits with banks 53,046 12,583 (23,426) 42,<strong>20</strong>3<br />
Total 59,115 12,879 (<strong>20</strong>,445) 51,549
<strong>20</strong>-F Additi<strong>on</strong>al Notes<br />
<strong>20</strong>08 Parent DBTC Other sub-<br />
in € m.<br />
1 This column includes amounts for other subsidiaries and intercompany cash flows.<br />
F - 182<br />
sidiaries 1<br />
<strong>Deutsche</strong><br />
<strong>Bank</strong> AG<br />
c<strong>on</strong>solidated<br />
Net cash provided by (used in) operating activities 35,768 14,285 (12,936) 37,117<br />
Cash flows from investing activities:<br />
Proceeds from:<br />
Sale of financial assets available for sale 6,270 2,088 11,075 19,433<br />
Maturities of financial assets available for sale 15,878 165 2,670 18,713<br />
Sale of equity method investments 218 69 393 680<br />
Sale of property and equipment 7 16 84 107<br />
Purchase of:<br />
Financial assets available for sale (26,496) (747) (10,576) (37,819)<br />
Equity method investments (301) (27) (553) (881)<br />
Property and equipment (348) (45) (546) (939)<br />
Net cash paid for business combinati<strong>on</strong>s/divestitures – – (24) (24)<br />
Other, net (2,<strong>20</strong>2) (19) 2,182 (39)<br />
Net cash provided by (used in) investing activities (6,974) 1,500 4,705 (769)<br />
Cash flows from financing activities:<br />
Issuances of subordinated l<strong>on</strong>g-term debt 22 – 501 523<br />
Repayments and extinguishments of subordinated l<strong>on</strong>g-term debt (<strong>20</strong>3) (<strong>20</strong>6) (250) (659)<br />
Issuances of trust preferred securities – – 3,404 3,404<br />
Repayments and extinguishments of trust preferred securities – – – –<br />
Comm<strong>on</strong> shares issued under share-based compensati<strong>on</strong> plans 19 – – 19<br />
Capital increase 2,<strong>20</strong>0 – – 2,<strong>20</strong>0<br />
Purchases of treasury shares (21,708) – (28) (21,736)<br />
Sale of treasury shares 21,400 – 26 21,426<br />
Cash dividends paid (2,274) – – (2,274)<br />
Other, net – (10) 327 317<br />
Net cash provided by (used in) financing activities (544) (216) 3,980 3,2<strong>20</strong><br />
Net effect of exchange rate changes <strong>on</strong> cash and cash equivalents (125) 63 (340) (402)<br />
Net increase (decrease) in cash and cash equivalents 28,125 15,632 (4,591) 39,166<br />
Cash and cash equivalents at beginning of period 32,138 1,619 (7,659) 26,098<br />
Cash and cash equivalents at end of period 60,263 17,251 (12,250) 65,264<br />
Net cash provided by (used in) operating activities include<br />
Income taxes paid, net (1,923) 33 (605) (2,495)<br />
Interest paid 37,191 913 5,6<strong>20</strong> 43,724<br />
Interest and dividends received 44,524 1,565 8,460 54,549<br />
Cash and cash equivalents comprise<br />
Cash and due from banks 6,089 979 2,758 9,826<br />
Demand deposits with banks 54,174 16,272 (15,008) 55,438<br />
Total 60,263 17,251 (12,250) 65,264
<strong>20</strong>07 Parent DBTC Other sub-<br />
in € m.<br />
1 This column includes amounts for other subsidiaries and intercompany cash flows.<br />
F - 183<br />
sidiaries 1<br />
<strong>Deutsche</strong><br />
<strong>Bank</strong> AG<br />
c<strong>on</strong>solidated<br />
Net cash provided by (used in) operating activities 13,043 436 3,311 16,790<br />
Cash flows from investing activities:<br />
Proceeds from:<br />
Sale of financial assets available for sale 4,<strong>20</strong>1 597 7,672 12,470<br />
Maturities of financial assets available for sale 4,311 403 3,465 8,179<br />
Sale of equity method investments 769 24 538 1,331<br />
Sale of property and equipment 134 1 852 987<br />
Purchase of:<br />
Financial assets available for sale (6,713) (1,493) (17,024) (25,230)<br />
Equity method investments (242) (10) (1,013) (1,265)<br />
Property and equipment (342) (58) (275) (675)<br />
Net cash paid for business combinati<strong>on</strong>s/divestitures – – (648) (648)<br />
Other, net (1,674) (36) 2,173 463<br />
Net cash provided by (used in) investing activities 444 (572) (4,260) (4,388)<br />
Cash flows from financing activities:<br />
Issuances of subordinated l<strong>on</strong>g-term debt 2,343 – (1,914) 429<br />
Repayments and extinguishments of subordinated l<strong>on</strong>g-term debt (1,989) (159) (661) (2,809)<br />
Issuances of trust preferred securities – – 1,874 1,874<br />
Repayments and extinguishments of trust preferred securities – (141) (279) (4<strong>20</strong>)<br />
Comm<strong>on</strong> shares issued under share-based compensati<strong>on</strong> plans 389 – – 389<br />
Purchases of treasury shares (41,128) – – (41,128)<br />
Sale of treasury shares 39,729 – – 39,729<br />
Cash dividends paid (2,005) – – (2,005)<br />
Other, net – (4) 576 572<br />
Net cash provided by (used in) financing activities (2,661) (304) (404) (3,369)<br />
Net effect of exchange rate changes <strong>on</strong> cash and cash equivalents (109) – (180) (289)<br />
Net increase (decrease) in cash and cash equivalents 10,717 (440) (1,533) 8,744<br />
Cash and cash equivalents at beginning of period 21,421 2,059 (6,126) 17,354<br />
Cash and cash equivalents at end of period 32,138 1,619 (7,659) 26,098<br />
Net cash provided by (used in) operating activities include<br />
Income taxes paid, net 1,728 370 708 2,806<br />
Interest paid 42,855 1,426 10,785 55,066<br />
Interest and dividends received 47,612 1,371 15,692 64,675<br />
Cash and cash equivalents comprise<br />
Cash and due from banks 4,245 1,455 2,932 8,632<br />
Demand deposits with banks 27,893 164 (10,591) 17,466<br />
Total 32,138 1,619 (7,659) 26,098
(This page intenti<strong>on</strong>ally left blank)
Supplemental Financial Informati<strong>on</strong> (Unaudited)<br />
Industry Guide 3 Informati<strong>on</strong><br />
Amounts for <str<strong>on</strong>g><strong>20</strong>09</str<strong>on</strong>g>, <strong>20</strong>08, <strong>20</strong>07 and <strong>20</strong>06 are prepared in accordance with IFRS, which is c<strong>on</strong>sistent with the<br />
Group’s Financial Statements. In accordance with the SEC Release, “First-time applicati<strong>on</strong> of Internati<strong>on</strong>al<br />
Financial <str<strong>on</strong>g>Report</str<strong>on</strong>g>ing”, amounts prior to <strong>20</strong>06 are prepared under U.S. GAAP.<br />
Financial C<strong>on</strong>diti<strong>on</strong><br />
The following table presents the Group’s average balance sheet and net interest income for the periods<br />
specified. The average balances are calculated in general based up<strong>on</strong> m<strong>on</strong>th-end balances. The allocati<strong>on</strong>s<br />
of the assets and liabilities between German and N<strong>on</strong>-German offices are based <strong>on</strong> the locati<strong>on</strong> of the<br />
Group’s entity <strong>on</strong> the books of which it carries the asset or liability. Categories of loans include n<strong>on</strong>accrual<br />
loans.<br />
S - 1
<strong>20</strong>-F Supplemental Financial Informati<strong>on</strong> (Unaudited)<br />
Average balance sheet and net interest income <str<strong>on</strong>g><strong>20</strong>09</str<strong>on</strong>g> <strong>20</strong>08 <strong>20</strong>07<br />
in € m.<br />
(unless stated otherwise)<br />
Assets:<br />
Interest-earning deposits with banks:<br />
Average<br />
balance<br />
Interest Average<br />
yield/rate<br />
S - 2<br />
Average<br />
balance<br />
Interest Average<br />
yield/rate<br />
Average<br />
balance<br />
Interest Average<br />
yield/rate<br />
In German offices 24,111 175 0.73 % 12,953 464 3.58 % 8,816 417 4.73 %<br />
In N<strong>on</strong>-German offices 29,794 458 1.54 % 22,083 849 3.84 % 15,662 967 6.18 %<br />
Total interest-earning deposits with banks 53,905 633 1.17 % 35,036 1,313 3.75 % 24,478 1,384 5.66 %<br />
Central bank funds sold and securities<br />
purchased under resale agreements:<br />
In German offices 638 13 2.03 % 1,913 103 5.41 % 2,111 139 6.59 %<br />
In N<strong>on</strong>-German offices 12,547 307 2.45 % <strong>20</strong>,005 861 4.30 % 11,475 951 8.29 %<br />
Total central bank funds sold and<br />
securities purchased under resale<br />
agreements 13,185 3<strong>20</strong> 2.43 % 21,918 964 4.40 % 13,586 1,090 8.02 %<br />
Securities borrowed:<br />
In German offices 1,083 (58) (5.37)% 3,661 54 1.48 % 2,897 60 2.08 %<br />
In N<strong>on</strong>-German offices 37,049 125 0.34 % 45,724 957 2.09 % 69,403 3,724 5.36 %<br />
Total securities borrowed 38,132 67 0.18 % 49,385 1,011 2.05 % 72,300 3,784 5.23 %<br />
Financial assets at fair value through profit<br />
or loss:<br />
In German offices 28,033 936 3.34 % 51,923 2,466 4.75 % 69,165 3,176 4.59 %<br />
In N<strong>on</strong>-German offices 396,579 12,698 3.<strong>20</strong> % 710,867 32,472 4.57 % 756,215 39,744 5.26 %<br />
Total financial assets at fair value through<br />
profit or loss 424,612 13,634 3.21 % 762,790 34,938 4.58 % 825,380 42,9<strong>20</strong> 5.<strong>20</strong> %<br />
Financial assets available for sale:<br />
In German offices 7,631 <strong>20</strong>8 2.73 % 13,286 488 3.67 % 14,818 4<strong>20</strong> 2.84 %<br />
In N<strong>on</strong>-German offices 13,729 379 2.76 % 24,430 1,084 4.44 % 25,974 1,376 5.30 %<br />
Total financial assets available for sale 21,360 587 2.75 % 37,716 1,572 4.17 % 40,792 1,796 4.40 %<br />
Loans:<br />
In German offices 114,487 4,736 4.14 % 98,051 5,425 5.53 % 89,439 5,016 5.61 %<br />
In N<strong>on</strong>-German offices 155,533 5,819 3.74 % 135,495 6,844 5.05 % 102,196 5,885 5.76 %<br />
Total loans 270,0<strong>20</strong> 10,555 3.91 % 233,546 12,269 5.25 % 191,635 10,901 5.69 %<br />
Total other interest-earning assets 58,387 1,157 1.98 % 76,275 2,482 3.25 % 58,0<strong>20</strong> 2,800 4.83 %<br />
Total interest-earning assets 879,601 26,953 3.06 % 1,216,666 54,549 4.48 % 1,226,191 64,675 5.27 %<br />
Cash and due from banks 8,907 8,680 8,054<br />
N<strong>on</strong>interest-earning financial assets at fair<br />
value through profit or loss:<br />
In German offices 322,362 196,527 133,680<br />
In N<strong>on</strong>-German offices 571,756 578,295 258,302<br />
All other assets 130,232 154,359 177,097<br />
Allowance for credit losses (2,732) (1,741) (1,669)<br />
Total assets 1,910,126 2,152,786 1,801,655<br />
% of assets attributable to N<strong>on</strong>-German offices 72 % 81 % 80 %
Average balance sheet and net interest income <str<strong>on</strong>g><strong>20</strong>09</str<strong>on</strong>g> <strong>20</strong>08 <strong>20</strong>07<br />
in € m.<br />
Average Interest Average Average Interest Average Average Interest Average<br />
(unless stated otherwise)<br />
Liabilities and equity:<br />
Interest-bearing deposits:<br />
In German offices:<br />
balance<br />
yield/rate balance<br />
yield/rate balance<br />
yield/rate<br />
Time deposits 35,897 628 1.75 % 45,116 1,761 3.90 % 43,681 1,850 4.23 %<br />
Savings deposits 52,856 1,462 2.77 % 44,117 1,585 3.59 % 33,736 1,048 3.11 %<br />
Demand deposits 46,066 306 0.66 % 44,912 1,227 2.73 % 36,475 1,1<strong>20</strong> 3.07 %<br />
Total in German offices<br />
In N<strong>on</strong>-German offices:<br />
134,819 2,396 1.78 % 134,145 4,573 3.41 % 113,892 4,018 3.53 %<br />
Time deposits 107,669 1,699 1.58 % 173,068 5,622 3.25 % <strong>20</strong>0,951 9,337 4.65 %<br />
Savings deposits 13,659 260 1.90 % 10,111 254 2.52 % 7,730 193 2.50 %<br />
Demand deposits 82,338 764 0.93 % 91,880 2,566 2.79 % 86,029 3,823 4.44 %<br />
Total in N<strong>on</strong>-German offices <strong>20</strong>3,666 2,723 1.34 % 275,059 8,442 3.07 % 294,710 13,353 4.53 %<br />
Total interest-bearing deposits<br />
Central bank funds purchased and securities<br />
sold under repurchase agreements:<br />
338,485 5,119 1.51 % 409,<strong>20</strong>4 13,015 3.18 % 408,602 17,371 4.25 %<br />
In German offices 4,104 28 0.69 % 11,431 346 3.03 % 18,586 722 3.88 %<br />
In N<strong>on</strong>-German offices<br />
Total central bank funds purchased and<br />
securities sold under repurchase<br />
73,027 252 0.34 % 167,767 4,079 2.43 % 1<strong>20</strong>,768 6,147 5.09 %<br />
agreements<br />
Securities loaned:<br />
77,131 280 0.36 % 179,198 4,425 2.47 % 139,354 6,869 4.93 %<br />
In German offices 92 (2) (2.54) % 256 0 0.19 % 131 6 4.60 %<br />
In N<strong>on</strong>-German offices 3,981 271 6.81 % 9,469 304 3.21 % 16,903 990 5.86 %<br />
Total securities loaned<br />
Financial liabilities at fair value through profit or<br />
loss:<br />
4,073 269 6.60 % 9,725 304 3.13 % 17,034 996 5.85 %<br />
In German offices 17,624 561 3.18 % 31,122 1,462 4.70 % 35,991 1,422 3.95 %<br />
In N<strong>on</strong>-German offices<br />
Total financial liabilities at fair value through<br />
153,7<strong>20</strong> 3,942 2.56 % 285,323 13,349 4.68 % 325,784 19,567 6.01 %<br />
profit or loss<br />
Other short-term borrowings:<br />
171,344 4,503 2.63 % 316,445 14,811 4.68 % 361,775 <strong>20</strong>,989 5.80 %<br />
In German offices 1,665 102 6.13 % 2,056 115 5.59 % 2,057 109 5.30 %<br />
In N<strong>on</strong>-German offices 45,851 696 1.52 % 50,925 1,790 3.51 % 48,971 2,556 5.22 %<br />
Total other short-term borrowings<br />
L<strong>on</strong>g-term debt and trust preferred securities:<br />
47,516 798 1.68 % 52,981 1,905 3.60 % 51,028 2,665 5.22 %<br />
In German offices 64,401 1,318 2.05 % 62,041 3,071 4.95 % 53,090 2,401 4.52 %<br />
In N<strong>on</strong>-German offices<br />
Total l<strong>on</strong>g-term debt and trust preferred<br />
79,057 1,974 2.50 % 76,445 2,773 3.63 % 74,393 2,850 3.83 %<br />
securities 143,458 3,292 2.29 % 138,486 5,844 4.22 % 127,483 5,251 4.12 %<br />
Total other interest-bearing liabilities 71,376 233 0.33 % 73,592 1,792 2.43 % 44,775 1,685 3.76 %<br />
Total interest-bearing liabilities<br />
N<strong>on</strong>interest-bearing deposits:<br />
853,383 14,494 1.70 % 1,179,631 42,096 3.57 % 1,150,051 55,826 4.85 %<br />
In German offices 32,515 22,380 24,088<br />
In N<strong>on</strong>-German offices<br />
N<strong>on</strong>interest-bearing financial liabilities at fair<br />
value through profit or loss:<br />
9,821 7,655 7,234<br />
In German offices 305,329 188,442 131,167<br />
In N<strong>on</strong>-German offices 549,164 568,384 275,256<br />
All other n<strong>on</strong>interest-bearing liabilities 124,700 150,102 176,925<br />
Total shareholders' equity 34,016 34,442 36,134<br />
Minority interest 1,198 1,750 800<br />
Total equity 35,214 36,192 36,934<br />
Total liabilities and equity 1,910,126 2,152,786 1,801,655<br />
% of liabilities attributable to N<strong>on</strong>-German offices 65 % 74 % 74 %<br />
Rate spread<br />
Net interest margin (Net interest income to total<br />
interest-earning assets):<br />
1.37 % 0.91 % 0.42 %<br />
In German offices 1.00 % 0.14 % 0.47 %<br />
In N<strong>on</strong>-German offices 1.55 % 1.35 % 0.93 %<br />
Total 1.42 % 1.02 %<br />
S - 3<br />
0.72 %
<strong>20</strong>-F Supplemental Financial Informati<strong>on</strong> (Unaudited)<br />
The following table presents an analysis of changes in net interest income between the periods specified, indicating<br />
for each category of assets and liabilities, how much of the change in net interest income arose from<br />
changes in the volume of the category of assets or liabilities and how much arose from changes in the interest<br />
rate applicable to the category. Changes due to a combinati<strong>on</strong> of volume and rate are allocated proporti<strong>on</strong>ally.<br />
<str<strong>on</strong>g><strong>20</strong>09</str<strong>on</strong>g> over <strong>20</strong>08 due to changes in <strong>20</strong>08 over <strong>20</strong>07 due to changes in<br />
in € m. Net change Volume Rate Net change Volume Rate<br />
Interest and similar income<br />
Interest-earning deposits with banks:<br />
German offices (289) 234 (523) 47 164 (117)<br />
N<strong>on</strong>-German offices (391) 231 (622) (118) 319 (437)<br />
Total interest-earning deposits with banks (680) 465 (1,145) (71) 483 (554)<br />
Central bank funds sold and securities purchased under resale<br />
agreements:<br />
German offices (91) (47) (44) (36) (12) (24)<br />
N<strong>on</strong>-German offices (553) (257) (296) (90) 501 (591)<br />
Total central bank funds sold and securities purchased under resale<br />
agreements (644) (304) (340) (126) 489 (615)<br />
Securities borrowed:<br />
German offices (112) (15) (97) (6) 14 (<strong>20</strong>)<br />
N<strong>on</strong>-German offices (832) (153) (679) (2,767) (992) (1,775)<br />
Total securities borrowed (944) (168) (776) (2,773) (978) (1,795)<br />
Financial assets at fair value through profit or loss:<br />
German offices (1,530) (930) (600) (710) (816) 106<br />
N<strong>on</strong>-German offices (19,774) (11,795) (7,979) (7,272) (2,285) (4,987)<br />
Total financial assets at fair value through profit or loss (21,304) (12,725) (8,579) (7,982) (3,101) (4,881)<br />
Financial assets available for sale<br />
German offices (280) (174) (106) 68 (47) 115<br />
N<strong>on</strong>-German offices (705) (378) (327) (292) (78) (214)<br />
Total financial assets available for sale (985) (552) (433) (224) (125) (99)<br />
Loans:<br />
German offices (689) 818 (1,507) 409 477 (68)<br />
N<strong>on</strong>-German offices (1,025) 917 (1,942) 959 1,746 (787)<br />
Total loans (1,714) 1,735 (3,449) 1,368 2,223 (855)<br />
Other interest-earning assets (1,325) 90 (1,415) (318) 1,678 (1,996)<br />
Total interest and similar income (27,596) (11,459) (16,137) (10,126) 669 (10,795)<br />
Interest expense:<br />
Interest-bearing deposits:<br />
German offices (2,177) 23 (2,<strong>20</strong>0) 555 694 (139)<br />
N<strong>on</strong>-German offices (5,719) (1,802) (3,917) (4,911) (841) (4,070)<br />
Total interest-bearing deposits (7,896) (1,779) (6,117) (4,356) (147) (4,<strong>20</strong>9)<br />
Central bank funds purchased and securities sold under repurchase<br />
agreements:<br />
German offices (318) (144) (174) (376) (239) (137)<br />
N<strong>on</strong>-German offices (3,827) (1,519) (2,308) (2,068) 1,859 (3,927)<br />
Total central bank funds purchased and securities sold under<br />
repurchase agreements (4,145) (1,663) (2,482) (2,444) 1,6<strong>20</strong> (4,064)<br />
Securities loaned:<br />
German offices (2) 0 (2) (6) 3 (9)<br />
N<strong>on</strong>-German offices (33) (243) 210 (686) (338) (348)<br />
Total securities loaned (35) (243) <strong>20</strong>8 (692) (335) (357)<br />
Financial liabilities at fair value through profit or loss:<br />
German offices (901) (517) (384) 40 (<strong>20</strong>8) 248<br />
N<strong>on</strong>-German offices (9,407) (4,752) (4,655) (6,218) (2,237) (3,981)<br />
Total financial liabilities at fair value through profit or loss (10,308) (5,269) (5,039) (6,178) (2,445) (3,733)<br />
Other short-term borrowings:<br />
German offices (13) (23) 10 6 0 6<br />
N<strong>on</strong>-German offices (1,094) (124) (970) (766) 60 (826)<br />
Total other short-term borrowings (1,107) (147) (960) (760) 60 (8<strong>20</strong>)<br />
L<strong>on</strong>g-term debt and trust preferred securities:<br />
German offices (1,753) 113 (1,866) 670 429 241<br />
N<strong>on</strong>-German offices (799) 92 (891) (77) 77 (154)<br />
Total l<strong>on</strong>g-term debt and trust preferred securities (2,552) <strong>20</strong>5 (2,757) 593 506 87<br />
Other interest-bearing liabilities (1,559) (65) (1,494) 107 773 (666)<br />
Total interest expense (27,602) (8,961) (18,641) (13,730) 32 (13,762)<br />
Net change in net interest income 6 (2,498) 2,504 3,604 637 2,967<br />
S - 4
Investment Portfolio (Securities Available for Sale)<br />
The fair values of the Group’s investment portfolio as of December 31, <str<strong>on</strong>g><strong>20</strong>09</str<strong>on</strong>g>, <strong>20</strong>08 and <strong>20</strong>07 were as follows.<br />
in € m.<br />
Debt securities:<br />
Dec 31, <str<strong>on</strong>g><strong>20</strong>09</str<strong>on</strong>g> Dec 31, <strong>20</strong>08 Dec 31, <strong>20</strong>07<br />
German government 2,585 2,672 2,466<br />
U.S. Treasury and U.S. government agencies 901 302 1,349<br />
U.S. local (municipal) governments 1 1 273<br />
Other foreign governments 3,832 3,700 3,347<br />
Corporates 4,280 6,035 7,753<br />
Other asset-backed securities 999 372 6,847<br />
Mortgage-backed securities, including obligati<strong>on</strong>s of U.S. federal agencies 815 87 3,753<br />
Other debt securities 438 4,797 4,631<br />
Total debt securities<br />
Equity securities:<br />
13,851 17,966 30,419<br />
Equity shares 3,192 4,539 7,934<br />
Investment certificates and mutual funds 76 <strong>20</strong>8 306<br />
Total equity securities 3,268 4,747 8,240<br />
Total 17,119 22,713 38,659<br />
As of December 31, <str<strong>on</strong>g><strong>20</strong>09</str<strong>on</strong>g>, there were no securities of an individual issuer that exceeded 10 % of the Group’s<br />
total shareholders’ equity.<br />
The following table presents the fair value, remaining maturities, approximate weighted-average yields (based<br />
<strong>on</strong> amortized cost) and total amortized cost by maturity distributi<strong>on</strong> of the debt security comp<strong>on</strong>ents of the<br />
Group’s investment portfolio as of December 31, <str<strong>on</strong>g><strong>20</strong>09</str<strong>on</strong>g>:<br />
Up to <strong>on</strong>e year More than <strong>on</strong>e year<br />
and up to five years<br />
More than five years<br />
and up to ten years<br />
S - 5<br />
More than ten years Total<br />
in € m. Amount Yield Amount Yield Amount Yield Amount Yield Amount Yield<br />
German government<br />
U.S. Treasury and<br />
85 0.89 % 10 2.15 % 67 3.22 % 2,423 3.51 % 2,585 3.42 %<br />
U.S. government agencies<br />
U.S. local (municipal)<br />
795 0.85 % 106 0.83 % – – – – 901 0.85 %<br />
governments 1 1.62 % – – – – – – 1 1.62 %<br />
Other foreign governments 1,279 1.23 % 237 4.55 % 634 3.82 % 1,682 3.61 % 3,832 2.92 %<br />
Corporates 138 5.18 % 601 2.71 % 2,409 3.52 % 1,132 4.72 % 4,280 3.78 %<br />
Other asset-backed securities<br />
Mortgage-backed securities,<br />
including obligati<strong>on</strong>s of<br />
– – 7 5.99 % 194 4.75 % 798 4.50 % 999 4.56 %<br />
U.S. federal agencies 13 4.33 % 2 0.68 % – – 800 5.87 % 815 5.62 %<br />
Other debt securities 293 5.51 % 115 4.98 % 23 2.23 % 7 5.87 % 438 5.28 %<br />
Total fair value 2,604 1.83 % 1,078 3.13 % 3,327 3.73 % 6,842 4.41 % 13,851 3.66 %<br />
Total amortized cost 2,613 1,060 3,411 7,271 14,355
<strong>20</strong>-F Supplemental Financial Informati<strong>on</strong> (Unaudited)<br />
Loans Outstanding<br />
The following table presents the Group’s loan portfolio according to the industry sector and locati<strong>on</strong> (within or<br />
outside Germany) of the borrower.<br />
in € m. Dec 31, <str<strong>on</strong>g><strong>20</strong>09</str<strong>on</strong>g> Dec 31, <strong>20</strong>08 Dec 31, <strong>20</strong>07 Dec 31, <strong>20</strong>06 Dec 31, <strong>20</strong>05<br />
German:<br />
<strong>Bank</strong>s and insurance 9,527 12,397 792 1,160 1,769<br />
Manufacturing 7,486 7,268 7,057 6,516 6,6<strong>20</strong><br />
Households 50,936 48,514 46,490 44,902 43,196<br />
Public sector 5,922 5,437 3,046 1,812 1,462<br />
Wholesale and retail trade 2,901 3,444 3,227 3,013 3,394<br />
Commercial real estate activities 13,792 13,869 10,<strong>20</strong>0 10,071 10,625<br />
Lease financing 882 1,030 1,548 1,017 1,001<br />
Other 13,851 13,357 12,719 14,239 11,508<br />
Total German 105,297 105,316 85,079 82,730 79,575<br />
N<strong>on</strong>-German:<br />
<strong>Bank</strong>s and insurance 12,475 14,601 12,057 11,<strong>20</strong>4 5,907<br />
Manufacturing 9,828 11,775 9,010 7,211 9,083<br />
Households 34,739 34,862 24,373 24,681 19,261<br />
Public sector 3,650 4,535 2,040 2,341 1,167<br />
Wholesale and retail trade 8,037 8,317 5,689 7,501 8,683<br />
Commercial real estate activities 15,167 13,214 6,276 3,971 2,634<br />
Lease financing 1,196 1,670 1,796 2,273 1,810<br />
Other 72,309 78,077 54,368 38,406 25,143<br />
Total N<strong>on</strong>-German 157,401 167,051 115,610 97,587 73,688<br />
Gross loans 262,698 272,367 <strong>20</strong>0,689 180,318 153,263<br />
(Deferred expense)/unearned income 1,250 1,148 92 124 (<strong>20</strong>)<br />
Loan less (deferred expense)/unearned income 261,448 271,219 <strong>20</strong>0,597 180,194 153,283<br />
Included in the category Other is fund management activities exposure of € 26.5 billi<strong>on</strong> and € 31.2 billi<strong>on</strong> for<br />
December 31, <str<strong>on</strong>g><strong>20</strong>09</str<strong>on</strong>g> and December 31, <strong>20</strong>08, respectively.<br />
S - 6
Loan Maturities and Sensitivity to Changes in Interest Rates<br />
The following table presents an analysis of the maturities of the loans in the Group’s loan portfolio (excluding<br />
lease financing) as of December 31, <str<strong>on</strong>g><strong>20</strong>09</str<strong>on</strong>g>.<br />
Dec 31, <str<strong>on</strong>g><strong>20</strong>09</str<strong>on</strong>g> Within <strong>on</strong>e<br />
year<br />
in € m.<br />
German:<br />
The following table presents volumes of the loans in the Group’s loan portfolio (excluding lease financings) as<br />
of December 31, <str<strong>on</strong>g><strong>20</strong>09</str<strong>on</strong>g>, that had residual maturities of more than <strong>on</strong>e year from that date, showing the split<br />
between those at fixed and those at floating or adjustable interest rates.<br />
S - 7<br />
After <strong>on</strong>e but<br />
within five<br />
years<br />
After five<br />
years<br />
<strong>Bank</strong>s and insurance 9,327 119 81 9,527<br />
Manufacturing 4,085 2,696 705 7,486<br />
Households (excluding mortgages) 3,372 4,370 4,590 12,332<br />
Households – mortgages 2,584 7,012 29,008 38,604<br />
Public sector 5,252 484 186 5,922<br />
Wholesale and retail trade 1,942 677 282 2,901<br />
Commercial real estate activities 2,768 3,874 7,150 13,792<br />
Other 4,464 6,639 2,748 13,851<br />
Total German 33,794 25,871 44,750 104,415<br />
N<strong>on</strong>-German:<br />
<strong>Bank</strong>s and insurance 4,489 4,768 3,218 12,475<br />
Manufacturing 6,315 2,973 540 9,828<br />
Households (excluding mortgages) 4,572 7,584 2,515 14,671<br />
Households – mortgages 2,469 274 17,325 <strong>20</strong>,068<br />
Public sector 1,213 272 2,165 3,650<br />
Wholesale and retail trade 6,184 935 918 8,037<br />
Commercial real estate activities 3,194 7,600 4,373 15,167<br />
Other 33,189 12,579 26,541 72,309<br />
Total N<strong>on</strong>-German 61,625 36,985 57,595 156,<strong>20</strong>5<br />
Gross loans 95,419 62,856 102,345 260,6<strong>20</strong><br />
(Deferred expense)/unearned income 335 152 762 1,249<br />
Loans less (deferred expense)/unearned income 95,084 62,704 101,583 259,371<br />
Dec 31, <str<strong>on</strong>g><strong>20</strong>09</str<strong>on</strong>g> After <strong>on</strong>e but<br />
within five<br />
in € m.<br />
years<br />
After five<br />
years<br />
Fixed rate loans 33,848 63,144 96,992<br />
Floating or adjustable rate loans 28,856 38,439 67,295<br />
Total 62,704 101,583 164,287<br />
Total<br />
Total
<strong>20</strong>-F Supplemental Financial Informati<strong>on</strong> (Unaudited)<br />
Problem Loans<br />
The Group’s problem loans are comprised of n<strong>on</strong>accrual loans, loans 90 days or more past due and still<br />
accruing and troubled debt restructuring. All loans where known informati<strong>on</strong> about possible credit problems of<br />
borrowers causes management to have serious doubts as to the ability of such borrowers to comply with the<br />
present loan repayment terms are included in this disclosure. The following table presents total problem loans<br />
based <strong>on</strong> the domicile of the Group’s counterparty (within or outside Germany) for the last five years.<br />
in € m. Dec 31, <str<strong>on</strong>g><strong>20</strong>09</str<strong>on</strong>g> Dec 31, <strong>20</strong>08 Dec 31, <strong>20</strong>07 Dec 31, <strong>20</strong>06 Dec 31, <strong>20</strong>05<br />
N<strong>on</strong>accrual loans:<br />
German 1,811 1,738 1,913 2,167 2,771<br />
N<strong>on</strong>-German 6,312 2,472 918 753 779<br />
Total n<strong>on</strong>accrual loans 8,123 4,210 2,831 2,9<strong>20</strong> 3,550<br />
Loans 90 days or more past due and still accruing:<br />
German 310 183 199 183 198<br />
N<strong>on</strong>-German 11 18 21 2 4<br />
Total loans 90 days or more past due and still<br />
accruing 321 <strong>20</strong>1 2<strong>20</strong> 185 <strong>20</strong>2<br />
Troubled debt restructuring:<br />
German 121 122 49 85 48<br />
N<strong>on</strong>-German 348 22 44 24 71<br />
Total troubled debt restructuring 469 144 93 109 119<br />
Additi<strong>on</strong>ally, as of December 31, <str<strong>on</strong>g><strong>20</strong>09</str<strong>on</strong>g>, the Group had € 7 milli<strong>on</strong> of lease financing transacti<strong>on</strong>s that were<br />
n<strong>on</strong>performing. This amount is not included in the Group’s total problem loans.<br />
The following table shows the approximate effect <strong>on</strong> interest revenue of n<strong>on</strong>accrual loans and troubled debt<br />
restructurings. It shows the gross interest income that would have been recorded, in <str<strong>on</strong>g><strong>20</strong>09</str<strong>on</strong>g>, if those loans had<br />
been current in accordance with their original terms and had been outstanding throughout <str<strong>on</strong>g><strong>20</strong>09</str<strong>on</strong>g> or since their<br />
originati<strong>on</strong>, if the Group <strong>on</strong>ly held them for part of <str<strong>on</strong>g><strong>20</strong>09</str<strong>on</strong>g>. It also shows the amount of interest income <strong>on</strong> those<br />
loans that was included in net income for <str<strong>on</strong>g><strong>20</strong>09</str<strong>on</strong>g>. The reducti<strong>on</strong> of interest revenue the Group experienced from<br />
the n<strong>on</strong>performing other interest bearing assets was immaterial to the Group.<br />
in € m. <str<strong>on</strong>g><strong>20</strong>09</str<strong>on</strong>g><br />
German loans:<br />
Gross amount of interest that would have been recorded at original rate 74<br />
Less interest, net of reversals, recognized in interest revenue 34<br />
Reducti<strong>on</strong> of interest revenue 40<br />
N<strong>on</strong>-German loans:<br />
Gross amount of interest that would have been recorded at original rate 93<br />
Less interest, net of reversals, recognized in interest revenue 100<br />
Reducti<strong>on</strong> of interest revenue (7)<br />
Total reducti<strong>on</strong> of interest revenue 33<br />
S - 8
Foreign Outstandings<br />
The following tables list <strong>on</strong>ly those countries for which the cross-border outstandings exceeded 0.75 % of the<br />
Group’s total assets as of December 31, <str<strong>on</strong>g><strong>20</strong>09</str<strong>on</strong>g>, <strong>20</strong>08 and <strong>20</strong>07. As of December 31, <str<strong>on</strong>g><strong>20</strong>09</str<strong>on</strong>g>, there were no outstandings<br />
that exceeded 0.75 % of total assets in any country currently facing debt restructuring or liquidity<br />
problems that the Group expects would materially impact the country’s ability to service its obligati<strong>on</strong>s.<br />
Dec 31, <str<strong>on</strong>g><strong>20</strong>09</str<strong>on</strong>g> <strong>Bank</strong>s and GovernCommit-<br />
Net local Total Percent<br />
other ments and<br />
ments country<br />
financial Official<br />
claim<br />
in € m.<br />
instituti<strong>on</strong>s instituti<strong>on</strong>s<br />
United States 6,605 13,361 102,981 8,157 397,219 528,323 35.21 %<br />
Great Britain 10,132 18,654 16,219 2,472 6,516 53,993 3.60 %<br />
Luxembourg 5,865 2,752 31,043 2,050 605 42,315 2.82 %<br />
France 4,666 3,478 19,319 5,591 – 33,054 2.<strong>20</strong> %<br />
Italy 5,380 4,815 12,023 847 7,014 30,079 2.00 %<br />
Spain 6,366 2,055 8,011 1,093 7,539 25,064 1.67 %<br />
Netherlands 3,240 1,741 13,938 4,851 – 23,770 1.58 %<br />
Japan 1,501 1,305 13,971 252 5,946 22,975 1.53 %<br />
Switzerland 2,479 1,576 9,427 1,986 274 15,742 1.05 %<br />
1 Other includes commercial and industrial, insurance and other loans.<br />
Dec 31, <strong>20</strong>08 <strong>Bank</strong>s and<br />
other<br />
financial<br />
in € m.<br />
instituti<strong>on</strong>s<br />
Governments<br />
and<br />
Official<br />
instituti<strong>on</strong>s<br />
1 Other includes commercial and industrial, insurance and other loans.<br />
1 Other includes commercial and industrial, insurance and other loans.<br />
S - 9<br />
Other 1<br />
Other 1<br />
Commitments<br />
Net local<br />
country<br />
claim<br />
Total Percent<br />
United States 9,296 <strong>20</strong>,696 107,222 10,787 69,705 217,706 9.88 %<br />
Great Britain 13,979 21,968 15,498 2,091 2,979 56,515 2.57 %<br />
Luxembourg 4,010 3,387 28,190 2,388 3,325 41,300 1.88 %<br />
France 6,071 2,651 22,387 3,848 – 34,957 1.59 %<br />
Italy 8,109 3,930 9,407 366 11,494 33,306 1.51 %<br />
Netherlands 4,740 1,417 14,649 5,187 – 25,993 1.18 %<br />
Cayman Islands 116 54 19,758 5,727 – 25,655 1.16 %<br />
Japan 1,625 2,145 16,132 111 4,4<strong>20</strong> 24,433 1.11 %<br />
Spain 6,358 2,239 7,980 878 4,831 22,286 1.01 %<br />
Dec 31, <strong>20</strong>07 <strong>Bank</strong>s and<br />
other<br />
financial<br />
in € m.<br />
instituti<strong>on</strong>s<br />
Governments<br />
and<br />
Official<br />
instituti<strong>on</strong>s<br />
Other 1<br />
Commitments<br />
Net local<br />
country<br />
claim<br />
Total Percent<br />
United States 21,415 11,475 191,257 16,015 236,631 476,793 23.51 %<br />
Great Britain 7,926 10,952 12,250 2,236 105,759 139,123 6.86 %<br />
France 7,874 7,<strong>20</strong>2 38,021 4,770 – 57,867 2.85 %<br />
Italy 8,<strong>20</strong>8 7,770 24,086 478 5,234 45,776 2.26 %<br />
Luxembourg 5,605 2,091 26,419 1,979 – 36,094 1.78 %<br />
Spain 7,316 4,344 12,016 1,165 4,278 29,119 1.44 %<br />
Japan 1,912 4,377 21,505 251 – 28,045 1.38 %<br />
Netherlands 4,799 2,714 15,712 4,819 – 28,044 1.38 %<br />
Cayman Islands 217 321 21,949 1,042 – 23,529 1.16 %<br />
Switzerland 1,818 903 11,071 2,024 2,635 18,451 0.91 %<br />
Russia 7,484 758 7,026 297 – 15,565 0.77 %
<strong>20</strong>-F Supplemental Financial Informati<strong>on</strong> (Unaudited)<br />
Allowance for Loan Losses<br />
The following table presents a breakdown of the movements in the Group’s allowance for loan losses for the<br />
periods specified.<br />
in € m.<br />
(unless stated otherwise) <str<strong>on</strong>g><strong>20</strong>09</str<strong>on</strong>g> <strong>20</strong>08 <strong>20</strong>07 <strong>20</strong>06 <strong>20</strong>05<br />
Balance, beginning of year 1,938 1,705 1,670 1,832 2,345<br />
Charge-offs:<br />
German:<br />
<strong>Bank</strong>s and insurance (2) (2) (1) (2) (1)<br />
Manufacturing (43) (53) (58) (78) (61)<br />
Households (excluding mortgages) (340) (330) (287) (244) (216)<br />
Households – mortgages (23) (32) (26) (35) (36)<br />
Public sector – – – – –<br />
Wholesale and retail trade (23) (41) (28) (40) (54)<br />
Commercial real estate activities (6) (19) (41) (96) (112)<br />
Other (72) (127) (76) (102) (165)<br />
German total (509) (604) (518) (596) (645)<br />
N<strong>on</strong>-German total (713) (386) (234) (136) (373)<br />
Total charge-offs (1,222) (990) (752) (732) (1,018)<br />
Recoveries: –<br />
German: –<br />
<strong>Bank</strong>s and insurance 1 1 1 1 1<br />
Manufacturing 11 14 21 19 11<br />
Households (excluding mortgages) 83 81 63 46 41<br />
Households – mortgages 1 3 – 8 –<br />
Public sector – – – – –<br />
Wholesale and retail trade 7 8 10 9 10<br />
Commercial real estate activities 7 9 9 16 4<br />
Other 25 41 49 56 42<br />
German total 135 157 153 155 109<br />
N<strong>on</strong>-German total 31 55 72 133 61<br />
Total recoveries 166 212 225 288 170<br />
Net charge-offs (1,056) (778) (527) (444) (848)<br />
Provisi<strong>on</strong> for loan losses 2,597 1,084 651 352 374<br />
Other changes (e.g. exchange rate changes,<br />
changes in the group of c<strong>on</strong>solidated companies) (137) (74) (88) (70) 57<br />
Balance, end of year<br />
Percentage of total net charge-offs to average<br />
3,343 1,938 1,705 1,670 1,928<br />
loans for the year 0.39 % 0.33 % 0.28 % 0.25 % 0.58 %<br />
The Group’s allowance for loan losses as of December 31, <str<strong>on</strong>g><strong>20</strong>09</str<strong>on</strong>g> was € 3.3 billi<strong>on</strong>, a 72 % increase from the<br />
€ 1.9 billi<strong>on</strong> reported for the end of <strong>20</strong>08. The increase in the Group’s allowance was principally due to provi-<br />
si<strong>on</strong>s exceeding substantially charge-offs.<br />
The Group’s gross charge-offs were € 1.2 billi<strong>on</strong> in <str<strong>on</strong>g><strong>20</strong>09</str<strong>on</strong>g>. Of the charge-offs for <str<strong>on</strong>g><strong>20</strong>09</str<strong>on</strong>g>, € 637 milli<strong>on</strong> were<br />
related to the Group’s corporate credit exposure, of which € 414 milli<strong>on</strong> were related to assets which had been<br />
reclassified in accordance with IAS 39 in the Group’s U.S. and U.K. portfolios, and € 419 milli<strong>on</strong> to the c<strong>on</strong>-<br />
sumer credit exposure, mainly driven by the Group’s German portfolios.<br />
The Group’s provisi<strong>on</strong> for loan losses in <str<strong>on</strong>g><strong>20</strong>09</str<strong>on</strong>g> was € 2.6 billi<strong>on</strong>, principally driven by € 1.8 billi<strong>on</strong> for its corpo-<br />
rate credit exposures, of which € 1.3 billi<strong>on</strong> of new provisi<strong>on</strong>s were established relating to assets which had<br />
S - 10
een reclassified in accordance with IAS 39, relating predominately to exposures in Leveraged Finance. The<br />
remaining increase reflected impairment charges taken <strong>on</strong> a number of exposures in the Americas and in<br />
Europe <strong>on</strong> the back of the overall deteriorating credit envir<strong>on</strong>ment. Loan loss provisi<strong>on</strong>s for PCAM amounted<br />
to € 805 milli<strong>on</strong>, predominately reflecting a more challenging credit envir<strong>on</strong>ment in Spain and Poland. Provisi<strong>on</strong>s<br />
in <str<strong>on</strong>g><strong>20</strong>09</str<strong>on</strong>g> were positively impacted by changes in certain parameter and model assumpti<strong>on</strong>s, which<br />
reduced provisi<strong>on</strong>s by € 87 milli<strong>on</strong> in CIB and € 146 milli<strong>on</strong> in PCAM.<br />
The Group’s individually assessed loan loss allowance was € 2.0 billi<strong>on</strong> as of December 31, <str<strong>on</strong>g><strong>20</strong>09</str<strong>on</strong>g>. The<br />
€ 1.1 billi<strong>on</strong> increase in <str<strong>on</strong>g><strong>20</strong>09</str<strong>on</strong>g> is comprised of net provisi<strong>on</strong>s of € 1.8 billi<strong>on</strong> (including the aforementi<strong>on</strong>ed<br />
impact from IAS 39 reclassificati<strong>on</strong>s), net charge-offs of € 637 milli<strong>on</strong> and a € 100 milli<strong>on</strong> decrease from currency<br />
translati<strong>on</strong> and unwinding effects.<br />
The Group’s collectively assessed loan loss allowance totaled € 1.3 billi<strong>on</strong> as of December 31, <str<strong>on</strong>g><strong>20</strong>09</str<strong>on</strong>g>,<br />
representing an increase of € 353 milli<strong>on</strong> against the level reported for the end of <strong>20</strong>08 (€ 961 milli<strong>on</strong>). Move-<br />
ments in this comp<strong>on</strong>ent include a € 808 milli<strong>on</strong> provisi<strong>on</strong>, including a positive impact by changes in certain<br />
parameter and model assumpti<strong>on</strong>s which reduced provisi<strong>on</strong> by € 87 milli<strong>on</strong>, being offset by € 419 milli<strong>on</strong> net<br />
charge-offs and a € 36 milli<strong>on</strong> net decrease from currency translati<strong>on</strong> and unwinding effects.<br />
The Group’s allowance for loan losses as of December 31, <strong>20</strong>08 was € 1.9 billi<strong>on</strong>, a 14 % increase from the<br />
€ 1.7 billi<strong>on</strong> reported for the end of <strong>20</strong>07. The increase in the Group’s allowance was principally due to provi-<br />
si<strong>on</strong>s exceeding the Group’s charge-offs.<br />
The Group’s gross charge-offs were € 990 milli<strong>on</strong> in <strong>20</strong>08. Of the charge-offs for <strong>20</strong>08, € 626 milli<strong>on</strong> were<br />
related to the Group’s c<strong>on</strong>sumer credit exposure, and € 364 milli<strong>on</strong> to the Group’s corporate credit exposure,<br />
mainly driven by the Group’s German and U.S. portfolios.<br />
The Group’s provisi<strong>on</strong> for loan losses in <strong>20</strong>08 was € 1.1 billi<strong>on</strong>, principally driven by the c<strong>on</strong>sumer credit<br />
exposure as a result of the deteriorating credit c<strong>on</strong>diti<strong>on</strong>s in Spain, higher delinquencies in Germany and Italy,<br />
as well as organic growth in Poland. For the Group’s corporate credit exposures, € 257 milli<strong>on</strong> new provisi<strong>on</strong>s<br />
were established in the sec<strong>on</strong>d half of <strong>20</strong>08 relating to assets which had been reclassified in accordance with<br />
IAS 39. Additi<strong>on</strong>al loan loss provisi<strong>on</strong>s within this portfolio were required <strong>on</strong> mainly European loans, reflecting<br />
the deteriorati<strong>on</strong> in credit c<strong>on</strong>diti<strong>on</strong>s.<br />
The Group’s individually assessed loan loss allowance was € 977 milli<strong>on</strong> as of December 31, <strong>20</strong>08. The<br />
€ 47 milli<strong>on</strong> increase in <strong>20</strong>08 is comprised of net provisi<strong>on</strong>s of € 382 milli<strong>on</strong> (including the aforementi<strong>on</strong>ed<br />
impact from IAS 39 reclassificati<strong>on</strong>s), net charge-offs of € 301 milli<strong>on</strong> and a € 34 milli<strong>on</strong> decrease from curren-<br />
cy translati<strong>on</strong> and unwinding effects.<br />
The Group’s collectively assessed loan loss allowance totaled € 961 milli<strong>on</strong> as of December 31, <strong>20</strong>08,<br />
representing an increase of € 186 milli<strong>on</strong> against the level reported for the end of <strong>20</strong>07 (€ 775 milli<strong>on</strong>). Move-<br />
ments in this comp<strong>on</strong>ent include a € 702 milli<strong>on</strong> provisi<strong>on</strong> being offset by € 477 milli<strong>on</strong> net charge-offs, and a<br />
€ 39 milli<strong>on</strong> net reducti<strong>on</strong> due to exchange rate movements and unwinding effects. Given this increase, the<br />
S - 11
<strong>20</strong>-F Supplemental Financial Informati<strong>on</strong> (Unaudited)<br />
Group’s collectively assessed loan loss allowance is almost at the same level as the individually assessed<br />
loan loss allowance.<br />
The Group’s allowance for loan losses as of December 31, <strong>20</strong>07 was € 1.7 billi<strong>on</strong>, virtually unchanged from<br />
the level reported at the end of <strong>20</strong>06.<br />
The Group’s gross charge-offs amounted to € 752 milli<strong>on</strong> in <strong>20</strong>07, an increase of € <strong>20</strong> milli<strong>on</strong>, or 3 %, from<br />
<strong>20</strong>06. Of the charge-offs for <strong>20</strong>07, € 244 milli<strong>on</strong> were related to the Group’s corporate credit exposure, and<br />
€ 508 milli<strong>on</strong> were related to the Group’s c<strong>on</strong>sumer credit exposure.<br />
The Group’s provisi<strong>on</strong> for loan losses in <strong>20</strong>07 was € 651 milli<strong>on</strong>, up € 299 milli<strong>on</strong>, or 85 %, primarily related to<br />
a single counterparty relati<strong>on</strong>ship in the Group’s Corporate and Investment <strong>Bank</strong> Group Divisi<strong>on</strong> and the<br />
Group’s c<strong>on</strong>sumer finance growth strategy. In <strong>20</strong>07, the Group’s total loan loss provisi<strong>on</strong> was principally<br />
driven by the Group’s smaller-balance standardized homogeneous loan portfolio.<br />
The Group’s individually assessed loan loss allowance was € 930 milli<strong>on</strong> as of December 31, <strong>20</strong>07, a decrease<br />
of € 55 milli<strong>on</strong>, or 6 %, from <strong>20</strong>06. The change is comprised of net charge-offs of € 149 milli<strong>on</strong>, a decrease of<br />
€ 52 milli<strong>on</strong> as a result of exchange rate changes and unwinding effects and a provisi<strong>on</strong> of € 146 milli<strong>on</strong>, an<br />
increase of € 130 milli<strong>on</strong> over the previous year. The individually assessed loan loss allowance was the<br />
largest comp<strong>on</strong>ent of the Group’s total allowance for loan losses.<br />
The Group’s collectively assessed loan loss allowance totaled € 775 milli<strong>on</strong> as of December 31, <strong>20</strong>07, a<br />
€ 91 milli<strong>on</strong> increase from the level at the end of <strong>20</strong>06, almost fully driven by the Group’s smaller-balance<br />
standardized homogeneous loan portfolio.<br />
The Group’s allowance for loan losses as of December 31, <strong>20</strong>06 was € 1.7 billi<strong>on</strong>, a 9 % decrease from the<br />
€ 1.8 billi<strong>on</strong> reported for the beginning of <strong>20</strong>06. The reducti<strong>on</strong> in the Group’s allowance was principally due to<br />
charge-offs exceeding the Group’s provisi<strong>on</strong>s.<br />
The Group’s gross charge-offs were € 732 milli<strong>on</strong> in <strong>20</strong>06. Of the charge-offs for <strong>20</strong>06, € 272 milli<strong>on</strong> were<br />
related to the Group’s corporate credit exposure, mainly driven by the Group’s German and U.S. portfolios,<br />
and € 460 milli<strong>on</strong> were related to the Group’s c<strong>on</strong>sumer credit exposure.<br />
The Group’s provisi<strong>on</strong> for loan losses in <strong>20</strong>06 was € 352 milli<strong>on</strong>, reflecting tight credit risk management, positive<br />
results of workout processes as well as the overall benign credit envir<strong>on</strong>ment. In <strong>20</strong>06, the Group’s total<br />
loan loss provisi<strong>on</strong> was principally driven by the Group’s smaller-balance standardized homogeneous loan<br />
portfolio.<br />
The Group’s individually assessed loan loss allowance was € 985 milli<strong>on</strong> as of December 31, <strong>20</strong>06. The<br />
€ 139 milli<strong>on</strong> decrease in <strong>20</strong>06 is comprised of net charge-offs of € 116 milli<strong>on</strong>, a provisi<strong>on</strong> of € 16 milli<strong>on</strong>, and<br />
a € 39 milli<strong>on</strong> decrease from currency translati<strong>on</strong> and unwinding effects. Notably, the individually assessed<br />
loan loss allowance was the largest comp<strong>on</strong>ent of the Group’s total allowance for loan losses.<br />
S - 12
The Group’s collectively assessed loan loss allowance totaled € 684 milli<strong>on</strong> as of December 31, <strong>20</strong>06, slightly<br />
below the level at the beginning of <strong>20</strong>06 (€ 708 milli<strong>on</strong>). Movements in this comp<strong>on</strong>ent include a € 336 milli<strong>on</strong><br />
provisi<strong>on</strong> being offset by € 328 milli<strong>on</strong> net charge-offs, and a € 32 milli<strong>on</strong> net reducti<strong>on</strong> due to exchange rate<br />
changes and unwinding effects.<br />
The Group’s allowance for loan losses as of December 31, <strong>20</strong>05 was € 1.9 billi<strong>on</strong>, an 18 % decrease from the<br />
€ 2.3 billi<strong>on</strong> reported at the end of <strong>20</strong>04. The reducti<strong>on</strong> in the Group’s allowance was principally due to<br />
charge-offs exceeding the Group’s net provisi<strong>on</strong>s.<br />
The Group’s gross charge-offs amounted to € 1.0 billi<strong>on</strong> in <strong>20</strong>05. Of the charge-offs for <strong>20</strong>05, € 580 milli<strong>on</strong><br />
were related to the Group’s corporate credit exposure, mainly driven by the Group’s German and American<br />
portfolios, and € 437 milli<strong>on</strong> were related to the Group’s c<strong>on</strong>sumer credit exposure.<br />
The Group’s provisi<strong>on</strong> for loan losses in <strong>20</strong>05 was € 374 milli<strong>on</strong>, reflecting tight credit risk management, posi-<br />
tive results of workout processes as well as the overall benign credit envir<strong>on</strong>ment. In <strong>20</strong>05, the Group’s total<br />
loan loss provisi<strong>on</strong> was principally driven by the Group’s smaller-balance standardized homogeneous loan<br />
portfolio.<br />
The Group’s specific loan loss allowance was € 1.2 billi<strong>on</strong> as of December 31, <strong>20</strong>05. The € 424 milli<strong>on</strong><br />
decrease in the Group’s allowance in <strong>20</strong>05 is comprised of net charge-offs of € 518 milli<strong>on</strong> and a net specific<br />
loan loss provisi<strong>on</strong> of € 52 milli<strong>on</strong>, which includes a € 72 milli<strong>on</strong> net release for n<strong>on</strong>-German clients and a<br />
€ 42 milli<strong>on</strong> increase from exchange rate changes. Notably, the specific loan loss allowance is the largest<br />
comp<strong>on</strong>ent of the Group’s total allowance for loan losses.<br />
The Group’s inherent loan loss allowance totaled € 698 milli<strong>on</strong> as of December 31, <strong>20</strong>05, slightly above the<br />
level at the end of <strong>20</strong>04 (€ 691 milli<strong>on</strong>). Movements in this comp<strong>on</strong>ent include € 365 milli<strong>on</strong> net provisi<strong>on</strong> being<br />
offset by € 330 milli<strong>on</strong> net charge-offs for the Group’s smaller-balance standardized homogeneous loan port-<br />
folio, and a € 23 milli<strong>on</strong> net reducti<strong>on</strong> in the Group’s other inherent loss allowance.<br />
The following table presents an analysis of the changes in the n<strong>on</strong>-German comp<strong>on</strong>ent of the allowance for<br />
loan losses. As of December 31, <str<strong>on</strong>g><strong>20</strong>09</str<strong>on</strong>g>, 71 % of the Group’s allowance for loan losses was attributable to<br />
internati<strong>on</strong>al clients.<br />
in € m. <str<strong>on</strong>g><strong>20</strong>09</str<strong>on</strong>g> <strong>20</strong>08 <strong>20</strong>07 <strong>20</strong>06 <strong>20</strong>05<br />
Balance, beginning of year 995 615 504 476 800<br />
Provisi<strong>on</strong> for loan losses 2,182 752 316 60 (53)<br />
Net charge-offs (682) (330) (162) (3) (312)<br />
Charge-offs (713) (385) (234) (136) (373)<br />
Recoveries 31 55 72 133 61<br />
Other changes (e.g. exchange rate changes,<br />
changes in the group of c<strong>on</strong>solidated companies) (104) (42) (43) (29) 57<br />
Balance, end of year 2,391 995 615 504 492<br />
The following table presents the comp<strong>on</strong>ents of the Group’s allowance for loan losses by industry of the bor-<br />
rower, and the percentage of its total loan portfolio accounted for by those industry classificati<strong>on</strong>s, <strong>on</strong> the<br />
S - 13
<strong>20</strong>-F Supplemental Financial Informati<strong>on</strong> (Unaudited)<br />
dates specified. The breakdown between German and n<strong>on</strong>-German borrowers is based <strong>on</strong> the locati<strong>on</strong> of the<br />
borrowers.<br />
in € m.<br />
(unless stated otherwise)<br />
German:<br />
Individually assessed loan<br />
loss allowance:<br />
Dec 31, <str<strong>on</strong>g><strong>20</strong>09</str<strong>on</strong>g> Dec 31, <strong>20</strong>08 Dec 31, <strong>20</strong>07 Dec 31, <strong>20</strong>06 Dec 31, <strong>20</strong>05<br />
<strong>Bank</strong>s and insurance 2 4 % 1 5 % – – – 1 % – 1 %<br />
Manufacturing<br />
Households (excluding<br />
199 3 % 165 3 % 176 4 % 246 4 % 288 4 %<br />
mortgages) 18 5 % 21 5 % 24 6 % 26 7 % 46 11 %<br />
Households – mortgages 3 15 % 5 13 % 5 17 % 10 18 % 14 18 %<br />
Public sector – 2 % – 2 % – 2 % – 1 % – 1 %<br />
Wholesale and retail trade<br />
Commercial real estate<br />
95 1 % 81 1 % 88 2 % 109 2 % 137 2 %<br />
activities 55 5 % 60 5 % 127 5 % 160 6 % 261 7 %<br />
Other<br />
Individually assessed loan loss<br />
126 5 % 146 5 % 189 6 % 172 8 % 229 8 %<br />
allowance German total<br />
Collectively assessed loan loss<br />
498 479 609 723 975<br />
allowance 454 464 481 443 461<br />
German total<br />
N<strong>on</strong>-German:<br />
Individually assessed loan<br />
952 40 % 943 39 % 1,090 42 % 1,166 46 % 1,436 52 %<br />
loss allowance<br />
Collectively assessed loan<br />
1,532 499 321 262 255<br />
loss allowance 859 496 294 242 237<br />
N<strong>on</strong>-German total 2,391 60 % 995 61 % 615 58 % 504 54 % 492 48 %<br />
Total allowance for loan losses<br />
Total individually assessed loan<br />
3,343 100 % 1,938 100 % 1,705 100 % 1,670 100 % 1,928 100 %<br />
loss allowance<br />
Total collectively assessed loan<br />
2,030 977 930 985 1,230<br />
loss allowance 1,313 961 775 684 698<br />
Total allowance for loan losses 3,343 1,938 1,705 1,670 1,928<br />
S - 14
Deposits<br />
The amount of other time deposits in the amount of U.S.$ 100,000 or more in offices in Germany was<br />
€ 24.8 billi<strong>on</strong> as of December 31, <str<strong>on</strong>g><strong>20</strong>09</str<strong>on</strong>g> thereof with maturities within three m<strong>on</strong>ths € 11.7 billi<strong>on</strong>, after three<br />
m<strong>on</strong>ths but within six m<strong>on</strong>ths € 1.8 billi<strong>on</strong>, after six m<strong>on</strong>ths but within <strong>on</strong>e year € 1.3 billi<strong>on</strong> and after <strong>on</strong>e year<br />
€ 10.0 billi<strong>on</strong>. There were no certificates of deposits in offices in Germany as of December 31, <str<strong>on</strong>g><strong>20</strong>09</str<strong>on</strong>g>.<br />
The amount of certificates of deposits and other time deposits in the amount of U.S.$ 100,000 or more issued<br />
by n<strong>on</strong>-German offices was € 24.8 billi<strong>on</strong> as of December 31, <str<strong>on</strong>g><strong>20</strong>09</str<strong>on</strong>g>.<br />
Total deposits by foreign depositors in German offices were € 32.3 billi<strong>on</strong>, € 34.2 billi<strong>on</strong> and € 35.7 billi<strong>on</strong> as of<br />
December 31, <str<strong>on</strong>g><strong>20</strong>09</str<strong>on</strong>g>, <strong>20</strong>08 and <strong>20</strong>07 respectively.<br />
Return <strong>on</strong> Equity and Assets<br />
<str<strong>on</strong>g><strong>20</strong>09</str<strong>on</strong>g> <strong>20</strong>08 <strong>20</strong>07<br />
Return <strong>on</strong> average shareholders’ equity (post-tax)1 14.62 % (11.13)% 17.92 %<br />
Return <strong>on</strong> average total assets (post-tax)2 0.26 % (0.18)% 0.36 %<br />
Equity to assets ratio3 1.78 % 1.60 % 2.01 %<br />
Dividend payout ratio4 :<br />
Basic earnings per share 9 % N/M 33 %<br />
Diluted earnings per share 10 % N/M 34 %<br />
N/M – Not meaningful<br />
1 Net income (loss) attributable to <strong>Deutsche</strong> <strong>Bank</strong> shareholders as a percentage of average shareholders’ equity.<br />
2 Net income (loss) attributable to <strong>Deutsche</strong> <strong>Bank</strong> shareholders as a percentage of average total assets.<br />
3 Average shareholders’ equity as a percentage of average total assets for each year.<br />
4 Dividends paid per share in respect of each year as a percentage of the Group’s basic and diluted earnings per share for that year. For <strong>20</strong>08, the payout<br />
ratio was not calculated due to the net loss.<br />
S - 15
<strong>20</strong>-F Supplemental Financial Informati<strong>on</strong> (Unaudited)<br />
Short-Term Borrowings<br />
Short-term borrowings are borrowings with an original maturity of <strong>on</strong>e year or less. The following table<br />
presents certain informati<strong>on</strong> relating to the categories of the Group’s short-term borrowings. The Group calculated<br />
the average balances based up<strong>on</strong> m<strong>on</strong>th-end balances.<br />
in € m.<br />
(unless stated otherwise)<br />
Central bank funds purchased and securities sold under repurchase agreements:<br />
Dec 31, <str<strong>on</strong>g><strong>20</strong>09</str<strong>on</strong>g> Dec 31, <strong>20</strong>08 Dec 31, <strong>20</strong>07<br />
Balance, end of year 45,495 87,117 178,741<br />
Average balance 77,131 179,198 139,354<br />
Maximum balance at any m<strong>on</strong>th-end 123,673 223,265 178,741<br />
Weighted-average interest rate during the year 0.36 % 2.47 % 4.93 %<br />
Weighted-average interest rate <strong>on</strong> year-end balance<br />
Securities loaned:<br />
0.77 % 2.73 % 3.02 %<br />
Balance, end of year 5,564 3,216 9,565<br />
Average balance 4,073 9,725 17,034<br />
Maximum balance at any m<strong>on</strong>th-end 9,403 23,996 29,684<br />
Weighted-average interest rate during the year 6.60 % 3.13 % 5.85 %<br />
Weighted-average interest rate <strong>on</strong> year-end balance<br />
Commercial paper:<br />
2.58 % 3.52 % 4.76 %<br />
Balance, end of year <strong>20</strong>,906 26,095 31,187<br />
Average balance 24,805 31,560 33,412<br />
Maximum balance at any m<strong>on</strong>th-end 30,857 35,985 36,<strong>20</strong>4<br />
Weighted-average interest rate during the year 0.82 % 3.29 % 5.53 %<br />
Weighted-average interest rate <strong>on</strong> year-end balance 0.91 % 3.01 % 4.92 %<br />
Other:<br />
Balance, end of year 21,991 13,0<strong>20</strong> 22,223<br />
Average balance 22,711 21,421 17,616<br />
Maximum balance at any m<strong>on</strong>th-end 28,377 26,6<strong>20</strong> 22,223<br />
Weighted-average interest rate during the year 2.62 % 4.05 % 4.64 %<br />
Weighted-average interest rate <strong>on</strong> year-end balance 2.01 % 5.09 % 3.96 %<br />
S - 16
N<strong>on</strong>-GAAP Financial Measures<br />
Target Definiti<strong>on</strong>s<br />
As discussed <strong>on</strong> page (v), this document and other documents the Group has published or may publish c<strong>on</strong>tain<br />
n<strong>on</strong>-GAAP financial measures. N<strong>on</strong>-GAAP financial measures are measures of the Group’s historical or<br />
future performance, financial positi<strong>on</strong> or cash flows that c<strong>on</strong>tain adjustments that exclude or include amounts<br />
that are included or excluded, as the case may be, from the most directly comparable measure calculated and<br />
presented in accordance with IFRS in the Group’s financial statements. The Group refers to the definiti<strong>on</strong>s of<br />
certain adjustments as “target definiti<strong>on</strong>s” because the Group has in the past used and may in the future use<br />
the n<strong>on</strong>-GAAP financial measures based <strong>on</strong> them to measure its financial targets.<br />
The Group’s n<strong>on</strong>-GAAP financial measures that relate to earnings use target definiti<strong>on</strong>s that adjust IFRS<br />
financial measures to exclude certain significant gains (such as gains from the sale of industrial holdings,<br />
businesses or premises) and certain significant charges (such as charges from restructuring, impairments of<br />
intangible assets or litigati<strong>on</strong>) if such gains or charges are not indicative of the future performance of the<br />
Group’s core businesses.<br />
IBIT attributable to <strong>Deutsche</strong> <strong>Bank</strong> Shareholders (Target Definiti<strong>on</strong>): The IBIT attributable to <strong>Deutsche</strong> <strong>Bank</strong><br />
shareholders n<strong>on</strong>-GAAP financial measure is based <strong>on</strong> income (loss) before income tax expense attributable<br />
to <strong>Deutsche</strong> <strong>Bank</strong> shareholders (i.e., less minority interest), adjusted for certain significant gains and charges<br />
as follows:<br />
<str<strong>on</strong>g><strong>20</strong>09</str<strong>on</strong>g> increase (decrease) <strong>20</strong>08 increase (decrease)<br />
from <strong>20</strong>08<br />
from <strong>20</strong>07<br />
in € m. <str<strong>on</strong>g><strong>20</strong>09</str<strong>on</strong>g> <strong>20</strong>08 <strong>20</strong>07 in € m. in % in € m. in %<br />
Income (loss) before income taxes (IBIT) 5,<strong>20</strong>2 (5,741) 8,749 10,943 N/M (14,490) N/M<br />
Less pre-tax minority interest 10 67 (36) (57) (85) 103 N/M<br />
IBIT attributable to <strong>Deutsche</strong> <strong>Bank</strong> shareholders<br />
Add (deduct):<br />
5,212 (5,675) 8,713 10,887 N/M (14,387) N/M<br />
Certain significant gains (net of related expenses) (236) 1<br />
(1,325) 2<br />
(955) 3<br />
1,088 (82) (370) 39<br />
Certain significant charges 138 4<br />
572 5<br />
74 6<br />
IBIT attributable to the <strong>Deutsche</strong> <strong>Bank</strong> shareholders<br />
(433) (76) 497 N/M<br />
(target definiti<strong>on</strong>) 5,114 (6,427) 7,832 11,541 N/M (14,259) N/M<br />
N/M – Not meaningful<br />
1 Gain from the sale of industrial holdings (Daimler AG) of € 236 milli<strong>on</strong>.<br />
2 Gains from the sale of industrial holdings (Daimler AG, Allianz SE and Linde AG) of € 1,228 milli<strong>on</strong> and a gain from the sale of the investment in Arcor AG & Co. KG of € 97 milli<strong>on</strong>.<br />
3 Gains from the sale of industrial holdings (Fiat S.p.A., Linde AG and Allianz SE) of € 514 milli<strong>on</strong>, income from equity method investments (<strong>Deutsche</strong> Interhotel Holding GmbH & Co.<br />
KG) of € 178 milli<strong>on</strong>, net of goodwill impairment charge of € 54 milli<strong>on</strong> and gains from the sale of premises (sale/leaseback transacti<strong>on</strong> of 60 Wall Street) of € 317 milli<strong>on</strong>.<br />
4 Reversal of impairment of intangible assets (Asset Management) of € 291 milli<strong>on</strong> (the related impairment had been recorded in <strong>20</strong>08), impairment charge of € 278 milli<strong>on</strong> <strong>on</strong> industrial<br />
holdings and an impairment of intangible assets (Corporate Investments) of € 151 milli<strong>on</strong>.<br />
5 Impairment of intangible assets (Asset Management) of € 572 milli<strong>on</strong>.<br />
6 Impairment of intangible assets (Asset Management) of € 74 milli<strong>on</strong>.<br />
S - 17
<strong>20</strong>-F Supplemental Financial Informati<strong>on</strong> (Unaudited)<br />
Pre-Tax Return <strong>on</strong> Average Active Equity (Target Definiti<strong>on</strong>): The pre-tax return <strong>on</strong> average active equity n<strong>on</strong>-<br />
GAAP financial measure is based <strong>on</strong> IBIT attributable to <strong>Deutsche</strong> <strong>Bank</strong> shareholders (target definiti<strong>on</strong>), as a<br />
percentage of the Group’s average active equity, which is defined below. For comparis<strong>on</strong>, also presented are<br />
pre-tax return <strong>on</strong> average shareholders’ equity, which is defined as income (loss) before income tax expense<br />
attributable to <strong>Deutsche</strong> <strong>Bank</strong> shareholders (i.e., less minority interest), as a percentage of average shareholders’<br />
equity, and pre-tax return <strong>on</strong> average active equity, which is defined as income (loss) before income<br />
tax expense attributable to <strong>Deutsche</strong> <strong>Bank</strong> shareholders (i.e., less minority interest), as a percentage of average<br />
active equity.<br />
Average Active Equity: The Group calculates active equity to make it easier to compare it to its competitors<br />
and refers to active equity in several ratios. However, active equity is not a measure provided for in IFRS and<br />
you should not compare the Group’s ratios based <strong>on</strong> average active equity to other companies’ ratios without<br />
c<strong>on</strong>sidering the differences in the calculati<strong>on</strong>. The items for which the Group adjusts the average shareholders’<br />
equity are average unrealized net gains (losses) <strong>on</strong> assets available for sale and <strong>on</strong> cash flow hedges<br />
(both comp<strong>on</strong>ents net of applicable taxes), as well as average dividends, for which a proposal is accrued <strong>on</strong> a<br />
quarterly basis and payments occur <strong>on</strong>ce a year following the approval by the general shareholders’ meeting.<br />
Tax rates applied in the calculati<strong>on</strong> of average active equity are those used in the financial statements for the<br />
individual items and not an average overall tax rate.<br />
in € m.<br />
(unless stated otherwise) <str<strong>on</strong>g><strong>20</strong>09</str<strong>on</strong>g> <strong>20</strong>08 <strong>20</strong>07<br />
1 Unless stated otherwise.<br />
2 The tax effect <strong>on</strong> average unrealized gains/losses <strong>on</strong> financial assets available for sale and <strong>on</strong> cash flow hedges was € (695) milli<strong>on</strong>, € (449) milli<strong>on</strong> and<br />
€ 30 milli<strong>on</strong> for the years ended December 31, <str<strong>on</strong>g><strong>20</strong>09</str<strong>on</strong>g>, <strong>20</strong>08 and <strong>20</strong>07, respectively.<br />
The n<strong>on</strong>-GAAP financial measure for growth in earnings per share is Diluted Earnings per Share (Target<br />
Definiti<strong>on</strong>), which is defined as net income (loss) attributable to <strong>Deutsche</strong> <strong>Bank</strong> shareholders (i.e., less minority<br />
interest), adjusted for post-tax effects of significant gains/charges and certain significant tax effects, after<br />
assumed c<strong>on</strong>versi<strong>on</strong>s, divided by the weighted average number of diluted shares outstanding. For reference,<br />
the Group’s diluted earnings per share, which is defined as net income (loss) attributable to <strong>Deutsche</strong> <strong>Bank</strong><br />
shareholders (i.e., less minority interest), after assumed c<strong>on</strong>versi<strong>on</strong>s, divided by the weighted average number<br />
of diluted shares outstanding, is also provided.<br />
S - 18<br />
<str<strong>on</strong>g><strong>20</strong>09</str<strong>on</strong>g> increase (decrease)<br />
from <strong>20</strong>08<br />
<strong>20</strong>08 increase (decrease)<br />
from <strong>20</strong>07<br />
in € m. in % 1 in € m. in % 1<br />
Average shareholders’ equity 34,016 34,442 36,134 (426) (1) (1,692) (5)<br />
Add (deduct):<br />
Average unrealized gains/losses <strong>on</strong> financial assets<br />
available for sale and <strong>on</strong> cash flow hedges, net of<br />
applicable tax 2 884 (619) (3,841) 1,503 N/M 3,222 (84)<br />
Average dividend accruals (287) (1,743) (2,<strong>20</strong>0) 1,456 (84) 457 (21)<br />
Average active equity 34,613 32,079 30,093 2,534 8 1,986 7<br />
Pre-tax return <strong>on</strong> average shareholders’ equity 15.3 % (16.5)% 24.1 % 31.8 ppt (40.6) ppt<br />
Pre-tax return <strong>on</strong> average active equity 15.1 % (17.7)% 29.0 % 32.8 ppt (46.7) ppt<br />
Pre-tax return <strong>on</strong> average active equity (target definiti<strong>on</strong>) 14.8 % (<strong>20</strong>.0)% 26.0 % 34.8 ppt (46.0) ppt
in € m.<br />
(unless stated otherwise) <str<strong>on</strong>g><strong>20</strong>09</str<strong>on</strong>g> <strong>20</strong>08 <strong>20</strong>07<br />
Diluted earnings per share € 7.59 € (7.61) € 13.05 € 15.<strong>20</strong> N/M € (<strong>20</strong>.66) N/M<br />
Diluted earnings per share (target definiti<strong>on</strong>)<br />
N/M – Not meaningful<br />
€ 7.45 € (9.51) € 10.79 € 16.96 N/M € (<strong>20</strong>.30) N/M<br />
1 Reversal of impairment of intangible assets (Asset Management) of € 173 milli<strong>on</strong> (the related impairment had been recorded in <strong>20</strong>08), a gain from the sale of industrial holdings<br />
(Daimler AG) of € 236 milli<strong>on</strong>, an impairment charge of € 221 milli<strong>on</strong> <strong>on</strong> industrial holdings and an impairment of intangible assets (Corporate Investments) of € 98 milli<strong>on</strong>.<br />
2 Gains from the sale of industrial holdings (Daimler AG, Allianz SE and Linde AG) of € 1,228 milli<strong>on</strong>, a gain from the sale of the investment in Arcor AG & Co. KG of € 86 milli<strong>on</strong> and an<br />
impairment of intangible assets (Asset Management) of € 355 milli<strong>on</strong>.<br />
3 Gains from the sale of industrial holdings (Fiat S.p.A., Linde AG and Allianz SE) of € 512 milli<strong>on</strong>, income from equity method investments (<strong>Deutsche</strong> Interhotel Holding GmbH & Co.<br />
KG) of € 125 milli<strong>on</strong>, net of goodwill impairment charge of € 54 milli<strong>on</strong>, gains from the sale of premises (sale/leaseback transacti<strong>on</strong> of 60 Wall Street) of € 172 milli<strong>on</strong> and an<br />
impairment of intangible assets (Asset Management) of € 44 milli<strong>on</strong>.<br />
4 Enactment of the German tax reform and utilizati<strong>on</strong> of capital losses.<br />
Leverage Ratio (Target Definiti<strong>on</strong>): A leverage ratio is calculated by dividing total assets by total equity. The<br />
Group discloses an adjusted leverage ratio, which is calculated using a target definiti<strong>on</strong>, for which the following<br />
adjustments are made: (1) total assets under IFRS are adjusted to reflect netting provisi<strong>on</strong>s applicable<br />
under U.S. GAAP but not under IFRS, to obtain total assets adjusted (pro forma U.S. GAAP), and (2) total<br />
equity under IFRS is adjusted to reflect fair value gains and losses <strong>on</strong> all own debt (post-tax), to obtain total<br />
equity adjusted. The tax rate applied for this calculati<strong>on</strong> is a blended uniform tax rate of 35 %. These adjustments<br />
are intended to provide an adjusted leverage ratio that is more comparable to those of certain of the<br />
Group’s competitors, which use U.S. GAAP and designate all their own debt at fair value.<br />
1 Estimate assuming that all own debt was designated at fair value. The tax effect <strong>on</strong> pro-forma fair value gains (losses) <strong>on</strong> all own debt was € (0.7) billi<strong>on</strong><br />
and € (2.4) billi<strong>on</strong> for the years ended December 31, <str<strong>on</strong>g><strong>20</strong>09</str<strong>on</strong>g> and <strong>20</strong>08, respectively.<br />
.<br />
S - 19<br />
<str<strong>on</strong>g><strong>20</strong>09</str<strong>on</strong>g> increase (decrease)<br />
from <strong>20</strong>08<br />
<strong>20</strong>08 increase (decrease)<br />
from <strong>20</strong>07<br />
in € m. in % in € m. in %<br />
Net income (loss) attributable to <strong>Deutsche</strong> <strong>Bank</strong><br />
shareholders<br />
Add (deduct):<br />
4,973 (3,835) 6,474 8,808 N/M (10,309) N/M<br />
Post-tax effect of certain significant gains/charges (90) 1<br />
(959) 2<br />
(710) 3<br />
868 (91) (248) 35<br />
Certain significant tax effects – – (409) 4<br />
Net income (loss) attributable to <strong>Deutsche</strong> <strong>Bank</strong><br />
– N/M 409 N/M<br />
shareholders (basis for target definiti<strong>on</strong> EPS) 4,883 (4,794) 5,355 9,676 N/M (10,148) N/M<br />
in € bn.<br />
(unless stated otherwise) Dec 31, <str<strong>on</strong>g><strong>20</strong>09</str<strong>on</strong>g> Dec 31, <strong>20</strong>08<br />
Total assets (IFRS) 1,501 2,<strong>20</strong>2<br />
Adjust derivatives according to U.S. GAAP netting rules (533) (1,097)<br />
Adjust pending settlements according to U.S. GAAP netting rules (71) (69)<br />
Adjust repos according to U.S. GAAP netting rules (5) (7)<br />
Total assets adjusted ("pro-forma U.S. GAAP") 891 1,030<br />
Total equity (IFRS) 38.0 31.9<br />
Adjust pro-forma fair value gains (losses) <strong>on</strong> all own debt (post-tax)1 1.3 4.4<br />
Total equity adjusted 39.3 36.3<br />
Leverage ratio based <strong>on</strong> total equity<br />
According to IFRS 40 69<br />
According to target definiti<strong>on</strong> 23 28
(This page intenti<strong>on</strong>ally left blank)
<strong>Deutsche</strong> <strong>Bank</strong> Aktiengesellschaft<br />
Theodor-Heuss-Allee 70<br />
60262 Frankfurt am Main<br />
Germany<br />
Teleph<strong>on</strong>e: +49 69 910-00<br />
deutsche.bank@db.com
<strong>20</strong>10<br />
Apr 27, <strong>20</strong>10 Interim <str<strong>on</strong>g>Report</str<strong>on</strong>g> as of March 31, <strong>20</strong>10<br />
May 27, <strong>20</strong>10 <str<strong>on</strong>g>Annual</str<strong>on</strong>g> General Meeting in the Festhalle<br />
Frankfurt am Main (Exhibiti<strong>on</strong> Center)<br />
May 28, <strong>20</strong>10 Dividend payment<br />
Jul 28, <strong>20</strong>10 Interim <str<strong>on</strong>g>Report</str<strong>on</strong>g> as of June 30, <strong>20</strong>10<br />
Oct 28, <strong>20</strong>10 Interim <str<strong>on</strong>g>Report</str<strong>on</strong>g> as of September 30, <strong>20</strong>10<br />
<strong>20</strong>11<br />
Feb 3, <strong>20</strong>11 Preliminary results for the <strong>20</strong>10 financial year<br />
Mar 15, <strong>20</strong>11 <str<strong>on</strong>g>Annual</str<strong>on</strong>g> <str<strong>on</strong>g>Report</str<strong>on</strong>g> <strong>20</strong>10 and <strong>Form</strong> <strong>20</strong>-F<br />
Apr 28, <strong>20</strong>11 Interim <str<strong>on</strong>g>Report</str<strong>on</strong>g> as of March 31, <strong>20</strong>11<br />
May 26, <strong>20</strong>11 <str<strong>on</strong>g>Annual</str<strong>on</strong>g> General Meeting in the Festhalle<br />
Frankfurt am Main (Exhibiti<strong>on</strong> Center)<br />
May 27, <strong>20</strong>11 Dividend payment<br />
Jul 27, <strong>20</strong>11 Interim <str<strong>on</strong>g>Report</str<strong>on</strong>g> as of June 30, <strong>20</strong>11<br />
Oct 26, <strong>20</strong>11 Interim <str<strong>on</strong>g>Report</str<strong>on</strong>g> as of September 30, <strong>20</strong>11