Estimation of available seagrass meadow area in Portugal for ...
Estimation of available seagrass meadow area in Portugal for ...
Estimation of available seagrass meadow area in Portugal for ...

Create successful ePaper yourself
Turn your PDF publications into a flip-book with our unique Google optimized e-Paper software.
Journal <strong>of</strong> Coastal Research SI 56 pg - pg ICS2009 (Proceed<strong>in</strong>gs) <strong>Portugal</strong> ISSN<br />
<strong>Estimation</strong> <strong>of</strong> <strong>available</strong> <strong>seagrass</strong> <strong>meadow</strong> <strong>area</strong> <strong>in</strong> <strong>Portugal</strong> <strong>for</strong><br />
transplant<strong>in</strong>g purposes.<br />
A. H. Cunha, J. Assis, E. A. Serrão<br />
Centro de Ciências do Mar, CIMAR-L.A.<br />
Universidade do Algarve, Campus de Gambelas<br />
8005-139 Faro – <strong>Portugal</strong><br />
acunha@ualg.pt<br />
ABSTRACT<br />
CUNHA, A. H., ASSIS, J., and SERRÃO, E.A. 2009. <strong>Estimation</strong> <strong>of</strong> the <strong>available</strong> <strong>seagrass</strong> <strong>meadow</strong> <strong>area</strong> <strong>in</strong> <strong>Portugal</strong><br />
<strong>for</strong> transplant<strong>in</strong>g purposes. Journal <strong>of</strong> Coastal Research, SI 56 (Proceed<strong>in</strong>gs <strong>of</strong> the 10 th International Coastal<br />
Symposium), pg – pg. Lisbon, <strong>Portugal</strong>, ISBN<br />
Seagrasses are mar<strong>in</strong>e flower<strong>in</strong>g plants found <strong>in</strong> shallow coastal habitats around the world. These plants create a<br />
habitat <strong>of</strong> substantial importance from an ecological, economic and biodiversity po<strong>in</strong>t <strong>of</strong> view. Un<strong>for</strong>tunately,<br />
there have been considerable losses <strong>of</strong> <strong>seagrass</strong> habitat worldwide, lead<strong>in</strong>g to <strong>in</strong>creas<strong>in</strong>g <strong>in</strong>terest on the<br />
development <strong>of</strong> <strong>seagrass</strong> restoration and rehabilitation projects. These projects, <strong>of</strong>ten developed as a mitigation<br />
tool, deeply benefit from the spatially explicit <strong>in</strong><strong>for</strong>mation <strong>in</strong>cluded <strong>in</strong> Geographic In<strong>for</strong>mation Systems (GIS).<br />
Thus, to have <strong>seagrass</strong> <strong>area</strong> estimates <strong>for</strong> transplant<strong>in</strong>g purposes and, to be able to monitor transplant<strong>in</strong>g impacts,<br />
a large-scale GIS map was build <strong>for</strong> Sado and Mira River Estuaries, Port<strong>in</strong>ho da Arrábida Bay and Ria Formosa<br />
regions us<strong>in</strong>g: (1) aerial photography analysis, (2) photo-<strong>in</strong>terpretation, (3) on-site groundtruth<strong>in</strong>g surveys and<br />
(4) statistical analysis. Habitat boundaries were evaluated through aerial photography, and a complete set <strong>of</strong><br />
selected sites were visited <strong>for</strong> groundtruth validation, us<strong>in</strong>g 4 types <strong>of</strong> transect methods (along the shore-l<strong>in</strong>e,<br />
free-div<strong>in</strong>g, scuba div<strong>in</strong>g and boat transects). Twelve thousand, six hundred and fifty two hectares (12652.17 ha)<br />
were assessed, 3944 groundtruth po<strong>in</strong>ts were recorded and 3 <strong>seagrass</strong> species were identified and mapped<br />
(Zostera mar<strong>in</strong>a, Zostera noltii and Cymodocea nodosa). Ria Formosa had the largest distribution <strong>area</strong> <strong>of</strong><br />
<strong>seagrass</strong> species (241.04 ha), followed by Sado Estuary (32.68 ha). Mira Estuary had only one <strong>seagrass</strong> <strong>meadow</strong><br />
and <strong>in</strong> Port<strong>in</strong>ho da Arrábida Bay no <strong>seagrass</strong> <strong>meadow</strong>s were registered. Zostera noltii was the most abundant<br />
species <strong>in</strong> both regions, followed by Cymodocea nodosa and Zostera mar<strong>in</strong>a. The error assessment <strong>for</strong> species<br />
distribution <strong>area</strong> and diversity, estimated through kappa statistics based on error matrices, gave a perfect<br />
agreement value (K=0.912) to the methodology used.<br />
ADDITIONAL INDEX WORDS: GIS, Mapp<strong>in</strong>g, Seagrass, Restoration<br />
INTRODUCTION<br />
Seagrass <strong>meadow</strong>s provide a wide array <strong>of</strong> ecological<br />
functions that are important <strong>in</strong> ma<strong>in</strong>ta<strong>in</strong><strong>in</strong>g healthy estuar<strong>in</strong>e and<br />
coastal ecosystems (ORTH et al., 1984, THAYER et al., 1984, HECK<br />
et al., 1995). They <strong>in</strong>crease the stability <strong>of</strong> the seafloor through<br />
the growth <strong>of</strong> extensive rhizome mats (FONSECA and FISHER,<br />
1986), play a critical role <strong>in</strong> primary production, <strong>in</strong>clud<strong>in</strong>g the<br />
harness<strong>in</strong>g and cycl<strong>in</strong>g <strong>of</strong> nutrients (HILLMAN et al., 1989), and<br />
provide valuable habitat <strong>for</strong> a diverse array <strong>of</strong> mar<strong>in</strong>e organisms<br />
(SHORT and WYLLIE-ECHEVERRIA, 1996, DUARTE, 2002, ORTH et<br />
al. 2006). Un<strong>for</strong>tunately, over the last years, Atlantic <strong>seagrass</strong><br />
populations have decl<strong>in</strong>ed due to pollution associated with<br />
<strong>in</strong>creased human populations (KEMP et al., 1983, VALIELA et al.,<br />
1992) and episodic occurrences <strong>of</strong> the wast<strong>in</strong>g disease (SHORT et<br />
al. 1986, DEN HARTOG, 1994), as well as other human-<strong>in</strong>duced<br />
and natural disturbances (SHORT and WYLLIE-ECHEVERRIA, 1996,<br />
ORTH et al,. 2006).<br />
Major ef<strong>for</strong>ts have been developed to implement <strong>seagrass</strong><br />
restoration and rehabilitation projects (Pall<strong>in</strong>g et al., 2009). The<br />
approaches that <strong>in</strong>volve the collection <strong>of</strong> mature <strong>seagrass</strong> from<br />
donor populations <strong>for</strong> transplant<strong>in</strong>g purposes, to <strong>area</strong>s <strong>of</strong> <strong>seagrass</strong><br />
Journal <strong>of</strong> Coastal Research, Special Issue 56, 2009<br />
loss (e.g. SEDDON, 2004), deeply benefit from the spatially explicit<br />
<strong>in</strong><strong>for</strong>mation <strong>in</strong>cluded <strong>in</strong> benthic habitat maps. With this type <strong>of</strong><br />
basel<strong>in</strong>e <strong>in</strong><strong>for</strong>mation, plann<strong>in</strong>g managers and researchers are<br />
allowed to better choose population donor sites and to monitor<br />
spatial and temporal changes <strong>in</strong> species distribution at a landscape<br />
level. The use <strong>of</strong> applications such as Geographic In<strong>for</strong>mation<br />
System (GIS) and fieldbased measurements us<strong>in</strong>g Geographic<br />
Position<strong>in</strong>g System (GPS) have become common place methods<br />
to achieve precise habitat mapp<strong>in</strong>g and spatial resource<br />
management decision-mak<strong>in</strong>g (BRETZ et al., 1998).<br />
The present paper describes the approach used <strong>in</strong> the Biomares<br />
restoration project to build a large-scale benthic habitat map to<br />
assess the potential donor <strong>seagrass</strong> <strong>meadow</strong>s <strong>area</strong> coverage<br />
<strong>available</strong> <strong>in</strong> <strong>Portugal</strong> <strong>for</strong> transplant<strong>in</strong>g purposes. It is also the first<br />
attempt to estimate total <strong>seagrass</strong> cover <strong>in</strong> the regions studied.<br />
Biomares, a European Union Life project (LIFE06 NAT/P/192),<br />
aims to restore and manage the biodiversity <strong>of</strong> the Mar<strong>in</strong>e Park<br />
Site Arrábida-Espichel.<br />
METHODS<br />
A large-scale <strong>seagrass</strong> habitat map was built dur<strong>in</strong>g the year<br />
2007, <strong>for</strong> Sado and Mira Rivers Estuary, Port<strong>in</strong>ho da Arrábida
<strong>Estimation</strong> <strong>of</strong> the <strong>available</strong> <strong>seagrass</strong> <strong>meadow</strong> <strong>area</strong> <strong>in</strong> <strong>Portugal</strong> <strong>for</strong> transplant<strong>in</strong>g purposes<br />
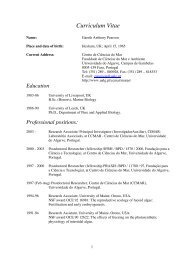
Bay and Ria Formosa regions (Figure 1). Intertidal and subtidal<br />
<strong>area</strong>s were surveyed <strong>for</strong> all regions except <strong>for</strong> Ria Formosa, where<br />
data from <strong>in</strong>tertidal zone was <strong>available</strong> from a previous work<br />
(Guimarães, 2007). Aerial photography, on-site groundtruth<strong>in</strong>g<br />
surveys, photo-<strong>in</strong>terpretation and statistical analysis was used<br />
follow<strong>in</strong>g the methods by ISRAEL and FYFE, 1996, WYLLIE et al.,<br />
1997, KENDRICK et al., 1999, 2002.<br />
Figure 1. Studied regions (Arrábida, Sado Estuary, Mira Estuary<br />
and Ria Formosa).<br />
One essential concern to conduct a mar<strong>in</strong>e habitat map is the<br />
use <strong>of</strong> an appropriate classification scheme. General consensus <strong>of</strong><br />
the <strong>seagrass</strong> habitat mapp<strong>in</strong>g community is that the simpler the<br />
system, the greater the chance <strong>of</strong> consistency and improved<br />
accuracy <strong>in</strong> the mapp<strong>in</strong>g results and the greater the opportunity <strong>for</strong><br />
replication <strong>of</strong> the mapp<strong>in</strong>g over several time periods (DAVISON<br />
and HUGHES, 1998). In order to describe the habitat a GIS<br />
classification scheme was developed under a simple hierarchical<br />
system. From a landscape perspective, the spatial structure <strong>of</strong> the<br />
habitats was conceptualized at 4 simple different levels: (1) Sandy<br />
or Muddy bottom, (2) Rocky bottom, (3) algal bed, and (4)<br />
<strong>seagrass</strong> <strong>meadow</strong>.<br />
Aerial photography remote sens<strong>in</strong>g<br />
A set <strong>of</strong> the latest rectified orthophotographs <strong>of</strong> the studied<br />
regions were selected with<strong>in</strong> the archives <strong>of</strong> the Instituto<br />
Geográfico Português and loaded <strong>in</strong>to ArcGis 9.1 s<strong>of</strong>tware, to<br />
generate a first draft habitat map. Interpretation and draw<strong>in</strong>g <strong>of</strong> the<br />
extension and boundaries <strong>of</strong> the habitats, was realized by onscreen<br />
digitiz<strong>in</strong>g techniques (GALDIES and BORG, 2006). For each<br />
identified <strong>area</strong> assigned accord<strong>in</strong>g to the classification scheme, a<br />
polygon was constructed. Brightness, contrast, and occasionally<br />
color balance <strong>of</strong> the mosaics were manipulated to enhance the<br />
<strong>in</strong>terpretability <strong>of</strong> some subtle field features and boundaries.<br />
Groundtruth validation<br />
Journal <strong>of</strong> Coastal Research, Special Issue 56, 2009<br />
Selected field sites were visited, explor<strong>in</strong>g all study regions<br />
<strong>for</strong> groundtruth validation to achieve a better agreement <strong>of</strong> the<br />
draft maps polygon boundaries and to assign the correspondent<br />
<strong>seagrass</strong> species to the constructed polygons. Accurate GPS<br />
positions with field features follow<strong>in</strong>g the classification scheme,<br />
were gathered <strong>in</strong> low tide periods, us<strong>in</strong>g 4 types <strong>of</strong> transect<br />
methods (transects along the shore l<strong>in</strong>e, free div<strong>in</strong>g transects,<br />
scuba div<strong>in</strong>g transects and boat transects) with systematically<br />
unaligned orientations (ARONOFF, 1985), diagonally to the shore<br />
l<strong>in</strong>e from shallow to deeper water, and reverse. For supratidal field<br />
sites, groundtruth<strong>in</strong>g was made by walk<strong>in</strong>g along the shore l<strong>in</strong>e,<br />
accurately register<strong>in</strong>g GPS po<strong>in</strong>ts with the observed field features.<br />
For shallow subtidal sites, <strong>in</strong>accessible by boat, groundtruth<strong>in</strong>g<br />
was made by means <strong>of</strong> free div<strong>in</strong>g (snorkel<strong>in</strong>g) <strong>in</strong> clear water<br />
conditions. Deep water or low visibility subtidal sites were<br />
visually evaluated by means <strong>of</strong> scuba div<strong>in</strong>g, plac<strong>in</strong>g the GPS unit<br />
to float on the water’s surface, <strong>in</strong> a hous<strong>in</strong>g attached to a buoy,<br />
vertically positioned over the scuba diver. For large open sites<br />
with clear water, long distance boat/canoe transects were made,<br />
us<strong>in</strong>g a crystal glass tube to better visually groundtruth the<br />
underwater field features. The habitat signatures and transitions,<br />
<strong>in</strong>tercepted by the transects, were evaluated, and a georeferenced<br />
text table was compiled and loaded to ArcGis 9.1 s<strong>of</strong>tware <strong>in</strong><br />
order to better place the drafts map polygon boundaries and to<br />
assign the <strong>seagrass</strong> species <strong>in</strong><strong>for</strong>mation to the drawn polygons.<br />
Error assessment<br />
Map users should be able to evaluate whether the accuracy <strong>of</strong><br />
the map suits their objectives or not (CONGALTON, 1991). Error<br />
matrices, also known as confusion matrices, have become a<br />
widely accepted method to report the error <strong>of</strong> mapped data (SMITS<br />
et al., 1999). Follow<strong>in</strong>g CARLETTA (1996), the habitat map error<br />
assessment was based on the concordance agreement scale<br />
(LANDIS and KOCH, 1977) <strong>of</strong> the Kappa coefficient statistical<br />
method (COHEN, 1960). This coefficient, calculated from error<br />
matrices, was <strong>in</strong>troduced to the remote sens<strong>in</strong>g community <strong>in</strong> the<br />
early 1980s (CONGALTON et al., 1991) and has become a widely<br />
used measure <strong>for</strong> classification accuracy.<br />
The study sites error matrices data were recorded <strong>for</strong> 100<br />
po<strong>in</strong>ts <strong>in</strong> 2 haphazardly chosen locations, follow<strong>in</strong>g the<br />
classification scheme. Furthermore, the accuracy measured at<br />
these 2 regions was assumed to be representative <strong>of</strong> the overall<br />
maps accuracy, elsewhere <strong>in</strong> the study <strong>area</strong> (CONGALTON, 1991).<br />
Seagrass habitat map analysis<br />
In order to have measures <strong>of</strong> technical ef<strong>for</strong>t dispended <strong>in</strong> the<br />
groundtruth process, the number <strong>of</strong> groundtruth po<strong>in</strong>ts and<br />
surveyed <strong>area</strong> were reported and calculated. Seagrass habitat map,<br />
number <strong>of</strong> <strong>seagrass</strong> <strong>meadow</strong>s, estimated <strong>seagrass</strong> species <strong>area</strong> per<br />
region (TESSD) and total estimated <strong>seagrass</strong> <strong>area</strong> per region were<br />
calculated and reported. Moreover, <strong>seagrass</strong> habitat maps were<br />
generated <strong>for</strong> each studied region to visually evaluate the most<br />
diverse localities <strong>in</strong> terms <strong>of</strong> <strong>seagrass</strong> species, number and <strong>area</strong> <strong>of</strong><br />
<strong>seagrass</strong> <strong>meadow</strong>s.
RESULTS<br />
The identified <strong>seagrass</strong> <strong>meadow</strong>s boundaries <strong>in</strong> the<br />
orthophotographs were del<strong>in</strong>eated around signatures (e.g. <strong>area</strong>s<br />
with a specific and similar color and texture patterns). A total <strong>of</strong><br />
412 <strong>seagrass</strong> <strong>meadow</strong>s were identified and polygons constructed.<br />
For Ria Formosa, 342 <strong>seagrass</strong> <strong>meadow</strong>s were identified, while<br />
Sado Estuary registered 64. Dur<strong>in</strong>g 31 days <strong>of</strong> field work, a total<br />
<strong>area</strong> <strong>of</strong> 12652.17 hectares was assessed and 3944 groundtruth<br />
po<strong>in</strong>ts (GP) were recorded. Free-div<strong>in</strong>g and scuba div<strong>in</strong>g transects<br />
along the shore-l<strong>in</strong>e and boat transects were applied <strong>in</strong> all regions,<br />
except <strong>in</strong> the Mira Estuary, where only boat transects were used.<br />
Ria Formosa had the largest number <strong>of</strong> groundtruth po<strong>in</strong>ts (GP),<br />
followed by the Sado Estuary, the Mira Estuary and Arrábida. The<br />
classification scheme followed was: sandy and muddy bottoms,<br />
rocky bottoms, algae <strong>meadow</strong>s and the 3 <strong>seagrass</strong> species (Zostera<br />
mar<strong>in</strong>a, Zostera noltii and Cymodocea nodosa). The groundtruth<br />
records were used to correct the polygon boundaries <strong>of</strong> the draft<br />
habitat map, which led to the f<strong>in</strong>al <strong>seagrass</strong> distribution map. Ria<br />
Formosa and Sado Estuary had 3 <strong>seagrass</strong> species, while <strong>in</strong> Mira<br />
Estuary only 1 species was recorded (Z. noltii). No <strong>seagrass</strong><br />
<strong>meadow</strong>s were found <strong>in</strong> Port<strong>in</strong>ho da Arrábida Bay (Table 1).<br />
Table 1. Seagrass species <strong>meadow</strong>s and total estimated <strong>seagrass</strong><br />
species distribution <strong>area</strong> (TESSD) <strong>for</strong> Port<strong>in</strong>ho da Arrábida Bay,<br />
Sado and Mira Rivers Estuaries and Ria Formosa (ZM <strong>for</strong><br />
Zostera mar<strong>in</strong>a, ZN <strong>for</strong> Zostera noltii and CN <strong>for</strong> Cymodocea<br />
nodosa). The values <strong>for</strong> Z. noltii <strong>area</strong>s from Ria Formosa only<br />
<strong>in</strong>cludes the subtidal <strong>area</strong>s.<br />
Region Species Meadows TESSD (ha)<br />
Port. Arrábida – 0 0<br />
Sado Estuary ZM 93 1.16<br />
ZN 203 28.38<br />
CN 46 3.14<br />
Mira Estuary ZN* 1 0.006<br />
Ria Formosa ZM 42 5.01<br />
ZN 7 144.78<br />
CN 15 91.26<br />
*The <strong>seagrass</strong> <strong>meadow</strong> found <strong>in</strong> Rio Mira had very sparse plant<br />
shoots and hard to f<strong>in</strong>d <strong>in</strong> the <strong>area</strong>.<br />
The total estimated <strong>seagrass</strong> distribution <strong>area</strong> <strong>of</strong> Ria Formosa<br />
and Sado Estuary was 241.05 ha and 32.68 ha. The most well<br />
represented species <strong>in</strong> Ria Formosa and Sado Estuary was Z.<br />
noltii, followed by C. nodosa and Z. mar<strong>in</strong>a. For the Ria Formosa<br />
region, Faro, Olhão, Culatra and Fuzeta were the localities with<br />
the highest species richness (3 species), with a total <strong>seagrass</strong> cover<br />
<strong>area</strong> <strong>of</strong> 15.75 ha (58 <strong>meadow</strong>s) <strong>for</strong> Faro, 39.58 ha (46 <strong>meadow</strong>s)<br />
<strong>for</strong> Olhão, 62.65 ha (47 <strong>meadow</strong>s) <strong>for</strong> Culatra and 44.52 ha (88<br />
<strong>meadow</strong>s) <strong>for</strong> the Fuzeta sites. In the Sado Estuary region, Tróia<br />
had the highest species richness (3 species), whereas Cabeços do<br />
Rio, Comporta and Pé de Cavalo had the largest Z. noltii <strong>meadow</strong>s<br />
present, with 7.78 ha (7 <strong>meadow</strong>s), 7.03 ha (8 <strong>meadow</strong>s) and<br />
17.98 ha (3 <strong>meadow</strong>s), respectively. In Caldeira, Moit<strong>in</strong>ha, and<br />
Águas de Moura, no <strong>seagrass</strong> <strong>meadow</strong>s were detected. Ria<br />
Formosa (Figure 2) had the larger distribution <strong>for</strong> the 3 identified<br />
<strong>seagrass</strong> species followed by the Sado Estuary (Figure 3).<br />
A. Cunha, J. Assis and E. Serrão<br />
Journal <strong>of</strong> Coastal Research, Special Issue 56, 2009<br />
An error matrix was built us<strong>in</strong>g 100 GPS po<strong>in</strong>ts recorded <strong>in</strong><br />
the Ria Formosa and Sado Estuary regions (Table 2). Sandy and<br />
muddy bottoms, Z. mar<strong>in</strong>a Z. noltii and C. nodosa <strong>meadow</strong>s were<br />
registered. No rocky bottoms or algal mats were registered <strong>in</strong> this<br />
process. Us<strong>in</strong>g the Kappa coefficient equation, the concordance<br />
agreement scale estimated was 0.91.<br />
Table 2. Error matrix. Based on 100 GPS records <strong>for</strong> Sado<br />
Estuary and Ria Formosa regions. Sandy and muddy bottoms<br />
(SMB) Rocky bottom (RB) Algae <strong>meadow</strong> (AM) Zostera mar<strong>in</strong>a<br />
(ZM) Zostera noltii (ZN) Cymodocea nodosa (CN).<br />
SMB RB AM ZM ZN CN<br />
SMB 29 0 0 1 3 2<br />
RB 0 0 0 0 0 0<br />
AM 0 0 0 0 0 0<br />
ZM 2 0 0 16 0 2<br />
ZN 2 0 0 1 18 0<br />
CN 1 0 0 1 1 21<br />
Figure 2. Seagrass distribution <strong>in</strong> Ria Formosa.<br />
Figure 3. Seagrass distribution <strong>in</strong> Sado Estuary.
<strong>Estimation</strong> <strong>of</strong> the <strong>available</strong> <strong>seagrass</strong> <strong>meadow</strong> <strong>area</strong> <strong>in</strong> <strong>Portugal</strong> <strong>for</strong> transplant<strong>in</strong>g purposes<br />
DISCUSSION<br />
The use <strong>of</strong> aerial photography methods is a valuable tool <strong>for</strong><br />
natural resource managers and researchers to document the<br />
location and extent <strong>of</strong> <strong>seagrass</strong> <strong>meadow</strong>s (VALTA-HULKKONEN et<br />
al., 2003). Aquatic vegetation yields spectrally dist<strong>in</strong>ct signals<br />
governed by the density <strong>of</strong> the vegetation, the openness <strong>of</strong> the<br />
canopy and the amounts, <strong>for</strong>ms and orientations <strong>of</strong> the leaves, thus<br />
facilitat<strong>in</strong>g the visual identification <strong>of</strong> the different patches.<br />
Def<strong>in</strong><strong>in</strong>g the edges <strong>of</strong> the <strong>seagrass</strong> <strong>meadow</strong>s, through on-screen<br />
analysis <strong>of</strong> the orthophotographs, was a critical step to determ<strong>in</strong>e<br />
the total habitat <strong>area</strong> coverage <strong>of</strong> the studied regions. The<br />
photographs had considerable good quality and were already<br />
georeferenced, mak<strong>in</strong>g the digitiz<strong>in</strong>g technique much simpler.<br />
Although automated techniques exists (KENDRICK et al., 2002), it<br />
was decided to analyze the photographs manually, s<strong>in</strong>ce<br />
brightness levels varied significantly with<strong>in</strong> and between<br />
photographs, caus<strong>in</strong>g variation <strong>in</strong> the gray tones correspond<strong>in</strong>g to<br />
the signatures <strong>of</strong> the classification scheme. The extension and<br />
boundaries <strong>of</strong> the <strong>seagrass</strong> <strong>meadow</strong>s were correctly percepted and<br />
correspond<strong>in</strong>g polygons were constructed with<strong>in</strong> the GIS. All<br />
remote sens<strong>in</strong>g technologies require groundtruth<strong>in</strong>g to accurately<br />
<strong>in</strong>terpret the mapped data <strong>in</strong> order to relate the aerial image data to<br />
real field features on the ground (LILLESAND and KIEFER, 1987).<br />
This procedure was successfully accomplished by register<strong>in</strong>g field<br />
features us<strong>in</strong>g 4 transect methodologies. These were differently<br />
used accord<strong>in</strong>g to the underwater depth and visibility at the time.<br />
Transects along shore and by boat were most used s<strong>in</strong>ce they<br />
cover larger <strong>area</strong>s with less field ef<strong>for</strong>t. For deeper waters, freedive<br />
transects were preferentially used rather than scuba div<strong>in</strong>g<br />
transects <strong>for</strong> the same reason. An unaligned systematic sampl<strong>in</strong>g<br />
design was used <strong>in</strong> transects to elim<strong>in</strong>ate a possible source <strong>of</strong> bias<br />
that may happen if periodical patterns co<strong>in</strong>cide with the systematic<br />
design (BERRY and BAKER, 1986). Systematic sampl<strong>in</strong>g ensures<br />
that sample po<strong>in</strong>ts are recorded from an entire <strong>area</strong>, which is<br />
adequate when the field features are randomly distributed over the<br />
<strong>area</strong>. Yet, most features show some <strong>for</strong>m <strong>of</strong> clustered distribution,<br />
or regular distribution (ARONOFF, 1985), there<strong>for</strong>e if the<br />
distribution <strong>of</strong> the draft map polygons tended <strong>in</strong> a particular<br />
direction (e.g. parallel to transects), with a systematic sampl<strong>in</strong>g a<br />
significant bias could be <strong>in</strong>troduced to the groundtruth process.<br />
The systematic unaligned sampl<strong>in</strong>g used <strong>in</strong> this work, comb<strong>in</strong>ed<br />
the advantage <strong>of</strong> randomization and stratification with the useful<br />
coverage achieved with systematic sampl<strong>in</strong>g, while avoid<strong>in</strong>g<br />
potential systematic bias sources.<br />
Three <strong>seagrass</strong> species were identified (Z. mar<strong>in</strong>a, Z. noltii and C.<br />
nodosa) and accurately mapped <strong>for</strong> two sites, Ria Formosa and<br />
Sado Estuary. In Port<strong>in</strong>ho da Arrábida Bay no <strong>seagrass</strong> species<br />
were found at the time <strong>of</strong> this survey, although this site had<br />
segrasses <strong>in</strong> the recent past (pers. obs. <strong>in</strong> 2006). When analyz<strong>in</strong>g a<br />
species distribution habitat map, it is important to remember that it<br />
is not a perfect representation <strong>of</strong> reality. There are always errors <strong>in</strong><br />
maps and be<strong>for</strong>e we can evaluate the utility <strong>of</strong> a particular map we<br />
need to have an idea <strong>of</strong> how accurate it really is and how accurate<br />
it should be to sufficiently meet the requirements <strong>for</strong> the <strong>in</strong>tended<br />
application. In order to check the exactness between the spatial<br />
data produced and the reality, an accuracy assessment was made<br />
<strong>in</strong> 2 haphazardly chosen locations. The assessment provided an<br />
overall Kappa statistics value – 0.91 – considered by the LANDIS<br />
and KOCH (1977) concordance agreement scale as a perfect match<br />
(the 0.91 calculated value is between the range <strong>of</strong> 0.81 - 1.00).<br />
This accuracy could then be assumed to the rest <strong>of</strong> the spatial<br />
distribution and field cover data <strong>of</strong> the 3 found <strong>seagrass</strong> species (Z.<br />
mar<strong>in</strong>a, Z. noltii and C. nodosa). From the results <strong>of</strong> the GIS<br />
Journal <strong>of</strong> Coastal Research, Special Issue 56, 2009<br />
analysis, Ria Formosa showed the greater <strong>area</strong> <strong>of</strong> <strong>seagrass</strong> cover.<br />
In this region, Faro, Olhão, Culatra and Fuzeta were the locations<br />
with higher species diversity and total <strong>area</strong> <strong>of</strong> distribution. The<br />
largest <strong>meadow</strong>s found were Z. noltii and C. nodosa <strong>in</strong> Olhão,<br />
Culatra and Fuzeta. These localities were recommended to the<br />
Biomares plann<strong>in</strong>g managers and researchers as suitable as donor<br />
sites <strong>for</strong> Z. noltii and C. nodosa. In Sado River Estuary region, the<br />
Tróia locality had higher species richness (3 species), while<br />
Cabeços do Rio, Comporta and Pé de Cavalo had the largest Z.<br />
noltii <strong>meadow</strong>s. This last locality was also recommended as a<br />
suitable Z. noltii donor site. For Z. mar<strong>in</strong>a, Culatra site <strong>in</strong> Ria<br />
Formosa and the Tróia site <strong>in</strong> the Sado Estuary were<br />
recommended as suitable donor sites. Nevertheless, the <strong>area</strong><br />
covered by this species is very small <strong>in</strong> both regions. For this<br />
reason, the use <strong>of</strong> only a very small proportion <strong>of</strong> the total <strong>area</strong><br />
and precaution <strong>in</strong> remov<strong>in</strong>g plants were recommended.<br />
CONCLUSIONS<br />
The method provided the necessary <strong>in</strong><strong>for</strong>mation <strong>for</strong> the<br />
<strong>seagrass</strong> restoration task implementation <strong>of</strong> the Biomares project.<br />
In<strong>for</strong>mation on location, size and structure <strong>of</strong> <strong>seagrass</strong><br />
communities <strong>of</strong> Ria Formosa and Sado River Estuary were<br />
obta<strong>in</strong>ed. In Mira River Estuary only a residual <strong>area</strong> <strong>of</strong> <strong>seagrass</strong>es<br />
was found and that no <strong>seagrass</strong>es were found <strong>in</strong> Port<strong>in</strong>ho da<br />
Arrábida Bay. The aerial photography method used <strong>in</strong> this work<br />
proved to be an appropriated technique to carry such an<br />
environmental survey. Indeed it proved to be reliable, and the<br />
numeric nature <strong>of</strong> the data <strong>in</strong> the GIS enables the generation <strong>of</strong><br />
maps on various scales and at different levels <strong>of</strong> complexity.<br />
ACKNOWLEDGMENTS<br />
This project was funded by the European Commisssion LIFE<br />
Project BIOMARES (LIFE06 NAT/P/192), co-funded by SECIL,<br />
<strong>Portugal</strong>. We thank Luís Gonçalves, Leonel Gonçalves and Vasco<br />
Ferreira <strong>for</strong> field assistance and an anonymous reviewer <strong>for</strong> his<br />
suggestions.<br />
REFERENCES<br />
ARONOFF, S., 1985. The m<strong>in</strong>imum accuracy value as an <strong>in</strong>dex <strong>of</strong><br />
classiffication accuracy. Photogrammetric Eng<strong>in</strong>eer<strong>in</strong>g and<br />
Remote Sens<strong>in</strong>g, 51,99-111.<br />
BERRY, B. and BAKER, A., 1986. Geographic sampl<strong>in</strong>g. Marble (ed.),<br />
Spatial Analysis| A Reader <strong>in</strong> Statistical Geography. Prentice-<br />
Hall, Englewood Cliffs, New Jersey.<br />
BRETZ, C.K., KVITEK, R.G., and IAMPIETRO. P.J., 1998. A case study <strong>in</strong><br />
the application <strong>of</strong> spatial data acquisition tools and multimedia<br />
GIS <strong>for</strong> environmental monitor<strong>in</strong>g and management <strong>in</strong><br />
Antarctica. Antarctic Journal <strong>of</strong> the U.S., 7,11–13.<br />
CARLETTA, J., 1996. Assess<strong>in</strong>g agreement on classification tasks:<br />
the Kappa statistic. Computational L<strong>in</strong>guistics 22.<br />
COHEN, J., 1960. A coefficient <strong>of</strong> agreement <strong>for</strong> nom<strong>in</strong>al scales.<br />
Educational and Psychological Measurement, 20,37- 46.<br />
CONGALTON, R., 1991. A Review <strong>of</strong> Assess<strong>in</strong>g the Accuracy <strong>of</strong><br />
Classifications <strong>of</strong> Remotely Sensed Data. Remote Sens<strong>in</strong>g <strong>of</strong><br />
Environment, 37, 35-46.<br />
DAVISON, D. M. and HUGHES, D. J., 1998. Zostera Biotopes (Volume<br />
I). An overview <strong>of</strong> dynamics and sensitivity characteristics <strong>for</strong><br />
conservation management <strong>of</strong> mar<strong>in</strong>e SACs. Scottish<br />
Association <strong>for</strong> Mar<strong>in</strong>e Science (UK Mar<strong>in</strong>e SACs Project).<br />
DEN HARTOG, C., 1994. Suffocation <strong>of</strong> a littoral Zostera bed by<br />
Enteromorpha radiata. Aquatic Botany, 47, 21-28
DUARTE, C. M., 2002. The future <strong>of</strong> <strong>seagrass</strong> <strong>meadow</strong>s.<br />
Environmental Conservation 29, 192-206.<br />
FONSECA, M. S. and FISHER, J. S., 1986. A comparison <strong>of</strong> canopy<br />
friction and sediment movement between four species <strong>of</strong><br />
<strong>seagrass</strong> with reference to their ecology and restoration.<br />
Mar<strong>in</strong>e Ecology Progress Series, 29, 15-22.<br />
GALDIES, C. and BORG, J. A., 2006. Aerial Remote Sens<strong>in</strong>g and<br />
Spatial Analysis <strong>of</strong> Mar<strong>in</strong>e Benthic Habitats <strong>in</strong> St George’s<br />
Bay (Malta). 2nd International Conference on the<br />
Management <strong>of</strong> Coastal Recreational Resources. Beaches,<br />
Yacht Mar<strong>in</strong>as and Coastal Ecotourism.<br />
GUIMARÃES, M.H.M.E., 2007. Contribuição para a elaboração de um<br />
plano <strong>in</strong>tegrado de gestão dos campos de Z. noltii na Ria<br />
Formosa. University <strong>of</strong> Algarve, Faro, <strong>Portugal</strong>, Master’s<br />
thesis, 53p.<br />
HECK, K. L., ABLE, K. W., ROMAN C. T., and, FAHAY M. P., 1995.<br />
Composition, abundance, biomass and production <strong>of</strong><br />
macr<strong>of</strong>auna <strong>in</strong> a New England estuary: comparisons among<br />
eelgrass <strong>meadow</strong>s and other nursery habitats. Estuary,<br />
18(2),379–389.<br />
HILLMAN, K., WALKER, D. I., LARKUM, A. W. D., and MACCOMB, A. J.,<br />
1989. Productivity and nutrient limitation. In: Biology <strong>of</strong><br />
Seagrasses. A treatise on the biology <strong>of</strong> <strong>seagrass</strong>es with<br />
special reference to the Australian region. A.W.D. LARKUM,<br />
A.J. MCCOMB AND S.A. (ed.), Shepherd.Elsevier, Amsterdam.<br />
635-685 p.<br />
ISRAEL, S. A. and FYFE, J. E., 1996. Determ<strong>in</strong><strong>in</strong>g the sensitivity <strong>of</strong><br />
SPOT XS imagery <strong>for</strong> monitor<strong>in</strong>g <strong>in</strong>tertidal and sublittoral<br />
vegetation <strong>of</strong> Otago Harbour. Conservation Advisory Science<br />
Notes 131. Department <strong>of</strong> Conservation, Well<strong>in</strong>gton, New<br />
Zealand. 21p.<br />
KEMP, W. M., TWILLEY, R. R., STEVENSON, J. C., BOYNTON, W. R. and<br />
MEANS, J. C., 1983. The decl<strong>in</strong>e <strong>of</strong> submerged vascular plants<br />
<strong>in</strong> upper Chesapeake Bay: summary <strong>of</strong> results concern<strong>in</strong>g<br />
possible causes. Mar<strong>in</strong>e Technology Society Journal, 17,78-89<br />
KENDRICK, G. A., ECKERSLEY, J., and WALKER, D. I., 1999.<br />
Landscape-scale changes <strong>in</strong> <strong>seagrass</strong> distribution over time: a<br />
case study from Success Bank, Western Australia. Aquatic<br />
Botany, 65,293–309.<br />
KENDRICK, G. A., AYLWARD, M. J., and HEGGE, B. J., 2002. Changes<br />
<strong>in</strong> <strong>seagrass</strong> coverage <strong>in</strong> Cockburn Sound, Western Australia<br />
between 1967 and 1999a. Aquatic Botany, 73,75–87.<br />
LANDIS, J. R. and KOCH, G. G., 1977. The measurement <strong>of</strong> observer<br />
agreement <strong>for</strong> categorical data. Biometrics, 33,159-174.<br />
LILLESAND, T.M. and KIEFER, R. W.1987. Remote sens<strong>in</strong>g and image<br />
<strong>in</strong>terpretation. John Wiley and Sons, Inc., USA, 709 p.<br />
ORTH, R. J., HECK K. L., and VAN MONTFRANS, J., 1984. Faunal<br />
communities <strong>in</strong> <strong>seagrass</strong> beds: a review <strong>of</strong> the <strong>in</strong>fluence <strong>of</strong><br />
plant structure and prey characteristics on predator-prey<br />
relationships. Estuary, 7,339–350.<br />
ORTH, R. J., CARRUTHERS, T. J. B., DENNISON, W. C., DUARTE, C. M.,<br />
FOURQUREAN, J.W., HECK K. L. JR, HUGHES, A. R., KENDRICK, G. A.,<br />
KENWORTHY, W. J., OLYARNIK S., SHORT, F. T., WAYCOTT M. and<br />
WILLIAMS, S. L. 2006. A global crisis <strong>for</strong> <strong>seagrass</strong> ecosystems.<br />
Bioscience, 56, 987–996.<br />
PALLING, E. I. 2009. Seagrass restoration. In: GERARDO M. E. PERILLO,<br />
E. WOLANSKI, D. R. CAHOON, and M.M. BRINSON, (ed.), Coastal<br />
Wetlands: An Integrated Approach. Elsevier, Amsterdam,<br />
685p.<br />
SEDDON, S. 2004. Go<strong>in</strong>g with the flow: Facilitat<strong>in</strong>g <strong>seagrass</strong><br />
rehabilitation. Ecological Management and Restoration,<br />
5,167-176<br />
SHORT, F. T., and WYLLIE-ECHEVERRIA, S., 1996. Natural and human<strong>in</strong>duced<br />
disturbance <strong>of</strong> <strong>seagrass</strong>es. Environmental<br />
Conservation, 23,17-27.<br />
A. Cunha, J. Assis and E. Serrão<br />
Journal <strong>of</strong> Coastal Research, Special Issue 56, 2009<br />
SHORT, F. T. and SANDY W., 1996. Natural and human-<strong>in</strong>duced<br />
disturbance <strong>of</strong> <strong>seagrass</strong>es. Environmental Conservation,<br />
23,17-27.<br />
SHORT F. T., MATHIESON, A. C. and NELSON, J. I., 1986. Reoccurance<br />
<strong>of</strong> the eelgrass wast<strong>in</strong>g disease at the border <strong>of</strong> New<br />
Hampshire and Ma<strong>in</strong>e, USA. Mar<strong>in</strong>e Ecology Progress Series,<br />
29, 89-92.<br />
SMITS, P. C., DELLEPIANE, S. G. and SCHOWENGERDT, R. A., 1999.<br />
Quality assessment <strong>of</strong> image classification algorithms <strong>for</strong><br />
landcover mapp<strong>in</strong>g: a review and a proposal <strong>for</strong> a cost-based<br />
approach, International Journal o Remote Sens<strong>in</strong>g,<br />
20(8),1461–1486<br />
THAYER, G. W., KENWORTHY, W. J., and FONSECA, M. S., 1984. The<br />
ecology <strong>of</strong> eelgrass <strong>meadow</strong>s <strong>of</strong> the Atlantic coast: a<br />
community pr<strong>of</strong>ile. US Fish and Wildlife Service, Slidell, LA<br />
(FWS/OBS-84/24)<br />
VALIELA, I. K., FOREMAN, M., LAMONTAGNE, D., HERSH, J., COSTA, P.,<br />
PECKOL, B., DEMEO-ANDERSON, C., D'AVANZO, M., BABIONE, C. H.,<br />
SHAM, J,. BRAWLEY, K. and LAJTHA, 1992. Coupl<strong>in</strong>gs <strong>of</strong><br />
watersheds and coastal waters: sources and consequences <strong>of</strong><br />
nutrient enrichment <strong>in</strong> Waquoit Bay, Massachusetts. Estuaries,<br />
15,443-457.<br />
VALTA-HULKKONRN, K., PELLIKKA, P., TANSKANEN, H., USTINOV, A.,<br />
and SANDMAN, O., 2003. Digital false colour aerial photographs<br />
<strong>for</strong> discrim<strong>in</strong>ation <strong>of</strong> aquatic macrophyte species. Aquatic<br />
Botany, 75, 71–88.<br />
WYLLIE, A., LORD, D., COLLINS, P., KENDRICK, G., and KIRKMAN, H.,<br />
1997. Mapp<strong>in</strong>g historical changes <strong>in</strong> <strong>seagrass</strong> beds border<strong>in</strong>g<br />
Owen Anchorage, Western Australia. 4 th International<br />
Conference <strong>for</strong> Remote Sens<strong>in</strong>g <strong>for</strong> Mar<strong>in</strong>e and Coastal<br />
Environments, March 1997, Orlando, Florida.