Earth's Climate: the 1st 4 Billion Years
Earth's Climate: the 1st 4 Billion Years
Earth's Climate: the 1st 4 Billion Years

Create successful ePaper yourself
Turn your PDF publications into a flip-book with our unique Google optimized e-Paper software.
Earth’s Earth s <strong>Climate</strong>:<br />
<strong>the</strong> 1 st 4 <strong>Billion</strong><br />
<strong>Years</strong><br />
OCEAN 355<br />
Prof. Julian Sachs<br />
Lecture Notes #6<br />
Autumn 2008
Kump et al. (1999)<br />
Earth’s <strong>Climate</strong><br />
History:<br />
Mostly sunny<br />
with a 10%<br />
chance of snow
<strong>Climate</strong> Controls - Long & Short<br />
Timescales<br />
•Solar output (luminosity): 10 9 yr<br />
•Continental drift (tectonics): 10 8 yr<br />
•Orogeny (tectonics): 10 7 yr<br />
•Orbital geometry (Earth -Sun distance): 10 4 -10 5 yr<br />
•Ocean circulation (geography, climate): 10 1 -10 3 yr<br />
•composition of <strong>the</strong> atmosphere (biology, tectonics,<br />
volcanoes): 10 0 -10 5 yr
Outline<br />
•Overview of Earth’s climate history<br />
•<strong>Climate</strong> feedbacks: what keeps climate away from extremes?<br />
Planetary Energy Balance<br />
Greenhouse Effect<br />
Geochemical Carbon Cycle, CO 2<br />
Temperature, Precipitation-Wea<strong>the</strong>ring Feedback<br />
•Case studies: Neoproterozoic glaciations (750-580 Ma)<br />
Permo-carboniferous Glaciations (300-275 Ma)<br />
Mesozoic Warmth (245-65 Ma)<br />
Cenozoic Cooling (100-0 Ma)<br />
Pleistocene Glaciations (0.5-0 Ma)
The ‘Faint Young<br />
Sun Paradox’
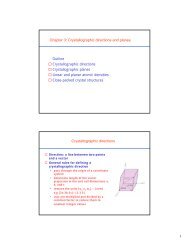
Faint Young Sun Paradox<br />
Faint<br />
Young<br />
Sun<br />
Paradox<br />
4 1 H--> 4 He<br />
Incr. density=<br />
incr. luminosity<br />
Liquid H 2 O existed<br />
>3.5 Ga (sed. rocks,<br />
life, zircon 18 O)
Contemporary Solar Variability<br />
• Contemporary Solar Variability ~0.1%<br />
• Associated with 11-year sunspot cycle
Simple Planetary Energy Balance<br />
• Likely solution to<br />
FYSP requires<br />
understanding of<br />
Earth’s energy balance<br />
(& C cycle)<br />
• Blackbody:<br />
emits radiation w/<br />
100% efficiency<br />
@ all <br />
(Multiply by area of sphere)<br />
Adapted from Kump et al. (1999)
Cross section<br />
of Earth =<br />
area of circle<br />
with Earth<br />
radius<br />
Energy Balance<br />
(cont’d.)<br />
S = solar radiation<br />
received at <strong>the</strong> radius of<br />
<strong>the</strong> planet’s orbit<br />
around star (so S is a<br />
function of <strong>the</strong><br />
luminosity of <strong>the</strong> star<br />
and <strong>the</strong> distance <strong>the</strong><br />
planet is from <strong>the</strong> star)<br />
A = albedo; <strong>the</strong> fraction<br />
of solar radiation<br />
reflected back to space<br />
from clouds, ice,<br />
deserts, etc.<br />
Adapted from Kump et al. (1999)
Nei<strong>the</strong>r<br />
Albedo or<br />
Geo<strong>the</strong>rmal<br />
Heat Flux<br />
Changes Can<br />
Keep <strong>the</strong><br />
Earth from<br />
freezing w/<br />
30% lower S<br />
Adapted from Kump et al. (1999)
Lower Solar<br />
Output<br />
Compensated by<br />
Larger<br />
Greenhouse<br />
Effect<br />
Adapted from Kump et al. (1999)
Earth’s Incoming & Outgoing Radiation<br />
Incoming<br />
Solar<br />
Radiation<br />
Outgoing<br />
Terrestrial<br />
Radiation
Greenhouse Gases<br />
absorb IR radiation<br />
efficiently
Molecules Acquire Energy When They<br />
Absorb Photons
Radiation Absorbed by Atmosphere<br />
Kump et al. (1999)
Earth’s Surface Radiation Spectrum @<br />
H 2 O<br />
Rotation<br />
CO 2<br />
“The Greenhouse Effect”<br />
Top of Troposphere<br />
O 3<br />
H 2 O<br />
Vibration<br />
CO 2<br />
Adapted from Bigg (1996)
Global Average E Balance<br />
Top of Atmosphere:<br />
Ein-Ereflected= reflected=<br />
E Out<br />
in-E<br />
100 - (25 - 5) = 70<br />
100 - 25 - 5 = 70 % Incident solar radiation available<br />
45 + 88 = 133 % Incident rad. avail. at surf. w/ grnhse. gases<br />
Direct absorption by land<br />
Absorption or re-radiated heat by<br />
atmospheric greenhouse gases<br />
Adapted from Bigg (1996)
Enhanced CO 2 Greenhouse Effect Seems Necessary to<br />
Keep Earth from Freezing > 2 Ga<br />
Hypo<strong>the</strong>sized additional<br />
greenhouse effect from CO 2<br />
Adapted from Kasting et al. (1988)
How much CO 2 Required for T Surface > 0° C?<br />
--> About 1,000x PAL of 385 ppmV
Kump et al. (1999)<br />
Earth’s<br />
<strong>Climate</strong><br />
History:<br />
Mostly sunny<br />
with a 10%<br />
chance of snow<br />
• What caused<br />
<strong>the</strong>se major<br />
global climate<br />
perturbations?
3. Case studies:<br />
Neoproterozoic glaciations (750-580 Ma)<br />
Permo-carboniferous Glaciations (300-275 Ma)<br />
Mesozoic Warmth (245-65 Ma)<br />
Cenozoic Cooling (100-0 Ma)<br />
Pleistocene Glaciations (0.5-0 Ma)<br />
The Carbon<br />
Cycle:<br />
Strong driver<br />
of climate on<br />
geologic<br />
timescales
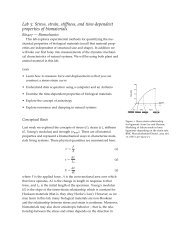
Steady State & Residence Time<br />
Steady State: Inflows = Outflows<br />
Any imbalance in I or O leads to changes in reservoir size<br />
Inflow:<br />
60 Gton C/yr<br />
Respiration<br />
Atmospheric CO 2<br />
760 Gton C<br />
1 Gton = 10 9 * 1000 kg = 10 15 g<br />
Outflow:<br />
60 Gton C/yr<br />
Photosyn<strong>the</strong>sis<br />
The Residence time of a molecule is <strong>the</strong> average amount of<br />
time it is expected to remain in a given reservoir.<br />
Example: t R of atmospheric CO 2 = 760/60 = 13 yr
The Biogeochemical<br />
carbon Cycle
Chemical Wea<strong>the</strong>ring = chemical attack<br />
of rocks by dilute acid<br />
C O 2 + H 2O H 2CO 3<br />
----------------------------------------------<br />
1. Carbonate Wea<strong>the</strong>ring:<br />
CaCO 3 + H 2CO 3 --> Ca 2+ + 2 HCO 3 -<br />
2. Silicate Wea<strong>the</strong>ring:<br />
CaSiO3 + 2 H2CO3 --> Ca 2+ -<br />
+ 2HCO3 + SiO2 + H2O -------------------------------------<br />
• 2x CO 2 consumption for silicates<br />
• Carbonates wea<strong>the</strong>r faster than silicates<br />
Geochemical<br />
Carbon Cycle<br />
#2
Carbonate<br />
rocks<br />
wea<strong>the</strong>r<br />
faster than<br />
silicate<br />
rocks!
Products of<br />
wea<strong>the</strong>ring<br />
precipitaed as<br />
CaCO 3 &<br />
SiO 2 in ocean<br />
Kump et al. (1999)
Net Reaction of Rock Wea<strong>the</strong>ring<br />
+<br />
Carbonate and Silica Precipitation in Ocean<br />
CaSiO 3 + CO 2 --> CaCO 3 + SiO 2<br />
• CO 2 consumed (~ 0.03 Gt C/yr)<br />
• Would deplete atmospheric CO 2 in 20 kyr<br />
• Plate tectonics returns CO 2 via Volcanism<br />
and Metamorphism<br />
-------------------------------------<br />
Carbonate Metamorphism<br />
CaCO 3 + SiO 2 --> CaSiO 3 + CO 2<br />
• CO 2 produced from subducted marine<br />
sediments<br />
Net reaction of<br />
geochemical<br />
carbon cycle<br />
(Urey Urey<br />
Reaction)
Carbonate-Silicate Geochemical<br />
Kump et al. (1999)<br />
Cycle
Stanley (1999)<br />
Carbonate-<br />
Silicate<br />
Geochemical<br />
Cycle<br />
• CO 2 released from<br />
volcanism dissolves in H 2 O,<br />
forming carbonic acid H 2 CO 3<br />
• CA dissolves rocks<br />
• Wea<strong>the</strong>ring products<br />
transported to ocean by rivers<br />
• CaCO 3 precipitation in<br />
shallow & deep water<br />
• Cycle closed when CaCO 3<br />
metamorphosed in subduction<br />
zone or during orogeny.
• Geologic record indicates climate has<br />
rarely reached or maintained extreme<br />
Greenhouse or Icehouse conditions....<br />
• Negative feedbacks between climate and<br />
Geochemical Carbon Cycle must exist<br />
• Thus far, only identified for Carbonate-<br />
Silicate Geochemical Cycle:<br />
Temp., rainfall enhance wea<strong>the</strong>ring rates<br />
(Walker et al, 1981)<br />
(I.e., no obvious climate dependence of tectonics<br />
or organic carbon geochemical cycle.)<br />
How are<br />
CO levels<br />
2<br />
kept in<br />
balance?<br />
Feedbacks<br />
Adapted from Kump<br />
et al. (1999)
Adapted from Kump et al (1999)<br />
<strong>Climate</strong><br />
History of<br />
Earth:<br />
Case Studies<br />
Neoproterozoic<br />
Glaciations<br />
Permo-<br />
Carboniferous<br />
Glaciations<br />
Mesozoic Warmth<br />
Cenozoic Cooling
The<br />
Proterozoic<br />
Glaciations<br />
(‘Snowball<br />
Earth’)<br />
Reading:<br />
•Hoffman & Schrag (2002) Terra Nova, Vol. 14(3):129-155.
Earth’s<br />
<strong>Climate</strong><br />
History<br />
1. Late Proterozoic<br />
Glaciations<br />
(‘Snowball Snowball Earth’)<br />
Earth
13 C limestones<br />
750 Ma 720 Ma<br />
Sturtian<br />
glacial(s)<br />
13 C marine<br />
organic matter<br />
13C fractionation<br />
TOC<br />
f organic-C buried<br />
580 Ma<br />
Marinoan/Varanger<br />
glacial(s)<br />
Carbon Isotopic<br />
Excursions<br />
800-500Ma<br />
•What caused<br />
<strong>the</strong>se massive<br />
perturbations to<br />
<strong>the</strong> carbon cycle<br />
during <strong>the</strong> late<br />
Proterozoic?<br />
Hayes et al. (1999) Chem Geol. Vol. 161: 37.
Late Proterozoic Glaciations: Evidence<br />
~4 global glaciations followed by extreme greenhouses 750-580 Ma<br />
•Harland (1964); Kirschvink (1992)<br />
•Hoffman et al. (1998) Science, v. 281: 1342-6; Hoffman & Schrag (2000) Sci. Am., Jan: 68-75.<br />
Snowball Events:<br />
•Breakup of equatorial supercontinent 770<br />
Ma<br />
•Enhanced wea<strong>the</strong>ring from increased<br />
rainfall (more land close to sea)<br />
•Drawdown atmospheric CO 2 Global<br />
cooling<br />
•Runaway albedo effect when sea ice <<br />
30° latitude<br />
•Global glaciation for ~10 Myr (avg T ~ -<br />
50°C)<br />
•Sea ice ~1000 m thick, geo<strong>the</strong>rmal heat<br />
flux (0.07 W/m 2 ) keeps ocean liquid
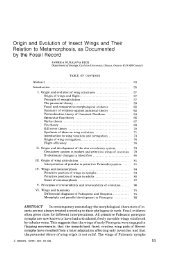
Evidence for<br />
Glaciers on All<br />
Continents<br />
Evidence for Glaciers on All Continents:<br />
0.9-0.6 Ga
Geologic<br />
Evidence<br />
for Glaciers<br />
•Tillites: Packed pebbles,<br />
sand & mud. Remnants of<br />
moraines<br />
•Glacial Striations:<br />
Scratches from rocks<br />
dragged by moving ice<br />
•Dropstones: Rocks<br />
transported by icebergs<br />
and dropped into finely<br />
laminated sediment (IRD).<br />
Kump et al. (1999)
Glacial sediments – poorly sorted, angular clasts<br />
including dropstones – Namibia c. 750 Ma
Neo-<br />
proterozoic<br />
Glacial<br />
Deposits<br />
From Norway,<br />
Mauritania, NW<br />
Canada, Namibia.<br />
•Tillites (a)<br />
•Glacial striations (b)<br />
•Dropstones (d,e,f)<br />
Hoffman & Schrag (2002)<br />
Terra Nova, Vol.<br />
14(3):129-155.
Equatorial Continents 600 Ma ?<br />
•Harland & Rudwick (1964) identified glacial sediments at what looked like equatorial<br />
latitudes by paleomagnetism.<br />
•George Williams (1975) identified a low latitude glacial sequence in S. Australia &<br />
attributed to episode of extreme obliquity (tilt).<br />
Hoffman<br />
& Schrag<br />
(2000)
Determining Paleo-latitude from<br />
Remnant Magnetism<br />
• Paleomagnetism:<br />
latitude of rock formation<br />
• Natural Remnant<br />
Magnetism (NRM):<br />
inclination varies with<br />
“magnetic” latitude<br />
- vertical @ magn poles<br />
- horz. @ magn equator<br />
(many Neoprot. glacial<br />
deposits)<br />
• Magn polar drift avgs<br />
out on T~10 ky<br />
Image from P. hoffman
Hoffman & Schrag (2002) Terra Nova, Vol. 14(3):129-155.<br />
Paleolatitude of<br />
Neoproterozoic<br />
Glacial Deposits<br />
Determined from<br />
Paleomagnetism<br />
• Many glacial deposits appear to<br />
have been formed near <strong>the</strong> equator
How to Explain Glaciers on<br />
all Continents when those<br />
continents appear to have<br />
been close to <strong>the</strong> equator?
High Obliquity<br />
Hypo<strong>the</strong>sis<br />
Williams (1975)<br />
•Earth’s tilt (obliquity)<br />
controls seasonality<br />
•At high tilt angles (><br />
54°) <strong>the</strong> poles receive<br />
more mean annual solar<br />
radiation than <strong>the</strong> tropics<br />
(sun constantly overhead<br />
in summer)!<br />
•Glaciers may be able to<br />
form at low latitudes<br />
Problems:<br />
•Even <strong>the</strong> tropics get quite warm at <strong>the</strong> equinoxes<br />
•Moon stabilizes obliquity<br />
•Would need v. large impact to destabilize; moon orbit doesn’t support this<br />
Image from P. hoffman
Snowball Earth Hypo<strong>the</strong>sis: Geochemical C Cycle,<br />
Water Vapor-T & Ice-Albedo Feedbacks<br />
~4 global glaciations followed by extreme greenhouses 750-580 Ma<br />
• Harland (1964); Kirschvink (1992)<br />
• Hoffman et al. (1998) Science, v. 281: 1342-6; Hoffman & Schrag (2000) Sci. Am., Jan: 68-75.<br />
Lubick (2002)<br />
Snowball Events:<br />
• Breakup of equatorial supercontinent<br />
770 Ma<br />
• Enhanced wea<strong>the</strong>ring from increased<br />
rainfall (more land close to sea)<br />
• Drawdown atmospheric CO 2 Global<br />
cooling<br />
• Runaway albedo effect when sea ice <<br />
30° latitude<br />
• Global glaciation for ~1-10 Myr (avg T<br />
~ -50°C)<br />
• Sea ice ~1000 m thick, geo<strong>the</strong>rmal heat<br />
flux (0.07 W/m 2 ) keeps ocean liquid
Hoffman & Schrag (2000)<br />
Prologue<br />
to<br />
Snowball<br />
• Breakup of equatorial<br />
supercontinent<br />
• Enhanced wea<strong>the</strong>ring<br />
from increased rainfall<br />
(more land close to sea)<br />
• Drawdown<br />
atmospheric CO 2 <br />
Global cooling
Hoffman & Schrag (2000)<br />
Deep<br />
Freeze<br />
•Global cooling<br />
causes sea ice<br />
margin to move<br />
equatorward<br />
•Runaway albedo<br />
effect when sea ice<br />
(1)<br />
(2)<br />
(3)<br />
(5)<br />
(4)<br />
Runaway<br />
Albedo<br />
Feedback<br />
1. Eq continents, incr<br />
wea<strong>the</strong>ring, lowers<br />
CO 2 , slow cooling,<br />
equatorward<br />
movement of ice.<br />
2. Runaway albedo<br />
3. Slow buildup of CO 2<br />
from volcanoes<br />
4. Rapid decay of ice in<br />
10 2 yr. High T s from<br />
enhanced H 2 0-T<br />
feedback.<br />
5. Slow CO 2 drawdown<br />
from wea<strong>the</strong>ring<br />
Image from P. hoffman
Hoffman & Schrag (2000)<br />
Snowball<br />
• Global glaciation<br />
for ~1-10 Myr<br />
(avg T ~ -50°C)<br />
• Sea ice ~1000 m<br />
thick, geo<strong>the</strong>rmal<br />
heat flux (0.07<br />
W/m 2 ) keeps<br />
ocean liquid
Glaciated Terrain
Evidence for Snowball<br />
• Stratigraphy: globally-dispersed glacial deposits.<br />
• Carbon isotopes: negative 13 C CaCO3 excursions through<br />
glacial sections ( 13 C reaches ~ -5 to -7‰). Little or no<br />
biological productivity (no light).<br />
• Banded iron formations w/IRD: only BIFs after 1.7 Ga.<br />
Anoxic seawater covered by ice.<br />
• Cambrian explosion (circumstantial): Rapid<br />
diversification of multicellular life 575-525 Ma expected<br />
to result from long periods of isolation and extreme<br />
environments (genetic "bottleneck and flush").
Carbon Isotopic Evidence for Snowball<br />
• 13 C values of -5‰ (mantle value) consistent with “dead” icecovered<br />
ocean<br />
Image from P. hoffman
Carbon<br />
Isotope<br />
Fractionation<br />
• As fraction of<br />
carbon buried<br />
approaches zero, <br />
13 C of CaCO3<br />
approaches mantle<br />
(input) value<br />
Image from P. hoffman
13 C limestones<br />
13 C marine<br />
organic matter<br />
13C fractionation<br />
TOC<br />
Fraction of C buried as C org<br />
Carbon Isotopic<br />
Excursions<br />
800-500Ma<br />
• Carbon isotopes in<br />
organic and inorganic<br />
carbon from <strong>the</strong><br />
Neoproterozoic indicate 4<br />
periods when 10% or less<br />
of <strong>the</strong> carbon buried in <strong>the</strong><br />
rock record was organic.<br />
• Consistent with very low<br />
primary productivity in an<br />
ice-covered ocean<br />
Hayes et al, Chem Geol. 161, 37, 1999
The Return of<br />
Banded Iron<br />
Formations<br />
• After a ~1 Gyr<br />
absence, BIFs return to<br />
<strong>the</strong> geologic record<br />
• Implies anoxic ocean<br />
• Consistent with icecovered<br />
ocean<br />
Image from P. hoffman
BIF + Dropstone = Ice-covered, anoxic ocean?<br />
McKenzie Mtns., Western Canada Image from P. hoffman
Metazoan Explosion: Response to genetic<br />
bottlenecks & flushes?<br />
Image from P. hoffman
Breaking out of <strong>the</strong> Snowball<br />
• Volcanic outgassing<br />
of CO 2 over ~10 6 yr<br />
may have increased<br />
greenhouse effect<br />
sufficiently to melt<br />
back <strong>the</strong> ice.<br />
Image from Lubick (2002) Nature,<br />
Vol. 417: 12-13.
Bring on <strong>the</strong> Heat: Hothouse follows<br />
Snowball? Hothouse Events<br />
• Slow CO 2 buildup to ~350<br />
PAL from volcanoes<br />
• Tropical ice melts: albedo<br />
feedback decreases, water<br />
vapor feedback increases<br />
• Global T reaches ~ +50°C in<br />
10 2 yr<br />
• High T & rainfall enhance<br />
wea<strong>the</strong>ring<br />
• Wea<strong>the</strong>ring products + CO 2 =<br />
carbonate precipitation in<br />
warm water
One<br />
Complete<br />
Snowball-<br />
Hothouse<br />
Episode<br />
Image from P. hoffman
The Geochemical Carbon Cycle<br />
Image from P. hoffman
Authigenic<br />
Enhanced<br />
Wea<strong>the</strong>ring of<br />
Rocks Results<br />
in Precipitation<br />
of Minerals in<br />
Ocean<br />
• High T & CO 2 cause<br />
increase in wea<strong>the</strong>ring<br />
rate of continents<br />
• Products of wea<strong>the</strong>ring<br />
carried to ocean by rivers<br />
• Precipitated as CaCO 3<br />
& SiO 2 minerals in ocean
Geologic Evidence for<br />
Hothouse Aftermath:<br />
“Cap Carbonates”<br />
Thick sequences of inorganically<br />
precipitated CaCO 3 cover<br />
Neoproterozoic glacial deposits<br />
globally.
Neo-proterozoic<br />
Cap Carbonates<br />
• Thick sequences of<br />
inorganically precipitated<br />
carbonate minerals cover<br />
Late Proterozoic glacial<br />
deposits.<br />
• Consistent with<br />
massive flux of<br />
wea<strong>the</strong>ring products to<br />
ocean in snowball<br />
aftermath.<br />
Hoffman & Schrag (2002) Terra<br />
Nova, Vol. 14(3):129-155.
Glacial<br />
Deposit<br />
Overlain by<br />
Cap<br />
Carbonate in<br />
Namibia<br />
(~700 Ma)<br />
Hoffman & Schrag (2000)
Aragonite (CaCO 3 ) Fan in Namibia<br />
• Carbonate fans form when CaCO 3 rapidly precipitates from water<br />
Image from P. hoffman
Geologic &<br />
Isotopic<br />
Change<br />
Associated<br />
with<br />
Snowball<br />
Event<br />
(Namibia)<br />
Hoffman & Schrag<br />
(2002) Terra Nova,<br />
Vol. 14(3):129-155.
Note: T estimated from<br />
E balance model<br />
Summary of<br />
Snowball-<br />
Hothouse<br />
Sequence<br />
Hoffman & Schrag (2002) Terra Nova, Vol. 14(3):129-155.
How Long Did it Last?<br />
• Big open question! Recent work by Sam Bowring (MIT)<br />
suggests glacial episode lasted < 1 Myr<br />
• Glacial episodes<br />
probably lasted < 1<br />
Myr<br />
• Cap carbonates<br />
likely deposited<br />
within 103-104 yr<br />
Image from P. hoffman
What kept this from happening after ~580 Ma?<br />
• Higher solar luminosity (~5% increase)<br />
• Less landmass near equator = lower wea<strong>the</strong>ring rates (?)<br />
Caveat: John Edmond, a highly regarded geochemist at<br />
MIT (now deceased) found that wea<strong>the</strong>ring rates were<br />
limited by abundance of fresh rock, not temperature. Based<br />
on analyses of dissolved major & minor elements in Siberian<br />
and tropical rivers.<br />
• Increased bioturbation (eukaryote diversity following reoxygenation<br />
of ocean) = higher rates of remineralization: Less C<br />
accumulation in sediments offsets lower wea<strong>the</strong>ring rates, so<br />
atmospheric CO 2 may be kept from reaching extremes<br />
• Lower iron & phosphorous concentrations in better-oxygenated<br />
Phanerozoic ocean [Fe(II) is soluble; Fe(III) is less so]: Decreased 1°<br />
production = Decreased CO 2 drawdown.<br />
What we would like to know:<br />
CO 2 concentrations through snowball/hothouse cycle.
Potential Problems<br />
with <strong>the</strong> ‘Snowball Snowball<br />
Earth hypo<strong>the</strong>sis’ hypo<strong>the</strong>sis<br />
• Ocean/atmosphere climate<br />
models cannot seem to keep<br />
entire ocean covered with ice<br />
• Weak evidence for lower<br />
sea level<br />
• Wea<strong>the</strong>ring reactions are<br />
slow….. Maybe too slow to<br />
be <strong>the</strong> source of cap<br />
carbonates<br />
Lubick (2002) Nature, Vol. 417: 12-13.
Alternate Cause for Cap Carbonate Deposition &<br />
13 C Depletions:<br />
Gas Hydrate Destabilization<br />
• CaCO3 precipitation does not require<br />
increased wea<strong>the</strong>ring flux of minerals<br />
• Can be caused by increased seawater<br />
alkalinity resulting from CH4 consumption<br />
by sulphate-reducing bacteria<br />
Kennedy et al. (2001) Geology Vol. 29(5): 443-446.
Structures in Cap<br />
Carbonates May<br />
Result from Gas<br />
Release<br />
• Gas Hydrate = [H 2 O +<br />
hydrocarbon (CH 4 )] ice<br />
• CH 4 from biogenic +<br />
<strong>the</strong>rmogenic<br />
decomposition of<br />
deeply buried C org<br />
• Biogenic CH 4 has very<br />
low 13 C (-60 to-90‰)<br />
• Sequestered as hydrate<br />
in permafrost (> 150 m)<br />
& along continental<br />
margins (> 300 m)<br />
• Destabilized by<br />
increased temperature<br />
• CH 4 released from<br />
flooded permafrost<br />
during deglaciation<br />
Kennedy et al. (2001) Geology<br />
Vol. 29(5): 443-446.
Gas Hydrate Stability Influenced by T & P<br />
Stability zone of gas<br />
hydrates deepens when<br />
ice sheet is removed<br />
owing to decreased<br />
pressure<br />
CH 4 released to atmosphere<br />
Smith, Sachs, et al. (2001) Geophys. Res. Lett., Vol.28(11): 2217-2220.
Ra<strong>the</strong>r than increased<br />
wea<strong>the</strong>ring flux of cations<br />
& HCO 3 - to ocean causing<br />
CaCO 3 precipitation,<br />
increased seawater<br />
alkalinity could have<br />
caused CaCO 3<br />
precipitation<br />
CH 4 consumption by SO 4 2reducers<br />
@ seafloor & in<br />
flooded permafrost<br />
Drives CO 2 (H 2 CO 3 + HCO 3 - + CO3 2- )<br />
toward CO 3 2- , causing CaCO3 to<br />
precipitate out of seawater<br />
CH 4 -derived CaCO 3 has low 13 C
CH 4<br />
consumption<br />
by sulphate<br />
reducers is<br />
observed at<br />
methane seeps<br />
in modern<br />
ocean, &<br />
CaCO 3<br />
precipitates<br />
<strong>the</strong>re as a<br />
result<br />
• SO 4 2- reducers<br />
produce highly 13 C<br />
depleted HCO 3 -<br />
which goes into<br />
ocean/atmosphere
Consortia of<br />
sulphate<br />
reducers &<br />
methane-<br />
oxidizing<br />
microbes<br />
from modern<br />
CH 4 seep
Santa Barbara<br />
Basin: Recent<br />
methane<br />
hydrate<br />
releases?<br />
• Large 13 C-depletions<br />
in seawater &<br />
biogenic carbonates<br />
• Likely resulted from<br />
massive releases of<br />
CH 4 when gas<br />
hydrates were<br />
destabilized by<br />
changing T & P (I.e.,<br />
sea level)<br />
Kennett et al. (2000) Science,<br />
Vol. 288: 128-133.