COMPREHENSIVE MOBILITY PLAN FOR JAIPUR
COMPREHENSIVE MOBILITY PLAN FOR JAIPUR
COMPREHENSIVE MOBILITY PLAN FOR JAIPUR

Create successful ePaper yourself
Turn your PDF publications into a flip-book with our unique Google optimized e-Paper software.
<strong>COMPREHENSIVE</strong> <strong>MOBILITY</strong> <strong>PLAN</strong> <strong>FOR</strong><br />
<strong>JAIPUR</strong>
Study Objective<br />
“Develop a Comprehensive Mobility Plan for Jaipur”<br />
CMP is a transport sector master plan-cum-investment program<br />
document to meet the mobility concerns arising from the<br />
population l i and d bbusiness i growth h of f the h study d area
CMP WILL<br />
• Provide for Future transport in<br />
accordance with NUTP<br />
• DDefine fi CCorridors id of f Movements<br />
M t<br />
• Focus on moving people<br />
• Integrate land use development and<br />
transport policy<br />
• Streamline transport projects<br />
• Capitalize and retain city strength<br />
• Systematically plan the infrastructure<br />
investment program<br />
• Support regional economy, growth,<br />
mobility demands<br />
CMP! NEW PARADIGM<br />
CMP WILL NOT<br />
• Conduct feasibility analysis of projects<br />
• Detail cost estimates<br />
• Locate Stations and Size them<br />
• Detail traffic engineering plans<br />
• Include alternate Analysis<br />
• Include DPR
The Master Development Plan for Jaipur region has<br />
been prepared for the horizon year 2025<br />
Reports on Metro Rail and BRT for Jaipur<br />
Review of Past Studies<br />
Master Plan for Traffic & Transportation – 2002‐ prepared by Shah Technical<br />
Consultants Pvt. Ltd<br />
Master Development Plan 2011 for Jaipur, 1998 – prepared by Jaipur Development<br />
Authority<br />
Ji Jaipur Urban Ub Mass M Transport T SStudy, d 1997 – prepared d bby CCentral lRRoad dRResearch h<br />
Institute (CRRI)<br />
Mass Transit Railway y System y for Jaipur, p , 1992 – prepared p p by y<br />
Rites
Review<br />
• CMP Process<br />
• Study area<br />
Vision & Objectives<br />
Goals<br />
• Present Transport Scenario<br />
• Future Transport Scenario<br />
• Benchmarks<br />
Strategies<br />
• Network Strategy<br />
• Landuse Strategy<br />
Initiatives<br />
Program<br />
• Investment & Phasing<br />
• IInstitutional i i l<br />
Approach & Methodology
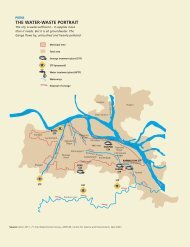
Study Area
Mumbai<br />
Bikaner<br />
11<br />
8<br />
8<br />
<strong>JAIPUR</strong> CITY<br />
12<br />
Bhopal<br />
Delhi<br />
11<br />
Agra<br />
Regional Setting
Cordon & Screen Line Volume Count<br />
Traffic Surveys<br />
Traffic Surveys Time Locations<br />
24 Hrs 10<br />
16 Hrs 12<br />
Classified Traffic Volume Counts and<br />
24 Hrs 10<br />
Origin Destination by Road side Interview 16 Hrs 12<br />
Mid Block Volume Count<br />
24 Hrs<br />
16 Hrs<br />
10<br />
10<br />
Household Interview<br />
-<br />
10000<br />
Samples<br />
Stated Preference Survey -<br />
1000<br />
samples<br />
Speed and Delay<br />
Identified<br />
stretches<br />
30 km<br />
Bus Occupancy Survey 9am–1pm 20<br />
Boarding & Alighting Counts and Bus<br />
&<br />
passenger Interview survey 4pm-8pm 20
Road Inventory<br />
Classified Turning Volume Counts-<br />
Junctions<br />
Q Queue LLength h S Survey<br />
Traffic Surveys<br />
Traffic Surveys Time Locations<br />
N/A 200 km<br />
12 Hours<br />
N/A<br />
Parking Survey 12 Hours 14 Stretches<br />
Pedestrian Volume Counts<br />
Vehicle Operator Operator Surveys – – Taxi Taxi, Auto Auto,<br />
Goods Vehicles<br />
12 Hours<br />
15<br />
5<br />
15<br />
12 Hours 5
Survey Locations
Cordon : Max Vol<br />
116735 PCUs –24 24 Hrs<br />
Ajmer Road near Toll Plaza<br />
Traffic Volume Count<br />
@ @Screenlines @ @ @Midblock @ @Cordon<br />
Screenline: Screenline Max Vol<br />
92078 PCUs –24 24 Hrs<br />
Collectorate Collectorate Road Road near<br />
near<br />
Court
Road Network Inventory<br />
Category of Roads<br />
On-street Parking
Mode Share<br />
Public<br />
Transport , 19%<br />
Car , 8%<br />
Taxi , 4% Auto Rickshaw ,<br />
6%<br />
Household Characteristics<br />
Average House Hold size 4.1<br />
Per Capita Trip Rate (All 1.1<br />
modes)<br />
Average Household Income Rs 11,600/<br />
Month<br />
TTwo wheeler h l ,<br />
31%<br />
Walk & Cycle ,<br />
32%
The Through Traffic<br />
bypassing the city is 20%<br />
RSI Survey at Cordon Points<br />
Average Occupancy at Outer Cordon<br />
Mode Average Occupancy<br />
Two Wheeler 1.6<br />
Car 1.8<br />
Auto 2.6<br />
Taxi 2.6
The Average Journey speed<br />
Commercial area 16 kmph<br />
Commercial area – 16 kmph<br />
Non-commercial – 30 kmph<br />
Speed and Delay Survey
Sodala JN<br />
16,029<br />
Kasha Kothi JN<br />
15,159<br />
Udyog Bhavan JN<br />
12,013<br />
GPO JN<br />
13,332<br />
Turning Volume Count<br />
Rambag JN<br />
18,029<br />
Ghat Gate JN<br />
10,824<br />
BIRLA MANDIR JN<br />
15,112<br />
Peak Hr Traffic<br />
Intersections Exceeding<br />
10,000 PCUs<br />
Transport Nagar JN<br />
14,146
Existing ROB’s & RUB’s
Parking Survey<br />
• Short Term Parking g( (0.5 Hours )<br />
- 90%<br />
of Vehicles<br />
• Motorized Two Wheelers are parked<br />
predominantly at<br />
• Johari Bazaar Road<br />
• Tripoli Bazaar Road<br />
• Chandpol Bazaar Road<br />
• Ramganj Bazaar Road<br />
• Surajpol Bazaar Road<br />
• Kishanpol Bazaar Road
Pedestrian Crossing Count<br />
Sanganer Airport Junction (19656)<br />
Ghat Gate Junction (14007)<br />
Peak hour -10.00 AM to 11.00 AM & 4.00 PM to 5.00 PM
Truck Truck Operator Operator Survey<br />
Survey<br />
• Average service life<br />
Trip Frequency Commodities<br />
- Taxi = 18 years<br />
- Auto Rickshaw = 13 years years.<br />
• Average annual maintenance cost<br />
IPT Survey<br />
- Taxi = Rs. 12550<br />
- Auto Rickshaw = Rs. 11903<br />
• Average number of passengers carried per trip<br />
- Auto rickshaw = 4 including driver<br />
- Taxi = 5 including driver
• Max observed Volume :<br />
Bus Passenger Survey<br />
Chandpol p Bazaar 3662 ppassengers g both directions<br />
• Bus occupancy : 45<br />
• Distance travelled to go bus stop : < 2 km (49%)<br />
• WWaiting iti Ti Time : > 10 minutes i t (67%)<br />
• Cost : 5-10 Rupees (47%)
Year Non Fatal Fatal<br />
Total<br />
Accidents<br />
Non Fatal<br />
Growth<br />
rate(%)<br />
Accidents<br />
Fatal Growth<br />
rate (%)<br />
2004 1915 343 2042 ‐ ‐<br />
2005 2150 416 2367 12% 21%<br />
2006 2124 454 2379 ‐1% 9%<br />
2007 2096 495 2316 ‐1% 9%<br />
2008 1894 452 2098 ‐10% ‐9%<br />
30 April<br />
2009<br />
600 125 655<br />
‐ ‐
Validation<br />
Travel Demand Modelling Process<br />
OD Data Network Landuse<br />
Assignment<br />
Cost skim<br />
Calibration of<br />
Distribution function<br />
Calibration of<br />
Mode Choice Function<br />
Validation<br />
Calibration of Trip<br />
EEnd dM Model d l<br />
Forecast for present<br />
year y<br />
Synthetic OD’s<br />
Assignment
Road Network Bus Routes Desire line for all modes<br />
• Total road length : 751 Kms<br />
• No. of Nodes : 996 79<br />
•<br />
78<br />
77<br />
2<br />
3<br />
12<br />
1<br />
10<br />
9<br />
70<br />
68<br />
69<br />
65<br />
66<br />
63 59<br />
58<br />
54<br />
67 64<br />
36<br />
8<br />
62 61 55 5149 37<br />
38<br />
50<br />
46<br />
5<br />
6<br />
34<br />
33 32<br />
55 49<br />
60<br />
7<br />
57<br />
43<br />
47<br />
4<br />
35<br />
17<br />
31<br />
16<br />
30 29<br />
11 15<br />
19 18<br />
13<br />
14<br />
22<br />
20<br />
27<br />
21<br />
25<br />
26<br />
23<br />
28<br />
53<br />
52<br />
24<br />
48<br />
Bus routes – 46<br />
Mofussil Bus routes – 7<br />
Fleet<br />
Standard bus - 250<br />
Mini Bus - 1500<br />
• Internal Zones – 70<br />
• External Zones – 10<br />
• Total – 80 Zones
Scenarios
Mode<br />
Validation Screen S lines<br />
Screen line 1 – NORTH - SOUTH<br />
Direction 1 Direction 2<br />
Assigned Observed %Difference Assigned Observed %Difference<br />
Two wheeler 6373 7075 -10% 10% 8533 8533 8440 8440 1%<br />
Car 2734 2586 6% 2786 3028 -8%<br />
Auto rickshaw 3380 3477 -3% 4940 5076 -3%<br />
Taxi 2197 2116 4% 3334 3613 -8%<br />
Public transport p<br />
30277 28962 -5% 31414 27263 -15%<br />
Screen line 2- EAST-WEST<br />
Direction 1 Direction 2<br />
Mode Assigned Observed %Difference Assigned Observed %Difference<br />
Two Wheeler 4458 4237 5% 3758 3709 1%<br />
Car 2221 2260 -2% 1785 2072 -14%<br />
Auto rickshaw 2221 2394 -7% 1891 2094 -10%<br />
Taxi 1316 1314 0% 1557 1754 -11%<br />
Public transport 13788 12109 -14% 15438 14351 -8%
Existing & Proposed Land Use<br />
2009 2025
Land Use Developments<br />
Growth Nodes Location<br />
Area Specified<br />
(Acres)<br />
Mahindra SEZ Bhankrota 25000<br />
International<br />
Conventional<br />
Center & Golf<br />
Course<br />
Vatika IT City<br />
Dehmikalan 125<br />
Bhankrota<br />
800<br />
Sports City Achrol 512<br />
Film City<br />
Sumel<br />
Village<br />
1000
Traffic Characteristics - 2009<br />
Trips assigned (Peak Hour) (motorized) : 1.97 lakhs<br />
Walk +Cycle : 31%<br />
Mode share -Two wheeler (All) : 27%<br />
Mode share -Car (All) : 8%<br />
Mode share-Auto rickshaw(All) : 6%<br />
Mode share - Taxi (All) : 8%<br />
Mode share - Public Transport (All) : 19%<br />
Average Network Speed : 28 Kmph<br />
Average Trip Length : 6.5<br />
Passenger Km : 15.34 lakhs<br />
Travel Characteristics<br />
Traffic Characteristics - 2031 (Do Nothing)<br />
Trips assigned (Peak Hour) (motorized) : 5.52 lakhs<br />
Walk +Cycle : 31%<br />
Mode share -Two wheeler (All) : 33%<br />
Mode share -Car (All) : 10%<br />
Mode share-Auto rickshaw(All) : 7%<br />
Mode share - Taxi (All) ( ) : 9% %<br />
Mode share - Public Transport (All) : 10%<br />
Average Network Speed : 14 Kmph<br />
Average Trip Length : 7.9<br />
Passenger Km : 52.3 lakhs
National Urban Transport Policy<br />
• Encouraging integrated land use and transport planning<br />
• Equitable allocation of road space with people, rather than vehicles<br />
• Encourage greater use of public transport and non-motorized modes<br />
• Eff Effective ti IInstitutional tit ti l mechanisms h i & capacity it bbuilding ildi<br />
• Intelligent Transport Systems<br />
• Reducing pollution levels through travel changes changes, enforcement enforcement, stricter<br />
norms, technological improvements, etc.<br />
• Innovative financial mechanisms<br />
• Private section participation<br />
• Pilot projects
WB Strategy for Urban Transport<br />
• Street design standards that are walk-and bicycle-friendly<br />
• Re-allocate Re allocate the existing road space to provide priority for public<br />
transport by way of parking and traffic management<br />
• Priority to urban road networks within low-income and poor areas<br />
• Metropolitan Transport Regulatory Authority (Fares (Fares, subsidies subsidies, mode<br />
split etc)<br />
• Regulatory reform aimed at higher-quality services and/or lower<br />
production p costs ( (MTCs, , Commuter rail and MRTS). )<br />
• Develop a market for public transport suitable to serve travel demands<br />
for low income people<br />
• Introduce rigorous g project p j evaluation for large g projects p j<br />
• Focus on at-grade, BRT lines, with publicly-owned infrastructure and<br />
competitively awarded service concessions, (inclusive of<br />
feeder/distributor networks).<br />
• Ensure that new primary roads include a provision for rapid public<br />
transport modes
Vision & Goals<br />
Comprehensive mobility Plan will have high class sustainable<br />
and efficient transport that will meet the needs of the economic<br />
developments including Tourism proposed in the area<br />
Index Formulation Present Goal<br />
PT Mode Share<br />
Public Transport Trips / Total motorised<br />
Trips<br />
19% 50%<br />
Bus Supply Bus Fleet / Lakh of Population 45 60<br />
IPT Registered IPT vehicles / Lakh of Population 958 850<br />
Walkability Footpath Length / Road Length 51% 100%<br />
Fatality No. of Fatalities / Lakh of Population 71 10<br />
NMT % of NMT trips in total trips 31% 31%
# Strategy Policy<br />
1<br />
Moving people rather<br />
than vehicles<br />
Integrating land use<br />
2 and<br />
transportation<br />
urban<br />
CMP Strategy & Policies<br />
• Augmenting the coverage and capacity of the rail and bus transits<br />
• Priority for bus transit by reservation of lanes along major arterial roads<br />
• Differential pricing commensurate with the LOS for public transit.<br />
• Running mini‐buses mini buses for railway/metro stations access<br />
• Developing a transport network based on Comprehensive Transport & Traffic<br />
Study<br />
• Restructuring the land use distribution around MRTS/transit nodes<br />
• Reduce the gap in the supply of minor arterial/collectors. Develop grid<br />
network in outer areas
CMP Strategy & Policies<br />
# Strategy Policy<br />
• Footpaths in residential streets and on major roads with commercial activities<br />
Priorities to non‐ • Redeeming the existing footpaths from encroachments & obstructions<br />
3 motorized transport • Propose legal framework for evicting the encroachments on footpaths / roads<br />
(NMT)<br />
• Demarcating road space exclusively for movement by pedestrians and cyclists<br />
• Providing safe passage of pedestrian / cyclists by grade separation.<br />
• Widening critical road links and intersections<br />
4<br />
Optimizing the existing<br />
road and transport<br />
infrastructure<br />
• Phased widening of roads to their prescribed street alignment width<br />
• Articulating the road network by developing missing links<br />
• Selected junction improvements for improving corridor throughput<br />
• Upgrading high density corridors as multi‐modal multi modal transit corridors<br />
• Shifting the inter‐regional terminals from city core to the city fringe<br />
• Mandative off‐street parking norms for various landuses<br />
• Develop multi‐level parking at major traffic generating locations<br />
• Develop park‐and‐ride facility at all critical sub‐urban / RTS / metro rail<br />
Putting a parking policy<br />
5<br />
in place<br />
stations<br />
• Develop park‐and‐ride facility at all critical bus terminals<br />
• Restrict/ban on‐street on street parking on critical commercial streets<br />
• Parking pricing to reduce the use of private modes<br />
• Construction of parking complexes on government agencies land
6<br />
Strategy Policy<br />
Redefining the role of<br />
para‐transit p<br />
Segregating freight<br />
7 ttraffic ffi<br />
traffic<br />
& passenger<br />
8<br />
Deploying various<br />
ttravell ddemand d<br />
management (TDM)<br />
measures<br />
CMP Strategy & Policies<br />
• EEncourage wider id coverage andd capacity it bby th thepara‐transit t it<br />
• Provide parking for para‐transit at public transport terminals<br />
• Encourage cycle‐rickshaws to operate between residential areas and<br />
transit routes<br />
• Regulate the operation of para‐transit by enforcing minimum safety<br />
norms.<br />
• Plan and developp orbital roads in the form of urban bypasses yp<br />
• Plan and develop outstation truck terminals and parking<br />
• Stagger the school & office & market times zone‐ wise<br />
• Encouragecar‐pooling g p gand van‐pooling p g<br />
• Encourage new industrial complexes to have residential quarters within<br />
their premises<br />
• Decentralise major activities to reduce traffic
9<br />
Strategy Policy<br />
Puttingg in place p an<br />
environmental<br />
development<br />
management<br />
mechanism h i<br />
Setting up a unified<br />
institutional<br />
10 fframework k<br />
encompassing all<br />
modes<br />
Enforcement f<br />
as a<br />
11 potential tool for<br />
development<br />
12<br />
Promoting innovative<br />
technologies /<br />
practices<br />
CMP Strategy & Policies<br />
• Enlarge vehicular population using pollution free fuels viz. LPG / CNG /<br />
bbattery<br />
• Establish a GIS based air quality monitoring and information system<br />
• Major transport development measure to comply with environmental<br />
safeguards g<br />
• Subject every major transport development measure to safety audit.<br />
• Set up UMTA within a specified timeframe with coordinating, planning and<br />
advisory d role l<br />
• PPP in development as well as operation of urban transport infrastructure<br />
• Effectivelyy clear infrastructure assets from encroachments byy constant<br />
patrolling<br />
• Campaigns and special drives to educate the road users to adhere to<br />
traffic discipline<br />
• Leverage ITS andd technology h l applications l<br />
• Develop new roads with ducts for services / utilities<br />
• Cement‐concrete the existing road pavement particularly the road<br />
intersections and
Network Strategy Concept
Traffic on New links ‐2031<br />
Tunnel 1 (in PCU) : 3475<br />
Tunnel 2 (in PCU) : 2850<br />
Elevated road along river (in PCU) : 1800<br />
Network + Bus Augmentation<br />
Traffic Characteristics - 2031 ( Network + Bus Augmentation )<br />
Trips assigned (Peak Hour) (motorized) : 5.52 lakhs<br />
Walk +Cycle : 31%<br />
Mode share -Two wheeler (All) : 22%<br />
Mode share -Car (All) : 12%<br />
Mode ode sshare-Auto a e uto rickshaw(All) c s a ( ) : 5%<br />
Mode share - Taxi (All) : 7%<br />
Mode share - Public Transport (All) : 23%<br />
Average Network Speed : 28.5 Kmph<br />
Average Trip Length : 9.0
Network + Bus Augmentation + Commuter Rail<br />
Traffic Characteristics - 2031 ( Network + Bus Augmentation )<br />
Trips assigned (Peak Hour) (motorized) : 55.52 52 lakhs<br />
Walk +Cycle : 31%<br />
Mode share -Two wheeler (All) : 21%<br />
Mode share -Car (All) : 12%<br />
Mode share-Auto rickshaw(All) : 4%<br />
Mode share - Taxi (All) : 6%<br />
Mode share - Public Transport (All) : 26%<br />
Average Network Speed : 29 Kmph<br />
Average Trip Length : 99.0 0
BRTS & Metro Plans
With BRT<br />
Traffic Characteristics - 2031 ( With BRT )<br />
Trips assigned (Peak Hour) (motorized) : 5.52 lakhs<br />
Walk +Cycle : 31%<br />
Mode share -Two wheeler (All) : 19%<br />
Mode share -Car (All) : 11%<br />
Mode share-Auto rickshaw(All) : 4%<br />
Mode share - Taxi (All) : 5%<br />
Mode share - Public Transport (All) : 30%<br />
Average Network Speed : 29.2 Kmph<br />
Average Trip Length : 9.2
With Mass Transit System<br />
Traffic Characteristics - 2031 ( With Mass Transit System )<br />
Trips assigned (Peak Hour) (motorized) : 5.52 lakhs<br />
Walk +Cycle : 31%<br />
Mode share -Two wheeler (All) : 20%<br />
Mode share -Car (All) : 11%<br />
Mode share-Auto rickshaw(All) : 4%<br />
Mode share - Taxi (All) : 6%<br />
Mode share - Public Transport (All) : 28%<br />
Average Network Speed : 32 Kmph<br />
Average Trip Length : 9.5
3<br />
6<br />
2<br />
4<br />
7<br />
1<br />
13<br />
BRT 8<br />
Metro<br />
Mono Rail<br />
14<br />
10<br />
Recommended System<br />
12<br />
11<br />
5<br />
15<br />
9<br />
No Syste<br />
No<br />
m<br />
From From Via Via To PPHPD<br />
1 BRT Ring Road<br />
Bara Kuwawali<br />
Ambabari Sindhi Camp 4200<br />
2 BRT Dhani Govindapura Ambabari 4100<br />
3 BRT Ambabari Kanakpura Rly Stn. Ajmeer Road<br />
Outer Ring<br />
3800<br />
4 BRT Ramnagar Ajmeer Road Road 7000<br />
5 BRT Ajmeer Road Manasarovar Tonk Road<br />
Outer Ring<br />
7000<br />
6 BRT Manasarovar Srinagarpura Road 7000<br />
7 BRT Balrampura Rampura Girdhari Pura<br />
Outer Ring<br />
3600<br />
8 BRT Sheopura Tonk Road Road 4800<br />
9 BRT Tonk Road Sheopura Khori 3400<br />
10 BRT Atish Nagar Durgapura Rly Stn. Amer 7800<br />
11 BRT Sindhi Camp Lalkothi Durgapura<br />
Outer Ring<br />
4900<br />
12 Monorail Amer Transport Nagar Road<br />
Muralipura<br />
18400<br />
13 Monorail Chandpole Shastri Nagar Jn. 11700<br />
14 Metro Badi Chopar<br />
Water Works<br />
Railway Station Manasarovar 26000<br />
15 Metro Road Ajmeeri Gate Sheopura 22000
BRT<br />
Metro<br />
Mono Rail<br />
Recommended Systems
Travel Charecteristics<br />
Do<br />
Nothing<br />
Travel Characteristics<br />
Network+Bus<br />
Augmentation<br />
2031<br />
Network+Bus<br />
Augmentation<br />
+ Commuter<br />
rail +BRT +Metro All<br />
Public Transport Share 10% 23% 26% 30% 28% 35%<br />
Average Trip Length(Km) 7.9 9 9.0 9.2 9.5 9.5<br />
Average g Network Speed(Kmph) p ( p )<br />
14 28.5 29 29 32 32
Mobility Plan Elements<br />
Proposed<br />
New Links
Proposed ROB’s & RUB’s<br />
Mobility Plan Elements
BUS FLEET ENHANCEMENT<br />
The Mobility Plan<br />
• Existing fleet strength is 1440. Additional fleet<br />
requirement is approximately 160 Buses for the<br />
present situation. i i<br />
• For 2031, the bus fleet requirement will be around<br />
4000<br />
• The bus fleet augmentation should focus bus<br />
technology as modern vehicles have direct impact on<br />
speed,<br />
comfort. f<br />
capacity, environmental friendliness and<br />
• ROUTE RATIONALISATION of the existing and new bus<br />
routes
Proposed Pedestrian Subways / FOBs<br />
The Mobility Plan<br />
NMT Plan<br />
11. RRailway il Station St ti Road R d<br />
2. Kasakothi Junction<br />
3. Chandpol Bazaar<br />
4. Chhotti Chaupar<br />
5. Badi Chaupar<br />
6. G.P.O Junction<br />
7. Ajmeri gate Junction<br />
8. Sanganeri Gate Junction<br />
99. Ghat Gate Junction<br />
10. Transport Nagar Junction<br />
11. Sanganer Airport Junction
Cycle Track & Skywalk<br />
Footpath<br />
A minimum i i usablewidth bl idth<br />
of 1.5 meters should<br />
be provided for footpath.
Core Area Schemes<br />
•Parking Improvement<br />
• Traffic Management<br />
•NMT Plan<br />
•Hawkers &<br />
Encroachment s
The Mobility Plan<br />
Traffic Management Plan Traffic Management<br />
• Junction improvements<br />
Measures<br />
Measures<br />
• Area Traffic Control Systems<br />
• Traffic Management Measures<br />
• Safety Measures<br />
• Parking Management Plan
Junction Improvements<br />
Signal Coordination and<br />
Optimization<br />
•Khasakoti Junction<br />
•G.P.O Junction<br />
•Ghatgate Junction<br />
•Rambagh Circle<br />
•Sodala Junction<br />
•Transport Nagar Junction<br />
The Mobility Plan<br />
Traffic Management<br />
Measures<br />
Junction Improvements<br />
Pavement Markings & Signage<br />
•T •Traffic ffi control t l ffacilities iliti suchh as: CCenter t li line,<br />
Traffic lane lines, Stop lines, Pedestrian<br />
crossings, Parking space limits, Kerb marking<br />
for visibility, Obstruction marking etc. must be<br />
provided keeping in view all users of the road<br />
and especially especially for night night time driving driving.<br />
•All the traffic signs should be facilitated as per<br />
the guidelines provided in IRC publication 67‐<br />
2001.
The Mobility Plan<br />
Parking Management Plan Traffic Management<br />
Measures<br />
Measures<br />
Off-Street Parking Locations<br />
1.Near G.P.O Juction<br />
1.Near G.P.O Juction<br />
2.Near Chaugan Stadium<br />
3. Dayanand Marg
Area Traffic Control Systems<br />
•The Area Traffic Control Systems shall link various<br />
elements of Intelligent Transportation Systems<br />
••Will ll enable bl ddecision makers k to identify d f andd react to an<br />
incident in a timely manner based on real‐time data.<br />
•The ATC will help reduce incident response times,<br />
disseminate traveler information and hence reduce<br />
congestion and enhance safety<br />
The Mobility Plan<br />
Safety Measures<br />
Traffic Management<br />
Measures<br />
•Black spots must be identified along the major<br />
roads and specific improvements must be<br />
proposed at those locations.<br />
•All speed breakers and humps be marked and<br />
signed adequately for night time visibility<br />
•All traffic signages be made retro reflective<br />
•Create traffic safety patrol programs for<br />
student volunteers at all schools<br />
•Install Install pavement markings such as lane lines,<br />
median lines, stop bar, parking stalls/bays etc<br />
•Ensure that adequate street lighting is provided<br />
•S •Set tup a RRoaddAAccident id tAAnalysis l i SSystem t
Freight Movement Plan<br />
Truck<br />
Terminal
Congestion Pricing<br />
•To reduce vehicular travel demand and congestion, a<br />
congestion charging policy can be introduced within the<br />
Central areas of Jaipur.<br />
•The The congestion operating hours can be taken as from<br />
10:00 AM to 7:30 PM, Monday through Friday,<br />
excluding public holidays.<br />
•A stipulated fee can be charged as congestion charge<br />
ffor th those dii driving within ithi th therestricted tit dcentral t larea.<br />
The Mobility Plan<br />
Parking g Control<br />
•Car‐free streets<br />
Travel Demand<br />
Management<br />
•Cordon controls on entering a particular area<br />
•Odd/ even schemes and variations based on<br />
number plates.<br />
•The areas that should be considered for parking<br />
control include Chanpol Bazaar, Ramganj<br />
Bazaar, Johari Bazaar Kishonpol Bazaar .
Encroachment & Hawker Management<br />
The Mobility Plan<br />
Other Plans<br />
Green Zone:. Zone Allow hawkers to do their business<br />
at all the times without any restrictions. The<br />
locations around the market areas generally are<br />
designated as Green Zones<br />
Amber Zone: Zone Some restrictions for the vendors<br />
and hawkers.<br />
•These restrictions could either be by time of the<br />
dday, or bby th the dday off th theweek. k<br />
•On all other times, vending is allowed at<br />
designated areas.<br />
Red Zone Zone: Hawking/vending g g are not allowed at<br />
these designated areas at any time.<br />
• The zones identified as Red Zones will always<br />
prohibit hawkers.<br />
• All the busy corridors of the town, will come<br />
under the cover of Red Zone Zone, and hence hence, are<br />
hawker‐free zones.
Tourist Monorail Corridor
Inves stmen nt Pro ogram<br />
mm<br />
Investment Category<br />
Quantity<br />
Unit Rate in<br />
Rs.Crores<br />
Total in<br />
Rs.Crores<br />
Public Transport Improvement 2010‐2015 2015‐2020<br />
Phasing PPP Potential<br />
2020 and<br />
Beyond<br />
Bus Fleet Augmentation 2600 0.4 1040 50 300 430 0<br />
Metro Rail 28 250 7000 3000 4000 0<br />
BRT 100 12 1200 400 400 400 450<br />
Intermodal Stations 4 10 40 20 20 40<br />
Tourist Monorail 11 90 990 2000 500<br />
Terminals Improvements 2 10 20 20 20<br />
Augmentation of Roads<br />
Grade separators & ROBs 17 20 340 340 0<br />
Rd Widening – 4laning 200 2 400 200 200 0<br />
Rd Widening – 6laning 30 4 120 60 60 0<br />
New Roads (4 lane) 60 4 240 120 120 0<br />
Ring Road 80 12 960 960 960<br />
Tunnels 2 400 800 400 400 0<br />
Riverside Road 50 30 1500 1500 200<br />
Non Motorised Transport<br />
Bike lane 160 1 160 160 0<br />
Foot Path cum drains 200 0.45 90 200 0<br />
Pedestrian FoB 11 1 11 11 5<br />
Traffic Management<br />
Major Jct Improvements 6 0.25 1.5 6 0<br />
Area Traffic Control LS 50 50 0<br />
Signages and Road Markings LS 5 5 0<br />
Total 14,968 7,602 7,000 1,230 2,175<br />
PPP Potential 2675 2155 370 150<br />
18% 28% 5% 12%<br />
Financing NURM 7,484 3,801 3,500 615<br />
PPP 2,675 2,155 370 150<br />
State 4,809 1,646 3,130 465
Central Planning<br />
Functions: Coordination<br />
Institutional Framework<br />
Regulator<br />
Functions: Safety & License<br />
MC JDA GoR Police DTCP<br />
DMRC
EEnd dof f Presentation<br />
P i<br />
Thank You