Water management and climate changes increases the phosphorus ...
Water management and climate changes increases the phosphorus ...
Water management and climate changes increases the phosphorus ...

Create successful ePaper yourself
Turn your PDF publications into a flip-book with our unique Google optimized e-Paper software.
( )<br />
V. Claero et al. The Science of <strong>the</strong> Total Enironment 228 1999 193202 195<br />
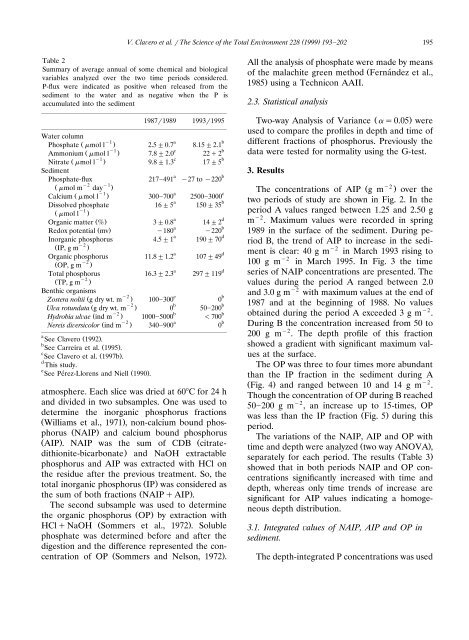
Table 2<br />
Summary of average annual of some chemical <strong>and</strong> biological<br />
variables analyzed over <strong>the</strong> two time periods considered.<br />
P-flux were indicated as positive when released from <strong>the</strong><br />
sediment to <strong>the</strong> water <strong>and</strong> as negative when <strong>the</strong> P is<br />
accumulated into <strong>the</strong> sediment<br />
19871989 19931995<br />
<strong>Water</strong> column<br />
Phosphate Ž mol l . 2.50.7 8.152.1<br />
Ammonium Ž mol l . 7.82.0 222<br />
Nitrate Ž mol l<br />
Sediment<br />
.<br />
9.81.3 175<br />
Phosphate-flux 217491 27 to 220<br />
Ž 2 1.<br />
Calcium Ž mol l .<br />
300700 25003000<br />
Dissolved phosphate<br />
1 Ž mol l .<br />
165 15035<br />
Organic matter Ž % .<br />
30.8 142<br />
Redox potential Ž mv. 180 220<br />
Inorganic <strong>phosphorus</strong><br />
2 Ž IP, g m .<br />
4.51 19070<br />
Organic <strong>phosphorus</strong><br />
2 Ž OP, g m .<br />
11.81.2 10749<br />
Total <strong>phosphorus</strong><br />
2 Ž TP, g m .<br />
Benthic organisms<br />
16.32.3 297119<br />
Zostera noltii Ž g dry wt. m . 100300 0<br />
Ula rotundata Ž g dry wt. m . 0 50200<br />
Hydrobia ulae Ž ind m . 10005000 700<br />
Nereis diersicolor Ž ind m . 340900 0<br />
1 a b<br />
1 c b<br />
1 c b<br />
a b<br />
mol m day 1 a c<br />
a<br />
See Clavero Ž 1992 . .<br />
b<br />
See Carreira et al. Ž 1995 . .<br />
c<br />
See Clavero et al. Ž 1997b . .<br />
d<br />
This study.<br />
e<br />
See Perez-Llorens ´<br />
<strong>and</strong> Niell Ž 1990 . .<br />
a b<br />
a d<br />
a b<br />
a d<br />
a d<br />
a d<br />
2 e b<br />
2 b b<br />
2 b b<br />
2 a b<br />
atmosphere. Each slice was dried at 60C for 24 h<br />
<strong>and</strong> divided in two subsamples. One was used to<br />
determine <strong>the</strong> inorganic <strong>phosphorus</strong> fractions<br />
Ž Williams et al., 1971 . , non-calcium bound <strong>phosphorus</strong><br />
Ž NAIP. <strong>and</strong> calcium bound <strong>phosphorus</strong><br />
Ž AIP . . NAIP was <strong>the</strong> sum of CDB Žcitrate-<br />
dithionite-bicarbonate. <strong>and</strong> NaOH extractable<br />
<strong>phosphorus</strong> <strong>and</strong> AIP was extracted with HCl on<br />
<strong>the</strong> residue after <strong>the</strong> previous treatment. So, <strong>the</strong><br />
total inorganic <strong>phosphorus</strong> Ž IP. was considered as<br />
<strong>the</strong> sum of both fractions Ž NAIPAIP . .<br />
The second subsample was used to determine<br />
<strong>the</strong> organic <strong>phosphorus</strong> Ž OP. by extraction with<br />
HClNaOH Ž Sommers et al., 1972 . . Soluble<br />
phosphate was determined before <strong>and</strong> after <strong>the</strong><br />
digestion <strong>and</strong> <strong>the</strong> difference represented <strong>the</strong> con-<br />
Ž .<br />
centration of OP Sommers <strong>and</strong> Nelson, 1972 .<br />
All <strong>the</strong> analysis of phosphate were made by means<br />
of <strong>the</strong> malachite green method ŽFern<strong>and</strong>ez<br />
´ et al.,<br />
1985. using a Technicon AAII.<br />
2.3. Statistical analysis<br />
Ž .<br />
Two-way Analysis of Variance 0.05 were<br />
used to compare <strong>the</strong> profiles in depth <strong>and</strong> time of<br />
different fractions of <strong>phosphorus</strong>. Previously <strong>the</strong><br />
data were tested for normality using <strong>the</strong> G-test.<br />
3. Results<br />
Ž 2 The concentrations of AIP g m . over <strong>the</strong><br />
two periods of study are shown in Fig. 2. In <strong>the</strong><br />
period A values ranged between 1.25 <strong>and</strong> 2.50 g<br />
m 2 . Maximum values were recorded in spring<br />
1989 in <strong>the</strong> surface of <strong>the</strong> sediment. During period<br />
B, <strong>the</strong> trend of AIP to increase in <strong>the</strong> sediment<br />
is clear: 40 g m 2 in March 1993 rising to<br />
100 g m 2 in March 1995. In Fig. 3 <strong>the</strong> time<br />
series of NAIP concentrations are presented. The<br />
values during <strong>the</strong> period A ranged between 2.0<br />
<strong>and</strong> 3.0 g m 2 with maximum values at <strong>the</strong> end of<br />
1987 <strong>and</strong> at <strong>the</strong> beginning of 1988. No values<br />
obtained during <strong>the</strong> period A exceeded 3 g m 2 .<br />
During B <strong>the</strong> concentration increased from 50 to<br />
200 g m 2 . The depth profile of this fraction<br />
showed a gradient with significant maximum values<br />
at <strong>the</strong> surface.<br />
The OP was three to four times more abundant<br />
than <strong>the</strong> IP fraction in <strong>the</strong> sediment during A<br />
Ž . 2<br />
Fig. 4 <strong>and</strong> ranged between 10 <strong>and</strong> 14 g m .<br />
Though <strong>the</strong> concentration of OP during B reached<br />
50200 g m2 , an increase up to 15-times, OP<br />
was less than <strong>the</strong> IP fraction Ž Fig. 5. during this<br />
period.<br />
The variations of <strong>the</strong> NAIP, AIP <strong>and</strong> OP with<br />
time <strong>and</strong> depth were analyzed Ž two way ANOVA . ,<br />
separately for each period. The results Ž Table 3.<br />
showed that in both periods NAIP <strong>and</strong> OP concentrations<br />
significantly increased with time <strong>and</strong><br />
depth, whereas only time trends of increase are<br />
significant for AIP values indicating a homogeneous<br />
depth distribution.<br />
3.1. Integrated alues of NAIP, AIP <strong>and</strong> OP in<br />
sediment.<br />
The depth-integrated P concentrations was used