Evolving Criteria - Reinsurance Thought Leadership | Aon Benfield
Evolving Criteria - Reinsurance Thought Leadership | Aon Benfield
Evolving Criteria - Reinsurance Thought Leadership | Aon Benfield

Create successful ePaper yourself
Turn your PDF publications into a flip-book with our unique Google optimized e-Paper software.
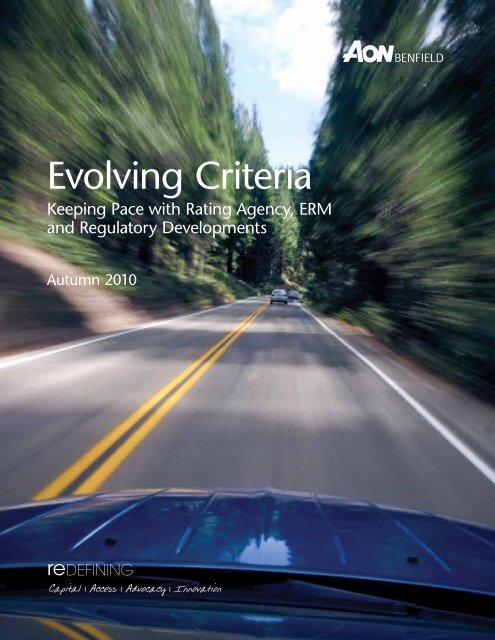
<strong>Evolving</strong> <strong>Criteria</strong><br />
Keeping Pace with Rating Agency, ERM<br />
and Regulatory Developments<br />
Autumn 2010<br />
reDEFINING<br />
Capital | Access | Advocacy | Innovation
Contents<br />
3 | Rating Trends<br />
5 | <strong>Criteria</strong> Updates<br />
9 | Rating Agency Key Concerns<br />
13 | ERM Expectations<br />
16 | Regulatory Update<br />
22 | Conclusion<br />
Executive Summary<br />
Keeping Pace with Rating Agency, ERM and Regulatory Developments<br />
Due to record levels of capital, the insurance industry<br />
remains plagued by an ongoing soft cycle. First half<br />
2010 insurer capital is commensurate with 2007 peak<br />
capital levels, leading to excess supply of insurance<br />
risk capital. This, coupled with weakened demand<br />
from continuing difficult economic conditions, has<br />
resulted in declining premiums and profitability. The<br />
rating agencies are more or less split in terms of<br />
industry outlooks between negative and stable, with<br />
rating upgrades and downgrades neutral. Given this<br />
environment, the question remains: will the industry<br />
stabilize or continue to worsen over the near term?<br />
Adding to current pressure on results and ratings,<br />
companies are dealing with continuously evolving<br />
rating agency criteria as well as numerous proposed<br />
regulatory changes globally. The likely impact is that<br />
companies will need to hold more capital due to these<br />
changes, further impacting capital adequacy, ratings<br />
and profitability metrics. The uncertainty surrounding<br />
these changes, particularly in regards to Solvency II, is<br />
making it difficult for companies to predict capital<br />
needs in the near term.<br />
Exhibit 1: Change in Insurer Capital<br />
2007<br />
-29% 34%<br />
2008<br />
2009<br />
2%<br />
1H 2010E<br />
Enterprise Risk Management (ERM) continues to be a<br />
hot topic and companies are investing significantly in<br />
developing their overall risk management framework<br />
and internal capital models. Standard & Poor’s (S&P)<br />
recently issued an exposure draft of proposed criteria in<br />
terms of economic capital model (ECM) reviews, which<br />
are onerous. Further, S&P indicated that even if the<br />
internal capital model shows lower capital<br />
requirements, it will have a limited impact on S&P<br />
capital requirements.
Rating Trends<br />
The major rating agencies have somewhat of a mixed<br />
viewpoint on the insurance industry. Exhibit 2 shows<br />
their respective outlooks for the various sectors, noting<br />
that no rating agency currently has a positive outlook<br />
for any line. However, this is a modest improvement<br />
compared to last year as Fitch changed its outlook on<br />
reinsurance from negative to stable and A.M. Best<br />
changed its life and annuity outlook similarly. The<br />
rating agencies view the industry outlooks as their<br />
“guidance” on the likely direction of rating actions<br />
during the next year.<br />
Most rating agencies have a negative outlook on the<br />
commercial lines sector, given concern over continued<br />
price competition forced by a historic level of supply with<br />
lagging demand from the 2008 and 2009 financial crisis,<br />
combined with weaker investment earnings. These<br />
negative rating factors are not expected to change in the<br />
near term until a broad economic recovery gains<br />
momentum. Likewise, concern regarding the tough<br />
competitive conditions throughout the industry and<br />
recent weak operating performance are the leading<br />
reasons for negative outlooks on the health sector. While<br />
health care reform will have an impact on U.S. health<br />
Exhibit 2: Current Industry Outlook (Sept 2010)<br />
Sector A.M. Best Fitch Moody's S&P<br />
Personal Lines Stable Negative Stable Negative<br />
Commercial Lines Stable Negative Negative Negative<br />
<strong>Reinsurance</strong> Stable Stable Negative Stable<br />
Health Negative Negative Negative Negative<br />
Life Insurance Stable Negative Stable Negative<br />
insurers, many of the changes it will bring are uncertain<br />
at this point, and as such is not the leading factor in the<br />
rating outlooks. Conversely, three rating agencies have a<br />
stable outlook on the reinsurance sector, reflecting their<br />
view that reinsurers have very strong capitalization and<br />
are well-positioned for continued profitability. These<br />
results are driven by relatively more stable pricing trends,<br />
conservative investment portfolios and leading risk<br />
management capabilities.<br />
Exhibit 3 shows the percentage of rating changes that<br />
were upgrades for each year since 2004 for A.M. Best,<br />
Moody’s and S&P. Overall, the trend from 2004 to 2007<br />
is fairly consistent across the rating agencies as the<br />
<strong>Aon</strong> <strong>Benfield</strong><br />
percentage of upgrades increased each year, transitioning<br />
from “downgrade” years in 2004 and 2005 to “upgrade”<br />
years in 2006 and 2007. However, from 2008 through<br />
June 2010 the correlation among rating agency<br />
disappears. A.M. Best rating activity has been stable with<br />
the percentage of upgrades around 50 percent each<br />
period. For Moody’s, rating activity is balanced in 2008<br />
and 2010 year-to-date with 50 percent of rating changes<br />
being upgrades; however, 2009 was a clear downgrade<br />
year as a number of companies had their ratings lowered<br />
as a fallout to the financial crisis. Separately, S&P shows a<br />
declining trend as the percentage of upgrades has<br />
decreased each of the last three years.<br />
Exhibit 3: Percentage of Upgrade Rating Actions<br />
100%<br />
80%<br />
60%<br />
40%<br />
20%<br />
0%<br />
4.0%<br />
2004<br />
2.1%<br />
2005<br />
A.M. Best<br />
2.6%<br />
2006<br />
Moody's<br />
0.5%<br />
2007<br />
-2.3%<br />
2008<br />
-3.5%<br />
2009<br />
2010YTD<br />
S&P Change in DWP<br />
Upgrade and downgrade activity for Fitch was not publicly available.<br />
Charted against this backdrop is the one-year change in<br />
Direct Written Premium (DWP). Starting in 2005 and<br />
ending in 2007, the trend towards upgrades occurred<br />
after the beginning of the current soft market, as<br />
evidenced by the corresponding decline in DWP over<br />
that time horizon. Further, the current stabilization of<br />
downgrades in 2010 is occurring while premiums are<br />
still declining. There appears to be a delay between<br />
cycle changes and corresponding rating changes, and<br />
as the current soft cycle continues, we should expect<br />
more downgrades to occur.<br />
The recent downgrades were primarily driven by<br />
consistent poor underwriting results rather than one<br />
single event loss. On average, the companies which<br />
were downgraded had a one-year and five-year average<br />
combined ratio that was more than 10 points higher<br />
than the companies who had their ratings affirmed.<br />
3
<strong>Evolving</strong> <strong>Criteria</strong><br />
Observations on A.M. Best<br />
“A-” Rating Activity<br />
To further deconstruct rating trends, <strong>Aon</strong> <strong>Benfield</strong><br />
performed a focused review of rating activity for the<br />
U.S.-based “A-“ rated companies for the years 2005 to<br />
2010. The study was focused on A.M. Best and the<br />
U.S. market because of the number of company<br />
ratings and corresponding availability of data for this<br />
segment. In addition, the target focus was on “A-”<br />
ratings, as many companies view an “A-“ rating as a<br />
key benchmark and/or threshold to effectively operate<br />
within their marketplace. This is especially true for the<br />
reinsurance and U.S. commercial markets where many<br />
strive to achieve an “A-” or better rating from multiple<br />
rating agencies.<br />
During this time period, 100 companies were upgraded<br />
from “B++” to “A-”. However, only 56 percent achieved<br />
the upgrade based upon their “own merit”. In other<br />
words, these companies were upgraded on account of<br />
their core operating performance and not due to an<br />
affiliation, capital infusion, merger, or other transaction.<br />
Exhibit 4 provides a summary of the median results of<br />
key financial ratios reported by “own merit” companies<br />
in the year of their upgrade.<br />
Exhibit 4: Median Results Reported by<br />
“Own Merit” Companies<br />
4<br />
Median 1 Year 3 Year 5 Year<br />
Combined Ratio 88% 90% 91%<br />
Operating ROR 20% 16% 16%<br />
BCAR 232%<br />
It is clear that rating activity has been driven by<br />
operating performance as companies that were<br />
downgraded significantly underperformed their peers.<br />
The downgraded peer group reported five-year average<br />
combined ratios that were on average 12 points higher<br />
than companies who had no ratings movement, and 17<br />
points higher than the upgraded peer group.<br />
Downgraded companies were also much more highly<br />
levered than the other peer groups. Capital adequacy<br />
remains important as evidenced by overall lower BCAR<br />
scores for the downgraded peer group.<br />
Exhibit 5: Median Results Reported<br />
Key Metrics –<br />
Median<br />
“A-” to “B++”<br />
Downgrades<br />
(Year of<br />
Downgrade)<br />
All “A-” Rating<br />
Units Through<br />
June 30, 2010<br />
“B++” to “A-”<br />
“Own Merit”<br />
Upgrades (Year<br />
of Upgrade)<br />
Total Companies 45 284 56<br />
Combined Ratio 119% 99% 88%<br />
5 Year<br />
Combined Ratio<br />
108% 96% 91%<br />
Operating ROR -12% 12% 20%<br />
5 Year<br />
Operating ROR<br />
1% 13% 16%<br />
NWP / PHS 1.2x 0.7x 1.0x<br />
BCAR 165% 246% 232%<br />
Looking at longer-term trends, we identified 190<br />
companies whose ratings were downgraded from “A-”<br />
from January 2000 to June 2010. The subsequent rating<br />
history of those companies is segregated as follows:<br />
> 87 companies’ ratings, or 46 percent, have remained<br />
the same or improved but are still below “A-”<br />
> 63 companies’ ratings, or 33 percent, have been<br />
downgraded further and/or withdrawn<br />
> 40 companies’ ratings, or 21 percent, have achieved<br />
an “A-“ or higher rating<br />
It is noteworthy to mention that of the 40 companies<br />
that regained a rating of “A-” or higher, only 20 (or<br />
11 percent of the total) were upgraded based<br />
primarily upon their “own merit” and on average, it<br />
took five years.<br />
Also, the same trends are applicable to “A” and “A+”<br />
companies who were downgraded over the same time<br />
period. These companies that were downgraded also<br />
performed significantly worse than their peers in terms<br />
of higher combined ratios by, on average, 10 points, and<br />
lower rates of return (ROR) by, on average, 10-15 points.<br />
Underwriting profitability is paramount to achieving an<br />
upgrade and avoiding a downgrade, and for companies<br />
currently on a downgrade trend this is even more<br />
important as it takes many years to regain an original<br />
rating, and many companies continue to get<br />
downgraded after the initial rating change.
<strong>Criteria</strong> Updates<br />
Looking back over the last decade, there have been a<br />
number of rating agency and regulatory criteria<br />
developments that have had a significant impact on<br />
how the industry operates today. These include A.M.<br />
Best introducing a catastrophe stress test, Fitch<br />
incorporating Prism, their updated suite of U.S. and<br />
non-U.S. capital models, and S&P adding ERM as a new<br />
category to their rating evaluation process. At the same<br />
time, Solvency II was introduced by EU regulators and<br />
many other jurisdictions are following its lead. The<br />
rating agencies and regulators are in a unique position<br />
to identify developing trends and best practices across<br />
Exhibit 6: Rating Agency <strong>Criteria</strong> Development Timeline<br />
S&P – Gauging the<br />
Impact of Unrealized<br />
Losses on Insurers<br />
Financial Strength<br />
June<br />
2009<br />
July<br />
2009<br />
A.M. Best – Natural<br />
Cat Stress Test<br />
Methodology Refined<br />
Aug<br />
2009<br />
A.M. Best – Rating<br />
Surplus Note and Insurance<br />
Trust-Preferred CDOs<br />
A.M. Best –<br />
Updated Understanding<br />
BCAR Score for<br />
Property & Casualty<br />
Insurers<br />
Sept<br />
2009<br />
A.M. Best – The Treatment<br />
of Terrorism Risk in the<br />
Rating Evaluation<br />
Oct<br />
2009<br />
S&P – ERM<br />
Assessing<br />
Management’s<br />
Commitment to<br />
the Execution<br />
of ERM<br />
Processes<br />
Nov<br />
2009<br />
A.M. Best – Rating Members<br />
of Insurance Groups<br />
Dec<br />
2009<br />
Fitch – Insurance<br />
Rating Methodology<br />
Fitch – Equity Credit<br />
for Hybrids & Other<br />
Capital Securities<br />
<strong>Aon</strong> <strong>Benfield</strong><br />
the industry and use that perspective to put forth new<br />
criteria. While many of the criteria developments have<br />
been incorporated within the industry for many years,<br />
rating agencies continually reassess their current<br />
methodology and introduce new criteria. The timeline<br />
below depicts rating agency criteria development from<br />
June 2009 through June 2010 and illustrates that rating<br />
agency criteria continually evolves.<br />
Many of the new methodology updates will influence<br />
how companies operate and prepare for rating agency<br />
discussions. The following pages summarize key criteria<br />
developments over the past year.<br />
S&P – Holding Company<br />
Hybrid Capital Issue<br />
Features: Update on<br />
Dividend Stoppers,<br />
Look-backs and Pushers<br />
S&P – Holding Company<br />
Clarification of the Equity<br />
Content Categories Used for<br />
Bank and Insurance Hybrid<br />
Jan<br />
2010<br />
S&P – ERM<br />
Expanded<br />
Definition<br />
of Adequate<br />
Classification in<br />
ERM Scores<br />
Feb<br />
2010<br />
March<br />
2010<br />
Fitch – Approach to<br />
Rating Insurance Groups<br />
S&P – Assumptions<br />
for 2010 Interest<br />
Rate Scenarios<br />
S&P – ERM<br />
Refined Methodology for<br />
Assessing an Insurer’s<br />
Risk Appetite<br />
S&P – Methodology<br />
for Incorporating<br />
Incremental<br />
Stress Factors<br />
Fitch – Non-Life<br />
Insurance Rating<br />
Methodology<br />
April<br />
2010<br />
A.M. Best –<br />
Equity Credit<br />
for Hybrid<br />
Securities<br />
A.M. Best –<br />
Draft: Rating<br />
New Company<br />
Formations<br />
Fitch – Introduced<br />
“Total Financing<br />
and Commitment<br />
Ratio”<br />
May<br />
2010<br />
Moody’s – Rating<br />
Methodology<br />
for Property &<br />
Casualty Insurers<br />
S&P – ERM<br />
Methodology<br />
for Assessing<br />
Insurers<br />
Economic<br />
Capital Models<br />
(request for<br />
comment)<br />
June<br />
2010<br />
S&P – Refined<br />
Methodology for<br />
Analyzing Insurer<br />
Capital Adequacy<br />
5
<strong>Evolving</strong> <strong>Criteria</strong><br />
A.M. Best<br />
A.M. Best released a number of methodology criteria<br />
papers during the past year and many were updates to<br />
existing criteria. For example, A.M. Best updated the<br />
catastrophe stress test calculation by lessening the<br />
impact on credit and reserve risk. The rating agency<br />
also stated a greater tolerance for a lower stress BCAR<br />
score. These changes eased the capital requirements for<br />
companies with material catastrophe exposure as<br />
compared to the previous approach. A.M. Best made<br />
minor updates to methodology criteria regarding<br />
treatment of terrorism risk and rating insurance groups<br />
among others.<br />
In April 2010, A.M. Best released a draft criteria paper<br />
regarding new company formations. The framework of<br />
this criteria paper was built off the initial criteria<br />
methodology released in March 2004, but with one very<br />
important distinction. In the current draft methodology,<br />
A.M. Best introduces the use of contingent capital to<br />
support upfront capital requirements. Historically,<br />
A.M. Best required a new company to raise initial capital<br />
that would support the first five years of operations (at<br />
the appropriate capital adequacy level) without the need<br />
for additional capital contributions. Coupled with other<br />
new company requirements, such as a 50 percent<br />
growth charge applied to reserve and premium risk, this<br />
created a high capital hurdle to obtain an initial rating of<br />
“A-” or higher. However, the current draft methodology<br />
puts forth consideration for use of contingent capital in<br />
years four and five to support initial capital requirements.<br />
Specifically, companies will be able to reduce initial<br />
on-balance sheet capital requirements if the following<br />
conditions exist (credit for contingent capital):<br />
> Fully executed, binding legal agreement<br />
> Irrevocable for the term of the agreement<br />
> Must be equity capital<br />
> Drawdown of capital must be unrestricted<br />
> Must have on-demand access to capital (within 20<br />
business days)<br />
> A risk-adjusted capital surcharge of 10 percent on<br />
the outstanding balance of the capital commitment<br />
will be assessed in the initial and subsequent BCARs<br />
6<br />
Given the current market environment, which is more<br />
geared toward mergers and acquisitions and less<br />
toward new company formations, the impact of this<br />
proposed criteria change is yet to be seen.<br />
Additionally, A.M. Best has a new draft methodology<br />
that addresses transfer and convertibility risk, which<br />
evaluates the likelihood of a sovereign disrupting the<br />
ability to convert local currency into foreign currency<br />
and/or transfer funds to nonresident creditors. In<br />
assessing transfer and convertibility risk, A.M. Best<br />
reviews a government’s current capital and trade<br />
controls, a country’s integration into the global<br />
economy, the strength of the local rule of law, and a<br />
sovereign’s use of price controls. The criteria may<br />
impact holding company issuer credit ratings and debt<br />
ratings, but is not expected to impact operating<br />
company financial strength ratings since it is designed<br />
to evaluate the ability to meet policyholder claims,<br />
which are normally in local currency.<br />
Fitch<br />
In December 2009, Fitch published a new global<br />
master criteria report detailing their insurance rating<br />
methodology for insurance organizations. This master<br />
criteria was then supplemented by various sector<br />
specific criteria including a global non-life insurance<br />
rating methodology published in March 2010. Fitch has<br />
stated that they must review their criteria a minimum<br />
of every three years.<br />
The main change in the new master criteria is the<br />
introduction of the total financing and commitment<br />
ratio (TFC) relative to capital as part of the analysis of<br />
the financial profile of a company.<br />
This is a comprehensive measure of debt-related<br />
leverage, making use of a broad definition of debt to<br />
include essentially all financing activities. This definition<br />
includes various financing types such as long-term<br />
notes, bank borrowings, commercial paper, repurchase<br />
agreements, “match-funded” debt at the holding<br />
company, letters of credit, securitizations, and<br />
guarantees of other debt issued by other entities.<br />
This ratio is designed to measure the debt, financing and<br />
capital markets “footprint” of an organization, and its<br />
overall reliance and ongoing access to funding sources.
The measure is intended to flag those companies that<br />
have an above-average reliance on the capital markets for<br />
funding, which would trigger further analysis by Fitch to<br />
understand the relative risk of the company’s various<br />
funding activities. Such additional analysis would involve<br />
leverage relative to capital, ability to refinance, potential<br />
calls on liquidity, and additional potential losses of capital.<br />
Fitch notes that the usefulness of the TFC ratio is to<br />
identify and further analyze outliers. For example,<br />
industry average TFC ratio is below 0.5x, while AIG’s TFC<br />
ratio leading into the financial crisis was more than 8.8x.<br />
Moody’s<br />
In May 2010, Moody’s Investor Service updated their<br />
global rating methodology for property & casualty<br />
insurers, last published in July 2008. The core principles<br />
of Moody’s approach remain similar, but Moody’s views<br />
the updated framework as better reflecting the<br />
changing landscape of the global property & casualty<br />
industry and the way in which Moody’s applies its<br />
methodologies.<br />
Compared to the previous methodology, the three<br />
main changes include:<br />
1. The elaboration of the components of operating<br />
environment and the inclusion of operating<br />
environment metrics in two categories.<br />
> Insurance systemic risk/country risk considers:<br />
• Economic strength — combination of several<br />
factors but primarily GDP per capital<br />
• Institutional strength — robustness of<br />
institutions and predictability of policies<br />
• Susceptibility to event risk — the risk of a direct<br />
and immediate credit threat; considers exposures<br />
to financial, economic and political stress<br />
> Insurance market development (development of<br />
the insurance sector in a given country):<br />
• Insurance penetration — significance of<br />
insurance market in the national economy<br />
• Insurance density (percentile rank) — utilization<br />
of insurance on a per capita basis<br />
<strong>Aon</strong> <strong>Benfield</strong><br />
2. Amended a number of the financial metrics used to<br />
analyze key rating factors, including: market position,<br />
asset quality, capital adequacy, profitability, reserve<br />
adequacy, and financial flexibility. Of the changes<br />
made to Moody’s rating scorecard, the most material<br />
has been the addition of a new metric to financial<br />
flexibility: total leverage ratio. This examines the<br />
total debt profile of the group that also incorporates<br />
operating debt.<br />
3. The metrics used to analyze key rating factors now<br />
include ranges for rating categories below Baa.<br />
It should be noted that Moody’s stated they do not<br />
anticipate changes to public ratings as a result of these<br />
updates to their methodology.<br />
Standard & Poor’s<br />
In January 2010, S&P expanded their ERM categories<br />
with the aim to provide differentiation within the<br />
“Adequate” category. The new classifications created<br />
three levels: (1) Adequate, (2) Adequate with strong<br />
risk controls and (3) Adequate with positive trend.<br />
Exhibit 7: S&P ERM Ratings for Global Non-Life<br />
and Life Industries<br />
Number of Companies<br />
200<br />
150<br />
100<br />
50<br />
0<br />
Excellent<br />
Strong<br />
Adequate<br />
(Positive)<br />
Adequate<br />
(Strong<br />
Controls)<br />
Adequate<br />
Weak<br />
Companies who are deemed “Adequate with strong risk<br />
controls” display the characteristics of “Adequate” plus<br />
strong controls over all of its material risks. Further,<br />
companies who are labeled “Adequate with positive<br />
trend” display all of the characteristics of “Adequate with<br />
strong risk controls” plus risk management culture scores<br />
that are at least “Strong”. These companies are expected<br />
to progress to a “Strong” ERM score within 24 months.<br />
7
<strong>Evolving</strong> <strong>Criteria</strong><br />
In June 2010, S&P updated their Enhanced Capital<br />
Model by outlining customized risk factors by global<br />
geographic regions. The model was updated to include<br />
regional specific risk charges for Asia Pacific, Latin<br />
America and Canada.<br />
While S&P specifically noted they do not anticipate this<br />
criteria update to result in rating changes, there were<br />
some notable increases when compared to the previous<br />
risk factors. The most affected risk charges were asset<br />
related, such as the charges for common equity, preferred<br />
equity and reinsurance recoverables. <strong>Aon</strong> <strong>Benfield</strong><br />
estimated these changes to increase net required capital<br />
by three to seven percent for the industry; however, it will<br />
vary by company depending on risk characteristics.<br />
In May 2010, S&P introduced their draft methodology on<br />
economic capital model (ECM) reviews, or Level III ERM<br />
reviews, and requested comments on the paper by<br />
August 9, 2010.<br />
8<br />
S&P stated that they believe ECM reviews to be the next<br />
step in the credit analysis, and they will deepen their<br />
assessment of a company’s risk management. S&P views<br />
it will help connect risk management with strategic<br />
decision making and advance analysis of each insurer’s<br />
capital needs, thus developing a more accurate and<br />
forward-looking view of financial strength.<br />
A company’s ECM will be incorporated in the capital<br />
adequacy analysis by blending the results of S&P’s<br />
Enhanced Capital Model results and the company’s<br />
ECM results. Following their review of the internal<br />
model, S&P proposes to utilize a credibility factor, the<br />
M-factor, which is an indication of its level of<br />
confidence in the insurer’s ECM. S&P will then refine<br />
their view of capital adequacy by using the combined<br />
result. It should be noted that any M-factor adjustment<br />
is limited to one rating category of capital relief.<br />
The potential implications of S&P’s draft ECM<br />
methodology are discussed in the ERM Expectations<br />
section on page 13.
Rating Agency Key Concerns<br />
Capital adequacy improved significantly for P&C insurers<br />
in 2009, rebounding from the drop in 2008. However,<br />
rating agencies remain cautious as evidenced by<br />
negative outlooks across a number of sectors. Similar to<br />
recent years, the theme of key rating agency concerns<br />
remain consistent, namely pricing pressure/soft cycle<br />
management, reserve adequacy, profitability trends,<br />
investments/liquidity, catastrophe management, and<br />
regulatory developments. The following pages explore<br />
the first three key concerns in more detail.<br />
Pricing Pressure<br />
While balance sheets rebounded, the downturn in the<br />
economy led to lower payrolls as most industries faced<br />
lower sales and production, reducing the demand for<br />
many insurance products and delaying the market<br />
hardening that was expected to happen during 2009.<br />
Pricing, especially for commercial lines, continues to be<br />
of concern among rating agencies.<br />
Exhibit 8: U.S. P&C Industry Aggregate<br />
Capital Adequacy<br />
$ Billions<br />
80<br />
60<br />
40<br />
20<br />
0<br />
-20<br />
-40<br />
-60<br />
-80<br />
2007<br />
2008<br />
Redundancy/Deficiency at the<br />
S&P “A” Rating Level ($ Billions)<br />
A.M. Best BCAR Score<br />
2009<br />
260<br />
240<br />
220<br />
200<br />
180<br />
160<br />
140<br />
120<br />
100<br />
BCAR Score<br />
<strong>Aon</strong> <strong>Benfield</strong><br />
Exhibit 9 depicts quarter-over-quarter changes<br />
in the U.S. industry DWP. Midway through 2008<br />
was the inflection point where personal lines<br />
rates stopped decreasing, placing significant<br />
pressure on the commercial lines. Since that point,<br />
commercial lines DWP continue to decline.<br />
Exhibit 9: U.S. Industry Aggregate Quarterover-Quarter<br />
Change in DWP<br />
Industry<br />
15%<br />
Commercial<br />
Personal<br />
10%<br />
5%<br />
0%<br />
-5%<br />
-10%<br />
2003<br />
2004<br />
2005<br />
2006<br />
2007<br />
2008<br />
2009 2010<br />
As shown in Exhibit 10, the Council of Insurance Agents<br />
and Brokers (CIAB), Market Scout and Advisen have<br />
indicated 20 consecutive quarters of declining rates.<br />
While Commercial Lines Insurance Pricing Survey<br />
(CLIPS), administered by Towers Watson, and <strong>Aon</strong><br />
<strong>Benfield</strong>’s results from quarterly conference calls show<br />
some recent quarters with modest growth indications.<br />
These do not cover modest inflation and may also<br />
reflect some optimism from reporting companies.<br />
In the second half of 2008, A.M. Best released a special<br />
report entitled Few Companies Excel at Managing<br />
through Market Cycles, which concluded insurers that<br />
performed best focused on underwriting to drive<br />
profits. Bottom performers were unable to grow as<br />
much as top performers during hard market years,<br />
finding themselves less well positioned after the last<br />
soft market. <strong>Aon</strong> <strong>Benfield</strong> Analytics replicated the cycle<br />
management analysis discussed in this report on all U.S.<br />
companies’ 2009 financials and found that only 15<br />
percent of the population achieved strong cycle<br />
management as defined within the original study.<br />
9
<strong>Evolving</strong> <strong>Criteria</strong><br />
Exhibit 10: Quarterly Rate Changes<br />
10<br />
CIAB (GL) Market Scout Advisen CLIPS All Co. Avg<br />
Q2 2005 -10.0% -2.3% -7.1% -2.0%<br />
Q3 2005 -7.7% -5.3% -8.3% -2.0%<br />
Q4 2005 -4.7% -4.7% -6.6% -2.0%<br />
Q1 2006 -6.0% -5.7% -4.4% -2.0%<br />
Q2 2006 -5.6% -6.0% -2.1% -1.0%<br />
Q3 2006 -6.3% -9.0% -0.4% -1.0%<br />
Q4 2006 -8.4% -8.7% -1.3% -3.0%<br />
<strong>Aon</strong> <strong>Benfield</strong> Company Sample<br />
Specialty<br />
Co. Avg<br />
Standard<br />
Co. Avg<br />
Q1 2007 -10.5% -10.3% -2.0% -4.0% -3.9% -5.2% -3.0%<br />
Q2 2007 -11.4% -13.0% -2.5% -5.0% -6.0% -8.0% -4.8%<br />
Q3 2007 -12.1% -15.0% -2.9% -5.0% -7.5% -9.4% -5.4%<br />
Q4 2007 -12.2% -15.3% -3.6% -6.0% -7.1% -7.4% -5.8%<br />
Q1 2008 -12.6% -13.7% -5.4% -6.0% -6.6% -6.9% -5.5%<br />
Q2 2008 -11.9% -11.3% -6.0% -6.0% -7.6% -7.8% -5.9%<br />
Q3 2008 -9.7% -10.3% -6.9% -5.0% -5.8% -6.0% -4.9%<br />
Q4 2008 -5.8% -9.0% -6.4% -3.0% -3.6% -4.4% -2.6%<br />
Q1 2009 -4.2% -8.0% -3.9% 0.0% -0.6% -0.8% -0.5%<br />
Q2 2009 -4.9% -6.3% -2.8% 1.0% 0.6% 0.0% 1.2%<br />
Q3 2009 -4.7% -5.0% -1.7% 0.0% 0.7% 0.6% 0.9%<br />
Q4 2009 -5.6% -4.7% -1.7% 0.0% 0.9% 0.9% 0.5%<br />
Q1 2010 -4.9% -4.3% -2.4% -0.1% -1.0% 0.7%
Cycle management strategy is often a component of a<br />
company’s ERM discussion with rating agencies. As part of<br />
this discussion, rating agencies are looking to understand<br />
a company’s cycle management approach, such as:<br />
> How does the insurer measure and monitor<br />
the cycle and then apply this information in its<br />
decision making?<br />
> Are the insurer’s underwriting, pricing and claim<br />
management functions robust?<br />
> Is the insurer’s compensation structure aligned with<br />
the company’s cycle management strategy?<br />
Rating agencies want companies to articulate how they<br />
are effectively balancing growth and long-term<br />
profitability. Companies that are growing aggressively<br />
in the soft market need to be prepared to discuss why<br />
they believe they can do so profitably.<br />
Reserve Adequacy<br />
In the past few years, P&C insurers have released<br />
significant amounts of loss reserves as overall market<br />
conditions continued to decline. While most of the<br />
rating agencies still believe the overall industry is<br />
adequately reserved, there is concern that individual<br />
companies could be under-reserved, especially as it<br />
relates to the most recent accident years. Further,<br />
underwriting results will be constrained going forward<br />
without additional reserve releases.<br />
Exhibit 11: U.S. Industry Aggregate 2009 One-Year<br />
Accident Year Reserve Development<br />
Accident Year One-Year Development<br />
Prior 4,615,902<br />
2000 162,619<br />
2001 258,944<br />
2002 52,590<br />
2003 (624,284)<br />
2004 (1,438,448)<br />
2005 (2,452,720)<br />
2006 (9,502,826)<br />
2007 (9,000,441)<br />
2008 (621,711)<br />
2009 XXX<br />
Totals (18,550,375)<br />
<strong>Aon</strong> <strong>Benfield</strong><br />
In 2009, U.S. P&C industry statutory results benefited<br />
from $18.6 billion of reserve releases, leading to 4.3<br />
points of calendar year loss ratio improvement. As<br />
shown in Exhibit 11, accident years 2006 and 2007<br />
accounted for the bulk of redundancies, while older<br />
accident years still have a drag on calendar year results.<br />
Further, first quarter 2010 combined ratios benefited<br />
from 5.2 points of favorable loss development. Again,<br />
the majority of reserve releases were from recent<br />
accident years, sparking concerns about a possible<br />
future reversal as these years mature.<br />
S&P published a paper in June 2010 entitled Why U.S.<br />
Property/Casualty Insurers Might Have to Put the Brakes<br />
on Reserve Releases. S&P believes that future reserve<br />
adequacy will depend heavily on the length of the<br />
current soft cycle, as well as the effectiveness of the risk<br />
controls and tools that have been developed in recent<br />
years under companies’ ERM frameworks.<br />
In August 2010, Fitch also reported on this topic in a<br />
special report called Property/Casualty Industry Loss<br />
Reserve Adequacy — Are Redundancies Exhausted? Fitch<br />
concludes that the U.S. industry’s reserves are<br />
approximately one to two percent redundant at<br />
year-end 2009, which is a similar position to year-end<br />
2008. They also believe that the more recent accident<br />
years of 2007-2009 are adequately reserved, although<br />
caution that they do not think it is likely they will<br />
produce redundancies in the future.<br />
Moody’s has similar conclusions in their August 2010<br />
report entitled U.S. P&C Insurers Harvest Significant<br />
Reserve Redundancy. They note the soft market cycle as<br />
P&C insurers’ primary obstacle to building reserves at<br />
the same level as recent years. Additionally, they believe<br />
that reserves are still redundant as of year-end 2009,<br />
but expect that as reserve releases slow, insurers will<br />
either raise rates or experience continued pressure on<br />
underwriting results.<br />
Lastly, A.M. Best presented during their industry<br />
conference that loss reserve adequacy was eroding<br />
as they estimated industry reserves moved from a<br />
$3 billion redundancy at year-end 2008 to a $4 billion<br />
deficit by year-end 2009.<br />
As evidenced by the various commentaries by all the<br />
major rating agencies, it is clear reserve adequacy is a<br />
key concern as the industry continues along a soft<br />
market cycle.<br />
11
<strong>Evolving</strong> <strong>Criteria</strong><br />
Profitability Trends<br />
Rating agencies have become increasingly focused on<br />
companies’ ability to underwrite profitably. P&C insurers<br />
are facing several impediments to earnings, including an<br />
extended soft market cycle, weak economic conditions,<br />
inadequate rates due to government restrictions, and<br />
catastrophe frequency losses.<br />
Exhibit 12: Percentage of Companies<br />
Reporting Combined Ratios Greater Than<br />
110 Percent and Below 100 Percent<br />
70%<br />
60%<br />
50%<br />
40%<br />
30%<br />
20%<br />
10%<br />
0%<br />
12<br />
less than 100% CR<br />
greater than 110% CR<br />
2000 2001 2002 2003 2004 2005 2006 2007 2008 2009<br />
The gray line on the graph above depicts the percentage<br />
of companies that reported a combined ratio below 100<br />
percent. For example, in 2006 64.5 percent of<br />
companies within the U.S. P&C industry reported a<br />
combined ratio below 100 percent. At year-end 2009,<br />
this percentage dropped to 46.1 percent. Conversely,<br />
the green line shows the percentage of companies that<br />
reported a combined ratio above 110 percent. This<br />
inherently has a negative correlation to the percentage<br />
reporting a combined ratio below 100 percent (gray<br />
line), but we chose a 10 point buffer to segment the<br />
percentage of poor performers versus companies that<br />
reported results only slightly above a 100 percent<br />
combined ratio. As expected, over the last ten years, the<br />
trough was 2006 when only 20.7 percent of companies<br />
reported a combined ratio above 110 percent, but this<br />
percentage increased to 30.6 percent in 2009. Whereas<br />
profitability trends are often the catalyst to rating<br />
actions, this graph depicts a weakening trend on a by<br />
company basis that is sometimes masked when looking<br />
at industry aggregate results.<br />
This concern is evidenced in several negative rating<br />
actions taken against well-capitalized companies that<br />
have performed poorly in comparison to their peers. In<br />
fact, 11 of 26 downgrades by A.M. Best in 2010 showed<br />
more than a 10 percent improvement in BCAR yearover-year.<br />
Further, shrinking premium bases are placing<br />
pressure on expense ratios and thus profitability. The<br />
median net expense ratio for the U.S. P&C industry in<br />
2009 was 30.7 percent, which is 3.5 points higher than<br />
2006 and 7.0 points higher than five years ago.<br />
Lastly, given these profitability trends, we have seen an<br />
increased focus on companies’ ability to achieve<br />
projections presented to rating agencies.<br />
The detailed pricing, reserving and profitability<br />
analyses are based on U.S. data due to general<br />
availability and accessibility of information. However,<br />
the underlying trends are applicable globally as many<br />
other markets are facing the same pricing pressures as<br />
in the U.S., and the rating agencies have the same<br />
concerns globally.<br />
S&P issued a report about the U.K. non-life market,<br />
noting declining profitability has largely been masked<br />
by reserve releases overall. Further, investment returns<br />
have been limited by the current low interest rates and<br />
the conservative investment strategies that insurers<br />
have maintained over the course of the financial turmoil<br />
of the past two or three years. A.M. Best noted that<br />
European multi-line insurers are relying on life business<br />
to help offset a struggling soft market. However, this is<br />
not the case in Asia as capacity and demand remains<br />
sufficient due to expansion, though not to the same<br />
levels as in the prior years. Further, many global<br />
companies reiterated in recent earnings calls these<br />
prevailing issues impacting overall profitability, with<br />
little hope on the horizon.<br />
The global reinsurance industry is experiencing similar<br />
trends, and we expect continued pressure on<br />
downward rates will be evident throughout all property<br />
catastrophe segments (even beyond the U.S.) as supply<br />
continues to exceed demand. Further, across most<br />
non-catastrophe lines globally, pricing is flat to slightly<br />
down with the exception of a few lines.
ERM Expectations<br />
ERM continues to play a significant role in how the<br />
insurance industry manages its operations broadly, and<br />
in understanding the risks associated with those<br />
operations specifically. Rating agencies elevated the<br />
awareness of ERM with specific ratings criteria<br />
introduced as far back as 2005. Regulatory influences<br />
have also been in play particularly with the pending<br />
Solvency II regime. External forces aside, some industry<br />
practitioners have benefited from their ERM<br />
frameworks for several years now. Many organizations<br />
have full-time chief risk officers or equivalent ERM<br />
leadership in their firm, with some industry surveys<br />
suggesting more than half of insurers with such roles in<br />
place. Moreover, economic capital modeling still plays<br />
a prominent role with insurers to understand risks,<br />
optimize reinsurance and make capital allocation<br />
decisions. All signs indicate that expectations for ERM<br />
are rising, along with related resources and technology.<br />
Rating Agency and Regulatory Influences<br />
S&P continues to be active in clarifying their criteria for<br />
ERM and capital during the past 12 months. One of the<br />
more prominent updates was the criteria draft for<br />
formal ECM reviews (or Level III ERM reviews) noted<br />
previously. Refinement to Level III criteria is expected in<br />
the coming months, followed by formal ECM reviews<br />
beginning later in 2010 or early 2011. This update by<br />
S&P is viewed as a logical progression in the review of<br />
ERM, an enhanced understanding of insurer’s capital<br />
needs and ultimately improved ratings decisions. Early<br />
indications suggest that ECM reviews that are not<br />
deemed credible will be a limiting factor to ERM scores.<br />
Yet S&P has indicated that in some cases a credible<br />
ECM may warrant capital relief in their view, and<br />
ultimately positive ratings traction. Additional clarity is<br />
needed before any definitive statements in that regard<br />
can be made; however, what is clear is ERM will remain<br />
a driving force for pending ratings evaluations.<br />
Thus far, A.M. Best has not updated their ERM criteria<br />
since their paper Risk Management and the Ratings<br />
Process for Insurance Companies was released in January<br />
2008, nor have we seen any recent and significant<br />
updates or clarifications on ERM from other major<br />
rating agencies. A.M. Best has stated plans to release a<br />
criteria paper that discusses their approach for<br />
evaluating ERM capabilities for small and medium-sized<br />
<strong>Aon</strong> <strong>Benfield</strong><br />
companies with varying levels of complexity. Overall,<br />
we expect ERM to remain a key factor in the ratings<br />
review processes among all rating agencies, particularly<br />
in understanding how ERM supports management’s<br />
strategic objectives, risk tolerances and risk preferences.<br />
The Solvency II regime and particularly Pillar II has ERM<br />
underpinnings to it. Further tweaking is expected to<br />
Solvency II requirements prior to companies going live<br />
in 2013. However, most of that tweaking is currently<br />
focused on Pillar I (capital requirements and related<br />
calculations). Less debated, but arguably of similar<br />
importance is Pillar II (governance and risk<br />
management). Pillar II’s focus is on such topics as risk<br />
control and self assessment, supervisory review, risk<br />
governance, and general risk management<br />
effectiveness. These topics all relate to the ERM ideal,<br />
and those organizations viewed to have relatively weak<br />
ERM constructs run the risk of regulators requiring<br />
additional capital and oversight; a precarious and costly<br />
situation that most insurers would like to avoid.<br />
External stakeholders continue to influence and<br />
elevate expectations of ERM. However, the industry is<br />
well-positioned to be at the forefront and raising the<br />
bar of what constitutes robust ERM. Indeed, best<br />
practices from today will become standard practices<br />
tomorrow. Those insurers who embrace this concept<br />
and push innovative risk intelligence will create their<br />
own competitive advantages, and as a by-product<br />
appease external influencers such as rating agencies<br />
and regulators.<br />
Key Trends in ERM<br />
<strong>Aon</strong> <strong>Benfield</strong> has identified three areas of ERM that<br />
seem to garner more attention on a consistent basis<br />
across the industry: risk appetite refinement,<br />
understanding emerging risks and risk modeling.<br />
Risk Appetite Refinement<br />
A key element of risk governance and risk oversight is to<br />
prescribe the extent of risk an organization is willing to<br />
take. This risk tolerance is predicated on understanding<br />
the firm’s capacity or ability to assume various risks.<br />
One part of risk bearing capacity is from a quantitative<br />
perspective such as available capital or surplus. The<br />
second is from a qualitative perspective and comes<br />
13
<strong>Evolving</strong> <strong>Criteria</strong><br />
from knowledge, systems, tools, and resources that<br />
collectively facilitate an understanding of risk for the<br />
insurer. Once this capacity is understood, the insurer is<br />
positioned to establish its tolerance for risk.<br />
Exhibit 13: Applying Risk Tolerance<br />
14<br />
Alt.<br />
Assets<br />
E&O<br />
Cat<br />
Munis<br />
Casualty<br />
D&O<br />
Risk Bearing Capacity<br />
Equities<br />
Credit<br />
Emerging<br />
Markets<br />
REITS<br />
Risk Tolerance = the “Box”<br />
M&A<br />
Aviation<br />
Surety<br />
Risk Appetite = How you<br />
decide what you put in the box<br />
Unlike the holistic understanding of ERM, traditional<br />
risk management tends to view risks in a<br />
compartmentalized fashion. This traditional approach<br />
has also carried over to risk tolerance definitions. For<br />
example, most insurers have a clear understanding of<br />
insurance risk and asset risk independently (e.g.,<br />
catastrophe PML targets vs. investment benchmark<br />
tracking error targets), but less on an aggregated basis.<br />
Advanced practitioners also view risk tolerance as a<br />
single, aggregate measure across all risk types,<br />
contemplating how risks interact and correlate with<br />
one another. Economic capital modeling is one tool<br />
that can help an insurer understand and develop their<br />
risk tolerance, articulate that tolerance and monitor its<br />
adherence over time.<br />
The most common articulation of risk tolerance is a<br />
fraction of capital or earnings. <strong>Aon</strong> <strong>Benfield</strong> has noticed<br />
a typical tolerance range of 10-25 percent of equity<br />
capital at risk over a one-year period, with reinsurers<br />
more willing to be at the higher end of the range.<br />
Some companies keep constraints with respect to a<br />
target financial strength rating or a risk-based capital<br />
threshold as well. No matter how it’s articulated, risk<br />
tolerance establishes a common understanding<br />
between management, the board of directors and<br />
external stakeholders to the boundaries the insurer can<br />
operate within.<br />
After understanding risk bearing capacity and<br />
establishing risk tolerance, management must determine<br />
its risk appetite and risk preferences. Companies with<br />
robust ERM use risk appetite as a means to prescribe the<br />
method to evaluate risk and what risks it wishes to<br />
entertain. This decision making process also starts at the<br />
corporate level in light of strategy and planning, but<br />
ultimately transcends to the point of sale via established<br />
limits, guidelines and standards of practice. Those<br />
insurers with robust ERM tend to refine their risk appetite<br />
and potentially their risk tolerance as market<br />
characteristics evolve. Rate adequacy, tort concerns and<br />
economic conditions are examples of dynamic variables<br />
that may indicate a favorable risk opportunity today that<br />
was less favorable the prior period.<br />
Understanding Emerging Risks<br />
Perhaps the most critical and potentially the most<br />
damaging risks that an organization faces are those that<br />
are unknown. The emergence of asbestos and<br />
environmental claims continues to teach valuable<br />
lessons to the industry. The credit market disruption<br />
and related housing crisis leading up to the financial<br />
market collapse in 2008 are other risks that hindsight<br />
shows presented early warning signs that were<br />
overlooked by many. These risks might not have been<br />
avoided in their entirety, but with more effective<br />
environmental scanning processes and early warning<br />
systems, the impact of these risks may have been<br />
reduced to acceptable ranges.<br />
<strong>Aon</strong> <strong>Benfield</strong> finds that the subject of emerging risks<br />
has become a standard agenda item at company risk<br />
committee meetings and is regularly discussed at board<br />
level risk reviews. Emerging risks are now tracked in the<br />
same manner as fully emerged risks. This may include<br />
assigning a risk owner, creating a detailed risk profile,<br />
employing risk mitigation procedures and controls, and<br />
to the extent possible, developing reasonable estimates<br />
of related potential loss.
An established risk discovery process enables insurers<br />
to identify emerging risks better. This includes<br />
mapping activities crucial to the operations of the<br />
business and frequent exploration of trends across<br />
science and technology, medicine, economics,<br />
regulation, and geo-politics. Measuring the impact of<br />
emerging risks is very subjective in the early stages of<br />
discovery, but should at least include collective<br />
perspectives of all leaders and functions of the<br />
company. Once risk traits are understood for an<br />
emerging risk, proxies of development trends based<br />
on established risks with similar traits can be applied.<br />
This facilitates an early estimation of how long a risk<br />
may take to fully emerge and the financial implications<br />
once that emergence is realized.<br />
A formal emerging risk management process is crucial<br />
to an effective ERM process, and has become a staple<br />
for industry leaders in this space. Our research shows<br />
that investors tend to reward insurers with higher<br />
multiples when those insurers have shown an ability to<br />
avoid loss due to the unexpected. Likewise, rating<br />
agencies and regulators are less likely to provide<br />
favorable opinions when emerging risk management<br />
processes are not deemed effective and not embedded<br />
in ERM frameworks of the insurers they evaluate.<br />
Exhibit 14: Stochastic ECM Application Spectrum<br />
<strong>Reinsurance</strong><br />
Management<br />
Regional carrier with<br />
few product offerings<br />
Catastrophe<br />
Management<br />
<strong>Aon</strong> <strong>Benfield</strong><br />
Risk Modeling<br />
Internal capital modeling is becoming a standard ERM<br />
tool for the industry. Yet, there still lacks any standard<br />
in how ECMs are applied. For non-life insurers, some<br />
suggest that ECMs are best suited for reinsurance<br />
purchase decisions, while others claim to use ECM as<br />
the primary driver of strategic decision making.<br />
As the graph below indicates, larger and more complex<br />
organizations may need ECM to fully understand how<br />
their varied risks interplay with one another. For these<br />
firms factor-based models may not adequately quantify<br />
their unique risk profile and how best to allocate capital<br />
for general operations. For smaller companies, with a<br />
limited product and geographic footprint, an elaborate<br />
and fully stochastic ECM tool used beyond reinsurance<br />
management decisions may be no more informative<br />
than a factor-based approach employed by rating<br />
agencies. However, there is a growing appreciation in<br />
the industry that overreliance on any risk model<br />
(including catastrophe models) can be dangerous no<br />
matter the size and scope of the company.<br />
Each period provides new data points to consider that<br />
may enrich the modeling analytics and the outputs it<br />
provides. But companies with robust ERM understand<br />
the limitations of models, and never overlook the<br />
importance of insight and judgment that an<br />
experienced management team brings to the risk<br />
management process.<br />
Operational<br />
Management<br />
Multinational carrier with<br />
extensive product offerings<br />
Strategy<br />
Automation<br />
15
<strong>Evolving</strong> <strong>Criteria</strong><br />
Regulatory Update<br />
In the aftermath of the 2008-2009 financial markets<br />
crisis, regulatory regimes globally began reassessing<br />
their approaches to regulation of the insurance<br />
industry. Even though the banking industry stole the<br />
headlines, the insurance industry was grouped in with<br />
overall financial services companies in terms of needing<br />
additional regulatory oversight.<br />
Since then, most developed countries have published<br />
numerous proposed enhancements to their regulation<br />
of the insurance industry or the broader financial<br />
services industry. The key themes include more robust<br />
capital requirements, trend towards internal capital<br />
modeling, trend towards de-risking of the balance<br />
sheet and fair value approaches, and additional<br />
governmental oversight. The primary difficulty for<br />
many insurers is that little guidance has been finalized,<br />
and therefore, companies are struggling to assess the<br />
ultimate impact of proposed regulatory changes.<br />
Globally the proposed enhancements are voluminous,<br />
so we will focus on the U.S. and Europe (Solvency II),<br />
and highlight important changes in other key regions.<br />
U.S.<br />
In July 2010, the Dodd-Frank Wall Street Reform and<br />
Consumer Protection Act (the Dodd-Frank Act) was<br />
passed by the U.S. Congress. There are certain<br />
provisions of the Dodd-Frank Act applicable to credit<br />
rating agencies that are effective immediately and are<br />
impacting current as well as evolving ratings criteria.<br />
Only time will tell the full impact of this legislation on<br />
rating agencies and therefore the industry.<br />
The Dodd-Frank Act repeals Rule 436(g) under the<br />
Securities Act of 1933, which relates to U.S. public<br />
offerings registered under the Securities Act. This rule<br />
initially provided that credit ratings assigned by a<br />
Nationally Registered Statistical Rating Organization<br />
(NRSRO) are not considered a part of registration<br />
statement prepared or certified by an “expert”.<br />
Historically, credit rating agencies had never been<br />
treated as experts under the Securities Act. However,<br />
going forward, issuers will need consent from credit<br />
rating agencies to use their ratings in any Securities Act<br />
registration statement and any related prospectuses. If<br />
a rating agency were to provide consent, they would<br />
be potentially exposed to “expert” liability under<br />
section 11 of the Securities Act, and the major credit<br />
16<br />
rating agencies have all indicated that as such, they will<br />
not allow their ratings to be used in prospectuses and<br />
registration statements.<br />
In addition, the Dodd-Frank Act removed the<br />
exemption for credit rating agencies from the SEC’s<br />
Fair Disclosure Rule (Regulation FD) within 90 days of<br />
the enactment of the Act. The exemption for credit<br />
rating agencies from Regulation FD permits issuers to<br />
provide the credit rating agencies with material<br />
non-public information without requiring public<br />
disclosure of such information. The rating agencies are<br />
waiting to see if a confidentiality agreement or other<br />
measure is available to continue to allow companies to<br />
disclose non-public information to the rating agencies<br />
as part of the analysis.<br />
These changes could impact how rating agencies are<br />
currently and prospectively evaluating the insurance<br />
industry. As mentioned earlier, S&P will review<br />
companies’ internal ECMs that meet certain stated<br />
criteria as part of the ERM analysis. S&P requires that a<br />
company must provide substantial detail behind their<br />
capital model in order for S&P to review it. If the<br />
Regulation FD repeal is upheld, companies who provide<br />
information on their ECMs to S&P would potentially be<br />
required to disclose this information to the public.<br />
Needless to say, most companies would not want such<br />
level of detail on their internal capital models in the<br />
public domain.<br />
Further, as part of the annual ratings review process,<br />
the rating agencies obtain a significant amount of<br />
information necessary to analyze the company that is<br />
not in the public domain such as catastrophe probable<br />
maximum losses (PMLs) and prospective pro-forma<br />
financial statements. If the rating agencies would be<br />
required to disclose such information, it seems likely<br />
that most companies would not share this with the<br />
rating agencies, meaning rating agencies would need<br />
to make many more assumptions going forward.<br />
Given these legislative developments, there is an added<br />
element of uncertainty in regards to how current and<br />
proposed criteria, as well as the overall rating process,<br />
will be impacted by the Dodd-Frank Act.
On the insurance regulatory front, the NAIC recently<br />
introduced the Solvency Modernization Initiative<br />
(SMI), which proposes a critical self-examination of<br />
the U.S. solvency regulation framework. This will be<br />
the first overall review of the risk-based capital (RBC)<br />
system since the 1990s, though annually the NAIC<br />
does update underlying capital factors for recent<br />
trends. The five key areas being reviewed are: capital<br />
requirements, international accounting, group<br />
supervision issues, valuation issues, and reinsurance.<br />
The key considerations at this point include:<br />
> Articulating U.S. solvency framework in one document<br />
> Improving tools related to economic capital, ERM<br />
and internal models in the RBC requirements<br />
> Evaluating RBC to incorporate additional risk and<br />
issues related to recalibration<br />
> Corporate governance and risk management focus<br />
As part of the SMI, the International Solvency Working<br />
Group is examining Solvency II to determine whether<br />
the U.S. could adopt a similar ECM. The working group<br />
is currently considering the following:<br />
> Using statistical measures to define the U.S. RBC<br />
system<br />
> Incorporating missing risks in the U.S. RBC system<br />
such as catastrophe, liquidity, operational, Foreign<br />
Exchange, and other<br />
> Having internal models be subject to quality tests<br />
and be preapproved by regulators<br />
> Grouping capital questions including how to<br />
address non-regulated or non-insurance affiliates,<br />
diversification credits, etc.<br />
<strong>Aon</strong> <strong>Benfield</strong><br />
Further, the NAIC has been considering the inclusion of<br />
a specific catastrophe risk charge in the RBC system<br />
over the past few years, and it recently reemerged on<br />
the agenda. There is current discussion regarding<br />
additional disclosure for 1 in 250, 500, 1000 year<br />
events as well as additional disclosure on modeling<br />
options and assumptions (demand surge, fire following<br />
earthquake, etc.). The proposal also discusses an<br />
increased focus on completeness and accuracy of<br />
exposure data input into the cat modeling process. As<br />
for the specific catastrophe charge, the NAIC is<br />
considering separate charges for hurricane and<br />
earthquake perils based upon a company’s 100-year<br />
modeled net PML though with a covariance benefit.<br />
The proposal does not include a tax benefit; however,<br />
the NAIC is considering premium offsets to reduce<br />
premium capital charges. Interestingly, the RBC is the<br />
only regulatory solvency model in a significant<br />
insurance market, apart from China, that does not<br />
include a specific catastrophe risk charge. However,<br />
approximately 95 percent of the U.S. market is rated by<br />
A.M. Best, who does include a specific catastrophe<br />
charge in their BCAR model.<br />
The SMI has established a road map, and expects all<br />
major policy decisions to be completed by the end of<br />
2012; at which time the NAIC, through various<br />
committees, can then choose to proceed as<br />
appropriate.<br />
Solvency II<br />
As Solvency II nears its anticipated implementation in<br />
2013, much of the final guidance remains undecided.<br />
The fifth quantitative impact study (QIS 5) takes place<br />
between August and November 2010 to analyze the<br />
Committee of European Insurance and Occupational<br />
Pensions Supervisors’ (CEIOPS) April 2010 proposal.<br />
The current QIS 5 specifications are less onerous than<br />
the proposals made by CEIOPS, and were welcomed by<br />
the industry, which feared that the initial proposals<br />
would lead to a dramatic increase in required capital.<br />
However, since its release in mid-April 2010, sharp<br />
comments were raised by CEIOPS (threatening the use<br />
of capital add-ons), rating agencies and investment<br />
bankers that the current proposal was too soft, so it<br />
remains to be seen what the final quantitative<br />
requirements are for Solvency II.<br />
17
<strong>Evolving</strong> <strong>Criteria</strong><br />
Solvency II is similar to the Basel II banking regulation<br />
by way of its three-pillar approach — Pillar 1 being the<br />
quantitative calculation of required and available<br />
capital; Pillar 2 the qualitative justification to the<br />
regulator (own risk and solvency assessment); and Pillar<br />
3 the disclosure requirements to all stakeholders.<br />
Guidance for Pillars 2 and 3 has not yet been published,<br />
so the industry does not have firm direction on those<br />
requirements.<br />
Natural and man-made catastrophe risk is calculated in<br />
the Standard Formula via a complex spreadsheet based<br />
on CRESTA zone exposures for natural catastrophes or<br />
via scenarios for man-made catastrophes. Output from<br />
commercial catastrophe models will only be accepted<br />
through a partial internal model. Insurers will be able to<br />
apply their own existing catastrophe reinsurance<br />
program and will have to show the regulator how they<br />
apply this to arrive at net exposures. Both proportional<br />
and non-proportional reinsurance for insurance<br />
companies are adequately reflected in the Standard<br />
Formula for catastrophe risk. Companies with material<br />
cat exposures outside the EU will be forced into a<br />
partial internal model.<br />
Elsewhere in the Standard Formula, reinsurance is<br />
inconsistently reflected in the standard model. In QIS 4,<br />
only a proportional reduction in premium and reserve<br />
risk was allowed. However, in QIS 5 proportional and<br />
non-proportional reinsurance can be introduced, but<br />
the methodology for non-proportional reinsurance has<br />
a limited impact. This could lead companies to retain<br />
more risk as the benefit of some forms of reinsurance is<br />
not fully credited in terms of capital relief in the<br />
Standard Formula. However, companies who use<br />
internal models will be able to reflect the true value of<br />
reinsurance in their capital models.<br />
Solvency II is likely to result in a significant increase in<br />
regulatory capital for many companies. Some of this<br />
increase will be offset by an increasing amount of<br />
available capital as a result of Fair Value estimates of<br />
liabilities, including discounting. Overall, <strong>Aon</strong> <strong>Benfield</strong><br />
estimates that the average solvency ratio for the<br />
non-life industry will reduce from about 250 percent<br />
(Solvency I) to about 140 percent. Many companies are<br />
planning to use internal capital models, which will likely<br />
be much more representative than the Standard<br />
Formula, and will also likely lead in most cases to<br />
significantly lower capital requirements.<br />
18<br />
Further, in the recent QIS 5 proposal, the balance sheet<br />
of an insurer is valued from a Fair Value perspective. On<br />
a very summary level, this includes the following:<br />
> All liabilities, life and non-life, will be valued on a<br />
pure prospective basis, i.e., present value of future<br />
cash-flows relating to the existing contracts and a<br />
risk margin<br />
> The discount rate is based upon the swap rate plus a<br />
liquidity premium, depending on the nature of the<br />
liabilities<br />
> Non-life pre-claims liabilities (unearned premiums)<br />
will be valued based upon the expected cash flows<br />
(premiums, claims and expenses) for the contracts<br />
that have already been written or for which there is a<br />
contractual obligation<br />
> The risk margin is added to the best estimate basis to<br />
make the liabilities transferable<br />
A Fair Value approach has consequences on the<br />
recognition of profits (the difference between the Fair<br />
Value of the assets and the liabilities):<br />
> Any positive difference at inception between the<br />
present value of future premiums, future cash-outgo<br />
and risk margin will be recognized as profit<br />
> This is also applicable to non-life insurance and<br />
the valuation of the pre-claims liabilities results<br />
in a profit recognition at the time of writing the<br />
contract (disregarding the start of the exposure<br />
period of the contract)<br />
Interestingly, the International Accounting Standards<br />
Board (IASB) released an Exposure Draft (ED) on<br />
insurance contracts on July 30, 2010, and the<br />
proposed Fair Value accounting measures differ from<br />
those in Solvency II, however, with similar<br />
implementation timeframes. In a Solvency II’s<br />
economic value balance sheet, the liabilities can be<br />
detailed in three building blocks:<br />
> The unbiased, probability-weighted average of<br />
future cash-flows (“best estimate”)<br />
> An incorporation of the time value of money<br />
(“discounting”)<br />
> A risk margin
Since this leads to immediate profit recognition, the<br />
IASB and U.S. Financial Accounting Standards Board<br />
(FASB) have introduced a fourth building block that<br />
avoids the possibility that any profit would be<br />
recognized up-front, the so-called “residual” margin.<br />
In regard to the risk margin, Solvency II provides<br />
detailed guidance on risks and methods to be used.<br />
Solvency II requires, for example, that the cost of<br />
capital method (six percent) will be used for the<br />
determination of the risk margin. In the ED, the IASB<br />
limits the permitted methods to three techniques<br />
without giving much guidance: the confidence interval<br />
(VaR), the conditional tail expectation (TVaR) and the<br />
cost of capital (economic capital). To complicate<br />
matters more, the FASB decided that the measurement<br />
of an insurance contract should not include a separate<br />
risk margin, but the residual and risk margin will be<br />
combined in a composite margin.<br />
The granularity for calculating the risk margin is also<br />
different. For Solvency II, the risk margin should take into<br />
account diversification between lines of business. The<br />
IASB proposes the risk adjustment is determined for a<br />
portfolio of contracts that are subject to broadly similar<br />
risks and managed together as a single pool.<br />
Diversification benefit between portfolios is not allowed.<br />
Further, for short duration contracts (most non-life<br />
contracts with a contract term of one year or less), instead<br />
of the four building blocks method, the IASB decided to<br />
require an “unearned premium” (after deduction of<br />
incremental acquisition costs) approach for the valuation<br />
of the pre-claims liability. Solvency II does not require a<br />
different treatment for short and long duration contracts<br />
and pre-claims liabilities have to be calculated based upon<br />
the three building block approach.<br />
Given this, there is a possibility that reserves will be<br />
calculated differently under Solvency II and IFRS (with<br />
the FASB still in disagreement with the IASB over<br />
certain elements), which further complicates planning<br />
for insurers and adds another element of uncertainty.<br />
Other Regimes<br />
<strong>Aon</strong> <strong>Benfield</strong><br />
Bermuda<br />
A key objective of the Bermuda Monetary Authority<br />
(BMA) is to develop an insurance framework that meets<br />
or exceeds international standards. The stated aim of<br />
the past two years is achieving Regulatory Equivalence<br />
with the U.S. and U.K./Europe, and equivalency with<br />
the Solvency II directive is core to this. The BMA,<br />
however, plans to adapt Solvency II to the Bermuda<br />
market rather than duplicate it. The key steps that<br />
should assist with this include:<br />
> The BMA’s proposals for enhanced disclosures were<br />
defined in a consultation paper on disclosures and<br />
transparency in June 2009<br />
> Class 4 companies now prepare GAAP statements<br />
that the BMA is publishing<br />
> Class 3B companies will have similar requirements<br />
in 2010<br />
> An internal capital model framework for Class 4<br />
companies was established in July 2009 and the<br />
BMA continues to develop this<br />
> A pilot implementation of the application and<br />
review process with selected Class 4 companies was<br />
announced in June 2010<br />
> Pilot companies allowed to use their own internal<br />
capital models, once reviewed and approved by the<br />
BMA, to determine regulatory capital requirements<br />
Canada<br />
The Office of the Superintendent of Financial<br />
Institutions (OSFI) is currently considering allowing<br />
companies to use internal economic capital models in<br />
lieu of the Minimum Capital Test (MCT), and the target<br />
date is 2012 with the following restraints: internal<br />
capital models must not be used to generate a lower<br />
capital benefit over MCT; must at parallel run with<br />
MCT for three years; requires regulatory approval on a<br />
case-by-case basis. Also, OSFI is removing many of the<br />
rules-based guidelines by moving towards a more<br />
risk-based approach where corporate governance<br />
needs to be formalized for companies. Without specific<br />
19
<strong>Evolving</strong> <strong>Criteria</strong><br />
rules, the assessment of the company’s risk profile<br />
becomes less clear and must rely on OSFI’s relationmanager’s<br />
ability to assess according to the risk-based<br />
guidelines provided. The objective is to eventually<br />
move to an international standard regime where there<br />
will be cooperative and mutual recognition of other<br />
jurisdiction regulatory systems. OSFI has indicated that<br />
the current factor-based solvency models work<br />
effectively and has no plans to move to Solvency II.<br />
Finally, Canada will implement IFRS for year<br />
commencing in 2011, though the move to IFRS will be<br />
challenging for companies as many of the accounting<br />
issues with the IFRS have not been finalized.<br />
Japan<br />
No structural change was made to the solvency margin<br />
criteria; however, the Financial Services Agency (FSA) is<br />
asking insurers to calculate their solvency margin ratio<br />
based on the current market value of their assets and<br />
liabilities. The objective of this market value-based<br />
measurement of the solvency margin ratio is to better<br />
reflect the financial position of insurance companies.<br />
This move was triggered by the global financial crisis, in<br />
particular, the collapse of Yamato Life Insurance Co. The<br />
new standard includes a requirement that insurers<br />
double their estimates for potential losses on securitized<br />
financial products. The new rule also limits the<br />
inclusion of reserves in calculating capital. The<br />
estimated impact on insurers (estimated by FSA) is that<br />
solvency ratios of major general insurers will decrease<br />
by about 30 percent. Insurers should start to “field<br />
test” the new calculation method FSA aims to<br />
implement in the new standard with the 2012 fiscal<br />
year reporting.<br />
20<br />
Lloyd’s<br />
Implementation of the Solvency II framework remains<br />
one of Lloyd’s biggest challenges. Lloyd’s has secured<br />
FSA’s agreement, in principle, that current basis of<br />
supervision will be maintained as far as possible<br />
under Solvency II, which is necessary to maintain<br />
Lloyd’s rating. Solvency II is intended to be<br />
implemented, where possible, in a way that protects<br />
or enhances Lloyd’s capital structure and efficiency.<br />
Lloyd’s is currently working closely with FSA to gain<br />
approval for their internal capital model. Lloyd’s<br />
plans to enhance risk management in response to<br />
Solvency II, and as part of the ongoing development<br />
of Lloyd’s risk management capability; they<br />
developed detailed implementation plans in late<br />
2009. Lloyd’s will focus on key areas such as risk<br />
governance, risk framework, risk appetite, and risk<br />
culture. At the S&P Insurance Market Seminar on<br />
June 29, 2010, Tom Bolt, Lloyd’s Franchise Director,<br />
stated that Lloyd’s carriers’ 2010 bill for Solvency II<br />
implementation was GBP51 million and suggested<br />
that the introduction of the direction may put<br />
pressure on some participants to consider<br />
consolidation.<br />
Latin America<br />
Mexican Insurance Commission (CNSF) has announced<br />
its intention to implement Solvency II type regulation<br />
in 2012. The regulation will be based on European<br />
Solvency II model, but with certain features modified<br />
for the Mexican insurance industry. Under the new<br />
regulation, capitalization will be based on portfolio risk,<br />
while valuation of assets and liabilities will be based on<br />
economic principles. Insurers would most likely be<br />
required to adopt IFRS accounting standard in valuation<br />
of assets and liabilities. Present supervision in Mexico is<br />
insensitive to market risk, which is believed to have<br />
contributed to the financial woes some insurance firms<br />
went through in the past.
Similarly, Chile is exploring changing to a Solvency II<br />
type regime. While Chile’s current regulatory capital<br />
model is factor-based and calculated using net written<br />
premiums and net reserves excluding a specific PML<br />
charge, the rule is to reserve the equivalent to 10<br />
percent of retained Total Insured Value (TIV) in critical<br />
Zone Aggregates for buildings and contents and 15<br />
percent of retained TIV in Critical Zone for Engineering.<br />
If the limit is ceded through a catastrophe excess of loss<br />
reinsurance agreement, the reserve must be 110<br />
percent of the retention of the program. As such, much<br />
of the Chilean earthquake exposure was ceded to the<br />
global reinsurance market, limiting the local impact of<br />
the losses from the 2010 earthquake.<br />
Several emerging markets in Latin America and the<br />
Caribbean are also tightly managing catastrophe<br />
charges. In Jamaica, companies’ windstorm and<br />
earthquake retentions are subject to a maximum of five<br />
percent of capital and surplus at the 1 in 500 year return<br />
period. In Trinidad and Tobago, companies must set a<br />
catastrophe reserve fund for all property insurers. A<br />
minimum of 10 percent of after-tax profits for the class<br />
shall be set aside each year until the fund is equivalent to<br />
100 percent of the company’s property net written<br />
premiums, and it can only be drawn upon after a<br />
catastrophe that causes an ultimate net loss to the<br />
company of 10 percent of its capital and free reserves.<br />
Mexican insurance companies can only obtain 50<br />
percent credit for excess of loss catastrophe<br />
reinsurance, but 100 percent credit for pro-rata<br />
(provided the event limits are at least the 1:1,500 PML).<br />
Colombian companies must buy up to 15 percent of<br />
key zone retained TIV, and pro-ratas cannot have event<br />
limits (to receive pro-rata treatment of the premium<br />
cession). Colombian companies must reserve 40<br />
percent of retained premium income, so pro-rata<br />
treatment of premium ceded under pro-rata treaties is<br />
important. Peru gets full credit for limit purchased on<br />
an excess of loss basis in reducing 1:1,000 year PML.<br />
Mexico was the first country in Latin America to<br />
move to a modeled loss approach and has been<br />
followed by Peru, and there are ongoing discussions<br />
in Colombia regarding a potential change to a<br />
modeled loss approach.<br />
<strong>Aon</strong> <strong>Benfield</strong><br />
These more stringent capital requirements, and<br />
allowances for reinsurance purchases, should help<br />
companies manage capital, and the rebound of the<br />
local economy, subsequent to a significant catastrophic<br />
event. Conversely, outside Latin America, most of the<br />
emerging markets do not yet have formal regulatory<br />
capital requirements, and those that do, have not<br />
incorporated a specific catastrophe charge. As noted<br />
above and depicted below, the majority of developed<br />
markets (and global rating agencies) require companies<br />
to hold a stated amount of capital for catastrophe risk,<br />
though the specific requirements vary. In many cases,<br />
the emerging markets are equally as susceptible to<br />
catastrophic events and have struggling economies,<br />
though overall less take-up rates of insurance as<br />
witnessed in Haiti. These economies have not yet been<br />
tested in terms of how conservative their insurance<br />
industry manages its catastrophe risk.<br />
Exhibit 15: Catastrophe <strong>Criteria</strong><br />
Capital Model One Year Development Basis<br />
Australia 1:250 Single Peril Occurrence<br />
Bermuda 1:100 TVaR All Perils Aggregate<br />
Canada 1:370 Earthquake Occurrence<br />
China None n/a<br />
Japan Greater of:<br />
1:250 Earthquake<br />
1:70 Wind<br />
Lloyd’s<br />
RDS and 1 in 200 year all risk<br />
estimate within the ICA<br />
Occurrence<br />
Aggregate<br />
Solvency I None n/a<br />
Solvency II 1:200 All Perils Aggregate<br />
U.K.<br />
None for ECR; however ICA includes<br />
a 1 in 200 year all risk estimate<br />
n/a<br />
U.S. None n/a<br />
A.M. Best BCAR Greater of:<br />
1:100 Wind<br />
1:250 Earthquake<br />
Occurrence<br />
S&P Enhanced 1:250 All Perils Aggregate<br />
21
<strong>Evolving</strong> <strong>Criteria</strong><br />
Conclusion<br />
The global insurance industry is in a precarious<br />
position. While continued downwards pricing pressure<br />
is negatively impacting many companies’ profitability,<br />
rating agencies and regulators alike refine criteria and<br />
capital requirements, which could place additional<br />
pressure on an already struggling industry. While many<br />
of the proposed changes aim to improve the overall<br />
analysis of the industry, companies will have to dedicate<br />
significant resources to the understanding and<br />
development of ERM, internal capital models and<br />
accounting frameworks. Further impacting this is the<br />
overall uncertainty surrounding many of the proposed<br />
changes, making some companies question whether or<br />
not such an investment is worth it.<br />
The Dodd-Frank Act also has the potential impact to<br />
change the way in which the rating agencies currently<br />
analyze insurance companies. It remains to be seen<br />
what their role will be going forward, and how they<br />
can continue to undertake the current analysis given<br />
the potential that companies will no longer disclose<br />
non-public data, as well as the rating agencies’<br />
unwillingness to expose themselves to expert liability.<br />
Other rating agencies could emerge that would be<br />
willing to take on such a liability and insure themselves<br />
appropriately.<br />
22<br />
The trend towards Solvency II and similar frameworks<br />
globally, coupled with the proposed fair valuing<br />
accounting provisions, also has the potential to<br />
drastically change how analysts and investors view and<br />
understand the industry. The additional volatility being<br />
introduced by fair value accounting could damper<br />
valuations further, as current price to book ratios<br />
already remain well below historic levels. <strong>Reinsurance</strong><br />
will continue to play an important role in managing this<br />
volatility as companies will look for ways to limit this<br />
quarter over quarter. QIS 5 in Solvency II provided<br />
more capital credit for reinsurance than in the previous<br />
QIS studies, though companies will see the most<br />
meaningful benefit from reinsurance in their internal<br />
capital models.
For more information on the <strong>Evolving</strong> <strong>Criteria</strong> report or our analytic<br />
capabilities, please contact your local <strong>Aon</strong> <strong>Benfield</strong> broker or:<br />
Kelly Superczynski, CPA<br />
Head of Global Rating Agency Advisory,<br />
<strong>Aon</strong> <strong>Benfield</strong> Analytics<br />
+1 312 381 5351<br />
kelly.superczynski@aonbenfield.com<br />
Patrick Matthews, CFA<br />
Head of U.S. Rating Agency Advisory,<br />
<strong>Aon</strong> <strong>Benfield</strong> Analytics<br />
+1 215 751 1591<br />
patrick.matthews@aonbenfield.com<br />
Christopher Myers, CFA, FRM<br />
Head of U.K. and EMEA Rating Agency Advisory<br />
and Head of Global ERM, <strong>Aon</strong> <strong>Benfield</strong> Analytics<br />
+1 973 966 3558<br />
+44 (0)20 7088 0044<br />
christopher.myers@aonbenfield.com<br />
About <strong>Aon</strong> <strong>Benfield</strong><br />
Sources: A.M. Best, S&P, Fitch, Moody’s, AXCO, SNL Financial, and <strong>Aon</strong> <strong>Benfield</strong> Analyics.<br />
<strong>Aon</strong> <strong>Benfield</strong><br />
As the industry leader in treaty, facultative and capital markets, <strong>Aon</strong> <strong>Benfield</strong> is redefining the role of the reinsurance intermediary<br />
and capital advisor. Through our unmatched talent and industry-leading proprietary tools and products, we help our clients to<br />
redefine themselves and their success. <strong>Aon</strong> <strong>Benfield</strong> offers unbiased capital advice and customized access to more reinsurance and<br />
capital markets than anyone else. As a trusted advocate, we provide local reach to the world’s markets, an unparalleled investment<br />
in innovative analytics, including catastrophe management, actuarial, and rating agency advisory, and the right professionals<br />
to advise clients in making the optimal capital choice for their business. With an international network of more than 4,000<br />
professionals in 50 countries, our worldwide client base is able to access the broadest portfolio of integrated capital solutions and<br />
services. Learn more at aonbenfield.com.<br />
23
200 E. Randolph Street, Chicago, Illinois 60601<br />
t: +1 312 381 5300 | f: +1 312 381 0160 | aonbenfield.com<br />
Copyright <strong>Aon</strong> <strong>Benfield</strong> Inc. 2010 | #4562 - 08/2010