A Comparison Of Intensity-Modulated Radiotherapy And Dynamic ...
A Comparison Of Intensity-Modulated Radiotherapy And Dynamic ...
A Comparison Of Intensity-Modulated Radiotherapy And Dynamic ...

You also want an ePaper? Increase the reach of your titles
YUMPU automatically turns print PDFs into web optimized ePapers that Google loves.
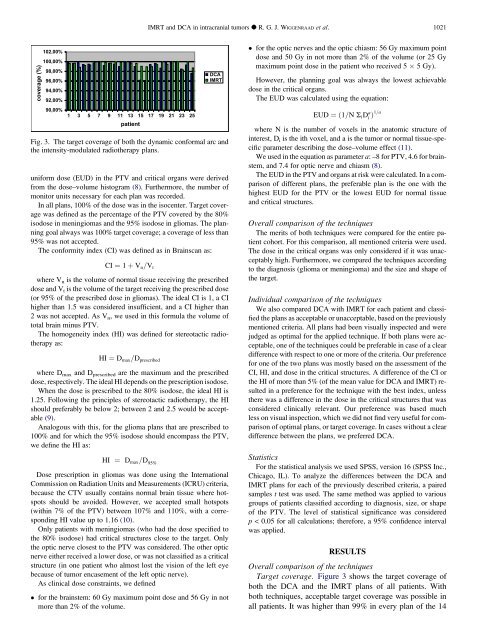
coverage (%)<br />
102,00%<br />
100,00%<br />
98,00%<br />
96,00%<br />
94,00%<br />
92,00%<br />
90,00%<br />
1 3 5 7 9 11 13 15 17 19 21 23 25<br />
patient<br />
uniform dose (EUD) in the PTV and critical organs were derived<br />
from the dose–volume histogram (8). Furthermore, the number of<br />
monitor units necessary for each plan was recorded.<br />
In all plans, 100% of the dose was in the isocenter. Target coverage<br />
was defined as the percentage of the PTV covered by the 80%<br />
isodose in meningiomas and the 95% isodose in gliomas. The planning<br />
goal always was 100% target coverage; a coverage of less than<br />
95% was not accepted.<br />
The conformity index (CI) was defined as in Brainscan as:<br />
CI ¼ 1 þ Vn=Vt<br />
where V n is the volume of normal tissue receiving the prescribed<br />
dose and Vt is the volume of the target receiving the prescribed dose<br />
(or 95% of the prescribed dose in gliomas). The ideal CI is 1, a CI<br />
higher than 1.5 was considered insufficient, and a CI higher than<br />
2 was not accepted. As Vn, we used in this formula the volume of<br />
total brain minus PTV.<br />
The homogeneity index (HI) was defined for stereotactic radiotherapy<br />
as:<br />
HI ¼ Dmax=Dprescribed<br />
where Dmax and Dprescribed are the maximum and the prescribed<br />
dose, respectively. The ideal HI depends on the prescription isodose.<br />
When the dose is prescribed to the 80% isodose, the ideal HI is<br />
1.25. Following the principles of stereotactic radiotherapy, the HI<br />
should preferably be below 2; between 2 and 2.5 would be acceptable<br />
(9).<br />
Analogous with this, for the glioma plans that are prescribed to<br />
100% and for which the 95% isodose should encompass the PTV,<br />
we define the HI as:<br />
HI ¼ Dmax=D 95%<br />
DCA<br />
IMRT<br />
Fig. 3. The target coverage of both the dynamic conformal arc and<br />
the intensity-modulated radiotherapy plans.<br />
Dose prescription in gliomas was done using the International<br />
Commission on Radiation Units and Measurements (ICRU) criteria,<br />
because the CTV usually contains normal brain tissue where hotspots<br />
should be avoided. However, we accepted small hotspots<br />
(within 7% of the PTV) between 107% and 110%, with a corresponding<br />
HI value up to 1.16 (10).<br />
Only patients with meningiomas (who had the dose specified to<br />
the 80% isodose) had critical structures close to the target. Only<br />
the optic nerve closest to the PTV was considered. The other optic<br />
nerve either received a lower dose, or was not classified as a critical<br />
structure (in one patient who almost lost the vision of the left eye<br />
because of tumor encasement of the left optic nerve).<br />
As clinical dose constraints, we defined<br />
for the brainstem: 60 Gy maximum point dose and 56 Gy in not<br />
more than 2% of the volume.<br />
IMRT and DCA in intracranial tumors d R. G. J. WIGGENRAAD et al. 1021<br />
for the optic nerves and the optic chiasm: 56 Gy maximum point<br />
dose and 50 Gy in not more than 2% of the volume (or 25 Gy<br />
maximum point dose in the patient who received 5 5 Gy).<br />
However, the planning goal was always the lowest achievable<br />
dose in the critical organs.<br />
The EUD was calculated using the equation:<br />
EUD ¼ð1=N SiD a<br />
i Þ1=a<br />
where N is the number of voxels in the anatomic structure of<br />
interest, D i is the ith voxel, and a is the tumor or normal tissue-specific<br />
parameter describing the dose–volume effect (11).<br />
We used in the equation as parameter a: –8 for PTV, 4.6 for brainstem,<br />
and 7.4 for optic nerve and chiasm (8).<br />
The EUD in the PTV and organs at risk were calculated. In a comparison<br />
of different plans, the preferable plan is the one with the<br />
highest EUD for the PTV or the lowest EUD for normal tissue<br />
and critical structures.<br />
Overall comparison of the techniques<br />
The merits of both techniques were compared for the entire patient<br />
cohort. For this comparison, all mentioned criteria were used.<br />
The dose in the critical organs was only considered if it was unacceptably<br />
high. Furthermore, we compared the techniques according<br />
to the diagnosis (glioma or meningioma) and the size and shape of<br />
the target.<br />
Individual comparison of the techniques<br />
We also compared DCA with IMRT for each patient and classified<br />
the plans as acceptable or unacceptable, based on the previously<br />
mentioned criteria. All plans had been visually inspected and were<br />
judged as optimal for the applied technique. If both plans were acceptable,<br />
one of the techniques could be preferable in case of a clear<br />
difference with respect to one or more of the criteria. Our preference<br />
for one of the two plans was mostly based on the assessment of the<br />
CI, HI, and dose in the critical structures. A difference of the CI or<br />
the HI of more than 5% (of the mean value for DCA and IMRT) resulted<br />
in a preference for the technique with the best index, unless<br />
there was a difference in the dose in the critical structures that was<br />
considered clinically relevant. Our preference was based much<br />
less on visual inspection, which we did not find very useful for comparison<br />
of optimal plans, or target coverage. In cases without a clear<br />
difference between the plans, we preferred DCA.<br />
Statistics<br />
For the statistical analysis we used SPSS, version 16 (SPSS Inc.,<br />
Chicago, IL). To analyze the differences between the DCA and<br />
IMRT plans for each of the previously described criteria, a paired<br />
samples t test was used. The same method was applied to various<br />
groups of patients classified according to diagnosis, size, or shape<br />
of the PTV. The level of statistical significance was considered<br />
p < 0.05 for all calculations; therefore, a 95% confidence interval<br />
was applied.<br />
RESULTS<br />
Overall comparison of the techniques<br />
Target coverage. Figure 3 shows the target coverage of<br />
both the DCA and the IMRT plans of all patients. With<br />
both techniques, acceptable target coverage was possible in<br />
all patients. It was higher than 99% in every plan of the 14