RTA and Economic Growth. The case of SADC - DAAD partnership ...
RTA and Economic Growth. The case of SADC - DAAD partnership ...
RTA and Economic Growth. The case of SADC - DAAD partnership ...

You also want an ePaper? Increase the reach of your titles
YUMPU automatically turns print PDFs into web optimized ePapers that Google loves.
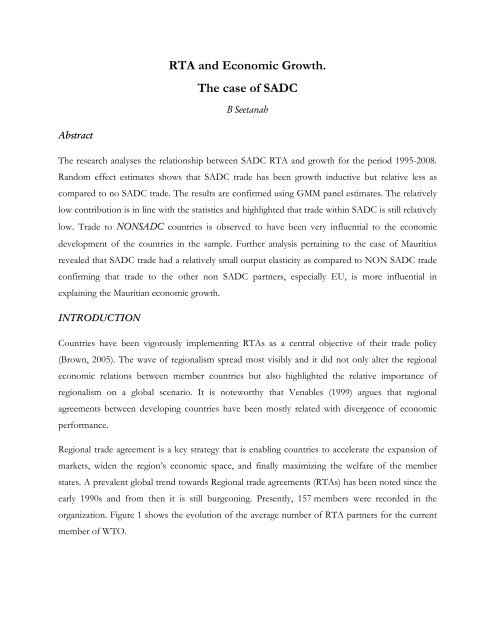
Abstract<br />
<strong>RTA</strong> <strong>and</strong> <strong>Economic</strong> <strong>Growth</strong>.<br />
<strong>The</strong> <strong>case</strong> <strong>of</strong> <strong>SADC</strong><br />
B Seetanah<br />
<strong>The</strong> research analyses the relationship between <strong>SADC</strong> <strong>RTA</strong> <strong>and</strong> growth for the period 1995-2008.<br />
R<strong>and</strong>om effect estimates shows that <strong>SADC</strong> trade has been growth inductive but relative less as<br />
compared to no <strong>SADC</strong> trade. <strong>The</strong> results are confirmed using GMM panel estimates. <strong>The</strong> relatively<br />
low contribution is in line with the statistics <strong>and</strong> highlighted that trade within <strong>SADC</strong> is still relatively<br />
low. Trade to NON<strong>SADC</strong> countries is observed to have been very influential to the economic<br />
development <strong>of</strong> the countries in the sample. Further analysis pertaining to the <strong>case</strong> <strong>of</strong> Mauritius<br />
revealed that <strong>SADC</strong> trade had a relatively small output elasticity as compared to NON <strong>SADC</strong> trade<br />
confirming that trade to the other non <strong>SADC</strong> partners, especially EU, is more influential in<br />
explaining the Mauritian economic growth.<br />
INTRODUCTION<br />
Countries have been vigorously implementing <strong>RTA</strong>s as a central objective <strong>of</strong> their trade policy<br />
(Brown, 2005). <strong>The</strong> wave <strong>of</strong> regionalism spread most visibly <strong>and</strong> it did not only alter the regional<br />
economic relations between member countries but also highlighted the relative importance <strong>of</strong><br />
regionalism on a global scenario. It is noteworthy that Venables (1999) argues that regional<br />
agreements between developing countries have been mostly related with divergence <strong>of</strong> economic<br />
performance.<br />
Regional trade agreement is a key strategy that is enabling countries to accelerate the expansion <strong>of</strong><br />
markets, widen the region’s economic space, <strong>and</strong> finally maximizing the welfare <strong>of</strong> the member<br />
states. A prevalent global trend towards Regional trade agreements (<strong>RTA</strong>s) has been noted since the<br />
early 1990s <strong>and</strong> from then it is still burgeoning. Presently, 157 members were recorded in the<br />
organization. Figure 1 shows the evolution <strong>of</strong> the average number <strong>of</strong> <strong>RTA</strong> partners for the current<br />
member <strong>of</strong> WTO.
Figure 1 - Average Number <strong>of</strong> <strong>RTA</strong> Partners over Time - Source from WTO<br />
<strong>The</strong> different types <strong>of</strong> <strong>RTA</strong>s are shown above in the diagram. FTA st<strong>and</strong>s for Free trade<br />
agreements, FTA & EIA st<strong>and</strong>s for Free trade agreement <strong>and</strong> <strong>Economic</strong> Integration Agreement, CU<br />
st<strong>and</strong>s for custom unions, CU & EIA st<strong>and</strong>s for custom unions <strong>and</strong> <strong>Economic</strong> Integration<br />
Agreement, PSA & EIA st<strong>and</strong>s for property settlement agreement <strong>and</strong> <strong>Economic</strong> Integration<br />
Agreement, EIA st<strong>and</strong>s for <strong>Economic</strong> Integration Agreement <strong>and</strong> PSA only st<strong>and</strong>s for property<br />
settlement agreement.<br />
<strong>The</strong> different agreements in WTO vary in duties towards its member states. One may be for<br />
promoting agricultural trade amongst trade while another one is to make sure balance between<br />
countries consumption <strong>and</strong> productions are met. WTO experienced increase in membership <strong>of</strong><br />
<strong>RTA</strong>s members every year. <strong>The</strong> reason for this increasing trend is the gains from increased openness<br />
to trade are from resources which are productively allocated <strong>and</strong> thereby decrease cost, leading to a<br />
lowering in consumer prices. <strong>The</strong> different <strong>RTA</strong>s in force in WTO are shown above in the diagram.<br />
However, the welfare that can be earned is not guaranteed. <strong>The</strong> benefits are subject to costs <strong>and</strong><br />
externalities which may nullify the gains. Furthermore the trend may lead to damaging long-run<br />
effects on external trade liberalization. <strong>The</strong> most popular issue about <strong>RTA</strong>s is discriminations <strong>and</strong><br />
the potential for trade diversion.<br />
Regional Corporations behaves as a channel through which surplus national production can be<br />
exchanged to the products <strong>of</strong> other countries. <strong>The</strong> consensus is that trade promotes growth <strong>and</strong>
educes poverty. <strong>RTA</strong>s can nevertheless fail <strong>and</strong> that in multiple facets. <strong>The</strong> impact <strong>of</strong> <strong>RTA</strong>s on an<br />
economy is thus not conclusive.<br />
This study aims to answer questions on whether <strong>RTA</strong> is growth conducive. In the first instance the<br />
study is performed on a sample <strong>of</strong> <strong>SADC</strong> member states using both static <strong>and</strong> dynamic panel data<br />
framework. <strong>The</strong> study goes further in focusing the potential growth effect <strong>of</strong> <strong>SADC</strong> on the<br />
Mauritian <strong>case</strong> study. <strong>The</strong> latter is performed by employing a dynamic time series approach, namely<br />
a Vector Autoregression framework which account for dynamism <strong>and</strong> endogeneity. <strong>The</strong> above<br />
analysis requires in the first instance a decomposition <strong>of</strong> trade into <strong>SADC</strong> <strong>and</strong> non <strong>SADC</strong> so as to<br />
have interesting comparative relative insights.<br />
LITERATURE REVIEW<br />
<strong>The</strong>oretical review<br />
Trade encourages the allocation <strong>of</strong> resources based on the perceived comparative advantage <strong>of</strong><br />
participating countries <strong>and</strong> derive significant gains from trading. <strong>The</strong> theory that trade is positively<br />
correlated with economic growth goes back to Adam Smith, who greatly favoured specialization.<br />
With regional agreements, trade certainly bolsters up, but there are no guarantees that the aggregate<br />
benefits are distributed equitably among the trading partners. <strong>The</strong>re are winners <strong>and</strong> losers in trading<br />
relationship. What is to be taken into consideration, thus, is the degree <strong>of</strong> gain from trade. Some<br />
factors that determine the degree <strong>of</strong> gain are; the terms <strong>of</strong> trade, exchange rate <strong>and</strong> market<br />
characteristics <strong>of</strong> the countries. On that, Baldwin (2003) demonstrated that countries with less trade<br />
restrictions achieve more rapidly economic growth. Trade liberalisation reduces relative price<br />
distortions <strong>and</strong> allows those activities with a comparative advantage to exp<strong>and</strong> <strong>and</strong> hence promotes<br />
economic growth.<br />
According to Yeats (1998), negativity in economic terms, comprise <strong>of</strong> trade diversion, reduction <strong>of</strong><br />
quality, increasing consumer prices <strong>and</strong> even lowering the global competitiveness <strong>of</strong> a country.<br />
Moreover, investment, economic growth, government tax revenue <strong>and</strong> employment may also drop.<br />
Extent <strong>of</strong> effects may fall, <strong>and</strong> wealth <strong>and</strong> income distribution <strong>and</strong> living st<strong>and</strong>ards may fall; stated<br />
Woodcock (2001) to social relations. In political domain, stability <strong>and</strong> cooperation may be on<br />
decline, <strong>and</strong> conflicts on the rise (World Bank, 2000). Barbier (2003) specified that sustainable<br />
development may not always complement economic expansion. In terms <strong>of</strong> culture <strong>of</strong> a country,<br />
unique identity <strong>and</strong> unity <strong>of</strong> a country may be lost; this is more acute among smaller countries
ecause <strong>of</strong> the imposition <strong>of</strong> larger countries culture; which may result in st<strong>and</strong>ardization <strong>of</strong> culture<br />
among member states.<br />
Application <strong>of</strong> regional integrations in the world has been a puzzling issue over time. Regional<br />
integration has been encouraged to make good relationship based on regional stability <strong>and</strong><br />
development, hence aiming at optimising revenues at fewer risks. <strong>The</strong> formation <strong>of</strong> <strong>RTA</strong>s is driven<br />
by a number <strong>of</strong> factors, including economic, political <strong>and</strong> security considerations. Membership to<br />
integration is a choice which may be driven by motives like; gaining access to large markets, new<br />
customers, competitive shoots, benefiting from MFN tariffs, enhancing investments, promoting the<br />
environment <strong>and</strong> labour st<strong>and</strong>ards <strong>and</strong> so on. <strong>The</strong>se integrations vary widely in structure, objectives,<br />
sector coverage <strong>and</strong> membership. As mentioned earlier, integration envelops developing countries<br />
amongst other staged countries. To that, Whalley (1996) argued that regionalism could serve as an<br />
elite-socialization process <strong>and</strong> as a lock-in mechanism for domestic political <strong>and</strong> economic reforms<br />
in less developed <strong>RTA</strong> members.<br />
In the past decades, many authors explored integration agreements <strong>and</strong> concluded that global<br />
economic integration is the vital to promoting resource allocation, technology transfer <strong>and</strong><br />
augmenting the st<strong>and</strong>ard <strong>of</strong> living, hence growth. Some studies have added-on that economic<br />
integration led to trade imbalances, increased financial market volatility <strong>and</strong> nurtured less-effective<br />
macroeconomic policies. Definitive conclusions have yet to be drawn. Moreover, Michael Mussa,<br />
the former director <strong>of</strong> research at the International Monetary Fund (IMF) found three fundamental<br />
factors that affect the process <strong>of</strong> economic integration, namely technology, preferences <strong>and</strong> public<br />
policy. Increased technology has assisted economic integration by lowering the cost <strong>of</strong><br />
transportation <strong>and</strong> also reduced the cost <strong>of</strong> communication. Public policies depending on a<br />
country’s objectives may promote or even hinder economic integration. Although the factors<br />
independently influence integration, causality between them is present.<br />
In theory <strong>and</strong> complementing statement <strong>of</strong> Balassa (1965) <strong>and</strong> DeRosa (1992), <strong>RTA</strong>s accomplish<br />
common objectives that encourage economic transformations in trade, customs union, common<br />
market economic union amongst others. Combination <strong>of</strong> regional, sub-regional <strong>and</strong> multilateral<br />
negotiations enabled government to be in a more open environment for cross border economic<br />
transactions. Government seek to enforce regional security <strong>and</strong> peace with member states <strong>and</strong> may<br />
even try to increase power in their negotiations, by first securitizing their governance commitment
ased on political <strong>and</strong> economic reforms. <strong>The</strong>y may even create <strong>and</strong> use political alliances, in the<br />
foreground, to be prejudiced.<br />
Some researchers argue that <strong>RTA</strong>s is an obstacle to multilateralism <strong>and</strong> globalisation. Countries are<br />
favouring <strong>RTA</strong>s over multilateral trade objectives in their trade policy; as their belief is that gain is<br />
higher with <strong>RTA</strong>s. However the effect <strong>of</strong> <strong>RTA</strong>s is not a basic thing which can be applied to<br />
everything. According to the Global <strong>Economic</strong> Prospects (2005), the result <strong>of</strong> an agreement on<br />
trade depends on their design <strong>and</strong> implementation. <strong>The</strong> most important thing in <strong>RTA</strong>s is the extent<br />
the trade barriers are lowered. Brown (2005) complemented the success <strong>of</strong> regional integration,<br />
which lies upon several factors, namely, domestic security, political <strong>and</strong> civic commitment, mutual<br />
trust, macro-economic stability, good financial management <strong>and</strong> expansive national reforms.<br />
<strong>The</strong>refore, prosperous regional integrations shall complement <strong>and</strong> not hinder multilateral<br />
negotiations. <strong>The</strong> aims for <strong>and</strong> welfares <strong>of</strong> forming <strong>RTA</strong>s have greatly been defined in general<br />
context.<br />
Frankel (1997) identified a number <strong>of</strong> traditional gains from trade; enforcing <strong>of</strong> domestic policy,<br />
guarantees <strong>of</strong> market access, increased multilateral power, <strong>and</strong> tactical bonds to multilateral <strong>and</strong><br />
regional relationships. Other benefits defined by Fern<strong>and</strong>ez (1997) are the increase in credibility,<br />
signaling, insurance, <strong>and</strong> coordination amongst countries. Reasons other than benefits are also<br />
prevalent. Firstly, the reaction to forming <strong>RTA</strong>s may be because <strong>of</strong> impatience towards the slow<br />
process <strong>and</strong> progress <strong>of</strong> multilateral approaches like, Doha Round. Secondly, the ‘b<strong>and</strong>wagon effect’<br />
can be one <strong>of</strong> the causes <strong>of</strong> development <strong>of</strong> <strong>RTA</strong>s. This effect was proposed by Bhagwati (1993)<br />
<strong>and</strong> is about small countries joining an agreement to follow policies <strong>of</strong> larger countries to make up<br />
on market. Another reason is that cooperation has increased not be globally left out.<br />
At this instant, address will be on the objectives <strong>of</strong> a regional integration. A few to mention here are<br />
intra REC 1 trade, free movement <strong>of</strong> persons, goods <strong>and</strong> services, macroeconomic policy<br />
convergence, physical integration, sectoral integration <strong>and</strong> cross cutting issues.<br />
1 Regional economic activities
Figure 2.<br />
A diagram (Figure 2.) was set to up to illustrate the objectives that <strong>RTA</strong>s try to achieve, discussed<br />
below <strong>and</strong> which results in cropping up <strong>of</strong> gains from trade in the region.<br />
<strong>The</strong> first one to be considered here is Intra REC trade. Countries generally enter <strong>RTA</strong>s to increase<br />
trade amongst member states. Countries have traded in accordance to a pattern with outside<br />
countries other than countries in their own continent. African countries, for example, prefer to trade<br />
with countries outside its continent rather than among themselves.<br />
Secondly the freedom <strong>of</strong> movement; the freedom <strong>of</strong> commodities, capital <strong>and</strong> people is necessary<br />
for successful integration. However, this process is quite troublesome but countries which adopted it<br />
prospered compared to the others. Freedom <strong>of</strong> people includes people may travel without visa or<br />
easily obtain visa to travel in members countries, rights <strong>of</strong> establishments <strong>and</strong> residence, shared laws<br />
<strong>and</strong> media <strong>and</strong> so forth. Other incentives include harmonizing customs procedures <strong>and</strong> instruments,<br />
adopting common tariffs procedures <strong>and</strong> creating a single administrative document.<br />
Macroeconomic policy convergence is implementing a stable economy on which member states may<br />
rely for trade. This is concerned with stabilising the factors which affect the economy such as;<br />
inflation, interest rates, level <strong>of</strong> employment among others. Thus, the aim is to engage in prudent<br />
macroeconomic policies to enhance economic growth <strong>and</strong> gain from sustainable development which
further results in the promotion <strong>of</strong> trade flows. <strong>The</strong>se factors will vary from economies to<br />
economies because their targets <strong>and</strong> objectives might not be similar.<br />
Physical integration is mainly about infrastructure which greatly impact on exploitation <strong>of</strong> local<br />
resources, transfer <strong>of</strong> information <strong>and</strong> use <strong>of</strong> communication technologies. Operational<br />
infrastructures are thus required to aid trade.<br />
Sectoral integration is also important. For example an agriculture based economy is open to drought,<br />
floods <strong>and</strong> even pests. By engaging in an integration, projects such as ensuring the security <strong>of</strong> the<br />
REC‘s food supply, the country is less vulnerable to problems like famine. Another <strong>case</strong> is where<br />
integration cares for industries. Increase in productivity <strong>and</strong> competitiveness <strong>of</strong> countries in <strong>RTA</strong>s<br />
were noted. Some reasons are movement <strong>of</strong> labour, special protocols applied to member states only<br />
<strong>and</strong> so on.<br />
<strong>The</strong> last one is cross cutting issues. This one is divided into three for clearer underst<strong>and</strong>ing. <strong>The</strong> first<br />
one is private sector. With integration, an economy is forced to gather all together to work as best as<br />
possible. For example, private <strong>and</strong> public sector have to settle arrangements on certain terms, hence<br />
enforcing the political <strong>and</strong> economic stability in a country. <strong>The</strong> second one is peace <strong>and</strong> security. A<br />
country will dress the image <strong>of</strong> itself in front <strong>of</strong> the member states; hence it will create a suitable<br />
environment for trade. This leads to friendly ties in trade <strong>and</strong> stability in the country. <strong>The</strong> last one is<br />
socio-economic issues. That is, in an <strong>RTA</strong>, issues like violence, discriminations amongst others are<br />
cared <strong>of</strong>.<br />
Despite the challenges in the process <strong>of</strong> an <strong>RTA</strong>, significant progress will be noted if a country is a<br />
member in an <strong>RTA</strong>, hence member states must consider regional integration in their strategic<br />
development projects.<br />
<strong>RTA</strong>s can nevertheless fail <strong>and</strong> that in multiple facets. <strong>The</strong> impact <strong>of</strong> <strong>RTA</strong>s on an economy is thus<br />
not conclusive. This study aims to answer questions on whether there is trade amelioration when<br />
before <strong>and</strong> being member in an <strong>RTA</strong>. This paper focuses on <strong>SADC</strong>’s member states’ trade with<br />
Mauritius. For a more concise analysis <strong>of</strong> benefits from trade for a later section in the paper, trade<br />
creation <strong>and</strong> trade diversion are explained below.<br />
Trade Creation <strong>and</strong> Trade Diversion
Viner (1950) theory postulates assessment <strong>of</strong> welfare effect from an <strong>RTA</strong> with the explanation <strong>of</strong><br />
trade creation, trade diversion <strong>and</strong> revenue effect. For the purpose <strong>of</strong> this paper, only trade creation<br />
<strong>and</strong> trade diversion are considered.<br />
Trade creation occurs when the implementation <strong>of</strong> an <strong>RTA</strong> in a country leave supply come from<br />
more efficient producers <strong>of</strong> products. Trade creation outcome, in theory, is said to be the add value<br />
in welfare. In other words, it happens when consumers enjoys imported goods at lower prices as a<br />
result <strong>of</strong> fall in price from the elimination <strong>of</strong> tariffs in the free trade area. <strong>The</strong> fact that prices are<br />
reduced, hence lower cost, more consumers enter the market as they can now afford to buy goods<br />
<strong>of</strong> higher quality. Trade creation therefore occurs as low cost member countries displace high cost<br />
domestic producers. Hence, it can be said that a positive consumption effect that benefits<br />
consumers <strong>of</strong> member countries is present.<br />
Trade diversion on the other h<strong>and</strong>, means that potentially better efficient producers outside the<br />
<strong>RTA</strong> are no more the ones supplying a country; as the country has shifted its supply or provision <strong>of</strong><br />
goods towards a less efficient producer within the <strong>RTA</strong>. Lee (2008) stated that regionalism has the<br />
potential <strong>of</strong> diverting bilateral trade away from countries outside the bloc; hence trade diversion.<br />
This process may lead to the shift <strong>of</strong> production from low cost to high cost producers; welfare loss.<br />
<strong>The</strong> consumer now incurs higher cost for the same goods.<br />
Presence <strong>of</strong> both trade creation <strong>and</strong> trade diversion in a free trade agreement implies that member<br />
countries experience both positive <strong>and</strong> negative impacts. Assessment <strong>of</strong> an <strong>RTA</strong> should be based on<br />
the net effect <strong>of</strong> the two, which will determine whether there is a welfare gain or loss. Implementing<br />
very low external tariffs (open regionalism arrangements) could help to lessen the risk <strong>of</strong> trade<br />
diversion. <strong>RTA</strong>s may cause changes in the world welfare depending on the relative degree <strong>of</strong> trade<br />
creation <strong>and</strong> trade diversion effects.<br />
In addition to that, <strong>RTA</strong> impact on welfare can be categorized into two types; static effects <strong>and</strong><br />
dynamic effects. Both effects usually result in a gain when there is a reduction in costs, increase in<br />
bargaining power, investment incentives in countries due to decrease in tariffs amongst others. Static<br />
effects are ways to gain when the country takes advantage <strong>of</strong> differences in factor endowments,<br />
market power <strong>and</strong> their availability <strong>of</strong> technologies. It is similar to arbitrage theory <strong>and</strong> the countries<br />
may generate gain from economies <strong>of</strong> scale, efforts towards product differentiation <strong>and</strong> constantly<br />
innovating products. <strong>The</strong> dynamic effects usually broken further into two types, namely;
competition effects <strong>and</strong> scale effects, dem<strong>and</strong>s more efforts for gains. Many researchers state that<br />
dynamic effects are the incentive to join in <strong>RTA</strong>s. <strong>The</strong>se effects comprise <strong>of</strong> higher production<br />
efficiency resulting from decrease in average production costs because <strong>of</strong> increased competition. <strong>The</strong><br />
countries are forced to decrease cost via for example economies <strong>of</strong> scale. Other dynamic methods to<br />
gains are increase international investment by increasing investment opportunities, exp<strong>and</strong> market<br />
scale, constantly improving technology in production.<br />
A country open to trade is forced to continuously innovate to remain competitive. Increased<br />
economic integration with the outside world adds to technological innovation through trade <strong>of</strong><br />
technologies from developed countries, like Japan. Krugman (2003) stated that once poor countries<br />
made their way to a better economy with globalisation.<br />
Empirical review<br />
Grossman <strong>and</strong> Helpman (1994) showed that integration with the world economy can boost a<br />
country’s productivity. Productivity <strong>and</strong> economic growth through integration or trade applies to<br />
developing countries as well as industrial countries. <strong>The</strong> two largest poverty stricken populations,<br />
China <strong>and</strong> India, have achieved productivity <strong>and</strong> economic growth during the last two decades with<br />
open trade. Thus, theory matches actual trends <strong>and</strong> results. <strong>The</strong> connection between trade <strong>and</strong><br />
growth is said to be positively correlated, but reducing trade barriers do not always have nice impact.<br />
Scitovski <strong>and</strong> Scott (1970) <strong>and</strong> Balassa (1971) were first to address this negativity. However, studies<br />
like; Dollar (1992), Sachs <strong>and</strong> Warner (1995) <strong>and</strong> Ben-David (1993) persists on positive correlations<br />
between a country’s openness <strong>and</strong> faster economic growth.<br />
Both before <strong>and</strong> after engaging in regional corporations, are liable to praises <strong>and</strong> critics. Different<br />
studies brought different results. Jacob Viner (1950) is the first one who considered analysis on trade<br />
patterns with regional blocs <strong>and</strong> his conclusion was that benefits or gains from <strong>RTA</strong>s are dependent<br />
upon trade creation <strong>and</strong> trade diversion. Furthermore, Johnson (1960) explained that welfare from<br />
trade creation <strong>and</strong> diversion may leave the country better or worse <strong>of</strong>f. Both sides are probable<br />
which he explained from a partial equilibrium diagram illustrating the economic effects, good <strong>and</strong><br />
bad.<br />
<strong>The</strong> most common tests carried on Regional Trade effects on countries is the Gravity model. It was<br />
proposed by Tinbergen (1962) to explain international bilateral trade <strong>and</strong> used it to determine the<br />
factors affecting trade patterns. Aitken (1973) used that same model for analysis on <strong>RTA</strong>s. Most
esearchers who used the model have ended saying that <strong>RTA</strong>s are trade creating. <strong>The</strong> extent <strong>of</strong><br />
welfare gained by member states depend on certain variable used in the equations <strong>and</strong> other factors<br />
which vary from countries to countries, for instance economic structure <strong>of</strong> a country. Hence, it<br />
depends on the data gathered <strong>and</strong> variable opted for in the model (Burfisher et al. (2001)).<br />
Magee (2003) had used simultaneous equations model to show empirically that with high bilateral<br />
trade, countries have their pr<strong>of</strong>itability boosted up <strong>and</strong> hence will encourage creation <strong>of</strong> agreements.<br />
Consideration was also made where increase in trade might be linked to historical <strong>and</strong> political issues<br />
amongst them <strong>and</strong> not only due to creation <strong>of</strong> corporations. Bayoumi <strong>and</strong> Eichengreen (1995)<br />
confirmed the above results.<br />
Not only the data <strong>and</strong> variables that are dealt with, but the sample <strong>of</strong> countries chosen also,<br />
determined the extent <strong>of</strong> accuracy in results. Pomfret (1997) have exposed a variety <strong>of</strong> conclusions<br />
upon trade effects using the gravity model <strong>and</strong> left with no flow, hence inadequacy in the model<br />
approach. Haveman <strong>and</strong> Hummels (1998) accorded that conclusions on the predictions <strong>of</strong> trade <strong>and</strong><br />
the effects <strong>of</strong> trade, with or without regional corporations, vary greatly with sample differences. In<br />
addition, Ghosh <strong>and</strong> Yamarik (2004) approved that model results are sensitive to the variables<br />
included in the equation. <strong>The</strong>y tested the sensibility <strong>of</strong> the model by utilizing different samples <strong>and</strong><br />
found that the numbers <strong>of</strong> <strong>RTA</strong>s that are trade creating with a sample are not with another sample.<br />
Some important <strong>and</strong> relevant studies are discussed below.<br />
Venables (1999) tested the benefits <strong>and</strong> costs <strong>of</strong> a free trade area on member states. He used a<br />
generalized Heckscher-Ohlin model whereby assuming same level <strong>of</strong> technology prevails but with<br />
different labour types, skilled <strong>and</strong> unskilled, based on their comparative advantage. As a whole, his<br />
results showed that developing countries were more capable to exploit the free trade agreements.<br />
Soloaga <strong>and</strong> Winters (1997) argued on trade diversion existence in EU <strong>and</strong> EFTA 2 . <strong>The</strong>y used<br />
annual non-fuel data for 58 countries from 1980 to 1996 which represented around 70% <strong>of</strong> total<br />
world imports at that time. General results were that they found that the imports <strong>of</strong> both<br />
organisations were lower in 1995 to 1996 than in prior period. <strong>The</strong>y worked with three sets <strong>of</strong><br />
dummy variables for each trade bloc. <strong>The</strong>y considered intra bloc trade, one bloc recording imports<br />
by members from all countries, including nonmembers, <strong>and</strong> another one taking exports by bloc<br />
members only to all countries, including nonmembers. <strong>The</strong> first dummy represents the effect <strong>of</strong> a<br />
2 European Free Trade Association
PTA on members’ trade <strong>and</strong> the two last dummies suggest the degree <strong>of</strong> imports <strong>and</strong> exports as a<br />
whole. <strong>The</strong>y tested for changes in the trade flows before <strong>and</strong> after the implementation <strong>of</strong> blocs <strong>and</strong><br />
concluded that no great changes in intra trade were noticed. Hence, the tendency <strong>of</strong> intra- bloc trade<br />
remained nearly unchanged both before <strong>and</strong> after creation <strong>of</strong> blocs.<br />
Rahman (2006) focused on the trade diversions between developed <strong>and</strong> developing countries <strong>and</strong><br />
considered several <strong>RTA</strong>s, laying emphasis on SAFTA. He worked with the gravity model <strong>and</strong> panel<br />
data was adopted with country pair fixed effects <strong>and</strong> year specific fixed effects. He captured the time<br />
dimension <strong>and</strong> cross section specification <strong>of</strong> the data by using two-stage estimation method. <strong>The</strong><br />
conclusion was that significant intra bloc export creation was present plus also net export diversion<br />
in SAFTA.<br />
Chong Wha Lee (2008) tested the relationship or degree <strong>of</strong> relationship between trade creating <strong>and</strong><br />
trade diverting effects <strong>of</strong> some <strong>RTA</strong>s. <strong>The</strong> author used the panel data, dividing observations into<br />
five years for the period 1950 to 1999. His study arrived at distinctive results. First one being that<br />
trade creating effects were found in five (EC, CACM, MERCOSUR, ASEAN, <strong>and</strong> SPARTECA) <strong>of</strong><br />
the set <strong>of</strong> <strong>RTA</strong>s taken. He also arrived at concluding that trade creating effects were at a declining<br />
rate in EC, CACM, MERCOSUR, <strong>and</strong> ASEAN. He added to that, countries ignore their differences<br />
<strong>and</strong> over stated the positive effects <strong>of</strong> <strong>RTA</strong>s. <strong>The</strong> last point he made is that EU <strong>and</strong> NAFTA were<br />
quite close to trade compared to other <strong>RTA</strong>s such as ASEAN <strong>and</strong> MERCOSUR.<br />
Coulibaly (2006) laid emphasis on six developing <strong>RTA</strong>s; ECOWAS <strong>and</strong> <strong>SADC</strong> in Sub- Saharan<br />
Africa, AFTA in Asia <strong>and</strong> CACM, CAN, MERCOSUR in Latin America, <strong>and</strong> two developed <strong>RTA</strong>s;<br />
EU <strong>and</strong> NAFTA. Data as from 1960 to 1996 was taken for comparison <strong>of</strong> the positive effects <strong>and</strong><br />
trade levels between the developing <strong>and</strong> developed <strong>RTA</strong>s along the years. Gravity model combined<br />
with kernel <strong>and</strong> bootstrap estimation techniques was used. <strong>The</strong> author found that welfare impacts<br />
differed between younger <strong>and</strong> mature <strong>RTA</strong>s. He stated that AFTA, CAN, MERCOSUR, NAFTA<br />
<strong>and</strong> <strong>SADC</strong> which were new at that time had positive impacts in their infant years. On the other<br />
h<strong>and</strong>, older <strong>RTA</strong>s such as CACM, ECOWAS <strong>and</strong> EU at that time have had more volatile welfare<br />
impacts. <strong>The</strong> latter added that trade <strong>and</strong> welfare impacts <strong>of</strong> both developing <strong>and</strong> developed <strong>RTA</strong>s<br />
have had no uniformed evolution.<br />
Brown (2005) discussed that agreements have an impact on economic, social <strong>and</strong> political climates<br />
<strong>of</strong> a country. He considered the EU for his study <strong>and</strong> found that imports were now cheaper <strong>and</strong><br />
exports were more pr<strong>of</strong>itable with agreements. This leads to the creation or the continuation <strong>of</strong>
foreign direct investment in a country, hereby enhancing economic growth, improve balance <strong>of</strong><br />
payments <strong>and</strong> may even bring new skills <strong>and</strong> technology.<br />
A more recent research is carried in the Western Hemisphere by Muhammad <strong>and</strong> Yucer (2010).<br />
<strong>The</strong>y studied on how the welfare effects <strong>of</strong> <strong>RTA</strong>s are dependent on trade creation <strong>and</strong> trade<br />
diversion generated. <strong>The</strong>y took 38 countries with six <strong>RTA</strong>s in the Western Hemisphere for 1986 to<br />
2005. <strong>The</strong>y used the gravity model based on Santos Silva’s <strong>and</strong> Tenreyo’s (2005) Poisson Pseudo-<br />
Maximum Likelihood (PPML) method. According to them they got more accurate results about<br />
trade impacts compared to the PPML. <strong>The</strong>ir estimates showed that trade creation was positively<br />
significant except for NAFTA <strong>and</strong> LAIA <strong>and</strong> that trade diversion effects <strong>of</strong> these two greatly varied.<br />
In addition to that, while NAFTA, LAILA <strong>and</strong> MERCOSUR had a remarkable trade diversion<br />
effect, ANDEAN <strong>and</strong> CACM had a positive significant trade diversion coefficient. After<br />
considering their analysis, conclusion is that <strong>RTA</strong>s do not only help countries to enhance their trade<br />
movements <strong>and</strong> relations between members but also improve or contribute to the world trade.<br />
<strong>SADC</strong><br />
This concept <strong>of</strong> regional integration was created with the vision <strong>of</strong> ensuring economic well-being,<br />
improvement <strong>of</strong> the st<strong>and</strong>ards <strong>of</strong> living <strong>and</strong> quality <strong>of</strong> life, freedom <strong>and</strong> social justice. <strong>SADC</strong> was<br />
first introduced when the Head <strong>of</strong> States or Government decided to formalize the Southern African<br />
development Coordinating Conference (<strong>SADC</strong>C) which had as first name Southern Africa: Towards<br />
<strong>Economic</strong> Liberation. This declaration had at that time the aim at economic liberation <strong>and</strong><br />
integrated <strong>and</strong> equitable development <strong>of</strong> the economies <strong>of</strong> the region. <strong>The</strong> <strong>SADC</strong>C turned out with<br />
a legal existence in August 1992, <strong>and</strong> is forth named as the Southern African Development<br />
Community (<strong>SADC</strong>). In the 2000 Ordinary Summit, a protocol to establish the tribunal was signed<br />
in Namibia. <strong>The</strong> tribunal was to onwards ensure the proper usage <strong>and</strong> underst<strong>and</strong>ing <strong>of</strong> the <strong>SADC</strong><br />
treaty <strong>and</strong> remedial actions upon disputes that may occur. <strong>The</strong> <strong>SADC</strong> treaty was amended in August<br />
2001 by the Head <strong>of</strong> State <strong>and</strong> Government <strong>and</strong> the protocol was subject to amendments in<br />
October 2002.<br />
In 2008, <strong>SADC</strong> joined the Common Market For Eastern <strong>and</strong> Southern Africa <strong>and</strong> the East African<br />
Community to form the African Free Trade Zone. As such, <strong>SADC</strong> subscribed to create a single free<br />
trade zone composing <strong>of</strong> 26 countries. Moreover, the <strong>SADC</strong> trade protocol <strong>of</strong> 2000 which
pronounced the reduction <strong>of</strong> custom duties is to be carried forward to further reduction to around<br />
85% <strong>of</strong> tariff lines by 2008 <strong>and</strong> on tariffs on sensitive products being eliminated by this year.<br />
<strong>SADC</strong> has had 15 member states but after the coup d’état Madagascar was suspended, hence <strong>SADC</strong><br />
has 14 active member states presently; Angola, Botswana, Democratic Republic <strong>of</strong> Congo, Lesotho,<br />
Malawi, Mauritius, Mozambique, Namibia, Seychelles, South Africa, Swazil<strong>and</strong>, Tanzania, Zambia,<br />
Zimbabwe.<br />
AFRICAN RECS AVERAGE EXPORTS TO THE REST OF AFRICA IN US$<br />
MILLIONS, 2000-2008<br />
At the global level, Africa’s share in global exports increased from 2.4 per cent in 2000 to 2.9 per<br />
cent in 2008, but averaged about 2.5 per cent between these periods. On the import side, Africa<br />
constituted only 2 per cent <strong>of</strong> total world imports over the same period. <strong>The</strong>se statistics confirm<br />
Africa’s infinitesimal share in global trade (UNECA, 2010).<br />
Africa is increasingly focusing on regional integration as a strategy for achieving sustainable<br />
economic growth as there is a consensus that by merging its economies <strong>and</strong> pooling its capacities,<br />
endowments <strong>and</strong> energies, the continent can overcome its daunting development challenges.<br />
However, there are still a number <strong>of</strong> constraints <strong>and</strong> challenges facing regional trading blocs in<br />
Africa.<br />
Intra-REC trade in particular <strong>and</strong> intra-African trade in general, is generally low. African countries<br />
in general tend to trade more with countries outside the continent than among themselves. <strong>The</strong><br />
most important trading partners are the EU <strong>and</strong> USA, although China in particular <strong>and</strong> Asia in<br />
general are increasingly also becoming important destinations for Africa’s exports <strong>and</strong> sources <strong>of</strong> its<br />
imports.<br />
As figure xx illustrates, on average, countries within CEN-SAD (<strong>The</strong> Community <strong>of</strong> Sahel-Saharan<br />
States) registered the highest exports beyond their borders to the rest <strong>of</strong> African countries, followed<br />
by <strong>SADC</strong>, ECOWAS (<strong>Economic</strong> Community <strong>of</strong> West African States), UEMOA (West African<br />
<strong>Economic</strong> <strong>and</strong> Monetary Union) <strong>and</strong> COMESA.<br />
Figure xx RECs Average Export Share to the Rest <strong>of</strong> Africa, US$ million, 2000-2008
Further, we note that the RECS’ major export destinations are the EU <strong>and</strong> USA, which constitute an<br />
average <strong>of</strong> 57 per cent <strong>of</strong> the exports <strong>of</strong> the African RECs. For some RECs, the EU <strong>and</strong> USA<br />
comprise more than 60 per cent <strong>of</strong> their export markets (see table). For RECs such as IOC <strong>and</strong><br />
UMA, about 80 per cent <strong>of</strong> their exports were destined, between 2000 <strong>and</strong> 2008, for the EU <strong>and</strong><br />
USA markets. Asia, <strong>and</strong> China in particular are important export markets for the RECs.<br />
Table: Direction <strong>of</strong> African RECs’ exports to African <strong>and</strong> non-African countries in US$<br />
millions, average between 2000 <strong>and</strong> 2008
Source: UNECA, 2010<br />
AFRICAN RECS AVERAGE IMPORTS TO AFRICAN AND NON-AFRICAN<br />
COUNTRIES IN US$ MILLIONS, 2000-2008<br />
<strong>The</strong> major sources <strong>of</strong> imports to Africa lie outside the continent. However, it is interesting to<br />
observe that within CEPGL (<strong>Economic</strong> Community <strong>of</strong> the Great Lakes Countries); Africa was a<br />
significant source <strong>of</strong> imports to the community, representing about 42 per cent <strong>of</strong> the total imports.<br />
About a fourth <strong>of</strong> imports by UEMOA also came from Africa. But for the rest <strong>of</strong> the RECs, the EU<br />
continues to be a major source <strong>of</strong> imports. This is shown in table 4.2 below.<br />
Table : African RECs average imports to African <strong>and</strong> non-African countries in US$ millions,<br />
2000-2008
OVERALL TRADE PERFORMANCE OF THE <strong>SADC</strong><br />
Source: UNECA, 2010<br />
Since 2006, global exports to <strong>SADC</strong> increase at a higher rate than imports from the region. Overall,<br />
global imports from the <strong>SADC</strong> region increase by 140 per cent between 2004 <strong>and</strong> 2008. <strong>The</strong> main<br />
products imported by the <strong>SADC</strong> region globally include mineral fuels, nuclear machinery, iron ore<br />
materials <strong>and</strong> vehicles. <strong>The</strong> highest growth imports between 2004 <strong>and</strong> 2008 are fertilizers, nickel<br />
articles <strong>and</strong> iron ore articles, with imports <strong>of</strong> fertilizers growing 347 per cent, imports <strong>of</strong> nickel<br />
articles growing 301.4 per cent <strong>and</strong> imports <strong>of</strong> iron ore articles growing 372 per cent. Overall, global<br />
exports from the <strong>SADC</strong> region increase by 194.4 per cent from 2004 to 2008. <strong>The</strong> global export<br />
basket <strong>of</strong> <strong>SADC</strong> closely mirrors the import basket, with high growth <strong>of</strong> exports <strong>of</strong> mineral fuels (456<br />
per cent), iron ore products (527 per cent) <strong>and</strong> copper <strong>and</strong> copper articles (361.7 per cent)<br />
(Trademap, 2010).<br />
<strong>The</strong> main products traded between the <strong>SADC</strong> countries are mineral fuels, nuclear machinery <strong>and</strong><br />
iron ore products. <strong>The</strong> growth in the trade <strong>of</strong> print media such as newspapers, books <strong>and</strong> pictures<br />
has seen an increase <strong>of</strong> 395 per cent from 2004 to 2008. Other high-growth products include<br />
cereals, iron ore products, nickel products <strong>and</strong> mineral fuels.
Figure : Overall Trade Performance <strong>of</strong> <strong>SADC</strong>, 2004-2008<br />
SOURCES OF THE <strong>SADC</strong> AVERAGE IMPORTS IN US$ MILLIONS, 2000-2008<br />
Table : Main Import Sources <strong>of</strong> <strong>SADC</strong>, 2000-2008.<br />
<strong>SADC</strong><br />
<strong>SADC</strong><br />
(%)<br />
Africa 8584.76 11.8<br />
China 5949.47 8.2<br />
Asia 8133.55 11.2<br />
EU 25872.92 35.6<br />
Japan 3922.57 5.4<br />
USA 5713.28 7.9<br />
Rest <strong>of</strong> World 14590.9 20.1<br />
Total WORLD 72767.4 100<br />
Source: UN COMTRADE Database
Figure : Main Import Sources <strong>of</strong> EAC, COMESA <strong>and</strong> <strong>SADC</strong>, 2000-2008.<br />
DESTINATION OF THE <strong>SADC</strong> AVERAGE EXPORTS IN US$ MILLIONS, 2000-2008<br />
Table: An Analysis <strong>of</strong> the Main Export Destinations <strong>of</strong> <strong>SADC</strong>, 2000-2008<br />
Main Export<br />
Destinations between<br />
2000-2008 <strong>SADC</strong><br />
<strong>SADC</strong><br />
(%)<br />
Africa 8,704.9 12.3<br />
China 7,139.5 10.1<br />
Asia 5,184.6 7.3<br />
EU 20,679.4 29.3<br />
Japan 2,672.8 3.8<br />
USA 11,266.5 16.0<br />
Rest <strong>of</strong> World 14,973.9 21.2<br />
WORLD 70,621.6 100
Source: UN COMTRADE Database<br />
Figure xx: Main Export Destinations <strong>of</strong> EAC, COMESA <strong>and</strong> <strong>SADC</strong> between 2000-2008<br />
<strong>The</strong> table below gives an interesting comparative percentage share <strong>of</strong> trade <strong>of</strong> <strong>SADC</strong> <strong>and</strong> non<br />
<strong>SADC</strong> <strong>and</strong> shows the relatively low level trade within <strong>SADC</strong> member countries.<br />
Year<br />
Imports Exports<br />
Total (Rs m) <strong>SADC</strong> (Rs000) % <strong>of</strong> <strong>SADC</strong> Total (Rs m) <strong>SADC</strong> (Rs000) % <strong>of</strong> <strong>SADC</strong><br />
2005 93,282 9,619,469 10.31 59,095 4,385,816 7.42<br />
2006 115,502 9,899,775 8.57 68,966 5,064,698 7.34<br />
2007 121,037 11,692,049 9.66 64,265 6,708,746 10.44<br />
2008 132,165 13,232,380 10.01 59,015 6,615,338 11.21<br />
2009 118,444 11,973,066 10.11 56,162 7,370,816 13.12<br />
2010 134,882 13,517,218 10.02 61,990 8,217,470 13.26<br />
INTRA TRADE:<br />
<strong>SADC</strong> patterns <strong>of</strong> Trade<br />
As shown in the table below, the shares <strong>of</strong> exports <strong>and</strong> imports to the <strong>SADC</strong> members over the<br />
period 2000 to 2011 vary greatly. <strong>The</strong> table was constructed by considering the total imports <strong>and</strong>
exports <strong>of</strong> each country over the period 2000 to 2011 <strong>and</strong> compared to the overall imports <strong>and</strong><br />
exports <strong>of</strong> all fourteen countries over that same period.<br />
Row Labels Exports (%) Imports (%)<br />
Angola 0.61 0.04<br />
Botswana 0.20 0.10<br />
Congo, Dem. Rep. 0.06 0.10<br />
Lesotho 0.26 0.21<br />
Madagascar 54.57 6.41<br />
Malawi 0.29 0.27<br />
Mozambique 0.90 2.06<br />
Namibia 0.06 0.20<br />
Seychelles 8.32 3.86<br />
South Africa 31.20 80.58<br />
Swazil<strong>and</strong> 0.05 2.16<br />
Tanzania 1.26 0.56<br />
Zambia 0.46 2.32<br />
Zimbabwe 1.77 1.15<br />
Table 4.<br />
Madagascar <strong>and</strong> South Africa dominate trade with 54.6% <strong>and</strong> 31.20% <strong>of</strong> <strong>SADC</strong> exports over the<br />
period respectively. However as mentioned earlier, Mauritius’ overall world exports fails to countries<br />
in <strong>SADC</strong> as exports are concentrated elsewhere than in <strong>SADC</strong>. <strong>The</strong> <strong>SADC</strong> falls well behind that <strong>of</strong><br />
EU for example. <strong>The</strong> products are supported by several initiatives, namely Everything But Arms<br />
(EBA) initiative, the Lome Convention amongst others. Some countries may have preferential<br />
market access in the EU. In addition to that, Mauritius flow <strong>of</strong> exports is more <strong>of</strong>ten dealt with in<br />
COMESA than in <strong>SADC</strong>. Nonetheless back to the consideration <strong>of</strong> <strong>SADC</strong> only, it is to be<br />
mentioned that Madagascar was expelled during that period, <strong>and</strong> yet stayed the first ranked <strong>of</strong><br />
importing from Mauritius. <strong>The</strong> second best in exports is South Africa, clearly seen from the table.<br />
In Imports, both countries are still the two best ranked. South Africa with a highly differential<br />
percentage compared to the others (80.58%) <strong>and</strong> Madagascar laying far behind but yet the second<br />
best ranked at 6.41% <strong>of</strong> imports to Mauritius. Again, the analysis <strong>of</strong> patterns <strong>of</strong> trade for Mauritius
should not be restricted to import volumes in <strong>SADC</strong> only but should also consider other <strong>RTA</strong>s as<br />
imports may be more significant in other <strong>RTA</strong>s.<br />
Hence it should be noted that both Madagascar <strong>and</strong> South Africa was relatively more important in<br />
exports <strong>and</strong> imports to the region in that period as compared to the other member states whose<br />
percentage <strong>of</strong> total trade in the region for Mauritius are very low.<br />
INTRA-REC EXPORT TRENDS IN US$ MILLIONS, 2000-2008<br />
In general, intra-REC exports have been growing in value across most RECs. On average between<br />
2000 <strong>and</strong> 2007, the top five RECs in intra-REC exports in value terms are CEN-SAD (25 per cent),<br />
<strong>SADC</strong> (25 per cent), ECOWAS (17 per cent), COMESA (12 per cent) <strong>and</strong> UMA (7 per cent). <strong>The</strong><br />
RECs that traded least among themselves, at 1 per cent or less, on average between 2000 <strong>and</strong> 2007<br />
are CEMAC, ECCAS, CEPGL <strong>and</strong> MRU (UNECA, 2010).<br />
Figure : Intra-REC exports 2000-2008 (in US$ millions)<br />
As far as COMESA, <strong>SADC</strong> <strong>and</strong> EAC are concerned, their trend <strong>of</strong> intra-REC exports from 2000-<br />
2008 is shown in Figure below. Our data confirms that <strong>SADC</strong> intra-exports potential is much<br />
higher than that <strong>of</strong> COMESA <strong>and</strong> the EAC.<br />
Figure xx EAC, COMESA <strong>and</strong> <strong>SADC</strong> intra-exports between 2000-2008
Table: Share <strong>of</strong> Individual Country’s Exports in total Intra-Exports within <strong>SADC</strong>, 2000-2008<br />
<strong>SADC</strong> 2000 2001 2002 2003 2004 2005 2006 2007 2008<br />
Angola 0.2 0.04 0.9 0.1 10.6 11.6 8.9 32.1 8.7<br />
DRC 0.2 2.3 0.6 1.0 1.1 1.3 1.6 3.1 3.8<br />
Madagascar 0.5 0.7 1.2 3.2 1.3 0.6 0.4 0.4 0.5<br />
Malawi 1.2 1.3 4.3 4.5 4.5 5.0 4.1 3.6 4.1<br />
Mauritius 2.2 3.0 7.6 8.1 5.7 5.8 3.9 3.8 4.3<br />
Mozambique 3.0 4.1 12.8 12.3 11.6 15.2 11.5 10.2 12.2<br />
South Africa 73.7 76.4 n/a n/a n/a n/a n/a n/a n/a<br />
Tanzania 1.2 0.9 5.5 4.9 5.2 6.9 4.7 3.8 4.3<br />
Zambia 6.8 7.2 22.8 21.8 30.7 26.7 53.4 19.6 31.0<br />
Zimbabwe 10.8 4.0 44.4 44.0 29.2 26.9 11.5 23.3 31.0<br />
Total 100 100 100 100 100 100 100 100 100<br />
Source: UN COMTRADE Database<br />
INTRA-REC IMPORT TRENDS IN US$ MILLIONS, 2000-2008<br />
Figure provides data on the value <strong>of</strong> intra-REC imports in $US millions. As in the <strong>case</strong> <strong>of</strong> exports,<br />
intra-REC imports also have witnessed a growing trend in value across most RECs. On average,<br />
between 2000 <strong>and</strong> 2007, the top five RECs in intra-REC imports were CEN-SAD (26 per cent),<br />
<strong>SADC</strong> (25 per cent), ECOWAS (17 per cent), COMESA (12 per cent) <strong>and</strong> UMA (7 per cent). <strong>The</strong><br />
same RECs also dominate intra-REC exports. On average, between 2000 <strong>and</strong> 2007, the most<br />
significant importing countries among these top five RECs in terms <strong>of</strong> intra-community imports<br />
were:
•CEN-SAD: Egypt (24 per cent), Nigeria (16 per cent), Morocco (15 per cent) <strong>and</strong> Tunisia (11 per<br />
cent);<br />
•<strong>SADC</strong>: South Africa (69 per cent) <strong>and</strong> Angola (9 per cent); <strong>and</strong><br />
•ECOWAS: Nigeria (40 per cent), Liberia (14 per cent), Ghana (11 per cent) <strong>and</strong> Cote d’Ivoire (9<br />
per cent)<br />
Figure: Intra-REC imports, 2000-2008, in US$ millions<br />
With regards to COMESA, <strong>SADC</strong> <strong>and</strong> EAC, their trend <strong>of</strong> intra-REC imports from 2000-2008 is<br />
shown in Figure below. Our data confirms that <strong>SADC</strong> intra-imports potential is much higher than<br />
that <strong>of</strong> COMESA <strong>and</strong> the EAC.<br />
Figure: EAC, COMESA <strong>and</strong> <strong>SADC</strong> intra-imports between 2000-2008, US$ million
<strong>SADC</strong> <strong>and</strong> Mauritius<br />
Mauritius, being one amongst the developing countries, has been an active member <strong>of</strong> WTO since 1<br />
January 1995 3 . Mauritius as a developing economy benefits from the MFN rules. Mauritius is<br />
actually a member <strong>of</strong> three <strong>RTA</strong>s in force. Moreover Mauritius find itself engaged in other<br />
agreements; such as the Indian Ocean Commission (COI), Cross Border Initiative (CBI) <strong>and</strong> the<br />
Indian Ocean Rim Association (IOR-ARC); (Figure 3).<br />
Figure .<br />
As an affiliate to <strong>RTA</strong>s, Mauritius expects a welfare gain. This has lead Mauritius to sign different<br />
agreements which differs in the conditions <strong>of</strong> trade. This is pointed out in the “spaghetti bowl”<br />
phenomenon by Bhagwati (1993). Recently, Mauritius has negotiated an agreement; Eastern<br />
Southern Africa (EPA), with the EU which came into force in May 2012. <strong>The</strong> EU is an important<br />
trading partner for Mauritius <strong>and</strong> Mauritius greatly benefits from the EU Protocols on sugar.<br />
According to statistics, the EU is the main export market for Mauritius as it comprises <strong>of</strong> 63.7% <strong>of</strong><br />
total exports in 2010.<br />
By main destination (2010) Exports (%)<br />
3 Source from WTO site.
European Union 63.7<br />
United states 10.9<br />
Madagascar 5.5<br />
South Africa 4.5<br />
Switzerl<strong>and</strong> 1.8<br />
Table 1.<br />
By main origin (2010) Imports (%)<br />
European Union 22.9<br />
India 22.3<br />
China 13.3<br />
South Africa 8.4<br />
Japan 3.3<br />
Table 2.<br />
<strong>The</strong> main export commodities for Mauritius are textiles, garment products <strong>and</strong> sugar. Mauritius not<br />
only benefit from the MFN tariffs but also gain highly from the Cotonou Sugar Protocol that<br />
guarantees the purchase <strong>of</strong> 507,000 tons <strong>of</strong> sugar per annum at an established price. Mauritius has<br />
diversified its trade with the EU significantly; it exp<strong>and</strong>ed its exports basket to textiles, garments,<br />
<strong>and</strong> even aircraft parts. Mauritius is very dependent on the EU market <strong>and</strong> on EU preferences for<br />
sugar. Even though a non-reciprocal trade relation persists between Mauritius <strong>and</strong> EU, Mauritius,<br />
classified as a middle-income country, still gain from their transactions. In recent past, Mauritius<br />
thought upon negotiating a “Southern-Eastern Africa EPA” that contains mainly COMESA states<br />
but excludes SACU countries. Mauritius undertook that action to improve trade or market relations<br />
with COMESA members. By that action, Mauritius showed an aversion to adopt the EU South<br />
Africa liberalisation schedule. Mauritius economic healthiness is threatened by increasing worldwide<br />
competition <strong>and</strong> limited protection options in trade. <strong>The</strong> EU brought the requirement for “double<br />
transformation” to help African, Carribean <strong>and</strong> Pacific countries (ACP) on market. However, this<br />
was not really helpful to Mauritius.<br />
Moreover, the reform <strong>of</strong> the European Common Agricultural Policy (CAP), which is to lower<br />
subsidies on specific crop production, if implemented, will result in a negative effect on Mauritius; as<br />
the value <strong>of</strong> the Protocol commodies will be reduced. In addition to that, the European “Everything
ut Arms” (EBA) scheme gave all least developed countries (LDCs) a duty free market access on<br />
sugar since 2009 <strong>and</strong> this leads to an increase in competition in the EU market. Mauritius again<br />
suffered a negative impact on its market share. Hence in Mauritius history, EU helped the growth <strong>of</strong><br />
Mauritius.<br />
Mauritius is an example <strong>of</strong> countries that have interests in <strong>SADC</strong>. <strong>The</strong> trade transactions <strong>of</strong><br />
Mauritius are frequentius in COMESA countries compared to <strong>SADC</strong> countries. Mauritius receives<br />
8.4% <strong>of</strong> its total imports from South Africa. However, South Africa is not perceived as an attractive<br />
destination for Mauritius exports. <strong>The</strong> reasons are Mauritius faces substantial barriers on trade <strong>and</strong><br />
its main export commodities are regarded as sensitive in the SACU. Although, it cannot be ignored<br />
that Africa is one <strong>of</strong> the major investor in Mauritius.<br />
<strong>SADC</strong> lacks importance in Mauritius compared to COMESA as the trade <strong>of</strong> its main products is not<br />
that much solid in <strong>SADC</strong>. <strong>The</strong> range <strong>of</strong> products traded in COMESA has changed much through<br />
the period 1980 to 2002. Mauritius has increased its trade considerably since that period by around<br />
30%. Pondering over COMESA, Mauritius has been a member <strong>of</strong> the Preferential Trade Area<br />
before COMESA. Mauritius gained from the Free Trade Area in 2000, which exclude all customs<br />
duties on imports from COMESA members. Mauritius was already heading from sugar industry to<br />
textile industry <strong>and</strong> yet the fact that Mauritius benefits from trade in COMESA still persists. This<br />
statement is proven considering the main trading partner for Mauritius lies in COMESA.<br />
Madagascar imports around 75% <strong>of</strong> Mauritius total exports <strong>and</strong> Egypt, is 29% approximately <strong>of</strong><br />
Mauritius total imports. Moreover any decisions taken in COMESA custom union benefits<br />
Mauritius. <strong>The</strong> export markets <strong>of</strong> Mauritius are still undiversified in COMESA compared to the EU.<br />
<strong>The</strong> export rate is made up <strong>of</strong> only 6.8% in COMESA. As mentioned earlier, trade volume increased<br />
since the time Mauritius entered into the agreement. Moreover, Mauritius was one among the five<br />
chosen countries to promote the project <strong>of</strong> Trading Houses. Mauritius will enhance its<br />
competitiveness on the services market; beneficial.<br />
Concerning the Indian Ocean Commission (COI), Mauritius was member since foundation. This<br />
small organization is also known as the Commission de l'Océan Indien in French caters for the<br />
cooperation between Comoros, Madagascar, Mauritius, Reunion <strong>and</strong> Seychelles. <strong>The</strong> main idea <strong>of</strong><br />
the foundation was to promote trade <strong>and</strong> tourism. Not much research was carried on this agreement
ut it can be said that it does not have enormous impact on the GDP <strong>of</strong> Mauritius. However,<br />
Mauritius finds itself in a better place with its projects <strong>and</strong> laws.<br />
Cross Border Initiatives (CBI) was agreed by the Minister <strong>of</strong> Foreign Affairs. Recently, food security<br />
was highlighted in Mauritius <strong>and</strong> a project came up. This was idealized on agricultural cultivation<br />
outside <strong>of</strong> Mauritius for its citizens with a budget <strong>of</strong> Rs1 billion in 2009.<br />
This negotiation has not only smoothened the relationship with foreigners but also encourage trade<br />
flows. Moreover, Mauritius has the opportunity to rent the l<strong>and</strong> acquired to other investors. Cross<br />
Border Initiatives facilitates the movements <strong>of</strong> people among the countries. Mauritius was no<br />
exception not to follow the trend to invest in outside economy for agricultural cultivation. Not to<br />
mention that the agreement also takes into consideration social factors like; child exploitation <strong>and</strong><br />
human trafficking. Hence this agreement benefits go two ways; the host <strong>and</strong> the foreign country.<br />
With this kind <strong>of</strong> integration, Mauritius does secure its social stability which enforces the economic<br />
<strong>and</strong> political stability; thus its growth has achieved reached a long term base.<br />
Mauritius is engaged in the Indian Ocean Rim-Association for Regional Cooperation (IOR-ARC),<br />
also known as the Indian Ocean Rim Initiative, for quite a long time. This initiative allows<br />
information flows to positively influence trade <strong>and</strong> investment. This agreement also favors mutual<br />
interests, growth <strong>and</strong> development. Trade flows had increased in goods, services <strong>and</strong> even scientific<br />
<strong>and</strong> technological sharing, as Mauritius gains from reduction <strong>and</strong> eradication <strong>of</strong> some barriers.<br />
Mauritius participates in the projects undertaken by the organization. Mauritius enjoys good<br />
cooperation <strong>and</strong> liaison settled by the initiative. Not to forget that Mauritius highly benefits in terms<br />
<strong>of</strong> trade <strong>and</strong> growth from being member in this region.<br />
Mauritius was welcomed as the twelfth member at the Annual Conference <strong>of</strong> the (Inter-state<br />
Defence <strong>and</strong> Security Committee) ISDSC that was held in Lilongwe during October 1996. Mauritius<br />
gained a lot <strong>of</strong> international experience as from its dependence <strong>and</strong> is now an export oriented unit.<br />
Being a member <strong>of</strong> <strong>SADC</strong> for the few years, it is now an exemplary country that provides an<br />
excellent <strong>case</strong> study <strong>of</strong> the economic achievements that are possible through outward-oriented trade<br />
policies. <strong>The</strong> topic <strong>of</strong> interest for Mauritius in <strong>SADC</strong> is acutely based on textiles <strong>and</strong> garments.<br />
Mauritius is one <strong>of</strong> the few manufacturing sectors in which there is significant production in a<br />
number <strong>of</strong> member countries. Mauritius was since long time known for its h<strong>and</strong> make production;
workforce. <strong>The</strong> difference in the workforce degree <strong>and</strong> other determinants <strong>of</strong> comparative costs,<br />
amongst member states, at the different stages in the industry means that there exist some sections<br />
that can be exploited altogether (through trade initiatives). Consequently, this may enhance the<br />
region’s global competitiveness. This is where Mauritius showed its capacity <strong>and</strong> laid the region’s<br />
potential.<br />
Opportunities for Mauritius to set strategic alliances through the Africa <strong>Growth</strong> <strong>and</strong> Opportunities<br />
Act (AGOA) have recently exploded. Mauritius needs, at the earliest, to remedy its domestic <strong>and</strong><br />
regional weaknesses to better exploit the American market while taking advantage <strong>of</strong> <strong>SADC</strong><br />
underutilized textile plants. Mauritius being one <strong>of</strong> the dominant players in the textile <strong>and</strong> garment<br />
sector <strong>of</strong> <strong>SADC</strong> has led to different objectives towards interests <strong>and</strong> approaches to <strong>SADC</strong>.
<strong>SADC</strong> Members 1970 1975 1978 1988 1990 1992 1995 2000 2005 2010<br />
Import 2.819 0.923 3 4 6 8 9 10 10 1977.472<br />
Angola<br />
Export 0 0 2 3 6 7 7 35.656 1916.575<br />
Total 2.819 0.923 5 7 12 15 16 10 45.656 3894.047<br />
Botswana<br />
Congo<br />
Lesotho<br />
Madagascar<br />
Malawi<br />
Mozambique<br />
Namibia<br />
Seychelles<br />
South Africa<br />
Swazil<strong>and</strong><br />
Tanzania<br />
Zambia<br />
Zimbabwe<br />
Gr<strong>and</strong> Total<br />
Import 3 5 6 6 6 7 7 12.581 381.428 27.481<br />
Export 60 80 80 80 90 90 90 681.098 150.038 106.902<br />
Total 63 85 86 86 96 97 97 693.679 531.466 134.383<br />
Import 6.33 4.00 7.00 558.57 491.57 185.57 185.90 6.64 19.00<br />
Export 30 34.00 38.69 66.62 459.78 45.27 24.00 4.00 8.00<br />
Total 30 40.33 42.69 7.00 625.19 951.35 230.83 209.90 10.64 27.00<br />
Import 0 56 34 34 434 34 5 5 779.286 2037.939<br />
Export 3 3 3 5 5 5 6 6 0 0<br />
Total 3 59 37 39 439 39 11 11 779.286 2037.939<br />
Import 1512.237 2662.187 1209.952 3579.072 11723.3 15583.97 20340.15 33485.41 14758.28 18466.53<br />
Export 216.205 165.686 219.152 2076.004 9660.502 15138.2 39798.93 76077.54 40777.59 47012.01<br />
Total 1728.442 2827.873 1429.104 5655.076 21383.8 30722.18 60139.08 109562.9 55535.87 65478.54<br />
Import 0.809 7.175 59.749 671.076 421.924 310.379 129.232 1091.474 84.737 1479.613<br />
Export 11.16 1.48 13.353 38 136.148 133.838 525.627 1256.885 125.256 184.433<br />
Total 11.969 8.655 73.102 709.076 558.072 444.217 654.859 2348.359 209.993 1664.046<br />
Import 31.227 529.329 343 234 47.398 144.258 119.539 1932.181 15590.03 3987.792<br />
Export 6.194 0 5.533 0 1.144 1110.463 193.714 958.086 783.393 1286.569<br />
Total 37.421 529.329 348.533 234 48.542 1254.721 313.253 2890.267 16373.42 5274.361<br />
Import 50 100 130 140 160 180 210 270.907 308.017 949.311<br />
Export 0 1 8 8 9 8 11 8.681 42.089 134.01<br />
Total 50 101 138 148 169 188 221 279.588 350.106 1083.321<br />
Import 215.082 350.344 530.702 454 95.874 1190.437 228.761 962.17 9531.7 13909.6<br />
Export 37.806 1192.475 607.637 963.859 3210.592 2653.202 2601.462 5487.792 5572.723 8823.775<br />
Total 252.888 1542.819 1138.339 1417.859 3306.466 3843.639 2830.223 6449.962 15104.42 22733.38<br />
Import 6808.213 32085.17 58560.43 110503.8 148802.9 232188.8 225567.6 309354.1 270782.2 370538<br />
Export 1873.451 3136.947 6168.379 4745.152 6755.176 12276.22 6798.884 8956.243 18337.5 72211.29<br />
Total 8681.664 35222.12 64728.81 115249 155558.1 244465.1 232366.5 318310.3 289119.7 442749.3<br />
Import 1200 2455 3345 3676 3600 3967 4700 5934.701 6602.039 8486.699<br />
Export 9 22 26 26 26 26 30 709.232 4.765 0.359<br />
Total 1209 2477 3371 3702 3626 3993 4730 6643.933 6606.804 8487.058<br />
Import 204.674 23.254 150.283 176 425.673 1643.242 1611.453 980.388 2615.564 3501.441<br />
Export 0 0 46.58 60 81.236 629.348 936.839 2466.208 1575.435 491.221<br />
Total 204.674 23.254 196.863 236 506.909 2272.59 2548.292 3446.596 4190.999 3992.662<br />
Import 12.675 6.277 0.865 1 15.106 0.789 12.036 188.644 8608.924 6273.059<br />
Export 21.453 308.604 348.941 354 293.412 1076.758 251.385 139.872 380.853 125<br />
Total 34.128 314.881 349.806 355 308.518 1077.547 263.421 328.516 8989.777 6398.059<br />
Import 1 7 8 55 2685.837 4120.532 9030.824 6790.873 2848.988 6737.36<br />
Export 2000 2500 2904 3000 3205.709 3617.519 6608.415 5784.288 786.803 1077.147<br />
Total 2001 2507 2912 3055 5891.546 7738.051 15639.24 12575.16 3635.791 7814.507<br />
Import 75580.74 330672.8 498367.9 1286005 1686320 1773675 1985819 2078052 3152118 4379043<br />
Export 67531.41 294594.8 320222.9 997519.9 1220503 1335501 1537690 1489616 1560305 1489806<br />
Total 143112.2 625267.6 818590.8 2283525 2906823 3109176 3523509 3567668 4712423 5868850
Mauritian exports to the <strong>SADC</strong> member states had experienced a steady moving from 2000 to 2011.<br />
This upward <strong>and</strong> downward trend is expected to continue with new policies <strong>of</strong> reducing or phasing<br />
out tariff by <strong>SADC</strong> countries. Some <strong>of</strong> the commodities that are dealt with for Mauritius are Fabrics,<br />
T-shirts, Jerseys, Soaps, Wheat pellets, Baby Napkins, Sunglasses, Cotton Fabrics, Food<br />
preparations Chemicals, Printed books, <strong>and</strong> Articles <strong>of</strong> plastic.<br />
<strong>The</strong> increase in exports to South Africa was mainly linked to non-industrial diamond, which covered<br />
<strong>of</strong> about 40% <strong>of</strong> total export earnings in 2003. <strong>The</strong> main products, 33% <strong>of</strong> total exports to South<br />
Africa, were textiles <strong>and</strong> garments. Other products such as baby napkins, soaps, printed books <strong>and</strong><br />
sunglasses were also highly considered in exports considerations. Under the <strong>SADC</strong> protocol, tariffs<br />
on cotton fabrics have declined from 30% to 25% when exported to Mozambique in the region <strong>and</strong><br />
duties on fertilizers have reduced to nil in 2000. Exports to Tanzania rose significantly just after the<br />
20 th century. Namibia has also experienced an increase in exports due to the exportation <strong>of</strong><br />
machinery (98% <strong>of</strong> total exports in 2003). For other countries such as Botswana <strong>and</strong> Lesotho,<br />
exports to these have decrease over the years up till now. <strong>The</strong> reason is that the main exporting<br />
products have lost market share, despite the fact that new products, for instance paper <strong>and</strong><br />
paperboard labels, were exported. <strong>The</strong> agreement on tariff phasing-down plan was made in the year<br />
2000 in respect to imports from all <strong>SADC</strong> member states, except for imports from South Africa<br />
which started in early <strong>of</strong> 2003. Plan adapted to sensitive products began in 2008. It is to be noted<br />
that South Africa remained the major trading partner in <strong>SADC</strong> region, <strong>and</strong> for Mauritius. Imports<br />
from member countries, to be precise Mozambique, Namibia, Botswana amongst others, has gained<br />
momentum in the period considered above (2000 to 2011). Digging down to history, the increase in<br />
imports from Botswana was linked mainly to the bovine meat, Mozambique increase <strong>of</strong> exports to<br />
Mauritius was due to the fact that tariff on coal has reduced significantly over the years, Namibia<br />
because <strong>of</strong> the increase in the imports <strong>of</strong> frozen fish amongst others. <strong>The</strong>re is a fundamental point<br />
to be exposed; the increase in imports in 2004 is mainly attributed to the imports <strong>of</strong> jet fuels <strong>and</strong><br />
motor spirit which is not related to the tariff phased down approach.<br />
METHODOLOGY<br />
In this section, we try to evaluate the link between <strong>SADC</strong> exports <strong>and</strong> <strong>SADC</strong> economic growth,<br />
through a regression analysis. To model the growth effects <strong>of</strong> trade in the <strong>SADC</strong> region, a classical<br />
economic growth function was extended with st<strong>and</strong>ard control variables such as investment,
education, labour, financial development <strong>and</strong> trade openness. This is consistent with works from the<br />
literature (Barro, 1991; Mankiw, Romer <strong>and</strong> Weil, 1992; Benhabib <strong>and</strong> Spiegel, 1994; Levine <strong>and</strong><br />
Renelt; 1992, Levine et al, 2000 among others & Seetanah <strong>and</strong> Khadaroo, 2008). More importantly<br />
for the sake <strong>of</strong> this study the <strong>SADC</strong> exports has been decoupled into exports <strong>of</strong> <strong>SADC</strong> countries to<br />
their member states <strong>and</strong> into exports to other non-<strong>SADC</strong> countries. This will permit us to gauge the<br />
effect <strong>of</strong> <strong>SADC</strong> trade on economic development. <strong>The</strong> implied theoretical model is thus<br />
Y = f ( IVT,<br />
EDU,<br />
LAB,<br />
FD,<br />
<strong>SADC</strong>,<br />
NON<strong>SADC</strong>)<br />
(1)<br />
Y denotes the respective <strong>SADC</strong>members economy’s output (measured as the real Gross Domestic<br />
Products at constant price in US$), IVT is the level <strong>of</strong> investment in the country (measured as the<br />
investment ratio), EDU is the level <strong>of</strong> literacy <strong>and</strong> quality <strong>of</strong> labour (measured by the secondary<br />
enrolment ratio), LAB is the labour force (measured as the number <strong>of</strong> people in employment), FD is<br />
the level <strong>of</strong> financial development (measured by the ratio <strong>of</strong> liquid Assets to GDP), <strong>SADC</strong> is the<br />
amount <strong>of</strong> export to <strong>SADC</strong> member states <strong>and</strong> NON<strong>SADC</strong> is the amount <strong>of</strong> export to NON<strong>SADC</strong><br />
countries (both measured as a percentage <strong>of</strong> GDP). <strong>The</strong> data series for OUTPUT, IVT, FD were<br />
generated from the International Financial Statistic (IFS) various yearbooks, the secondary<br />
enrolment ratio from the World Development Report (various issues) <strong>and</strong> the two sets <strong>of</strong> data on<br />
exports have been constructed from World Trade Analyzer.<br />
ANALYSIS<br />
<strong>The</strong> Econometric Model <strong>and</strong> preliminary tests<br />
Recall equation 1 above <strong>and</strong> taking logs on both sides <strong>of</strong> the equation <strong>and</strong> denoting the lower<strong>case</strong><br />
variables as the natural log <strong>of</strong> the respective upper<strong>case</strong> variable results in the following:<br />
y ε<br />
it = β 0 + β1ivtit<br />
+ β 2eduit<br />
+ β3lit<br />
+ β 4 fdit<br />
+ β5sadcit<br />
+ β6nonsadcit<br />
+ it (2)<br />
where β0 is the constant term, β1 , β2 , β3, β4, β5 <strong>and</strong> β6 represent the elasticity <strong>of</strong> output relative to<br />
investment , education, labour, financial development, trade to <strong>SADC</strong> states <strong>and</strong> trade to<br />
NON<strong>SADC</strong> states. i denotes the respective countries in the sample <strong>and</strong> t the time period, that is<br />
1995-2008.
Analysis <strong>and</strong> Results<br />
Given the limitations <strong>of</strong> using a single-equation OLS cross sectional regression model <strong>and</strong> pooled<br />
OLS (see Kennedy, 2003) panel data techniques are used. In this section we employ both static <strong>and</strong><br />
dynamic (Generalised Methods <strong>of</strong> Moments) techniques to gauge the relationship between <strong>SADC</strong><br />
trade <strong>and</strong> economic performance. In fact, use <strong>of</strong> panel data allows not only to control for<br />
unobserved cross country heterogeneity but also to investigate dynamic relations.<br />
We use the Hausman test to test the use <strong>of</strong> a r<strong>and</strong>om or fixed effect estimator. <strong>The</strong> Hausman test<br />
tests the null hypothesis that the coefficients estimated by the efficient r<strong>and</strong>om effects estimator are<br />
the same as the ones estimated by the consistent fixed effects estimator. <strong>The</strong> specification test<br />
recommended the use <strong>of</strong> r<strong>and</strong>om effects model. <strong>The</strong> null hypothesis <strong>of</strong> homoskedasticity was<br />
rejected at 1% <strong>and</strong> the last column presents the P(h), the heteroskedastic consistent estimates the<br />
effects coefficients <strong>of</strong> the extended growth equation specified previously.<br />
It is shown that <strong>SADC</strong> trade, has had a positive contribution to economic growth <strong>of</strong> Member states,<br />
although to a much lesser extent as compared to non <strong>SADC</strong> trade. In fact the coefficient <strong>of</strong> 0.16, a<br />
measure <strong>of</strong> output elasticity, means that a one percent increase in <strong>SADC</strong> trade contributes to 0.16<br />
percent increase in the GDP <strong>of</strong> member states. It is noteworthy that non <strong>SADC</strong> trade is much more<br />
important than intra <strong>SADC</strong> trade for most members (mainly with EU <strong>and</strong> US). <strong>The</strong> main<br />
determinant <strong>of</strong> growth in <strong>SADC</strong> appear, as expected, investment with labour, education <strong>and</strong><br />
financial development being valuable contributors as well.<br />
Table: Panel Data estimates<br />
Dependent variable output = log OUTPUT<br />
Variable R<strong>and</strong>om Effect<br />
Constant<br />
ivt<br />
estimates<br />
0.21<br />
(1.95)*<br />
0.53
edu<br />
l<br />
fd<br />
sadc<br />
nonsadc<br />
R 2<br />
Hausman test<br />
(2.41)***<br />
0.22<br />
(2.23)**<br />
0.28<br />
(2.02)*<br />
0.14<br />
(2.01)*<br />
0.16<br />
(2.25)<br />
0.31<br />
(2.27)***<br />
0.4<br />
Prob>Chi2=0.321<br />
*significant at 10%, ** significant at 5%, ***significant at 1%<br />
<strong>The</strong> small letters denotes variables in natural logarithmic <strong>and</strong> t values are in parentheses<br />
Dynamic Panel Data Regression.<br />
To incorporate the dynamic nature <strong>of</strong> economic growth into our model, we rewrite econometric<br />
equation as an AR (1) model in the following.<br />
y µ<br />
it − yit−1<br />
= α t + νyit−1<br />
+ βxit<br />
+ it<br />
(3)
where yit = the log <strong>of</strong> real GDP; xit= the vector <strong>of</strong> explanatory variables, that is x = [ivt, edu, l,<br />
fd,sadc,nonsadc] <strong>and</strong> αt = the period specific intercept terms to capture changes common to all<br />
sectors; μit = the time variant idiosyncratic error term.<br />
Equivalently, above equation can be written as<br />
y α ( ν y + βx<br />
+ µ<br />
(4)<br />
it = t + + 1)<br />
it−1<br />
We can also write the above in first differences<br />
∆ it = t + + 1)<br />
∆ it−1<br />
it<br />
it<br />
it<br />
y α ( ν y + β∆x<br />
+ ∆µ<br />
(5)<br />
it<br />
A problem <strong>of</strong> endogeneity might exist if yt-1 is endogeneous to the error terms through uit-1, <strong>and</strong> it<br />
will therefore be inappropriate to estimate the above specification by OLS. To overcome this<br />
problem <strong>of</strong> endogeneity, an instrumental variable needs to be used for Δyit-1. Two approaches,<br />
namely Instrumental Variable (IV, Anderson <strong>and</strong> Hsiao 1982) <strong>and</strong> two GMM estimators (Arellano<br />
<strong>and</strong> Bond’s 1991), first <strong>and</strong> second step respectively, can be used in this regard. We used the latter<br />
technique, as the IV approach leads to consistent but not necessary efficient estimates <strong>of</strong> the<br />
parameters (see Baltagi 1995). Moreover, the first step GMM estimator will be used since it has been<br />
shown to result in more reliable inferences. <strong>The</strong> asymptotic st<strong>and</strong>ards errors from the two step<br />
GMM estimator have been found to have a downward bias (Blundell <strong>and</strong> Bond 1998).<br />
<strong>The</strong> results from estimating equation (5), extended with a lag term, using the Arellano-Bond (1991)<br />
first step GMM estimator are contained in table 4. <strong>The</strong> various estimated equations passes all<br />
diagnosis test related to Sargan Test <strong>of</strong> Over-identifying restrictions <strong>and</strong> the Arellano-Bond test <strong>of</strong><br />
1 st order <strong>and</strong> 2 nd autocorrelation. Note that it has also been argued that since panel data techniques<br />
are employed, the issue <strong>of</strong> non-stationarity <strong>of</strong> the variables is less serious (Garcia Mila, McGuire <strong>and</strong><br />
Porter, 1996).<br />
Table 4: Dynamic Panel Data Estimation (First Step GMM estimator)<br />
Dependent variable y= log <strong>of</strong> Y<br />
Variable GMM estimates<br />
Constant 0.005
Δser,<br />
yt-1<br />
Δivt<br />
Δempt<br />
Δfd<br />
Δxpsadc<br />
Δxpnonsadc<br />
Diagnosis tests<br />
Sargan Test <strong>of</strong><br />
Overidentifying restrictions<br />
Arellano-Bond test <strong>of</strong> 1 st<br />
order autocorrelation<br />
Arellano-Bond test <strong>of</strong> 2 nd<br />
order autocorrelation<br />
*significant at 10%, ** significant at 5%, ***significant at 1%<br />
(2.29)**<br />
0.21<br />
(3.22)***<br />
0.19<br />
(1.99)*<br />
(0.1)<br />
(1.86)*<br />
0 15<br />
(2.16)**<br />
0.11<br />
(2.10)**<br />
0.04<br />
(1.76)*<br />
0.12**<br />
(2.14)**<br />
prob>chi2=0.34<br />
prob>chi2=0.264<br />
prob>chi2= 0.76<br />
<strong>The</strong> results from the dynamic panel analysis validate the preliminary results in general. We should<br />
highlight that the coefficient <strong>of</strong> <strong>SADC</strong>, that is trade to <strong>SADC</strong> member states, is positive, although<br />
small, but significant, suggesting that it has impacted significantly on the economic growth <strong>of</strong> the<br />
block. This is in line with the statistics we showed above <strong>and</strong> highlighted that trade within <strong>SADC</strong> is<br />
relatively higher than other major African block. On the other h<strong>and</strong>, trade to <strong>SADC</strong> countries is
observed to have been very influential to the economic development <strong>of</strong> the countries in the sample<br />
as judged by its coefficient. Recall from the literature above that Europe is the main importer <strong>of</strong><br />
<strong>SADC</strong> products under the Cotonou agreement <strong>and</strong> Everything But Arms initiative. Investment,<br />
Education, Labour <strong>and</strong> Financial development report signs <strong>and</strong> magnitudes <strong>of</strong> elasticity as generally<br />
predicted by the literature.<br />
Interestingly the positive <strong>and</strong> significant coefficient <strong>of</strong> yt-1 from the table suggests that lagged income<br />
<strong>of</strong> the country contributes positively towards the current level <strong>of</strong> y confirming the existence <strong>of</strong><br />
dynamism <strong>and</strong> endogeineity in the modeling framework. This is consistent with recent works from<br />
Li <strong>and</strong> Liu (2005) <strong>and</strong> Seetanah (2007).<br />
Is <strong>SADC</strong> growth conducive for Mauritius?<br />
We also analyse is <strong>SADC</strong> as been economically beneficial to Mauritius for the period 1978-2010.<br />
Using the same model as previously described <strong>and</strong> augmented with an interactive dummy (<strong>SADC</strong><br />
trade <strong>and</strong> a dummy which takes the value <strong>of</strong> 0 before 1992 <strong>and</strong> 1 after the created on the <strong>SADC</strong><br />
block), we accounted for important feedback <strong>and</strong> endogeneity issues by adopting a VAR framework.<br />
However, before that we tested for the time series properties <strong>of</strong> our data series.<br />
<strong>The</strong> Augmented Dickey-Fuller (ADF) (1979) <strong>and</strong> Phillips-Perron (PP) (1988) unit-root tests reveals<br />
that our variables are all integrated <strong>of</strong> order 1 (I(1)) <strong>and</strong> are thus stationary in first difference.<br />
Analysis <strong>of</strong> cointegration among the six variables was then undertaken using the Johansen Maximum<br />
Likelihood procedure <strong>and</strong> is based on a VAR <strong>of</strong> order 2, suggested by the Schwarz Bayesian<br />
criterion (SBC). Both the Maximum Eigenvalue test <strong>and</strong> the Trace test reveal the presence <strong>of</strong> one<br />
cointegrating vector.<br />
<strong>The</strong> estimated cointegrating vector, normalised on output, <strong>and</strong> the estimated adjustment parameters<br />
are presented in Table below<br />
Table : Estimates <strong>of</strong> long run parameter<br />
Variables<br />
β t-ratios
y<br />
ivt 0.68*** 3.34<br />
ser 0.27** 2.25<br />
lab 0.31* 1.88<br />
fd<br />
1<br />
0.36*** 2.34<br />
sadc 0.103* 1.82<br />
nonsadc 0.456** 2.12<br />
Sadc * Dum 0.215* 1.84<br />
*significant at 10%, ** significant at 5%, ***significant at 1%<br />
From the table above, <strong>of</strong> interest to us are the three last variables. Indeed it can be shown, as<br />
witnessed by the significant interactive dummy, that being in <strong>SADC</strong> has been growth beneficial for<br />
the country. It is noteworthy that probably even prior to <strong>SADC</strong> trade to these countries in aggregate<br />
had favourable growth benefits although to quite low extent, but it this could have accelerate to<br />
slightly greater extent with the formation <strong>of</strong> the <strong>RTA</strong>. However, trade to Non <strong>SADC</strong> countries is<br />
observed to have a much the greater output elasticity, revealing its relative higher importance as<br />
compared to <strong>SADC</strong> trade. As confirmed by previous studies, investment is the major driver <strong>of</strong><br />
growth with education <strong>and</strong> financial development being important ingredients as well.<br />
SUMMARY<br />
<strong>The</strong> paper investigated the relationship between growth <strong>and</strong> openness for the <strong>SADC</strong> <strong>RTA</strong> for the<br />
period 1995-2008. R<strong>and</strong>om effect estimates shows that <strong>SADC</strong> trade has been growth inductive but<br />
relative less as compared to no <strong>SADC</strong> trade. <strong>The</strong> results are confirmed using GMM panel estimates<br />
which moreover suggested the presence <strong>of</strong> dynamic in the system. <strong>The</strong> relatively low contribution is<br />
in line with the statistics <strong>and</strong> highlighted that trade within <strong>SADC</strong> is still relatively low. Trade to
NON<strong>SADC</strong> countries is observed to have been very influential to the economic development <strong>of</strong> the<br />
countries in the sample. One should bear in mind that Europe is the main importer <strong>of</strong> <strong>SADC</strong><br />
products under the Cotonou agreement <strong>and</strong> Everything But Arms initiative. Investment, Education,<br />
Labour <strong>and</strong> Financial development report signs <strong>and</strong> magnitudes <strong>of</strong> elasticity as generally predicted<br />
by the literature. Interestingly it appears that lagged income <strong>of</strong> the country contributes positively<br />
towards the current level <strong>of</strong> output confirming the existence <strong>of</strong> dynamism <strong>and</strong> endogeineity in the<br />
modeling framework.<br />
<strong>The</strong> time series study pertaining to the <strong>case</strong> <strong>of</strong> Mauritius revealed that <strong>SADC</strong> trade had a relatively<br />
small output elasticity as compared to NON <strong>SADC</strong> trade confirming that trade to the other non<br />
<strong>SADC</strong> partners, especially EU, is more influential in explaining the Mauritian economic growth.<br />
REFERENCES:<br />
Anderson, T, W & Hsio, C., 1982. Formulation <strong>and</strong> Estimation <strong>of</strong> dynamic Models using Panel<br />
Data’, Journal <strong>of</strong> Econometrics, 18: 47-82<br />
Arrelano, M <strong>and</strong> Bond, S., 1991. Some Tests <strong>of</strong> Specification for panel data: Monte Carlo Evidence<br />
<strong>and</strong> an application to employment equations, Review <strong>of</strong> <strong>Economic</strong> Studies :58:277-297<br />
Baltagi, B H (1995), Econometric Analysis <strong>of</strong> Panel Data, New York:John Wiley<br />
Barro, R.J. <strong>and</strong> Lee, J.-W., 1993. ‘International comparisons <strong>of</strong> educational attainment’ Journal <strong>of</strong><br />
Monetary <strong>Economic</strong>s, 32, 363-394.<br />
Barro, R.J., 1991. ‘<strong>Economic</strong> growth in a cross-section <strong>of</strong> countries’. <strong>The</strong> Quarterly Journal <strong>of</strong><br />
<strong>Economic</strong>s, CVI, 2, 407-443.<br />
Benhabib, J. <strong>and</strong> Spiegel, M.M., 1994. ‘<strong>The</strong> role <strong>of</strong> human capital in economic development:<br />
evidence from aggregate cross-country data’. Journal <strong>of</strong> Monetary <strong>Economic</strong>s, 34, 143-173.<br />
Blundell <strong>and</strong> Bond., 1998. Initial conditions <strong>and</strong> Moments restrictions in dynamic panel data models,<br />
Journal <strong>of</strong> Econometrics 87:115-144<br />
Mankiw, N.G., Romer, D. <strong>and</strong> Weil, D.N., 1992, A contribution to the empirics <strong>of</strong> economic<br />
growth. <strong>The</strong> Quarterly Journal <strong>of</strong> <strong>Economic</strong>s, CVI, 2, 407-437.
Rojid S. (2007), “Impact <strong>of</strong> COMESA Forming a Custom Union – A CGE Analysis”- presented at<br />
the Centre for the Study <strong>of</strong> African Economies (CSEA) Conference 2007 on <strong>Economic</strong> Development<br />
in Africa, University <strong>of</strong> Oxford, March 2007<br />
Seetanah B <strong>and</strong> Khadaroo J (2008), ‘Transport <strong>and</strong> economic performance: <strong>The</strong> <strong>case</strong> <strong>of</strong> Mauritius’,<br />
forthcoming in Journal <strong>of</strong> Transport <strong>Economic</strong>s <strong>and</strong> Policy<br />
Table 3: TimeLine <strong>and</strong> Achievements <strong>of</strong> the Southern African Development Community<br />
(<strong>SADC</strong>)<br />
Agreement Type Member Countries Date <strong>of</strong><br />
Entry in<br />
Force<br />
<strong>SADC</strong> FTA Angola, Botswana, DRC, Lesotho,<br />
Malawi , Mauritius, Mozambique,<br />
Namibia, Seychelles , South Africa,<br />
Swazil<strong>and</strong>, Tanzania, Zambia ,<br />
Zimbabwe<br />
Year Type <strong>of</strong> Achievement<br />
Several Trade Agreements with Third Parties<br />
GDP Per<br />
Capita<br />
(US$)<br />
Total<br />
Population<br />
1980 3, 152 233, 944, 179<br />
2008 <strong>The</strong> EU is currently negotiating an economic <strong>partnership</strong> agreement (EPA)<br />
Free Trade Area<br />
2008 Implementation <strong>of</strong> a Free Trade Area<br />
Trade Liberalisation Process<br />
2003 -<strong>SADC</strong> Member States committed themselves to a Regional Indicative Strategic<br />
Development Plan (RISDP) among whose goals <strong>and</strong> target dates is the attainment <strong>of</strong>
Future Developments<br />
Productive Sectors<br />
a Customs Union by 2010 <strong>and</strong> subsequently a Common Market by 2012.<br />
-Trade Protocol entered into force in January 2000. <strong>The</strong> Protocol is in line with<br />
<strong>SADC</strong>’s overall integration policies <strong>and</strong> strategies which seek to eliminate obstacles to<br />
the free movement <strong>of</strong> goods, services, capital <strong>and</strong> labour <strong>and</strong> to improve the region’s<br />
economic performance <strong>and</strong> international competitiveness. <strong>The</strong> gradual elimination <strong>of</strong><br />
tariff <strong>and</strong> non-tariff barriers will make it easier for traders to market their goods across<br />
borders, for manufacturers to source inputs regionally <strong>and</strong> add value to their products,<br />
<strong>and</strong> it will widen options for consumers to buy locally produced goods that are<br />
competitive in terms <strong>of</strong> quality <strong>and</strong> pricing<br />
- Category <strong>of</strong> Goods: A - Immediate reduction <strong>of</strong> duty to zero upon gazetting <strong>of</strong> tariff<br />
schedules by Member States; <strong>and</strong> On average 47% <strong>of</strong> all goods traded under this<br />
regime by August 2001. B - Gradual tariff reduction over 8 years; <strong>and</strong> 85% expected<br />
to trade at zero tariff by 2008. C - Sensitive products mainly in areas <strong>of</strong> security,<br />
health <strong>and</strong> safety; Constitute 15%; <strong>and</strong> Tariffs expected to be eliminated by 2012<br />
- A policy framework for technical regulations on st<strong>and</strong>ards, which is being put in<br />
place, takes into account the implementation <strong>of</strong> the World Trade Organization<br />
(WTO) Agreement on Technical Barriers to Trade<br />
<strong>SADC</strong> is committed to develop closer economic cooperation between its Member<br />
States <strong>and</strong> this process is ongoing. <strong>The</strong> <strong>SADC</strong> objectives <strong>of</strong> a Free Trade Area by<br />
2008, Customs Union by 2010, Common Market by 2012, <strong>SADC</strong> Central Bank by<br />
2015, Monetary Union by 2016, <strong>and</strong> regional currency by 2018 - clearly all have an<br />
economic dimension.<br />
Mining – promotion <strong>of</strong> mining activities under <strong>SADC</strong>, investment <strong>and</strong> private sector<br />
participation
Table: <strong>SADC</strong> intra-regional exports(%share)<br />
Table : <strong>SADC</strong> intra-regional imports(%share)
Table: Value <strong>of</strong> top ten <strong>SADC</strong> exports for period 2000-2008(US $)<br />
Table: Value <strong>of</strong> top ten <strong>SADC</strong> exports for period 2000-2008 (US$ millions)
Table: Value <strong>of</strong> <strong>SADC</strong> imports for the period 2000-2008 (US$ millions)<br />
Table: Total value <strong>of</strong> <strong>SADC</strong> exports, 1980-2008 (US$ millions)
Source: UNCTAD 2009b<br />
Note: Countries included for each year are not clear<br />
Figure: Direction <strong>of</strong> <strong>SADC</strong> exports for period 1980-2008 (% by destination)
Source: UNCTAD 2009b<br />
Note: Countries included for each year are not clear<br />
Table: <strong>SADC</strong> ECONOMIC GROWTH RATE