wind tunnel investigation of the aerodynamic interactions - NASA
wind tunnel investigation of the aerodynamic interactions - NASA
wind tunnel investigation of the aerodynamic interactions - NASA

Create successful ePaper yourself
Turn your PDF publications into a flip-book with our unique Google optimized e-Paper software.
WIND TUNNEL INVESTIGATION OF THE AERODYNAMIC INTERACTIONS BETWEEN<br />
HELICOPTERS AND TILTROTORS IN A SHIPBOARD ENVIRONMENT<br />
Mark J. Silva<br />
Advanced Aerodynamics Branch<br />
NAVAIR Air Vehicle Department<br />
Patuxent River, MD<br />
mark.silva@navy.mil<br />
Alan J. Wadcock<br />
Aerospace Computing Inc.<br />
M<strong>of</strong>fett Field, CA<br />
awadcock@mail.arc.nasa.gov<br />
ABSTRACT<br />
Gloria K. Yamauchi<br />
Army/<strong>NASA</strong> Rotorcraft Division<br />
<strong>NASA</strong> Ames Research Center<br />
M<strong>of</strong>fett Field, CA<br />
Gloria.K.Yamauchi@nasa.gov<br />
Kurtis R. Long<br />
Rotary Wing Ship Suitability Branch<br />
NAVAIR Test & Evaluation Engineering Department<br />
Patuxent River, MD<br />
klong@mail.arc.nasa.gov<br />
The design and execution <strong>of</strong> a small-scale <strong>wind</strong> <strong>tunnel</strong> <strong>investigation</strong> <strong>of</strong> V-22 shipboard interactional <strong>aerodynamic</strong><br />
phenomena is described. The objectives <strong>of</strong> <strong>the</strong> <strong>investigation</strong> were to quantify <strong>the</strong> <strong>aerodynamic</strong> disturbances driving <strong>the</strong><br />
uncommanded roll response experienced by a ground turning V-22 on <strong>the</strong> deck <strong>of</strong> an amphibious ship during recovery<br />
operations <strong>of</strong> up<strong>wind</strong> rotorcraft. Over 100 hours <strong>of</strong> <strong>wind</strong>-on testing were conducted in <strong>the</strong> US Army 7x10 Wind Tunnel<br />
at <strong>NASA</strong> Ames Research Center, between October 2001 and April 2002. Major model hardware included <strong>the</strong><br />
fabrication <strong>of</strong> 1/48-scale representation <strong>of</strong> an LHA class ship, as well as 1/48-scale powered models <strong>of</strong> <strong>the</strong> on-deck V-22<br />
and three up<strong>wind</strong> aircraft representing a CH-46, a CH-53, and a second V-22. Principal measurements acquired include<br />
Particle Image Velocimetry measurements <strong>of</strong> <strong>the</strong> flow field and force and moment measurements <strong>of</strong> <strong>the</strong> on-deck V-22<br />
response. An overview <strong>of</strong> <strong>the</strong> test approach and execution and a general discussion <strong>of</strong> <strong>the</strong> results obtained are presented.<br />
NOTATION INTRODUCTION<br />
A rotor disk area, πR 2<br />
b V-22 rotor-rotor distance<br />
CT aircraft thrust coefficient, aircraft thrust/ρnAVtip 2<br />
n number <strong>of</strong> rotors<br />
Nr % nominal rotor rotational speed<br />
R rotor radius<br />
RM aircraft rolling moment, positive right wing<br />
down<br />
Spot landing spot designation on flightdeck<br />
vi hover induced velocity, Vtip CT<br />
/2<br />
Vtip blade tip speed, ΩR<br />
WHOD wheel-height-over-deck<br />
WOD relative <strong>wind</strong> over deck expressed as an azimuth<br />
(0 deg. down <strong>the</strong> bow) and magnitude in knots<br />
µ advance ratio, <strong>tunnel</strong> speed/Vtip<br />
Ω rotor rotational speed<br />
ρ air density<br />
Presented at <strong>the</strong> American Helicopter Society 4 th Decennial Specialist’s<br />
Conference on Aeromechanics, San Francisco, CA, January 21-23, 2004.<br />
Copyright ©2004 by <strong>the</strong> American Helicopter Society International, Inc.<br />
All rights reserved.<br />
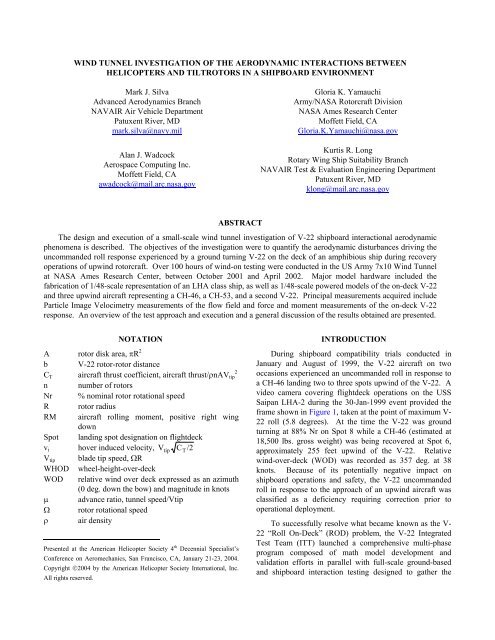
During shipboard compatibility trials conducted in<br />
January and August <strong>of</strong> 1999, <strong>the</strong> V-22 aircraft on two<br />
occasions experienced an uncommanded roll in response to<br />
a CH-46 landing two to three spots up<strong>wind</strong> <strong>of</strong> <strong>the</strong> V-22. A<br />
video camera covering flightdeck operations on <strong>the</strong> USS<br />
Saipan LHA-2 during <strong>the</strong> 30-Jan-1999 event provided <strong>the</strong><br />
frame shown in Figure 1, taken at <strong>the</strong> point <strong>of</strong> maximum V-<br />
22 roll (5.8 degrees). At <strong>the</strong> time <strong>the</strong> V-22 was ground<br />
turning at 88% Nr on Spot 8 while a CH-46 (estimated at<br />
18,500 lbs. gross weight) was being recovered at Spot 6,<br />
approximately 255 feet up<strong>wind</strong> <strong>of</strong> <strong>the</strong> V-22. Relative<br />
<strong>wind</strong>-over-deck (WOD) was recorded as 357 deg. at 38<br />
knots. Because <strong>of</strong> its potentially negative impact on<br />
shipboard operations and safety, <strong>the</strong> V-22 uncommanded<br />
roll in response to <strong>the</strong> approach <strong>of</strong> an up<strong>wind</strong> aircraft was<br />
classified as a deficiency requiring correction prior to<br />
operational deployment.<br />
To successfully resolve what became known as <strong>the</strong> V-<br />
22 “Roll On-Deck” (ROD) problem, <strong>the</strong> V-22 Integrated<br />
Test Team (ITT) launched a comprehensive multi-phase<br />
program composed <strong>of</strong> math model development and<br />
validation efforts in parallel with full-scale ground-based<br />
and shipboard interaction testing designed to ga<strong>the</strong>r <strong>the</strong>
engineering data in build-up fashion which ultimately led to<br />
<strong>the</strong> design, implementation, and demonstration <strong>of</strong> a fix. In<br />
August <strong>of</strong> 2001 (before <strong>the</strong> V-22 had returned to flight<br />
status), it was decided that a <strong>wind</strong> <strong>tunnel</strong> test, if performed<br />
in a timely manner, could provide valuable insights into <strong>the</strong><br />
<strong>aerodynamic</strong> interaction mechanisms involved and perhaps<br />
help identify <strong>the</strong> worst-case uncommanded roll scenarios<br />
before <strong>the</strong> V-22 returned to sea trials. This paper describes<br />
<strong>the</strong> resulting joint NAVAIR/Army/<strong>NASA</strong> <strong>wind</strong> <strong>tunnel</strong><br />
<strong>investigation</strong> <strong>of</strong> V-22 shipboard interactional <strong>aerodynamic</strong><br />
phenomena sponsored by <strong>the</strong> V-22 Program Office.<br />
Figure 1. “Roll On-deck” event aboard<br />
USS Saipan LHA-2, 30-Jan-99<br />
WIND TUNNEL TEST REQUIREMENTS<br />
The objectives <strong>of</strong> a <strong>wind</strong> <strong>tunnel</strong> <strong>investigation</strong> <strong>of</strong> V-22<br />
shipboard interactional <strong>aerodynamic</strong> phenomena were<br />
stated as follows:<br />
• Quantify <strong>the</strong> flow field disturbance generated by <strong>the</strong><br />
up<strong>wind</strong> rotorcraft and ship combined wake for various<br />
rotorcraft operating upstream <strong>of</strong> a V-22 on-deck <strong>of</strong> <strong>the</strong><br />
LHA for use in an analytical study <strong>of</strong> <strong>the</strong> aircraft<br />
dynamic response.<br />
• Identify critical combinations <strong>of</strong> up<strong>wind</strong> aircraft<br />
downwash, proximity, and WOD conditions based on<br />
measured thrust asymmetry and/or rolling moment<br />
response.<br />
The challenge <strong>of</strong> investigating V-22 ROD interactional<br />
<strong>aerodynamic</strong>s in a <strong>wind</strong> <strong>tunnel</strong> was to model <strong>the</strong><br />
contributors (ship, WOD, upstream aircraft, on-deck V-22)<br />
with sufficient fidelity to duplicate <strong>the</strong> governing flow field<br />
phenomena, i.e. rotor/wake <strong>interactions</strong> coupled with <strong>the</strong><br />
ship airwake environment. For a reasonable reproduction<br />
<strong>of</strong> <strong>the</strong> full-scale event, <strong>the</strong> principal similarity parameter<br />
that needed to be observed is <strong>the</strong> ratio <strong>of</strong> rotor-induced<br />
velocity to free stream velocity. This placed little<br />
constraint on model scale as long as <strong>the</strong> nondimensional<br />
thrust coefficient and advance ratio <strong>of</strong> <strong>the</strong> full-scale rotors<br />
were matched. Fidelity <strong>of</strong> <strong>the</strong> airframe representation was<br />
secondary at <strong>the</strong> low speeds being considered.<br />
Minimal model scale was driven more by <strong>the</strong><br />
packaging <strong>of</strong> instrumentation and rotor controls. At a<br />
minimum, a measurement <strong>of</strong> roll moment response <strong>of</strong> <strong>the</strong><br />
on-deck V-22 was required. Individual rotor thrust<br />
measurement was desired to resolve <strong>the</strong> thrust asymmetry.<br />
Although articulated rotors (to reduce hub moment<br />
contributions) were desired, variable collective pitch to set<br />
thrust at a given RPM was a requirement; cyclic pitch was<br />
secondary. Model installation requirements included <strong>the</strong><br />
ability to yaw <strong>the</strong> ship in <strong>the</strong> <strong>tunnel</strong> test section to simulate<br />
portside <strong>wind</strong>s (conditions that are likely to convey<br />
approaching aircraft wakes towards <strong>the</strong> “on-deck” V-22)<br />
and variable positioning <strong>of</strong> <strong>the</strong> up<strong>wind</strong> aircraft relative to<br />
<strong>the</strong> ship and on-deck V-22 with minimal flow interference.<br />
Control <strong>of</strong> up<strong>wind</strong> aircraft thrust and, in some cases,<br />
moment trim was also required. In addition to measuring<br />
<strong>the</strong> V-22 rolling moment response, <strong>the</strong> flow field<br />
disturbance itself needed to be quantified. Of particular<br />
interest is <strong>the</strong> vertical velocity field in <strong>the</strong> plane <strong>of</strong> <strong>the</strong> ondeck<br />
V-22 rotors.<br />
APPROACH<br />
Given <strong>the</strong> above requirements and <strong>the</strong> near-term need<br />
for data, <strong>the</strong> decision was made to conduct a 1/48 th -scale<br />
test in <strong>the</strong> Army 7 x 10 Foot Wind Tunnel at <strong>NASA</strong> Ames<br />
Research Center under <strong>the</strong> direction <strong>of</strong> <strong>the</strong> Army/<strong>NASA</strong><br />
Rotorcraft Division and NAVAIR. Designated as <strong>the</strong> V-<br />
22/Ship/<br />
Helicopter Aerodynamic Interaction Phenomena (VSHAIP)<br />
<strong>investigation</strong> [1], <strong>the</strong> test was a logical extension <strong>of</strong> <strong>the</strong><br />
tiltrotor aeromechanics work being conducted at Ames [2]<br />
and <strong>the</strong> ship airwake work being conducted at NAVAIR<br />
[3]. The effort leveraged heavily on <strong>NASA</strong> <strong>investigation</strong>s<br />
<strong>of</strong> Tiltrotor Descent Aerodynamics using low-cost, smallscale<br />
(1/40 th ) dual rotor models built from <strong>of</strong>f-<strong>the</strong>-shelf<br />
radio-control (RC) model components [4]. Conducting <strong>the</strong><br />
test at Ames also capitalized on <strong>the</strong> resident expertise in<br />
Particle Image Velocimetry (PIV) [5], an essential element<br />
for acquiring <strong>the</strong> up<strong>wind</strong> aircraft downwash velocity field.<br />
The primary driver for <strong>the</strong> model scale selection was<br />
<strong>the</strong> economy and efficiency <strong>of</strong> conducting <strong>the</strong> test in <strong>the</strong><br />
Army 7 x 10 Foot Wind Tunnel. The 1/48 th scale satisfied<br />
<strong>the</strong> model fidelity requirements while providing adequate<br />
real estate for essential instrumentation. A 1/48 th -scale<br />
LHA, at roughly 17 ft in length and 4 ft 2 in cross-section,<br />
was just about <strong>the</strong> largest size that could be tested in <strong>the</strong><br />
7x10 Foot Wind Tunnel without introducing significant<br />
blockage effects at yaw angles up to 15 degrees. In<br />
addition, <strong>the</strong> choice <strong>of</strong> 1/48 th -scale allowed <strong>the</strong> use <strong>of</strong>
commercially available plastic model rotorcraft kits for<br />
assembling airframe components.<br />
Tunnel and aircraft operating conditions were selected<br />
to match nondimensional parameters <strong>of</strong> rotor thrust<br />
coefficient and advance ratio <strong>of</strong> <strong>the</strong> full-scale ROD<br />
scenario. Rotor tip speed was limited to 33% <strong>of</strong> full-scale<br />
for each aircraft due to <strong>the</strong> performance <strong>of</strong> <strong>the</strong> electric<br />
motors powering each aircraft; <strong>the</strong>refore, <strong>tunnel</strong> speed was<br />
set to match 1/3 full-scale <strong>wind</strong> speeds. The airwake <strong>of</strong> <strong>the</strong><br />
isolated LHA is expected to be independent <strong>of</strong> Reynolds<br />
Number since <strong>the</strong> sharp leading edges <strong>of</strong> <strong>the</strong> ship fix <strong>the</strong><br />
location <strong>of</strong> flow separation. Hence, <strong>the</strong> interaction <strong>of</strong> <strong>the</strong><br />
ship wake and rotor wake at 1/48 th -scale was assumed an<br />
adequate simulation <strong>of</strong> full-scale events. For this test, yaw<br />
angles up to 15 deg (port-side <strong>wind</strong>s) and <strong>tunnel</strong> speeds up<br />
to approximately 33 ft/s were tested. No attempt was made<br />
to simulate <strong>the</strong> atmospheric boundary layer, primarily<br />
because <strong>of</strong> <strong>the</strong> difficulty in modeling <strong>the</strong> boundary layer for<br />
non-zero ship yaw angles.<br />
Figure 2 shows <strong>the</strong> installation <strong>of</strong> <strong>the</strong> LHA, on-deck V-<br />
22, and <strong>the</strong> CH-46 in <strong>the</strong> 7x10 Foot Wind Tunnel employed<br />
to investigate <strong>the</strong> V-22 ROD scenario. The ship is mounted<br />
to <strong>the</strong> <strong>tunnel</strong> turntable to facilitate testing at different<br />
relative <strong>wind</strong> azimuths. The V-22 model is mounted on <strong>the</strong><br />
ship in a position replicating that <strong>of</strong> an on-deck V-22<br />
spotted on ei<strong>the</strong>r deck Spot 7 or deck Spot 8. The up<strong>wind</strong><br />
aircraft is mounted on a sting extending from <strong>the</strong> <strong>tunnel</strong><br />
traverse mechanism to allow positioning <strong>of</strong> <strong>the</strong> model<br />
relative to <strong>the</strong> on-deck V-22 in three directions. No attempt<br />
was made to model a dynamically translating up<strong>wind</strong><br />
aircraft; instead, a quasi-steady approach was adopted,<br />
taking data with <strong>the</strong> up<strong>wind</strong> aircraft held at a number fixed<br />
positions along its trajectory. The test objectives were met<br />
by acquiring both PIV measurements <strong>of</strong> <strong>the</strong> flowfield and<br />
force and moment measurements <strong>of</strong> <strong>the</strong> on-deck V-22<br />
response over a wide range <strong>of</strong> up<strong>wind</strong> aircraft position and<br />
WOD conditions.<br />
Figure 2. VSHAIP installation in <strong>the</strong><br />
Army 7x10Foot Wind Tunnel at <strong>NASA</strong> Ames<br />
DESCRIPTION OF FACILITY, MODELS, AND<br />
MEASUREMENT SYSTEMS<br />
Facility<br />
The 7x10 Foot Wind Tunnel is a closed circuit <strong>wind</strong><br />
<strong>tunnel</strong> operated by <strong>the</strong> U.S. Army Aer<strong>of</strong>lightdynamics<br />
Directorate at <strong>NASA</strong> Ames Research Center. The constant<br />
cross-section test section measures 7-ft high by 10-ft wide<br />
by 15-ft long. The <strong>tunnel</strong> has a 14:1 contraction ratio and a<br />
maximum speed <strong>of</strong> approximately 355 ft/s. The test section<br />
turntable is capable <strong>of</strong> yaw angles up to 360 degrees. An<br />
air exchange system allows up to 29.3% air exchange.<br />
Since target speeds for this experiment ranged from 13 to<br />
26 ft/s, <strong>the</strong> <strong>tunnel</strong> was run with 0% air exchange to<br />
eliminate atmospheric influence on <strong>the</strong> test section flow<br />
steadiness. A traverse system, installed in <strong>the</strong> test section,<br />
is capable <strong>of</strong> traversing in <strong>the</strong> vertical, lateral, and<br />
streamwise directions.<br />
1/48 Scale Models<br />
Most <strong>of</strong> <strong>the</strong> model hardware for this test was designed<br />
and fabricated by <strong>NASA</strong> Ames. In order to minimize<br />
design and fabrication costs, some compromises were made<br />
on <strong>the</strong> ship and aircraft geometry, none <strong>of</strong> which were<br />
expected to affect <strong>the</strong> gross <strong>aerodynamic</strong>s <strong>of</strong> <strong>the</strong> ship or<br />
aircraft. A brief description <strong>of</strong> <strong>the</strong> ship and powered<br />
aircraft models follows. Details <strong>of</strong> model design, design<br />
trade-<strong>of</strong>fs, and construction are reported in [6].<br />
Ship Model<br />
The ship is a low fidelity, 1/48 th scale model <strong>of</strong> <strong>the</strong><br />
LHA-2 Saipan amphibious assault ship (Figure 3). At<br />
1/48 th -scale <strong>the</strong> LHA flight deck scales to roughly 200<br />
inches (16.7 ft) in length and 30 inches in width. The<br />
model replicates <strong>the</strong> above waterline portion <strong>of</strong> <strong>the</strong> LHA<br />
using <strong>the</strong> same low-fidelity level <strong>of</strong> detail as <strong>the</strong> LHA<br />
geometry used in recent CFD ship airwake studies for <strong>the</strong><br />
Joint Ship Helicopter Integration Process (JSHIP) Program<br />
[7].<br />
Figure 3. USS Saipan LHA-2
The ship is mounted internally to an aluminum rail that<br />
extends nearly <strong>the</strong> entire length <strong>of</strong> <strong>the</strong> ship. The rail is<br />
mounted to linear bearings that are welded to <strong>the</strong> <strong>tunnel</strong><br />
turntable. The linear bearings allow <strong>the</strong> ship to be<br />
translated longitudinally in <strong>the</strong> <strong>tunnel</strong> while <strong>the</strong> turntable<br />
provides <strong>the</strong> yaw degree <strong>of</strong> freedom. The LHA was<br />
installed <strong>of</strong>f-axis in <strong>the</strong> test section to favor modeling<br />
up<strong>wind</strong> aircraft approaches to landing spots on <strong>the</strong> port side<br />
<strong>of</strong> <strong>the</strong> ship for ship yaw angles <strong>of</strong> 0 to 15 deg. (portside<br />
<strong>wind</strong>s). Figure 4 shows <strong>the</strong> ship mounted in <strong>the</strong> <strong>wind</strong><br />
<strong>tunnel</strong> while Figure 5 shows <strong>the</strong> general dimensions <strong>of</strong> <strong>the</strong><br />
flightdeck along with <strong>the</strong> locations <strong>of</strong> <strong>the</strong> landing spots.<br />
Figure 4. 1/48-scale LHA installed in<br />
Army 7x10 Foot Wind Tunnel<br />
173.38<br />
135.88<br />
109.63<br />
83.38<br />
30.88<br />
57.13<br />
29.71<br />
Figure 5. 1/48-scale LHA flightdeck layout (in)<br />
2<br />
4<br />
5<br />
6<br />
7<br />
8<br />
Aircraft Models<br />
Figure 6 shows <strong>the</strong> four powered rotorcraft models<br />
fabricated for <strong>the</strong> test, representing 3 configurations <strong>of</strong><br />
rotorcraft: a V-22 tiltrotor, a CH-46 tandem-rotor<br />
helicopter, and a CH-53E single-main-rotor helicopter. The<br />
primary modeling parameters were rotor diameter, solidity,<br />
rotor-rotor position and relative tip speed. Pertinent<br />
properties <strong>of</strong> <strong>the</strong> scale model aircraft are tabulated in Table<br />
1.<br />
On-deck V-22<br />
CH-46<br />
CH-53E<br />
V-22<br />
Figure 6. 1/48-scale powered rotorcraft models
Table 1. Model Aircraft Properties<br />
V-22 CH-46 CH-53E<br />
No. <strong>of</strong> rotors 2 2 1<br />
No. blades per rotor 3 3 5<br />
Rotor radius (in) 4.687 6.311 10.220<br />
Target rotor RPM 6,355 4,224 2,831<br />
Target tip speed (ft/s) 260 233 252<br />
Target tip Reynolds No. 61,616 46,366 114,604<br />
Target thrust coefficient 0.0008 a 0.0048 0.0108<br />
Motor<br />
(rpm)<br />
design speed 12,313 4,224 11,324<br />
Gear ratio 1.9375 1.0 4.0<br />
Design<br />
(W)<br />
power, 125%<br />
251 69 304<br />
a on-deck V-22<br />
Figure 7 shows <strong>the</strong> major components <strong>of</strong> <strong>the</strong> tiltrotor<br />
model. Rotor dynamic components were built from<br />
commercially available radio-control (RC) model<br />
components where possible. All <strong>of</strong> <strong>the</strong> models used rigid<br />
hubs, and had collective control only, no cyclic. Any hub<br />
moments generated at <strong>the</strong> low advance ratios tested were<br />
negligible compared to <strong>the</strong> rotor wake <strong>interactions</strong>. The<br />
rotor blades were fabricated by a RC model propeller<br />
manufacturer. In <strong>the</strong> case <strong>of</strong> <strong>the</strong> CH-46 and CH-53E rotor<br />
blades, a special low Reynolds Number airfoil was<br />
employed to ensure adequate lift could be generated to<br />
meet up<strong>wind</strong> aircraft thrust targets. Custom compact and<br />
lightweight model drive systems were designed and built<br />
for each model configuration. Each aircraft used a single,<br />
high-power density RC model motor mounted within <strong>the</strong><br />
aircraft to power <strong>the</strong> rotors. The power available in a motor<br />
meeting <strong>the</strong> dimensional constraints led to <strong>the</strong> design trade<strong>of</strong>f<br />
<strong>of</strong> operating at 33% full-scale rotor tip-speed.<br />
R/C tail rotor<br />
transmission Motor<br />
1.63:1 helical<br />
transmission<br />
1/rev sensor<br />
Control<br />
linkage<br />
1.19:1 right-angle<br />
transmission<br />
Control servo ¾ inch Task balance<br />
Figure 7. Major components <strong>of</strong> tiltrotor model<br />
Measurement Systems<br />
Aircraft Force and Moment Measurement<br />
The up<strong>wind</strong> aircraft and <strong>the</strong> on-deck V-22 were each<br />
mounted on a 6-component (5 forces, 1 moment), 0.75-inch<br />
internal Task balance functioning as a total loads balance.<br />
Airframe contributions to normal force and rolling moment,<br />
<strong>the</strong> components <strong>of</strong> principal concern for trimming up<strong>wind</strong><br />
aircraft and quantifying <strong>the</strong> on-deck V-22 response, were<br />
assumed to be negligible compared to rotor contributions.<br />
The 1/48 th -scale precluded practical implementation <strong>of</strong><br />
individual rotor thrust measurement on <strong>the</strong> V-22 model.<br />
However, if one assumes that <strong>the</strong> rotors are <strong>the</strong> chief<br />
contributors to both normal force and rolling moment,<br />
individual left and right rotor thrust can be resolved from<br />
<strong>the</strong> total loads balance output.<br />
A LabView based data acquisition system was used to<br />
monitor and record output from both <strong>the</strong> on-deck and<br />
up<strong>wind</strong> aircraft balances. Dynamic force and moment data<br />
were recorded at 2048 samples per second over an 8 second<br />
<strong>wind</strong>ow for each test point. All results presented herein<br />
represent mean values.<br />
Particle Image Velocimetry<br />
Meeting <strong>the</strong> principal test objective <strong>of</strong> quantifying <strong>the</strong><br />
combined flow field disturbance generated by <strong>the</strong> up<strong>wind</strong><br />
rotorcraft and ship wakes for <strong>the</strong> matrix <strong>of</strong> scenarios <strong>of</strong><br />
interest was accomplished employing <strong>the</strong> Particle Image<br />
Velocimetry (PIV) technique. No o<strong>the</strong>r flow measurement<br />
technique has proven to be as efficient for acquiring<br />
concurrent 3-component velocity measurements over<br />
relatively large flowfields. In <strong>the</strong> present case, <strong>the</strong> area <strong>of</strong><br />
interest extended from <strong>the</strong> starboard edge <strong>of</strong> <strong>the</strong> LHA<br />
flightdeck to four V-22 wingspans <strong>of</strong>f <strong>the</strong> port deck edge in<br />
width (≈ 76 in) and from <strong>the</strong> flight deck level to a WHOD<br />
<strong>of</strong> 120 ft in height (≈ 30 in) to allow capture <strong>of</strong> <strong>the</strong> ship<br />
airwake features as well as <strong>the</strong> wake <strong>of</strong> <strong>the</strong> up<strong>wind</strong> aircraft<br />
on approach for landing.<br />
Figure 8 shows a schematic <strong>of</strong> <strong>the</strong> PIV setup employed<br />
for this test, with <strong>the</strong> laser and laser light sheet (LLS) optics<br />
located on <strong>the</strong> starboard side <strong>of</strong> <strong>the</strong> test section and <strong>the</strong><br />
cameras on <strong>the</strong> o<strong>the</strong>r. The size chosen for <strong>the</strong> PIV survey<br />
region was 6 ft wide by 3 ft high, centered in <strong>the</strong> test<br />
section. Since velocity data in a cross-flow plane were<br />
desired at different streamwise locations corresponding to<br />
portside landing spots on <strong>the</strong> LHA, <strong>the</strong> LHA was designed<br />
to translate longitudinally in <strong>the</strong> <strong>wind</strong> <strong>tunnel</strong> test section to<br />
minimize movement (and recalibration) <strong>of</strong> <strong>the</strong> PIV optics.<br />
Only two PIV set-ups were ultimately used for all four test<br />
phases: 1) an upstream set-up to acquire isolated ship<br />
airwake measurements at Landing Spots 2 and 4; and 2) a<br />
downstream set-up to acquire isolated ship airwake<br />
measurements at Landing Spots 7 and 8, isolated V-22
wake measurements, and combined ship/CH-46 wake<br />
measurements.<br />
Since <strong>the</strong> velocity field <strong>of</strong> interest is that which would<br />
be seen by <strong>the</strong> on-deck V-22, PIV measurements at a given<br />
deck spot were acquired in a cross-flow plane that would<br />
pass through <strong>the</strong> V-22 rotor axes, an <strong>of</strong>fset <strong>of</strong> 4.53 inches<br />
aft from <strong>the</strong> deck spot nose wheel reference point. For<br />
expedience, <strong>the</strong> PIV set-up was designed such that <strong>the</strong> LLS<br />
remained in <strong>the</strong> cross-flow plane. Consequently, when <strong>the</strong><br />
ship is yawed in <strong>the</strong> test section, <strong>the</strong> LLS is no longer<br />
perpendicular to <strong>the</strong> longitudinal axis <strong>of</strong> <strong>the</strong> ship. This<br />
trade-<strong>of</strong>f results in an oblique survey region as shown in<br />
Figure 9.<br />
For <strong>the</strong> present test a PIV acquisition rate <strong>of</strong> 2 Hz was<br />
employed. No attempt was made to synchronize <strong>the</strong> image<br />
acquisition with <strong>the</strong> rotor rotational speed since <strong>the</strong><br />
objective <strong>of</strong> <strong>the</strong> PIV measurements was <strong>the</strong> mean velocity<br />
field. PIV images presented herein represent an average <strong>of</strong><br />
50 to 100 individual frames. Additional details regarding<br />
<strong>the</strong> PIV setup and a presentation <strong>of</strong> select velocity fields are<br />
provided in [8].<br />
Sheet forming<br />
optics<br />
Laser<br />
Cameras<br />
Figure 8. PIV system setup<br />
Mirrors<br />
Laser sheet<br />
(a)<br />
(b)<br />
Figure 9. PIV survey plane orientation relative<br />
to ship at (a) 0° yaw and (b) 15° yaw<br />
TEST PLAN & EXECUTION<br />
The test was divided into four major phases as<br />
described in Table 2. The intent was to conduct <strong>the</strong> test in<br />
a logical build-up fashion in order to quantify <strong>the</strong><br />
individual, uncoupled contributions <strong>of</strong> each player before<br />
proceeding to <strong>the</strong> fully coupled ROD scenario. The actual<br />
sequence <strong>of</strong> execution was determined by <strong>the</strong> timetable <strong>of</strong><br />
model hardware delivery. Hence, Phase II was completed<br />
first, followed by a very abbreviated Phase I, and <strong>the</strong>n<br />
Phase III and IV.<br />
Defining <strong>the</strong> test conditions in terms <strong>of</strong> operational<br />
parameters made <strong>the</strong> test matrix tractable. WOD were<br />
limited to 20 to 45 knots full-scale at azimuths <strong>of</strong> 000 and<br />
345 degrees. Position <strong>of</strong> <strong>the</strong> on-deck V-22 was limited to<br />
Spots 7 and 8, <strong>the</strong> two aft portside spots currently<br />
designated for V-22 operations on <strong>the</strong> LHA. Likewise, <strong>the</strong><br />
myriad <strong>of</strong> possible positions <strong>of</strong> <strong>the</strong> up<strong>wind</strong> aircraft relative<br />
to <strong>the</strong> on-deck V-22 was delineated by mission<br />
representative approach parameters. Thus, as shown in<br />
Figure 10, longitudinal separation was defined by landing<br />
spot separation distances, aircraft height by mission<br />
representative wheel-height-over-deck (WHOD), and<br />
lateral <strong>of</strong>fset in terms <strong>of</strong> multiples <strong>of</strong> half <strong>the</strong> V-22 rotorcenter-to-rotor-center<br />
distance, b/2.
Table 2. Description <strong>of</strong> Major Test Phases<br />
Phase Configuration Objectives<br />
I. Isolated Up<strong>wind</strong> A/C<br />
(V-22, CH-46, CH-53E)<br />
PIV measurement<br />
velocity field at various<br />
rotor diameters<br />
down<strong>wind</strong> <strong>of</strong> A/C for<br />
various advance ratios<br />
and thrust levels<br />
II. LHA alone PIV measurement <strong>of</strong><br />
velocity field at portside<br />
deck spot for<br />
prescribed WOD<br />
conditions<br />
III. LHA + on-deck V-22<br />
+ up<strong>wind</strong> A/C<br />
IV. LHA + on-deck V-22<br />
+ up<strong>wind</strong> A/C<br />
y = y/b<br />
RESULTS<br />
Force and Moment data<br />
<strong>of</strong> on-deck V-22 for<br />
prescribed WOD and<br />
up<strong>wind</strong> A/C positions<br />
PIV measurements <strong>of</strong><br />
flowfield at V-22 deck<br />
spots 7 & 8 for critical<br />
WOD and up<strong>wind</strong> A/C<br />
position combinations<br />
identified in Phase III<br />
x = Spot<br />
z = WHOD<br />
Figure 10. Up<strong>wind</strong> A/C approach parameters<br />
The following sections describe <strong>the</strong> testing procedure<br />
and representative results for each test Phase in <strong>the</strong> order<br />
executed. For relevance sake, test conditions and results<br />
are <strong>of</strong>ten referred to in terms <strong>of</strong> <strong>the</strong>ir full-scale equivalent<br />
parameters. A more complete description <strong>of</strong> <strong>the</strong> test plan,<br />
facility, models, measurements, and results is found in [1].<br />
Phase II: Ship Alone<br />
This phase concentrated on characterizing and<br />
quantifying <strong>the</strong> ship airwake at each <strong>of</strong> <strong>the</strong> portside deck<br />
spots from which <strong>the</strong> V-22 might operate. PIV<br />
measurements were acquired at Spots 2, 4, 7, and 8<br />
(masking <strong>of</strong> <strong>the</strong> laser light sheet by <strong>the</strong> ship island<br />
b<br />
precluded Spots 5 and 6), at full-scale equivalent <strong>wind</strong>s <strong>of</strong><br />
10, 20, 30 and 40 knots at azimuths <strong>of</strong> 000, 355, 350, and<br />
345 degrees. Figure 11 shows <strong>the</strong> relative position <strong>of</strong> <strong>the</strong><br />
PIV cross-flow survey planes for ship airwake<br />
measurement. Figure 12 shows a composite <strong>of</strong> <strong>the</strong> PIV<br />
measurements taken at conditions simulating a WOD <strong>of</strong><br />
000 deg. at 40 knots.<br />
Figure 11. PIV survey planes for ship airwake<br />
Spot 2<br />
Spot 4<br />
Spot 7<br />
Spot 8<br />
Figure 12. PIV measurements <strong>of</strong> ship airwake<br />
for WOD 000° at 40 kts
Velocities in <strong>the</strong> freestream direction are represented<br />
by <strong>the</strong> color contours while in-plane velocities are shown as<br />
vectors (for clarity sake only 25% <strong>of</strong> <strong>the</strong> available vectors<br />
are shown). The reverse flow region in <strong>the</strong> wake <strong>of</strong> <strong>the</strong><br />
island is clearly evident at Spot 7. Deck edge vortices<br />
apparent at <strong>the</strong> forward Spots 2 and 4 appear to dissipate by<br />
<strong>the</strong> time <strong>the</strong>y reach Spots 7 and 8. Figure 13 shows <strong>the</strong><br />
same composite for WOD azimuth <strong>of</strong> 345 deg.<br />
Spot 2<br />
Spot 4<br />
Spot 7<br />
Spot 8<br />
Figure 13. PIV measurements <strong>of</strong> ship airwake<br />
for WOD 345° at 40 kts<br />
As can be seen, <strong>the</strong> character <strong>of</strong> <strong>the</strong> airwake changes<br />
considerably with 15 deg. <strong>of</strong> yaw. At 345 deg., a<br />
prominent vortical region emanating from <strong>the</strong> gun-port<br />
cutout region near <strong>the</strong> bow can be traced as it grows in<br />
cross-section all <strong>the</strong> way back to Spot 8. Also evident at<br />
Spots 7 and 8 is a strong upwash region along <strong>the</strong> port deck<br />
edge that has a significant influence on <strong>the</strong> ROD<br />
interaction. Figure 14 compares <strong>the</strong> scaled mean vertical<br />
velocity pr<strong>of</strong>iles at Spots 7 and 8 at a height above deck<br />
corresponding to <strong>the</strong> plane <strong>of</strong> <strong>the</strong> on-deck V-22 rotors.<br />
In addition to PIV, limited surface oil flow<br />
visualizations were obtained using a mixture <strong>of</strong> motor oil,<br />
olive oil, mineral spirits, and titanium dioxide. Figure 15<br />
shows <strong>the</strong> pattern established after running at<br />
approximately 36 ft/sec at 15 deg. yaw for 20 minutes. A<br />
stagnation line stretching from bow to stern appears to<br />
match <strong>the</strong> trajectory <strong>of</strong> <strong>the</strong> vortex seen in <strong>the</strong> PIV planes <strong>of</strong><br />
Figure 13.<br />
mean Vertical Velocity (ft/sec)<br />
30<br />
20<br />
10<br />
0<br />
-10<br />
-20<br />
-30<br />
Spot 7 000°<br />
Spot 7 345°<br />
Spot 8 000°<br />
Spot 8 345°<br />
-120 -80 -40 0 40 80 120<br />
Distance w.r.t Deck Centerline (ft)<br />
Figure 14. Scaled mean vertical velocity pr<strong>of</strong>iles<br />
at Spots 7 and 8, WOD 40 kts<br />
Figure 15. Surface oil flow visualization for WOD 345°
Phase I: Isolated V-22<br />
The intent <strong>of</strong> this phase was to characterize and<br />
quantify <strong>the</strong> wake <strong>of</strong> <strong>the</strong> up<strong>wind</strong> aircraft in isolation at<br />
down<strong>wind</strong> distances comparable to <strong>the</strong> scaled landing spot<br />
separation distances. Delays in <strong>the</strong> delivery <strong>of</strong> aircraft<br />
model hardware and <strong>the</strong> higher priority given to Phases III<br />
and IV combined to severely limit Phase I. A brief<br />
opportunity for acquiring PIV data behind an isolated V-22<br />
model presented itself at a time when <strong>the</strong> <strong>tunnel</strong> drive<br />
system was undergoing maintenance. Six large fans were<br />
placed in <strong>the</strong> diffuser <strong>of</strong> <strong>the</strong> <strong>tunnel</strong>, producing a maximum<br />
test section speed <strong>of</strong> 12 ft/sec (equivalent to approximately<br />
21 knots full-scale). At <strong>the</strong>se less than ideal conditions PIV<br />
measurements were made at three locations downstream<br />
from <strong>the</strong> V-22 operating at two different thrust coefficients.<br />
Figure 16 shows one such PIV image taken approximately<br />
2 rotor diameters downstream <strong>of</strong> <strong>the</strong> V-22 powered model<br />
operating at a CT <strong>of</strong> 0.0105 and an advance ratio <strong>of</strong> 0.044.<br />
The color contours represent <strong>the</strong> mean freestream velocity<br />
and <strong>the</strong> vectors represent <strong>the</strong> in-plane velocity components.<br />
Figure 16. PIV measurement <strong>of</strong> isolated V-22 wake<br />
Phase III: Ship + On-deck V-22 + Up<strong>wind</strong> CH-46/CH-<br />
53E<br />
The majority <strong>of</strong> <strong>the</strong> test concentrated on measuring <strong>the</strong><br />
on-deck V-22 response to a wide range <strong>of</strong> up<strong>wind</strong> CH-46<br />
positions. Only a limited amount <strong>of</strong> data was acquired with<br />
<strong>the</strong> CH-53E as <strong>the</strong> up<strong>wind</strong> aircraft, and no data with an<br />
up<strong>wind</strong> V-22 due to <strong>tunnel</strong> time constraints. Priority was<br />
given to using <strong>the</strong> CH-46 as <strong>the</strong> up<strong>wind</strong> aircraft since both<br />
documented ROD events during Developmental Testing <strong>of</strong><br />
<strong>the</strong> V-22 occurred while recovering a CH-46 to an up<strong>wind</strong><br />
spot. Figure 17 shows <strong>the</strong> test setup for replicating one<br />
such event with <strong>the</strong> on-deck V-22 positioned at Spot 7 and<br />
<strong>the</strong> up<strong>wind</strong> CH-46 above Spot 4.<br />
All Phase III testing followed <strong>the</strong> same general<br />
procedure: with <strong>wind</strong>-<strong>of</strong>f, <strong>the</strong> on-deck V-22 was set to an<br />
initial low thrust level (CT=0.0008) predicted for a ground<br />
turning V-22 under static conditions with its thrust control<br />
lever (TCL) at its aft stop. Differential collective pitch was<br />
introduced to trim out rolling moment to <strong>the</strong> extent allowed<br />
by <strong>the</strong> control system. With <strong>the</strong> up<strong>wind</strong> aircraft positioned<br />
“up and away” (<strong>the</strong> traverse extreme upper left limit,<br />
looking upstream) and rotors stationary, <strong>the</strong> <strong>tunnel</strong> was<br />
brought up to <strong>the</strong> desired speed without any adjustment to<br />
<strong>the</strong> on-deck V-22 trim. This state provided a <strong>wind</strong>-on<br />
reference condition for all subsequent interaction test<br />
points. The up<strong>wind</strong> aircraft was <strong>the</strong>n brought up to speed<br />
and trimmed to <strong>the</strong> desired thrust and traversed through a<br />
preprogrammed array <strong>of</strong> positions defined by scaled spot<br />
separation, lateral <strong>of</strong>fset, and WHOD. At each position, <strong>the</strong><br />
up<strong>wind</strong> aircraft was re-trimmed as necessary before taking<br />
data, while <strong>the</strong> on-deck V-22 was operated “hands-<strong>of</strong>f”.<br />
Using this procedure, <strong>the</strong> forces and moments <strong>of</strong> <strong>the</strong> ondeck<br />
tiltrotor were mapped as a function <strong>of</strong> up<strong>wind</strong> aircraft<br />
position.<br />
Figure 17. Phase III test set-up<br />
In all, force and moment data were acquired for more<br />
than two hundred combinations <strong>of</strong> WOD, on-deck V-22<br />
spot, and up<strong>wind</strong> CH-46 positions facilitating sensitivity<br />
studies <strong>of</strong> <strong>the</strong> effects <strong>of</strong> WOD speed, WOD azimuth,<br />
longitudinal separation, lateral <strong>of</strong>fset, and WHOD on <strong>the</strong><br />
on-deck V-22 roll response. Representative results are<br />
presented in terms <strong>of</strong> a "referred rolling moment"<br />
parameter, defined as follows:<br />
where:<br />
RM =<br />
( RM − RM )<br />
ref<br />
RM<br />
o<br />
⋅ 995328<br />
• RM ≡ measured rolling moment (ft-lbs, + right wing<br />
down)<br />
• RMref ≡ rolling moment measured at V-22 <strong>wind</strong>-on<br />
reference point (with up<strong>wind</strong> a/c positioned "up and<br />
away" and rotors stopped)<br />
• 995328 ≡ moment scaling factor ( = 483 · 32)<br />
• RMo ≡ <strong>the</strong> full-scale rolling moment estimated to be<br />
sufficient to cause a 43,000 lb V-22 to lift a main gear<br />
(6.2 deg. roll)<br />
Figure 18 shows <strong>the</strong> on-deck V-22 rolling moment<br />
response to up<strong>wind</strong> CH-46 position (longitudinal separation<br />
in terms <strong>of</strong> deck spots, lateral <strong>of</strong>fset in terms <strong>of</strong> V-22<br />
wingspans, constant full-scale WHOD <strong>of</strong> 20 ft) for a<br />
simulated full-scale WOD condition <strong>of</strong> 345 deg. at 35
1.0<br />
0.0<br />
-1.0<br />
1.0<br />
0.0<br />
-1.0<br />
1.0<br />
0.0<br />
-1.0<br />
3.0<br />
Spot 6<br />
1.0<br />
+ right<br />
RM<br />
0.0<br />
-left<br />
-1.0<br />
3.5<br />
Spot 5<br />
Spot 4<br />
2.5<br />
3.0<br />
2.0<br />
Spot 2<br />
3.5<br />
2.5<br />
1.5<br />
3.0<br />
2.0<br />
1.0<br />
2.5 2.0 1.5 1.0 0.5 0.0<br />
8<br />
2.5<br />
1.5<br />
0.5<br />
knots. Note that <strong>the</strong> locus <strong>of</strong> maximum left roll response,<br />
shown in both <strong>the</strong> schematic and <strong>the</strong> bar charts, lies on a<br />
direct <strong>wind</strong>ward line between <strong>the</strong> CH-46 and <strong>the</strong> on-deck<br />
V-22 left rotor.<br />
Figure 19 illustrates <strong>the</strong> impact <strong>of</strong> <strong>the</strong> ship airwake on<br />
<strong>the</strong> ROD interaction. Shown is <strong>the</strong> on-deck V-22 rolling<br />
moment response with WHOD <strong>of</strong> an up<strong>wind</strong> CH-46 for<br />
two distinct WOD conditions: 35 knots at 000 deg. and 345<br />
deg.. Both height sweeps were conducted with <strong>the</strong> CH-46<br />
at Spot 6 and a lateral <strong>of</strong>fset <strong>of</strong> 2b/2, <strong>the</strong> position<br />
corresponding to <strong>the</strong> maximum left roll interaction in<br />
Figure 18. The trend for <strong>wind</strong>s straight down <strong>the</strong> deck is<br />
<strong>the</strong> expected one, namely that rolling moment would<br />
increase with WHOD to a maximum, corresponding to <strong>the</strong><br />
height at which direct impingement <strong>of</strong> <strong>the</strong> CH-46 wake<br />
2.0<br />
1.0<br />
0.0<br />
1.5<br />
0.5<br />
1.0<br />
lateral <strong>of</strong>fset, y/b<br />
7<br />
6<br />
0.0<br />
0.5<br />
0.0<br />
Winds 345°<br />
Figure 18. V-22 rolling moment response to<br />
up<strong>wind</strong> CH-46 position, WOD 345° at 35 kts<br />
5<br />
4<br />
2<br />
occurs, <strong>the</strong>n decrease as fur<strong>the</strong>r increases in WHOD raise<br />
<strong>the</strong> wake <strong>of</strong> <strong>the</strong> CH-46 above <strong>the</strong> plane <strong>of</strong> <strong>the</strong> V-22 rotors.<br />
The trend for <strong>wind</strong>s 15 degrees to port is <strong>of</strong> a different<br />
character. Here, <strong>the</strong> interaction is strongest at low WHOD<br />
and decreases with increasing wheel height <strong>of</strong> <strong>the</strong> up<strong>wind</strong><br />
CH-46. This unexpected trend is indicative <strong>of</strong> <strong>the</strong><br />
significant role <strong>the</strong> ship airwake can play in ROD<br />
<strong>interactions</strong>, a role more clearly revealed by PIV<br />
measurements in Phase IV.<br />
RM<br />
RM<br />
RM<br />
-0.8<br />
-0.6<br />
-0.4<br />
-0.2<br />
0.0<br />
0.2<br />
0.0<br />
-0.2<br />
-0.4<br />
PIV<br />
PIV<br />
PIV<br />
WOD 000°<br />
WOD 345°<br />
0 20 40 60 80 100<br />
Full-scale WHOD (ft)<br />
Figure 19. V-22 rolling moment response<br />
vs. up<strong>wind</strong> CH-46 WHOD<br />
-0.6<br />
3.0<br />
-0.8<br />
-0.6<br />
-0.4<br />
-0.2<br />
0.0<br />
PIV<br />
PIV<br />
2.5<br />
PIV<br />
2.0<br />
1.5<br />
1.0<br />
Lateral Offset (y/b)<br />
CH-46<br />
CH-53<br />
0.5<br />
CH-53<br />
CH-46<br />
120<br />
0.0<br />
0 20 40 60 80 10<br />
0<br />
Full-scale WHOD (ft)<br />
Figure 20. V-22 rolling moment response vs.<br />
(a) lateral <strong>of</strong>fset and (b) WHOD <strong>of</strong> <strong>the</strong><br />
CH-53E and CH-46 aircraft
Limited interaction data were acquired for a full-scale<br />
WOD <strong>of</strong> 000 deg. at 35 knots with <strong>the</strong> CH-53E as up<strong>wind</strong><br />
aircraft and <strong>the</strong> on-deck V-22 at Spot 8. Figure 20<br />
compares <strong>the</strong> on-deck V-22 rolling moment response for<br />
lateral <strong>of</strong>fset and WHOD sweeps <strong>of</strong> <strong>the</strong> CH-53E and CH-<br />
46 up<strong>wind</strong> aircraft. As expected, <strong>the</strong> stronger downwash <strong>of</strong><br />
<strong>the</strong> heavier CH-53E results in a stronger interaction with<br />
<strong>the</strong> on-deck V-22. At a given <strong>wind</strong> speed, <strong>the</strong> wake <strong>of</strong> <strong>the</strong><br />
CH-53E is less skewed than that <strong>of</strong> <strong>the</strong> CH-46, thus <strong>the</strong><br />
maximum interaction occurs at a higher WHOD. Fur<strong>the</strong>r<br />
<strong>investigation</strong> <strong>of</strong> <strong>the</strong> <strong>interactions</strong> <strong>of</strong> <strong>the</strong> on-deck V-22 with<br />
an up<strong>wind</strong> CH-53E and V-22 aircraft was resumed in a<br />
second <strong>wind</strong> <strong>tunnel</strong> entry (concluded in November 2003);<br />
<strong>the</strong> results <strong>of</strong> which will be documented in a subsequent<br />
report.<br />
Phase IV: Ship + Up<strong>wind</strong> CH-46 with PIV<br />
The objective <strong>of</strong> this phase was to acquire<br />
complementary PIV measurements <strong>of</strong> <strong>the</strong> flow field at V-22<br />
designated deck Spots 7 and 8 for <strong>the</strong> sensitivity studies<br />
and <strong>the</strong> critical WOD and up<strong>wind</strong> A/C position<br />
combinations identified in Phase III. For <strong>the</strong> majority <strong>of</strong><br />
testing in this phase <strong>the</strong> on-deck V-22 was replaced (or left<br />
inoperative at a downstream spot) by <strong>the</strong> PIV light sheet in<br />
an attempt to quantify <strong>the</strong> flowfield disturbance “seen” by<br />
<strong>the</strong> V-22 rotors. Ancillary PIV measurements were made at<br />
one rotor diameter ahead <strong>of</strong> <strong>the</strong> operating on-deck V-22 to<br />
check <strong>the</strong> assumption <strong>of</strong> superposition, i.e. that little<br />
coupling exists between <strong>the</strong> wake <strong>of</strong> <strong>the</strong> V-22 rotors and<br />
<strong>the</strong> flowfield disturbance.<br />
To illustrate <strong>the</strong> insights provided by <strong>the</strong> PIV<br />
measurements, we return to <strong>the</strong> V-22 rolling moment vs.<br />
WHOD sensitivity study presented in Figure 19. Three<br />
points were selected from each WHOD sweep for fur<strong>the</strong>r<br />
<strong>investigation</strong> with PIV. Figure 21 presents a composite <strong>of</strong><br />
<strong>the</strong> PIV measurements acquired for WOD 000 deg. at 35<br />
knots. Each PIV image represents an average <strong>of</strong> 100<br />
realizations <strong>of</strong> <strong>the</strong> flow field looking upstream consistent<br />
with <strong>the</strong> image area shown in <strong>the</strong> top frame. As before,<br />
velocities in <strong>the</strong> freestream direction are mapped as color<br />
contours while <strong>the</strong> in-plane velocities are shown as vectors.<br />
Place keepers for <strong>the</strong> ship deck (black rectangle lower<br />
right), on-deck V-22 left and right rotors (red and green<br />
line, respectively), and CH-46 aft rotor (blue line) are<br />
included in each image.<br />
For <strong>the</strong> current scenario, <strong>the</strong> PIV plane is<br />
approximately 1.8 rotor diameters downstream <strong>of</strong> <strong>the</strong> CH-<br />
46 aft rotor center. At this distance, <strong>the</strong> individual tip<br />
vortices <strong>of</strong> <strong>the</strong> fore and aft rotors have rolled-up into two<br />
“super-vortices”, making <strong>the</strong> tandem helicopter wake<br />
resemble that <strong>of</strong> a fixed wing aircraft. Recall that <strong>the</strong><br />
WHOD sweep was performed at <strong>the</strong> lateral <strong>of</strong>fset resulting<br />
in a peak left rolling moment for <strong>the</strong> on-deck V-22. As<br />
WHOD 10 ft<br />
WHOD 25 ft<br />
WHOD 40 ft<br />
Figure 21. PIV measurements at Spot 7 with<br />
CH-46 at Spot 6 for WOD 000° at 35 knots<br />
shown in <strong>the</strong> PIV images, this lateral <strong>of</strong>fset results in <strong>the</strong><br />
on-deck V-22 left rotor being immersed in <strong>the</strong> downwash<br />
<strong>of</strong> <strong>the</strong> up<strong>wind</strong> aircraft while its right rotor is in <strong>the</strong> upwash<br />
field. The resulting thrust reduction on <strong>the</strong> left rotor and<br />
<strong>the</strong> thrust increase on <strong>the</strong> right rotor give rise to <strong>the</strong><br />
negative roll experienced by <strong>the</strong> on-deck V-22. The trend<br />
in rolling moment magnitude with increasing WHOD<br />
evident in Figure 19 is clearly explained by <strong>the</strong> PIV<br />
sequence. The peak rolling moment at a WHOD <strong>of</strong> 25 ft<br />
corresponds with a direct impingement <strong>of</strong> <strong>the</strong> up<strong>wind</strong>
WHOD 10ft<br />
WHOD 25ft<br />
WHOD 40ft<br />
Figure 22. PIV measurements at Spot 7 with<br />
CH-46 at Spot 6 for WOD 345° at 35 knots<br />
aircraft wake on <strong>the</strong> on-deck V-22 rotor disk plane. The<br />
lower rolling moment magnitudes at WHOD at 10 ft and 40<br />
ft result from <strong>the</strong> up<strong>wind</strong> aircraft wake passing below and<br />
above <strong>the</strong> V-22 rotor disk plane respectively.<br />
Figure 22 presents a similar composite <strong>of</strong> PIV<br />
measurements acquired for WOD 345 deg. at 35 knots.<br />
Here <strong>the</strong> influence <strong>of</strong> <strong>the</strong> upwash field generated under<br />
portside <strong>wind</strong> conditions is clearly evident. The effect <strong>of</strong><br />
<strong>the</strong> ship airwake is to lift <strong>the</strong> wake <strong>of</strong> <strong>the</strong> up<strong>wind</strong> aircraft<br />
into <strong>the</strong> plane <strong>of</strong> <strong>the</strong> on-deck V-22 rotors, thus accounting<br />
for <strong>the</strong> peak rolling moment occurring at a low WHOD.<br />
The PIV sequence shows that <strong>the</strong> up<strong>wind</strong> aircraft wake<br />
passes increasingly above <strong>the</strong> plane <strong>of</strong> <strong>the</strong> V-22 rotors with<br />
fur<strong>the</strong>r increases in WHOD.<br />
Apart from facilitating qualitative observations <strong>of</strong> <strong>the</strong><br />
flowfield, <strong>the</strong> PIV measurements quantify <strong>the</strong> flowfield<br />
disturbance. Figure 23 presents scaled downwash pr<strong>of</strong>iles<br />
extracted from <strong>the</strong> PIV data. These pr<strong>of</strong>iles have been<br />
superimposed as a non-uniform inflow in analytical models<br />
<strong>of</strong> <strong>the</strong> V-22 rotors for predicting <strong>the</strong> thrust asymmetry that<br />
would result on a full-scale on-deck V-22.<br />
mean Vertical Vel. (ft/sec)<br />
mean Vertical Vel. (ft/sec)<br />
60<br />
40<br />
20<br />
0<br />
-20<br />
-40<br />
-60<br />
60<br />
40<br />
20<br />
-20<br />
-40<br />
-60<br />
10 ft WHOD<br />
25 ft WHOD<br />
40 ft WHOD<br />
-140 -120 -100 -80 -60 -40 -20 0 20 40 60 80<br />
Distance from V-22 Left Rotor (ft)<br />
0<br />
10 ft WHOD<br />
25 ft WHOD<br />
40 ft WHOD<br />
(a)<br />
(b)<br />
-100 -80 -60 -40 -20 0 20 40 60 80 100 120<br />
Distance from V-22 Left Rotor (ft)<br />
Figure 23. Scaled mean downwash pr<strong>of</strong>iles<br />
extracted from PIV data for WOD <strong>of</strong> 35 kts<br />
at (a) 000° and (b) 345°<br />
The validity <strong>of</strong> <strong>the</strong> superposition assumption is<br />
supported by Figure 24 which presents <strong>the</strong> scaled mean<br />
downwash and outwash pr<strong>of</strong>iles extracted from PIV<br />
measurements one rotor diameter ahead <strong>of</strong> <strong>the</strong> on-deck V-<br />
22 rotors, with and without <strong>the</strong> V-22 rotors turning at 100%<br />
Nr. Comparing <strong>the</strong> pr<strong>of</strong>iles shows that, at <strong>the</strong> low thrust<br />
levels typical <strong>of</strong> a ground turning V-22, <strong>the</strong> on-deck V-<br />
22imparts very little influence on ei<strong>the</strong>r <strong>the</strong> isolated ship
Wmean (ft/sec)<br />
Height Above Deck (ft)<br />
40<br />
20<br />
0<br />
-20<br />
-40<br />
-60<br />
40<br />
30<br />
20<br />
10<br />
Ship Alone<br />
Ship + V-22<br />
Ship + CH-46<br />
Ship + V-22 + CH-46<br />
-120 -100 -80 -60 -40 -20 0 20 40 60<br />
Distance from V-22 Centerline (ft)<br />
0<br />
(a)<br />
(b)<br />
Ship Alone<br />
Ship + V-22<br />
Ship + CH-46<br />
0 20 40 60 80<br />
Umean (ft/sec)<br />
Ship + V-22 + CH-46<br />
35 kts freestream<br />
V-22 Right Rotor<br />
Figure 24. Scaled mean (a) downwash and (b) outwash<br />
pr<strong>of</strong>iles extracted from PIV measurements one rotor<br />
diameter ahead <strong>of</strong> <strong>the</strong> on-deck V-22 at Spot 8<br />
airwake (Ship + V-22 vs. Ship alone) or <strong>the</strong> combined ship<br />
airwake and up<strong>wind</strong> CH-46 wake (Ship + CH-46 + V-22<br />
vs. Ship + CH-46) flowfields.<br />
CONCLUDING REMARKS<br />
The V-22 “Roll On-Deck” scenario was <strong>the</strong> subject <strong>of</strong><br />
a small-scale <strong>wind</strong> <strong>tunnel</strong> <strong>investigation</strong>. The results <strong>of</strong> <strong>the</strong><br />
<strong>investigation</strong> have provided significant insights into <strong>the</strong> key<br />
interactional <strong>aerodynamic</strong> phenomena that drive <strong>the</strong> ondeck<br />
V-22 uncommanded roll response. The combination<br />
<strong>of</strong> airframe force and moment and detailed velocity field<br />
measurements has allowed <strong>the</strong> interaction to be<br />
characterized and quantified, and, most importantly, bound<br />
through <strong>the</strong> identification <strong>of</strong> critical scenarios.<br />
Small-scale <strong>wind</strong> <strong>tunnel</strong> testing continues to <strong>of</strong>fer an<br />
expedient and low-risk means <strong>of</strong> investigating full-scale<br />
aeromechanics phenomena. Results and observations from<br />
<strong>the</strong> present test are consistent with recorded full-scale<br />
events and have been used to guide <strong>the</strong> planning and reduce<br />
<strong>the</strong> risk <strong>of</strong> full-scale shipboard interactional testing <strong>of</strong> <strong>the</strong><br />
V-22.<br />
ACKNOWLEDGEMENTS<br />
The support from <strong>the</strong> test crew at <strong>the</strong> U. S. Army 7x10<br />
Foot Wind Tunnel and personnel from <strong>the</strong> <strong>NASA</strong> Ames<br />
Systems Analysis Branch is gratefully acknowledged. The<br />
contributions <strong>of</strong> Michael Derby (Aerospace Computing,<br />
Inc) and James T. Heineck (Systems Analysis Branch) were<br />
especially invaluable.<br />
REFERENCES<br />
1. Yamauchi, G. K., Wadcock, A. J., Derby, M. D. and<br />
Long, K. L., “Results from <strong>the</strong> V-22/Ship/Helicopter<br />
Aerodynamic Interaction Phenomena (VSHAIP) Wind<br />
Tunnel Test,” <strong>NASA</strong> Technical Memorandum to be<br />
published, 2004.<br />
2. Betzina, M. D., “Tiltrotor Descent Aerodynamics: A<br />
Small-Scale Experimental Investigation <strong>of</strong> Vortex Ring<br />
State,” American Helicopter Society 57th Annual<br />
Forum, Washington, D. C., May 2001.<br />
3. Polsky, S. and Bruner, C., “Time-Accurate<br />
Computational Simulations <strong>of</strong> an LHA Ship Airwake,”<br />
AIAA Paper 2000-4126, AIAA Applied Aerodynamics<br />
Conference, Colorado, Jan 2000.<br />
4. Abrego, A. I., Betzina, M. D., and Long, K. L., “A<br />
Small-Scale Tiltrotor Model Operating in Descending<br />
Flight,” 28th European Rotorcraft Forum, Bristol,<br />
United Kingdom, September 2002.<br />
5. Heineck, J. T., Yamauchi, G. K., Wadcock, A. J., and<br />
Lourenco, L., “Application <strong>of</strong> Three-Component PIV<br />
to a Hovering Rotor Wake,” American Helicopter<br />
Society 56 th Annual Forum, Virginia Beach, VA, May<br />
2000.<br />
6. Derby, M. D. and Yamauchi, G. K., “Design <strong>of</strong> 1/48 th -<br />
Scale Models for Ship/Rotorcraft Interaction Studies,”<br />
AIAA-2003-3952, 21st AIAA Applied Aerodynamics<br />
Conference, Orlando, FL, June 2003.<br />
7. Polsky, S., “Computational Study <strong>of</strong> Unsteady Ship<br />
Wake,” AIAA Paper 2002-1002, AIAA Aerospace<br />
Sciences Meeting, Reno, NV, Jan 2002.<br />
8. Wadcock, A. J., Yamauchi, G. K., Heineck, J. T.,<br />
Silva, M. J., and Long, K. L., “ PIV Measurements <strong>of</strong><br />
<strong>the</strong> Wake <strong>of</strong> a Tandem-Rotor Helicopter in Proximity<br />
to a Ship,” AHS 4 th Decennial Specialist’s Conference<br />
on Aeromechanics, San Francisco, CA, January 2004