Stanford 10 Longitudinal Data Analysis Tutorial.pdf - Alex
Stanford 10 Longitudinal Data Analysis Tutorial.pdf - Alex
Stanford 10 Longitudinal Data Analysis Tutorial.pdf - Alex

Create successful ePaper yourself
Turn your PDF publications into a flip-book with our unique Google optimized e-Paper software.
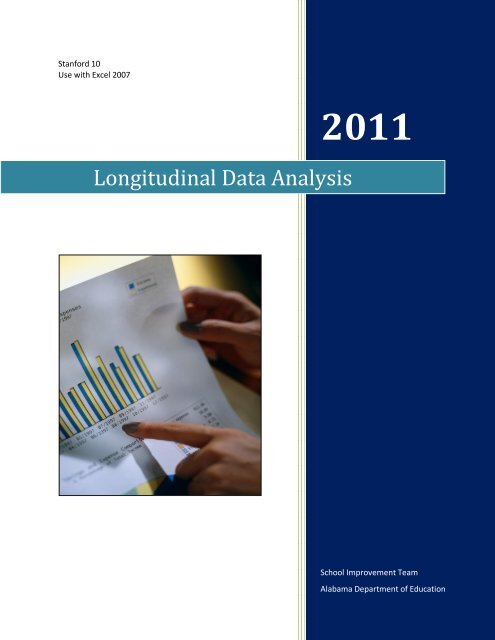
<strong>Stanford</strong> <strong>10</strong><br />
Use with Excel 2007<br />
<strong>Longitudinal</strong> <strong>Data</strong> <strong>Analysis</strong><br />
2011<br />
School Improvement Team<br />
Alabama Department of Education
Purpose:<br />
Why should we use longitudinal data?<br />
One year’s data cannot pinpoint trends. Many factors can cause variations in test scores if we look at<br />
only one year. When a pattern emerges from analysis of several years’ data---this points to curriculum<br />
and/or instruction issues which must be addressed.<br />
How many years of data should be included in a longitudinal data study?<br />
When we review data over a period of 3 to 5 years, we are looking for gaps in curriculum or instruction.<br />
This type of data analysis is valuable when identifying goals for continuous improvement.<br />
What are the benefits of longitudinal data analysis?<br />
Looking at the current year’s data gives a school only a snap-shot of student performance for that one<br />
test, one assessment, or one year’s data. One year’s data cannot pinpoint trends, instructional gaps, or<br />
curriculum and pacing issues. Many factors could be responsible for the variation in test scores.<br />
<strong>Longitudinal</strong> data gives a school data of how students are achieving over time.<br />
I. Materials Needed<br />
Laptop or computer<br />
<strong>Stanford</strong>-<strong>10</strong> 3+ Year <strong>Analysis</strong> Excel File<br />
o "<strong>Stanford</strong> <strong>10</strong> 3-5 Year <strong>Analysis</strong> stanines 1 - 3" file<br />
o “<strong>Stanford</strong> <strong>10</strong> 3-5 Year <strong>Analysis</strong> stanines 7 – 9” file<br />
<strong>Stanford</strong>-<strong>10</strong> Group Reports<br />
<strong>Stanford</strong>-<strong>10</strong> Graphing Instructions for computers using Excel ‘2007<br />
II. <strong>Stanford</strong>-<strong>10</strong> Graphing Instructions<br />
III. Utilizing the <strong>Data</strong> Charts
<strong>Longitudinal</strong> <strong>Data</strong> <strong>Analysis</strong><br />
<strong>Stanford</strong>-<strong>10</strong><br />
Graphing Instructions using Microsoft Excel ‘2007<br />
Reports Needed: “<strong>Stanford</strong>-<strong>10</strong> Group Reports”<br />
for the last 3 years for each<br />
grade level tested in your school.<br />
Step One: Inputting the <strong>Data</strong><br />
From the <strong>Stanford</strong>-<strong>10</strong> folder:<br />
Open the "<strong>Stanford</strong>-<strong>10</strong> 3+ Year <strong>Analysis</strong>" file. It will have an icon indicating<br />
that it is an EXCEL spreadsheet.<br />
o "<strong>Stanford</strong> <strong>10</strong> stanines 1 - 3" file<br />
Or<br />
o “<strong>Stanford</strong> <strong>10</strong> stanines 7 – 9” file<br />
If using the file " Stanines 1 - 3" enter each year's content cluster scores from the 1-3 column of<br />
"percent in each” Stanine range
If using the file " Stanines 7 - 9" enter each year's content cluster scores from the 7-9 column of<br />
"percent in each” Stanine range<br />
Each tab in the Excel Spreadsheet Workbook contains content cluster lists for grades 3-8.<br />
Graphs will be made from this grid.<br />
3rd grade<br />
Workbook<br />
Workbook Tabs<br />
8 th grade<br />
Workbook<br />
Using your “<strong>Stanford</strong>-<strong>10</strong> Group Report” for one grade at a time; enter the percent<br />
correct from the “below average” (Stanines 1-3) or “above average” (Stanines 7-9)<br />
column for each content cluster.<br />
6th grade<br />
Workbook
Step Two: Making the graphs in Microsoft Excel ’2007<br />
Highlight the EXACT area of each Content Cluster<br />
on the spreadsheet that contains any words or<br />
numbers starting in the A1 column on the left.<br />
Click on the "Insert” Tab on the toolbar<br />
at the top of your screen.<br />
Click on the “Column” Icon<br />
A “Chart Tools” tab will appear at the<br />
top of your screen.<br />
Choose the type graph you like best.<br />
o A small graph will appear<br />
on your screen.
Choose the Tab: “Lay Out”<br />
Click on "Chart Title"<br />
Choose “Above Chart”<br />
Type your chart name<br />
(Ex. “ Grade Level and Content Cluster”)<br />
Choose the Tab "Legend"<br />
Decide where you best like the<br />
legend to be placed.<br />
Choose the Tab "<strong>Data</strong> Labels"<br />
(decide if you like it with or without the numbers)<br />
Choose the Tab “Design”<br />
Decide which color scheme<br />
You like best.
In the Tab “Design”<br />
Click on “Switch Row/Column”<br />
Decide which format you like best<br />
Click on "Move Chart Location” (top right corner of the screen)<br />
A “Move Chart” box will appear on your screen.<br />
Click on "New Sheet" Type the name of your chart again.<br />
Click “OK/finish”<br />
Step Three: Viewing the final Graph<br />
Workbook Tabs<br />
Look back at your Excel Workbook Tabs at the bottom of the screen. You should now<br />
see the the title of your graph that you created.<br />
Click on the title
Do you see the graph that you created?<br />
Drawing the 23 rd percentile line<br />
Click on the Tab “Insert” and “Shapes”<br />
Choose the “Line” shape<br />
Place the cross on the left side of the graph border.<br />
Click and drag the line across all bars shown at approximately the 23 rd percentile mark.<br />
Options for a line color and to make a thicker line is in the “Shape Outline”<br />
What do the bars mean in a <strong>Stanford</strong> <strong>10</strong> graph of Stanines 1-3? Since the bars indicate the percent of<br />
students scoring in Stanines 1-3…bars at or below the 23% mark is good. Bars that are tall in this case<br />
(above the 23% mark) indicate that too many students are performing in the lower three stanines for a<br />
particular content cluster.<br />
What do the bars mean in a <strong>Stanford</strong> <strong>10</strong> graph of Stanines 7-9? Since the bars indicate the percent of<br />
students scoring in Stanines 7-9…bars at or above the 23% indicate good representation in those stanines<br />
in the testing population.
Utilizing the <strong>Data</strong> Charts<br />
What are some of the issues revealed through longitudinal data analysis?<br />
Academic progress from grade to grade.<br />
Effectiveness of school programs.<br />
Strengths and weaknesses in school programs (high performing areas and low-performing areas)<br />
Best practices that significantly impact student achievement.<br />
Effects of teacher preparation and professional development on student achievement.<br />
Curriculum or achievement gaps in the instructional program.<br />
<strong>Data</strong> is compiled and placed in Excel spread sheets by grade levels/standards. Graphs are made from<br />
the spreadsheets in order to provide teachers useful visual displays of strengths and weaknesses by<br />
content clusters on the <strong>Stanford</strong> <strong>10</strong>. <strong>Analysis</strong> questions are completed from the graphs in order to<br />
develop specific actions to address the hole(s).<br />
This represents a sample from the <strong>Stanford</strong> <strong>10</strong> 3-5 Year <strong>Longitudinal</strong> analysis using Excel.<br />
The <strong>Stanford</strong> <strong>10</strong> scores are reported in clusters. Each cluster represents a content area. <strong>Data</strong> can be<br />
compiled in stanines to assess improvement of specific sub-groups. This chart represents the bottom<br />
three stanines and represents students who have scored in stanines 1-3. The red bar represents the<br />
statistical limit for this data. On a standard Bell Curve, no more than 23% of students should be placing<br />
in the bottom 3 stanines. This data shows that a disproportionate number of students are scores in the<br />
bottom 3 stanines. This should raise the question as to why these students are not achieving and what<br />
steps need to be taken to move the students forward.
<strong>Longitudinal</strong> <strong>Data</strong> <strong>Analysis</strong> questions:<br />
These questions can be used to help study the graphs and to draw purposeful conclusions from the<br />
information represented in the data and graphs. NEXT STEPS ARE AN IMPORTANT PART OF THE<br />
LONGITUDINAL DATA ANALYSIS AND SHOULD NOT BE LEFT OUT OF THE PROCESS.<br />
<strong>Longitudinal</strong> <strong>Data</strong>: Guiding Questions:<br />
What do you notice?<br />
What are our “holes” in the curriculum?<br />
What time of year are these standards normally taught?<br />
What resources do you use when teaching these standards?<br />
Are you teaching the standards how they are tested? (Are you aligning instruction and practice with<br />
the Item Specifications?)<br />
From the identified strengths and weaknesses, next steps are created to address the weaknesses.<br />
Next Steps:<br />
Talk with your grade level and/or content cohorts about the following:<br />
o Instructional strategies focused on engaging students<br />
o Resources that align with the Item Specifications<br />
o Intervention for non-mastery students<br />
Develop a grade level and/or a department plan of action to improve student learning based on<br />
your longitudinal data analysis.<br />
o Pacing of standards<br />
o Resources<br />
o Method of instruction/strategies<br />
o Alignment to Item Specifications<br />
o Intervention<br />
o Other data (student/teacher attendance, discipline referrals, grade level/departmental<br />
planning, common assessments, etc.)
<strong>Longitudinal</strong> <strong>Data</strong> <strong>Analysis</strong> Questions<br />
What do you notice?<br />
What are our "holes" in the curriculum?<br />
What time of year are these standards normally taught?<br />
What resources do you use when teaching these standards?<br />
Are you teaching the standards how they are tested? (Are you<br />
aligning instruction and practice with the Item Specifications?)