relationships between flow fluctuations and redd dewatering and ...
relationships between flow fluctuations and redd dewatering and ...
relationships between flow fluctuations and redd dewatering and ...

Create successful ePaper yourself
Turn your PDF publications into a flip-book with our unique Google optimized e-Paper software.
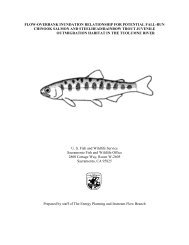
RELATIONSHIPS BETWEEN FLOW FLUCTUATIONS AND REDD DEWATERING<br />
AND JUVENILE STRANDING FOR CHINOOK SALMON<br />
AND STEELHEAD/RAINBOW TROUT IN THE YUBA RIVER<br />
U. S. Fish <strong>and</strong> Wildlife Service<br />
Sacramento Fish <strong>and</strong> Wildlife Office<br />
2800 Cottage Way, Room W-2605<br />
Sacramento, California 95825<br />
Prepared by staff of<br />
The Energy Planning <strong>and</strong> Instream Flow Branch
CVPIA INSTREAM FLOW INVESTIGATIONS<br />
YUBA RIVER CHINOOK SALMON AND STEELHEAD/RAINBOW TROUT<br />
REDD DEWATERING AND JUVENILE STRANDING<br />
PREFACE<br />
The following is the draft final report for the U. S. Fish <strong>and</strong> Wildlife Service’s investigations on<br />
the effects of <strong>flow</strong> <strong>fluctuations</strong> on anadromous salmonid <strong>redd</strong> <strong>dewatering</strong> <strong>and</strong> juvenile str<strong>and</strong>ing<br />
in the Yuba River <strong>between</strong> Englebright Dam <strong>and</strong> the Feather River. These investigations are part<br />
of the Central Valley Project Improvement Act (CVPIA) Instream Flow Investigations, a 6-year<br />
effort which began in October, 2001. 1 Title 34, Section 3406(b)(1)(B) of the CVPIA, P.L. 102-<br />
575, requires the Secretary of the Interior to determine instream <strong>flow</strong> needs for anadromous fish<br />
for all Central Valley Project controlled streams <strong>and</strong> rivers, based on recommendations of the<br />
U.S. Fish <strong>and</strong> Wildlife Service after consultation with the California Department of Fish <strong>and</strong><br />
Game. The purpose of these investigations is to provide scientific information to the U.S. Fish<br />
<strong>and</strong> Wildlife Service Central Valley Project Improvement Act Program to assist in developing<br />
such recommendations for Central Valley rivers.<br />
Written comments or information can be submitted to:<br />
Mark Gard, Senior Biologist<br />
Energy Planning <strong>and</strong> Instream Flow Branch<br />
U.S. Fish <strong>and</strong> Wildlife Service<br />
Sacramento Fish <strong>and</strong> Wildlife Office<br />
2800 Cottage Way, Room W-2605<br />
Sacramento, CA 95825<br />
Mark_Gard@fws.gov<br />
1 This program is a continuation of a 7-year effort, also titled the Central Valley Project<br />
Improvement Act Instream Flow Investigations, which ran from February 1995 through<br />
September 2001.<br />
USFWS, SFWO, Energy Planning <strong>and</strong> Instream Flow Branch<br />
Yuba River Redd Dewatering <strong>and</strong> Juvenile Str<strong>and</strong>ing Report<br />
September 15, 2010 ii
ACKNOWLEDGMENTS<br />
Field work for this study was conducted by Ed Ballard, Mark Gard, Rick Williams <strong>and</strong> Bill Pelle<br />
with assistance from Terry Adelsbach, Susan Hill, Jennifer Bain, Debbie Giglio, Jonathan Foster,<br />
Nick Hindman, Richard DeHaven <strong>and</strong> staff of the U.S. Bureau of Reclamation’s Surveys <strong>and</strong><br />
Mapping Branch. Data analysis <strong>and</strong> report preparation were performed by Mark Gard, Ed<br />
Ballard <strong>and</strong> Bill Pelle. Funding was provided by the Central Valley Project Improvement Act.<br />
ABSTRACT<br />
The effects of Yuba River <strong>flow</strong> <strong>fluctuations</strong> on Chinook salmon <strong>and</strong> steelhead/rainbow trout <strong>redd</strong><br />
<strong>dewatering</strong> <strong>and</strong> juvenile entrapment str<strong>and</strong>ing were quantified in this study as the percentage of<br />
spawning habitat dewatered <strong>and</strong> the area str<strong>and</strong>ed. The <strong>redd</strong> <strong>dewatering</strong> analysis used twodimensional<br />
hydraulic <strong>and</strong> habitat modeling of 10 spawning sites on the Yuba River <strong>between</strong><br />
Englebright Dam <strong>and</strong> the confluence with the Feather River, <strong>and</strong> <strong>redd</strong> <strong>dewatering</strong> criteria<br />
developed from measurements of Yuba River Chinook salmon <strong>and</strong> steelhead/rainbow trout<br />
<strong>redd</strong>s. The velocity <strong>and</strong> depth <strong>dewatering</strong> criteria were developed, respectively, from<br />
measurements of Yuba River Chinook salmon <strong>and</strong> steelhead/rainbow trout <strong>redd</strong> velocities, <strong>and</strong><br />
<strong>redd</strong> <strong>and</strong> tailspill depths. The juvenile entrapment str<strong>and</strong>ing analysis was developed from<br />
observed or modeled str<strong>and</strong>ing <strong>flow</strong>s <strong>and</strong> measured str<strong>and</strong>ing areas. Three approaches were<br />
taken to determine str<strong>and</strong>ing <strong>flow</strong>s for the 76 str<strong>and</strong>ing sites we identified on the Yuba River<br />
<strong>between</strong> Englebright Dam <strong>and</strong> the Feather River: 1) use of the two-dimensional hydraulic model<br />
of our spawning <strong>and</strong> juvenile habitat modeling sites; 2) observation of the <strong>flow</strong> present during<br />
our identification of the str<strong>and</strong>ing site; <strong>and</strong> 3) development of a stage-discharge relationship for<br />
the main river channel at the str<strong>and</strong>ing site. Spawning habitat was considered to be dewatered<br />
when depths fell below 0.5 foot (0.15 m) for Chinook salmon <strong>and</strong> 0.2 foot (0.06 m) for<br />
steelhead/rainbow trout, or when velocities fell below 0.29 ft/s (feet per second) [0.088 m/s],<br />
0.23 ft/s (0.070 m/s) <strong>and</strong> 0.09 ft/s (0.027 m/s) for, respectively, spring-run <strong>and</strong> fall-run Chinook<br />
salmon <strong>and</strong> steelhead/rainbow trout. Both <strong>redd</strong> <strong>dewatering</strong> <strong>and</strong> juvenile entrapment str<strong>and</strong>ing<br />
increased with greater drops in <strong>flow</strong>. However, substantial juvenile str<strong>and</strong>ing could be avoided<br />
by maintaining <strong>flow</strong>s downstream of Daguerre Point Dam either above or below 1,200 cfs (cubic<br />
feet per second), <strong>and</strong> maintaining <strong>flow</strong>s upstream of Daguerre Point Dam either: 1) above 3,700<br />
cfs; 2) <strong>between</strong> 2,300 <strong>and</strong> 3,700 cfs; or 3) below 2,300 cfs.<br />
USFWS, SFWO, Energy Planning <strong>and</strong> Instream Flow Branch<br />
Yuba River Redd Dewatering <strong>and</strong> Juvenile Str<strong>and</strong>ing Report<br />
September 15, 2010 iii
TABLE OF CONTENTS<br />
PREFACE......................................................................................................................................ii<br />
ACKNOWLEDGMENTS............................................................................................................iii<br />
ABSTRACT..................................................................................................................................iii<br />
TABLE OF CONTENTS.............................................................................................................iv<br />
LIST OF FIGURES......................................................................................................................vi<br />
LIST OF TABLES.......................................................................................................................vii<br />
INTRODUCTION.........................................................................................................................1<br />
METHODS.....................................................................................................................................3<br />
STUDY SITE SELECTION.............................................................................................3<br />
TRANSECT PLACEMENT (STUDY SITE SETUP)....................................................5<br />
HYDRAULIC AND STRUCTURAL DATA COLLECTION......................................6<br />
HYDRAULIC MODEL CONSTRUCTION AND CALIBRATION............................6<br />
HABITAT SUITABILITY CRITERIA (HSC) DEVELOPMENT...............................8<br />
HABITAT SIMULATION................................................................................................8<br />
RESULTS.......................................................................................................................................9<br />
STUDY SITE SELECTION.............................................................................................9<br />
TRANSECT PLACEMENT (STUDY SITE SETUP)....................................................9<br />
HYDRAULIC AND STRUCTURAL DATA COLLECTION......................................9<br />
HYDRAULIC MODEL CONSTRUCTION AND CALIBRATION..........................10<br />
HABITAT SUITABILITY CRITERIA (HSC) DEVELOPMENT.............................12<br />
HABITAT SIMULATION..........................................................................................................13<br />
USFWS, SFWO, Energy Planning <strong>and</strong> Instream Flow Branch<br />
Yuba River Redd Dewatering <strong>and</strong> Juvenile Str<strong>and</strong>ing Report<br />
September 15, 2010 iv
TABLE OF CONTENTS (CONTINUED)<br />
DISCUSSION...............................................................................................................................16<br />
HYDRAULIC MODEL CONSTRUCTION AND CALIBRATION..........................16<br />
HABITAT SUITABILITY CRITERIA (HSC) DEVELOPMENT.............................26<br />
HABITAT SIMULATION..............................................................................................26<br />
CONCLUSION............................................................................................................................27<br />
REFERENCES.............................................................................................................................27<br />
APPENDIX A STRANDING SITE LOCATIONS ................................................................30<br />
APPENDIX B PHABSIM WSEL CALIBRATION..............................................................33<br />
APPENDIX C JUVENILE STRANDING RESULTS..........................................................41<br />
APPENDIX D REDD DEWATERING RESULTS...............................................................46<br />
APPENDIX E ACRONYMS....................................................................................................59<br />
USFWS, SFWO, Energy Planning <strong>and</strong> Instream Flow Branch<br />
Yuba River Redd Dewatering <strong>and</strong> Juvenile Str<strong>and</strong>ing Report<br />
September 15, 2010 v
LIST OF FIGURES<br />
FIGURE 1 Yuba River stream segments <strong>and</strong> <strong>redd</strong> <strong>dewatering</strong> study sites..................................4<br />
FIGURE 2 Tailspill <strong>and</strong> <strong>redd</strong> depths for Yuba River spring-run Chinook salmon <strong>redd</strong>s..........14<br />
FIGURE 3 Tailspill <strong>and</strong> <strong>redd</strong> depths for Yuba River fall-run Chinook salmon <strong>redd</strong>s...............14<br />
FIGURE 4 Tailspill <strong>and</strong> <strong>redd</strong> depths for Yuba River steelhead/rainbow trout <strong>redd</strong>s.................15<br />
FIGURE 5 Juvenile anadromous salmonid str<strong>and</strong>ing upstream of Daguerre Point Dam……..17<br />
FIGURE 6 Juvenile anadromous salmonid str<strong>and</strong>ing downstream of Daguerre Point Dam…...18<br />
FIGURE 7 Fall-run Chinook <strong>redd</strong> <strong>dewatering</strong> upstream of Daguerre Point Dam.....................19<br />
FIGURE 8 Fall-run Chinook <strong>redd</strong> <strong>dewatering</strong> downstream of Daguerre Point Dam................20<br />
FIGURE 9 Spring-run Chinook <strong>redd</strong> <strong>dewatering</strong> upstream of Daguerre Point Dam……….....21<br />
FIGURE 10 Spring-run Chinook <strong>redd</strong> <strong>dewatering</strong> downstream of Daguerre Point Dam……..22<br />
FIGURE 11 Steelhead/rainbow trout <strong>redd</strong> <strong>dewatering</strong> upstream of Daguerre Point Dam.........23<br />
FIGURE 12 Steelhead/rainbow trout <strong>redd</strong> <strong>dewatering</strong> downstream of Daguerre Point Dam....24<br />
FIGURE 13 Yuba River <strong>flow</strong>s after data collection for this study..............................................28<br />
USFWS, SFWO, Energy Planning <strong>and</strong> Instream Flow Branch<br />
Yuba River Redd Dewatering <strong>and</strong> Juvenile Str<strong>and</strong>ing Report<br />
September 15, 2010 vi
LIST OF TABLES<br />
TABLE 1 Study tasks <strong>and</strong> associated objectives..........................................................................2<br />
TABLE 2 Spawning <strong>and</strong> incubation timing...............................................................................2<br />
TABLE 3 Flows for water’s edge polygons provided by Jones <strong>and</strong> Stokes.................................5<br />
TABLE 4 CFG file used for ADCP data.......................................................................................7<br />
TABLE 5 Gage measured calibration <strong>flow</strong>s for the str<strong>and</strong>ing study sites..................................11<br />
TABLE 6 Flow/<strong>flow</strong> regression equations..................................................................................11<br />
TABLE 7 Calibration <strong>flow</strong>s for str<strong>and</strong>ing study sites 19 <strong>and</strong> 36................................................12<br />
TABLE 8 Stage/discharge regression equations for sites where IFG4 was not used.................13<br />
TABLE 9 Redd <strong>dewatering</strong> HSC................................................................................................16<br />
TABLE 10 Examples of juvenile str<strong>and</strong>ing <strong>and</strong> <strong>redd</strong> <strong>dewatering</strong> results....................................25<br />
USFWS, SFWO, Energy Planning <strong>and</strong> Instream Flow Branch<br />
Yuba River Redd Dewatering <strong>and</strong> Juvenile Str<strong>and</strong>ing Report<br />
September 15, 2010 vii
USFWS, SFWO, Energy Planning <strong>and</strong> Instream Flow Branch<br />
Yuba River Redd Dewatering <strong>and</strong> Juvenile Str<strong>and</strong>ing Report<br />
September 15, 2010<br />
INTRODUCTION<br />
In response to substantial declines in anadromous fish populations, the Central Valley Project<br />
Improvement Act provided for enactment of all reasonable efforts to double sustainable natural<br />
production of anadromous fish stocks including the four races of Chinook salmon (fall, late-fall,<br />
winter, <strong>and</strong> spring runs), steelhead, white <strong>and</strong> green sturgeon, American shad <strong>and</strong> striped bass.<br />
The Yuba River is a major tributary of the Feather River, located in the Sacramento River basin<br />
portion of the Central Valley of California. The Lower Yuba River, <strong>between</strong> Englebright Dam<br />
<strong>and</strong> the Feather River confluence, is a major contributor to anadromous salmonid production in<br />
the Central Valley <strong>and</strong> supports the largest stock of Chinook salmon that is not supplemented by<br />
hatcheries. The focus of the Yuba River study was the Lower Yuba River, the only portion of<br />
the Yuba River accessible for spring <strong>and</strong> fall-run Chinook salmon <strong>and</strong> steelhead spawning <strong>and</strong><br />
juvenile rearing. For the Yuba River downstream of Englebright Dam, the Central Valley<br />
Project Improvement Act Anadromous Fish Restoration Plan calls for improved <strong>flow</strong>s for all life<br />
history stages of Chinook salmon <strong>and</strong> steelhead (U.S. Fish <strong>and</strong> Wildlife Service 1995) as a high<br />
priority action to restore anadromous fish populations in the Yuba River. Subsequently, Yuba<br />
County Water Agency, collaboratively with the National Marine Fisheries Service, the U.S.<br />
Fish <strong>and</strong> Wildlife Service, the California Department of Fish <strong>and</strong> Game <strong>and</strong> Non-<br />
Governmental Organizations, developed a comprehensive set of improved <strong>flow</strong> regimes,<br />
which now are the Flow Schedules of the Lower Yuba River Accord (HDR/SWRI 2007).<br />
In June 2001, the U.S. Fish <strong>and</strong> Wildlife Service prepared a study proposal to identify the<br />
instream <strong>flow</strong> requirements for anadromous fish in certain streams within the Central Valley of<br />
California, including the Yuba River. The Yuba River was selected for study because of a<br />
number of factors, including the presence of listed threatened or endangered species, the number<br />
of target species or races, whether current instream <strong>flow</strong>s were inadequate <strong>and</strong> if there was an<br />
upcoming hydroelectric project relicensing. The goal of this study is to model the effects of <strong>flow</strong><br />
<strong>fluctuations</strong> on Chinook salmon <strong>and</strong> steelhead/rainbow trout <strong>redd</strong> <strong>dewatering</strong> <strong>and</strong> juvenile<br />
entrapment str<strong>and</strong>ing in the Yuba River <strong>between</strong> Englebright Dam <strong>and</strong> the Feather River within,<br />
to the extent feasible, the levels of accuracy specified in the methods section. The tasks <strong>and</strong> their<br />
associated objectives are given in Table 1. Spawning <strong>and</strong> incubation timing is shown in Table 2.<br />
Str<strong>and</strong>ing can either occur on gently sloping river bars, or in potholes <strong>and</strong> backchannels that<br />
become isolated as water levels decrease (Bradford et al. 1995). The latter type of str<strong>and</strong>ing is<br />
commonly called fish isolation (California Department of Fish <strong>and</strong> Game 2001) or entrapment<br />
str<strong>and</strong>ing. Str<strong>and</strong>ing on gently sloping river bars is generally associated with rapidly varying<br />
<strong>flow</strong>s, such as downstream of hydropeaking operations, <strong>and</strong> is typically addressed by ramping<br />
rates (Cushman 1985, Hunter 1992). In contrast, this report focuses on entrapment str<strong>and</strong>ing <strong>and</strong><br />
the effects of <strong>flow</strong> <strong>fluctuations</strong> which are independent of any practicable ramping rate, <strong>and</strong> <strong>flow</strong><br />
variations with a temporal scale of one month. Thus, there is little potential for reconnecting<br />
entrapped areas before water temperatures or other habitat conditions, such as dessication or<br />
avian predation, result in juvenile mortality.<br />
1
Table 1. Study tasks <strong>and</strong> associated objectives.<br />
Task Objective<br />
study site selection identify locations where juvenile spring <strong>and</strong> fall-run Chinook<br />
salmon <strong>and</strong> steelhead/rainbow trout could become isolated from<br />
the main channel with drops in <strong>flow</strong><br />
transect placement (study site setup) delineate the location of the str<strong>and</strong>ing sites<br />
hydraulic <strong>and</strong> structural data<br />
collection<br />
hydraulic model construction <strong>and</strong><br />
calibration<br />
habitat suitability criteria<br />
development<br />
USFWS, SFWO, Energy Planning <strong>and</strong> Instream Flow Branch<br />
Yuba River Redd Dewatering <strong>and</strong> Juvenile Str<strong>and</strong>ing Report<br />
September 15, 2010<br />
collect the data necessary to develop stage-discharge<br />
<strong>relationships</strong> at the str<strong>and</strong>ing study sites <strong>and</strong> to measure the area<br />
of the str<strong>and</strong>ing sites<br />
develop stage-discharge <strong>relationships</strong> at the str<strong>and</strong>ing study sites<br />
determine the minimum depths <strong>and</strong> velocities below which<br />
spawning habitat would be lost with drops in <strong>flow</strong><br />
habitat simulation determine the str<strong>and</strong>ing area <strong>and</strong> percentage loss of spawning<br />
habitat associated with different drops in <strong>flow</strong><br />
Table 2. Spawning <strong>and</strong> incubation timing.<br />
Race/species Spawning timing Incubation timing<br />
Spring-run Chinook salmon September October-November<br />
Fall-run Chinook salmon October-December November-February<br />
Steelhead/rainbow trout February-June March-August<br />
The Effective Habitat Analysis (HABEF) program in the Physical Habitat Simulation<br />
(PHABSIM 2 ) component of the Instream Flow Incremental Methodology (IFIM) is capable of<br />
analyzing <strong>redd</strong> <strong>dewatering</strong> as a function of different drops in <strong>flow</strong> (Milhous et al. 1989). The<br />
HABEF program compares the conditions in a specific cell at alternative <strong>flow</strong>s, setting the WUA<br />
(weighted useable area) for the higher <strong>flow</strong> (spawning <strong>flow</strong>) to zero if the WUA for that cell at<br />
the lower <strong>flow</strong> (incubation <strong>flow</strong>) is zero. Binary criteria are used for the incubation <strong>flow</strong>, so that<br />
WUA equals zero if the depth or velocity falls below the criteria. In this study, we applied this<br />
concept to two-dimensional hydraulic <strong>and</strong> habitat modeling.<br />
The <strong>flow</strong>s to be evaluated for management range from 150 cubic feet per second (cfs)<br />
downstream of Daguerre Point Dam (the lowest <strong>flow</strong> in the Yuba River Accord) <strong>and</strong> 400 cfs<br />
upstream of Daguerre Point Dam (the current State Water Resources Control Board minimum<br />
<strong>flow</strong>) to 4,170 cfs (the combined capacity of Narrows I <strong>and</strong> II). Accordingly, the range of study<br />
<strong>flow</strong>s (400 to 4,500 cfs upstream Daguerre Point Dam <strong>and</strong> 150 to 4,500 cfs downstream of<br />
2 PHABSIM is the collection of one dimensional hydraulic <strong>and</strong> habitat models which are<br />
used to predict the relationship <strong>between</strong> physical habitat availability <strong>and</strong> stream<strong>flow</strong> over a range<br />
of river discharges.<br />
2
Daguerre Point Dam) encompasses the range of <strong>flow</strong>s to be evaluated for management. The<br />
assumptions of this study are: 1) juvenile salmon would be str<strong>and</strong>ed if the depth at the str<strong>and</strong>ing<br />
point (located at the connection point from the main channel to the entrapment area) is less than<br />
the minimum depth at which we found juvenile salmon during our juvenile habitat suitability<br />
data collection; 2) there would be reduced survival of eggs or pre-emergent fry, <strong>and</strong> thus<br />
spawning habitat would be lost, if the tailspill was exposed or if velocities dropped to the point<br />
where there was insufficient intragravel <strong>flow</strong> through the <strong>redd</strong>; <strong>and</strong> 3) there would be insufficient<br />
intragravel <strong>flow</strong> through the <strong>redd</strong> if the mean water column velocity at the <strong>redd</strong> <strong>dewatering</strong> <strong>flow</strong><br />
was less than the lowest velocity at which we found a fall-run <strong>and</strong> spring-run Chinook salmon<br />
<strong>and</strong> steelhead/rainbow trout <strong>redd</strong> in the Yuba River.<br />
USFWS, SFWO, Energy Planning <strong>and</strong> Instream Flow Branch<br />
Yuba River Redd Dewatering <strong>and</strong> Juvenile Str<strong>and</strong>ing Report<br />
September 15, 2010<br />
METHODS<br />
A two-dimensional model, River2D Version 0.93 November 11, 2006 by P. Steffler, A. Ghanem,<br />
J. Blackburn <strong>and</strong> Z. Yang (Steffler <strong>and</strong> Blackburn 2002), was used for the <strong>redd</strong> <strong>dewatering</strong><br />
portion of this modeling, instead of PHABSIM. River2D inputs include the bed topography <strong>and</strong><br />
bed roughness, <strong>and</strong> the water surface elevation at the downstream end of the site. The amount of<br />
habitat present in the site is computed using the depths <strong>and</strong> velocities predicted by River2D, <strong>and</strong><br />
the substrate <strong>and</strong> cover present in the site.<br />
Study Site Selection<br />
We divided the Yuba River study area into two stream segments (Figure 1), based on hydrology:<br />
Above Daguerre Point Dam <strong>and</strong> Below Daguerre Point Dam (U.S. Fish <strong>and</strong> Wildlife Service<br />
2010a). We conducted mesohabitat mapping of the Yuba River <strong>between</strong> Englebright Dam <strong>and</strong><br />
the Feather River. We designated 12 mesohabitat types: bar complex glides, bar complex pools,<br />
bar complex riffles, bar complex runs, flatwater glides, flatwater pools, flatwater riffles, flatwater<br />
runs, side channel glides, side channel pools, side channel riffles, <strong>and</strong> side channel runs (U.S.<br />
Fish <strong>and</strong> Wildlife Service 2010b). The mesohabitat units (MHUs) were used to reference the<br />
location of the str<strong>and</strong>ing sites (Appendix A). See U.S. Fish <strong>and</strong> Wildlife Service (2010b)<br />
Appendix A Habitat Mapping Data for the locations of the MHUs.<br />
The <strong>redd</strong> <strong>dewatering</strong> analysis was conducted using data from our 10 spawning sites (U.C. Sierra,<br />
Timbuctoo, Highway 20, Isl<strong>and</strong>, Hammond, Upper Daguerre, Lower Daguerre, Hallwood,<br />
Pyramids, <strong>and</strong> Plantz (Figure 1). Information on these sites is given in U.S. Fish <strong>and</strong> Wildlife<br />
Service (2010a).<br />
Potential str<strong>and</strong>ing areas were first identified in a Geographic Information System (GIS), using<br />
polygons of water’s edge data supplied by Jones <strong>and</strong> Stokes for the <strong>flow</strong>s in Table 3. We then<br />
surveyed both banks of the Yuba River from the Narrows (located 2.4 km downstream of<br />
Englebright Dam) to the confluence with the Feather River to evaluate these potential str<strong>and</strong>ing<br />
areas, <strong>and</strong> to identify additional locations where juvenile Chinook salmon could become trapped<br />
in inundated areas isolated from the main river channel when <strong>flow</strong>s drop. These field surveys<br />
3
Figure 1. Yuba River stream segments <strong>and</strong> <strong>redd</strong> <strong>dewatering</strong> sites.<br />
USFWS, SFWO, Energy Planning <strong>and</strong> Instream Flow Branch<br />
Yuba River Redd Dewatering <strong>and</strong> Juvenile Str<strong>and</strong>ing Report<br />
September 15, 2010<br />
4
Table 3. Flows for water’s edge polygons provided by Jones <strong>and</strong> Stokes.<br />
Flow (cfs) Above Daguerre Point Dam Flow (cfs) Below Daguerre Point Dam<br />
USFWS, SFWO, Energy Planning <strong>and</strong> Instream Flow Branch<br />
Yuba River Redd Dewatering <strong>and</strong> Juvenile Str<strong>and</strong>ing Report<br />
September 15, 2010<br />
718 473<br />
909 627<br />
1,218 947<br />
1,589 1,265<br />
2,015 1,642<br />
2,674 2,915<br />
4,307 4,564<br />
were conducted at medium-to-low <strong>flow</strong>s (943 to 2,054 cfs). The criteria that we used to identify<br />
str<strong>and</strong>ing areas were: 1) the area would not completely drain to the main river channel; <strong>and</strong> 2)<br />
the area would str<strong>and</strong> at river <strong>flow</strong>s ranging from 150 to 4,500 cfs.<br />
Transect Placement (study site set-up)<br />
Details on transect placement <strong>and</strong> study site set-up for the spawning sites are described in the<br />
spawning report (U.S. Fish <strong>and</strong> Wildlife Service 2010a). Details on transect placement <strong>and</strong><br />
study site set-up for the juvenile habitat modeling sites (used as discussed below for some of the<br />
str<strong>and</strong>ing sites) are described in the juvenile rearing report (U.S. Fish <strong>and</strong> Wildlife Service<br />
2010b).<br />
Three approaches were used to determine the str<strong>and</strong>ing <strong>flow</strong>s 3 for the str<strong>and</strong>ing sites: 1) for<br />
those str<strong>and</strong>ing sites located in one of our spawning or juvenile habitat modeling sites, the<br />
two-dimensional hydraulic model of that spawning or juvenile habitat site was used to determine<br />
the str<strong>and</strong>ing <strong>flow</strong> for the str<strong>and</strong>ing site; 2) for those str<strong>and</strong>ing sites where the <strong>flow</strong> during our<br />
identification of the str<strong>and</strong>ing site was at or slightly above or below the str<strong>and</strong>ing <strong>flow</strong> for that<br />
site, we determined the str<strong>and</strong>ing <strong>flow</strong> based on the <strong>flow</strong> on that date; <strong>and</strong> 3) for the remaining<br />
sites, we developed a stage-discharge relationship for the main river channel at the str<strong>and</strong>ing site<br />
to determine the str<strong>and</strong>ing <strong>flow</strong>. The first two categories of sites did not require any site setup or<br />
data collection, while the third category of site required the installation of a vertical benchmark<br />
(e.g., a lag bolt in a tree or stump; or a paint spot on a boulder, concrete, or bedrock point).<br />
3 We defined the str<strong>and</strong>ing <strong>flow</strong> as the <strong>flow</strong> where the connection <strong>between</strong> the str<strong>and</strong>ing<br />
area <strong>and</strong> main river channel has a maximum depth of 0.1 foot. We selected 0.1 foot because the<br />
minimum depth at which we found juvenile salmon <strong>and</strong> steelhead/rainbow trout during our<br />
juvenile HSI data collection was 0.2 foot. When <strong>flow</strong>s drop to or below the str<strong>and</strong>ing <strong>flow</strong>,<br />
juvenile salmon <strong>and</strong> steelhead/rainbow trout will be isolated from the main river channel.<br />
5
Hydraulic <strong>and</strong> Structural Data Collection<br />
Fieldwork was conducted <strong>between</strong> January 2005 <strong>and</strong> January 2007.<br />
Areas were determined for all of the str<strong>and</strong>ing sites. For smaller sites, we determined the area by<br />
measuring the length <strong>and</strong> two to six widths of the str<strong>and</strong>ing site, using an electronic distance<br />
meter; the area is calculated by multiplying the length times the average width. The areas of<br />
larger sites were computed in GIS from the water’s edge polygons supplied by Jones <strong>and</strong> Stokes<br />
or from polygons delineated from water’s edge output of the River2D modeling of our spawning<br />
<strong>and</strong> juvenile habitat modeling sites. As described above, vertical benchmarks were established at<br />
each of the str<strong>and</strong>ing sites for which we developed <strong>flow</strong>-habitat <strong>relationships</strong> to serve as the<br />
reference elevations to which all elevations (streambed <strong>and</strong> water surface) were tied.<br />
Data required for developing a stage discharge relationship are: 1) water surface elevations<br />
(WSELs, or stages), measured to the nearest 0.01 foot (0.0031 m) at three <strong>flow</strong>s using st<strong>and</strong>ard<br />
surveying techniques (i.e., differential leveling); <strong>and</strong> 2) the Stage of Zero Flow (SZF). We also<br />
measured the bed elevation of the str<strong>and</strong>ing point (the lowest point at the connection <strong>between</strong> the<br />
str<strong>and</strong>ing area <strong>and</strong> the main river channel) using differential leveling; the stage at the str<strong>and</strong>ing<br />
<strong>flow</strong> was calculated by adding 0.1 foot (0.03 m) to the bed elevation of the str<strong>and</strong>ing point.<br />
Once developed, the stage discharge relationship was used to determine the str<strong>and</strong>ing <strong>flow</strong>. For<br />
most of the sites, the SZF was determined by making a traverse 4 with a 600 kHz Broad-B<strong>and</strong><br />
Acoustic Doppler Current Profiler (ADCP) across the main channel at the str<strong>and</strong>ing point, based<br />
on the assumption that there was not a downstream hydraulic control. The ADCP settings used<br />
are shown in Table 4. Additional details on the ADCP operation are given in Gard <strong>and</strong> Ballard<br />
(2003). For a few sites on side channels where the entire channel could be waded, the SZF was<br />
determined by measuring depths across the side channel with a wading rod. In both cases, the<br />
SZF was calculated as the difference <strong>between</strong> the WSEL on that date <strong>and</strong> the largest depth.<br />
Flows for most sites were determined from gage data. For str<strong>and</strong>ing sites located on split<br />
channels, regressions <strong>between</strong> the split channel <strong>flow</strong> <strong>and</strong> the total Yuba River discharge were<br />
developed from <strong>flow</strong> measurements made when the WSELs were collected. Flows were<br />
measured by making depth <strong>and</strong> velocity measurements by wading with a wading rod equipped<br />
with a Marsh-McBirney R model 2000 or a Price AA velocity meter.<br />
Hydraulic Model Construction <strong>and</strong> Calibration<br />
See U.S Fish <strong>and</strong> Wildlife Service (2010a) <strong>and</strong> (2010b) for details on how the spawning <strong>and</strong><br />
juvenile site River2D models were constructed <strong>and</strong> calibrated.<br />
Flow-<strong>flow</strong> regressions were performed for sites located on split channels, using the <strong>flow</strong>s<br />
measured in the site, <strong>and</strong> the corresponding total <strong>flow</strong>s determined from gage readings. The site<br />
<strong>flow</strong>s used in the regression were the <strong>flow</strong>s measured with a wading rod <strong>and</strong> Price AA or Marsh-<br />
McBirney meter on the site.<br />
4 A traverse refers to a set of data collected each time the ADCP is driven across the channel.<br />
USFWS, SFWO, Energy Planning <strong>and</strong> Instream Flow Branch<br />
Yuba River Redd Dewatering <strong>and</strong> Juvenile Str<strong>and</strong>ing Report<br />
September 15, 2010<br />
6
Table 4. CFG File Used for ADCP Data. The first four characters of the ADCP<br />
traverses designates which CFG file (containing the ADCP settings) was used for the<br />
traverses. WT is the water track transmit length.<br />
CFG File Mode Depth Cell<br />
Size (m)<br />
Depth Cell<br />
Number<br />
USFWS, SFWO, Energy Planning <strong>and</strong> Instream Flow Branch<br />
Yuba River Redd Dewatering <strong>and</strong> Juvenile Str<strong>and</strong>ing Report<br />
September 15, 2010<br />
Max Bottom<br />
Track Depth (m)<br />
7<br />
Pings WT First Depth<br />
Cell (m)<br />
Blanking<br />
Dist. (m)<br />
MD4E 4 0.20 30 7.9 4 5 0.56 0.10<br />
American St<strong>and</strong>ard Code for Information Interchange (ASCII) files of each ADCP traverse were<br />
produced using the Playback feature of the Transect program 5 . Each ASCII file was then<br />
imported into RHABSIM Version 2.0 6 to produce the bed elevations, the component of the<br />
average water column velocity perpendicular to the transect, <strong>and</strong> stations (relative to the start of<br />
the ADCP traverse). RHABSIM was then used to output a second ASCII file containing this<br />
data. For the SZF measurements, the second ASCII file was input into an Excel spreadsheet<br />
where the maximum depth was subtracted from the measured WSEL to compute the SZF.<br />
For the str<strong>and</strong>ing sites for which we developed stage-discharge <strong>relationships</strong>, all stage-discharge<br />
data were compiled <strong>and</strong> checked before entry into PHABSIM data files. A total of two to four<br />
sets of WSELs at widely spaced <strong>flow</strong>s were used. Calibration <strong>flow</strong>s in the data files were either<br />
from gage readings, or the <strong>flow</strong>s calculated from gage reading/site <strong>flow</strong> regression equations. A<br />
separate file was constructed for each set of study sites with the same calibration <strong>flow</strong>s.<br />
The first step in the calibration procedure was to determine the best approach for WSEL<br />
simulation. Initially, the IFG4 hydraulic model (Milhous et al. 1989) was run on each file to<br />
compare predicted <strong>and</strong> measured WSELs. This model produces a stage-discharge relationship<br />
using a log-log linear rating curve calculated from at least three sets of measurements taken at<br />
different <strong>flow</strong>s. IFG4 is considered to have worked well if the following criteria are met: 1) the<br />
beta value (a measure of the change in channel roughness with changes in stream<strong>flow</strong>) is<br />
<strong>between</strong> 2.0 <strong>and</strong> 4.5; 2) the mean error in calculated versus given discharges is less than 10%;<br />
3) there is no more than a 25% difference for any calculated versus given discharge; <strong>and</strong> 4) there<br />
is no more than a 0.1 foot (0.031 m) difference <strong>between</strong> measured <strong>and</strong> simulated WSELs 7 .<br />
For sites where the initial IFG4 calibration indicated that there was a significantly non-linear loglog<br />
relationship <strong>between</strong> stage <strong>and</strong> <strong>flow</strong> over the range of calibration <strong>flow</strong>s, we applied a<br />
modification of IFG4 where we only used two calibration <strong>flow</strong>s. The calibration <strong>flow</strong>s selected<br />
5 The Transect program is the software used to receive, record <strong>and</strong> process data from the<br />
ADCP.<br />
6<br />
RHABSIM is a commercially produced software (Payne <strong>and</strong> Associates 1998) that<br />
incorporates the modeling procedures used in PHABSIM.<br />
7<br />
The first three criteria are from U.S. Fish <strong>and</strong> Wildlife Service (1994), while the fourth<br />
criterion is our own.
were those which bracketed the str<strong>and</strong>ing <strong>flow</strong>. Since only two <strong>flow</strong>s are used in this method,<br />
the mean error <strong>and</strong> calculated versus given discharge criteria of IFG4 do not apply <strong>and</strong> the<br />
difference <strong>between</strong> measured <strong>and</strong> predicted WSELs will always be zero.<br />
There were two categories of sites where we developed stage-discharge <strong>relationships</strong> using<br />
methods other than IFG4: 1) for sites located in the lower portion of the Yuba River where there<br />
are backwater effects from the Feather River, we developed a stage-discharge relationship using<br />
a multiple regression of log(WSEL - SZF) versus log(Yuba River <strong>flow</strong>) <strong>and</strong> log(Feather River<br />
<strong>flow</strong>); <strong>and</strong> 2) for sites where we only had two measurements of WSELs, we developed stagedischarge<br />
<strong>relationships</strong> using the WSELs measured at the site <strong>and</strong> the rating curve for the<br />
Marysville gage.<br />
Habitat Suitability Criteria (HSC) Development<br />
We assumed that there would be reduced survival of eggs or pre-emergent fry, <strong>and</strong> thus<br />
spawning habitat would be lost, if the tailspill was exposed or if velocities dropped to the point<br />
where there was insufficient intragravel <strong>flow</strong> through the <strong>redd</strong>. We took velocity, <strong>redd</strong> depth <strong>and</strong><br />
tailspill depth measurements for 168 spring-run Chinook salmon, 851 fall-run Chinook salmon<br />
<strong>and</strong> 106 steelhead/rainbow trout/rainbow trout <strong>redd</strong>s on the Yuba River. The velocity <strong>and</strong> <strong>redd</strong><br />
depth measurements were generally made slightly upstream of the <strong>redd</strong> (U.S. Fish <strong>and</strong> Wildlife<br />
Service 2010a), while the tailspill depth was measured at the highest point of the tailspill. We<br />
first tested whether there was a significant correlation <strong>between</strong> the Yuba River <strong>redd</strong> depths <strong>and</strong><br />
the difference <strong>between</strong> the <strong>redd</strong> <strong>and</strong> tailspill depth to determine how to develop the <strong>redd</strong><br />
<strong>dewatering</strong> criteria. We selected the following for the <strong>redd</strong> <strong>dewatering</strong> criteria: 1) the average<br />
difference <strong>between</strong> tailspill <strong>and</strong> <strong>redd</strong> depths for fall-run <strong>and</strong> spring-run Chinook salmon <strong>and</strong><br />
steelhead/rainbow trout <strong>redd</strong>s with <strong>redd</strong> depths less than 2 feet; <strong>and</strong> 2) the lowest velocity at<br />
which we found a fall-run <strong>and</strong> spring-run Chinook salmon <strong>and</strong> steelhead/rainbow trout <strong>redd</strong> in<br />
the Yuba River.<br />
Habitat Simulation<br />
We conducted an effective spawning analysis (analogous to HABEF) with River2D to determine<br />
the percentage loss of fall-run <strong>and</strong> spring-run Chinook salmon <strong>and</strong> steelhead/rainbow trout<br />
spawning habitat in the Yuba River <strong>between</strong> Englebright Dam <strong>and</strong> the Feather River associated<br />
with drops in <strong>flow</strong>. An effective spawning analysis examines, on a node-by-node basis, the<br />
depths <strong>and</strong> velocities at lower <strong>flow</strong>s. The weighted useable area represented by each node at a<br />
given <strong>flow</strong> is set to zero if the depth or velocity at a lower <strong>flow</strong> are less than the str<strong>and</strong>ing<br />
criteria. Alternatively, if the depth <strong>and</strong> velocity at the lower <strong>flow</strong> are both greater than the<br />
str<strong>and</strong>ing criteria, the weighted useable area represented by a given node is not changed. The<br />
resulting weighted useable areas represented by all the nodes are then summed to compute how<br />
much weighted useable area remains after the <strong>flow</strong> drops. The percentage loss in spawning<br />
habitat is then computed as:<br />
USFWS, SFWO, Energy Planning <strong>and</strong> Instream Flow Branch<br />
Yuba River Redd Dewatering <strong>and</strong> Juvenile Str<strong>and</strong>ing Report<br />
September 15, 2010<br />
8
Σ WUA higher <strong>flow</strong> - Σ WUA lower <strong>flow</strong><br />
Percentage loss spawning habitat = ------------------------------------------ x 100<br />
Σ WUA higher <strong>flow</strong><br />
We conducted the effective spawning habitat analysis by opening the spawning <strong>flow</strong> file for a<br />
given site in River2D, <strong>and</strong> producing an output file containing the spawning combined habitat<br />
suitability. This file of combined habitat suitabilities was then used as a channel index 8 file for<br />
the River2D files for the <strong>dewatering</strong> <strong>flow</strong>s for that site, along with the str<strong>and</strong>ing criteria, to<br />
compute the remaining spawning habitat.<br />
RESULTS<br />
Study Site Selection<br />
A total of 76 locations were found <strong>between</strong> the Narrows <strong>and</strong> the confluence with the Feather<br />
River which would potentially become isolated from the main channel at <strong>flow</strong>s ranging from 150<br />
to 4,500 cfs. Twenty-two of these str<strong>and</strong>ing sites were located in the following spawning (U.C.<br />
Sierra, Timbuctoo, Highway 20, Isl<strong>and</strong>, Lower Daguerre, Hallwood, Pyramids, <strong>and</strong> Plantz) <strong>and</strong><br />
juvenile rearing study sites (Narrows, Rose Bar, Side-Channel, <strong>and</strong> Whirlpool). Information on<br />
the spawning sites is given in U.S. Fish <strong>and</strong> Wildlife Service (2010a) <strong>and</strong> information on the<br />
juvenile rearing sites is given in U.S. Fish <strong>and</strong> Wildlife Service (2010b). Twenty-six of the<br />
str<strong>and</strong>ing sites were identified in January 2005. Forty of these sites were identified in February<br />
2005. The remaining sites were identified in March <strong>and</strong> May 2005. The locations of these sites,<br />
as designated by the mesohabitat unit (MHU) number, are identified in Appendix A. The MHUs<br />
were designated numerically, starting with MHU # 1 at the Feather River to MHU # 220 just<br />
downstream of Englebright Dam. See U.S. Fish <strong>and</strong> Wildlife Service (2010b) Appendix A<br />
Habitat Mapping Data for the locations of the MHUs.<br />
Transect Placement (study site setup)<br />
Of the 76 identified str<strong>and</strong>ing sites, 22 were located in our spawning <strong>and</strong> juvenile rearing habitat<br />
modeling sites, 5 sites had the <strong>flow</strong> during our identification of the str<strong>and</strong>ing site at or slightly<br />
above or below the str<strong>and</strong>ing <strong>flow</strong> for that site, <strong>and</strong> the remaining 49 sites had stage-discharge<br />
<strong>relationships</strong> that we developed.<br />
Hydraulic <strong>and</strong> Structural Data Collection<br />
The <strong>flow</strong>s used for str<strong>and</strong>ing sites 1-16 <strong>and</strong> 26-47 were the sum of the <strong>flow</strong>s from the Yuba<br />
River at Smartville (USGS gage # 11418000) <strong>and</strong> Deer Creek (USGS gage # 11418500) gages,<br />
while the <strong>flow</strong>s used for str<strong>and</strong>ing sites 17-25 <strong>and</strong> 54-68 were the <strong>flow</strong> from the Yuba River at<br />
Marysville (USGS gage # 11421000) gage. The <strong>flow</strong>s used for str<strong>and</strong>ing sites 48-53 were<br />
computed by subtracting the <strong>flow</strong> coming out of the Yuba Goldfields (see U.S. Fish <strong>and</strong> Wildlife<br />
Service 2010a) from the <strong>flow</strong> at the Marysville gage.<br />
8 Normally a channel index file contains substrate or cover data.<br />
USFWS, SFWO, Energy Planning <strong>and</strong> Instream Flow Branch<br />
Yuba River Redd Dewatering <strong>and</strong> Juvenile Str<strong>and</strong>ing Report<br />
September 15, 2010<br />
9
Water surface elevations were measured at the following four <strong>flow</strong> ranges for 26 of these 49<br />
str<strong>and</strong>ing sites: 943-1,001 cfs, 1,740-2,054 cfs, 2,509-3,154 cfs, <strong>and</strong> 3,674-5,771 cfs. Twentytwo<br />
of the 49 str<strong>and</strong>ing sites had WSELs measured at the following three <strong>flow</strong> ranges: 351-<br />
1,151 cfs, 1,686-2,517 cfs <strong>and</strong> 3,150-5,729 cfs. One of the sites (Site 65) had WSELs measured<br />
at the following two <strong>flow</strong>s: 1,151 cfs <strong>and</strong> 3,768 cfs. When we returned to this site on June 29,<br />
2005 to collect a third WSEL, the vertical benchmark for this site had been destroyed by high<br />
<strong>flow</strong>s in late May 2005.<br />
There were two of the 49 str<strong>and</strong>ing sites for which we developed stage-discharge <strong>relationships</strong><br />
that were located on split channels. For these two sites (Str<strong>and</strong>ing Sites 19 <strong>and</strong> 36), <strong>flow</strong>s were<br />
measured when the WSELs were collected, to enable the development of <strong>flow</strong>/<strong>flow</strong> regressions<br />
<strong>between</strong> the split channel <strong>flow</strong> <strong>and</strong> the total Yuba River discharge.<br />
Hydraulic Model Construction <strong>and</strong> Calibration<br />
The total <strong>flow</strong>s used to develop the <strong>flow</strong>-<strong>flow</strong> regressions for sites located on split channels <strong>and</strong><br />
to develop stage-discharge <strong>relationships</strong> for sites that included all of the Yuba River <strong>flow</strong> are<br />
given in Table 5. The <strong>flow</strong>-<strong>flow</strong> regressions were developed from three sets of <strong>flow</strong>s, with the<br />
entire river discharge at 971-1,151 cfs, 1,898-2,054 cfs <strong>and</strong> 3,150-3,768 cfs. The total discharge<br />
in Table 5 <strong>and</strong> the appropriate regression equation in Table 6 were used to compute the<br />
calibration <strong>flow</strong>s for Str<strong>and</strong>ing Sites 19 <strong>and</strong> 36 (Table 7).<br />
The SZF values used to develop the stage-discharge <strong>relationships</strong> are given in Appendix B. For<br />
a majority of the sites, IFG4 met the criteria for IFG4 identified in the methods (Appendix B).<br />
For str<strong>and</strong>ing sites 10, 11, 18, 19, 20, 32, 34 <strong>and</strong> 63A <strong>and</strong> B, the initial IFG4 calibration<br />
indicated that there was a significantly non-linear log-log relationship <strong>between</strong> stage <strong>and</strong> <strong>flow</strong><br />
over the range of calibration <strong>flow</strong>s. For these sites, we applied the modification of IFG4<br />
discussed in the methods of using only two calibration <strong>flow</strong>s. For str<strong>and</strong>ing sites 26, 29, 43, 44,<br />
<strong>and</strong> 50A/B/C, where we had measured WSELs at four <strong>flow</strong>s, we were unable to meet the criteria<br />
for IFG4 identified in the methods using all four <strong>flow</strong>s, but were able to meet the criteria for<br />
IFG4 identified in the methods using either the three lowest or three highest <strong>flow</strong>s (see Appendix<br />
B).<br />
There were three other sites (str<strong>and</strong>ing sites 65, 67 <strong>and</strong> 68) for which we developed stagedischarge<br />
<strong>relationships</strong> using methods other than IFG4. The location where we measured<br />
WSELs for Str<strong>and</strong>ing site 65 was 188 feet downstream of the Marysville gage (located at<br />
39.1760°N, 121.5240°W). For both of the measured WSELs, the height of the Marysville gage<br />
at those <strong>flow</strong>s, from the Marysville gage rating table, was exactly 33.68 feet lower than the<br />
measured WSEL 9 . We then determined the str<strong>and</strong>ing <strong>flow</strong> by subtracting 33.68 from the<br />
str<strong>and</strong>ing WSEL (96.2 feet), <strong>and</strong> looked up in the Marysville gage rating table what <strong>flow</strong> (907<br />
cfs) corresponded to the above computed value (62.52 feet).<br />
9 The difference in elevations <strong>between</strong> the measured WSELs <strong>and</strong> the gage height is because the<br />
measured WSELs were referenced to a vertical benchmark with an assigned local elevation of<br />
100.00 feet, while the gage height is referenced to mean sea level.<br />
USFWS, SFWO, Energy Planning <strong>and</strong> Instream Flow Branch<br />
Yuba River Redd Dewatering <strong>and</strong> Juvenile Str<strong>and</strong>ing Report<br />
September 15, 2010<br />
10
Table 5. Total Yuba River <strong>flow</strong>s (cfs) at str<strong>and</strong>ing study sites used to develop stagedischarge<br />
<strong>relationships</strong> or <strong>flow</strong>/<strong>flow</strong> regressions. These <strong>flow</strong>s are the same as the<br />
str<strong>and</strong>ing study site <strong>flow</strong>s only for those str<strong>and</strong>ing sites that include all of the Yuba River<br />
<strong>flow</strong> (i.e., all sites except Str<strong>and</strong>ing Sites 19 <strong>and</strong> 36, see Table 6).<br />
USFWS, SFWO, Energy Planning <strong>and</strong> Instream Flow Branch<br />
Yuba River Redd Dewatering <strong>and</strong> Juvenile Str<strong>and</strong>ing Report<br />
September 15, 2010<br />
11<br />
Str<strong>and</strong>ing Sites<br />
Date 1-16 <strong>and</strong> 26-47 48-54 17-25 <strong>and</strong> 55-68<br />
1/24/2005 1,021<br />
1/25/2005 1,018<br />
1/27/2005 991<br />
2/22/2005 2,054<br />
2/23/2005 1,930<br />
2/24/2005 1,740 1,813<br />
2/25/2005 1,151<br />
3/7/2005 1,052<br />
3/8/2005 971<br />
3/9/2005 965 943 1,001<br />
5/2/2005 3,154<br />
5/3/2005 3,150<br />
5/4/2005 2,509 2,517<br />
5/16/2005 3,768<br />
5/17/2005 4,180 3,674 3,720<br />
5/18/2007 10:00 AM 5,559<br />
5/18/2007 10:15 AM 5,651<br />
5/18/2007 10:30 AM 5,683<br />
5/18/2007 10:45 AM 5,653<br />
5/18/2007 11:00 AM 5,574<br />
5/18/2007 11:15 AM 5,727<br />
5/18/2007 11:30 AM 5,729<br />
5/18/2007 12:00 PM 5,786<br />
5/18/2007 12:15 PM 5,769<br />
5/18/2007 12:30 PM 5,771<br />
6/22/2005 1,898<br />
6/29/2005 1,686<br />
10/5/2005 391<br />
Table 6. Flow/<strong>flow</strong> regression equations. Q is the total river <strong>flow</strong>, Site 19 Q is the <strong>flow</strong><br />
in Str<strong>and</strong>ing Site 19, etc.<br />
Str<strong>and</strong>ing Study Site Regression Equation R 2 -value<br />
19 log (Site 19 Q) = 0.4626 + 0.6026 x log (Q – 1145) 0.9999<br />
36 log (Site 36 Q) = 0.4609 + 0.7007 x log (Q – 132) 0.9968
Table 7. Calibration <strong>flow</strong>s for str<strong>and</strong>ing study sites 19 <strong>and</strong> 36 (cfs). These were<br />
computed from the total Yuba River <strong>flow</strong>s in Table 5 <strong>and</strong> the regression equations in<br />
Table 6.<br />
USFWS, SFWO, Energy Planning <strong>and</strong> Instream Flow Branch<br />
Yuba River Redd Dewatering <strong>and</strong> Juvenile Str<strong>and</strong>ing Report<br />
September 15, 2010<br />
Date Site 19 Site 36<br />
2/22/2005 578<br />
2/25/2005 8.5<br />
3/8/2005 323<br />
5/3/2005 793<br />
5/16/2005 333<br />
5/18/2005 10:30 AM 1,215<br />
6/22/2005 157<br />
Str<strong>and</strong>ing sites 67 <strong>and</strong> 68 were located within the backwater effect of the Feather River.<br />
Accordingly, we used the multiple regression equation in the methods section with Yuba River<br />
<strong>flow</strong>s from the Marysville gage <strong>and</strong> Feather River <strong>flow</strong>s from the Feather River near Gridley<br />
gage (USGS gage # 11407150) (Table 8). To predict the str<strong>and</strong>ing <strong>flow</strong>, we used these multiple<br />
regression equations with the str<strong>and</strong>ing WSEL <strong>and</strong> the average Feather River <strong>flow</strong> (4,910 cfs) for<br />
the period January 1, 1993 10 to April 18, 2006.<br />
We compared stage-discharge <strong>relationships</strong> for each site modeled with IFG4 to the criteria<br />
described in the methods. The calculated-given discharge criterion was met for all of these sites.<br />
The mean error criterion was met in all cases except for str<strong>and</strong>ing site 45. The measuredsimulated<br />
WSEL difference criterion for IFG4 was met in all cases except for str<strong>and</strong>ing site 2.<br />
As shown in Appendix B, the beta coefficients were less than 2.0 for str<strong>and</strong>ing sites 18, 19, 38,<br />
55A/B, 58 <strong>and</strong> 61, <strong>and</strong> were greater than 4.5 for str<strong>and</strong>ing sites 2, 26 <strong>and</strong> 29.<br />
The str<strong>and</strong>ing <strong>flow</strong>s <strong>and</strong> areas for the 76 str<strong>and</strong>ing sites are given in Appendix A. The stagedischarge<br />
<strong>relationships</strong> or River2D models for eight of the str<strong>and</strong>ing sites located upstream of<br />
Daguerre Point Dam resulted in a str<strong>and</strong>ing <strong>flow</strong> of less than 400 cfs. These eight sites were<br />
dropped from consideration, since we are identifying areas upstream of Daguerre Point Dam that<br />
str<strong>and</strong> at <strong>flow</strong>s <strong>between</strong> 400 <strong>and</strong> 4,500 cfs.<br />
Habitat Suitability Criteria (HSC) Development<br />
There was a significant positive correlation <strong>between</strong> the depth of the <strong>redd</strong>s <strong>and</strong> the difference<br />
<strong>between</strong> the <strong>redd</strong> depth <strong>and</strong> tailspill depth for spring-run Chinook salmon (R 2 = 0.06, p =<br />
0.0015), fall-run Chinook salmon (R 2 = 0.74, p < 0.0001) <strong>and</strong> steelhead/rainbow trout (R 2 =<br />
10 Flows are available at the California Data Exchange Center website (http://cdec.water.ca.gov/cgiprogs/queryDaily?GRL)<br />
for the Feather River at Gridley gage starting from January 1, 1993.<br />
12
Table 8. Stage-discharge multiple regression equations for sites where stage-discharge<br />
<strong>relationships</strong> were developed using methods other than IFG4. Yuba Q is the Yuba<br />
River <strong>flow</strong> <strong>and</strong> Feather Q is the Feather River <strong>flow</strong>. The R 2 -values for both regressions<br />
were by definition 1.00 since the regressions were computed from three measurements<br />
<strong>and</strong> had two independent variables<br />
Str<strong>and</strong>ing Study<br />
Site<br />
USFWS, SFWO, Energy Planning <strong>and</strong> Instream Flow Branch<br />
Yuba River Redd Dewatering <strong>and</strong> Juvenile Str<strong>and</strong>ing Report<br />
September 15, 2010<br />
Regression Equation R 2 -value<br />
67 log (WSEL – SZF) = -0.3755 + 0.2716 x log (Yuba Q)<br />
+ 0.1109 x log (Feather Q)<br />
68 log (WSEL – SZF) = -0.704 + 0.03222 x log (Yuba Q)<br />
+ 0.0681 x log (Feather Q)<br />
0.04, p = 0.03) <strong>redd</strong>s (Figures 2 to 4). When only <strong>redd</strong>s with depths less than 2 feet 11 were<br />
considered, the correlations for spring-run Chinook salmon (R 2 = 0.05, p = 0.006), fall-run<br />
Chinook salmon (n = 664, R 2 = 0.31, p < 0.0001) <strong>and</strong> steelhead/rainbow trout (n = 26, R 2 = 0.39,<br />
p = 0.0005) were still significant. However, since we needed to choose a single value<br />
representing the difference <strong>between</strong> the tailspill <strong>and</strong> <strong>redd</strong> depths for the <strong>redd</strong> <strong>dewatering</strong> analysis<br />
because the analysis uses binary criteria, we selected the average difference for spring-run<br />
Chinook salmon (0.5 foot) [0.15 m], fall-run Chinook salmon (0.5 foot) [0.15 m] <strong>and</strong><br />
steelhead/rainbow trout (0.2 foot) [0.06 m] <strong>redd</strong>s with <strong>redd</strong> depths less than 2 feet (0.6 m). If the<br />
tailspill is 0.5 foot (0.15 m) higher than the depth at the head of the pit (the depth used to<br />
compute spawning habitat), Chinook salmon spawning habitat would be lost if the spawning<br />
depth fell below 0.5 foot (0.15 m). Similarly, if the tailspill is 0.2 foot (0.06 m) higher than the<br />
depth at the head of the pit (the depth used to compute spawning habitat), steelhead/rainbow<br />
trout spawning habitat would be lost if the spawning depth fell below 0.2 foot (0.06 m). We<br />
assumed that there would be insufficient intragravel <strong>flow</strong> through the <strong>redd</strong> if the spawning<br />
velocity was less than the lowest velocity at which we found a spring-run or fall-run Chinook<br />
salmon or steelhead/rainbow trout <strong>redd</strong> in the Yuba River. The lowest velocities we found in<br />
measurements of Yuba River spring-run <strong>and</strong> fall-run Chinook salmon <strong>and</strong> steelhead/rainbow<br />
trout were, respectively, 0.29 ft/s (0.088 m/s), 0.23 ft/s (0.070 m/s) <strong>and</strong> 0.09 ft/s (0.027 m/s)<br />
(U.S. Fish <strong>and</strong> Wildlife Service 2010a). The <strong>redd</strong> <strong>dewatering</strong> criteria used are given in Table 9.<br />
Habitat Simulation<br />
The total str<strong>and</strong>ing area in the Yuba River <strong>between</strong> the Narrows <strong>and</strong> the Feather River for<br />
different drops in <strong>flow</strong> are shown in Figures 5 <strong>and</strong> 6 <strong>and</strong> Appendix C. For example, if the Yuba<br />
River <strong>flow</strong> downstream of Daguerre Point Dam drops from 1,200 to 1,100 cfs, the total str<strong>and</strong>ing<br />
13<br />
1.00<br />
1.00<br />
11<br />
Two feet (0.6 m) was selected because the drop in stage associated with a change in<br />
<strong>flow</strong> for the Yuba River sites is typically less than 2 feet (0.6 m).
Figure 2. Tailspill <strong>and</strong> <strong>redd</strong> depth <strong>relationships</strong> for Yuba River spring-run Chinook<br />
salmon <strong>redd</strong>s.<br />
Figure 3. Tailspill <strong>and</strong> <strong>redd</strong> depth <strong>relationships</strong> for Yuba River fall-run Chinook salmon<br />
<strong>redd</strong>s.<br />
USFWS, SFWO, Energy Planning <strong>and</strong> Instream Flow Branch<br />
Yuba River Redd Dewatering <strong>and</strong> Juvenile Str<strong>and</strong>ing Report<br />
September 15, 2010<br />
14
Figure 4. Tailspill <strong>and</strong> <strong>redd</strong> depth <strong>relationships</strong> for Yuba River steelhead/rainbow trout<br />
<strong>redd</strong>s.<br />
area downstream of Daguerre Point Dam would be 250,049 ft 2 12 (23,230 m 2 ). In contrast, if the<br />
Yuba River <strong>flow</strong> downstream of Daguerre Point Dam drops from 1,900 to 1,200 cfs, the<br />
str<strong>and</strong>ing area downstream of Daguerre Point Dam would be 6,078 ft 2 (565 m 2 ). The<br />
relationship of <strong>flow</strong> drops to <strong>redd</strong> <strong>dewatering</strong> are shown in Figures 7 to 12 <strong>and</strong> Appendix D. The<br />
definition of the <strong>dewatering</strong> <strong>and</strong> str<strong>and</strong>ing <strong>flow</strong>s shown in Figures 5 to 12 <strong>and</strong> Appendices C <strong>and</strong><br />
D is the <strong>flow</strong> after the <strong>flow</strong> decrease has occurred. Table 10 shows the juvenile str<strong>and</strong>ing <strong>and</strong><br />
<strong>redd</strong> <strong>dewatering</strong> results for three example <strong>flow</strong> decreases: 2,900 to 2,000 cfs, 2,000 to 1,000 cfs<br />
<strong>and</strong> 2,900 to 1,000 cfs.<br />
12 250,049 ft 2 (23,230 m 2 ) is the total area of the str<strong>and</strong>ing sites (site 57) that str<strong>and</strong><br />
<strong>between</strong> 1,200 <strong>and</strong> 1,100 cfs.<br />
USFWS, SFWO, Energy Planning <strong>and</strong> Instream Flow Branch<br />
Yuba River Redd Dewatering <strong>and</strong> Juvenile Str<strong>and</strong>ing Report<br />
September 15, 2010<br />
15
Table 9. Redd <strong>dewatering</strong> Habitat Suitability Criteria for the Lower Yuba River. Binary<br />
Suitability Index (SI) have values of either 0 or 1.<br />
Water Water Channel<br />
Velocity (ft/s) SI Value Depth (ft) SI Value Index Value SI Value<br />
USFWS, SFWO, Energy Planning <strong>and</strong> Instream Flow Branch<br />
Yuba River Redd Dewatering <strong>and</strong> Juvenile Str<strong>and</strong>ing Report<br />
September 15, 2010<br />
Spring-run Chinook Salmon<br />
0.00 0.00 0.00 0.00 0.00 0.00<br />
0.28 0.00 0.50 0.00 1.00 1.00<br />
0.29 1.00 0.52 1.00 100.0 1.00<br />
100.0 1.00 100.0 1.00<br />
Fall-run Chinook Salmon<br />
0.00 0.00 0.00 0.00 0.00 0.00<br />
0.22 0.00 0.50 0.00 1.00 1.00<br />
0.23 1.00 0.52 1.00 100.0 1.00<br />
100.0 1.00 100.0 1.00<br />
Steelhead/rainbow trout<br />
0.00 0.00 0.00 0.00 0.00 0.00<br />
0.08 0.00 0.20 0.00 1.00 1.00<br />
0.09 1.00 0.23 1.00 100.0 1.00<br />
100.0 1.00 100.0 1.00<br />
DISCUSSION<br />
Hydraulic Model Construction <strong>and</strong> Calibration<br />
The modification of IFG4 discussed in the methods where we only used two calibration <strong>flow</strong>s is<br />
not usually considered acceptable for developing stage-discharge <strong>relationships</strong>. However, we<br />
believe that it is sufficiently accurate for interpolating a str<strong>and</strong>ing <strong>flow</strong> in <strong>between</strong> two<br />
calibration <strong>flow</strong>s in our study because errors in stage-discharge <strong>relationships</strong> are typically large<br />
only for extrapolation outside of the range of calibration <strong>flow</strong>s. IFG4 could not be used for sites<br />
located within the backwater effects of the Feather River because a basic assumption of IFG4 is<br />
that the WSEL only varies as a function of the discharge at the stage-discharge relationship<br />
location.<br />
16
Figure 5. Str<strong>and</strong>ing areas of juvenile anadromous salmonids for the Lower Yuba River<br />
upstream of Daguerre Point Dam. Substantial juvenile str<strong>and</strong>ing could be avoided by<br />
keeping <strong>flow</strong>s above 3,700 cfs, <strong>between</strong> 2,300 <strong>and</strong> 3,700 cfs, or below 2,300 cfs.<br />
These thresholds are shown as sharp drops in str<strong>and</strong>ing area with declining rearing<br />
<strong>flow</strong>s in the above graph. The red lines give an example of how to read this graph - if<br />
the <strong>flow</strong>s drop from a rearing <strong>flow</strong> of 3,500 cfs to a str<strong>and</strong>ing <strong>flow</strong> of 2,100 cfs, the total<br />
str<strong>and</strong>ing area would be 201,707 ft 2 (18,739 m 2 ). The rearing <strong>flow</strong> is the <strong>flow</strong> prior to a<br />
<strong>flow</strong> reduction, while the str<strong>and</strong>ing <strong>flow</strong> is the <strong>flow</strong> after a <strong>flow</strong> reduction.<br />
USFWS, SFWO, Energy Planning <strong>and</strong> Instream Flow Branch<br />
Yuba River Redd Dewatering <strong>and</strong> Juvenile Str<strong>and</strong>ing Report<br />
September 15, 2010<br />
17
Figure 6. Str<strong>and</strong>ing areas of juvenile anadromous salmonids for the Lower Yuba River<br />
downstream of Daguerre Point Dam. Substantial juvenile str<strong>and</strong>ing could be avoided by<br />
keeping <strong>flow</strong>s above or below 1,200 cfs. The rearing <strong>flow</strong> is the <strong>flow</strong> prior to a <strong>flow</strong><br />
reduction, while the str<strong>and</strong>ing <strong>flow</strong> is the <strong>flow</strong> after a <strong>flow</strong> reduction.<br />
USFWS, SFWO, Energy Planning <strong>and</strong> Instream Flow Branch<br />
Yuba River Redd Dewatering <strong>and</strong> Juvenile Str<strong>and</strong>ing Report<br />
September 15, 2010<br />
18
Figure 7. Predicted <strong>dewatering</strong> of fall-run Chinook salmon <strong>redd</strong>s for the Lower Yuba<br />
River upstream of Daguerre Point Dam. The spawning <strong>flow</strong> is the <strong>flow</strong> prior to a <strong>flow</strong><br />
reduction, while the <strong>dewatering</strong> <strong>flow</strong> is the <strong>flow</strong> after a <strong>flow</strong> reduction.<br />
USFWS, SFWO, Energy Planning <strong>and</strong> Instream Flow Branch<br />
Yuba River Redd Dewatering <strong>and</strong> Juvenile Str<strong>and</strong>ing Report<br />
September 15, 2010<br />
19
Figure 8. Predicted <strong>dewatering</strong> of fall-run Chinook salmon <strong>redd</strong>s for the Lower Yuba<br />
River downstream of Daguerre Point Dam. The spawning <strong>flow</strong> is the <strong>flow</strong> prior to a <strong>flow</strong><br />
reduction, while the <strong>dewatering</strong> <strong>flow</strong> is the <strong>flow</strong> after a <strong>flow</strong> reduction.<br />
USFWS, SFWO, Energy Planning <strong>and</strong> Instream Flow Branch<br />
Yuba River Redd Dewatering <strong>and</strong> Juvenile Str<strong>and</strong>ing Report<br />
September 15, 2010<br />
20
Figure 9. Predicted <strong>dewatering</strong> of spring-run Chinook salmon <strong>redd</strong>s for the Lower Yuba<br />
River upstream of Daguerre Point Dam. The spawning <strong>flow</strong> is the <strong>flow</strong> prior to a <strong>flow</strong><br />
reduction, while the <strong>dewatering</strong> <strong>flow</strong> is the <strong>flow</strong> after a <strong>flow</strong> reduction.<br />
USFWS, SFWO, Energy Planning <strong>and</strong> Instream Flow Branch<br />
Yuba River Redd Dewatering <strong>and</strong> Juvenile Str<strong>and</strong>ing Report<br />
September 15, 2010<br />
21
Figure 10. Predicted <strong>dewatering</strong> of spring-run Chinook salmon <strong>redd</strong>s for the Lower<br />
Yuba River downstream of Daguerre Point Dam. The spawning <strong>flow</strong> is the <strong>flow</strong> prior to<br />
a <strong>flow</strong> reduction, while the <strong>dewatering</strong> <strong>flow</strong> is the <strong>flow</strong> after a <strong>flow</strong> reduction.<br />
USFWS, SFWO, Energy Planning <strong>and</strong> Instream Flow Branch<br />
Yuba River Redd Dewatering <strong>and</strong> Juvenile Str<strong>and</strong>ing Report<br />
September 15, 2010<br />
22
Figure 11. Predicted <strong>dewatering</strong> of steelhead/rainbow trout <strong>redd</strong>s for the Lower Yuba<br />
River upstream of Daguerre Point Dam. The spawning <strong>flow</strong> is the <strong>flow</strong> prior to a <strong>flow</strong><br />
reduction, while the <strong>dewatering</strong> <strong>flow</strong> is the <strong>flow</strong> after a <strong>flow</strong> reduction.<br />
USFWS, SFWO, Energy Planning <strong>and</strong> Instream Flow Branch<br />
Yuba River Redd Dewatering <strong>and</strong> Juvenile Str<strong>and</strong>ing Report<br />
September 15, 2010<br />
23
Figure 12. Predicted <strong>dewatering</strong> of steelhead/rainbow trout <strong>redd</strong>s for the Lower Yuba<br />
River downstream of Daguerre Point Dam. The spawning <strong>flow</strong> is the <strong>flow</strong> prior to a <strong>flow</strong><br />
reduction, while the <strong>dewatering</strong> <strong>flow</strong> is the <strong>flow</strong> after a <strong>flow</strong> reduction.<br />
USFWS, SFWO, Energy Planning <strong>and</strong> Instream Flow Branch<br />
Yuba River Redd Dewatering <strong>and</strong> Juvenile Str<strong>and</strong>ing Report<br />
September 15, 2010<br />
24
Table 10. Str<strong>and</strong>ing area (ft 2 ) for juvenile anadromous salmonids <strong>and</strong> predicted<br />
percentage of Chinook salmon <strong>and</strong> steelhead/rainbow trout <strong>redd</strong>s dewatered with <strong>flow</strong><br />
changing from 2,900 to 2,000 cfs, 2,000 to 1,000 cfs <strong>and</strong> 2,900 to 1,000 cfs. This table<br />
provides examples (for the above three <strong>flow</strong> decreases) of the data in Appendices C<br />
<strong>and</strong> D.<br />
Lifestage/race/species/segment 2,900 to<br />
2,000 cfs<br />
USFWS, SFWO, Energy Planning <strong>and</strong> Instream Flow Branch<br />
Yuba River Redd Dewatering <strong>and</strong> Juvenile Str<strong>and</strong>ing Report<br />
September 15, 2010<br />
25<br />
2,000 to<br />
1,000 cfs<br />
2,900 to<br />
1,000 cfs<br />
Juvenile salmonids above Daguerre Point Dam 188,564 66,486 255,050<br />
Juvenile salmonids below Daguerre Point Dam 43,310 302,451 345,761<br />
Fall-run Chinook <strong>redd</strong>s above Daguerre Point Dam 14.9% 20.1% 41.0%<br />
Fall-run Chinook <strong>redd</strong>s below Daguerre Point Dam 14.2% 42.7% 56.9%<br />
Spring-run Chinook <strong>redd</strong>s above Daguerre Point Dam 7.5% 10.9% 28.9%<br />
Spring-run Chinook <strong>redd</strong>s below Daguerre Point Dam 6.8% 40.7% 60.3%<br />
Steelhead/rainbow trout <strong>redd</strong>s above Daguerre Point Dam 1.5% 2.4% 6.4%<br />
Steelhead/rainbow trout <strong>redd</strong>s below Daguerre Point Dam 2.1% 19.6% 29.0%<br />
We still used IFG4 for str<strong>and</strong>ing site 2, which did not meet the measured-simulated WSEL<br />
difference criterion for IFG4, <strong>and</strong> str<strong>and</strong>ing site 45, which did not meet the mean error criterion,<br />
because: 1) the difference <strong>between</strong> measured <strong>and</strong> simulated WSELs for both sites was less than<br />
0.12 foot 13 (0.037 m); 2) in both cases the str<strong>and</strong>ing <strong>flow</strong> was not greater than the highest<br />
calibration <strong>flow</strong>; <strong>and</strong> 3) the calibration plots indicated that there was a linear log-log relationship<br />
over the range of calibration <strong>flow</strong>s. It seems likely that that beta coefficient values less than 2.0<br />
were caused by channel characteristics at certain sites which form hydraulic controls at some<br />
<strong>flow</strong>s but not at others (compound controls), thus affecting upstream water elevations.<br />
Specifically, at lower <strong>flow</strong>s the channel at these sites controlled the water surface elevations,<br />
while at higher <strong>flow</strong>s the water surface elevations were controlled by downstream hydraulic<br />
controls. Accordingly, the performance of IFG4 for these sites was considered adequate despite<br />
the beta coefficient criterion not being met. Beta coefficient values greater than 4.5 likely were<br />
caused by the presence of a downstream hydraulic control, such that the actual SZFs of these<br />
sites were greater than those in Appendix B. We determined that the correct SZF would have<br />
had a minimal effect on the estimated str<strong>and</strong>ing <strong>flow</strong>s for these sites - for example, a SZF which<br />
produced a beta coefficient of 4.5 for str<strong>and</strong>ing site 2 would have only decreased the str<strong>and</strong>ing<br />
<strong>flow</strong> from 685 cfs to 680 cfs. As a result, we concluded that the SZFs in Appendix B were<br />
sufficiently accurate for the purposes of estimating str<strong>and</strong>ing <strong>flow</strong>s.<br />
0.2 foot.<br />
13 For much of the Yuba River, the WSEL going across the river will differ by more than
Habitat Suitability Criteria (HSC) Development<br />
The average difference <strong>between</strong> the <strong>redd</strong> <strong>and</strong> tailspill depths of 0.5 foot (0.15 m) for Yuba River<br />
spring-run <strong>and</strong> fall-run Chinook salmon <strong>redd</strong>s shallower than 2 feet (0.6 m) in this study is<br />
similar to the average tailspill height of 0.6 foot (0.18 m) for Columbia River fall-run Chinook<br />
salmon (Chapman et al. 1986). Devries (1997) in a literature review found considerable<br />
variation in estimates of egg burial depths, ranging from 0 to 0.80 m, <strong>and</strong> proposed a criterion of<br />
0.15 m for the depth of the top of the egg pocket below the original stream bed level for both<br />
Chinook salmon <strong>and</strong> steelhead. Based on this criterion, we would estimate that the top of the<br />
egg pocket was 0.30 m (0.15 m + 0.15 m) below the tailspill elevation for Chinook salmon <strong>and</strong><br />
0.21 m (0.15 m + 0.06 m) for steelhead. Chapman et al. (1986) found that the depth of gravel<br />
over eggs in Columbia River fall-run Chinook salmon <strong>redd</strong>s was at least 0.3 foot (0.09 m), while<br />
Reiser <strong>and</strong> White (1983) did not find increased mortality of steelhead/rainbow trout or Chinook<br />
salmon eggs when water levels were 0.3 feet (0.09 m) below the eggs for up to 4 to 5 weeks. In<br />
contrast, Becker et al. (1982) found substantial mortality for alevins that were dewatered for 1 to<br />
4 hours per day. Given the uncertainty as to the location of the egg pockets within the <strong>redd</strong>, we<br />
believe that exposure of the tailspill is a reasonable conservative estimate of reduced survival.<br />
McMichael et al. (2005) found a survival rate averaging 29.2% from eggs to fry for <strong>redd</strong>s which<br />
were dewatered 3.1% of the time during the posthatch intragravel rearing period. In contrast,<br />
since our <strong>dewatering</strong> analysis is based on <strong>flow</strong> variations with a temporal scale of one month,<br />
<strong>and</strong> thus <strong>dewatering</strong> during 100% of the time during the posthatch intragravel period, we would<br />
expect no survival of eggs <strong>and</strong> pre-emergent alevins for our <strong>redd</strong> <strong>dewatering</strong> estimates.<br />
Miller et al. (2008) found reduced growth rates of rainbow trout that were exposed to hypoxic<br />
conditions associated with low intragravel <strong>flow</strong> rates. In some situations, downwelling currents<br />
can provide adequate intragravel velocities through <strong>redd</strong>s even with very low mean water<br />
column velocities. We do not consider this to be likely in the Yuba River - if there had been<br />
conditions where downwelling currents had provided sufficient intragravel velocities at low<br />
mean water column velocities, we would have expected to find salmon <strong>and</strong> steelhead<br />
constructing <strong>redd</strong>s in such situations.<br />
Habitat Simulation<br />
The results indicate that, as expected, greater drops in <strong>flow</strong> are associated with increased juvenile<br />
anadromous salmonid str<strong>and</strong>ing areas, but that substantial juvenile str<strong>and</strong>ing could be avoided by<br />
maintaining <strong>flow</strong>s downstream of Daguerre Point Dam either above or below a threshold of<br />
1,200 cfs, <strong>and</strong> maintaining <strong>flow</strong>s upstream of Daguerre Point Dam either: 1) above a threshold of<br />
3,700 cfs; 2) <strong>between</strong> thresholds of 2,300 <strong>and</strong> 3,700 cfs; or 3) below 2,300 cfs. The results of<br />
this juvenile str<strong>and</strong>ing study could be refined by combining the results of this study with the<br />
results of Jones <strong>and</strong> Stokes’ studies on juvenile salmonid densities found in str<strong>and</strong>ing areas. A<br />
further refinement of this juvenile str<strong>and</strong>ing study would be to develop separate <strong>relationships</strong> for<br />
different seasons or water year types. Specifically, Str<strong>and</strong>ing Sites 37, 51 <strong>and</strong> 57 had <strong>flow</strong>,<br />
originating from the Yuba Goldfields, exiting the str<strong>and</strong>ing sites, when the str<strong>and</strong>ing sites were<br />
identified. Juvenile anadromous salmonids would only be str<strong>and</strong>ed in these sites when there was<br />
no longer <strong>flow</strong> exiting these sites (for example in the fall or during dry years). Similar to<br />
USFWS, SFWO, Energy Planning <strong>and</strong> Instream Flow Branch<br />
Yuba River Redd Dewatering <strong>and</strong> Juvenile Str<strong>and</strong>ing Report<br />
September 15, 2010<br />
26
juvenile str<strong>and</strong>ing, the results of the <strong>redd</strong> <strong>dewatering</strong> analysis indicate that, as expected, greater<br />
drops in <strong>flow</strong> result in a greater percentage of salmon <strong>and</strong> steelhead/rainbow trout <strong>redd</strong>s being<br />
dewatered. However, the <strong>redd</strong> <strong>dewatering</strong> analysis did not show <strong>flow</strong> threshold patterns, as<br />
were observed for juvenile str<strong>and</strong>ing.<br />
A basic assumption of all instream <strong>flow</strong> studies is that a stream is in dynamic equilibrium. When<br />
a channel is in dynamic equilibrium, there is an approximate balance <strong>between</strong> sediment supply<br />
<strong>and</strong> transport, so that the channel pattern <strong>and</strong> cross-sectional profile of the entire stream is<br />
consistent (Bovee 1996). For a stream in dynamic equilibrium, it would be expected that large<br />
<strong>flow</strong> events would not result in a significant change in <strong>flow</strong>-habitat <strong>relationships</strong>. Recent high<br />
<strong>flow</strong>s on the Yuba River (Figure 13) have resulted in significant channel changes. While we do<br />
not have direct evidence that the Yuba River is in dynamic equilibrium, our findings on the<br />
American River that the January 1997 flood did not result in a substantial change in Chinook<br />
salmon or steelhead spawning <strong>flow</strong>-habitat <strong>relationships</strong> (US Fish <strong>and</strong> Wildlife Service 2000)<br />
offer support that the results of this study are still applicable to the Yuba River.<br />
USFWS, SFWO, Energy Planning <strong>and</strong> Instream Flow Branch<br />
Yuba River Redd Dewatering <strong>and</strong> Juvenile Str<strong>and</strong>ing Report<br />
September 15, 2010<br />
CONCLUSION<br />
The model developed in this study is predictive for <strong>flow</strong>s ranging from 400 cfs to 4,500 cfs for<br />
<strong>redd</strong> <strong>dewatering</strong> <strong>and</strong> juvenile str<strong>and</strong>ing upstream of Daguerre Point Dam, <strong>and</strong> for <strong>flow</strong>s ranging<br />
from 150 cfs to 4,500 cfs downstream of Daguerre Point Dam. This study supported <strong>and</strong><br />
achieved the objective of modeling the effects of <strong>flow</strong> decreases on Chinook salmon <strong>and</strong><br />
steelhead/rainbow trout spawning habitat <strong>and</strong> maximum potential juvenile entrapment in the<br />
Yuba River <strong>between</strong> Englebright Dam <strong>and</strong> the Feather River.<br />
REFERENCES<br />
Becker, C.D., D.A. Neitzel <strong>and</strong> D.H. Fickeisen. 1982. Effects of <strong>dewatering</strong> on Chinook salmon<br />
<strong>redd</strong>s: tolerance of four developmental phases to daily <strong>dewatering</strong>s. Transactions of the<br />
American Fisheries Society 111: 624-637.<br />
Bovee, K.D., editor. 1996. The Complete IFIM: A Coursebook for IF 250. U.S. Geological<br />
Survey, Fort Collins, CO.<br />
Bradford, M.J., G.C. Taylor, J.A. Allen <strong>and</strong> P.S. Higgins. 1995. An experimental study of the<br />
str<strong>and</strong>ing of juvenile coho salmon <strong>and</strong> rainbow trout during rapid <strong>flow</strong> decreases under<br />
winter conditions. North American Journal of Fisheries Management 15: 473-379.<br />
California Department of Fish <strong>and</strong> Game. 2001. Evaluation of effects of <strong>flow</strong> <strong>fluctuations</strong> on<br />
the anadromous fish populations in the Lower American River. Sacramento, CA:<br />
California Department of Fish <strong>and</strong> Game, Stream Evaluation Program, Technical Report<br />
No. 01-2.<br />
27
Figure 13. Yuba River <strong>flow</strong>s below Daguerre Point Dam subsequent to the completion<br />
of most of the data collection for this study. High <strong>flow</strong>s in May 2005 <strong>and</strong> January <strong>and</strong><br />
April 2006 resulted in substantial channel changes in the Yuba River.<br />
Chapman, D.W., D.E. Weitkamp, T.L. Welsh, M.B. Dell <strong>and</strong> T.H. Schadt. 1986. Effects of<br />
river <strong>flow</strong> on the distribution of chinook salmon <strong>redd</strong>s. Transactions of the American<br />
Fisheries Society 115: 537-547.<br />
Cushman, R.M. 1985. Review of ecological effects of rapidly varying <strong>flow</strong>s downstream from<br />
hydroelectric facilities. North American Journal of Fisheries Management 5: 330-339.<br />
Devries, P. 1997. Riverine salmonid egg burial depths: review of published data <strong>and</strong><br />
implications for scour studies. Canadian Journal of Fisheries <strong>and</strong> Aquatic Sciences 54:<br />
1685-1698.<br />
Gard, M. <strong>and</strong> E. Ballard. 2003. Applications of new technologies to instream <strong>flow</strong> studies in<br />
large rivers. North American Journal of Fisheries Management 23: 1114-1125.<br />
HDR/SWRI. 2007. Draft Environmental Impact Report/Environmental Impact Statement<br />
for the Proposed Lower Yuba River Accord. Prepared for the California<br />
Department of Water Resources, Yuba County Water Agency <strong>and</strong> the U.S. Bureau<br />
of Reclamation. June 2007. HDR/SWRI: Sacramento, CA.<br />
Hunter, M.A. 1992. Hydropower <strong>flow</strong> <strong>fluctuations</strong> <strong>and</strong> salmonids: a review of the biological<br />
effects, mechanical causes, <strong>and</strong> options for mitigation. State of Washington Department<br />
of Fisheries Technical Report No. 119. Olympia. 46 pp.<br />
USFWS, SFWO, Energy Planning <strong>and</strong> Instream Flow Branch<br />
Yuba River Redd Dewatering <strong>and</strong> Juvenile Str<strong>and</strong>ing Report<br />
September 15, 2010<br />
28
McMichael, G.A., C.L. Rakowski, B.B. James <strong>and</strong> J.A. Lukas. 2005. Estimated fall Chinook<br />
salmon survival to emergence in dewatered <strong>redd</strong>s in a shallow side channel of the<br />
Columbia River. North American Journal of Fisheries Management 25:876-884.<br />
Milhous, R.T., M.A. Updike <strong>and</strong> D.M. Schneider. 1989. Physical habitat simulation system<br />
reference manual - version II. Instream Flow Information Paper No. 26. U. S. Fish <strong>and</strong><br />
Wildlife Service Biological Report 89(16).<br />
Miller, S.C., S.E. Reeb, P.A. Wright <strong>and</strong> T.E. Gillis. 2008. Oxygen concentration in the water<br />
boundary layer next to rainbow trout (Oncorhynchus mykiss) embryos is influenced by<br />
hypoxia exposure time, metabolic rate, <strong>and</strong> water <strong>flow</strong>. Canadian Journal of Fisheries<br />
<strong>and</strong> Aquatic Sciences 65: 2170-2177.<br />
Payne <strong>and</strong> Associates. 1998. RHABSIM 2.0 for DOS <strong>and</strong> Windows User’s Manual. Arcata,<br />
CA: Thomas R. Payne <strong>and</strong> Associates.<br />
Reiser, D.W. <strong>and</strong> R.G. White. 1983. Effects of complete <strong>redd</strong> <strong>dewatering</strong> on salmonid egghatching<br />
success <strong>and</strong> development of juveniles. Transactions of the American Fisheries<br />
Society 112: 532-540.<br />
Steffler, P. <strong>and</strong> J. Blackburn. 2002. River2D: Two-dimensional Depth Averaged Model of<br />
River Hydrodynamics <strong>and</strong> Fish Habitat. Introduction to Depth Averaged Modeling <strong>and</strong><br />
User’s Manual. University of Alberta, Edmonton, Alberta. 120 pp.<br />
http://www.River2D.ualberta.ca/download.htm<br />
U.S. Fish <strong>and</strong> Wildlife Service. 1994. Using the computer based physical habitat simulation<br />
system (PHABSIM). Fort Collins, CO: U.S. Fish <strong>and</strong> Wildlife Service.<br />
U.S. Fish <strong>and</strong> Wildlife Service. 1995. Working paper on restoration needs: habitat restoration<br />
actions to double natural production of anadromous fish in the Central Valley of<br />
California. Volume 1. May 9, 1995. Prepared for the U. S. Fish <strong>and</strong> Wildlife Service<br />
under the direction of the Anadromous Fish Restoration Program Core Group. Stockton,<br />
CA: U.S. Fish <strong>and</strong> Wildlife Service.<br />
U.S. Fish <strong>and</strong> Wildlife Service. 2000. Effects of the January 1997 flood on <strong>flow</strong>-habitat<br />
<strong>relationships</strong> for steelhead <strong>and</strong> fall-run Chinook salmon in the Lower American River.<br />
U.S. Fish <strong>and</strong> Wildlife Service, Sacramento, CA.<br />
U.S. Fish <strong>and</strong> Wildlife Service. 2010a. Flow-habitat <strong>relationships</strong> for spring <strong>and</strong> fall-run<br />
Chinook salmon <strong>and</strong> steelhead/rainbow trout spawning in the Yuba River. Sacramento,<br />
CA: U.S. Fish <strong>and</strong> Wildlife Service.<br />
U.S. Fish <strong>and</strong> Wildlife Service. 2010b. Flow-habitat <strong>relationships</strong> for spring <strong>and</strong> fall-run<br />
Chinook salmon <strong>and</strong> steelhead/rainbow trout rearing in the Yuba River. Sacramento,<br />
CA: U.S. Fish <strong>and</strong> Wildlife Service.<br />
USFWS, SFWO, Energy Planning <strong>and</strong> Instream Flow Branch<br />
Yuba River Redd Dewatering <strong>and</strong> Juvenile Str<strong>and</strong>ing Report<br />
September 15, 2010<br />
29
APPENDIX A<br />
STRANDING SITE LOCATIONS AND STRANDING FLOWS<br />
Str<strong>and</strong>ing Site # MHU #<br />
Str<strong>and</strong>ing Flow 14<br />
(cfs)<br />
Str<strong>and</strong>ing Area (ft 2 )<br />
1 179-180 < 400 27,144<br />
2 173 685 1,400<br />
3 169 2,128 253<br />
4 170 2,110 7,356<br />
5 168 3,317 750<br />
7 160-163 < 400 48,742<br />
7A 158-159 494 14,712<br />
8 141 < 400 14,208<br />
8A 141 829 268<br />
8B 142 516 104<br />
9 139/135 3,338 3,653<br />
10 135 1,672 4,870<br />
11 137/138 545 9<br />
12 134 < 400 7,980<br />
13 131 < 400 7,471<br />
15 128 < 400 31,534<br />
16 117/119 1,667 16,434<br />
17 50 307 10,337<br />
18 49 354 38,045<br />
19 45 2,096 4,205<br />
20 45 891 3,413<br />
21 41, 43, 44 395 29,859<br />
22 40 1,696 3,231<br />
23 37 1,879 1,057<br />
24 35 991 5,433<br />
25 28-33 750 14,519<br />
14 The str<strong>and</strong>ing <strong>flow</strong> is the <strong>flow</strong> where the connection <strong>between</strong> the str<strong>and</strong>ing area <strong>and</strong> main river<br />
channel has a maximum depth of 0.1 foot.<br />
USFWS, SFWO, Energy Planning <strong>and</strong> Instream Flow Branch<br />
Yuba River Redd Dewatering <strong>and</strong> Juvenile Str<strong>and</strong>ing Report<br />
September 15, 2010<br />
30
Str<strong>and</strong>ing Site # MHU #<br />
USFWS, SFWO, Energy Planning <strong>and</strong> Instream Flow Branch<br />
Yuba River Redd Dewatering <strong>and</strong> Juvenile Str<strong>and</strong>ing Report<br />
September 15, 2010<br />
31<br />
Str<strong>and</strong>ing Flow<br />
(cfs)<br />
Str<strong>and</strong>ing Area (ft 2 )<br />
26 201 3,597 10,279<br />
27 201 1,953 16<br />
28 201 2,300 1,511<br />
29 199 3,135 2,230<br />
30 194 2,707 5,625<br />
31 192 1,790 1,200<br />
32 190 634 1,473<br />
33 187 1,188 246<br />
34 120 < 400 1,800<br />
35 117 1,908 2,083<br />
36 118 1,735 351<br />
37 113 2,416 153,129<br />
38 113 1,175 1,000<br />
39 112 4,907 3,547<br />
40 112 3,525 227,615<br />
41 112 3,993 2,068<br />
42 112 1,563 1,339<br />
43 112 3,192 6,510<br />
44 94 597 18,854<br />
45 96-98 < 400 1,219<br />
46 100 1,930 38,947<br />
47 100-104 2,309 20,690<br />
48 89 1,002 800<br />
49 89 1,813 1,220<br />
49A 89 857 1,200<br />
49B 89 1,001 750<br />
50A 89 3,069 300<br />
50B 89 2,702 15<br />
50C 89 1,249 420<br />
51 83 2,474 26,917
Str<strong>and</strong>ing Site # MHU #<br />
USFWS, SFWO, Energy Planning <strong>and</strong> Instream Flow Branch<br />
Yuba River Redd Dewatering <strong>and</strong> Juvenile Str<strong>and</strong>ing Report<br />
September 15, 2010<br />
32<br />
Str<strong>and</strong>ing Flow<br />
(cfs)<br />
Str<strong>and</strong>ing Area (ft 2 )<br />
52 82 990 476<br />
53 80 1,079 20,576<br />
54 80 1,060 6,600<br />
55A 78 1,017 7,613<br />
55B 78 3,974 330<br />
56 74 1,813 150<br />
57 71 1,136 250,049<br />
58 69 2,906 5,685<br />
59A 68/69 2,698 960<br />
59B 68/69 3,409 861<br />
60 63 485 18,607<br />
61 59 790 10,774<br />
62 56 2,247 10,989<br />
63A 56 4,380 3,460<br />
63B 56 2,300 224<br />
64 53 1,949 9,985<br />
65 51 907 15,168<br />
66 24 903 3,040<br />
67 4 738 100<br />
68 1 467 583<br />
Shapefiles for the above str<strong>and</strong>ing areas are available in electronic format upon request from:<br />
Mark Gard, Senior Biologist<br />
Energy Planning <strong>and</strong> Instream Flow Branch<br />
U.S. Fish <strong>and</strong> Wildlife Service<br />
Sacramento Fish <strong>and</strong> Wildlife Office<br />
2800 Cottage Way, Room W-2605<br />
Sacramento, CA 95825<br />
Mark_Gard@fws.gov
USFWS, SFWO, Energy Planning <strong>and</strong> Instream Flow Branch<br />
Yuba River Redd Dewatering <strong>and</strong> Juvenile Str<strong>and</strong>ing Report<br />
September 15, 2010<br />
APPENDIX B<br />
PHABSIM WSEL CALIBRATION<br />
33
USFWS, SFWO, Energy Planning <strong>and</strong> Instream Flow Branch<br />
Yuba River Redd Dewatering <strong>and</strong> Juvenile Str<strong>and</strong>ing Report<br />
September 15, 2010<br />
Stage of Zero Flow Values 15<br />
Str<strong>and</strong>ing Site SZF<br />
2 91.8<br />
10 97.1<br />
11 97.6<br />
12 95.6<br />
16 99.4<br />
18 93.0<br />
19 92.5<br />
20 97.0<br />
21 97.2<br />
22 95.9<br />
24 97.6<br />
26 94.8<br />
28 98.7<br />
29 97.2<br />
30 97.7<br />
31 99.5<br />
32 97.4<br />
34 95.5<br />
35 96.0<br />
36 98.7<br />
37 98.4<br />
38 96.9<br />
39 93.3<br />
40 93.3<br />
15 Elevations are set relative to a benchmark arbitrarily assigned an elevation of 100.00 ft.<br />
34
USFWS, SFWO, Energy Planning <strong>and</strong> Instream Flow Branch<br />
Yuba River Redd Dewatering <strong>and</strong> Juvenile Str<strong>and</strong>ing Report<br />
September 15, 2010<br />
Str<strong>and</strong>ing Site SZF<br />
41 90.1<br />
42 94.1<br />
43 94.0<br />
44 95.3<br />
45 96.7<br />
47 94.6<br />
48 89.9<br />
49A 93.9<br />
50 92.3<br />
55 95.7<br />
57 94.1<br />
58 93.6<br />
59 90.1<br />
61 87.7<br />
62 92.6<br />
63 93.5<br />
64 93.5<br />
65 92.8<br />
66 90.7<br />
67 90.0<br />
68 86.1<br />
35
BETA %MEAN Calculated vs. Given Disch. (%) 16 Difference (measured vs. pred. WSELs)<br />
SITE COEFF. ERROR 1,021 cfs 3,154 cfs 5,786 cfs 1,021 cfs 3,154 cfs 5,786 cfs<br />
2 4.66 4.0 2.4 6.2 3.6 0.04 0.11 0.08<br />
BETA %MEAN Calculated vs. Given Disch. (%) Difference (measured vs. pred. WSELs)<br />
SITE COEFF. ERROR 1,018 cfs 3,154 cfs 1,018 cfs 3,154 cfs<br />
10 3.26 --- --- --- 0.00 0.00<br />
11 4.17 --- --- --- 0.00 0.00<br />
BETA %MEAN Calculated vs. Given Disch. (%) Difference (measured vs. pred. WSELs)<br />
SITE COEFF. ERROR 1,018 cfs 3,154 cfs 5,574 cfs 1,018 cfs 3,154 cfs 5,574 cfs<br />
12 3.49 1.9 1.0 2.9 1.8 0.01 0.04 0.04<br />
BETA %MEAN Calculated vs. Given Disch. (%) Difference (measured vs. pred. WSELs)<br />
SITE COEFF. ERROR 1,018 cfs 3,150 cfs 5,559 cfs 1,018 cfs 3,150 cfs 5,559 cfs<br />
16 2.07 0.2 0.1 0.4 0.2 0.00 0.01 0.01<br />
BETA %MEAN Calculated vs. Given Disch. (%) Difference (measured vs. pred. WSELs)<br />
SITE COEFF. ERROR 1,151 cfs 1,898 cfs 1,151 cfs 1,898 cfs<br />
18 1.74 --- --- --- 0.00 0.00<br />
20 2.69 --- --- --- 0.00 0.00<br />
BETA %MEAN Calculated vs. Given Disch. (%) Difference (measured vs. pred. WSELs)<br />
SITE COEFF. ERROR 1,898 cfs 3,150 cfs 1,898 cfs 3,150 cfs<br />
19 1.35 --- --- --- 0.00 0.00<br />
BETA %MEAN Calculated vs. Given Disch. (%) Difference (measured vs. pred. WSELs)<br />
SITE COEFF. ERROR 991 cfs 1,898 cfs 3,768 cfs 991 cfs 1,898 cfs 3,768 cfs<br />
21 3.21 4.2 2.8 6.0 3.5 0.03 0.09 0.06<br />
16 For Calculated versus Given Discharge <strong>and</strong> Difference, the direction of deviation is omitted.<br />
USFWS, SFWO, Energy Planning <strong>and</strong> Instream Flow Branch<br />
Yuba River Redd Dewatering <strong>and</strong> Juvenile Str<strong>and</strong>ing Report<br />
September 15, 2010<br />
36
BETA %MEAN Calculated vs. Given Disch. (%) Difference (measured vs. pred. WSELs)<br />
SITE COEFF. ERROR 991 cfs 1,898 cfs 3,768 cfs 991 cfs 1,898 cfs 3,768 cfs<br />
22 4.13 1.8 1.5 2.8 1.3 0.02 0.04 0.02<br />
BETA %MEAN Calculated vs. Given Disch. (%) Difference (measured vs. pred. WSELs)<br />
SITE COEFF. ERROR 2,054 cfs 3,150 cfs 5,771 cfs 2,054 cfs 3,150 cfs 5,771 cfs<br />
26 5.20 2.2 2.1 3.4 1.2 0.05 0.08 0.03<br />
BETA %MEAN Calculated vs. Given Disch. (%) Difference (measured vs. pred. WSELs)<br />
SITE COEFF. ERROR 971 cfs 2,054 cfs 3,150 cfs 5,771 cfs 971 cfs 2,054 cfs 3,150 cfs 5,771 cfs<br />
28 2.26 1.0 1.1 1.6 0.4 0.9 0.01 0.02 0.01 0.02<br />
BETA %MEAN Calculated vs. Given Disch. (%) Difference (measured vs. pred. WSELs)<br />
SITE COEFF. ERROR 2,054 cfs 3,150 cfs 5,769 cfs 2,054 cfs 3,150 cfs 5,769 cfs<br />
29 8.36 0.5 0.4 0.7 0.3 0.01 0.01 0.01<br />
BETA %MEAN Calculated vs. Given Disch. (%) Difference (measured vs. pred. WSELs)<br />
SITE COEFF. ERROR 971 cfs 2,054 cfs 3,150 cfs 971 cfs 2,054 cfs 3,150 cfs<br />
30 3.26 5.2 3.6 8.3 4.2 0.03 0.07 0.04<br />
BETA %MEAN Calculated vs. Given Disch. (%) Difference (measured vs. pred. WSELs)<br />
SITE COEFF. ERROR 971 cfs 2,054 cfs 3,150 cfs 5,769 cfs 971 cfs 2,054 cfs 3,150 cfs 5,769 cfs<br />
31 4.34 1.2 0.5 1.9 1.9 0.5 0.01 0.03 0.04 0.01<br />
BETA %MEAN Calculated vs. Given Disch. (%) Difference (measured vs. pred. WSELs)<br />
SITE COEFF. ERROR 971 cfs 2,054 cfs 971 cfs 2,054 cfs<br />
32 3.65 --- --- --- 0.00 0.00<br />
34 3.03 --- --- --- 0.00 0.00<br />
USFWS, SFWO, Energy Planning <strong>and</strong> Instream Flow Branch<br />
Yuba River Redd Dewatering <strong>and</strong> Juvenile Str<strong>and</strong>ing Report<br />
September 15, 2010<br />
37
BETA %MEAN Calculated vs. Given Disch. (%) Difference (measured vs. pred. WSELs)<br />
SITE COEFF. ERROR 971 cfs 2,054 cfs 3,150 cfs 5,651 cfs 971 cfs 2,054 cfs 3,150 cfs 5,651 cfs<br />
35 3.15 1.6 1.3 1.5 1.6 1.8 0.01 0.01 0.02 0.02<br />
BETA %MEAN Calculated vs. Given Disch. (%) Difference (measured vs. pred. WSELs)<br />
SITE COEFF. ERROR 971 cfs 2,054 cfs 3,150 cfs 5,683 cfs 971 cfs 2,054 cfs 3,150 cfs 5,683 cfs<br />
36 2.34 1.8 1.9 2.7 0.9 1.7 0.02 0.04 0.01 0.03<br />
BETA %MEAN Calculated vs. Given Disch. (%) Difference (measured vs. pred. WSELs)<br />
SITE COEFF. ERROR 971 cfs 1,930 cfs 3,154 cfs 4,180 cfs 971 cfs 1,930 cfs 3,154 cfs 4,180 cfs<br />
37 2.71 5.0 5.5 8.7 1.7 4.4 0.04 0.08 0.02 0.05<br />
38 1.29 2.1 2.0 4.2 0.7 1.6 0.02 0.06 0.01 0.04<br />
BETA %MEAN Calculated vs. Given Disch. (%) Difference (measured vs. pred. WSELs)<br />
SITE COEFF. ERROR 971 cfs 1,930 cfs 3,150 cfs 4,180 cfs 971 cfs 1,930 cfs 3,150 cfs 4,180 cfs<br />
39 2.48 1.6 1.2 1.6 1.6 2.0 0.01 0.02 0.03 0.04<br />
40 2.78 3.4 3.0 4.2 2.7 3.7 0.03 0.05 0.04 0.06<br />
41 3.07 0.6 0.6 1.2 0.1 0.5 0.01 0.02 0.00 0.01<br />
42 4.26 2.9 2.1 2.2 3.5 3.5 0.03 0.04 0.07 0.08<br />
BETA %MEAN Calculated vs. Given Disch. (%) Difference (measured vs. pred. WSELs)<br />
SITE COEFF. ERROR 965 cfs 1,930 cfs 3,150 cfs 965 cfs 1,930 cfs 3,150 cfs<br />
43 2.61 3.0 2.1 4.6 2.4 0.02 0.07 0.04<br />
44 3.03 3.6 1.9 5.3 3.6 0.01 0.04 0.04<br />
45 2.55 13.2 2.3 17.8 18.9 0.01 0.09 0.09<br />
47 2.21 1.4 0.8 2.1 1.3 0.01 0.03 0.02<br />
BETA %MEAN Calculated vs. Given Disch. (%) Difference (measured vs. pred. WSELs)<br />
SITE COEFF. ERROR 943 cfs 1,740 cfs 2,509 cfs 3,674 cfs 943 cfs 1,740 cfs 2,509 cfs 3,674 cfs<br />
48 2.68 0.9 0.0 0.1 1.8 0.8 0.00 0.01 0.03 0.02<br />
USFWS, SFWO, Energy Planning <strong>and</strong> Instream Flow Branch<br />
Yuba River Redd Dewatering <strong>and</strong> Juvenile Str<strong>and</strong>ing Report<br />
September 15, 2010<br />
38
BETA %MEAN Calculated vs. Given Disch. (%) Difference (measured vs. pred. WSELs)<br />
SITE COEFF. ERROR 943 cfs 2,517 cfs 3,674 cfs 943 cfs 2,517 cfs 3,674 cfs<br />
49A 2.23 2.3 0.8 3.3 2.6 0.01 0.07 0.07<br />
BETA %MEAN Calculated vs. Given Disch. (%) Difference (measured vs. pred. WSELs)<br />
SITE COEFF. ERROR 943 cfs 1,740 cfs 2,509 cfs 943 cfs 1,740 cfs 2,509 cfs<br />
50A/B/C 2.27 2.7 1.3 4.0 2.9 0.02 0.08 0.05<br />
BETA %MEAN Calculated vs. Given Disch. (%) Difference (measured vs. pred. WSELs)<br />
SITE COEFF. ERROR 1,001 cfs 1,813 cfs 2,517 cfs 3,720 cfs 1,001 cfs 1,813 cfs 2,517 cfs 3,720 cfs<br />
55A/B 1.73 1.6 0.2 2.2 3.1 1.0 0.00 0.03 0.06 0.02<br />
58 1.81 2.7 1.8 5.2 2.9 0.7 0.02 0.10 0.07 0.02<br />
59A/B 3.92 1.4 0.3 1.1 2.8 1.4 0.00 0.02 0.05 0.02<br />
BETA %MEAN Calculated vs. Given Disch. (%) Difference (measured vs. pred. WSELs)<br />
SITE COEFF. ERROR 1,001 cfs 1,813 cfs 2,517 cfs 1,001 cfs 1,813 cfs 2,517 cfs<br />
57 3.05 3.7 1.4 5.4 4.2 0.01 0.07 0.05<br />
BETA %MEAN Calculated vs. Given Disch. (%) Difference (measured vs. pred. WSELs)<br />
SITE COEFF. ERROR 1,151 cfs 2,517 cfs 3,768 cfs 1,151 cfs 2,517 cfs 3,768 cfs<br />
61 1.38 0.1 0.0 0.1 0.1 0.00 0.00 0.00<br />
62 2.43 1.2 0.6 1.8 1.1 0.01 0.04 0.03<br />
BETA %MEAN Calculated vs. Given Disch. (%) Difference (measured vs. pred. WSELs)<br />
SITE COEFF. ERROR 1,151 cfs 2,823 cfs 1,151 cfs 2,823 cfs<br />
63A/B 2.62 --- --- --- 0.00 0.00<br />
BETA %MEAN Calculated vs. Given Disch. (%) Difference (measured vs. pred. WSELs)<br />
SITE COEFF. ERROR 1,151 cfs 2,823 cfs 3,768 cfs 1,151 cfs 2,823 cfs 3,768 cfs<br />
64 2.31 0.9 0.4 1.4 1.0 0.00 0.03 0.01<br />
USFWS, SFWO, Energy Planning <strong>and</strong> Instream Flow Branch<br />
Yuba River Redd Dewatering <strong>and</strong> Juvenile Str<strong>and</strong>ing Report<br />
September 15, 2010<br />
39
BETA %MEAN Calculated vs. Given Disch. (%) Difference (measured vs. pred. WSELs)<br />
SITE COEFF. ERROR 1,052 cfs 1,898 cfs 3,768 cfs 1,052 cfs 1,898 cfs 3,768 cfs<br />
66 2.26 2.7 2.0 4.0 2.1 0.03 0.08 0.06<br />
USFWS, SFWO, Energy Planning <strong>and</strong> Instream Flow Branch<br />
Yuba River Redd Dewatering <strong>and</strong> Juvenile Str<strong>and</strong>ing Report<br />
September 15, 2010<br />
40
USFWS, SFWO, Energy Planning <strong>and</strong> Instream Flow Branch<br />
Yuba River Redd Dewatering <strong>and</strong> Juvenile Str<strong>and</strong>ing Report<br />
September 15, 2010<br />
APPENDIX C<br />
JUVENILE STRANDING RESULTS<br />
41
Str<strong>and</strong>ing <strong>flow</strong> (cfs)<br />
USFWS, SFWO, Energy Planning <strong>and</strong> Instream Flow Branch<br />
Yuba River Redd Dewatering <strong>and</strong> Juvenile Str<strong>and</strong>ing Report<br />
September 15, 2010<br />
Area (ft 2 ) Str<strong>and</strong>ed Above Daguerre<br />
500 600 700 800 900 1,000 1,100 1,200 1,300 1,400 1,500 1,600 1,700 1,800 1,900 2,000<br />
4,300 Rearing Flow (cfs)<br />
4,100<br />
3,900<br />
3,700<br />
3,500<br />
3,300<br />
3,100<br />
2,900<br />
2,700<br />
2,500<br />
2,300<br />
2,100<br />
2,000<br />
1,900 41,046<br />
1,800 0 41,046<br />
1,700 1551 1551 42,597<br />
1,600 21,304 22,855 22,855 63,901<br />
1,500 1,339 22,643 24,194 24,194 65,240<br />
1,400 0 1,339 22,643 24,194 24,194 65,240<br />
1,300 0 0 1,339 22,643 24,194 24,194 65,240<br />
1,200 0 0 0 1,339 22,643 24,194 24,194 65,240<br />
1,100 1,246 1,246 1,246 1,246 2,585 23,889 25,440 25,440 66,486<br />
1,000 0 1,246 1,246 1,246 1,246 2,585 23,889 25,440 25,440 66,486<br />
900 0 0 1,246 1,246 1,246 1,246 2,585 23,889 25,440 25,440 66,486<br />
800 268 268 268 1,514 1,514 1,514 1,514 2,853 24,157 25,708 25,708 66,754<br />
700 0 268 268 268 1,514 1,514 1,514 1,514 2,853 24,157 25,708 25,708 66,754<br />
600 2,873 2,873 3,141 3,141 3,141 4,387 4,387 4,387 4,387 5,726 27,030 28,581 28,581 69,627<br />
500 18,967 21,840 21,840 22,108 22,108 22,108 23,354 23,354 23,354 23,354 24,693 45,997 47,548 47,548 88,594<br />
400 14,712 33,679 36,552 36,552 36,820 36,820 36,820 38,066 38,066 38,066 38,066 39,405 60,709 62,260 62,260 103,306<br />
42
Str<strong>and</strong>ing <strong>flow</strong> (cfs)<br />
USFWS, SFWO, Energy Planning <strong>and</strong> Instream Flow Branch<br />
Yuba River Redd Dewatering <strong>and</strong> Juvenile Str<strong>and</strong>ing Report<br />
September 15, 2010<br />
Area (ft 2 ) Str<strong>and</strong>ed Above Daguerre (continued)<br />
2,100 2,300 2,500 2,700 2,900 3,100 3,300 3,500 3,700 3,900 4,100 4,300 4,500<br />
4,300 Rearing Flow (cfs) 0<br />
4,100 0 0<br />
3,900 2,068 2,068 2,068<br />
3,700 0 2,068 2,068 2,068<br />
3,500 237,894 237,894 239,962 239,962 239,962<br />
3,300 4,403 242,297 242,297 244,365 244,365 244,365<br />
3,100 8,740 13,143 251,037 251,037 253,105 253,105 253,105<br />
2,900 0 8,740 13,143 251,037 251,037 253,105 253,105 253,105<br />
2,700 5,625 5,625 14,365 18,768 256,662 256,662 258,730 258,730 258,730<br />
2,500 0 5,625 5,625 14,365 18,768 256,662 256,662 258,730 258,730 258,730<br />
2,300 175,330 175,330 180,955 180,955 189,695 194,098 431,992 431,992 434,060 434,060 434,060<br />
2,100 7,609 182,939 182,939 188,564 188,564 197,304 201,707 439,601 439,601 441,669 441,669 441,669<br />
2,000 0 7,609 182,939 182,939 188,564 188,564 197,304 201,707 439,601 439,601 441,669 441,669 441,669<br />
1,900 41,046 48,655 223,985 223,985 229,610 229,610 238,350 242,753 480,647 480,647 482,715 482,715 482,715<br />
1,800 41,046 48,655 223,985 223,985 229,610 229,610 238,350 242,753 480,647 480,647 482,715 482,715 482,715<br />
1,700 42,597 50,206 225,536 225,536 231,161 231,161 239,901 244,304 482,198 482,198 484,266 484,266 484,266<br />
1,600 63,901 71,510 246,840 246,840 252,465 252,465 261,205 265,608 503,502 503,502 505,570 505,570 505,570<br />
1,500 65,240 72,849 248,179 248,179 253,804 253,804 262,544 266,947 504,841 504,841 506,909 506,909 506,909<br />
1,400 65,240 72,849 248,179 248,179 253,804 253,804 262,544 266,947 504,841 504,841 506,909 506,909 506,909<br />
1,300 65,240 72,849 248,179 248,179 253,804 253,804 262,544 266,947 504,841 504,841 506,909 506,909 506,909<br />
1,200 65,240 72,849 248,179 248,179 253,804 253,804 262,544 266,947 504,841 504,841 506,909 506,909 506,909<br />
1,100 66,486 74,095 249,425 249,425 255,050 255,050 263,790 268,193 506,087 506,087 508,155 508,155 508,155<br />
1,000 66,486 74,095 249,425 249,425 255,050 255,050 263,790 268,193 506,087 506,087 508,155 508,155 508,155<br />
900 66,486 74,095 249,425 249,425 255,050 255,050 263,790 268,193 506,087 506,087 508,155 508,155 508,155<br />
800 66,754 74,363 249,693 249,693 255,318 255,318 264,058 268,461 506,355 506,355 508,423 508,423 508,423<br />
700 66,754 74,363 249,693 249,693 255,318 255,318 264,058 268,461 506,355 506,355 508,423 508,423 508,423<br />
600 69,627 77,236 252,566 252,566 258,191 258,191 266,931 271,334 509,228 509,228 511,296 511,296 511,296<br />
500 88,594 96,203 271,533 271,533 277,158 277,158 285,898 290,301 528,195 528,195 530,263 530,263 530,263<br />
400 103,306 110,915 286,245 286,245 291,870 291,870 300,610 305,013 542,907 542,907 544,975 544,975 544,975<br />
43
Str<strong>and</strong>ing <strong>flow</strong> (cfs)<br />
USFWS, SFWO, Energy Planning <strong>and</strong> Instream Flow Branch<br />
Yuba River Redd Dewatering <strong>and</strong> Juvenile Str<strong>and</strong>ing Report<br />
September 15, 2010<br />
Area (ft 2 ) Str<strong>and</strong>ed Below Daguerre<br />
250 300 350 400 500 600 700 800 900 1,000 1,100 1,200 1,300 1,400 1,500 1,600<br />
4,100 Rearing Flow (cfs)<br />
3,700<br />
3,300<br />
2,900<br />
2,700<br />
2,500<br />
2,300<br />
2,100<br />
2,000<br />
1,900<br />
1,800<br />
1,700<br />
1,600<br />
1,500 0<br />
1,400 0 0<br />
1,300 0 0 0<br />
1,200 420 420 420 420<br />
1,100 250,049 250,469 250,469 250,469 250,469<br />
1,000 36,339 286,388 286,808 286,808 286,808 286,808<br />
900 24,117 60,456 310,505 310,925 310,925 310,925 310,925<br />
800 4,613 28,730 65,069 315,118 315,538 315,538 315,538 315,538<br />
700 25,393 30,006 54,123 90,462 340,511 340,931 340,931 340,931 340,931<br />
600 0 25,393 30,006 54,123 90,462 340,511 340,931 340,931 340,931 340,931<br />
500 0 0 25,393 30,006 54,123 90,462 340,511 340,931 340,931 340,931 340,931<br />
400 19,190 19,190 19,190 44,583 49,196 73,313 109,652 359,701 360,121 360,121 360,121 360,121<br />
350 67,904 87,094 87,094 87,094 112,487 117,100 141,217 177,556 427,605 428,025 428,025 428,025 428,025<br />
300 10,337 78,241 97,431 97,431 97,431 122,824 127,437 151,554 187,893 437,942 438,362 438,362 438,362 438,362<br />
250 0 10,337 78,241 97,431 97,431 97,431 122,824 127,437 151,554 187,893 437,942 438,362 438,362 438,362 438,362<br />
150 0 0 10,337 78,241 97,431 97,431 97,431 122,824 127,437 151,554 187,893 437,942 438,362 438,362 438,362 438,362<br />
44
Str<strong>and</strong>ing <strong>flow</strong> (cfs)<br />
USFWS, SFWO, Energy Planning <strong>and</strong> Instream Flow Branch<br />
Yuba River Redd Dewatering <strong>and</strong> Juvenile Str<strong>and</strong>ing Report<br />
September 15, 2010<br />
Area (ft 2 ) Str<strong>and</strong>ed Below Daguerre (continued)<br />
1,700 1,800 1,900 2,000 2,100 2,300 2,500 2,700 2,900 3,300 3,700 4,100 4,500<br />
4,100 Rearing Flow (cfs) 3,460<br />
3,700 330 3,790<br />
3,300 861 1,191 4,651<br />
2,900 5,985 6,846 7,176 10,636<br />
2,700 15 6,000 6,861 7,191 10,651<br />
2,500 960 975 6,960 7,821 8,151 11,611<br />
2,300 27,141 28,101 28,116 34,101 34,962 35,292 38,752<br />
2,100 10,989 38,130 39,090 39,105 45,090 45,951 46,281 49,741<br />
2,000 4,205 15,194 42,335 43,295 43,310 49,295 50,156 50,486 53,946<br />
1,900 9,985 14,190 25,179 52,320 53,280 53,295 59,280 60,141 60,471 63,931<br />
1,800 2,427 12,412 16,617 27,606 54,747 55,707 55,722 61,707 62,568 62,898 66,358<br />
1,700 0 2,427 12,412 16,617 27,606 54,747 55,707 55,722 61,707 62,568 62,898 66,358<br />
1,600 3,231 3,231 5,658 15,643 19,848 30,837 57,978 58,938 58,953 64,938 65,799 66,129 69,589<br />
1,500 3,231 3,231 5,658 15,643 19,848 30,837 57,978 58,938 58,953 64,938 65,799 66,129 69,589<br />
1,400 3,231 3,231 5,658 15,643 19,848 30,837 57,978 58,938 58,953 64,938 65,799 66,129 69,589<br />
1,300 3,231 3,231 5,658 15,643 19,848 30,837 57,978 58,938 58,953 64,938 65,799 66,129 69,589<br />
1,200 3,651 3,651 6,078 16,063 20,268 31,257 58,398 59,358 59,373 65,358 66,219 66,549 70,009<br />
1,100 253,700 253,700 256,127 266,112 270,317 281,306 308,447 309,407 309,422 315,407 316,268 316,598 320,058<br />
1,000 290,039 290,039 292,466 302,451 306,656 317,645 344,786 345,746 345,761 351,746 352,607 352,937 356,397<br />
900 314,156 314,156 316,583 326,568 330,773 341,762 368,903 369,863 369,878 375,863 376,724 377,054 380,514<br />
800 318,769 318,769 321,196 331,181 335,386 346,375 373,516 374,476 374,491 380,476 381,337 381,667 385,127<br />
700 344,162 344,162 346,589 356,574 360,779 371,768 398,909 399,869 399,884 405,869 406,730 407,060 410,520<br />
600 344,162 344,162 346,589 356,574 360,779 371,768 398,909 399,869 399,884 405,869 406,730 407,060 410,520<br />
500 344,162 344,162 346,589 356,574 360,779 371,768 398,909 399,869 399,884 405,869 406,730 407,060 410,520<br />
400 363,352 363,352 365,779 375,764 379,969 390,958 418,099 419,059 419,074 425,059 425,920 426,250 429,710<br />
350 431,256 431,256 433,683 443,668 447,873 458,862 486,003 486,963 486,978 492,963 493,824 494,154 497,614<br />
300 441,593 441,593 444,020 454,005 458,210 469,199 496,340 497,300 497,315 503,300 504,161 504,491 507,951<br />
250 441,593 441,593 444,020 454,005 458,210 469,199 496,340 497,300 497,315 503,300 504,161 504,491 507,951<br />
150 441,593 441,593 444,020 454,005 458,210 469,199 496,340 497,300 497,315 503,300 504,161 504,491 507,951<br />
45
USFWS, SFWO, Energy Planning <strong>and</strong> Instream Flow Branch<br />
Yuba River Redd Dewatering <strong>and</strong> Juvenile Str<strong>and</strong>ing Report<br />
September 15, 2010<br />
APPENDIX D<br />
REDD DEWATERING RESULTS<br />
46
Dewatering <strong>flow</strong> (cfs)<br />
USFWS, SFWO, Energy Planning <strong>and</strong> Instream Flow Branch<br />
Yuba River Redd Dewatering <strong>and</strong> Juvenile Str<strong>and</strong>ing Report<br />
September 15, 2010<br />
Percentage of Fall-run Chinook Salmon Redds Dewatered Above Daguerre<br />
500 600 700 800 900 1,000 1,100 1,200 1,300 1,400 1,500 1,600 1,700 1,800 1,900 2,000<br />
4,300 Spawning Flow (cfs)<br />
4,100<br />
3,900<br />
3,700<br />
3,500<br />
3,300<br />
3,100<br />
2,900<br />
2,700<br />
2,500<br />
2,300<br />
2,100<br />
2,000<br />
1,900 0.9%<br />
1,800 0.8% 1.9%<br />
1,700 0.8% 1.7% 3.1%<br />
1,600 0.9% 1.9% 3.1% 4.8%<br />
1,500 0.8% 1.9% 3.3% 4.7% 6.5%<br />
1,400 0.9% 1.7% 3.1% 4.7% 6.4% 8.3%<br />
1,300 1.1% 2.0% 3.1% 4.7% 6.5% 8.2% 10.3%<br />
1,200 1.3% 2.5% 3.9% 5.4% 7.2% 9.2% 11.1% 13.4%<br />
1,100 1.7% 3.2% 4.9% 6.6% 8.4% 10.4% 12.7% 14.8% 17.2%<br />
1,000 1.6% 3.1% 5.0% 7.0% 8.9% 10.9% 13.0% 15.3% 17.6% 20.1%<br />
900 1.7% 3.3% 5.3% 7.5% 9.8% 12.0% 14.1% 16.4% 18.9% 21.2% 23.8%<br />
800 2.1% 3.8% 5.9% 8.3% 10.8% 13.2% 15.6% 17.9% 20.3% 22.8% 25.1% 27.7%<br />
700 2.7% 5.4% 7.8% 10.4% 13.1% 15.8% 18.4% 20.9% 23.1% 25.5% 28.0% 30.4% 32.9%<br />
600 3.2% 6.6% 10.1% 13.2% 16.3% 19.3% 22.2% 24.9% 27.5% 29.8% 32.2% 34.6% 36.9% 39.3%<br />
500 3.7% 7.9% 12.3% 16.4% 19.8% 23.0% 26.1% 29.0% 31.7% 34.2% 36.4% 38.7% 41.1% 43.3% 45.6%<br />
400 2.6% 8.1% 13.3% 18.2% 22.6% 26.3% 29.7% 32.9% 35.7% 38.4% 40.8% 43.0% 45.2% 47.5% 49.6% 51.8%<br />
47
Dewatering <strong>flow</strong> (cfs)<br />
USFWS, SFWO, Energy Planning <strong>and</strong> Instream Flow Branch<br />
Yuba River Redd Dewatering <strong>and</strong> Juvenile Str<strong>and</strong>ing Report<br />
September 15, 2010<br />
Percentage of Fall-run Chinook Salmon Redds Dewatered Above Daguerre (continued)<br />
2,100 2,300 2,500 2,700 2,900 3,100 3,300 3,500 3,700 3,900 4,100 4,300 4,500<br />
4,300 Spawning Flow (cfs) 1.5%<br />
4,100 2.2% 4.5%<br />
3,900 1.9% 4.7% 7.9%<br />
3,700 1.7% 3.9% 7.3% 10.9%<br />
3,500 1.6% 3.6% 6.4% 10.2% 14.0%<br />
3,300 1.8% 4.2% 6.9% 10.2% 14.2% 18.3%<br />
3,100 2.2% 4.7% 7.9% 11.1% 14.7% 19.0% 23.2%<br />
2,900 1.8% 4.5% 7.7% 11.4% 14.8% 18.6% 23.0% 27.3%<br />
2,700 2.0% 4.0% 7.4% 11.2% 15.4% 19.1% 23.2% 27.8% 32.3%<br />
2,500 1.5% 3.9% 6.5% 10.2% 14.3% 18.6% 22.4% 26.6% 31.1% 35.5%<br />
2,300 1.8% 4.2% 7.3% 10.3% 14.3% 18.6% 23.1% 27.1% 31.2% 35.7% 40.0%<br />
2,100 2.2% 5.1% 8.5% 12.5% 15.9% 20.3% 24.9% 29.4% 32.7% 36.9% 42.0% 46.1%<br />
2,000 1.0% 3.6% 7.0% 10.8% 14.9% 18.6% 23.1% 27.7% 32.3% 36.3% 40.4% 44.7% 48.7%<br />
1,900 2.0% 5.3% 9.0% 13.0% 17.3% 21.1% 25.7% 30.3% 34.8% 38.8% 42.9% 47.1% 51.0%<br />
1,800 3.5% 7.2% 11.2% 15.4% 19.9% 23.8% 28.4% 33.0% 37.5% 41.5% 45.4% 49.6% 53.4%<br />
1,700 4.8% 8.9% 13.1% 17.6% 22.2% 26.1% 30.7% 35.3% 39.7% 43.6% 47.5% 51.6% 55.3%<br />
1,600 6.7% 10.9% 15.3% 19.7% 24.3% 28.3% 32.8% 37.3% 41.7% 45.5% 49.3% 53.3% 56.9%<br />
1,500 8.6% 13.1% 17.5% 22.1% 26.7% 30.6% 35.2% 39.6% 42.2% 47.7% 51.4% 55.2% 58.8%<br />
1,400 10.5% 15.1% 19.7% 24.2% 28.8% 32.7% 37.1% 41.5% 45.7% 49.4% 53.1% 56.8% 60.4%<br />
1,300 12.5% 17.1% 21.6% 26.1% 30.7% 34.4% 38.8% 43.0% 47.1% 50.7% 54.3% 58.0% 61.4%<br />
1,200 15.8% 20.6% 25.3% 29.9% 34.3% 38.0% 42.2% 46.3% 50.3% 53.7% 57.2% 60.7% 64.0%<br />
1,100 19.7% 24.6% 29.3% 33.8% 38.2% 41.7% 45.8% 49.7% 53.4% 56.7% 60.0% 63.4% 66.5%<br />
1,000 22.6% 27.6% 32.3% 36.7% 41.0% 44.5% 48.4% 52.2% 55.8% 59.0% 62.2% 65.4% 68.5%<br />
900 26.3% 31.2% 35.8% 40.2% 44.3% 47.6% 51.4% 55.0% 58.4% 61.5% 64.5% 67.6% 70.5%<br />
800 30.3% 35.2% 39.6% 43.8% 47.8% 51.0% 54.6% 58.1% 61.4% 64.3% 67.2% 70.2% 72.9%<br />
700 35.5% 40.2% 44.5% 48.5% 52.3% 55.4% 58.8% 62.0% 65.1% 67.8% 70.5% 73.2% 75.7%<br />
600 41.8% 46.3% 50.3% 54.1% 57.6% 60.5% 63.6% 66.5% 69.3% 71.8% 74.1% 76.6% 78.8%<br />
500 48.0% 52.2% 56.0% 59.5% 62.7% 65.4% 68.2% 70.9% 73.3% 75.5% 77.6% 79.8% 81.7%<br />
400 54.1% 58.0% 61.5% 64.7% 67.6% 70.1% 72.6% 75.0% 77.2% 79.1% 81.0% 82.8% 84.5%<br />
48
Dewatering <strong>flow</strong> (cfs)<br />
USFWS, SFWO, Energy Planning <strong>and</strong> Instream Flow Branch<br />
Yuba River Redd Dewatering <strong>and</strong> Juvenile Str<strong>and</strong>ing Report<br />
September 15, 2010<br />
Percentage of Fall-run Chinook Salmon Redds Dewatered Below Daguerre<br />
250 300 350 400 500 600 700 800 900 1,000 1,100 1,200 1,300 1,400 1,500 1,600<br />
4,100 Spawning Flow (cfs)<br />
3,700<br />
3,300<br />
2,900<br />
2,700<br />
2,500<br />
2,300<br />
2,100<br />
2,000<br />
1,900<br />
1,800<br />
1,700<br />
1,600<br />
1,500 1.9%<br />
1,400 2.4% 4.4%<br />
1,300 2.1% 4.5% 7.0%<br />
1,200 2.1% 4.4% 7.5% 10.3%<br />
1,100 2.8% 5.6% 8.7% 12.2% 15.3%<br />
1,000 2.7% 6.7% 10.3% 13.8% 17.5% 20.7%<br />
900 2.8% 6.2% 10.8% 14.9% 18.6% 22.4% 25.7%<br />
800 3.4% 7.0% 11.3% 16.3% 20.6% 24.4% 28.3% 31.6%<br />
700 3.3% 7.0% 11.3% 16.0% 21.2% 25.5% 29.4% 33.1% 36.4%<br />
600 4.1% 8.4% 13.0% 17.9% 22.8% 28.0% 32.2% 36.0% 39.6% 42.7%<br />
500 4.4% 9.5% 14.6% 19.6% 24.7% 29.6% 34.5% 38.6% 42.2% 45.6% 48.6%<br />
400 5.0% 10.1% 15.8% 21.2% 26.2% 31.1% 35.9% 40.6% 44.4% 47.9% 51.2% 54.0%<br />
350 3.1% 8.2% 13.8% 19.6% 25.1% 30.1% 34.9% 39.5% 44.0% 47.8% 51.1% 54.2% 57.0%<br />
300 3.6% 6.3% 12.4% 18.4% 24.2% 29.7% 34.6% 39.3% 43.7% 48.0% 51.6% 54.8% 57.8% 60.4%<br />
250 4.1% 7.0% 10.3% 16.9% 23.1% 29.0% 34.5% 39.3% 43.8% 48.1% 52.2% 55.6% 58.7% 61.6% 64.1%<br />
150 12.1% 16.5% 20.7% 24.6% 31.8% 37.7% 43.1% 48.0% 52.2% 56.1% 59.8% 63.4% 66.3% 69.0% 71.4% 73.6%<br />
49
Dewatering <strong>flow</strong> (cfs)<br />
USFWS, SFWO, Energy Planning <strong>and</strong> Instream Flow Branch<br />
Yuba River Redd Dewatering <strong>and</strong> Juvenile Str<strong>and</strong>ing Report<br />
September 15, 2010<br />
Percentage of Fall-run Chinook Salmon Redds Dewatered Below Daguerre (continued)<br />
1,700 1,800 1,900 2,000 2,100 2,300 2,500 2,700 2,900 3,300 3,700 4,100 4,500<br />
4,100 Spawning Flow (cfs) 4.5%<br />
3,700 3.8% 11.6%<br />
3,300 3.6% 10.8% 19.9%<br />
2,900 4.1% 10.5% 19.1% 28.6%<br />
2,700 1.4% 7.3% 14.3% 23.1% 32.6%<br />
2,500 1.6% 4.1% 11.0% 18.7% 27.7% 37.1%<br />
2,300 1.8% 4.8% 8.0% 15.5% 23.4% 32.4% 41.7%<br />
2,100 2.3% 5.6% 9.5% 13.2% 21.2% 29.1% 37.9% 47.1%<br />
2,000 0.9% 3.4% 7.0% 10.9% 16.6% 23.0% 30.9% 39.7% 48.8%<br />
1,900 1.8% 2.9% 6.8% 11.0% 15.3% 19.4% 27.8% 35.7% 44.5% 53.4%<br />
1,800 1.3% 3.6% 4.9% 9.3% 13.8% 18.3% 22.6% 31.0% 38.9% 47.6% 56.3%<br />
1,700 2.1% 4.1% 7.4% 8.9% 13.9% 18.8% 23.6% 27.9% 36.3% 44.2% 52.7% 61.0%<br />
1,600 2.1% 4.5% 7.2% 10.9% 14.2% 18.1% 23.1% 28.0% 32.4% 40.8% 48.7% 56.9% 64.9%<br />
1,500 3.9% 6.9% 9.8% 13.8% 15.6% 21.3% 26.5% 31.4% 35.8% 44.1% 51.9% 60.0% 67.8%<br />
1,400 7.2% 10.4% 13.6% 17.9% 19.7% 25.4% 30.7% 35.6% 39.9% 48.2% 56.0% 63.9% 71.4%<br />
1,300 10.0% 13.6% 16.9% 21.2% 23.1% 28.8% 34.0% 38.7% 43.0% 51.2% 58.8% 66.5% 73.7%<br />
1,200 13.6% 17.3% 20.6% 25.0% 26.9% 32.6% 37.7% 42.4% 46.6% 54.5% 61.9% 69.3% 76.2%<br />
1,100 18.7% 22.3% 25.7% 29.9% 31.8% 37.4% 42.3% 46.9% 51.1% 58.8% 66.0% 73.0% 79.3%<br />
1,000 24.2% 27.9% 31.2% 35.3% 37.2% 42.6% 47.4% 51.9% 55.9% 63.4% 70.3% 76.8% 82.6%<br />
900 29.2% 32.8% 36.1% 40.0% 41.9% 47.2% 51.9% 56.2% 60.1% 67.4% 74.0% 80.1% 85.4%<br />
800 34.9% 38.4% 41.5% 45.2% 47.1% 52.2% 56.7% 60.9% 64.7% 71.6% 77.9% 83.6% 88.3%<br />
700 39.6% 43.0% 46.0% 49.6% 51.5% 56.4% 60.7% 64.7% 68.4% 75.1% 81.0% 86.2% 90.4%<br />
600 45.8% 49.0% 51.8% 55.2% 56.9% 61.5% 65.6% 69.4% 72.8% 78.9% 84.4% 89.0% 92.6%<br />
500 51.6% 54.6% 57.3% 60.4% 62.1% 66.4% 70.2% 73.7% 76.9% 82.6% 87.5% 91.5% 94.5%<br />
400 56.9% 59.7% 62.2% 65.1% 66.7% 70.7% 74.2% 77.4% 80.3% 85.5% 89.8% 93.2% 95.7%<br />
350 59.8% 62.4% 64.9% 67.7% 69.2% 73.0% 76.3% 79.4% 82.2% 87.0% 91.0% 94.1% 96.4%<br />
300 63.1% 65.6% 68.0% 70.6% 72.1% 75.7% 78.8% 81.7% 84.2% 88.7% 92.3% 95.1% 97.0%<br />
250 66.6% 69.0% 71.2% 73.7% 75.0% 78.4% 81.4% 84.0% 86.4% 90.4% 93.6% 96.0% 97.6%<br />
150 75.6% 77.6% 79.4% 81.3% 82.5% 85.1% 87.5% 89.5% 91.4% 94.3% 96.5% 98.0% 98.9%<br />
50
Dewatering <strong>flow</strong> (cfs)<br />
USFWS, SFWO, Energy Planning <strong>and</strong> Instream Flow Branch<br />
Yuba River Redd Dewatering <strong>and</strong> Juvenile Str<strong>and</strong>ing Report<br />
September 15, 2010<br />
Percentage of Spring-run Chinook Salmon Redds Dewatered Above Daguerre<br />
500 600 700 800 900 1,000 1,100 1,200 1,300 1,400 1,500 1,600 1,700 1,800 1,900 2,000<br />
4,300 Spawning Flow (cfs)<br />
4,100<br />
3,900<br />
3,700<br />
3,500<br />
3,300<br />
3,100<br />
2,900<br />
2,700<br />
2,500<br />
2,300<br />
2,100<br />
2,000<br />
1,900 0.3%<br />
1,800 0.3% 0.6%<br />
1,700 0.3% 0.5% 1.0%<br />
1,600 0.3% 0.7% 1.2% 1.8%<br />
1,500 0.2% 0.6% 1.1% 1.7% 2.6%<br />
1,400 0.3% 0.5% 1.0% 1.7% 2.4% 3.4%<br />
1,300 0.4% 0.8% 1.2% 2.0% 2.8% 3.6% 4.7%<br />
1,200 0.5% 1.0% 1.7% 2.3% 3.3% 4.2% 5.2% 6.5%<br />
1,100 0.6% 1.3% 2.2% 3.1% 4.0% 5.3% 6.4% 7.6% 9.1%<br />
1,000 0.6% 1.2% 2.2% 3.2% 4.3% 5.4% 6.7% 8.0% 9.3% 10.9%<br />
900 0.8% 1.3% 2.2% 3.4% 4.7% 6.1% 7.4% 8.9% 10.4% 11.9% 13.7%<br />
800 0.9% 1.8% 2.5% 3.7% 5.2% 6.7% 8.3% 9.8% 11.5% 13.1% 14.7% 16.5%<br />
700 1.0% 2.3% 3.9% 5.2% 6.9% 8.7% 10.6% 12.6% 14.4% 16.4% 18.3% 20.2% 22.2%<br />
600 1.2% 2.7% 4.7% 6.9% 8.9% 11.2% 13.6% 16.0% 18.4% 20.6% 23.0% 25.1% 27.1% 29.2%<br />
500 1.4% 3.3% 5.7% 8.5% 11.4% 13.9% 16.6% 19.3% 22.1% 24.8% 27.2% 29.7% 31.9% 34.1% 36.2%<br />
400 1.8% 3.8% 6.5% 9.5% 12.9% 16.4% 19.4% 22.5% 25.5% 28.4% 31.2% 33.6% 36.1% 38.4% 40.5% 42.6%<br />
51
Dewatering <strong>flow</strong> (cfs)<br />
Percentage of Spring-run Chinook Salmon Redds Dewatered Above Daguerre (continued)<br />
2,100 2,300 2,500 2,700 2,900 3,100 3,300 3,500 3,700 3,900 4,100 4,300 4,500<br />
4,300 Spawning Flow (cfs) 0.5%<br />
4,100 0.8% 2.0%<br />
3,900 0.7% 1.9% 3.5%<br />
3,700 0.6% 1.6% 3.2% 5.4%<br />
3,500 0.6% 1.5% 2.9% 5.0% 7.5%<br />
3,300 0.7% 1.8% 3.4% 5.4% 8.1% 11.2%<br />
3,100 0.9% 2.4% 4.4% 6.6% 9.3% 12.5% 16.1%<br />
2,900 0.7% 1.8% 3.8% 6.3% 9.0% 12.1% 15.8% 19.8%<br />
2,700 0.7% 1.6% 3.2% 5.6% 8.5% 11.5% 15.0% 19.1% 23.4%<br />
2,500 0.5% 1.4% 2.8% 4.7% 7.5% 10.7% 14.1% 17.9% 22.3% 26.9%<br />
2,300 0.8% 1.7% 3.2% 5.4% 8.0% 11.3% 15.2% 19.0% 23.2% 28.0% 32.8%<br />
2,100 0.7% 2.0% 3.6% 5.9% 8.6% 10.5% 16.1% 20.5% 24.9% 29.7% 34.8% 39.8%<br />
2,000 0.3% 1.3% 3.0% 4.9% 7.5% 10.6% 14.3% 18.7% 23.5% 28.1% 33.0% 38.1% 43.2%<br />
1,900 0.7% 2.0% 4.0% 6.3% 9.2% 12.5% 16.5% 21.2% 26.2% 30.9% 35.9% 41.1% 46.2%<br />
1,800 1.3% 2.9% 5.2% 7.8% 11.0% 14.6% 18.9% 23.9% 29.0% 33.9% 39.0% 44.3% 49.3%<br />
1,700 1.8% 3.7% 6.3% 9.0% 12.5% 16.3% 20.8% 26.0% 31.3% 36.3% 41.5% 46.8% 51.9%<br />
1,600 2.8% 5.1% 7.9% 10.9% 14.6% 18.6% 23.2% 28.5% 33.8% 38.8% 44.0% 49.3% 54.2%<br />
1,500 3.6% 6.2% 9.3% 12.7% 16.6% 20.8% 25.6% 31.0% 36.4% 41.4% 46.5% 51.6% 56.5%<br />
1,400 4.6% 7.4% 10.7% 14.3% 18.3% 22.7% 27.6% 33.0% 38.3% 43.3% 48.4% 53.5% 58.2%<br />
1,300 6.1% 9.0% 12.4% 15.9% 19.9% 24.2% 29.0% 34.3% 39.5% 44.4% 49.4% 54.3% 59.0%<br />
1,200 8.0% 11.3% 15.1% 19.0% 23.2% 27.8% 32.8% 38.3% 43.6% 48.5% 53.5% 58.4% 62.9%<br />
1,100 10.7% 14.3% 18.2% 22.3% 26.6% 31.2% 36.2% 41.6% 46.9% 51.7% 56.5% 61.2% 65.6%<br />
1,000 12.6% 16.3% 20.4% 24.5% 28.9% 33.5% 38.4% 43.8% 49.0% 53.7% 58.5% 63.1% 67.3%<br />
900 15.6% 19.6% 23.9% 28.2% 32.8% 37.4% 42.3% 47.6% 52.7% 57.3% 61.9% 66.2% 70.3%<br />
800 18.4% 22.5% 26.8% 31.1% 35.6% 40.2% 45.0% 50.2% 55.2% 59.7% 64.2% 68.4% 72.3%<br />
700 24.2% 28.4% 32.7% 36.9% 41.3% 45.7% 50.3% 55.2% 59.9% 64.1% 68.1% 72.0% 75.6%<br />
600 31.3% 35.4% 39.6% 43.5% 47.7% 51.7% 55.9% 60.3% 64.5% 68.3% 71.9% 75.3% 78.5%<br />
500 38.3% 42.3% 46.3% 50.3% 54.1% 57.8% 61.6% 65.7% 69.5% 72.9% 76.1% 79.1% 81.9%<br />
400 44.6% 48.4% 52.2% 55.8% 59.4% 62.7% 66.2% 69.9% 73.2% 76.2% 79.1% 81.9% 84.3%<br />
USFWS, SFWO, Energy Planning <strong>and</strong> Instream Flow Branch<br />
Yuba River Redd Dewatering <strong>and</strong> Juvenile Str<strong>and</strong>ing Report<br />
September 15, 2010<br />
52
Dewatering <strong>flow</strong> (cfs)<br />
USFWS, SFWO, Energy Planning <strong>and</strong> Instream Flow Branch<br />
Yuba River Redd Dewatering <strong>and</strong> Juvenile Str<strong>and</strong>ing Report<br />
September 15, 2010<br />
Percentage of Spring-run Chinook Salmon Redds Dewatered Below Daguerre<br />
250 300 350 400 500 600 700 800 900 1,000 1,100 1,200 1,300 1,400 1,500 1,600<br />
4,100 Spawning Flow (cfs)<br />
3,700<br />
3,300<br />
2,900<br />
2,700<br />
2,500<br />
2,300<br />
2,100<br />
2,000<br />
1,900<br />
1,800<br />
1,700<br />
1,600<br />
1,500 0.8%<br />
1,400 0.8% 1.8%<br />
1,300 0.8% 2.0% 3.5%<br />
1,200 0.9% 2.1% 4.0% 6.1%<br />
1,100 1.1% 2.8% 4.8% 7.4% 10.1%<br />
1,000 1.2% 3.0% 5.7% 8.6% 12.0% 15.3%<br />
900 1.2% 3.0% 6.0% 9.6% 13.2% 17.2% 20.9%<br />
800 1.4% 3.2% 6.0% 9.7% 14.1% 18.5% 23.0% 27.2%<br />
700 1.3% 3.4% 6.0% 9.6% 14.2% 19.2% 23.9% 28.9% 33.3%<br />
600 1.4% 3.8% 6.9% 10.7% 15.2% 20.6% 26.1% 31.2% 36.2% 40.7%<br />
500 1.7% 4.2% 7.8% 12.0% 16.7% 21.8% 27.7% 33.3% 38.4% 43.5% 47.8%<br />
400 1.9% 5.0% 8.6% 13.0% 18.2% 23.0% 28.4% 34.4% 39.9% 44.9% 49.6% 53.7%<br />
350 0.9% 3.3% 6.9% 10.8% 15.7% 20.8% 26.2% 31.7% 37.6% 43.0% 47.9% 52.5% 56.4%<br />
300 1.0% 2.1% 5.4% 9.6% 14.1% 19.6% 25.1% 30.7% 36.3% 42.2% 47.4% 52.1% 56.5% 60.3%<br />
250 1.2% 2.4% 4.0% 8.1% 12.8% 17.7% 23.3% 29.1% 34.7% 40.3% 46.1% 51.2% 55.8% 60.0% 63.6%<br />
150 5.4% 8.1% 10.8% 13.6% 19.6% 25.6% 31.3% 37.3% 42.9% 48.2% 53.3% 58.6% 63.2% 67.2% 70.9% 73.9%<br />
53
Dewatering <strong>flow</strong> (cfs)<br />
Percentage of Spring-run Chinook Salmon Redds Dewatered Below Daguerre (continued)<br />
1,700 1,800 1,900 2,000 2,100 2,300 2,500 2,700 2,900 3,300 3,700 4,100 4,500<br />
4,100 Spawning Flow (cfs) 2.6%<br />
3,700 1.6% 7.4%<br />
3,300 1.6% 6.3% 15.2%<br />
2,900 2.4% 7.4% 15.4% 27.0%<br />
2,700 0.5% 4.0% 10.1% 19.0% 31.3%<br />
2,500 0.5% 1.9% 6.9% 14.2% 24.2% 36.8%<br />
2,300 0.6% 2.3% 4.6% 11.2% 19.6% 30.1% 42.7%<br />
2,100 0.8% 2.7% 5.6% 9.1% 17.7% 27.4% 38.2% 50.1%<br />
2,000 0.3% 1.5% 3.7% 7.0% 10.7% 20.2% 30.6% 41.7% 53.5%<br />
1,900 0.7% 1.0% 3.2% 6.4% 10.5% 15.1% 25.7% 36.8% 47.9% 59.1%<br />
1,800 0.5% 1.6% 2.2% 5.1% 8.9% 13.7% 18.9% 30.3% 41.6% 52.4% 63.0%<br />
1,700 0.7% 1.8% 3.7% 4.6% 8.7% 13.6% 19.4% 25.5% 38.0% 49.7% 59.9% 69.5%<br />
1,600 0.7% 1.7% 3.4% 5.7% 6.8% 11.7% 17.4% 23.7% 30.2% 43.2% 54.8% 64.5% 73.4%<br />
1,500 1.6% 3.1% 4.9% 7.9% 9.2% 14.6% 20.9% 27.7% 34.5% 47.7% 59.1% 68.3% 76.4%<br />
1,400 3.1% 5.0% 7.2% 10.9% 12.3% 18.6% 25.5% 32.8% 39.7% 52.9% 63.8% 72.3% 79.9%<br />
1,300 5.3% 7.6% 10.3% 14.4% 16.1% 22.9% 30.1% 37.4% 44.4% 57.0% 67.4% 75.4% 82.5%<br />
1,200 8.4% 11.2% 14.2% 18.7% 20.5% 27.6% 35.0% 42.2% 49.0% 61.0% 70.7% 78.2% 84.7%<br />
1,100 13.0% 16.3% 19.7% 24.7% 26.7% 34.0% 41.4% 48.4% 54.8% 66.0% 74.9% 81.7% 87.2%<br />
1,000 18.8% 22.6% 26.5% 31.8% 33.9% 41.4% 48.8% 55.5% 61.5% 71.7% 79.9% 85.8% 90.6%<br />
900 24.7% 28.8% 32.9% 38.4% 40.6% 48.1% 55.2% 61.4% 66.9% 76.3% 83.7% 88.9% 92.6%<br />
800 31.4% 35.7% 40.0% 45.6% 47.9% 55.3% 61.9% 67.5% 72.5% 80.9% 87.4% 91.6% 94.5%<br />
700 37.6% 42.0% 46.2% 51.6% 53.9% 60.9% 67.2% 72.4% 77.0% 84.8% 90.5% 94.1% 96.2%<br />
600 44.9% 49.1% 53.1% 58.1% 60.3% 66.7% 72.4% 77.1% 81.2% 88.0% 92.6% 95.4% 97.2%<br />
500 51.9% 55.9% 59.7% 64.2% 66.4% 72.3% 77.5% 81.6% 85.2% 91.0% 94.7% 96.8% 98.0%<br />
400 57.5% 61.2% 64.7% 68.6% 70.8% 76.2% 80.8% 84.3% 87.4% 92.4% 95.6% 97.4% 98.4%<br />
350 60.1% 63.6% 66.9% 70.7% 72.8% 77.9% 82.2% 85.5% 88.4% 93.0% 96.0% 97.7% 98.6%<br />
300 63.7% 67.0% 70.1% 73.6% 75.6% 80.4% 84.3% 87.3% 89.9% 94.0% 96.7% 98.2% 98.9%<br />
250 66.9% 70.0% 73.1% 76.3% 78.3% 82.8% 86.3% 88.9% 91.3% 94.9% 97.3% 98.6% 99.2%<br />
150 76.7% 79.2% 81.7% 84.3% 85.9% 89.0% 91.6% 93.5% 95.1% 97.3% 98.9% 99.5% 99.7%<br />
USFWS, SFWO, Energy Planning <strong>and</strong> Instream Flow Branch<br />
Yuba River Redd Dewatering <strong>and</strong> Juvenile Str<strong>and</strong>ing Report<br />
September 15, 2010<br />
54
Dewatering <strong>flow</strong> (cfs)<br />
USFWS, SFWO, Energy Planning <strong>and</strong> Instream Flow Branch<br />
Yuba River Redd Dewatering <strong>and</strong> Juvenile Str<strong>and</strong>ing Report<br />
September 15, 2010<br />
Percentage of Steelhead/Rainbow Trout Redds Dewatered Above Daguerre<br />
500 600 700 800 900 1,000 1,100 1,200 1,300 1,400 1,500 1,600 1,700 1,800 1,900 2,000<br />
4,300 Spawning Flow (cfs)<br />
4,100<br />
3,900<br />
3,700<br />
3,500<br />
3,300<br />
3,100<br />
2,900<br />
2,700<br />
2,500<br />
2,300<br />
2,100<br />
2,000<br />
1,900 0.3%<br />
1,800 0.4% 0.3%<br />
1,700 0.3% 0.4% 0.4%<br />
1,600 0.3% 0.3% 0.5% 0.5%<br />
1,500 0.4% 0.3% 0.4% 0.6% 0.7%<br />
1,400 0.3% 0.4% 0.4% 0.5% 0.8% 1.0%<br />
1,300 0.3% 0.4% 0.5% 0.5% 0.7% 1.1% 1.3%<br />
1,200 0.5% 0.4% 0.5% 0.7% 0.7% 1.0% 1.4% 1.5%<br />
1,100 0.5% 0.6% 0.6% 0.7% 1.0% 1.1% 1.4% 1.8% 2.0%<br />
1,000 0.5% 0.6% 0.7% 0.8% 1.0% 1.3% 1.5% 1.8% 2.2% 2.4%<br />
900 0.4% 0.6% 0.8% 1.0% 1.1% 1.4% 1.8% 2.0% 2.3% 2.8% 3.0%<br />
800 0.7% 0.6% 0.9% 1.2% 1.5% 1.7% 2.0% 2.5% 2.7% 3.1% 3.6% 3.8%<br />
700 0.5% 1.0% 1.1% 1.6% 1.9% 2.3% 2.6% 3.0% 3.5% 3.7% 4.1% 4.6% 4.9%<br />
600 0.8% 1.0% 1.8% 2.2% 2.8% 3.2% 3.7% 4.0% 4.5% 5.0% 5.3% 5.7% 6.2% 6.6%<br />
500 0.8% 1.3% 1.9% 3.0% 3.6% 4.2% 4.7% 5.3% 5.7% 6.1% 6.7% 7.0% 7.4% 8.0% 8.3%<br />
400 2.4% 1.7% 2.6% 3.4% 4.6% 5.3% 6.0% 6.5% 7.1% 7.5% 8.0% 8.6% 8.9% 9.3% 9.9% 10.3%<br />
55
Dewatering <strong>flow</strong> (cfs)<br />
USFWS, SFWO, Energy Planning <strong>and</strong> Instream Flow Branch<br />
Yuba River Redd Dewatering <strong>and</strong> Juvenile Str<strong>and</strong>ing Report<br />
September 15, 2010<br />
Percentage of Steelhead/Rainbow Trout Redds Dewatered Above Daguerre (continued)<br />
2,100 2,300 2,500 2,700 2,900 3,100 3,300 3,500 3,700 3,900 4,100 4,300 4,500<br />
4,300 Spawning Flow (cfs) 0.2%<br />
4,100 0.2% 0.3%<br />
3,900 0.2% 0.4% 0.7%<br />
3,700 0.2% 0.3% 0.7% 1.1%<br />
3,500 0.2% 0.3% 0.6% 1.1% 1.6%<br />
3,300 0.2% 0.3% 0.6% 1.0% 1.6% 2.1%<br />
3,100 0.2% 0.3% 0.7% 1.1% 1.6% 2.3% 2.9%<br />
2,900 0.1% 0.3% 0.6% 1.1% 1.6% 2.2% 3.0% 3.7%<br />
2,700 0.2% 0.3% 0.6% 1.0% 1.6% 2.2% 2.9% 3.8% 4.6%<br />
2,500 0.3% 0.3% 0.5% 0.9% 1.4% 2.1% 2.7% 3.4% 4.4% 5.3%<br />
2,300 0.2% 0.4% 0.6% 1.0% 1.5% 2.1% 2.9% 3.5% 4.3% 5.3% 6.3%<br />
2,100 0.4% 0.4% 0.8% 1.2% 1.7% 2.3% 3.0% 3.8% 4.6% 5.4% 6.5% 7.5%<br />
2,000 0.2% 0.4% 0.6% 1.0% 1.5% 2.1% 2.8% 3.4% 4.3% 5.1% 6.0% 7.1% 8.2%<br />
1,900 0.2% 0.6% 0.8% 1.3% 1.9% 2.5% 3.3% 4.0% 5.0% 5.8% 6.8% 8.0% 9.1%<br />
1,800 0.3% 0.8% 1.0% 1.6% 2.2% 2.9% 3.8% 4.6% 5.6% 6.5% 7.5% 8.7% 9.9%<br />
1,700 0.5% 1.0% 1.3% 2.0% 2.7% 3.4% 4.2% 5.1% 6.1% 7.1% 8.0% 9.3% 10.5%<br />
1,600 0.7% 1.3% 1.7% 2.4% 3.2% 4.0% 4.9% 5.8% 6.9% 7.9% 9.0% 10.3% 11.5%<br />
1,500 0.8% 1.5% 2.0% 2.8% 3.5% 4.4% 5.3% 6.3% 7.4% 8.4% 9.5% 10.9% 12.1%<br />
1,400 1.2% 1.9% 2.4% 3.3% 4.1% 5.0% 6.0% 7.0% 8.2% 9.3% 10.4% 11.8% 13.2%<br />
1,300 1.4% 2.3% 2.8% 3.7% 4.6% 5.6% 6.6% 7.6% 8.9% 10.0% 11.2% 12.5% 13.8%<br />
1,200 1.8% 2.7% 3.3% 4.2% 5.1% 6.2% 7.3% 8.4% 9.7% 10.8% 12.1% 13.5% 14.9%<br />
1,100 2.3% 3.2% 3.8% 4.8% 5.8% 6.9% 8.0% 9.2% 10.4% 11.7% 13.0% 14.5% 15.9%<br />
1,000 2.7% 3.7% 4.3% 5.4% 6.4% 7.5% 8.8% 10.0% 11.4% 12.7% 14.1% 15.7% 17.2%<br />
900 3.3% 4.3% 5.0% 6.2% 7.2% 8.4% 9.7% 10.9% 12.4% 13.7% 15.1% 16.7% 18.2%<br />
800 4.2% 5.2% 6.0% 7.1% 8.2% 9.5% 10.8% 12.1% 13.5% 14.9% 16.3% 17.8% 19.3%<br />
700 5.3% 6.4% 7.2% 8.4% 9.5% 10.9% 12.2% 13.5% 15.1% 16.5% 17.9% 19.6% 21.1%<br />
600 6.9% 8.1% 9.0% 10.2% 11.4% 12.7% 14.1% 15.4% 16.9% 18.3% 19.8% 21.4% 22.9%<br />
500 8.7% 10.0% 10.9% 12.2% 13.5% 14.7% 16.1% 17.6% 19.2% 20.7% 22.2% 23.8% 25.5%<br />
400 10.7% 12.0% 13.0% 14.4% 15.8% 17.1% 18.7% 20.2% 21.9% 23.5% 25.1% 26.8% 28.4%<br />
56
Dewatering <strong>flow</strong> (cfs)<br />
USFWS, SFWO, Energy Planning <strong>and</strong> Instream Flow Branch<br />
Yuba River Redd Dewatering <strong>and</strong> Juvenile Str<strong>and</strong>ing Report<br />
September 15, 2010<br />
Percentage of Steelhead/Rainbow Trout Redds Dewatered Below Daguerre<br />
250 300 350 400 500 600 700 800 900 1,000 1,100 1,200 1,300 1,400 1,500 1,600<br />
4,100 Spawning Flow (cfs)<br />
3,700<br />
3,300<br />
2,900<br />
2,700<br />
2,500<br />
2,300<br />
2,100<br />
2,000<br />
1,900<br />
1,800<br />
1,700<br />
1,600<br />
1,500 0.0%<br />
1,400 0.1% 0.4%<br />
1,300 0.1% 0.5% 1.2%<br />
1,200 0.1% 0.5% 1.5% 2.7%<br />
1,100 0.0% 0.4% 1.4% 2.8% 4.3%<br />
1000 0.1% 0.8% 2.0% 3.4% 5.3% 7.1%<br />
900 0.0% 0.6% 2.1% 3.9% 5.8% 7.8% 9.8%<br />
800 0.1% 0.6% 1.9% 4.2% 6.2% 8.4% 10.6% 12.8%<br />
700 0.1% 0.9% 2.3% 4.2% 6.9% 9.4% 11.7% 14.1% 16.3%<br />
600 0.2% 1.3% 3.0% 4.9% 7.2% 10.1% 12.7% 15.0% 17.4% 19.6%<br />
500 0.2% 1.5% 3.6% 5.9% 8.3% 11.3% 14.4% 16.4% 18.8% 21.1% 23.2%<br />
400 0.4% 2.4% 4.9% 7.8% 10.3% 12.7% 15.1% 18.0% 20.5% 22.8% 25.0% 27.1%<br />
350 0.0% 1.5% 4.3% 7.2% 10.2% 12.8% 15.3% 17.7% 20.6% 23.0% 25.2% 27.4% 29.4%<br />
300 0.1% 0.6% 2.9% 6.8% 10.1% 13.4% 16.0% 18.5% 20.9% 23.8% 26.2% 28.3% 30.4% 32.4%<br />
250 0.0% 0.5% 1.4% 5.0% 8.7% 12.1% 15.4% 18.2% 20.6% 23.0% 25.9% 28.3% 30.4% 32.5% 34.4%<br />
150 2.5% 4.4% 6.5% 8.4% 13.2% 17.2% 20.7% 24.0% 26.6% 30.0% 31.4% 34.1% 36.4% 38.4% 40.3% 42.1%<br />
57
Dewatering <strong>flow</strong> (cfs)<br />
USFWS, SFWO, Energy Planning <strong>and</strong> Instream Flow Branch<br />
Yuba River Redd Dewatering <strong>and</strong> Juvenile Str<strong>and</strong>ing Report<br />
September 15, 2010<br />
Percentage of Steelhead/Rainbow Trout Redds Dewatered Below Daguerre (continued)<br />
1,700 1,800 1,900 2,000 2,100 2,300 2,500 2,700 2,900 3,300 3,700 4,100 4,500<br />
4,100 Spawning Flow (cfs) 0.4%<br />
3,700 0.3% 1.9%<br />
3,300 0.3% 2.0% 4.4%<br />
2,900 0.4% 1.8% 4.3% 7.0%<br />
2,700 0.1% 1.5% 3.4% 6.1% 9.0%<br />
2,500 0.2% 1.1% 3.8% 6.1% 9.1% 11.9%<br />
2,300 0.1% 0.9% 2.6% 6.2% 8.9% 11.9% 14.8%<br />
2,100 0.1% 1.8% 2.3% 4.5% 8.8% 11.7% 14.8% 17.7%<br />
2,000 0.0% 0.3% 1.3% 3.0% 5.4% 9.6% 12.5% 15.7% 18.6%<br />
1,900 0.0% 0.1% 0.9% 2.4% 4.4% 6.9% 11.4% 14.4% 17.5% 20.3%<br />
1,800 0.0% 0.2% 0.6% 1.9% 3.7% 5.9% 8.5% 13.0% 16.0% 19.0% 21.7%<br />
1,700 0.0% 0.1% 0.6% 1.2% 2.7% 4.6% 6.9% 9.5% 14.2% 17.2% 20.2% 22.8%<br />
1,600 0.0% 0.2% 0.6% 1.4% 2.1% 4.0% 6.0% 8.4% 11.1% 15.8% 18.8% 21.7% 24.3%<br />
1,500 0.3% 0.8% 1.6% 2.8% 3.6% 5.8% 8.1% 10.6% 13.4% 18.9% 21.1% 23.9% 26.4%<br />
1,400 1.1% 2.1% 3.3% 4.8% 5.8% 8.4% 10.9% 13.4% 16.2% 20.8% 23.6% 26.3% 28.5%<br />
1,300 2.3% 3.6% 4.9% 6.6% 7.7% 10.4% 13.0% 15.5% 18.4% 22.8% 25.5% 28.1% 30.2%<br />
1,200 4.1% 5.7% 7.3% 9.1% 10.3% 13.2% 15.8% 18.4% 21.1% 25.3% 27.8% 30.2% 32.1%<br />
1,100 6.0% 7.7% 9.4% 11.4% 12.6% 15.6% 18.2% 20.8% 23.5% 27.6% 30.0% 32.2% 34.0%<br />
1,000 9.0% 10.9% 12.7% 14.8% 16.0% 19.0% 21.6% 24.1% 26.7% 30.6% 32.8% 34.8% 36.5%<br />
900 11.9% 13.9% 15.7% 17.8% 19.2% 22.2% 24.8% 27.2% 29.7% 33.4% 35.5% 37.5% 39.0%<br />
800 14.9% 16.9% 18.8% 20.9% 22.2% 25.3% 27.8% 30.1% 32.5% 36.1% 38.1% 40.0% 41.5%<br />
700 18.5% 19.5% 22.4% 24.5% 25.9% 28.9% 31.4% 33.7% 36.1% 39.6% 41.6% 43.4% 44.8%<br />
600 21.7% 23.7% 25.6% 27.6% 29.0% 32.0% 34.6% 36.8% 39.2% 42.7% 44.5% 46.2% 47.6%<br />
500 25.3% 27.3% 29.2% 31.2% 32.7% 35.7% 38.3% 40.6% 42.9% 46.2% 47.9% 49.4% 50.6%<br />
400 29.2% 31.1% 32.9% 34.9% 36.3% 39.3% 41.9% 44.1% 46.3% 49.6% 51.3% 52.8% 53.8%<br />
350 31.4% 33.3% 35.1% 37.0% 38.4% 41.4% 43.9% 46.0% 48.2% 51.4% 53.0% 54.5% 55.5%<br />
300 34.4% 36.2% 38.0% 39.8% 41.3% 44.2% 46.6% 48.8% 50.9% 53.9% 55.4% 56.8% 57.7%<br />
250 36.4% 38.2% 39.9% 41.8% 43.2% 46.0% 48.5% 50.6% 52.6% 55.6% 57.0% 58.2% 59.1%<br />
150 44.0% 45.7% 47.3% 49.0% 50.3% 52.9% 55.1% 57.0% 58.8% 61.3% 62.5% 63.5% 64.2%<br />
58
USFWS, SFWO, Energy Planning <strong>and</strong> Instream Flow Branch<br />
Yuba River Redd Dewatering <strong>and</strong> Juvenile Str<strong>and</strong>ing Report<br />
September 15, 2010<br />
APPENDIX E<br />
ACRONYMS<br />
59
LIST OF ACRONYMS<br />
2-D Two dimensional<br />
ADCP Acoustic Doppler Current Profiler<br />
ASCII American St<strong>and</strong>ard Code for Information Interchange<br />
cfs cubic feet per second<br />
GIS Geographic Information System<br />
HABEF Effective Habitat Analysis<br />
HSC Habitat Suitability Criteria<br />
IFG4 Instream Flow Group Program 4<br />
IFIM Instream Flow Incremental Methodology<br />
MHU mesohabitat unit<br />
PHABSIM Physical Habitat Simulation Model<br />
RHABSIM Riverine Habitat Simulation Model<br />
River2D Two dimensional depth averaged model of river hydrodynamics <strong>and</strong> fish habitat<br />
SZF stage of zero <strong>flow</strong><br />
USGS U.S. Geological Survey<br />
WSEL Water Surface Elevation<br />
WUA Weighted Useable Area<br />
USFWS, SFWO, Energy Planning <strong>and</strong> Instream Flow Branch<br />
Yuba River Redd Dewatering <strong>and</strong> Juvenile Str<strong>and</strong>ing Report<br />
September 15, 2010<br />
60