2. Axial Force, Shear Force, Torque and Bending Moment Diagrams
2. Axial Force, Shear Force, Torque and Bending Moment Diagrams
2. Axial Force, Shear Force, Torque and Bending Moment Diagrams

Create successful ePaper yourself
Turn your PDF publications into a flip-book with our unique Google optimized e-Paper software.
<strong>2.</strong> <strong>Axial</strong> <strong>Force</strong>, <strong>Shear</strong> <strong>Force</strong>, <strong>Torque</strong> <strong>and</strong> <strong>Bending</strong> <strong>Moment</strong><br />
<strong>Diagrams</strong><br />
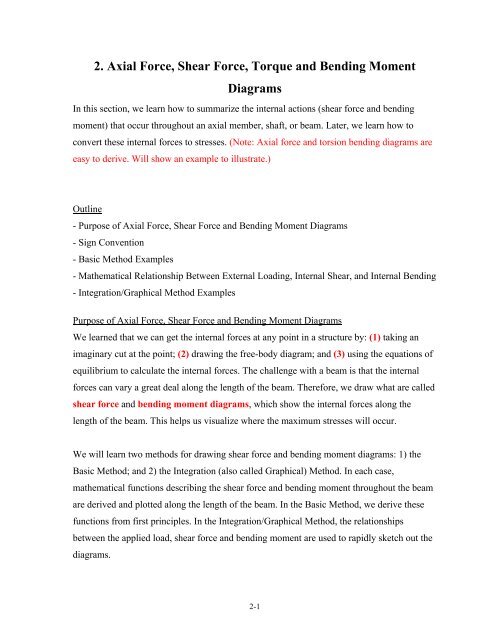
In this section, we learn how to summarize the internal actions (shear force <strong>and</strong> bending<br />
moment) that occur throughout an axial member, shaft, or beam. Later, we learn how to<br />
convert these internal forces to stresses. (Note: <strong>Axial</strong> force <strong>and</strong> torsion bending diagrams are<br />
easy to derive. Will show an example to illustrate.)<br />
.: mention that axial force <strong>and</strong> torsion bending diagrams are easy to derive. Will showcouple<br />
of examples to ill<br />
Outline<br />
- Purpose of <strong>Axial</strong> <strong>Force</strong>, <strong>Shear</strong> <strong>Force</strong> <strong>and</strong> <strong>Bending</strong> <strong>Moment</strong> <strong>Diagrams</strong><br />
- Sign Convention<br />
- Basic Method Examples<br />
- Mathematical Relationship Between External Loading, Internal <strong>Shear</strong>, <strong>and</strong> Internal <strong>Bending</strong><br />
- Integration/Graphical Method Examples<br />
Purpose of <strong>Axial</strong> <strong>Force</strong>, <strong>Shear</strong> <strong>Force</strong> <strong>and</strong> <strong>Bending</strong> <strong>Moment</strong> <strong>Diagrams</strong><br />
We learned that we can get the internal forces at any point in a structure by: (1) taking an<br />
imaginary cut at the point; (2) drawing the free-body diagram; <strong>and</strong> (3) using the equations of<br />
equilibrium to calculate the internal forces. The challenge with a beam is that the internal<br />
forces can vary a great deal along the length of the beam. Therefore, we draw what are called<br />
shear force <strong>and</strong> bending moment diagrams, which show the internal forces along the<br />
length of the beam. This helps us visualize where the maximum stresses will occur.<br />
We will learn two methods for drawing shear force <strong>and</strong> bending moment diagrams: 1) the<br />
Basic Method; <strong>and</strong> 2) the Integration (also called Graphical) Method. In each case,<br />
mathematical functions describing the shear force <strong>and</strong> bending moment throughout the beam<br />
are derived <strong>and</strong> plotted along the length of the beam. In the Basic Method, we derive these<br />
functions from first principles. In the Integration/Graphical Method, the relationships<br />
between the applied load, shear force <strong>and</strong> bending moment are used to rapidly sketch out the<br />
diagrams.<br />
2-1
The approach used depends on the problem <strong>and</strong> what the designer requires from the<br />
diagrams. For example, many problems require only the maximum values of the shear <strong>and</strong><br />
moment, <strong>and</strong> the locations at which these values occur. The Graphical Method is most useful<br />
for these situations. In other cases, a beam may be subjected to a loading that is a fairly<br />
complicated function. For these situations, the Basic Method may be needed.<br />
You should know how to use both methods <strong>and</strong> recognize when to apply them!<br />
Sign Convention (Section 6.1 in Mechanics of Materials)<br />
We define the sign convention for internal shear force <strong>and</strong> bending moment:<br />
<strong>Shear</strong> <strong>Force</strong> <strong>Bending</strong> <strong>Moment</strong><br />
Positive internal shear force tends to rotate the free-body diagram clockwise.<br />
Positive internal bending moment causes the beam to sag. Also known (informally) as the<br />
smile rule. <strong>Bending</strong> moment is drawn on the compression side of the member.<br />
Summary of Steps for Basic Method:<br />
1) Determine the support reactions for the beam.<br />
2) Specify an origin for a co-ordinate x along the length of the beam.<br />
3) Section the beam with an imaginary cut at a distance x, <strong>and</strong> draw the free-body diagram.<br />
4) Determine shear <strong>and</strong> bending moment as a function of x using equilibrium equations.<br />
5) Repeat steps 3 <strong>and</strong> 4 for all regions between any two discontinuities of loading.<br />
6) Draw, to scale, the functions on a sketch of the beam.<br />
2-2
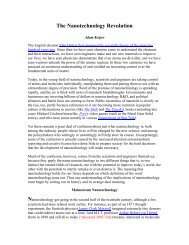
Basic Method Example<br />
Consider beam ABC from the example in Section 1.<br />
1.0 m<br />
A<br />
D<br />
0.5 m<br />
E<br />
θ<br />
B<br />
Pin<br />
F<br />
60 N/m<br />
0.5 m 0.5 m 0.5 m<br />
C<br />
Determine the axial force, shear force, <strong>and</strong> bending moment diagrams for the beam ABC.<br />
2-3
2-4
Mathematical Relationship Between External Loading, Internal <strong>Shear</strong>, <strong>and</strong> Internal <strong>Bending</strong><br />
The previous example shows that:<br />
1) axial force (<strong>and</strong> shear force) diagrams change abruptly at the location of a concentrated<br />
axial force (or applied force);<br />
2) for a region of a beam without external applied forces, the shear force has a constant<br />
value, <strong>and</strong> the bending moment is a function of x;<br />
[see section AB of the beam in the previous example]<br />
3) for a region of the beam subjected to a uniformly distributed load (UDL), the shear force is<br />
a function of x, <strong>and</strong> the bending moment is a function of x 2 .<br />
[see section BC of the beam in the previous example].<br />
In fact, we can prove that (see Section 6.2 of the textbook):<br />
dV ( x)<br />
= −w(<br />
x)<br />
(2-1)<br />
dx<br />
i.e. the slope of the shear force diagram at x is equal to the negative of the value of the<br />
loading function at x; <strong>and</strong>,<br />
dM ( x)<br />
= V ( x)<br />
(2-2)<br />
dx<br />
i.e. the slope of the moment diagram at x is equal to the value of the shear function at x.<br />
dV ( x)<br />
From Eq. 2-1 we have: = −w(<br />
x)<br />
through integration:<br />
dx<br />
(note what each side of the equation represents)<br />
From Eq. 2-2 we have through integration:<br />
(note what each side of the equation represents)<br />
2-5<br />
(2-3).<br />
(2-4).
Graphically:<br />
2-6
The following table, taken from your textbook, illustrates a number of common loading<br />
cases. It shows how shear <strong>and</strong> moment diagrams can be constructed on the basis of knowing<br />
the variation of the slope from the load <strong>and</strong> shear diagrams. Make sure that the relationships<br />
make sense, but you should not memorize the table!! You should always work from the<br />
basic relationships, Eqs. <strong>2.</strong>1 to <strong>2.</strong>4.<br />
(show overhead of table)<br />
2-7
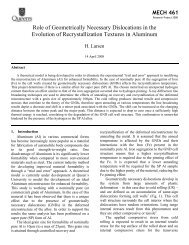
Graphical Method Example 1<br />
Consider the cantilever beam subjected to the loading w(x). Draw the internal forces on a<br />
typical element of the beam, <strong>and</strong> hence derive the differential equations relating bending<br />
moments, shear forces, <strong>and</strong> applied loading, i.e. Eqs. 2-1, 2-<strong>2.</strong> Use these differential<br />
equations to draw shear force <strong>and</strong> bending moment diagrams for the following cases: (a) w(x)<br />
= 20 kN/m; (b) w(x) = 20x kN/m<br />
L<br />
w(x)<br />
2-8<br />
(add soln from Campbell notes)
2-9
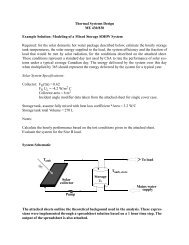
Example<br />
Draw the shear force <strong>and</strong> bending moment diagrams.<br />
1 m<br />
35 kN/m<br />
2 m<br />
2-10<br />
3 m<br />
40 kN/m
2-11
Finally, we end this section with a discussion of torque diagrams. These are usually simpler<br />
than shear <strong>and</strong> bending moment diagrams, <strong>and</strong> can be illustrated with the following example.<br />
Example<br />
Draw the torque diagram for the cantilever shaft shown. Determine the maximum torque in<br />
the shaft.<br />
1 m 1 m 1 m<br />
5 kNm 7 kNm<br />
12 kNm<br />
2-12<br />
fixed<br />
end
2-13